Fishing Creek, MD Map & Demographics
Fishing Creek Map
Fishing Creek Overview
$33,151
PER CAPITA INCOME
$77,054
AVG FAMILY INCOME
$76,250
AVG HOUSEHOLD INCOME
67.8%
WAGE / INCOME GAP [ % ]
32.2¢/ $1
WAGE / INCOME GAP [ $ ]
0.34
INEQUALITY / GINI INDEX
235
TOTAL POPULATION
75
MALE POPULATION
160
FEMALE POPULATION
46.88
MALES / 100 FEMALES
213.33
FEMALES / 100 MALES
55.9
MEDIAN AGE
2.5
AVG FAMILY SIZE
2.2
AVG HOUSEHOLD SIZE
108
LABOR FORCE [ PEOPLE ]
56.0%
PERCENT IN LABOR FORCE
13.0%
UNEMPLOYMENT RATE
Fishing Creek Zip Codes
Fishing Creek Area Codes
Income in Fishing Creek
Income Overview in Fishing Creek
Per Capita Income in Fishing Creek is $33,151, while median incomes of families and households are $77,054 and $76,250 respectively.
| Characteristic | Number | Measure |
| Per Capita Income | 235 | $33,151 |
| Median Family Income | 87 | $77,054 |
| Mean Family Income | 87 | $83,043 |
| Median Household Income | 108 | $76,250 |
| Mean Household Income | 108 | $75,164 |
| Income Deficit | 87 | $0 |
| Wage / Income Gap (%) | 235 | 67.85% |
| Wage / Income Gap ($) | 235 | 32.15¢ per $1 |
| Gini / Inequality Index | 235 | 0.34 |
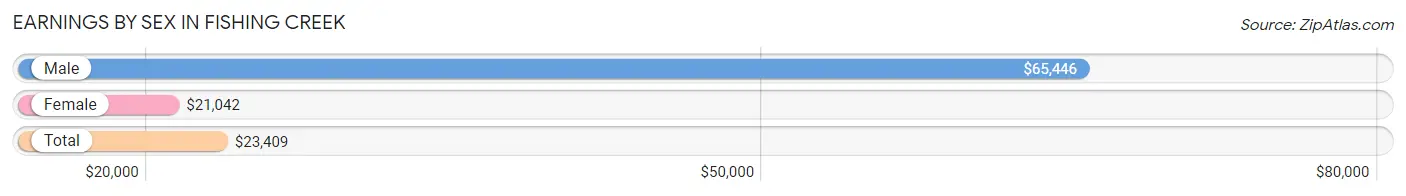
Earnings by Sex in Fishing Creek
Average Earnings in Fishing Creek are $23,409, $65,446 for men and $21,042 for women, a difference of 67.8%.
| Sex | Number | Average Earnings |
| Male | 35 (28.2%) | $65,446 |
| Female | 89 (71.8%) | $21,042 |
| Total | 124 (100.0%) | $23,409 |
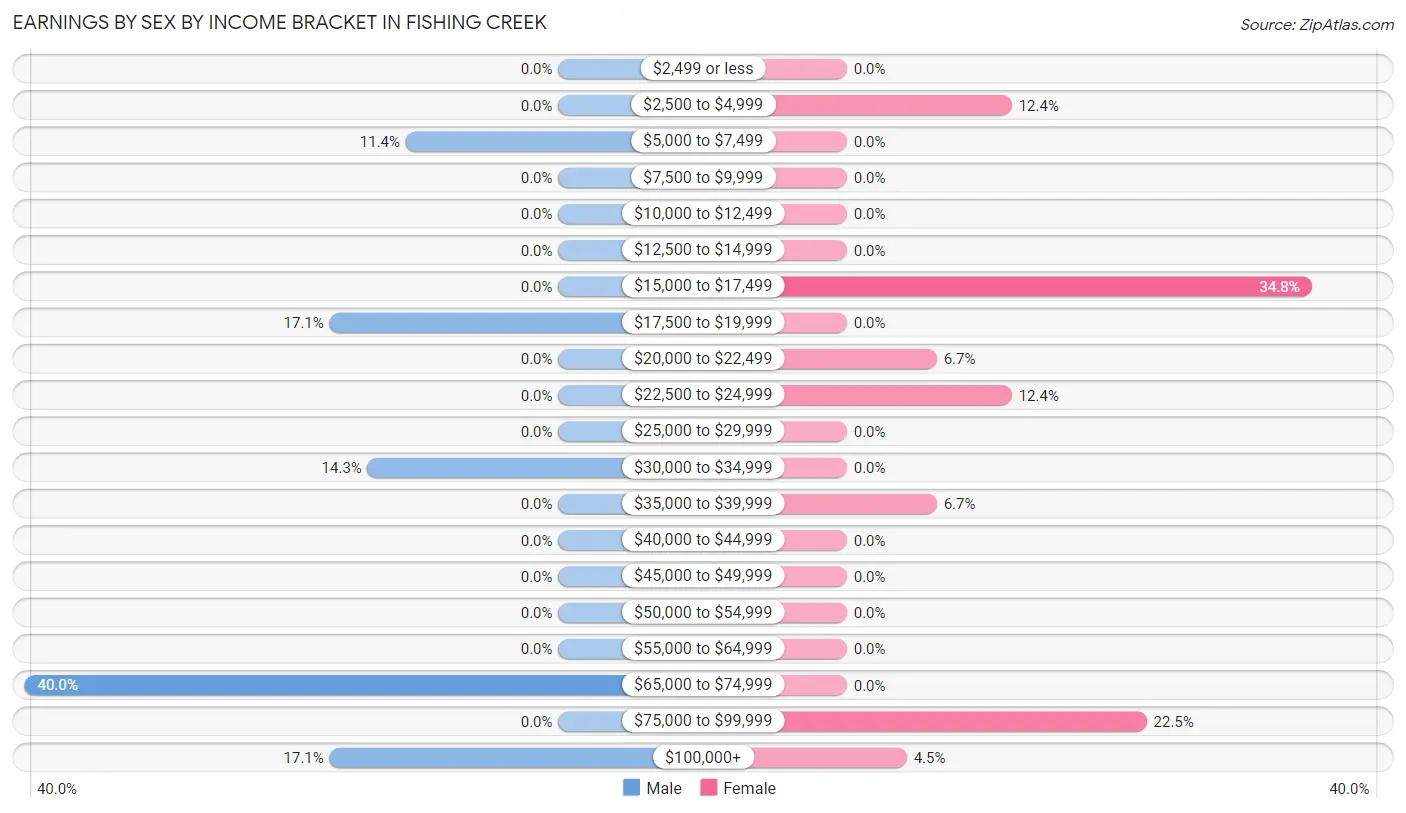
Earnings by Sex by Income Bracket in Fishing Creek
The most common earnings brackets in Fishing Creek are $65,000 to $74,999 for men (14 | 40.0%) and $15,000 to $17,499 for women (31 | 34.8%).
| Income | Male | Female |
| $2,499 or less | 0 (0.0%) | 0 (0.0%) |
| $2,500 to $4,999 | 0 (0.0%) | 11 (12.4%) |
| $5,000 to $7,499 | 4 (11.4%) | 0 (0.0%) |
| $7,500 to $9,999 | 0 (0.0%) | 0 (0.0%) |
| $10,000 to $12,499 | 0 (0.0%) | 0 (0.0%) |
| $12,500 to $14,999 | 0 (0.0%) | 0 (0.0%) |
| $15,000 to $17,499 | 0 (0.0%) | 31 (34.8%) |
| $17,500 to $19,999 | 6 (17.1%) | 0 (0.0%) |
| $20,000 to $22,499 | 0 (0.0%) | 6 (6.7%) |
| $22,500 to $24,999 | 0 (0.0%) | 11 (12.4%) |
| $25,000 to $29,999 | 0 (0.0%) | 0 (0.0%) |
| $30,000 to $34,999 | 5 (14.3%) | 0 (0.0%) |
| $35,000 to $39,999 | 0 (0.0%) | 6 (6.7%) |
| $40,000 to $44,999 | 0 (0.0%) | 0 (0.0%) |
| $45,000 to $49,999 | 0 (0.0%) | 0 (0.0%) |
| $50,000 to $54,999 | 0 (0.0%) | 0 (0.0%) |
| $55,000 to $64,999 | 0 (0.0%) | 0 (0.0%) |
| $65,000 to $74,999 | 14 (40.0%) | 0 (0.0%) |
| $75,000 to $99,999 | 0 (0.0%) | 20 (22.5%) |
| $100,000+ | 6 (17.1%) | 4 (4.5%) |
| Total | 35 (100.0%) | 89 (100.0%) |
Earnings by Sex by Educational Attainment in Fishing Creek
| Educational Attainment | Male Income | Female Income |
| Less than High School | - | - |
| High School Diploma | - | - |
| College or Associate's Degree | - | - |
| Bachelor's Degree | - | - |
| Graduate Degree | - | - |
| Total | $65,446 | $0 |
Family Income in Fishing Creek
Family Income Brackets in Fishing Creek
According to the Fishing Creek family income data, there are 31 families falling into the $75,000 to $99,999 income range, which is the most common income bracket and makes up 35.6% of all families.
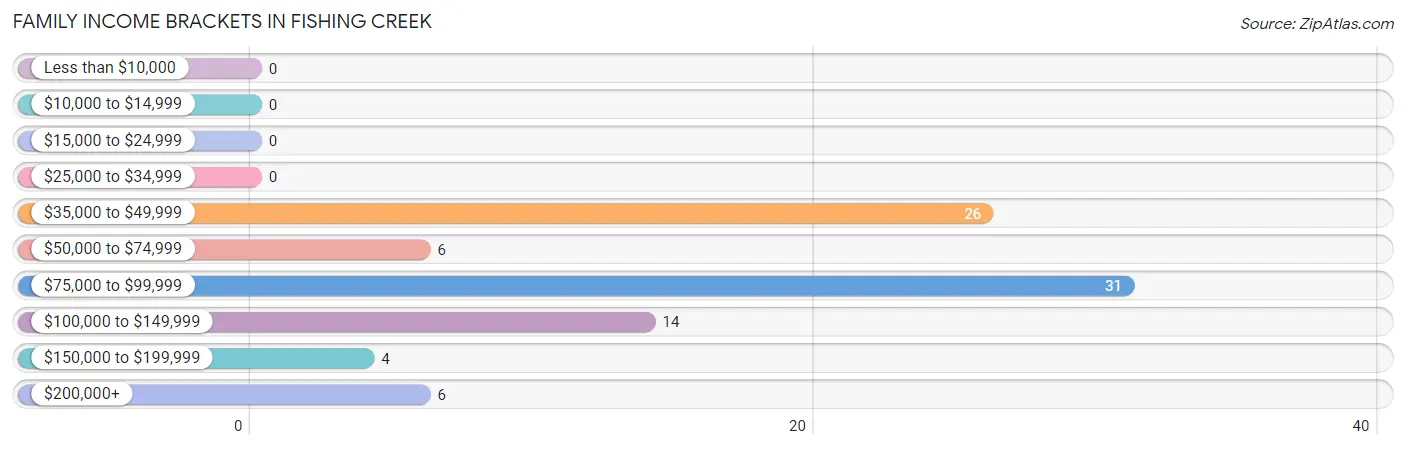
| Income Bracket | # Families | % Families |
| Less than $10,000 | 0 | 0.0% |
| $10,000 to $14,999 | 0 | 0.0% |
| $15,000 to $24,999 | 0 | 0.0% |
| $25,000 to $34,999 | 0 | 0.0% |
| $35,000 to $49,999 | 26 | 29.9% |
| $50,000 to $74,999 | 6 | 6.9% |
| $75,000 to $99,999 | 31 | 35.6% |
| $100,000 to $149,999 | 14 | 16.1% |
| $150,000 to $199,999 | 4 | 4.6% |
| $200,000+ | 6 | 6.9% |
Family Income by Famaliy Size in Fishing Creek
2-person families (56 | 64.4%) account for the highest median family income in Fishing Creek with $55,833 per family, while 2-person families (56 | 64.4%) have the highest median income of $27,916 per family member.
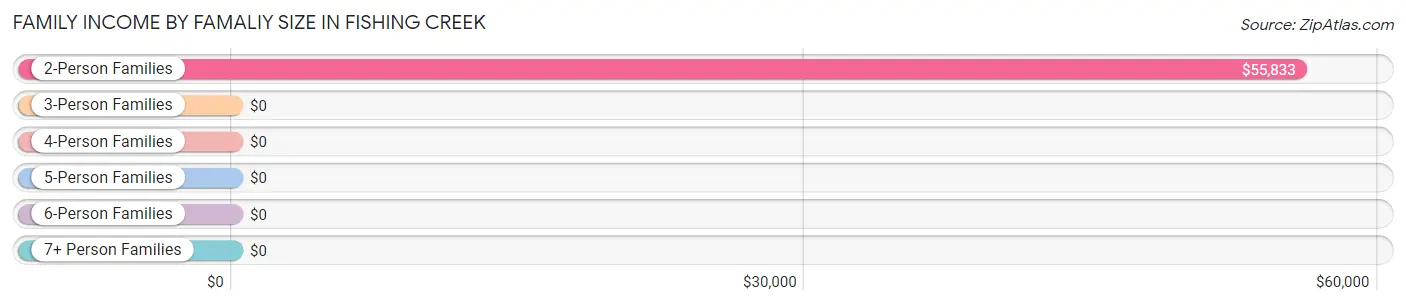
| Income Bracket | # Families | Median Income |
| 2-Person Families | 56 (64.4%) | $55,833 |
| 3-Person Families | 14 (16.1%) | $0 |
| 4-Person Families | 0 (0.0%) | $0 |
| 5-Person Families | 17 (19.5%) | $0 |
| 6-Person Families | 0 (0.0%) | $0 |
| 7+ Person Families | 0 (0.0%) | $0 |
| Total | 87 (100.0%) | $77,054 |
Family Income by Number of Earners in Fishing Creek
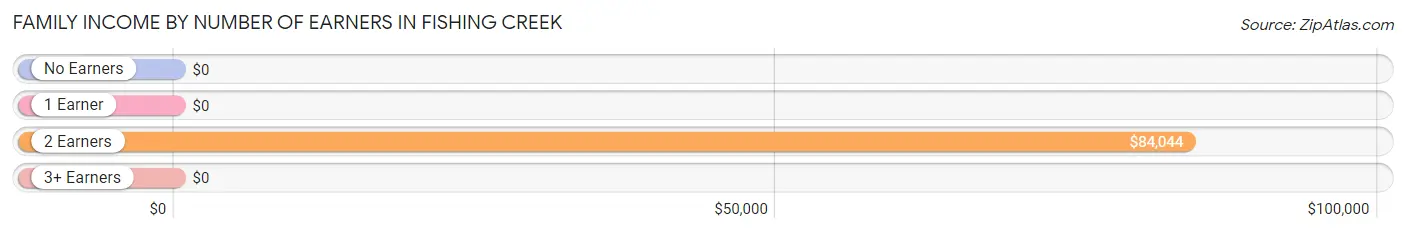
| Number of Earners | # Families | Median Income |
| No Earners | 26 (29.9%) | $0 |
| 1 Earner | 14 (16.1%) | $0 |
| 2 Earners | 33 (37.9%) | $84,044 |
| 3+ Earners | 14 (16.1%) | $0 |
| Total | 87 (100.0%) | $77,054 |
Household Income in Fishing Creek
Household Income Brackets in Fishing Creek
With 37 households falling in the category, the $75,000 to $99,999 income range is the most frequent in Fishing Creek, accounting for 34.3% of all households.
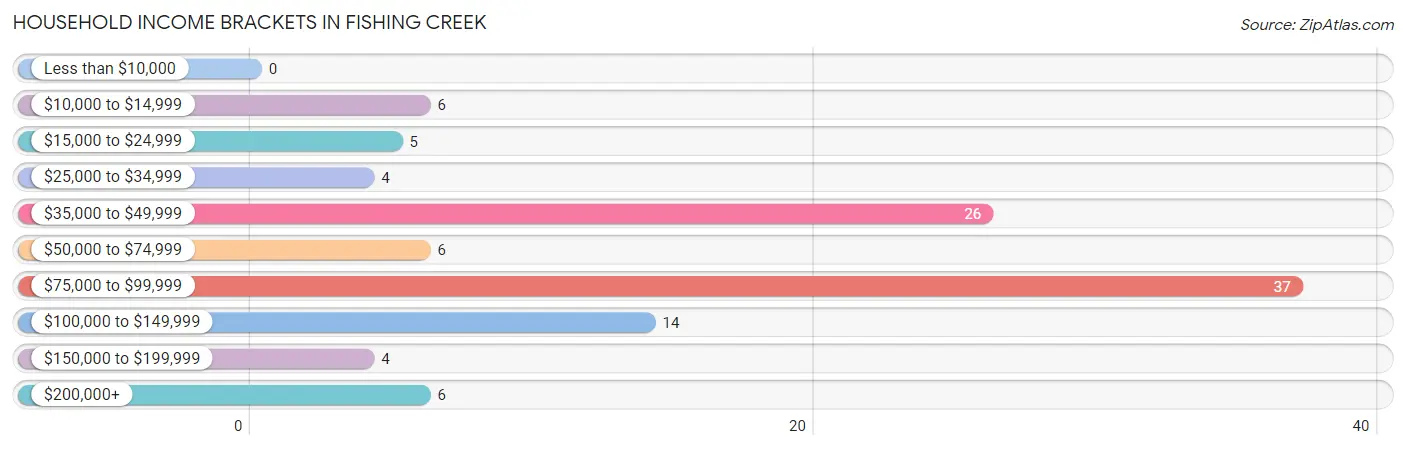
| Income Bracket | # Households | % Households |
| Less than $10,000 | 0 | 0.0% |
| $10,000 to $14,999 | 6 | 5.6% |
| $15,000 to $24,999 | 5 | 4.6% |
| $25,000 to $34,999 | 4 | 3.7% |
| $35,000 to $49,999 | 26 | 24.1% |
| $50,000 to $74,999 | 6 | 5.6% |
| $75,000 to $99,999 | 37 | 34.3% |
| $100,000 to $149,999 | 14 | 13.0% |
| $150,000 to $199,999 | 4 | 3.7% |
| $200,000+ | 6 | 5.6% |
Household Income by Householder Age in Fishing Creek
The median household income in Fishing Creek is $76,250, with the highest median household income of $105,357 found in the 45 to 64 years age bracket for the primary householder. A total of 44 households (40.7%) fall into this category.
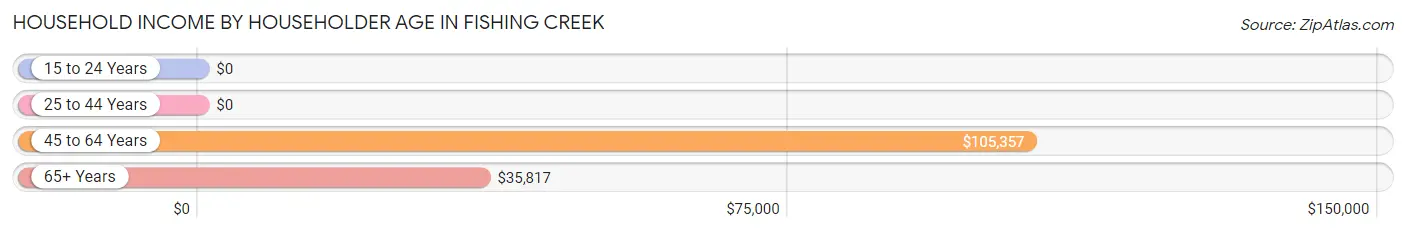
| Income Bracket | # Households | Median Income |
| 15 to 24 Years | 0 (0.0%) | $0 |
| 25 to 44 Years | 17 (15.7%) | $0 |
| 45 to 64 Years | 44 (40.7%) | $105,357 |
| 65+ Years | 47 (43.5%) | $35,817 |
| Total | 108 (100.0%) | $76,250 |
Poverty in Fishing Creek
Income Below Poverty by Sex and Age in Fishing Creek
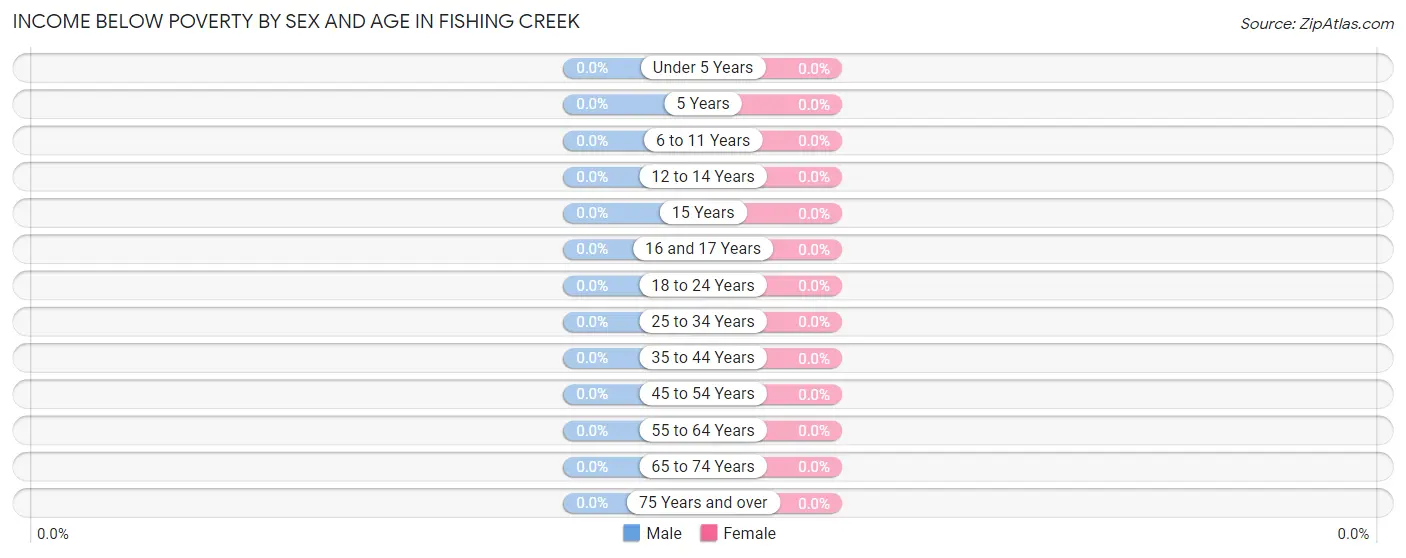
| Age Bracket | Male | Female |
| Under 5 Years | 0 (0.0%) | 0 (0.0%) |
| 5 Years | 0 (0.0%) | 0 (0.0%) |
| 6 to 11 Years | 0 (0.0%) | 0 (0.0%) |
| 12 to 14 Years | 0 (0.0%) | 0 (0.0%) |
| 15 Years | 0 (0.0%) | 0 (0.0%) |
| 16 and 17 Years | 0 (0.0%) | 0 (0.0%) |
| 18 to 24 Years | 0 (0.0%) | 0 (0.0%) |
| 25 to 34 Years | 0 (0.0%) | 0 (0.0%) |
| 35 to 44 Years | 0 (0.0%) | 0 (0.0%) |
| 45 to 54 Years | 0 (0.0%) | 0 (0.0%) |
| 55 to 64 Years | 0 (0.0%) | 0 (0.0%) |
| 65 to 74 Years | 0 (0.0%) | 0 (0.0%) |
| 75 Years and over | 0 (0.0%) | 0 (0.0%) |
| Total | 0 (0.0%) | 0 (0.0%) |
Income Above Poverty by Sex and Age in Fishing Creek
According to the poverty statistics in Fishing Creek, males aged 25 to 34 years and females aged under 5 years are the age groups that are most secure financially, with 100.0% of males and 100.0% of females in these age groups living above the poverty line.
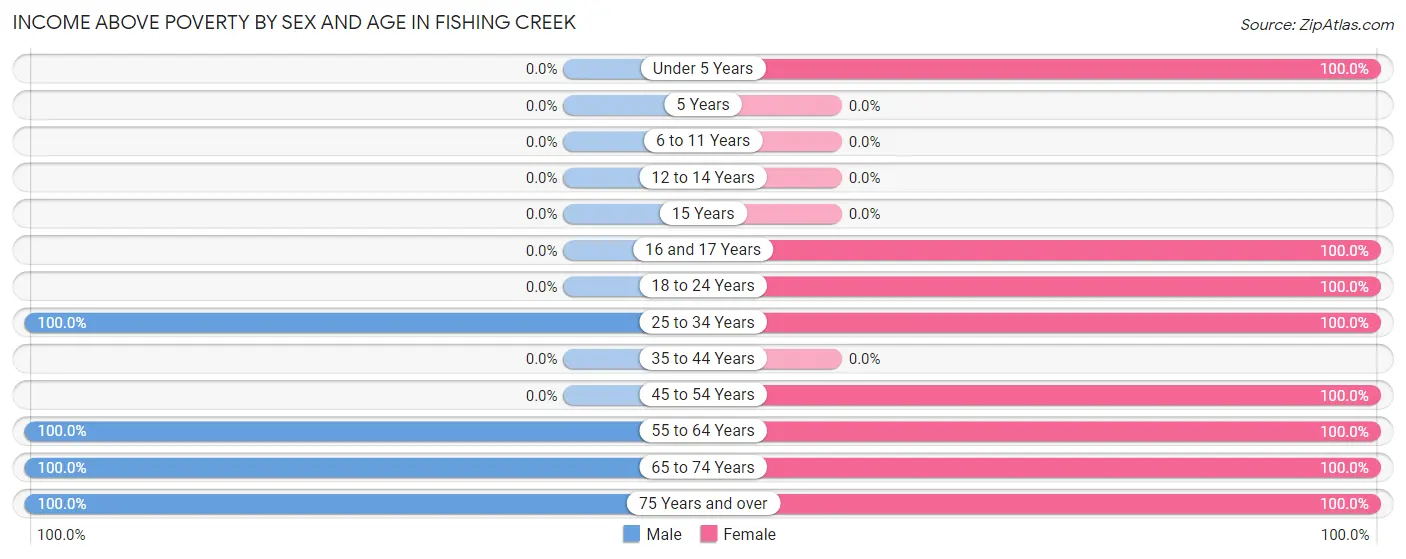
| Age Bracket | Male | Female |
| Under 5 Years | 0 (0.0%) | 42 (100.0%) |
| 5 Years | 0 (0.0%) | 0 (0.0%) |
| 6 to 11 Years | 0 (0.0%) | 0 (0.0%) |
| 12 to 14 Years | 0 (0.0%) | 0 (0.0%) |
| 15 Years | 0 (0.0%) | 0 (0.0%) |
| 16 and 17 Years | 0 (0.0%) | 11 (100.0%) |
| 18 to 24 Years | 0 (0.0%) | 11 (100.0%) |
| 25 to 34 Years | 14 (100.0%) | 17 (100.0%) |
| 35 to 44 Years | 0 (0.0%) | 0 (0.0%) |
| 45 to 54 Years | 0 (0.0%) | 18 (100.0%) |
| 55 to 64 Years | 31 (100.0%) | 26 (100.0%) |
| 65 to 74 Years | 26 (100.0%) | 18 (100.0%) |
| 75 Years and over | 4 (100.0%) | 17 (100.0%) |
| Total | 75 (100.0%) | 160 (100.0%) |
Income Below Poverty Among Married-Couple Families in Fishing Creek
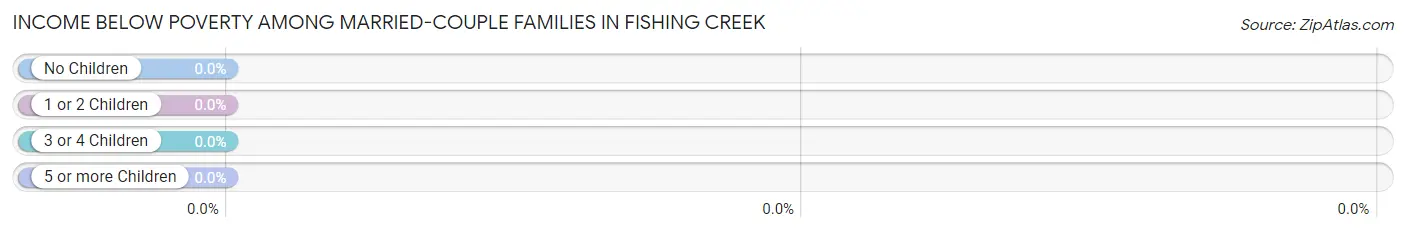
| Children | Above Poverty | Below Poverty |
| No Children | 56 (100.0%) | 0 (0.0%) |
| 1 or 2 Children | 0 (0.0%) | 0 (0.0%) |
| 3 or 4 Children | 17 (100.0%) | 0 (0.0%) |
| 5 or more Children | 0 (0.0%) | 0 (0.0%) |
| Total | 73 (100.0%) | 0 (0.0%) |
Income Below Poverty Among Single-Parent Households in Fishing Creek
| Children | Single Father | Single Mother |
| No Children | 0 (0.0%) | 0 (0.0%) |
| 1 or 2 Children | 0 (0.0%) | 0 (0.0%) |
| 3 or 4 Children | 0 (0.0%) | 0 (0.0%) |
| 5 or more Children | 0 (0.0%) | 0 (0.0%) |
| Total | 0 (0.0%) | 0 (0.0%) |
Income Below Poverty Among Married-Couple vs Single-Parent Households in Fishing Creek
| Children | Married-Couple Families | Single-Parent Households |
| No Children | 0 (0.0%) | 0 (0.0%) |
| 1 or 2 Children | 0 (0.0%) | 0 (0.0%) |
| 3 or 4 Children | 0 (0.0%) | 0 (0.0%) |
| 5 or more Children | 0 (0.0%) | 0 (0.0%) |
| Total | 0 (0.0%) | 0 (0.0%) |
Race in Fishing Creek
The most populous races in Fishing Creek are , and White / Caucasian (235 | 100.0%).
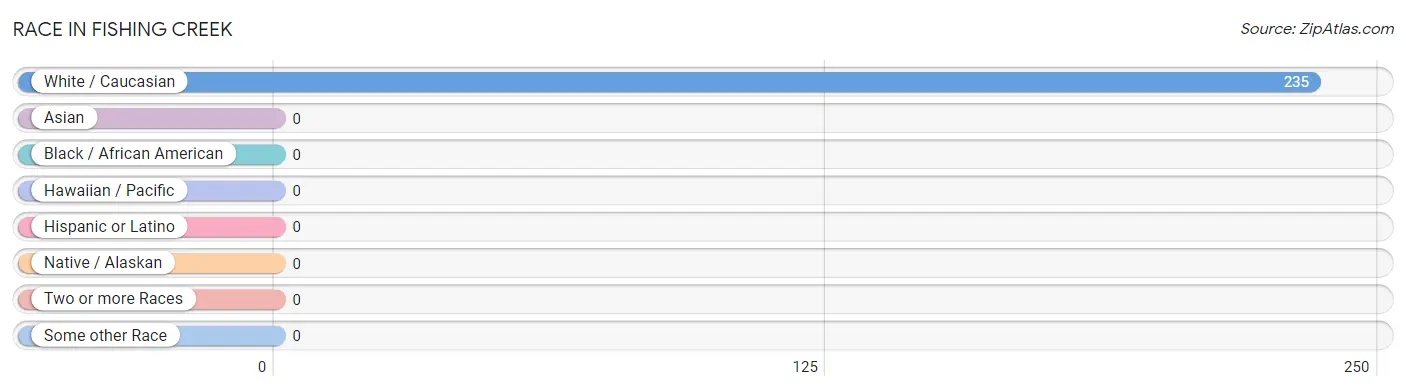
| Race | # Population | % Population |
| Asian | 0 | 0.0% |
| Black / African American | 0 | 0.0% |
| Hawaiian / Pacific | 0 | 0.0% |
| Hispanic or Latino | 0 | 0.0% |
| Native / Alaskan | 0 | 0.0% |
| White / Caucasian | 235 | 100.0% |
| Two or more Races | 0 | 0.0% |
| Some other Race | 0 | 0.0% |
| Total | 235 | 100.0% |
Ancestry in Fishing Creek
The most populous ancestries reported in Fishing Creek are German (40 | 17.0%), English (36 | 15.3%), Irish (19 | 8.1%), Italian (18 | 7.7%), and American (6 | 2.5%), together accounting for 50.6% of all Fishing Creek residents.
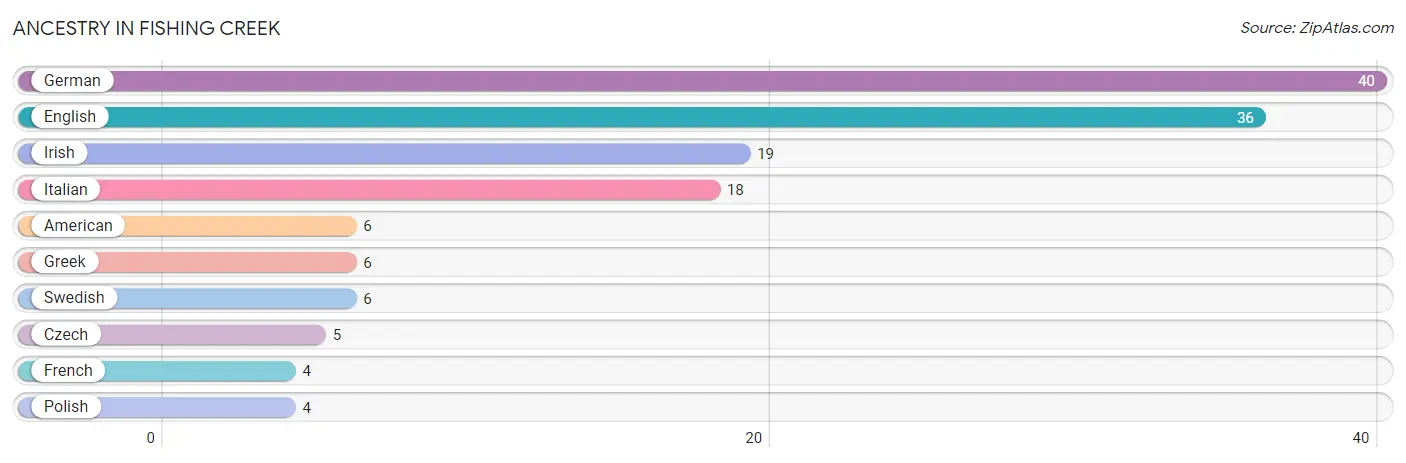
| Ancestry | # Population | % Population |
| American | 6 | 2.5% |
| Czech | 5 | 2.1% |
| English | 36 | 15.3% |
| French | 4 | 1.7% |
| German | 40 | 17.0% |
| Greek | 6 | 2.5% |
| Irish | 19 | 8.1% |
| Italian | 18 | 7.7% |
| Polish | 4 | 1.7% |
| Swedish | 6 | 2.5% | View All 10 Rows |
Immigrants in Fishing Creek

| Immigration Origin | # Population | % Population | View All 0 Rows |
Sex and Age in Fishing Creek
Sex and Age in Fishing Creek
The most populous age groups in Fishing Creek are 70 to 74 Years (26 | 34.7%) for men and Under 5 Years (42 | 26.3%) for women.
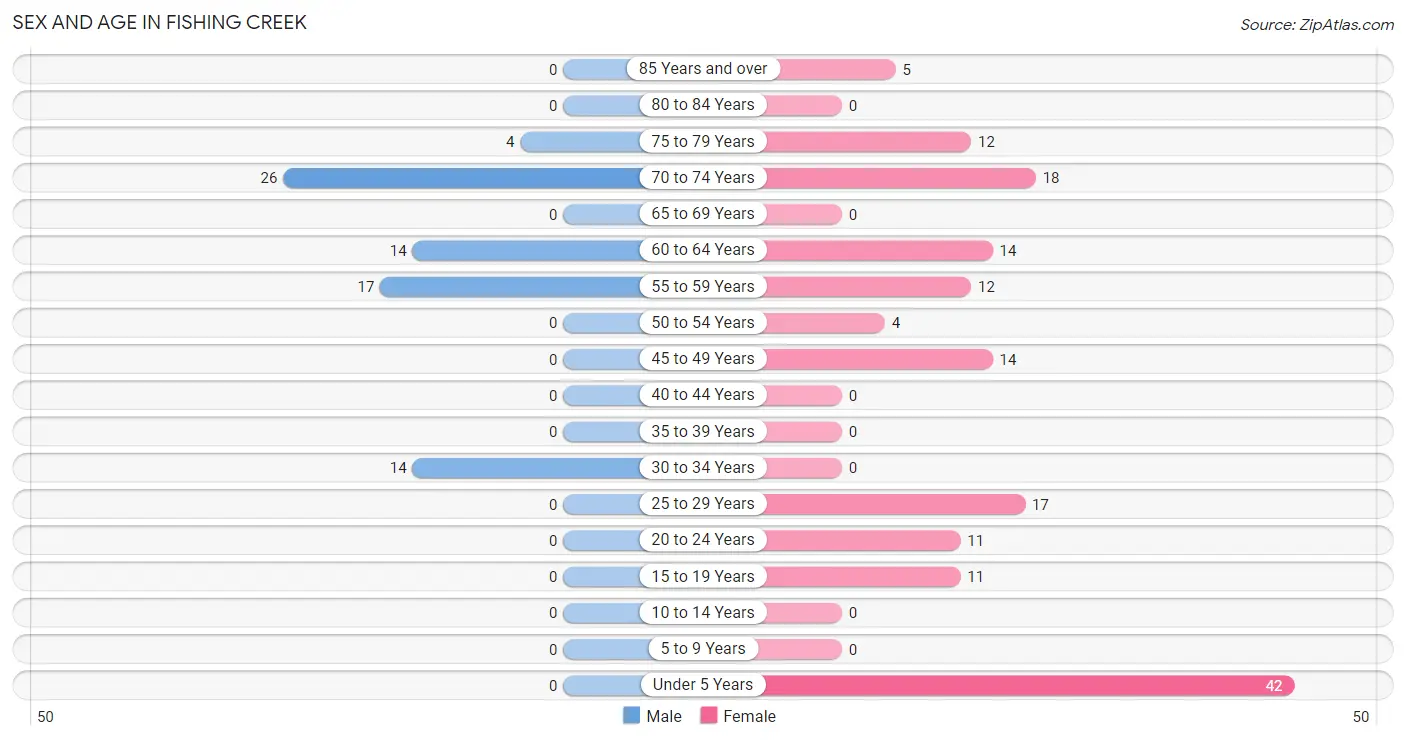
| Age Bracket | Male | Female |
| Under 5 Years | 0 (0.0%) | 42 (26.3%) |
| 5 to 9 Years | 0 (0.0%) | 0 (0.0%) |
| 10 to 14 Years | 0 (0.0%) | 0 (0.0%) |
| 15 to 19 Years | 0 (0.0%) | 11 (6.9%) |
| 20 to 24 Years | 0 (0.0%) | 11 (6.9%) |
| 25 to 29 Years | 0 (0.0%) | 17 (10.6%) |
| 30 to 34 Years | 14 (18.7%) | 0 (0.0%) |
| 35 to 39 Years | 0 (0.0%) | 0 (0.0%) |
| 40 to 44 Years | 0 (0.0%) | 0 (0.0%) |
| 45 to 49 Years | 0 (0.0%) | 14 (8.7%) |
| 50 to 54 Years | 0 (0.0%) | 4 (2.5%) |
| 55 to 59 Years | 17 (22.7%) | 12 (7.5%) |
| 60 to 64 Years | 14 (18.7%) | 14 (8.7%) |
| 65 to 69 Years | 0 (0.0%) | 0 (0.0%) |
| 70 to 74 Years | 26 (34.7%) | 18 (11.3%) |
| 75 to 79 Years | 4 (5.3%) | 12 (7.5%) |
| 80 to 84 Years | 0 (0.0%) | 0 (0.0%) |
| 85 Years and over | 0 (0.0%) | 5 (3.1%) |
| Total | 75 (100.0%) | 160 (100.0%) |
Families and Households in Fishing Creek
Median Family Size in Fishing Creek
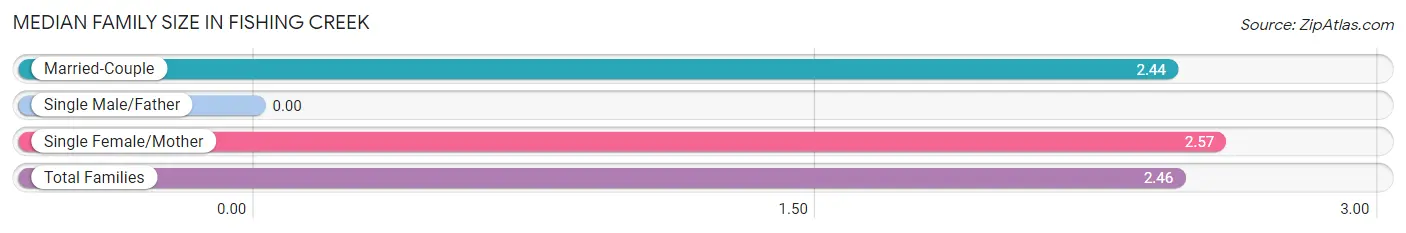
| Family Type | # Families | Family Size |
| Married-Couple | 73 (83.9%) | 2.44 |
| Single Male/Father | 0 (0.0%) | - |
| Single Female/Mother | 14 (16.1%) | 2.57 |
| Total Families | 87 (100.0%) | 2.46 |
Median Household Size in Fishing Creek
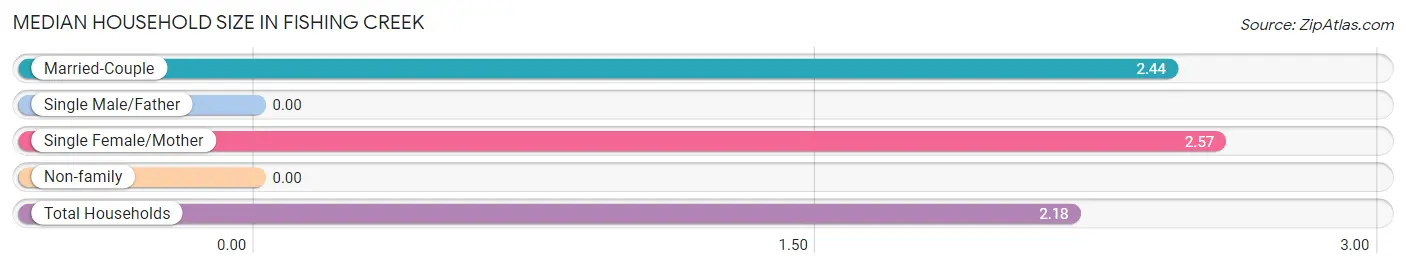
| Household Type | # Households | Household Size |
| Married-Couple | 73 (67.6%) | 2.44 |
| Single Male/Father | 0 (0.0%) | - |
| Single Female/Mother | 14 (13.0%) | 2.57 |
| Non-family | 21 (19.4%) | - |
| Total Households | 108 (100.0%) | 2.18 |
Household Size by Marriage Status in Fishing Creek
Out of a total of 108 households in Fishing Creek, 87 (80.6%) are family households, while 21 (19.4%) are nonfamily households. The most numerous type of family households are 2-person households, comprising 56, and the most common type of nonfamily households are 1-person households, comprising 21.
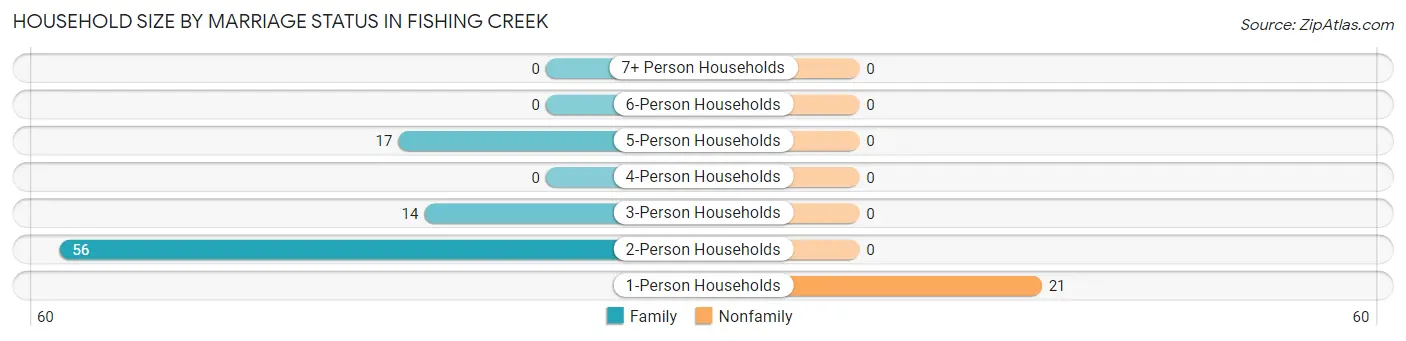
| Household Size | Family Households | Nonfamily Households |
| 1-Person Households | - | 21 (19.4%) |
| 2-Person Households | 56 (51.8%) | 0 (0.0%) |
| 3-Person Households | 14 (13.0%) | 0 (0.0%) |
| 4-Person Households | 0 (0.0%) | 0 (0.0%) |
| 5-Person Households | 17 (15.7%) | 0 (0.0%) |
| 6-Person Households | 0 (0.0%) | 0 (0.0%) |
| 7+ Person Households | 0 (0.0%) | 0 (0.0%) |
| Total | 87 (80.6%) | 21 (19.4%) |
Female Fertility in Fishing Creek
Fertility by Age in Fishing Creek
Average fertility rate in Fishing Creek is 321.0 births per 1,000 women. Women in the age bracket of 20 to 34 years have the highest fertility rate with 607.0 births per 1,000 women. Women in the age bracket of 20 to 34 years acount for 100.0% of all women with births.
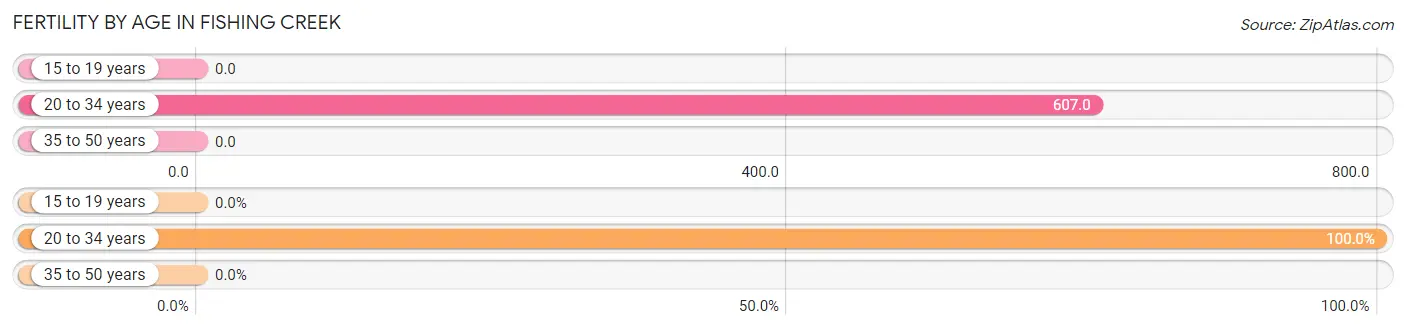
| Age Bracket | Women with Births | Births / 1,000 Women |
| 15 to 19 years | 0 (0.0%) | 0.0 |
| 20 to 34 years | 17 (100.0%) | 607.0 |
| 35 to 50 years | 0 (0.0%) | 0.0 |
| Total | 17 (100.0%) | 321.0 |
Fertility by Age by Marriage Status in Fishing Creek
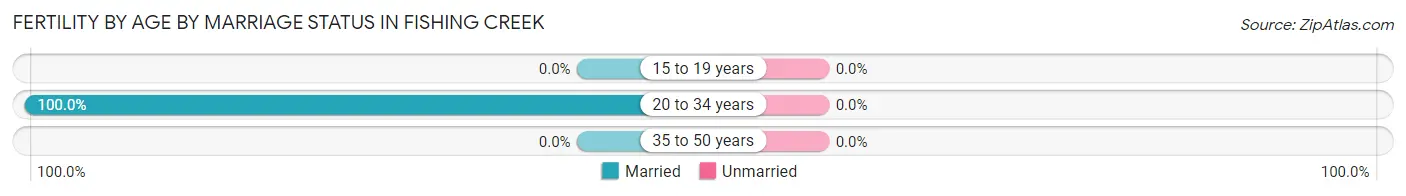
| Age Bracket | Married | Unmarried |
| 15 to 19 years | 0 (0.0%) | 0 (0.0%) |
| 20 to 34 years | 17 (100.0%) | 0 (0.0%) |
| 35 to 50 years | 0 (0.0%) | 0 (0.0%) |
| Total | 17 (100.0%) | 0 (0.0%) |
Fertility by Education in Fishing Creek
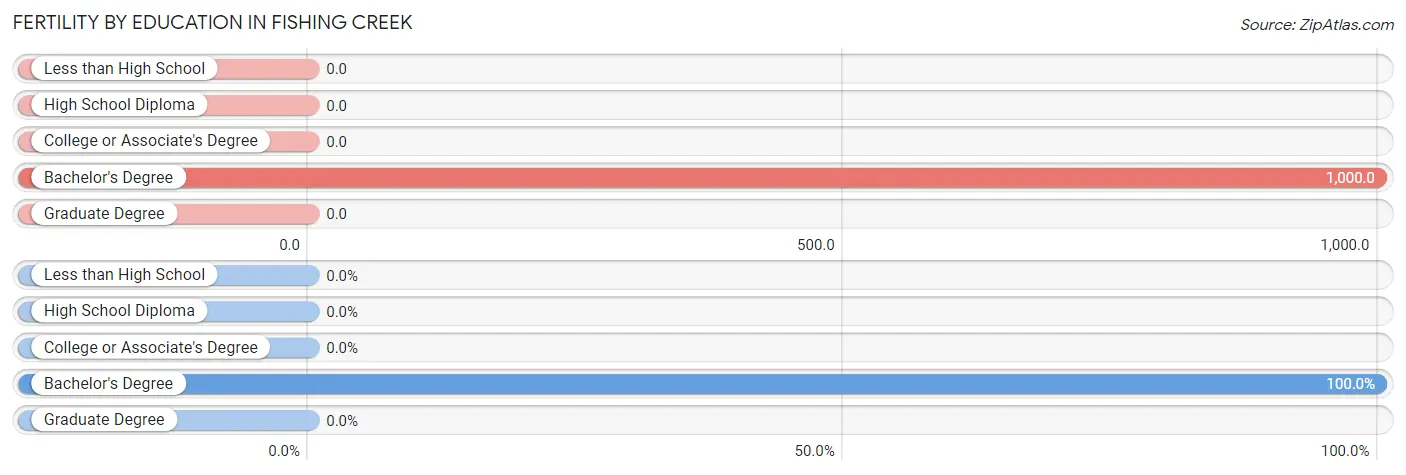
| Educational Attainment | Women with Births | Births / 1,000 Women |
| Less than High School | 0 (0.0%) | 0.0 |
| High School Diploma | 0 (0.0%) | 0.0 |
| College or Associate's Degree | 0 (0.0%) | 0.0 |
| Bachelor's Degree | 17 (100.0%) | 1,000.0 |
| Graduate Degree | 0 (0.0%) | 0.0 |
| Total | 17 (100.0%) | 321.0 |
Fertility by Education by Marriage Status in Fishing Creek
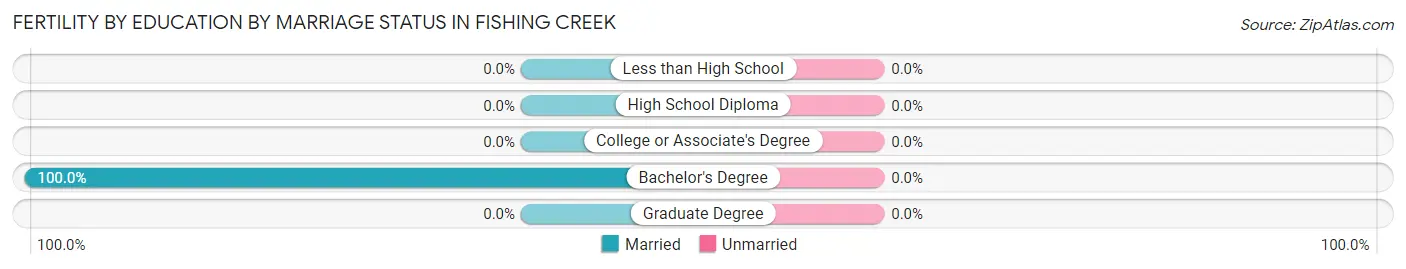
| Educational Attainment | Married | Unmarried |
| Less than High School | 0 (0.0%) | 0 (0.0%) |
| High School Diploma | 0 (0.0%) | 0 (0.0%) |
| College or Associate's Degree | 0 (0.0%) | 0 (0.0%) |
| Bachelor's Degree | 17 (100.0%) | 0 (0.0%) |
| Graduate Degree | 0 (0.0%) | 0 (0.0%) |
| Total | 17 (100.0%) | 0 (0.0%) |
Employment Characteristics in Fishing Creek
Employment by Class of Employer in Fishing Creek
Among the 88 employed individuals in Fishing Creek, private company employees (68 | 77.3%), self-employed (not incorporated) (16 | 18.2%), and federal government employees (4 | 4.5%) make up the most common classes of employment.
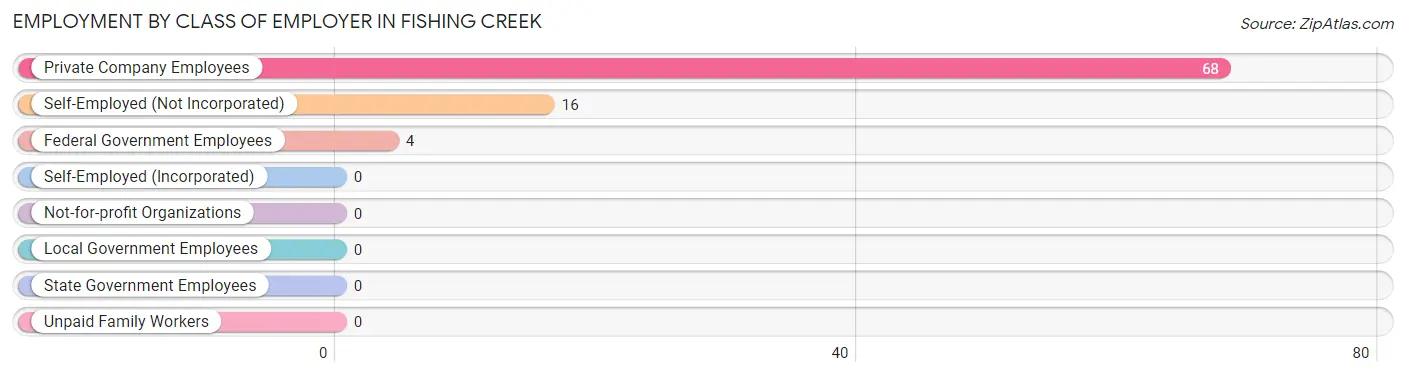
| Employer Class | # Employees | % Employees |
| Private Company Employees | 68 | 77.3% |
| Self-Employed (Incorporated) | 0 | 0.0% |
| Self-Employed (Not Incorporated) | 16 | 18.2% |
| Not-for-profit Organizations | 0 | 0.0% |
| Local Government Employees | 0 | 0.0% |
| State Government Employees | 0 | 0.0% |
| Federal Government Employees | 4 | 4.5% |
| Unpaid Family Workers | 0 | 0.0% |
| Total | 88 | 100.0% |
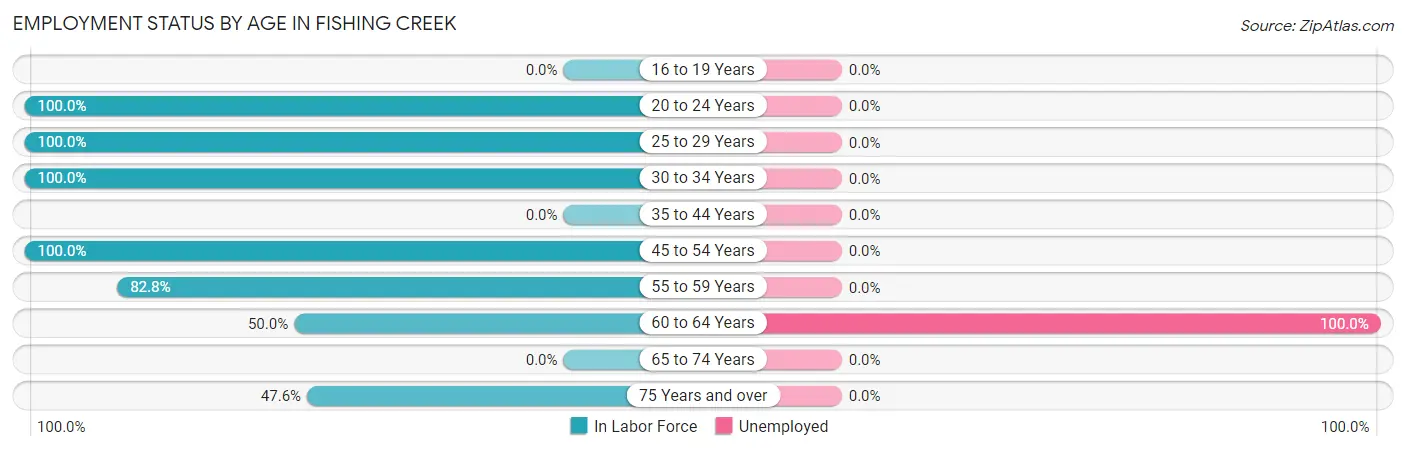
Employment Status by Age in Fishing Creek
According to the labor force statistics for Fishing Creek, out of the total population over 16 years of age (193), 56.0% or 108 individuals are in the labor force, with 13.0% or 14 of them unemployed. The age group with the highest labor force participation rate is 20 to 24 years, with 100.0% or 11 individuals in the labor force. Within the labor force, the 60 to 64 years age range has the highest percentage of unemployed individuals, with 100.0% or 14 of them being unemployed.
| Age Bracket | In Labor Force | Unemployed |
| 16 to 19 Years | 0 (0.0%) | 0 (0.0%) |
| 20 to 24 Years | 11 (100.0%) | 0 (0.0%) |
| 25 to 29 Years | 17 (100.0%) | 0 (0.0%) |
| 30 to 34 Years | 14 (100.0%) | 0 (0.0%) |
| 35 to 44 Years | 0 (0.0%) | 0 (0.0%) |
| 45 to 54 Years | 18 (100.0%) | 0 (0.0%) |
| 55 to 59 Years | 24 (82.8%) | 0 (0.0%) |
| 60 to 64 Years | 14 (50.0%) | 14 (100.0%) |
| 65 to 74 Years | 0 (0.0%) | 0 (0.0%) |
| 75 Years and over | 10 (47.6%) | 0 (0.0%) |
| Total | 108 (56.0%) | 14 (13.0%) |
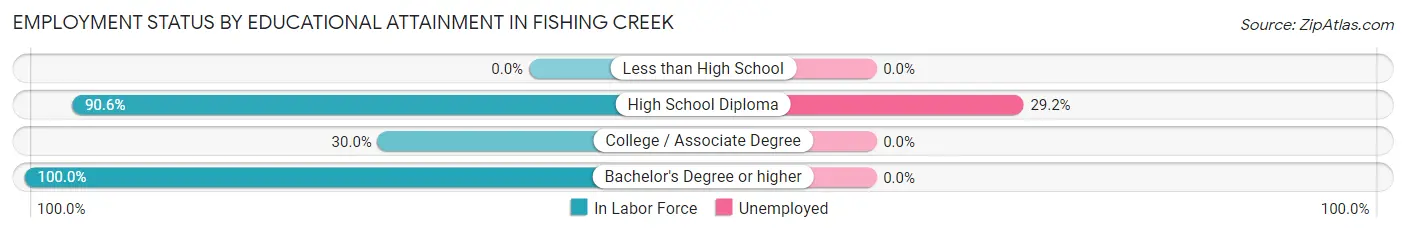
Employment Status by Educational Attainment in Fishing Creek
According to labor force statistics for Fishing Creek, 82.1% of individuals (87) out of the total population between 25 and 64 years of age (106) are in the labor force, with 16.1% or 14 of them being unemployed. The group with the highest labor force participation rate are those with the educational attainment of bachelor's degree or higher, with 100.0% or 33 individuals in the labor force. Within the labor force, individuals with high school diploma education have the highest percentage of unemployment, with 29.2% or 14 of them being unemployed.
| Educational Attainment | In Labor Force | Unemployed |
| Less than High School | 0 (0.0%) | 0 (0.0%) |
| High School Diploma | 48 (90.6%) | 15 (29.2%) |
| College / Associate Degree | 6 (30.0%) | 0 (0.0%) |
| Bachelor's Degree or higher | 33 (100.0%) | 0 (0.0%) |
| Total | 87 (82.1%) | 17 (16.1%) |
Employment Occupations by Sex in Fishing Creek
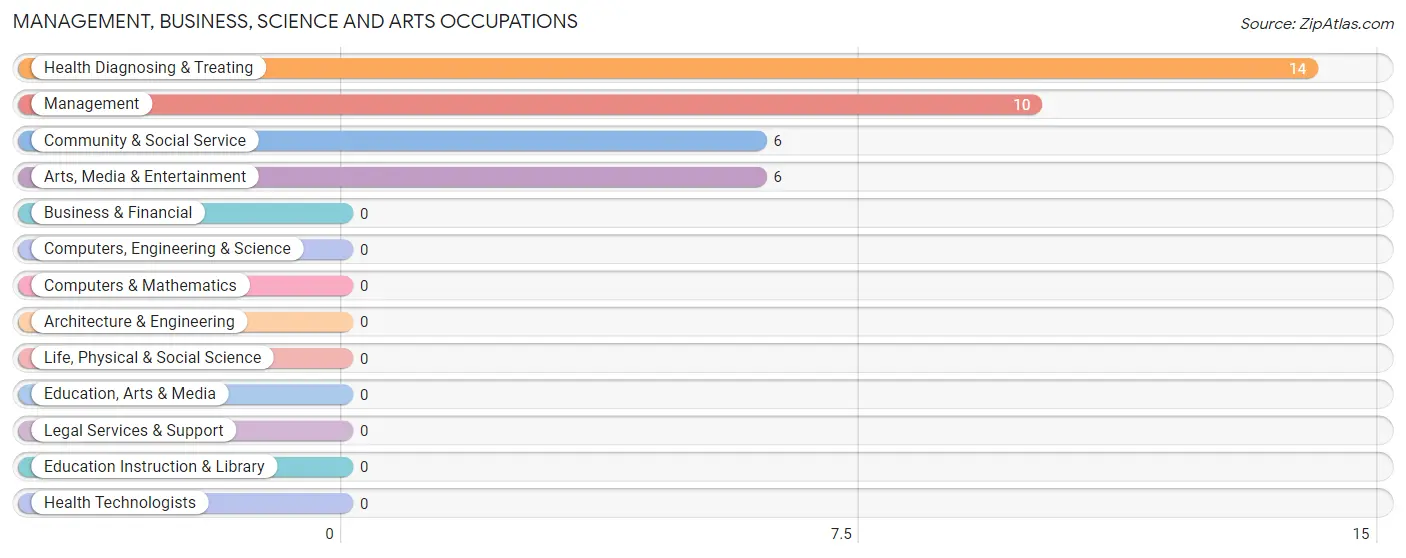
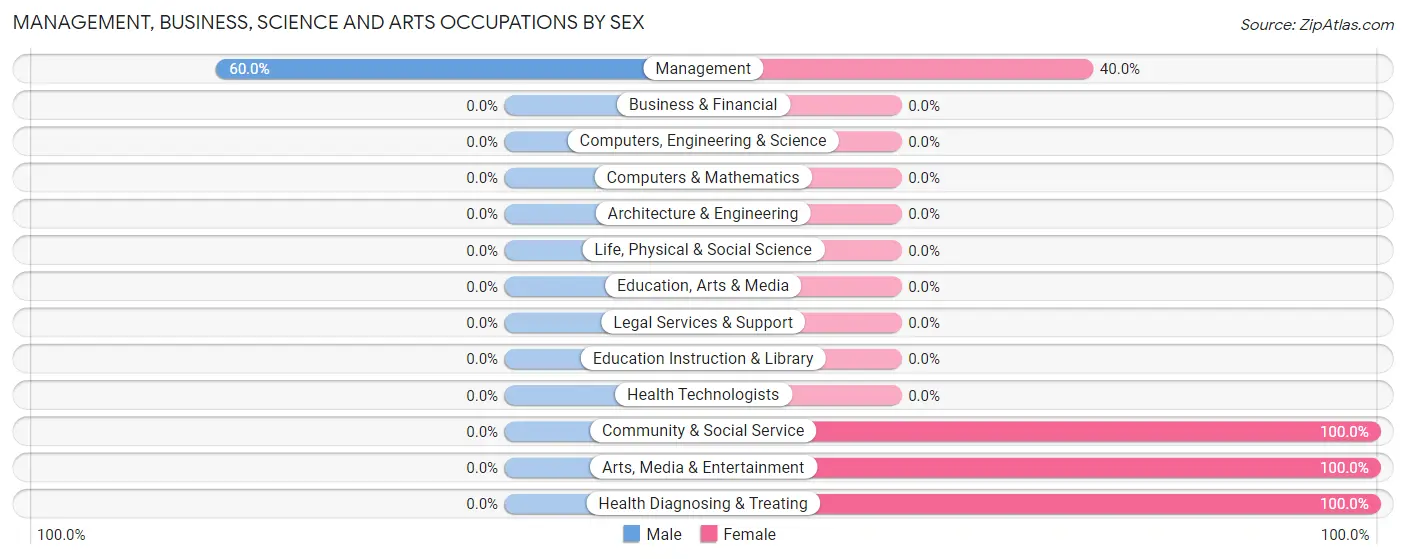
Management, Business, Science and Arts Occupations
The most common Management, Business, Science and Arts occupations in Fishing Creek are Health Diagnosing & Treating (14 | 14.9%), Management (10 | 10.6%), Community & Social Service (6 | 6.4%), and Arts, Media & Entertainment (6 | 6.4%).
Management, Business, Science and Arts Occupations by Sex
| Occupation | Male | Female |
| Management | 6 (60.0%) | 4 (40.0%) |
| Business & Financial | 0 (0.0%) | 0 (0.0%) |
| Computers, Engineering & Science | 0 (0.0%) | 0 (0.0%) |
| Computers & Mathematics | 0 (0.0%) | 0 (0.0%) |
| Architecture & Engineering | 0 (0.0%) | 0 (0.0%) |
| Life, Physical & Social Science | 0 (0.0%) | 0 (0.0%) |
| Community & Social Service | 0 (0.0%) | 6 (100.0%) |
| Education, Arts & Media | 0 (0.0%) | 0 (0.0%) |
| Legal Services & Support | 0 (0.0%) | 0 (0.0%) |
| Education Instruction & Library | 0 (0.0%) | 0 (0.0%) |
| Arts, Media & Entertainment | 0 (0.0%) | 6 (100.0%) |
| Health Diagnosing & Treating | 0 (0.0%) | 14 (100.0%) |
| Health Technologists | 0 (0.0%) | 0 (0.0%) |
| Total (Category) | 6 (20.0%) | 24 (80.0%) |
| Total (Overall) | 30 (31.9%) | 64 (68.1%) |
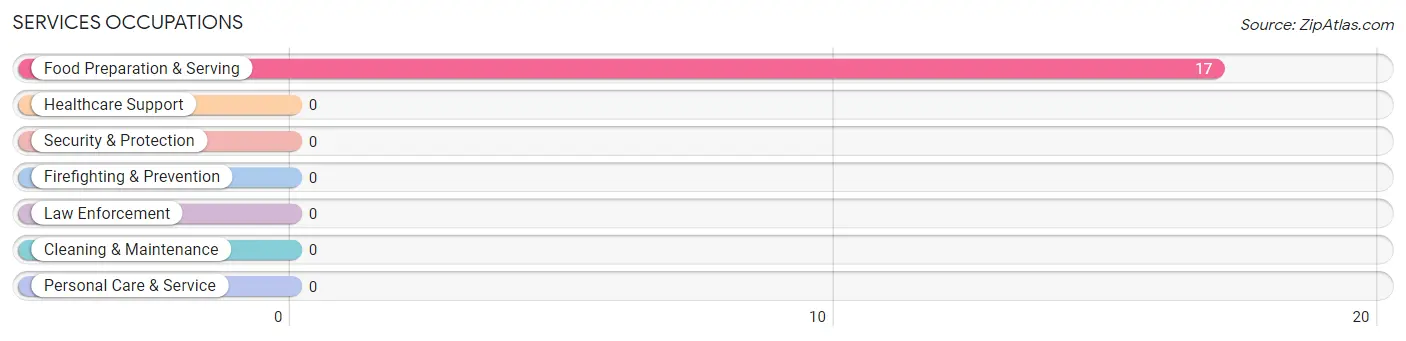
Services Occupations
The most common Services occupations in Fishing Creek are , and Food Preparation & Serving (17 | 18.1%).
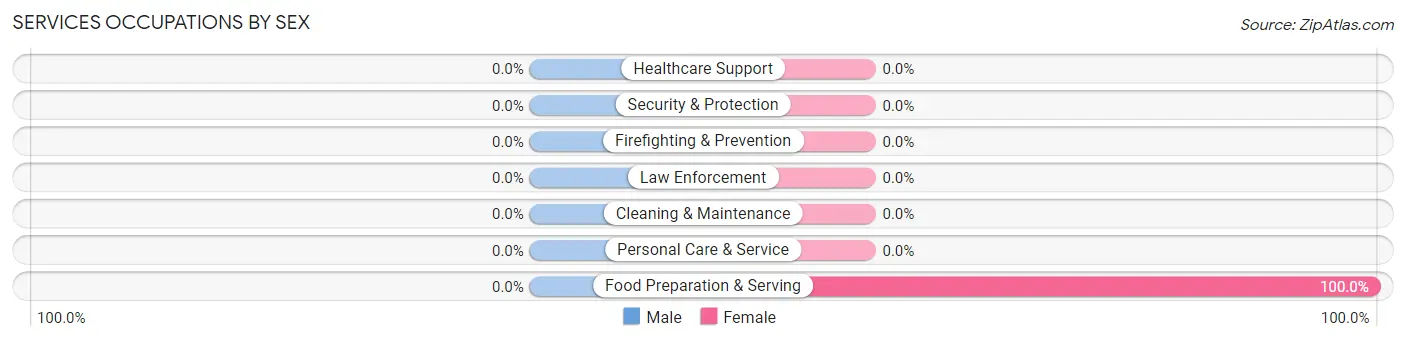
Services Occupations by Sex
| Occupation | Male | Female |
| Healthcare Support | 0 (0.0%) | 0 (0.0%) |
| Security & Protection | 0 (0.0%) | 0 (0.0%) |
| Firefighting & Prevention | 0 (0.0%) | 0 (0.0%) |
| Law Enforcement | 0 (0.0%) | 0 (0.0%) |
| Food Preparation & Serving | 0 (0.0%) | 17 (100.0%) |
| Cleaning & Maintenance | 0 (0.0%) | 0 (0.0%) |
| Personal Care & Service | 0 (0.0%) | 0 (0.0%) |
| Total (Category) | 0 (0.0%) | 17 (100.0%) |
| Total (Overall) | 30 (31.9%) | 64 (68.1%) |
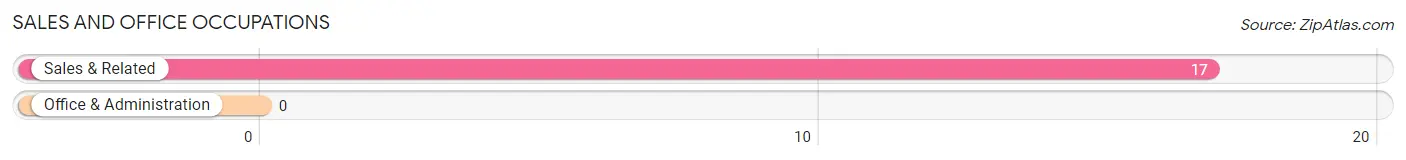
Sales and Office Occupations
The most common Sales and Office occupations in Fishing Creek are , and Sales & Related (17 | 18.1%).
Sales and Office Occupations by Sex

| Occupation | Male | Female |
| Sales & Related | 0 (0.0%) | 17 (100.0%) |
| Office & Administration | 0 (0.0%) | 0 (0.0%) |
| Total (Category) | 0 (0.0%) | 17 (100.0%) |
| Total (Overall) | 30 (31.9%) | 64 (68.1%) |
Natural Resources, Construction and Maintenance Occupations
The most common Natural Resources, Construction and Maintenance occupations in Fishing Creek are , and Farming, Fishing & Forestry (18 | 19.2%).
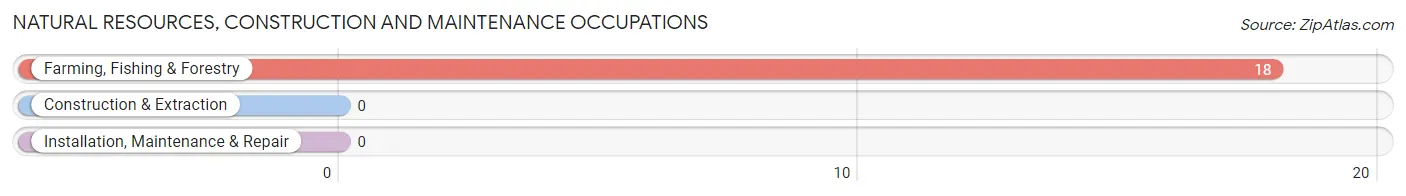
Natural Resources, Construction and Maintenance Occupations by Sex
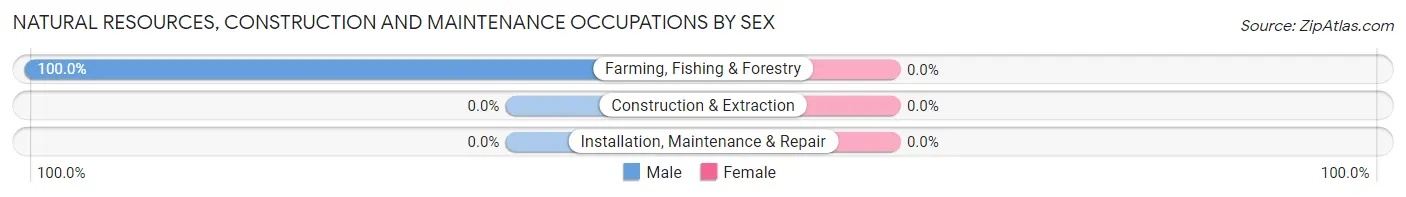
| Occupation | Male | Female |
| Farming, Fishing & Forestry | 18 (100.0%) | 0 (0.0%) |
| Construction & Extraction | 0 (0.0%) | 0 (0.0%) |
| Installation, Maintenance & Repair | 0 (0.0%) | 0 (0.0%) |
| Total (Category) | 18 (100.0%) | 0 (0.0%) |
| Total (Overall) | 30 (31.9%) | 64 (68.1%) |
Production, Transportation and Moving Occupations
The most common Production, Transportation and Moving occupations in Fishing Creek are Production (6 | 6.4%), and Transportation (6 | 6.4%).
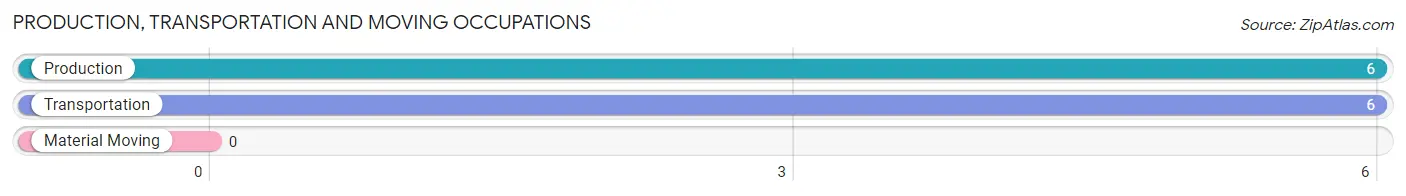
Production, Transportation and Moving Occupations by Sex
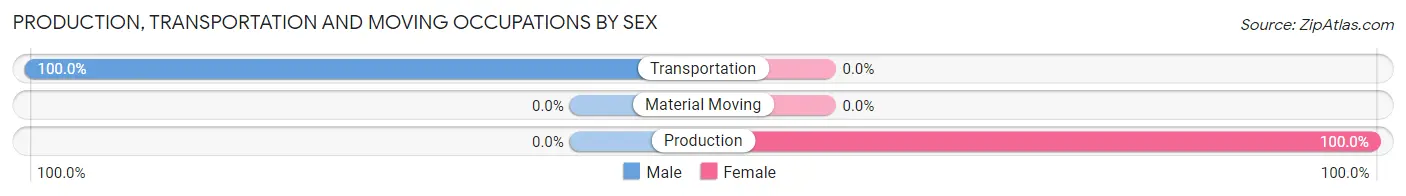
| Occupation | Male | Female |
| Production | 0 (0.0%) | 6 (100.0%) |
| Transportation | 6 (100.0%) | 0 (0.0%) |
| Material Moving | 0 (0.0%) | 0 (0.0%) |
| Total (Category) | 6 (50.0%) | 6 (50.0%) |
| Total (Overall) | 30 (31.9%) | 64 (68.1%) |
Employment Industries by Sex in Fishing Creek
Employment Industries in Fishing Creek
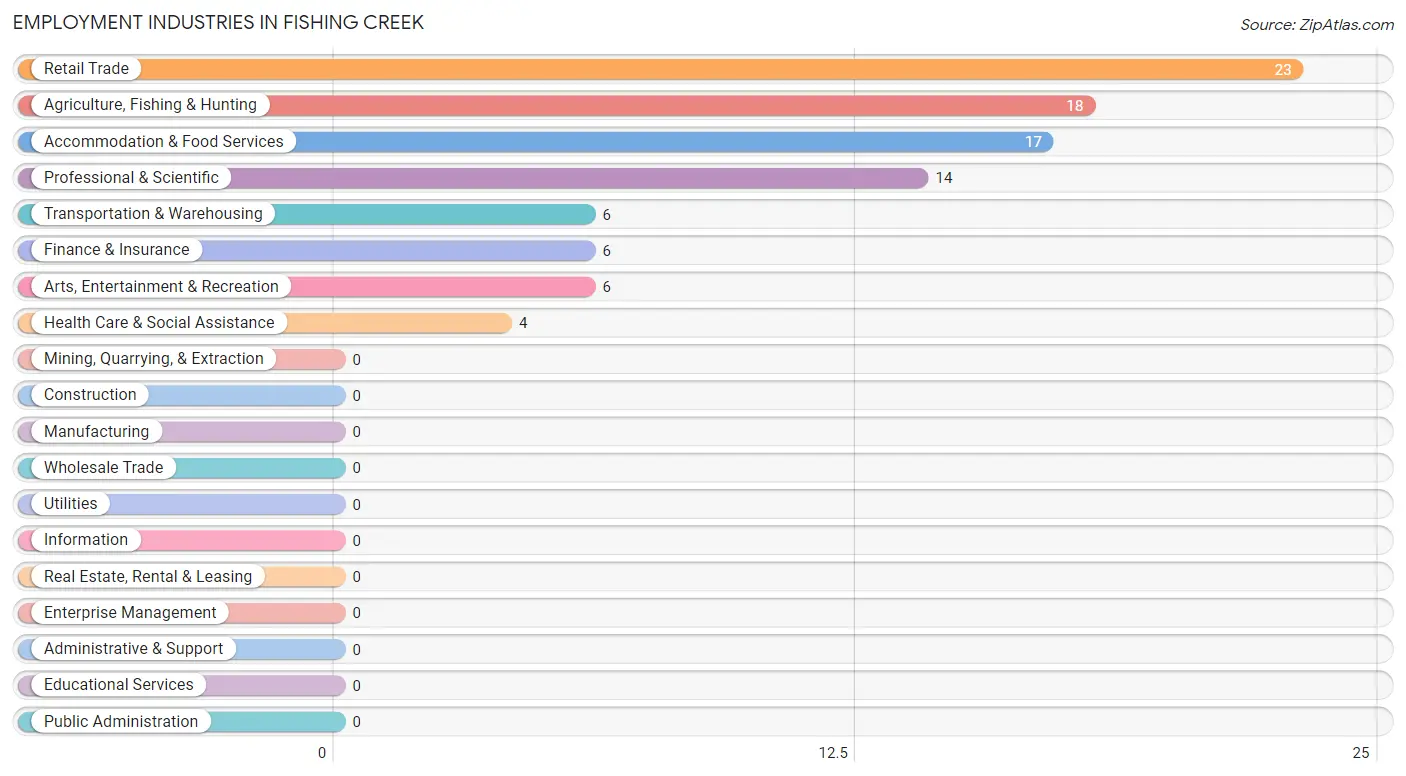
The major employment industries in Fishing Creek include Retail Trade (23 | 24.5%), Agriculture, Fishing & Hunting (18 | 19.2%), Accommodation & Food Services (17 | 18.1%), Professional & Scientific (14 | 14.9%), and Transportation & Warehousing (6 | 6.4%).
Employment Industries by Sex in Fishing Creek
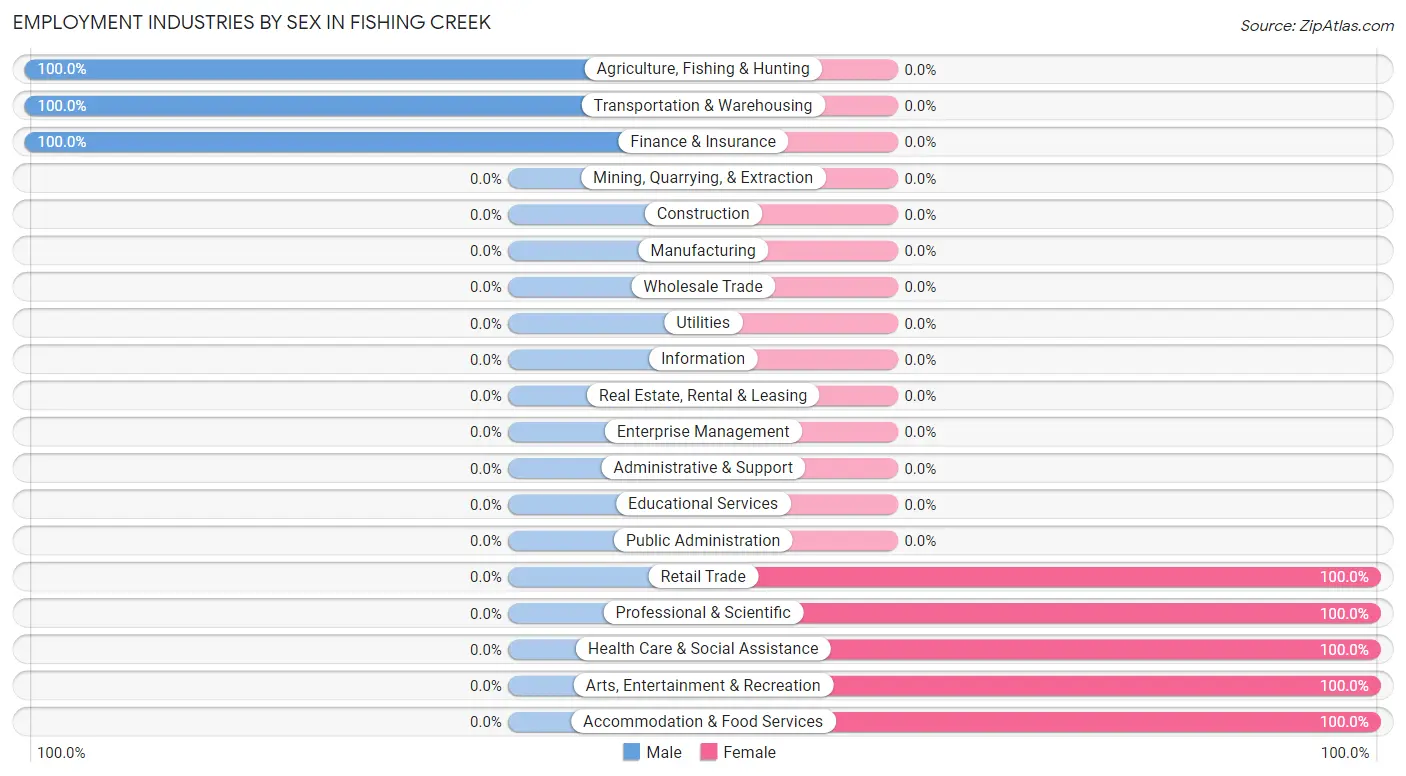
The Fishing Creek industries that see more men than women are Agriculture, Fishing & Hunting (100.0%), Transportation & Warehousing (100.0%), and Finance & Insurance (100.0%), whereas the industries that tend to have a higher number of women are Retail Trade (100.0%), Professional & Scientific (100.0%), and Health Care & Social Assistance (100.0%).
| Industry | Male | Female |
| Agriculture, Fishing & Hunting | 18 (100.0%) | 0 (0.0%) |
| Mining, Quarrying, & Extraction | 0 (0.0%) | 0 (0.0%) |
| Construction | 0 (0.0%) | 0 (0.0%) |
| Manufacturing | 0 (0.0%) | 0 (0.0%) |
| Wholesale Trade | 0 (0.0%) | 0 (0.0%) |
| Retail Trade | 0 (0.0%) | 23 (100.0%) |
| Transportation & Warehousing | 6 (100.0%) | 0 (0.0%) |
| Utilities | 0 (0.0%) | 0 (0.0%) |
| Information | 0 (0.0%) | 0 (0.0%) |
| Finance & Insurance | 6 (100.0%) | 0 (0.0%) |
| Real Estate, Rental & Leasing | 0 (0.0%) | 0 (0.0%) |
| Professional & Scientific | 0 (0.0%) | 14 (100.0%) |
| Enterprise Management | 0 (0.0%) | 0 (0.0%) |
| Administrative & Support | 0 (0.0%) | 0 (0.0%) |
| Educational Services | 0 (0.0%) | 0 (0.0%) |
| Health Care & Social Assistance | 0 (0.0%) | 4 (100.0%) |
| Arts, Entertainment & Recreation | 0 (0.0%) | 6 (100.0%) |
| Accommodation & Food Services | 0 (0.0%) | 17 (100.0%) |
| Public Administration | 0 (0.0%) | 0 (0.0%) |
| Total | 30 (31.9%) | 64 (68.1%) |
Education in Fishing Creek
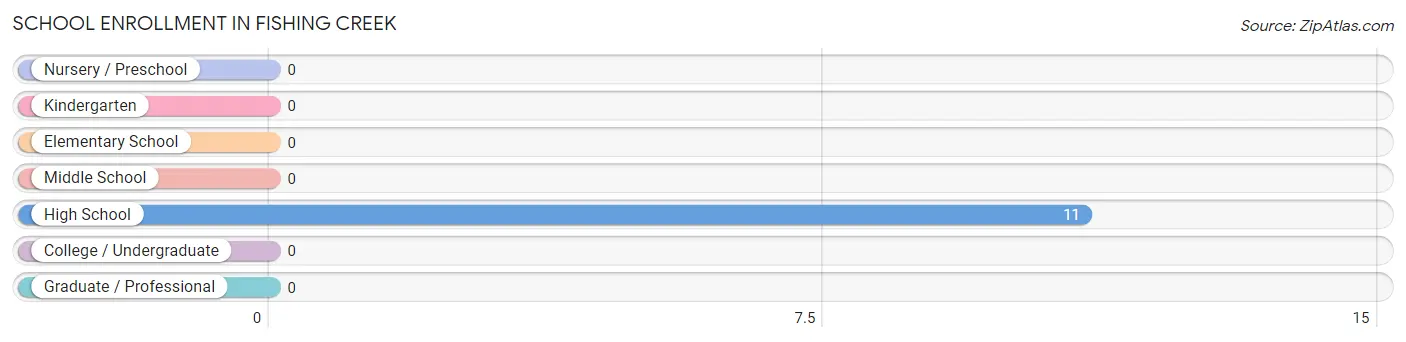
School Enrollment in Fishing Creek
| School Level | # Students | % Students |
| Nursery / Preschool | 0 | 0.0% |
| Kindergarten | 0 | 0.0% |
| Elementary School | 0 | 0.0% |
| Middle School | 0 | 0.0% |
| High School | 11 | 100.0% |
| College / Undergraduate | 0 | 0.0% |
| Graduate / Professional | 0 | 0.0% |
| Total | 11 | 100.0% |
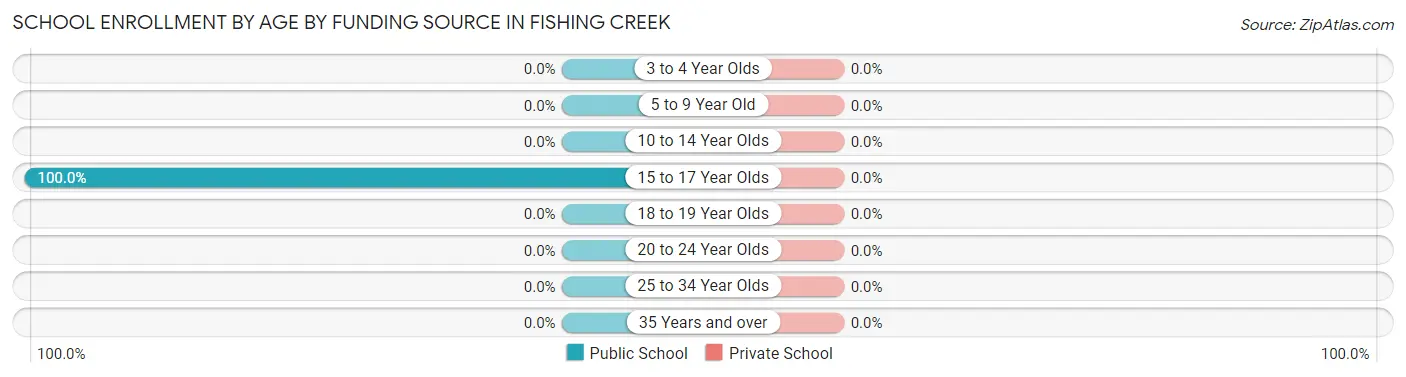
School Enrollment by Age by Funding Source in Fishing Creek
| Age Bracket | Public School | Private School |
| 3 to 4 Year Olds | 0 (0.0%) | 0 (0.0%) |
| 5 to 9 Year Old | 0 (0.0%) | 0 (0.0%) |
| 10 to 14 Year Olds | 0 (0.0%) | 0 (0.0%) |
| 15 to 17 Year Olds | 11 (100.0%) | 0 (0.0%) |
| 18 to 19 Year Olds | 0 (0.0%) | 0 (0.0%) |
| 20 to 24 Year Olds | 0 (0.0%) | 0 (0.0%) |
| 25 to 34 Year Olds | 0 (0.0%) | 0 (0.0%) |
| 35 Years and over | 0 (0.0%) | 0 (0.0%) |
| Total | 11 (100.0%) | 0 (0.0%) |
Educational Attainment by Field of Study in Fishing Creek
Arts & humanities (17 | 44.7%), visual & performing arts (11 | 28.9%), social sciences (6 | 15.8%), and science & technology (4 | 10.5%) are the most common fields of study among 38 individuals in Fishing Creek who have obtained a bachelor's degree or higher.
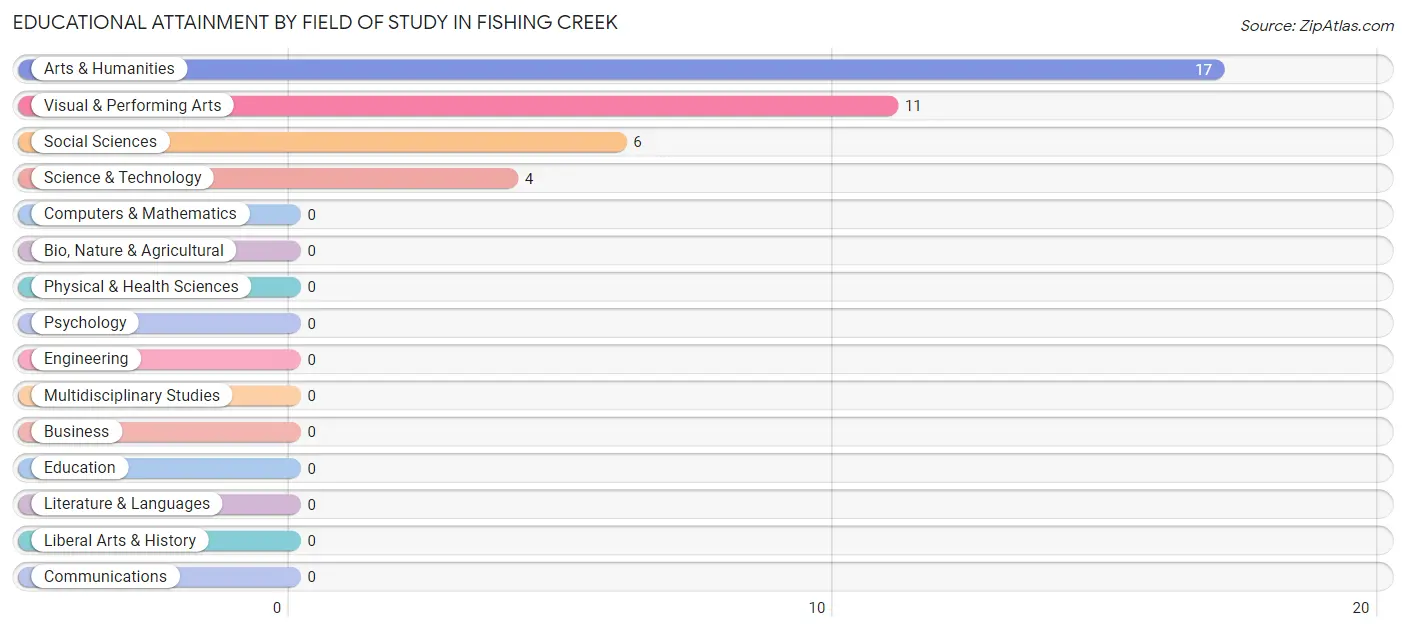
| Field of Study | # Graduates | % Graduates |
| Computers & Mathematics | 0 | 0.0% |
| Bio, Nature & Agricultural | 0 | 0.0% |
| Physical & Health Sciences | 0 | 0.0% |
| Psychology | 0 | 0.0% |
| Social Sciences | 6 | 15.8% |
| Engineering | 0 | 0.0% |
| Multidisciplinary Studies | 0 | 0.0% |
| Science & Technology | 4 | 10.5% |
| Business | 0 | 0.0% |
| Education | 0 | 0.0% |
| Literature & Languages | 0 | 0.0% |
| Liberal Arts & History | 0 | 0.0% |
| Visual & Performing Arts | 11 | 28.9% |
| Communications | 0 | 0.0% |
| Arts & Humanities | 17 | 44.7% |
| Total | 38 | 100.0% |
Transportation & Commute in Fishing Creek
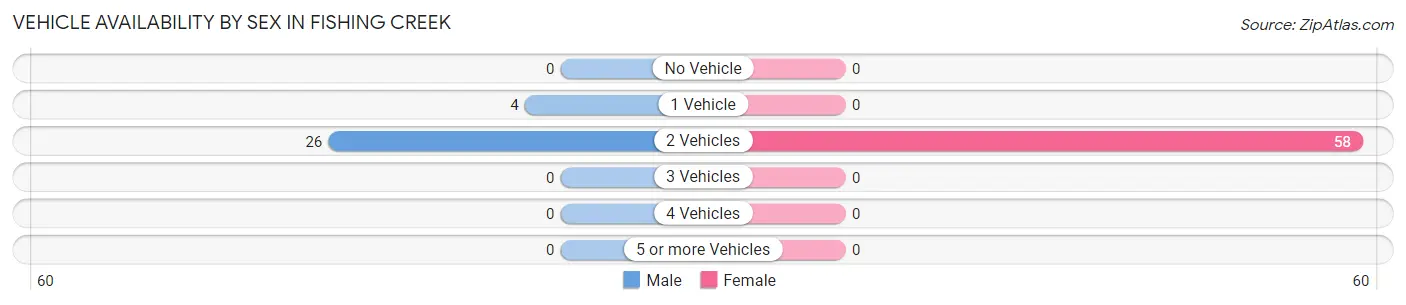
Vehicle Availability by Sex in Fishing Creek
The most prevalent vehicle ownership categories in Fishing Creek are males with 2 vehicles (26, accounting for 86.7%) and females with 2 vehicles (58, making up 44.8%).
| Vehicles Available | Male | Female |
| No Vehicle | 0 (0.0%) | 0 (0.0%) |
| 1 Vehicle | 4 (13.3%) | 0 (0.0%) |
| 2 Vehicles | 26 (86.7%) | 58 (100.0%) |
| 3 Vehicles | 0 (0.0%) | 0 (0.0%) |
| 4 Vehicles | 0 (0.0%) | 0 (0.0%) |
| 5 or more Vehicles | 0 (0.0%) | 0 (0.0%) |
| Total | 30 (100.0%) | 58 (100.0%) |
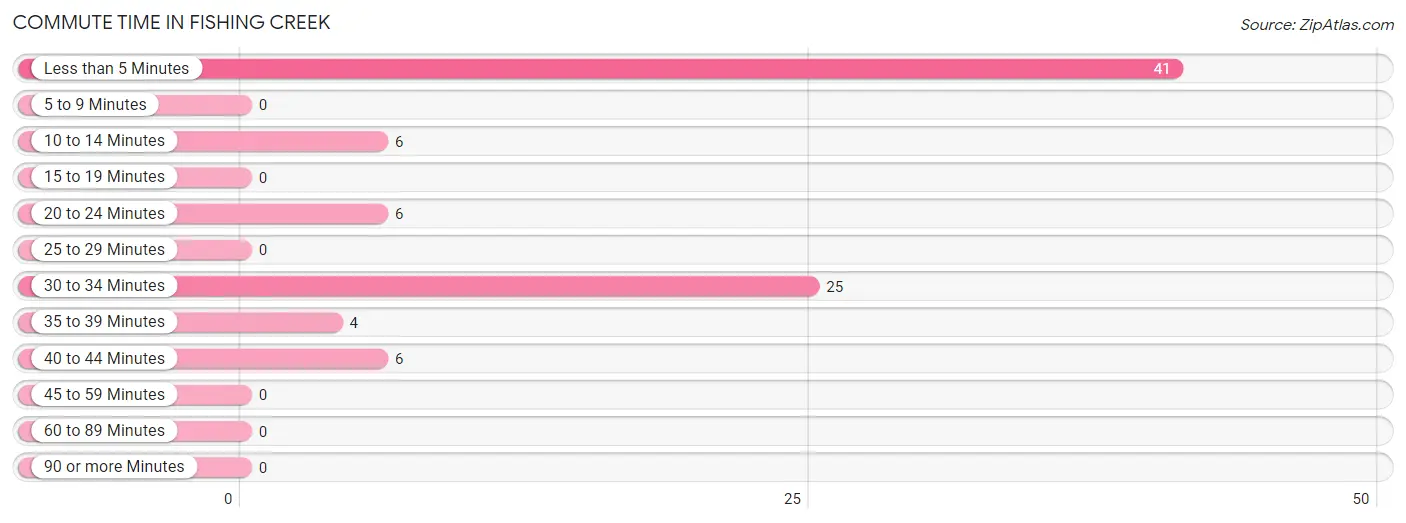
Commute Time in Fishing Creek
The most frequently occuring commute durations in Fishing Creek are less than 5 minutes (41 commuters, 46.6%), 30 to 34 minutes (25 commuters, 28.4%), and 10 to 14 minutes (6 commuters, 6.8%).
| Commute Time | # Commuters | % Commuters |
| Less than 5 Minutes | 41 | 46.6% |
| 5 to 9 Minutes | 0 | 0.0% |
| 10 to 14 Minutes | 6 | 6.8% |
| 15 to 19 Minutes | 0 | 0.0% |
| 20 to 24 Minutes | 6 | 6.8% |
| 25 to 29 Minutes | 0 | 0.0% |
| 30 to 34 Minutes | 25 | 28.4% |
| 35 to 39 Minutes | 4 | 4.5% |
| 40 to 44 Minutes | 6 | 6.8% |
| 45 to 59 Minutes | 0 | 0.0% |
| 60 to 89 Minutes | 0 | 0.0% |
| 90 or more Minutes | 0 | 0.0% |
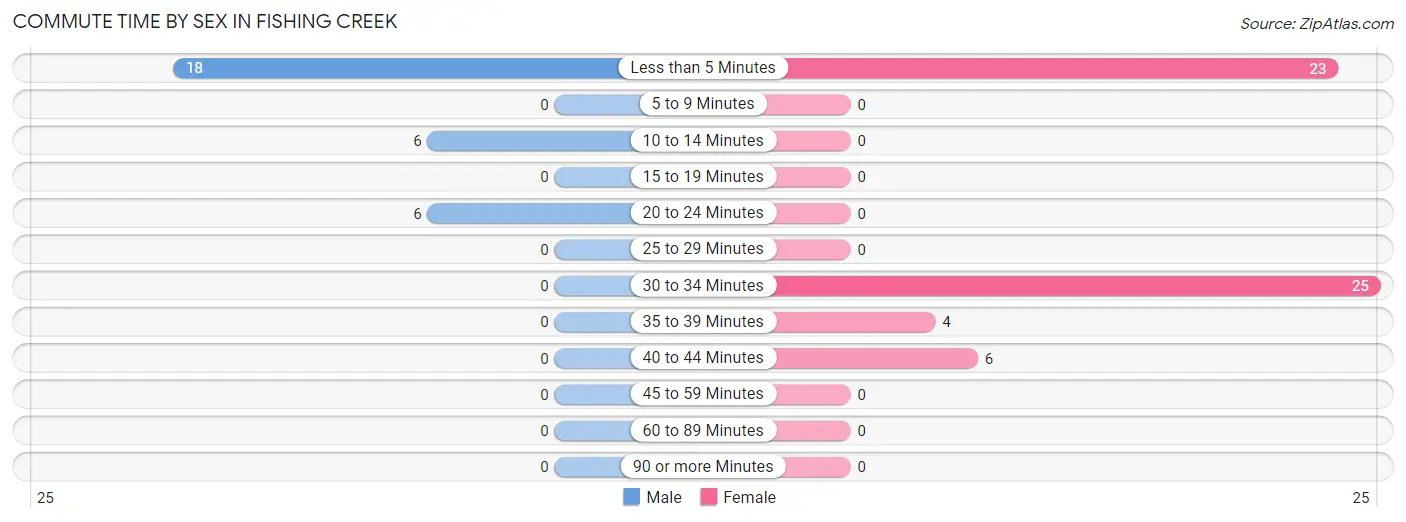
Commute Time by Sex in Fishing Creek
The most common commute times in Fishing Creek are less than 5 minutes (18 commuters, 60.0%) for males and 30 to 34 minutes (25 commuters, 43.1%) for females.
| Commute Time | Male | Female |
| Less than 5 Minutes | 18 (60.0%) | 23 (39.7%) |
| 5 to 9 Minutes | 0 (0.0%) | 0 (0.0%) |
| 10 to 14 Minutes | 6 (20.0%) | 0 (0.0%) |
| 15 to 19 Minutes | 0 (0.0%) | 0 (0.0%) |
| 20 to 24 Minutes | 6 (20.0%) | 0 (0.0%) |
| 25 to 29 Minutes | 0 (0.0%) | 0 (0.0%) |
| 30 to 34 Minutes | 0 (0.0%) | 25 (43.1%) |
| 35 to 39 Minutes | 0 (0.0%) | 4 (6.9%) |
| 40 to 44 Minutes | 0 (0.0%) | 6 (10.3%) |
| 45 to 59 Minutes | 0 (0.0%) | 0 (0.0%) |
| 60 to 89 Minutes | 0 (0.0%) | 0 (0.0%) |
| 90 or more Minutes | 0 (0.0%) | 0 (0.0%) |
Time of Departure to Work by Sex in Fishing Creek
The most frequent times of departure to work in Fishing Creek are 12:00 AM to 4:59 AM (14, 46.7%) for males and 10:00 AM to 10:59 AM (17, 29.3%) for females.
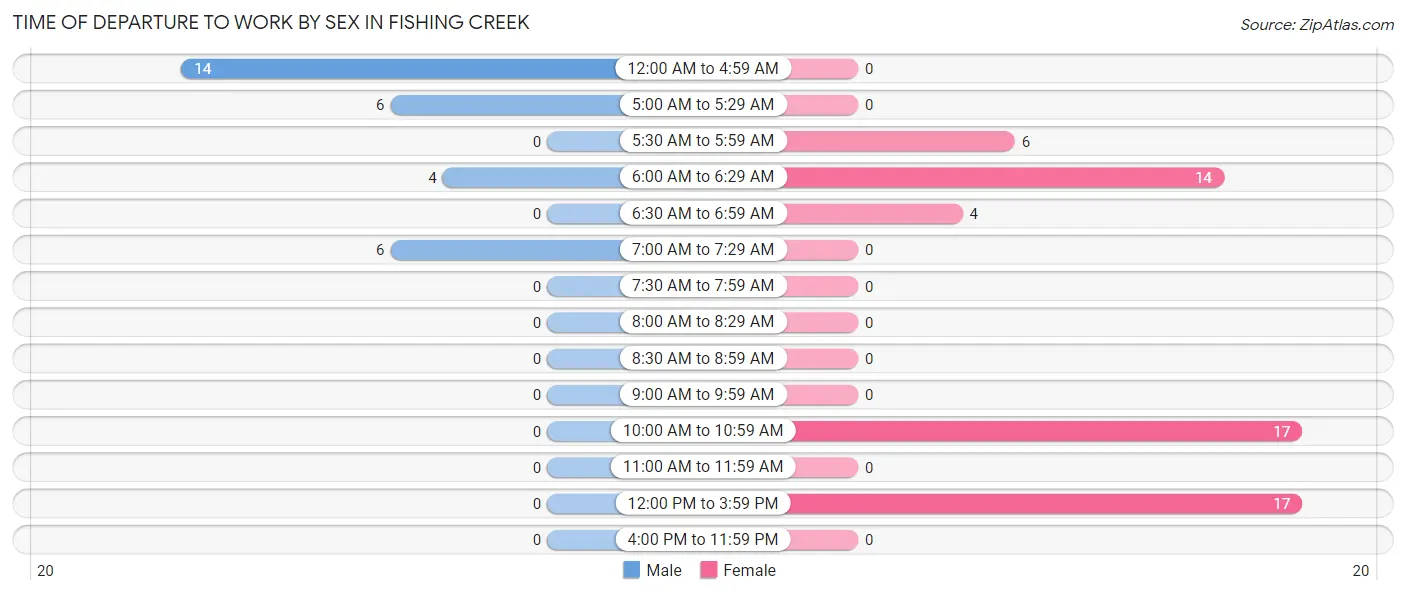
| Time of Departure | Male | Female |
| 12:00 AM to 4:59 AM | 14 (46.7%) | 0 (0.0%) |
| 5:00 AM to 5:29 AM | 6 (20.0%) | 0 (0.0%) |
| 5:30 AM to 5:59 AM | 0 (0.0%) | 6 (10.3%) |
| 6:00 AM to 6:29 AM | 4 (13.3%) | 14 (24.1%) |
| 6:30 AM to 6:59 AM | 0 (0.0%) | 4 (6.9%) |
| 7:00 AM to 7:29 AM | 6 (20.0%) | 0 (0.0%) |
| 7:30 AM to 7:59 AM | 0 (0.0%) | 0 (0.0%) |
| 8:00 AM to 8:29 AM | 0 (0.0%) | 0 (0.0%) |
| 8:30 AM to 8:59 AM | 0 (0.0%) | 0 (0.0%) |
| 9:00 AM to 9:59 AM | 0 (0.0%) | 0 (0.0%) |
| 10:00 AM to 10:59 AM | 0 (0.0%) | 17 (29.3%) |
| 11:00 AM to 11:59 AM | 0 (0.0%) | 0 (0.0%) |
| 12:00 PM to 3:59 PM | 0 (0.0%) | 17 (29.3%) |
| 4:00 PM to 11:59 PM | 0 (0.0%) | 0 (0.0%) |
| Total | 30 (100.0%) | 58 (100.0%) |
Housing Occupancy in Fishing Creek
Occupancy by Ownership in Fishing Creek
Of the total 108 dwellings in Fishing Creek, owner-occupied units account for 94 (87.0%), while renter-occupied units make up 14 (13.0%).
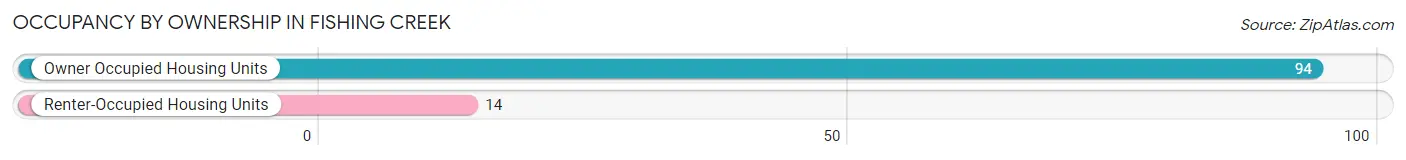
| Occupancy | # Housing Units | % Housing Units |
| Owner Occupied Housing Units | 94 | 87.0% |
| Renter-Occupied Housing Units | 14 | 13.0% |
| Total Occupied Housing Units | 108 | 100.0% |
Occupancy by Household Size in Fishing Creek
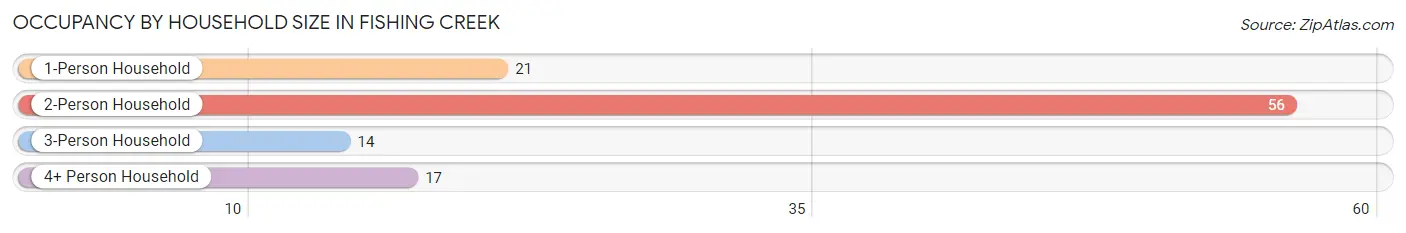
| Household Size | # Housing Units | % Housing Units |
| 1-Person Household | 21 | 19.4% |
| 2-Person Household | 56 | 51.8% |
| 3-Person Household | 14 | 13.0% |
| 4+ Person Household | 17 | 15.7% |
| Total Housing Units | 108 | 100.0% |
Occupancy by Ownership by Household Size in Fishing Creek
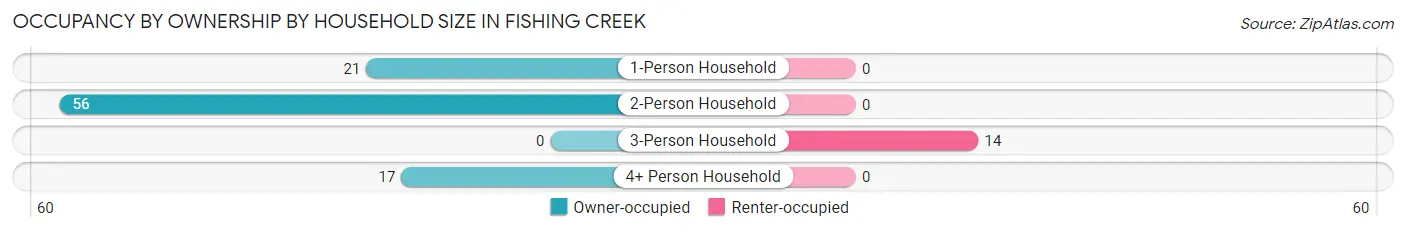
| Household Size | Owner-occupied | Renter-occupied |
| 1-Person Household | 21 (100.0%) | 0 (0.0%) |
| 2-Person Household | 56 (100.0%) | 0 (0.0%) |
| 3-Person Household | 0 (0.0%) | 14 (100.0%) |
| 4+ Person Household | 17 (100.0%) | 0 (0.0%) |
| Total Housing Units | 94 (87.0%) | 14 (13.0%) |
Occupancy by Educational Attainment in Fishing Creek
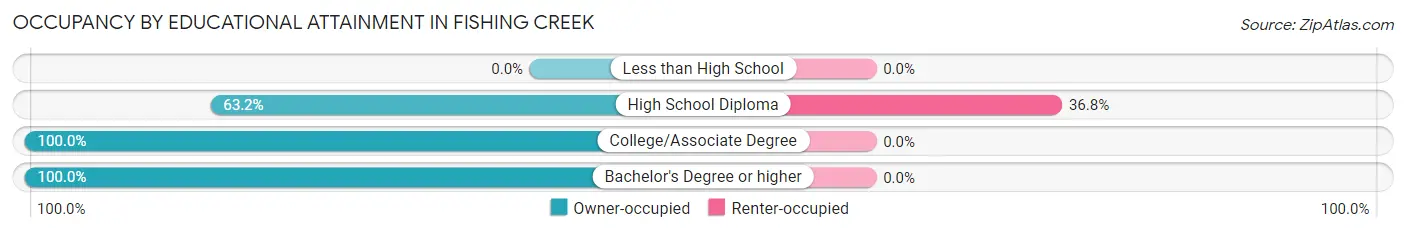
| Household Size | Owner-occupied | Renter-occupied |
| Less than High School | 0 (0.0%) | 0 (0.0%) |
| High School Diploma | 24 (63.2%) | 14 (36.8%) |
| College/Associate Degree | 38 (100.0%) | 0 (0.0%) |
| Bachelor's Degree or higher | 32 (100.0%) | 0 (0.0%) |
Occupancy by Age of Householder in Fishing Creek
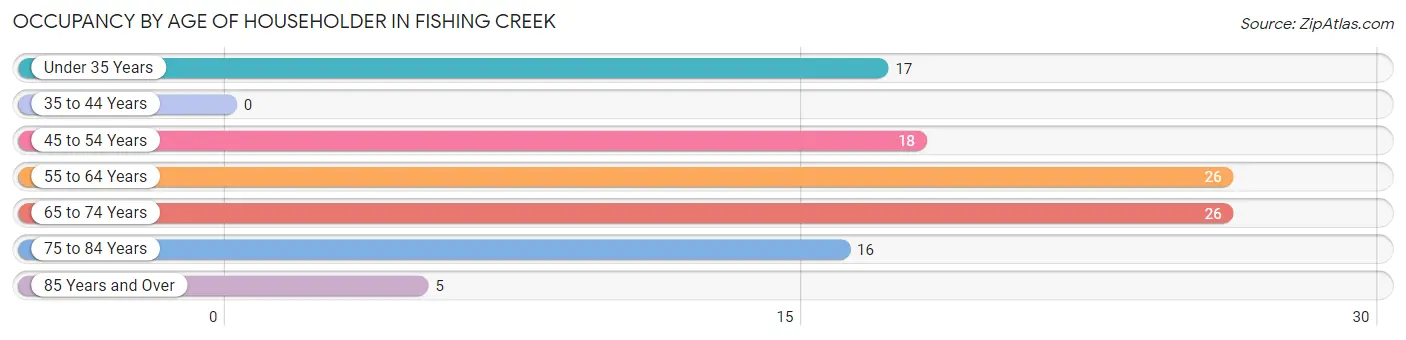
| Age Bracket | # Households | % Households |
| Under 35 Years | 17 | 15.7% |
| 35 to 44 Years | 0 | 0.0% |
| 45 to 54 Years | 18 | 16.7% |
| 55 to 64 Years | 26 | 24.1% |
| 65 to 74 Years | 26 | 24.1% |
| 75 to 84 Years | 16 | 14.8% |
| 85 Years and Over | 5 | 4.6% |
| Total | 108 | 100.0% |
Housing Finances in Fishing Creek
Median Income by Occupancy in Fishing Creek
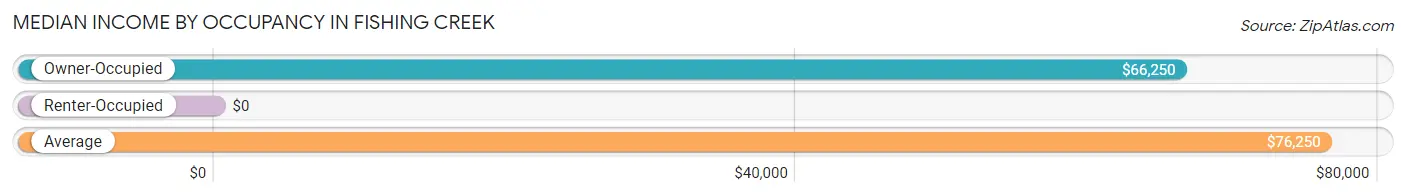
| Occupancy Type | # Households | Median Income |
| Owner-Occupied | 94 (87.0%) | $66,250 |
| Renter-Occupied | 14 (13.0%) | $0 |
| Average | 108 (100.0%) | $76,250 |
Occupancy by Householder Income Bracket in Fishing Creek
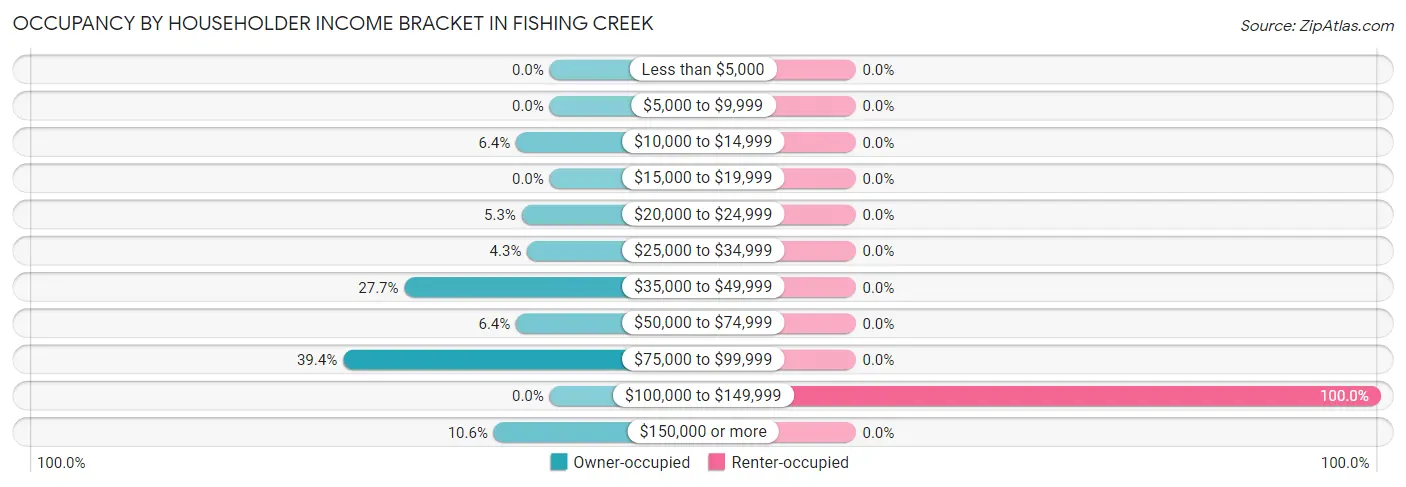
| Income Bracket | Owner-occupied | Renter-occupied |
| Less than $5,000 | 0 (0.0%) | 0 (0.0%) |
| $5,000 to $9,999 | 0 (0.0%) | 0 (0.0%) |
| $10,000 to $14,999 | 6 (6.4%) | 0 (0.0%) |
| $15,000 to $19,999 | 0 (0.0%) | 0 (0.0%) |
| $20,000 to $24,999 | 5 (5.3%) | 0 (0.0%) |
| $25,000 to $34,999 | 4 (4.3%) | 0 (0.0%) |
| $35,000 to $49,999 | 26 (27.7%) | 0 (0.0%) |
| $50,000 to $74,999 | 6 (6.4%) | 0 (0.0%) |
| $75,000 to $99,999 | 37 (39.4%) | 0 (0.0%) |
| $100,000 to $149,999 | 0 (0.0%) | 14 (100.0%) |
| $150,000 or more | 10 (10.6%) | 0 (0.0%) |
| Total | 94 (100.0%) | 14 (100.0%) |
Monthly Housing Cost Tiers in Fishing Creek
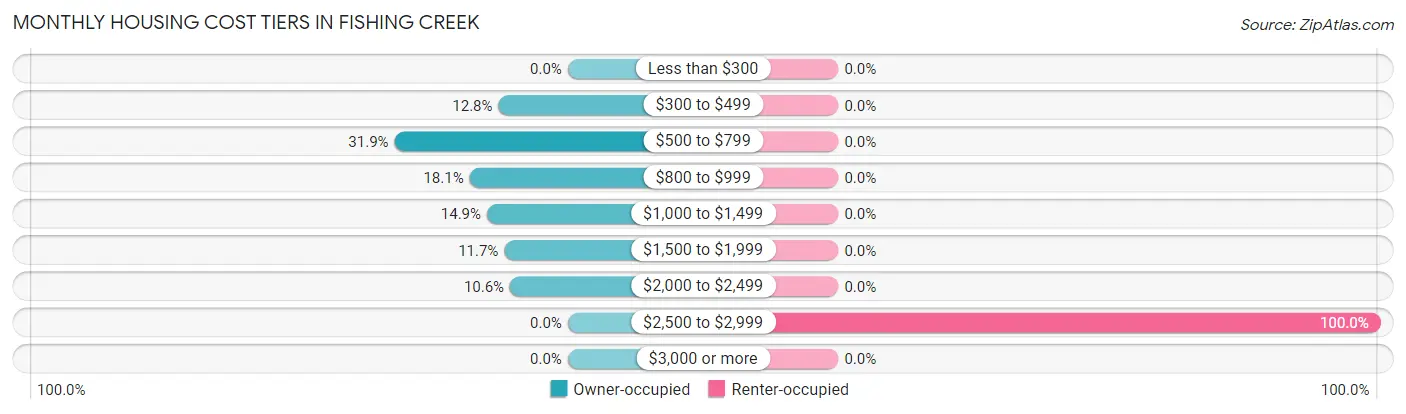
| Monthly Cost | Owner-occupied | Renter-occupied |
| Less than $300 | 0 (0.0%) | 0 (0.0%) |
| $300 to $499 | 12 (12.8%) | 0 (0.0%) |
| $500 to $799 | 30 (31.9%) | 0 (0.0%) |
| $800 to $999 | 17 (18.1%) | 0 (0.0%) |
| $1,000 to $1,499 | 14 (14.9%) | 0 (0.0%) |
| $1,500 to $1,999 | 11 (11.7%) | 0 (0.0%) |
| $2,000 to $2,499 | 10 (10.6%) | 0 (0.0%) |
| $2,500 to $2,999 | 0 (0.0%) | 14 (100.0%) |
| $3,000 or more | 0 (0.0%) | 0 (0.0%) |
| Total | 94 (100.0%) | 14 (100.0%) |
Physical Housing Characteristics in Fishing Creek
Housing Structures in Fishing Creek
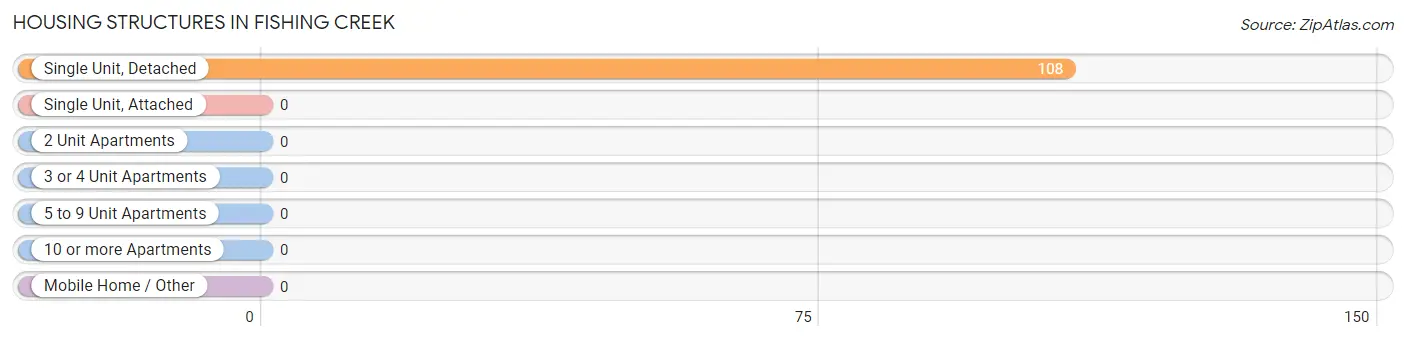
| Structure Type | # Housing Units | % Housing Units |
| Single Unit, Detached | 108 | 100.0% |
| Single Unit, Attached | 0 | 0.0% |
| 2 Unit Apartments | 0 | 0.0% |
| 3 or 4 Unit Apartments | 0 | 0.0% |
| 5 to 9 Unit Apartments | 0 | 0.0% |
| 10 or more Apartments | 0 | 0.0% |
| Mobile Home / Other | 0 | 0.0% |
| Total | 108 | 100.0% |
Housing Structures by Occupancy in Fishing Creek
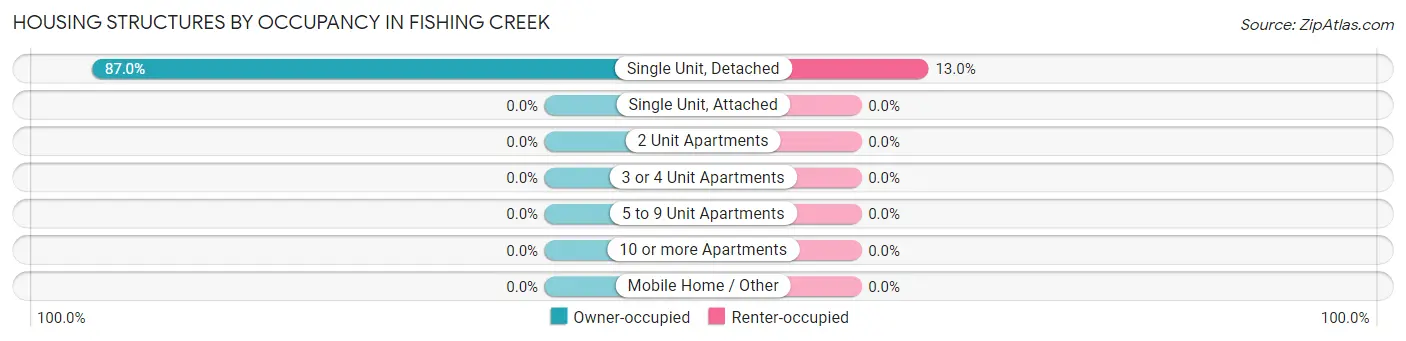
| Structure Type | Owner-occupied | Renter-occupied |
| Single Unit, Detached | 94 (87.0%) | 14 (13.0%) |
| Single Unit, Attached | 0 (0.0%) | 0 (0.0%) |
| 2 Unit Apartments | 0 (0.0%) | 0 (0.0%) |
| 3 or 4 Unit Apartments | 0 (0.0%) | 0 (0.0%) |
| 5 to 9 Unit Apartments | 0 (0.0%) | 0 (0.0%) |
| 10 or more Apartments | 0 (0.0%) | 0 (0.0%) |
| Mobile Home / Other | 0 (0.0%) | 0 (0.0%) |
| Total | 94 (87.0%) | 14 (13.0%) |
Housing Structures by Number of Rooms in Fishing Creek
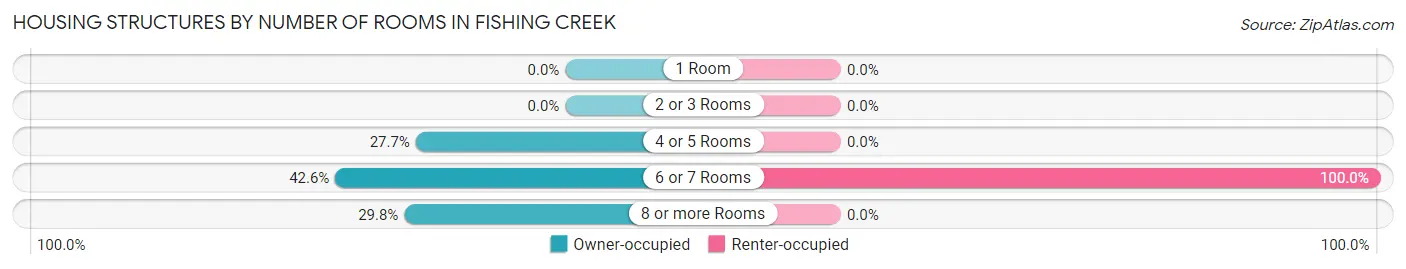
| Number of Rooms | Owner-occupied | Renter-occupied |
| 1 Room | 0 (0.0%) | 0 (0.0%) |
| 2 or 3 Rooms | 0 (0.0%) | 0 (0.0%) |
| 4 or 5 Rooms | 26 (27.7%) | 0 (0.0%) |
| 6 or 7 Rooms | 40 (42.5%) | 14 (100.0%) |
| 8 or more Rooms | 28 (29.8%) | 0 (0.0%) |
| Total | 94 (100.0%) | 14 (100.0%) |
Housing Structure by Heating Type in Fishing Creek
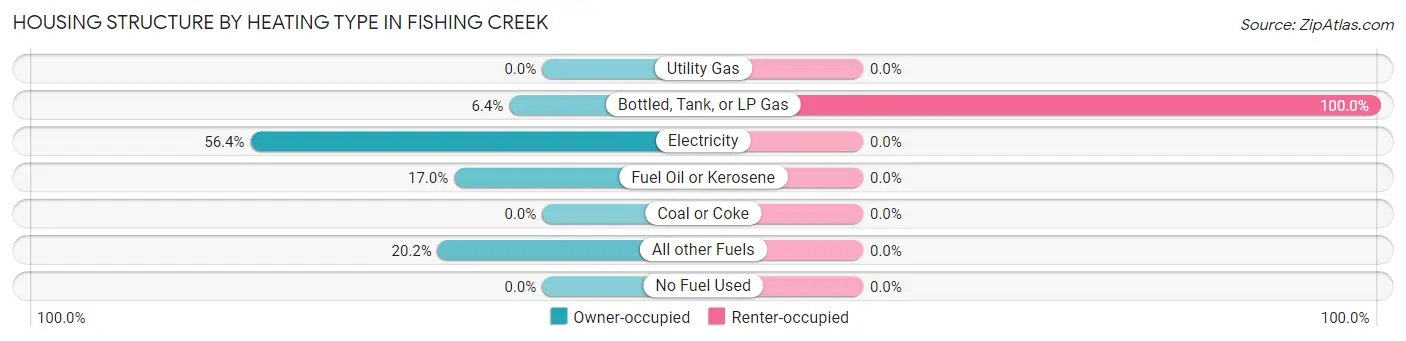
| Heating Type | Owner-occupied | Renter-occupied |
| Utility Gas | 0 (0.0%) | 0 (0.0%) |
| Bottled, Tank, or LP Gas | 6 (6.4%) | 14 (100.0%) |
| Electricity | 53 (56.4%) | 0 (0.0%) |
| Fuel Oil or Kerosene | 16 (17.0%) | 0 (0.0%) |
| Coal or Coke | 0 (0.0%) | 0 (0.0%) |
| All other Fuels | 19 (20.2%) | 0 (0.0%) |
| No Fuel Used | 0 (0.0%) | 0 (0.0%) |
| Total | 94 (100.0%) | 14 (100.0%) |
Household Vehicle Usage in Fishing Creek
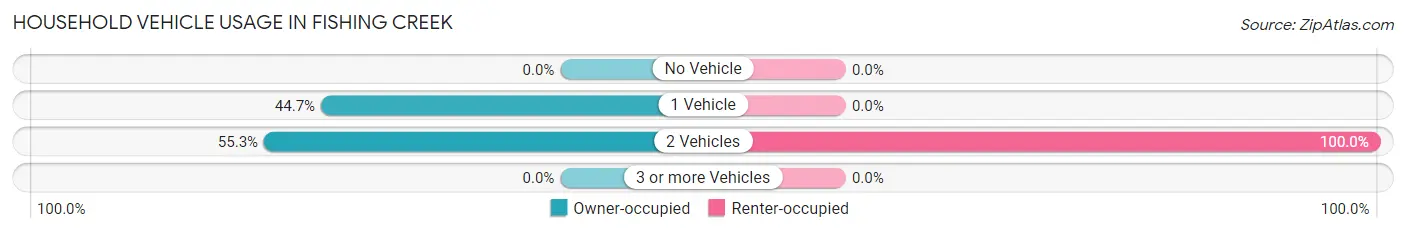
| Vehicles per Household | Owner-occupied | Renter-occupied |
| No Vehicle | 0 (0.0%) | 0 (0.0%) |
| 1 Vehicle | 42 (44.7%) | 0 (0.0%) |
| 2 Vehicles | 52 (55.3%) | 14 (100.0%) |
| 3 or more Vehicles | 0 (0.0%) | 0 (0.0%) |
| Total | 94 (100.0%) | 14 (100.0%) |
Real Estate & Mortgages in Fishing Creek
Real Estate and Mortgage Overview in Fishing Creek
| Characteristic | Without Mortgage | With Mortgage |
| Housing Units | 59 | 35 |
| Median Property Value | $307,800 | $0 |
| Median Household Income | - | - |
| Monthly Housing Costs | $558 | $0 |
| Real Estate Taxes | $3,078 | $0 |
Property Value by Mortgage Status in Fishing Creek
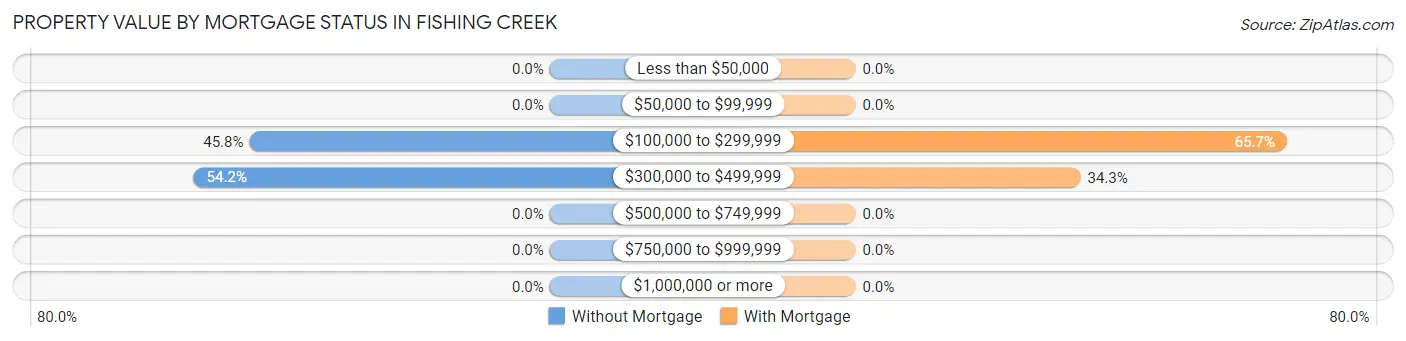
| Property Value | Without Mortgage | With Mortgage |
| Less than $50,000 | 0 (0.0%) | 0 (0.0%) |
| $50,000 to $99,999 | 0 (0.0%) | 0 (0.0%) |
| $100,000 to $299,999 | 27 (45.8%) | 23 (65.7%) |
| $300,000 to $499,999 | 32 (54.2%) | 12 (34.3%) |
| $500,000 to $749,999 | 0 (0.0%) | 0 (0.0%) |
| $750,000 to $999,999 | 0 (0.0%) | 0 (0.0%) |
| $1,000,000 or more | 0 (0.0%) | 0 (0.0%) |
| Total | 59 (100.0%) | 35 (100.0%) |
Household Income by Mortgage Status in Fishing Creek
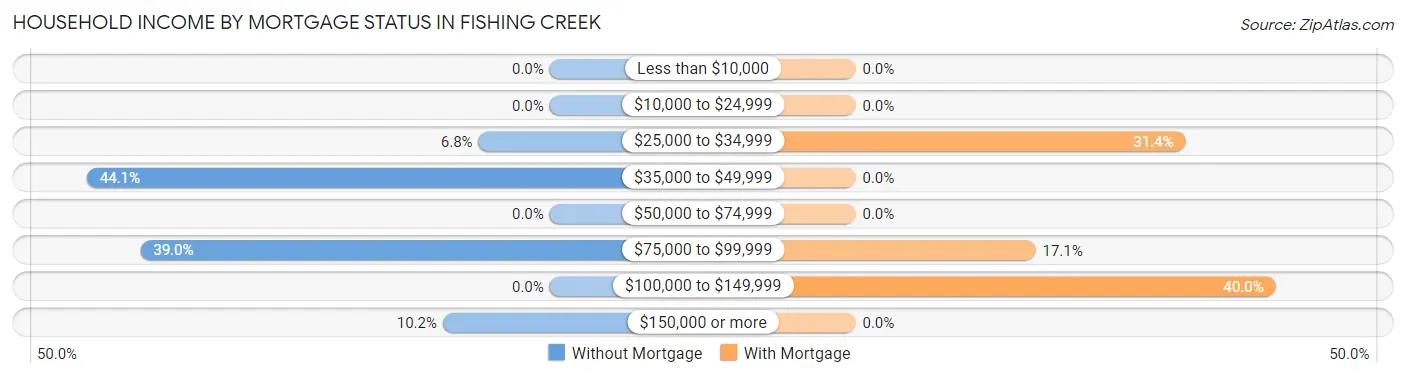
| Household Income | Without Mortgage | With Mortgage |
| Less than $10,000 | 0 (0.0%) | 0 (0.0%) |
| $10,000 to $24,999 | 0 (0.0%) | 0 (0.0%) |
| $25,000 to $34,999 | 4 (6.8%) | 11 (31.4%) |
| $35,000 to $49,999 | 26 (44.1%) | 0 (0.0%) |
| $50,000 to $74,999 | 0 (0.0%) | 0 (0.0%) |
| $75,000 to $99,999 | 23 (39.0%) | 6 (17.1%) |
| $100,000 to $149,999 | 0 (0.0%) | 14 (40.0%) |
| $150,000 or more | 6 (10.2%) | 0 (0.0%) |
| Total | 59 (100.0%) | 35 (100.0%) |
Property Value to Household Income Ratio in Fishing Creek
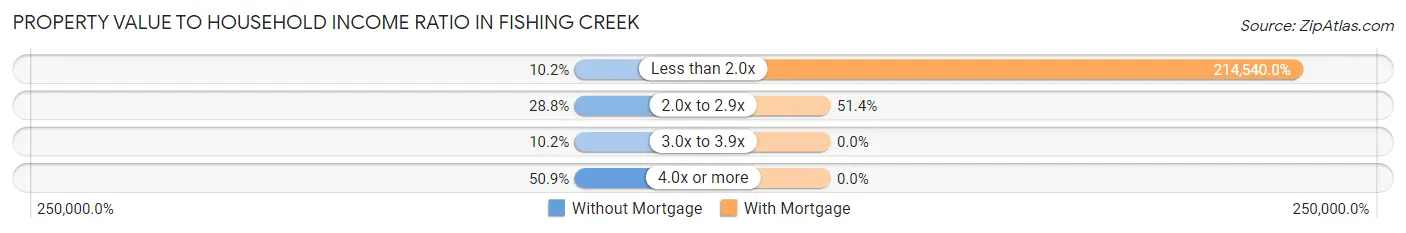
| Value-to-Income Ratio | Without Mortgage | With Mortgage |
| Less than 2.0x | 6 (10.2%) | 75,089 (214,540.0%) |
| 2.0x to 2.9x | 17 (28.8%) | 18 (51.4%) |
| 3.0x to 3.9x | 6 (10.2%) | 0 (0.0%) |
| 4.0x or more | 30 (50.8%) | 0 (0.0%) |
| Total | 59 (100.0%) | 35 (100.0%) |
Real Estate Taxes by Mortgage Status in Fishing Creek
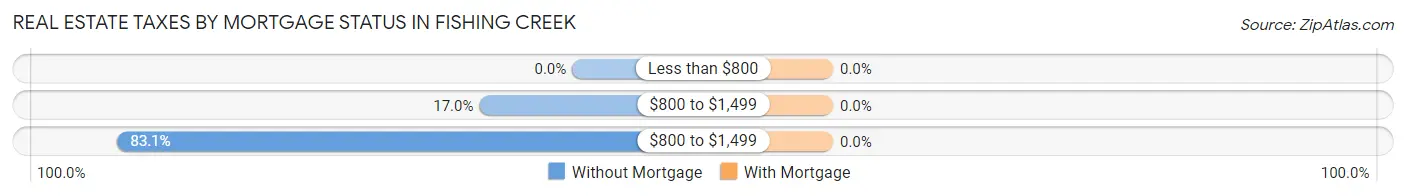
| Property Taxes | Without Mortgage | With Mortgage |
| Less than $800 | 0 (0.0%) | 0 (0.0%) |
| $800 to $1,499 | 10 (17.0%) | 0 (0.0%) |
| $800 to $1,499 | 49 (83.1%) | 0 (0.0%) |
| Total | 59 (100.0%) | 35 (100.0%) |
Health & Disability in Fishing Creek
Health Insurance Coverage by Age in Fishing Creek
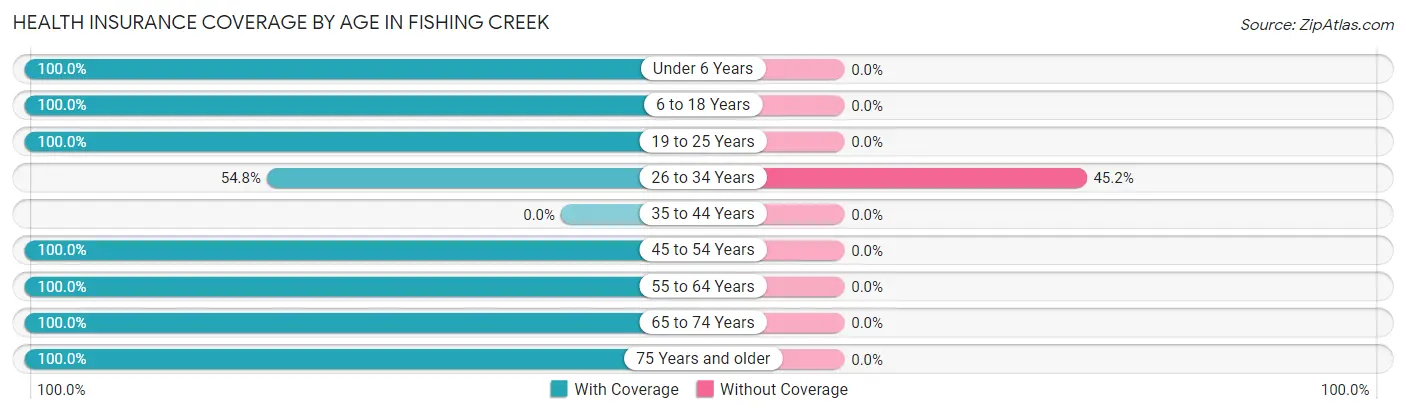
| Age Bracket | With Coverage | Without Coverage |
| Under 6 Years | 42 (100.0%) | 0 (0.0%) |
| 6 to 18 Years | 11 (100.0%) | 0 (0.0%) |
| 19 to 25 Years | 11 (100.0%) | 0 (0.0%) |
| 26 to 34 Years | 17 (54.8%) | 14 (45.2%) |
| 35 to 44 Years | 0 (0.0%) | 0 (0.0%) |
| 45 to 54 Years | 18 (100.0%) | 0 (0.0%) |
| 55 to 64 Years | 57 (100.0%) | 0 (0.0%) |
| 65 to 74 Years | 44 (100.0%) | 0 (0.0%) |
| 75 Years and older | 21 (100.0%) | 0 (0.0%) |
| Total | 221 (94.0%) | 14 (6.0%) |
Health Insurance Coverage by Citizenship Status in Fishing Creek
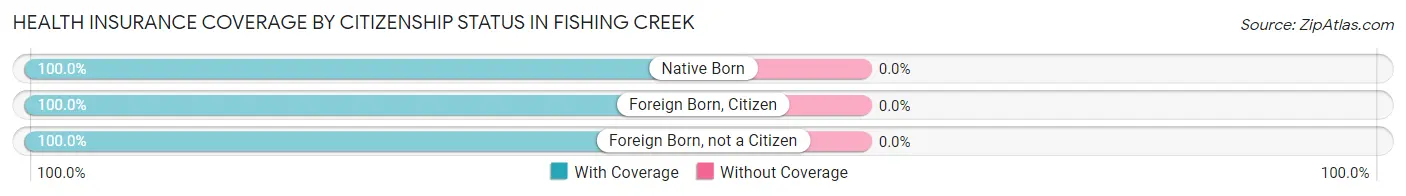
| Citizenship Status | With Coverage | Without Coverage |
| Native Born | 42 (100.0%) | 0 (0.0%) |
| Foreign Born, Citizen | 11 (100.0%) | 0 (0.0%) |
| Foreign Born, not a Citizen | 11 (100.0%) | 0 (0.0%) |
Health Insurance Coverage by Household Income in Fishing Creek
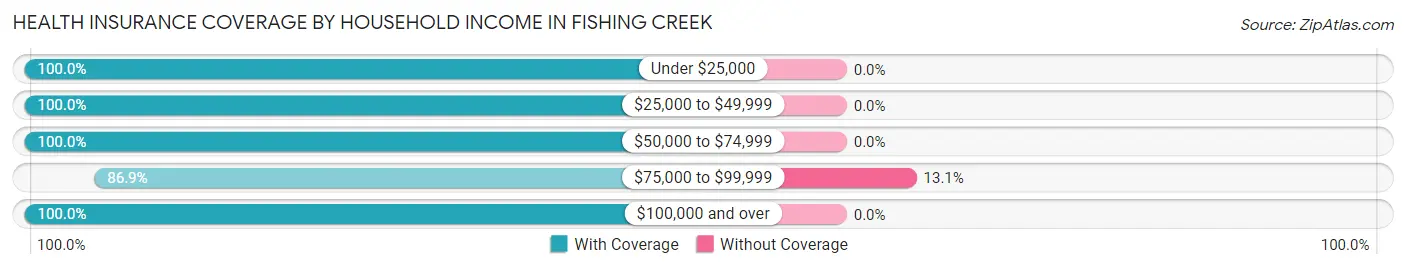
| Household Income | With Coverage | Without Coverage |
| Under $25,000 | 11 (100.0%) | 0 (0.0%) |
| $25,000 to $49,999 | 48 (100.0%) | 0 (0.0%) |
| $50,000 to $74,999 | 12 (100.0%) | 0 (0.0%) |
| $75,000 to $99,999 | 93 (86.9%) | 14 (13.1%) |
| $100,000 and over | 57 (100.0%) | 0 (0.0%) |
Public vs Private Health Insurance Coverage by Age in Fishing Creek
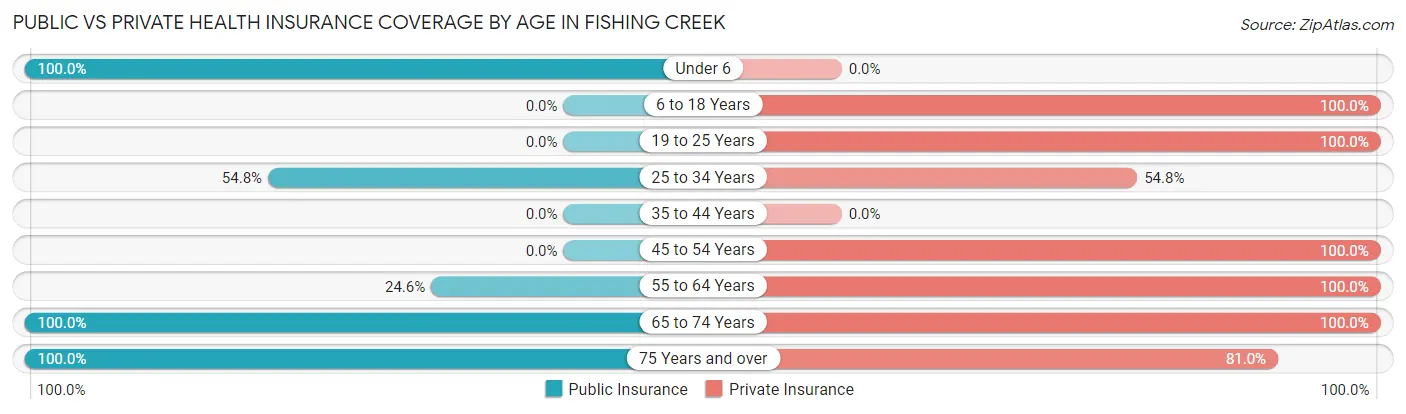
| Age Bracket | Public Insurance | Private Insurance |
| Under 6 | 42 (100.0%) | 0 (0.0%) |
| 6 to 18 Years | 0 (0.0%) | 11 (100.0%) |
| 19 to 25 Years | 0 (0.0%) | 11 (100.0%) |
| 25 to 34 Years | 17 (54.8%) | 17 (54.8%) |
| 35 to 44 Years | 0 (0.0%) | 0 (0.0%) |
| 45 to 54 Years | 0 (0.0%) | 18 (100.0%) |
| 55 to 64 Years | 14 (24.6%) | 57 (100.0%) |
| 65 to 74 Years | 44 (100.0%) | 44 (100.0%) |
| 75 Years and over | 21 (100.0%) | 17 (80.9%) |
| Total | 138 (58.7%) | 175 (74.5%) |
Disability Status by Sex by Age in Fishing Creek
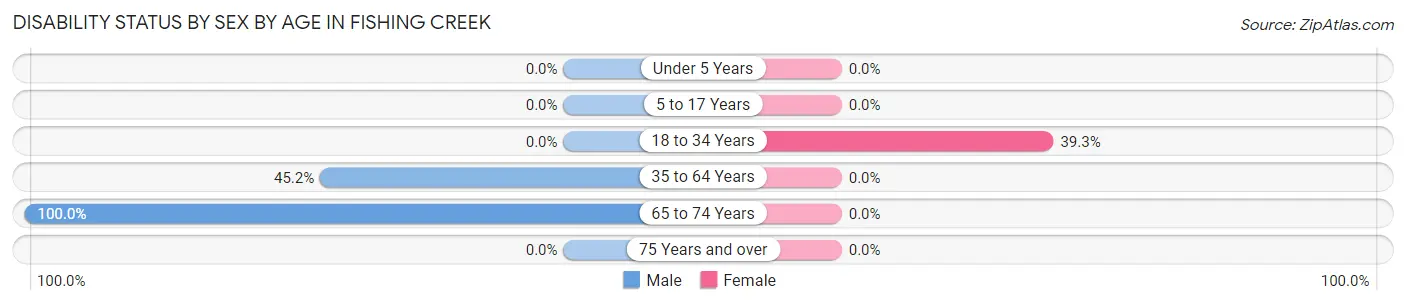
| Age Bracket | Male | Female |
| Under 5 Years | 0 (0.0%) | 0 (0.0%) |
| 5 to 17 Years | 0 (0.0%) | 0 (0.0%) |
| 18 to 34 Years | 0 (0.0%) | 11 (39.3%) |
| 35 to 64 Years | 14 (45.2%) | 0 (0.0%) |
| 65 to 74 Years | 26 (100.0%) | 0 (0.0%) |
| 75 Years and over | 0 (0.0%) | 0 (0.0%) |
Disability Class by Sex by Age in Fishing Creek
Disability Class: Hearing Difficulty
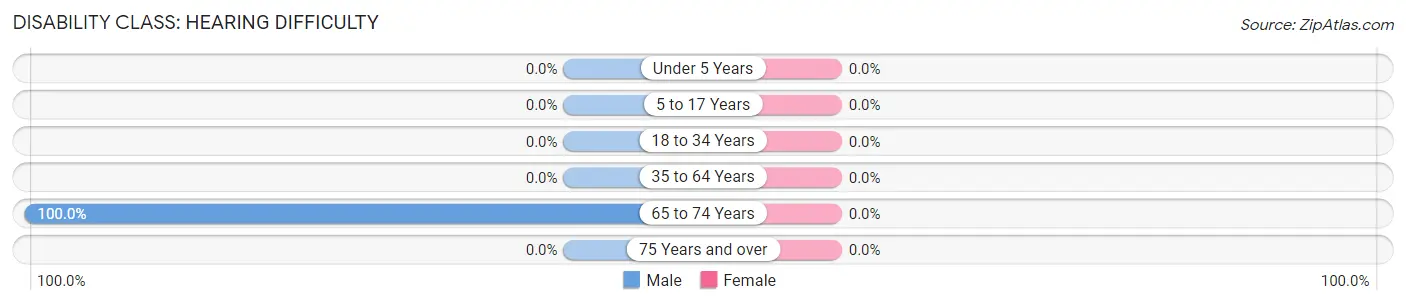
| Age Bracket | Male | Female |
| Under 5 Years | 0 (0.0%) | 0 (0.0%) |
| 5 to 17 Years | 0 (0.0%) | 0 (0.0%) |
| 18 to 34 Years | 0 (0.0%) | 0 (0.0%) |
| 35 to 64 Years | 0 (0.0%) | 0 (0.0%) |
| 65 to 74 Years | 26 (100.0%) | 0 (0.0%) |
| 75 Years and over | 0 (0.0%) | 0 (0.0%) |
Disability Class: Vision Difficulty
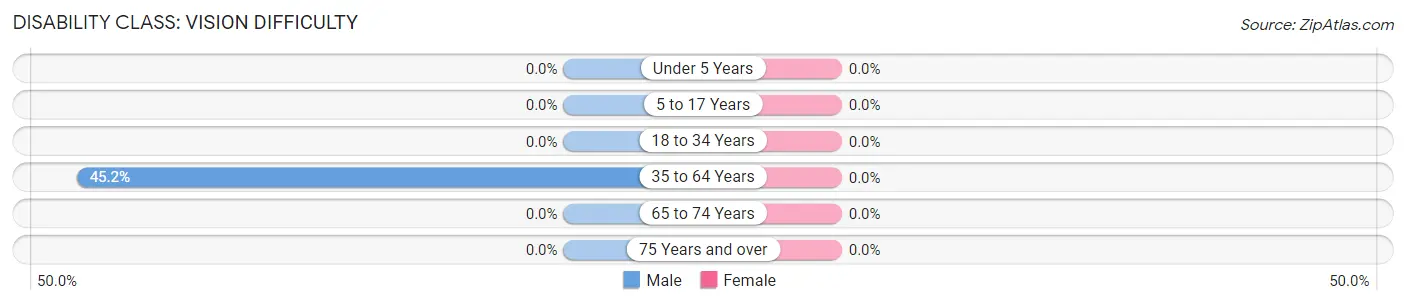
| Age Bracket | Male | Female |
| Under 5 Years | 0 (0.0%) | 0 (0.0%) |
| 5 to 17 Years | 0 (0.0%) | 0 (0.0%) |
| 18 to 34 Years | 0 (0.0%) | 0 (0.0%) |
| 35 to 64 Years | 14 (45.2%) | 0 (0.0%) |
| 65 to 74 Years | 0 (0.0%) | 0 (0.0%) |
| 75 Years and over | 0 (0.0%) | 0 (0.0%) |
Disability Class: Cognitive Difficulty
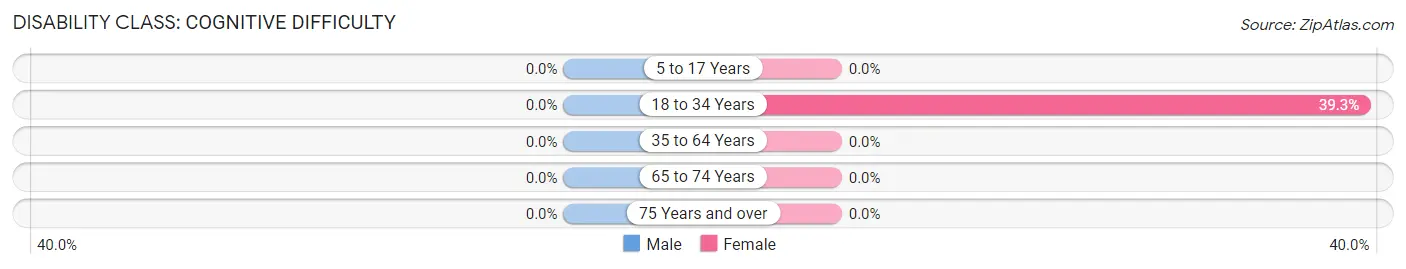
| Age Bracket | Male | Female |
| 5 to 17 Years | 0 (0.0%) | 0 (0.0%) |
| 18 to 34 Years | 0 (0.0%) | 11 (39.3%) |
| 35 to 64 Years | 0 (0.0%) | 0 (0.0%) |
| 65 to 74 Years | 0 (0.0%) | 0 (0.0%) |
| 75 Years and over | 0 (0.0%) | 0 (0.0%) |
Disability Class: Ambulatory Difficulty
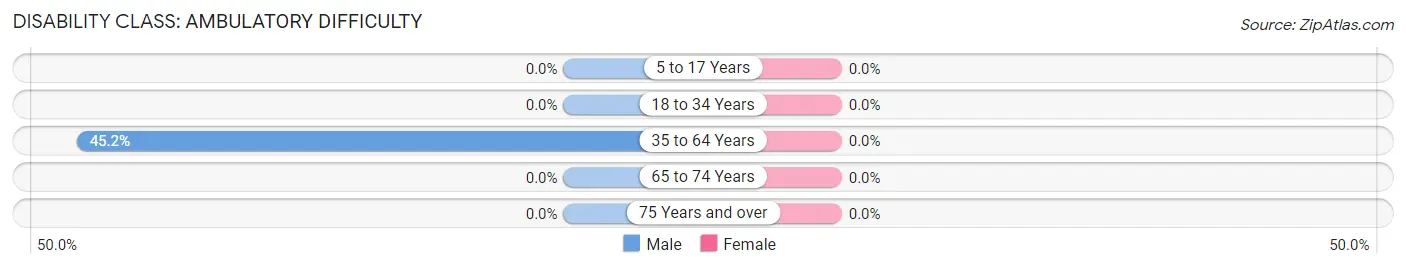
| Age Bracket | Male | Female |
| 5 to 17 Years | 0 (0.0%) | 0 (0.0%) |
| 18 to 34 Years | 0 (0.0%) | 0 (0.0%) |
| 35 to 64 Years | 14 (45.2%) | 0 (0.0%) |
| 65 to 74 Years | 0 (0.0%) | 0 (0.0%) |
| 75 Years and over | 0 (0.0%) | 0 (0.0%) |
Disability Class: Self-Care Difficulty
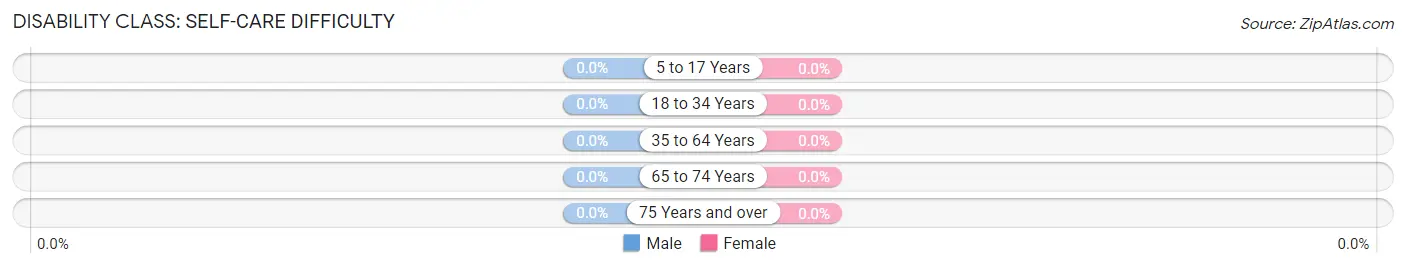
| Age Bracket | Male | Female |
| 5 to 17 Years | 0 (0.0%) | 0 (0.0%) |
| 18 to 34 Years | 0 (0.0%) | 0 (0.0%) |
| 35 to 64 Years | 0 (0.0%) | 0 (0.0%) |
| 65 to 74 Years | 0 (0.0%) | 0 (0.0%) |
| 75 Years and over | 0 (0.0%) | 0 (0.0%) |
Technology Access in Fishing Creek
Computing Device Access in Fishing Creek
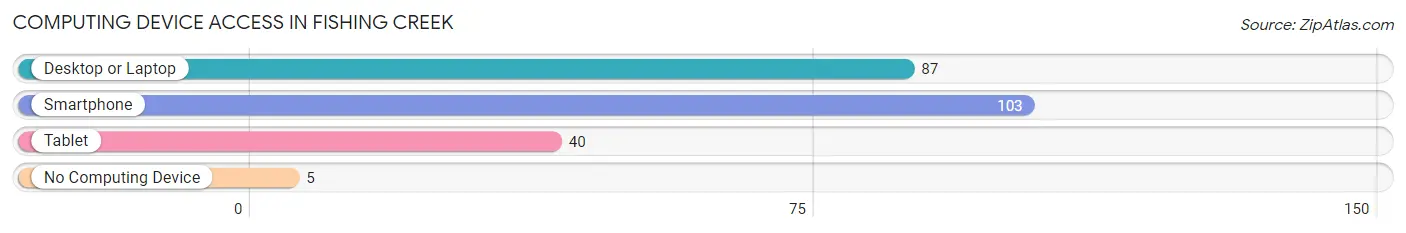
| Device Type | # Households | % Households |
| Desktop or Laptop | 87 | 80.6% |
| Smartphone | 103 | 95.4% |
| Tablet | 40 | 37.0% |
| No Computing Device | 5 | 4.6% |
| Total | 108 | 100.0% |
Internet Access in Fishing Creek
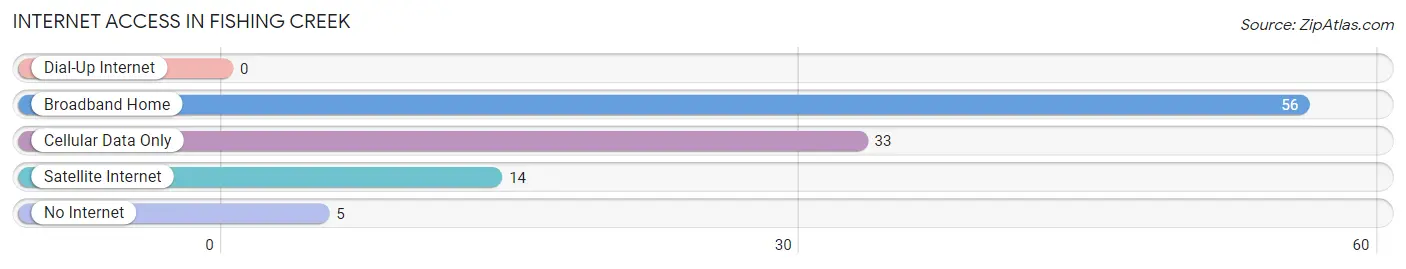
| Internet Type | # Households | % Households |
| Dial-Up Internet | 0 | 0.0% |
| Broadband Home | 56 | 51.8% |
| Cellular Data Only | 33 | 30.6% |
| Satellite Internet | 14 | 13.0% |
| No Internet | 5 | 4.6% |
| Total | 108 | 100.0% |
Fishing Creek Summary
Fishing Creek is a small unincorporated community located in Dorchester County, Maryland. It is situated on the eastern shore of the Chesapeake Bay, approximately 25 miles south of Cambridge. The community is bordered by the Choptank River to the north and the Little Choptank River to the south. Fishing Creek is a rural area with a population of approximately 1,000 people.
History
Fishing Creek was first settled in the early 1700s by English settlers. The area was originally known as “Fishing Creek Landing” and was used as a port for shipping goods to and from the Chesapeake Bay. The town was officially established in 1790 and was named after the creek that runs through it.
In the late 1800s, Fishing Creek was a thriving fishing and oystering community. The town was home to several seafood processing plants and canneries, which provided employment for many of the local residents. The town also had a number of stores, churches, and a post office.
In the early 1900s, the town began to decline as the seafood industry moved elsewhere. The town’s population decreased and many of the businesses closed. In the 1950s, the town was revitalized when the Chesapeake Bay Bridge was built, connecting Fishing Creek to the rest of Maryland.
Geography
Fishing Creek is located in Dorchester County, Maryland. It is situated on the eastern shore of the Chesapeake Bay, approximately 25 miles south of Cambridge. The community is bordered by the Choptank River to the north and the Little Choptank River to the south.
The town is located in a rural area and is surrounded by farmland and woodlands. The terrain is mostly flat with some rolling hills. The climate is mild with hot summers and cold winters.
Economy
Fishing Creek’s economy is largely based on agriculture and tourism. The town is home to several farms that produce a variety of crops, including corn, soybeans, and wheat. The town also has a number of seafood processing plants and canneries, which provide employment for many of the local residents.
Tourism is also an important part of the local economy. Fishing Creek is a popular destination for boaters, fishermen, and nature lovers. The town is home to several marinas, boat ramps, and fishing piers. There are also several parks and nature preserves in the area.
Demographics
As of the 2010 census, Fishing Creek had a population of 1,000 people. The racial makeup of the town was 94.2% White, 2.7% African American, 0.7% Native American, 0.3% Asian, and 2.1% from other races. The median household income was $37,500 and the median age was 44.
Fishing Creek is a small, rural community with a close-knit population. The town is home to several churches, a post office, and a few small businesses. The town is also home to a volunteer fire department and a volunteer rescue squad.
Common Questions
What is Per Capita Income in Fishing Creek?
Per Capita income in Fishing Creek is $33,151.
What is the Median Family Income in Fishing Creek?
Median Family Income in Fishing Creek is $77,054.
What is the Median Household income in Fishing Creek?
Median Household Income in Fishing Creek is $76,250.
What is Income or Wage Gap in Fishing Creek?
Income or Wage Gap in Fishing Creek is 67.8%.
Women in Fishing Creek earn 32.2 cents for every dollar earned by a man.
What is Inequality or Gini Index in Fishing Creek?
Inequality or Gini Index in Fishing Creek is 0.34.
What is the Total Population of Fishing Creek?
Total Population of Fishing Creek is 235.
What is the Total Male Population of Fishing Creek?
Total Male Population of Fishing Creek is 75.
What is the Total Female Population of Fishing Creek?
Total Female Population of Fishing Creek is 160.
What is the Ratio of Males per 100 Females in Fishing Creek?
There are 46.88 Males per 100 Females in Fishing Creek.
What is the Ratio of Females per 100 Males in Fishing Creek?
There are 213.33 Females per 100 Males in Fishing Creek.
What is the Median Population Age in Fishing Creek?
Median Population Age in Fishing Creek is 55.9 Years.
What is the Average Family Size in Fishing Creek
Average Family Size in Fishing Creek is 2.5 People.
What is the Average Household Size in Fishing Creek
Average Household Size in Fishing Creek is 2.2 People.
How Large is the Labor Force in Fishing Creek?
There are 108 People in the Labor Forcein in Fishing Creek.
What is the Percentage of People in the Labor Force in Fishing Creek?
56.0% of People are in the Labor Force in Fishing Creek.
What is the Unemployment Rate in Fishing Creek?
Unemployment Rate in Fishing Creek is 13.0%.