Zip Codes with the Highest Percentage of Population Employed in Food Preparation & Serving in Maryland
RELATED REPORTS & OPTIONS
Food Preparation & Serving
Maryland
Compare Zip Codes
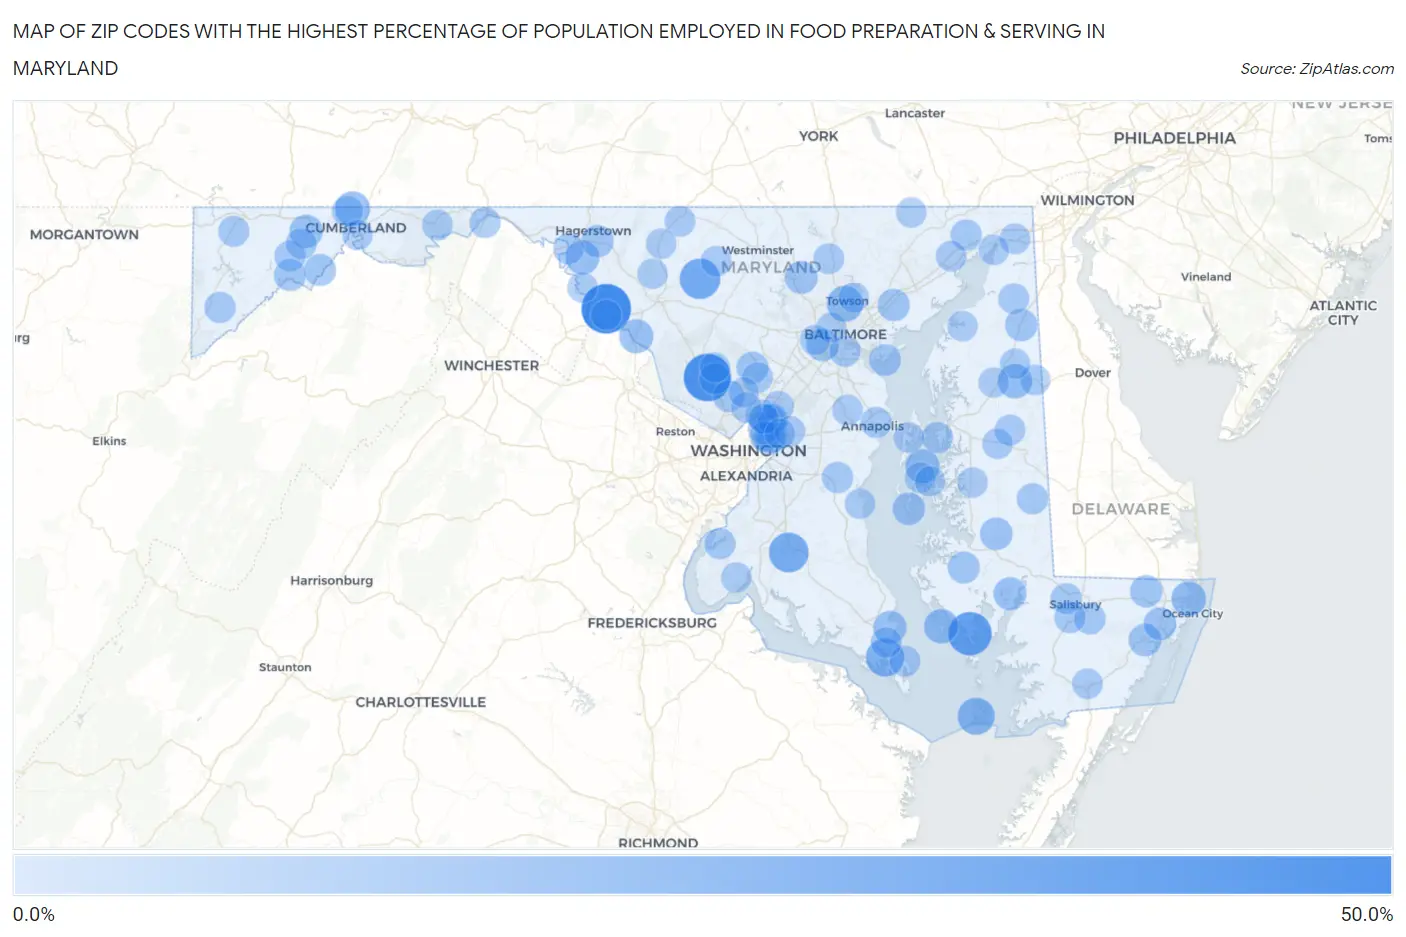
Map of Zip Codes with the Highest Percentage of Population Employed in Food Preparation & Serving in Maryland
0.0%
50.0%
Zip Codes with the Highest Percentage of Population Employed in Food Preparation & Serving in Maryland
| Zip Code | % Employed | vs State | vs National | |
| 1. | 21715 | 50.0% | 4.4%(+45.6)#1 | 5.3%(+44.7)#61 |
| 2. | 20899 | 45.2% | 4.4%(+40.8)#2 | 5.3%(+39.9)#73 |
| 3. | 21672 | 36.0% | 4.4%(+31.6)#3 | 5.3%(+30.7)#138 |
| 4. | 21762 | 28.9% | 4.4%(+24.5)#4 | 5.3%(+23.6)#234 |
| 5. | 20617 | 27.1% | 4.4%(+22.7)#5 | 5.3%(+21.8)#262 |
| 6. | 20686 | 23.6% | 4.4%(+19.2)#6 | 5.3%(+18.3)#364 |
| 7. | 21824 | 21.3% | 4.4%(+16.9)#7 | 5.3%(+16.0)#446 |
| 8. | 21252 | 18.9% | 4.4%(+14.5)#8 | 5.3%(+13.6)#575 |
| 9. | 21529 | 15.9% | 4.4%(+11.5)#9 | 5.3%(+10.6)#873 |
| 10. | 21842 | 15.6% | 4.4%(+11.2)#10 | 5.3%(+10.3)#903 |
| 11. | 21634 | 15.2% | 4.4%(+10.8)#11 | 5.3%(+9.89)#958 |
| 12. | 21607 | 15.1% | 4.4%(+10.7)#12 | 5.3%(+9.82)#968 |
| 13. | 21624 | 14.9% | 4.4%(+10.5)#13 | 5.3%(+9.62)#994 |
| 14. | 21777 | 14.2% | 4.4%(+9.80)#14 | 5.3%(+8.89)#1,128 |
| 15. | 21733 | 14.0% | 4.4%(+9.59)#15 | 5.3%(+8.69)#1,168 |
| 16. | 20670 | 12.6% | 4.4%(+8.24)#16 | 5.3%(+7.33)#1,487 |
| 17. | 21532 | 12.6% | 4.4%(+8.18)#17 | 5.3%(+7.27)#1,504 |
| 18. | 21869 | 11.8% | 4.4%(+7.43)#18 | 5.3%(+6.52)#1,733 |
| 19. | 21071 | 11.5% | 4.4%(+7.16)#19 | 5.3%(+6.25)#1,836 |
| 20. | 20742 | 11.3% | 4.4%(+6.93)#20 | 5.3%(+6.02)#1,917 |
| 21. | 21841 | 11.2% | 4.4%(+6.85)#21 | 5.3%(+5.95)#1,943 |
| 22. | 21250 | 11.0% | 4.4%(+6.57)#22 | 5.3%(+5.67)#2,080 |
| 23. | 21811 | 10.9% | 4.4%(+6.48)#23 | 5.3%(+5.57)#2,133 |
| 24. | 21664 | 10.8% | 4.4%(+6.40)#24 | 5.3%(+5.50)#2,163 |
| 25. | 21671 | 10.8% | 4.4%(+6.39)#25 | 5.3%(+5.49)#2,168 |
| 26. | 21734 | 10.5% | 4.4%(+6.08)#26 | 5.3%(+5.18)#2,342 |
| 27. | 21872 | 10.4% | 4.4%(+5.98)#27 | 5.3%(+5.08)#2,391 |
| 28. | 21635 | 10.4% | 4.4%(+5.98)#28 | 5.3%(+5.08)#2,393 |
| 29. | 21162 | 10.1% | 4.4%(+5.68)#29 | 5.3%(+4.77)#2,588 |
| 30. | 21613 | 9.7% | 4.4%(+5.34)#30 | 5.3%(+4.43)#2,871 |
| 31. | 21557 | 9.5% | 4.4%(+5.16)#31 | 5.3%(+4.25)#3,024 |
| 32. | 21562 | 9.5% | 4.4%(+5.12)#32 | 5.3%(+4.22)#3,049 |
| 33. | 20862 | 9.4% | 4.4%(+5.02)#33 | 5.3%(+4.12)#3,138 |
| 34. | 21052 | 9.4% | 4.4%(+4.98)#34 | 5.3%(+4.08)#3,175 |
| 35. | 20722 | 8.8% | 4.4%(+4.43)#35 | 5.3%(+3.52)#3,725 |
| 36. | 20851 | 8.7% | 4.4%(+4.28)#36 | 5.3%(+3.37)#3,907 |
| 37. | 20877 | 8.3% | 4.4%(+3.94)#37 | 5.3%(+3.04)#4,289 |
| 38. | 21804 | 8.1% | 4.4%(+3.69)#38 | 5.3%(+2.79)#4,624 |
| 39. | 20711 | 7.9% | 4.4%(+3.57)#39 | 5.3%(+2.66)#4,809 |
| 40. | 21826 | 7.9% | 4.4%(+3.55)#40 | 5.3%(+2.64)#4,848 |
| 41. | 21550 | 7.9% | 4.4%(+3.54)#41 | 5.3%(+2.63)#4,855 |
| 42. | 21632 | 7.9% | 4.4%(+3.54)#42 | 5.3%(+2.63)#4,860 |
| 43. | 21638 | 7.9% | 4.4%(+3.47)#43 | 5.3%(+2.57)#4,959 |
| 44. | 21904 | 7.7% | 4.4%(+3.36)#44 | 5.3%(+2.46)#5,145 |
| 45. | 21801 | 7.7% | 4.4%(+3.36)#45 | 5.3%(+2.46)#5,147 |
| 46. | 21225 | 7.7% | 4.4%(+3.36)#46 | 5.3%(+2.46)#5,150 |
| 47. | 21402 | 7.7% | 4.4%(+3.29)#47 | 5.3%(+2.38)#5,263 |
| 48. | 20781 | 7.7% | 4.4%(+3.28)#48 | 5.3%(+2.37)#5,283 |
| 49. | 20658 | 7.6% | 4.4%(+3.23)#49 | 5.3%(+2.33)#5,358 |
| 50. | 20782 | 7.6% | 4.4%(+3.22)#50 | 5.3%(+2.32)#5,372 |
| 51. | 21521 | 7.5% | 4.4%(+3.13)#51 | 5.3%(+2.23)#5,538 |
| 52. | 21539 | 7.4% | 4.4%(+3.06)#52 | 5.3%(+2.15)#5,668 |
| 53. | 21750 | 7.2% | 4.4%(+2.86)#53 | 5.3%(+1.95)#6,052 |
| 54. | 21520 | 7.2% | 4.4%(+2.85)#54 | 5.3%(+1.95)#6,057 |
| 55. | 20903 | 7.2% | 4.4%(+2.82)#55 | 5.3%(+1.92)#6,128 |
| 56. | 21524 | 7.2% | 4.4%(+2.79)#56 | 5.3%(+1.88)#6,192 |
| 57. | 20628 | 7.1% | 4.4%(+2.67)#57 | 5.3%(+1.77)#6,435 |
| 58. | 21152 | 7.0% | 4.4%(+2.64)#58 | 5.3%(+1.74)#6,501 |
| 59. | 20861 | 7.0% | 4.4%(+2.61)#59 | 5.3%(+1.70)#6,589 |
| 60. | 20653 | 7.0% | 4.4%(+2.60)#60 | 5.3%(+1.69)#6,613 |
| 61. | 21913 | 6.9% | 4.4%(+2.52)#61 | 5.3%(+1.62)#6,804 |
| 62. | 21727 | 6.8% | 4.4%(+2.44)#62 | 5.3%(+1.54)#7,006 |
| 63. | 21791 | 6.8% | 4.4%(+2.41)#63 | 5.3%(+1.51)#7,082 |
| 64. | 20740 | 6.8% | 4.4%(+2.41)#64 | 5.3%(+1.50)#7,087 |
| 65. | 21660 | 6.8% | 4.4%(+2.39)#65 | 5.3%(+1.49)#7,130 |
| 66. | 21795 | 6.7% | 4.4%(+2.31)#66 | 5.3%(+1.40)#7,376 |
| 67. | 21078 | 6.6% | 4.4%(+2.26)#67 | 5.3%(+1.35)#7,518 |
| 68. | 21851 | 6.6% | 4.4%(+2.24)#68 | 5.3%(+1.34)#7,548 |
| 69. | 21766 | 6.5% | 4.4%(+2.16)#69 | 5.3%(+1.26)#7,758 |
| 70. | 20712 | 6.5% | 4.4%(+2.16)#70 | 5.3%(+1.25)#7,773 |
| 71. | 21921 | 6.5% | 4.4%(+2.11)#71 | 5.3%(+1.20)#7,908 |
| 72. | 20705 | 6.5% | 4.4%(+2.09)#72 | 5.3%(+1.18)#7,954 |
| 73. | 21666 | 6.5% | 4.4%(+2.09)#73 | 5.3%(+1.18)#7,959 |
| 74. | 21641 | 6.5% | 4.4%(+2.07)#74 | 5.3%(+1.17)#8,005 |
| 75. | 21758 | 6.3% | 4.4%(+1.95)#75 | 5.3%(+1.05)#8,327 |
| 76. | 20902 | 6.3% | 4.4%(+1.94)#76 | 5.3%(+1.03)#8,385 |
| 77. | 20706 | 6.3% | 4.4%(+1.92)#77 | 5.3%(+1.02)#8,423 |
| 78. | 20783 | 6.3% | 4.4%(+1.92)#78 | 5.3%(+1.01)#8,435 |
| 79. | 20693 | 6.2% | 4.4%(+1.84)#79 | 5.3%(+0.935)#8,671 |
| 80. | 21649 | 6.2% | 4.4%(+1.83)#80 | 5.3%(+0.929)#8,692 |
| 81. | 21601 | 6.2% | 4.4%(+1.79)#81 | 5.3%(+0.880)#8,833 |
| 82. | 21032 | 6.2% | 4.4%(+1.78)#82 | 5.3%(+0.871)#8,857 |
| 83. | 20714 | 6.1% | 4.4%(+1.72)#83 | 5.3%(+0.819)#9,001 |
| 84. | 21647 | 6.1% | 4.4%(+1.72)#84 | 5.3%(+0.817)#9,012 |
| 85. | 21678 | 6.0% | 4.4%(+1.65)#85 | 5.3%(+0.749)#9,227 |
| 86. | 21663 | 6.0% | 4.4%(+1.64)#86 | 5.3%(+0.732)#9,286 |
| 87. | 21702 | 6.0% | 4.4%(+1.64)#87 | 5.3%(+0.730)#9,296 |
| 88. | 21216 | 6.0% | 4.4%(+1.63)#88 | 5.3%(+0.725)#9,309 |
| 89. | 21788 | 6.0% | 4.4%(+1.62)#89 | 5.3%(+0.715)#9,339 |
| 90. | 21160 | 6.0% | 4.4%(+1.61)#90 | 5.3%(+0.706)#9,371 |
| 91. | 21782 | 5.9% | 4.4%(+1.56)#91 | 5.3%(+0.659)#9,524 |
| 92. | 21286 | 5.9% | 4.4%(+1.53)#92 | 5.3%(+0.629)#9,622 |
| 93. | 20906 | 5.9% | 4.4%(+1.52)#93 | 5.3%(+0.617)#9,673 |
| 94. | 21502 | 5.9% | 4.4%(+1.49)#94 | 5.3%(+0.584)#9,783 |
| 95. | 21668 | 5.9% | 4.4%(+1.48)#95 | 5.3%(+0.573)#9,828 |
| 96. | 21901 | 5.9% | 4.4%(+1.47)#96 | 5.3%(+0.566)#9,860 |
| 97. | 20879 | 5.8% | 4.4%(+1.46)#97 | 5.3%(+0.559)#9,884 |
| 98. | 20784 | 5.8% | 4.4%(+1.45)#98 | 5.3%(+0.543)#9,939 |
| 99. | 21228 | 5.8% | 4.4%(+1.44)#99 | 5.3%(+0.537)#9,959 |
| 100. | 21623 | 5.8% | 4.4%(+1.44)#100 | 5.3%(+0.536)#9,962 |
Common Questions
What are the Top 10 Zip Codes with the Highest Percentage of Population Employed in Food Preparation & Serving in Maryland?
Top 10 Zip Codes with the Highest Percentage of Population Employed in Food Preparation & Serving in Maryland are:
What zip code has the Highest Percentage of Population Employed in Food Preparation & Serving in Maryland?
21715 has the Highest Percentage of Population Employed in Food Preparation & Serving in Maryland with 50.0%.
What is the Percentage of Population Employed in Food Preparation & Serving in the State of Maryland?
Percentage of Population Employed in Food Preparation & Serving in Maryland is 4.4%.
What is the Percentage of Population Employed in Food Preparation & Serving in the United States?
Percentage of Population Employed in Food Preparation & Serving in the United States is 5.3%.