Zip Codes with the Highest Percentage of Population Employed in Food Preparation & Serving in Glen Burnie, MD
RELATED REPORTS & OPTIONS
Food Preparation & Serving
Glen Burnie
Compare Zip Codes
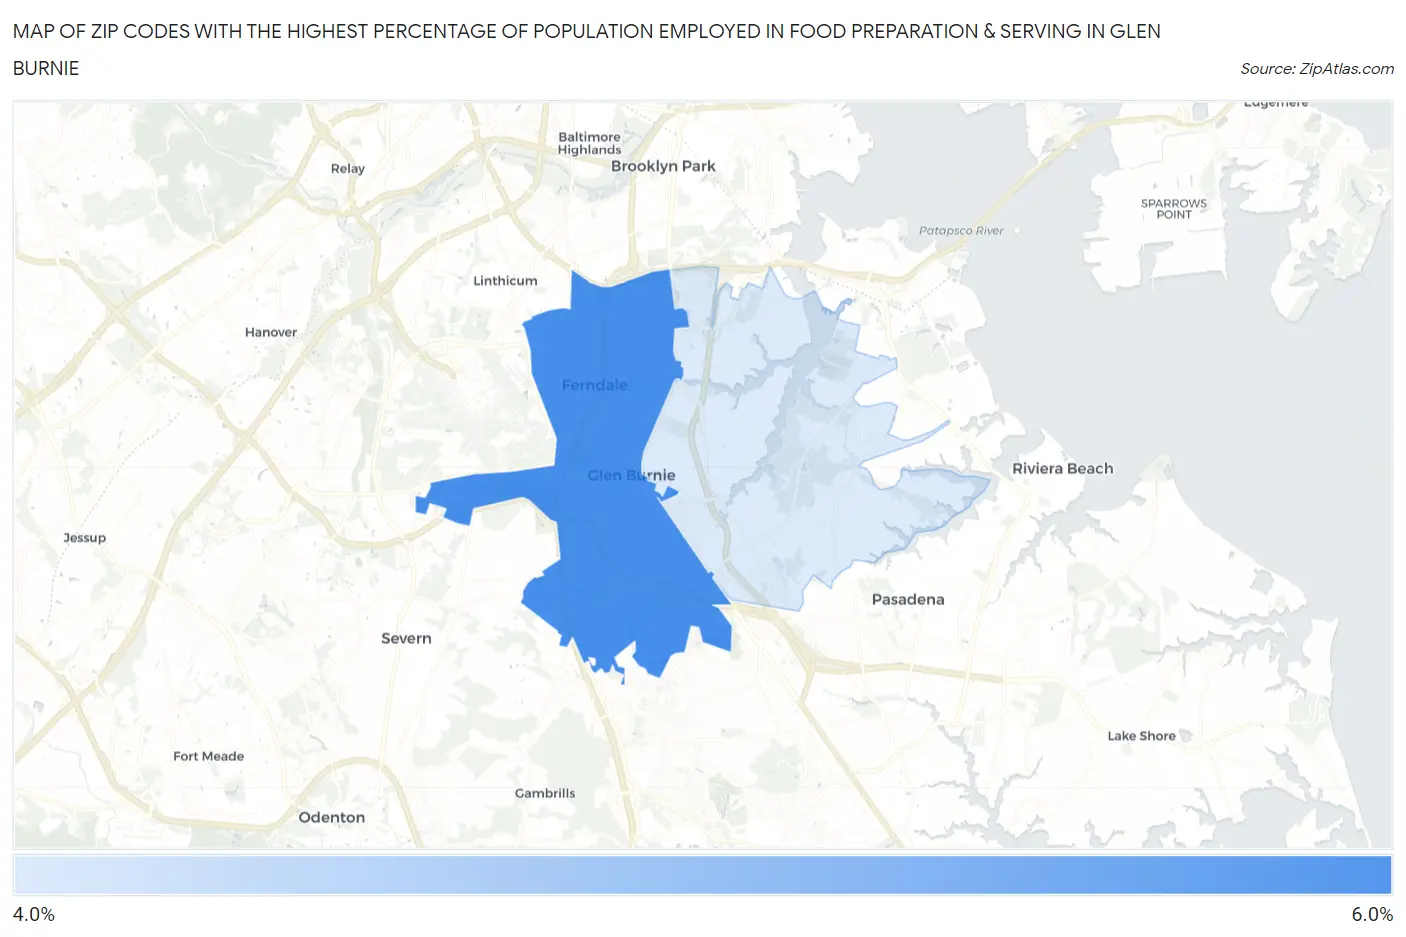
Map of Zip Codes with the Highest Percentage of Population Employed in Food Preparation & Serving in Glen Burnie
5.0%
5.3%
Zip Codes with the Highest Percentage of Population Employed in Food Preparation & Serving in Glen Burnie, MD
| Zip Code | % Employed | vs State | vs National | |
| 1. | 21061 | 5.3% | 4.4%(+0.870)#132 | 5.3%(-0.035)#11,955 |
| 2. | 21060 | 5.0% | 4.4%(+0.581)#151 | 5.3%(-0.325)#13,103 |
1
Common Questions
What are the Top Zip Codes with the Highest Percentage of Population Employed in Food Preparation & Serving in Glen Burnie, MD?
Top Zip Codes with the Highest Percentage of Population Employed in Food Preparation & Serving in Glen Burnie, MD are:
What zip code has the Highest Percentage of Population Employed in Food Preparation & Serving in Glen Burnie, MD?
21061 has the Highest Percentage of Population Employed in Food Preparation & Serving in Glen Burnie, MD with 5.3%.
What is the Percentage of Population Employed in Food Preparation & Serving in Glen Burnie, MD?
Percentage of Population Employed in Food Preparation & Serving in Glen Burnie is 5.1%.
What is the Percentage of Population Employed in Food Preparation & Serving in Maryland?
Percentage of Population Employed in Food Preparation & Serving in Maryland is 4.4%.
What is the Percentage of Population Employed in Food Preparation & Serving in the United States?
Percentage of Population Employed in Food Preparation & Serving in the United States is 5.3%.