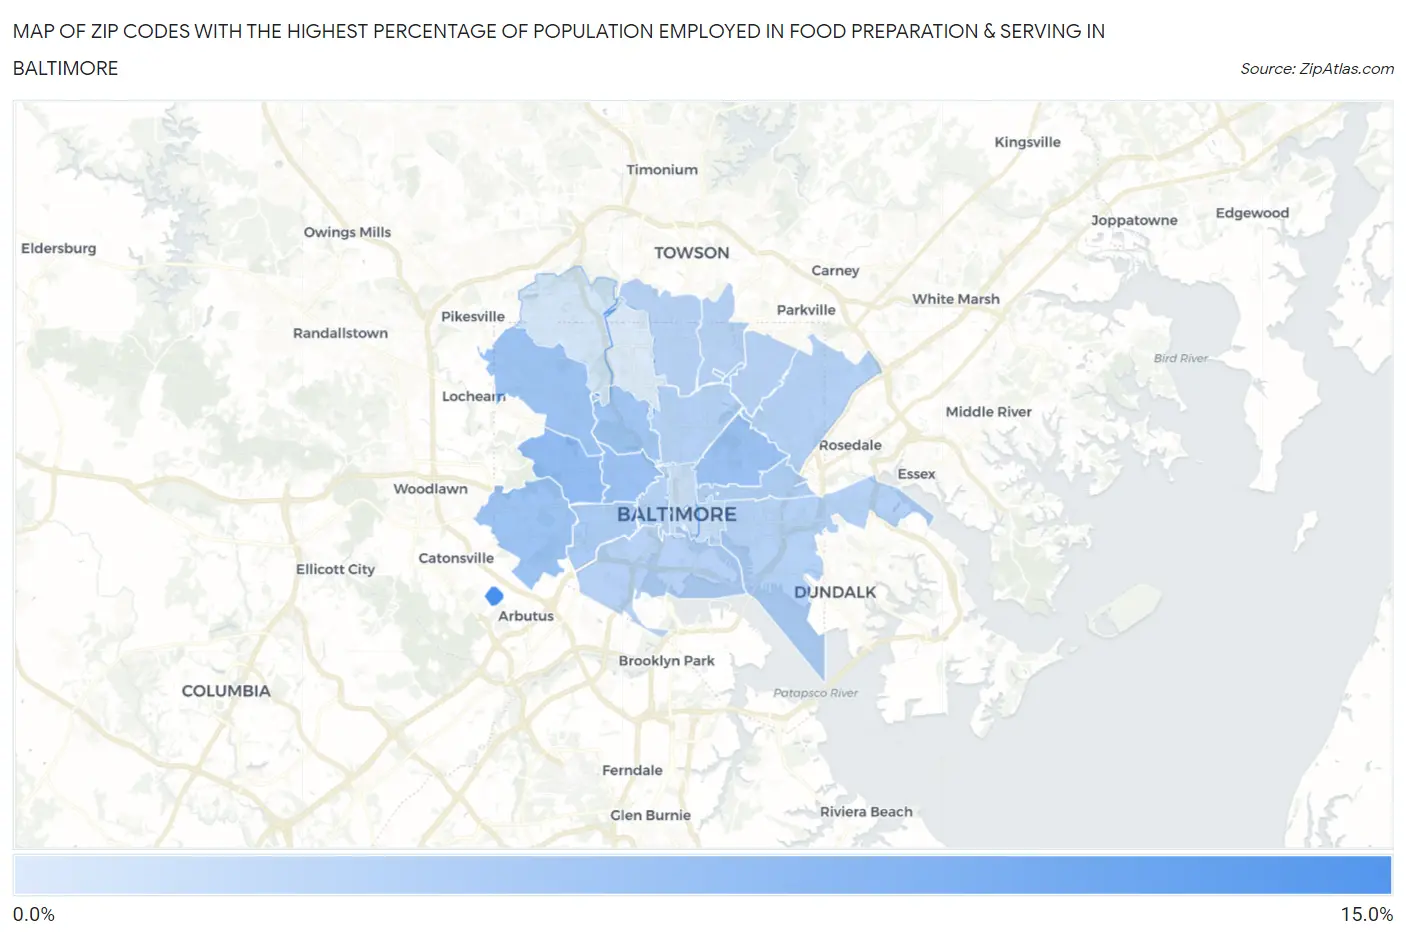
Zip Codes with the Highest Percentage of Population Employed in Food Preparation & Serving in Baltimore, MD
RELATED REPORTS & OPTIONS
Food Preparation & Serving
Baltimore
Compare Zip Codes
Map of Zip Codes with the Highest Percentage of Population Employed in Food Preparation & Serving in Baltimore
1.5%
11.0%
Zip Codes with the Highest Percentage of Population Employed in Food Preparation & Serving in Baltimore, MD
| Zip Code | % Employed | vs State | vs National | |
| 1. | 21250 | 11.0% | 4.4%(+6.57)#22 | 5.3%(+5.67)#2,080 |
| 2. | 21216 | 6.0% | 4.4%(+1.63)#88 | 5.3%(+0.725)#9,309 |
| 3. | 21213 | 5.6% | 4.4%(+1.18)#117 | 5.3%(+0.271)#10,851 |
| 4. | 21217 | 5.4% | 4.4%(+0.996)#125 | 5.3%(+0.090)#11,482 |
| 5. | 21229 | 5.4% | 4.4%(+0.978)#126 | 5.3%(+0.073)#11,548 |
| 6. | 21215 | 5.2% | 4.4%(+0.866)#133 | 5.3%(-0.039)#11,970 |
| 7. | 21211 | 5.0% | 4.4%(+0.632)#148 | 5.3%(-0.274)#12,898 |
| 8. | 21223 | 4.5% | 4.4%(+0.103)#176 | 5.3%(-0.803)#15,093 |
| 9. | 21205 | 4.3% | 4.4%(-0.092)#191 | 5.3%(-0.997)#15,933 |
| 10. | 21251 | 4.2% | 4.4%(-0.214)#201 | 5.3%(-1.12)#16,445 |
| 11. | 21218 | 3.9% | 4.4%(-0.498)#219 | 5.3%(-1.40)#17,623 |
| 12. | 21206 | 3.9% | 4.4%(-0.525)#221 | 5.3%(-1.43)#17,714 |
| 13. | 21224 | 3.8% | 4.4%(-0.543)#222 | 5.3%(-1.45)#17,782 |
| 14. | 21201 | 3.8% | 4.4%(-0.573)#225 | 5.3%(-1.48)#17,909 |
| 15. | 21212 | 3.7% | 4.4%(-0.632)#232 | 5.3%(-1.54)#18,137 |
| 16. | 21214 | 3.7% | 4.4%(-0.666)#237 | 5.3%(-1.57)#18,278 |
| 17. | 21239 | 3.7% | 4.4%(-0.685)#239 | 5.3%(-1.59)#18,376 |
| 18. | 21230 | 3.7% | 4.4%(-0.690)#241 | 5.3%(-1.60)#18,397 |
| 19. | 21231 | 2.8% | 4.4%(-1.55)#299 | 5.3%(-2.45)#21,939 |
| 20. | 21202 | 2.7% | 4.4%(-1.70)#307 | 5.3%(-2.60)#22,478 |
| 21. | 21209 | 1.9% | 4.4%(-2.50)#347 | 5.3%(-3.41)#25,063 |
| 22. | 21210 | 1.5% | 4.4%(-2.93)#364 | 5.3%(-3.83)#26,099 |
1
Common Questions
What are the Top 10 Zip Codes with the Highest Percentage of Population Employed in Food Preparation & Serving in Baltimore, MD?
Top 10 Zip Codes with the Highest Percentage of Population Employed in Food Preparation & Serving in Baltimore, MD are:
What zip code has the Highest Percentage of Population Employed in Food Preparation & Serving in Baltimore, MD?
21250 has the Highest Percentage of Population Employed in Food Preparation & Serving in Baltimore, MD with 11.0%.
What is the Percentage of Population Employed in Food Preparation & Serving in Baltimore, MD?
Percentage of Population Employed in Food Preparation & Serving in Baltimore is 4.4%.
What is the Percentage of Population Employed in Food Preparation & Serving in Maryland?
Percentage of Population Employed in Food Preparation & Serving in Maryland is 4.4%.
What is the Percentage of Population Employed in Food Preparation & Serving in the United States?
Percentage of Population Employed in Food Preparation & Serving in the United States is 5.3%.