Cities with the Highest Percentage of Swedish Population in Kentucky
RELATED REPORTS & OPTIONS
Swedish
Kentucky
Compare Cities
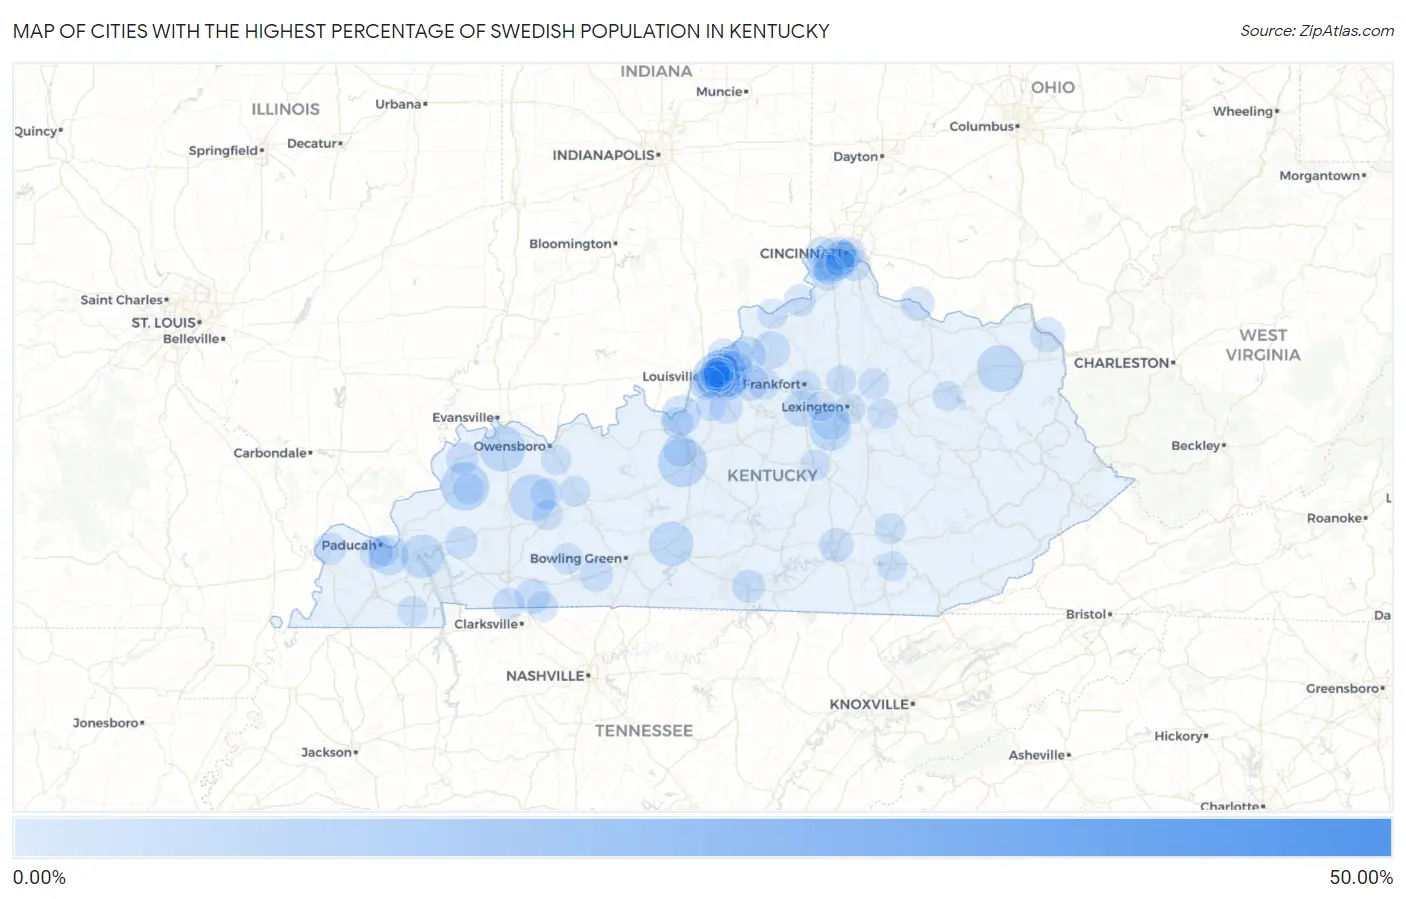
Map of Cities with the Highest Percentage of Swedish Population in Kentucky
0.00%
50.00%
Cities with the Highest Percentage of Swedish Population in Kentucky
| City | Swedish | vs State | vs National | |
| 1. | Curdsville | 40.35% | 0.39%(+40.0)#1 | 1.05%(+39.3)#37 |
| 2. | Cecilia | 4.33% | 0.39%(+3.94)#2 | 1.05%(+3.28)#2,418 |
| 3. | Wheatcroft | 4.20% | 0.39%(+3.81)#3 | 1.05%(+3.15)#2,512 |
| 4. | Olive Hill | 3.88% | 0.39%(+3.50)#4 | 1.05%(+2.84)#2,755 |
| 5. | Sacramento | 3.87% | 0.39%(+3.49)#5 | 1.05%(+2.83)#2,763 |
| 6. | Anthoston | 3.65% | 0.39%(+3.27)#6 | 1.05%(+2.61)#2,993 |
| 7. | Sycamore | 3.57% | 0.39%(+3.19)#7 | 1.05%(+2.52)#3,088 |
| 8. | Park City | 3.43% | 0.39%(+3.04)#8 | 1.05%(+2.38)#3,248 |
| 9. | Villa Hills | 3.33% | 0.39%(+2.94)#9 | 1.05%(+2.28)#3,371 |
| 10. | Grand Rivers | 3.24% | 0.39%(+2.85)#10 | 1.05%(+2.19)#3,472 |
| 11. | Wilmore | 2.83% | 0.39%(+2.44)#11 | 1.05%(+1.78)#4,090 |
| 12. | Reidland | 2.56% | 0.39%(+2.17)#12 | 1.05%(+1.51)#4,533 |
| 13. | Barbourmeade | 2.56% | 0.39%(+2.17)#13 | 1.05%(+1.51)#4,539 |
| 14. | West Point | 2.33% | 0.39%(+1.94)#14 | 1.05%(+1.28)#4,991 |
| 15. | Rolling Fields | 2.33% | 0.39%(+1.94)#15 | 1.05%(+1.28)#4,997 |
| 16. | Briarwood | 2.08% | 0.39%(+1.69)#16 | 1.05%(+1.03)#5,563 |
| 17. | New Castle | 2.05% | 0.39%(+1.66)#17 | 1.05%(+0.997)#5,651 |
| 18. | Keene | 2.02% | 0.39%(+1.64)#18 | 1.05%(+0.976)#5,715 |
| 19. | Middletown | 1.86% | 0.39%(+1.47)#19 | 1.05%(+0.807)#6,240 |
| 20. | La Grange | 1.83% | 0.39%(+1.44)#20 | 1.05%(+0.778)#6,318 |
| 21. | Simpsonville | 1.75% | 0.39%(+1.36)#21 | 1.05%(+0.699)#6,555 |
| 22. | Lawrenceburg | 1.63% | 0.39%(+1.24)#22 | 1.05%(+0.577)#6,934 |
| 23. | Pewee Valley | 1.59% | 0.39%(+1.20)#23 | 1.05%(+0.537)#7,075 |
| 24. | Douglass Hills | 1.57% | 0.39%(+1.19)#24 | 1.05%(+0.525)#7,114 |
| 25. | Green Spring | 1.55% | 0.39%(+1.17)#25 | 1.05%(+0.506)#7,189 |
| 26. | Spring Valley | 1.51% | 0.39%(+1.13)#26 | 1.05%(+0.465)#7,358 |
| 27. | Raceland | 1.44% | 0.39%(+1.05)#27 | 1.05%(+0.391)#7,635 |
| 28. | Trenton | 1.40% | 0.39%(+1.01)#28 | 1.05%(+0.350)#7,806 |
| 29. | Somerset | 1.38% | 0.39%(+0.989)#29 | 1.05%(+0.327)#7,911 |
| 30. | Dover | 1.32% | 0.39%(+0.938)#30 | 1.05%(+0.276)#8,143 |
| 31. | Parkway Village | 1.29% | 0.39%(+0.900)#31 | 1.05%(+0.238)#8,320 |
| 32. | Auburn | 1.22% | 0.39%(+0.830)#32 | 1.05%(+0.167)#8,632 |
| 33. | Rineyville | 1.20% | 0.39%(+0.812)#33 | 1.05%(+0.149)#8,717 |
| 34. | Hendron | 1.15% | 0.39%(+0.768)#34 | 1.05%(+0.106)#8,909 |
| 35. | Wellington | 1.13% | 0.39%(+0.743)#35 | 1.05%(+0.080)#9,055 |
| 36. | Burkesville | 1.12% | 0.39%(+0.738)#36 | 1.05%(+0.076)#9,077 |
| 37. | Meadow Vale | 1.08% | 0.39%(+0.699)#37 | 1.05%(+0.036)#9,288 |
| 38. | Murray Hill | 1.03% | 0.39%(+0.640)#38 | 1.05%(-0.023)#9,618 |
| 39. | Graymoor Devondale | 1.02% | 0.39%(+0.633)#39 | 1.05%(-0.029)#9,655 |
| 40. | Mount Washington | 1.01% | 0.39%(+0.620)#40 | 1.05%(-0.042)#9,719 |
| 41. | Goshen | 0.96% | 0.39%(+0.578)#41 | 1.05%(-0.084)#9,957 |
| 42. | Shelbyville | 0.95% | 0.39%(+0.559)#42 | 1.05%(-0.103)#10,064 |
| 43. | Princeton | 0.94% | 0.39%(+0.558)#43 | 1.05%(-0.104)#10,073 |
| 44. | Morganfield | 0.93% | 0.39%(+0.539)#44 | 1.05%(-0.123)#10,178 |
| 45. | Barlow | 0.92% | 0.39%(+0.533)#45 | 1.05%(-0.129)#10,198 |
| 46. | Lyndon | 0.92% | 0.39%(+0.532)#46 | 1.05%(-0.130)#10,200 |
| 47. | Windy Hills | 0.91% | 0.39%(+0.526)#47 | 1.05%(-0.136)#10,239 |
| 48. | Park Hills | 0.89% | 0.39%(+0.500)#48 | 1.05%(-0.162)#10,385 |
| 49. | Cold Spring | 0.88% | 0.39%(+0.493)#49 | 1.05%(-0.170)#10,430 |
| 50. | Seneca Gardens | 0.88% | 0.39%(+0.491)#50 | 1.05%(-0.171)#10,438 |
| 51. | Fort Campbell North | 0.87% | 0.39%(+0.488)#51 | 1.05%(-0.174)#10,457 |
| 52. | St Matthews | 0.87% | 0.39%(+0.488)#52 | 1.05%(-0.175)#10,458 |
| 53. | Warsaw | 0.87% | 0.39%(+0.485)#53 | 1.05%(-0.177)#10,474 |
| 54. | Norbourne Estates | 0.86% | 0.39%(+0.476)#54 | 1.05%(-0.186)#10,532 |
| 55. | Bellewood | 0.85% | 0.39%(+0.465)#55 | 1.05%(-0.197)#10,604 |
| 56. | Wildwood | 0.84% | 0.39%(+0.454)#56 | 1.05%(-0.208)#10,693 |
| 57. | Richlawn | 0.83% | 0.39%(+0.445)#57 | 1.05%(-0.217)#10,755 |
| 58. | Muldraugh | 0.82% | 0.39%(+0.433)#58 | 1.05%(-0.229)#10,832 |
| 59. | Northfield | 0.81% | 0.39%(+0.428)#59 | 1.05%(-0.235)#10,853 |
| 60. | Island | 0.81% | 0.39%(+0.427)#60 | 1.05%(-0.235)#10,857 |
| 61. | Union | 0.80% | 0.39%(+0.415)#61 | 1.05%(-0.248)#10,922 |
| 62. | Jeffersontown | 0.79% | 0.39%(+0.406)#62 | 1.05%(-0.257)#10,990 |
| 63. | Burlington | 0.78% | 0.39%(+0.391)#63 | 1.05%(-0.271)#11,084 |
| 64. | Clay | 0.74% | 0.39%(+0.355)#64 | 1.05%(-0.307)#11,345 |
| 65. | Lewisburg | 0.74% | 0.39%(+0.352)#65 | 1.05%(-0.310)#11,368 |
| 66. | Brownsboro Farm | 0.72% | 0.39%(+0.337)#66 | 1.05%(-0.325)#11,449 |
| 67. | Orchard Grass Hills | 0.72% | 0.39%(+0.337)#67 | 1.05%(-0.326)#11,455 |
| 68. | Francisville | 0.72% | 0.39%(+0.331)#68 | 1.05%(-0.332)#11,490 |
| 69. | East Bernstadt | 0.71% | 0.39%(+0.320)#69 | 1.05%(-0.343)#11,571 |
| 70. | Buckner | 0.68% | 0.39%(+0.297)#70 | 1.05%(-0.365)#11,729 |
| 71. | Danville | 0.66% | 0.39%(+0.277)#71 | 1.05%(-0.385)#11,876 |
| 72. | Paris | 0.66% | 0.39%(+0.274)#72 | 1.05%(-0.388)#11,891 |
| 73. | Cambridge | 0.65% | 0.39%(+0.268)#73 | 1.05%(-0.395)#11,940 |
| 74. | Hartford | 0.64% | 0.39%(+0.250)#74 | 1.05%(-0.412)#12,068 |
| 75. | Druid Hills | 0.63% | 0.39%(+0.245)#75 | 1.05%(-0.417)#12,109 |
| 76. | Bromley | 0.63% | 0.39%(+0.242)#76 | 1.05%(-0.421)#12,128 |
| 77. | Murray | 0.62% | 0.39%(+0.234)#77 | 1.05%(-0.428)#12,186 |
| 78. | Beechwood Village | 0.61% | 0.39%(+0.228)#78 | 1.05%(-0.434)#12,232 |
| 79. | Winchester | 0.60% | 0.39%(+0.217)#79 | 1.05%(-0.446)#12,308 |
| 80. | Riverwood | 0.60% | 0.39%(+0.213)#80 | 1.05%(-0.450)#12,334 |
| 81. | Central City | 0.59% | 0.39%(+0.206)#81 | 1.05%(-0.456)#12,399 |
| 82. | Farley | 0.59% | 0.39%(+0.206)#82 | 1.05%(-0.456)#12,401 |
| 83. | Frankfort | 0.58% | 0.39%(+0.194)#83 | 1.05%(-0.469)#12,483 |
| 84. | Oakbrook | 0.58% | 0.39%(+0.191)#84 | 1.05%(-0.471)#12,500 |
| 85. | Guthrie | 0.57% | 0.39%(+0.180)#85 | 1.05%(-0.483)#12,594 |
| 86. | Lexington | 0.56% | 0.39%(+0.179)#86 | 1.05%(-0.484)#12,605 |
| 87. | Masonville | 0.55% | 0.39%(+0.166)#87 | 1.05%(-0.497)#12,719 |
| 88. | Salt Lick | 0.53% | 0.39%(+0.146)#88 | 1.05%(-0.516)#12,884 |
| 89. | Ludlow | 0.52% | 0.39%(+0.139)#89 | 1.05%(-0.524)#12,947 |
| 90. | Carrollton | 0.51% | 0.39%(+0.128)#90 | 1.05%(-0.534)#13,036 |
| 91. | Crossgate | 0.51% | 0.39%(+0.124)#91 | 1.05%(-0.538)#13,069 |
| 92. | Fort Mitchell | 0.51% | 0.39%(+0.122)#92 | 1.05%(-0.541)#13,096 |
| 93. | Louisville | 0.51% | 0.39%(+0.121)#93 | 1.05%(-0.542)#13,107 |
| 94. | Bellevue | 0.50% | 0.39%(+0.114)#94 | 1.05%(-0.548)#13,163 |
| 95. | Corbin | 0.50% | 0.39%(+0.113)#95 | 1.05%(-0.549)#13,178 |
| 96. | Crestview Hills | 0.50% | 0.39%(+0.112)#96 | 1.05%(-0.550)#13,191 |
| 97. | Florence | 0.49% | 0.39%(+0.104)#97 | 1.05%(-0.559)#13,266 |
| 98. | Versailles | 0.49% | 0.39%(+0.099)#98 | 1.05%(-0.563)#13,300 |
| 99. | Fox Chase | 0.48% | 0.39%(+0.089)#99 | 1.05%(-0.573)#13,403 |
| 100. | Georgetown | 0.47% | 0.39%(+0.083)#100 | 1.05%(-0.579)#13,458 |
Common Questions
What are the Top 10 Cities with the Highest Percentage of Swedish Population in Kentucky?
Top 10 Cities with the Highest Percentage of Swedish Population in Kentucky are:
#1
4.33%
#2
4.20%
#3
3.88%
#4
3.87%
#5
3.65%
#6
3.57%
#7
3.43%
#8
3.33%
#9
3.24%
#10
2.83%
What city has the Highest Percentage of Swedish Population in Kentucky?
Cecilia has the Highest Percentage of Swedish Population in Kentucky with 4.33%.
What is the Percentage of Swedish Population in the State of Kentucky?
Percentage of Swedish Population in Kentucky is 0.39%.
What is the Percentage of Swedish Population in the United States?
Percentage of Swedish Population in the United States is 1.05%.