Chuluota, FL Map & Demographics
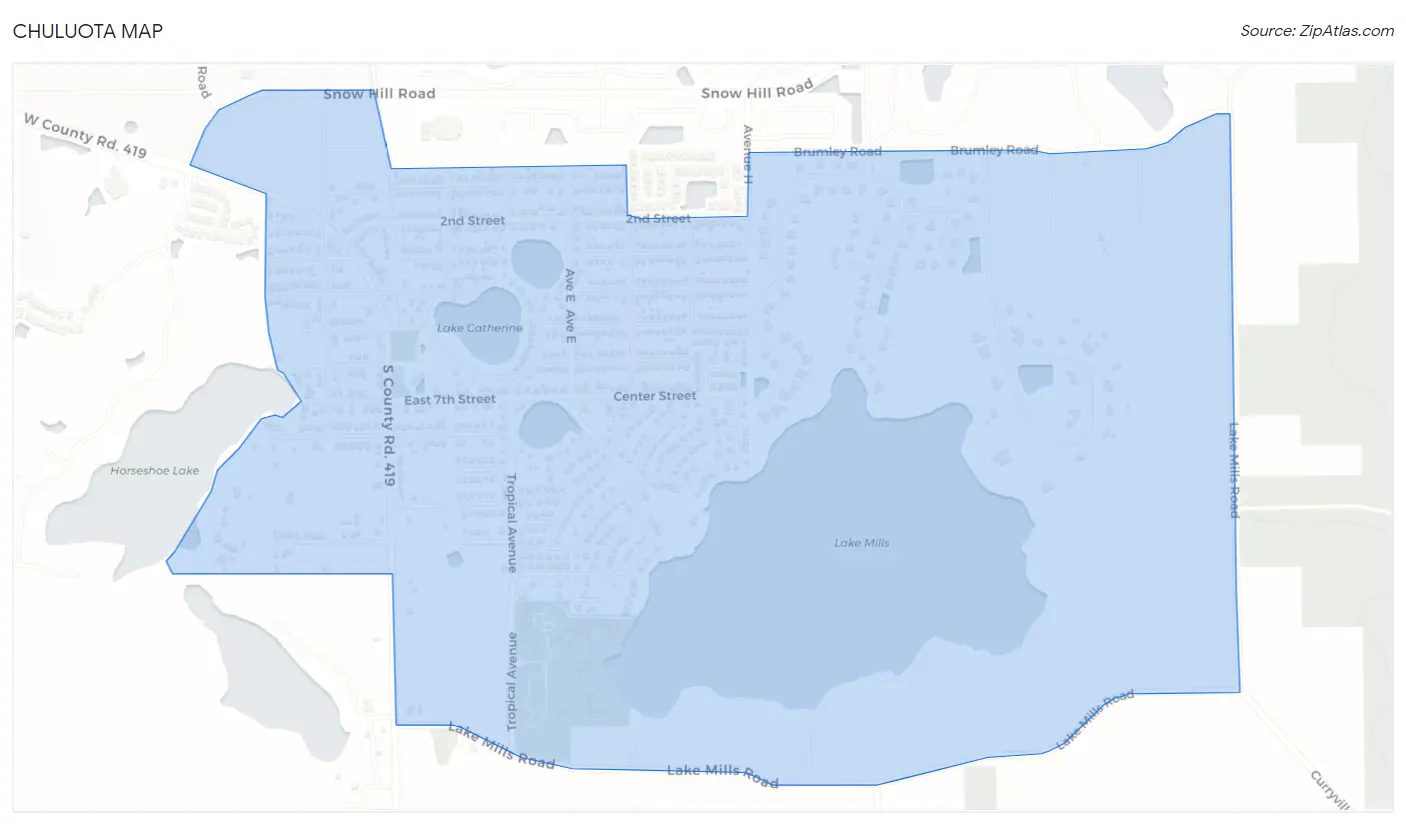
Chuluota Map
Chuluota Overview
$33,401
PER CAPITA INCOME
$74,765
AVG FAMILY INCOME
$80,250
AVG HOUSEHOLD INCOME
1.3%
WAGE / INCOME GAP [ % ]
98.7¢/ $1
WAGE / INCOME GAP [ $ ]
0.45
INEQUALITY / GINI INDEX
2,484
TOTAL POPULATION
1,445
MALE POPULATION
1,039
FEMALE POPULATION
139.08
MALES / 100 FEMALES
71.90
FEMALES / 100 MALES
33.6
MEDIAN AGE
3.1
AVG FAMILY SIZE
2.9
AVG HOUSEHOLD SIZE
1,177
LABOR FORCE [ PEOPLE ]
62.2%
PERCENT IN LABOR FORCE
5.9%
UNEMPLOYMENT RATE
Income in Chuluota
Income Overview in Chuluota
Per Capita Income in Chuluota is $33,401, while median incomes of families and households are $74,765 and $80,250 respectively.
| Characteristic | Number | Measure |
| Per Capita Income | 2,484 | $33,401 |
| Median Family Income | 646 | $74,765 |
| Mean Family Income | 646 | $81,105 |
| Median Household Income | 853 | $80,250 |
| Mean Household Income | 853 | $95,935 |
| Income Deficit | 646 | $0 |
| Wage / Income Gap (%) | 2,484 | 1.28% |
| Wage / Income Gap ($) | 2,484 | 98.72¢ per $1 |
| Gini / Inequality Index | 2,484 | 0.45 |
Earnings by Sex in Chuluota
Average Earnings in Chuluota are $36,289, $36,115 for men and $36,585 for women, a difference of 1.3%.
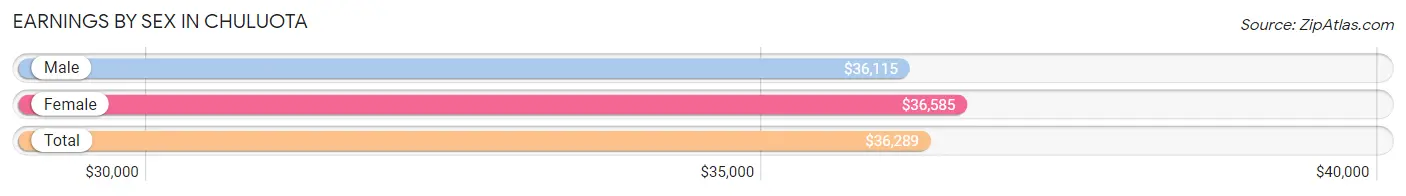
| Sex | Number | Average Earnings |
| Male | 785 (59.8%) | $36,115 |
| Female | 528 (40.2%) | $36,585 |
| Total | 1,313 (100.0%) | $36,289 |
Earnings by Sex by Income Bracket in Chuluota
The most common earnings brackets in Chuluota are $35,000 to $39,999 for men (120 | 15.3%) and $40,000 to $44,999 for women (85 | 16.1%).
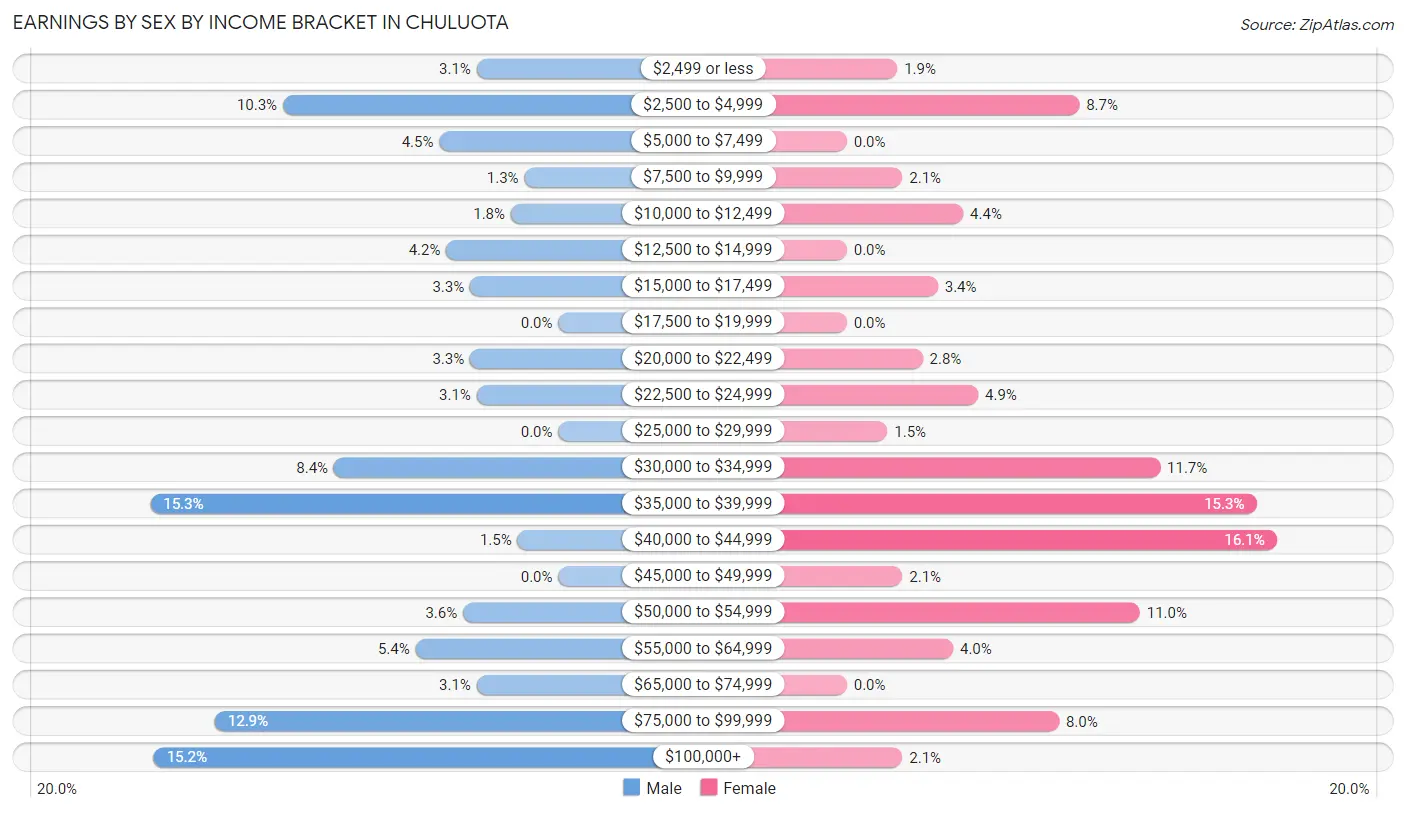
| Income | Male | Female |
| $2,499 or less | 24 (3.1%) | 10 (1.9%) |
| $2,500 to $4,999 | 81 (10.3%) | 46 (8.7%) |
| $5,000 to $7,499 | 35 (4.5%) | 0 (0.0%) |
| $7,500 to $9,999 | 10 (1.3%) | 11 (2.1%) |
| $10,000 to $12,499 | 14 (1.8%) | 23 (4.4%) |
| $12,500 to $14,999 | 33 (4.2%) | 0 (0.0%) |
| $15,000 to $17,499 | 26 (3.3%) | 18 (3.4%) |
| $17,500 to $19,999 | 0 (0.0%) | 0 (0.0%) |
| $20,000 to $22,499 | 26 (3.3%) | 15 (2.8%) |
| $22,500 to $24,999 | 24 (3.1%) | 26 (4.9%) |
| $25,000 to $29,999 | 0 (0.0%) | 8 (1.5%) |
| $30,000 to $34,999 | 66 (8.4%) | 62 (11.7%) |
| $35,000 to $39,999 | 120 (15.3%) | 81 (15.3%) |
| $40,000 to $44,999 | 12 (1.5%) | 85 (16.1%) |
| $45,000 to $49,999 | 0 (0.0%) | 11 (2.1%) |
| $50,000 to $54,999 | 28 (3.6%) | 58 (11.0%) |
| $55,000 to $64,999 | 42 (5.3%) | 21 (4.0%) |
| $65,000 to $74,999 | 24 (3.1%) | 0 (0.0%) |
| $75,000 to $99,999 | 101 (12.9%) | 42 (8.0%) |
| $100,000+ | 119 (15.2%) | 11 (2.1%) |
| Total | 785 (100.0%) | 528 (100.0%) |
Earnings by Sex by Educational Attainment in Chuluota
Average earnings in Chuluota are $36,896 for men and $36,884 for women, a difference of 0.0%. Men with an educational attainment of bachelor's degree enjoy the highest average annual earnings of $108,393, while those with college or associate's degree education earn the least with $31,977. Women with an educational attainment of graduate degree earn the most with the average annual earnings of $53,125, while those with high school diploma education have the smallest earnings of $30,100.
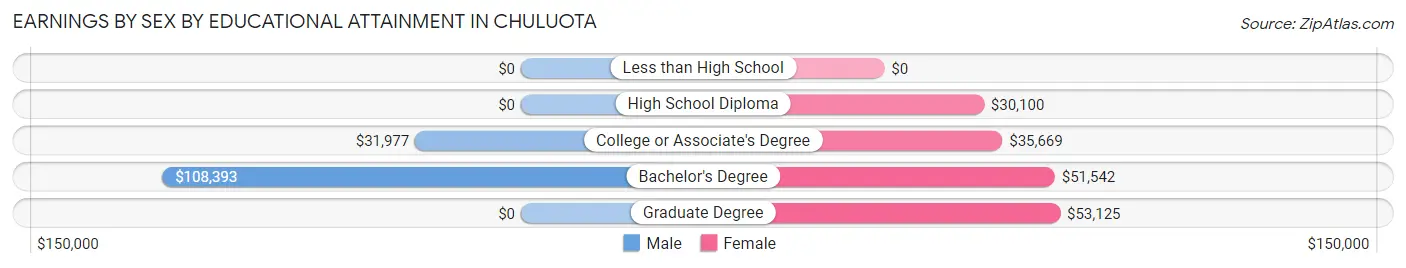
| Educational Attainment | Male Income | Female Income |
| Less than High School | - | - |
| High School Diploma | - | - |
| College or Associate's Degree | $31,977 | $35,669 |
| Bachelor's Degree | $108,393 | $51,542 |
| Graduate Degree | - | - |
| Total | $36,896 | $36,884 |
Family Income in Chuluota
Family Income Brackets in Chuluota
According to the Chuluota family income data, there are 144 families falling into the $50,000 to $74,999 income range, which is the most common income bracket and makes up 22.3% of all families.
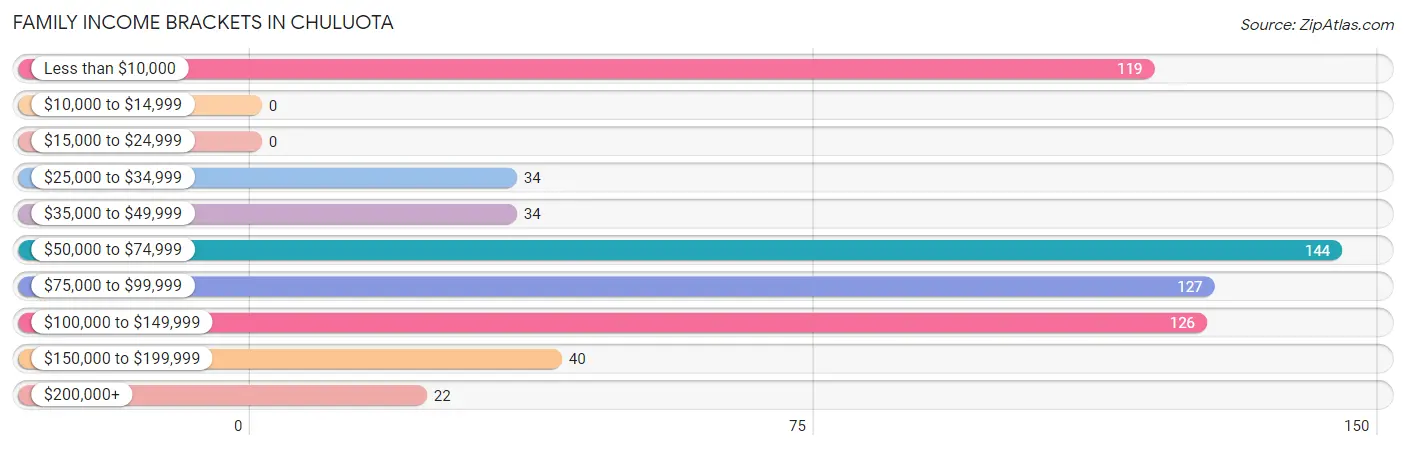
| Income Bracket | # Families | % Families |
| Less than $10,000 | 119 | 18.4% |
| $10,000 to $14,999 | 0 | 0.0% |
| $15,000 to $24,999 | 0 | 0.0% |
| $25,000 to $34,999 | 34 | 5.3% |
| $35,000 to $49,999 | 34 | 5.3% |
| $50,000 to $74,999 | 144 | 22.3% |
| $75,000 to $99,999 | 127 | 19.7% |
| $100,000 to $149,999 | 126 | 19.5% |
| $150,000 to $199,999 | 40 | 6.2% |
| $200,000+ | 22 | 3.4% |
Family Income by Famaliy Size in Chuluota
5-person families (48 | 7.4%) account for the highest median family income in Chuluota with $146,719 per family, while 2-person families (223 | 34.5%) have the highest median income of $31,479 per family member.
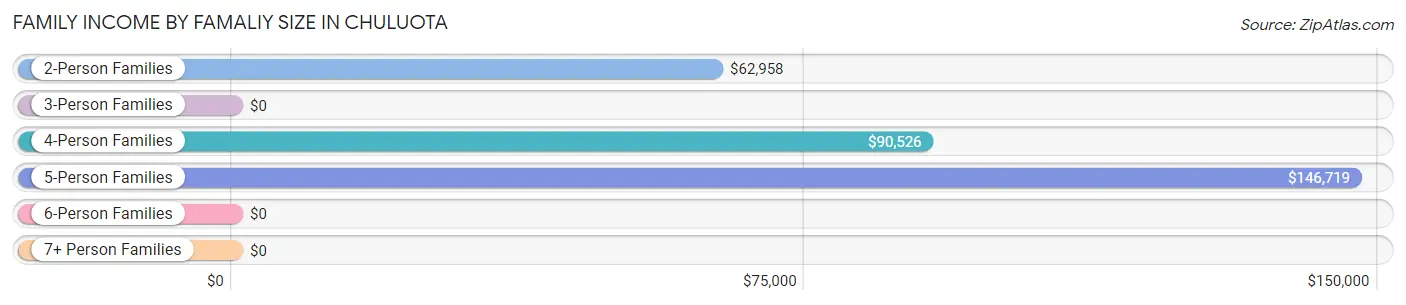
| Income Bracket | # Families | Median Income |
| 2-Person Families | 223 (34.5%) | $62,958 |
| 3-Person Families | 147 (22.8%) | $0 |
| 4-Person Families | 228 (35.3%) | $90,526 |
| 5-Person Families | 48 (7.4%) | $146,719 |
| 6-Person Families | 0 (0.0%) | $0 |
| 7+ Person Families | 0 (0.0%) | $0 |
| Total | 646 (100.0%) | $74,765 |
Family Income by Number of Earners in Chuluota
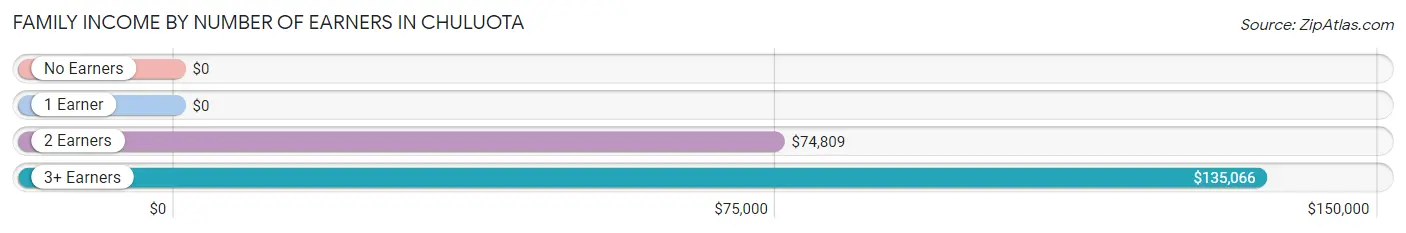
| Number of Earners | # Families | Median Income |
| No Earners | 93 (14.4%) | $0 |
| 1 Earner | 209 (32.4%) | $0 |
| 2 Earners | 255 (39.5%) | $74,809 |
| 3+ Earners | 89 (13.8%) | $135,066 |
| Total | 646 (100.0%) | $74,765 |
Household Income in Chuluota
Household Income Brackets in Chuluota
With 219 households falling in the category, the $75,000 to $99,999 income range is the most frequent in Chuluota, accounting for 25.7% of all households. In contrast, only 12 households (1.4%) fall into the $10,000 to $14,999 income bracket, making it the least populous group.
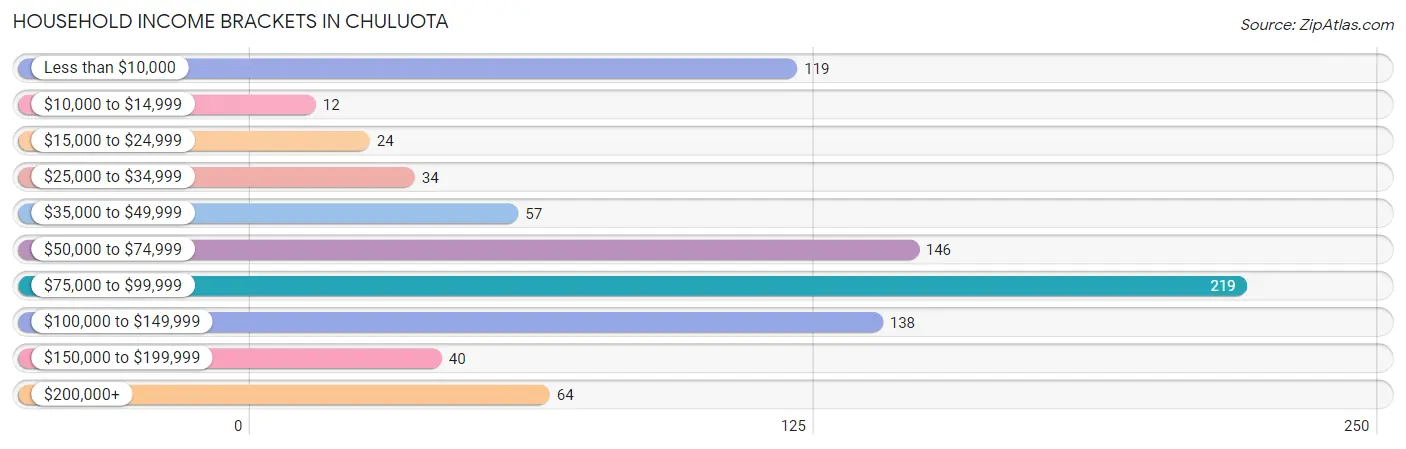
| Income Bracket | # Households | % Households |
| Less than $10,000 | 119 | 14.0% |
| $10,000 to $14,999 | 12 | 1.4% |
| $15,000 to $24,999 | 24 | 2.8% |
| $25,000 to $34,999 | 34 | 4.0% |
| $35,000 to $49,999 | 57 | 6.7% |
| $50,000 to $74,999 | 146 | 17.1% |
| $75,000 to $99,999 | 219 | 25.7% |
| $100,000 to $149,999 | 138 | 16.2% |
| $150,000 to $199,999 | 40 | 4.7% |
| $200,000+ | 64 | 7.5% |
Household Income by Householder Age in Chuluota
The median household income in Chuluota is $80,250, with the highest median household income of $135,417 found in the 65+ years age bracket for the primary householder. A total of 103 households (12.1%) fall into this category.
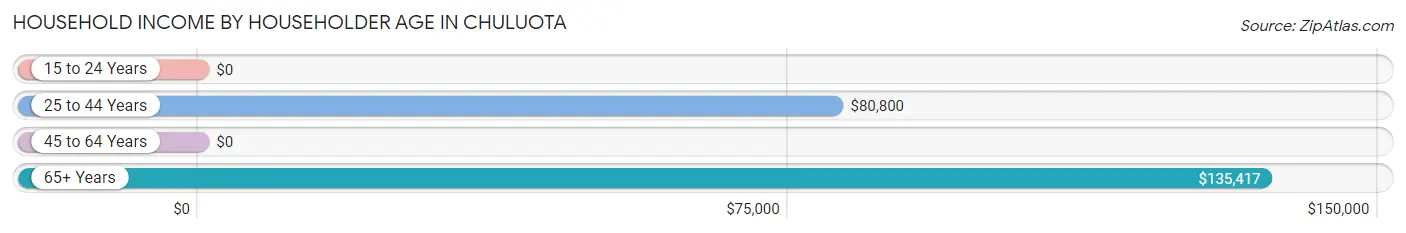
| Income Bracket | # Households | Median Income |
| 15 to 24 Years | 0 (0.0%) | $0 |
| 25 to 44 Years | 492 (57.7%) | $80,800 |
| 45 to 64 Years | 258 (30.2%) | $0 |
| 65+ Years | 103 (12.1%) | $135,417 |
| Total | 853 (100.0%) | $80,250 |
Poverty in Chuluota
Income Below Poverty by Sex and Age in Chuluota
With 20.1% poverty level for males and 13.9% for females among the residents of Chuluota, 18 to 24 year old males and 55 to 64 year old females are the most vulnerable to poverty, with 69 males (48.9%) and 33 females (37.5%) in their respective age groups living below the poverty level.
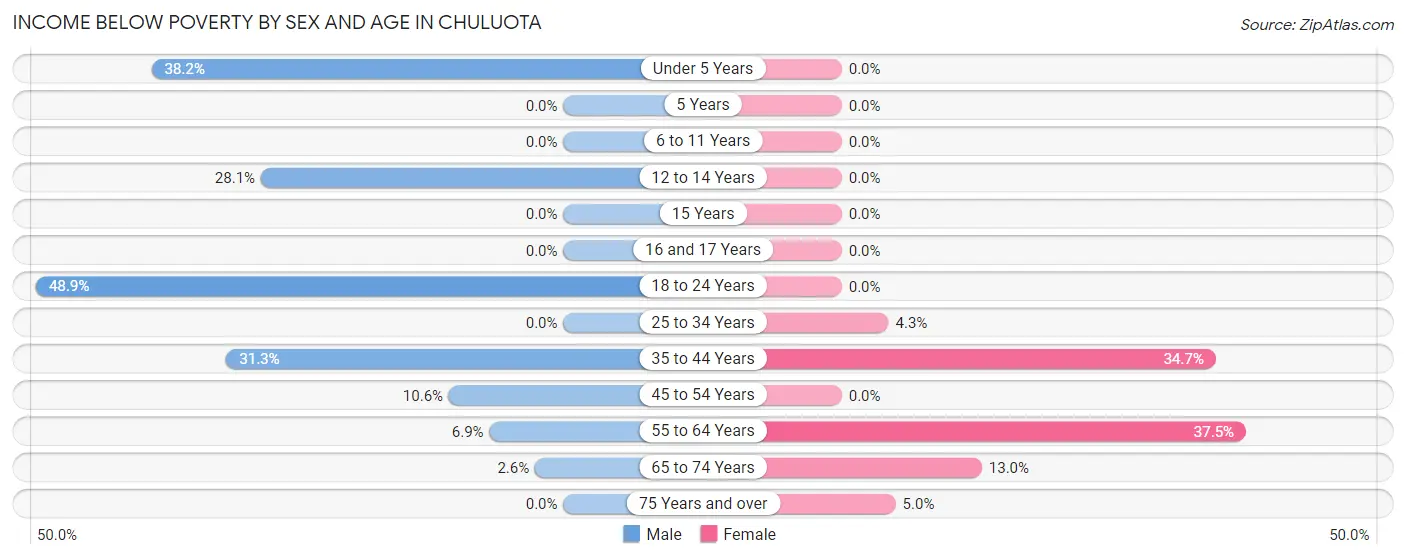
| Age Bracket | Male | Female |
| Under 5 Years | 86 (38.2%) | 0 (0.0%) |
| 5 Years | 0 (0.0%) | 0 (0.0%) |
| 6 to 11 Years | 0 (0.0%) | 0 (0.0%) |
| 12 to 14 Years | 16 (28.1%) | 0 (0.0%) |
| 15 Years | 0 (0.0%) | 0 (0.0%) |
| 16 and 17 Years | 0 (0.0%) | 0 (0.0%) |
| 18 to 24 Years | 69 (48.9%) | 0 (0.0%) |
| 25 to 34 Years | 0 (0.0%) | 15 (4.3%) |
| 35 to 44 Years | 81 (31.3%) | 76 (34.7%) |
| 45 to 54 Years | 17 (10.6%) | 0 (0.0%) |
| 55 to 64 Years | 12 (6.9%) | 33 (37.5%) |
| 65 to 74 Years | 2 (2.6%) | 13 (13.0%) |
| 75 Years and over | 0 (0.0%) | 3 (5.0%) |
| Total | 283 (20.1%) | 140 (13.9%) |
Income Above Poverty by Sex and Age in Chuluota
According to the poverty statistics in Chuluota, males aged 5 years and females aged under 5 years are the age groups that are most secure financially, with 100.0% of males and 100.0% of females in these age groups living above the poverty line.
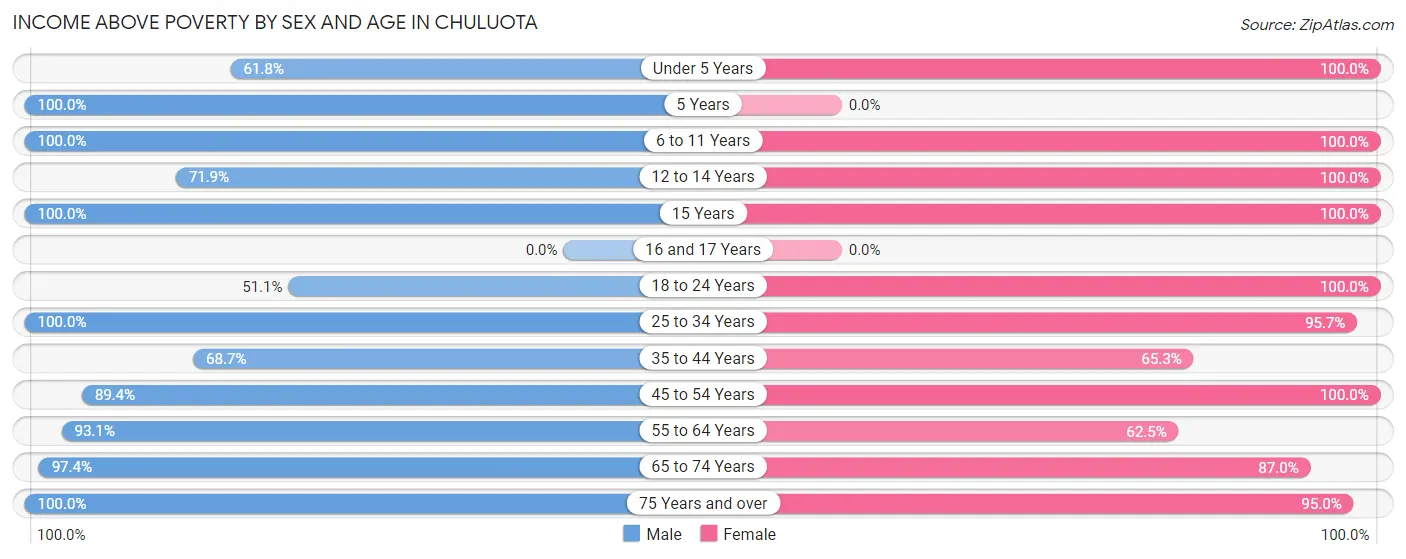
| Age Bracket | Male | Female |
| Under 5 Years | 139 (61.8%) | 64 (100.0%) |
| 5 Years | 27 (100.0%) | 0 (0.0%) |
| 6 to 11 Years | 101 (100.0%) | 41 (100.0%) |
| 12 to 14 Years | 41 (71.9%) | 10 (100.0%) |
| 15 Years | 11 (100.0%) | 22 (100.0%) |
| 16 and 17 Years | 0 (0.0%) | 0 (0.0%) |
| 18 to 24 Years | 72 (51.1%) | 11 (100.0%) |
| 25 to 34 Years | 157 (100.0%) | 331 (95.7%) |
| 35 to 44 Years | 178 (68.7%) | 143 (65.3%) |
| 45 to 54 Years | 143 (89.4%) | 45 (100.0%) |
| 55 to 64 Years | 163 (93.1%) | 55 (62.5%) |
| 65 to 74 Years | 74 (97.4%) | 87 (87.0%) |
| 75 Years and over | 19 (100.0%) | 57 (95.0%) |
| Total | 1,125 (79.9%) | 866 (86.1%) |
Income Below Poverty Among Married-Couple Families in Chuluota
The poverty statistics for married-couple families in Chuluota show that 2.4% or 12 of the total 494 families live below the poverty line. Families with no children have the highest poverty rate of 6.0%, comprising of 12 families. On the other hand, families with 1 or 2 children have the lowest poverty rate of 0.0%, which includes 0 families.
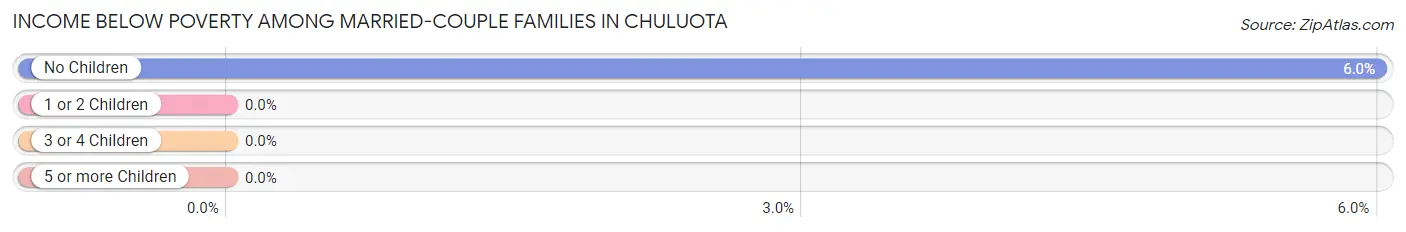
| Children | Above Poverty | Below Poverty |
| No Children | 188 (94.0%) | 12 (6.0%) |
| 1 or 2 Children | 294 (100.0%) | 0 (0.0%) |
| 3 or 4 Children | 0 (0.0%) | 0 (0.0%) |
| 5 or more Children | 0 (0.0%) | 0 (0.0%) |
| Total | 482 (97.6%) | 12 (2.4%) |
Income Below Poverty Among Single-Parent Households in Chuluota
According to the poverty data in Chuluota, 79.0% or 98 single-father households and 32.1% or 9 single-mother households are living below the poverty line. Among single-father households, those with 1 or 2 children have the highest poverty rate, with 98 households (100.0%) experiencing poverty. Likewise, among single-mother households, those with no children have the highest poverty rate, with 9 households (32.1%) falling below the poverty line.
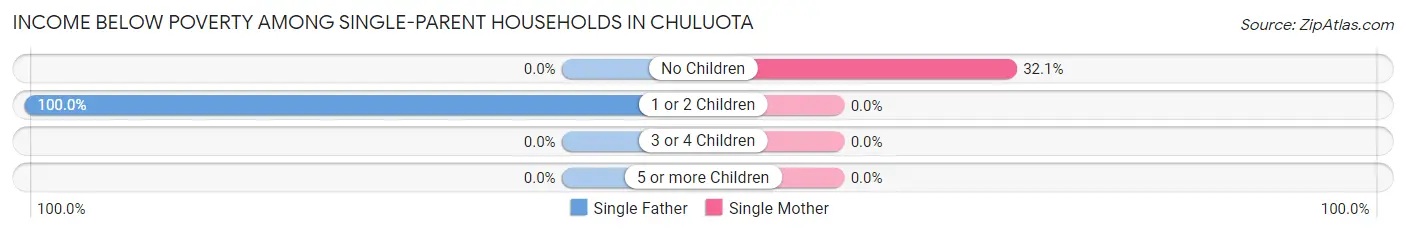
| Children | Single Father | Single Mother |
| No Children | 0 (0.0%) | 9 (32.1%) |
| 1 or 2 Children | 98 (100.0%) | 0 (0.0%) |
| 3 or 4 Children | 0 (0.0%) | 0 (0.0%) |
| 5 or more Children | 0 (0.0%) | 0 (0.0%) |
| Total | 98 (79.0%) | 9 (32.1%) |
Income Below Poverty Among Married-Couple vs Single-Parent Households in Chuluota
The poverty data for Chuluota shows that 12 of the married-couple family households (2.4%) and 107 of the single-parent households (70.4%) are living below the poverty level. Within the married-couple family households, those with no children have the highest poverty rate, with 12 households (6.0%) falling below the poverty line. Among the single-parent households, those with 1 or 2 children have the highest poverty rate, with 98 household (100.0%) living below poverty.
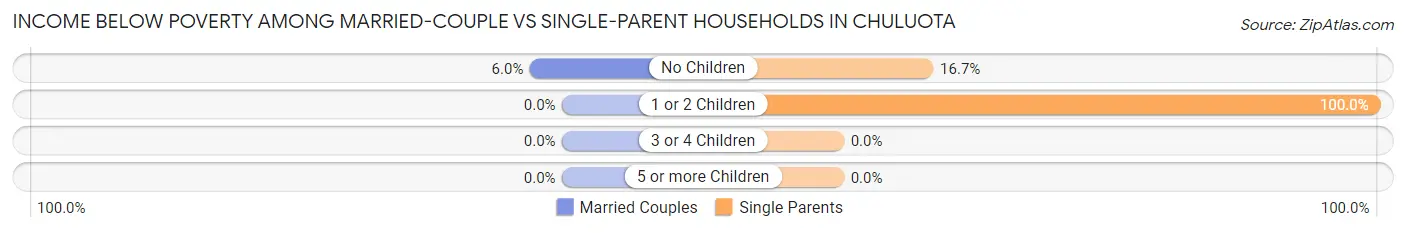
| Children | Married-Couple Families | Single-Parent Households |
| No Children | 12 (6.0%) | 9 (16.7%) |
| 1 or 2 Children | 0 (0.0%) | 98 (100.0%) |
| 3 or 4 Children | 0 (0.0%) | 0 (0.0%) |
| 5 or more Children | 0 (0.0%) | 0 (0.0%) |
| Total | 12 (2.4%) | 107 (70.4%) |
Race in Chuluota
The most populous races in Chuluota are White / Caucasian (1,848 | 74.4%), Hispanic or Latino (581 | 23.4%), and Some other Race (362 | 14.6%).
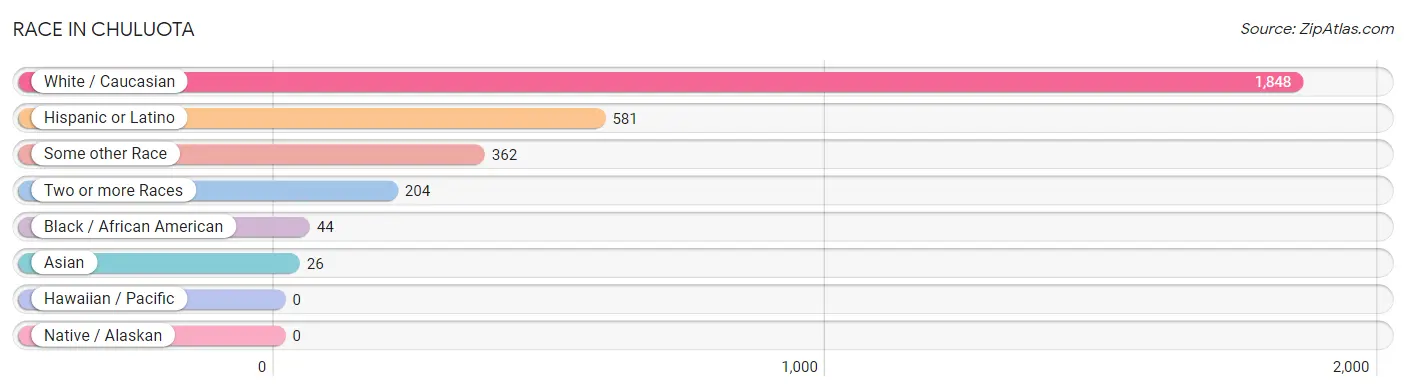
| Race | # Population | % Population |
| Asian | 26 | 1.1% |
| Black / African American | 44 | 1.8% |
| Hawaiian / Pacific | 0 | 0.0% |
| Hispanic or Latino | 581 | 23.4% |
| Native / Alaskan | 0 | 0.0% |
| White / Caucasian | 1,848 | 74.4% |
| Two or more Races | 204 | 8.2% |
| Some other Race | 362 | 14.6% |
| Total | 2,484 | 100.0% |
Ancestry in Chuluota
The most populous ancestries reported in Chuluota are German (282 | 11.4%), Eastern European (224 | 9.0%), Norwegian (177 | 7.1%), Irish (170 | 6.8%), and Dominican (163 | 6.6%), together accounting for 40.9% of all Chuluota residents.
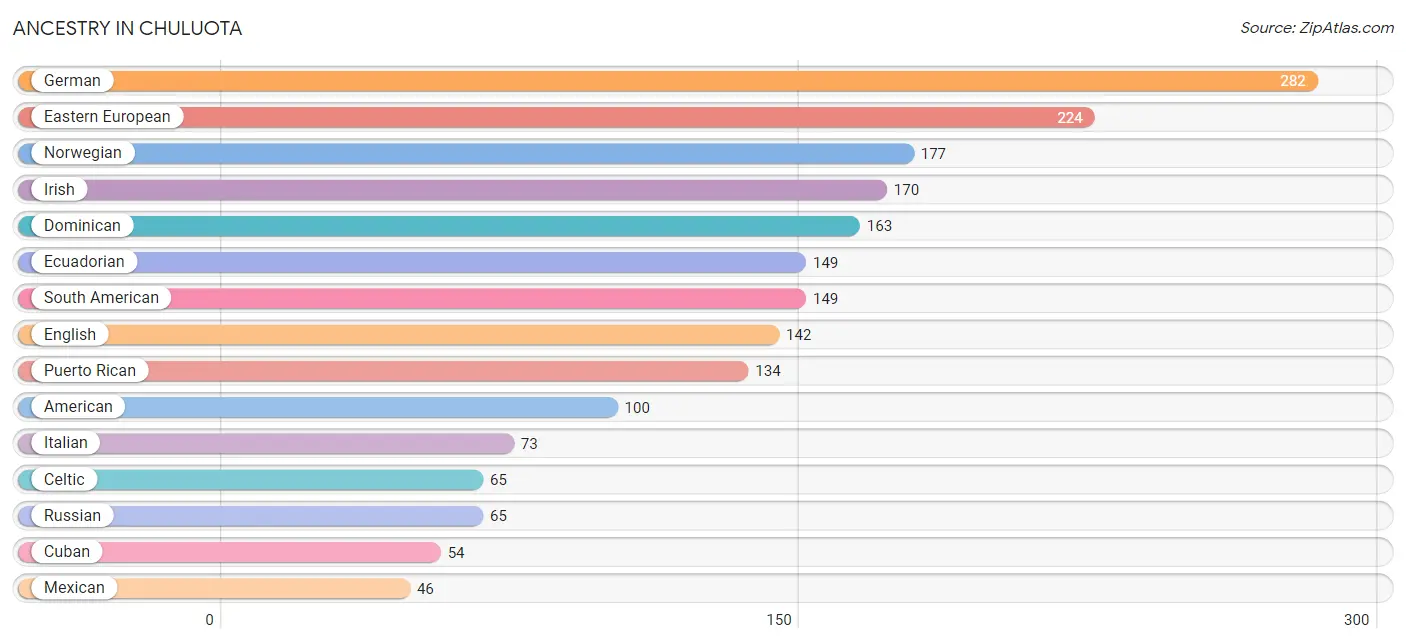
| Ancestry | # Population | % Population |
| American | 100 | 4.0% |
| Celtic | 65 | 2.6% |
| Central American | 11 | 0.4% |
| Cherokee | 9 | 0.4% |
| Cuban | 54 | 2.2% |
| Dominican | 163 | 6.6% |
| Dutch | 45 | 1.8% |
| Eastern European | 224 | 9.0% |
| Ecuadorian | 149 | 6.0% |
| English | 142 | 5.7% |
| European | 10 | 0.4% |
| French | 8 | 0.3% |
| French Canadian | 16 | 0.6% |
| German | 282 | 11.4% |
| Irish | 170 | 6.8% |
| Italian | 73 | 2.9% |
| Mexican | 46 | 1.8% |
| Nicaraguan | 11 | 0.4% |
| Norwegian | 177 | 7.1% |
| Polish | 37 | 1.5% |
| Puerto Rican | 134 | 5.4% |
| Russian | 65 | 2.6% |
| Scotch-Irish | 39 | 1.6% |
| Scottish | 19 | 0.8% |
| Seminole | 9 | 0.4% |
| Slovene | 13 | 0.5% |
| South American | 149 | 6.0% |
| Swedish | 38 | 1.5% |
| Thai | 26 | 1.1% |
| Welsh | 21 | 0.9% | View All 30 Rows |
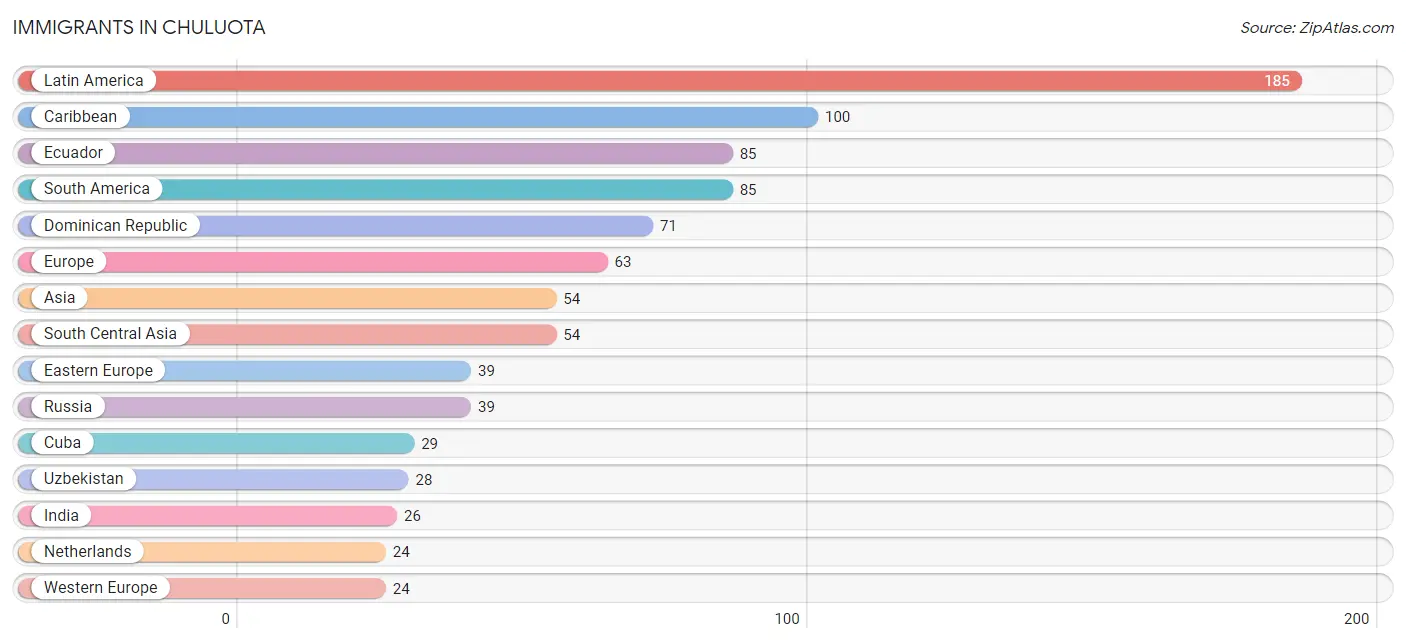
Immigrants in Chuluota
The most numerous immigrant groups reported in Chuluota came from Latin America (185 | 7.4%), Caribbean (100 | 4.0%), Ecuador (85 | 3.4%), South America (85 | 3.4%), and Dominican Republic (71 | 2.9%), together accounting for 21.2% of all Chuluota residents.
| Immigration Origin | # Population | % Population |
| Asia | 54 | 2.2% |
| Canada | 9 | 0.4% |
| Caribbean | 100 | 4.0% |
| Cuba | 29 | 1.2% |
| Dominican Republic | 71 | 2.9% |
| Eastern Europe | 39 | 1.6% |
| Ecuador | 85 | 3.4% |
| Europe | 63 | 2.5% |
| India | 26 | 1.1% |
| Latin America | 185 | 7.4% |
| Netherlands | 24 | 1.0% |
| Russia | 39 | 1.6% |
| South America | 85 | 3.4% |
| South Central Asia | 54 | 2.2% |
| Uzbekistan | 28 | 1.1% |
| Western Europe | 24 | 1.0% | View All 16 Rows |
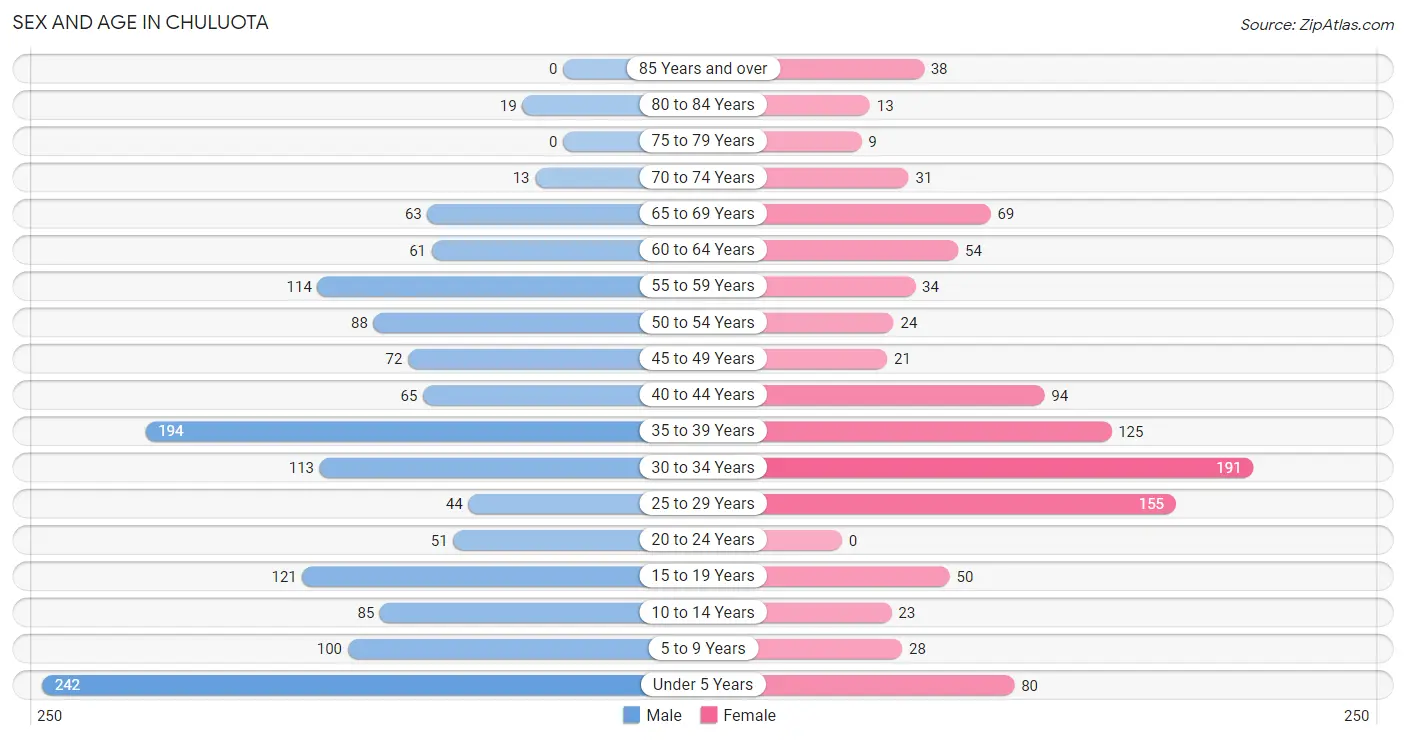
Sex and Age in Chuluota
Sex and Age in Chuluota
The most populous age groups in Chuluota are Under 5 Years (242 | 16.8%) for men and 30 to 34 Years (191 | 18.4%) for women.
| Age Bracket | Male | Female |
| Under 5 Years | 242 (16.8%) | 80 (7.7%) |
| 5 to 9 Years | 100 (6.9%) | 28 (2.7%) |
| 10 to 14 Years | 85 (5.9%) | 23 (2.2%) |
| 15 to 19 Years | 121 (8.4%) | 50 (4.8%) |
| 20 to 24 Years | 51 (3.5%) | 0 (0.0%) |
| 25 to 29 Years | 44 (3.0%) | 155 (14.9%) |
| 30 to 34 Years | 113 (7.8%) | 191 (18.4%) |
| 35 to 39 Years | 194 (13.4%) | 125 (12.0%) |
| 40 to 44 Years | 65 (4.5%) | 94 (9.0%) |
| 45 to 49 Years | 72 (5.0%) | 21 (2.0%) |
| 50 to 54 Years | 88 (6.1%) | 24 (2.3%) |
| 55 to 59 Years | 114 (7.9%) | 34 (3.3%) |
| 60 to 64 Years | 61 (4.2%) | 54 (5.2%) |
| 65 to 69 Years | 63 (4.4%) | 69 (6.6%) |
| 70 to 74 Years | 13 (0.9%) | 31 (3.0%) |
| 75 to 79 Years | 0 (0.0%) | 9 (0.9%) |
| 80 to 84 Years | 19 (1.3%) | 13 (1.3%) |
| 85 Years and over | 0 (0.0%) | 38 (3.7%) |
| Total | 1,445 (100.0%) | 1,039 (100.0%) |
Families and Households in Chuluota
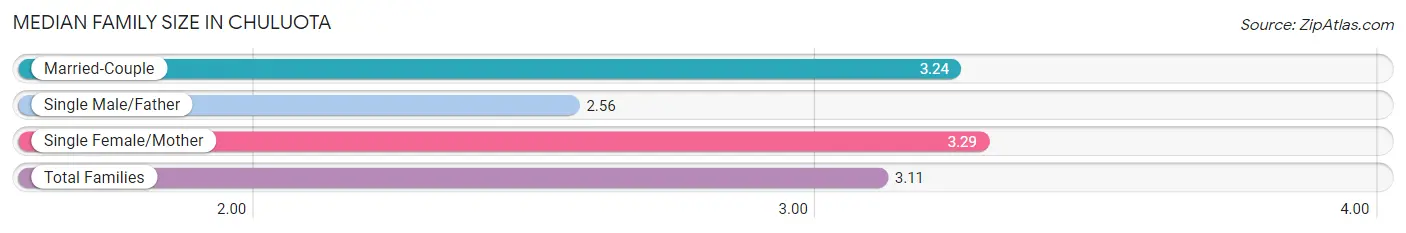
Median Family Size in Chuluota
The median family size in Chuluota is 3.11 persons per family, with single female/mother families (28 | 4.3%) accounting for the largest median family size of 3.29 persons per family. On the other hand, single male/father families (124 | 19.2%) represent the smallest median family size with 2.56 persons per family.
| Family Type | # Families | Family Size |
| Married-Couple | 494 (76.5%) | 3.24 |
| Single Male/Father | 124 (19.2%) | 2.56 |
| Single Female/Mother | 28 (4.3%) | 3.29 |
| Total Families | 646 (100.0%) | 3.11 |
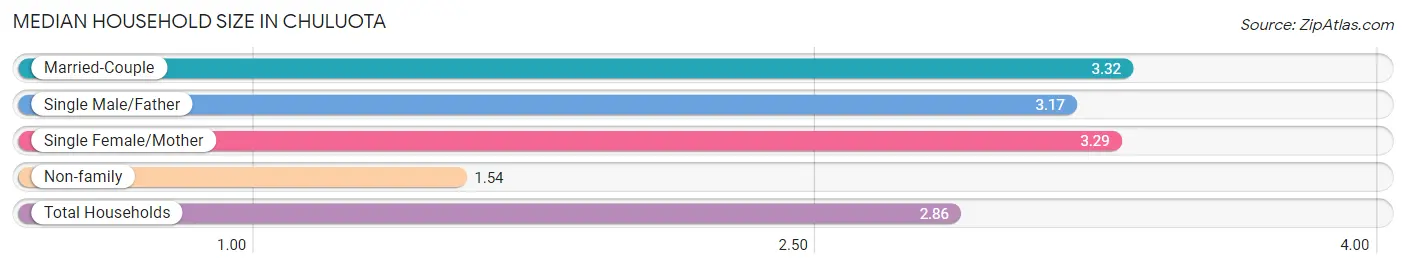
Median Household Size in Chuluota
The median household size in Chuluota is 2.86 persons per household, with married-couple households (494 | 57.9%) accounting for the largest median household size of 3.32 persons per household. non-family households (207 | 24.3%) represent the smallest median household size with 1.54 persons per household.
| Household Type | # Households | Household Size |
| Married-Couple | 494 (57.9%) | 3.32 |
| Single Male/Father | 124 (14.5%) | 3.17 |
| Single Female/Mother | 28 (3.3%) | 3.29 |
| Non-family | 207 (24.3%) | 1.54 |
| Total Households | 853 (100.0%) | 2.86 |
Household Size by Marriage Status in Chuluota
Out of a total of 853 households in Chuluota, 646 (75.7%) are family households, while 207 (24.3%) are nonfamily households. The most numerous type of family households are 4-person households, comprising 309, and the most common type of nonfamily households are 1-person households, comprising 138.
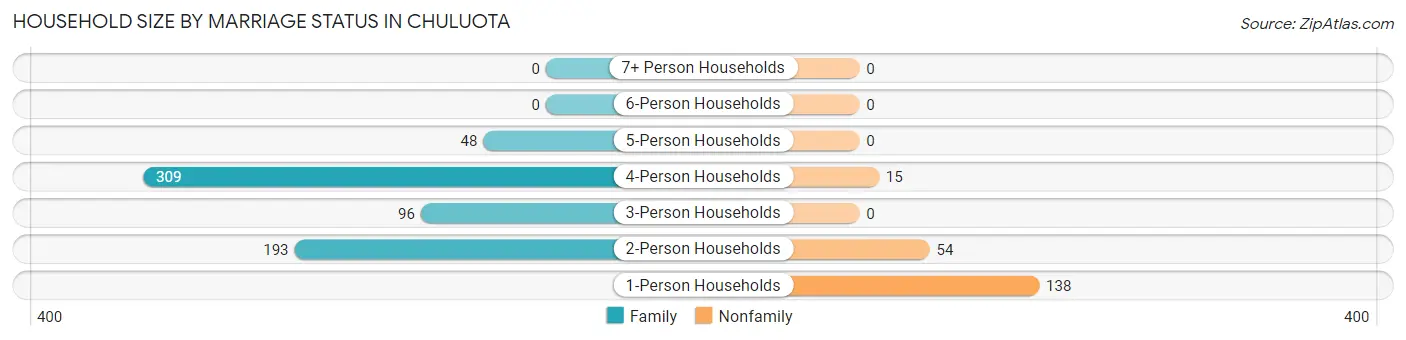
| Household Size | Family Households | Nonfamily Households |
| 1-Person Households | - | 138 (16.2%) |
| 2-Person Households | 193 (22.6%) | 54 (6.3%) |
| 3-Person Households | 96 (11.3%) | 0 (0.0%) |
| 4-Person Households | 309 (36.2%) | 15 (1.8%) |
| 5-Person Households | 48 (5.6%) | 0 (0.0%) |
| 6-Person Households | 0 (0.0%) | 0 (0.0%) |
| 7+ Person Households | 0 (0.0%) | 0 (0.0%) |
| Total | 646 (75.7%) | 207 (24.3%) |
Female Fertility in Chuluota
Fertility by Age in Chuluota
Average fertility rate in Chuluota is 220.0 births per 1,000 women. Women in the age bracket of 20 to 34 years have the highest fertility rate with 410.0 births per 1,000 women. Women in the age bracket of 20 to 34 years acount for 100.0% of all women with births.
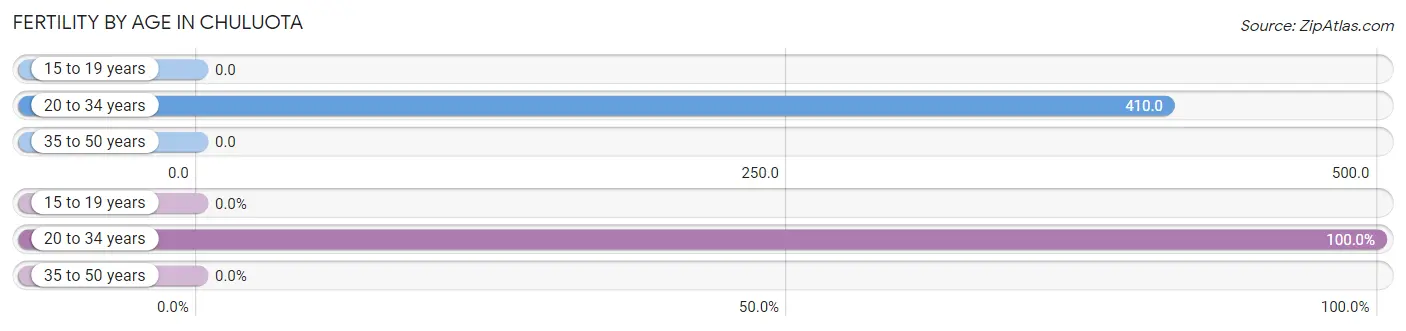
| Age Bracket | Women with Births | Births / 1,000 Women |
| 15 to 19 years | 0 (0.0%) | 0.0 |
| 20 to 34 years | 142 (100.0%) | 410.0 |
| 35 to 50 years | 0 (0.0%) | 0.0 |
| Total | 142 (100.0%) | 220.0 |
Fertility by Age by Marriage Status in Chuluota
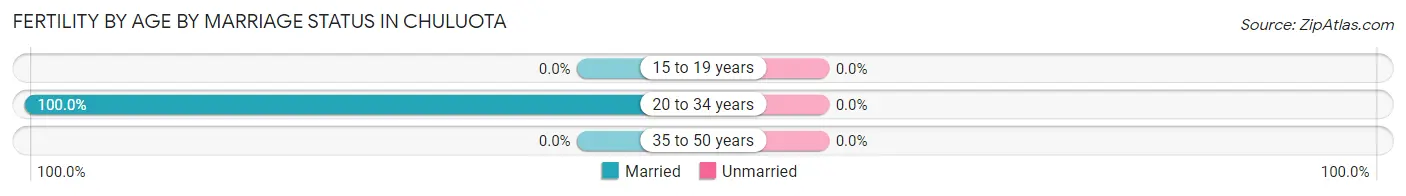
| Age Bracket | Married | Unmarried |
| 15 to 19 years | 0 (0.0%) | 0 (0.0%) |
| 20 to 34 years | 142 (100.0%) | 0 (0.0%) |
| 35 to 50 years | 0 (0.0%) | 0 (0.0%) |
| Total | 142 (100.0%) | 0 (0.0%) |
Fertility by Education in Chuluota
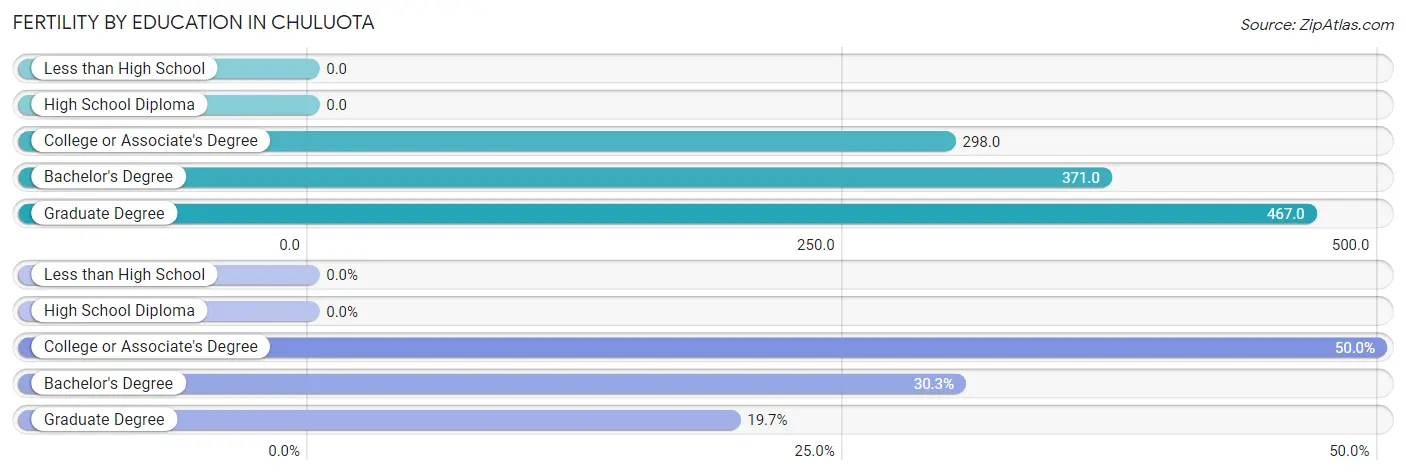
| Educational Attainment | Women with Births | Births / 1,000 Women |
| Less than High School | 0 (0.0%) | 0.0 |
| High School Diploma | 0 (0.0%) | 0.0 |
| College or Associate's Degree | 71 (50.0%) | 298.0 |
| Bachelor's Degree | 43 (30.3%) | 371.0 |
| Graduate Degree | 28 (19.7%) | 467.0 |
| Total | 142 (100.0%) | 220.0 |
Fertility by Education by Marriage Status in Chuluota
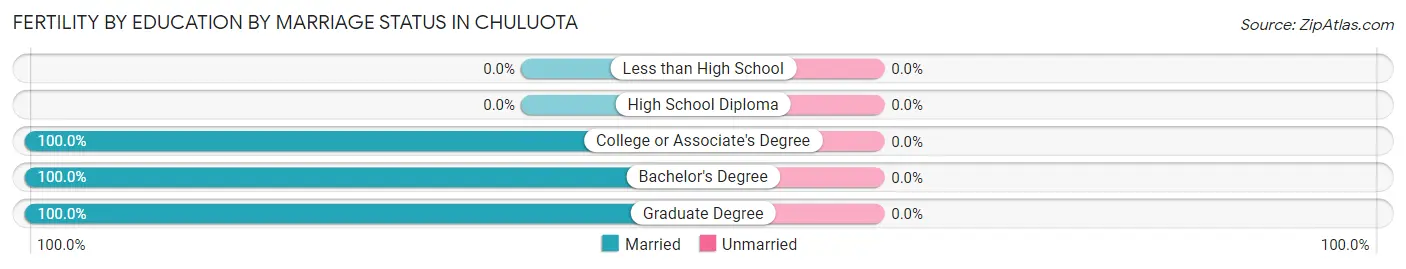
| Educational Attainment | Married | Unmarried |
| Less than High School | 0 (0.0%) | 0 (0.0%) |
| High School Diploma | 0 (0.0%) | 0 (0.0%) |
| College or Associate's Degree | 71 (100.0%) | 0 (0.0%) |
| Bachelor's Degree | 43 (100.0%) | 0 (0.0%) |
| Graduate Degree | 28 (100.0%) | 0 (0.0%) |
| Total | 142 (100.0%) | 0 (0.0%) |
Employment Characteristics in Chuluota
Employment by Class of Employer in Chuluota
Among the 1,052 employed individuals in Chuluota, private company employees (664 | 63.1%), self-employed (incorporated) (220 | 20.9%), and self-employed (not incorporated) (87 | 8.3%) make up the most common classes of employment.
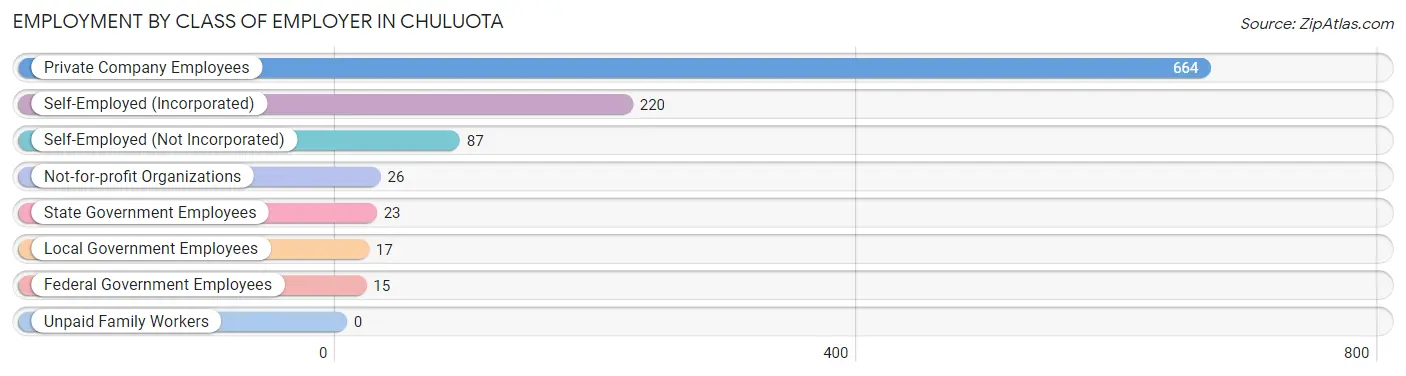
| Employer Class | # Employees | % Employees |
| Private Company Employees | 664 | 63.1% |
| Self-Employed (Incorporated) | 220 | 20.9% |
| Self-Employed (Not Incorporated) | 87 | 8.3% |
| Not-for-profit Organizations | 26 | 2.5% |
| Local Government Employees | 17 | 1.6% |
| State Government Employees | 23 | 2.2% |
| Federal Government Employees | 15 | 1.4% |
| Unpaid Family Workers | 0 | 0.0% |
| Total | 1,052 | 100.0% |
Employment Status by Age in Chuluota
According to the labor force statistics for Chuluota, out of the total population over 16 years of age (1,893), 62.2% or 1,177 individuals are in the labor force, with 5.9% or 69 of them unemployed. The age group with the highest labor force participation rate is 20 to 24 years, with 100.0% or 51 individuals in the labor force. Within the labor force, the 16 to 19 years age range has the highest percentage of unemployed individuals, with 76.7% or 69 of them being unemployed.
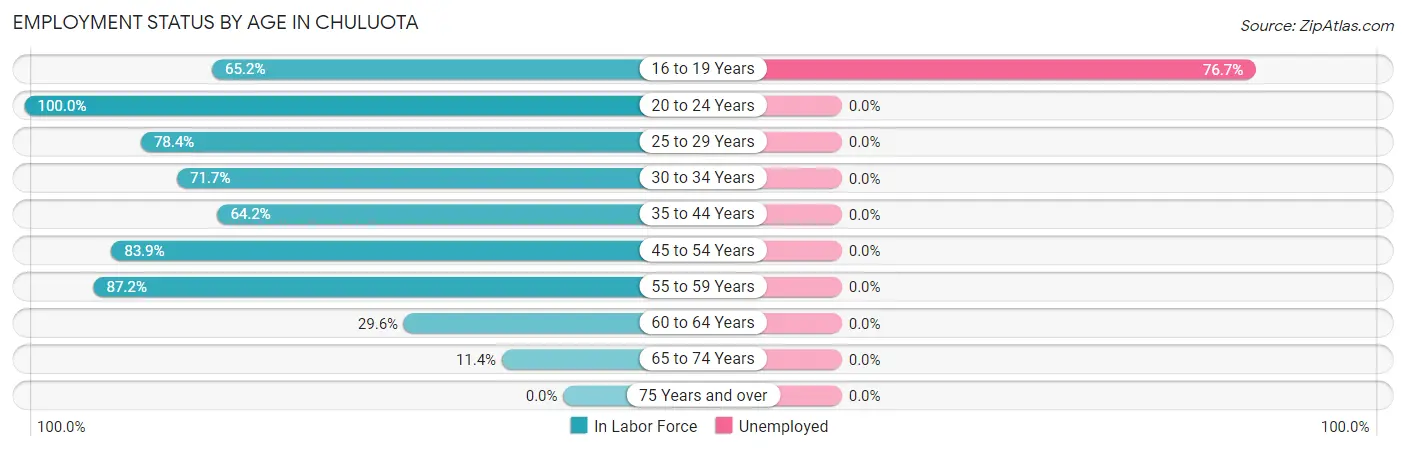
| Age Bracket | In Labor Force | Unemployed |
| 16 to 19 Years | 90 (65.2%) | 69 (76.7%) |
| 20 to 24 Years | 51 (100.0%) | 0 (0.0%) |
| 25 to 29 Years | 156 (78.4%) | 0 (0.0%) |
| 30 to 34 Years | 218 (71.7%) | 0 (0.0%) |
| 35 to 44 Years | 307 (64.2%) | 0 (0.0%) |
| 45 to 54 Years | 172 (83.9%) | 0 (0.0%) |
| 55 to 59 Years | 129 (87.2%) | 0 (0.0%) |
| 60 to 64 Years | 34 (29.6%) | 0 (0.0%) |
| 65 to 74 Years | 20 (11.4%) | 0 (0.0%) |
| 75 Years and over | 0 (0.0%) | 0 (0.0%) |
| Total | 1,177 (62.2%) | 69 (5.9%) |
Employment Status by Educational Attainment in Chuluota
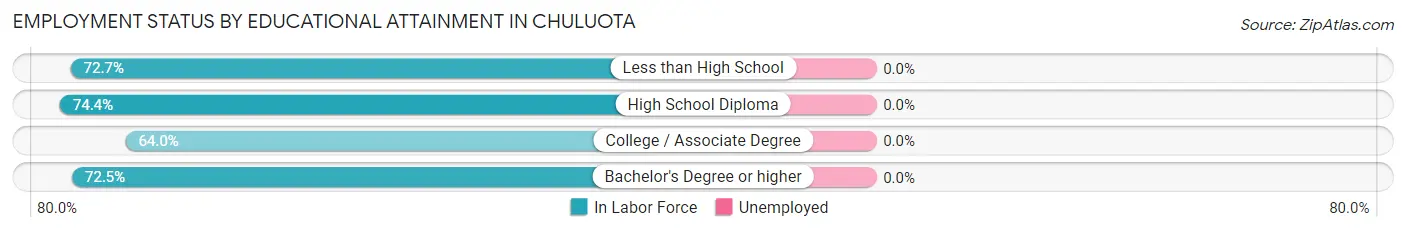
| Educational Attainment | In Labor Force | Unemployed |
| Less than High School | 72 (72.7%) | 0 (0.0%) |
| High School Diploma | 401 (74.4%) | 0 (0.0%) |
| College / Associate Degree | 340 (64.0%) | 0 (0.0%) |
| Bachelor's Degree or higher | 203 (72.5%) | 0 (0.0%) |
| Total | 1,016 (70.1%) | 0 (0.0%) |
Employment Occupations by Sex in Chuluota
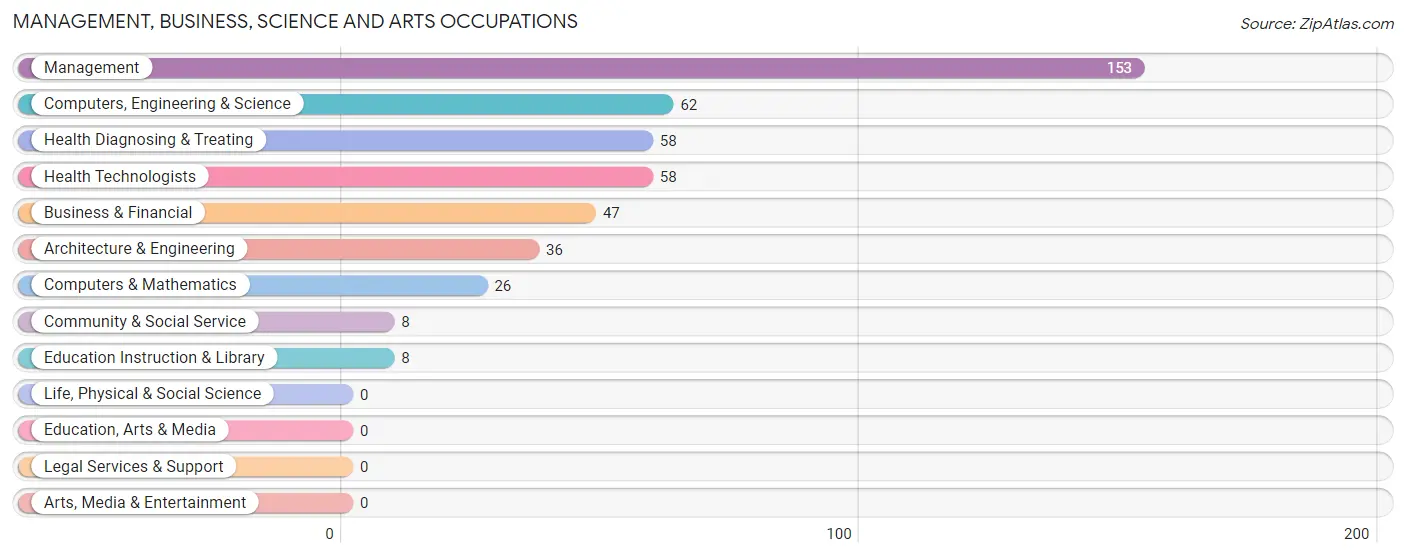
Management, Business, Science and Arts Occupations
The most common Management, Business, Science and Arts occupations in Chuluota are Management (153 | 13.8%), Computers, Engineering & Science (62 | 5.6%), Health Diagnosing & Treating (58 | 5.2%), Health Technologists (58 | 5.2%), and Business & Financial (47 | 4.2%).
Management, Business, Science and Arts Occupations by Sex
Within the Management, Business, Science and Arts occupations in Chuluota, the most male-oriented occupations are Architecture & Engineering (100.0%), Community & Social Service (100.0%), and Education Instruction & Library (100.0%), while the most female-oriented occupations are Health Diagnosing & Treating (100.0%), Health Technologists (100.0%), and Computers & Mathematics (53.8%).
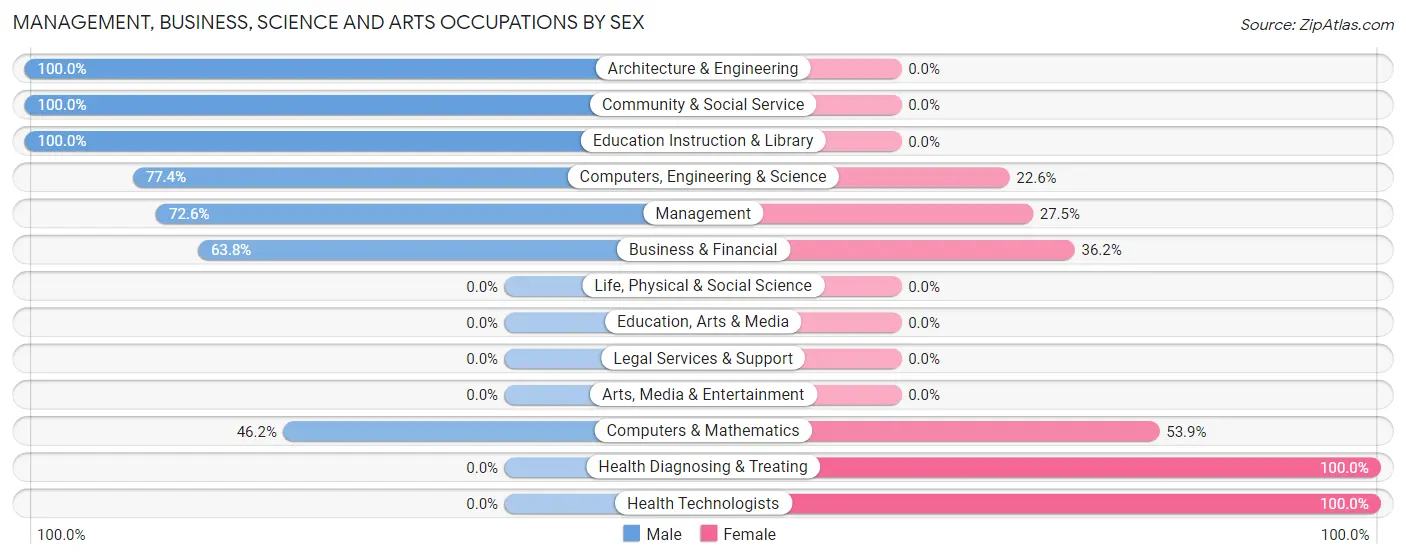
| Occupation | Male | Female |
| Management | 111 (72.6%) | 42 (27.5%) |
| Business & Financial | 30 (63.8%) | 17 (36.2%) |
| Computers, Engineering & Science | 48 (77.4%) | 14 (22.6%) |
| Computers & Mathematics | 12 (46.2%) | 14 (53.8%) |
| Architecture & Engineering | 36 (100.0%) | 0 (0.0%) |
| Life, Physical & Social Science | 0 (0.0%) | 0 (0.0%) |
| Community & Social Service | 8 (100.0%) | 0 (0.0%) |
| Education, Arts & Media | 0 (0.0%) | 0 (0.0%) |
| Legal Services & Support | 0 (0.0%) | 0 (0.0%) |
| Education Instruction & Library | 8 (100.0%) | 0 (0.0%) |
| Arts, Media & Entertainment | 0 (0.0%) | 0 (0.0%) |
| Health Diagnosing & Treating | 0 (0.0%) | 58 (100.0%) |
| Health Technologists | 0 (0.0%) | 58 (100.0%) |
| Total (Category) | 197 (60.1%) | 131 (39.9%) |
| Total (Overall) | 690 (62.3%) | 418 (37.7%) |
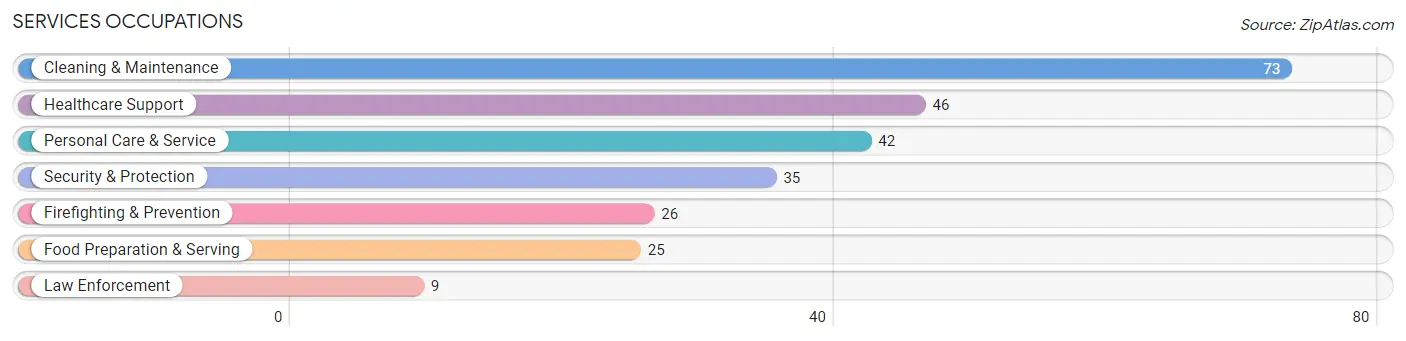
Services Occupations
The most common Services occupations in Chuluota are Cleaning & Maintenance (73 | 6.6%), Healthcare Support (46 | 4.2%), Personal Care & Service (42 | 3.8%), Security & Protection (35 | 3.2%), and Firefighting & Prevention (26 | 2.4%).
Services Occupations by Sex
Within the Services occupations in Chuluota, the most male-oriented occupations are Security & Protection (100.0%), Firefighting & Prevention (100.0%), and Law Enforcement (100.0%), while the most female-oriented occupations are Healthcare Support (100.0%), Personal Care & Service (100.0%), and Food Preparation & Serving (44.0%).
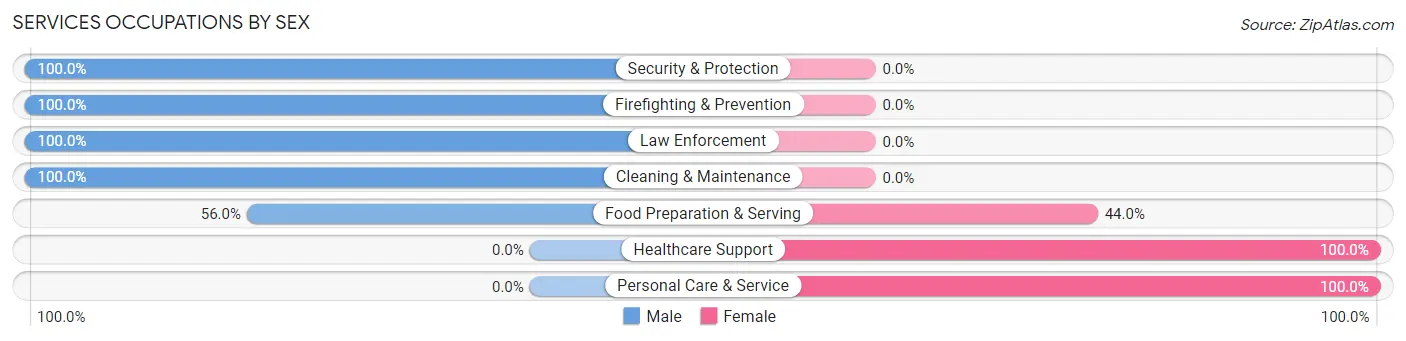
| Occupation | Male | Female |
| Healthcare Support | 0 (0.0%) | 46 (100.0%) |
| Security & Protection | 35 (100.0%) | 0 (0.0%) |
| Firefighting & Prevention | 26 (100.0%) | 0 (0.0%) |
| Law Enforcement | 9 (100.0%) | 0 (0.0%) |
| Food Preparation & Serving | 14 (56.0%) | 11 (44.0%) |
| Cleaning & Maintenance | 73 (100.0%) | 0 (0.0%) |
| Personal Care & Service | 0 (0.0%) | 42 (100.0%) |
| Total (Category) | 122 (55.2%) | 99 (44.8%) |
| Total (Overall) | 690 (62.3%) | 418 (37.7%) |
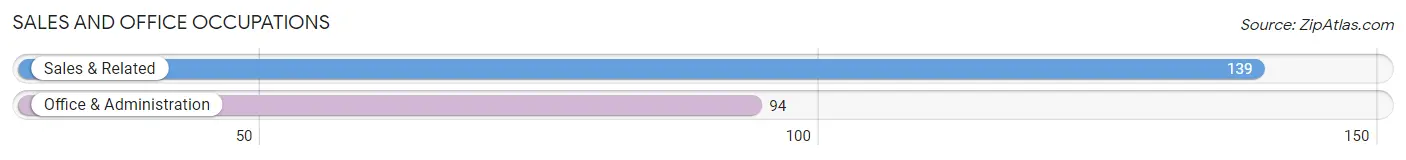
Sales and Office Occupations
The most common Sales and Office occupations in Chuluota are Sales & Related (139 | 12.6%), and Office & Administration (94 | 8.5%).
Sales and Office Occupations by Sex
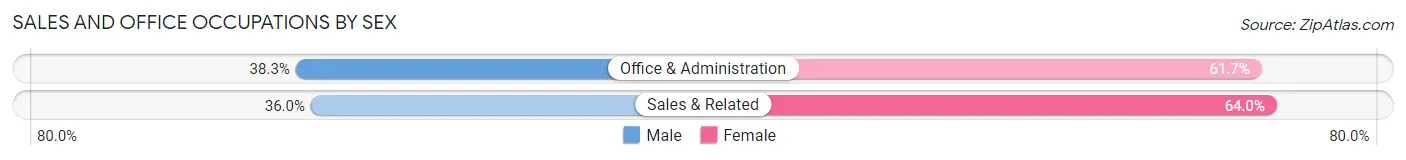
| Occupation | Male | Female |
| Sales & Related | 50 (36.0%) | 89 (64.0%) |
| Office & Administration | 36 (38.3%) | 58 (61.7%) |
| Total (Category) | 86 (36.9%) | 147 (63.1%) |
| Total (Overall) | 690 (62.3%) | 418 (37.7%) |
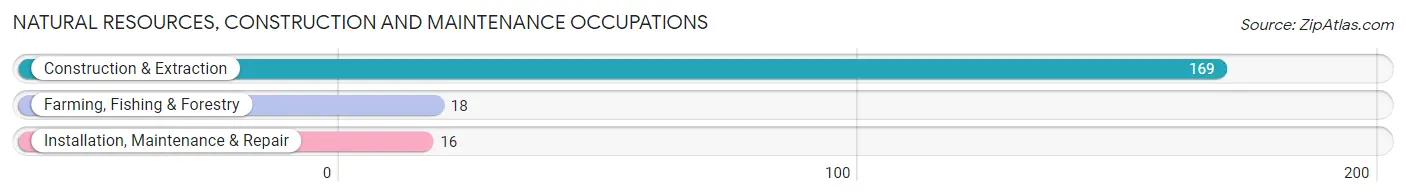
Natural Resources, Construction and Maintenance Occupations
The most common Natural Resources, Construction and Maintenance occupations in Chuluota are Construction & Extraction (169 | 15.2%), Farming, Fishing & Forestry (18 | 1.6%), and Installation, Maintenance & Repair (16 | 1.4%).
Natural Resources, Construction and Maintenance Occupations by Sex
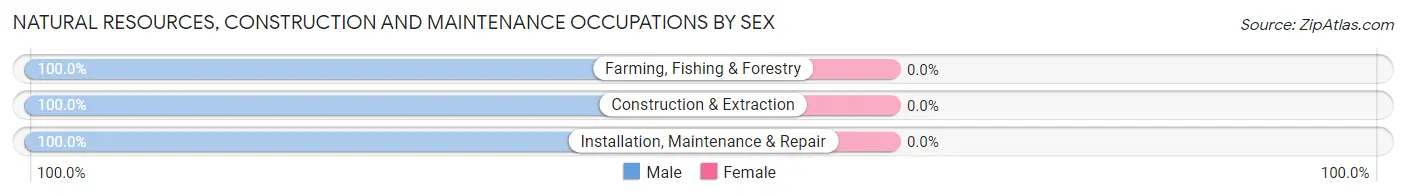
| Occupation | Male | Female |
| Farming, Fishing & Forestry | 18 (100.0%) | 0 (0.0%) |
| Construction & Extraction | 169 (100.0%) | 0 (0.0%) |
| Installation, Maintenance & Repair | 16 (100.0%) | 0 (0.0%) |
| Total (Category) | 203 (100.0%) | 0 (0.0%) |
| Total (Overall) | 690 (62.3%) | 418 (37.7%) |
Production, Transportation and Moving Occupations
The most common Production, Transportation and Moving occupations in Chuluota are Material Moving (77 | 7.0%), Production (31 | 2.8%), and Transportation (15 | 1.3%).
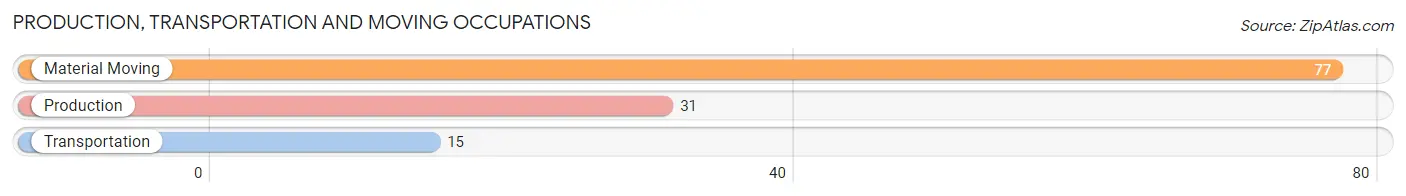
Production, Transportation and Moving Occupations by Sex
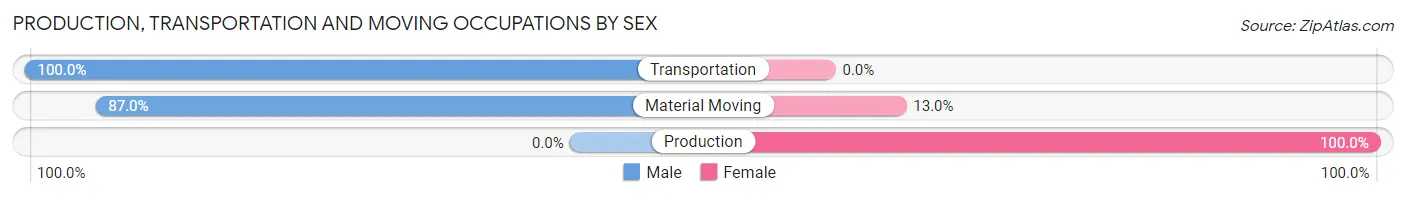
| Occupation | Male | Female |
| Production | 0 (0.0%) | 31 (100.0%) |
| Transportation | 15 (100.0%) | 0 (0.0%) |
| Material Moving | 67 (87.0%) | 10 (13.0%) |
| Total (Category) | 82 (66.7%) | 41 (33.3%) |
| Total (Overall) | 690 (62.3%) | 418 (37.7%) |
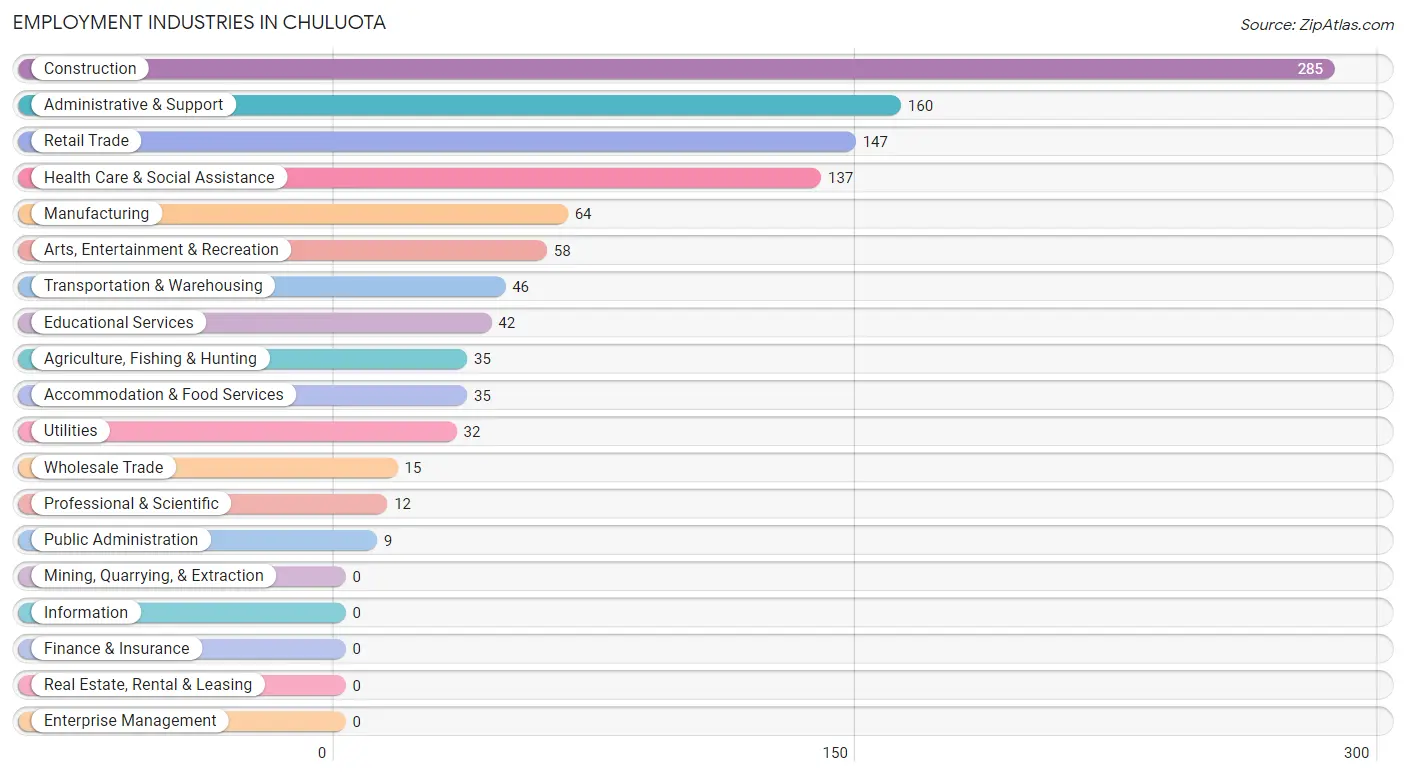
Employment Industries by Sex in Chuluota
Employment Industries in Chuluota
The major employment industries in Chuluota include Construction (285 | 25.7%), Administrative & Support (160 | 14.4%), Retail Trade (147 | 13.3%), Health Care & Social Assistance (137 | 12.4%), and Manufacturing (64 | 5.8%).
Employment Industries by Sex in Chuluota
The Chuluota industries that see more men than women are Wholesale Trade (100.0%), Utilities (100.0%), and Professional & Scientific (100.0%), whereas the industries that tend to have a higher number of women are Health Care & Social Assistance (100.0%), Educational Services (80.9%), and Transportation & Warehousing (67.4%).
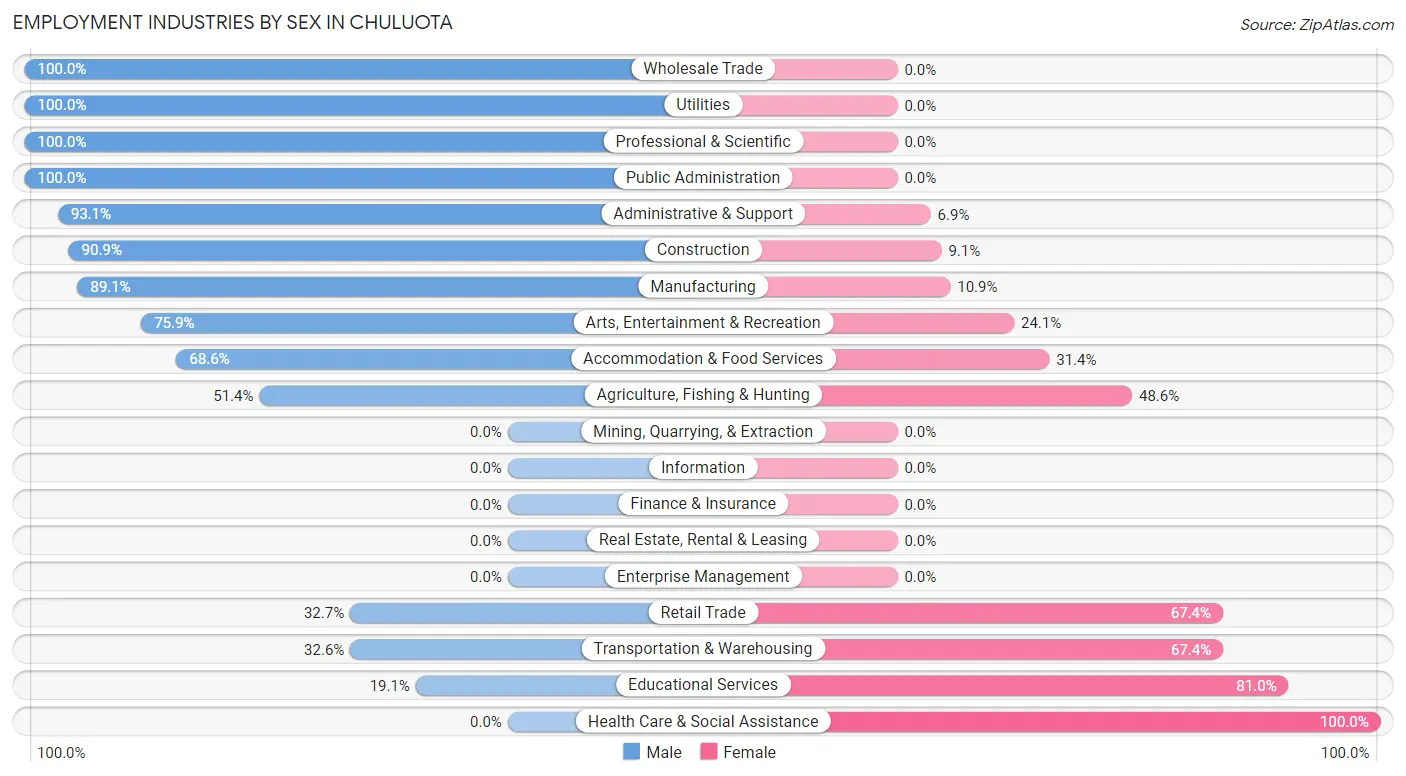
| Industry | Male | Female |
| Agriculture, Fishing & Hunting | 18 (51.4%) | 17 (48.6%) |
| Mining, Quarrying, & Extraction | 0 (0.0%) | 0 (0.0%) |
| Construction | 259 (90.9%) | 26 (9.1%) |
| Manufacturing | 57 (89.1%) | 7 (10.9%) |
| Wholesale Trade | 15 (100.0%) | 0 (0.0%) |
| Retail Trade | 48 (32.7%) | 99 (67.3%) |
| Transportation & Warehousing | 15 (32.6%) | 31 (67.4%) |
| Utilities | 32 (100.0%) | 0 (0.0%) |
| Information | 0 (0.0%) | 0 (0.0%) |
| Finance & Insurance | 0 (0.0%) | 0 (0.0%) |
| Real Estate, Rental & Leasing | 0 (0.0%) | 0 (0.0%) |
| Professional & Scientific | 12 (100.0%) | 0 (0.0%) |
| Enterprise Management | 0 (0.0%) | 0 (0.0%) |
| Administrative & Support | 149 (93.1%) | 11 (6.9%) |
| Educational Services | 8 (19.1%) | 34 (80.9%) |
| Health Care & Social Assistance | 0 (0.0%) | 137 (100.0%) |
| Arts, Entertainment & Recreation | 44 (75.9%) | 14 (24.1%) |
| Accommodation & Food Services | 24 (68.6%) | 11 (31.4%) |
| Public Administration | 9 (100.0%) | 0 (0.0%) |
| Total | 690 (62.3%) | 418 (37.7%) |
Education in Chuluota
School Enrollment in Chuluota
The most common levels of schooling among the 539 students in Chuluota are college / undergraduate (222 | 41.2%), elementary school (142 | 26.4%), and high school (84 | 15.6%).
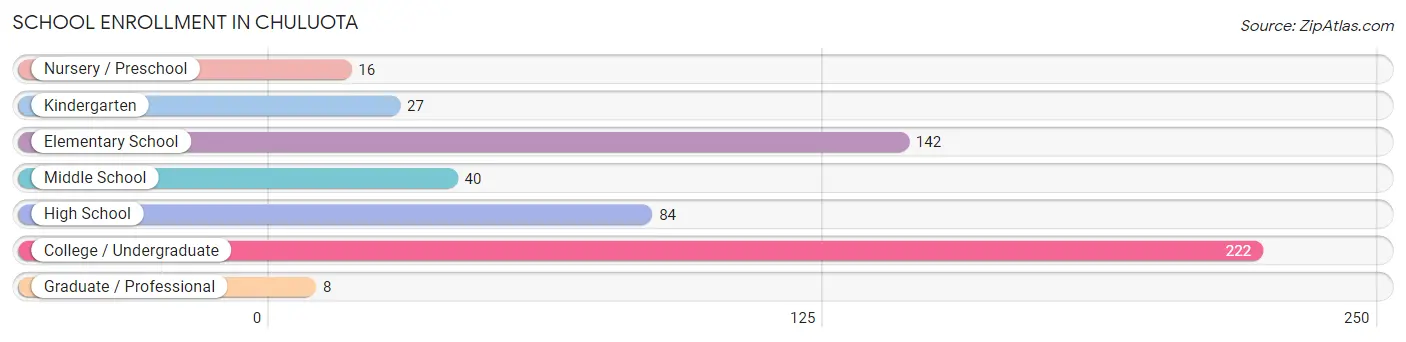
| School Level | # Students | % Students |
| Nursery / Preschool | 16 | 3.0% |
| Kindergarten | 27 | 5.0% |
| Elementary School | 142 | 26.4% |
| Middle School | 40 | 7.4% |
| High School | 84 | 15.6% |
| College / Undergraduate | 222 | 41.2% |
| Graduate / Professional | 8 | 1.5% |
| Total | 539 | 100.0% |
School Enrollment by Age by Funding Source in Chuluota
Out of a total of 539 students who are enrolled in schools in Chuluota, 90 (16.7%) attend a private institution, while the remaining 449 (83.3%) are enrolled in public schools. The age group of 3 to 4 year olds has the highest likelihood of being enrolled in private schools, with 16 (100.0% in the age bracket) enrolled. Conversely, the age group of 20 to 24 year olds has the lowest likelihood of being enrolled in a private school, with 24 (100.0% in the age bracket) attending a public institution.
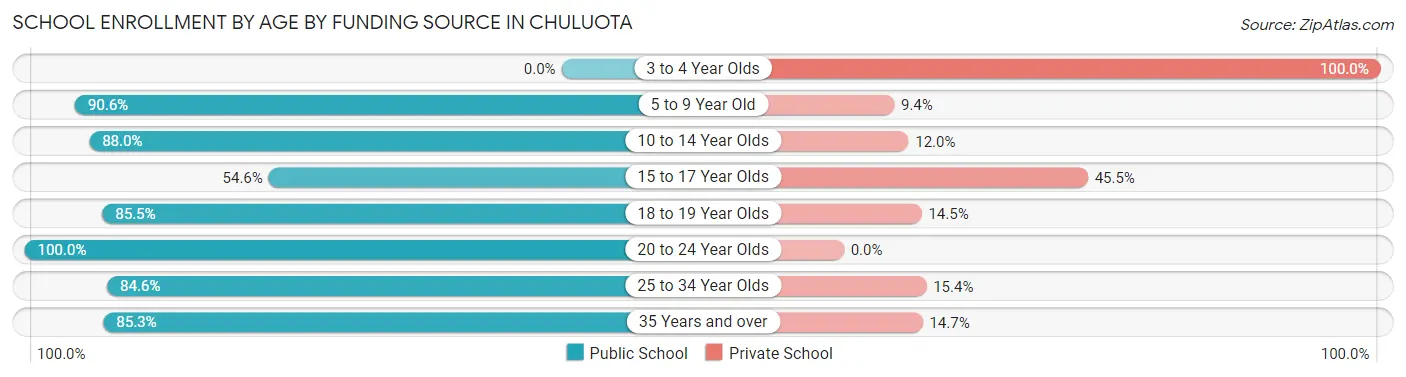
| Age Bracket | Public School | Private School |
| 3 to 4 Year Olds | 0 (0.0%) | 16 (100.0%) |
| 5 to 9 Year Old | 116 (90.6%) | 12 (9.4%) |
| 10 to 14 Year Olds | 95 (88.0%) | 13 (12.0%) |
| 15 to 17 Year Olds | 18 (54.5%) | 15 (45.5%) |
| 18 to 19 Year Olds | 59 (85.5%) | 10 (14.5%) |
| 20 to 24 Year Olds | 24 (100.0%) | 0 (0.0%) |
| 25 to 34 Year Olds | 44 (84.6%) | 8 (15.4%) |
| 35 Years and over | 93 (85.3%) | 16 (14.7%) |
| Total | 449 (83.3%) | 90 (16.7%) |
Educational Attainment by Field of Study in Chuluota
Business (72 | 23.5%), arts & humanities (53 | 17.3%), computers & mathematics (49 | 16.0%), science & technology (49 | 16.0%), and engineering (36 | 11.8%) are the most common fields of study among 306 individuals in Chuluota who have obtained a bachelor's degree or higher.
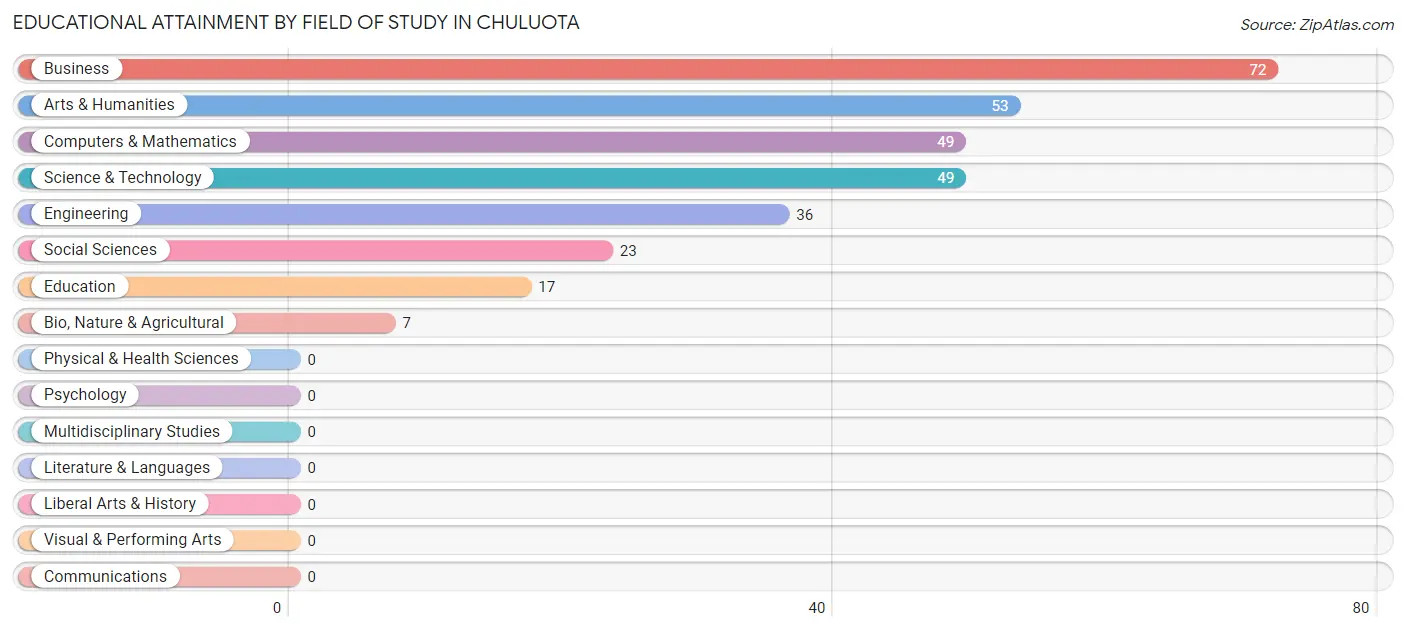
| Field of Study | # Graduates | % Graduates |
| Computers & Mathematics | 49 | 16.0% |
| Bio, Nature & Agricultural | 7 | 2.3% |
| Physical & Health Sciences | 0 | 0.0% |
| Psychology | 0 | 0.0% |
| Social Sciences | 23 | 7.5% |
| Engineering | 36 | 11.8% |
| Multidisciplinary Studies | 0 | 0.0% |
| Science & Technology | 49 | 16.0% |
| Business | 72 | 23.5% |
| Education | 17 | 5.6% |
| Literature & Languages | 0 | 0.0% |
| Liberal Arts & History | 0 | 0.0% |
| Visual & Performing Arts | 0 | 0.0% |
| Communications | 0 | 0.0% |
| Arts & Humanities | 53 | 17.3% |
| Total | 306 | 100.0% |
Transportation & Commute in Chuluota
Vehicle Availability by Sex in Chuluota
The most prevalent vehicle ownership categories in Chuluota are males with 3 vehicles (298, accounting for 46.4%) and females with 3 vehicles (143, making up 76.4%).
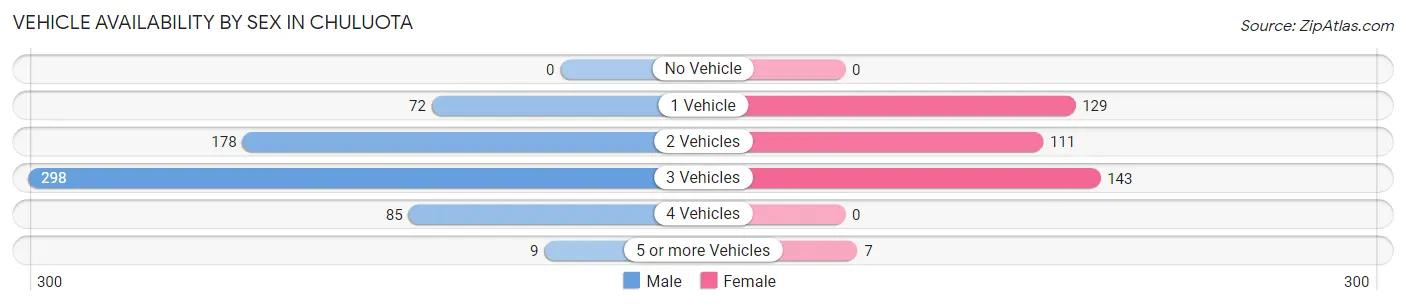
| Vehicles Available | Male | Female |
| No Vehicle | 0 (0.0%) | 0 (0.0%) |
| 1 Vehicle | 72 (11.2%) | 129 (33.1%) |
| 2 Vehicles | 178 (27.7%) | 111 (28.5%) |
| 3 Vehicles | 298 (46.4%) | 143 (36.7%) |
| 4 Vehicles | 85 (13.2%) | 0 (0.0%) |
| 5 or more Vehicles | 9 (1.4%) | 7 (1.8%) |
| Total | 642 (100.0%) | 390 (100.0%) |
Commute Time in Chuluota
The most frequently occuring commute durations in Chuluota are 30 to 34 minutes (193 commuters, 20.2%), 20 to 24 minutes (151 commuters, 15.8%), and 45 to 59 minutes (126 commuters, 13.2%).
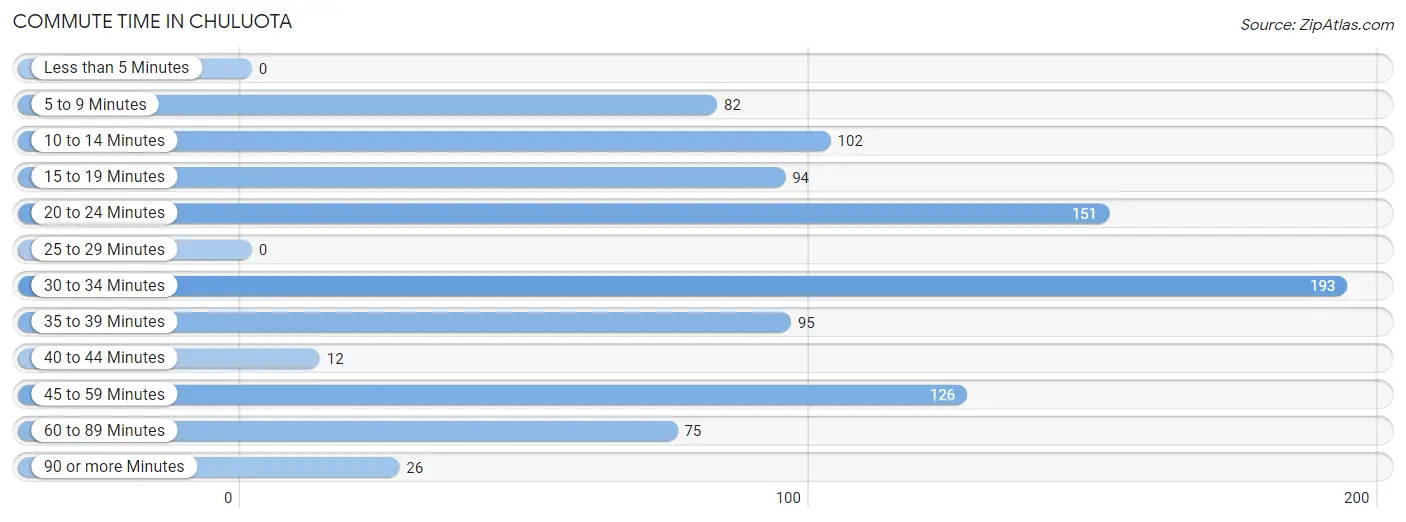
| Commute Time | # Commuters | % Commuters |
| Less than 5 Minutes | 0 | 0.0% |
| 5 to 9 Minutes | 82 | 8.6% |
| 10 to 14 Minutes | 102 | 10.7% |
| 15 to 19 Minutes | 94 | 9.8% |
| 20 to 24 Minutes | 151 | 15.8% |
| 25 to 29 Minutes | 0 | 0.0% |
| 30 to 34 Minutes | 193 | 20.2% |
| 35 to 39 Minutes | 95 | 9.9% |
| 40 to 44 Minutes | 12 | 1.3% |
| 45 to 59 Minutes | 126 | 13.2% |
| 60 to 89 Minutes | 75 | 7.9% |
| 90 or more Minutes | 26 | 2.7% |
Commute Time by Sex in Chuluota
The most common commute times in Chuluota are 30 to 34 minutes (148 commuters, 24.6%) for males and 10 to 14 minutes (102 commuters, 28.8%) for females.
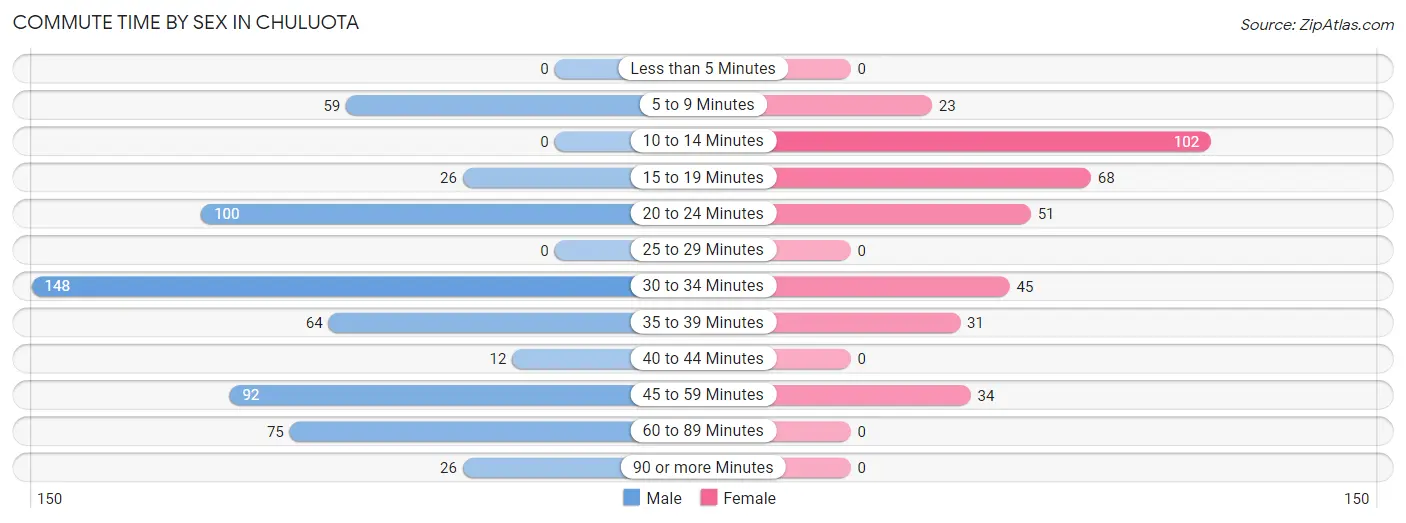
| Commute Time | Male | Female |
| Less than 5 Minutes | 0 (0.0%) | 0 (0.0%) |
| 5 to 9 Minutes | 59 (9.8%) | 23 (6.5%) |
| 10 to 14 Minutes | 0 (0.0%) | 102 (28.8%) |
| 15 to 19 Minutes | 26 (4.3%) | 68 (19.2%) |
| 20 to 24 Minutes | 100 (16.6%) | 51 (14.4%) |
| 25 to 29 Minutes | 0 (0.0%) | 0 (0.0%) |
| 30 to 34 Minutes | 148 (24.6%) | 45 (12.7%) |
| 35 to 39 Minutes | 64 (10.6%) | 31 (8.8%) |
| 40 to 44 Minutes | 12 (2.0%) | 0 (0.0%) |
| 45 to 59 Minutes | 92 (15.3%) | 34 (9.6%) |
| 60 to 89 Minutes | 75 (12.5%) | 0 (0.0%) |
| 90 or more Minutes | 26 (4.3%) | 0 (0.0%) |
Time of Departure to Work by Sex in Chuluota
The most frequent times of departure to work in Chuluota are 7:30 AM to 7:59 AM (174, 28.9%) for males and 7:30 AM to 7:59 AM (75, 21.2%) for females.
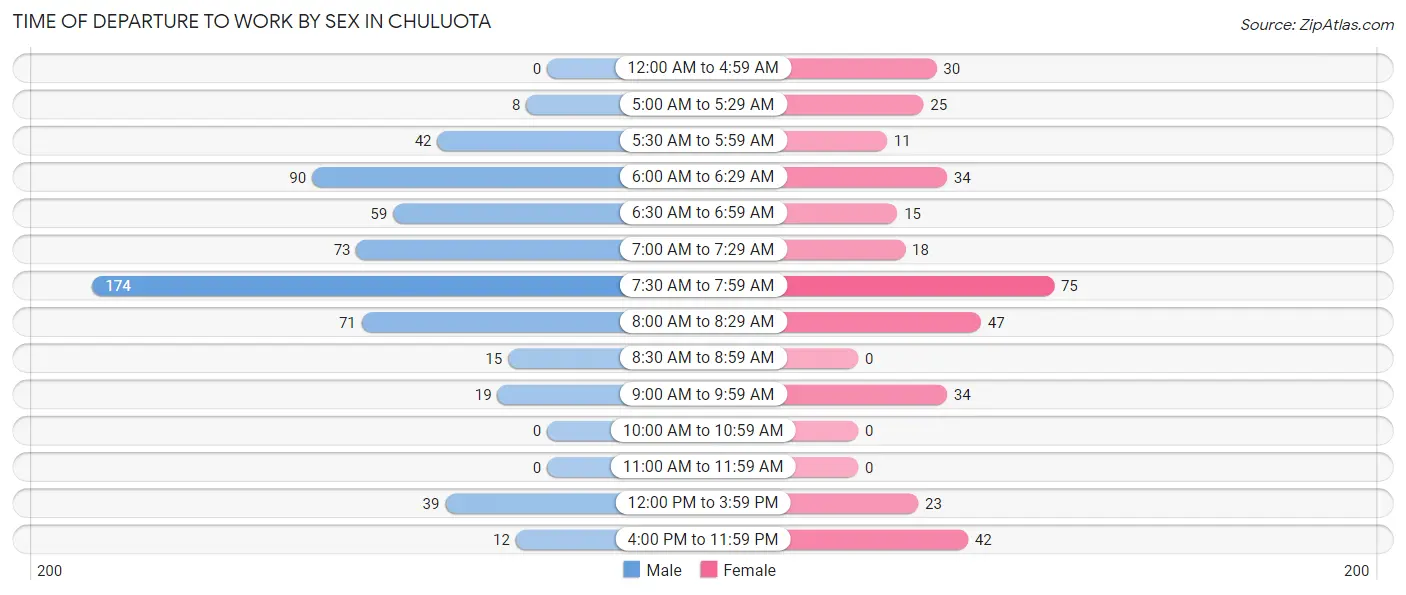
| Time of Departure | Male | Female |
| 12:00 AM to 4:59 AM | 0 (0.0%) | 30 (8.5%) |
| 5:00 AM to 5:29 AM | 8 (1.3%) | 25 (7.1%) |
| 5:30 AM to 5:59 AM | 42 (7.0%) | 11 (3.1%) |
| 6:00 AM to 6:29 AM | 90 (14.9%) | 34 (9.6%) |
| 6:30 AM to 6:59 AM | 59 (9.8%) | 15 (4.2%) |
| 7:00 AM to 7:29 AM | 73 (12.1%) | 18 (5.1%) |
| 7:30 AM to 7:59 AM | 174 (28.9%) | 75 (21.2%) |
| 8:00 AM to 8:29 AM | 71 (11.8%) | 47 (13.3%) |
| 8:30 AM to 8:59 AM | 15 (2.5%) | 0 (0.0%) |
| 9:00 AM to 9:59 AM | 19 (3.2%) | 34 (9.6%) |
| 10:00 AM to 10:59 AM | 0 (0.0%) | 0 (0.0%) |
| 11:00 AM to 11:59 AM | 0 (0.0%) | 0 (0.0%) |
| 12:00 PM to 3:59 PM | 39 (6.5%) | 23 (6.5%) |
| 4:00 PM to 11:59 PM | 12 (2.0%) | 42 (11.9%) |
| Total | 602 (100.0%) | 354 (100.0%) |
Housing Occupancy in Chuluota
Occupancy by Ownership in Chuluota
Of the total 853 dwellings in Chuluota, owner-occupied units account for 629 (73.7%), while renter-occupied units make up 224 (26.3%).
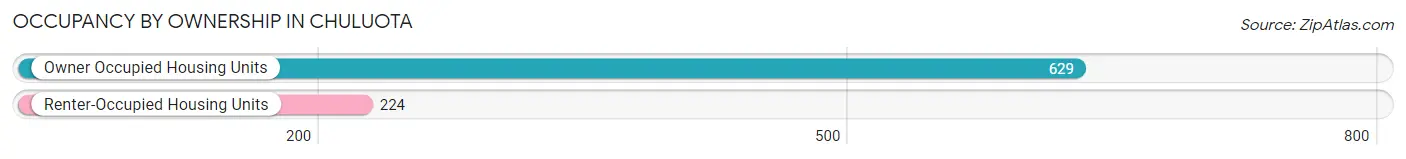
| Occupancy | # Housing Units | % Housing Units |
| Owner Occupied Housing Units | 629 | 73.7% |
| Renter-Occupied Housing Units | 224 | 26.3% |
| Total Occupied Housing Units | 853 | 100.0% |
Occupancy by Household Size in Chuluota
| Household Size | # Housing Units | % Housing Units |
| 1-Person Household | 138 | 16.2% |
| 2-Person Household | 247 | 29.0% |
| 3-Person Household | 96 | 11.3% |
| 4+ Person Household | 372 | 43.6% |
| Total Housing Units | 853 | 100.0% |
Occupancy by Ownership by Household Size in Chuluota
| Household Size | Owner-occupied | Renter-occupied |
| 1-Person Household | 103 (74.6%) | 35 (25.4%) |
| 2-Person Household | 179 (72.5%) | 68 (27.5%) |
| 3-Person Household | 56 (58.3%) | 40 (41.7%) |
| 4+ Person Household | 291 (78.2%) | 81 (21.8%) |
| Total Housing Units | 629 (73.7%) | 224 (26.3%) |
Occupancy by Educational Attainment in Chuluota
| Household Size | Owner-occupied | Renter-occupied |
| Less than High School | 15 (36.6%) | 26 (63.4%) |
| High School Diploma | 316 (90.5%) | 33 (9.5%) |
| College/Associate Degree | 108 (43.2%) | 142 (56.8%) |
| Bachelor's Degree or higher | 190 (89.2%) | 23 (10.8%) |
Occupancy by Age of Householder in Chuluota
| Age Bracket | # Households | % Households |
| Under 35 Years | 181 | 21.2% |
| 35 to 44 Years | 311 | 36.5% |
| 45 to 54 Years | 95 | 11.1% |
| 55 to 64 Years | 163 | 19.1% |
| 65 to 74 Years | 89 | 10.4% |
| 75 to 84 Years | 14 | 1.6% |
| 85 Years and Over | 0 | 0.0% |
| Total | 853 | 100.0% |
Housing Finances in Chuluota
Median Income by Occupancy in Chuluota
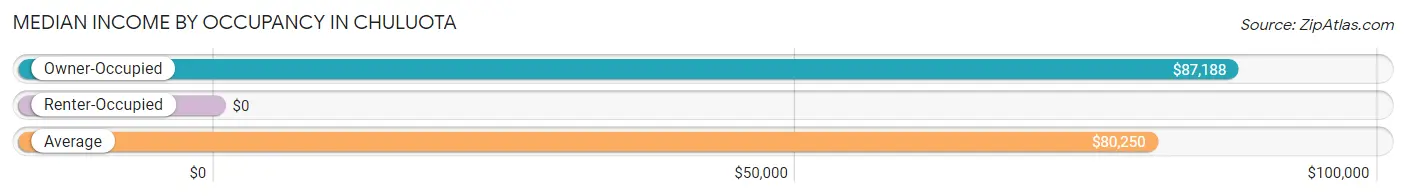
| Occupancy Type | # Households | Median Income |
| Owner-Occupied | 629 (73.7%) | $87,188 |
| Renter-Occupied | 224 (26.3%) | $0 |
| Average | 853 (100.0%) | $80,250 |
Occupancy by Householder Income Bracket in Chuluota
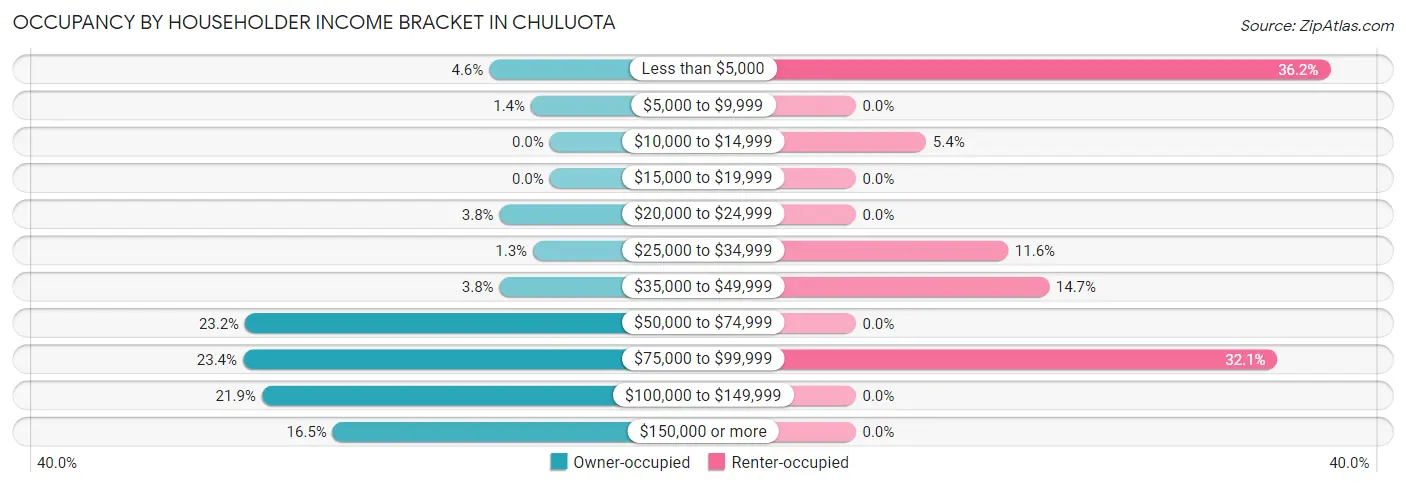
| Income Bracket | Owner-occupied | Renter-occupied |
| Less than $5,000 | 29 (4.6%) | 81 (36.2%) |
| $5,000 to $9,999 | 9 (1.4%) | 0 (0.0%) |
| $10,000 to $14,999 | 0 (0.0%) | 12 (5.4%) |
| $15,000 to $19,999 | 0 (0.0%) | 0 (0.0%) |
| $20,000 to $24,999 | 24 (3.8%) | 0 (0.0%) |
| $25,000 to $34,999 | 8 (1.3%) | 26 (11.6%) |
| $35,000 to $49,999 | 24 (3.8%) | 33 (14.7%) |
| $50,000 to $74,999 | 146 (23.2%) | 0 (0.0%) |
| $75,000 to $99,999 | 147 (23.4%) | 72 (32.1%) |
| $100,000 to $149,999 | 138 (21.9%) | 0 (0.0%) |
| $150,000 or more | 104 (16.5%) | 0 (0.0%) |
| Total | 629 (100.0%) | 224 (100.0%) |
Monthly Housing Cost Tiers in Chuluota
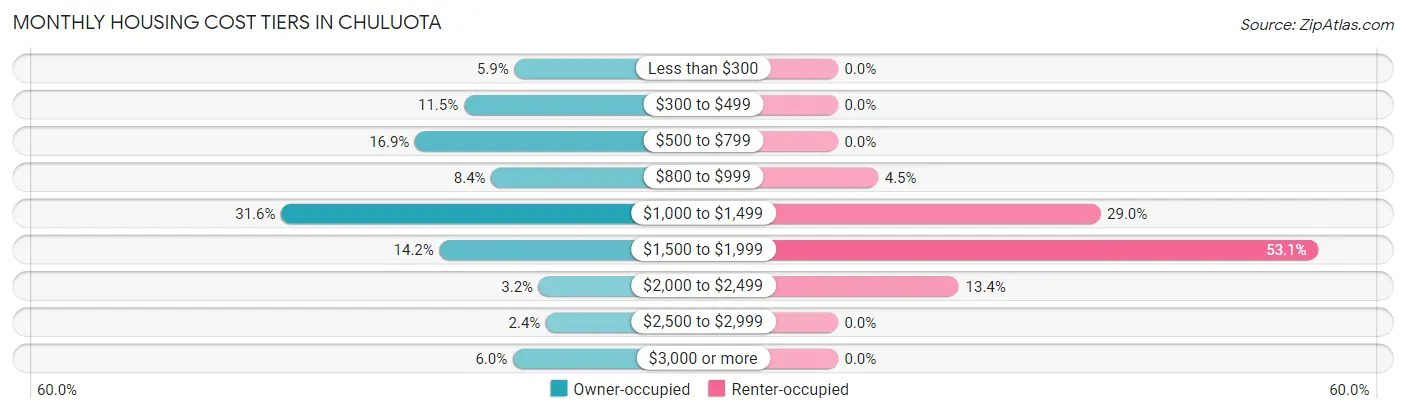
| Monthly Cost | Owner-occupied | Renter-occupied |
| Less than $300 | 37 (5.9%) | 0 (0.0%) |
| $300 to $499 | 72 (11.5%) | 0 (0.0%) |
| $500 to $799 | 106 (16.9%) | 0 (0.0%) |
| $800 to $999 | 53 (8.4%) | 10 (4.5%) |
| $1,000 to $1,499 | 199 (31.6%) | 65 (29.0%) |
| $1,500 to $1,999 | 89 (14.1%) | 119 (53.1%) |
| $2,000 to $2,499 | 20 (3.2%) | 30 (13.4%) |
| $2,500 to $2,999 | 15 (2.4%) | 0 (0.0%) |
| $3,000 or more | 38 (6.0%) | 0 (0.0%) |
| Total | 629 (100.0%) | 224 (100.0%) |
Physical Housing Characteristics in Chuluota
Housing Structures in Chuluota
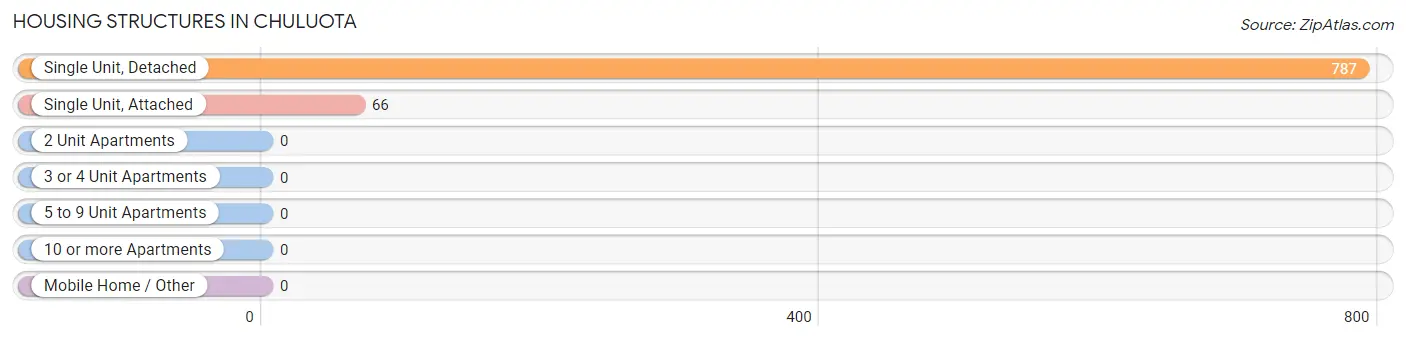
| Structure Type | # Housing Units | % Housing Units |
| Single Unit, Detached | 787 | 92.3% |
| Single Unit, Attached | 66 | 7.7% |
| 2 Unit Apartments | 0 | 0.0% |
| 3 or 4 Unit Apartments | 0 | 0.0% |
| 5 to 9 Unit Apartments | 0 | 0.0% |
| 10 or more Apartments | 0 | 0.0% |
| Mobile Home / Other | 0 | 0.0% |
| Total | 853 | 100.0% |
Housing Structures by Occupancy in Chuluota
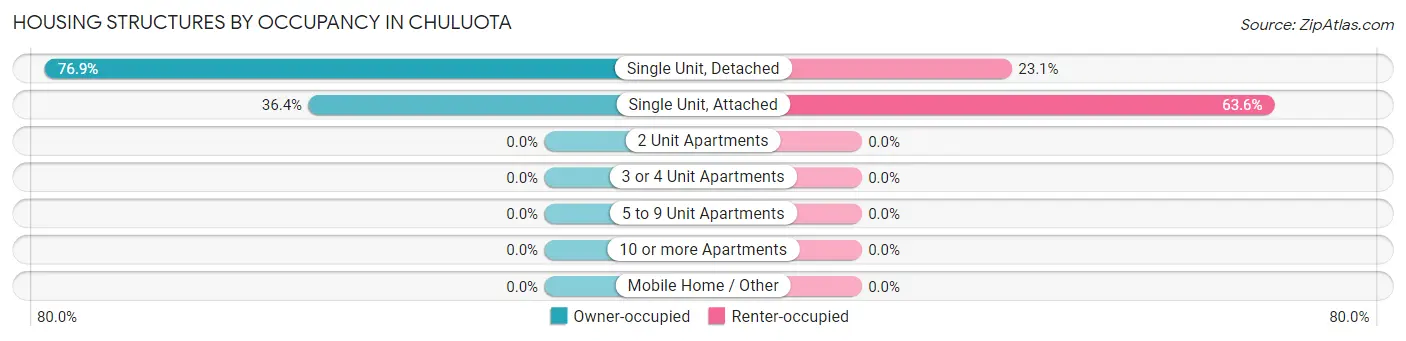
| Structure Type | Owner-occupied | Renter-occupied |
| Single Unit, Detached | 605 (76.9%) | 182 (23.1%) |
| Single Unit, Attached | 24 (36.4%) | 42 (63.6%) |
| 2 Unit Apartments | 0 (0.0%) | 0 (0.0%) |
| 3 or 4 Unit Apartments | 0 (0.0%) | 0 (0.0%) |
| 5 to 9 Unit Apartments | 0 (0.0%) | 0 (0.0%) |
| 10 or more Apartments | 0 (0.0%) | 0 (0.0%) |
| Mobile Home / Other | 0 (0.0%) | 0 (0.0%) |
| Total | 629 (73.7%) | 224 (26.3%) |
Housing Structures by Number of Rooms in Chuluota
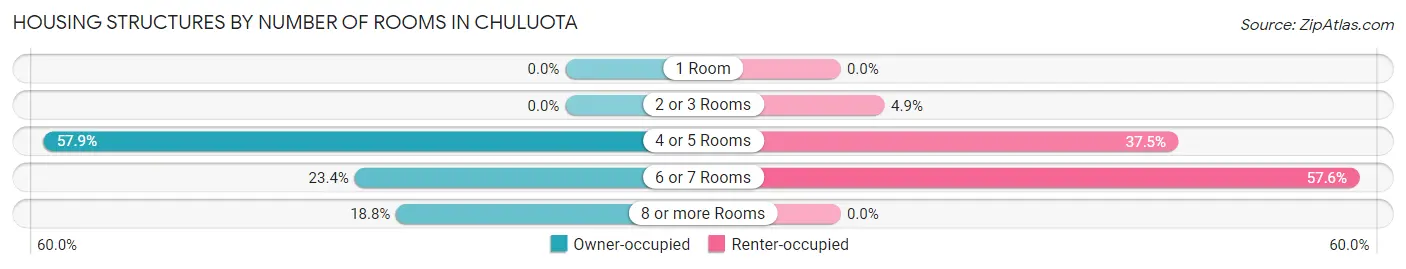
| Number of Rooms | Owner-occupied | Renter-occupied |
| 1 Room | 0 (0.0%) | 0 (0.0%) |
| 2 or 3 Rooms | 0 (0.0%) | 11 (4.9%) |
| 4 or 5 Rooms | 364 (57.9%) | 84 (37.5%) |
| 6 or 7 Rooms | 147 (23.4%) | 129 (57.6%) |
| 8 or more Rooms | 118 (18.8%) | 0 (0.0%) |
| Total | 629 (100.0%) | 224 (100.0%) |
Housing Structure by Heating Type in Chuluota
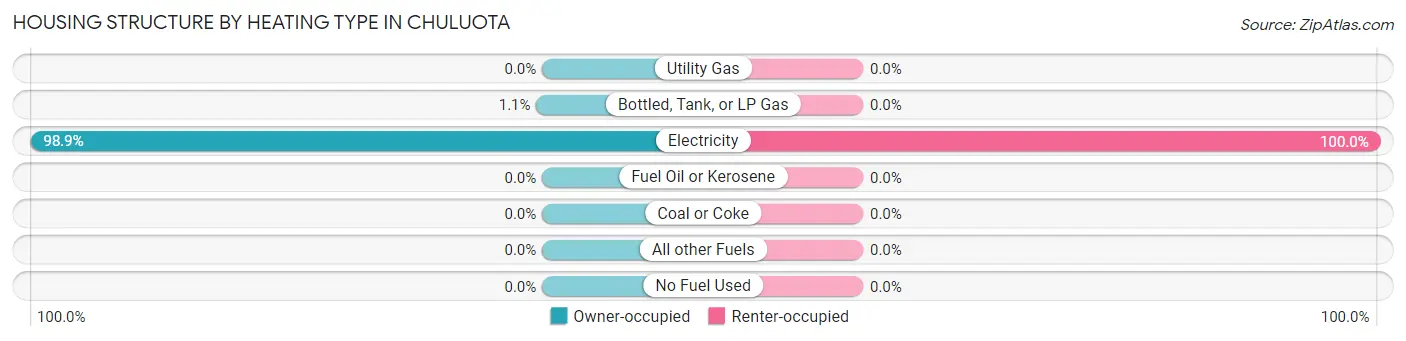
| Heating Type | Owner-occupied | Renter-occupied |
| Utility Gas | 0 (0.0%) | 0 (0.0%) |
| Bottled, Tank, or LP Gas | 7 (1.1%) | 0 (0.0%) |
| Electricity | 622 (98.9%) | 224 (100.0%) |
| Fuel Oil or Kerosene | 0 (0.0%) | 0 (0.0%) |
| Coal or Coke | 0 (0.0%) | 0 (0.0%) |
| All other Fuels | 0 (0.0%) | 0 (0.0%) |
| No Fuel Used | 0 (0.0%) | 0 (0.0%) |
| Total | 629 (100.0%) | 224 (100.0%) |
Household Vehicle Usage in Chuluota
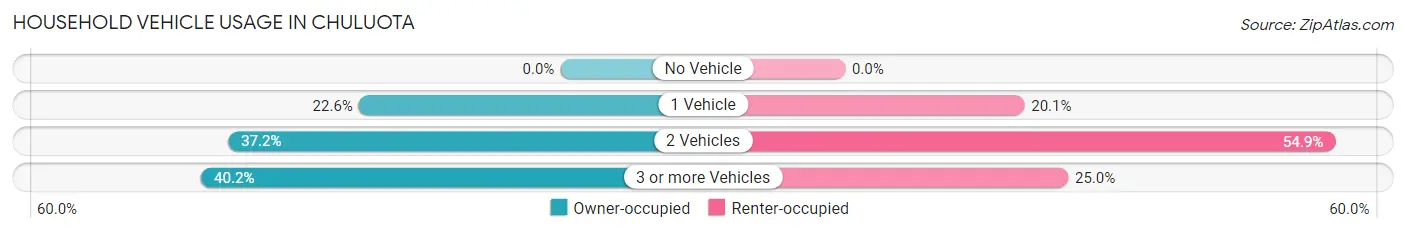
| Vehicles per Household | Owner-occupied | Renter-occupied |
| No Vehicle | 0 (0.0%) | 0 (0.0%) |
| 1 Vehicle | 142 (22.6%) | 45 (20.1%) |
| 2 Vehicles | 234 (37.2%) | 123 (54.9%) |
| 3 or more Vehicles | 253 (40.2%) | 56 (25.0%) |
| Total | 629 (100.0%) | 224 (100.0%) |
Real Estate & Mortgages in Chuluota
Real Estate and Mortgage Overview in Chuluota
| Characteristic | Without Mortgage | With Mortgage |
| Housing Units | 192 | 437 |
| Median Property Value | $429,000 | $346,800 |
| Median Household Income | $73,971 | $88 |
| Monthly Housing Costs | $714 | $38 |
| Real Estate Taxes | $2,271 | $25 |
Property Value by Mortgage Status in Chuluota
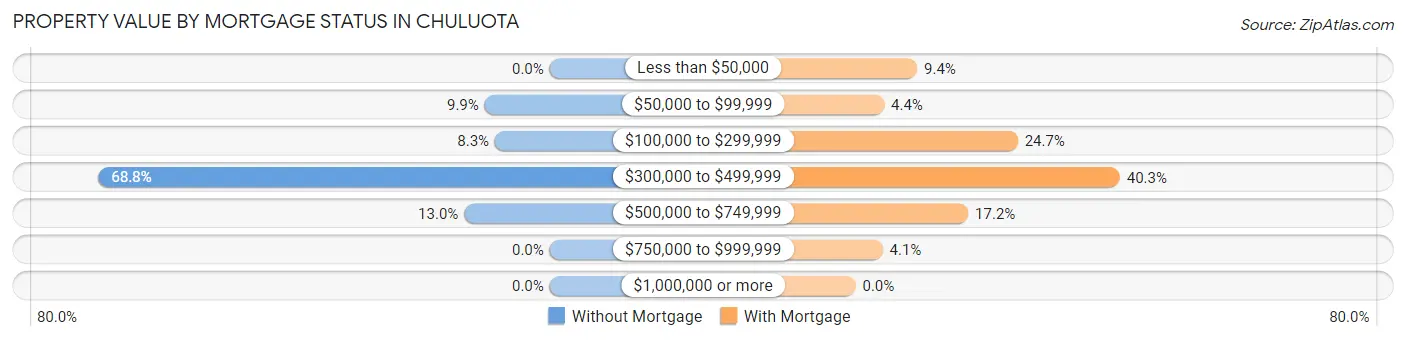
| Property Value | Without Mortgage | With Mortgage |
| Less than $50,000 | 0 (0.0%) | 41 (9.4%) |
| $50,000 to $99,999 | 19 (9.9%) | 19 (4.3%) |
| $100,000 to $299,999 | 16 (8.3%) | 108 (24.7%) |
| $300,000 to $499,999 | 132 (68.8%) | 176 (40.3%) |
| $500,000 to $749,999 | 25 (13.0%) | 75 (17.2%) |
| $750,000 to $999,999 | 0 (0.0%) | 18 (4.1%) |
| $1,000,000 or more | 0 (0.0%) | 0 (0.0%) |
| Total | 192 (100.0%) | 437 (100.0%) |
Household Income by Mortgage Status in Chuluota
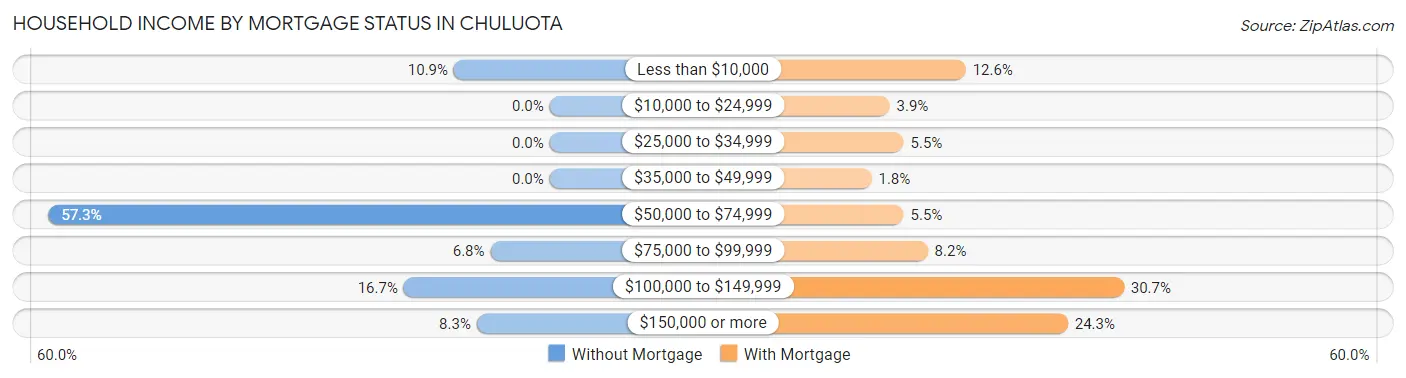
| Household Income | Without Mortgage | With Mortgage |
| Less than $10,000 | 21 (10.9%) | 55 (12.6%) |
| $10,000 to $24,999 | 0 (0.0%) | 17 (3.9%) |
| $25,000 to $34,999 | 0 (0.0%) | 24 (5.5%) |
| $35,000 to $49,999 | 0 (0.0%) | 8 (1.8%) |
| $50,000 to $74,999 | 110 (57.3%) | 24 (5.5%) |
| $75,000 to $99,999 | 13 (6.8%) | 36 (8.2%) |
| $100,000 to $149,999 | 32 (16.7%) | 134 (30.7%) |
| $150,000 or more | 16 (8.3%) | 106 (24.3%) |
| Total | 192 (100.0%) | 437 (100.0%) |
Property Value to Household Income Ratio in Chuluota
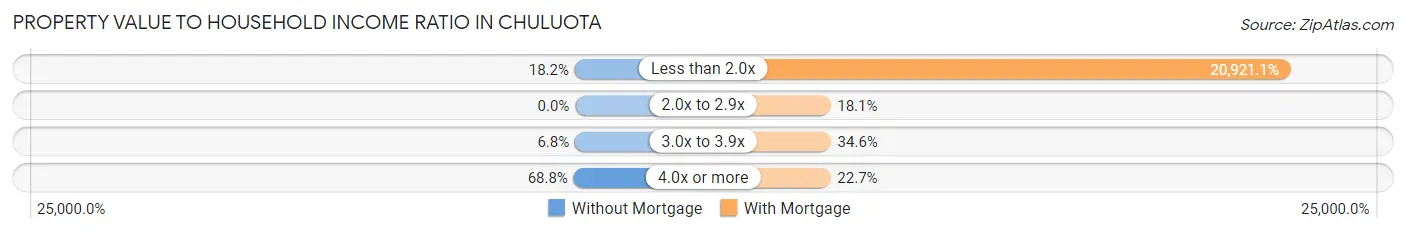
| Value-to-Income Ratio | Without Mortgage | With Mortgage |
| Less than 2.0x | 35 (18.2%) | 91,425 (20,921.0%) |
| 2.0x to 2.9x | 0 (0.0%) | 79 (18.1%) |
| 3.0x to 3.9x | 13 (6.8%) | 151 (34.5%) |
| 4.0x or more | 132 (68.8%) | 99 (22.7%) |
| Total | 192 (100.0%) | 437 (100.0%) |
Real Estate Taxes by Mortgage Status in Chuluota
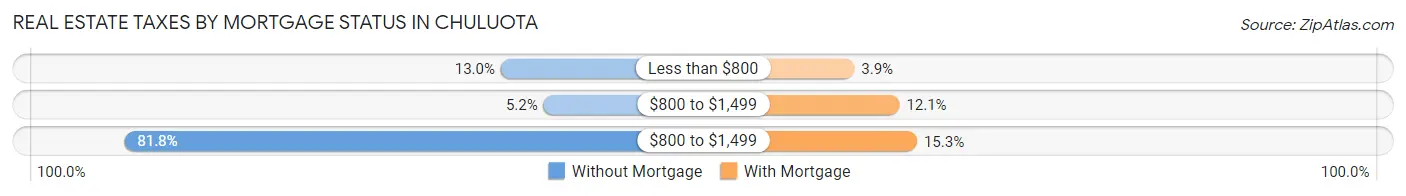
| Property Taxes | Without Mortgage | With Mortgage |
| Less than $800 | 25 (13.0%) | 17 (3.9%) |
| $800 to $1,499 | 10 (5.2%) | 53 (12.1%) |
| $800 to $1,499 | 157 (81.8%) | 67 (15.3%) |
| Total | 192 (100.0%) | 437 (100.0%) |
Health & Disability in Chuluota
Health Insurance Coverage by Age in Chuluota
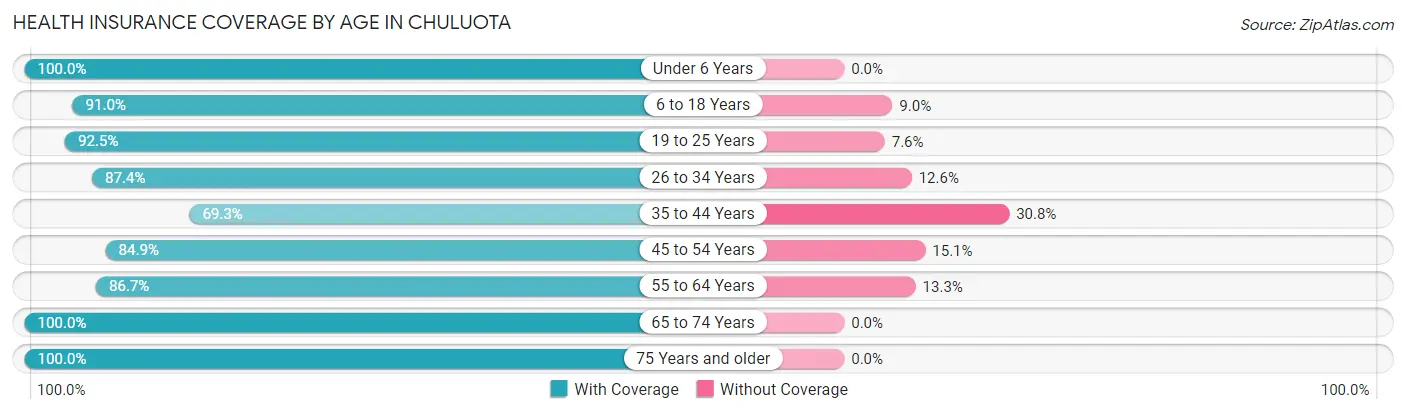
| Age Bracket | With Coverage | Without Coverage |
| Under 6 Years | 349 (100.0%) | 0 (0.0%) |
| 6 to 18 Years | 264 (91.0%) | 26 (9.0%) |
| 19 to 25 Years | 147 (92.4%) | 12 (7.5%) |
| 26 to 34 Years | 424 (87.4%) | 61 (12.6%) |
| 35 to 44 Years | 331 (69.3%) | 147 (30.7%) |
| 45 to 54 Years | 174 (84.9%) | 31 (15.1%) |
| 55 to 64 Years | 228 (86.7%) | 35 (13.3%) |
| 65 to 74 Years | 176 (100.0%) | 0 (0.0%) |
| 75 Years and older | 79 (100.0%) | 0 (0.0%) |
| Total | 2,172 (87.4%) | 312 (12.6%) |
Health Insurance Coverage by Citizenship Status in Chuluota
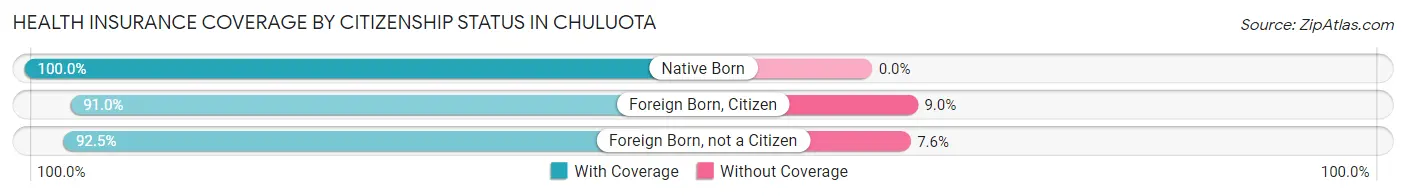
| Citizenship Status | With Coverage | Without Coverage |
| Native Born | 349 (100.0%) | 0 (0.0%) |
| Foreign Born, Citizen | 264 (91.0%) | 26 (9.0%) |
| Foreign Born, not a Citizen | 147 (92.4%) | 12 (7.5%) |
Health Insurance Coverage by Household Income in Chuluota
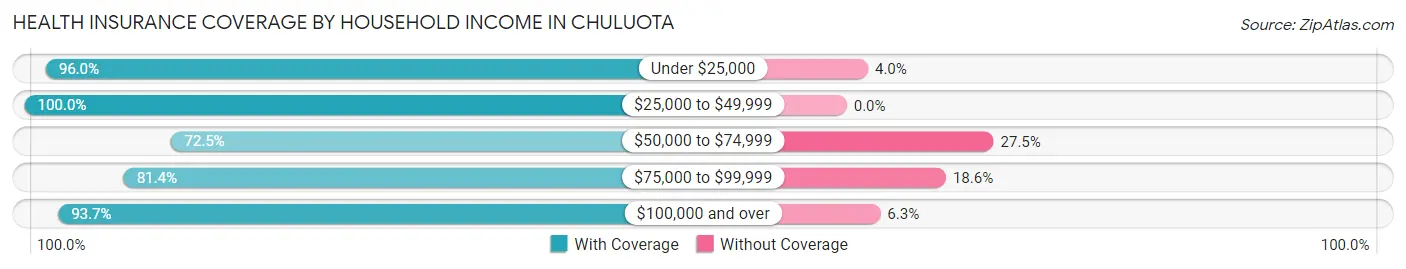
| Household Income | With Coverage | Without Coverage |
| Under $25,000 | 410 (96.0%) | 17 (4.0%) |
| $25,000 to $49,999 | 165 (100.0%) | 0 (0.0%) |
| $50,000 to $74,999 | 332 (72.5%) | 126 (27.5%) |
| $75,000 to $99,999 | 539 (81.4%) | 123 (18.6%) |
| $100,000 and over | 684 (93.7%) | 46 (6.3%) |
Public vs Private Health Insurance Coverage by Age in Chuluota
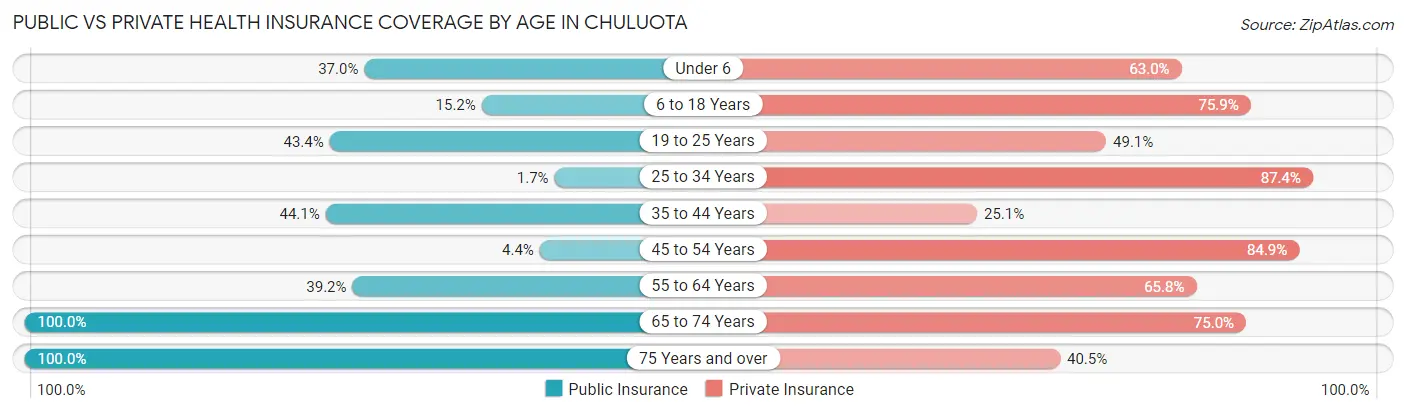
| Age Bracket | Public Insurance | Private Insurance |
| Under 6 | 129 (37.0%) | 220 (63.0%) |
| 6 to 18 Years | 44 (15.2%) | 220 (75.9%) |
| 19 to 25 Years | 69 (43.4%) | 78 (49.1%) |
| 25 to 34 Years | 8 (1.7%) | 424 (87.4%) |
| 35 to 44 Years | 211 (44.1%) | 120 (25.1%) |
| 45 to 54 Years | 9 (4.4%) | 174 (84.9%) |
| 55 to 64 Years | 103 (39.2%) | 173 (65.8%) |
| 65 to 74 Years | 176 (100.0%) | 132 (75.0%) |
| 75 Years and over | 79 (100.0%) | 32 (40.5%) |
| Total | 828 (33.3%) | 1,573 (63.3%) |
Disability Status by Sex by Age in Chuluota
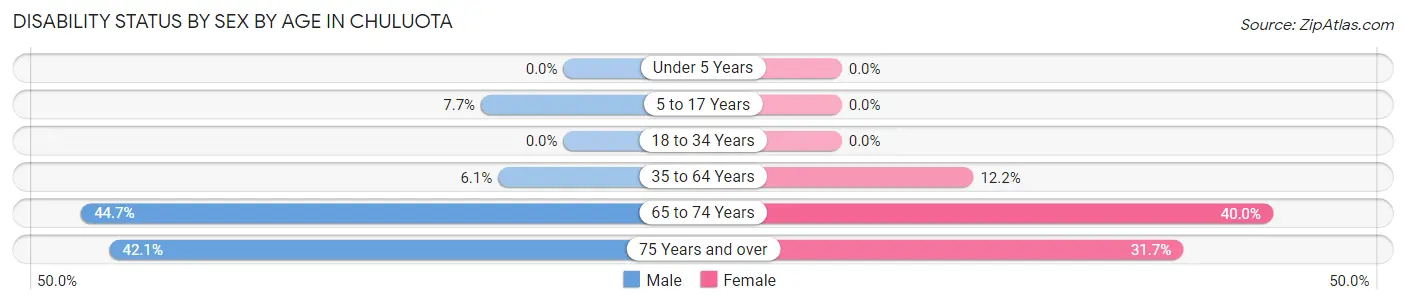
| Age Bracket | Male | Female |
| Under 5 Years | 0 (0.0%) | 0 (0.0%) |
| 5 to 17 Years | 15 (7.6%) | 0 (0.0%) |
| 18 to 34 Years | 0 (0.0%) | 0 (0.0%) |
| 35 to 64 Years | 36 (6.1%) | 43 (12.2%) |
| 65 to 74 Years | 34 (44.7%) | 40 (40.0%) |
| 75 Years and over | 8 (42.1%) | 19 (31.7%) |
Disability Class by Sex by Age in Chuluota
Disability Class: Hearing Difficulty
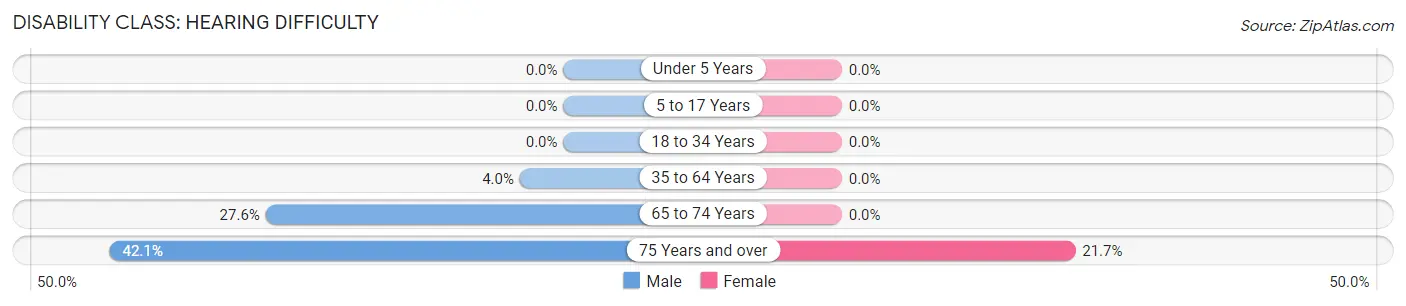
| Age Bracket | Male | Female |
| Under 5 Years | 0 (0.0%) | 0 (0.0%) |
| 5 to 17 Years | 0 (0.0%) | 0 (0.0%) |
| 18 to 34 Years | 0 (0.0%) | 0 (0.0%) |
| 35 to 64 Years | 24 (4.0%) | 0 (0.0%) |
| 65 to 74 Years | 21 (27.6%) | 0 (0.0%) |
| 75 Years and over | 8 (42.1%) | 13 (21.7%) |
Disability Class: Vision Difficulty
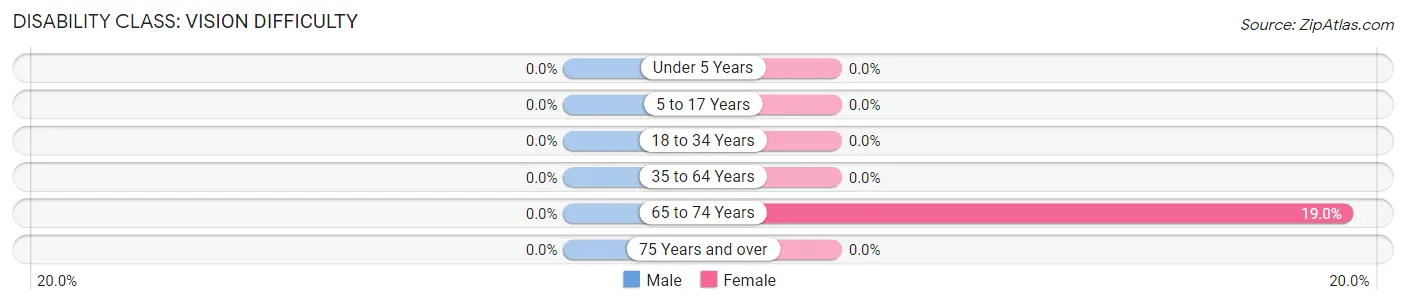
| Age Bracket | Male | Female |
| Under 5 Years | 0 (0.0%) | 0 (0.0%) |
| 5 to 17 Years | 0 (0.0%) | 0 (0.0%) |
| 18 to 34 Years | 0 (0.0%) | 0 (0.0%) |
| 35 to 64 Years | 0 (0.0%) | 0 (0.0%) |
| 65 to 74 Years | 0 (0.0%) | 19 (19.0%) |
| 75 Years and over | 0 (0.0%) | 0 (0.0%) |
Disability Class: Cognitive Difficulty
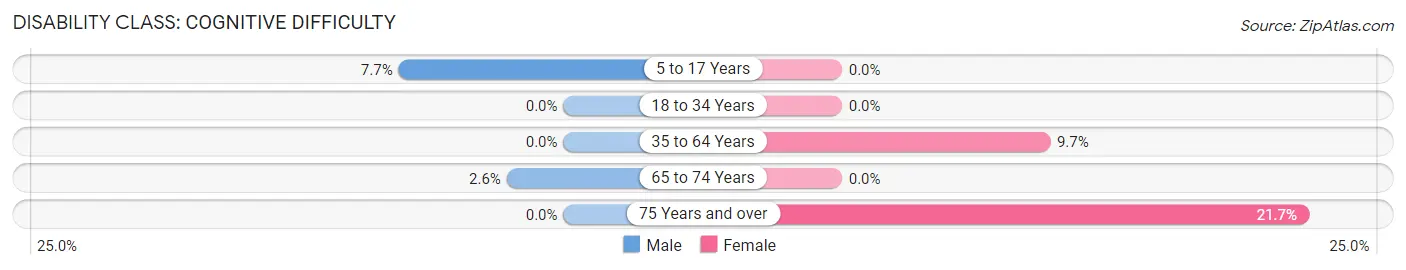
| Age Bracket | Male | Female |
| 5 to 17 Years | 15 (7.6%) | 0 (0.0%) |
| 18 to 34 Years | 0 (0.0%) | 0 (0.0%) |
| 35 to 64 Years | 0 (0.0%) | 34 (9.7%) |
| 65 to 74 Years | 2 (2.6%) | 0 (0.0%) |
| 75 Years and over | 0 (0.0%) | 13 (21.7%) |
Disability Class: Ambulatory Difficulty
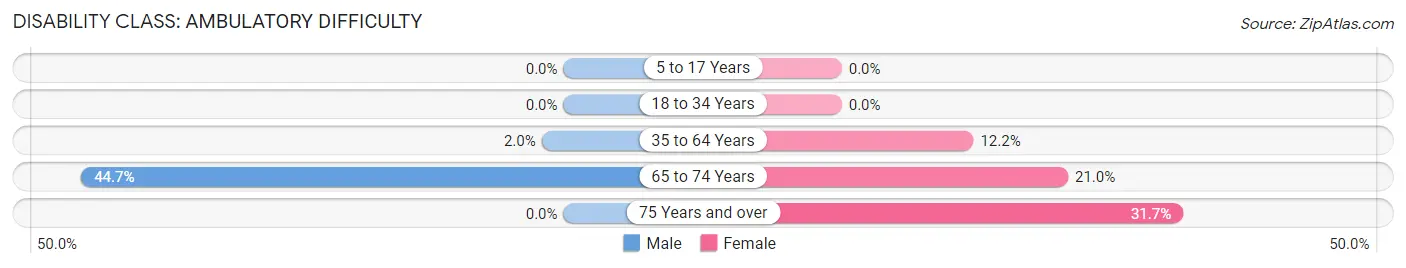
| Age Bracket | Male | Female |
| 5 to 17 Years | 0 (0.0%) | 0 (0.0%) |
| 18 to 34 Years | 0 (0.0%) | 0 (0.0%) |
| 35 to 64 Years | 12 (2.0%) | 43 (12.2%) |
| 65 to 74 Years | 34 (44.7%) | 21 (21.0%) |
| 75 Years and over | 0 (0.0%) | 19 (31.7%) |
Disability Class: Self-Care Difficulty
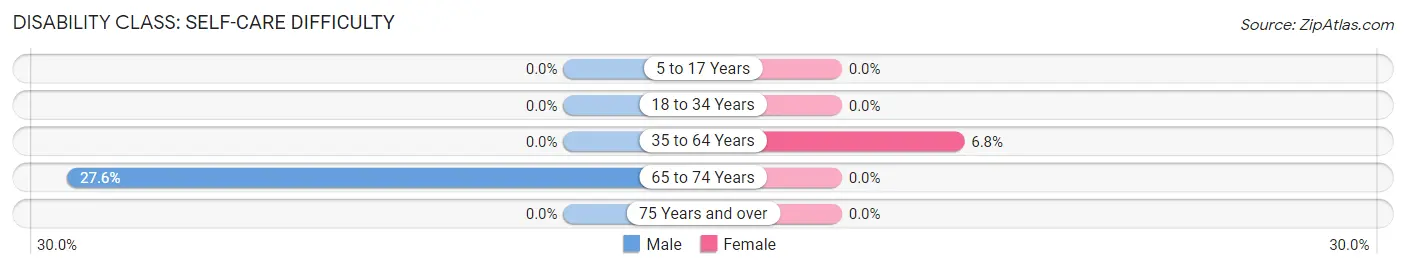
| Age Bracket | Male | Female |
| 5 to 17 Years | 0 (0.0%) | 0 (0.0%) |
| 18 to 34 Years | 0 (0.0%) | 0 (0.0%) |
| 35 to 64 Years | 0 (0.0%) | 24 (6.8%) |
| 65 to 74 Years | 21 (27.6%) | 0 (0.0%) |
| 75 Years and over | 0 (0.0%) | 0 (0.0%) |
Technology Access in Chuluota
Computing Device Access in Chuluota
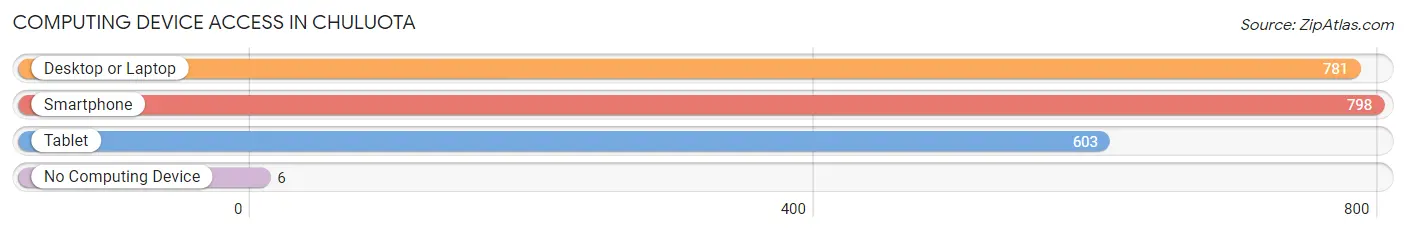
| Device Type | # Households | % Households |
| Desktop or Laptop | 781 | 91.6% |
| Smartphone | 798 | 93.5% |
| Tablet | 603 | 70.7% |
| No Computing Device | 6 | 0.7% |
| Total | 853 | 100.0% |
Internet Access in Chuluota
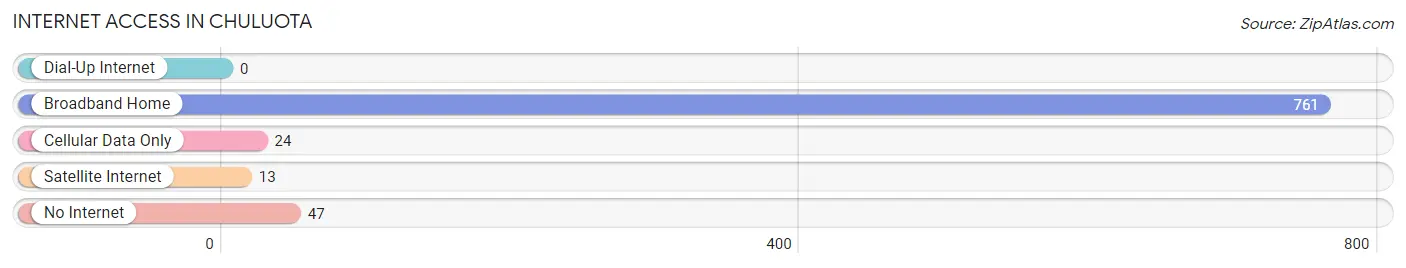
| Internet Type | # Households | % Households |
| Dial-Up Internet | 0 | 0.0% |
| Broadband Home | 761 | 89.2% |
| Cellular Data Only | 24 | 2.8% |
| Satellite Internet | 13 | 1.5% |
| No Internet | 47 | 5.5% |
| Total | 853 | 100.0% |
Chuluota Summary
Chuluota, Florida is a small unincorporated community located in Seminole County, Florida. It is situated approximately 20 miles northeast of Orlando and is part of the Orlando-Kissimmee-Sanford Metropolitan Statistical Area. The population of Chuluota was estimated to be 2,845 in 2019.
History
Chuluota was first settled in the late 1800s by a group of settlers from the nearby town of Geneva. The settlers named the area Chuluota, which is derived from the Seminole Indian word meaning “big island”. The area was primarily used for cattle ranching and citrus farming. In the early 1900s, the area was home to a number of small businesses, including a general store, a post office, and a school.
In the 1950s, the area began to experience rapid growth as more people moved to the area. This growth was largely due to the development of the nearby Orlando area. In the 1960s, the area was annexed by Seminole County and the population continued to grow.
Geography
Chuluota is located in Seminole County, Florida. It is situated approximately 20 miles northeast of Orlando and is part of the Orlando-Kissimmee-Sanford Metropolitan Statistical Area. The area is primarily flat and is located on the northern edge of the Econlockhatchee River. The area is also home to a number of lakes, including Lake Jesup, Lake Harney, and Lake Monroe.
Economy
The economy of Chuluota is largely driven by the tourism industry. The area is home to a number of attractions, including the Central Florida Zoo and the Central Florida Zoological Park. The area is also home to a number of restaurants, retail stores, and other businesses.
Demographics
As of 2019, the population of Chuluota was estimated to be 2,845. The population is primarily white (83.3%) and Hispanic (14.2%). The median household income is $60,945 and the median home value is $223,400. The unemployment rate is 3.7%.
Conclusion
Chuluota, Florida is a small unincorporated community located in Seminole County, Florida. It is situated approximately 20 miles northeast of Orlando and is part of the Orlando-Kissimmee-Sanford Metropolitan Statistical Area. The population of Chuluota was estimated to be 2,845 in 2019. The economy of Chuluota is largely driven by the tourism industry and the population is primarily white (83.3%) and Hispanic (14.2%). The median household income is $60,945 and the median home value is $223,400. The unemployment rate is 3.7%.
Common Questions
What is Per Capita Income in Chuluota?
Per Capita income in Chuluota is $33,401.
What is the Median Family Income in Chuluota?
Median Family Income in Chuluota is $74,765.
What is the Median Household income in Chuluota?
Median Household Income in Chuluota is $80,250.
What is Income or Wage Gap in Chuluota?
Income or Wage Gap in Chuluota is 1.3%.
Women in Chuluota earn 98.7 cents for every dollar earned by a man.
What is Inequality or Gini Index in Chuluota?
Inequality or Gini Index in Chuluota is 0.45.
What is the Total Population of Chuluota?
Total Population of Chuluota is 2,484.
What is the Total Male Population of Chuluota?
Total Male Population of Chuluota is 1,445.
What is the Total Female Population of Chuluota?
Total Female Population of Chuluota is 1,039.
What is the Ratio of Males per 100 Females in Chuluota?
There are 139.08 Males per 100 Females in Chuluota.
What is the Ratio of Females per 100 Males in Chuluota?
There are 71.90 Females per 100 Males in Chuluota.
What is the Median Population Age in Chuluota?
Median Population Age in Chuluota is 33.6 Years.
What is the Average Family Size in Chuluota
Average Family Size in Chuluota is 3.1 People.
What is the Average Household Size in Chuluota
Average Household Size in Chuluota is 2.9 People.
How Large is the Labor Force in Chuluota?
There are 1,177 People in the Labor Forcein in Chuluota.
What is the Percentage of People in the Labor Force in Chuluota?
62.2% of People are in the Labor Force in Chuluota.
What is the Unemployment Rate in Chuluota?
Unemployment Rate in Chuluota is 5.9%.