West Perrine, FL Map & Demographics
West Perrine Map
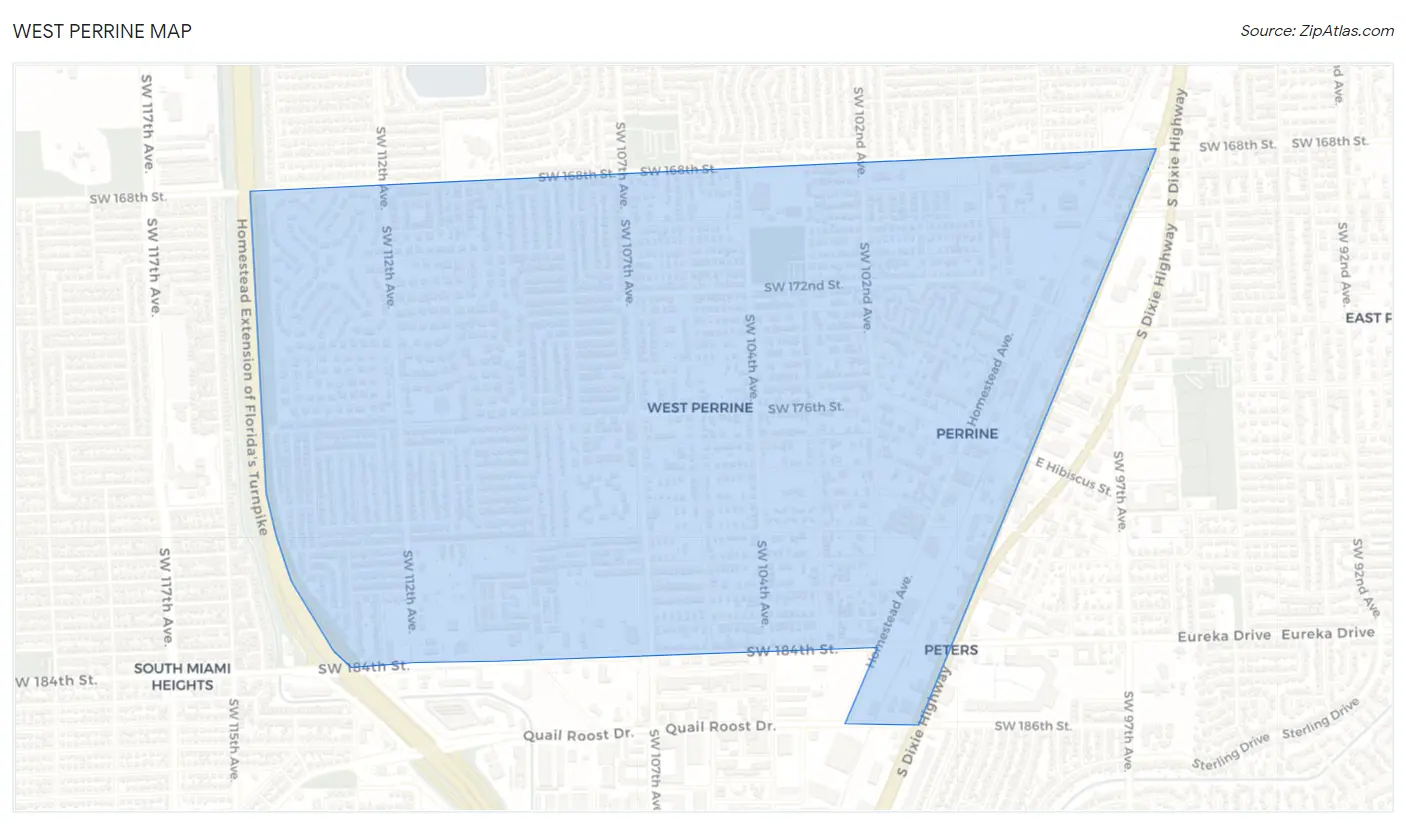
West Perrine Overview
$22,929
PER CAPITA INCOME
$70,560
AVG FAMILY INCOME
$57,188
AVG HOUSEHOLD INCOME
32.3%
WAGE / INCOME GAP [ % ]
67.7¢/ $1
WAGE / INCOME GAP [ $ ]
$10,735
FAMILY INCOME DEFICIT
0.46
INEQUALITY / GINI INDEX
10,597
TOTAL POPULATION
4,959
MALE POPULATION
5,638
FEMALE POPULATION
87.96
MALES / 100 FEMALES
113.69
FEMALES / 100 MALES
33.8
MEDIAN AGE
3.9
AVG FAMILY SIZE
3.4
AVG HOUSEHOLD SIZE
5,027
LABOR FORCE [ PEOPLE ]
63.7%
PERCENT IN LABOR FORCE
8.0%
UNEMPLOYMENT RATE
Income in West Perrine
Income Overview in West Perrine
Per Capita Income in West Perrine is $22,929, while median incomes of families and households are $70,560 and $57,188 respectively.
| Characteristic | Number | Measure |
| Per Capita Income | 10,597 | $22,929 |
| Median Family Income | 2,396 | $70,560 |
| Mean Family Income | 2,396 | $82,742 |
| Median Household Income | 3,089 | $57,188 |
| Mean Household Income | 3,089 | $73,881 |
| Income Deficit | 2,396 | $10,735 |
| Wage / Income Gap (%) | 10,597 | 32.27% |
| Wage / Income Gap ($) | 10,597 | 67.73¢ per $1 |
| Gini / Inequality Index | 10,597 | 0.46 |
Earnings by Sex in West Perrine
Average Earnings in West Perrine are $27,255, $36,106 for men and $24,456 for women, a difference of 32.3%.
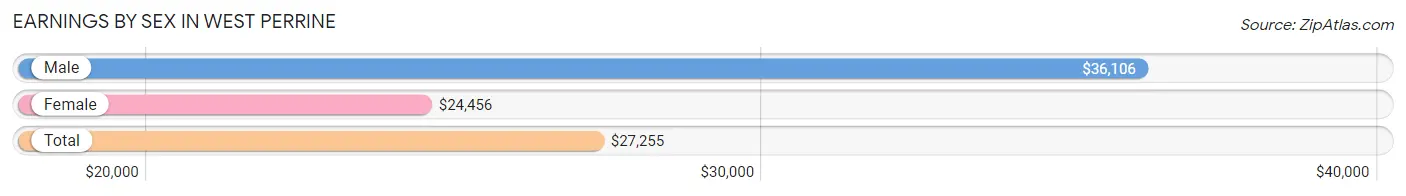
| Sex | Number | Average Earnings |
| Male | 2,340 (45.3%) | $36,106 |
| Female | 2,823 (54.7%) | $24,456 |
| Total | 5,163 (100.0%) | $27,255 |
Earnings by Sex by Income Bracket in West Perrine
The most common earnings brackets in West Perrine are $30,000 to $34,999 for men (336 | 14.4%) and $25,000 to $29,999 for women (465 | 16.5%).
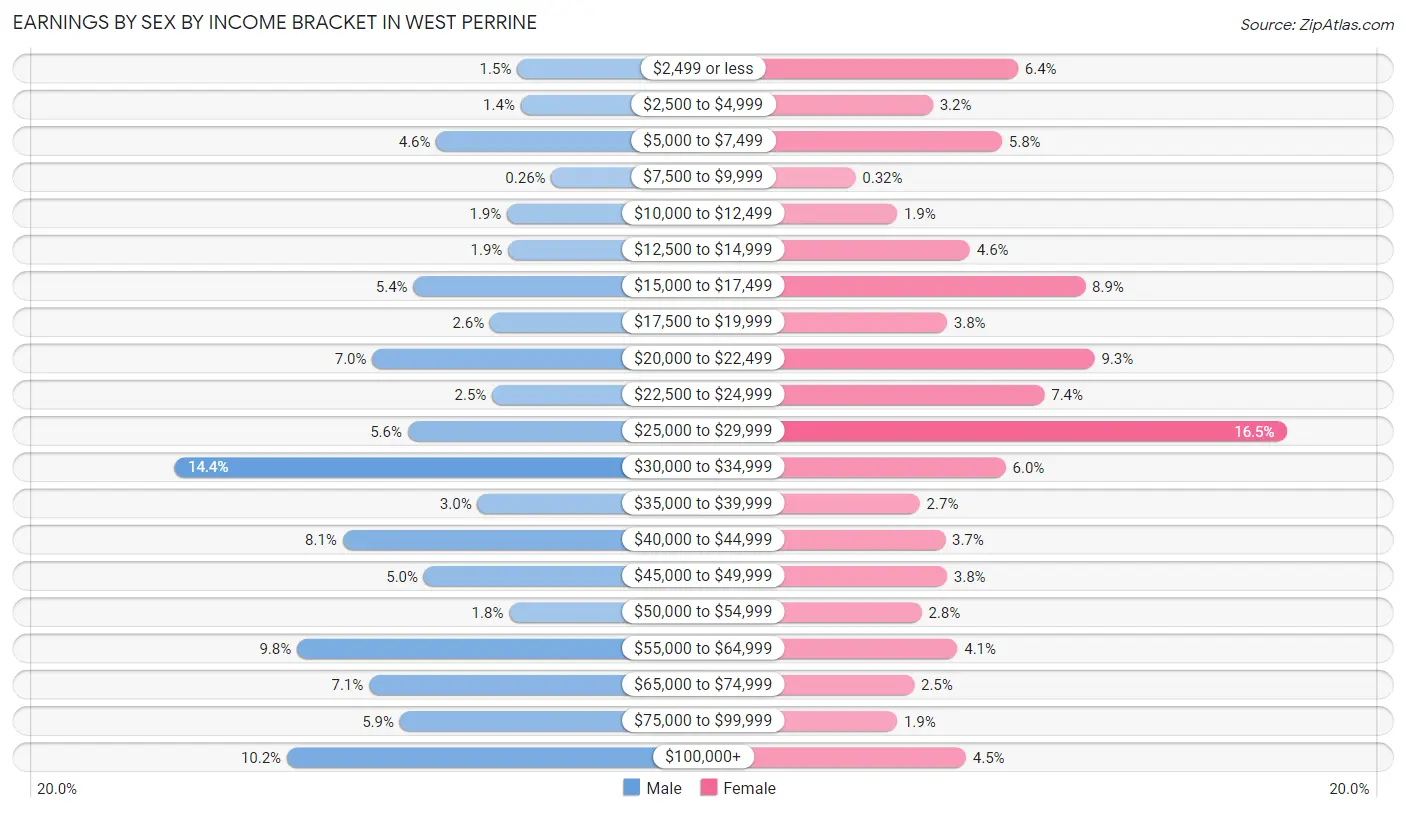
| Income | Male | Female |
| $2,499 or less | 36 (1.5%) | 181 (6.4%) |
| $2,500 to $4,999 | 33 (1.4%) | 91 (3.2%) |
| $5,000 to $7,499 | 107 (4.6%) | 164 (5.8%) |
| $7,500 to $9,999 | 6 (0.3%) | 9 (0.3%) |
| $10,000 to $12,499 | 45 (1.9%) | 53 (1.9%) |
| $12,500 to $14,999 | 44 (1.9%) | 130 (4.6%) |
| $15,000 to $17,499 | 127 (5.4%) | 252 (8.9%) |
| $17,500 to $19,999 | 60 (2.6%) | 106 (3.7%) |
| $20,000 to $22,499 | 163 (7.0%) | 262 (9.3%) |
| $22,500 to $24,999 | 58 (2.5%) | 209 (7.4%) |
| $25,000 to $29,999 | 132 (5.6%) | 465 (16.5%) |
| $30,000 to $34,999 | 336 (14.4%) | 168 (5.9%) |
| $35,000 to $39,999 | 71 (3.0%) | 77 (2.7%) |
| $40,000 to $44,999 | 189 (8.1%) | 104 (3.7%) |
| $45,000 to $49,999 | 118 (5.0%) | 106 (3.7%) |
| $50,000 to $54,999 | 43 (1.8%) | 79 (2.8%) |
| $55,000 to $64,999 | 229 (9.8%) | 117 (4.1%) |
| $65,000 to $74,999 | 166 (7.1%) | 71 (2.5%) |
| $75,000 to $99,999 | 139 (5.9%) | 53 (1.9%) |
| $100,000+ | 238 (10.2%) | 126 (4.5%) |
| Total | 2,340 (100.0%) | 2,823 (100.0%) |
Earnings by Sex by Educational Attainment in West Perrine
Average earnings in West Perrine are $41,025 for men and $25,899 for women, a difference of 36.9%. Men with an educational attainment of bachelor's degree enjoy the highest average annual earnings of $59,412, while those with less than high school education earn the least with $30,369. Women with an educational attainment of graduate degree earn the most with the average annual earnings of $50,806, while those with less than high school education have the smallest earnings of $17,127.
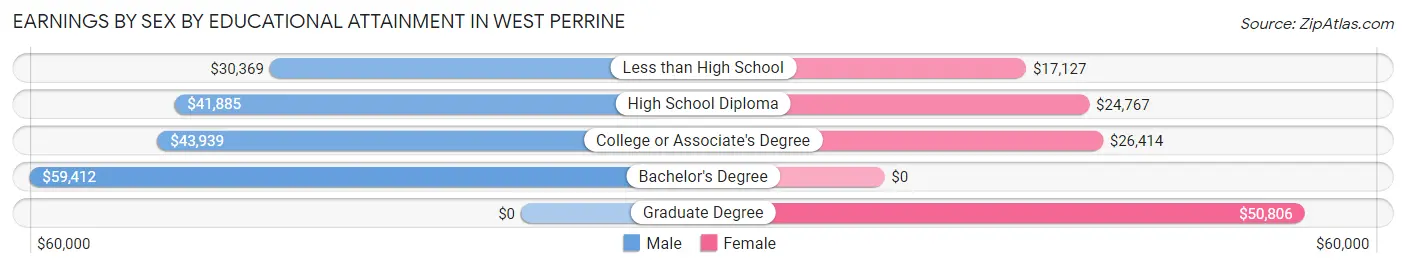
| Educational Attainment | Male Income | Female Income |
| Less than High School | $30,369 | $17,127 |
| High School Diploma | $41,885 | $24,767 |
| College or Associate's Degree | $43,939 | $26,414 |
| Bachelor's Degree | $59,412 | $0 |
| Graduate Degree | - | - |
| Total | $41,025 | $25,899 |
Family Income in West Perrine
Family Income Brackets in West Perrine
According to the West Perrine family income data, there are 405 families falling into the $35,000 to $49,999 income range, which is the most common income bracket and makes up 16.9% of all families. Conversely, the less than $10,000 income bracket is the least frequent group with only 113 families (4.7%) belonging to this category.
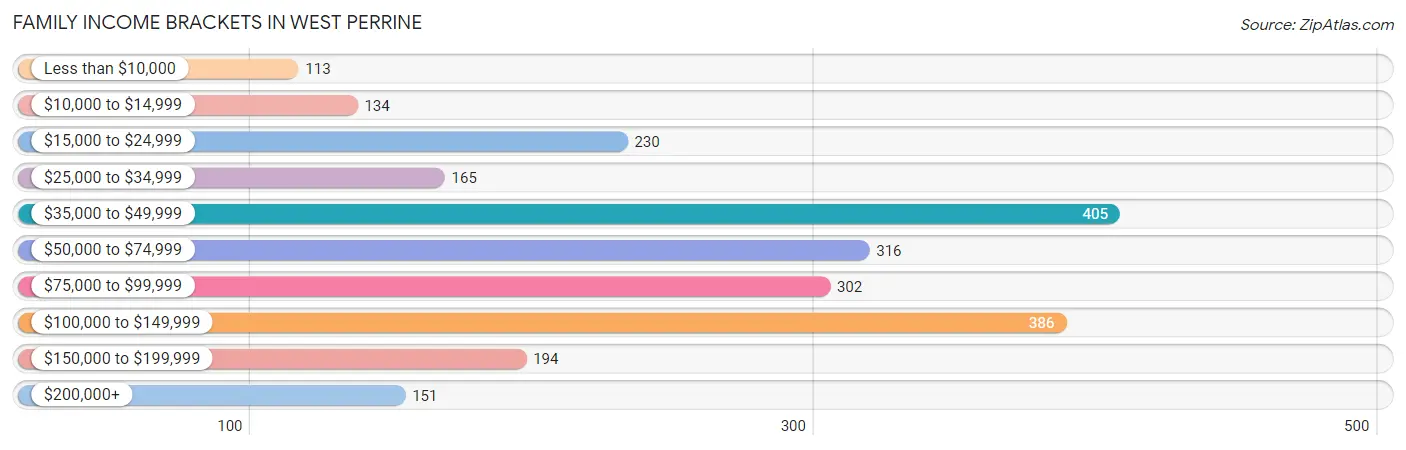
| Income Bracket | # Families | % Families |
| Less than $10,000 | 113 | 4.7% |
| $10,000 to $14,999 | 134 | 5.6% |
| $15,000 to $24,999 | 230 | 9.6% |
| $25,000 to $34,999 | 165 | 6.9% |
| $35,000 to $49,999 | 405 | 16.9% |
| $50,000 to $74,999 | 316 | 13.2% |
| $75,000 to $99,999 | 302 | 12.6% |
| $100,000 to $149,999 | 386 | 16.1% |
| $150,000 to $199,999 | 194 | 8.1% |
| $200,000+ | 151 | 6.3% |
Family Income by Famaliy Size in West Perrine
3-person families (608 | 25.4%) account for the highest median family income in West Perrine with $83,382 per family, while 3-person families (608 | 25.4%) have the highest median income of $27,794 per family member.
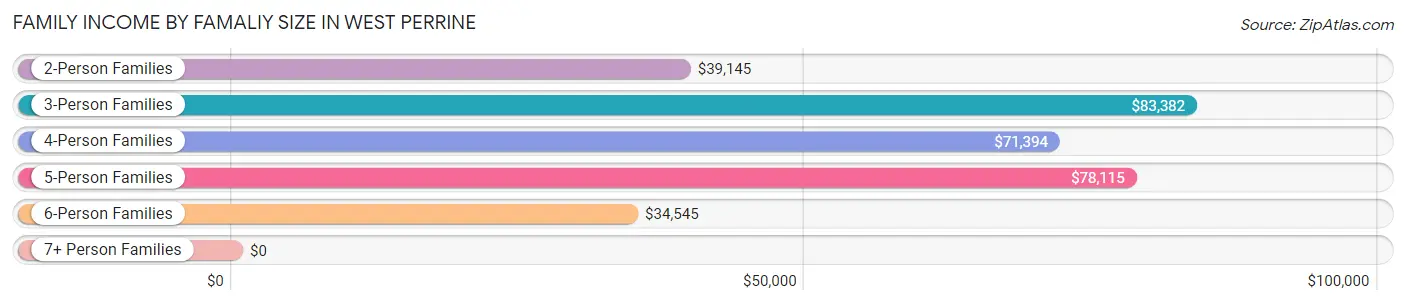
| Income Bracket | # Families | Median Income |
| 2-Person Families | 689 (28.8%) | $39,145 |
| 3-Person Families | 608 (25.4%) | $83,382 |
| 4-Person Families | 510 (21.3%) | $71,394 |
| 5-Person Families | 376 (15.7%) | $78,115 |
| 6-Person Families | 72 (3.0%) | $34,545 |
| 7+ Person Families | 141 (5.9%) | $0 |
| Total | 2,396 (100.0%) | $70,560 |
Family Income by Number of Earners in West Perrine
The median family income in West Perrine is $70,560, with families comprising 3+ earners (571) having the highest median family income of $112,188, while families with no earners (268) have the lowest median family income of $25,714, accounting for 23.8% and 11.2% of families, respectively.
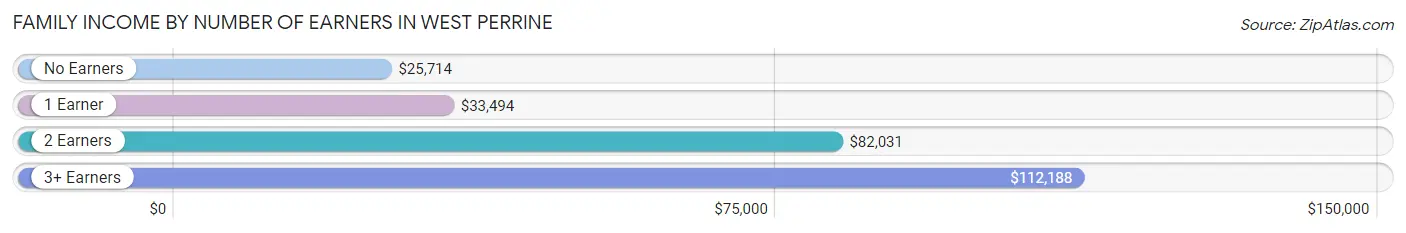
| Number of Earners | # Families | Median Income |
| No Earners | 268 (11.2%) | $25,714 |
| 1 Earner | 846 (35.3%) | $33,494 |
| 2 Earners | 711 (29.7%) | $82,031 |
| 3+ Earners | 571 (23.8%) | $112,188 |
| Total | 2,396 (100.0%) | $70,560 |
Household Income in West Perrine
Household Income Brackets in West Perrine
With 488 households falling in the category, the $50,000 to $74,999 income range is the most frequent in West Perrine, accounting for 15.8% of all households. In contrast, only 151 households (4.9%) fall into the $200,000+ income bracket, making it the least populous group.
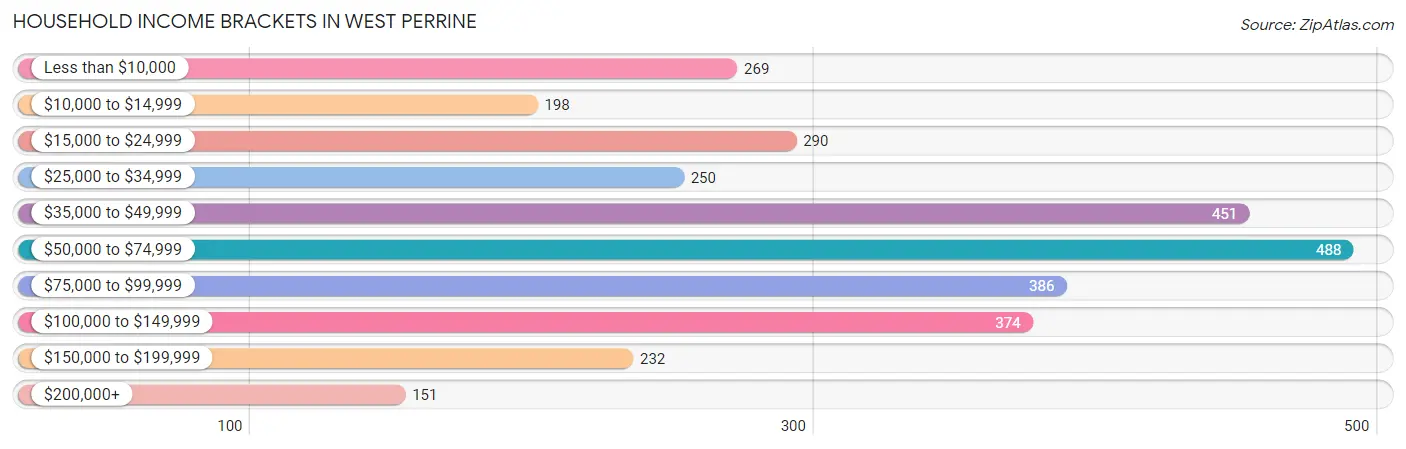
| Income Bracket | # Households | % Households |
| Less than $10,000 | 269 | 8.7% |
| $10,000 to $14,999 | 198 | 6.4% |
| $15,000 to $24,999 | 290 | 9.4% |
| $25,000 to $34,999 | 250 | 8.1% |
| $35,000 to $49,999 | 451 | 14.6% |
| $50,000 to $74,999 | 488 | 15.8% |
| $75,000 to $99,999 | 386 | 12.5% |
| $100,000 to $149,999 | 374 | 12.1% |
| $150,000 to $199,999 | 232 | 7.5% |
| $200,000+ | 151 | 4.9% |
Household Income by Householder Age in West Perrine
The median household income in West Perrine is $57,188, with the highest median household income of $71,789 found in the 45 to 64 years age bracket for the primary householder. A total of 1,387 households (44.9%) fall into this category. Meanwhile, the 15 to 24 years age bracket for the primary householder has the lowest median household income of $0, with 32 households (1.0%) in this group.
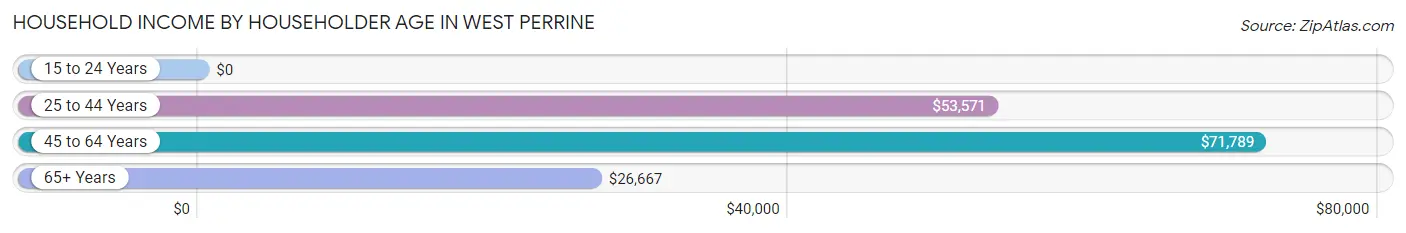
| Income Bracket | # Households | Median Income |
| 15 to 24 Years | 32 (1.0%) | $0 |
| 25 to 44 Years | 1,084 (35.1%) | $53,571 |
| 45 to 64 Years | 1,387 (44.9%) | $71,789 |
| 65+ Years | 586 (19.0%) | $26,667 |
| Total | 3,089 (100.0%) | $57,188 |
Poverty in West Perrine
Income Below Poverty by Sex and Age in West Perrine
With 14.6% poverty level for males and 21.8% for females among the residents of West Perrine, 16 and 17 year old males and under 5 year old females are the most vulnerable to poverty, with 83 males (45.6%) and 155 females (53.4%) in their respective age groups living below the poverty level.
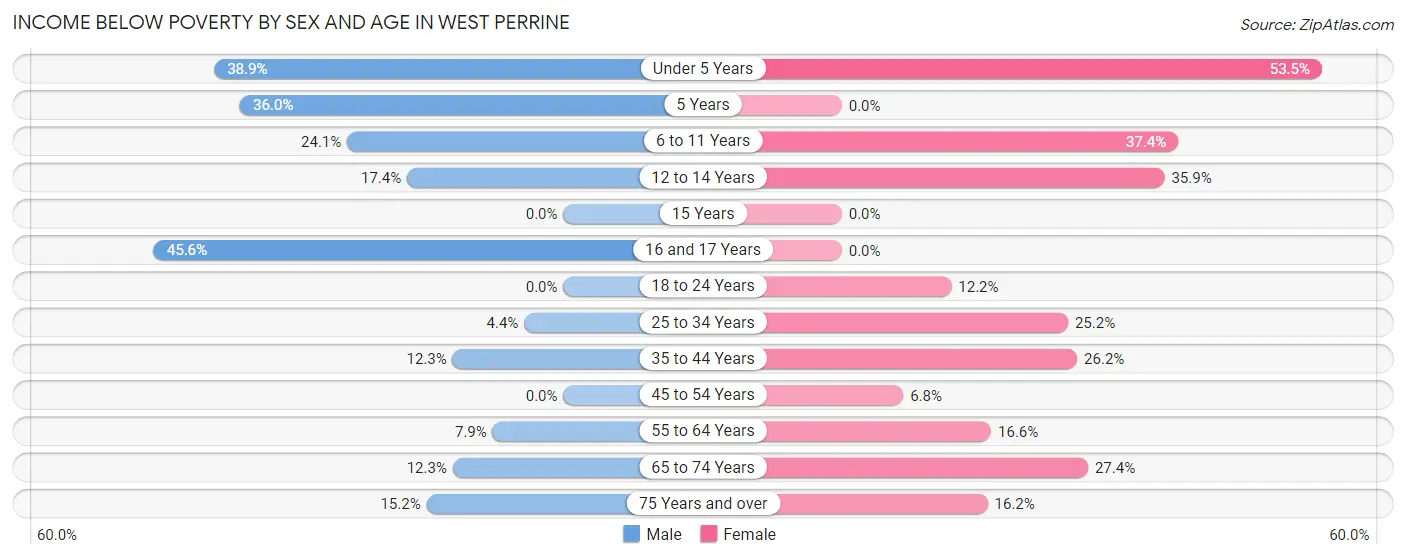
| Age Bracket | Male | Female |
| Under 5 Years | 194 (38.9%) | 155 (53.4%) |
| 5 Years | 27 (36.0%) | 0 (0.0%) |
| 6 to 11 Years | 177 (24.1%) | 164 (37.4%) |
| 12 to 14 Years | 43 (17.4%) | 69 (35.9%) |
| 15 Years | 0 (0.0%) | 0 (0.0%) |
| 16 and 17 Years | 83 (45.6%) | 0 (0.0%) |
| 18 to 24 Years | 0 (0.0%) | 62 (12.2%) |
| 25 to 34 Years | 20 (4.4%) | 269 (25.2%) |
| 35 to 44 Years | 104 (12.3%) | 189 (26.2%) |
| 45 to 54 Years | 0 (0.0%) | 60 (6.8%) |
| 55 to 64 Years | 35 (7.9%) | 78 (16.6%) |
| 65 to 74 Years | 17 (12.3%) | 122 (27.4%) |
| 75 Years and over | 25 (15.2%) | 57 (16.2%) |
| Total | 725 (14.6%) | 1,225 (21.8%) |
Income Above Poverty by Sex and Age in West Perrine
According to the poverty statistics in West Perrine, males aged 15 years and females aged 5 years are the age groups that are most secure financially, with 100.0% of males and 100.0% of females in these age groups living above the poverty line.
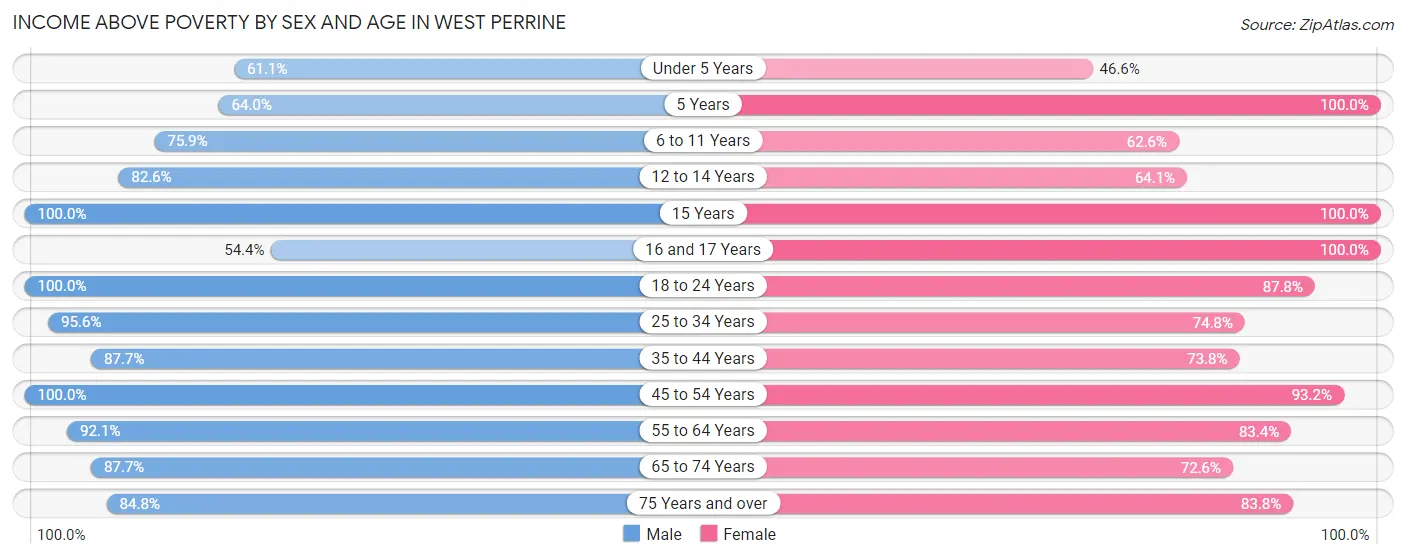
| Age Bracket | Male | Female |
| Under 5 Years | 305 (61.1%) | 135 (46.6%) |
| 5 Years | 48 (64.0%) | 46 (100.0%) |
| 6 to 11 Years | 558 (75.9%) | 274 (62.6%) |
| 12 to 14 Years | 204 (82.6%) | 123 (64.1%) |
| 15 Years | 22 (100.0%) | 141 (100.0%) |
| 16 and 17 Years | 99 (54.4%) | 66 (100.0%) |
| 18 to 24 Years | 369 (100.0%) | 446 (87.8%) |
| 25 to 34 Years | 439 (95.6%) | 799 (74.8%) |
| 35 to 44 Years | 739 (87.7%) | 532 (73.8%) |
| 45 to 54 Years | 778 (100.0%) | 817 (93.2%) |
| 55 to 64 Years | 409 (92.1%) | 391 (83.4%) |
| 65 to 74 Years | 121 (87.7%) | 323 (72.6%) |
| 75 Years and over | 139 (84.8%) | 294 (83.8%) |
| Total | 4,230 (85.4%) | 4,387 (78.2%) |
Income Below Poverty Among Married-Couple Families in West Perrine
The poverty statistics for married-couple families in West Perrine show that 10.5% or 115 of the total 1,095 families live below the poverty line. Families with 3 or 4 children have the highest poverty rate of 46.7%, comprising of 71 families. On the other hand, families with 1 or 2 children have the lowest poverty rate of 0.0%, which includes 0 families.
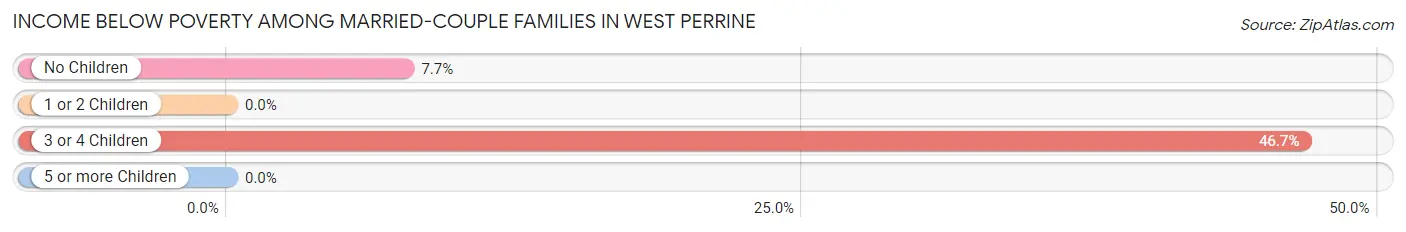
| Children | Above Poverty | Below Poverty |
| No Children | 529 (92.3%) | 44 (7.7%) |
| 1 or 2 Children | 370 (100.0%) | 0 (0.0%) |
| 3 or 4 Children | 81 (53.3%) | 71 (46.7%) |
| 5 or more Children | 0 (0.0%) | 0 (0.0%) |
| Total | 980 (89.5%) | 115 (10.5%) |
Income Below Poverty Among Single-Parent Households in West Perrine
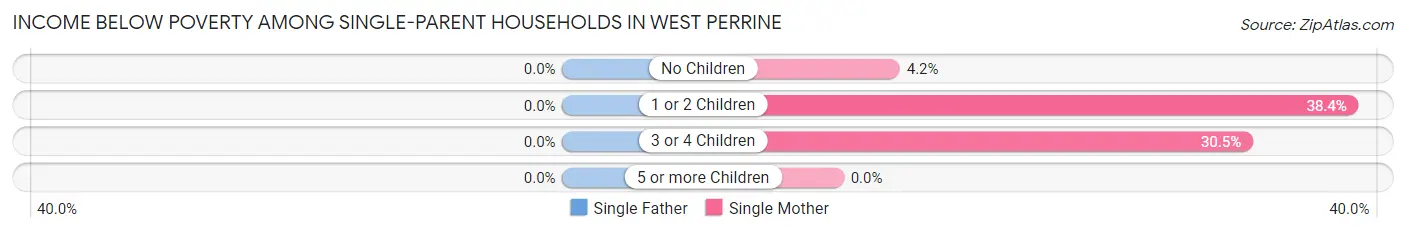
| Children | Single Father | Single Mother |
| No Children | 0 (0.0%) | 11 (4.2%) |
| 1 or 2 Children | 0 (0.0%) | 231 (38.4%) |
| 3 or 4 Children | 0 (0.0%) | 43 (30.5%) |
| 5 or more Children | 0 (0.0%) | 0 (0.0%) |
| Total | 0 (0.0%) | 285 (28.3%) |
Income Below Poverty Among Married-Couple vs Single-Parent Households in West Perrine
The poverty data for West Perrine shows that 115 of the married-couple family households (10.5%) and 285 of the single-parent households (21.9%) are living below the poverty level. Within the married-couple family households, those with 3 or 4 children have the highest poverty rate, with 71 households (46.7%) falling below the poverty line. Among the single-parent households, those with 1 or 2 children have the highest poverty rate, with 231 household (34.9%) living below poverty.
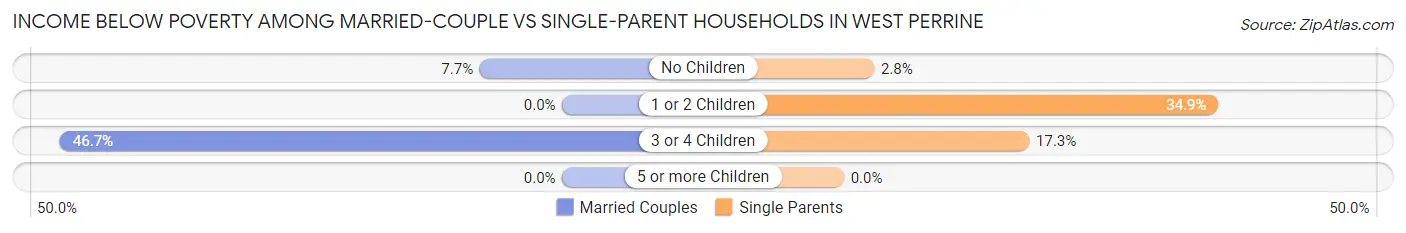
| Children | Married-Couple Families | Single-Parent Households |
| No Children | 44 (7.7%) | 11 (2.8%) |
| 1 or 2 Children | 0 (0.0%) | 231 (34.9%) |
| 3 or 4 Children | 71 (46.7%) | 43 (17.3%) |
| 5 or more Children | 0 (0.0%) | 0 (0.0%) |
| Total | 115 (10.5%) | 285 (21.9%) |
Race in West Perrine
The most populous races in West Perrine are Hispanic or Latino (6,012 | 56.7%), Black / African American (4,196 | 39.6%), and White / Caucasian (2,813 | 26.6%).
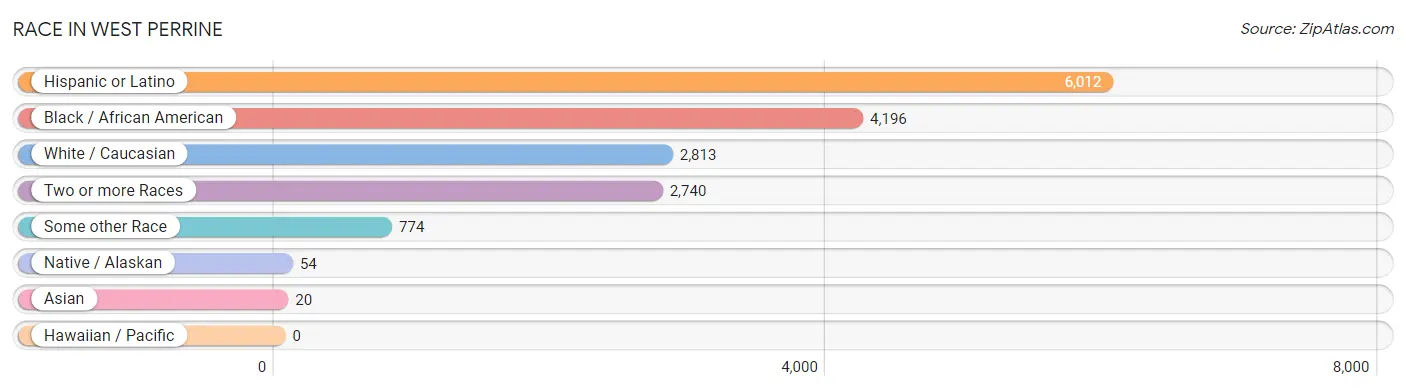
| Race | # Population | % Population |
| Asian | 20 | 0.2% |
| Black / African American | 4,196 | 39.6% |
| Hawaiian / Pacific | 0 | 0.0% |
| Hispanic or Latino | 6,012 | 56.7% |
| Native / Alaskan | 54 | 0.5% |
| White / Caucasian | 2,813 | 26.6% |
| Two or more Races | 2,740 | 25.9% |
| Some other Race | 774 | 7.3% |
| Total | 10,597 | 100.0% |
Ancestry in West Perrine
The most populous ancestries reported in West Perrine are Cuban (2,840 | 26.8%), South American (1,356 | 12.8%), Central American (1,048 | 9.9%), Nicaraguan (790 | 7.4%), and Ecuadorian (587 | 5.5%), together accounting for 62.5% of all West Perrine residents.
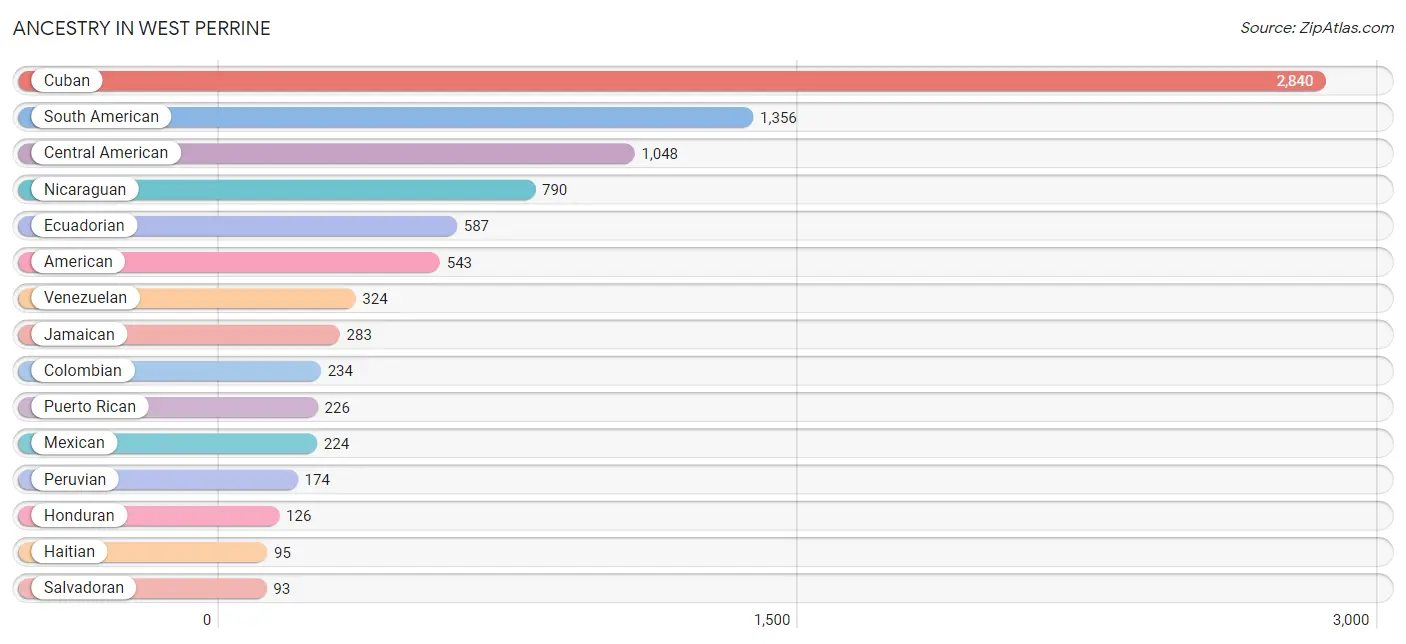
| Ancestry | # Population | % Population |
| African | 53 | 0.5% |
| American | 543 | 5.1% |
| Argentinean | 30 | 0.3% |
| Bahamian | 46 | 0.4% |
| Bhutanese | 15 | 0.1% |
| Central American | 1,048 | 9.9% |
| Cherokee | 6 | 0.1% |
| Colombian | 234 | 2.2% |
| Costa Rican | 5 | 0.1% |
| Cuban | 2,840 | 26.8% |
| Danish | 6 | 0.1% |
| Dominican | 34 | 0.3% |
| Dutch | 7 | 0.1% |
| Ecuadorian | 587 | 5.5% |
| English | 63 | 0.6% |
| European | 4 | 0.0% |
| Finnish | 8 | 0.1% |
| German | 21 | 0.2% |
| Guatemalan | 9 | 0.1% |
| Guyanese | 14 | 0.1% |
| Haitian | 95 | 0.9% |
| Honduran | 126 | 1.2% |
| Indian (Asian) | 82 | 0.8% |
| Irish | 37 | 0.4% |
| Italian | 32 | 0.3% |
| Jamaican | 283 | 2.7% |
| Mexican | 224 | 2.1% |
| Nicaraguan | 790 | 7.4% |
| Panamanian | 25 | 0.2% |
| Peruvian | 174 | 1.6% |
| Portuguese | 15 | 0.1% |
| Puerto Rican | 226 | 2.1% |
| Salvadoran | 93 | 0.9% |
| South American | 1,356 | 12.8% |
| South American Indian | 10 | 0.1% |
| Spaniard | 9 | 0.1% |
| Subsaharan African | 53 | 0.5% |
| Thai | 20 | 0.2% |
| Uruguayan | 7 | 0.1% |
| Venezuelan | 324 | 3.1% | View All 40 Rows |
Immigrants in West Perrine
The most numerous immigrant groups reported in West Perrine came from Latin America (4,039 | 38.1%), Caribbean (2,206 | 20.8%), Cuba (1,789 | 16.9%), South America (1,057 | 10.0%), and Central America (776 | 7.3%), together accounting for 93.1% of all West Perrine residents.
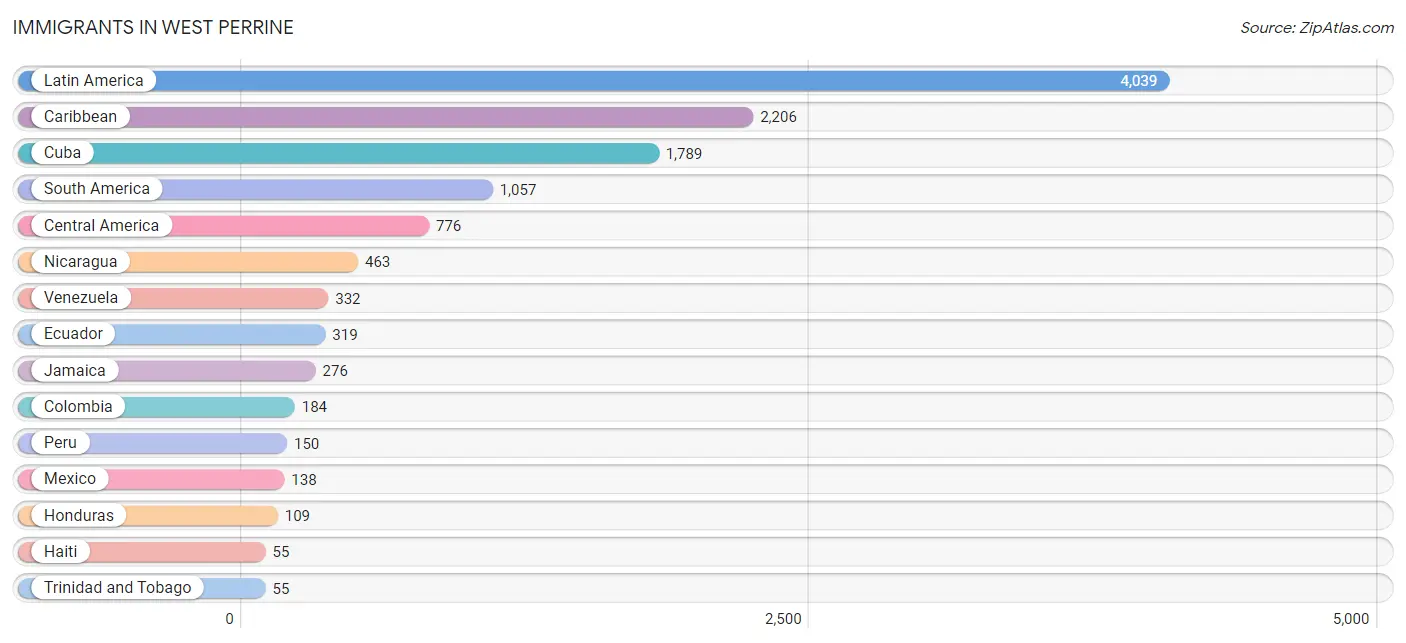
| Immigration Origin | # Population | % Population |
| Argentina | 38 | 0.4% |
| Caribbean | 2,206 | 20.8% |
| Central America | 776 | 7.3% |
| Colombia | 184 | 1.7% |
| Costa Rica | 16 | 0.2% |
| Cuba | 1,789 | 16.9% |
| Dominican Republic | 31 | 0.3% |
| Eastern Europe | 16 | 0.2% |
| Ecuador | 319 | 3.0% |
| El Salvador | 41 | 0.4% |
| England | 21 | 0.2% |
| Europe | 54 | 0.5% |
| Guatemala | 9 | 0.1% |
| Guyana | 21 | 0.2% |
| Haiti | 55 | 0.5% |
| Honduras | 109 | 1.0% |
| Jamaica | 276 | 2.6% |
| Latin America | 4,039 | 38.1% |
| Mexico | 138 | 1.3% |
| Nicaragua | 463 | 4.4% |
| Northern Europe | 29 | 0.3% |
| Peru | 150 | 1.4% |
| South America | 1,057 | 10.0% |
| Southern Europe | 9 | 0.1% |
| Spain | 9 | 0.1% |
| Trinidad and Tobago | 55 | 0.5% |
| Ukraine | 16 | 0.2% |
| Uruguay | 13 | 0.1% |
| Venezuela | 332 | 3.1% | View All 29 Rows |
Sex and Age in West Perrine
Sex and Age in West Perrine
The most populous age groups in West Perrine are 35 to 39 Years (606 | 12.2%) for men and 25 to 29 Years (547 | 9.7%) for women.
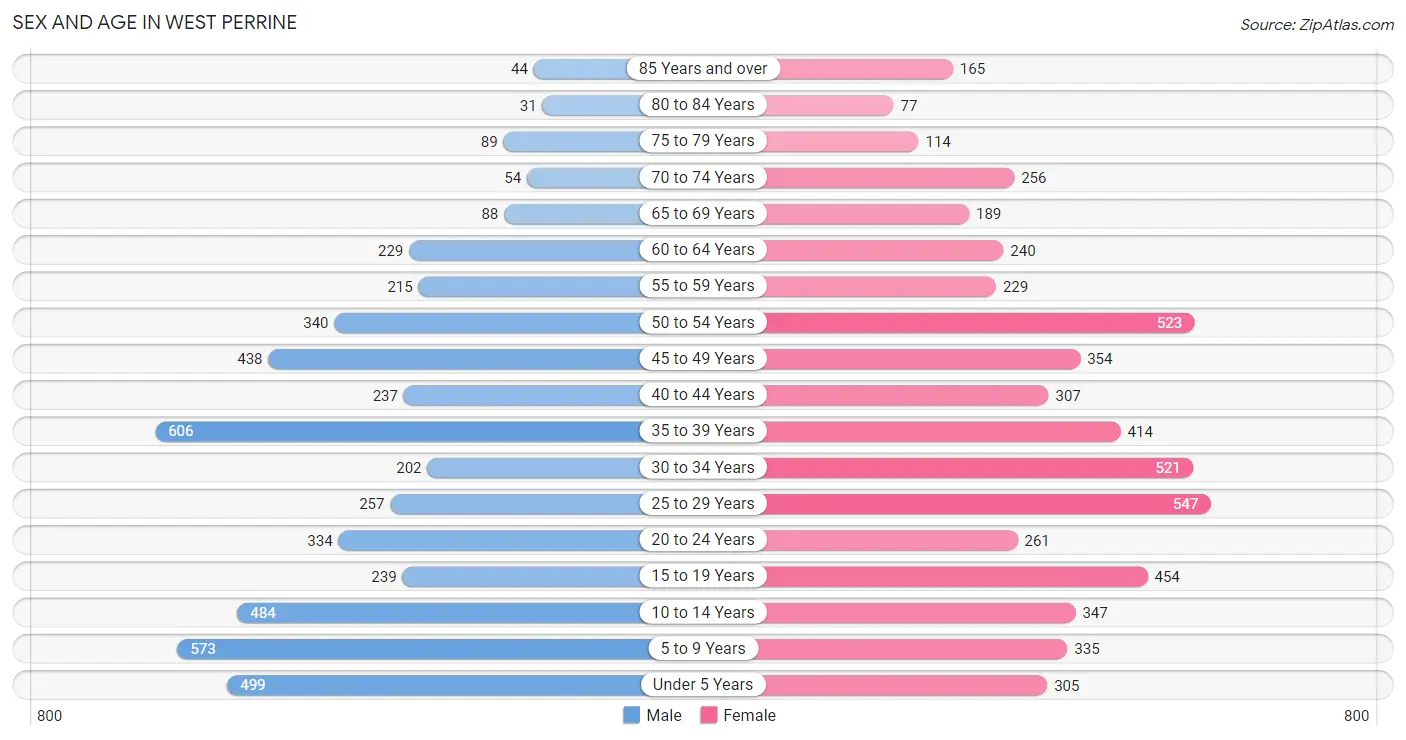
| Age Bracket | Male | Female |
| Under 5 Years | 499 (10.1%) | 305 (5.4%) |
| 5 to 9 Years | 573 (11.6%) | 335 (5.9%) |
| 10 to 14 Years | 484 (9.8%) | 347 (6.1%) |
| 15 to 19 Years | 239 (4.8%) | 454 (8.1%) |
| 20 to 24 Years | 334 (6.7%) | 261 (4.6%) |
| 25 to 29 Years | 257 (5.2%) | 547 (9.7%) |
| 30 to 34 Years | 202 (4.1%) | 521 (9.2%) |
| 35 to 39 Years | 606 (12.2%) | 414 (7.3%) |
| 40 to 44 Years | 237 (4.8%) | 307 (5.4%) |
| 45 to 49 Years | 438 (8.8%) | 354 (6.3%) |
| 50 to 54 Years | 340 (6.9%) | 523 (9.3%) |
| 55 to 59 Years | 215 (4.3%) | 229 (4.1%) |
| 60 to 64 Years | 229 (4.6%) | 240 (4.3%) |
| 65 to 69 Years | 88 (1.8%) | 189 (3.4%) |
| 70 to 74 Years | 54 (1.1%) | 256 (4.5%) |
| 75 to 79 Years | 89 (1.8%) | 114 (2.0%) |
| 80 to 84 Years | 31 (0.6%) | 77 (1.4%) |
| 85 Years and over | 44 (0.9%) | 165 (2.9%) |
| Total | 4,959 (100.0%) | 5,638 (100.0%) |
Families and Households in West Perrine
Median Family Size in West Perrine
The median family size in West Perrine is 3.90 persons per family, with married-couple families (1,095 | 45.7%) accounting for the largest median family size of 4.16 persons per family. On the other hand, single female/mother families (1,006 | 42.0%) represent the smallest median family size with 3.59 persons per family.
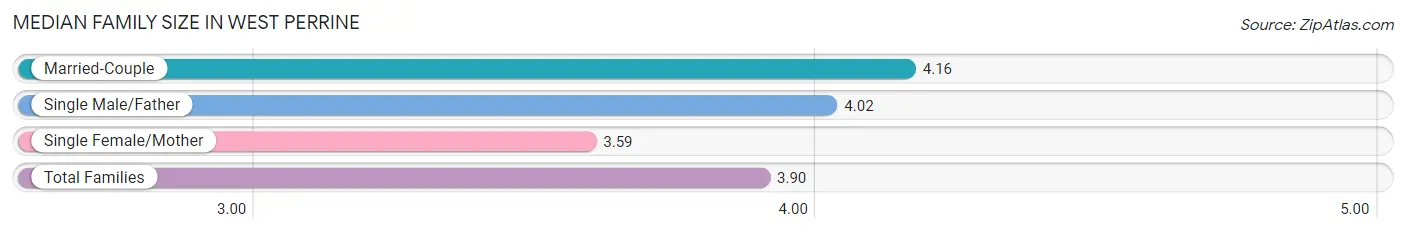
| Family Type | # Families | Family Size |
| Married-Couple | 1,095 (45.7%) | 4.16 |
| Single Male/Father | 295 (12.3%) | 4.02 |
| Single Female/Mother | 1,006 (42.0%) | 3.59 |
| Total Families | 2,396 (100.0%) | 3.90 |
Median Household Size in West Perrine
The median household size in West Perrine is 3.42 persons per household, with single male/father households (295 | 9.6%) accounting for the largest median household size of 4.66 persons per household. non-family households (693 | 22.4%) represent the smallest median household size with 1.11 persons per household.
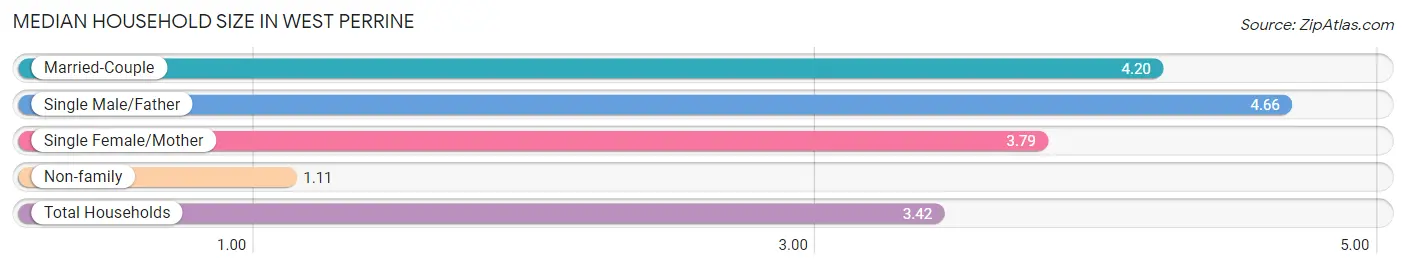
| Household Type | # Households | Household Size |
| Married-Couple | 1,095 (35.4%) | 4.20 |
| Single Male/Father | 295 (9.6%) | 4.66 |
| Single Female/Mother | 1,006 (32.6%) | 3.79 |
| Non-family | 693 (22.4%) | 1.11 |
| Total Households | 3,089 (100.0%) | 3.42 |
Household Size by Marriage Status in West Perrine
Out of a total of 3,089 households in West Perrine, 2,396 (77.6%) are family households, while 693 (22.4%) are nonfamily households. The most numerous type of family households are 3-person households, comprising 705, and the most common type of nonfamily households are 1-person households, comprising 669.
| Household Size | Family Households | Nonfamily Households |
| 1-Person Households | - | 669 (21.7%) |
| 2-Person Households | 507 (16.4%) | 5 (0.2%) |
| 3-Person Households | 705 (22.8%) | 0 (0.0%) |
| 4-Person Households | 555 (18.0%) | 13 (0.4%) |
| 5-Person Households | 376 (12.2%) | 6 (0.2%) |
| 6-Person Households | 99 (3.2%) | 0 (0.0%) |
| 7+ Person Households | 154 (5.0%) | 0 (0.0%) |
| Total | 2,396 (77.6%) | 693 (22.4%) |
Female Fertility in West Perrine
Fertility by Age in West Perrine
Average fertility rate in West Perrine is 12.0 births per 1,000 women. Women in the age bracket of 35 to 50 years have the highest fertility rate with 27.0 births per 1,000 women. Women in the age bracket of 35 to 50 years acount for 100.0% of all women with births.
| Age Bracket | Women with Births | Births / 1,000 Women |
| 15 to 19 years | 0 (0.0%) | 0.0 |
| 20 to 34 years | 0 (0.0%) | 0.0 |
| 35 to 50 years | 37 (100.0%) | 27.0 |
| Total | 37 (100.0%) | 12.0 |
Fertility by Age by Marriage Status in West Perrine
21.6% of women with births (37) in West Perrine are married. The highest percentage of unmarried women with births falls into 35 to 50 years age bracket with 78.4% of them unmarried at the time of birth, while the lowest percentage of unmarried women with births belong to 35 to 50 years age bracket with 78.4% of them unmarried.
| Age Bracket | Married | Unmarried |
| 15 to 19 years | 0 (0.0%) | 0 (0.0%) |
| 20 to 34 years | 0 (0.0%) | 0 (0.0%) |
| 35 to 50 years | 8 (21.6%) | 29 (78.4%) |
| Total | 8 (21.6%) | 29 (78.4%) |
Fertility by Education in West Perrine
| Educational Attainment | Women with Births | Births / 1,000 Women |
| Less than High School | 0 (0.0%) | 0.0 |
| High School Diploma | 0 (0.0%) | 0.0 |
| College or Associate's Degree | 29 (78.4%) | 33.0 |
| Bachelor's Degree | 0 (0.0%) | 0.0 |
| Graduate Degree | 8 (21.6%) | 30.0 |
| Total | 37 (100.0%) | 12.0 |
Fertility by Education by Marriage Status in West Perrine
78.4% of women with births in West Perrine are unmarried. Women with the educational attainment of graduate degree are most likely to be married with 100.0% of them married at childbirth, while women with the educational attainment of college or associate's degree are least likely to be married with 100.0% of them unmarried at childbirth.
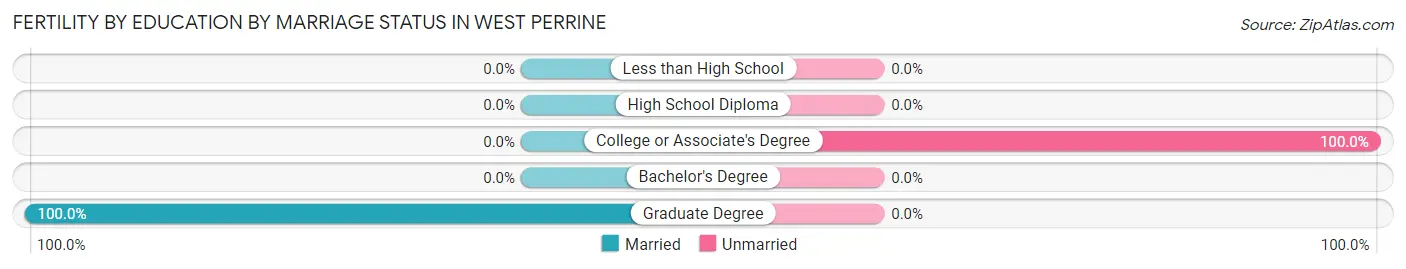
| Educational Attainment | Married | Unmarried |
| Less than High School | 0 (0.0%) | 0 (0.0%) |
| High School Diploma | 0 (0.0%) | 0 (0.0%) |
| College or Associate's Degree | 0 (0.0%) | 29 (100.0%) |
| Bachelor's Degree | 0 (0.0%) | 0 (0.0%) |
| Graduate Degree | 8 (100.0%) | 0 (0.0%) |
| Total | 8 (21.6%) | 29 (78.4%) |
Employment Characteristics in West Perrine
Employment by Class of Employer in West Perrine
Among the 4,468 employed individuals in West Perrine, private company employees (2,976 | 66.6%), self-employed (not incorporated) (535 | 12.0%), and not-for-profit organizations (315 | 7.0%) make up the most common classes of employment.
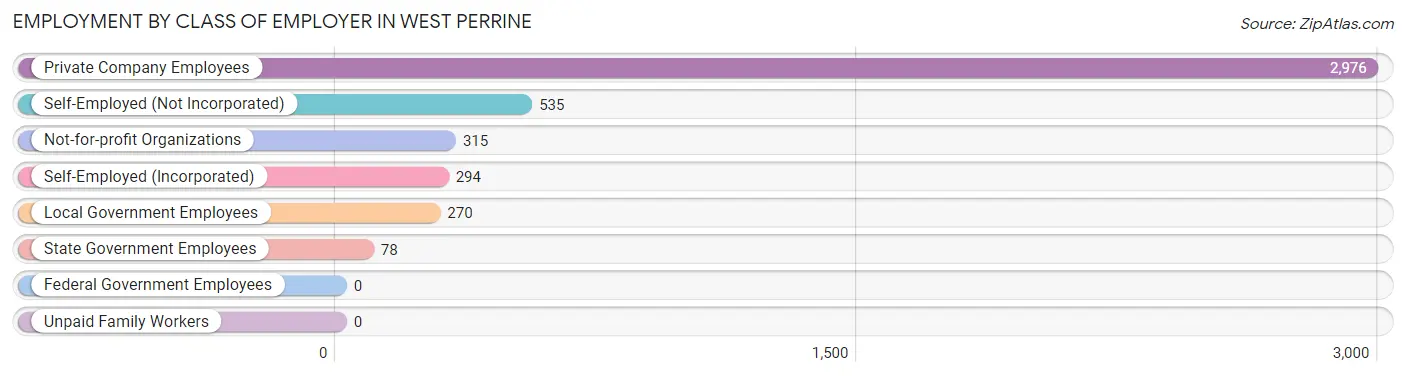
| Employer Class | # Employees | % Employees |
| Private Company Employees | 2,976 | 66.6% |
| Self-Employed (Incorporated) | 294 | 6.6% |
| Self-Employed (Not Incorporated) | 535 | 12.0% |
| Not-for-profit Organizations | 315 | 7.0% |
| Local Government Employees | 270 | 6.0% |
| State Government Employees | 78 | 1.8% |
| Federal Government Employees | 0 | 0.0% |
| Unpaid Family Workers | 0 | 0.0% |
| Total | 4,468 | 100.0% |
Employment Status by Age in West Perrine
According to the labor force statistics for West Perrine, out of the total population over 16 years of age (7,891), 63.7% or 5,027 individuals are in the labor force, with 8.0% or 402 of them unemployed. The age group with the highest labor force participation rate is 25 to 29 years, with 87.1% or 700 individuals in the labor force. Within the labor force, the 30 to 34 years age range has the highest percentage of unemployed individuals, with 22.3% or 118 of them being unemployed.
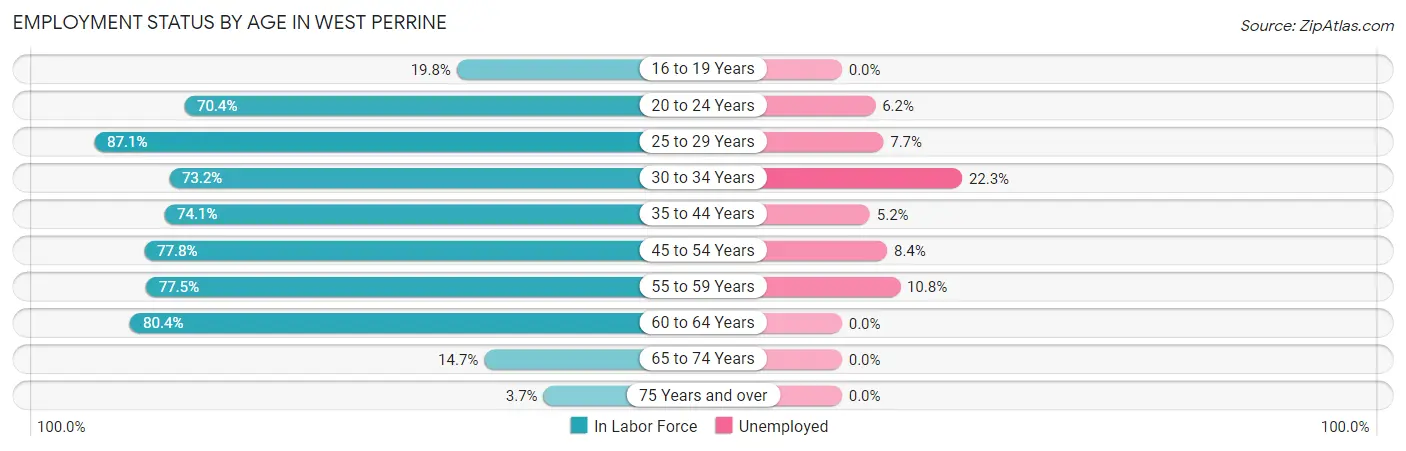
| Age Bracket | In Labor Force | Unemployed |
| 16 to 19 Years | 105 (19.8%) | 0 (0.0%) |
| 20 to 24 Years | 419 (70.4%) | 26 (6.2%) |
| 25 to 29 Years | 700 (87.1%) | 54 (7.7%) |
| 30 to 34 Years | 529 (73.2%) | 118 (22.3%) |
| 35 to 44 Years | 1,159 (74.1%) | 60 (5.2%) |
| 45 to 54 Years | 1,288 (77.8%) | 108 (8.4%) |
| 55 to 59 Years | 344 (77.5%) | 37 (10.8%) |
| 60 to 64 Years | 377 (80.4%) | 0 (0.0%) |
| 65 to 74 Years | 86 (14.7%) | 0 (0.0%) |
| 75 Years and over | 19 (3.7%) | 0 (0.0%) |
| Total | 5,027 (63.7%) | 402 (8.0%) |
Employment Status by Educational Attainment in West Perrine
According to labor force statistics for West Perrine, 77.7% of individuals (4,397) out of the total population between 25 and 64 years of age (5,659) are in the labor force, with 8.6% or 378 of them being unemployed. The group with the highest labor force participation rate are those with the educational attainment of bachelor's degree or higher, with 88.0% or 917 individuals in the labor force. Within the labor force, individuals with high school diploma education have the highest percentage of unemployment, with 17.5% or 307 of them being unemployed.
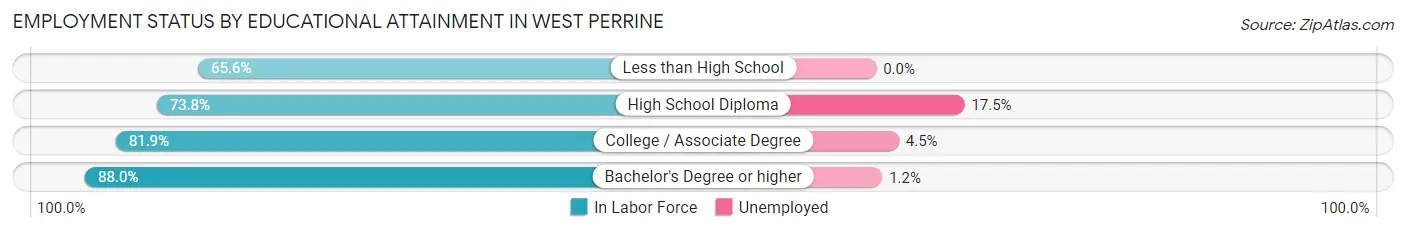
| Educational Attainment | In Labor Force | Unemployed |
| Less than High School | 444 (65.6%) | 0 (0.0%) |
| High School Diploma | 1,756 (73.8%) | 416 (17.5%) |
| College / Associate Degree | 1,278 (81.9%) | 70 (4.5%) |
| Bachelor's Degree or higher | 917 (88.0%) | 13 (1.2%) |
| Total | 4,397 (77.7%) | 487 (8.6%) |
Employment Occupations by Sex in West Perrine
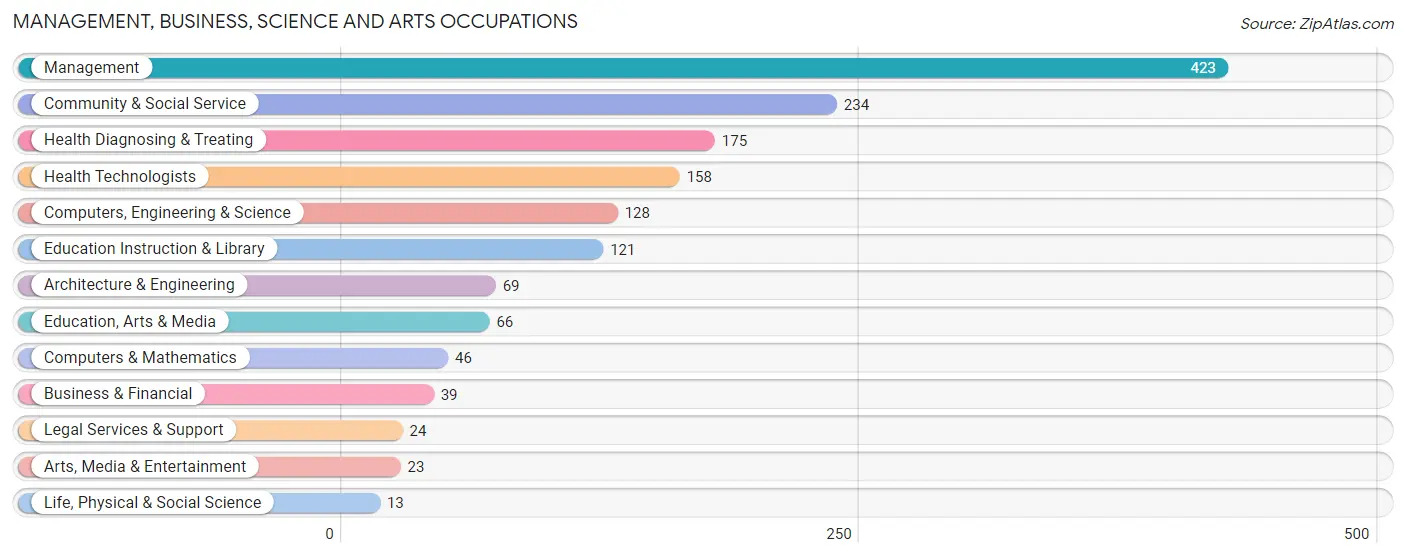
Management, Business, Science and Arts Occupations
The most common Management, Business, Science and Arts occupations in West Perrine are Management (423 | 9.1%), Community & Social Service (234 | 5.1%), Health Diagnosing & Treating (175 | 3.8%), Health Technologists (158 | 3.4%), and Computers, Engineering & Science (128 | 2.8%).
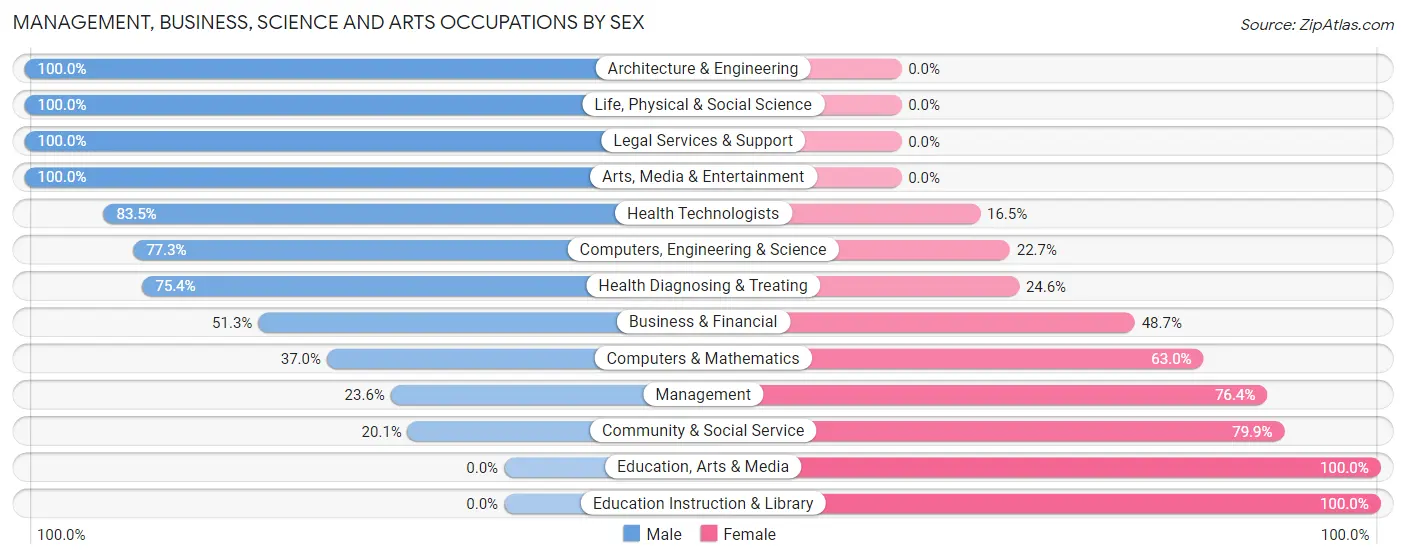
Management, Business, Science and Arts Occupations by Sex
Within the Management, Business, Science and Arts occupations in West Perrine, the most male-oriented occupations are Architecture & Engineering (100.0%), Life, Physical & Social Science (100.0%), and Legal Services & Support (100.0%), while the most female-oriented occupations are Education, Arts & Media (100.0%), Education Instruction & Library (100.0%), and Community & Social Service (79.9%).
| Occupation | Male | Female |
| Management | 100 (23.6%) | 323 (76.4%) |
| Business & Financial | 20 (51.3%) | 19 (48.7%) |
| Computers, Engineering & Science | 99 (77.3%) | 29 (22.7%) |
| Computers & Mathematics | 17 (37.0%) | 29 (63.0%) |
| Architecture & Engineering | 69 (100.0%) | 0 (0.0%) |
| Life, Physical & Social Science | 13 (100.0%) | 0 (0.0%) |
| Community & Social Service | 47 (20.1%) | 187 (79.9%) |
| Education, Arts & Media | 0 (0.0%) | 66 (100.0%) |
| Legal Services & Support | 24 (100.0%) | 0 (0.0%) |
| Education Instruction & Library | 0 (0.0%) | 121 (100.0%) |
| Arts, Media & Entertainment | 23 (100.0%) | 0 (0.0%) |
| Health Diagnosing & Treating | 132 (75.4%) | 43 (24.6%) |
| Health Technologists | 132 (83.5%) | 26 (16.5%) |
| Total (Category) | 398 (39.8%) | 601 (60.2%) |
| Total (Overall) | 2,174 (47.0%) | 2,448 (53.0%) |
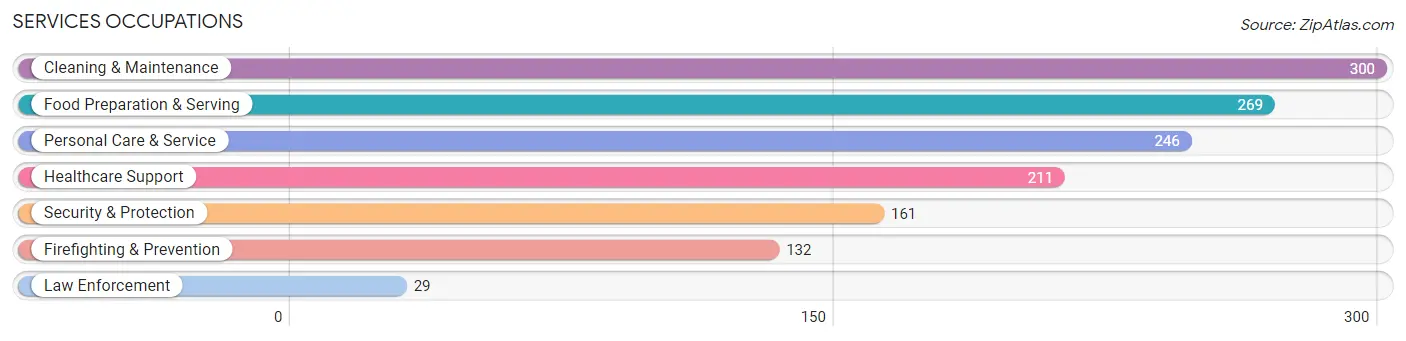
Services Occupations
The most common Services occupations in West Perrine are Cleaning & Maintenance (300 | 6.5%), Food Preparation & Serving (269 | 5.8%), Personal Care & Service (246 | 5.3%), Healthcare Support (211 | 4.6%), and Security & Protection (161 | 3.5%).
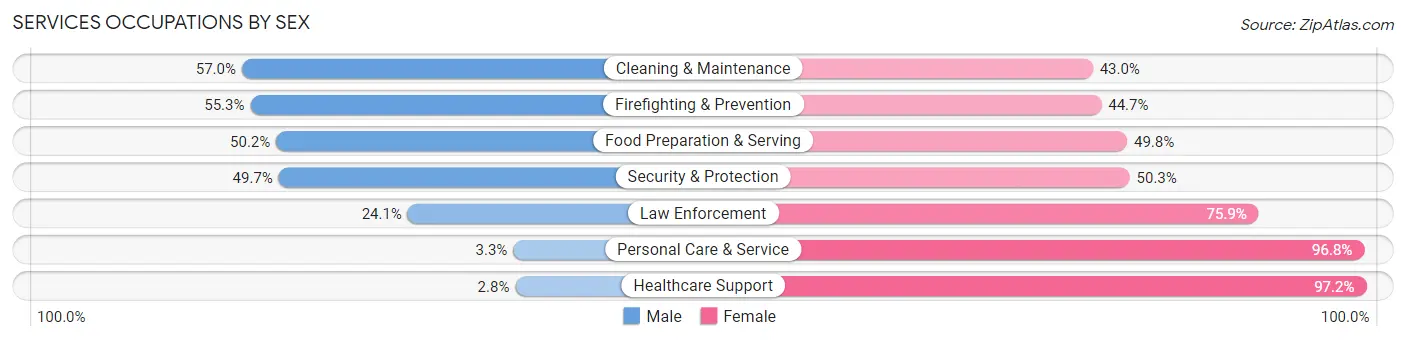
Services Occupations by Sex
Within the Services occupations in West Perrine, the most male-oriented occupations are Cleaning & Maintenance (57.0%), Firefighting & Prevention (55.3%), and Food Preparation & Serving (50.2%), while the most female-oriented occupations are Healthcare Support (97.2%), Personal Care & Service (96.8%), and Law Enforcement (75.9%).
| Occupation | Male | Female |
| Healthcare Support | 6 (2.8%) | 205 (97.2%) |
| Security & Protection | 80 (49.7%) | 81 (50.3%) |
| Firefighting & Prevention | 73 (55.3%) | 59 (44.7%) |
| Law Enforcement | 7 (24.1%) | 22 (75.9%) |
| Food Preparation & Serving | 135 (50.2%) | 134 (49.8%) |
| Cleaning & Maintenance | 171 (57.0%) | 129 (43.0%) |
| Personal Care & Service | 8 (3.3%) | 238 (96.8%) |
| Total (Category) | 400 (33.7%) | 787 (66.3%) |
| Total (Overall) | 2,174 (47.0%) | 2,448 (53.0%) |
Sales and Office Occupations
The most common Sales and Office occupations in West Perrine are Office & Administration (670 | 14.5%), and Sales & Related (548 | 11.9%).

Sales and Office Occupations by Sex
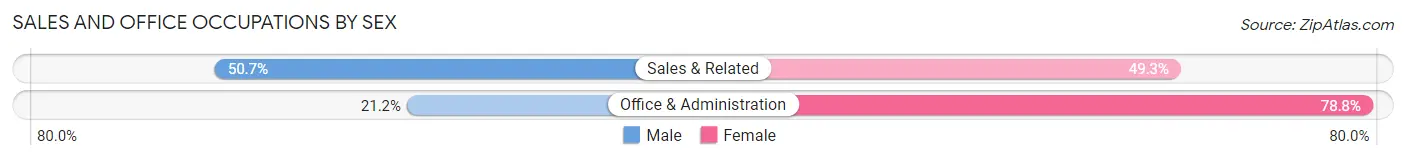
| Occupation | Male | Female |
| Sales & Related | 278 (50.7%) | 270 (49.3%) |
| Office & Administration | 142 (21.2%) | 528 (78.8%) |
| Total (Category) | 420 (34.5%) | 798 (65.5%) |
| Total (Overall) | 2,174 (47.0%) | 2,448 (53.0%) |
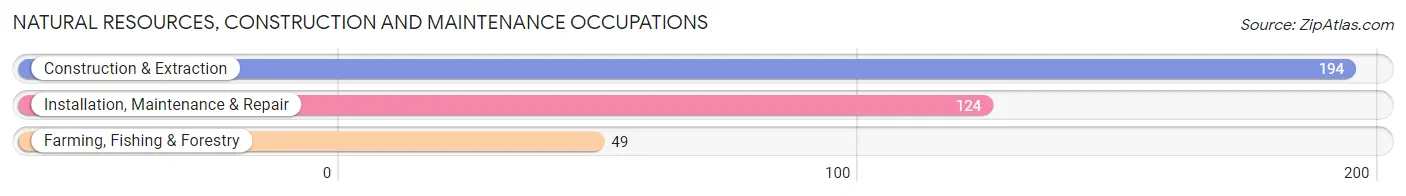
Natural Resources, Construction and Maintenance Occupations
The most common Natural Resources, Construction and Maintenance occupations in West Perrine are Construction & Extraction (194 | 4.2%), Installation, Maintenance & Repair (124 | 2.7%), and Farming, Fishing & Forestry (49 | 1.1%).
Natural Resources, Construction and Maintenance Occupations by Sex
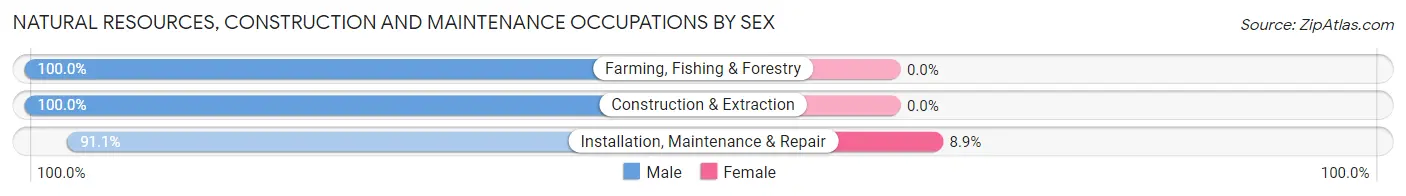
| Occupation | Male | Female |
| Farming, Fishing & Forestry | 49 (100.0%) | 0 (0.0%) |
| Construction & Extraction | 194 (100.0%) | 0 (0.0%) |
| Installation, Maintenance & Repair | 113 (91.1%) | 11 (8.9%) |
| Total (Category) | 356 (97.0%) | 11 (3.0%) |
| Total (Overall) | 2,174 (47.0%) | 2,448 (53.0%) |
Production, Transportation and Moving Occupations
The most common Production, Transportation and Moving occupations in West Perrine are Transportation (558 | 12.1%), Production (198 | 4.3%), and Material Moving (95 | 2.1%).
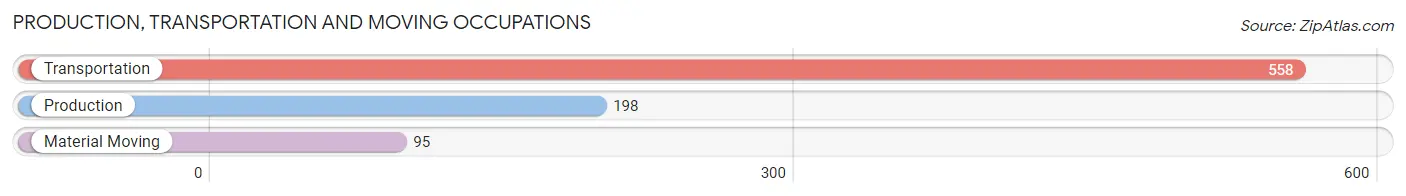
Production, Transportation and Moving Occupations by Sex
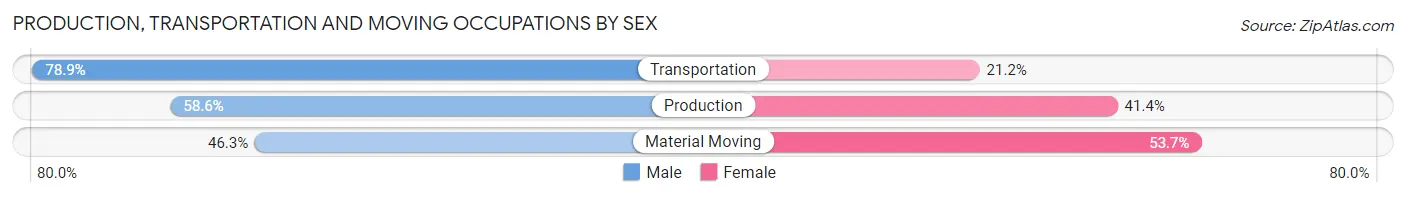
| Occupation | Male | Female |
| Production | 116 (58.6%) | 82 (41.4%) |
| Transportation | 440 (78.8%) | 118 (21.1%) |
| Material Moving | 44 (46.3%) | 51 (53.7%) |
| Total (Category) | 600 (70.5%) | 251 (29.5%) |
| Total (Overall) | 2,174 (47.0%) | 2,448 (53.0%) |
Employment Industries by Sex in West Perrine
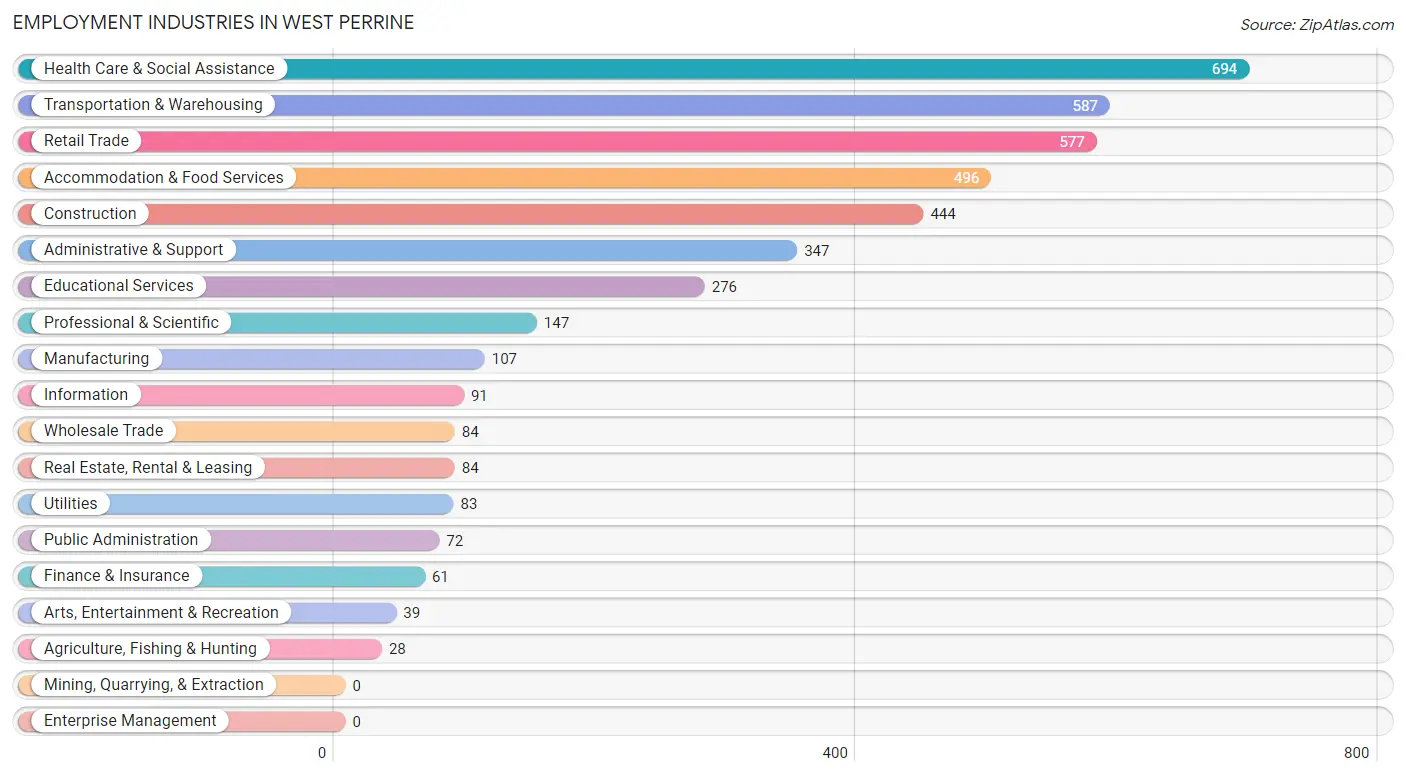
Employment Industries in West Perrine
The major employment industries in West Perrine include Health Care & Social Assistance (694 | 15.0%), Transportation & Warehousing (587 | 12.7%), Retail Trade (577 | 12.5%), Accommodation & Food Services (496 | 10.7%), and Construction (444 | 9.6%).
Employment Industries by Sex in West Perrine
The West Perrine industries that see more men than women are Agriculture, Fishing & Hunting (100.0%), Wholesale Trade (100.0%), and Transportation & Warehousing (77.2%), whereas the industries that tend to have a higher number of women are Utilities (85.5%), Arts, Entertainment & Recreation (79.5%), and Educational Services (77.9%).
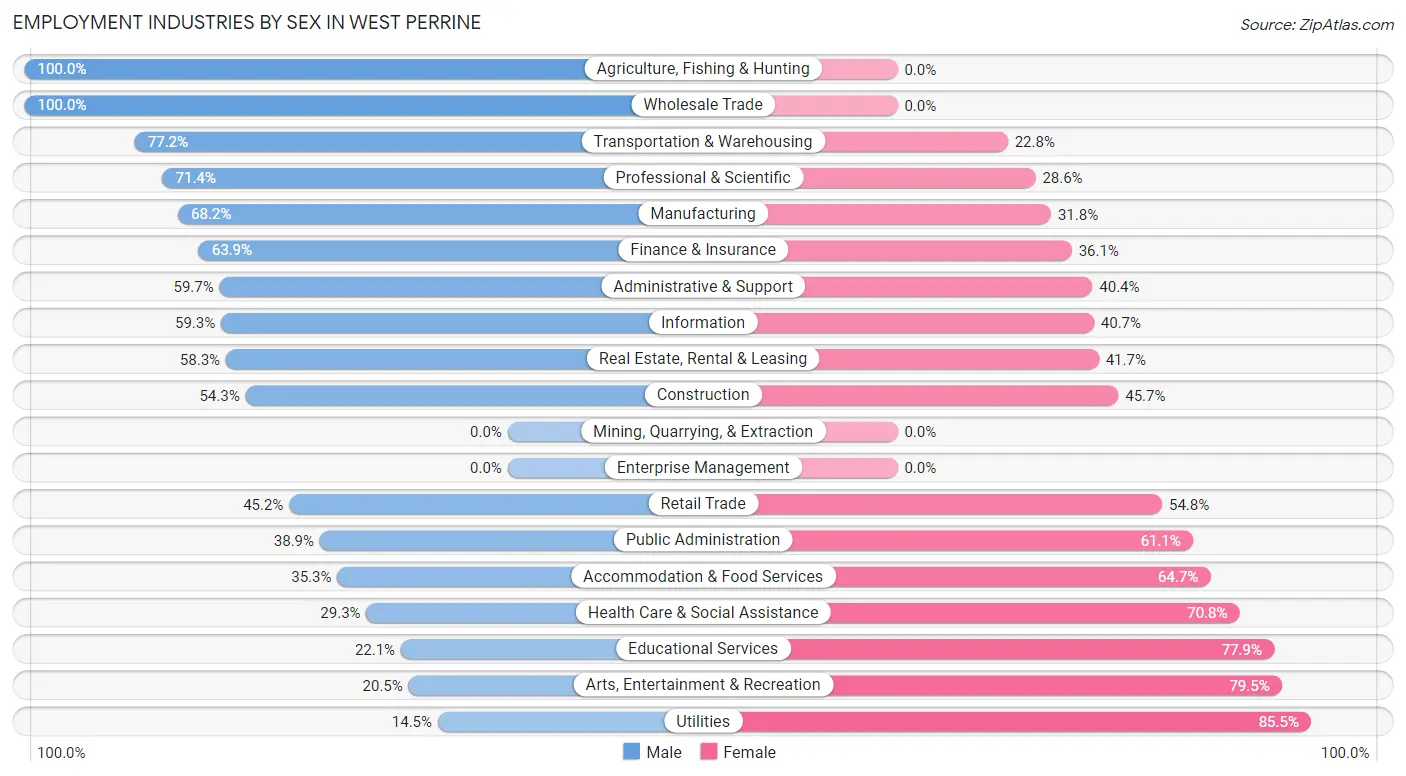
| Industry | Male | Female |
| Agriculture, Fishing & Hunting | 28 (100.0%) | 0 (0.0%) |
| Mining, Quarrying, & Extraction | 0 (0.0%) | 0 (0.0%) |
| Construction | 241 (54.3%) | 203 (45.7%) |
| Manufacturing | 73 (68.2%) | 34 (31.8%) |
| Wholesale Trade | 84 (100.0%) | 0 (0.0%) |
| Retail Trade | 261 (45.2%) | 316 (54.8%) |
| Transportation & Warehousing | 453 (77.2%) | 134 (22.8%) |
| Utilities | 12 (14.5%) | 71 (85.5%) |
| Information | 54 (59.3%) | 37 (40.7%) |
| Finance & Insurance | 39 (63.9%) | 22 (36.1%) |
| Real Estate, Rental & Leasing | 49 (58.3%) | 35 (41.7%) |
| Professional & Scientific | 105 (71.4%) | 42 (28.6%) |
| Enterprise Management | 0 (0.0%) | 0 (0.0%) |
| Administrative & Support | 207 (59.7%) | 140 (40.4%) |
| Educational Services | 61 (22.1%) | 215 (77.9%) |
| Health Care & Social Assistance | 203 (29.2%) | 491 (70.8%) |
| Arts, Entertainment & Recreation | 8 (20.5%) | 31 (79.5%) |
| Accommodation & Food Services | 175 (35.3%) | 321 (64.7%) |
| Public Administration | 28 (38.9%) | 44 (61.1%) |
| Total | 2,174 (47.0%) | 2,448 (53.0%) |
Education in West Perrine
School Enrollment in West Perrine
The most common levels of schooling among the 3,121 students in West Perrine are elementary school (817 | 26.2%), middle school (696 | 22.3%), and college / undergraduate (615 | 19.7%).
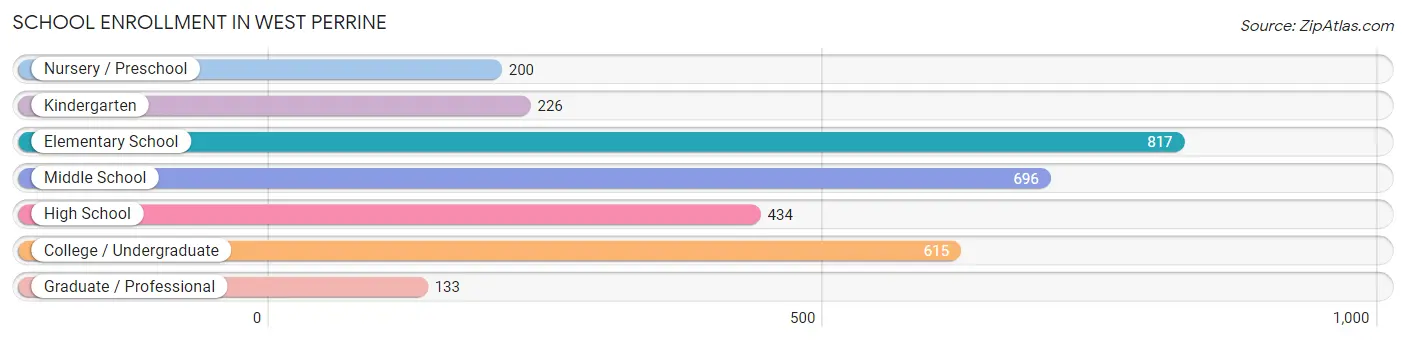
| School Level | # Students | % Students |
| Nursery / Preschool | 200 | 6.4% |
| Kindergarten | 226 | 7.2% |
| Elementary School | 817 | 26.2% |
| Middle School | 696 | 22.3% |
| High School | 434 | 13.9% |
| College / Undergraduate | 615 | 19.7% |
| Graduate / Professional | 133 | 4.3% |
| Total | 3,121 | 100.0% |
School Enrollment by Age by Funding Source in West Perrine
Out of a total of 3,121 students who are enrolled in schools in West Perrine, 774 (24.8%) attend a private institution, while the remaining 2,347 (75.2%) are enrolled in public schools. The age group of 35 years and over has the highest likelihood of being enrolled in private schools, with 75 (100.0% in the age bracket) enrolled. Conversely, the age group of 15 to 17 year olds has the lowest likelihood of being enrolled in a private school, with 369 (100.0% in the age bracket) attending a public institution.
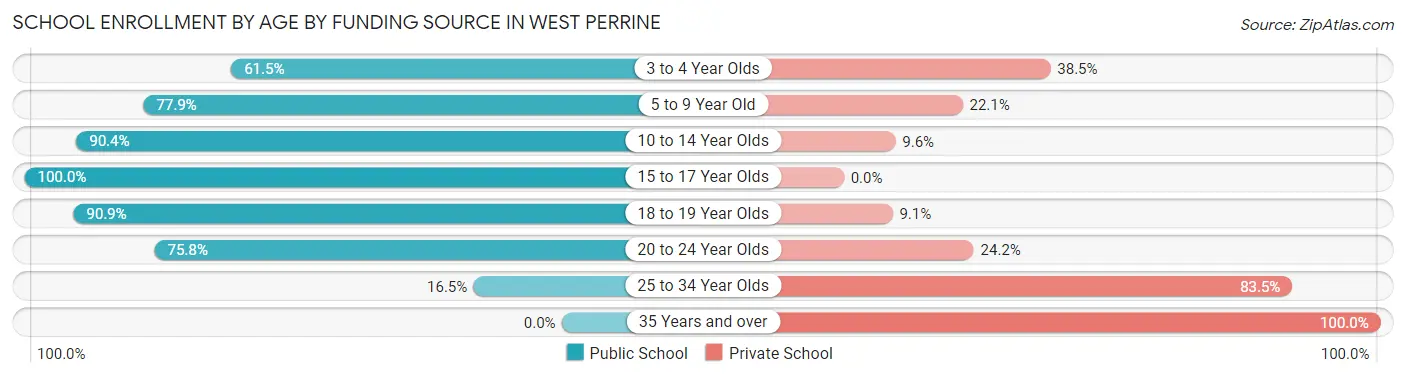
| Age Bracket | Public School | Private School |
| 3 to 4 Year Olds | 123 (61.5%) | 77 (38.5%) |
| 5 to 9 Year Old | 707 (77.9%) | 201 (22.1%) |
| 10 to 14 Year Olds | 751 (90.4%) | 80 (9.6%) |
| 15 to 17 Year Olds | 369 (100.0%) | 0 (0.0%) |
| 18 to 19 Year Olds | 200 (90.9%) | 20 (9.1%) |
| 20 to 24 Year Olds | 144 (75.8%) | 46 (24.2%) |
| 25 to 34 Year Olds | 54 (16.5%) | 274 (83.5%) |
| 35 Years and over | 0 (0.0%) | 75 (100.0%) |
| Total | 2,347 (75.2%) | 774 (24.8%) |
Educational Attainment by Field of Study in West Perrine
Business (272 | 22.2%), engineering (185 | 15.1%), arts & humanities (154 | 12.5%), science & technology (123 | 10.0%), and education (100 | 8.1%) are the most common fields of study among 1,228 individuals in West Perrine who have obtained a bachelor's degree or higher.
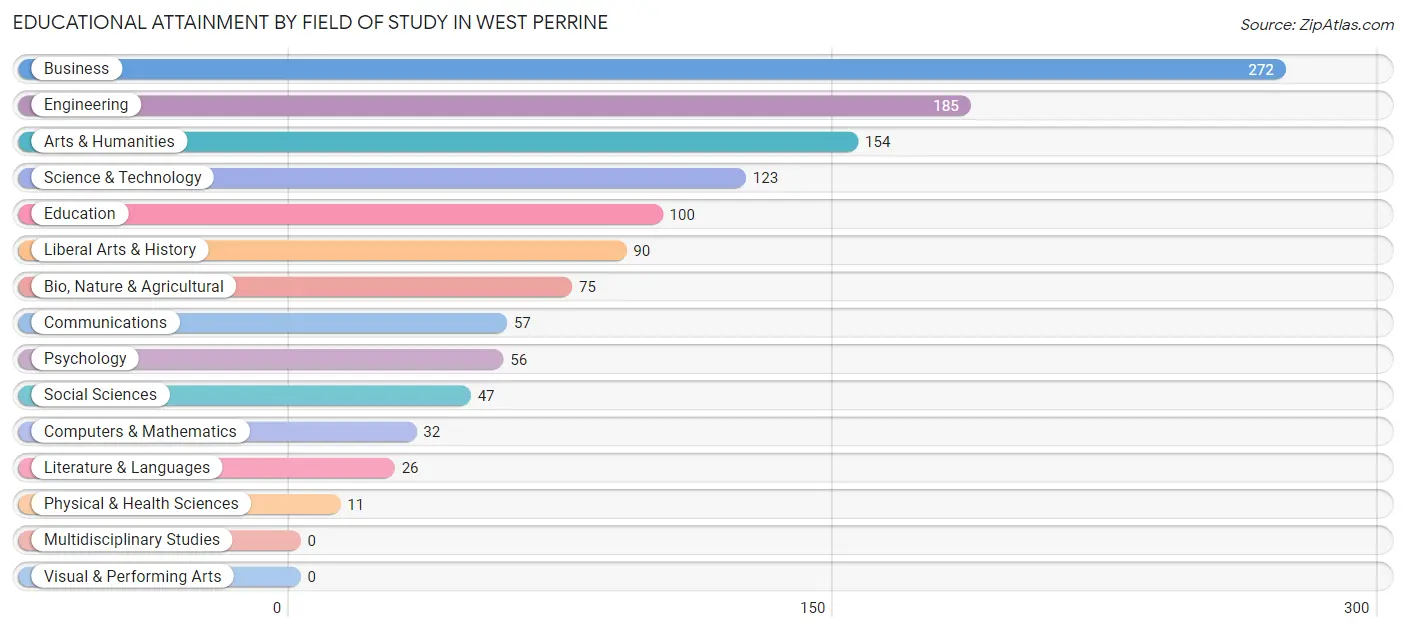
| Field of Study | # Graduates | % Graduates |
| Computers & Mathematics | 32 | 2.6% |
| Bio, Nature & Agricultural | 75 | 6.1% |
| Physical & Health Sciences | 11 | 0.9% |
| Psychology | 56 | 4.6% |
| Social Sciences | 47 | 3.8% |
| Engineering | 185 | 15.1% |
| Multidisciplinary Studies | 0 | 0.0% |
| Science & Technology | 123 | 10.0% |
| Business | 272 | 22.2% |
| Education | 100 | 8.1% |
| Literature & Languages | 26 | 2.1% |
| Liberal Arts & History | 90 | 7.3% |
| Visual & Performing Arts | 0 | 0.0% |
| Communications | 57 | 4.6% |
| Arts & Humanities | 154 | 12.5% |
| Total | 1,228 | 100.0% |
Transportation & Commute in West Perrine
Vehicle Availability by Sex in West Perrine
The most prevalent vehicle ownership categories in West Perrine are males with 2 vehicles (1,009, accounting for 47.4%) and females with 2 vehicles (884, making up 43.3%).
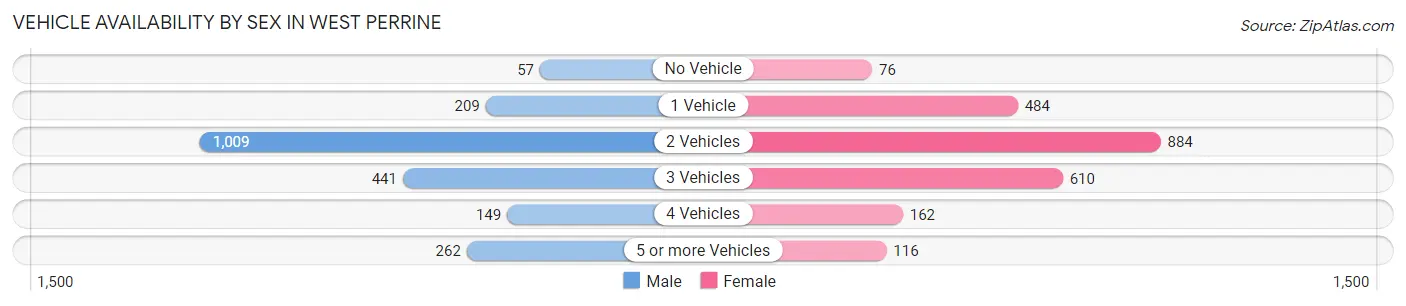
| Vehicles Available | Male | Female |
| No Vehicle | 57 (2.7%) | 76 (3.3%) |
| 1 Vehicle | 209 (9.8%) | 484 (20.7%) |
| 2 Vehicles | 1,009 (47.4%) | 884 (37.9%) |
| 3 Vehicles | 441 (20.7%) | 610 (26.2%) |
| 4 Vehicles | 149 (7.0%) | 162 (7.0%) |
| 5 or more Vehicles | 262 (12.3%) | 116 (5.0%) |
| Total | 2,127 (100.0%) | 2,332 (100.0%) |
Commute Time in West Perrine
The most frequently occuring commute durations in West Perrine are 30 to 34 minutes (725 commuters, 16.5%), 20 to 24 minutes (640 commuters, 14.5%), and 10 to 14 minutes (557 commuters, 12.7%).
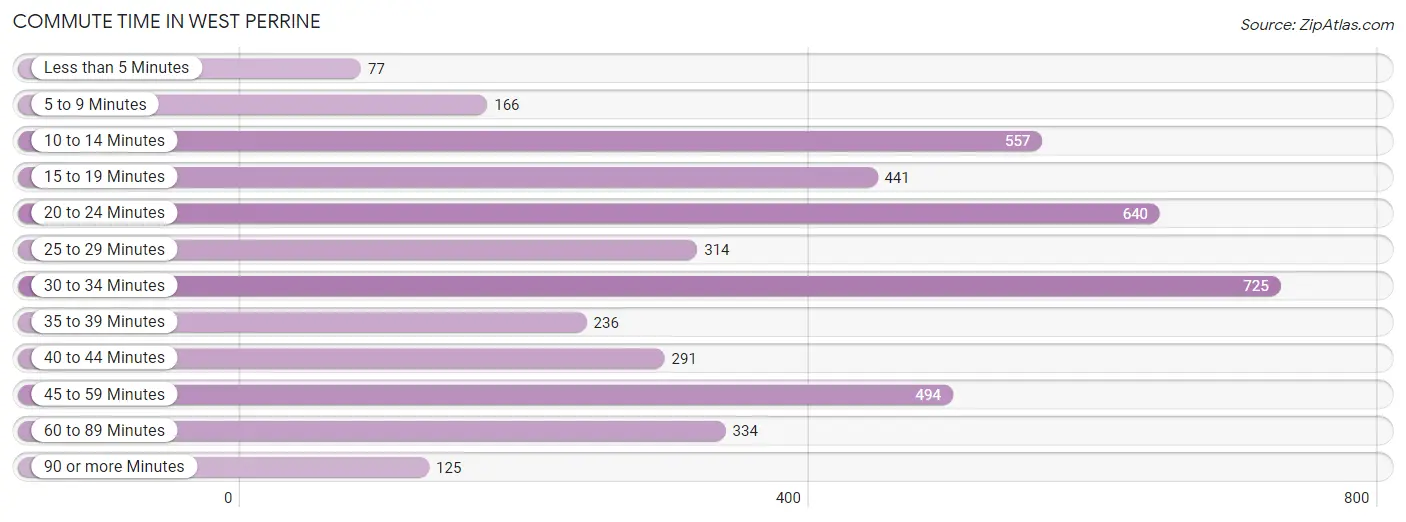
| Commute Time | # Commuters | % Commuters |
| Less than 5 Minutes | 77 | 1.8% |
| 5 to 9 Minutes | 166 | 3.8% |
| 10 to 14 Minutes | 557 | 12.7% |
| 15 to 19 Minutes | 441 | 10.0% |
| 20 to 24 Minutes | 640 | 14.5% |
| 25 to 29 Minutes | 314 | 7.1% |
| 30 to 34 Minutes | 725 | 16.5% |
| 35 to 39 Minutes | 236 | 5.4% |
| 40 to 44 Minutes | 291 | 6.6% |
| 45 to 59 Minutes | 494 | 11.2% |
| 60 to 89 Minutes | 334 | 7.6% |
| 90 or more Minutes | 125 | 2.8% |
Commute Time by Sex in West Perrine
The most common commute times in West Perrine are 30 to 34 minutes (381 commuters, 18.1%) for males and 10 to 14 minutes (466 commuters, 20.3%) for females.
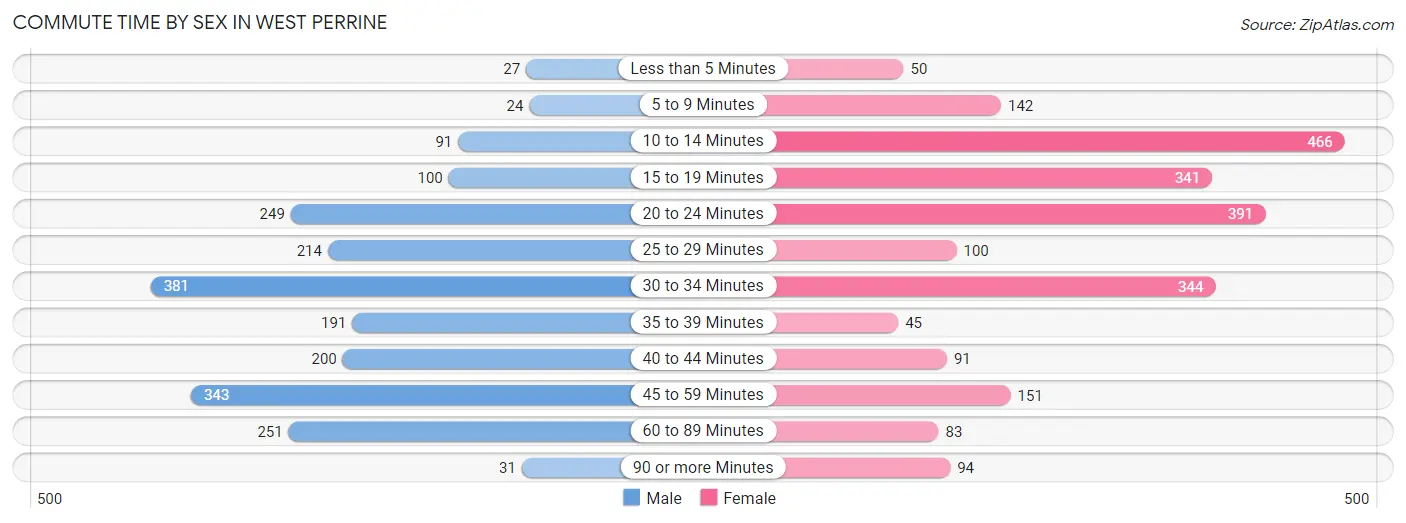
| Commute Time | Male | Female |
| Less than 5 Minutes | 27 (1.3%) | 50 (2.2%) |
| 5 to 9 Minutes | 24 (1.1%) | 142 (6.2%) |
| 10 to 14 Minutes | 91 (4.3%) | 466 (20.3%) |
| 15 to 19 Minutes | 100 (4.8%) | 341 (14.8%) |
| 20 to 24 Minutes | 249 (11.8%) | 391 (17.0%) |
| 25 to 29 Minutes | 214 (10.2%) | 100 (4.3%) |
| 30 to 34 Minutes | 381 (18.1%) | 344 (15.0%) |
| 35 to 39 Minutes | 191 (9.1%) | 45 (2.0%) |
| 40 to 44 Minutes | 200 (9.5%) | 91 (4.0%) |
| 45 to 59 Minutes | 343 (16.3%) | 151 (6.6%) |
| 60 to 89 Minutes | 251 (11.9%) | 83 (3.6%) |
| 90 or more Minutes | 31 (1.5%) | 94 (4.1%) |
Time of Departure to Work by Sex in West Perrine
The most frequent times of departure to work in West Perrine are 4:00 PM to 11:59 PM (335, 15.9%) for males and 9:00 AM to 9:59 AM (515, 22.4%) for females.
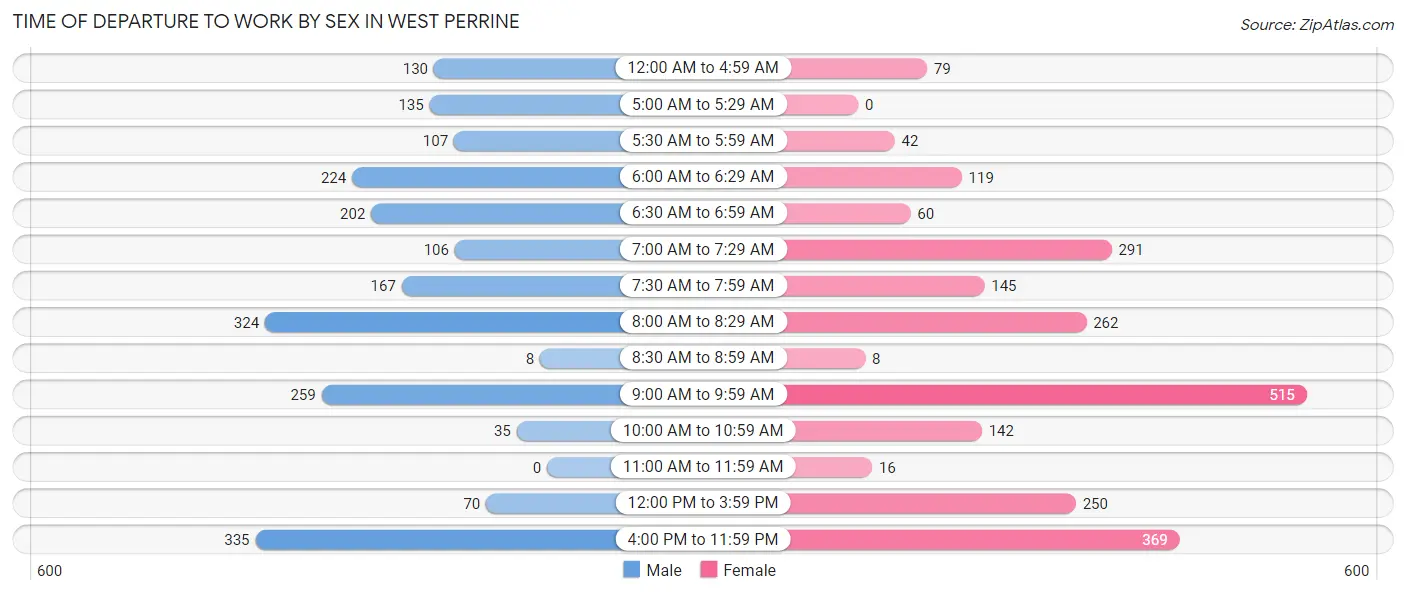
| Time of Departure | Male | Female |
| 12:00 AM to 4:59 AM | 130 (6.2%) | 79 (3.4%) |
| 5:00 AM to 5:29 AM | 135 (6.4%) | 0 (0.0%) |
| 5:30 AM to 5:59 AM | 107 (5.1%) | 42 (1.8%) |
| 6:00 AM to 6:29 AM | 224 (10.7%) | 119 (5.2%) |
| 6:30 AM to 6:59 AM | 202 (9.6%) | 60 (2.6%) |
| 7:00 AM to 7:29 AM | 106 (5.0%) | 291 (12.7%) |
| 7:30 AM to 7:59 AM | 167 (7.9%) | 145 (6.3%) |
| 8:00 AM to 8:29 AM | 324 (15.4%) | 262 (11.4%) |
| 8:30 AM to 8:59 AM | 8 (0.4%) | 8 (0.4%) |
| 9:00 AM to 9:59 AM | 259 (12.3%) | 515 (22.4%) |
| 10:00 AM to 10:59 AM | 35 (1.7%) | 142 (6.2%) |
| 11:00 AM to 11:59 AM | 0 (0.0%) | 16 (0.7%) |
| 12:00 PM to 3:59 PM | 70 (3.3%) | 250 (10.9%) |
| 4:00 PM to 11:59 PM | 335 (15.9%) | 369 (16.1%) |
| Total | 2,102 (100.0%) | 2,298 (100.0%) |
Housing Occupancy in West Perrine
Occupancy by Ownership in West Perrine
Of the total 3,089 dwellings in West Perrine, owner-occupied units account for 1,518 (49.1%), while renter-occupied units make up 1,571 (50.9%).
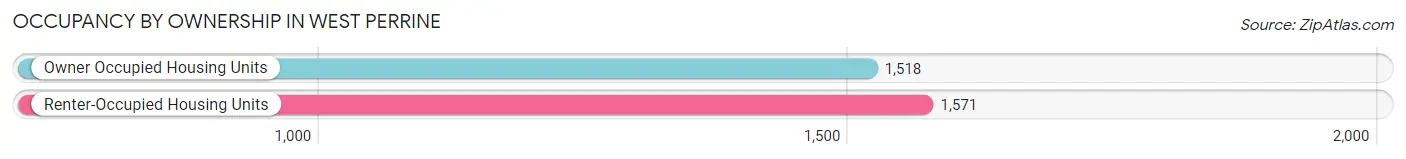
| Occupancy | # Housing Units | % Housing Units |
| Owner Occupied Housing Units | 1,518 | 49.1% |
| Renter-Occupied Housing Units | 1,571 | 50.9% |
| Total Occupied Housing Units | 3,089 | 100.0% |
Occupancy by Household Size in West Perrine
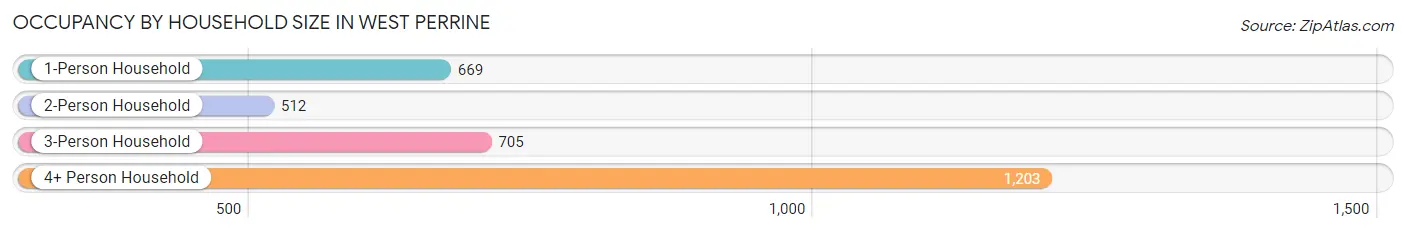
| Household Size | # Housing Units | % Housing Units |
| 1-Person Household | 669 | 21.7% |
| 2-Person Household | 512 | 16.6% |
| 3-Person Household | 705 | 22.8% |
| 4+ Person Household | 1,203 | 38.9% |
| Total Housing Units | 3,089 | 100.0% |
Occupancy by Ownership by Household Size in West Perrine
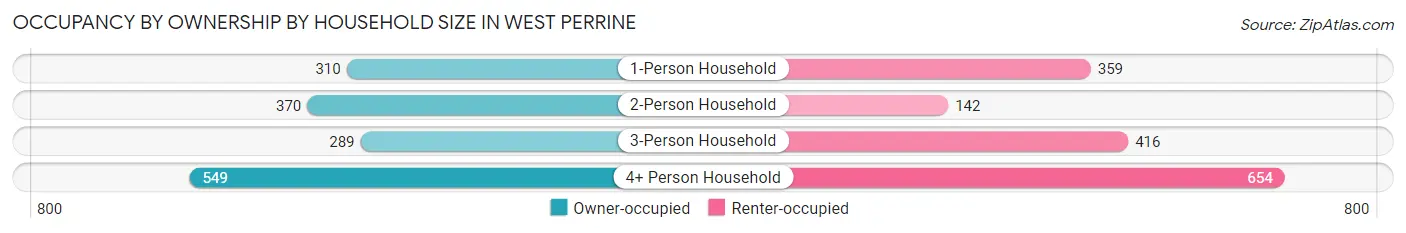
| Household Size | Owner-occupied | Renter-occupied |
| 1-Person Household | 310 (46.3%) | 359 (53.7%) |
| 2-Person Household | 370 (72.3%) | 142 (27.7%) |
| 3-Person Household | 289 (41.0%) | 416 (59.0%) |
| 4+ Person Household | 549 (45.6%) | 654 (54.4%) |
| Total Housing Units | 1,518 (49.1%) | 1,571 (50.9%) |
Occupancy by Educational Attainment in West Perrine
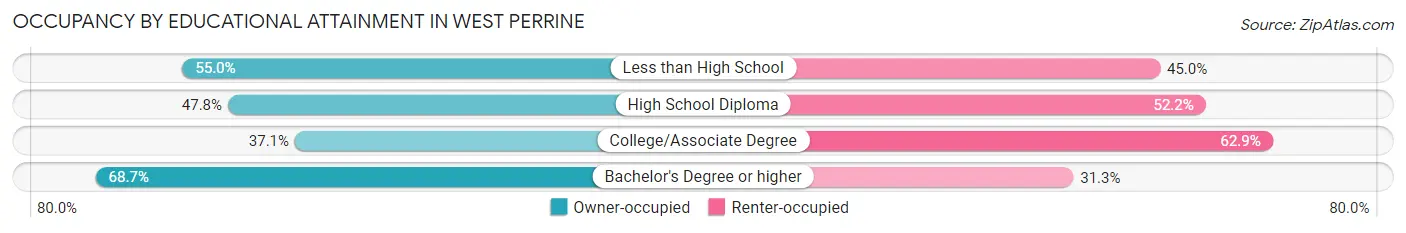
| Household Size | Owner-occupied | Renter-occupied |
| Less than High School | 249 (55.0%) | 204 (45.0%) |
| High School Diploma | 523 (47.8%) | 572 (52.2%) |
| College/Associate Degree | 368 (37.1%) | 623 (62.9%) |
| Bachelor's Degree or higher | 378 (68.7%) | 172 (31.3%) |
Occupancy by Age of Householder in West Perrine
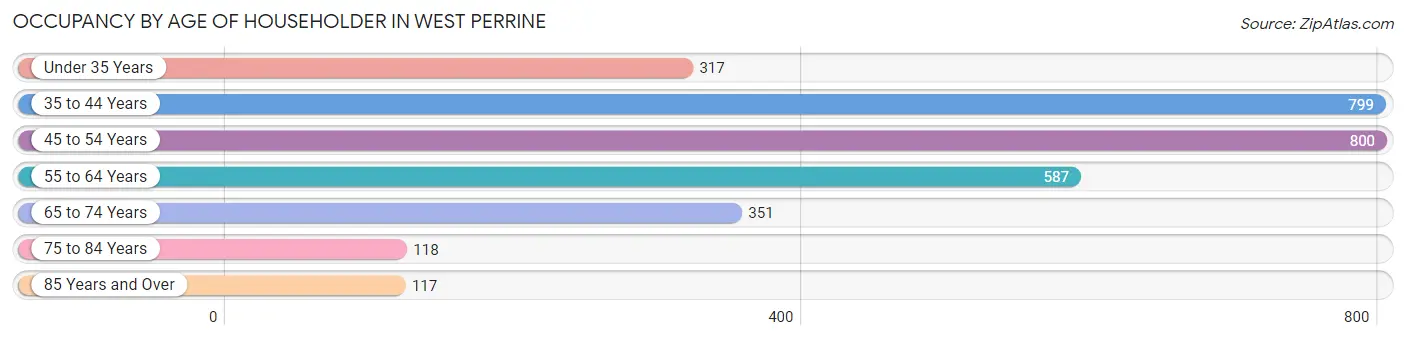
| Age Bracket | # Households | % Households |
| Under 35 Years | 317 | 10.3% |
| 35 to 44 Years | 799 | 25.9% |
| 45 to 54 Years | 800 | 25.9% |
| 55 to 64 Years | 587 | 19.0% |
| 65 to 74 Years | 351 | 11.4% |
| 75 to 84 Years | 118 | 3.8% |
| 85 Years and Over | 117 | 3.8% |
| Total | 3,089 | 100.0% |
Housing Finances in West Perrine
Median Income by Occupancy in West Perrine
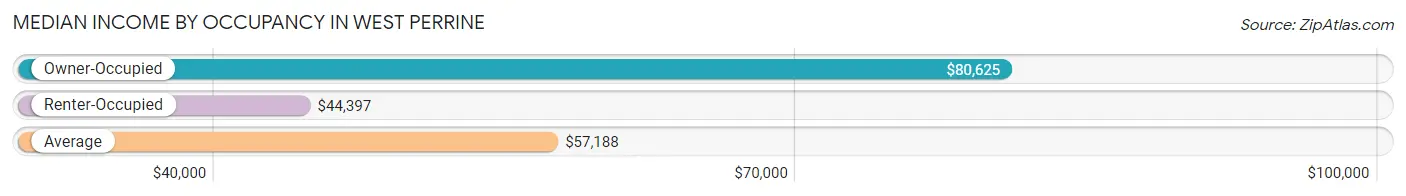
| Occupancy Type | # Households | Median Income |
| Owner-Occupied | 1,518 (49.1%) | $80,625 |
| Renter-Occupied | 1,571 (50.9%) | $44,397 |
| Average | 3,089 (100.0%) | $57,188 |
Occupancy by Householder Income Bracket in West Perrine
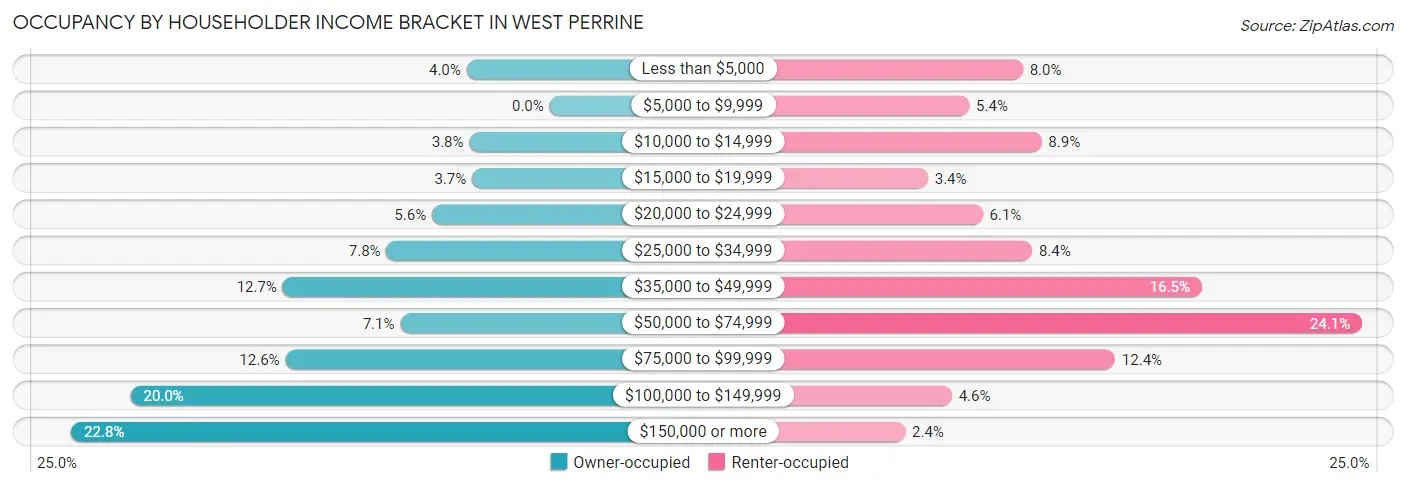
| Income Bracket | Owner-occupied | Renter-occupied |
| Less than $5,000 | 60 (4.0%) | 125 (8.0%) |
| $5,000 to $9,999 | 0 (0.0%) | 85 (5.4%) |
| $10,000 to $14,999 | 58 (3.8%) | 139 (8.8%) |
| $15,000 to $19,999 | 56 (3.7%) | 54 (3.4%) |
| $20,000 to $24,999 | 85 (5.6%) | 95 (6.0%) |
| $25,000 to $34,999 | 118 (7.8%) | 132 (8.4%) |
| $35,000 to $49,999 | 193 (12.7%) | 259 (16.5%) |
| $50,000 to $74,999 | 108 (7.1%) | 379 (24.1%) |
| $75,000 to $99,999 | 191 (12.6%) | 194 (12.3%) |
| $100,000 to $149,999 | 303 (20.0%) | 72 (4.6%) |
| $150,000 or more | 346 (22.8%) | 37 (2.4%) |
| Total | 1,518 (100.0%) | 1,571 (100.0%) |
Monthly Housing Cost Tiers in West Perrine
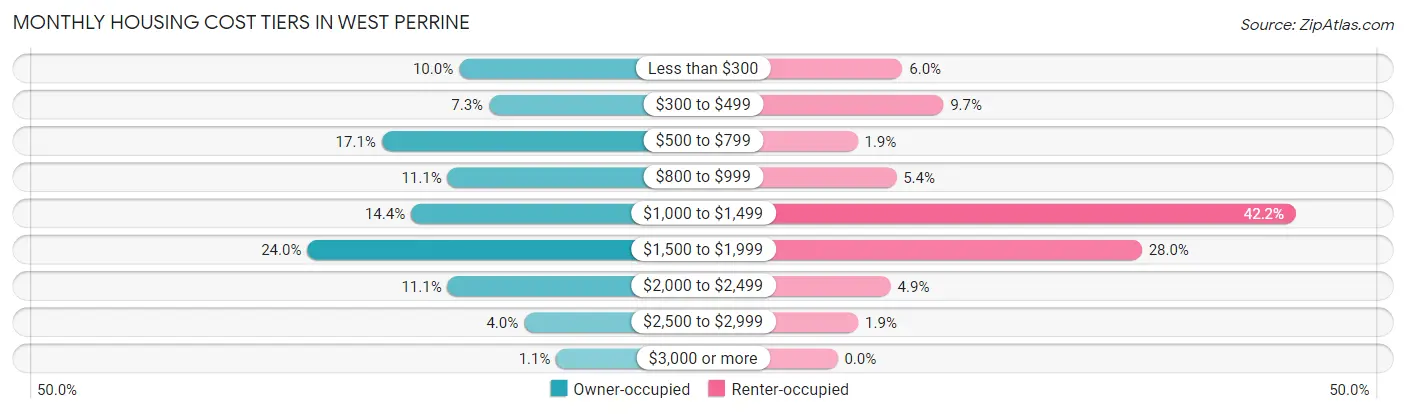
| Monthly Cost | Owner-occupied | Renter-occupied |
| Less than $300 | 152 (10.0%) | 94 (6.0%) |
| $300 to $499 | 110 (7.2%) | 153 (9.7%) |
| $500 to $799 | 260 (17.1%) | 29 (1.8%) |
| $800 to $999 | 168 (11.1%) | 85 (5.4%) |
| $1,000 to $1,499 | 219 (14.4%) | 663 (42.2%) |
| $1,500 to $1,999 | 364 (24.0%) | 440 (28.0%) |
| $2,000 to $2,499 | 168 (11.1%) | 77 (4.9%) |
| $2,500 to $2,999 | 61 (4.0%) | 30 (1.9%) |
| $3,000 or more | 16 (1.1%) | 0 (0.0%) |
| Total | 1,518 (100.0%) | 1,571 (100.0%) |
Physical Housing Characteristics in West Perrine
Housing Structures in West Perrine
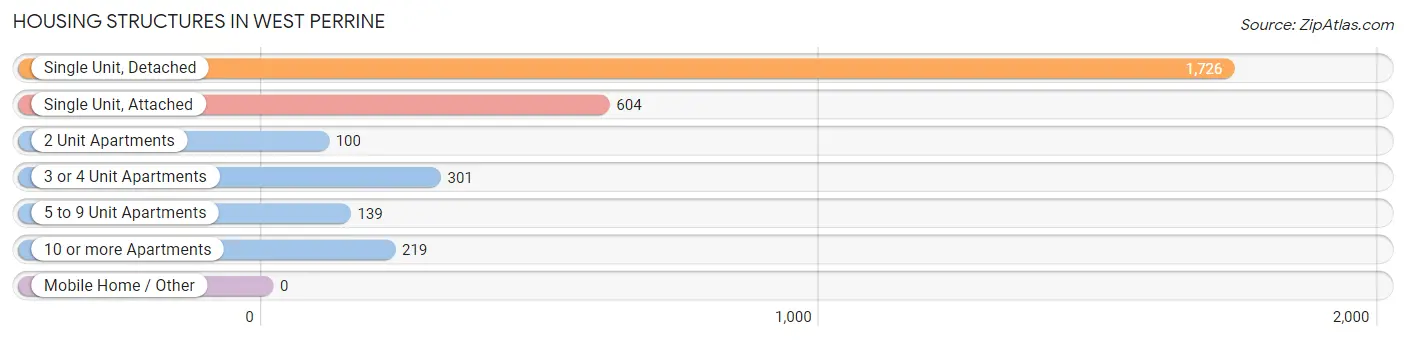
| Structure Type | # Housing Units | % Housing Units |
| Single Unit, Detached | 1,726 | 55.9% |
| Single Unit, Attached | 604 | 19.6% |
| 2 Unit Apartments | 100 | 3.2% |
| 3 or 4 Unit Apartments | 301 | 9.7% |
| 5 to 9 Unit Apartments | 139 | 4.5% |
| 10 or more Apartments | 219 | 7.1% |
| Mobile Home / Other | 0 | 0.0% |
| Total | 3,089 | 100.0% |
Housing Structures by Occupancy in West Perrine
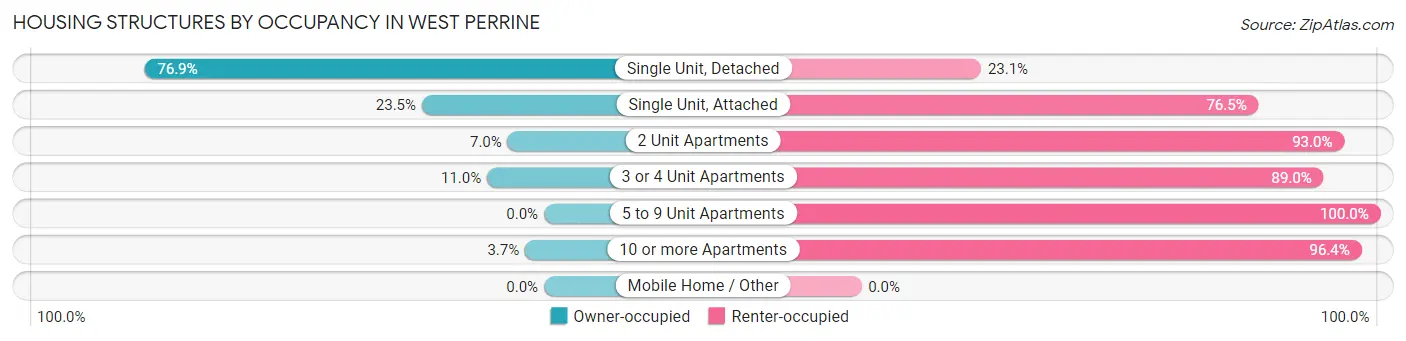
| Structure Type | Owner-occupied | Renter-occupied |
| Single Unit, Detached | 1,328 (76.9%) | 398 (23.1%) |
| Single Unit, Attached | 142 (23.5%) | 462 (76.5%) |
| 2 Unit Apartments | 7 (7.0%) | 93 (93.0%) |
| 3 or 4 Unit Apartments | 33 (11.0%) | 268 (89.0%) |
| 5 to 9 Unit Apartments | 0 (0.0%) | 139 (100.0%) |
| 10 or more Apartments | 8 (3.6%) | 211 (96.4%) |
| Mobile Home / Other | 0 (0.0%) | 0 (0.0%) |
| Total | 1,518 (49.1%) | 1,571 (50.9%) |
Housing Structures by Number of Rooms in West Perrine
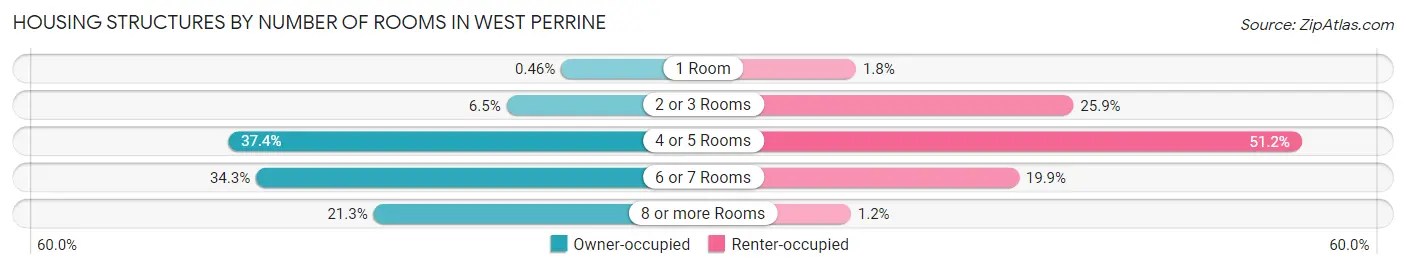
| Number of Rooms | Owner-occupied | Renter-occupied |
| 1 Room | 7 (0.5%) | 28 (1.8%) |
| 2 or 3 Rooms | 99 (6.5%) | 407 (25.9%) |
| 4 or 5 Rooms | 568 (37.4%) | 805 (51.2%) |
| 6 or 7 Rooms | 521 (34.3%) | 312 (19.9%) |
| 8 or more Rooms | 323 (21.3%) | 19 (1.2%) |
| Total | 1,518 (100.0%) | 1,571 (100.0%) |
Housing Structure by Heating Type in West Perrine
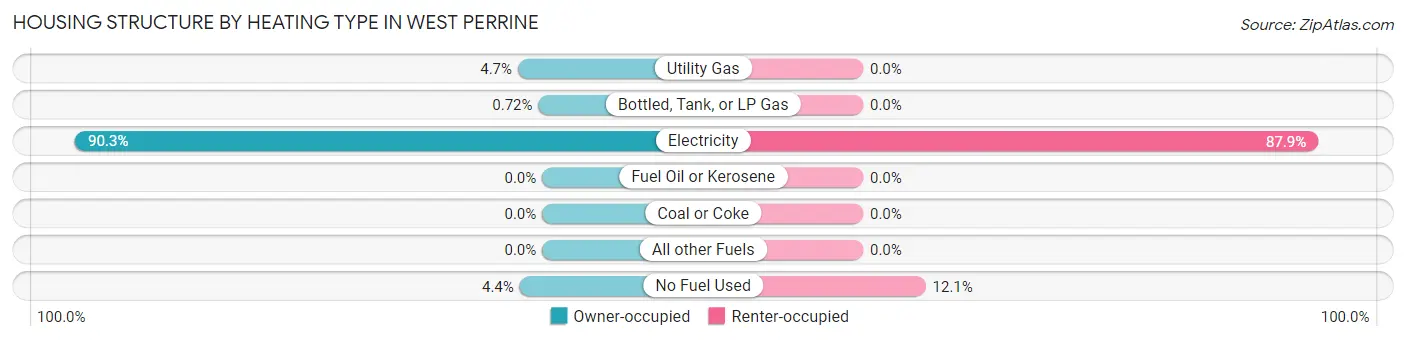
| Heating Type | Owner-occupied | Renter-occupied |
| Utility Gas | 71 (4.7%) | 0 (0.0%) |
| Bottled, Tank, or LP Gas | 11 (0.7%) | 0 (0.0%) |
| Electricity | 1,370 (90.2%) | 1,381 (87.9%) |
| Fuel Oil or Kerosene | 0 (0.0%) | 0 (0.0%) |
| Coal or Coke | 0 (0.0%) | 0 (0.0%) |
| All other Fuels | 0 (0.0%) | 0 (0.0%) |
| No Fuel Used | 66 (4.3%) | 190 (12.1%) |
| Total | 1,518 (100.0%) | 1,571 (100.0%) |
Household Vehicle Usage in West Perrine
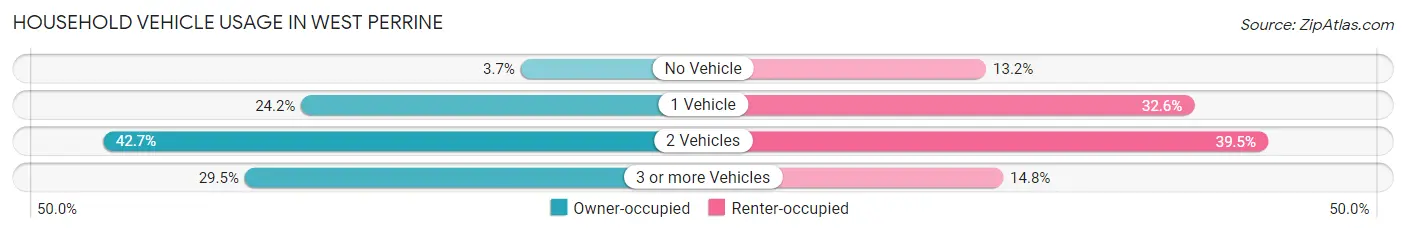
| Vehicles per Household | Owner-occupied | Renter-occupied |
| No Vehicle | 56 (3.7%) | 207 (13.2%) |
| 1 Vehicle | 367 (24.2%) | 512 (32.6%) |
| 2 Vehicles | 648 (42.7%) | 620 (39.5%) |
| 3 or more Vehicles | 447 (29.4%) | 232 (14.8%) |
| Total | 1,518 (100.0%) | 1,571 (100.0%) |
Real Estate & Mortgages in West Perrine
Real Estate and Mortgage Overview in West Perrine
| Characteristic | Without Mortgage | With Mortgage |
| Housing Units | 697 | 821 |
| Median Property Value | $276,700 | $347,900 |
| Median Household Income | $74,635 | $243 |
| Monthly Housing Costs | $573 | $16 |
| Real Estate Taxes | $1,481 | $1 |
Property Value by Mortgage Status in West Perrine
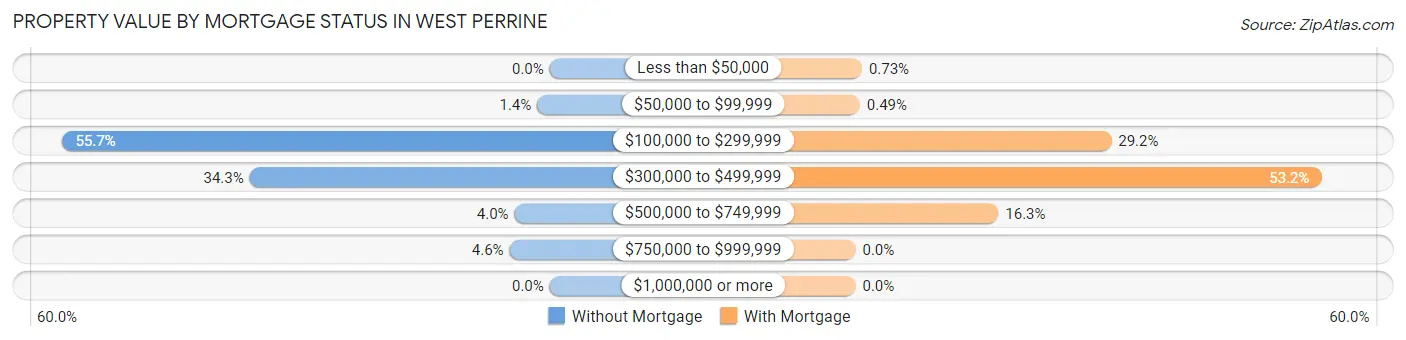
| Property Value | Without Mortgage | With Mortgage |
| Less than $50,000 | 0 (0.0%) | 6 (0.7%) |
| $50,000 to $99,999 | 10 (1.4%) | 4 (0.5%) |
| $100,000 to $299,999 | 388 (55.7%) | 240 (29.2%) |
| $300,000 to $499,999 | 239 (34.3%) | 437 (53.2%) |
| $500,000 to $749,999 | 28 (4.0%) | 134 (16.3%) |
| $750,000 to $999,999 | 32 (4.6%) | 0 (0.0%) |
| $1,000,000 or more | 0 (0.0%) | 0 (0.0%) |
| Total | 697 (100.0%) | 821 (100.0%) |
Household Income by Mortgage Status in West Perrine
| Household Income | Without Mortgage | With Mortgage |
| Less than $10,000 | 31 (4.4%) | 52 (6.3%) |
| $10,000 to $24,999 | 113 (16.2%) | 29 (3.5%) |
| $25,000 to $34,999 | 48 (6.9%) | 86 (10.5%) |
| $35,000 to $49,999 | 114 (16.4%) | 70 (8.5%) |
| $50,000 to $74,999 | 46 (6.6%) | 79 (9.6%) |
| $75,000 to $99,999 | 111 (15.9%) | 62 (7.5%) |
| $100,000 to $149,999 | 131 (18.8%) | 80 (9.7%) |
| $150,000 or more | 103 (14.8%) | 172 (20.9%) |
| Total | 697 (100.0%) | 821 (100.0%) |
Property Value to Household Income Ratio in West Perrine
| Value-to-Income Ratio | Without Mortgage | With Mortgage |
| Less than 2.0x | 113 (16.2%) | 100,146 (12,198.1%) |
| 2.0x to 2.9x | 123 (17.6%) | 113 (13.8%) |
| 3.0x to 3.9x | 42 (6.0%) | 196 (23.9%) |
| 4.0x or more | 397 (57.0%) | 113 (13.8%) |
| Total | 697 (100.0%) | 821 (100.0%) |
Real Estate Taxes by Mortgage Status in West Perrine
| Property Taxes | Without Mortgage | With Mortgage |
| Less than $800 | 97 (13.9%) | 20 (2.4%) |
| $800 to $1,499 | 261 (37.4%) | 45 (5.5%) |
| $800 to $1,499 | 339 (48.6%) | 61 (7.4%) |
| Total | 697 (100.0%) | 821 (100.0%) |
Health & Disability in West Perrine
Health Insurance Coverage by Age in West Perrine
| Age Bracket | With Coverage | Without Coverage |
| Under 6 Years | 856 (92.5%) | 69 (7.5%) |
| 6 to 18 Years | 2,029 (90.8%) | 206 (9.2%) |
| 19 to 25 Years | 720 (72.1%) | 278 (27.9%) |
| 26 to 34 Years | 915 (76.2%) | 285 (23.7%) |
| 35 to 44 Years | 1,162 (74.3%) | 402 (25.7%) |
| 45 to 54 Years | 1,041 (62.9%) | 614 (37.1%) |
| 55 to 64 Years | 853 (93.4%) | 60 (6.6%) |
| 65 to 74 Years | 566 (97.1%) | 17 (2.9%) |
| 75 Years and older | 499 (96.9%) | 16 (3.1%) |
| Total | 8,641 (81.6%) | 1,947 (18.4%) |
Health Insurance Coverage by Citizenship Status in West Perrine
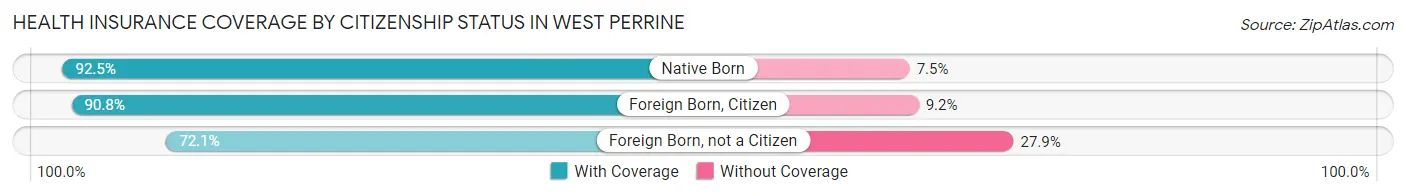
| Citizenship Status | With Coverage | Without Coverage |
| Native Born | 856 (92.5%) | 69 (7.5%) |
| Foreign Born, Citizen | 2,029 (90.8%) | 206 (9.2%) |
| Foreign Born, not a Citizen | 720 (72.1%) | 278 (27.9%) |
Health Insurance Coverage by Household Income in West Perrine
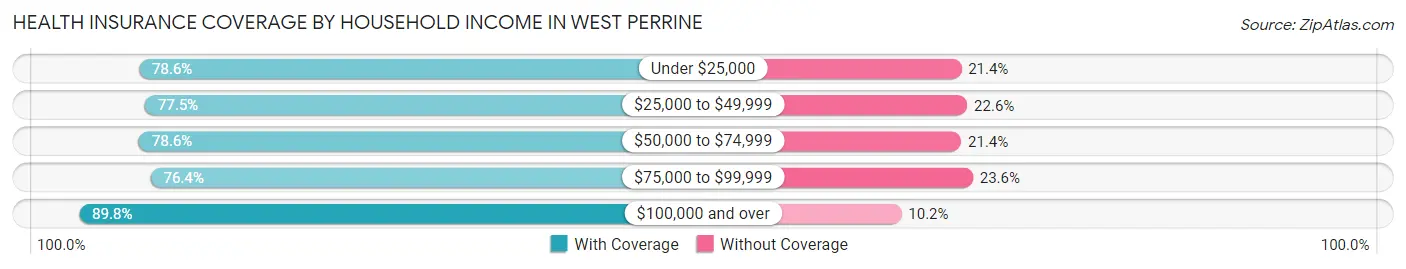
| Household Income | With Coverage | Without Coverage |
| Under $25,000 | 1,118 (78.6%) | 305 (21.4%) |
| $25,000 to $49,999 | 1,820 (77.4%) | 530 (22.6%) |
| $50,000 to $74,999 | 1,328 (78.6%) | 362 (21.4%) |
| $75,000 to $99,999 | 1,256 (76.4%) | 388 (23.6%) |
| $100,000 and over | 3,102 (89.8%) | 353 (10.2%) |
Public vs Private Health Insurance Coverage by Age in West Perrine
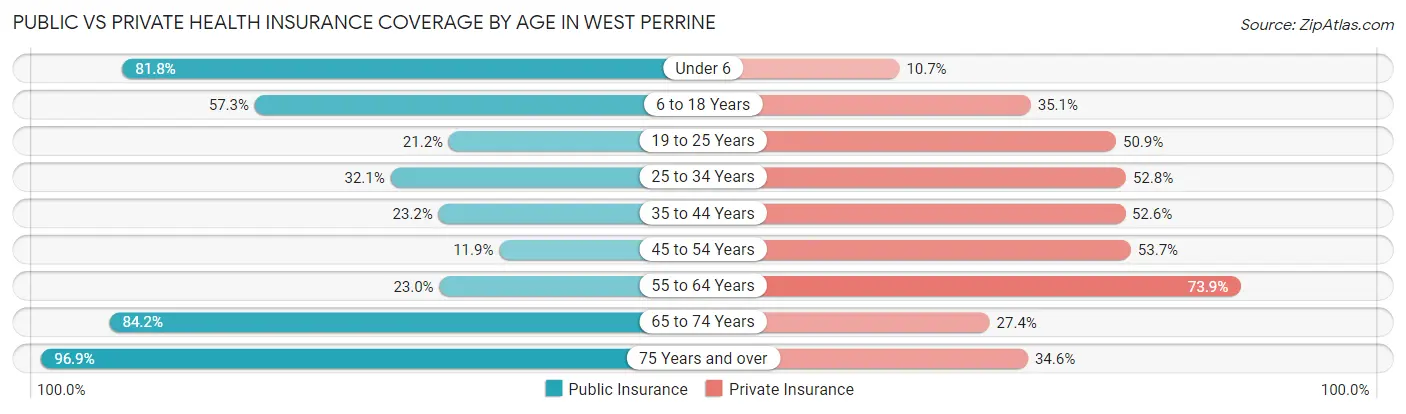
| Age Bracket | Public Insurance | Private Insurance |
| Under 6 | 757 (81.8%) | 99 (10.7%) |
| 6 to 18 Years | 1,280 (57.3%) | 784 (35.1%) |
| 19 to 25 Years | 212 (21.2%) | 508 (50.9%) |
| 25 to 34 Years | 385 (32.1%) | 633 (52.7%) |
| 35 to 44 Years | 362 (23.2%) | 822 (52.6%) |
| 45 to 54 Years | 197 (11.9%) | 888 (53.7%) |
| 55 to 64 Years | 210 (23.0%) | 675 (73.9%) |
| 65 to 74 Years | 491 (84.2%) | 160 (27.4%) |
| 75 Years and over | 499 (96.9%) | 178 (34.6%) |
| Total | 4,393 (41.5%) | 4,747 (44.8%) |
Disability Status by Sex by Age in West Perrine
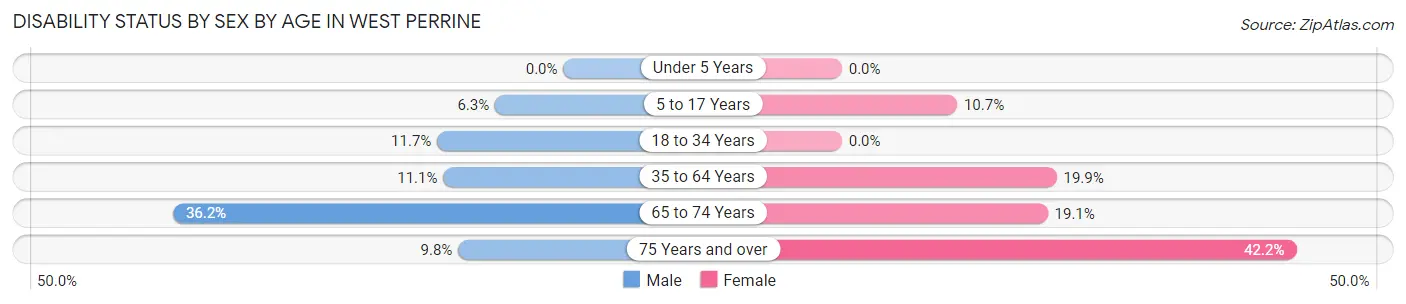
| Age Bracket | Male | Female |
| Under 5 Years | 0 (0.0%) | 0 (0.0%) |
| 5 to 17 Years | 80 (6.3%) | 95 (10.7%) |
| 18 to 34 Years | 97 (11.7%) | 0 (0.0%) |
| 35 to 64 Years | 230 (11.1%) | 412 (19.9%) |
| 65 to 74 Years | 50 (36.2%) | 85 (19.1%) |
| 75 Years and over | 16 (9.8%) | 148 (42.2%) |
Disability Class by Sex by Age in West Perrine
Disability Class: Hearing Difficulty
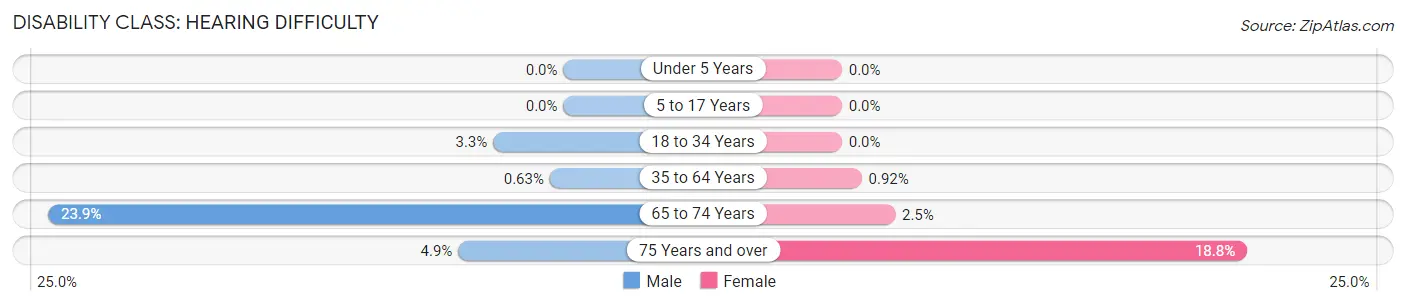
| Age Bracket | Male | Female |
| Under 5 Years | 0 (0.0%) | 0 (0.0%) |
| 5 to 17 Years | 0 (0.0%) | 0 (0.0%) |
| 18 to 34 Years | 27 (3.3%) | 0 (0.0%) |
| 35 to 64 Years | 13 (0.6%) | 19 (0.9%) |
| 65 to 74 Years | 33 (23.9%) | 11 (2.5%) |
| 75 Years and over | 8 (4.9%) | 66 (18.8%) |
Disability Class: Vision Difficulty
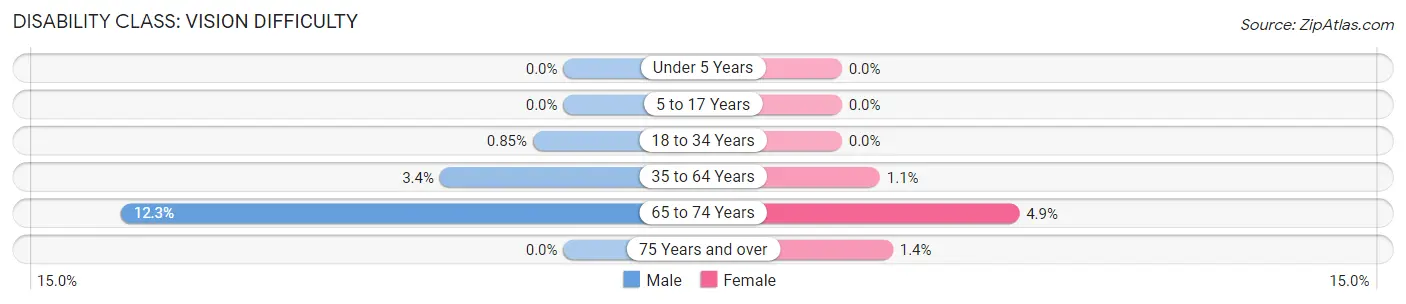
| Age Bracket | Male | Female |
| Under 5 Years | 0 (0.0%) | 0 (0.0%) |
| 5 to 17 Years | 0 (0.0%) | 0 (0.0%) |
| 18 to 34 Years | 7 (0.9%) | 0 (0.0%) |
| 35 to 64 Years | 71 (3.4%) | 22 (1.1%) |
| 65 to 74 Years | 17 (12.3%) | 22 (4.9%) |
| 75 Years and over | 0 (0.0%) | 5 (1.4%) |
Disability Class: Cognitive Difficulty
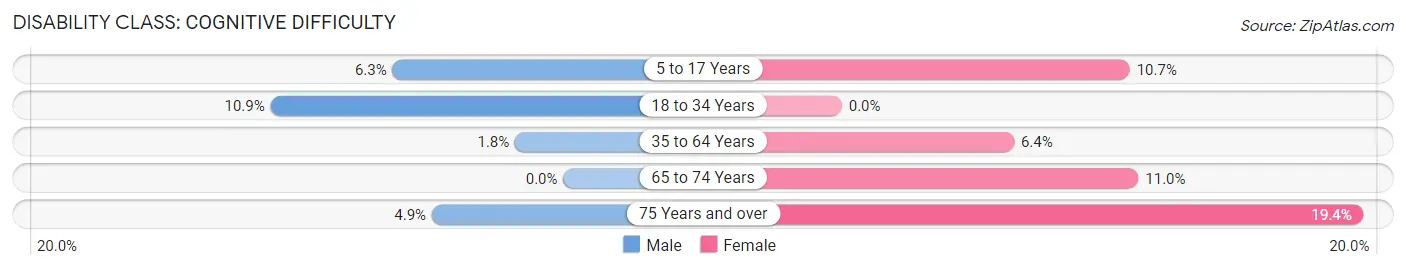
| Age Bracket | Male | Female |
| 5 to 17 Years | 80 (6.3%) | 95 (10.7%) |
| 18 to 34 Years | 90 (10.9%) | 0 (0.0%) |
| 35 to 64 Years | 37 (1.8%) | 132 (6.4%) |
| 65 to 74 Years | 0 (0.0%) | 49 (11.0%) |
| 75 Years and over | 8 (4.9%) | 68 (19.4%) |
Disability Class: Ambulatory Difficulty
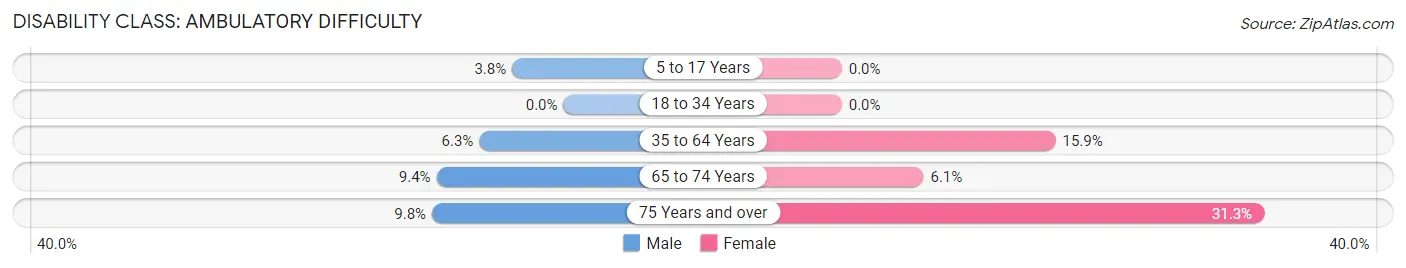
| Age Bracket | Male | Female |
| 5 to 17 Years | 48 (3.8%) | 0 (0.0%) |
| 18 to 34 Years | 0 (0.0%) | 0 (0.0%) |
| 35 to 64 Years | 129 (6.2%) | 328 (15.9%) |
| 65 to 74 Years | 13 (9.4%) | 27 (6.1%) |
| 75 Years and over | 16 (9.8%) | 110 (31.3%) |
Disability Class: Self-Care Difficulty
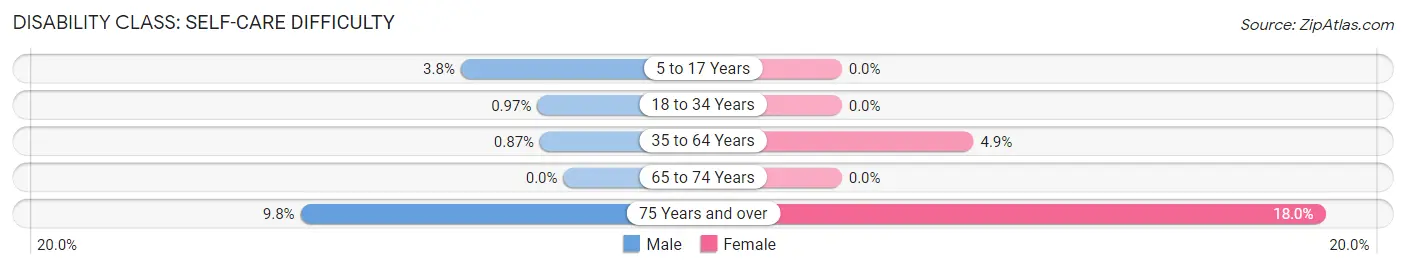
| Age Bracket | Male | Female |
| 5 to 17 Years | 48 (3.8%) | 0 (0.0%) |
| 18 to 34 Years | 8 (1.0%) | 0 (0.0%) |
| 35 to 64 Years | 18 (0.9%) | 101 (4.9%) |
| 65 to 74 Years | 0 (0.0%) | 0 (0.0%) |
| 75 Years and over | 16 (9.8%) | 63 (17.9%) |
Technology Access in West Perrine
Computing Device Access in West Perrine
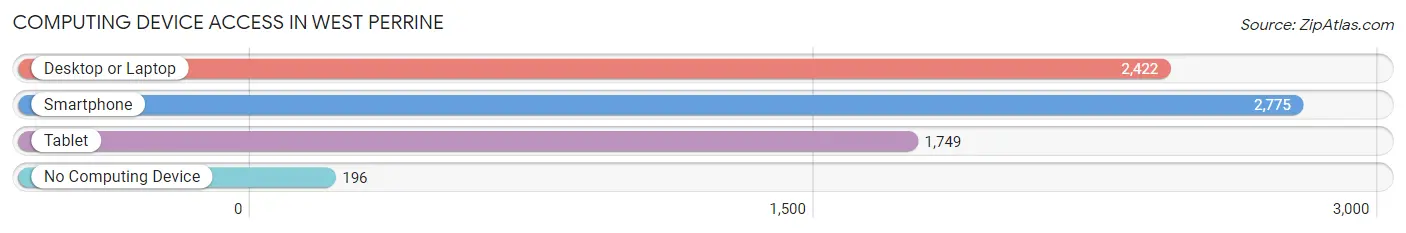
| Device Type | # Households | % Households |
| Desktop or Laptop | 2,422 | 78.4% |
| Smartphone | 2,775 | 89.8% |
| Tablet | 1,749 | 56.6% |
| No Computing Device | 196 | 6.4% |
| Total | 3,089 | 100.0% |
Internet Access in West Perrine
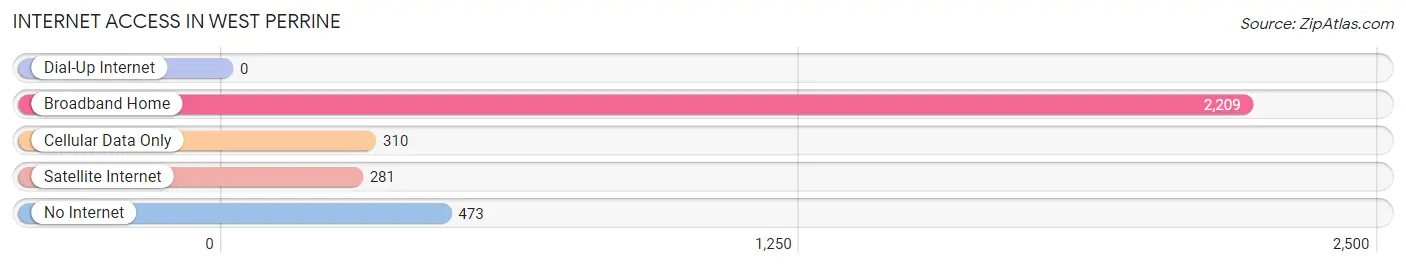
| Internet Type | # Households | % Households |
| Dial-Up Internet | 0 | 0.0% |
| Broadband Home | 2,209 | 71.5% |
| Cellular Data Only | 310 | 10.0% |
| Satellite Internet | 281 | 9.1% |
| No Internet | 473 | 15.3% |
| Total | 3,089 | 100.0% |
West Perrine Summary
West Perrine is a census-designated place (CDP) located in Miami-Dade County, Florida, United States. The population was 16,890 at the 2010 census. It is located south of the Palmetto Expressway and north of the Homestead Extension of Florida's Turnpike.
History
West Perrine was originally part of the Perrine Grant, a 2,000-acre tract of land granted to Dr. Henry Perrine in 1873 by the United States government. The grant was located in what is now the southern part of Miami-Dade County. The area was sparsely populated until the 1950s, when the population began to grow rapidly. The area was incorporated as the Town of Perrine in 1955, but was later annexed by the City of Miami in 1957.
Geography
West Perrine is located at 25°35'25" North, 80°22'45" West (25.590278, -80.379167). According to the United States Census Bureau, the CDP has a total area of 4.2 square miles (10.9 km2), all land.
Economy
West Perrine is a primarily residential area, with a few small businesses located in the area. The main industries in the area are construction, retail, and health care. The median household income in West Perrine is $30,845, which is lower than the national average.
Demographics
As of the 2010 census, there were 16,890 people, 5,845 households, and 4,072 families residing in the CDP. The population density was 4,037.2 people per square mile (1,561.2/km2). There were 6,541 housing units at an average density of 1,564.2 per square mile (604.3/km2). The racial makeup of the CDP was 57.2% White (non-Hispanic), 28.2% African American, 0.4% Native American, 0.7% Asian, 0.1% Pacific Islander, 10.3% from other races, and 3.1% from two or more races. Hispanic or Latino of any race were 57.2% of the population.
There were 5,845 households, out of which 37.2% had children under the age of 18 living with them, 37.2% were married couples living together, 22.2% had a female householder with no husband present, and 33.2% were non-families. 25.7% of all households were made up of individuals, and 8.2% had someone living alone who was 65 years of age or older. The average household size was 2.88 and the average family size was 3.48.
In the CDP, the population was spread out, with 28.2% under the age of 18, 10.3% from 18 to 24, 30.2% from 25 to 44, 20.2% from 45 to 64, and 11.1% who were 65 years of age or older. The median age was 32 years. For every 100 females, there were 95.2 males. For every 100 females age 18 and over, there were 91.2 males.
The median income for a household in the CDP was $25,945, and the median income for a family was $27,917. Males had a median income of $25,945 versus $20,938 for females. The per capita income for the CDP was $11,845. About 22.2% of families and 25.7% of the population were below the poverty line, including 33.2% of those under age 18 and 16.2% of those age 65 or over.
Common Questions
What is Per Capita Income in West Perrine?
Per Capita income in West Perrine is $22,929.
What is the Median Family Income in West Perrine?
Median Family Income in West Perrine is $70,560.
What is the Median Household income in West Perrine?
Median Household Income in West Perrine is $57,188.
What is Income or Wage Gap in West Perrine?
Income or Wage Gap in West Perrine is 32.3%.
Women in West Perrine earn 67.7 cents for every dollar earned by a man.
What is Family Income Deficit in West Perrine?
Family Income Deficit in West Perrine is $10,735.
Families that are below poverty line in West Perrine earn $10,735 less on average than the poverty threshold level.
What is Inequality or Gini Index in West Perrine?
Inequality or Gini Index in West Perrine is 0.46.
What is the Total Population of West Perrine?
Total Population of West Perrine is 10,597.
What is the Total Male Population of West Perrine?
Total Male Population of West Perrine is 4,959.
What is the Total Female Population of West Perrine?
Total Female Population of West Perrine is 5,638.
What is the Ratio of Males per 100 Females in West Perrine?
There are 87.96 Males per 100 Females in West Perrine.
What is the Ratio of Females per 100 Males in West Perrine?
There are 113.69 Females per 100 Males in West Perrine.
What is the Median Population Age in West Perrine?
Median Population Age in West Perrine is 33.8 Years.
What is the Average Family Size in West Perrine
Average Family Size in West Perrine is 3.9 People.
What is the Average Household Size in West Perrine
Average Household Size in West Perrine is 3.4 People.
How Large is the Labor Force in West Perrine?
There are 5,027 People in the Labor Forcein in West Perrine.
What is the Percentage of People in the Labor Force in West Perrine?
63.7% of People are in the Labor Force in West Perrine.
What is the Unemployment Rate in West Perrine?
Unemployment Rate in West Perrine is 8.0%.