Leadville, CO Map & Demographics
Leadville Map
Leadville Overview
$53,598
PER CAPITA INCOME
$135,278
AVG FAMILY INCOME
$80,100
AVG HOUSEHOLD INCOME
31.7%
WAGE / INCOME GAP [ % ]
68.3¢/ $1
WAGE / INCOME GAP [ $ ]
0.39
INEQUALITY / GINI INDEX
2,622
TOTAL POPULATION
1,241
MALE POPULATION
1,381
FEMALE POPULATION
89.86
MALES / 100 FEMALES
111.28
FEMALES / 100 MALES
38.0
MEDIAN AGE
3.9
AVG FAMILY SIZE
2.1
AVG HOUSEHOLD SIZE
1,945
LABOR FORCE [ PEOPLE ]
89.2%
PERCENT IN LABOR FORCE
2.3%
UNEMPLOYMENT RATE
Leadville Zip Codes
Leadville Area Codes
Income in Leadville
Income Overview in Leadville
Per Capita Income in Leadville is $53,598, while median incomes of families and households are $135,278 and $80,100 respectively.
| Characteristic | Number | Measure |
| Per Capita Income | 2,622 | $53,598 |
| Median Family Income | 360 | $135,278 |
| Mean Family Income | 360 | $142,492 |
| Median Household Income | 1,220 | $80,100 |
| Mean Household Income | 1,220 | $96,758 |
| Income Deficit | 360 | $0 |
| Wage / Income Gap (%) | 2,622 | 31.70% |
| Wage / Income Gap ($) | 2,622 | 68.30¢ per $1 |
| Gini / Inequality Index | 2,622 | 0.39 |
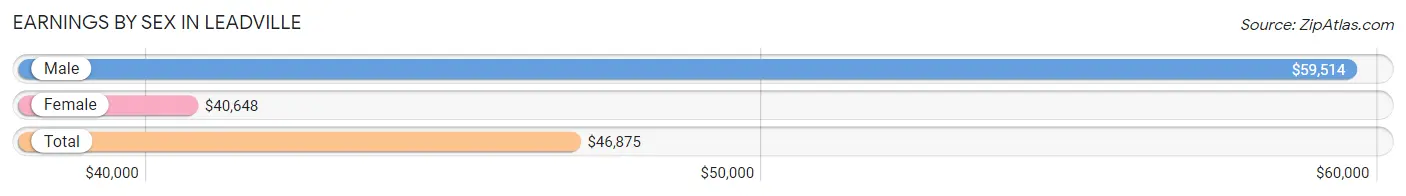
Earnings by Sex in Leadville
Average Earnings in Leadville are $46,875, $59,514 for men and $40,648 for women, a difference of 31.7%.
| Sex | Number | Average Earnings |
| Male | 870 (43.9%) | $59,514 |
| Female | 1,110 (56.1%) | $40,648 |
| Total | 1,980 (100.0%) | $46,875 |
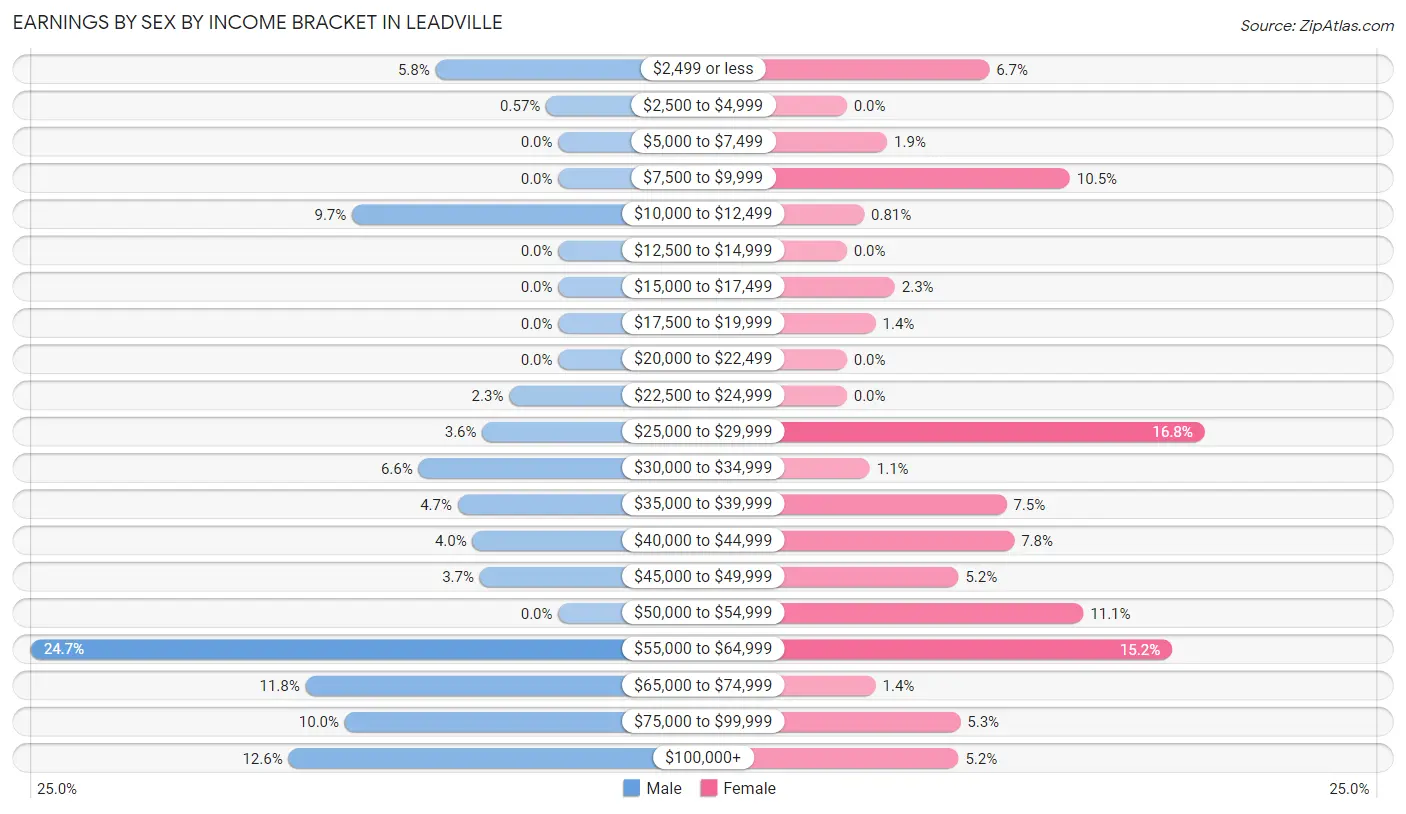
Earnings by Sex by Income Bracket in Leadville
The most common earnings brackets in Leadville are $55,000 to $64,999 for men (215 | 24.7%) and $25,000 to $29,999 for women (186 | 16.8%).
| Income | Male | Female |
| $2,499 or less | 50 (5.8%) | 74 (6.7%) |
| $2,500 to $4,999 | 5 (0.6%) | 0 (0.0%) |
| $5,000 to $7,499 | 0 (0.0%) | 21 (1.9%) |
| $7,500 to $9,999 | 0 (0.0%) | 116 (10.4%) |
| $10,000 to $12,499 | 84 (9.7%) | 9 (0.8%) |
| $12,500 to $14,999 | 0 (0.0%) | 0 (0.0%) |
| $15,000 to $17,499 | 0 (0.0%) | 25 (2.2%) |
| $17,500 to $19,999 | 0 (0.0%) | 15 (1.3%) |
| $20,000 to $22,499 | 0 (0.0%) | 0 (0.0%) |
| $22,500 to $24,999 | 20 (2.3%) | 0 (0.0%) |
| $25,000 to $29,999 | 31 (3.6%) | 186 (16.8%) |
| $30,000 to $34,999 | 57 (6.6%) | 12 (1.1%) |
| $35,000 to $39,999 | 41 (4.7%) | 83 (7.5%) |
| $40,000 to $44,999 | 35 (4.0%) | 87 (7.8%) |
| $45,000 to $49,999 | 32 (3.7%) | 58 (5.2%) |
| $50,000 to $54,999 | 0 (0.0%) | 123 (11.1%) |
| $55,000 to $64,999 | 215 (24.7%) | 169 (15.2%) |
| $65,000 to $74,999 | 103 (11.8%) | 15 (1.3%) |
| $75,000 to $99,999 | 87 (10.0%) | 59 (5.3%) |
| $100,000+ | 110 (12.6%) | 58 (5.2%) |
| Total | 870 (100.0%) | 1,110 (100.0%) |
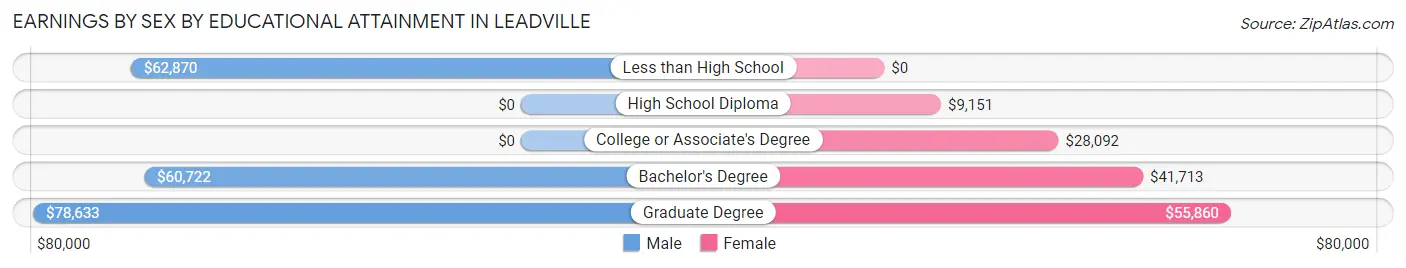
Earnings by Sex by Educational Attainment in Leadville
Average earnings in Leadville are $60,495 for men and $47,533 for women, a difference of 21.4%. Men with an educational attainment of graduate degree enjoy the highest average annual earnings of $78,633, while those with bachelor's degree education earn the least with $60,722. Women with an educational attainment of graduate degree earn the most with the average annual earnings of $55,860, while those with high school diploma education have the smallest earnings of $9,151.
| Educational Attainment | Male Income | Female Income |
| Less than High School | $62,870 | $0 |
| High School Diploma | - | - |
| College or Associate's Degree | - | - |
| Bachelor's Degree | $60,722 | $41,713 |
| Graduate Degree | $78,633 | $55,860 |
| Total | $60,495 | $47,533 |
Family Income in Leadville
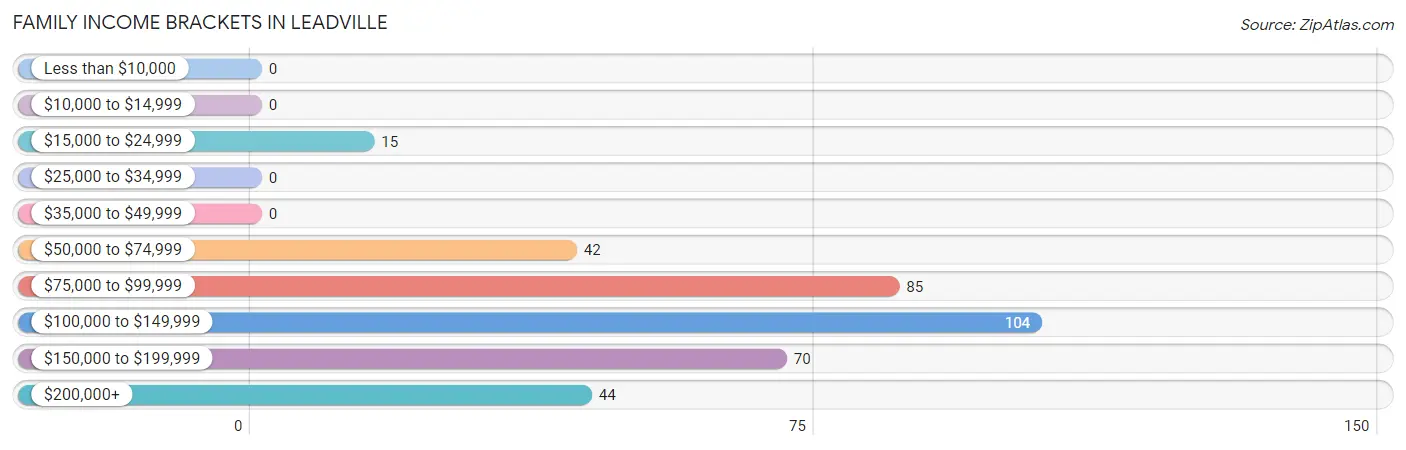
Family Income Brackets in Leadville
According to the Leadville family income data, there are 104 families falling into the $100,000 to $149,999 income range, which is the most common income bracket and makes up 28.9% of all families.
| Income Bracket | # Families | % Families |
| Less than $10,000 | 0 | 0.0% |
| $10,000 to $14,999 | 0 | 0.0% |
| $15,000 to $24,999 | 15 | 4.2% |
| $25,000 to $34,999 | 0 | 0.0% |
| $35,000 to $49,999 | 0 | 0.0% |
| $50,000 to $74,999 | 42 | 11.7% |
| $75,000 to $99,999 | 85 | 23.6% |
| $100,000 to $149,999 | 104 | 28.9% |
| $150,000 to $199,999 | 70 | 19.4% |
| $200,000+ | 44 | 12.2% |
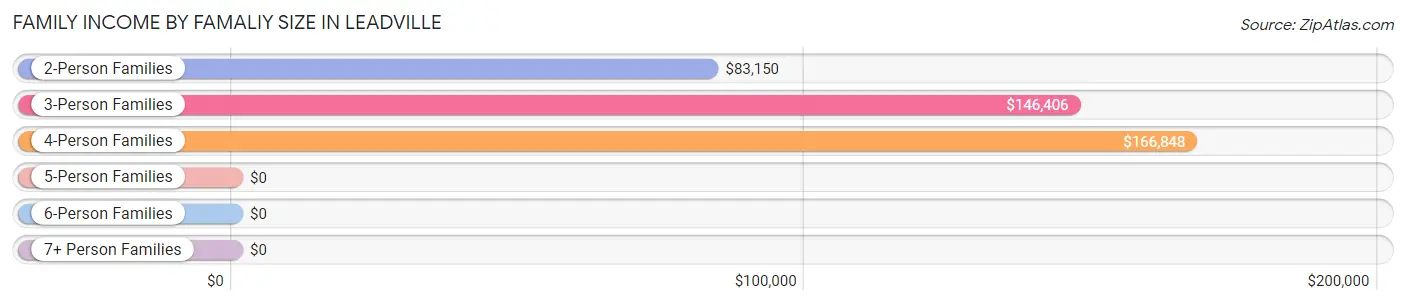
Family Income by Famaliy Size in Leadville
4-person families (86 | 23.9%) account for the highest median family income in Leadville with $166,848 per family, while 3-person families (48 | 13.3%) have the highest median income of $48,802 per family member.
| Income Bracket | # Families | Median Income |
| 2-Person Families | 171 (47.5%) | $83,150 |
| 3-Person Families | 48 (13.3%) | $146,406 |
| 4-Person Families | 86 (23.9%) | $166,848 |
| 5-Person Families | 15 (4.2%) | $0 |
| 6-Person Families | 23 (6.4%) | $0 |
| 7+ Person Families | 17 (4.7%) | $0 |
| Total | 360 (100.0%) | $135,278 |
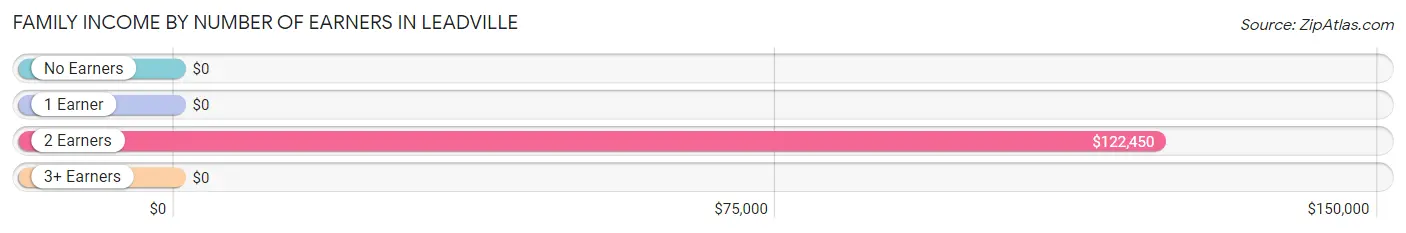
Family Income by Number of Earners in Leadville
| Number of Earners | # Families | Median Income |
| No Earners | 12 (3.3%) | $0 |
| 1 Earner | 56 (15.6%) | $0 |
| 2 Earners | 265 (73.6%) | $122,450 |
| 3+ Earners | 27 (7.5%) | $0 |
| Total | 360 (100.0%) | $135,278 |
Household Income in Leadville
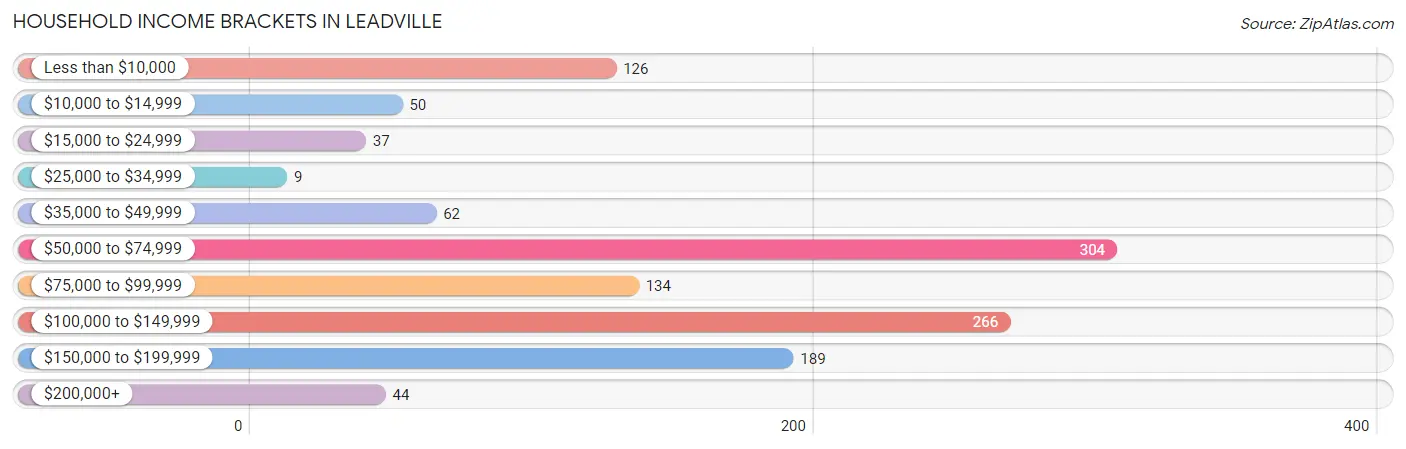
Household Income Brackets in Leadville
With 304 households falling in the category, the $50,000 to $74,999 income range is the most frequent in Leadville, accounting for 24.9% of all households. In contrast, only 9 households (0.7%) fall into the $25,000 to $34,999 income bracket, making it the least populous group.
| Income Bracket | # Households | % Households |
| Less than $10,000 | 126 | 10.3% |
| $10,000 to $14,999 | 50 | 4.1% |
| $15,000 to $24,999 | 37 | 3.0% |
| $25,000 to $34,999 | 9 | 0.7% |
| $35,000 to $49,999 | 62 | 5.1% |
| $50,000 to $74,999 | 304 | 24.9% |
| $75,000 to $99,999 | 134 | 11.0% |
| $100,000 to $149,999 | 266 | 21.8% |
| $150,000 to $199,999 | 189 | 15.5% |
| $200,000+ | 44 | 3.6% |
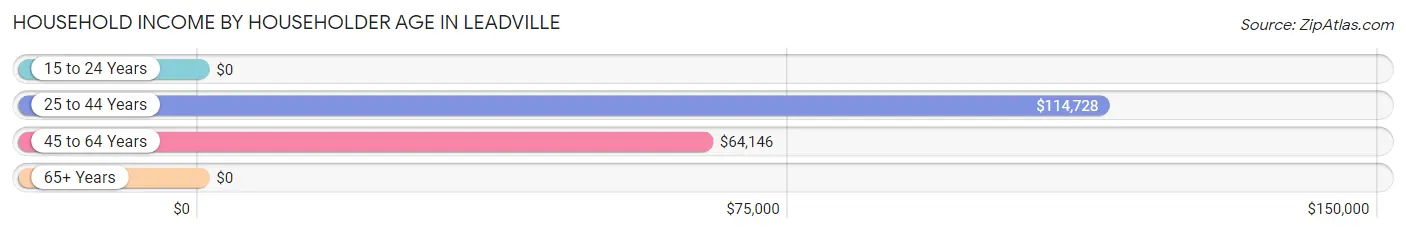
Household Income by Householder Age in Leadville
The median household income in Leadville is $80,100, with the highest median household income of $114,728 found in the 25 to 44 years age bracket for the primary householder. A total of 367 households (30.1%) fall into this category. Meanwhile, the 15 to 24 years age bracket for the primary householder has the lowest median household income of $0, with 43 households (3.5%) in this group.
| Income Bracket | # Households | Median Income |
| 15 to 24 Years | 43 (3.5%) | $0 |
| 25 to 44 Years | 367 (30.1%) | $114,728 |
| 45 to 64 Years | 610 (50.0%) | $64,146 |
| 65+ Years | 200 (16.4%) | $0 |
| Total | 1,220 (100.0%) | $80,100 |
Poverty in Leadville
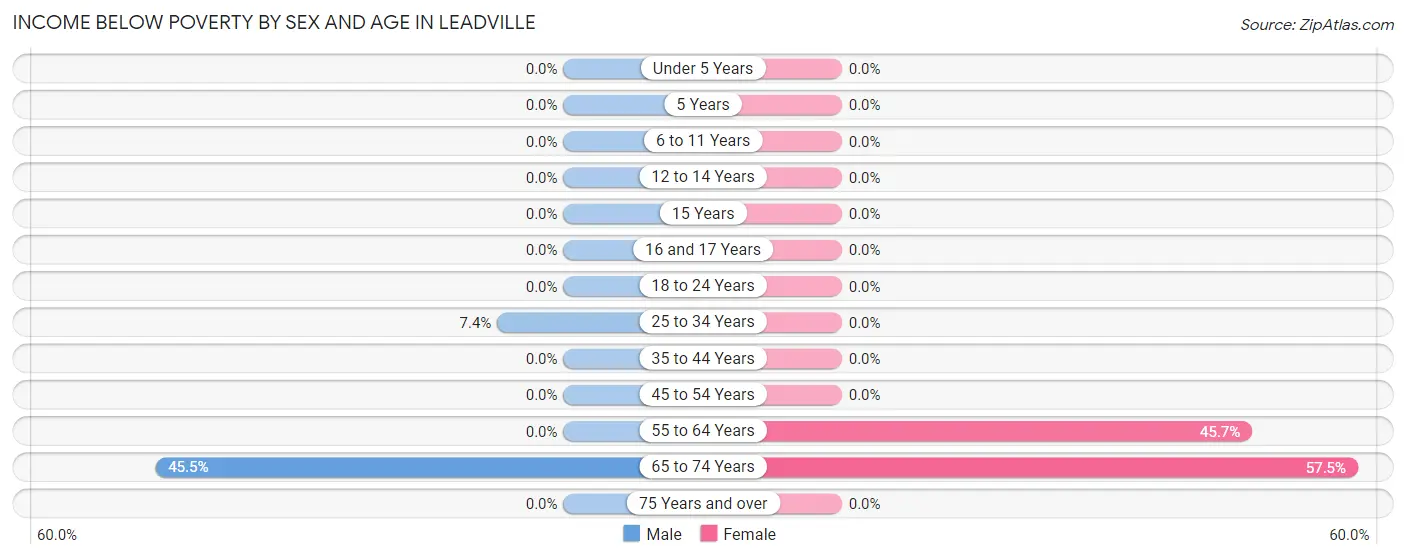
Income Below Poverty by Sex and Age in Leadville
With 3.0% poverty level for males and 11.4% for females among the residents of Leadville, 65 to 74 year old males and 65 to 74 year old females are the most vulnerable to poverty, with 20 males (45.5%) and 50 females (57.5%) in their respective age groups living below the poverty level.
| Age Bracket | Male | Female |
| Under 5 Years | 0 (0.0%) | 0 (0.0%) |
| 5 Years | 0 (0.0%) | 0 (0.0%) |
| 6 to 11 Years | 0 (0.0%) | 0 (0.0%) |
| 12 to 14 Years | 0 (0.0%) | 0 (0.0%) |
| 15 Years | 0 (0.0%) | 0 (0.0%) |
| 16 and 17 Years | 0 (0.0%) | 0 (0.0%) |
| 18 to 24 Years | 0 (0.0%) | 0 (0.0%) |
| 25 to 34 Years | 16 (7.4%) | 0 (0.0%) |
| 35 to 44 Years | 0 (0.0%) | 0 (0.0%) |
| 45 to 54 Years | 0 (0.0%) | 0 (0.0%) |
| 55 to 64 Years | 0 (0.0%) | 106 (45.7%) |
| 65 to 74 Years | 20 (45.5%) | 50 (57.5%) |
| 75 Years and over | 0 (0.0%) | 0 (0.0%) |
| Total | 36 (3.0%) | 156 (11.4%) |
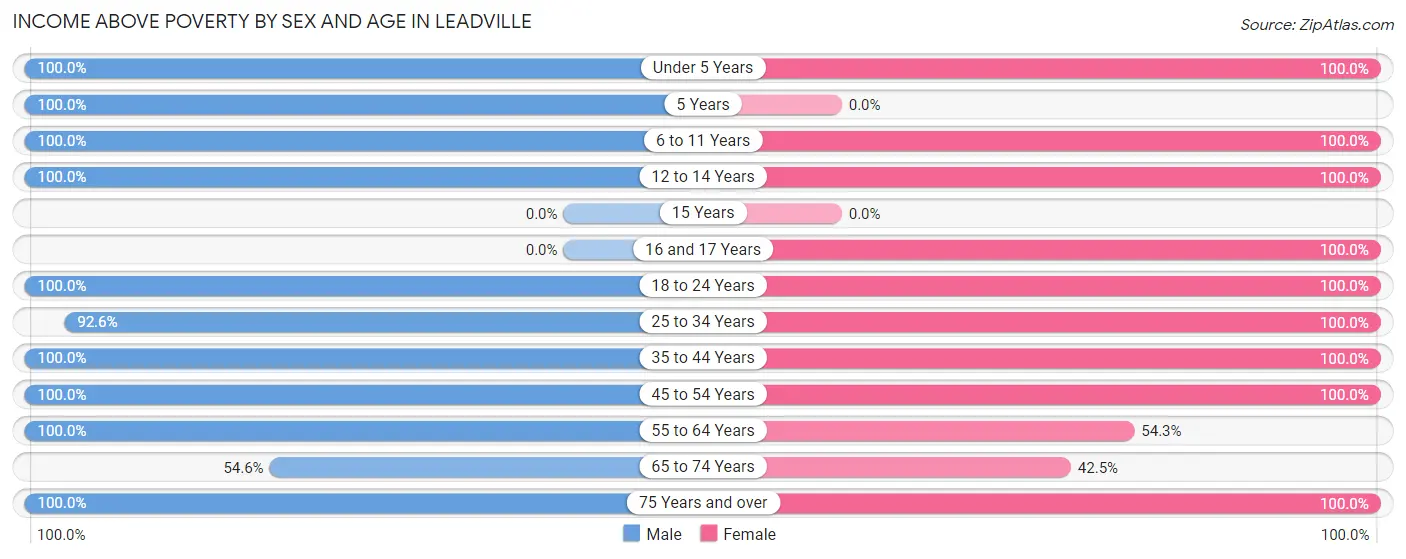
Income Above Poverty by Sex and Age in Leadville
According to the poverty statistics in Leadville, males aged under 5 years and females aged under 5 years are the age groups that are most secure financially, with 100.0% of males and 100.0% of females in these age groups living above the poverty line.
| Age Bracket | Male | Female |
| Under 5 Years | 29 (100.0%) | 90 (100.0%) |
| 5 Years | 13 (100.0%) | 0 (0.0%) |
| 6 to 11 Years | 133 (100.0%) | 44 (100.0%) |
| 12 to 14 Years | 53 (100.0%) | 79 (100.0%) |
| 15 Years | 0 (0.0%) | 0 (0.0%) |
| 16 and 17 Years | 0 (0.0%) | 24 (100.0%) |
| 18 to 24 Years | 51 (100.0%) | 163 (100.0%) |
| 25 to 34 Years | 201 (92.6%) | 294 (100.0%) |
| 35 to 44 Years | 265 (100.0%) | 157 (100.0%) |
| 45 to 54 Years | 305 (100.0%) | 179 (100.0%) |
| 55 to 64 Years | 10 (100.0%) | 126 (54.3%) |
| 65 to 74 Years | 24 (54.5%) | 37 (42.5%) |
| 75 Years and over | 77 (100.0%) | 23 (100.0%) |
| Total | 1,161 (97.0%) | 1,216 (88.6%) |
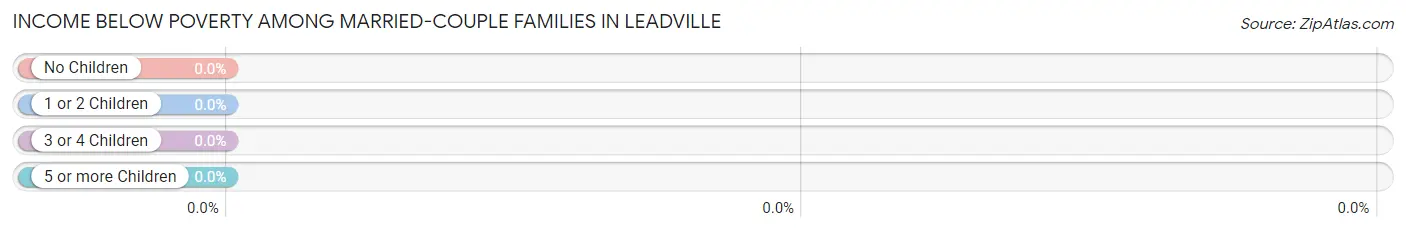
Income Below Poverty Among Married-Couple Families in Leadville
| Children | Above Poverty | Below Poverty |
| No Children | 169 (100.0%) | 0 (0.0%) |
| 1 or 2 Children | 109 (100.0%) | 0 (0.0%) |
| 3 or 4 Children | 38 (100.0%) | 0 (0.0%) |
| 5 or more Children | 0 (0.0%) | 0 (0.0%) |
| Total | 316 (100.0%) | 0 (0.0%) |
Income Below Poverty Among Single-Parent Households in Leadville
| Children | Single Father | Single Mother |
| No Children | 0 (0.0%) | 0 (0.0%) |
| 1 or 2 Children | 0 (0.0%) | 0 (0.0%) |
| 3 or 4 Children | 0 (0.0%) | 0 (0.0%) |
| 5 or more Children | 0 (0.0%) | 0 (0.0%) |
| Total | 0 (0.0%) | 0 (0.0%) |
Income Below Poverty Among Married-Couple vs Single-Parent Households in Leadville
| Children | Married-Couple Families | Single-Parent Households |
| No Children | 0 (0.0%) | 0 (0.0%) |
| 1 or 2 Children | 0 (0.0%) | 0 (0.0%) |
| 3 or 4 Children | 0 (0.0%) | 0 (0.0%) |
| 5 or more Children | 0 (0.0%) | 0 (0.0%) |
| Total | 0 (0.0%) | 0 (0.0%) |
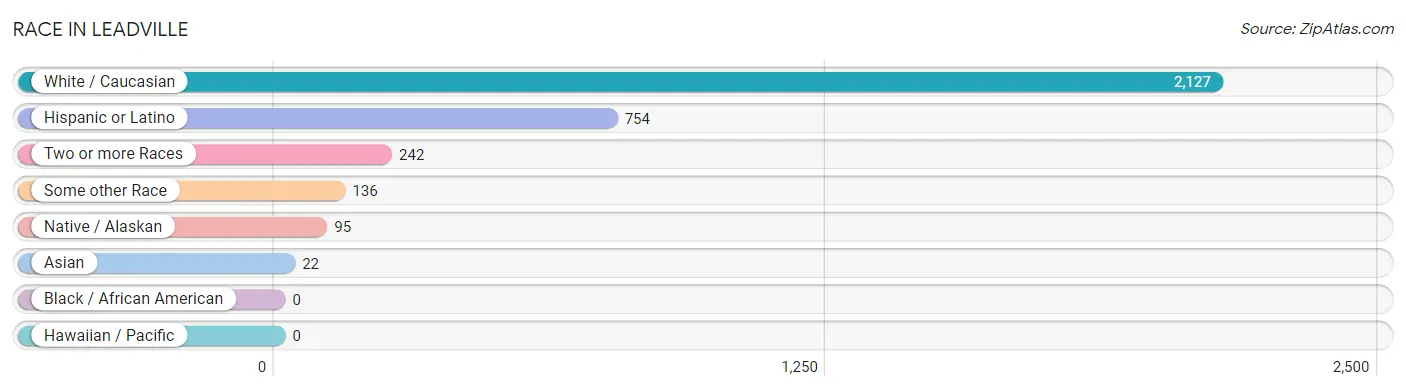
Race in Leadville
The most populous races in Leadville are White / Caucasian (2,127 | 81.1%), Hispanic or Latino (754 | 28.8%), and Two or more Races (242 | 9.2%).
| Race | # Population | % Population |
| Asian | 22 | 0.8% |
| Black / African American | 0 | 0.0% |
| Hawaiian / Pacific | 0 | 0.0% |
| Hispanic or Latino | 754 | 28.8% |
| Native / Alaskan | 95 | 3.6% |
| White / Caucasian | 2,127 | 81.1% |
| Two or more Races | 242 | 9.2% |
| Some other Race | 136 | 5.2% |
| Total | 2,622 | 100.0% |
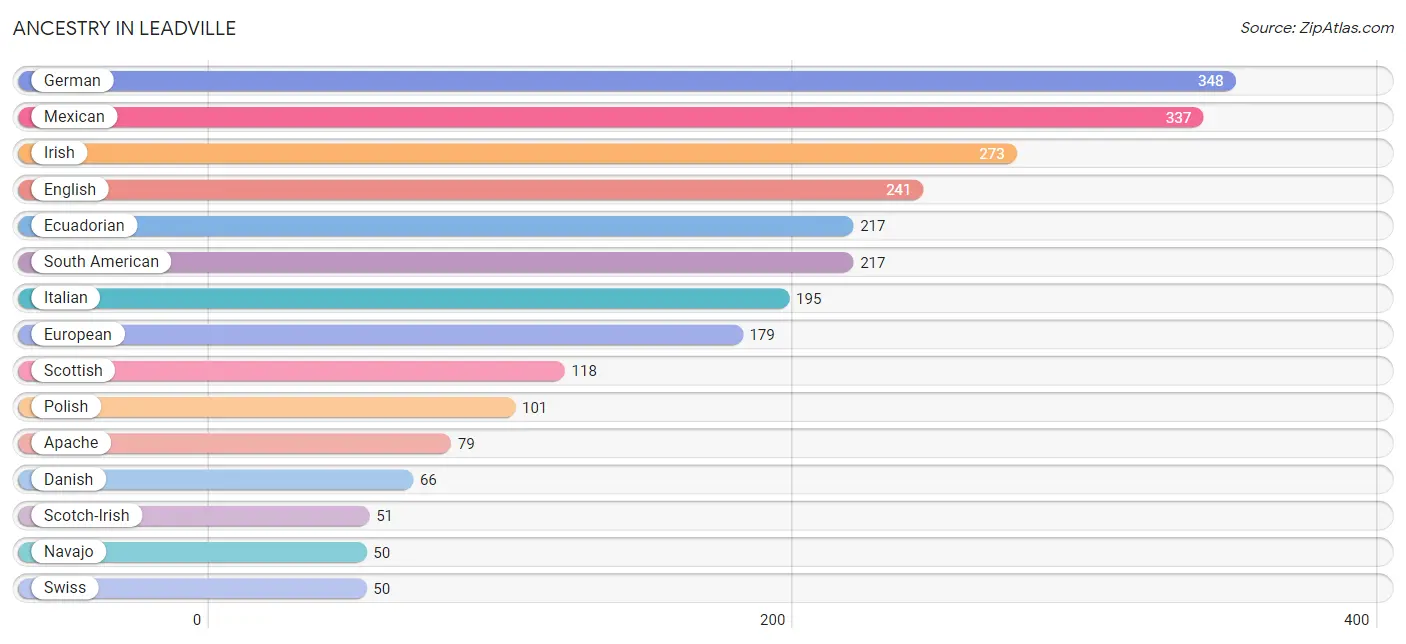
Ancestry in Leadville
The most populous ancestries reported in Leadville are German (348 | 13.3%), Mexican (337 | 12.9%), Irish (273 | 10.4%), English (241 | 9.2%), and Ecuadorian (217 | 8.3%), together accounting for 54.0% of all Leadville residents.
| Ancestry | # Population | % Population |
| Apache | 79 | 3.0% |
| Austrian | 11 | 0.4% |
| Bhutanese | 7 | 0.3% |
| Burmese | 13 | 0.5% |
| Canadian | 12 | 0.5% |
| Central American | 30 | 1.1% |
| Chinese | 10 | 0.4% |
| Chippewa | 2 | 0.1% |
| Danish | 66 | 2.5% |
| Dutch | 46 | 1.8% |
| Ecuadorian | 217 | 8.3% |
| English | 241 | 9.2% |
| European | 179 | 6.8% |
| French | 35 | 1.3% |
| French Canadian | 19 | 0.7% |
| German | 348 | 13.3% |
| Guatemalan | 30 | 1.1% |
| Guyanese | 9 | 0.3% |
| Hungarian | 2 | 0.1% |
| Indian (Asian) | 23 | 0.9% |
| Irish | 273 | 10.4% |
| Italian | 195 | 7.4% |
| Lithuanian | 20 | 0.8% |
| Mexican | 337 | 12.9% |
| Navajo | 50 | 1.9% |
| Norwegian | 30 | 1.1% |
| Polish | 101 | 3.8% |
| Scotch-Irish | 51 | 1.9% |
| Scottish | 118 | 4.5% |
| Sioux | 25 | 0.9% |
| Slovene | 19 | 0.7% |
| South American | 217 | 8.3% |
| Spaniard | 1 | 0.0% |
| Spanish | 49 | 1.9% |
| Swedish | 25 | 0.9% |
| Swiss | 50 | 1.9% |
| Thai | 9 | 0.3% | View All 37 Rows |
Immigrants in Leadville
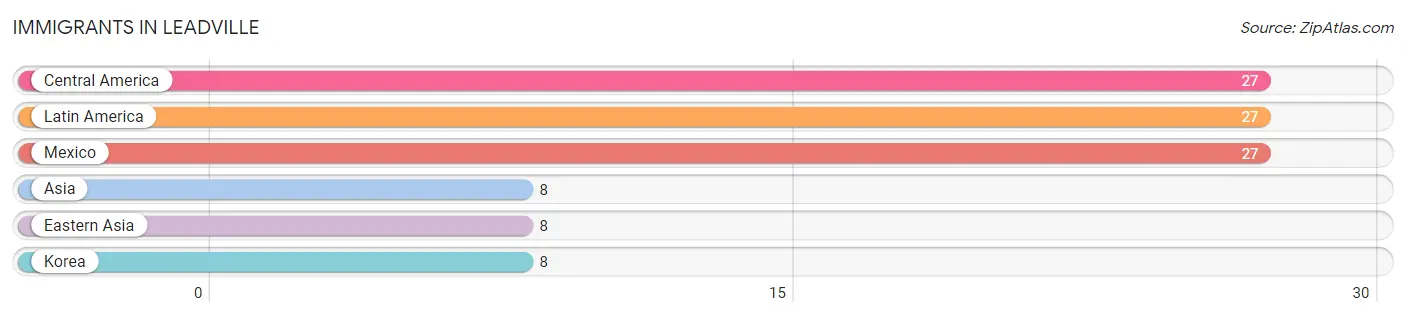
The most numerous immigrant groups reported in Leadville came from Central America (27 | 1.0%), Latin America (27 | 1.0%), Mexico (27 | 1.0%), Asia (8 | 0.3%), and Eastern Asia (8 | 0.3%), together accounting for 3.7% of all Leadville residents.
| Immigration Origin | # Population | % Population |
| Asia | 8 | 0.3% |
| Central America | 27 | 1.0% |
| Eastern Asia | 8 | 0.3% |
| Korea | 8 | 0.3% |
| Latin America | 27 | 1.0% |
| Mexico | 27 | 1.0% | View All 6 Rows |
Sex and Age in Leadville
Sex and Age in Leadville
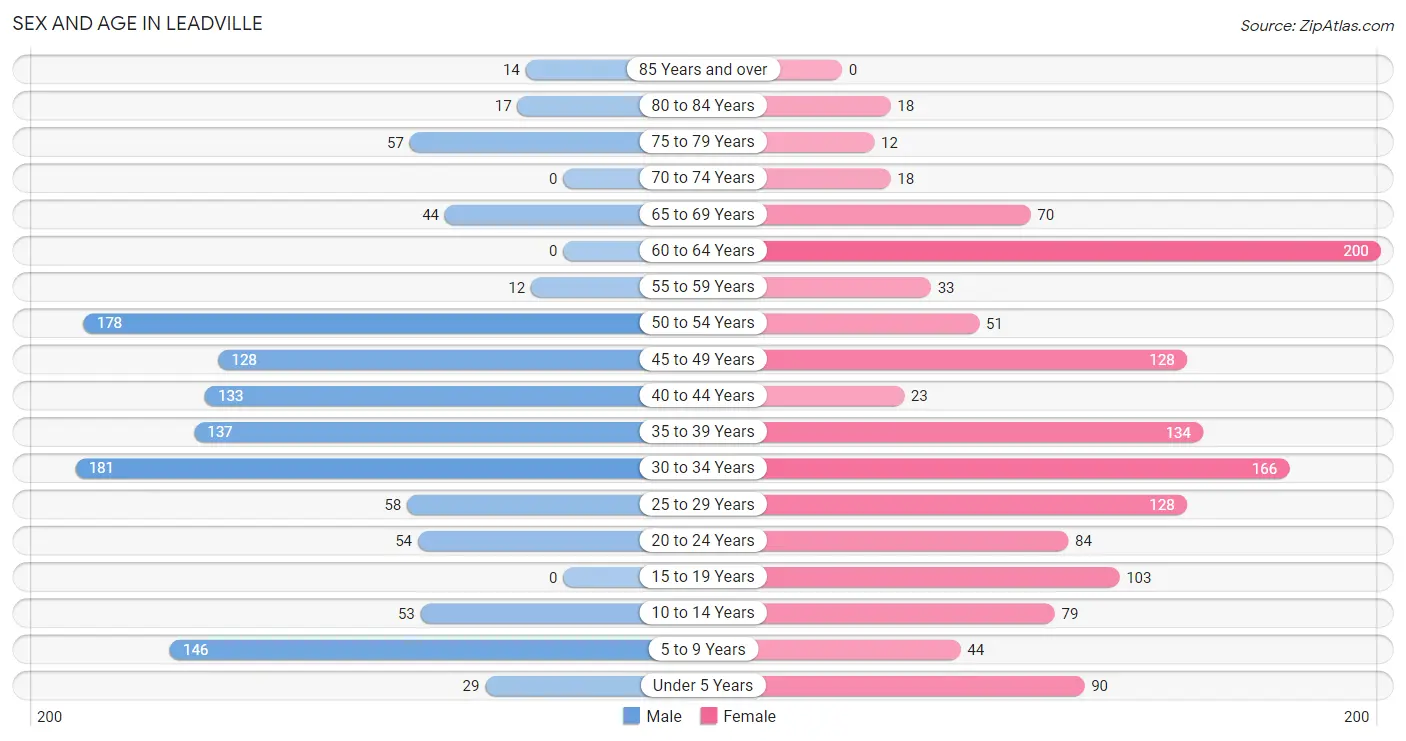
The most populous age groups in Leadville are 30 to 34 Years (181 | 14.6%) for men and 60 to 64 Years (200 | 14.5%) for women.
| Age Bracket | Male | Female |
| Under 5 Years | 29 (2.3%) | 90 (6.5%) |
| 5 to 9 Years | 146 (11.8%) | 44 (3.2%) |
| 10 to 14 Years | 53 (4.3%) | 79 (5.7%) |
| 15 to 19 Years | 0 (0.0%) | 103 (7.5%) |
| 20 to 24 Years | 54 (4.3%) | 84 (6.1%) |
| 25 to 29 Years | 58 (4.7%) | 128 (9.3%) |
| 30 to 34 Years | 181 (14.6%) | 166 (12.0%) |
| 35 to 39 Years | 137 (11.0%) | 134 (9.7%) |
| 40 to 44 Years | 133 (10.7%) | 23 (1.7%) |
| 45 to 49 Years | 128 (10.3%) | 128 (9.3%) |
| 50 to 54 Years | 178 (14.3%) | 51 (3.7%) |
| 55 to 59 Years | 12 (1.0%) | 33 (2.4%) |
| 60 to 64 Years | 0 (0.0%) | 200 (14.5%) |
| 65 to 69 Years | 44 (3.5%) | 70 (5.1%) |
| 70 to 74 Years | 0 (0.0%) | 18 (1.3%) |
| 75 to 79 Years | 57 (4.6%) | 12 (0.9%) |
| 80 to 84 Years | 17 (1.4%) | 18 (1.3%) |
| 85 Years and over | 14 (1.1%) | 0 (0.0%) |
| Total | 1,241 (100.0%) | 1,381 (100.0%) |
Families and Households in Leadville
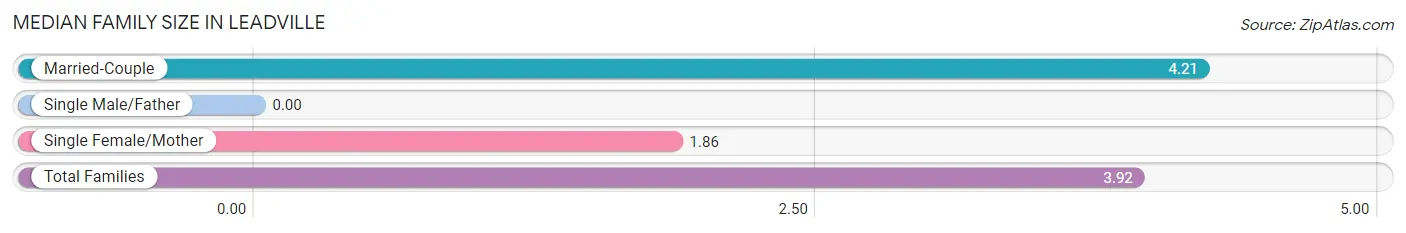
Median Family Size in Leadville
| Family Type | # Families | Family Size |
| Married-Couple | 316 (87.8%) | 4.21 |
| Single Male/Father | 0 (0.0%) | - |
| Single Female/Mother | 44 (12.2%) | 1.86 |
| Total Families | 360 (100.0%) | 3.92 |
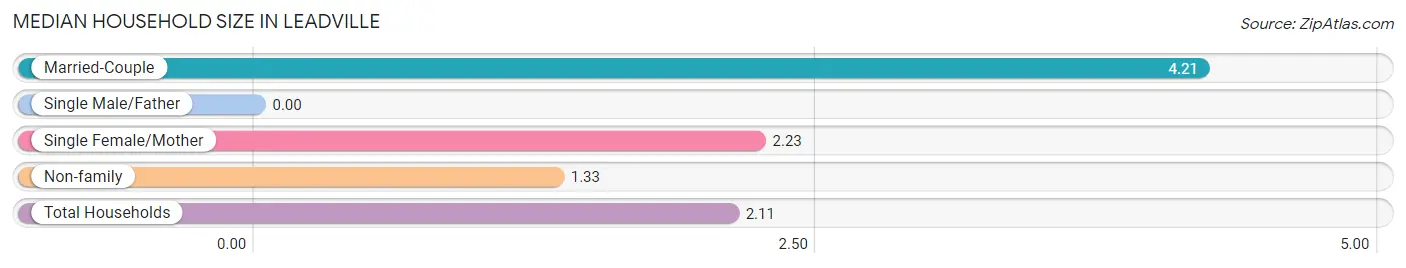
Median Household Size in Leadville
| Household Type | # Households | Household Size |
| Married-Couple | 316 (25.9%) | 4.21 |
| Single Male/Father | 0 (0.0%) | - |
| Single Female/Mother | 44 (3.6%) | 2.23 |
| Non-family | 860 (70.5%) | 1.33 |
| Total Households | 1,220 (100.0%) | 2.11 |
Household Size by Marriage Status in Leadville
Out of a total of 1,220 households in Leadville, 360 (29.5%) are family households, while 860 (70.5%) are nonfamily households. The most numerous type of family households are 2-person households, comprising 156, and the most common type of nonfamily households are 1-person households, comprising 693.
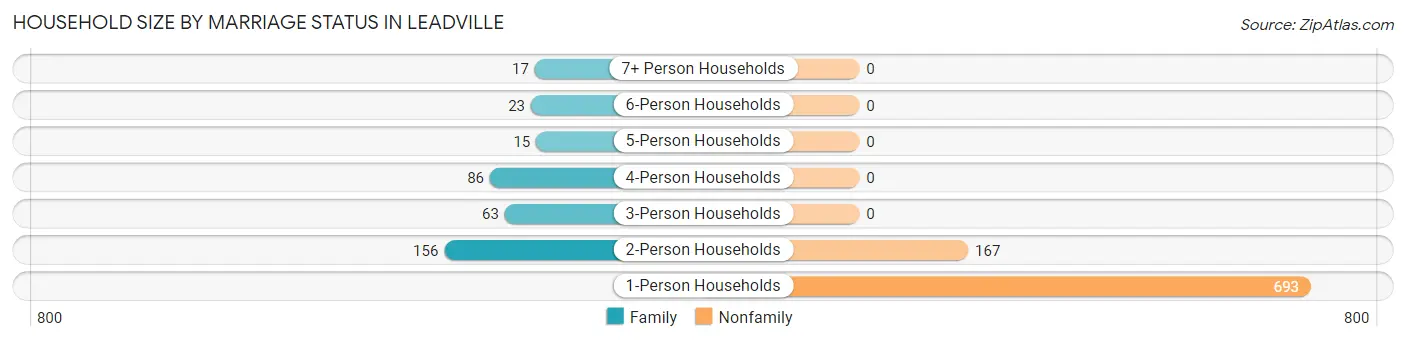
| Household Size | Family Households | Nonfamily Households |
| 1-Person Households | - | 693 (56.8%) |
| 2-Person Households | 156 (12.8%) | 167 (13.7%) |
| 3-Person Households | 63 (5.2%) | 0 (0.0%) |
| 4-Person Households | 86 (7.0%) | 0 (0.0%) |
| 5-Person Households | 15 (1.2%) | 0 (0.0%) |
| 6-Person Households | 23 (1.9%) | 0 (0.0%) |
| 7+ Person Households | 17 (1.4%) | 0 (0.0%) |
| Total | 360 (29.5%) | 860 (70.5%) |
Female Fertility in Leadville
Fertility by Age in Leadville
| Age Bracket | Women with Births | Births / 1,000 Women |
| 15 to 19 years | 0 (0.0%) | 0.0 |
| 20 to 34 years | 0 (0.0%) | 0.0 |
| 35 to 50 years | 0 (0.0%) | 0.0 |
| Total | 0 (0.0%) | 0.0 |
Fertility by Age by Marriage Status in Leadville
| Age Bracket | Married | Unmarried |
| 15 to 19 years | 0 (0.0%) | 0 (0.0%) |
| 20 to 34 years | 0 (0.0%) | 0 (0.0%) |
| 35 to 50 years | 0 (0.0%) | 0 (0.0%) |
| Total | 0 (0.0%) | 0 (0.0%) |
Fertility by Education in Leadville
| Educational Attainment | Women with Births | Births / 1,000 Women |
| Less than High School | 0 (0.0%) | 0.0 |
| High School Diploma | 0 (0.0%) | 0.0 |
| College or Associate's Degree | 0 (0.0%) | 0.0 |
| Bachelor's Degree | 0 (0.0%) | 0.0 |
| Graduate Degree | 0 (0.0%) | 0.0 |
| Total | 0 (0.0%) | 0.0 |
Fertility by Education by Marriage Status in Leadville
| Educational Attainment | Married | Unmarried |
| Less than High School | 0 (0.0%) | 0 (0.0%) |
| High School Diploma | 0 (0.0%) | 0 (0.0%) |
| College or Associate's Degree | 0 (0.0%) | 0 (0.0%) |
| Bachelor's Degree | 0 (0.0%) | 0 (0.0%) |
| Graduate Degree | 0 (0.0%) | 0 (0.0%) |
| Total | 0 (0.0%) | 0 (0.0%) |
Employment Characteristics in Leadville
Employment by Class of Employer in Leadville
Among the 1,852 employed individuals in Leadville, private company employees (1,090 | 58.9%), not-for-profit organizations (196 | 10.6%), and local government employees (158 | 8.5%) make up the most common classes of employment.
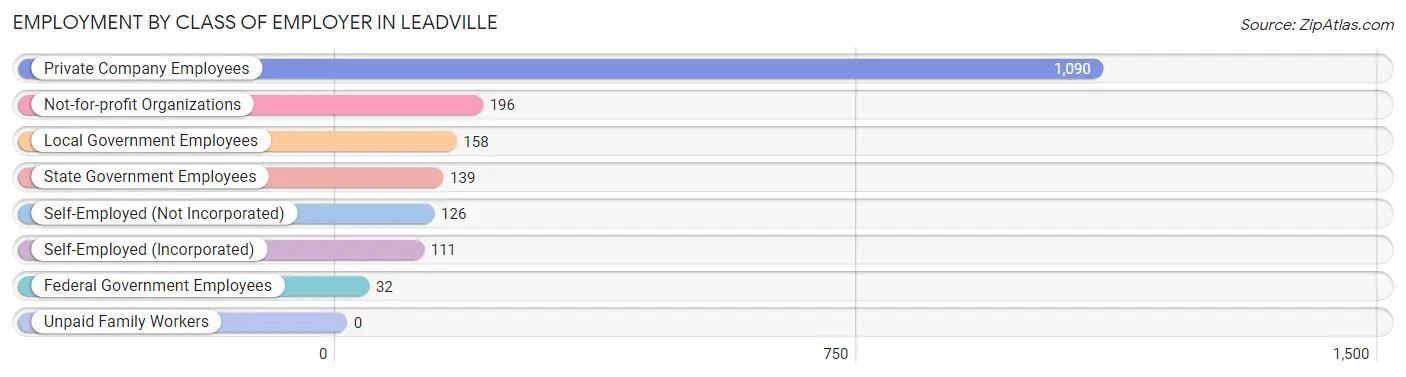
| Employer Class | # Employees | % Employees |
| Private Company Employees | 1,090 | 58.9% |
| Self-Employed (Incorporated) | 111 | 6.0% |
| Self-Employed (Not Incorporated) | 126 | 6.8% |
| Not-for-profit Organizations | 196 | 10.6% |
| Local Government Employees | 158 | 8.5% |
| State Government Employees | 139 | 7.5% |
| Federal Government Employees | 32 | 1.7% |
| Unpaid Family Workers | 0 | 0.0% |
| Total | 1,852 | 100.0% |
Employment Status by Age in Leadville
According to the labor force statistics for Leadville, out of the total population over 16 years of age (2,181), 89.2% or 1,945 individuals are in the labor force, with 2.3% or 45 of them unemployed. The age group with the highest labor force participation rate is 25 to 29 years, with 100.0% or 186 individuals in the labor force. Within the labor force, the 55 to 59 years age range has the highest percentage of unemployed individuals, with 18.6% or 8 of them being unemployed.
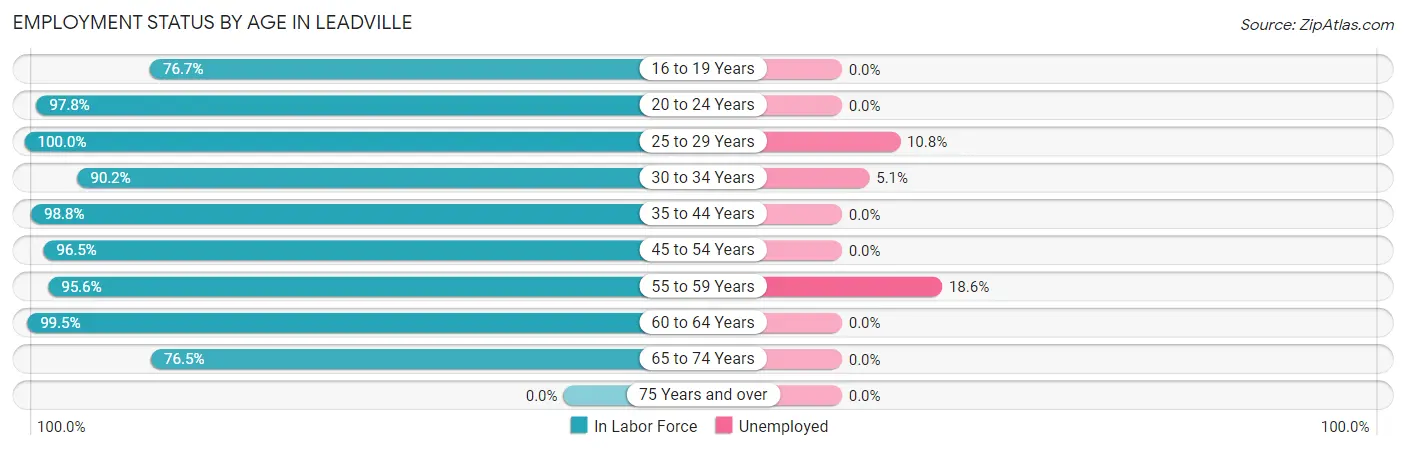
| Age Bracket | In Labor Force | Unemployed |
| 16 to 19 Years | 79 (76.7%) | 0 (0.0%) |
| 20 to 24 Years | 135 (97.8%) | 0 (0.0%) |
| 25 to 29 Years | 186 (100.0%) | 20 (10.8%) |
| 30 to 34 Years | 313 (90.2%) | 16 (5.1%) |
| 35 to 44 Years | 422 (98.8%) | 0 (0.0%) |
| 45 to 54 Years | 468 (96.5%) | 0 (0.0%) |
| 55 to 59 Years | 43 (95.6%) | 8 (18.6%) |
| 60 to 64 Years | 199 (99.5%) | 0 (0.0%) |
| 65 to 74 Years | 101 (76.5%) | 0 (0.0%) |
| 75 Years and over | 0 (0.0%) | 0 (0.0%) |
| Total | 1,945 (89.2%) | 45 (2.3%) |
Employment Status by Educational Attainment in Leadville
According to labor force statistics for Leadville, 96.5% of individuals (1,631) out of the total population between 25 and 64 years of age (1,690) are in the labor force, with 2.7% or 44 of them being unemployed. The group with the highest labor force participation rate are those with the educational attainment of bachelor's degree or higher, with 98.9% or 1,020 individuals in the labor force. Within the labor force, individuals with high school diploma education have the highest percentage of unemployment, with 6.9% or 16 of them being unemployed.
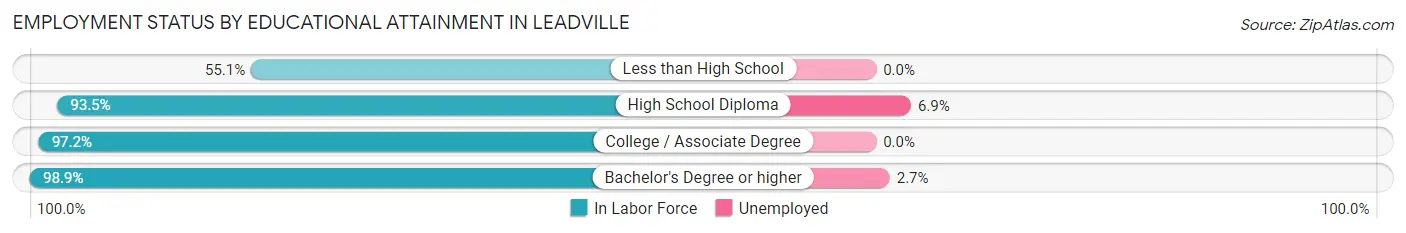
| Educational Attainment | In Labor Force | Unemployed |
| Less than High School | 27 (55.1%) | 0 (0.0%) |
| High School Diploma | 232 (93.5%) | 17 (6.9%) |
| College / Associate Degree | 352 (97.2%) | 0 (0.0%) |
| Bachelor's Degree or higher | 1,020 (98.9%) | 28 (2.7%) |
| Total | 1,631 (96.5%) | 46 (2.7%) |
Employment Occupations by Sex in Leadville
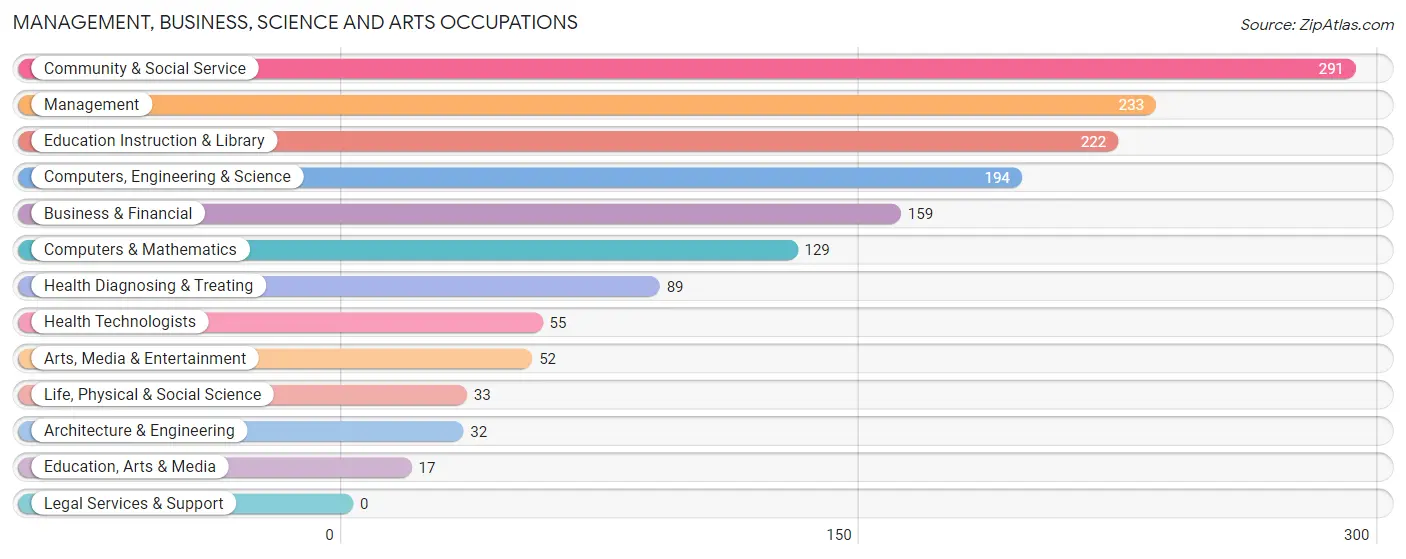
Management, Business, Science and Arts Occupations
The most common Management, Business, Science and Arts occupations in Leadville are Community & Social Service (291 | 15.3%), Management (233 | 12.2%), Education Instruction & Library (222 | 11.7%), Computers, Engineering & Science (194 | 10.2%), and Business & Financial (159 | 8.4%).
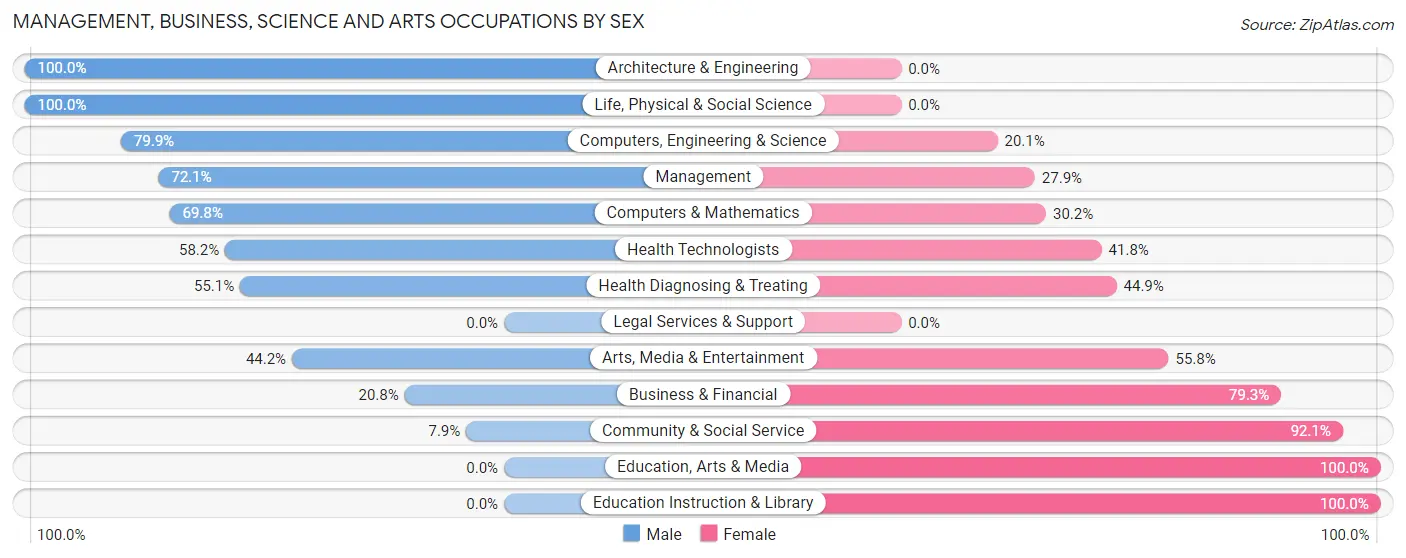
Management, Business, Science and Arts Occupations by Sex
Within the Management, Business, Science and Arts occupations in Leadville, the most male-oriented occupations are Architecture & Engineering (100.0%), Life, Physical & Social Science (100.0%), and Computers, Engineering & Science (79.9%), while the most female-oriented occupations are Education, Arts & Media (100.0%), Education Instruction & Library (100.0%), and Community & Social Service (92.1%).
| Occupation | Male | Female |
| Management | 168 (72.1%) | 65 (27.9%) |
| Business & Financial | 33 (20.7%) | 126 (79.2%) |
| Computers, Engineering & Science | 155 (79.9%) | 39 (20.1%) |
| Computers & Mathematics | 90 (69.8%) | 39 (30.2%) |
| Architecture & Engineering | 32 (100.0%) | 0 (0.0%) |
| Life, Physical & Social Science | 33 (100.0%) | 0 (0.0%) |
| Community & Social Service | 23 (7.9%) | 268 (92.1%) |
| Education, Arts & Media | 0 (0.0%) | 17 (100.0%) |
| Legal Services & Support | 0 (0.0%) | 0 (0.0%) |
| Education Instruction & Library | 0 (0.0%) | 222 (100.0%) |
| Arts, Media & Entertainment | 23 (44.2%) | 29 (55.8%) |
| Health Diagnosing & Treating | 49 (55.1%) | 40 (44.9%) |
| Health Technologists | 32 (58.2%) | 23 (41.8%) |
| Total (Category) | 428 (44.3%) | 538 (55.7%) |
| Total (Overall) | 846 (44.5%) | 1,056 (55.5%) |
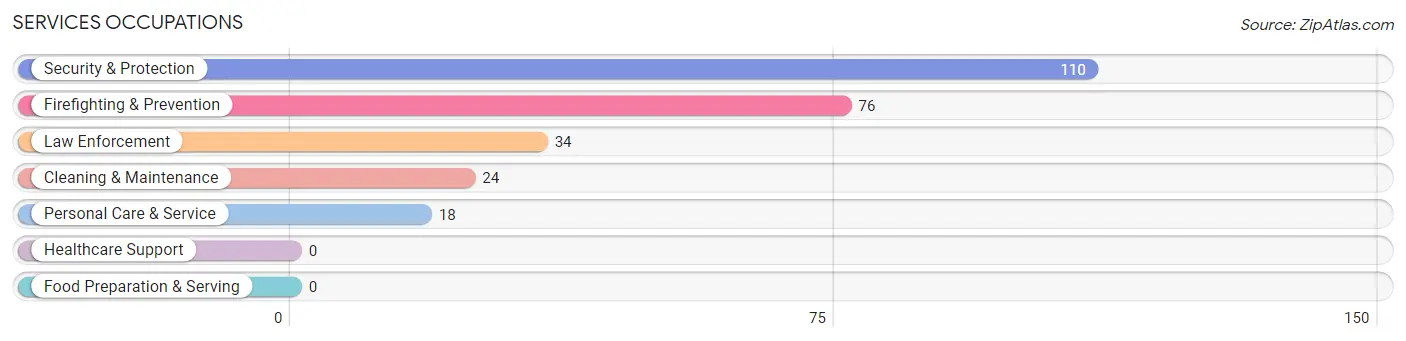
Services Occupations
The most common Services occupations in Leadville are Security & Protection (110 | 5.8%), Firefighting & Prevention (76 | 4.0%), Law Enforcement (34 | 1.8%), Cleaning & Maintenance (24 | 1.3%), and Personal Care & Service (18 | 0.9%).
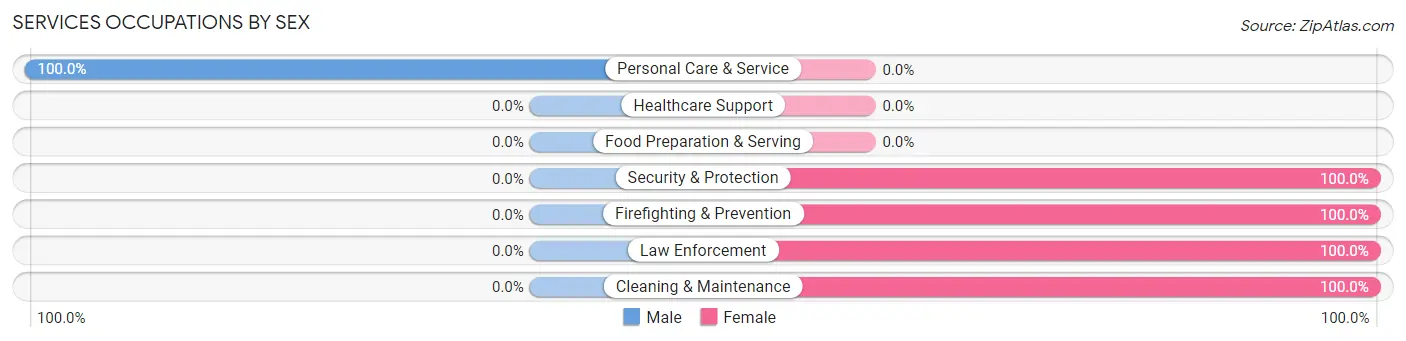
Services Occupations by Sex
| Occupation | Male | Female |
| Healthcare Support | 0 (0.0%) | 0 (0.0%) |
| Security & Protection | 0 (0.0%) | 110 (100.0%) |
| Firefighting & Prevention | 0 (0.0%) | 76 (100.0%) |
| Law Enforcement | 0 (0.0%) | 34 (100.0%) |
| Food Preparation & Serving | 0 (0.0%) | 0 (0.0%) |
| Cleaning & Maintenance | 0 (0.0%) | 24 (100.0%) |
| Personal Care & Service | 18 (100.0%) | 0 (0.0%) |
| Total (Category) | 18 (11.8%) | 134 (88.2%) |
| Total (Overall) | 846 (44.5%) | 1,056 (55.5%) |
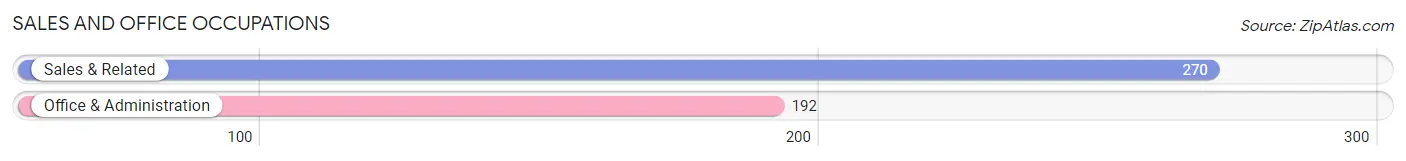
Sales and Office Occupations
The most common Sales and Office occupations in Leadville are Sales & Related (270 | 14.2%), and Office & Administration (192 | 10.1%).
Sales and Office Occupations by Sex
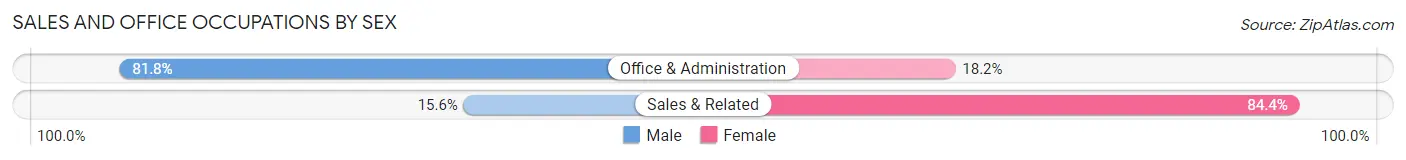
| Occupation | Male | Female |
| Sales & Related | 42 (15.6%) | 228 (84.4%) |
| Office & Administration | 157 (81.8%) | 35 (18.2%) |
| Total (Category) | 199 (43.1%) | 263 (56.9%) |
| Total (Overall) | 846 (44.5%) | 1,056 (55.5%) |
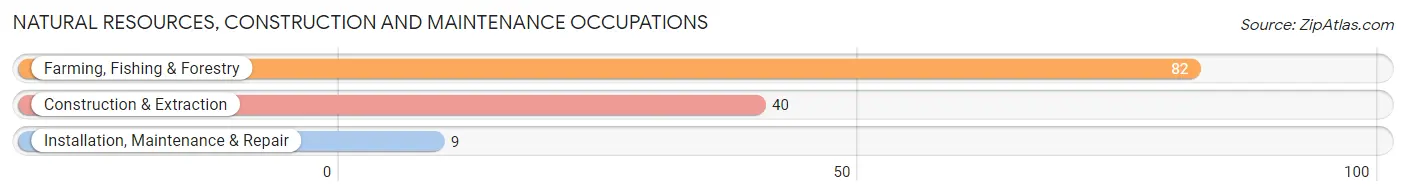
Natural Resources, Construction and Maintenance Occupations
The most common Natural Resources, Construction and Maintenance occupations in Leadville are Farming, Fishing & Forestry (82 | 4.3%), Construction & Extraction (40 | 2.1%), and Installation, Maintenance & Repair (9 | 0.5%).
Natural Resources, Construction and Maintenance Occupations by Sex
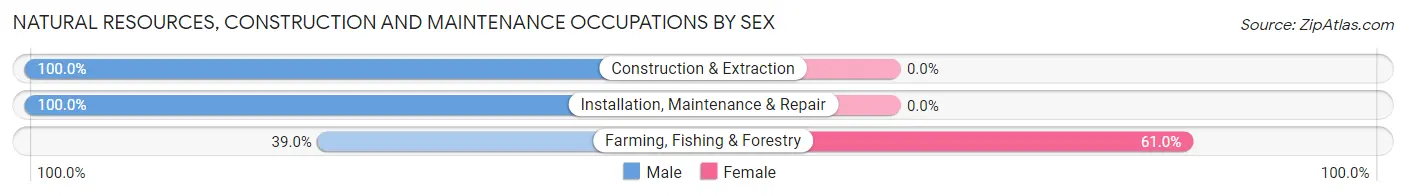
| Occupation | Male | Female |
| Farming, Fishing & Forestry | 32 (39.0%) | 50 (61.0%) |
| Construction & Extraction | 40 (100.0%) | 0 (0.0%) |
| Installation, Maintenance & Repair | 9 (100.0%) | 0 (0.0%) |
| Total (Category) | 81 (61.8%) | 50 (38.2%) |
| Total (Overall) | 846 (44.5%) | 1,056 (55.5%) |
Production, Transportation and Moving Occupations
The most common Production, Transportation and Moving occupations in Leadville are Production (105 | 5.5%), and Transportation (86 | 4.5%).
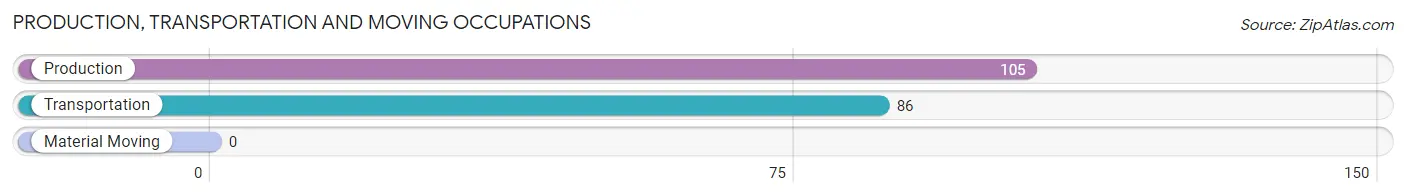
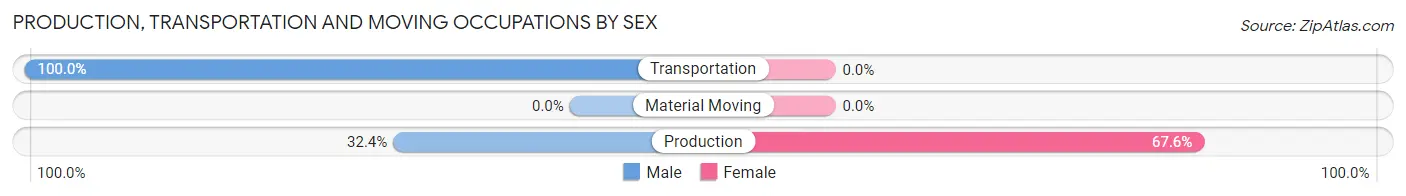
Production, Transportation and Moving Occupations by Sex
| Occupation | Male | Female |
| Production | 34 (32.4%) | 71 (67.6%) |
| Transportation | 86 (100.0%) | 0 (0.0%) |
| Material Moving | 0 (0.0%) | 0 (0.0%) |
| Total (Category) | 120 (62.8%) | 71 (37.2%) |
| Total (Overall) | 846 (44.5%) | 1,056 (55.5%) |
Employment Industries by Sex in Leadville
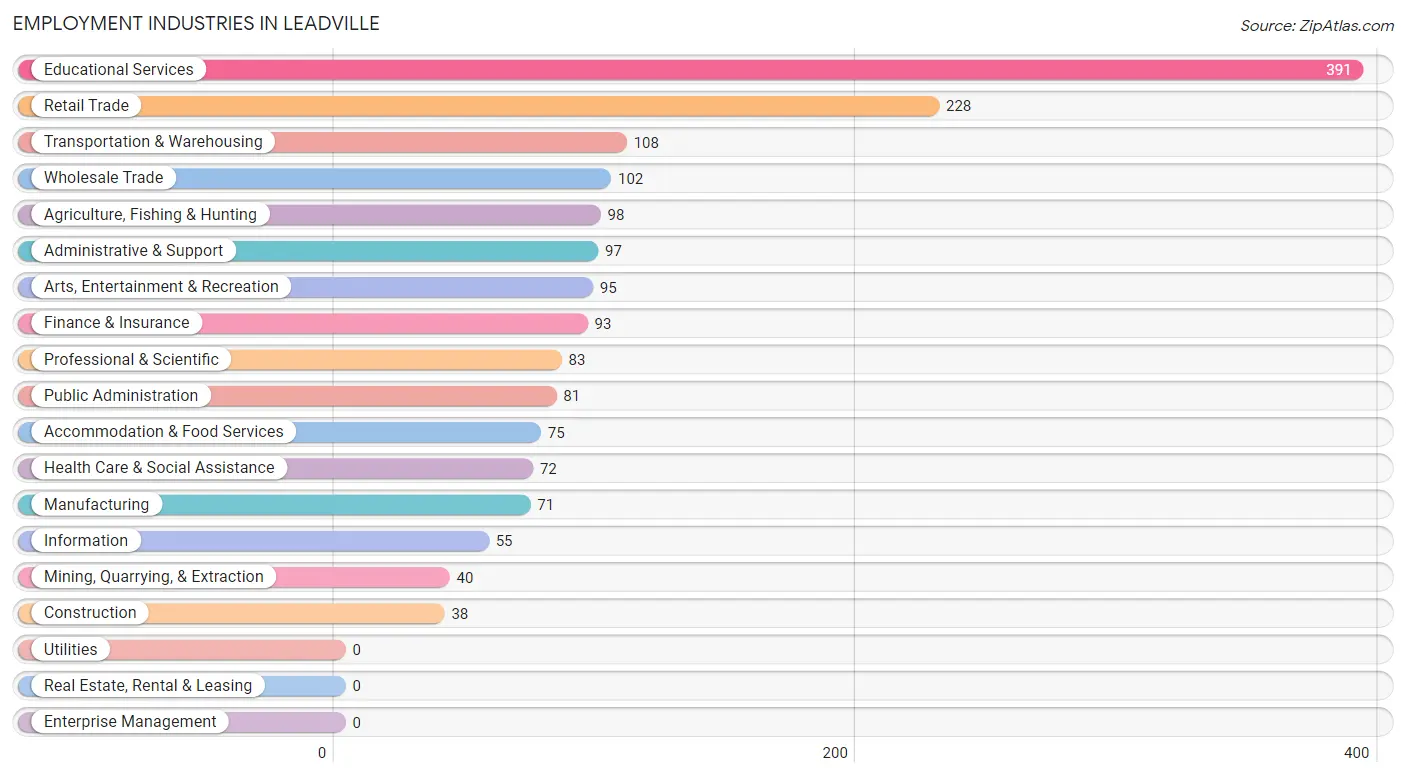
Employment Industries in Leadville
The major employment industries in Leadville include Educational Services (391 | 20.6%), Retail Trade (228 | 12.0%), Transportation & Warehousing (108 | 5.7%), Wholesale Trade (102 | 5.4%), and Agriculture, Fishing & Hunting (98 | 5.1%).
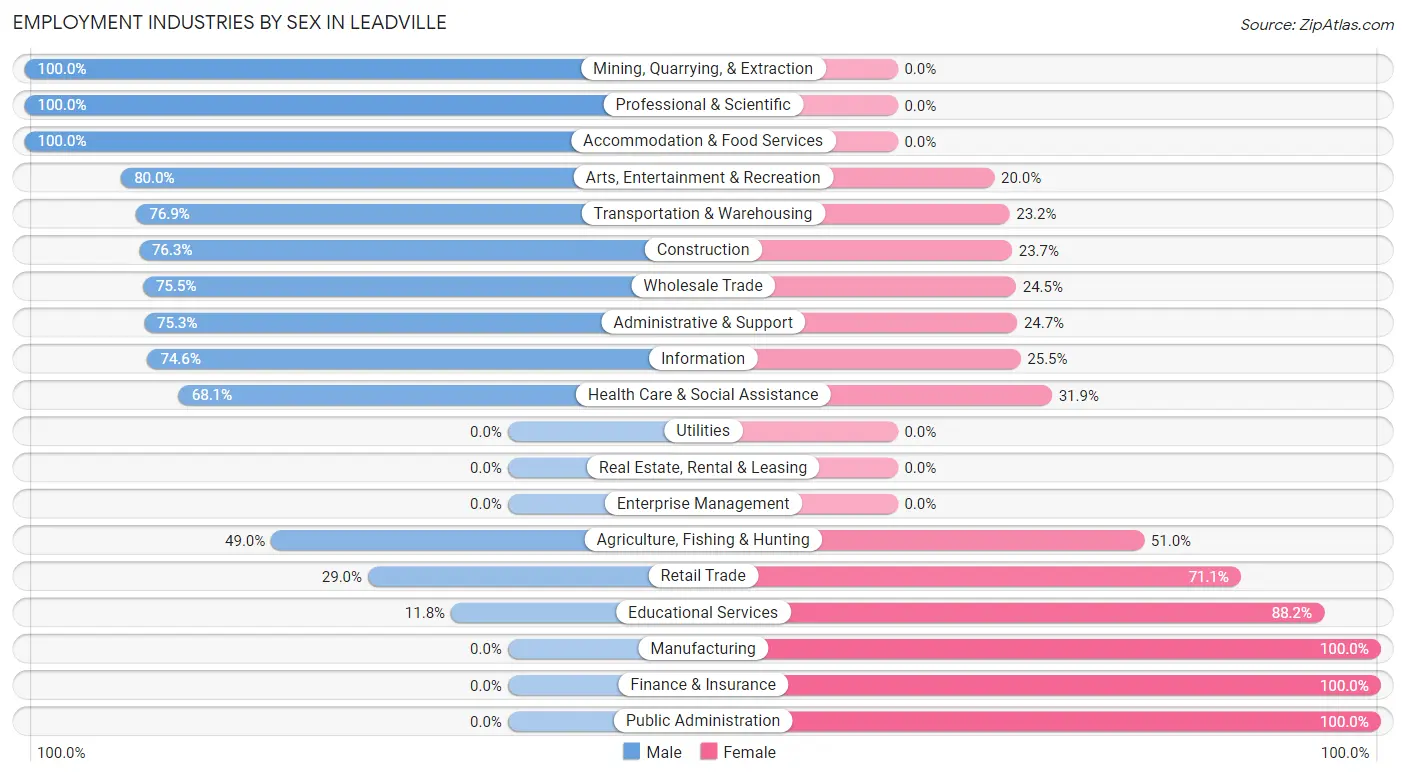
Employment Industries by Sex in Leadville
The Leadville industries that see more men than women are Mining, Quarrying, & Extraction (100.0%), Professional & Scientific (100.0%), and Accommodation & Food Services (100.0%), whereas the industries that tend to have a higher number of women are Manufacturing (100.0%), Finance & Insurance (100.0%), and Public Administration (100.0%).
| Industry | Male | Female |
| Agriculture, Fishing & Hunting | 48 (49.0%) | 50 (51.0%) |
| Mining, Quarrying, & Extraction | 40 (100.0%) | 0 (0.0%) |
| Construction | 29 (76.3%) | 9 (23.7%) |
| Manufacturing | 0 (0.0%) | 71 (100.0%) |
| Wholesale Trade | 77 (75.5%) | 25 (24.5%) |
| Retail Trade | 66 (28.9%) | 162 (71.1%) |
| Transportation & Warehousing | 83 (76.8%) | 25 (23.2%) |
| Utilities | 0 (0.0%) | 0 (0.0%) |
| Information | 41 (74.6%) | 14 (25.5%) |
| Finance & Insurance | 0 (0.0%) | 93 (100.0%) |
| Real Estate, Rental & Leasing | 0 (0.0%) | 0 (0.0%) |
| Professional & Scientific | 83 (100.0%) | 0 (0.0%) |
| Enterprise Management | 0 (0.0%) | 0 (0.0%) |
| Administrative & Support | 73 (75.3%) | 24 (24.7%) |
| Educational Services | 46 (11.8%) | 345 (88.2%) |
| Health Care & Social Assistance | 49 (68.1%) | 23 (31.9%) |
| Arts, Entertainment & Recreation | 76 (80.0%) | 19 (20.0%) |
| Accommodation & Food Services | 75 (100.0%) | 0 (0.0%) |
| Public Administration | 0 (0.0%) | 81 (100.0%) |
| Total | 846 (44.5%) | 1,056 (55.5%) |
Education in Leadville
School Enrollment in Leadville
The most common levels of schooling among the 594 students in Leadville are elementary school (156 | 26.3%), college / undergraduate (143 | 24.1%), and middle school (109 | 18.3%).
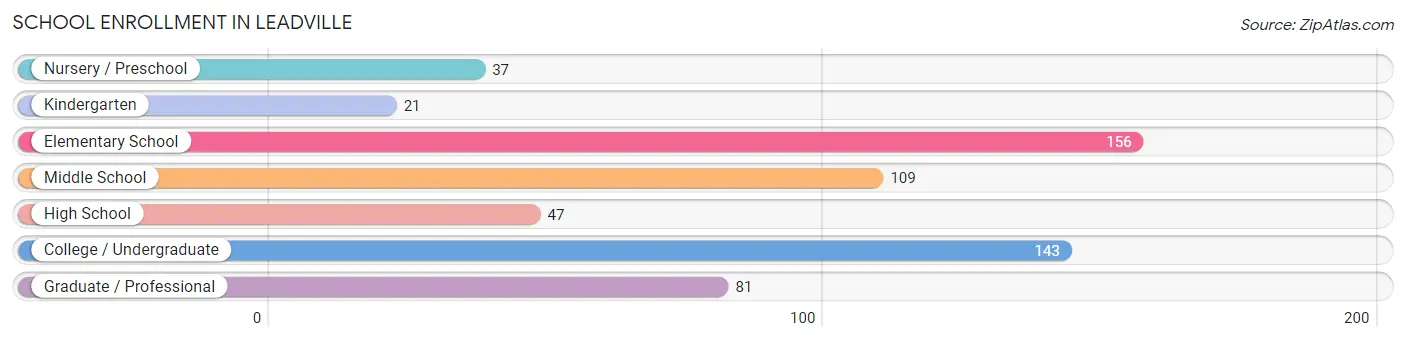
| School Level | # Students | % Students |
| Nursery / Preschool | 37 | 6.2% |
| Kindergarten | 21 | 3.5% |
| Elementary School | 156 | 26.3% |
| Middle School | 109 | 18.3% |
| High School | 47 | 7.9% |
| College / Undergraduate | 143 | 24.1% |
| Graduate / Professional | 81 | 13.6% |
| Total | 594 | 100.0% |
School Enrollment by Age by Funding Source in Leadville
Out of a total of 594 students who are enrolled in schools in Leadville, 98 (16.5%) attend a private institution, while the remaining 496 (83.5%) are enrolled in public schools. The age group of 35 years and over has the highest likelihood of being enrolled in private schools, with 47 (49.0% in the age bracket) enrolled. Conversely, the age group of 3 to 4 year olds has the lowest likelihood of being enrolled in a private school, with 24 (100.0% in the age bracket) attending a public institution.
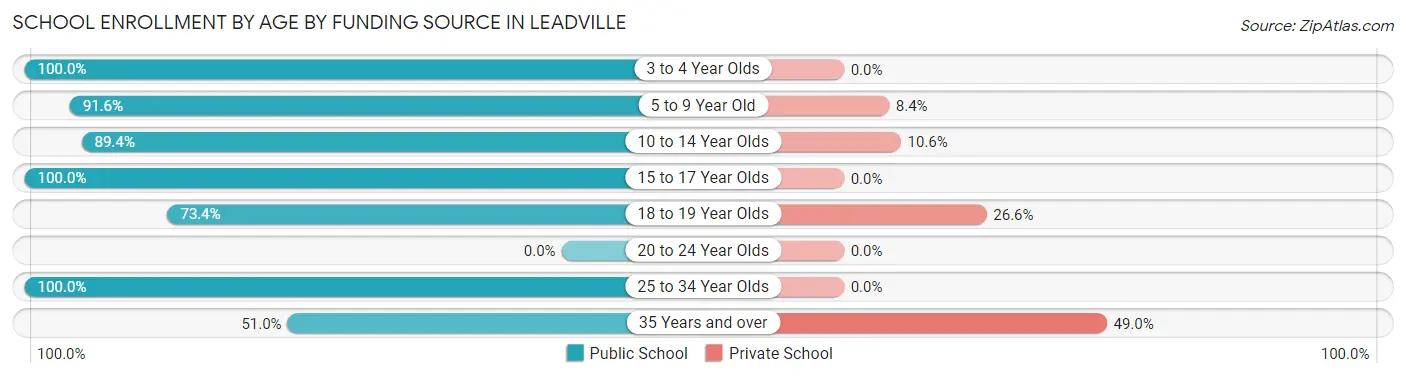
| Age Bracket | Public School | Private School |
| 3 to 4 Year Olds | 24 (100.0%) | 0 (0.0%) |
| 5 to 9 Year Old | 174 (91.6%) | 16 (8.4%) |
| 10 to 14 Year Olds | 118 (89.4%) | 14 (10.6%) |
| 15 to 17 Year Olds | 24 (100.0%) | 0 (0.0%) |
| 18 to 19 Year Olds | 58 (73.4%) | 21 (26.6%) |
| 20 to 24 Year Olds | 0 (0.0%) | 0 (0.0%) |
| 25 to 34 Year Olds | 49 (100.0%) | 0 (0.0%) |
| 35 Years and over | 49 (51.0%) | 47 (49.0%) |
| Total | 496 (83.5%) | 98 (16.5%) |
Educational Attainment by Field of Study in Leadville
Education (280 | 20.0%), computers & mathematics (185 | 13.2%), social sciences (170 | 12.1%), arts & humanities (166 | 11.9%), and bio, nature & agricultural (120 | 8.6%) are the most common fields of study among 1,399 individuals in Leadville who have obtained a bachelor's degree or higher.
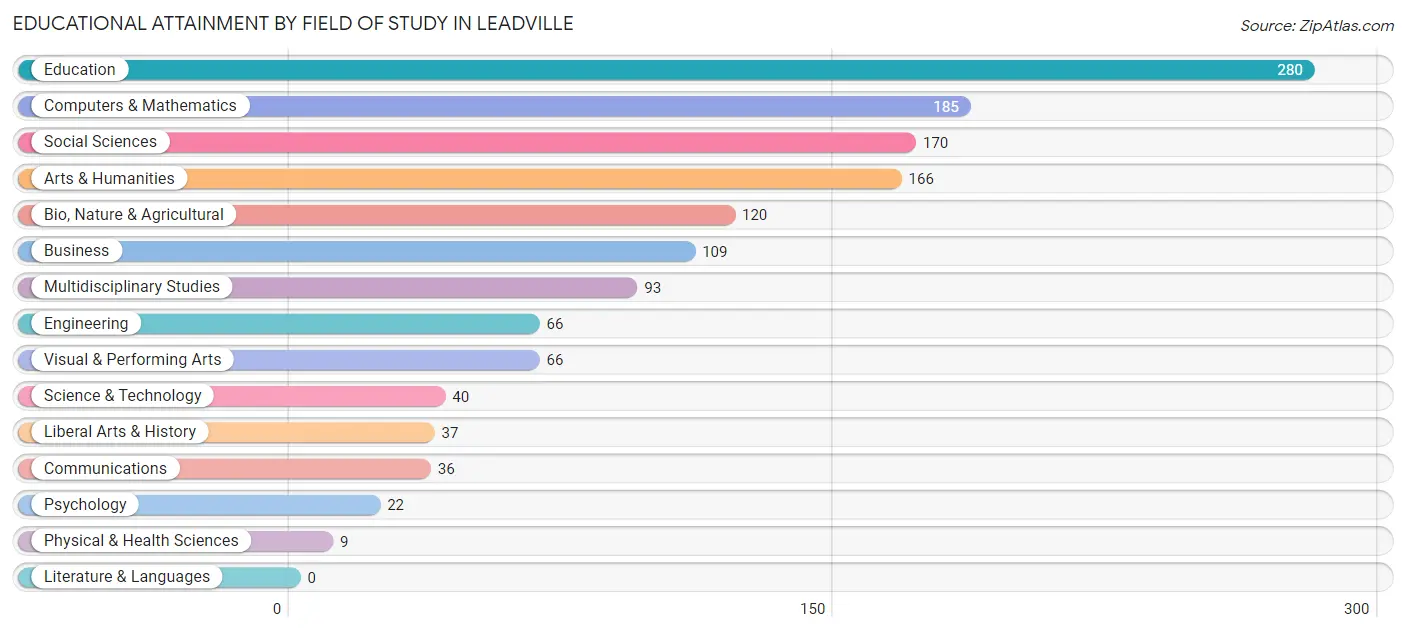
| Field of Study | # Graduates | % Graduates |
| Computers & Mathematics | 185 | 13.2% |
| Bio, Nature & Agricultural | 120 | 8.6% |
| Physical & Health Sciences | 9 | 0.6% |
| Psychology | 22 | 1.6% |
| Social Sciences | 170 | 12.1% |
| Engineering | 66 | 4.7% |
| Multidisciplinary Studies | 93 | 6.7% |
| Science & Technology | 40 | 2.9% |
| Business | 109 | 7.8% |
| Education | 280 | 20.0% |
| Literature & Languages | 0 | 0.0% |
| Liberal Arts & History | 37 | 2.6% |
| Visual & Performing Arts | 66 | 4.7% |
| Communications | 36 | 2.6% |
| Arts & Humanities | 166 | 11.9% |
| Total | 1,399 | 100.0% |
Transportation & Commute in Leadville
Vehicle Availability by Sex in Leadville
The most prevalent vehicle ownership categories in Leadville are males with 2 vehicles (404, accounting for 48.0%) and females with 2 vehicles (344, making up 40.0%).
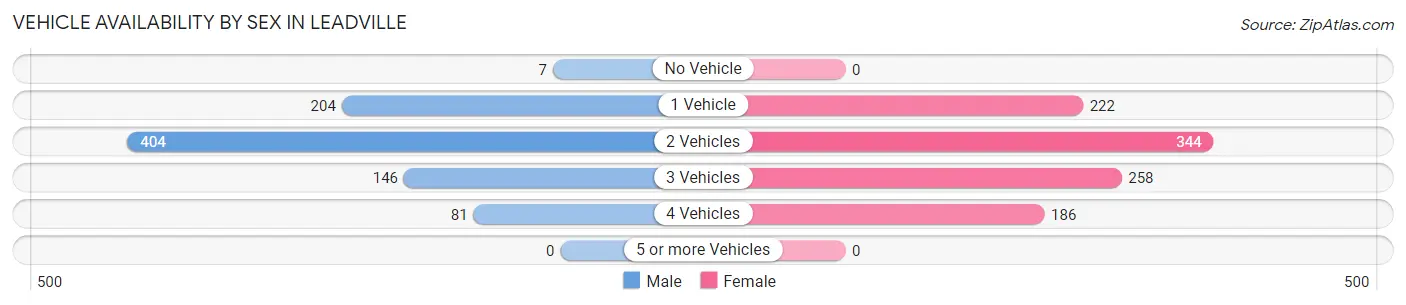
| Vehicles Available | Male | Female |
| No Vehicle | 7 (0.8%) | 0 (0.0%) |
| 1 Vehicle | 204 (24.2%) | 222 (22.0%) |
| 2 Vehicles | 404 (48.0%) | 344 (34.1%) |
| 3 Vehicles | 146 (17.3%) | 258 (25.5%) |
| 4 Vehicles | 81 (9.6%) | 186 (18.4%) |
| 5 or more Vehicles | 0 (0.0%) | 0 (0.0%) |
| Total | 842 (100.0%) | 1,010 (100.0%) |
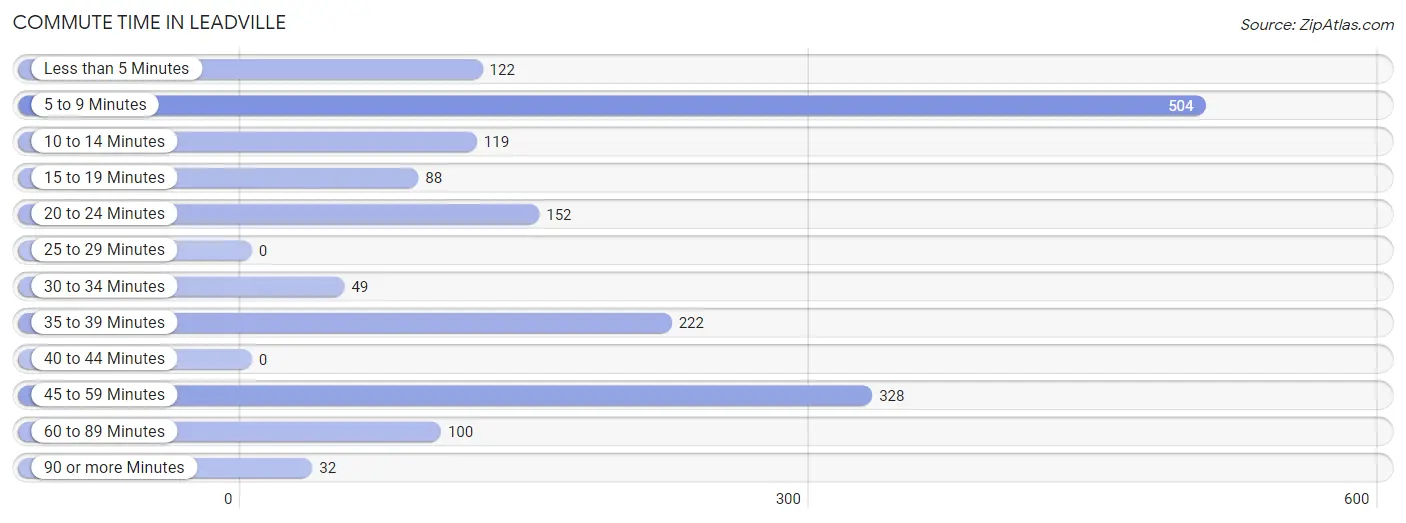
Commute Time in Leadville
The most frequently occuring commute durations in Leadville are 5 to 9 minutes (504 commuters, 29.4%), 45 to 59 minutes (328 commuters, 19.1%), and 35 to 39 minutes (222 commuters, 12.9%).
| Commute Time | # Commuters | % Commuters |
| Less than 5 Minutes | 122 | 7.1% |
| 5 to 9 Minutes | 504 | 29.4% |
| 10 to 14 Minutes | 119 | 6.9% |
| 15 to 19 Minutes | 88 | 5.1% |
| 20 to 24 Minutes | 152 | 8.9% |
| 25 to 29 Minutes | 0 | 0.0% |
| 30 to 34 Minutes | 49 | 2.9% |
| 35 to 39 Minutes | 222 | 12.9% |
| 40 to 44 Minutes | 0 | 0.0% |
| 45 to 59 Minutes | 328 | 19.1% |
| 60 to 89 Minutes | 100 | 5.8% |
| 90 or more Minutes | 32 | 1.9% |
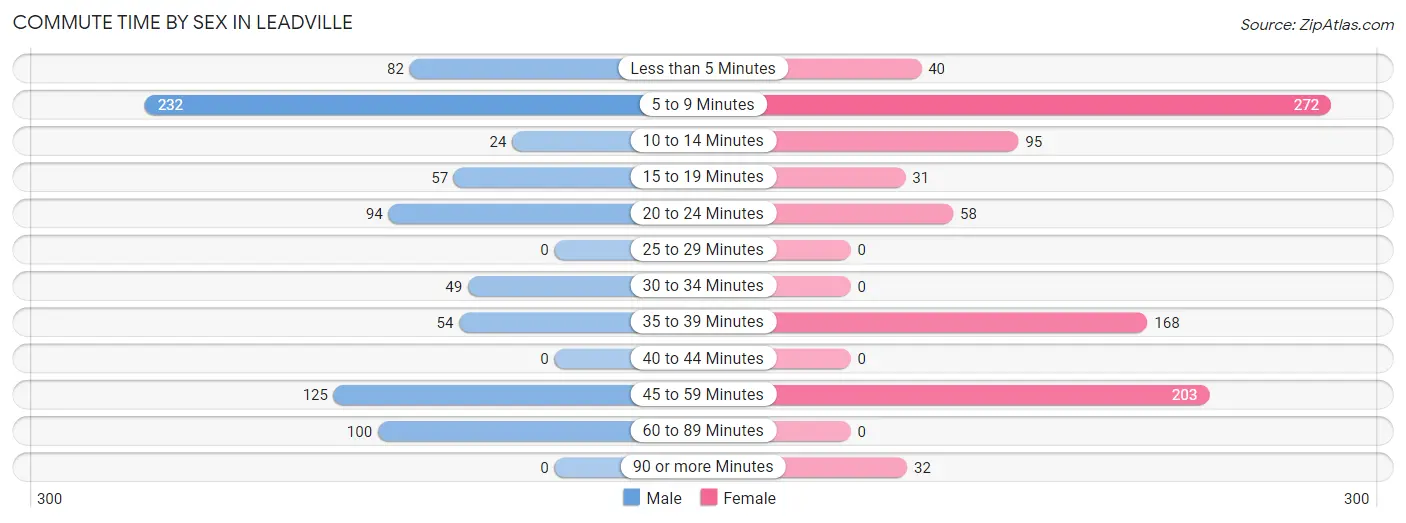
Commute Time by Sex in Leadville
The most common commute times in Leadville are 5 to 9 minutes (232 commuters, 28.4%) for males and 5 to 9 minutes (272 commuters, 30.3%) for females.
| Commute Time | Male | Female |
| Less than 5 Minutes | 82 (10.0%) | 40 (4.4%) |
| 5 to 9 Minutes | 232 (28.4%) | 272 (30.3%) |
| 10 to 14 Minutes | 24 (2.9%) | 95 (10.6%) |
| 15 to 19 Minutes | 57 (7.0%) | 31 (3.5%) |
| 20 to 24 Minutes | 94 (11.5%) | 58 (6.5%) |
| 25 to 29 Minutes | 0 (0.0%) | 0 (0.0%) |
| 30 to 34 Minutes | 49 (6.0%) | 0 (0.0%) |
| 35 to 39 Minutes | 54 (6.6%) | 168 (18.7%) |
| 40 to 44 Minutes | 0 (0.0%) | 0 (0.0%) |
| 45 to 59 Minutes | 125 (15.3%) | 203 (22.6%) |
| 60 to 89 Minutes | 100 (12.2%) | 0 (0.0%) |
| 90 or more Minutes | 0 (0.0%) | 32 (3.6%) |
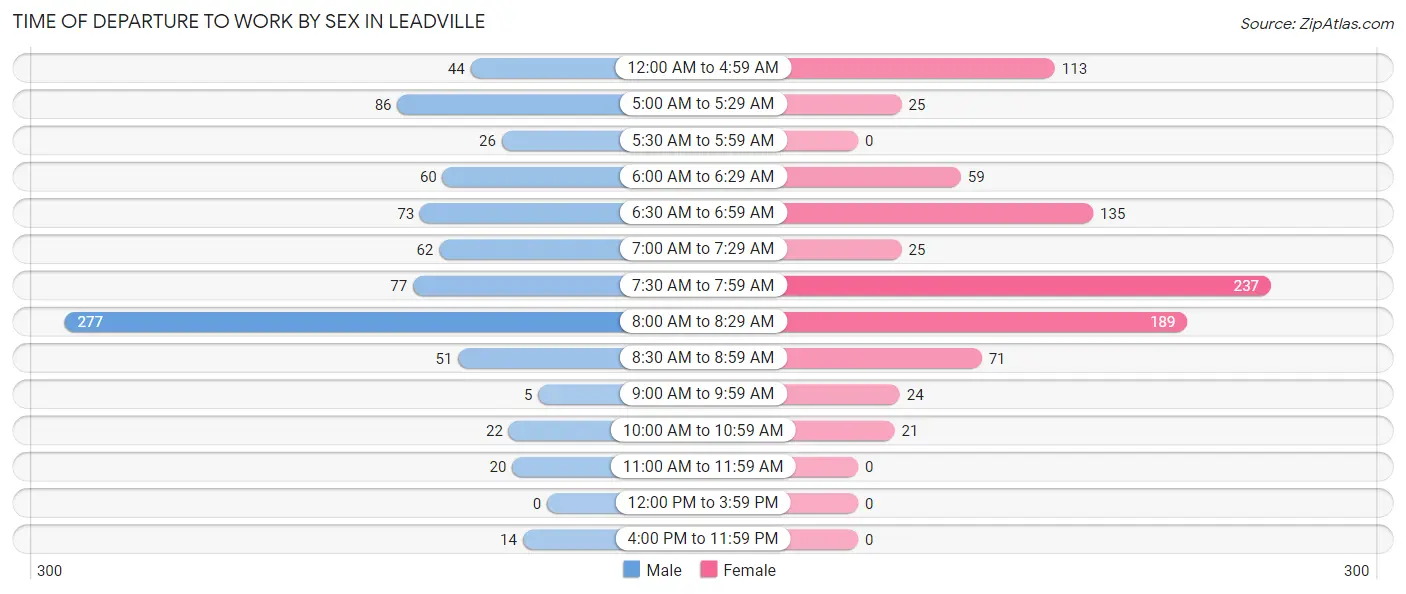
Time of Departure to Work by Sex in Leadville
The most frequent times of departure to work in Leadville are 8:00 AM to 8:29 AM (277, 33.9%) for males and 7:30 AM to 7:59 AM (237, 26.4%) for females.
| Time of Departure | Male | Female |
| 12:00 AM to 4:59 AM | 44 (5.4%) | 113 (12.6%) |
| 5:00 AM to 5:29 AM | 86 (10.5%) | 25 (2.8%) |
| 5:30 AM to 5:59 AM | 26 (3.2%) | 0 (0.0%) |
| 6:00 AM to 6:29 AM | 60 (7.3%) | 59 (6.6%) |
| 6:30 AM to 6:59 AM | 73 (8.9%) | 135 (15.0%) |
| 7:00 AM to 7:29 AM | 62 (7.6%) | 25 (2.8%) |
| 7:30 AM to 7:59 AM | 77 (9.4%) | 237 (26.4%) |
| 8:00 AM to 8:29 AM | 277 (33.9%) | 189 (21.0%) |
| 8:30 AM to 8:59 AM | 51 (6.2%) | 71 (7.9%) |
| 9:00 AM to 9:59 AM | 5 (0.6%) | 24 (2.7%) |
| 10:00 AM to 10:59 AM | 22 (2.7%) | 21 (2.3%) |
| 11:00 AM to 11:59 AM | 20 (2.5%) | 0 (0.0%) |
| 12:00 PM to 3:59 PM | 0 (0.0%) | 0 (0.0%) |
| 4:00 PM to 11:59 PM | 14 (1.7%) | 0 (0.0%) |
| Total | 817 (100.0%) | 899 (100.0%) |
Housing Occupancy in Leadville
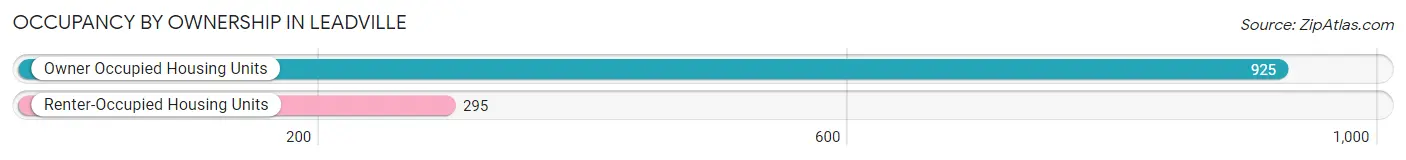
Occupancy by Ownership in Leadville
Of the total 1,220 dwellings in Leadville, owner-occupied units account for 925 (75.8%), while renter-occupied units make up 295 (24.2%).
| Occupancy | # Housing Units | % Housing Units |
| Owner Occupied Housing Units | 925 | 75.8% |
| Renter-Occupied Housing Units | 295 | 24.2% |
| Total Occupied Housing Units | 1,220 | 100.0% |
Occupancy by Household Size in Leadville
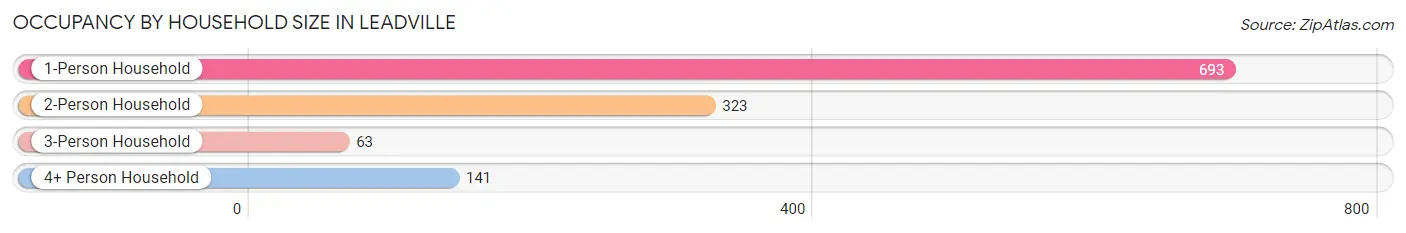
| Household Size | # Housing Units | % Housing Units |
| 1-Person Household | 693 | 56.8% |
| 2-Person Household | 323 | 26.5% |
| 3-Person Household | 63 | 5.2% |
| 4+ Person Household | 141 | 11.6% |
| Total Housing Units | 1,220 | 100.0% |
Occupancy by Ownership by Household Size in Leadville
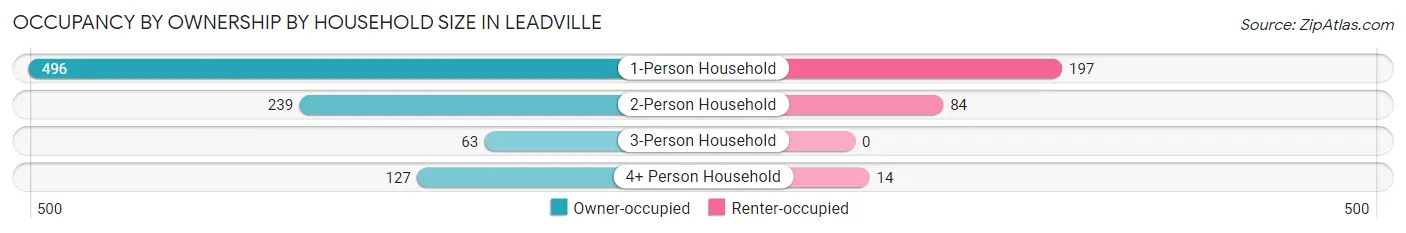
| Household Size | Owner-occupied | Renter-occupied |
| 1-Person Household | 496 (71.6%) | 197 (28.4%) |
| 2-Person Household | 239 (74.0%) | 84 (26.0%) |
| 3-Person Household | 63 (100.0%) | 0 (0.0%) |
| 4+ Person Household | 127 (90.1%) | 14 (9.9%) |
| Total Housing Units | 925 (75.8%) | 295 (24.2%) |
Occupancy by Educational Attainment in Leadville
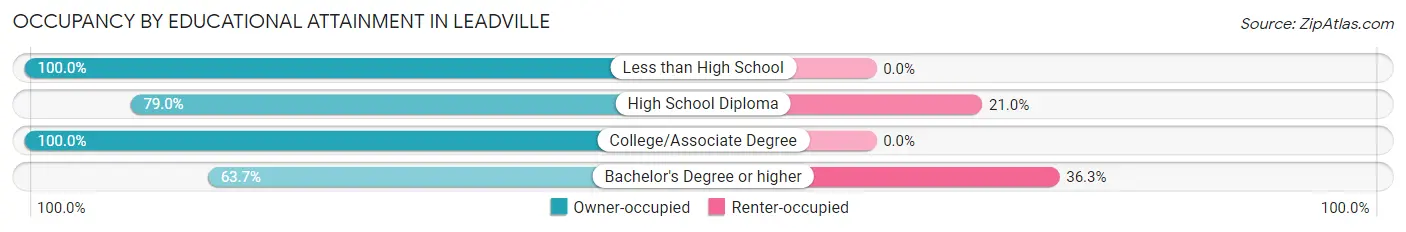
| Household Size | Owner-occupied | Renter-occupied |
| Less than High School | 9 (100.0%) | 0 (0.0%) |
| High School Diploma | 192 (79.0%) | 51 (21.0%) |
| College/Associate Degree | 296 (100.0%) | 0 (0.0%) |
| Bachelor's Degree or higher | 428 (63.7%) | 244 (36.3%) |
Occupancy by Age of Householder in Leadville
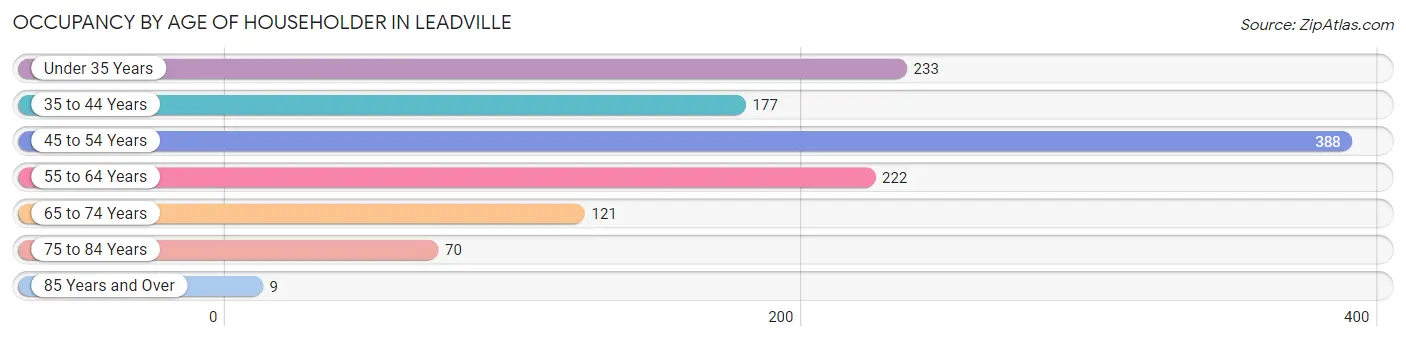
| Age Bracket | # Households | % Households |
| Under 35 Years | 233 | 19.1% |
| 35 to 44 Years | 177 | 14.5% |
| 45 to 54 Years | 388 | 31.8% |
| 55 to 64 Years | 222 | 18.2% |
| 65 to 74 Years | 121 | 9.9% |
| 75 to 84 Years | 70 | 5.7% |
| 85 Years and Over | 9 | 0.7% |
| Total | 1,220 | 100.0% |
Housing Finances in Leadville
Median Income by Occupancy in Leadville
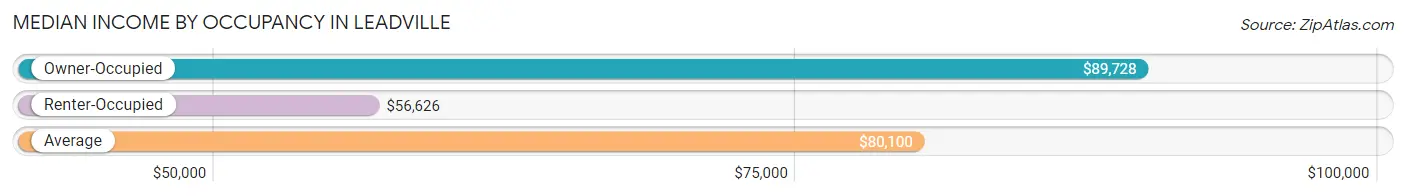
| Occupancy Type | # Households | Median Income |
| Owner-Occupied | 925 (75.8%) | $89,728 |
| Renter-Occupied | 295 (24.2%) | $56,626 |
| Average | 1,220 (100.0%) | $80,100 |
Occupancy by Householder Income Bracket in Leadville
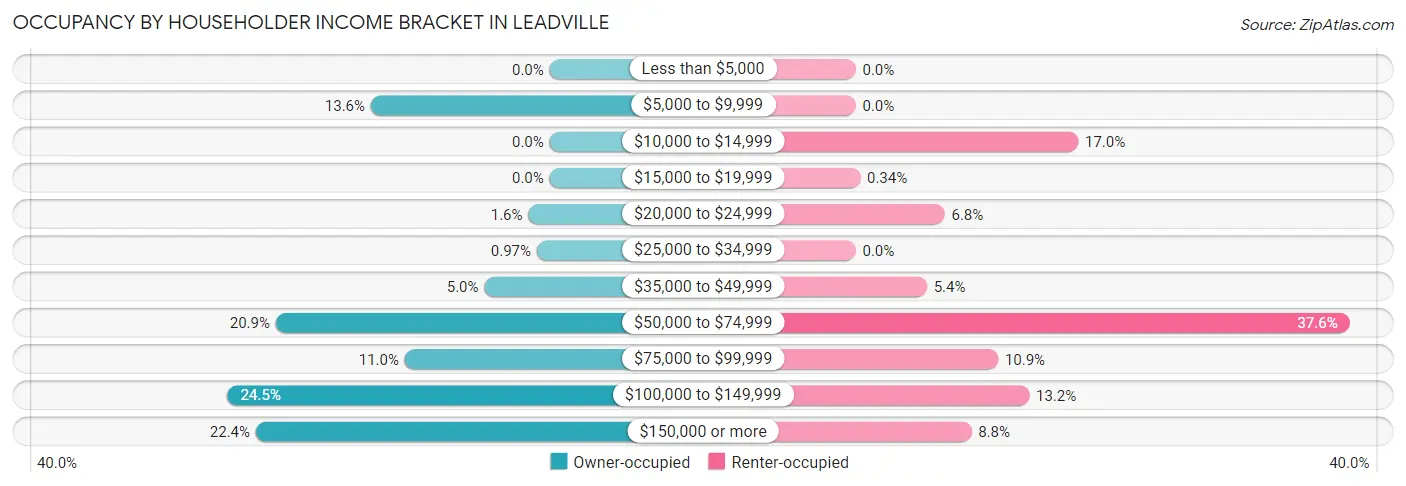
| Income Bracket | Owner-occupied | Renter-occupied |
| Less than $5,000 | 0 (0.0%) | 0 (0.0%) |
| $5,000 to $9,999 | 126 (13.6%) | 0 (0.0%) |
| $10,000 to $14,999 | 0 (0.0%) | 50 (17.0%) |
| $15,000 to $19,999 | 0 (0.0%) | 1 (0.3%) |
| $20,000 to $24,999 | 15 (1.6%) | 20 (6.8%) |
| $25,000 to $34,999 | 9 (1.0%) | 0 (0.0%) |
| $35,000 to $49,999 | 46 (5.0%) | 16 (5.4%) |
| $50,000 to $74,999 | 193 (20.9%) | 111 (37.6%) |
| $75,000 to $99,999 | 102 (11.0%) | 32 (10.8%) |
| $100,000 to $149,999 | 227 (24.5%) | 39 (13.2%) |
| $150,000 or more | 207 (22.4%) | 26 (8.8%) |
| Total | 925 (100.0%) | 295 (100.0%) |
Monthly Housing Cost Tiers in Leadville
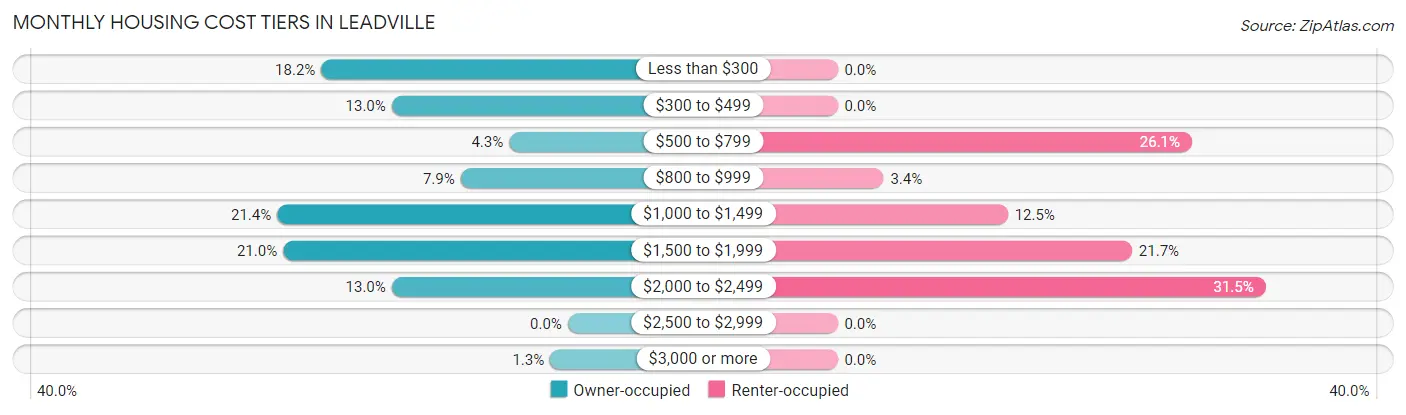
| Monthly Cost | Owner-occupied | Renter-occupied |
| Less than $300 | 168 (18.2%) | 0 (0.0%) |
| $300 to $499 | 120 (13.0%) | 0 (0.0%) |
| $500 to $799 | 40 (4.3%) | 77 (26.1%) |
| $800 to $999 | 73 (7.9%) | 10 (3.4%) |
| $1,000 to $1,499 | 198 (21.4%) | 37 (12.5%) |
| $1,500 to $1,999 | 194 (21.0%) | 64 (21.7%) |
| $2,000 to $2,499 | 120 (13.0%) | 93 (31.5%) |
| $2,500 to $2,999 | 0 (0.0%) | 0 (0.0%) |
| $3,000 or more | 12 (1.3%) | 0 (0.0%) |
| Total | 925 (100.0%) | 295 (100.0%) |
Physical Housing Characteristics in Leadville
Housing Structures in Leadville
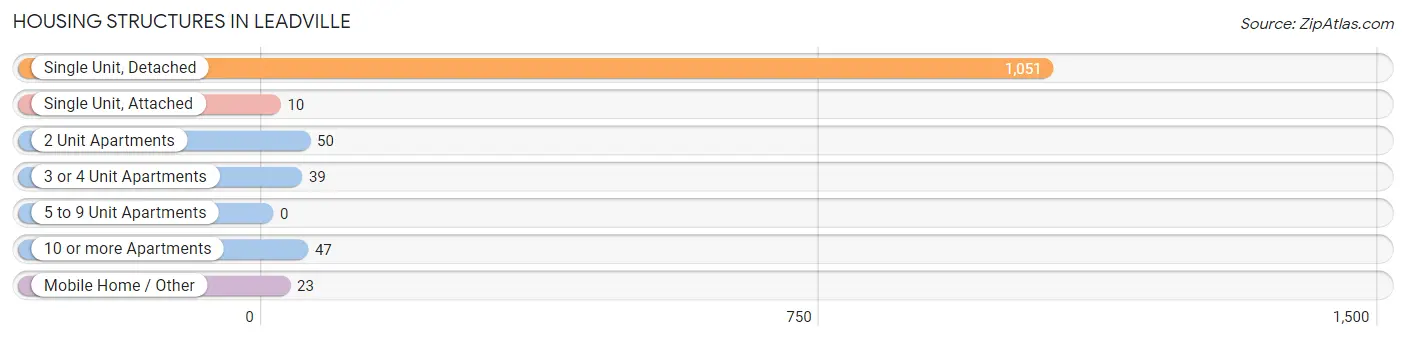
| Structure Type | # Housing Units | % Housing Units |
| Single Unit, Detached | 1,051 | 86.2% |
| Single Unit, Attached | 10 | 0.8% |
| 2 Unit Apartments | 50 | 4.1% |
| 3 or 4 Unit Apartments | 39 | 3.2% |
| 5 to 9 Unit Apartments | 0 | 0.0% |
| 10 or more Apartments | 47 | 3.8% |
| Mobile Home / Other | 23 | 1.9% |
| Total | 1,220 | 100.0% |
Housing Structures by Occupancy in Leadville
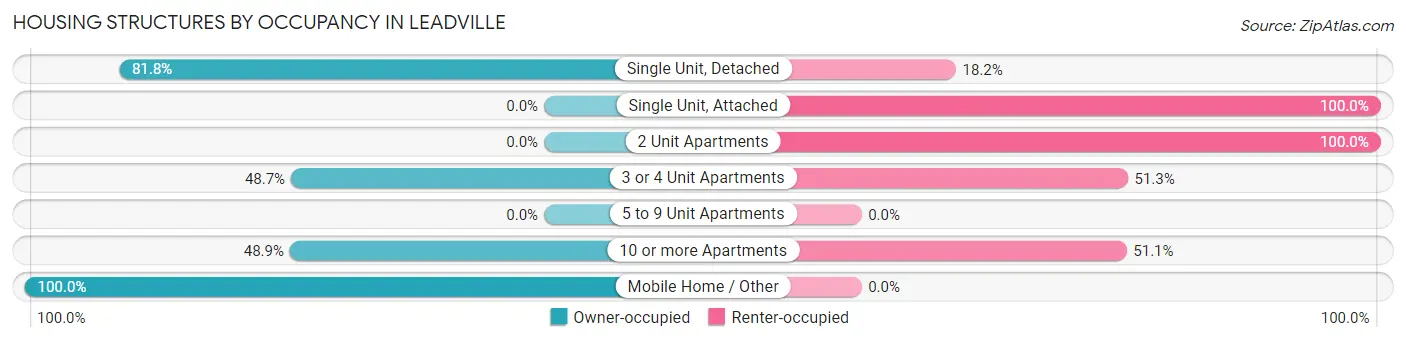
| Structure Type | Owner-occupied | Renter-occupied |
| Single Unit, Detached | 860 (81.8%) | 191 (18.2%) |
| Single Unit, Attached | 0 (0.0%) | 10 (100.0%) |
| 2 Unit Apartments | 0 (0.0%) | 50 (100.0%) |
| 3 or 4 Unit Apartments | 19 (48.7%) | 20 (51.3%) |
| 5 to 9 Unit Apartments | 0 (0.0%) | 0 (0.0%) |
| 10 or more Apartments | 23 (48.9%) | 24 (51.1%) |
| Mobile Home / Other | 23 (100.0%) | 0 (0.0%) |
| Total | 925 (75.8%) | 295 (24.2%) |
Housing Structures by Number of Rooms in Leadville
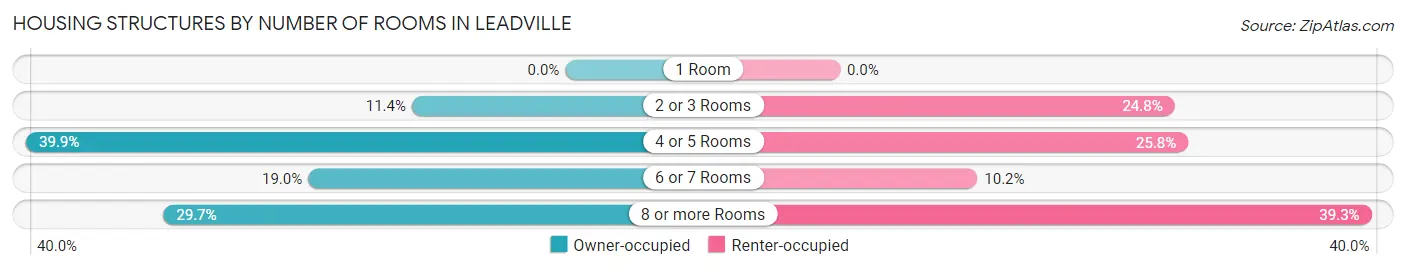
| Number of Rooms | Owner-occupied | Renter-occupied |
| 1 Room | 0 (0.0%) | 0 (0.0%) |
| 2 or 3 Rooms | 105 (11.4%) | 73 (24.7%) |
| 4 or 5 Rooms | 369 (39.9%) | 76 (25.8%) |
| 6 or 7 Rooms | 176 (19.0%) | 30 (10.2%) |
| 8 or more Rooms | 275 (29.7%) | 116 (39.3%) |
| Total | 925 (100.0%) | 295 (100.0%) |
Housing Structure by Heating Type in Leadville
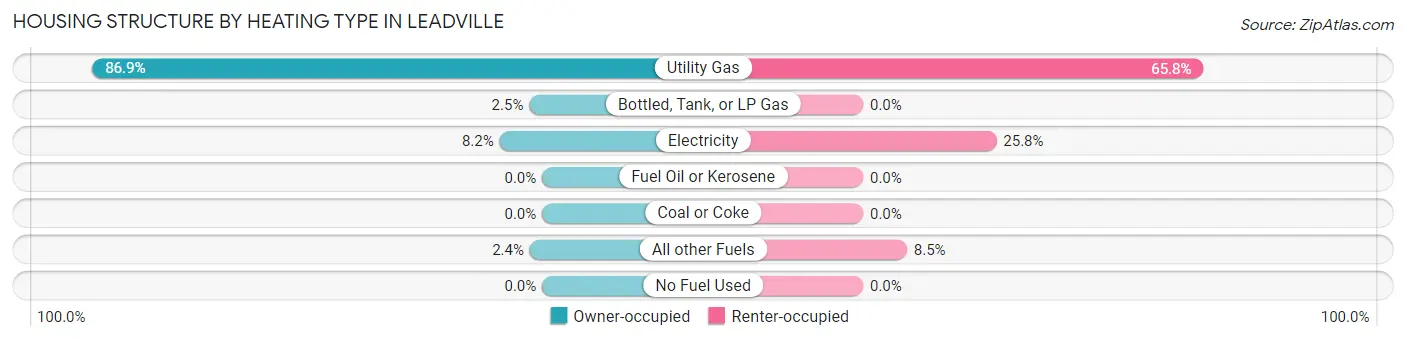
| Heating Type | Owner-occupied | Renter-occupied |
| Utility Gas | 804 (86.9%) | 194 (65.8%) |
| Bottled, Tank, or LP Gas | 23 (2.5%) | 0 (0.0%) |
| Electricity | 76 (8.2%) | 76 (25.8%) |
| Fuel Oil or Kerosene | 0 (0.0%) | 0 (0.0%) |
| Coal or Coke | 0 (0.0%) | 0 (0.0%) |
| All other Fuels | 22 (2.4%) | 25 (8.5%) |
| No Fuel Used | 0 (0.0%) | 0 (0.0%) |
| Total | 925 (100.0%) | 295 (100.0%) |
Household Vehicle Usage in Leadville
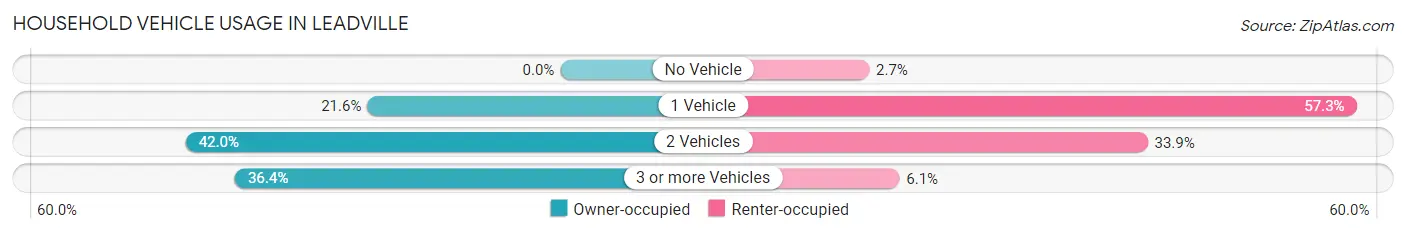
| Vehicles per Household | Owner-occupied | Renter-occupied |
| No Vehicle | 0 (0.0%) | 8 (2.7%) |
| 1 Vehicle | 200 (21.6%) | 169 (57.3%) |
| 2 Vehicles | 388 (41.9%) | 100 (33.9%) |
| 3 or more Vehicles | 337 (36.4%) | 18 (6.1%) |
| Total | 925 (100.0%) | 295 (100.0%) |
Real Estate & Mortgages in Leadville
Real Estate and Mortgage Overview in Leadville
| Characteristic | Without Mortgage | With Mortgage |
| Housing Units | 318 | 607 |
| Median Property Value | - | - |
| Median Household Income | - | - |
| Monthly Housing Costs | $290 | $12 |
| Real Estate Taxes | - | - |
Property Value by Mortgage Status in Leadville
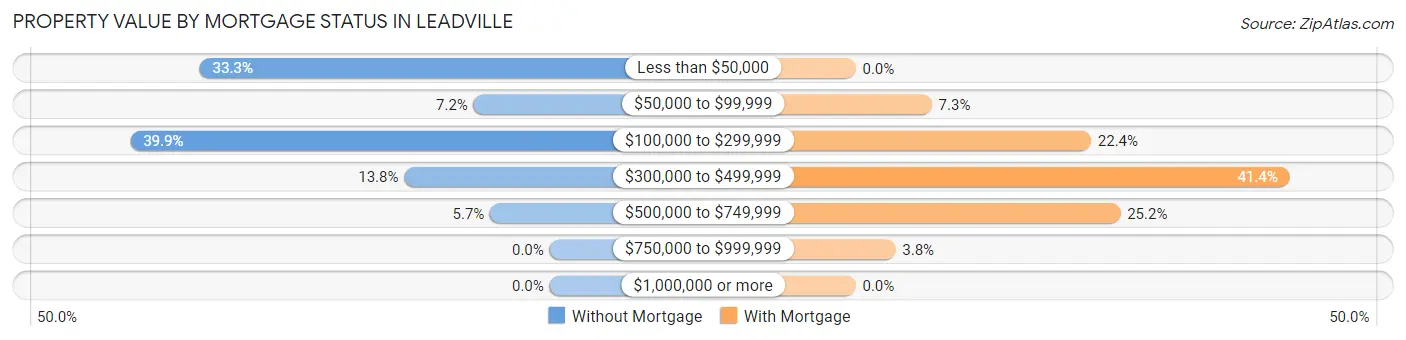
| Property Value | Without Mortgage | With Mortgage |
| Less than $50,000 | 106 (33.3%) | 0 (0.0%) |
| $50,000 to $99,999 | 23 (7.2%) | 44 (7.2%) |
| $100,000 to $299,999 | 127 (39.9%) | 136 (22.4%) |
| $300,000 to $499,999 | 44 (13.8%) | 251 (41.3%) |
| $500,000 to $749,999 | 18 (5.7%) | 153 (25.2%) |
| $750,000 to $999,999 | 0 (0.0%) | 23 (3.8%) |
| $1,000,000 or more | 0 (0.0%) | 0 (0.0%) |
| Total | 318 (100.0%) | 607 (100.0%) |
Household Income by Mortgage Status in Leadville
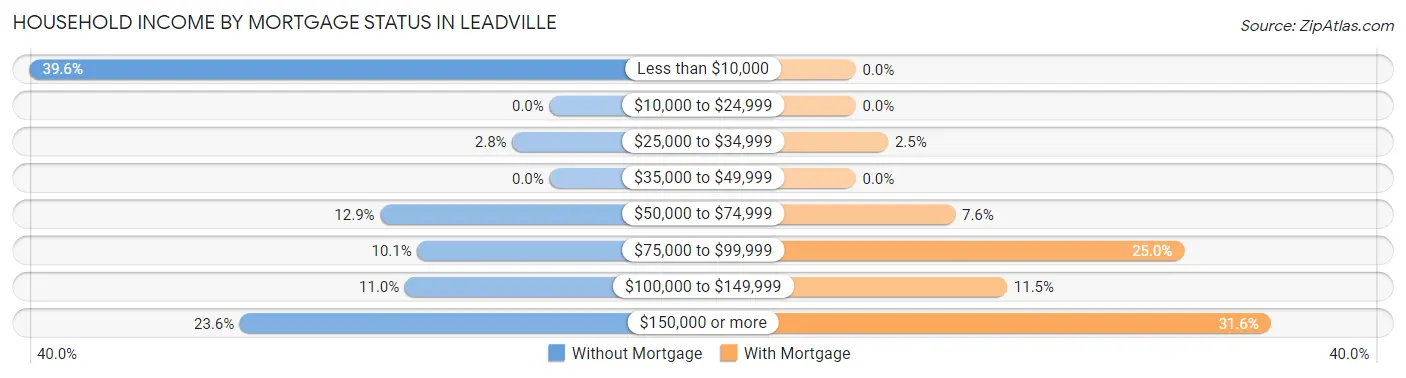
| Household Income | Without Mortgage | With Mortgage |
| Less than $10,000 | 126 (39.6%) | 0 (0.0%) |
| $10,000 to $24,999 | 0 (0.0%) | 0 (0.0%) |
| $25,000 to $34,999 | 9 (2.8%) | 15 (2.5%) |
| $35,000 to $49,999 | 0 (0.0%) | 0 (0.0%) |
| $50,000 to $74,999 | 41 (12.9%) | 46 (7.6%) |
| $75,000 to $99,999 | 32 (10.1%) | 152 (25.0%) |
| $100,000 to $149,999 | 35 (11.0%) | 70 (11.5%) |
| $150,000 or more | 75 (23.6%) | 192 (31.6%) |
| Total | 318 (100.0%) | 607 (100.0%) |
Property Value to Household Income Ratio in Leadville
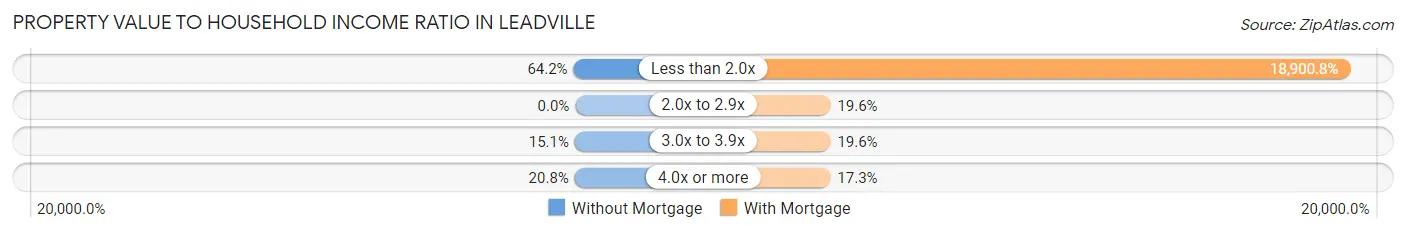
| Value-to-Income Ratio | Without Mortgage | With Mortgage |
| Less than 2.0x | 204 (64.1%) | 114,728 (18,900.8%) |
| 2.0x to 2.9x | 0 (0.0%) | 119 (19.6%) |
| 3.0x to 3.9x | 48 (15.1%) | 119 (19.6%) |
| 4.0x or more | 66 (20.7%) | 105 (17.3%) |
| Total | 318 (100.0%) | 607 (100.0%) |
Real Estate Taxes by Mortgage Status in Leadville
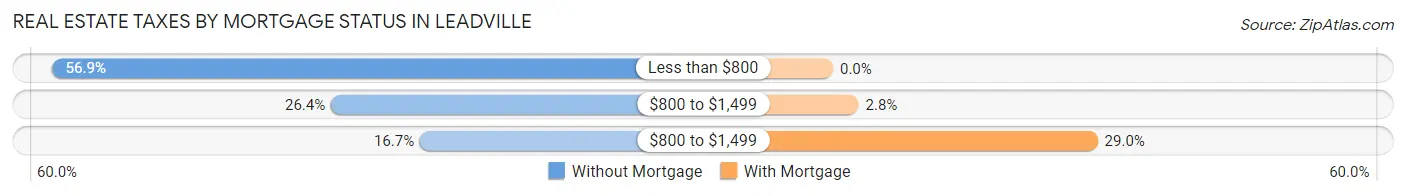
| Property Taxes | Without Mortgage | With Mortgage |
| Less than $800 | 181 (56.9%) | 0 (0.0%) |
| $800 to $1,499 | 84 (26.4%) | 17 (2.8%) |
| $800 to $1,499 | 53 (16.7%) | 176 (29.0%) |
| Total | 318 (100.0%) | 607 (100.0%) |
Health & Disability in Leadville
Health Insurance Coverage by Age in Leadville
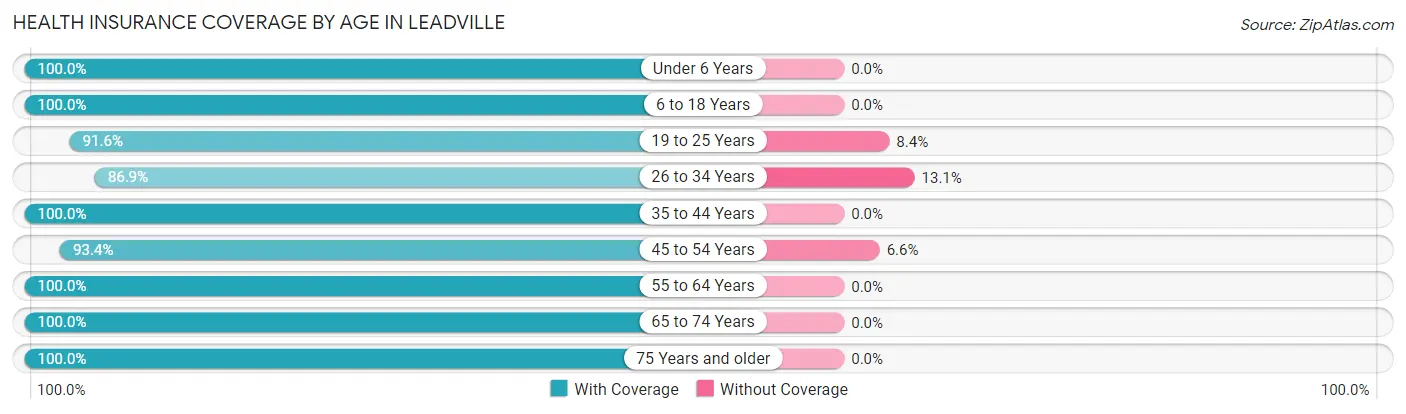
| Age Bracket | With Coverage | Without Coverage |
| Under 6 Years | 132 (100.0%) | 0 (0.0%) |
| 6 to 18 Years | 333 (100.0%) | 0 (0.0%) |
| 19 to 25 Years | 196 (91.6%) | 18 (8.4%) |
| 26 to 34 Years | 444 (86.9%) | 67 (13.1%) |
| 35 to 44 Years | 422 (100.0%) | 0 (0.0%) |
| 45 to 54 Years | 452 (93.4%) | 32 (6.6%) |
| 55 to 64 Years | 242 (100.0%) | 0 (0.0%) |
| 65 to 74 Years | 131 (100.0%) | 0 (0.0%) |
| 75 Years and older | 100 (100.0%) | 0 (0.0%) |
| Total | 2,452 (95.5%) | 117 (4.5%) |
Health Insurance Coverage by Citizenship Status in Leadville
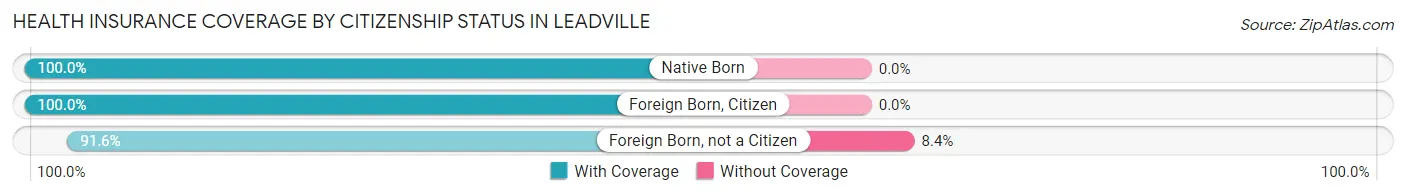
| Citizenship Status | With Coverage | Without Coverage |
| Native Born | 132 (100.0%) | 0 (0.0%) |
| Foreign Born, Citizen | 333 (100.0%) | 0 (0.0%) |
| Foreign Born, not a Citizen | 196 (91.6%) | 18 (8.4%) |
Health Insurance Coverage by Household Income in Leadville
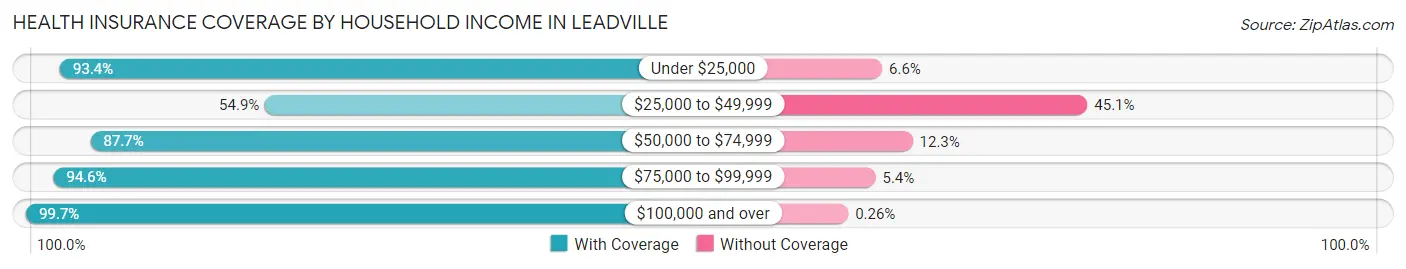
| Household Income | With Coverage | Without Coverage |
| Under $25,000 | 226 (93.4%) | 16 (6.6%) |
| $25,000 to $49,999 | 39 (54.9%) | 32 (45.1%) |
| $50,000 to $74,999 | 320 (87.7%) | 45 (12.3%) |
| $75,000 to $99,999 | 352 (94.6%) | 20 (5.4%) |
| $100,000 and over | 1,515 (99.7%) | 4 (0.3%) |
Public vs Private Health Insurance Coverage by Age in Leadville
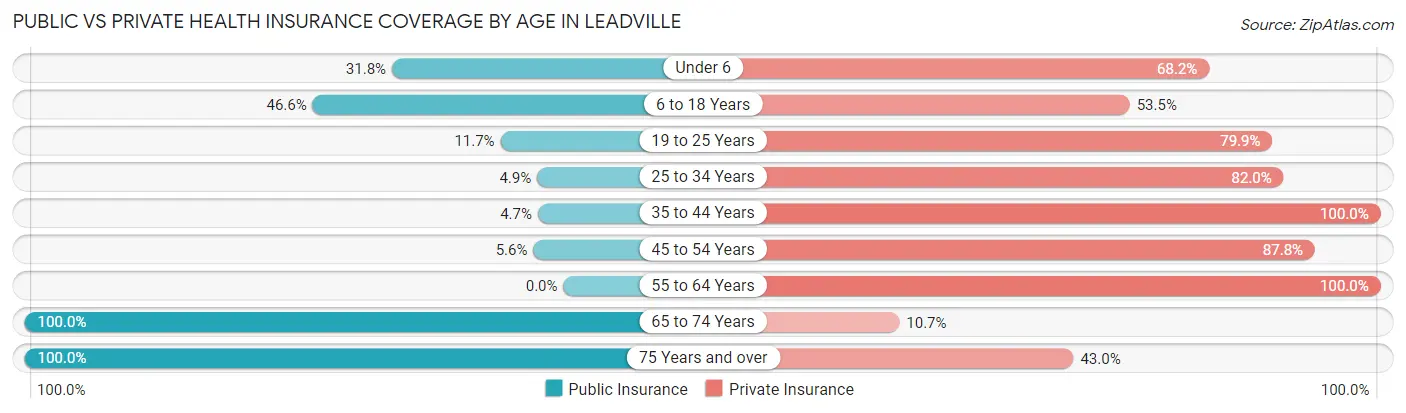
| Age Bracket | Public Insurance | Private Insurance |
| Under 6 | 42 (31.8%) | 90 (68.2%) |
| 6 to 18 Years | 155 (46.6%) | 178 (53.4%) |
| 19 to 25 Years | 25 (11.7%) | 171 (79.9%) |
| 25 to 34 Years | 25 (4.9%) | 419 (82.0%) |
| 35 to 44 Years | 20 (4.7%) | 422 (100.0%) |
| 45 to 54 Years | 27 (5.6%) | 425 (87.8%) |
| 55 to 64 Years | 0 (0.0%) | 242 (100.0%) |
| 65 to 74 Years | 131 (100.0%) | 14 (10.7%) |
| 75 Years and over | 100 (100.0%) | 43 (43.0%) |
| Total | 525 (20.4%) | 2,004 (78.0%) |
Disability Status by Sex by Age in Leadville
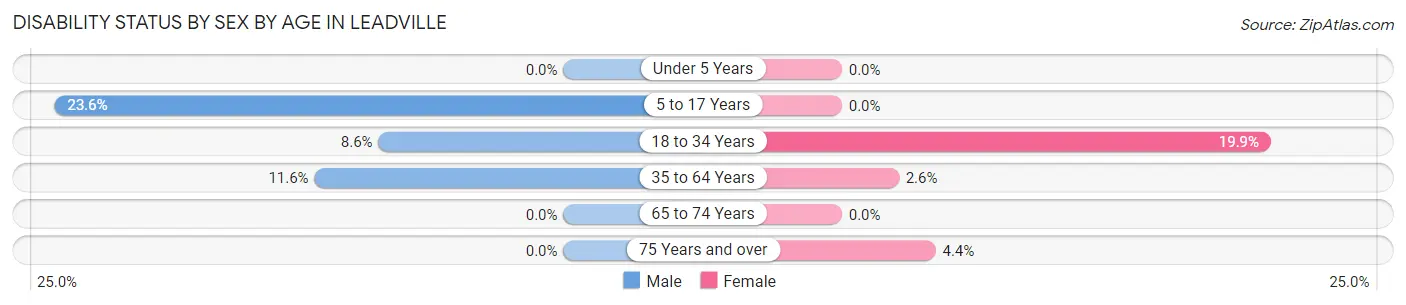
| Age Bracket | Male | Female |
| Under 5 Years | 0 (0.0%) | 0 (0.0%) |
| 5 to 17 Years | 47 (23.6%) | 0 (0.0%) |
| 18 to 34 Years | 23 (8.6%) | 91 (19.9%) |
| 35 to 64 Years | 67 (11.6%) | 15 (2.6%) |
| 65 to 74 Years | 0 (0.0%) | 0 (0.0%) |
| 75 Years and over | 0 (0.0%) | 1 (4.3%) |
Disability Class by Sex by Age in Leadville
Disability Class: Hearing Difficulty
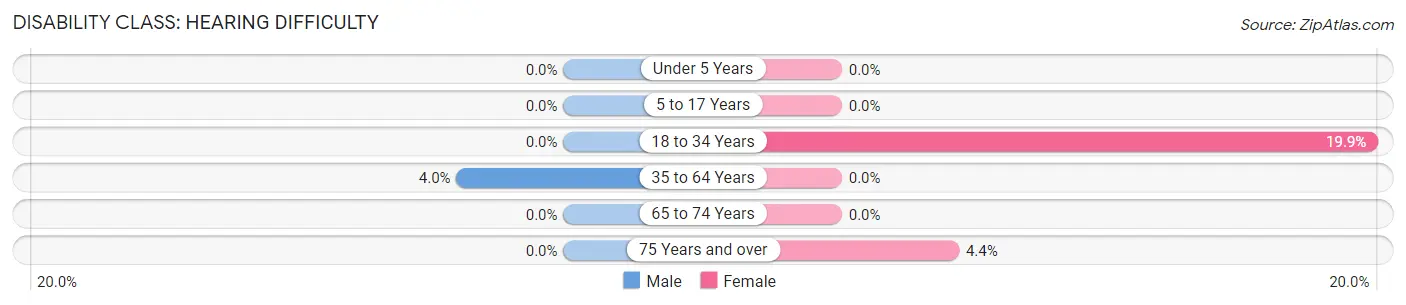
| Age Bracket | Male | Female |
| Under 5 Years | 0 (0.0%) | 0 (0.0%) |
| 5 to 17 Years | 0 (0.0%) | 0 (0.0%) |
| 18 to 34 Years | 0 (0.0%) | 91 (19.9%) |
| 35 to 64 Years | 23 (4.0%) | 0 (0.0%) |
| 65 to 74 Years | 0 (0.0%) | 0 (0.0%) |
| 75 Years and over | 0 (0.0%) | 1 (4.3%) |
Disability Class: Vision Difficulty
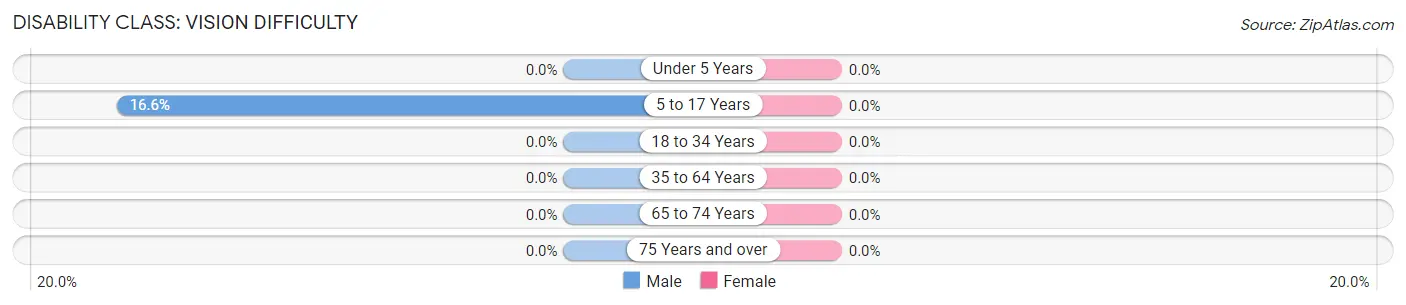
| Age Bracket | Male | Female |
| Under 5 Years | 0 (0.0%) | 0 (0.0%) |
| 5 to 17 Years | 33 (16.6%) | 0 (0.0%) |
| 18 to 34 Years | 0 (0.0%) | 0 (0.0%) |
| 35 to 64 Years | 0 (0.0%) | 0 (0.0%) |
| 65 to 74 Years | 0 (0.0%) | 0 (0.0%) |
| 75 Years and over | 0 (0.0%) | 0 (0.0%) |
Disability Class: Cognitive Difficulty
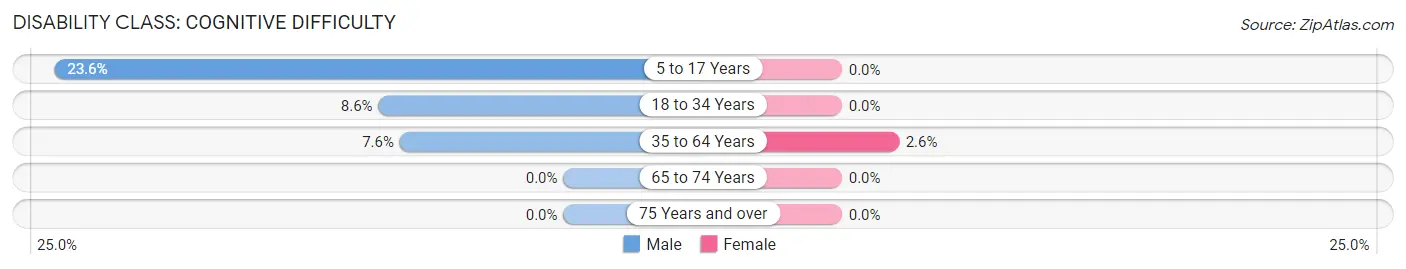
| Age Bracket | Male | Female |
| 5 to 17 Years | 47 (23.6%) | 0 (0.0%) |
| 18 to 34 Years | 23 (8.6%) | 0 (0.0%) |
| 35 to 64 Years | 44 (7.6%) | 15 (2.6%) |
| 65 to 74 Years | 0 (0.0%) | 0 (0.0%) |
| 75 Years and over | 0 (0.0%) | 0 (0.0%) |
Disability Class: Ambulatory Difficulty
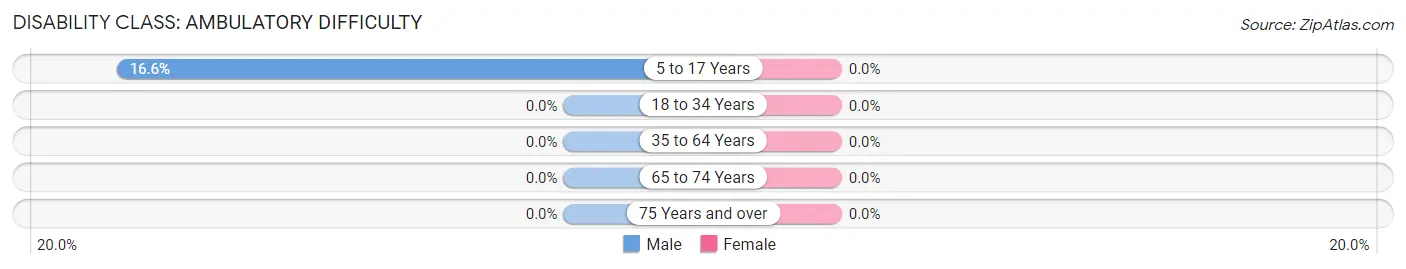
| Age Bracket | Male | Female |
| 5 to 17 Years | 33 (16.6%) | 0 (0.0%) |
| 18 to 34 Years | 0 (0.0%) | 0 (0.0%) |
| 35 to 64 Years | 0 (0.0%) | 0 (0.0%) |
| 65 to 74 Years | 0 (0.0%) | 0 (0.0%) |
| 75 Years and over | 0 (0.0%) | 0 (0.0%) |
Disability Class: Self-Care Difficulty
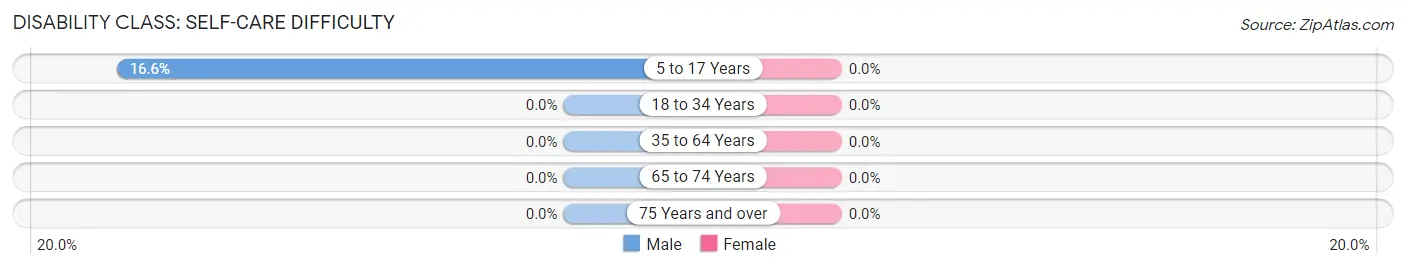
| Age Bracket | Male | Female |
| 5 to 17 Years | 33 (16.6%) | 0 (0.0%) |
| 18 to 34 Years | 0 (0.0%) | 0 (0.0%) |
| 35 to 64 Years | 0 (0.0%) | 0 (0.0%) |
| 65 to 74 Years | 0 (0.0%) | 0 (0.0%) |
| 75 Years and over | 0 (0.0%) | 0 (0.0%) |
Technology Access in Leadville
Computing Device Access in Leadville
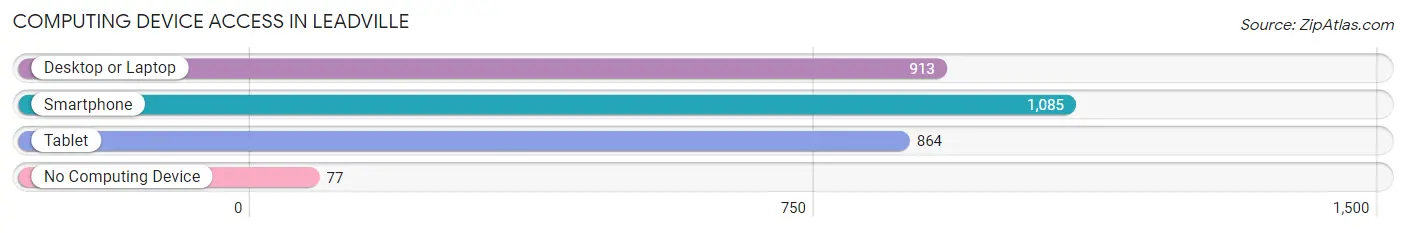
| Device Type | # Households | % Households |
| Desktop or Laptop | 913 | 74.8% |
| Smartphone | 1,085 | 88.9% |
| Tablet | 864 | 70.8% |
| No Computing Device | 77 | 6.3% |
| Total | 1,220 | 100.0% |
Internet Access in Leadville
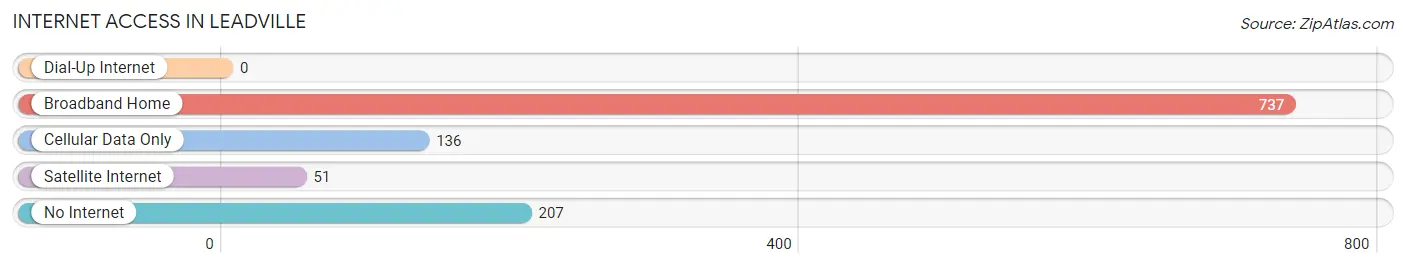
| Internet Type | # Households | % Households |
| Dial-Up Internet | 0 | 0.0% |
| Broadband Home | 737 | 60.4% |
| Cellular Data Only | 136 | 11.2% |
| Satellite Internet | 51 | 4.2% |
| No Internet | 207 | 17.0% |
| Total | 1,220 | 100.0% |
Leadville Summary
Introduction
Leadville is a small city located in the Rocky Mountains of Colorado, United States. It is the county seat of Lake County and is situated at an elevation of 10,152 feet (3,094 m). Leadville is the highest incorporated city in the United States and is known for its rich mining history. The city has a population of 2,711 people as of the 2010 census.
History
Leadville was founded in 1877 by miners who were searching for silver and gold. The city was named after the heavy deposits of lead ore found in the area. The city quickly grew and by 1880, it had a population of over 10,000 people. Leadville was the second largest city in Colorado at the time.
The city was home to many famous people, including Horace Tabor, who made his fortune in the silver mines, and Baby Doe Tabor, who lived in a cabin near the mines. Leadville was also the site of the famous “Race for the Sky” between two hot air balloons in 1881.
The city’s economy was based on mining until the late 19th century when the mines began to close. The city then shifted to tourism and outdoor recreation. Leadville is now known for its skiing, snowmobiling, and mountain biking.
Geography
Leadville is located in the Rocky Mountains of Colorado, in the Arkansas River Valley. The city is situated at an elevation of 10,152 feet (3,094 m). The city is surrounded by mountains, including Mount Elbert, the highest peak in Colorado.
The climate in Leadville is cold and dry, with an average annual temperature of 34°F (1°C). The city receives an average of only 16 inches (41 cm) of precipitation per year.
Economy
Leadville’s economy is based on tourism and outdoor recreation. The city is home to several ski resorts, including Ski Cooper and the Leadville Ski Resort. The city is also a popular destination for mountain biking, snowmobiling, and hiking.
The city is also home to several businesses, including restaurants, bars, and retail stores. The city is also home to several mining companies, including Climax Molybdenum and the Climax Mine.
Demographics
As of the 2010 census, Leadville had a population of 2,711 people. The racial makeup of the city was 91.3% White, 0.7% African American, 0.7% Native American, 0.7% Asian, 0.1% Pacific Islander, 4.2% from other races, and 2.1% from two or more races. Hispanic or Latino of any race were 8.3% of the population.
The median income for a household in Leadville was $37,917, and the median income for a family was $45,938. The per capita income for the city was $20,945. About 11.2% of families and 14.3% of the population were below the poverty line, including 18.2% of those under age 18 and 8.2% of those age 65 or over.
Conclusion
Leadville is a small city located in the Rocky Mountains of Colorado, United States. It is the highest incorporated city in the United States and is known for its rich mining history. The city has a population of 2,711 people as of the 2010 census. Leadville’s economy is based on tourism and outdoor recreation, and the city is home to several ski resorts, businesses, and mining companies. The racial makeup of the city is 91.3% White, 0.7% African American, 0.7% Native American, 0.7% Asian, 0.1% Pacific Islander, 4.2% from other races, and 2.1% from two or more races. The median income for a household in Leadville was $37,917, and the median income for a family was $45,938.
Common Questions
What is Per Capita Income in Leadville?
Per Capita income in Leadville is $53,598.
What is the Median Family Income in Leadville?
Median Family Income in Leadville is $135,278.
What is the Median Household income in Leadville?
Median Household Income in Leadville is $80,100.
What is Income or Wage Gap in Leadville?
Income or Wage Gap in Leadville is 31.7%.
Women in Leadville earn 68.3 cents for every dollar earned by a man.
What is Inequality or Gini Index in Leadville?
Inequality or Gini Index in Leadville is 0.39.
What is the Total Population of Leadville?
Total Population of Leadville is 2,622.
What is the Total Male Population of Leadville?
Total Male Population of Leadville is 1,241.
What is the Total Female Population of Leadville?
Total Female Population of Leadville is 1,381.
What is the Ratio of Males per 100 Females in Leadville?
There are 89.86 Males per 100 Females in Leadville.
What is the Ratio of Females per 100 Males in Leadville?
There are 111.28 Females per 100 Males in Leadville.
What is the Median Population Age in Leadville?
Median Population Age in Leadville is 38.0 Years.
What is the Average Family Size in Leadville
Average Family Size in Leadville is 3.9 People.
What is the Average Household Size in Leadville
Average Household Size in Leadville is 2.1 People.
How Large is the Labor Force in Leadville?
There are 1,945 People in the Labor Forcein in Leadville.
What is the Percentage of People in the Labor Force in Leadville?
89.2% of People are in the Labor Force in Leadville.
What is the Unemployment Rate in Leadville?
Unemployment Rate in Leadville is 2.3%.