Lake Hart, FL Map & Demographics
Lake Hart Map
Lake Hart Overview
$27,550
PER CAPITA INCOME
$66,250
AVG HOUSEHOLD INCOME
56.6%
WAGE / INCOME GAP [ % ]
43.4¢/ $1
WAGE / INCOME GAP [ $ ]
0.22
INEQUALITY / GINI INDEX
507
TOTAL POPULATION
144
MALE POPULATION
363
FEMALE POPULATION
39.67
MALES / 100 FEMALES
252.08
FEMALES / 100 MALES
26.8
MEDIAN AGE
5.6
AVG FAMILY SIZE
2.9
AVG HOUSEHOLD SIZE
207
LABOR FORCE [ PEOPLE ]
54.5%
PERCENT IN LABOR FORCE
Income in Lake Hart
Income Overview in Lake Hart
| Characteristic | Number | Measure |
| Per Capita Income | 507 | $27,550 |
| Median Family Income | 35 | $0 |
| Mean Family Income | 35 | $0 |
| Median Household Income | 178 | $66,250 |
| Mean Household Income | 178 | $73,998 |
| Income Deficit | 35 | $0 |
| Wage / Income Gap (%) | 507 | 56.61% |
| Wage / Income Gap ($) | 507 | 43.39¢ per $1 |
| Gini / Inequality Index | 507 | 0.22 |
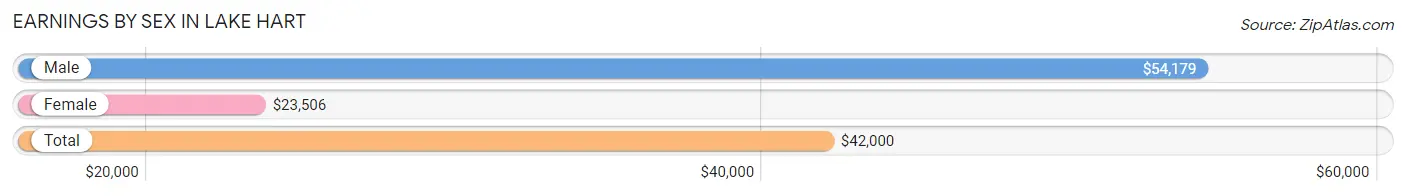
Earnings by Sex in Lake Hart
Average Earnings in Lake Hart are $42,000, $54,179 for men and $23,506 for women, a difference of 56.6%.
| Sex | Number | Average Earnings |
| Male | 105 (46.9%) | $54,179 |
| Female | 119 (53.1%) | $23,506 |
| Total | 224 (100.0%) | $42,000 |
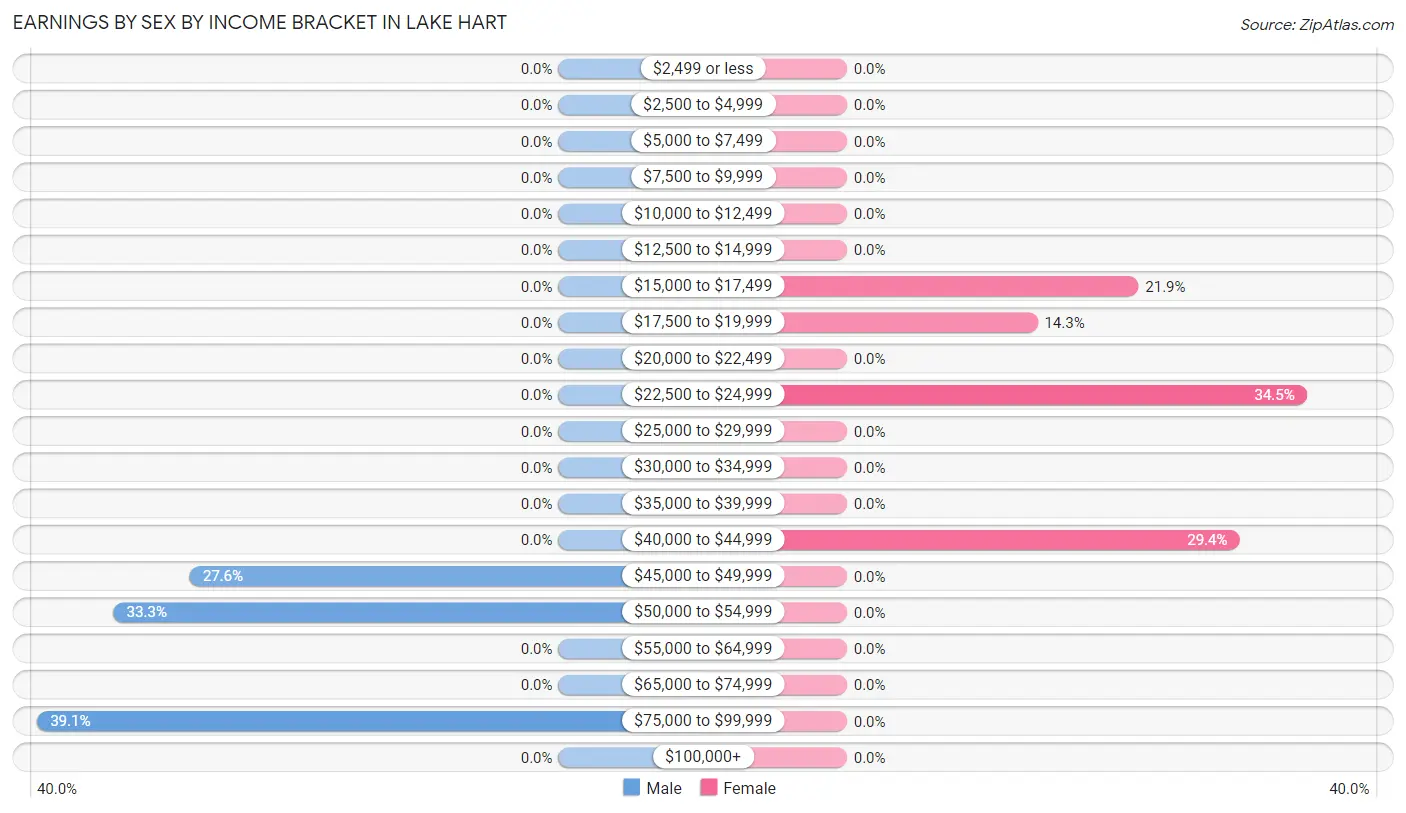
Earnings by Sex by Income Bracket in Lake Hart
The most common earnings brackets in Lake Hart are $75,000 to $99,999 for men (41 | 39.1%) and $22,500 to $24,999 for women (41 | 34.4%).
| Income | Male | Female |
| $2,499 or less | 0 (0.0%) | 0 (0.0%) |
| $2,500 to $4,999 | 0 (0.0%) | 0 (0.0%) |
| $5,000 to $7,499 | 0 (0.0%) | 0 (0.0%) |
| $7,500 to $9,999 | 0 (0.0%) | 0 (0.0%) |
| $10,000 to $12,499 | 0 (0.0%) | 0 (0.0%) |
| $12,500 to $14,999 | 0 (0.0%) | 0 (0.0%) |
| $15,000 to $17,499 | 0 (0.0%) | 26 (21.8%) |
| $17,500 to $19,999 | 0 (0.0%) | 17 (14.3%) |
| $20,000 to $22,499 | 0 (0.0%) | 0 (0.0%) |
| $22,500 to $24,999 | 0 (0.0%) | 41 (34.4%) |
| $25,000 to $29,999 | 0 (0.0%) | 0 (0.0%) |
| $30,000 to $34,999 | 0 (0.0%) | 0 (0.0%) |
| $35,000 to $39,999 | 0 (0.0%) | 0 (0.0%) |
| $40,000 to $44,999 | 0 (0.0%) | 35 (29.4%) |
| $45,000 to $49,999 | 29 (27.6%) | 0 (0.0%) |
| $50,000 to $54,999 | 35 (33.3%) | 0 (0.0%) |
| $55,000 to $64,999 | 0 (0.0%) | 0 (0.0%) |
| $65,000 to $74,999 | 0 (0.0%) | 0 (0.0%) |
| $75,000 to $99,999 | 41 (39.1%) | 0 (0.0%) |
| $100,000+ | 0 (0.0%) | 0 (0.0%) |
| Total | 105 (100.0%) | 119 (100.0%) |
Earnings by Sex by Educational Attainment in Lake Hart
| Educational Attainment | Male Income | Female Income |
| Less than High School | - | - |
| High School Diploma | - | - |
| College or Associate's Degree | - | - |
| Bachelor's Degree | - | - |
| Graduate Degree | - | - |
| Total | $54,179 | $24,024 |
Family Income in Lake Hart
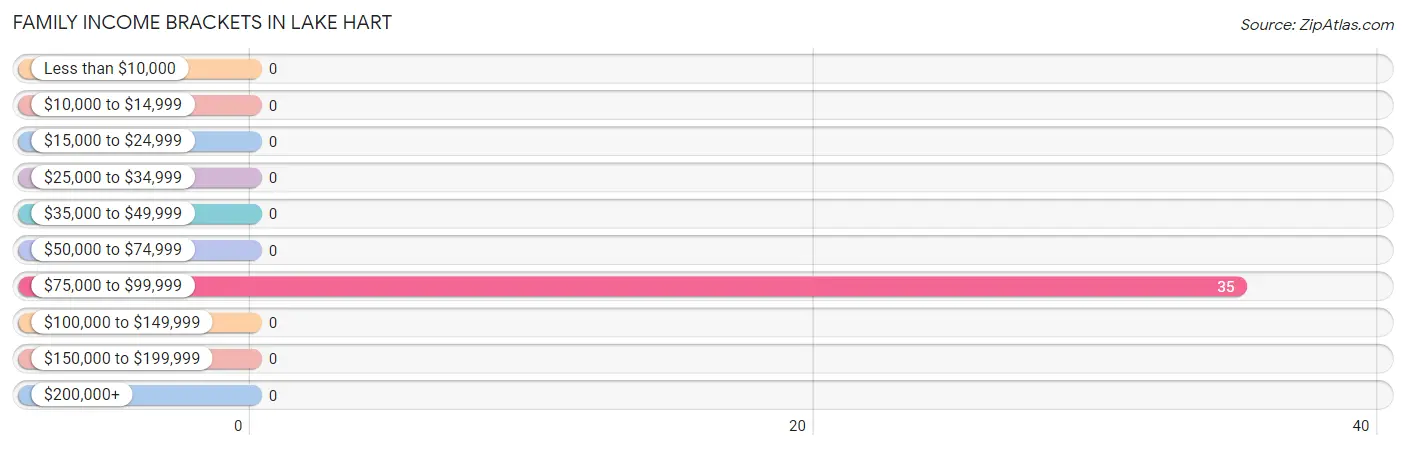
Family Income Brackets in Lake Hart
According to the Lake Hart family income data, there are 35 families falling into the $75,000 to $99,999 income range, which is the most common income bracket and makes up 100.0% of all families.
| Income Bracket | # Families | % Families |
| Less than $10,000 | 0 | 0.0% |
| $10,000 to $14,999 | 0 | 0.0% |
| $15,000 to $24,999 | 0 | 0.0% |
| $25,000 to $34,999 | 0 | 0.0% |
| $35,000 to $49,999 | 0 | 0.0% |
| $50,000 to $74,999 | 0 | 0.0% |
| $75,000 to $99,999 | 35 | 100.0% |
| $100,000 to $149,999 | 0 | 0.0% |
| $150,000 to $199,999 | 0 | 0.0% |
| $200,000+ | 0 | 0.0% |
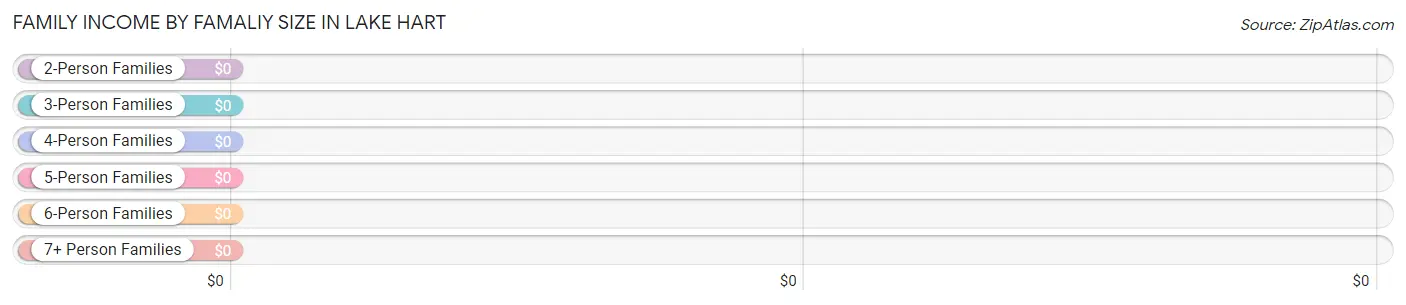
Family Income by Famaliy Size in Lake Hart
| Income Bracket | # Families | Median Income |
| 2-Person Families | 0 (0.0%) | $0 |
| 3-Person Families | 0 (0.0%) | $0 |
| 4-Person Families | 0 (0.0%) | $0 |
| 5-Person Families | 35 (100.0%) | $0 |
| 6-Person Families | 0 (0.0%) | $0 |
| 7+ Person Families | 0 (0.0%) | $0 |
| Total | 35 (100.0%) | $0 |
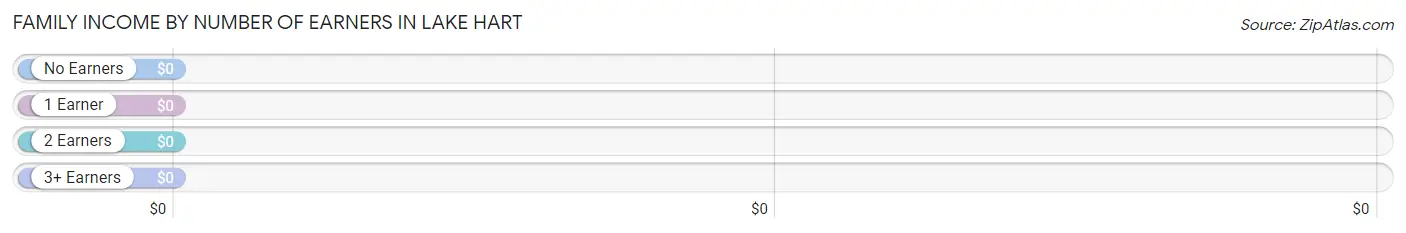
Family Income by Number of Earners in Lake Hart
| Number of Earners | # Families | Median Income |
| No Earners | 0 (0.0%) | $0 |
| 1 Earner | 0 (0.0%) | $0 |
| 2 Earners | 35 (100.0%) | $0 |
| 3+ Earners | 0 (0.0%) | $0 |
| Total | 35 (100.0%) | $0 |
Household Income in Lake Hart
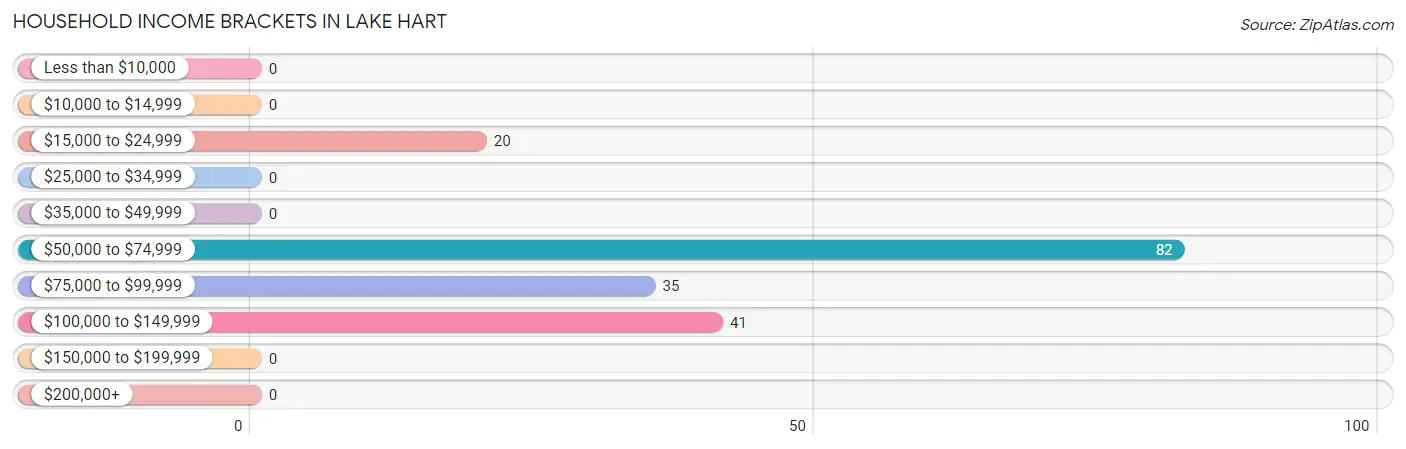
Household Income Brackets in Lake Hart
With 82 households falling in the category, the $50,000 to $74,999 income range is the most frequent in Lake Hart, accounting for 46.1% of all households.
| Income Bracket | # Households | % Households |
| Less than $10,000 | 0 | 0.0% |
| $10,000 to $14,999 | 0 | 0.0% |
| $15,000 to $24,999 | 20 | 11.2% |
| $25,000 to $34,999 | 0 | 0.0% |
| $35,000 to $49,999 | 0 | 0.0% |
| $50,000 to $74,999 | 82 | 46.1% |
| $75,000 to $99,999 | 35 | 19.7% |
| $100,000 to $149,999 | 41 | 23.0% |
| $150,000 to $199,999 | 0 | 0.0% |
| $200,000+ | 0 | 0.0% |
Household Income by Householder Age in Lake Hart
The median household income in Lake Hart is $66,250, with the highest median household income of $75,000 found in the 25 to 44 years age bracket for the primary householder. A total of 152 households (85.4%) fall into this category.
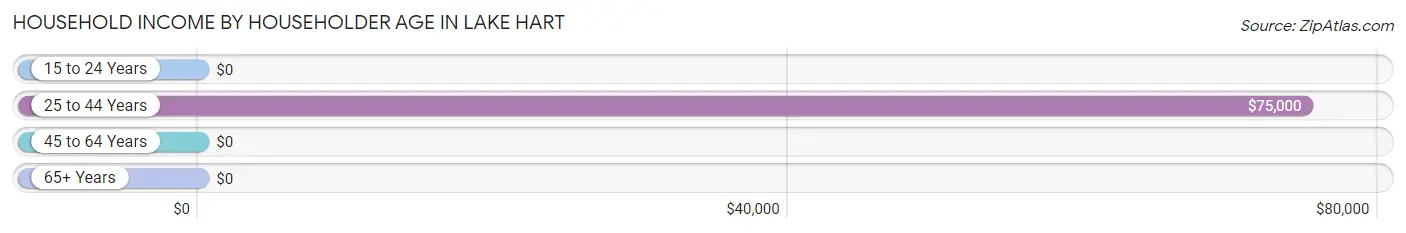
| Income Bracket | # Households | Median Income |
| 15 to 24 Years | 0 (0.0%) | $0 |
| 25 to 44 Years | 152 (85.4%) | $75,000 |
| 45 to 64 Years | 26 (14.6%) | $0 |
| 65+ Years | 0 (0.0%) | $0 |
| Total | 178 (100.0%) | $66,250 |
Poverty in Lake Hart
Income Below Poverty by Sex and Age in Lake Hart
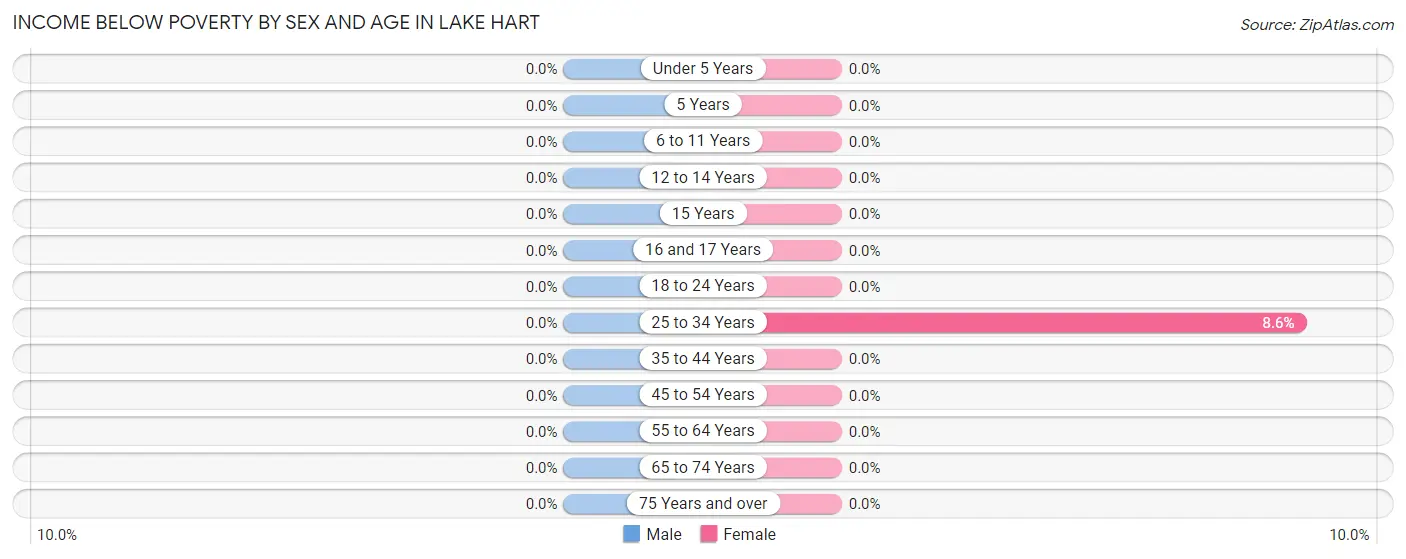
| Age Bracket | Male | Female |
| Under 5 Years | 0 (0.0%) | 0 (0.0%) |
| 5 Years | 0 (0.0%) | 0 (0.0%) |
| 6 to 11 Years | 0 (0.0%) | 0 (0.0%) |
| 12 to 14 Years | 0 (0.0%) | 0 (0.0%) |
| 15 Years | 0 (0.0%) | 0 (0.0%) |
| 16 and 17 Years | 0 (0.0%) | 0 (0.0%) |
| 18 to 24 Years | 0 (0.0%) | 0 (0.0%) |
| 25 to 34 Years | 0 (0.0%) | 20 (8.6%) |
| 35 to 44 Years | 0 (0.0%) | 0 (0.0%) |
| 45 to 54 Years | 0 (0.0%) | 0 (0.0%) |
| 55 to 64 Years | 0 (0.0%) | 0 (0.0%) |
| 65 to 74 Years | 0 (0.0%) | 0 (0.0%) |
| 75 Years and over | 0 (0.0%) | 0 (0.0%) |
| Total | 0 (0.0%) | 20 (5.5%) |
Income Above Poverty by Sex and Age in Lake Hart
According to the poverty statistics in Lake Hart, males aged under 5 years and females aged under 5 years are the age groups that are most secure financially, with 100.0% of males and 100.0% of females in these age groups living above the poverty line.
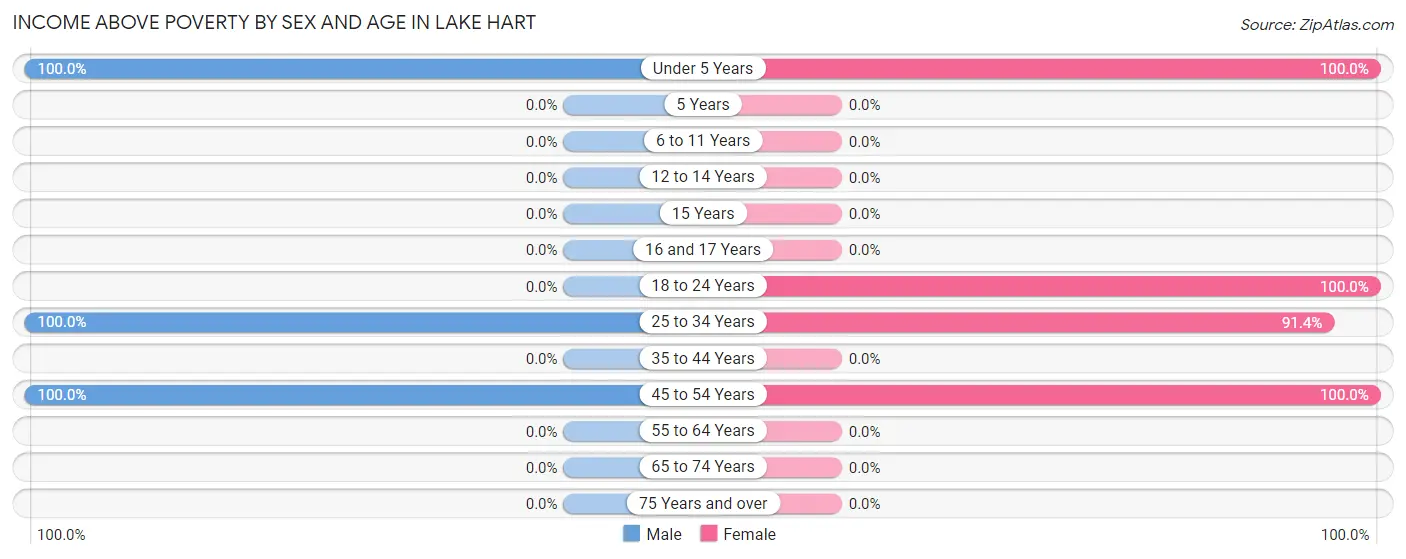
| Age Bracket | Male | Female |
| Under 5 Years | 39 (100.0%) | 88 (100.0%) |
| 5 Years | 0 (0.0%) | 0 (0.0%) |
| 6 to 11 Years | 0 (0.0%) | 0 (0.0%) |
| 12 to 14 Years | 0 (0.0%) | 0 (0.0%) |
| 15 Years | 0 (0.0%) | 0 (0.0%) |
| 16 and 17 Years | 0 (0.0%) | 0 (0.0%) |
| 18 to 24 Years | 0 (0.0%) | 17 (100.0%) |
| 25 to 34 Years | 76 (100.0%) | 212 (91.4%) |
| 35 to 44 Years | 0 (0.0%) | 0 (0.0%) |
| 45 to 54 Years | 29 (100.0%) | 26 (100.0%) |
| 55 to 64 Years | 0 (0.0%) | 0 (0.0%) |
| 65 to 74 Years | 0 (0.0%) | 0 (0.0%) |
| 75 Years and over | 0 (0.0%) | 0 (0.0%) |
| Total | 144 (100.0%) | 343 (94.5%) |
Income Below Poverty Among Married-Couple Families in Lake Hart
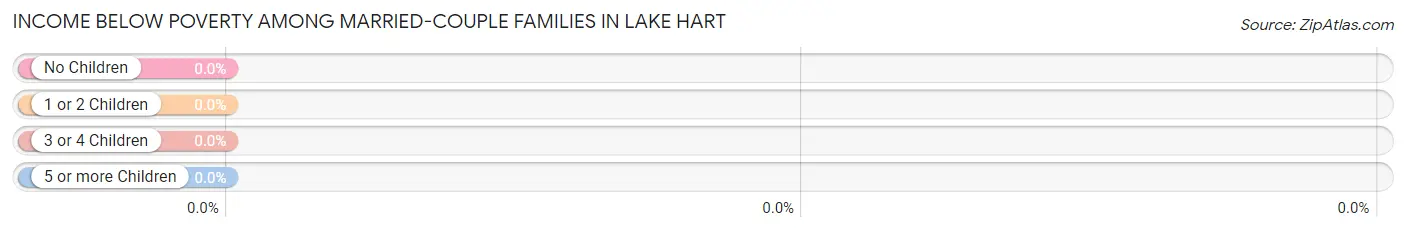
| Children | Above Poverty | Below Poverty |
| No Children | 0 (0.0%) | 0 (0.0%) |
| 1 or 2 Children | 0 (0.0%) | 0 (0.0%) |
| 3 or 4 Children | 35 (100.0%) | 0 (0.0%) |
| 5 or more Children | 0 (0.0%) | 0 (0.0%) |
| Total | 35 (100.0%) | 0 (0.0%) |
Income Below Poverty Among Single-Parent Households in Lake Hart
| Children | Single Father | Single Mother |
| No Children | 0 (0.0%) | 0 (0.0%) |
| 1 or 2 Children | 0 (0.0%) | 0 (0.0%) |
| 3 or 4 Children | 0 (0.0%) | 0 (0.0%) |
| 5 or more Children | 0 (0.0%) | 0 (0.0%) |
| Total | 0 (0.0%) | 0 (0.0%) |
Income Below Poverty Among Married-Couple vs Single-Parent Households in Lake Hart
| Children | Married-Couple Families | Single-Parent Households |
| No Children | 0 (0.0%) | 0 (0.0%) |
| 1 or 2 Children | 0 (0.0%) | 0 (0.0%) |
| 3 or 4 Children | 0 (0.0%) | 0 (0.0%) |
| 5 or more Children | 0 (0.0%) | 0 (0.0%) |
| Total | 0 (0.0%) | 0 (0.0%) |
Race in Lake Hart
The most populous races in Lake Hart are Hispanic or Latino (334 | 65.9%), White / Caucasian (273 | 53.8%), and Some other Race (162 | 32.0%).
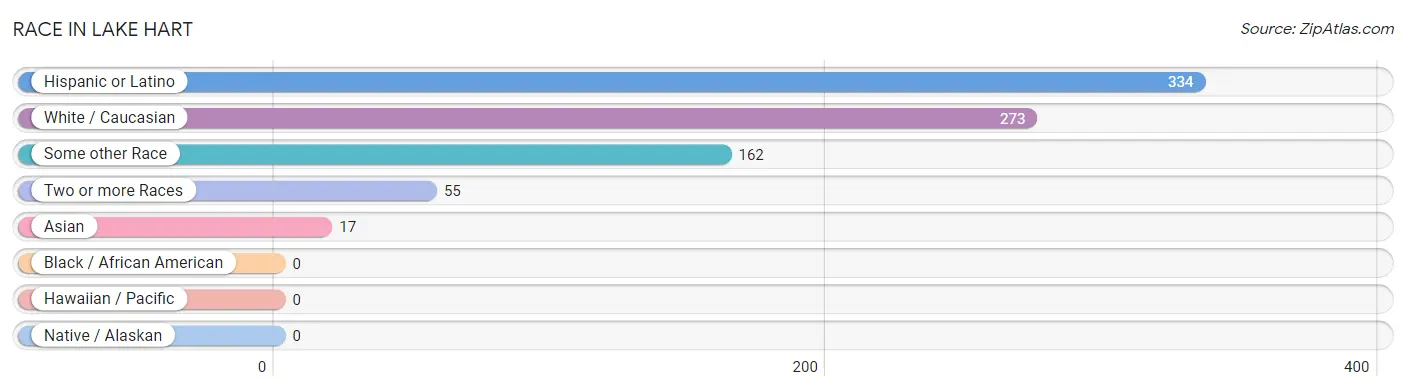
| Race | # Population | % Population |
| Asian | 17 | 3.4% |
| Black / African American | 0 | 0.0% |
| Hawaiian / Pacific | 0 | 0.0% |
| Hispanic or Latino | 334 | 65.9% |
| Native / Alaskan | 0 | 0.0% |
| White / Caucasian | 273 | 53.8% |
| Two or more Races | 55 | 10.8% |
| Some other Race | 162 | 32.0% |
| Total | 507 | 100.0% |
Ancestry in Lake Hart
The most populous ancestries reported in Lake Hart are Puerto Rican (162 | 32.0%), Cuban (82 | 16.2%), British (80 | 15.8%), Scandinavian (80 | 15.8%), and Polish (56 | 11.1%), together accounting for 90.7% of all Lake Hart residents.
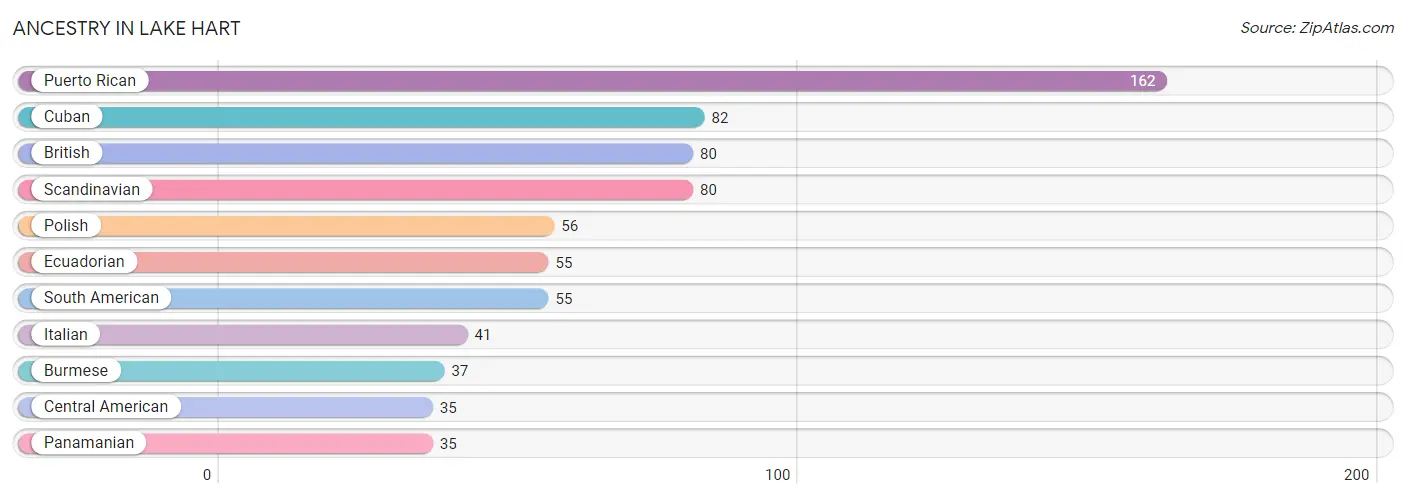
| Ancestry | # Population | % Population |
| British | 80 | 15.8% |
| Burmese | 37 | 7.3% |
| Central American | 35 | 6.9% |
| Cuban | 82 | 16.2% |
| Ecuadorian | 55 | 10.8% |
| Italian | 41 | 8.1% |
| Panamanian | 35 | 6.9% |
| Polish | 56 | 11.1% |
| Puerto Rican | 162 | 32.0% |
| Scandinavian | 80 | 15.8% |
| South American | 55 | 10.8% | View All 11 Rows |
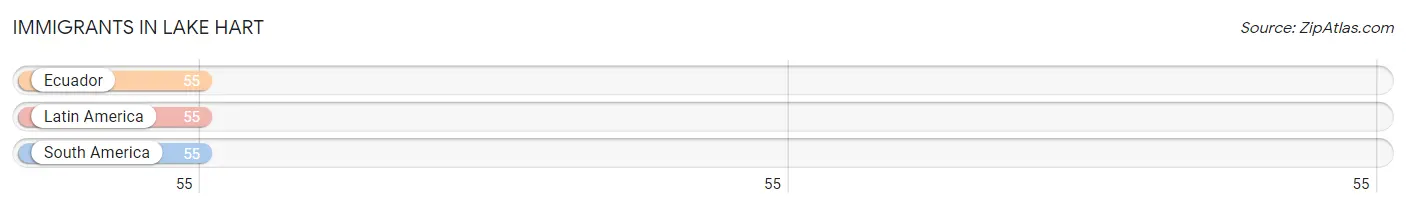
Immigrants in Lake Hart
The most numerous immigrant groups reported in Lake Hart came from Ecuador (55 | 10.8%), Latin America (55 | 10.8%), and South America (55 | 10.8%), together accounting for 32.6% of all Lake Hart residents.
| Immigration Origin | # Population | % Population |
| Ecuador | 55 | 10.8% |
| Latin America | 55 | 10.8% |
| South America | 55 | 10.8% | View All 3 Rows |
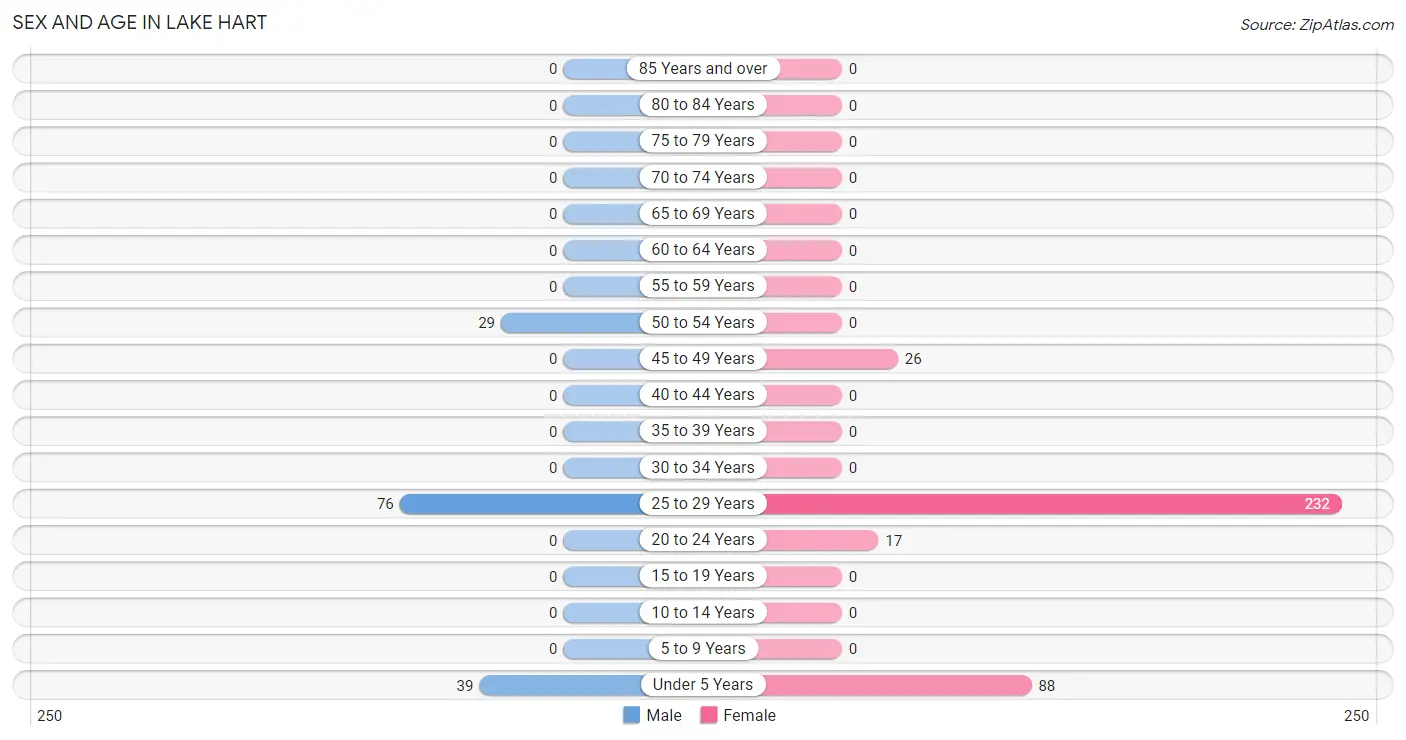
Sex and Age in Lake Hart
Sex and Age in Lake Hart
The most populous age groups in Lake Hart are 25 to 29 Years (76 | 52.8%) for men and 25 to 29 Years (232 | 63.9%) for women.
| Age Bracket | Male | Female |
| Under 5 Years | 39 (27.1%) | 88 (24.2%) |
| 5 to 9 Years | 0 (0.0%) | 0 (0.0%) |
| 10 to 14 Years | 0 (0.0%) | 0 (0.0%) |
| 15 to 19 Years | 0 (0.0%) | 0 (0.0%) |
| 20 to 24 Years | 0 (0.0%) | 17 (4.7%) |
| 25 to 29 Years | 76 (52.8%) | 232 (63.9%) |
| 30 to 34 Years | 0 (0.0%) | 0 (0.0%) |
| 35 to 39 Years | 0 (0.0%) | 0 (0.0%) |
| 40 to 44 Years | 0 (0.0%) | 0 (0.0%) |
| 45 to 49 Years | 0 (0.0%) | 26 (7.2%) |
| 50 to 54 Years | 29 (20.1%) | 0 (0.0%) |
| 55 to 59 Years | 0 (0.0%) | 0 (0.0%) |
| 60 to 64 Years | 0 (0.0%) | 0 (0.0%) |
| 65 to 69 Years | 0 (0.0%) | 0 (0.0%) |
| 70 to 74 Years | 0 (0.0%) | 0 (0.0%) |
| 75 to 79 Years | 0 (0.0%) | 0 (0.0%) |
| 80 to 84 Years | 0 (0.0%) | 0 (0.0%) |
| 85 Years and over | 0 (0.0%) | 0 (0.0%) |
| Total | 144 (100.0%) | 363 (100.0%) |
Families and Households in Lake Hart
Median Family Size in Lake Hart
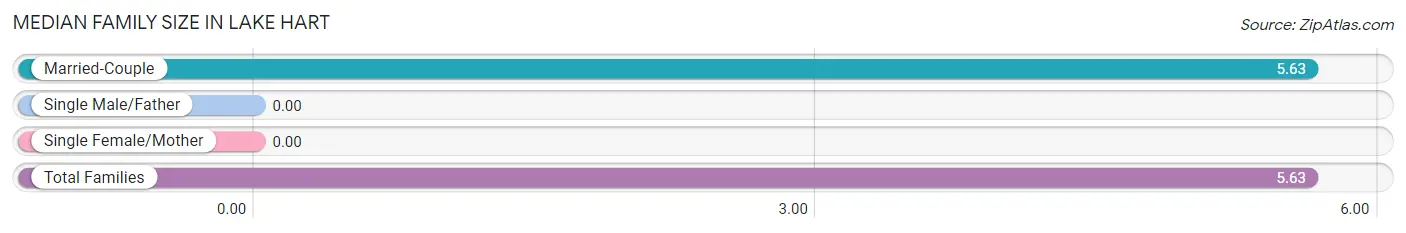
| Family Type | # Families | Family Size |
| Married-Couple | 35 (100.0%) | 5.63 |
| Single Male/Father | 0 (0.0%) | - |
| Single Female/Mother | 0 (0.0%) | - |
| Total Families | 35 (100.0%) | 5.63 |
Median Household Size in Lake Hart
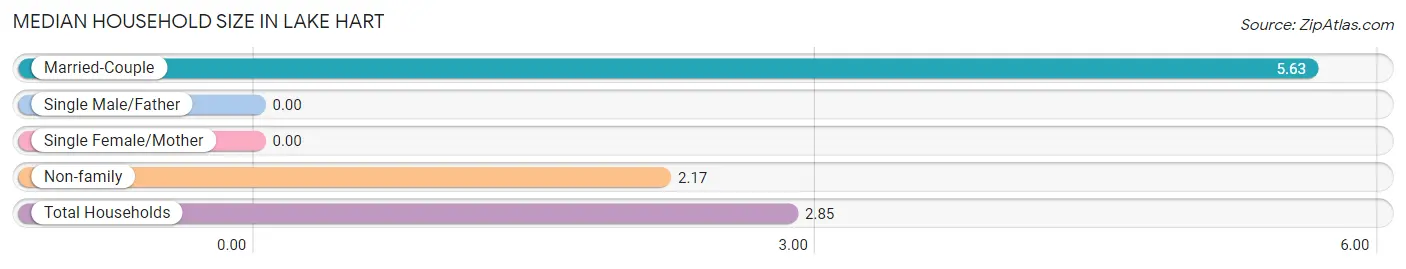
| Household Type | # Households | Household Size |
| Married-Couple | 35 (19.7%) | 5.63 |
| Single Male/Father | 0 (0.0%) | - |
| Single Female/Mother | 0 (0.0%) | - |
| Non-family | 143 (80.3%) | 2.17 |
| Total Households | 178 (100.0%) | 2.85 |
Household Size by Marriage Status in Lake Hart
Out of a total of 178 households in Lake Hart, 35 (19.7%) are family households, while 143 (80.3%) are nonfamily households. The most numerous type of family households are 5-person households, comprising 35, and the most common type of nonfamily households are 2-person households, comprising 143.
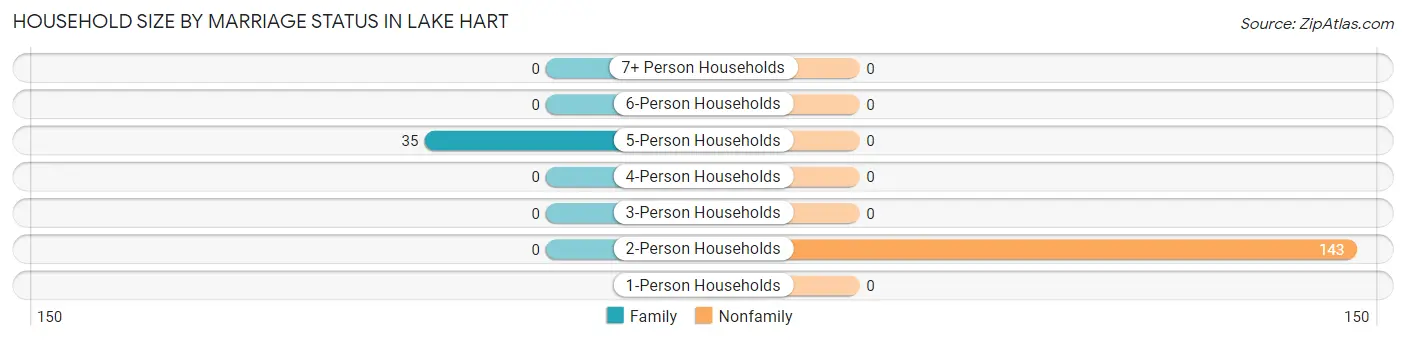
| Household Size | Family Households | Nonfamily Households |
| 1-Person Households | - | 0 (0.0%) |
| 2-Person Households | 0 (0.0%) | 143 (80.3%) |
| 3-Person Households | 0 (0.0%) | 0 (0.0%) |
| 4-Person Households | 0 (0.0%) | 0 (0.0%) |
| 5-Person Households | 35 (19.7%) | 0 (0.0%) |
| 6-Person Households | 0 (0.0%) | 0 (0.0%) |
| 7+ Person Households | 0 (0.0%) | 0 (0.0%) |
| Total | 35 (19.7%) | 143 (80.3%) |
Female Fertility in Lake Hart
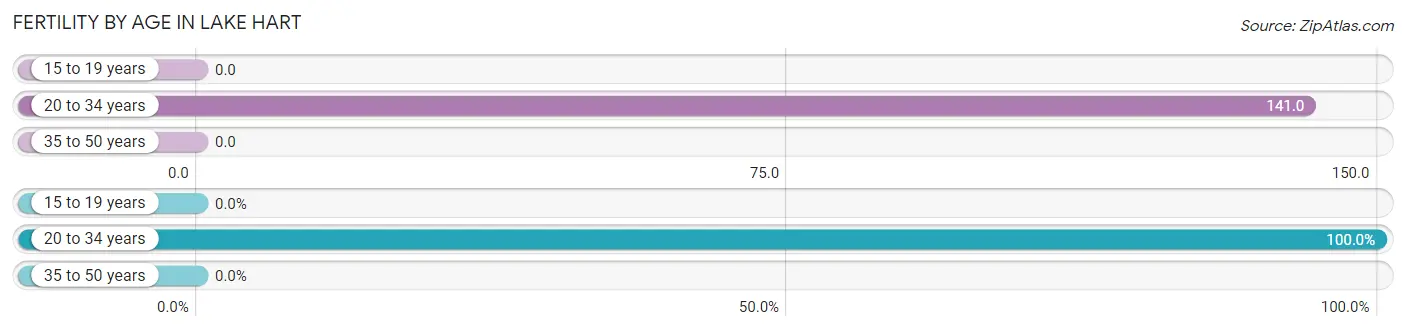
Fertility by Age in Lake Hart
Average fertility rate in Lake Hart is 127.0 births per 1,000 women. Women in the age bracket of 20 to 34 years have the highest fertility rate with 141.0 births per 1,000 women. Women in the age bracket of 20 to 34 years acount for 100.0% of all women with births.
| Age Bracket | Women with Births | Births / 1,000 Women |
| 15 to 19 years | 0 (0.0%) | 0.0 |
| 20 to 34 years | 35 (100.0%) | 141.0 |
| 35 to 50 years | 0 (0.0%) | 0.0 |
| Total | 35 (100.0%) | 127.0 |
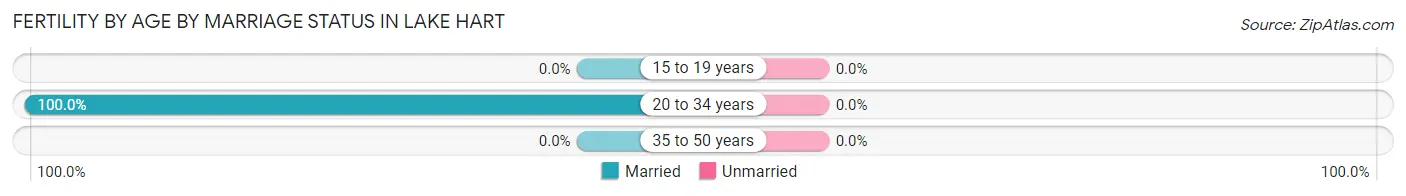
Fertility by Age by Marriage Status in Lake Hart
| Age Bracket | Married | Unmarried |
| 15 to 19 years | 0 (0.0%) | 0 (0.0%) |
| 20 to 34 years | 35 (100.0%) | 0 (0.0%) |
| 35 to 50 years | 0 (0.0%) | 0 (0.0%) |
| Total | 35 (100.0%) | 0 (0.0%) |
Fertility by Education in Lake Hart
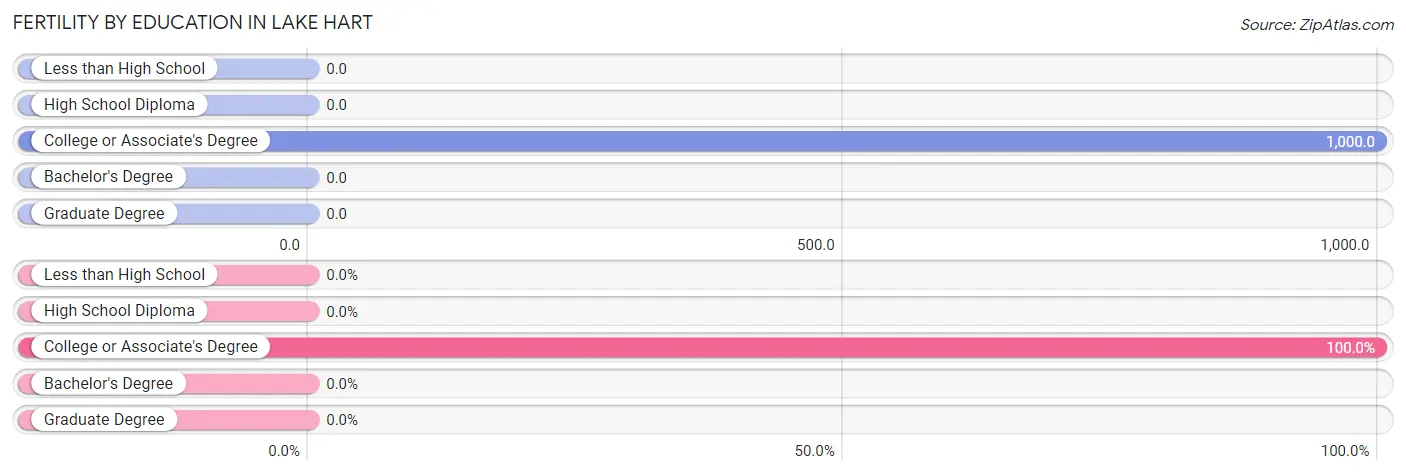
| Educational Attainment | Women with Births | Births / 1,000 Women |
| Less than High School | 0 (0.0%) | 0.0 |
| High School Diploma | 0 (0.0%) | 0.0 |
| College or Associate's Degree | 35 (100.0%) | 1,000.0 |
| Bachelor's Degree | 0 (0.0%) | 0.0 |
| Graduate Degree | 0 (0.0%) | 0.0 |
| Total | 35 (100.0%) | 127.0 |
Fertility by Education by Marriage Status in Lake Hart
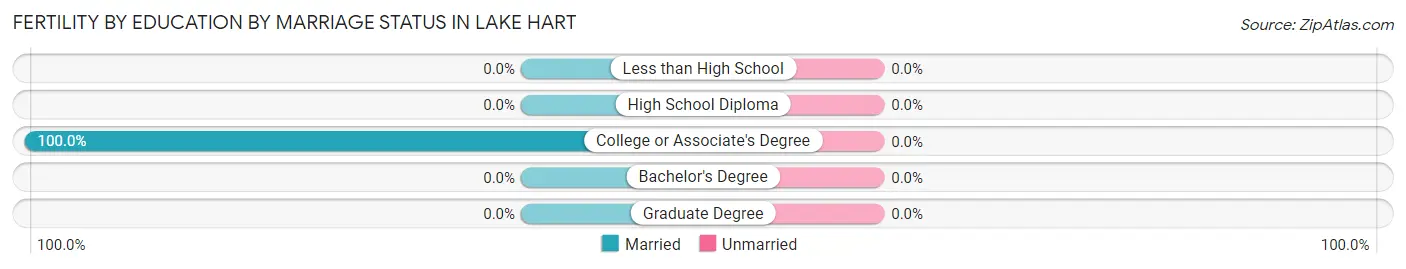
| Educational Attainment | Married | Unmarried |
| Less than High School | 0 (0.0%) | 0 (0.0%) |
| High School Diploma | 0 (0.0%) | 0 (0.0%) |
| College or Associate's Degree | 35 (100.0%) | 0 (0.0%) |
| Bachelor's Degree | 0 (0.0%) | 0 (0.0%) |
| Graduate Degree | 0 (0.0%) | 0 (0.0%) |
| Total | 35 (100.0%) | 0 (0.0%) |
Employment Characteristics in Lake Hart
Employment by Class of Employer in Lake Hart
Among the 181 employed individuals in Lake Hart, private company employees (140 | 77.3%), and not-for-profit organizations (41 | 22.7%) make up the most common classes of employment.
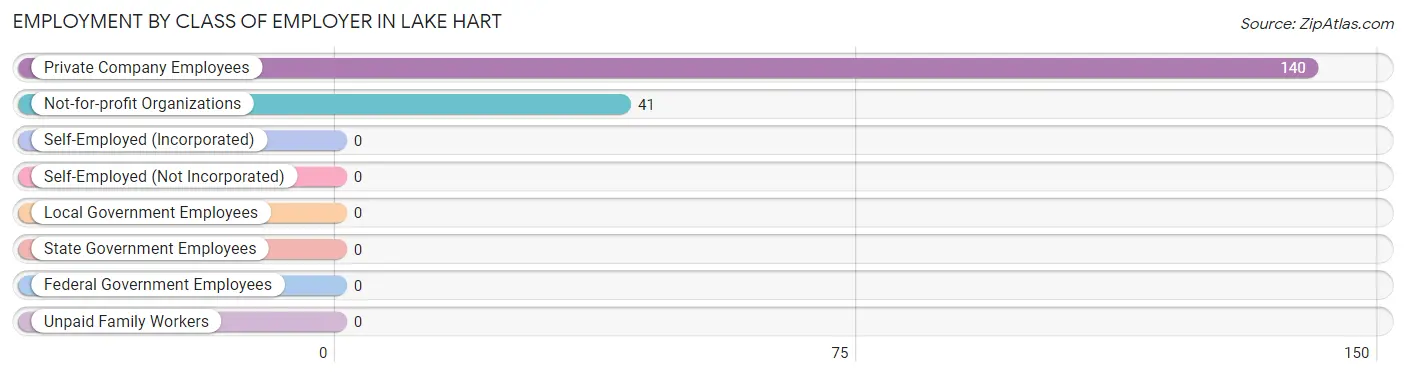
| Employer Class | # Employees | % Employees |
| Private Company Employees | 140 | 77.3% |
| Self-Employed (Incorporated) | 0 | 0.0% |
| Self-Employed (Not Incorporated) | 0 | 0.0% |
| Not-for-profit Organizations | 41 | 22.7% |
| Local Government Employees | 0 | 0.0% |
| State Government Employees | 0 | 0.0% |
| Federal Government Employees | 0 | 0.0% |
| Unpaid Family Workers | 0 | 0.0% |
| Total | 181 | 100.0% |
Employment Status by Age in Lake Hart
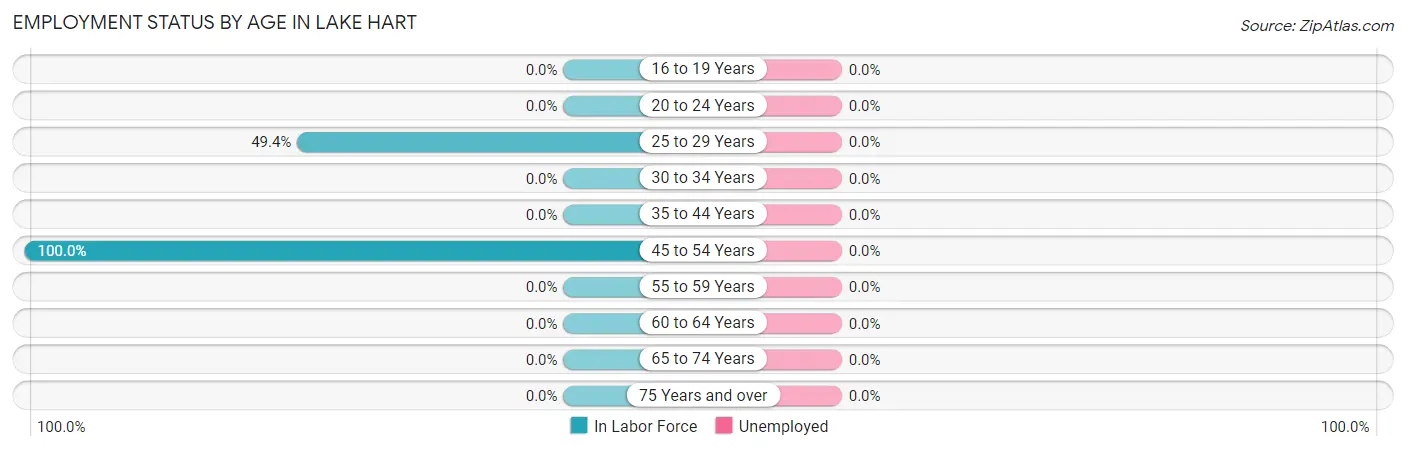
| Age Bracket | In Labor Force | Unemployed |
| 16 to 19 Years | 0 (0.0%) | 0 (0.0%) |
| 20 to 24 Years | 0 (0.0%) | 0 (0.0%) |
| 25 to 29 Years | 152 (49.4%) | 0 (0.0%) |
| 30 to 34 Years | 0 (0.0%) | 0 (0.0%) |
| 35 to 44 Years | 0 (0.0%) | 0 (0.0%) |
| 45 to 54 Years | 55 (100.0%) | 0 (0.0%) |
| 55 to 59 Years | 0 (0.0%) | 0 (0.0%) |
| 60 to 64 Years | 0 (0.0%) | 0 (0.0%) |
| 65 to 74 Years | 0 (0.0%) | 0 (0.0%) |
| 75 Years and over | 0 (0.0%) | 0 (0.0%) |
| Total | 207 (54.5%) | 0 (0.0%) |
Employment Status by Educational Attainment in Lake Hart
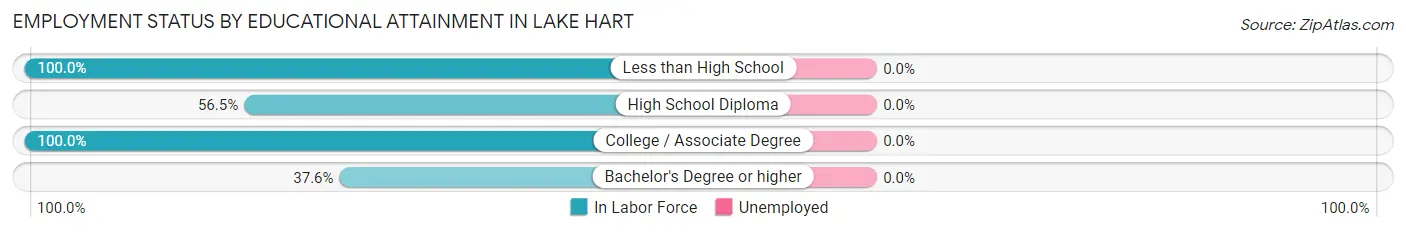
| Educational Attainment | In Labor Force | Unemployed |
| Less than High School | 35 (100.0%) | 0 (0.0%) |
| High School Diploma | 26 (56.5%) | 0 (0.0%) |
| College / Associate Degree | 64 (100.0%) | 0 (0.0%) |
| Bachelor's Degree or higher | 82 (37.6%) | 0 (0.0%) |
| Total | 207 (57.0%) | 0 (0.0%) |
Employment Occupations by Sex in Lake Hart
Management, Business, Science and Arts Occupations
The most common Management, Business, Science and Arts occupations in Lake Hart are Management (41 | 19.8%), Computers, Engineering & Science (41 | 19.8%), and Computers & Mathematics (41 | 19.8%).
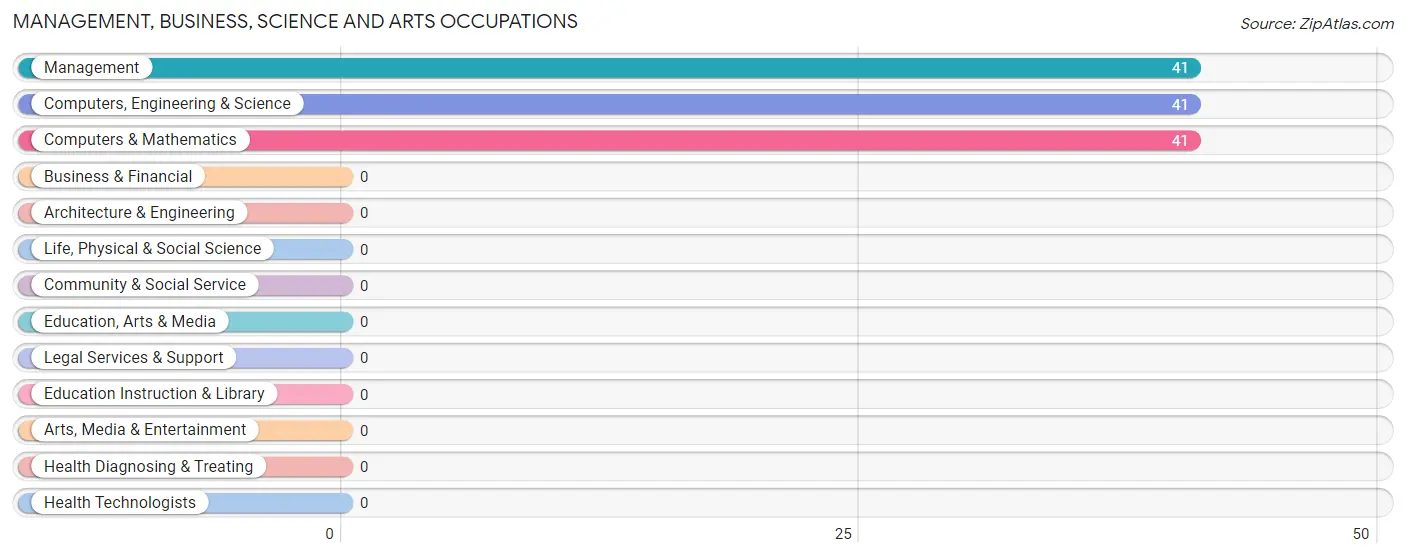
Management, Business, Science and Arts Occupations by Sex
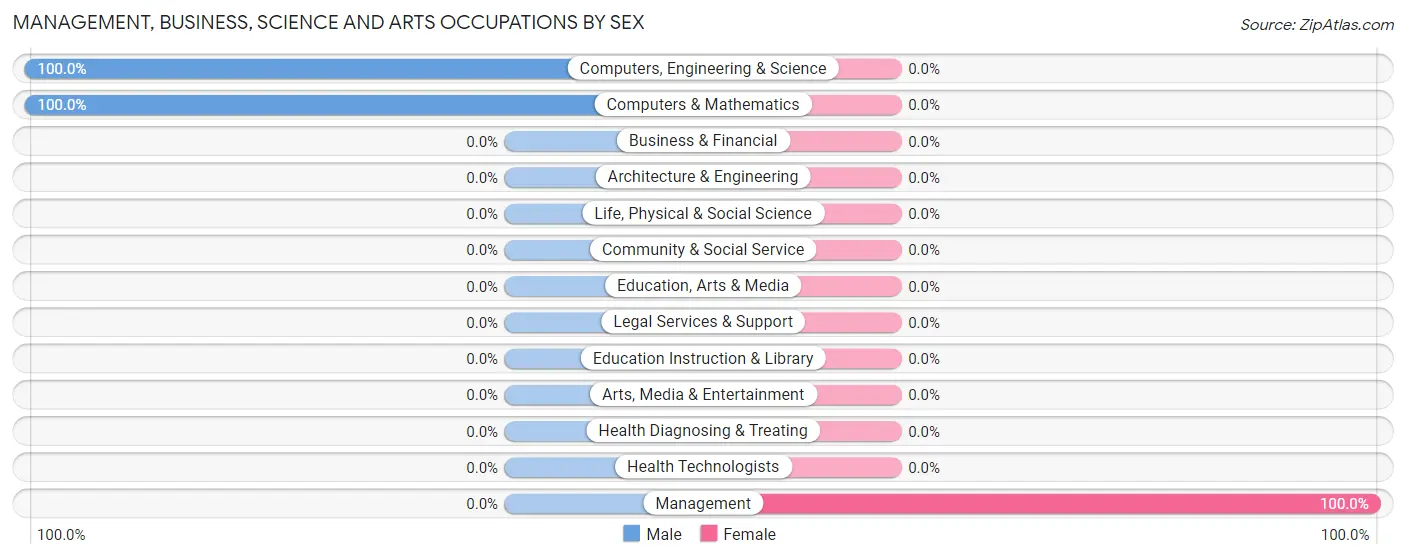
| Occupation | Male | Female |
| Management | 0 (0.0%) | 41 (100.0%) |
| Business & Financial | 0 (0.0%) | 0 (0.0%) |
| Computers, Engineering & Science | 41 (100.0%) | 0 (0.0%) |
| Computers & Mathematics | 41 (100.0%) | 0 (0.0%) |
| Architecture & Engineering | 0 (0.0%) | 0 (0.0%) |
| Life, Physical & Social Science | 0 (0.0%) | 0 (0.0%) |
| Community & Social Service | 0 (0.0%) | 0 (0.0%) |
| Education, Arts & Media | 0 (0.0%) | 0 (0.0%) |
| Legal Services & Support | 0 (0.0%) | 0 (0.0%) |
| Education Instruction & Library | 0 (0.0%) | 0 (0.0%) |
| Arts, Media & Entertainment | 0 (0.0%) | 0 (0.0%) |
| Health Diagnosing & Treating | 0 (0.0%) | 0 (0.0%) |
| Health Technologists | 0 (0.0%) | 0 (0.0%) |
| Total (Category) | 41 (50.0%) | 41 (50.0%) |
| Total (Overall) | 105 (50.7%) | 102 (49.3%) |
Services Occupations
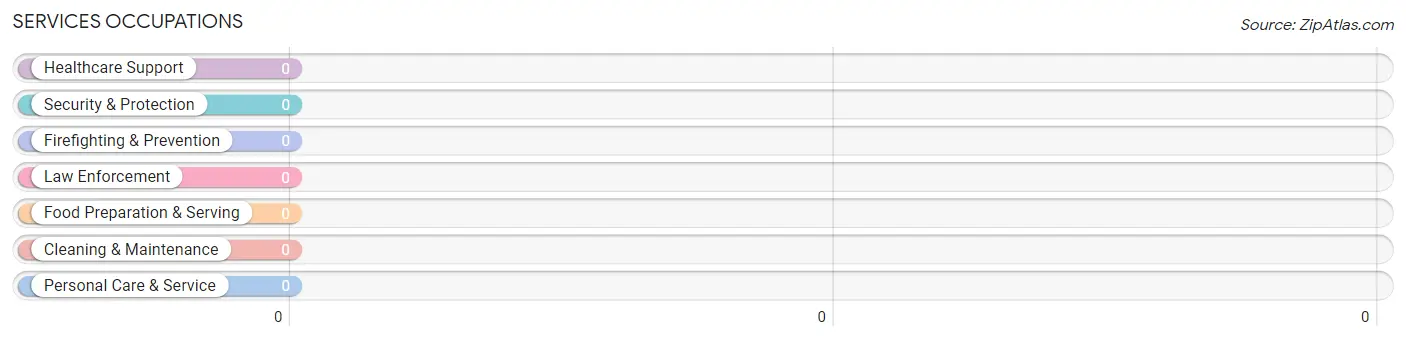
Services Occupations by Sex
| Occupation | Male | Female |
| Healthcare Support | 0 (0.0%) | 0 (0.0%) |
| Security & Protection | 0 (0.0%) | 0 (0.0%) |
| Firefighting & Prevention | 0 (0.0%) | 0 (0.0%) |
| Law Enforcement | 0 (0.0%) | 0 (0.0%) |
| Food Preparation & Serving | 0 (0.0%) | 0 (0.0%) |
| Cleaning & Maintenance | 0 (0.0%) | 0 (0.0%) |
| Personal Care & Service | 0 (0.0%) | 0 (0.0%) |
| Total (Category) | 0 (0.0%) | 0 (0.0%) |
| Total (Overall) | 105 (50.7%) | 102 (49.3%) |
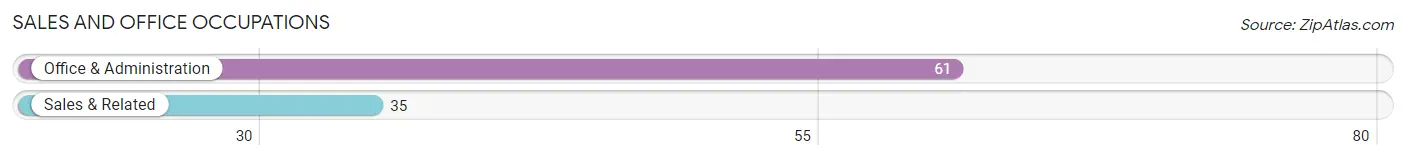
Sales and Office Occupations
The most common Sales and Office occupations in Lake Hart are Office & Administration (61 | 29.5%), and Sales & Related (35 | 16.9%).
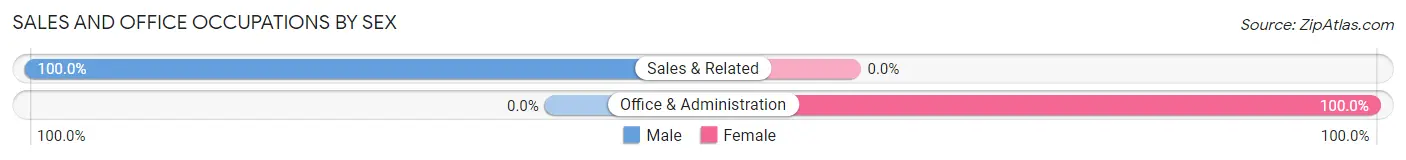
Sales and Office Occupations by Sex
| Occupation | Male | Female |
| Sales & Related | 35 (100.0%) | 0 (0.0%) |
| Office & Administration | 0 (0.0%) | 61 (100.0%) |
| Total (Category) | 35 (36.5%) | 61 (63.5%) |
| Total (Overall) | 105 (50.7%) | 102 (49.3%) |
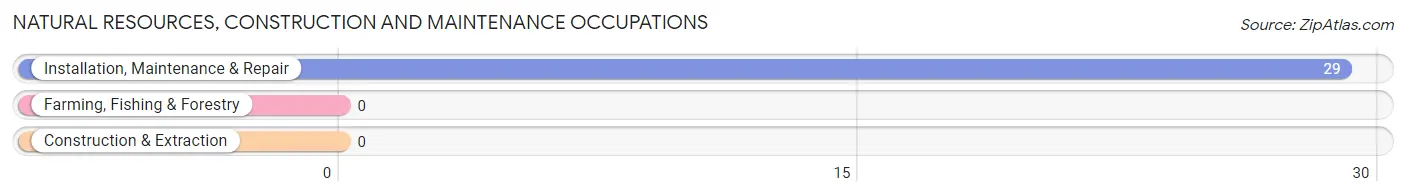
Natural Resources, Construction and Maintenance Occupations
The most common Natural Resources, Construction and Maintenance occupations in Lake Hart are , and Installation, Maintenance & Repair (29 | 14.0%).
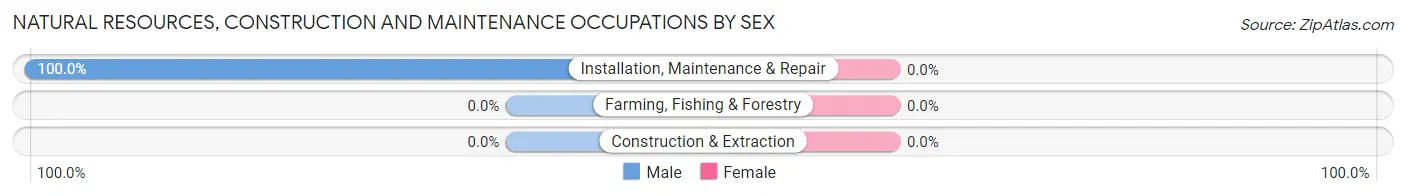
Natural Resources, Construction and Maintenance Occupations by Sex
| Occupation | Male | Female |
| Farming, Fishing & Forestry | 0 (0.0%) | 0 (0.0%) |
| Construction & Extraction | 0 (0.0%) | 0 (0.0%) |
| Installation, Maintenance & Repair | 29 (100.0%) | 0 (0.0%) |
| Total (Category) | 29 (100.0%) | 0 (0.0%) |
| Total (Overall) | 105 (50.7%) | 102 (49.3%) |
Production, Transportation and Moving Occupations
Production, Transportation and Moving Occupations by Sex
| Occupation | Male | Female |
| Production | 0 (0.0%) | 0 (0.0%) |
| Transportation | 0 (0.0%) | 0 (0.0%) |
| Material Moving | 0 (0.0%) | 0 (0.0%) |
| Total (Category) | 0 (0.0%) | 0 (0.0%) |
| Total (Overall) | 105 (50.7%) | 102 (49.3%) |
Employment Industries by Sex in Lake Hart
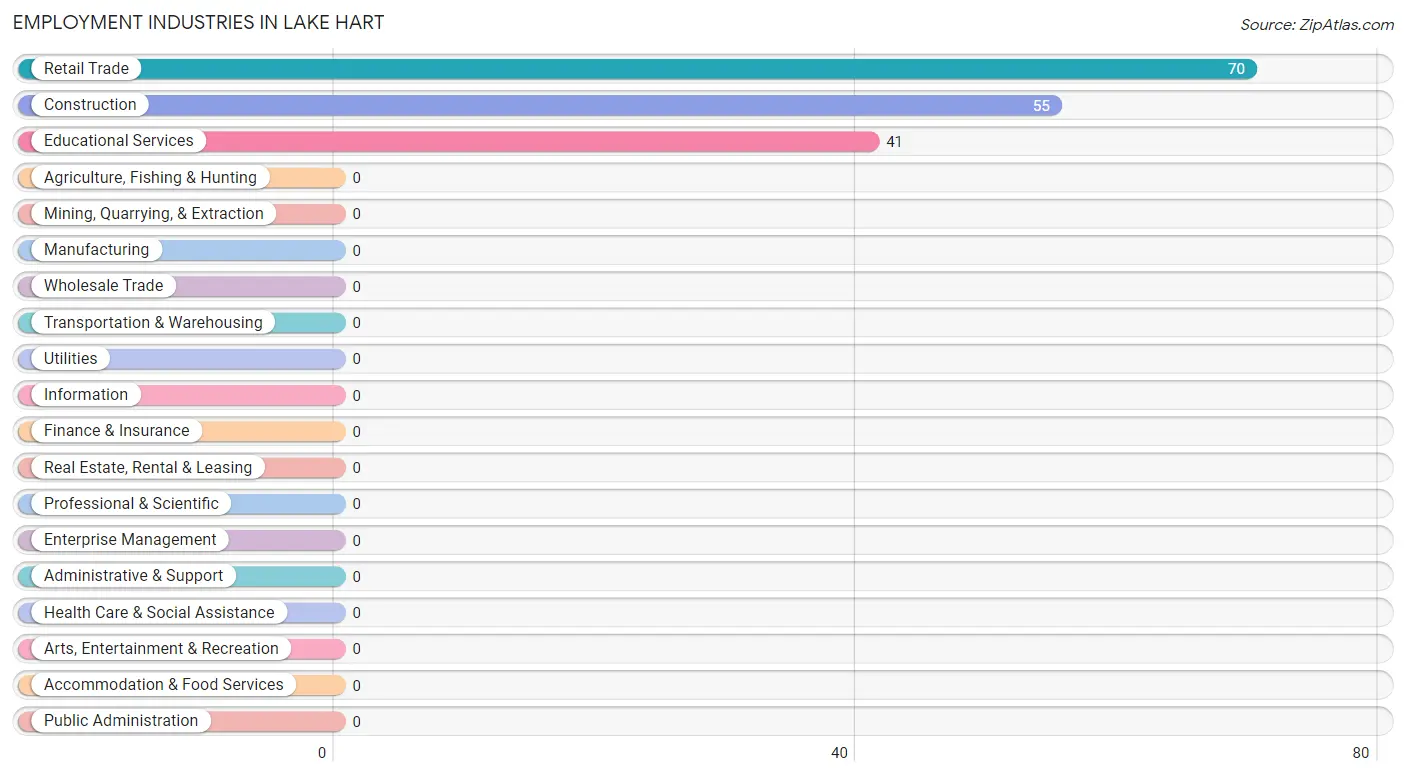
Employment Industries in Lake Hart
The major employment industries in Lake Hart include Retail Trade (70 | 33.8%), Construction (55 | 26.6%), and Educational Services (41 | 19.8%).
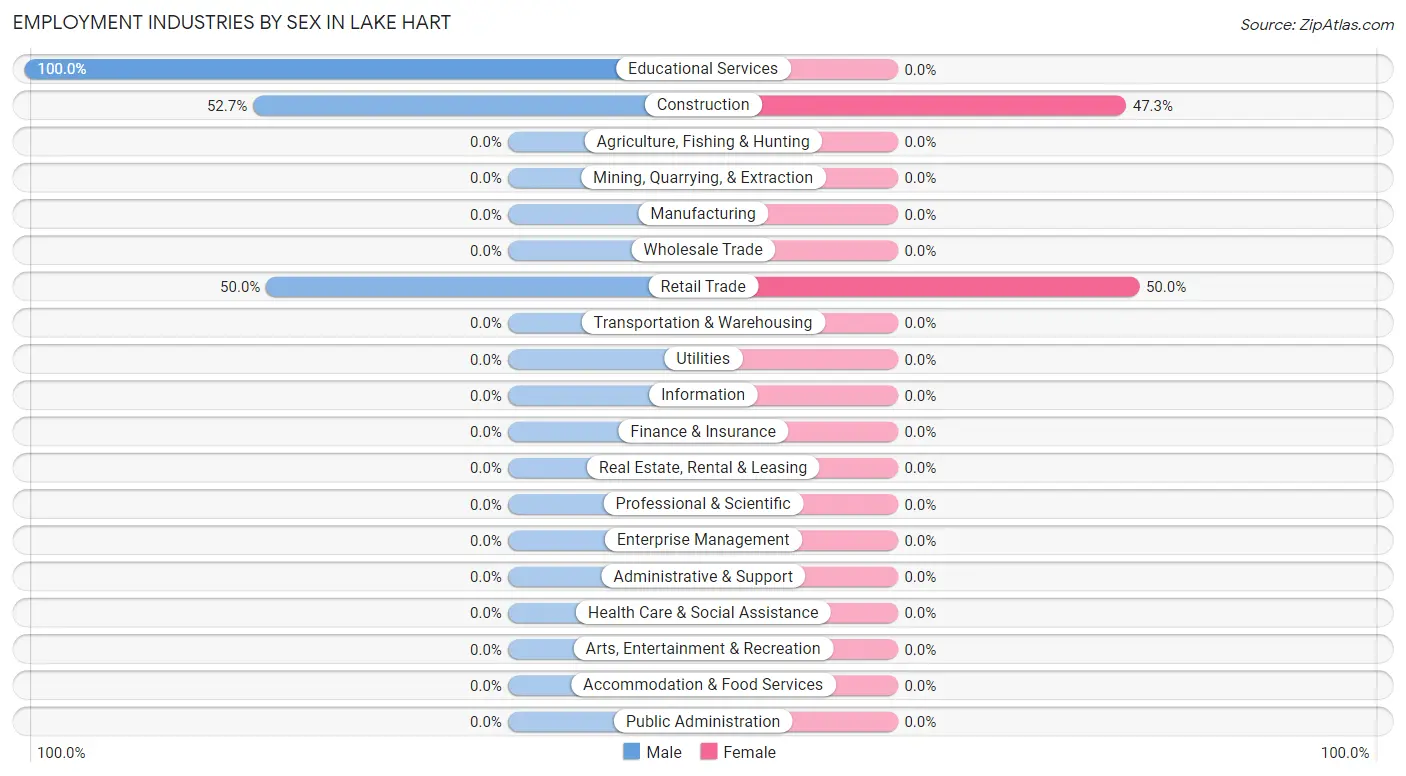
Employment Industries by Sex in Lake Hart
The Lake Hart industries that see more men than women are Educational Services (100.0%), Construction (52.7%), and Retail Trade (50.0%), whereas the industries that tend to have a higher number of women are Retail Trade (50.0%), and Construction (47.3%).
| Industry | Male | Female |
| Agriculture, Fishing & Hunting | 0 (0.0%) | 0 (0.0%) |
| Mining, Quarrying, & Extraction | 0 (0.0%) | 0 (0.0%) |
| Construction | 29 (52.7%) | 26 (47.3%) |
| Manufacturing | 0 (0.0%) | 0 (0.0%) |
| Wholesale Trade | 0 (0.0%) | 0 (0.0%) |
| Retail Trade | 35 (50.0%) | 35 (50.0%) |
| Transportation & Warehousing | 0 (0.0%) | 0 (0.0%) |
| Utilities | 0 (0.0%) | 0 (0.0%) |
| Information | 0 (0.0%) | 0 (0.0%) |
| Finance & Insurance | 0 (0.0%) | 0 (0.0%) |
| Real Estate, Rental & Leasing | 0 (0.0%) | 0 (0.0%) |
| Professional & Scientific | 0 (0.0%) | 0 (0.0%) |
| Enterprise Management | 0 (0.0%) | 0 (0.0%) |
| Administrative & Support | 0 (0.0%) | 0 (0.0%) |
| Educational Services | 41 (100.0%) | 0 (0.0%) |
| Health Care & Social Assistance | 0 (0.0%) | 0 (0.0%) |
| Arts, Entertainment & Recreation | 0 (0.0%) | 0 (0.0%) |
| Accommodation & Food Services | 0 (0.0%) | 0 (0.0%) |
| Public Administration | 0 (0.0%) | 0 (0.0%) |
| Total | 105 (50.7%) | 102 (49.3%) |
Education in Lake Hart
School Enrollment in Lake Hart
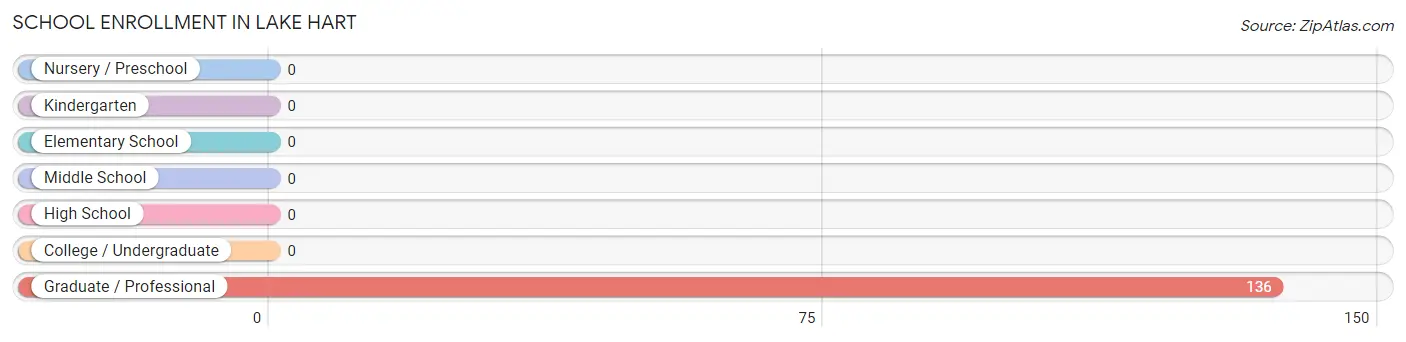
| School Level | # Students | % Students |
| Nursery / Preschool | 0 | 0.0% |
| Kindergarten | 0 | 0.0% |
| Elementary School | 0 | 0.0% |
| Middle School | 0 | 0.0% |
| High School | 0 | 0.0% |
| College / Undergraduate | 0 | 0.0% |
| Graduate / Professional | 136 | 100.0% |
| Total | 136 | 100.0% |
School Enrollment by Age by Funding Source in Lake Hart
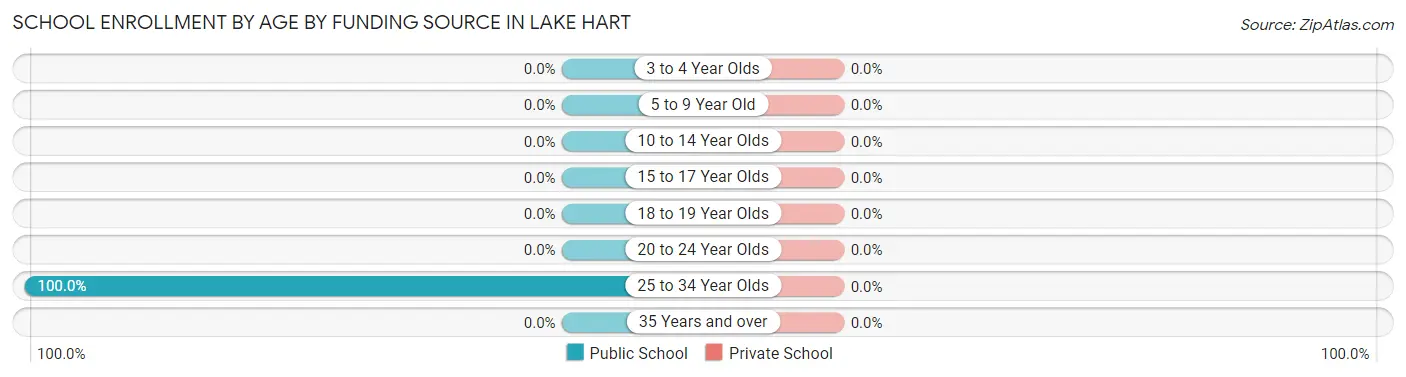
| Age Bracket | Public School | Private School |
| 3 to 4 Year Olds | 0 (0.0%) | 0 (0.0%) |
| 5 to 9 Year Old | 0 (0.0%) | 0 (0.0%) |
| 10 to 14 Year Olds | 0 (0.0%) | 0 (0.0%) |
| 15 to 17 Year Olds | 0 (0.0%) | 0 (0.0%) |
| 18 to 19 Year Olds | 0 (0.0%) | 0 (0.0%) |
| 20 to 24 Year Olds | 0 (0.0%) | 0 (0.0%) |
| 25 to 34 Year Olds | 136 (100.0%) | 0 (0.0%) |
| 35 Years and over | 0 (0.0%) | 0 (0.0%) |
| Total | 136 (100.0%) | 0 (0.0%) |
Educational Attainment by Field of Study in Lake Hart
Physical & health sciences (80 | 26.9%), visual & performing arts (80 | 26.9%), bio, nature & agricultural (56 | 18.8%), computers & mathematics (41 | 13.8%), and arts & humanities (41 | 13.8%) are the most common fields of study among 298 individuals in Lake Hart who have obtained a bachelor's degree or higher.
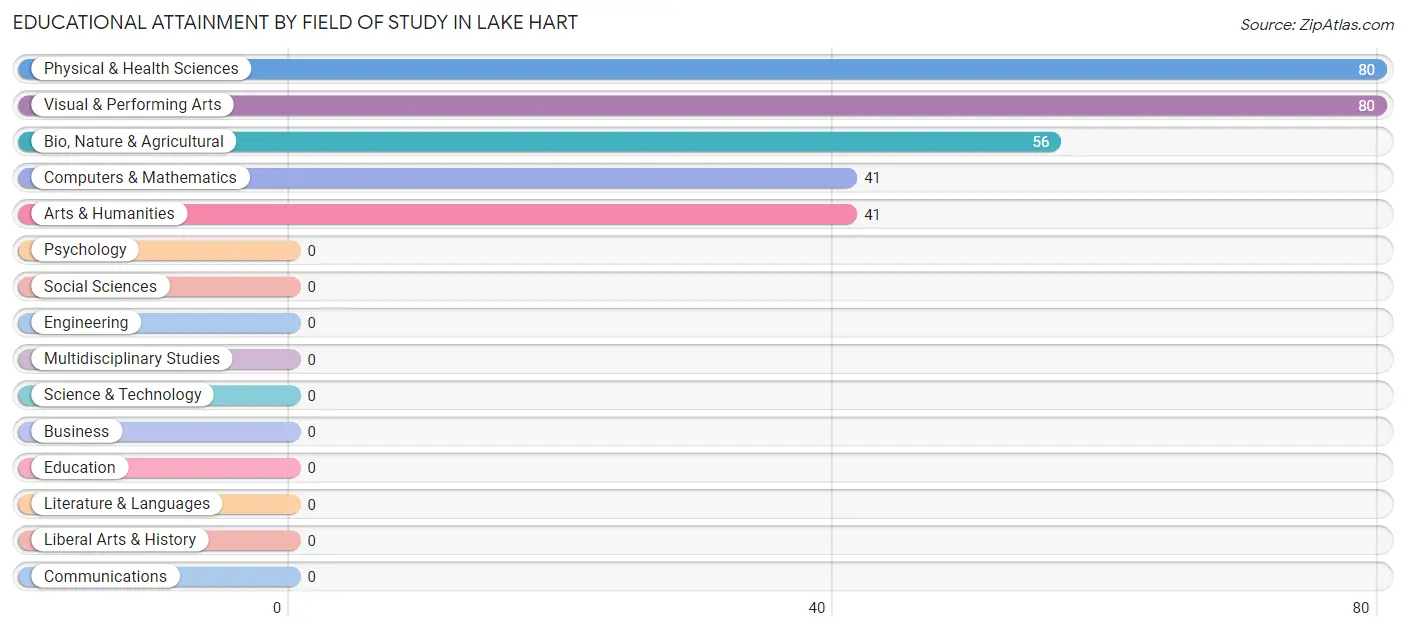
| Field of Study | # Graduates | % Graduates |
| Computers & Mathematics | 41 | 13.8% |
| Bio, Nature & Agricultural | 56 | 18.8% |
| Physical & Health Sciences | 80 | 26.9% |
| Psychology | 0 | 0.0% |
| Social Sciences | 0 | 0.0% |
| Engineering | 0 | 0.0% |
| Multidisciplinary Studies | 0 | 0.0% |
| Science & Technology | 0 | 0.0% |
| Business | 0 | 0.0% |
| Education | 0 | 0.0% |
| Literature & Languages | 0 | 0.0% |
| Liberal Arts & History | 0 | 0.0% |
| Visual & Performing Arts | 80 | 26.9% |
| Communications | 0 | 0.0% |
| Arts & Humanities | 41 | 13.8% |
| Total | 298 | 100.0% |
Transportation & Commute in Lake Hart
Vehicle Availability by Sex in Lake Hart
The most prevalent vehicle ownership categories in Lake Hart are males with 2 vehicles (70, accounting for 66.7%) and females with 2 vehicles (41, making up 92.1%).
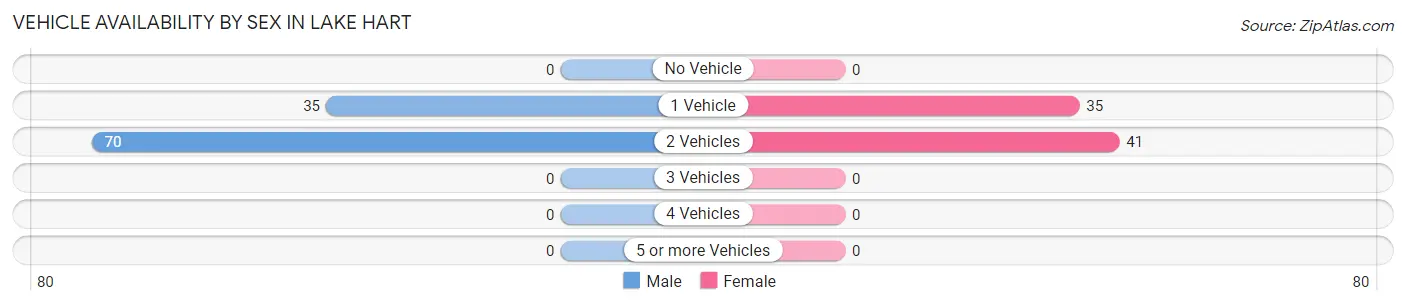
| Vehicles Available | Male | Female |
| No Vehicle | 0 (0.0%) | 0 (0.0%) |
| 1 Vehicle | 35 (33.3%) | 35 (46.1%) |
| 2 Vehicles | 70 (66.7%) | 41 (53.9%) |
| 3 Vehicles | 0 (0.0%) | 0 (0.0%) |
| 4 Vehicles | 0 (0.0%) | 0 (0.0%) |
| 5 or more Vehicles | 0 (0.0%) | 0 (0.0%) |
| Total | 105 (100.0%) | 76 (100.0%) |
Commute Time in Lake Hart
The most frequently occuring commute durations in Lake Hart are 15 to 19 minutes (41 commuters, 39.1%), 10 to 14 minutes (35 commuters, 33.3%), and 40 to 44 minutes (29 commuters, 27.6%).
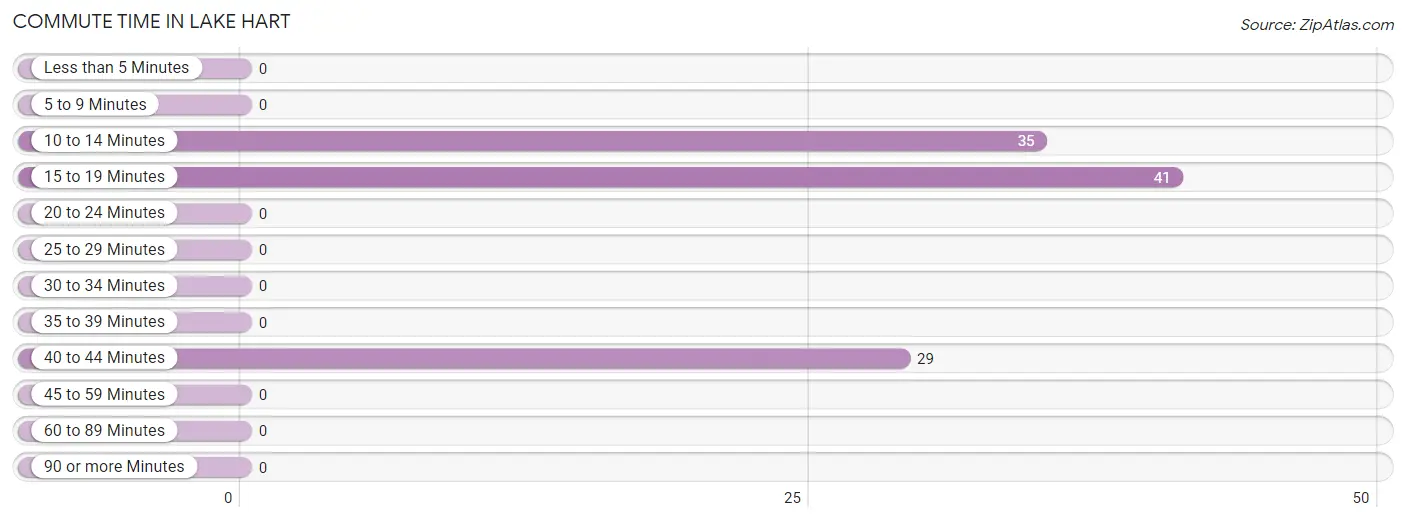
| Commute Time | # Commuters | % Commuters |
| Less than 5 Minutes | 0 | 0.0% |
| 5 to 9 Minutes | 0 | 0.0% |
| 10 to 14 Minutes | 35 | 33.3% |
| 15 to 19 Minutes | 41 | 39.1% |
| 20 to 24 Minutes | 0 | 0.0% |
| 25 to 29 Minutes | 0 | 0.0% |
| 30 to 34 Minutes | 0 | 0.0% |
| 35 to 39 Minutes | 0 | 0.0% |
| 40 to 44 Minutes | 29 | 27.6% |
| 45 to 59 Minutes | 0 | 0.0% |
| 60 to 89 Minutes | 0 | 0.0% |
| 90 or more Minutes | 0 | 0.0% |
Commute Time by Sex in Lake Hart
The most common commute times in Lake Hart are 40 to 44 minutes (29 commuters, 100.0%) for males and 15 to 19 minutes (41 commuters, 53.9%) for females.
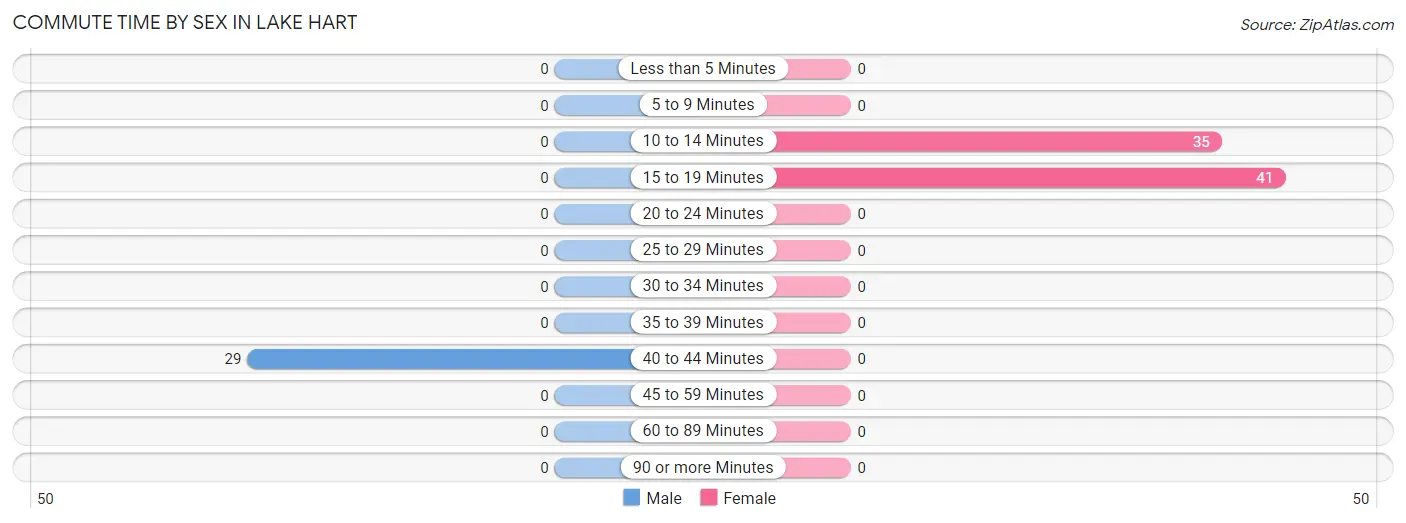
| Commute Time | Male | Female |
| Less than 5 Minutes | 0 (0.0%) | 0 (0.0%) |
| 5 to 9 Minutes | 0 (0.0%) | 0 (0.0%) |
| 10 to 14 Minutes | 0 (0.0%) | 35 (46.1%) |
| 15 to 19 Minutes | 0 (0.0%) | 41 (53.9%) |
| 20 to 24 Minutes | 0 (0.0%) | 0 (0.0%) |
| 25 to 29 Minutes | 0 (0.0%) | 0 (0.0%) |
| 30 to 34 Minutes | 0 (0.0%) | 0 (0.0%) |
| 35 to 39 Minutes | 0 (0.0%) | 0 (0.0%) |
| 40 to 44 Minutes | 29 (100.0%) | 0 (0.0%) |
| 45 to 59 Minutes | 0 (0.0%) | 0 (0.0%) |
| 60 to 89 Minutes | 0 (0.0%) | 0 (0.0%) |
| 90 or more Minutes | 0 (0.0%) | 0 (0.0%) |
Time of Departure to Work by Sex in Lake Hart
The most frequent times of departure to work in Lake Hart are 6:00 AM to 6:29 AM (29, 100.0%) for males and 8:30 AM to 8:59 AM (41, 53.9%) for females.
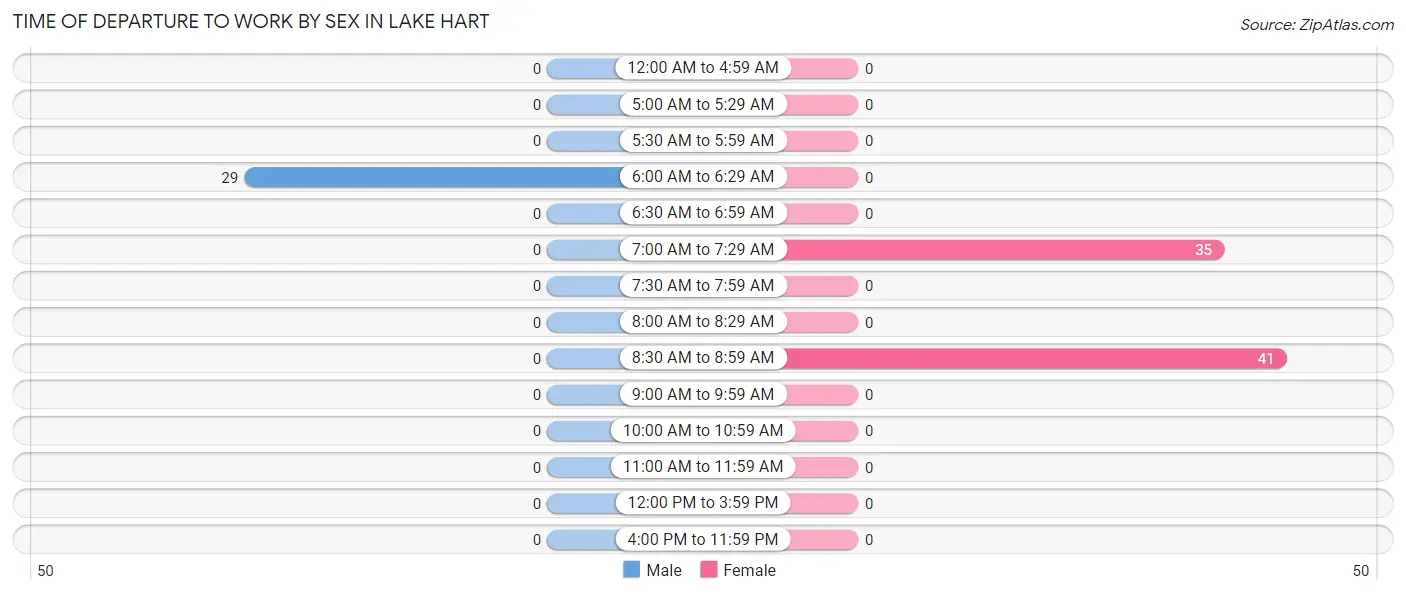
| Time of Departure | Male | Female |
| 12:00 AM to 4:59 AM | 0 (0.0%) | 0 (0.0%) |
| 5:00 AM to 5:29 AM | 0 (0.0%) | 0 (0.0%) |
| 5:30 AM to 5:59 AM | 0 (0.0%) | 0 (0.0%) |
| 6:00 AM to 6:29 AM | 29 (100.0%) | 0 (0.0%) |
| 6:30 AM to 6:59 AM | 0 (0.0%) | 0 (0.0%) |
| 7:00 AM to 7:29 AM | 0 (0.0%) | 35 (46.1%) |
| 7:30 AM to 7:59 AM | 0 (0.0%) | 0 (0.0%) |
| 8:00 AM to 8:29 AM | 0 (0.0%) | 0 (0.0%) |
| 8:30 AM to 8:59 AM | 0 (0.0%) | 41 (53.9%) |
| 9:00 AM to 9:59 AM | 0 (0.0%) | 0 (0.0%) |
| 10:00 AM to 10:59 AM | 0 (0.0%) | 0 (0.0%) |
| 11:00 AM to 11:59 AM | 0 (0.0%) | 0 (0.0%) |
| 12:00 PM to 3:59 PM | 0 (0.0%) | 0 (0.0%) |
| 4:00 PM to 11:59 PM | 0 (0.0%) | 0 (0.0%) |
| Total | 29 (100.0%) | 76 (100.0%) |
Housing Occupancy in Lake Hart
Occupancy by Ownership in Lake Hart
Of the total 178 dwellings in Lake Hart, owner-occupied units account for 0 (0.0%), while renter-occupied units make up 178 (100.0%).
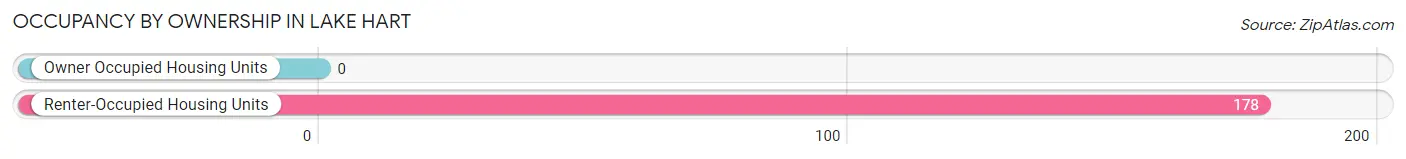
| Occupancy | # Housing Units | % Housing Units |
| Owner Occupied Housing Units | 0 | 0.0% |
| Renter-Occupied Housing Units | 178 | 100.0% |
| Total Occupied Housing Units | 178 | 100.0% |
Occupancy by Household Size in Lake Hart
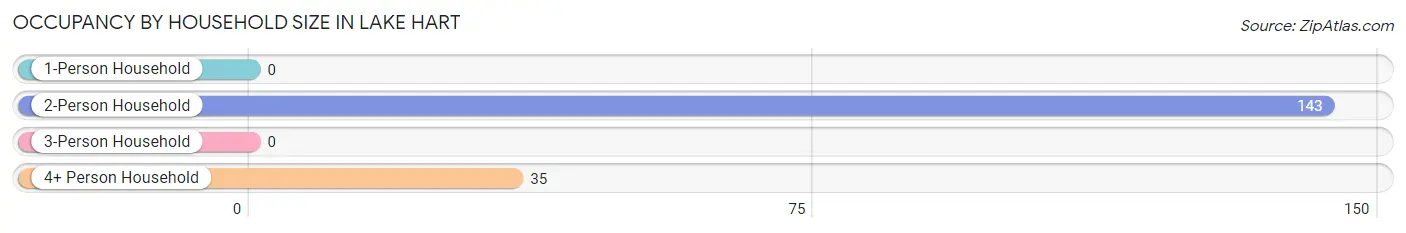
| Household Size | # Housing Units | % Housing Units |
| 1-Person Household | 0 | 0.0% |
| 2-Person Household | 143 | 80.3% |
| 3-Person Household | 0 | 0.0% |
| 4+ Person Household | 35 | 19.7% |
| Total Housing Units | 178 | 100.0% |
Occupancy by Ownership by Household Size in Lake Hart
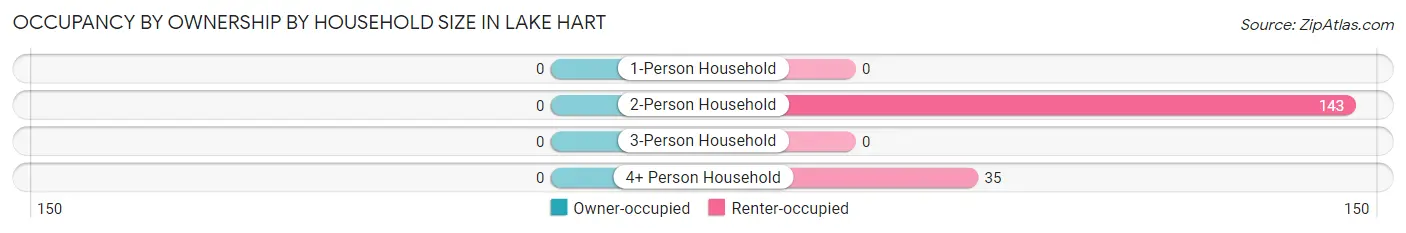
| Household Size | Owner-occupied | Renter-occupied |
| 1-Person Household | 0 (0.0%) | 0 (0.0%) |
| 2-Person Household | 0 (0.0%) | 143 (100.0%) |
| 3-Person Household | 0 (0.0%) | 0 (0.0%) |
| 4+ Person Household | 0 (0.0%) | 35 (100.0%) |
| Total Housing Units | 0 (0.0%) | 178 (100.0%) |
Occupancy by Educational Attainment in Lake Hart
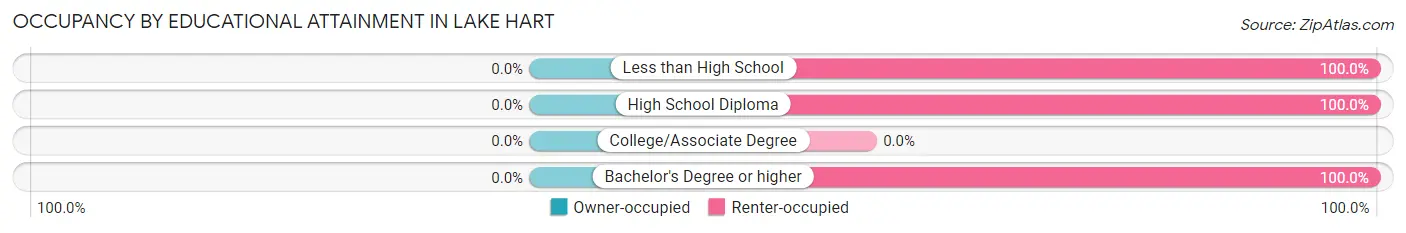
| Household Size | Owner-occupied | Renter-occupied |
| Less than High School | 0 (0.0%) | 35 (100.0%) |
| High School Diploma | 0 (0.0%) | 46 (100.0%) |
| College/Associate Degree | 0 (0.0%) | 0 (0.0%) |
| Bachelor's Degree or higher | 0 (0.0%) | 97 (100.0%) |
Occupancy by Age of Householder in Lake Hart
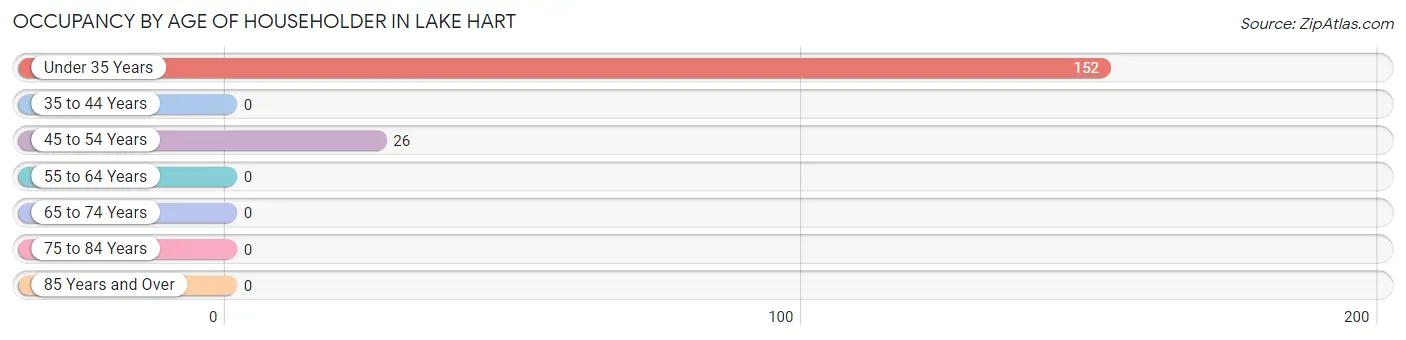
| Age Bracket | # Households | % Households |
| Under 35 Years | 152 | 85.4% |
| 35 to 44 Years | 0 | 0.0% |
| 45 to 54 Years | 26 | 14.6% |
| 55 to 64 Years | 0 | 0.0% |
| 65 to 74 Years | 0 | 0.0% |
| 75 to 84 Years | 0 | 0.0% |
| 85 Years and Over | 0 | 0.0% |
| Total | 178 | 100.0% |
Housing Finances in Lake Hart
Median Income by Occupancy in Lake Hart
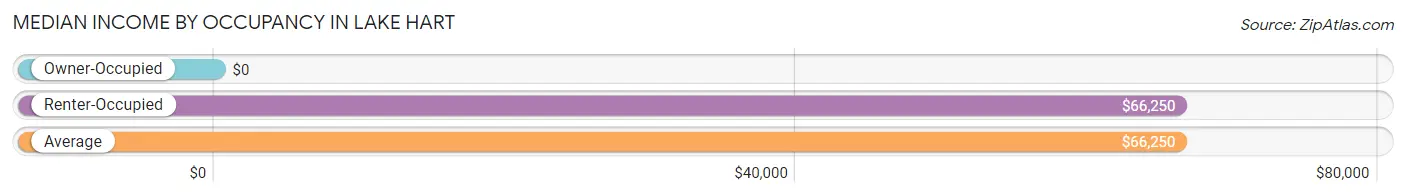
| Occupancy Type | # Households | Median Income |
| Owner-Occupied | 0 (0.0%) | $0 |
| Renter-Occupied | 178 (100.0%) | $66,250 |
| Average | 178 (100.0%) | $66,250 |
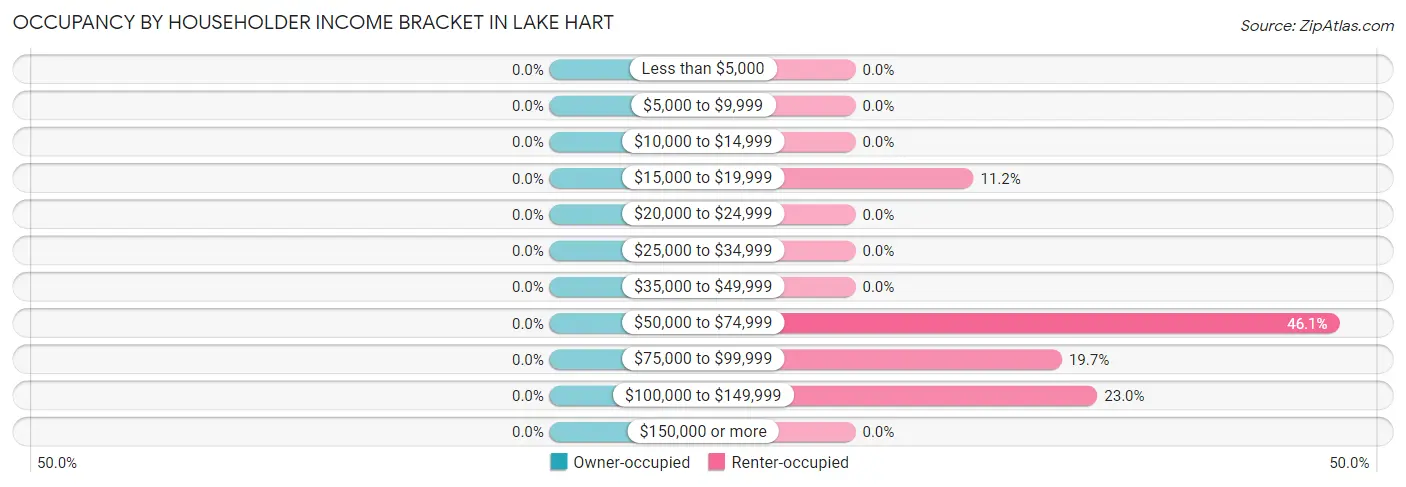
Occupancy by Householder Income Bracket in Lake Hart
| Income Bracket | Owner-occupied | Renter-occupied |
| Less than $5,000 | 0 (0.0%) | 0 (0.0%) |
| $5,000 to $9,999 | 0 (0.0%) | 0 (0.0%) |
| $10,000 to $14,999 | 0 (0.0%) | 0 (0.0%) |
| $15,000 to $19,999 | 0 (0.0%) | 20 (11.2%) |
| $20,000 to $24,999 | 0 (0.0%) | 0 (0.0%) |
| $25,000 to $34,999 | 0 (0.0%) | 0 (0.0%) |
| $35,000 to $49,999 | 0 (0.0%) | 0 (0.0%) |
| $50,000 to $74,999 | 0 (0.0%) | 82 (46.1%) |
| $75,000 to $99,999 | 0 (0.0%) | 35 (19.7%) |
| $100,000 to $149,999 | 0 (0.0%) | 41 (23.0%) |
| $150,000 or more | 0 (0.0%) | 0 (0.0%) |
| Total | 0 (0.0%) | 178 (100.0%) |
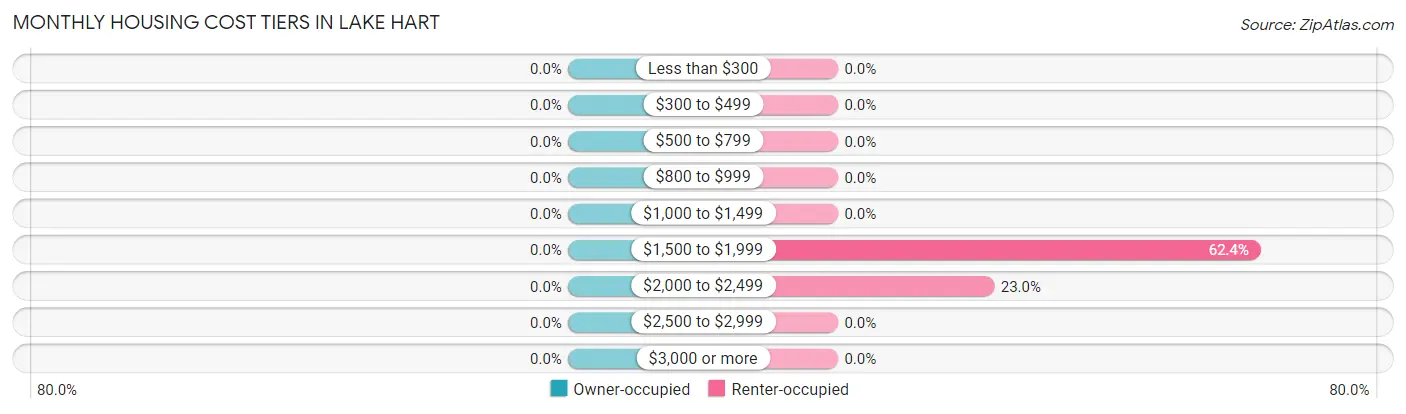
Monthly Housing Cost Tiers in Lake Hart
| Monthly Cost | Owner-occupied | Renter-occupied |
| Less than $300 | 0 (0.0%) | 0 (0.0%) |
| $300 to $499 | 0 (0.0%) | 0 (0.0%) |
| $500 to $799 | 0 (0.0%) | 0 (0.0%) |
| $800 to $999 | 0 (0.0%) | 0 (0.0%) |
| $1,000 to $1,499 | 0 (0.0%) | 0 (0.0%) |
| $1,500 to $1,999 | 0 (0.0%) | 111 (62.4%) |
| $2,000 to $2,499 | 0 (0.0%) | 41 (23.0%) |
| $2,500 to $2,999 | 0 (0.0%) | 0 (0.0%) |
| $3,000 or more | 0 (0.0%) | 0 (0.0%) |
| Total | 0 (0.0%) | 178 (100.0%) |
Physical Housing Characteristics in Lake Hart
Housing Structures in Lake Hart
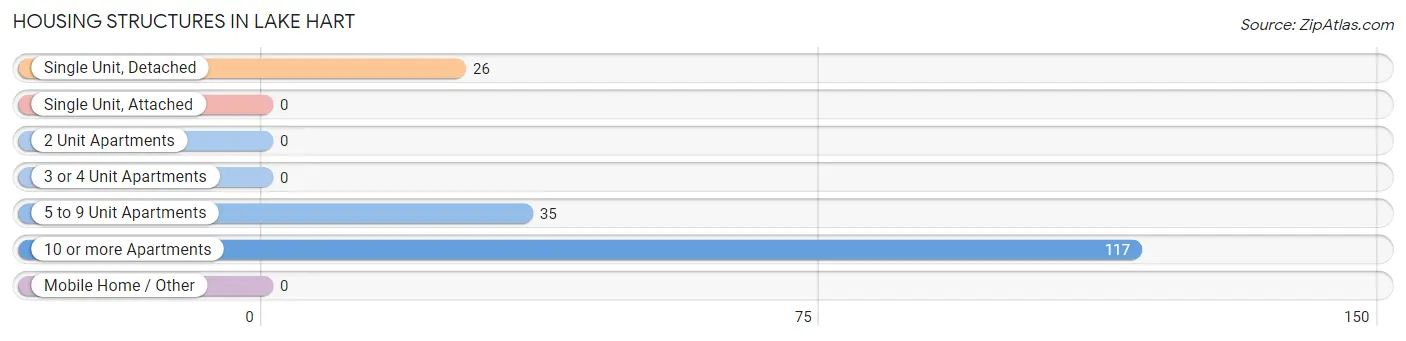
| Structure Type | # Housing Units | % Housing Units |
| Single Unit, Detached | 26 | 14.6% |
| Single Unit, Attached | 0 | 0.0% |
| 2 Unit Apartments | 0 | 0.0% |
| 3 or 4 Unit Apartments | 0 | 0.0% |
| 5 to 9 Unit Apartments | 35 | 19.7% |
| 10 or more Apartments | 117 | 65.7% |
| Mobile Home / Other | 0 | 0.0% |
| Total | 178 | 100.0% |
Housing Structures by Occupancy in Lake Hart
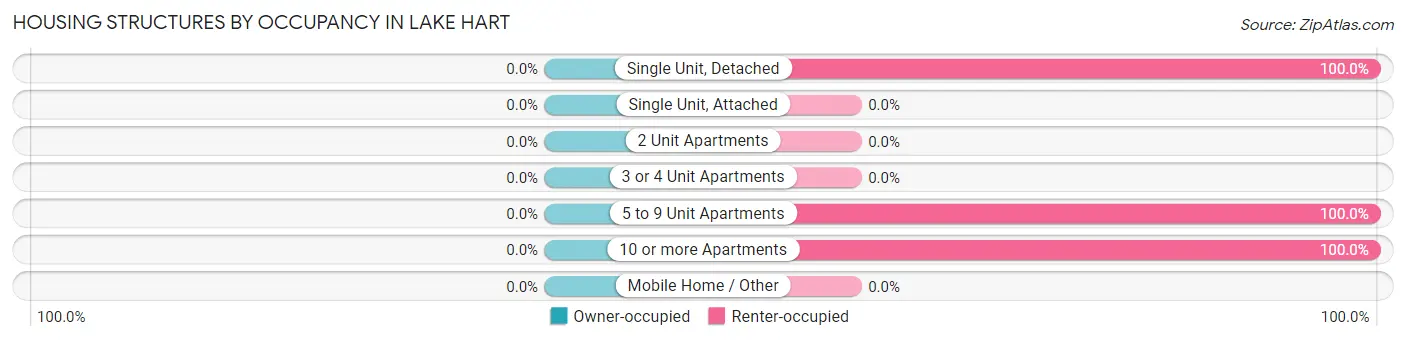
| Structure Type | Owner-occupied | Renter-occupied |
| Single Unit, Detached | 0 (0.0%) | 26 (100.0%) |
| Single Unit, Attached | 0 (0.0%) | 0 (0.0%) |
| 2 Unit Apartments | 0 (0.0%) | 0 (0.0%) |
| 3 or 4 Unit Apartments | 0 (0.0%) | 0 (0.0%) |
| 5 to 9 Unit Apartments | 0 (0.0%) | 35 (100.0%) |
| 10 or more Apartments | 0 (0.0%) | 117 (100.0%) |
| Mobile Home / Other | 0 (0.0%) | 0 (0.0%) |
| Total | 0 (0.0%) | 178 (100.0%) |
Housing Structures by Number of Rooms in Lake Hart
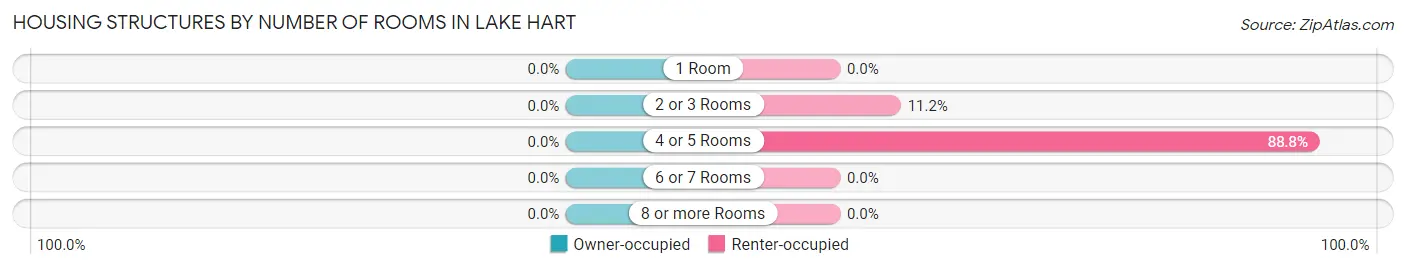
| Number of Rooms | Owner-occupied | Renter-occupied |
| 1 Room | 0 (0.0%) | 0 (0.0%) |
| 2 or 3 Rooms | 0 (0.0%) | 20 (11.2%) |
| 4 or 5 Rooms | 0 (0.0%) | 158 (88.8%) |
| 6 or 7 Rooms | 0 (0.0%) | 0 (0.0%) |
| 8 or more Rooms | 0 (0.0%) | 0 (0.0%) |
| Total | 0 (0.0%) | 178 (100.0%) |
Housing Structure by Heating Type in Lake Hart
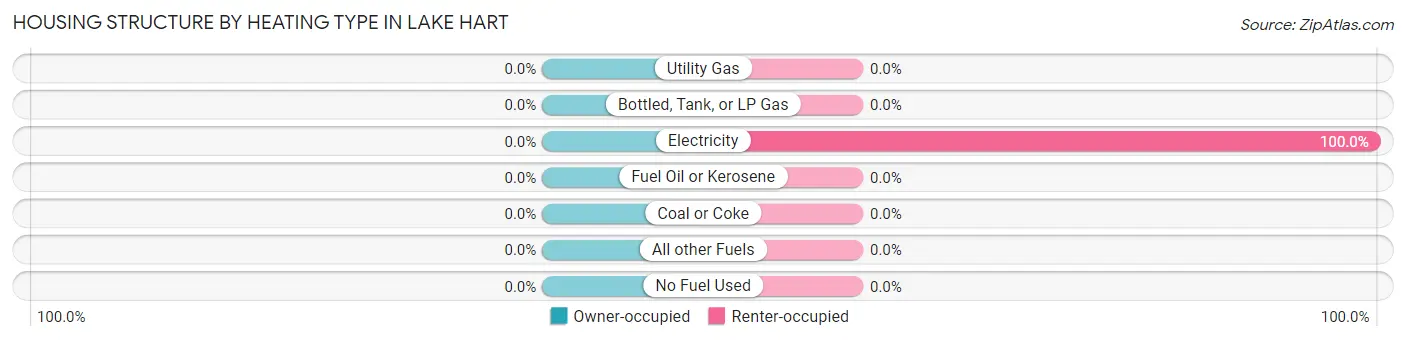
| Heating Type | Owner-occupied | Renter-occupied |
| Utility Gas | 0 (0.0%) | 0 (0.0%) |
| Bottled, Tank, or LP Gas | 0 (0.0%) | 0 (0.0%) |
| Electricity | 0 (0.0%) | 178 (100.0%) |
| Fuel Oil or Kerosene | 0 (0.0%) | 0 (0.0%) |
| Coal or Coke | 0 (0.0%) | 0 (0.0%) |
| All other Fuels | 0 (0.0%) | 0 (0.0%) |
| No Fuel Used | 0 (0.0%) | 0 (0.0%) |
| Total | 0 (0.0%) | 178 (100.0%) |
Household Vehicle Usage in Lake Hart
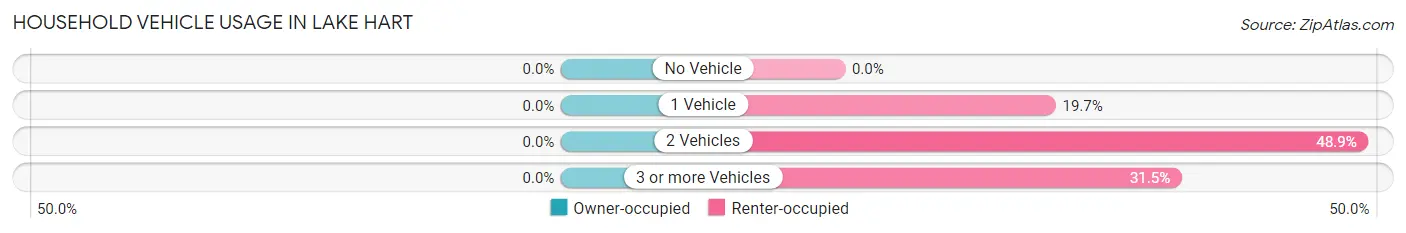
| Vehicles per Household | Owner-occupied | Renter-occupied |
| No Vehicle | 0 (0.0%) | 0 (0.0%) |
| 1 Vehicle | 0 (0.0%) | 35 (19.7%) |
| 2 Vehicles | 0 (0.0%) | 87 (48.9%) |
| 3 or more Vehicles | 0 (0.0%) | 56 (31.5%) |
| Total | 0 (0.0%) | 178 (100.0%) |
Real Estate & Mortgages in Lake Hart
Real Estate and Mortgage Overview in Lake Hart
| Characteristic | Without Mortgage | With Mortgage |
| Housing Units | 0 | 0 |
| Median Property Value | - | - |
| Median Household Income | - | - |
| Monthly Housing Costs | - | - |
| Real Estate Taxes | - | - |
Property Value by Mortgage Status in Lake Hart
| Property Value | Without Mortgage | With Mortgage |
| Less than $50,000 | 0 (0.0%) | 0 (0.0%) |
| $50,000 to $99,999 | 0 (0.0%) | 0 (0.0%) |
| $100,000 to $299,999 | 0 (0.0%) | 0 (0.0%) |
| $300,000 to $499,999 | 0 (0.0%) | 0 (0.0%) |
| $500,000 to $749,999 | 0 (0.0%) | 0 (0.0%) |
| $750,000 to $999,999 | 0 (0.0%) | 0 (0.0%) |
| $1,000,000 or more | 0 (0.0%) | 0 (0.0%) |
| Total | 0 (0.0%) | 0 (0.0%) |
Household Income by Mortgage Status in Lake Hart
| Household Income | Without Mortgage | With Mortgage |
| Less than $10,000 | 0 (0.0%) | 0 (0.0%) |
| $10,000 to $24,999 | 0 (0.0%) | 0 (0.0%) |
| $25,000 to $34,999 | 0 (0.0%) | 0 (0.0%) |
| $35,000 to $49,999 | 0 (0.0%) | 0 (0.0%) |
| $50,000 to $74,999 | 0 (0.0%) | 0 (0.0%) |
| $75,000 to $99,999 | 0 (0.0%) | 0 (0.0%) |
| $100,000 to $149,999 | 0 (0.0%) | 0 (0.0%) |
| $150,000 or more | 0 (0.0%) | 0 (0.0%) |
| Total | 0 (0.0%) | 0 (0.0%) |
Property Value to Household Income Ratio in Lake Hart
| Value-to-Income Ratio | Without Mortgage | With Mortgage |
| Less than 2.0x | 0 (0.0%) | 0 (0.0%) |
| 2.0x to 2.9x | 0 (0.0%) | 0 (0.0%) |
| 3.0x to 3.9x | 0 (0.0%) | 0 (0.0%) |
| 4.0x or more | 0 (0.0%) | 0 (0.0%) |
| Total | 0 (0.0%) | 0 (0.0%) |
Real Estate Taxes by Mortgage Status in Lake Hart
| Property Taxes | Without Mortgage | With Mortgage |
| Less than $800 | 0 (0.0%) | 0 (0.0%) |
| $800 to $1,499 | 0 (0.0%) | 0 (0.0%) |
| $800 to $1,499 | 0 (0.0%) | 0 (0.0%) |
| Total | 0 (0.0%) | 0 (0.0%) |
Health & Disability in Lake Hart
Health Insurance Coverage by Age in Lake Hart
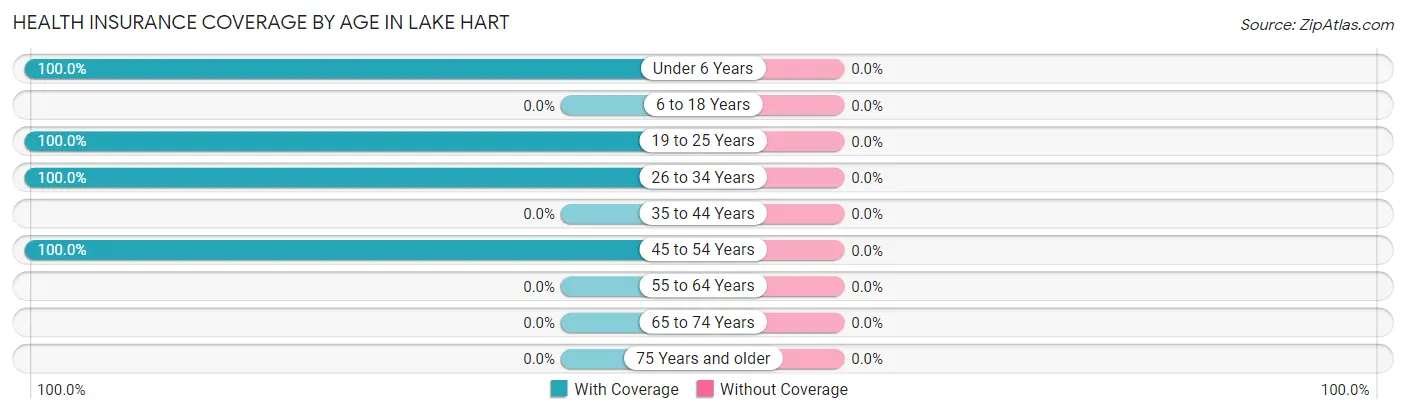
| Age Bracket | With Coverage | Without Coverage |
| Under 6 Years | 127 (100.0%) | 0 (0.0%) |
| 6 to 18 Years | 0 (0.0%) | 0 (0.0%) |
| 19 to 25 Years | 52 (100.0%) | 0 (0.0%) |
| 26 to 34 Years | 273 (100.0%) | 0 (0.0%) |
| 35 to 44 Years | 0 (0.0%) | 0 (0.0%) |
| 45 to 54 Years | 55 (100.0%) | 0 (0.0%) |
| 55 to 64 Years | 0 (0.0%) | 0 (0.0%) |
| 65 to 74 Years | 0 (0.0%) | 0 (0.0%) |
| 75 Years and older | 0 (0.0%) | 0 (0.0%) |
| Total | 507 (100.0%) | 0 (0.0%) |
Health Insurance Coverage by Citizenship Status in Lake Hart
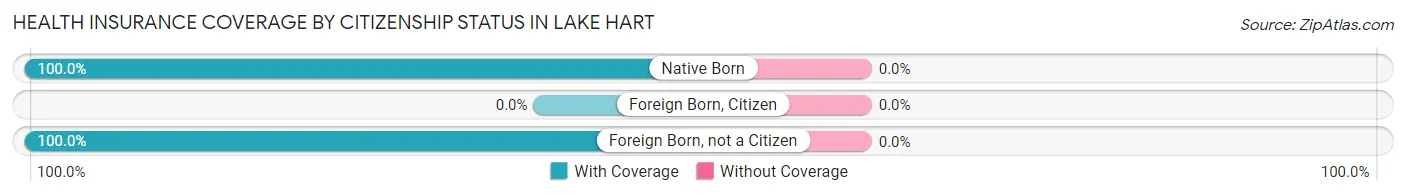
| Citizenship Status | With Coverage | Without Coverage |
| Native Born | 127 (100.0%) | 0 (0.0%) |
| Foreign Born, Citizen | 0 (0.0%) | 0 (0.0%) |
| Foreign Born, not a Citizen | 52 (100.0%) | 0 (0.0%) |
Health Insurance Coverage by Household Income in Lake Hart
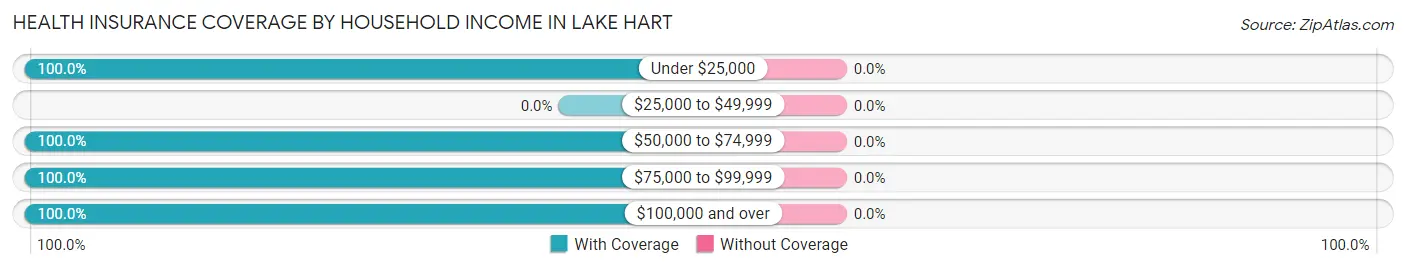
| Household Income | With Coverage | Without Coverage |
| Under $25,000 | 37 (100.0%) | 0 (0.0%) |
| $25,000 to $49,999 | 0 (0.0%) | 0 (0.0%) |
| $50,000 to $74,999 | 191 (100.0%) | 0 (0.0%) |
| $75,000 to $99,999 | 197 (100.0%) | 0 (0.0%) |
| $100,000 and over | 82 (100.0%) | 0 (0.0%) |
Public vs Private Health Insurance Coverage by Age in Lake Hart
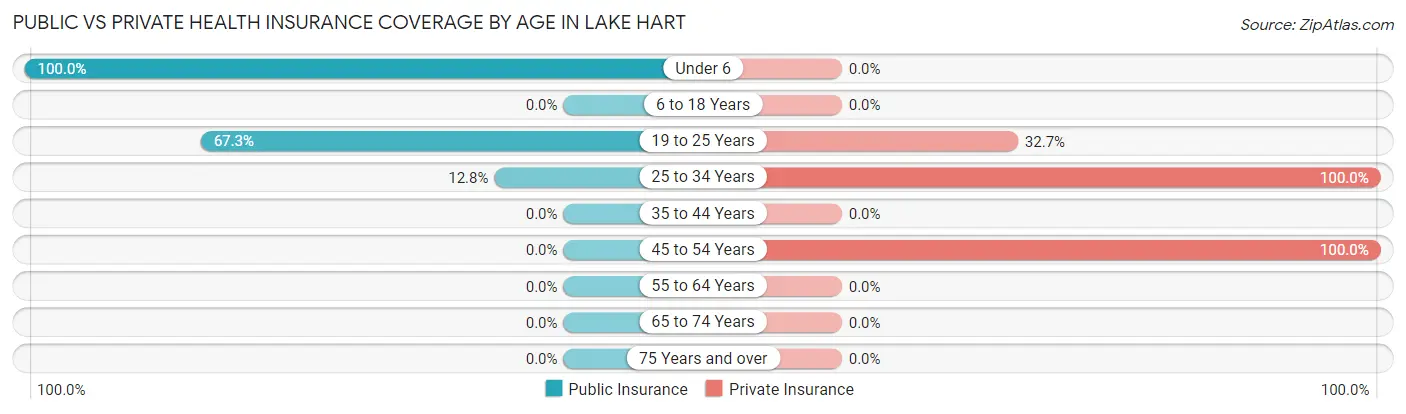
| Age Bracket | Public Insurance | Private Insurance |
| Under 6 | 127 (100.0%) | 0 (0.0%) |
| 6 to 18 Years | 0 (0.0%) | 0 (0.0%) |
| 19 to 25 Years | 35 (67.3%) | 17 (32.7%) |
| 25 to 34 Years | 35 (12.8%) | 273 (100.0%) |
| 35 to 44 Years | 0 (0.0%) | 0 (0.0%) |
| 45 to 54 Years | 0 (0.0%) | 55 (100.0%) |
| 55 to 64 Years | 0 (0.0%) | 0 (0.0%) |
| 65 to 74 Years | 0 (0.0%) | 0 (0.0%) |
| 75 Years and over | 0 (0.0%) | 0 (0.0%) |
| Total | 197 (38.9%) | 345 (68.0%) |
Disability Status by Sex by Age in Lake Hart
| Age Bracket | Male | Female |
| Under 5 Years | 0 (0.0%) | 0 (0.0%) |
| 5 to 17 Years | 0 (0.0%) | 0 (0.0%) |
| 18 to 34 Years | 0 (0.0%) | 0 (0.0%) |
| 35 to 64 Years | 0 (0.0%) | 0 (0.0%) |
| 65 to 74 Years | 0 (0.0%) | 0 (0.0%) |
| 75 Years and over | 0 (0.0%) | 0 (0.0%) |
Disability Class by Sex by Age in Lake Hart
Disability Class: Hearing Difficulty
| Age Bracket | Male | Female |
| Under 5 Years | 0 (0.0%) | 0 (0.0%) |
| 5 to 17 Years | 0 (0.0%) | 0 (0.0%) |
| 18 to 34 Years | 0 (0.0%) | 0 (0.0%) |
| 35 to 64 Years | 0 (0.0%) | 0 (0.0%) |
| 65 to 74 Years | 0 (0.0%) | 0 (0.0%) |
| 75 Years and over | 0 (0.0%) | 0 (0.0%) |
Disability Class: Vision Difficulty
| Age Bracket | Male | Female |
| Under 5 Years | 0 (0.0%) | 0 (0.0%) |
| 5 to 17 Years | 0 (0.0%) | 0 (0.0%) |
| 18 to 34 Years | 0 (0.0%) | 0 (0.0%) |
| 35 to 64 Years | 0 (0.0%) | 0 (0.0%) |
| 65 to 74 Years | 0 (0.0%) | 0 (0.0%) |
| 75 Years and over | 0 (0.0%) | 0 (0.0%) |
Disability Class: Cognitive Difficulty
| Age Bracket | Male | Female |
| 5 to 17 Years | 0 (0.0%) | 0 (0.0%) |
| 18 to 34 Years | 0 (0.0%) | 0 (0.0%) |
| 35 to 64 Years | 0 (0.0%) | 0 (0.0%) |
| 65 to 74 Years | 0 (0.0%) | 0 (0.0%) |
| 75 Years and over | 0 (0.0%) | 0 (0.0%) |
Disability Class: Ambulatory Difficulty
| Age Bracket | Male | Female |
| 5 to 17 Years | 0 (0.0%) | 0 (0.0%) |
| 18 to 34 Years | 0 (0.0%) | 0 (0.0%) |
| 35 to 64 Years | 0 (0.0%) | 0 (0.0%) |
| 65 to 74 Years | 0 (0.0%) | 0 (0.0%) |
| 75 Years and over | 0 (0.0%) | 0 (0.0%) |
Disability Class: Self-Care Difficulty
| Age Bracket | Male | Female |
| 5 to 17 Years | 0 (0.0%) | 0 (0.0%) |
| 18 to 34 Years | 0 (0.0%) | 0 (0.0%) |
| 35 to 64 Years | 0 (0.0%) | 0 (0.0%) |
| 65 to 74 Years | 0 (0.0%) | 0 (0.0%) |
| 75 Years and over | 0 (0.0%) | 0 (0.0%) |
Technology Access in Lake Hart
Computing Device Access in Lake Hart
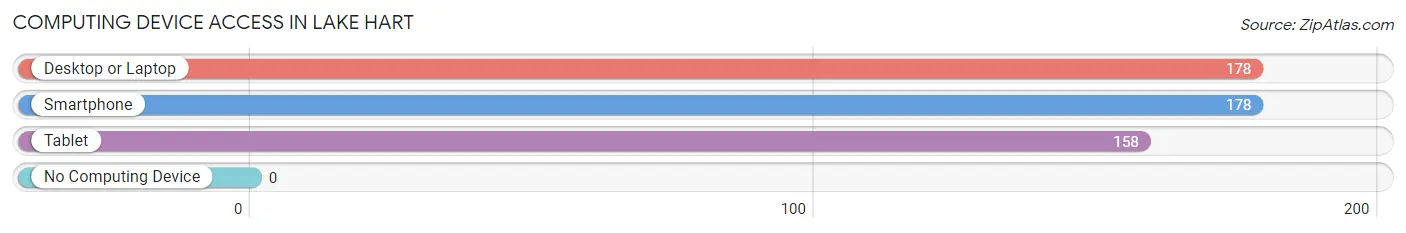
| Device Type | # Households | % Households |
| Desktop or Laptop | 178 | 100.0% |
| Smartphone | 178 | 100.0% |
| Tablet | 158 | 88.8% |
| No Computing Device | 0 | 0.0% |
| Total | 178 | 100.0% |
Internet Access in Lake Hart
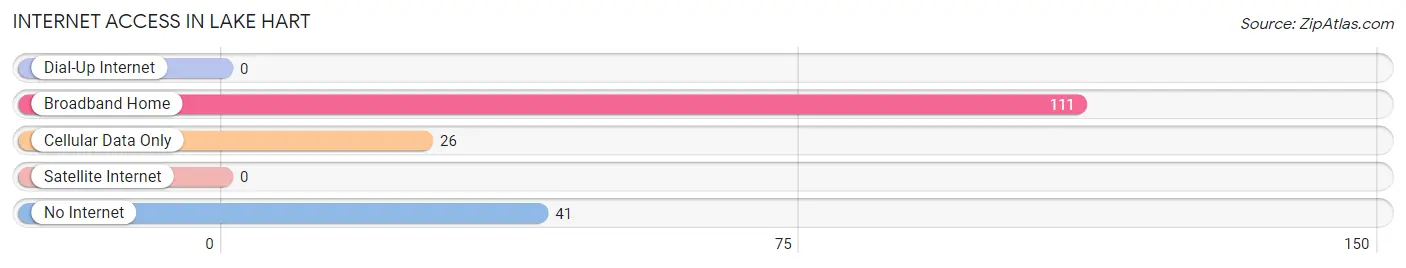
| Internet Type | # Households | % Households |
| Dial-Up Internet | 0 | 0.0% |
| Broadband Home | 111 | 62.4% |
| Cellular Data Only | 26 | 14.6% |
| Satellite Internet | 0 | 0.0% |
| No Internet | 41 | 23.0% |
| Total | 178 | 100.0% |
Lake Hart Summary
History
Lake Hart is a small unincorporated community located in Orange County, Florida. It is situated on the northern shore of Lake Hart, a large lake that is part of the St. Johns River system. The area was first settled in the late 1800s by settlers from the nearby town of Orlando. The settlers were attracted to the area due to its abundance of natural resources, including fish, game, and timber. The area was also known for its fertile soil, which made it ideal for farming.
The community of Lake Hart was officially established in 1887, when the first post office was opened. The town was named after the lake, which was named after a local settler, William Hart. The town grew slowly over the years, and by the early 1900s, it had become a popular destination for tourists and fishermen.
In the 1920s, the area began to experience a boom in population and development. The town was incorporated in 1925, and the population grew to over 500 by 1930. During this time, the town was home to several businesses, including a general store, a hotel, and a sawmill.
In the 1950s, the town began to decline in population as people moved away to larger cities. By the 1970s, the population had dropped to less than 200. In the 1980s, the town began to experience a resurgence in population and development. Today, the population of Lake Hart is estimated to be around 500.
Geography
Lake Hart is located in Orange County, Florida, on the northern shore of Lake Hart. The lake is part of the St. Johns River system and is approximately 4,000 acres in size. The lake is surrounded by a variety of natural habitats, including cypress swamps, hardwood hammocks, and marshes. The area is also home to a variety of wildlife, including alligators, turtles, and a variety of birds.
The town of Lake Hart is situated on the western shore of the lake. It is approximately 10 miles north of Orlando and 25 miles south of Daytona Beach. The town is located in a rural area and is surrounded by farms and ranches.
Economy
The economy of Lake Hart is largely based on tourism and agriculture. The town is home to several tourist attractions, including a public beach, a marina, and a campground. The town is also home to several restaurants and shops.
Agriculture is also an important part of the local economy. The area is home to several farms and ranches, which produce a variety of crops, including citrus fruits, vegetables, and hay.
Demographics
As of the 2010 census, the population of Lake Hart was estimated to be 498. The population is predominantly white (94.2%), with a small percentage of African Americans (2.2%) and Hispanics (2.6%). The median household income is $45,000, and the median age is 44.
Conclusion
Lake Hart is a small unincorporated community located in Orange County, Florida. It is situated on the northern shore of Lake Hart, a large lake that is part of the St. Johns River system. The area was first settled in the late 1800s by settlers from the nearby town of Orlando. The town has experienced a resurgence in population and development in recent years, and the population is now estimated to be around 500. The economy of Lake Hart is largely based on tourism and agriculture, and the population is predominantly white.
Common Questions
What is Per Capita Income in Lake Hart?
Per Capita income in Lake Hart is $27,550.
What is the Median Household income in Lake Hart?
Median Household Income in Lake Hart is $66,250.
What is Income or Wage Gap in Lake Hart?
Income or Wage Gap in Lake Hart is 56.6%.
Women in Lake Hart earn 43.4 cents for every dollar earned by a man.
What is Inequality or Gini Index in Lake Hart?
Inequality or Gini Index in Lake Hart is 0.22.
What is the Total Population of Lake Hart?
Total Population of Lake Hart is 507.
What is the Total Male Population of Lake Hart?
Total Male Population of Lake Hart is 144.
What is the Total Female Population of Lake Hart?
Total Female Population of Lake Hart is 363.
What is the Ratio of Males per 100 Females in Lake Hart?
There are 39.67 Males per 100 Females in Lake Hart.
What is the Ratio of Females per 100 Males in Lake Hart?
There are 252.08 Females per 100 Males in Lake Hart.
What is the Median Population Age in Lake Hart?
Median Population Age in Lake Hart is 26.8 Years.
What is the Average Family Size in Lake Hart
Average Family Size in Lake Hart is 5.6 People.
What is the Average Household Size in Lake Hart
Average Household Size in Lake Hart is 2.9 People.
How Large is the Labor Force in Lake Hart?
There are 207 People in the Labor Forcein in Lake Hart.
What is the Percentage of People in the Labor Force in Lake Hart?
54.5% of People are in the Labor Force in Lake Hart.