Pumpkin Center, NC Map & Demographics
Pumpkin Center Map
Pumpkin Center Overview
$24,474
PER CAPITA INCOME
$61,486
AVG FAMILY INCOME
$60,797
AVG HOUSEHOLD INCOME
11.9%
WAGE / INCOME GAP [ % ]
88.1¢/ $1
WAGE / INCOME GAP [ $ ]
0.32
INEQUALITY / GINI INDEX
2,151
TOTAL POPULATION
894
MALE POPULATION
1,257
FEMALE POPULATION
71.12
MALES / 100 FEMALES
140.60
FEMALES / 100 MALES
32.8
MEDIAN AGE
3.0
AVG FAMILY SIZE
2.8
AVG HOUSEHOLD SIZE
846
LABOR FORCE [ PEOPLE ]
50.8%
PERCENT IN LABOR FORCE
6.4%
UNEMPLOYMENT RATE
Income in Pumpkin Center
Income Overview in Pumpkin Center
Per Capita Income in Pumpkin Center is $24,474, while median incomes of families and households are $61,486 and $60,797 respectively.
| Characteristic | Number | Measure |
| Per Capita Income | 2,151 | $24,474 |
| Median Family Income | 644 | $61,486 |
| Mean Family Income | 644 | $68,603 |
| Median Household Income | 778 | $60,797 |
| Mean Household Income | 778 | $69,849 |
| Income Deficit | 644 | $0 |
| Wage / Income Gap (%) | 2,151 | 11.87% |
| Wage / Income Gap ($) | 2,151 | 88.13¢ per $1 |
| Gini / Inequality Index | 2,151 | 0.32 |
Earnings by Sex in Pumpkin Center
Average Earnings in Pumpkin Center are $42,708, $38,098 for men and $43,229 for women, a difference of 11.9%.
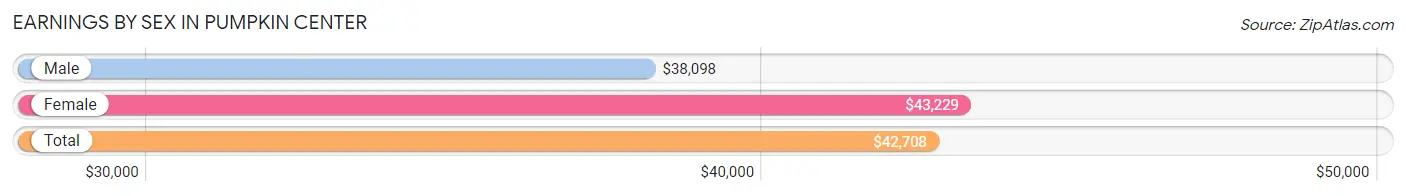
| Sex | Number | Average Earnings |
| Male | 481 (53.7%) | $38,098 |
| Female | 415 (46.3%) | $43,229 |
| Total | 896 (100.0%) | $42,708 |
Earnings by Sex by Income Bracket in Pumpkin Center
The most common earnings brackets in Pumpkin Center are $22,500 to $24,999 for men (95 | 19.8%) and $40,000 to $44,999 for women (94 | 22.7%).
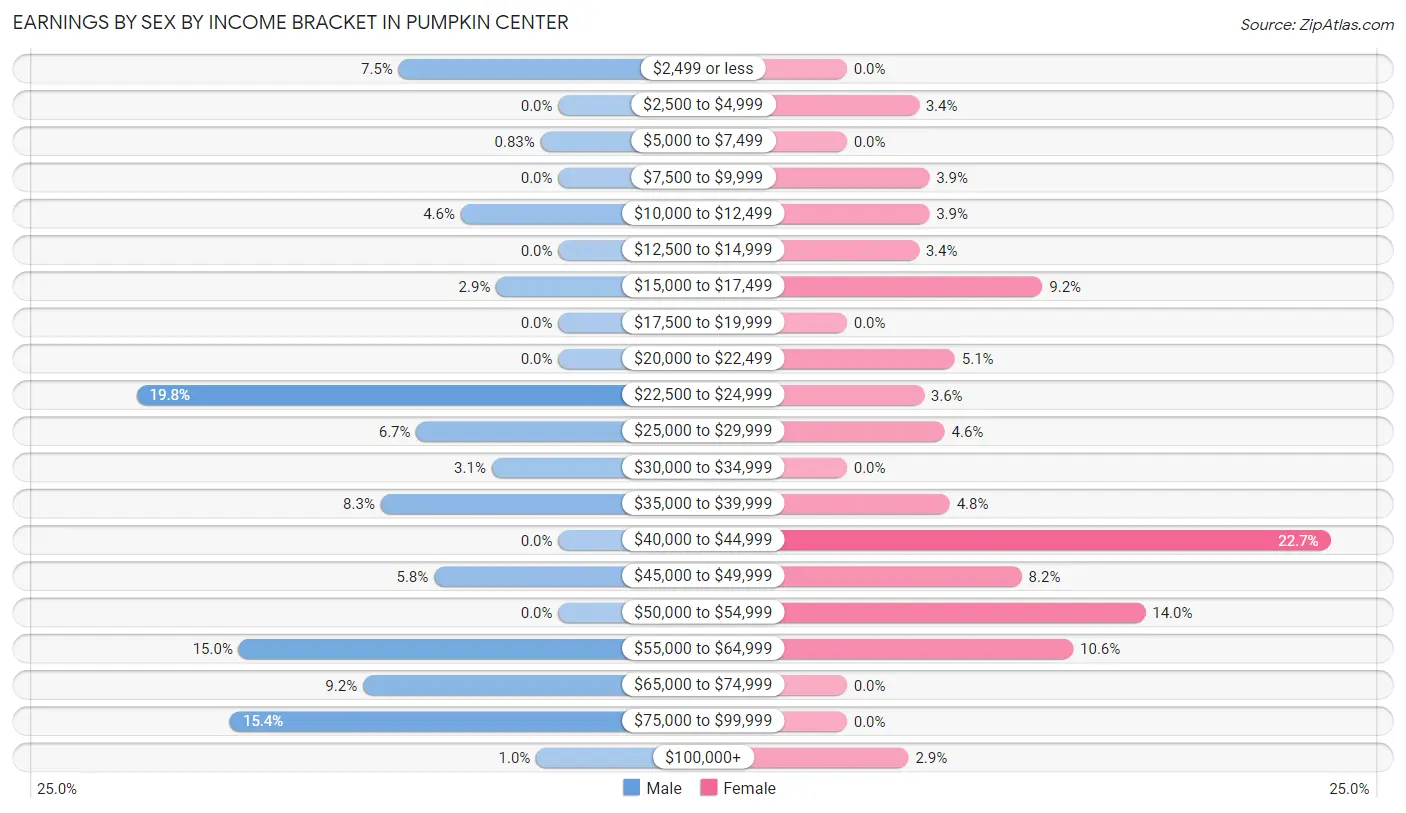
| Income | Male | Female |
| $2,499 or less | 36 (7.5%) | 0 (0.0%) |
| $2,500 to $4,999 | 0 (0.0%) | 14 (3.4%) |
| $5,000 to $7,499 | 4 (0.8%) | 0 (0.0%) |
| $7,500 to $9,999 | 0 (0.0%) | 16 (3.9%) |
| $10,000 to $12,499 | 22 (4.6%) | 16 (3.9%) |
| $12,500 to $14,999 | 0 (0.0%) | 14 (3.4%) |
| $15,000 to $17,499 | 14 (2.9%) | 38 (9.2%) |
| $17,500 to $19,999 | 0 (0.0%) | 0 (0.0%) |
| $20,000 to $22,499 | 0 (0.0%) | 21 (5.1%) |
| $22,500 to $24,999 | 95 (19.8%) | 15 (3.6%) |
| $25,000 to $29,999 | 32 (6.7%) | 19 (4.6%) |
| $30,000 to $34,999 | 15 (3.1%) | 0 (0.0%) |
| $35,000 to $39,999 | 40 (8.3%) | 20 (4.8%) |
| $40,000 to $44,999 | 0 (0.0%) | 94 (22.7%) |
| $45,000 to $49,999 | 28 (5.8%) | 34 (8.2%) |
| $50,000 to $54,999 | 0 (0.0%) | 58 (14.0%) |
| $55,000 to $64,999 | 72 (15.0%) | 44 (10.6%) |
| $65,000 to $74,999 | 44 (9.1%) | 0 (0.0%) |
| $75,000 to $99,999 | 74 (15.4%) | 0 (0.0%) |
| $100,000+ | 5 (1.0%) | 12 (2.9%) |
| Total | 481 (100.0%) | 415 (100.0%) |
Earnings by Sex by Educational Attainment in Pumpkin Center
Average earnings in Pumpkin Center are $49,330 for men and $43,735 for women, a difference of 11.3%. Men with an educational attainment of high school diploma enjoy the highest average annual earnings of $63,750, while those with high school diploma education earn the least with $63,750. Women with an educational attainment of bachelor's degree earn the most with the average annual earnings of $44,327, while those with high school diploma education have the smallest earnings of $28,487.
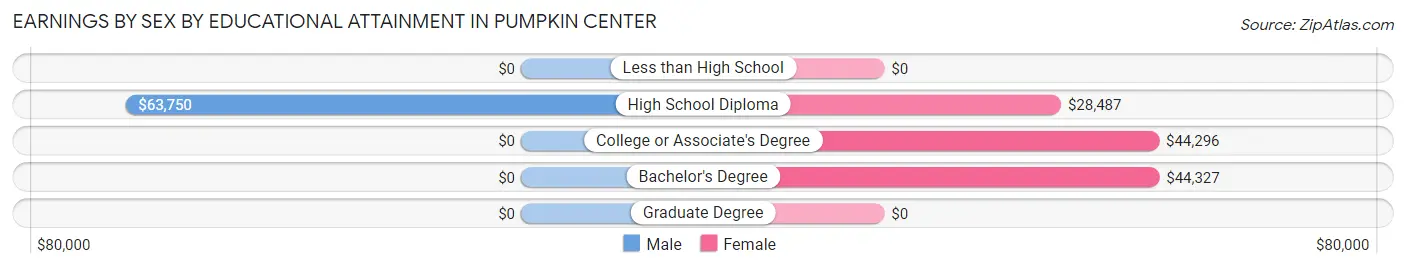
| Educational Attainment | Male Income | Female Income |
| Less than High School | - | - |
| High School Diploma | $63,750 | $28,487 |
| College or Associate's Degree | - | - |
| Bachelor's Degree | - | - |
| Graduate Degree | - | - |
| Total | $49,330 | $43,735 |
Family Income in Pumpkin Center
Family Income Brackets in Pumpkin Center
According to the Pumpkin Center family income data, there are 134 families falling into the $50,000 to $74,999 income range, which is the most common income bracket and makes up 20.8% of all families.
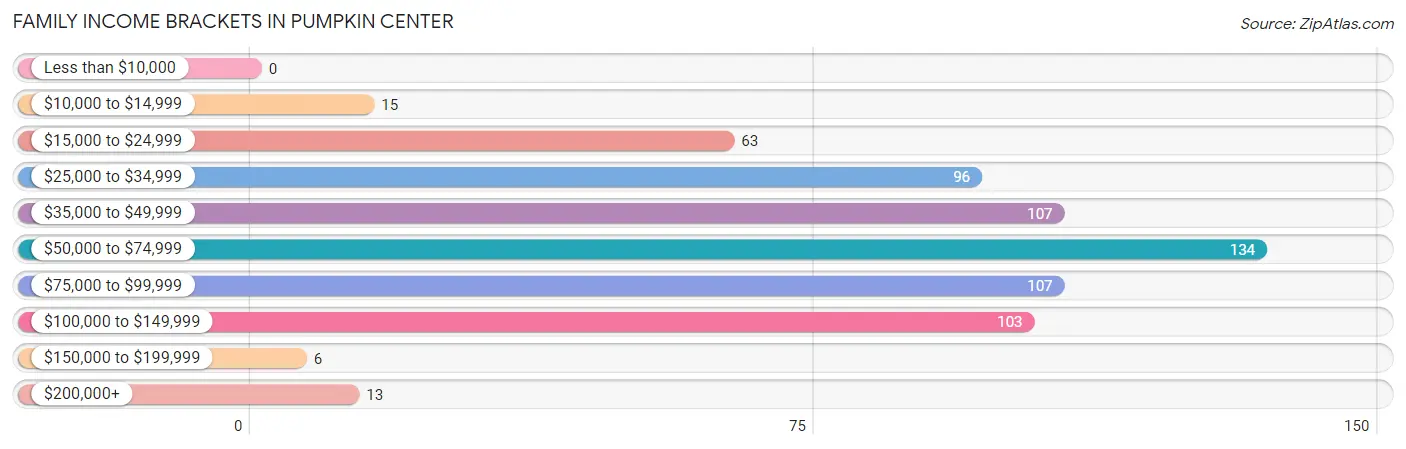
| Income Bracket | # Families | % Families |
| Less than $10,000 | 0 | 0.0% |
| $10,000 to $14,999 | 15 | 2.3% |
| $15,000 to $24,999 | 63 | 9.8% |
| $25,000 to $34,999 | 96 | 14.9% |
| $35,000 to $49,999 | 107 | 16.6% |
| $50,000 to $74,999 | 134 | 20.8% |
| $75,000 to $99,999 | 107 | 16.6% |
| $100,000 to $149,999 | 103 | 16.0% |
| $150,000 to $199,999 | 6 | 0.9% |
| $200,000+ | 13 | 2.0% |
Family Income by Famaliy Size in Pumpkin Center
2-person families (280 | 43.5%) account for the highest median family income in Pumpkin Center with $85,163 per family, while 2-person families (280 | 43.5%) have the highest median income of $42,582 per family member.
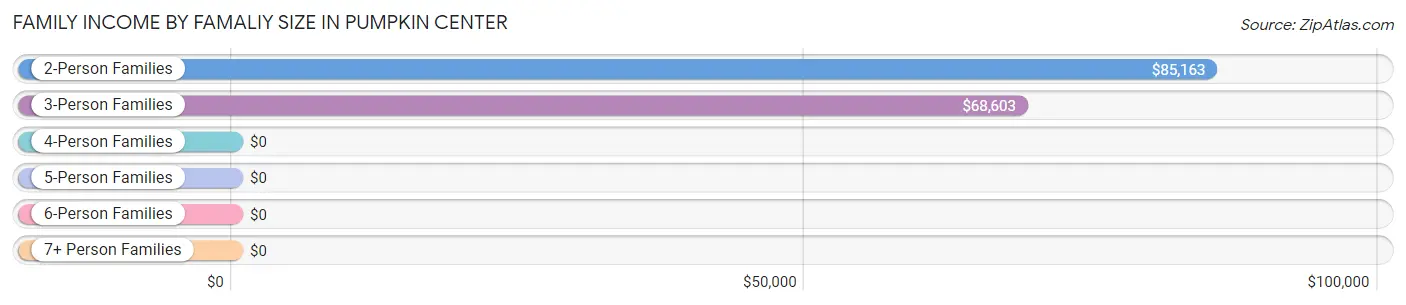
| Income Bracket | # Families | Median Income |
| 2-Person Families | 280 (43.5%) | $85,163 |
| 3-Person Families | 163 (25.3%) | $68,603 |
| 4-Person Families | 201 (31.2%) | $0 |
| 5-Person Families | 0 (0.0%) | $0 |
| 6-Person Families | 0 (0.0%) | $0 |
| 7+ Person Families | 0 (0.0%) | $0 |
| Total | 644 (100.0%) | $61,486 |
Family Income by Number of Earners in Pumpkin Center
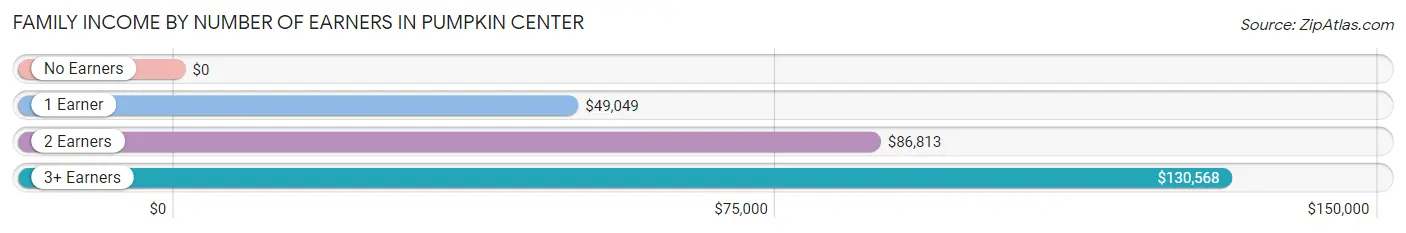
| Number of Earners | # Families | Median Income |
| No Earners | 136 (21.1%) | $0 |
| 1 Earner | 306 (47.5%) | $49,049 |
| 2 Earners | 159 (24.7%) | $86,813 |
| 3+ Earners | 43 (6.7%) | $130,568 |
| Total | 644 (100.0%) | $61,486 |
Household Income in Pumpkin Center
Household Income Brackets in Pumpkin Center
With 192 households falling in the category, the $50,000 to $74,999 income range is the most frequent in Pumpkin Center, accounting for 24.7% of all households.
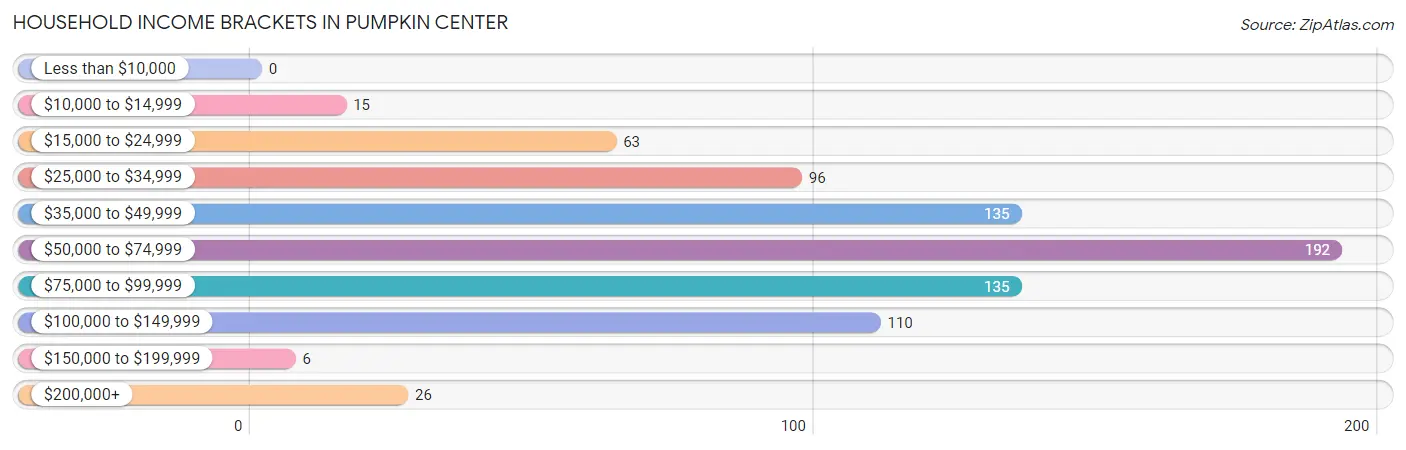
| Income Bracket | # Households | % Households |
| Less than $10,000 | 0 | 0.0% |
| $10,000 to $14,999 | 15 | 1.9% |
| $15,000 to $24,999 | 63 | 8.1% |
| $25,000 to $34,999 | 96 | 12.3% |
| $35,000 to $49,999 | 135 | 17.4% |
| $50,000 to $74,999 | 192 | 24.7% |
| $75,000 to $99,999 | 135 | 17.4% |
| $100,000 to $149,999 | 110 | 14.1% |
| $150,000 to $199,999 | 6 | 0.8% |
| $200,000+ | 26 | 3.3% |
Household Income by Householder Age in Pumpkin Center
The median household income in Pumpkin Center is $60,797, with the highest median household income of $89,116 found in the 65+ years age bracket for the primary householder. A total of 145 households (18.6%) fall into this category. Meanwhile, the 15 to 24 years age bracket for the primary householder has the lowest median household income of $0, with 20 households (2.6%) in this group.
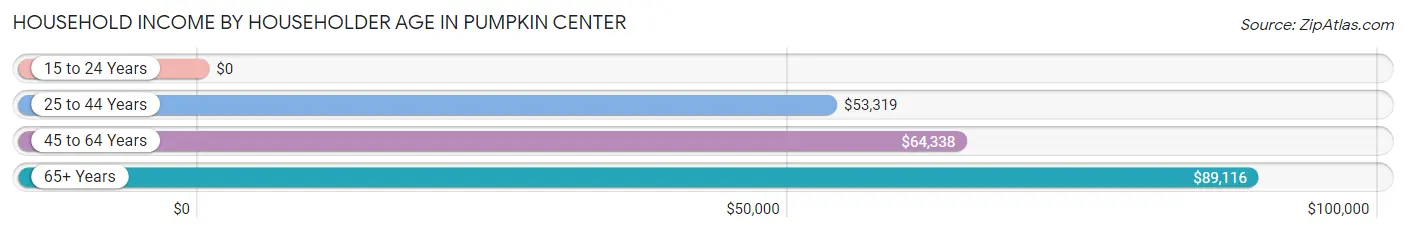
| Income Bracket | # Households | Median Income |
| 15 to 24 Years | 20 (2.6%) | $0 |
| 25 to 44 Years | 250 (32.1%) | $53,319 |
| 45 to 64 Years | 363 (46.7%) | $64,338 |
| 65+ Years | 145 (18.6%) | $89,116 |
| Total | 778 (100.0%) | $60,797 |
Poverty in Pumpkin Center
Income Below Poverty by Sex and Age in Pumpkin Center
With 10.1% poverty level for males and 18.1% for females among the residents of Pumpkin Center, 45 to 54 year old males and 16 and 17 year old females are the most vulnerable to poverty, with 90 males (43.7%) and 73 females (58.4%) in their respective age groups living below the poverty level.
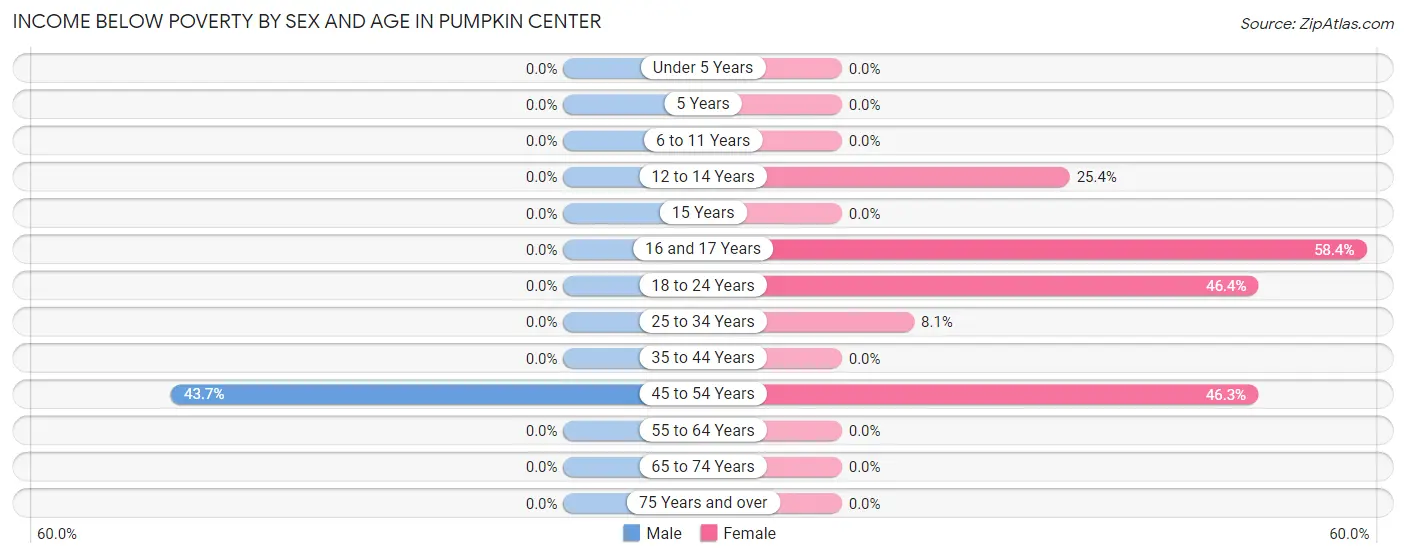
| Age Bracket | Male | Female |
| Under 5 Years | 0 (0.0%) | 0 (0.0%) |
| 5 Years | 0 (0.0%) | 0 (0.0%) |
| 6 to 11 Years | 0 (0.0%) | 0 (0.0%) |
| 12 to 14 Years | 0 (0.0%) | 33 (25.4%) |
| 15 Years | 0 (0.0%) | 0 (0.0%) |
| 16 and 17 Years | 0 (0.0%) | 73 (58.4%) |
| 18 to 24 Years | 0 (0.0%) | 32 (46.4%) |
| 25 to 34 Years | 0 (0.0%) | 14 (8.1%) |
| 35 to 44 Years | 0 (0.0%) | 0 (0.0%) |
| 45 to 54 Years | 90 (43.7%) | 76 (46.3%) |
| 55 to 64 Years | 0 (0.0%) | 0 (0.0%) |
| 65 to 74 Years | 0 (0.0%) | 0 (0.0%) |
| 75 Years and over | 0 (0.0%) | 0 (0.0%) |
| Total | 90 (10.1%) | 228 (18.1%) |
Income Above Poverty by Sex and Age in Pumpkin Center
According to the poverty statistics in Pumpkin Center, males aged under 5 years and females aged 5 years are the age groups that are most secure financially, with 100.0% of males and 100.0% of females in these age groups living above the poverty line.
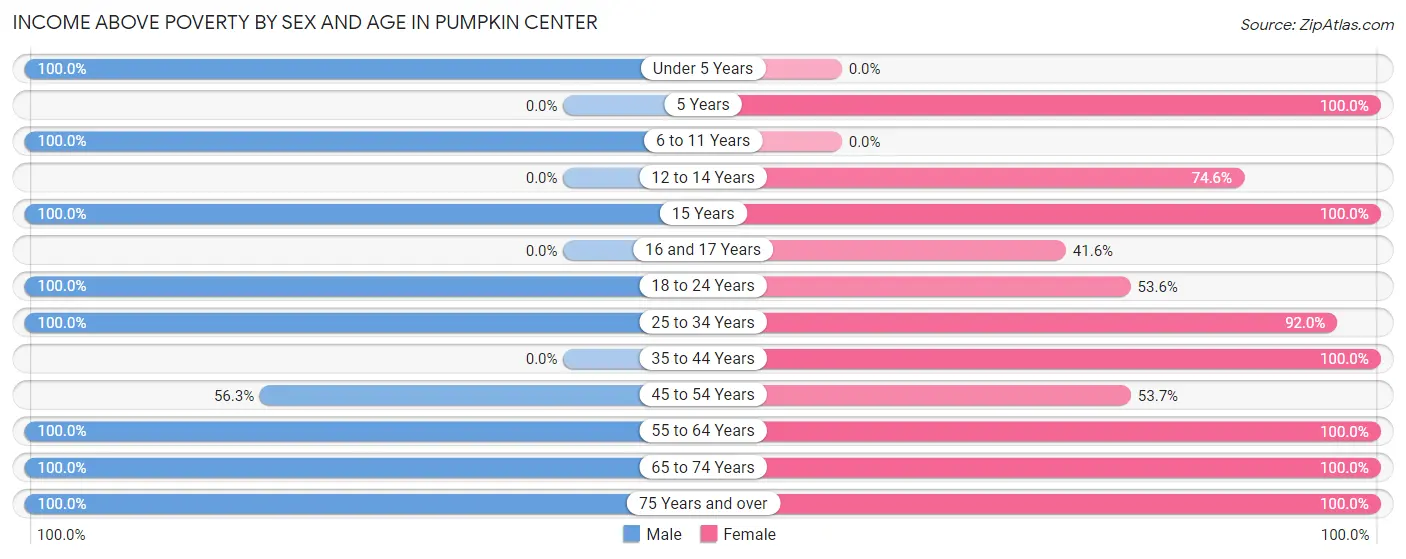
| Age Bracket | Male | Female |
| Under 5 Years | 18 (100.0%) | 0 (0.0%) |
| 5 Years | 0 (0.0%) | 144 (100.0%) |
| 6 to 11 Years | 97 (100.0%) | 0 (0.0%) |
| 12 to 14 Years | 0 (0.0%) | 97 (74.6%) |
| 15 Years | 61 (100.0%) | 32 (100.0%) |
| 16 and 17 Years | 0 (0.0%) | 52 (41.6%) |
| 18 to 24 Years | 76 (100.0%) | 37 (53.6%) |
| 25 to 34 Years | 190 (100.0%) | 160 (91.9%) |
| 35 to 44 Years | 0 (0.0%) | 102 (100.0%) |
| 45 to 54 Years | 116 (56.3%) | 88 (53.7%) |
| 55 to 64 Years | 120 (100.0%) | 141 (100.0%) |
| 65 to 74 Years | 77 (100.0%) | 136 (100.0%) |
| 75 Years and over | 45 (100.0%) | 40 (100.0%) |
| Total | 800 (89.9%) | 1,029 (81.9%) |
Income Below Poverty Among Married-Couple Families in Pumpkin Center
The poverty statistics for married-couple families in Pumpkin Center show that 16.4% or 78 of the total 475 families live below the poverty line. Families with 1 or 2 children have the highest poverty rate of 31.3%, comprising of 63 families. On the other hand, families with no children have the lowest poverty rate of 5.5%, which includes 15 families.
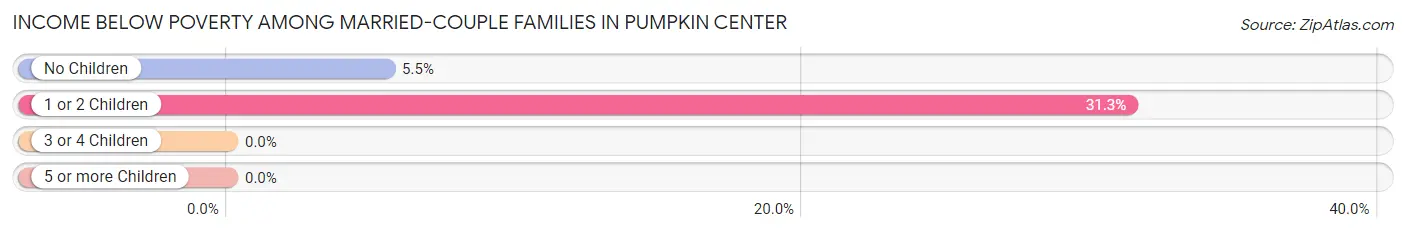
| Children | Above Poverty | Below Poverty |
| No Children | 259 (94.5%) | 15 (5.5%) |
| 1 or 2 Children | 138 (68.7%) | 63 (31.3%) |
| 3 or 4 Children | 0 (0.0%) | 0 (0.0%) |
| 5 or more Children | 0 (0.0%) | 0 (0.0%) |
| Total | 397 (83.6%) | 78 (16.4%) |
Income Below Poverty Among Single-Parent Households in Pumpkin Center
| Children | Single Father | Single Mother |
| No Children | 0 (0.0%) | 0 (0.0%) |
| 1 or 2 Children | 0 (0.0%) | 0 (0.0%) |
| 3 or 4 Children | 0 (0.0%) | 0 (0.0%) |
| 5 or more Children | 0 (0.0%) | 0 (0.0%) |
| Total | 0 (0.0%) | 0 (0.0%) |
Income Below Poverty Among Married-Couple vs Single-Parent Households in Pumpkin Center
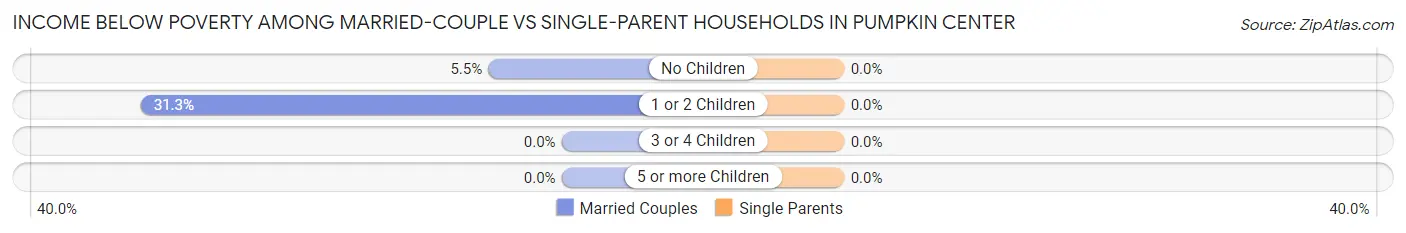
| Children | Married-Couple Families | Single-Parent Households |
| No Children | 15 (5.5%) | 0 (0.0%) |
| 1 or 2 Children | 63 (31.3%) | 0 (0.0%) |
| 3 or 4 Children | 0 (0.0%) | 0 (0.0%) |
| 5 or more Children | 0 (0.0%) | 0 (0.0%) |
| Total | 78 (16.4%) | 0 (0.0%) |
Race in Pumpkin Center
The most populous races in Pumpkin Center are White / Caucasian (1,689 | 78.5%), Black / African American (391 | 18.2%), and Hispanic or Latino (277 | 12.9%).
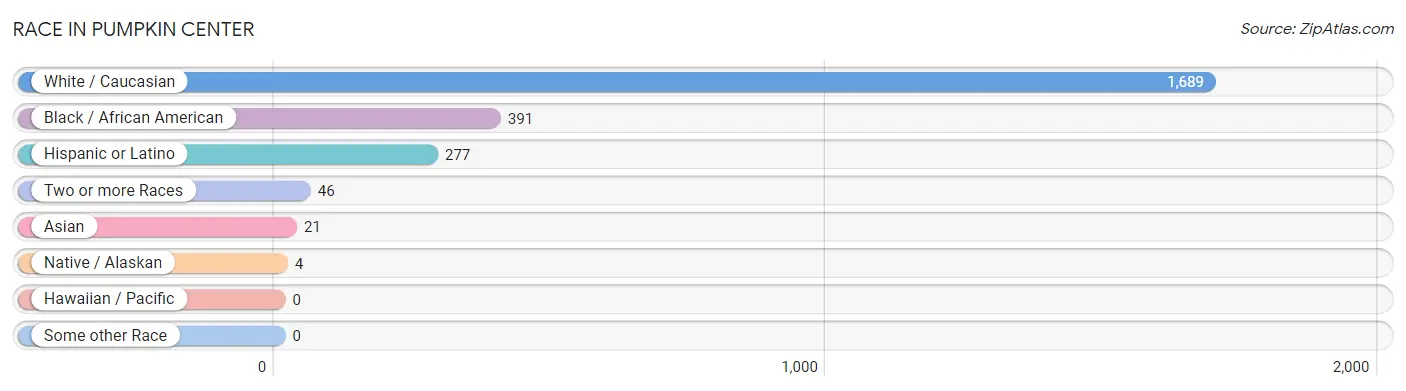
| Race | # Population | % Population |
| Asian | 21 | 1.0% |
| Black / African American | 391 | 18.2% |
| Hawaiian / Pacific | 0 | 0.0% |
| Hispanic or Latino | 277 | 12.9% |
| Native / Alaskan | 4 | 0.2% |
| White / Caucasian | 1,689 | 78.5% |
| Two or more Races | 46 | 2.1% |
| Some other Race | 0 | 0.0% |
| Total | 2,151 | 100.0% |
Ancestry in Pumpkin Center
The most populous ancestries reported in Pumpkin Center are German (390 | 18.1%), Irish (240 | 11.2%), English (188 | 8.7%), Mexican (136 | 6.3%), and Swedish (123 | 5.7%), together accounting for 50.1% of all Pumpkin Center residents.
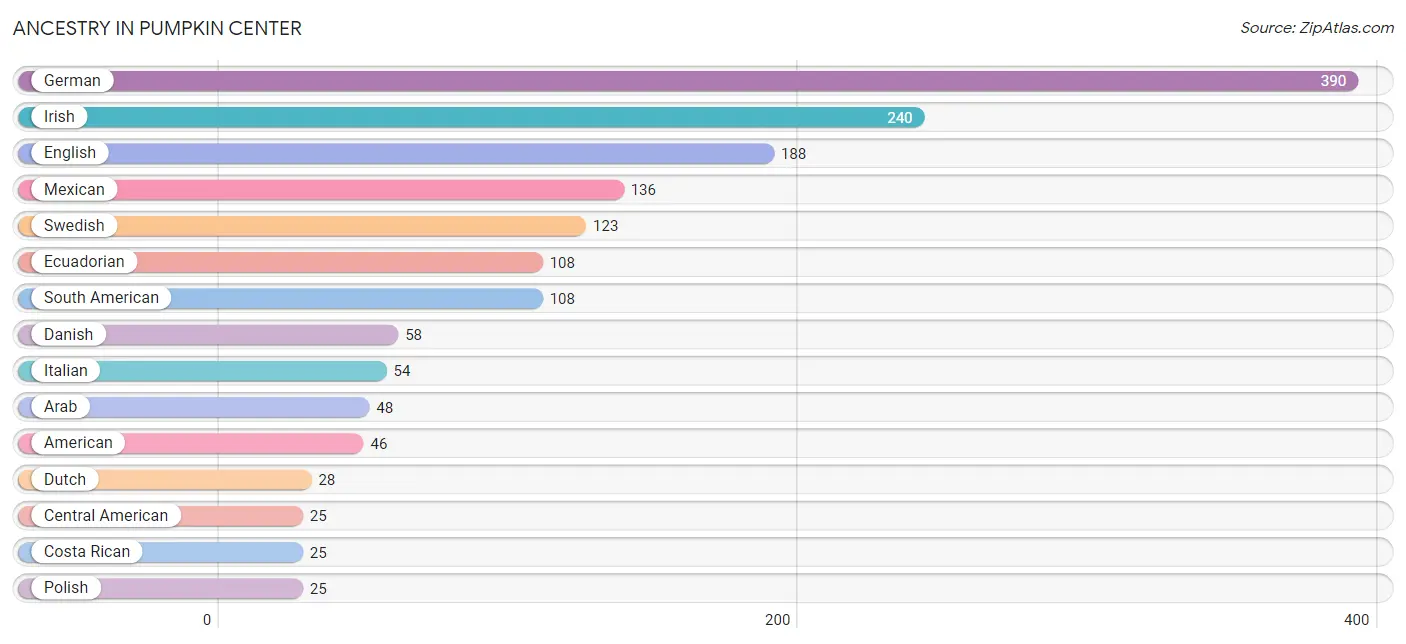
| Ancestry | # Population | % Population |
| American | 46 | 2.1% |
| Arab | 48 | 2.2% |
| Bhutanese | 12 | 0.6% |
| Bulgarian | 19 | 0.9% |
| Burmese | 20 | 0.9% |
| Central American | 25 | 1.2% |
| Cherokee | 4 | 0.2% |
| Costa Rican | 25 | 1.2% |
| Cuban | 8 | 0.4% |
| Danish | 58 | 2.7% |
| Dutch | 28 | 1.3% |
| Eastern European | 6 | 0.3% |
| Ecuadorian | 108 | 5.0% |
| English | 188 | 8.7% |
| German | 390 | 18.1% |
| Irish | 240 | 11.2% |
| Italian | 54 | 2.5% |
| Korean | 13 | 0.6% |
| Mexican | 136 | 6.3% |
| Native Hawaiian | 12 | 0.6% |
| Norwegian | 14 | 0.6% |
| Polish | 25 | 1.2% |
| Scottish | 5 | 0.2% |
| Slovene | 11 | 0.5% |
| South American | 108 | 5.0% |
| Swedish | 123 | 5.7% | View All 26 Rows |
Immigrants in Pumpkin Center
The most numerous immigrant groups reported in Pumpkin Center came from Ecuador (75 | 3.5%), Latin America (75 | 3.5%), South America (75 | 3.5%), Africa (29 | 1.3%), and Egypt (29 | 1.3%), together accounting for 13.2% of all Pumpkin Center residents.
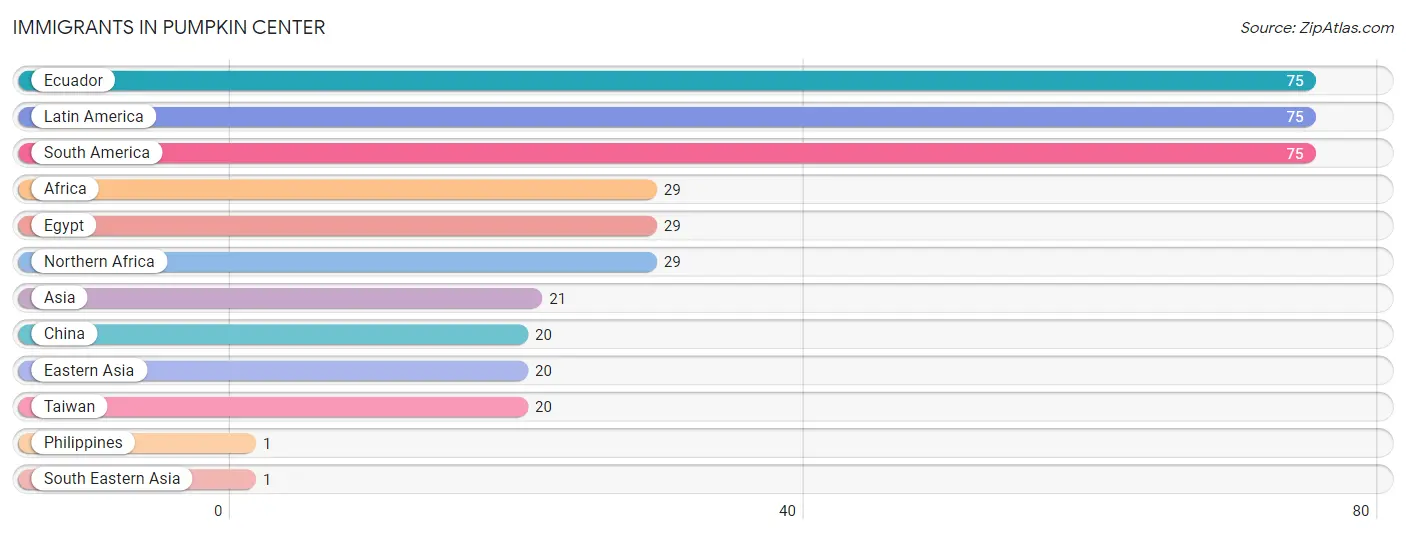
| Immigration Origin | # Population | % Population |
| Africa | 29 | 1.3% |
| Asia | 21 | 1.0% |
| China | 20 | 0.9% |
| Eastern Asia | 20 | 0.9% |
| Ecuador | 75 | 3.5% |
| Egypt | 29 | 1.3% |
| Latin America | 75 | 3.5% |
| Northern Africa | 29 | 1.3% |
| Philippines | 1 | 0.1% |
| South America | 75 | 3.5% |
| South Eastern Asia | 1 | 0.1% |
| Taiwan | 20 | 0.9% | View All 12 Rows |
Sex and Age in Pumpkin Center
Sex and Age in Pumpkin Center
The most populous age groups in Pumpkin Center are 50 to 54 Years (151 | 16.9%) for men and 15 to 19 Years (157 | 12.5%) for women.
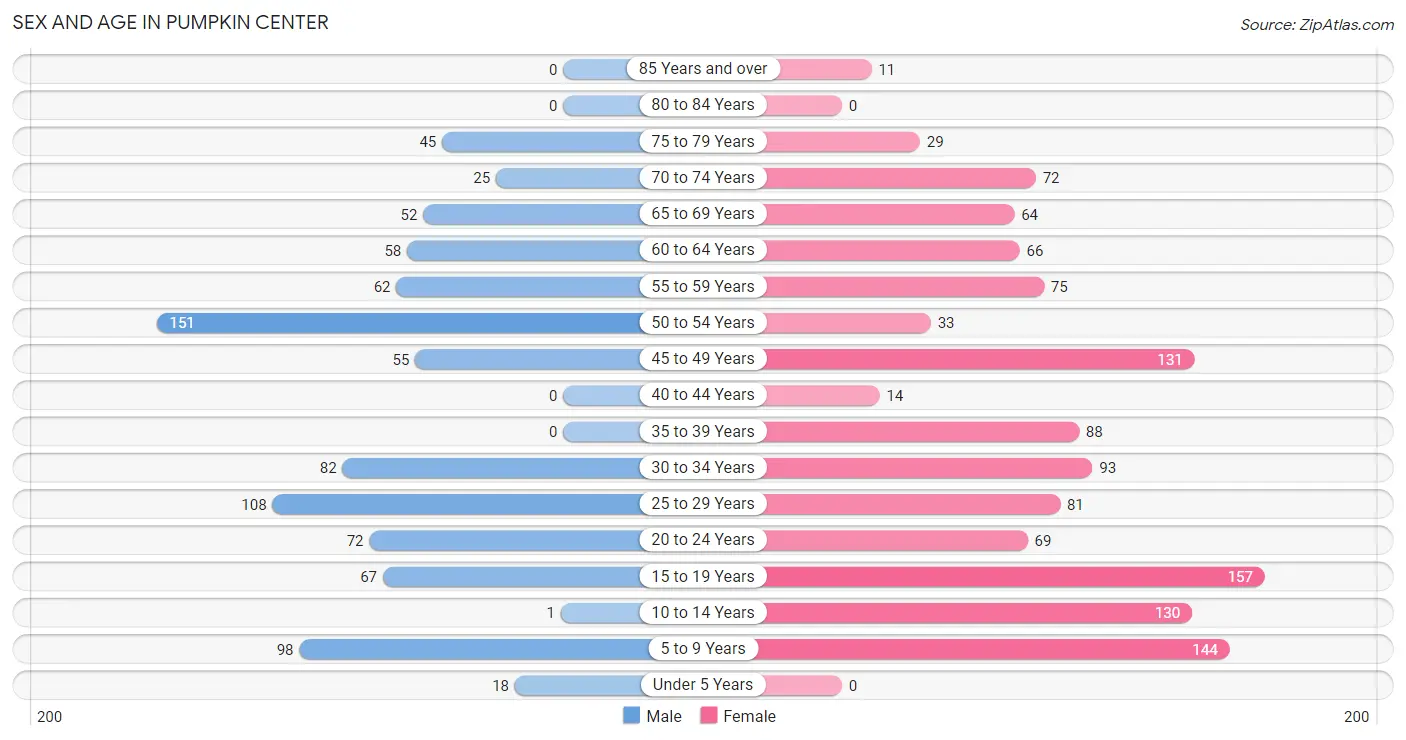
| Age Bracket | Male | Female |
| Under 5 Years | 18 (2.0%) | 0 (0.0%) |
| 5 to 9 Years | 98 (11.0%) | 144 (11.5%) |
| 10 to 14 Years | 1 (0.1%) | 130 (10.3%) |
| 15 to 19 Years | 67 (7.5%) | 157 (12.5%) |
| 20 to 24 Years | 72 (8.1%) | 69 (5.5%) |
| 25 to 29 Years | 108 (12.1%) | 81 (6.4%) |
| 30 to 34 Years | 82 (9.2%) | 93 (7.4%) |
| 35 to 39 Years | 0 (0.0%) | 88 (7.0%) |
| 40 to 44 Years | 0 (0.0%) | 14 (1.1%) |
| 45 to 49 Years | 55 (6.1%) | 131 (10.4%) |
| 50 to 54 Years | 151 (16.9%) | 33 (2.6%) |
| 55 to 59 Years | 62 (6.9%) | 75 (6.0%) |
| 60 to 64 Years | 58 (6.5%) | 66 (5.2%) |
| 65 to 69 Years | 52 (5.8%) | 64 (5.1%) |
| 70 to 74 Years | 25 (2.8%) | 72 (5.7%) |
| 75 to 79 Years | 45 (5.0%) | 29 (2.3%) |
| 80 to 84 Years | 0 (0.0%) | 0 (0.0%) |
| 85 Years and over | 0 (0.0%) | 11 (0.9%) |
| Total | 894 (100.0%) | 1,257 (100.0%) |
Families and Households in Pumpkin Center
Median Family Size in Pumpkin Center
The median family size in Pumpkin Center is 3.02 persons per family, with married-couple families (475 | 73.8%) accounting for the largest median family size of 3.23 persons per family. On the other hand, single female/mother families (152 | 23.6%) represent the smallest median family size with 2.38 persons per family.
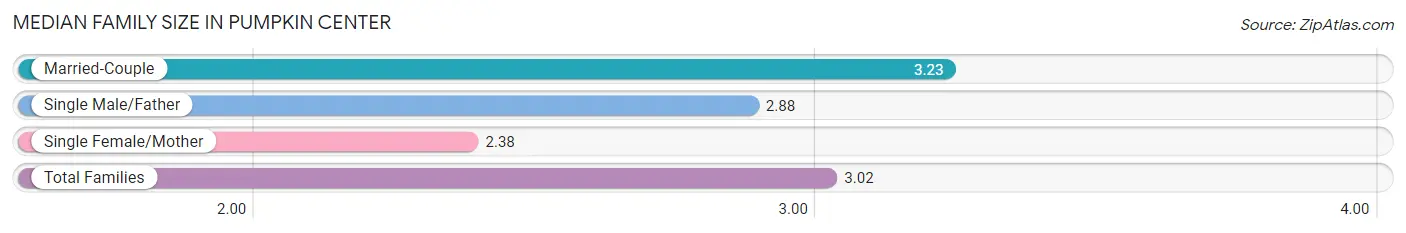
| Family Type | # Families | Family Size |
| Married-Couple | 475 (73.8%) | 3.23 |
| Single Male/Father | 17 (2.6%) | 2.88 |
| Single Female/Mother | 152 (23.6%) | 2.38 |
| Total Families | 644 (100.0%) | 3.02 |
Median Household Size in Pumpkin Center
The median household size in Pumpkin Center is 2.76 persons per household, with married-couple households (475 | 61.1%) accounting for the largest median household size of 3.29 persons per household. non-family households (134 | 17.2%) represent the smallest median household size with 1.28 persons per household.
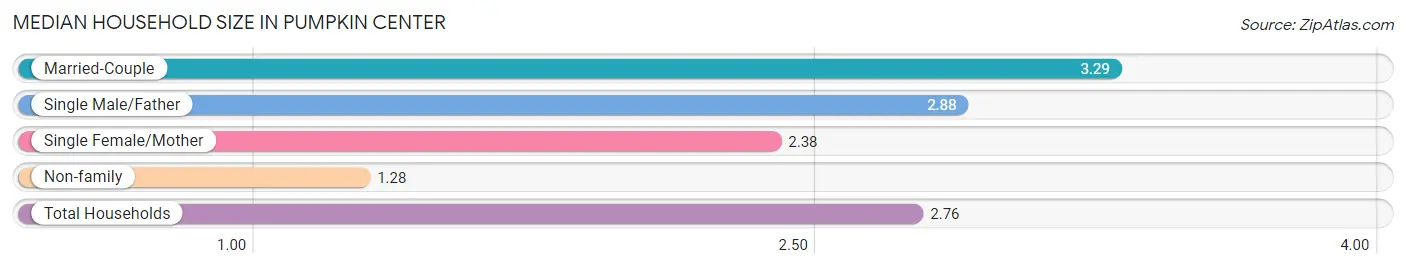
| Household Type | # Households | Household Size |
| Married-Couple | 475 (61.1%) | 3.29 |
| Single Male/Father | 17 (2.2%) | 2.88 |
| Single Female/Mother | 152 (19.5%) | 2.38 |
| Non-family | 134 (17.2%) | 1.28 |
| Total Households | 778 (100.0%) | 2.76 |
Household Size by Marriage Status in Pumpkin Center
Out of a total of 778 households in Pumpkin Center, 644 (82.8%) are family households, while 134 (17.2%) are nonfamily households. The most numerous type of family households are 2-person households, comprising 280, and the most common type of nonfamily households are 1-person households, comprising 92.
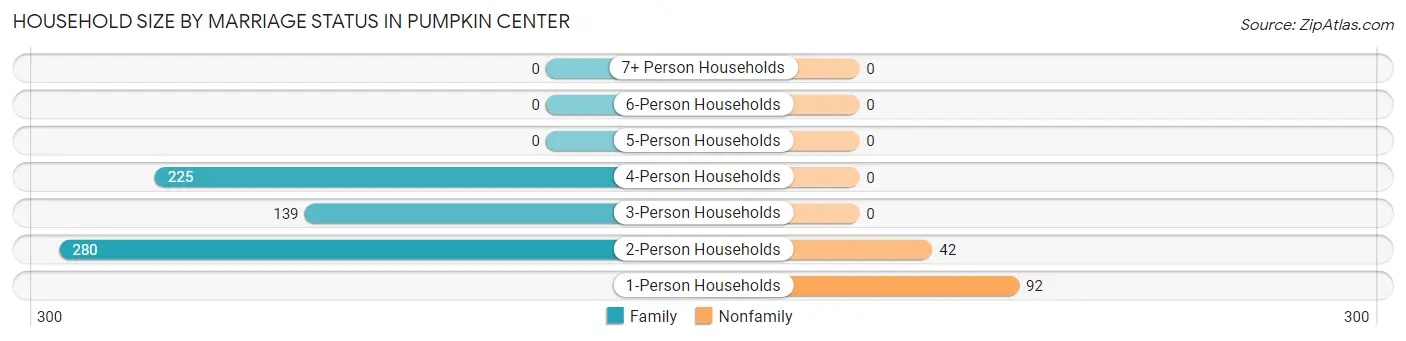
| Household Size | Family Households | Nonfamily Households |
| 1-Person Households | - | 92 (11.8%) |
| 2-Person Households | 280 (36.0%) | 42 (5.4%) |
| 3-Person Households | 139 (17.9%) | 0 (0.0%) |
| 4-Person Households | 225 (28.9%) | 0 (0.0%) |
| 5-Person Households | 0 (0.0%) | 0 (0.0%) |
| 6-Person Households | 0 (0.0%) | 0 (0.0%) |
| 7+ Person Households | 0 (0.0%) | 0 (0.0%) |
| Total | 644 (82.8%) | 134 (17.2%) |
Female Fertility in Pumpkin Center
Fertility by Age in Pumpkin Center
| Age Bracket | Women with Births | Births / 1,000 Women |
| 15 to 19 years | 0 (0.0%) | 0.0 |
| 20 to 34 years | 0 (0.0%) | 0.0 |
| 35 to 50 years | 0 (0.0%) | 0.0 |
| Total | 0 (0.0%) | 0.0 |
Fertility by Age by Marriage Status in Pumpkin Center
| Age Bracket | Married | Unmarried |
| 15 to 19 years | 0 (0.0%) | 0 (0.0%) |
| 20 to 34 years | 0 (0.0%) | 0 (0.0%) |
| 35 to 50 years | 0 (0.0%) | 0 (0.0%) |
| Total | 0 (0.0%) | 0 (0.0%) |
Fertility by Education in Pumpkin Center
| Educational Attainment | Women with Births | Births / 1,000 Women |
| Less than High School | 0 (0.0%) | 0.0 |
| High School Diploma | 0 (0.0%) | 0.0 |
| College or Associate's Degree | 0 (0.0%) | 0.0 |
| Bachelor's Degree | 0 (0.0%) | 0.0 |
| Graduate Degree | 0 (0.0%) | 0.0 |
| Total | 0 (0.0%) | 0.0 |
Fertility by Education by Marriage Status in Pumpkin Center
| Educational Attainment | Married | Unmarried |
| Less than High School | 0 (0.0%) | 0 (0.0%) |
| High School Diploma | 0 (0.0%) | 0 (0.0%) |
| College or Associate's Degree | 0 (0.0%) | 0 (0.0%) |
| Bachelor's Degree | 0 (0.0%) | 0 (0.0%) |
| Graduate Degree | 0 (0.0%) | 0 (0.0%) |
| Total | 0 (0.0%) | 0 (0.0%) |
Employment Characteristics in Pumpkin Center
Employment by Class of Employer in Pumpkin Center
Among the 794 employed individuals in Pumpkin Center, private company employees (396 | 49.9%), state government employees (102 | 12.9%), and not-for-profit organizations (92 | 11.6%) make up the most common classes of employment.
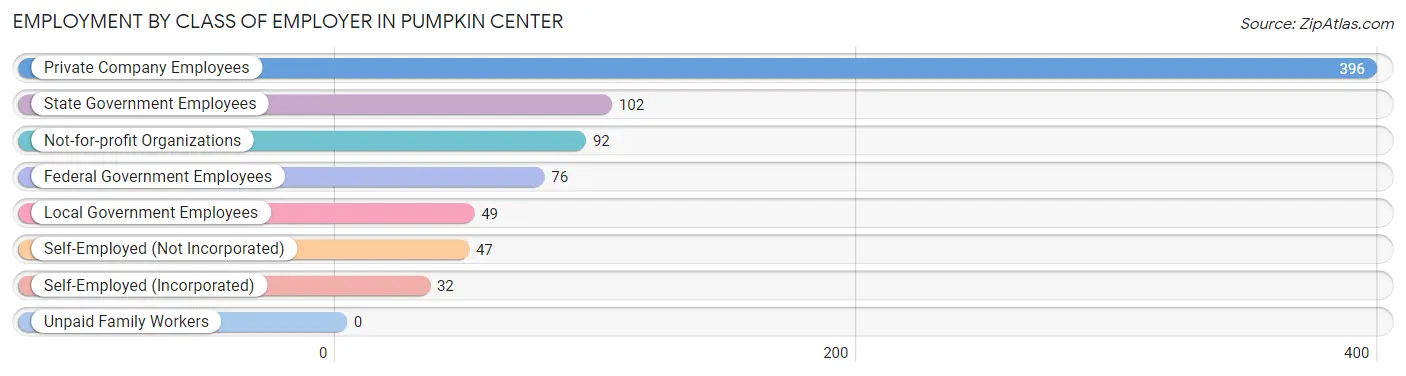
| Employer Class | # Employees | % Employees |
| Private Company Employees | 396 | 49.9% |
| Self-Employed (Incorporated) | 32 | 4.0% |
| Self-Employed (Not Incorporated) | 47 | 5.9% |
| Not-for-profit Organizations | 92 | 11.6% |
| Local Government Employees | 49 | 6.2% |
| State Government Employees | 102 | 12.9% |
| Federal Government Employees | 76 | 9.6% |
| Unpaid Family Workers | 0 | 0.0% |
| Total | 794 | 100.0% |
Employment Status by Age in Pumpkin Center
According to the labor force statistics for Pumpkin Center, out of the total population over 16 years of age (1,666), 50.8% or 846 individuals are in the labor force, with 6.4% or 54 of them unemployed. The age group with the highest labor force participation rate is 35 to 44 years, with 100.0% or 102 individuals in the labor force. Within the labor force, the 20 to 24 years age range has the highest percentage of unemployed individuals, with 21.4% or 18 of them being unemployed.
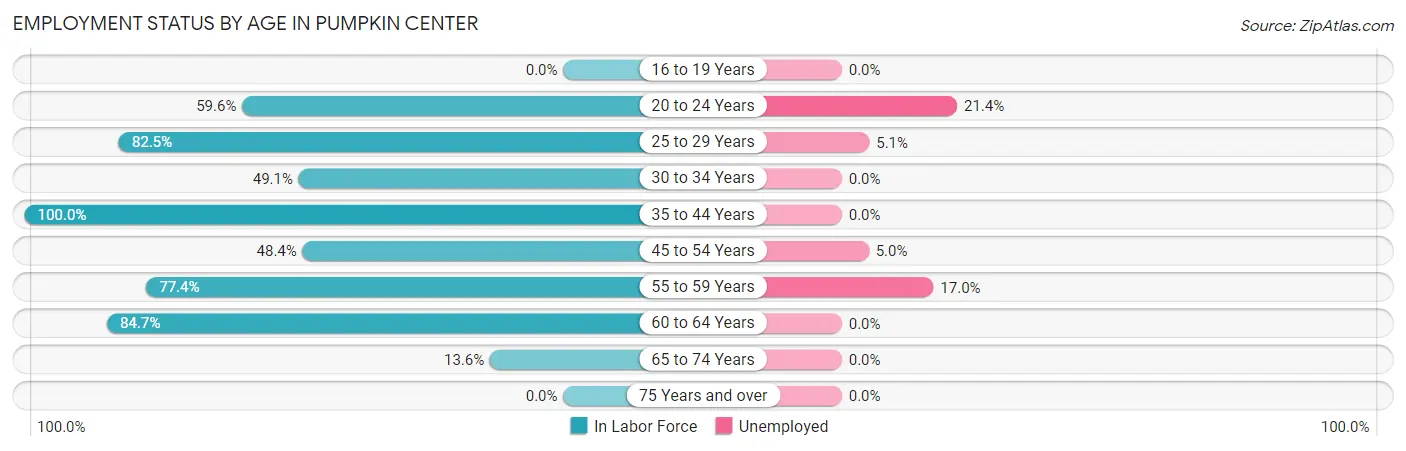
| Age Bracket | In Labor Force | Unemployed |
| 16 to 19 Years | 0 (0.0%) | 0 (0.0%) |
| 20 to 24 Years | 84 (59.6%) | 18 (21.4%) |
| 25 to 29 Years | 156 (82.5%) | 8 (5.1%) |
| 30 to 34 Years | 86 (49.1%) | 0 (0.0%) |
| 35 to 44 Years | 102 (100.0%) | 0 (0.0%) |
| 45 to 54 Years | 179 (48.4%) | 9 (5.0%) |
| 55 to 59 Years | 106 (77.4%) | 18 (17.0%) |
| 60 to 64 Years | 105 (84.7%) | 0 (0.0%) |
| 65 to 74 Years | 29 (13.6%) | 0 (0.0%) |
| 75 Years and over | 0 (0.0%) | 0 (0.0%) |
| Total | 846 (50.8%) | 54 (6.4%) |
Employment Status by Educational Attainment in Pumpkin Center
According to labor force statistics for Pumpkin Center, 66.9% of individuals (734) out of the total population between 25 and 64 years of age (1,097) are in the labor force, with 4.9% or 36 of them being unemployed. The group with the highest labor force participation rate are those with the educational attainment of college / associate degree, with 76.0% or 419 individuals in the labor force. Within the labor force, individuals with bachelor's degree or higher education have the highest percentage of unemployment, with 14.4% or 18 of them being unemployed.
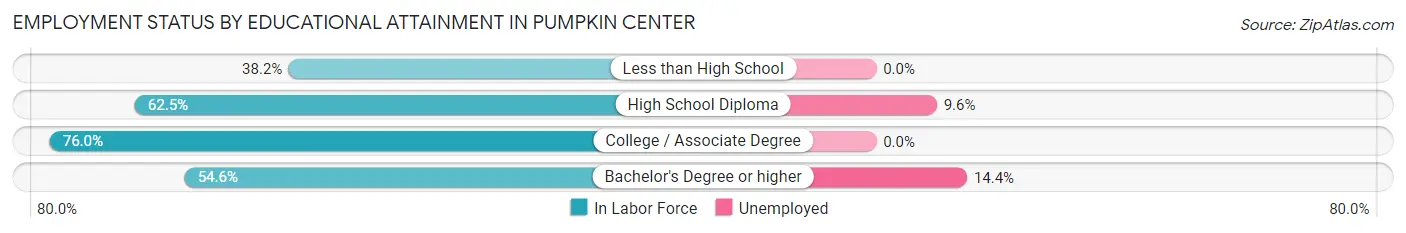
| Educational Attainment | In Labor Force | Unemployed |
| Less than High School | 13 (38.2%) | 0 (0.0%) |
| High School Diploma | 177 (62.5%) | 27 (9.6%) |
| College / Associate Degree | 419 (76.0%) | 0 (0.0%) |
| Bachelor's Degree or higher | 125 (54.6%) | 33 (14.4%) |
| Total | 734 (66.9%) | 54 (4.9%) |
Employment Occupations by Sex in Pumpkin Center
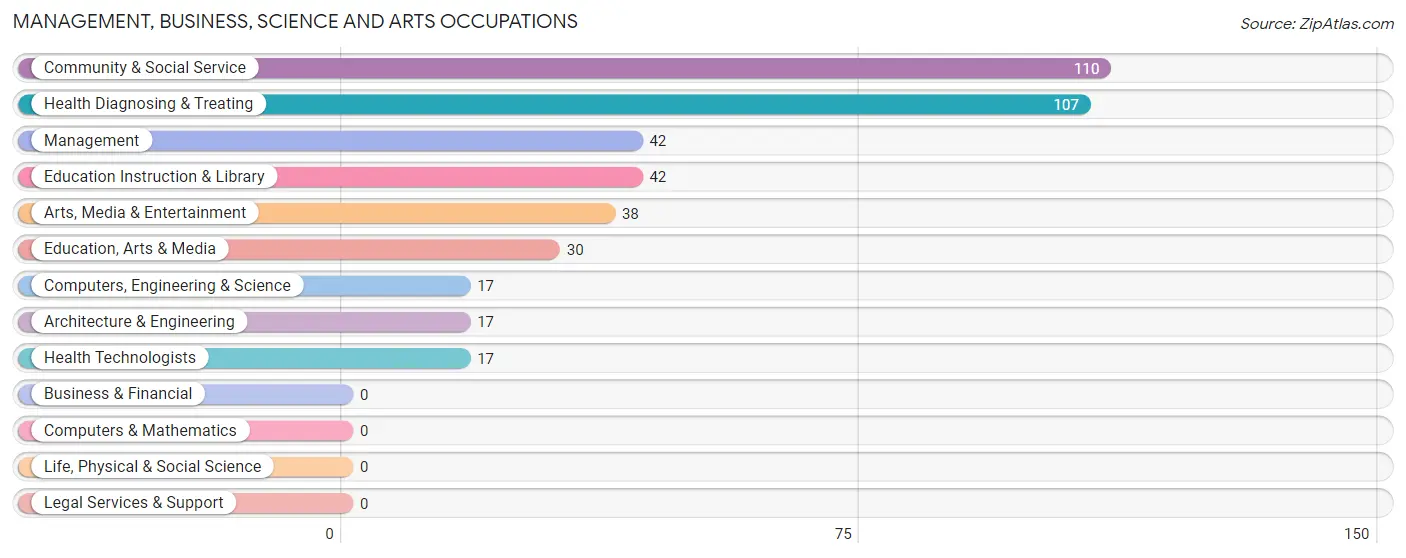
Management, Business, Science and Arts Occupations
The most common Management, Business, Science and Arts occupations in Pumpkin Center are Community & Social Service (110 | 14.1%), Health Diagnosing & Treating (107 | 13.7%), Management (42 | 5.4%), Education Instruction & Library (42 | 5.4%), and Arts, Media & Entertainment (38 | 4.9%).
Management, Business, Science and Arts Occupations by Sex
Within the Management, Business, Science and Arts occupations in Pumpkin Center, the most male-oriented occupations are Computers, Engineering & Science (100.0%), Architecture & Engineering (100.0%), and Education, Arts & Media (100.0%), while the most female-oriented occupations are Education Instruction & Library (100.0%), Management (59.5%), and Health Diagnosing & Treating (57.9%).
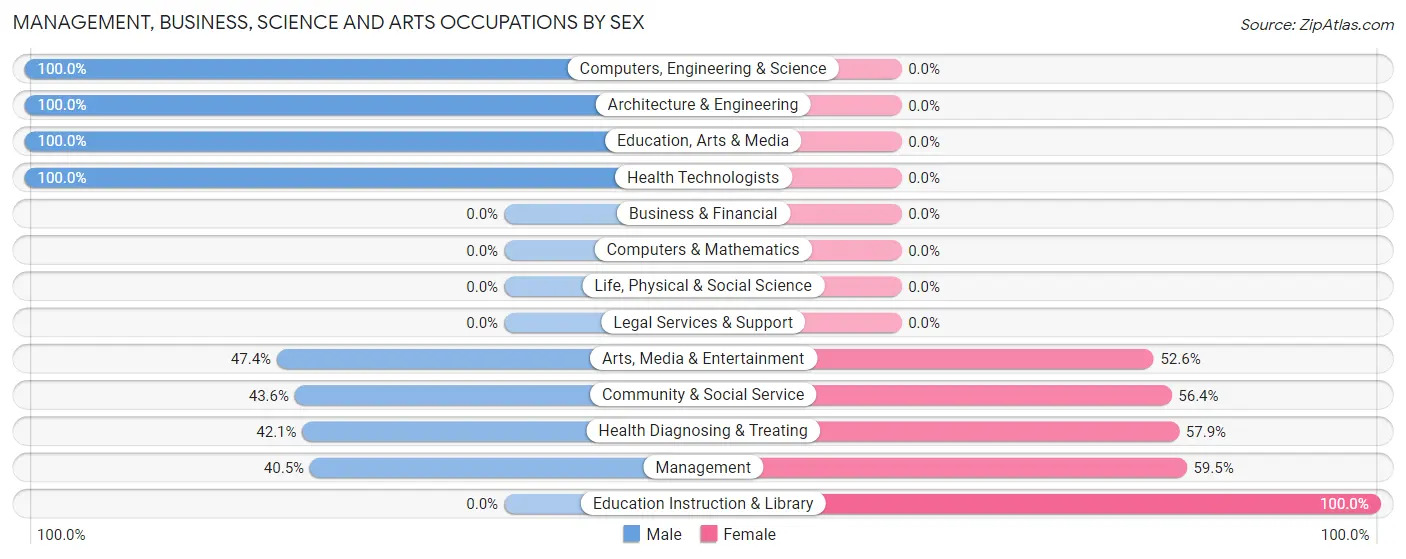
| Occupation | Male | Female |
| Management | 17 (40.5%) | 25 (59.5%) |
| Business & Financial | 0 (0.0%) | 0 (0.0%) |
| Computers, Engineering & Science | 17 (100.0%) | 0 (0.0%) |
| Computers & Mathematics | 0 (0.0%) | 0 (0.0%) |
| Architecture & Engineering | 17 (100.0%) | 0 (0.0%) |
| Life, Physical & Social Science | 0 (0.0%) | 0 (0.0%) |
| Community & Social Service | 48 (43.6%) | 62 (56.4%) |
| Education, Arts & Media | 30 (100.0%) | 0 (0.0%) |
| Legal Services & Support | 0 (0.0%) | 0 (0.0%) |
| Education Instruction & Library | 0 (0.0%) | 42 (100.0%) |
| Arts, Media & Entertainment | 18 (47.4%) | 20 (52.6%) |
| Health Diagnosing & Treating | 45 (42.1%) | 62 (57.9%) |
| Health Technologists | 17 (100.0%) | 0 (0.0%) |
| Total (Category) | 127 (46.0%) | 149 (54.0%) |
| Total (Overall) | 400 (51.3%) | 379 (48.6%) |
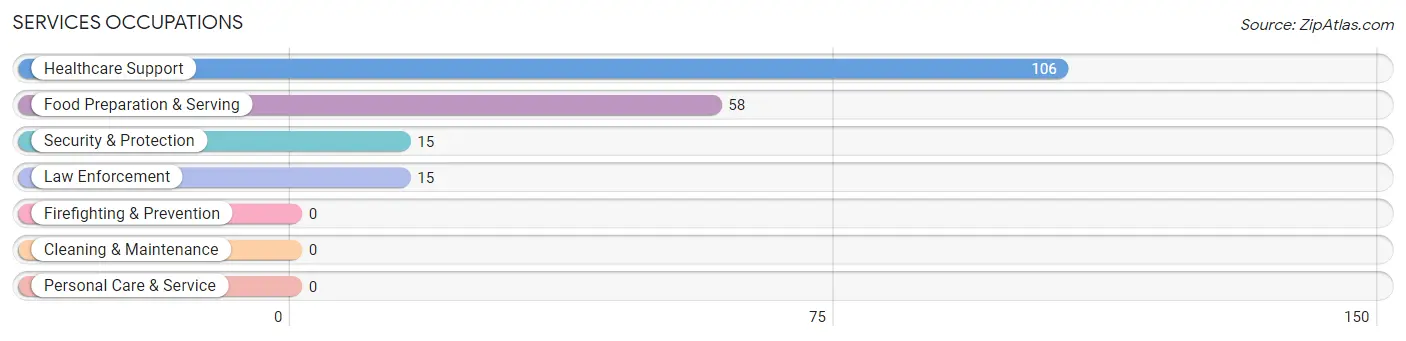
Services Occupations
The most common Services occupations in Pumpkin Center are Healthcare Support (106 | 13.6%), Food Preparation & Serving (58 | 7.4%), Security & Protection (15 | 1.9%), and Law Enforcement (15 | 1.9%).
Services Occupations by Sex
Within the Services occupations in Pumpkin Center, the most male-oriented occupations are Security & Protection (100.0%), Law Enforcement (100.0%), and Food Preparation & Serving (34.5%), while the most female-oriented occupations are Healthcare Support (100.0%), and Food Preparation & Serving (65.5%).
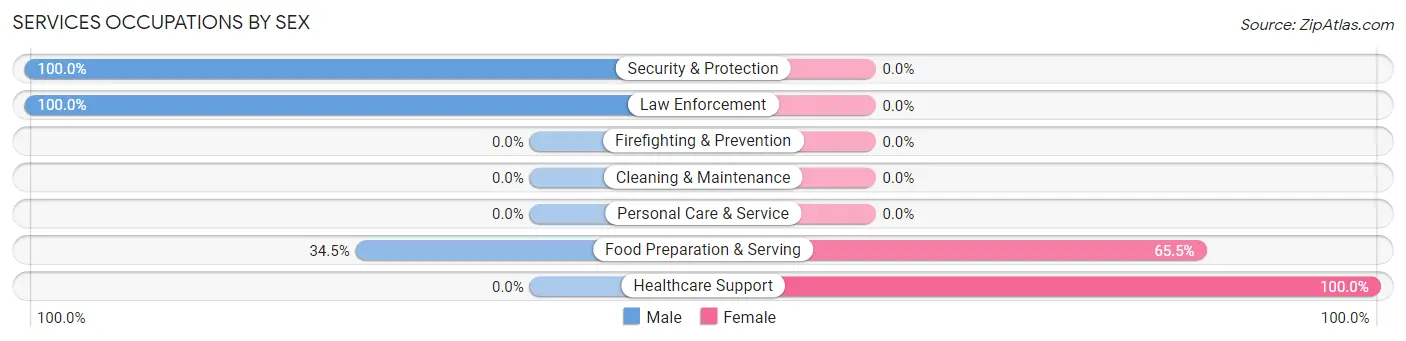
| Occupation | Male | Female |
| Healthcare Support | 0 (0.0%) | 106 (100.0%) |
| Security & Protection | 15 (100.0%) | 0 (0.0%) |
| Firefighting & Prevention | 0 (0.0%) | 0 (0.0%) |
| Law Enforcement | 15 (100.0%) | 0 (0.0%) |
| Food Preparation & Serving | 20 (34.5%) | 38 (65.5%) |
| Cleaning & Maintenance | 0 (0.0%) | 0 (0.0%) |
| Personal Care & Service | 0 (0.0%) | 0 (0.0%) |
| Total (Category) | 35 (19.6%) | 144 (80.4%) |
| Total (Overall) | 400 (51.3%) | 379 (48.6%) |
Sales and Office Occupations
The most common Sales and Office occupations in Pumpkin Center are Sales & Related (67 | 8.6%), and Office & Administration (64 | 8.2%).
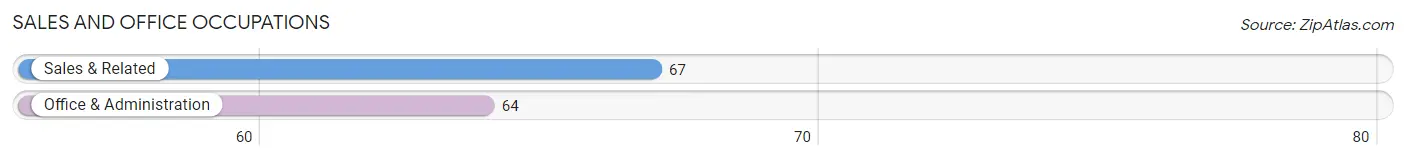
Sales and Office Occupations by Sex
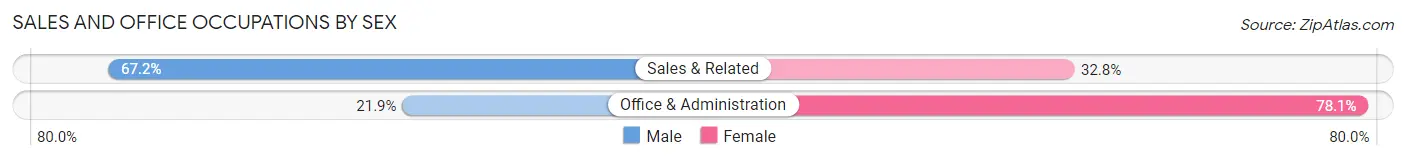
| Occupation | Male | Female |
| Sales & Related | 45 (67.2%) | 22 (32.8%) |
| Office & Administration | 14 (21.9%) | 50 (78.1%) |
| Total (Category) | 59 (45.0%) | 72 (55.0%) |
| Total (Overall) | 400 (51.3%) | 379 (48.6%) |
Natural Resources, Construction and Maintenance Occupations
The most common Natural Resources, Construction and Maintenance occupations in Pumpkin Center are , and Installation, Maintenance & Repair (92 | 11.8%).
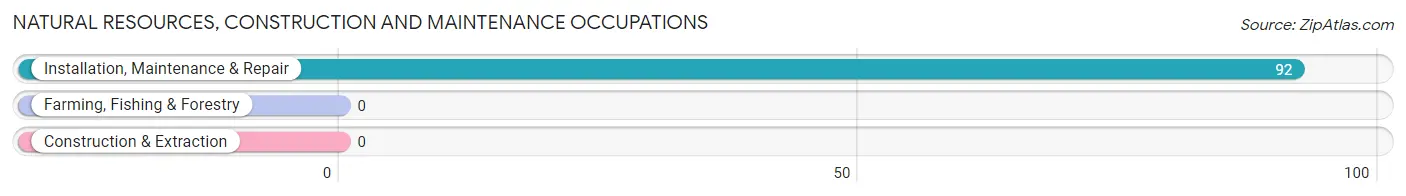
Natural Resources, Construction and Maintenance Occupations by Sex
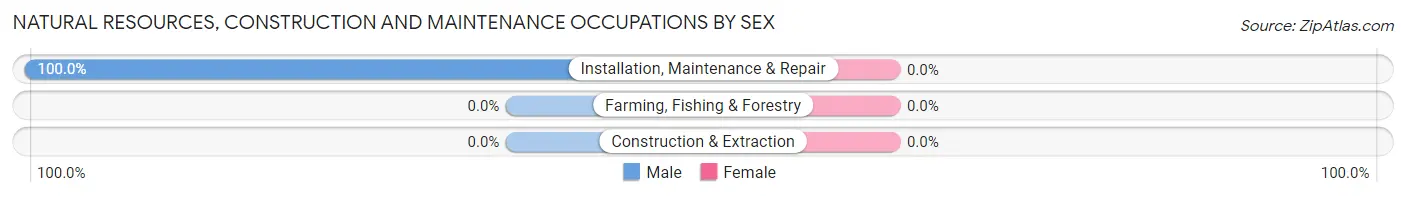
| Occupation | Male | Female |
| Farming, Fishing & Forestry | 0 (0.0%) | 0 (0.0%) |
| Construction & Extraction | 0 (0.0%) | 0 (0.0%) |
| Installation, Maintenance & Repair | 92 (100.0%) | 0 (0.0%) |
| Total (Category) | 92 (100.0%) | 0 (0.0%) |
| Total (Overall) | 400 (51.3%) | 379 (48.6%) |
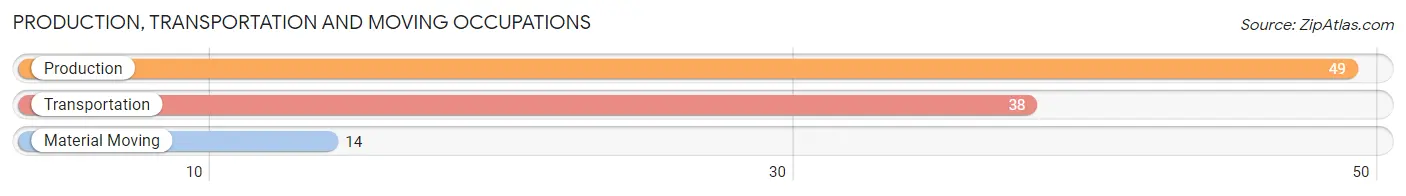
Production, Transportation and Moving Occupations
The most common Production, Transportation and Moving occupations in Pumpkin Center are Production (49 | 6.3%), Transportation (38 | 4.9%), and Material Moving (14 | 1.8%).
Production, Transportation and Moving Occupations by Sex
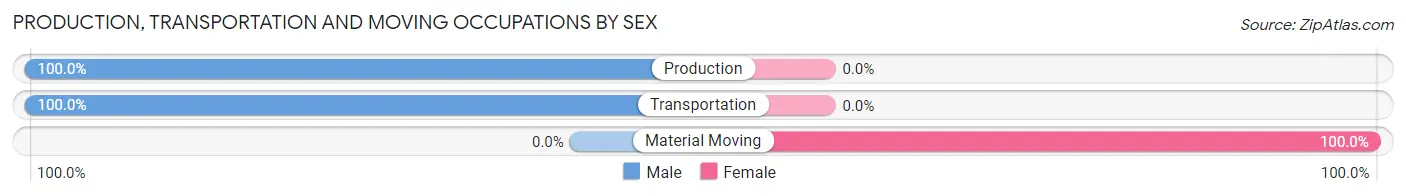
| Occupation | Male | Female |
| Production | 49 (100.0%) | 0 (0.0%) |
| Transportation | 38 (100.0%) | 0 (0.0%) |
| Material Moving | 0 (0.0%) | 14 (100.0%) |
| Total (Category) | 87 (86.1%) | 14 (13.9%) |
| Total (Overall) | 400 (51.3%) | 379 (48.6%) |
Employment Industries by Sex in Pumpkin Center
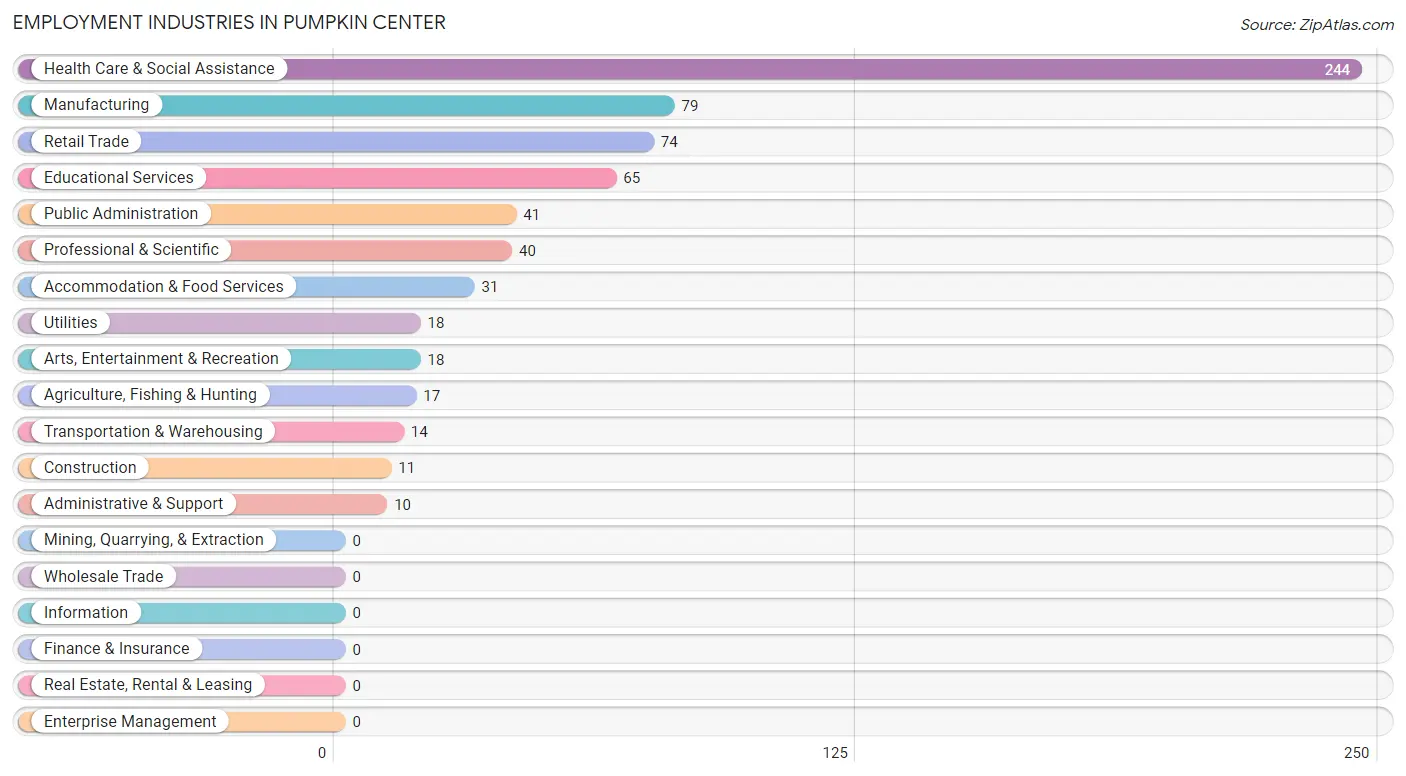
Employment Industries in Pumpkin Center
The major employment industries in Pumpkin Center include Health Care & Social Assistance (244 | 31.3%), Manufacturing (79 | 10.1%), Retail Trade (74 | 9.5%), Educational Services (65 | 8.3%), and Public Administration (41 | 5.3%).
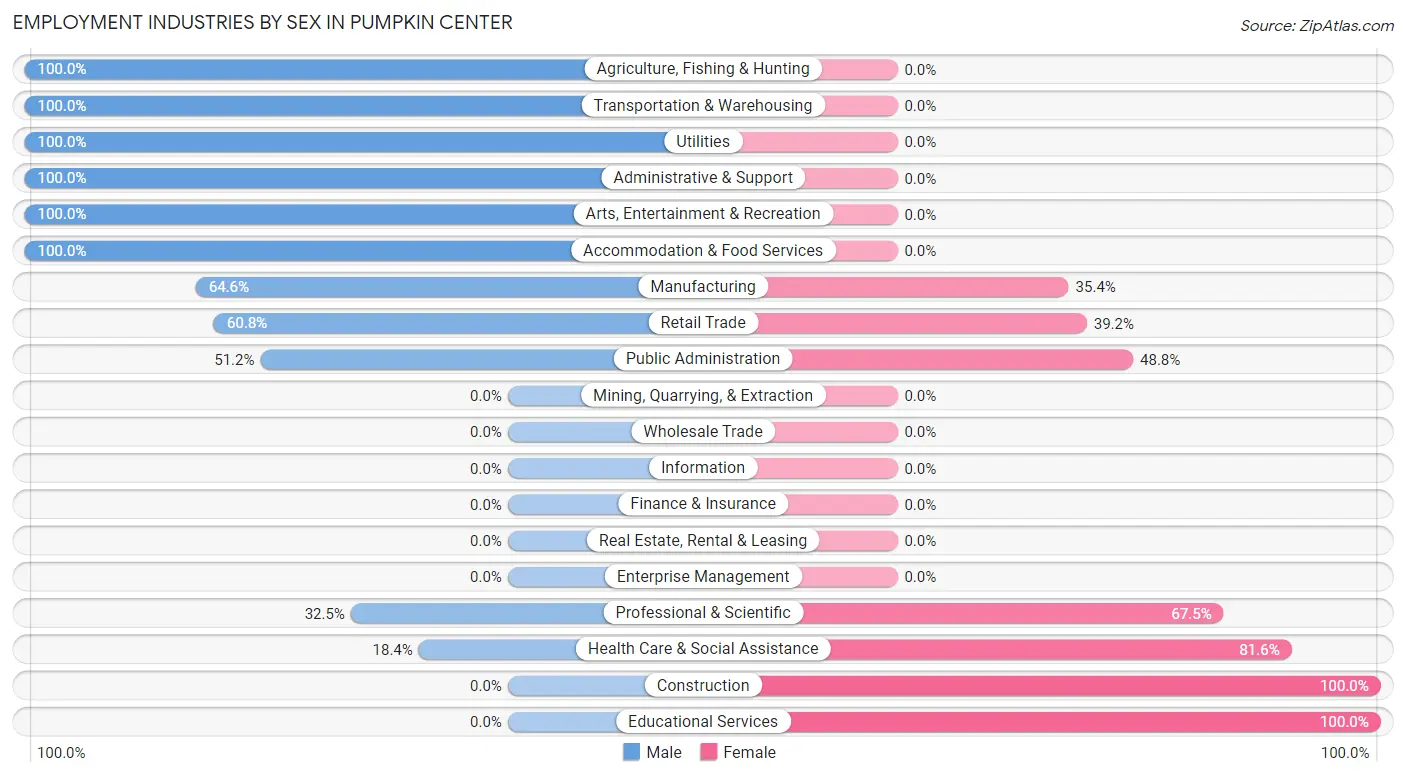
Employment Industries by Sex in Pumpkin Center
The Pumpkin Center industries that see more men than women are Agriculture, Fishing & Hunting (100.0%), Transportation & Warehousing (100.0%), and Utilities (100.0%), whereas the industries that tend to have a higher number of women are Construction (100.0%), Educational Services (100.0%), and Health Care & Social Assistance (81.6%).
| Industry | Male | Female |
| Agriculture, Fishing & Hunting | 17 (100.0%) | 0 (0.0%) |
| Mining, Quarrying, & Extraction | 0 (0.0%) | 0 (0.0%) |
| Construction | 0 (0.0%) | 11 (100.0%) |
| Manufacturing | 51 (64.6%) | 28 (35.4%) |
| Wholesale Trade | 0 (0.0%) | 0 (0.0%) |
| Retail Trade | 45 (60.8%) | 29 (39.2%) |
| Transportation & Warehousing | 14 (100.0%) | 0 (0.0%) |
| Utilities | 18 (100.0%) | 0 (0.0%) |
| Information | 0 (0.0%) | 0 (0.0%) |
| Finance & Insurance | 0 (0.0%) | 0 (0.0%) |
| Real Estate, Rental & Leasing | 0 (0.0%) | 0 (0.0%) |
| Professional & Scientific | 13 (32.5%) | 27 (67.5%) |
| Enterprise Management | 0 (0.0%) | 0 (0.0%) |
| Administrative & Support | 10 (100.0%) | 0 (0.0%) |
| Educational Services | 0 (0.0%) | 65 (100.0%) |
| Health Care & Social Assistance | 45 (18.4%) | 199 (81.6%) |
| Arts, Entertainment & Recreation | 18 (100.0%) | 0 (0.0%) |
| Accommodation & Food Services | 31 (100.0%) | 0 (0.0%) |
| Public Administration | 21 (51.2%) | 20 (48.8%) |
| Total | 400 (51.3%) | 379 (48.6%) |
Education in Pumpkin Center
School Enrollment in Pumpkin Center
The most common levels of schooling among the 492 students in Pumpkin Center are college / undergraduate (183 | 37.2%), high school (159 | 32.3%), and middle school (131 | 26.6%).
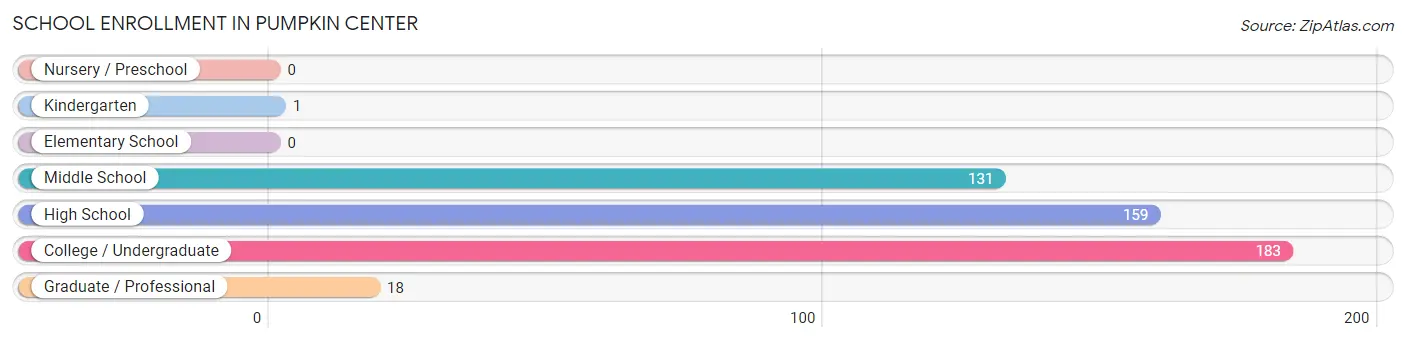
| School Level | # Students | % Students |
| Nursery / Preschool | 0 | 0.0% |
| Kindergarten | 1 | 0.2% |
| Elementary School | 0 | 0.0% |
| Middle School | 131 | 26.6% |
| High School | 159 | 32.3% |
| College / Undergraduate | 183 | 37.2% |
| Graduate / Professional | 18 | 3.7% |
| Total | 492 | 100.0% |
School Enrollment by Age by Funding Source in Pumpkin Center
Out of a total of 492 students who are enrolled in schools in Pumpkin Center, 91 (18.5%) attend a private institution, while the remaining 401 (81.5%) are enrolled in public schools. The age group of 25 to 34 year olds has the highest likelihood of being enrolled in private schools, with 58 (68.2% in the age bracket) enrolled. Conversely, the age group of 5 to 9 year old has the lowest likelihood of being enrolled in a private school, with 1 (100.0% in the age bracket) attending a public institution.
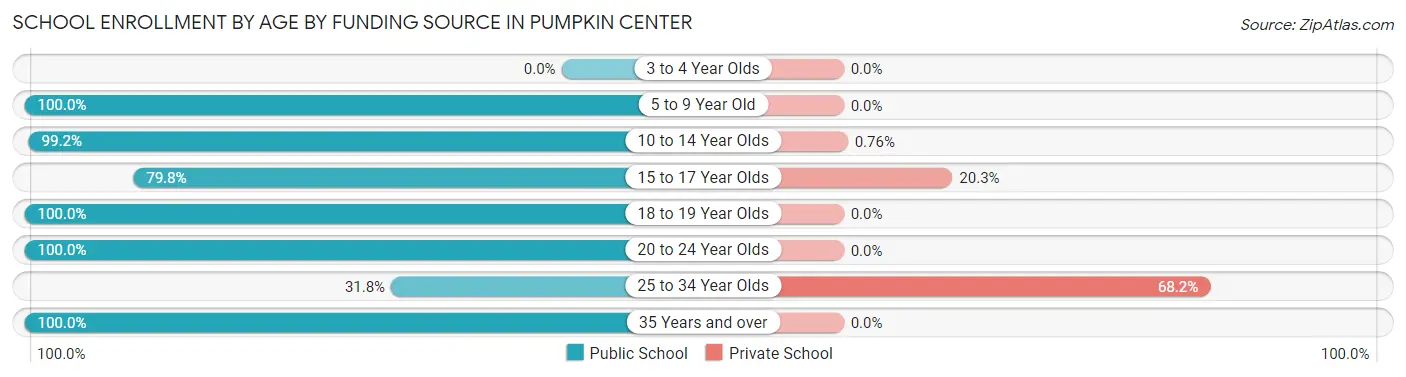
| Age Bracket | Public School | Private School |
| 3 to 4 Year Olds | 0 (0.0%) | 0 (0.0%) |
| 5 to 9 Year Old | 1 (100.0%) | 0 (0.0%) |
| 10 to 14 Year Olds | 130 (99.2%) | 1 (0.8%) |
| 15 to 17 Year Olds | 126 (79.7%) | 32 (20.3%) |
| 18 to 19 Year Olds | 1 (100.0%) | 0 (0.0%) |
| 20 to 24 Year Olds | 18 (100.0%) | 0 (0.0%) |
| 25 to 34 Year Olds | 27 (31.8%) | 58 (68.2%) |
| 35 Years and over | 98 (100.0%) | 0 (0.0%) |
| Total | 401 (81.5%) | 91 (18.5%) |
Educational Attainment by Field of Study in Pumpkin Center
Science & technology (86 | 25.2%), business (67 | 19.6%), education (39 | 11.4%), social sciences (35 | 10.2%), and multidisciplinary studies (30 | 8.8%) are the most common fields of study among 342 individuals in Pumpkin Center who have obtained a bachelor's degree or higher.
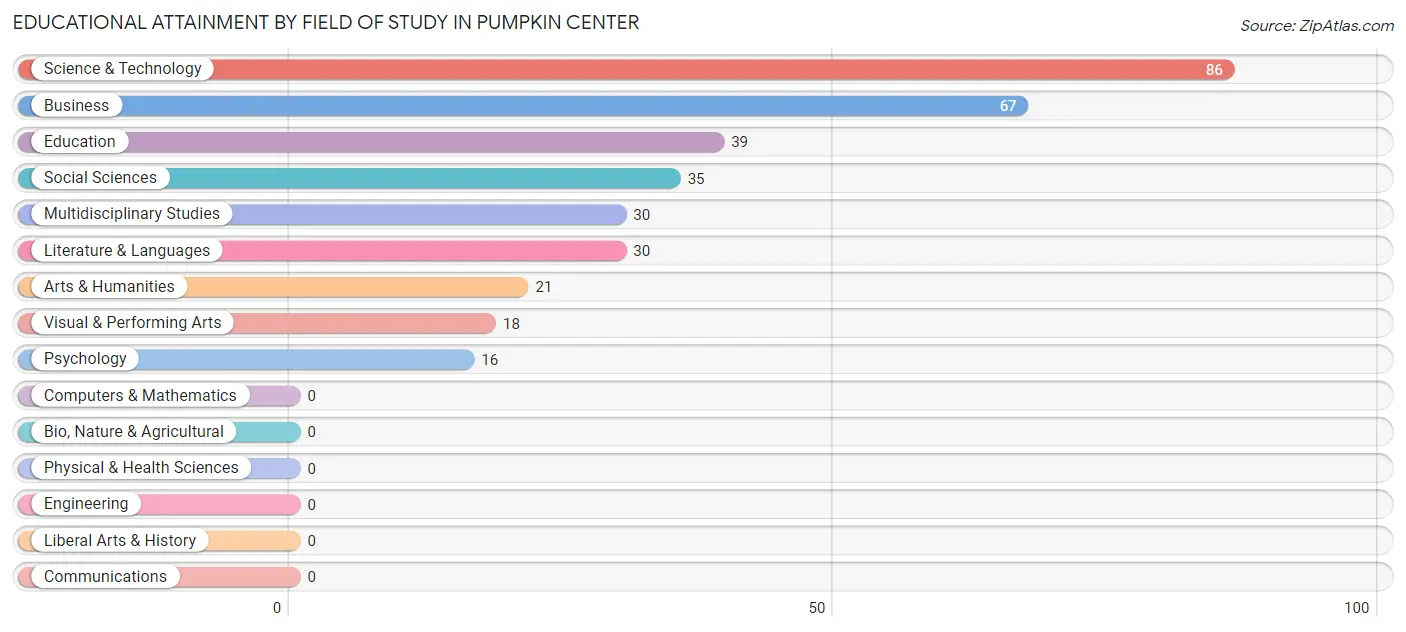
| Field of Study | # Graduates | % Graduates |
| Computers & Mathematics | 0 | 0.0% |
| Bio, Nature & Agricultural | 0 | 0.0% |
| Physical & Health Sciences | 0 | 0.0% |
| Psychology | 16 | 4.7% |
| Social Sciences | 35 | 10.2% |
| Engineering | 0 | 0.0% |
| Multidisciplinary Studies | 30 | 8.8% |
| Science & Technology | 86 | 25.2% |
| Business | 67 | 19.6% |
| Education | 39 | 11.4% |
| Literature & Languages | 30 | 8.8% |
| Liberal Arts & History | 0 | 0.0% |
| Visual & Performing Arts | 18 | 5.3% |
| Communications | 0 | 0.0% |
| Arts & Humanities | 21 | 6.1% |
| Total | 342 | 100.0% |
Transportation & Commute in Pumpkin Center
Vehicle Availability by Sex in Pumpkin Center
The most prevalent vehicle ownership categories in Pumpkin Center are males with 2 vehicles (230, accounting for 55.4%) and females with 2 vehicles (266, making up 60.7%).
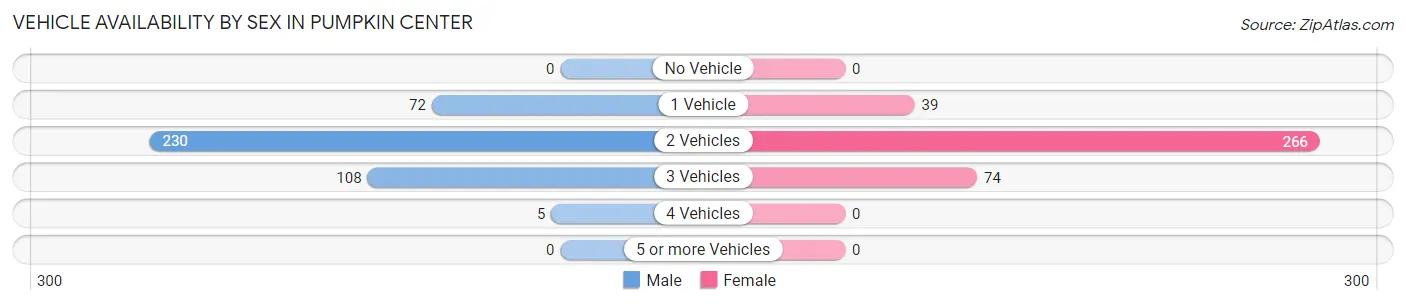
| Vehicles Available | Male | Female |
| No Vehicle | 0 (0.0%) | 0 (0.0%) |
| 1 Vehicle | 72 (17.3%) | 39 (10.3%) |
| 2 Vehicles | 230 (55.4%) | 266 (70.2%) |
| 3 Vehicles | 108 (26.0%) | 74 (19.5%) |
| 4 Vehicles | 5 (1.2%) | 0 (0.0%) |
| 5 or more Vehicles | 0 (0.0%) | 0 (0.0%) |
| Total | 415 (100.0%) | 379 (100.0%) |
Commute Time in Pumpkin Center
The most frequently occuring commute durations in Pumpkin Center are 15 to 19 minutes (264 commuters, 35.8%), 10 to 14 minutes (147 commuters, 20.0%), and 20 to 24 minutes (77 commuters, 10.4%).
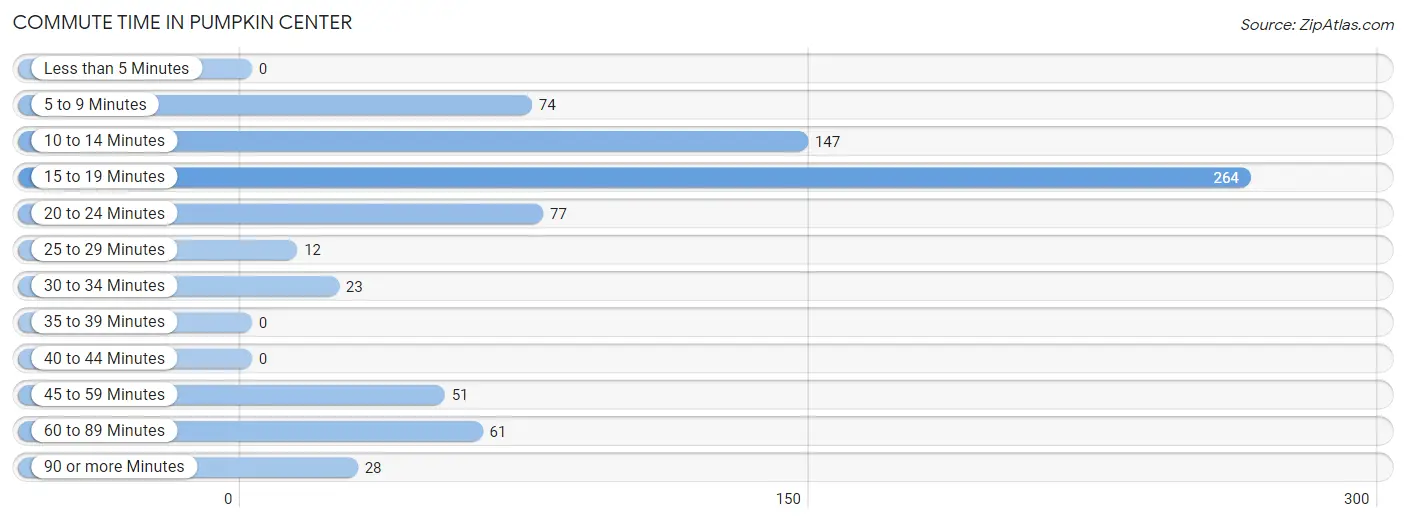
| Commute Time | # Commuters | % Commuters |
| Less than 5 Minutes | 0 | 0.0% |
| 5 to 9 Minutes | 74 | 10.0% |
| 10 to 14 Minutes | 147 | 20.0% |
| 15 to 19 Minutes | 264 | 35.8% |
| 20 to 24 Minutes | 77 | 10.4% |
| 25 to 29 Minutes | 12 | 1.6% |
| 30 to 34 Minutes | 23 | 3.1% |
| 35 to 39 Minutes | 0 | 0.0% |
| 40 to 44 Minutes | 0 | 0.0% |
| 45 to 59 Minutes | 51 | 6.9% |
| 60 to 89 Minutes | 61 | 8.3% |
| 90 or more Minutes | 28 | 3.8% |
Commute Time by Sex in Pumpkin Center
The most common commute times in Pumpkin Center are 10 to 14 minutes (132 commuters, 34.9%) for males and 15 to 19 minutes (182 commuters, 50.7%) for females.
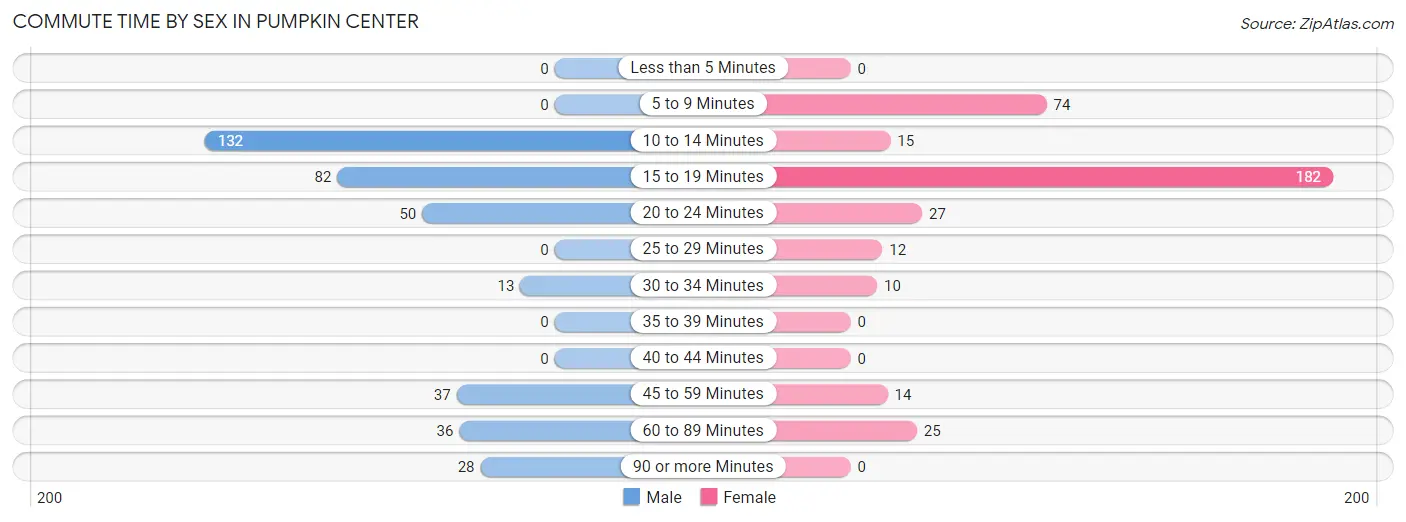
| Commute Time | Male | Female |
| Less than 5 Minutes | 0 (0.0%) | 0 (0.0%) |
| 5 to 9 Minutes | 0 (0.0%) | 74 (20.6%) |
| 10 to 14 Minutes | 132 (34.9%) | 15 (4.2%) |
| 15 to 19 Minutes | 82 (21.7%) | 182 (50.7%) |
| 20 to 24 Minutes | 50 (13.2%) | 27 (7.5%) |
| 25 to 29 Minutes | 0 (0.0%) | 12 (3.3%) |
| 30 to 34 Minutes | 13 (3.4%) | 10 (2.8%) |
| 35 to 39 Minutes | 0 (0.0%) | 0 (0.0%) |
| 40 to 44 Minutes | 0 (0.0%) | 0 (0.0%) |
| 45 to 59 Minutes | 37 (9.8%) | 14 (3.9%) |
| 60 to 89 Minutes | 36 (9.5%) | 25 (7.0%) |
| 90 or more Minutes | 28 (7.4%) | 0 (0.0%) |
Time of Departure to Work by Sex in Pumpkin Center
The most frequent times of departure to work in Pumpkin Center are 7:30 AM to 7:59 AM (88, 23.3%) for males and 6:30 AM to 6:59 AM (158, 44.0%) for females.
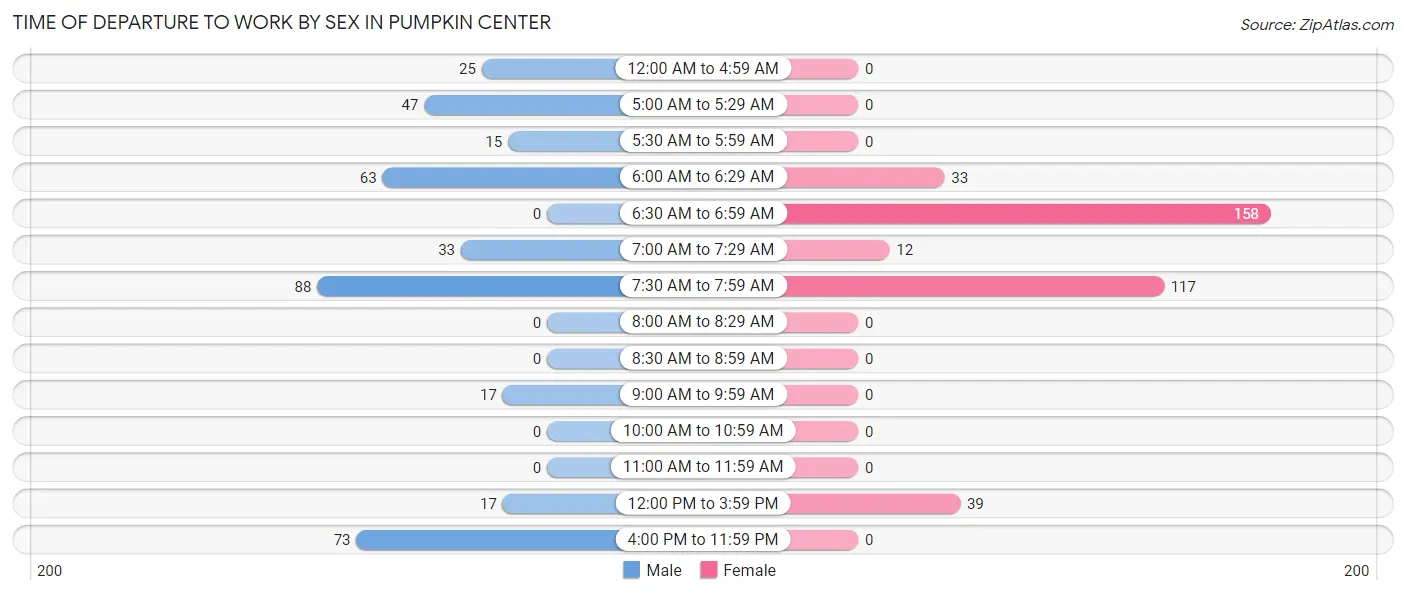
| Time of Departure | Male | Female |
| 12:00 AM to 4:59 AM | 25 (6.6%) | 0 (0.0%) |
| 5:00 AM to 5:29 AM | 47 (12.4%) | 0 (0.0%) |
| 5:30 AM to 5:59 AM | 15 (4.0%) | 0 (0.0%) |
| 6:00 AM to 6:29 AM | 63 (16.7%) | 33 (9.2%) |
| 6:30 AM to 6:59 AM | 0 (0.0%) | 158 (44.0%) |
| 7:00 AM to 7:29 AM | 33 (8.7%) | 12 (3.3%) |
| 7:30 AM to 7:59 AM | 88 (23.3%) | 117 (32.6%) |
| 8:00 AM to 8:29 AM | 0 (0.0%) | 0 (0.0%) |
| 8:30 AM to 8:59 AM | 0 (0.0%) | 0 (0.0%) |
| 9:00 AM to 9:59 AM | 17 (4.5%) | 0 (0.0%) |
| 10:00 AM to 10:59 AM | 0 (0.0%) | 0 (0.0%) |
| 11:00 AM to 11:59 AM | 0 (0.0%) | 0 (0.0%) |
| 12:00 PM to 3:59 PM | 17 (4.5%) | 39 (10.9%) |
| 4:00 PM to 11:59 PM | 73 (19.3%) | 0 (0.0%) |
| Total | 378 (100.0%) | 359 (100.0%) |
Housing Occupancy in Pumpkin Center
Occupancy by Ownership in Pumpkin Center
Of the total 778 dwellings in Pumpkin Center, owner-occupied units account for 704 (90.5%), while renter-occupied units make up 74 (9.5%).
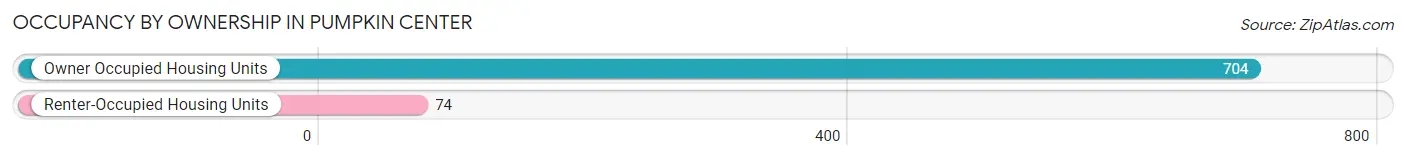
| Occupancy | # Housing Units | % Housing Units |
| Owner Occupied Housing Units | 704 | 90.5% |
| Renter-Occupied Housing Units | 74 | 9.5% |
| Total Occupied Housing Units | 778 | 100.0% |
Occupancy by Household Size in Pumpkin Center
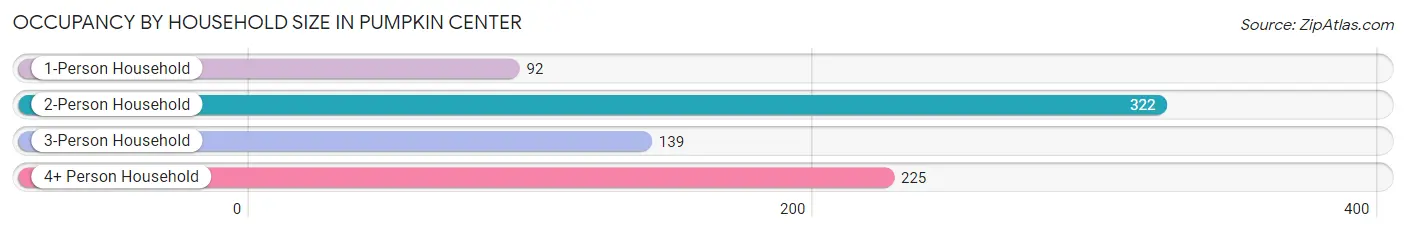
| Household Size | # Housing Units | % Housing Units |
| 1-Person Household | 92 | 11.8% |
| 2-Person Household | 322 | 41.4% |
| 3-Person Household | 139 | 17.9% |
| 4+ Person Household | 225 | 28.9% |
| Total Housing Units | 778 | 100.0% |
Occupancy by Ownership by Household Size in Pumpkin Center
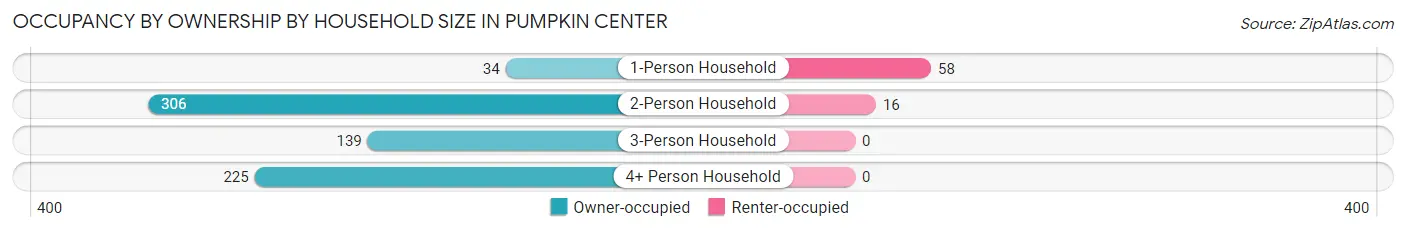
| Household Size | Owner-occupied | Renter-occupied |
| 1-Person Household | 34 (37.0%) | 58 (63.0%) |
| 2-Person Household | 306 (95.0%) | 16 (5.0%) |
| 3-Person Household | 139 (100.0%) | 0 (0.0%) |
| 4+ Person Household | 225 (100.0%) | 0 (0.0%) |
| Total Housing Units | 704 (90.5%) | 74 (9.5%) |
Occupancy by Educational Attainment in Pumpkin Center
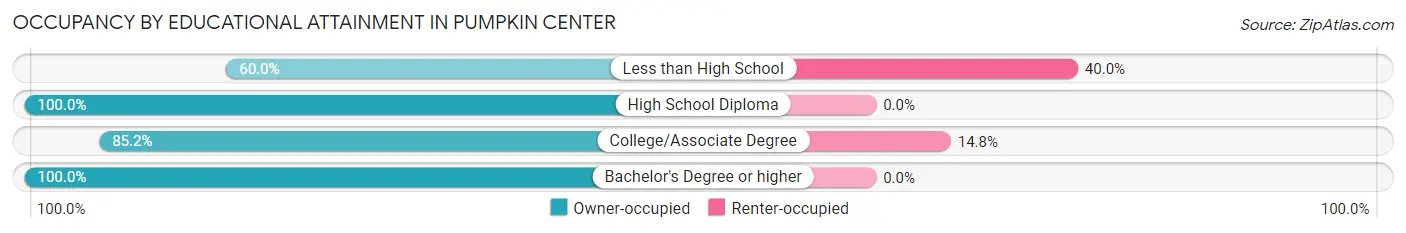
| Household Size | Owner-occupied | Renter-occupied |
| Less than High School | 24 (60.0%) | 16 (40.0%) |
| High School Diploma | 179 (100.0%) | 0 (0.0%) |
| College/Associate Degree | 334 (85.2%) | 58 (14.8%) |
| Bachelor's Degree or higher | 167 (100.0%) | 0 (0.0%) |
Occupancy by Age of Householder in Pumpkin Center
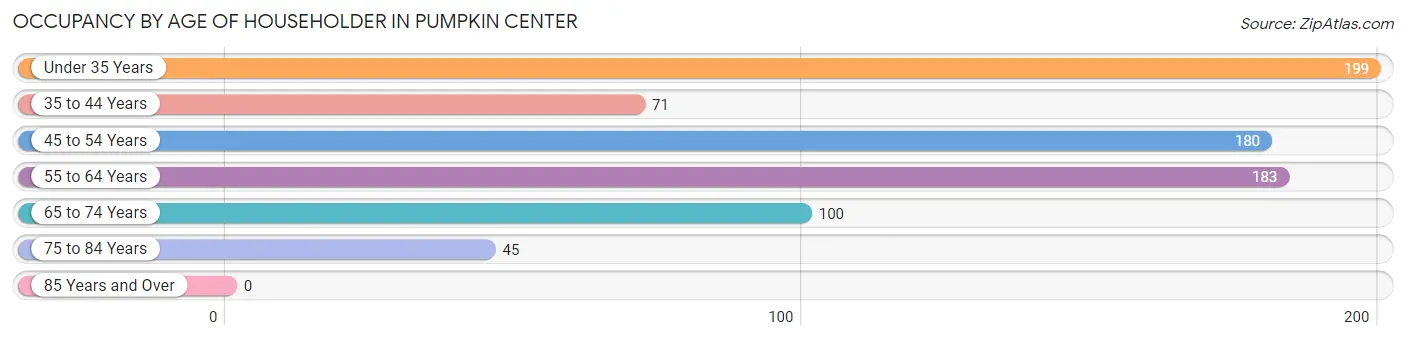
| Age Bracket | # Households | % Households |
| Under 35 Years | 199 | 25.6% |
| 35 to 44 Years | 71 | 9.1% |
| 45 to 54 Years | 180 | 23.1% |
| 55 to 64 Years | 183 | 23.5% |
| 65 to 74 Years | 100 | 12.9% |
| 75 to 84 Years | 45 | 5.8% |
| 85 Years and Over | 0 | 0.0% |
| Total | 778 | 100.0% |
Housing Finances in Pumpkin Center
Median Income by Occupancy in Pumpkin Center
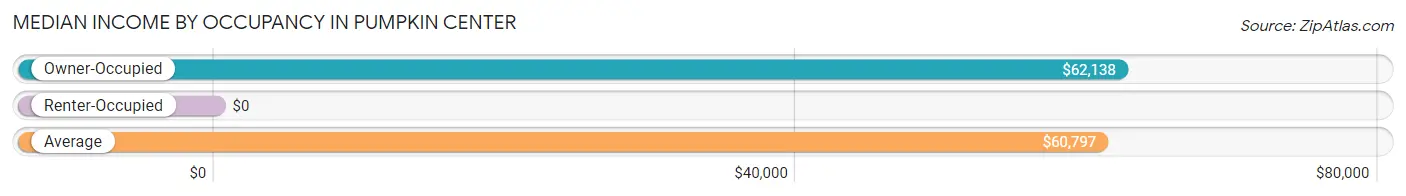
| Occupancy Type | # Households | Median Income |
| Owner-Occupied | 704 (90.5%) | $62,138 |
| Renter-Occupied | 74 (9.5%) | $0 |
| Average | 778 (100.0%) | $60,797 |
Occupancy by Householder Income Bracket in Pumpkin Center
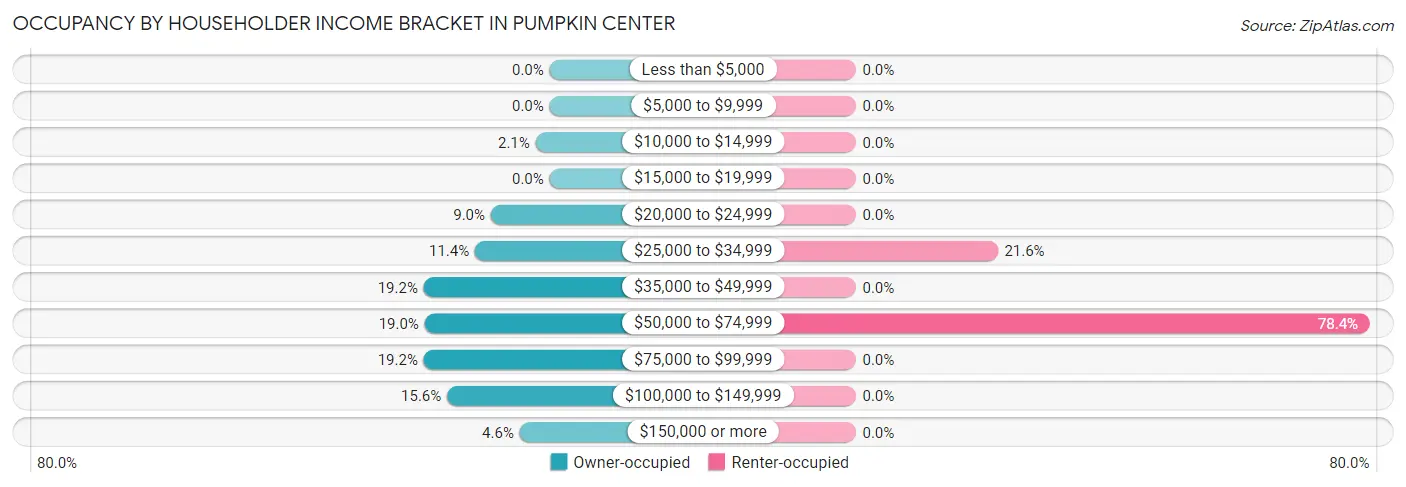
| Income Bracket | Owner-occupied | Renter-occupied |
| Less than $5,000 | 0 (0.0%) | 0 (0.0%) |
| $5,000 to $9,999 | 0 (0.0%) | 0 (0.0%) |
| $10,000 to $14,999 | 15 (2.1%) | 0 (0.0%) |
| $15,000 to $19,999 | 0 (0.0%) | 0 (0.0%) |
| $20,000 to $24,999 | 63 (8.9%) | 0 (0.0%) |
| $25,000 to $34,999 | 80 (11.4%) | 16 (21.6%) |
| $35,000 to $49,999 | 135 (19.2%) | 0 (0.0%) |
| $50,000 to $74,999 | 134 (19.0%) | 58 (78.4%) |
| $75,000 to $99,999 | 135 (19.2%) | 0 (0.0%) |
| $100,000 to $149,999 | 110 (15.6%) | 0 (0.0%) |
| $150,000 or more | 32 (4.5%) | 0 (0.0%) |
| Total | 704 (100.0%) | 74 (100.0%) |
Monthly Housing Cost Tiers in Pumpkin Center
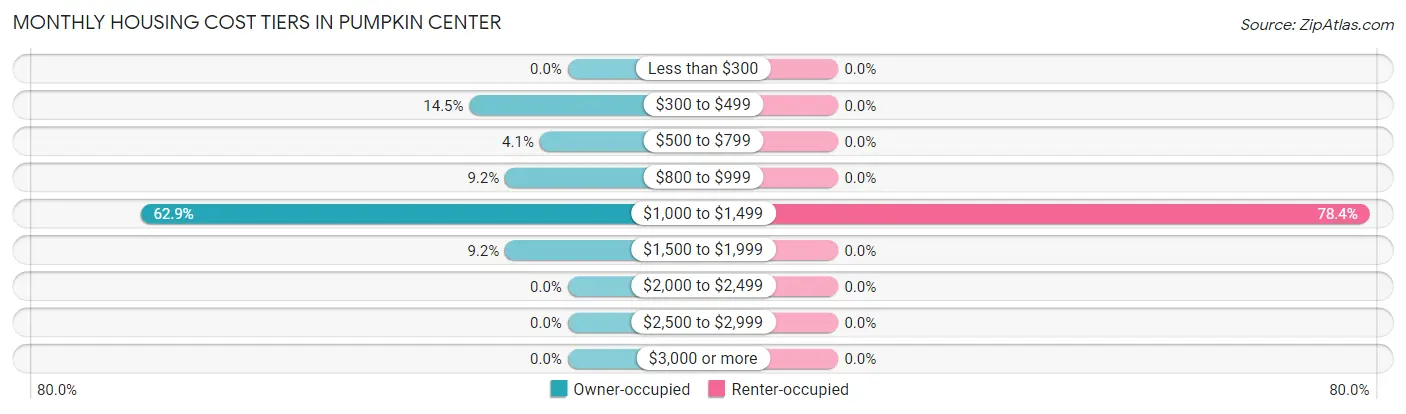
| Monthly Cost | Owner-occupied | Renter-occupied |
| Less than $300 | 0 (0.0%) | 0 (0.0%) |
| $300 to $499 | 102 (14.5%) | 0 (0.0%) |
| $500 to $799 | 29 (4.1%) | 0 (0.0%) |
| $800 to $999 | 65 (9.2%) | 0 (0.0%) |
| $1,000 to $1,499 | 443 (62.9%) | 58 (78.4%) |
| $1,500 to $1,999 | 65 (9.2%) | 0 (0.0%) |
| $2,000 to $2,499 | 0 (0.0%) | 0 (0.0%) |
| $2,500 to $2,999 | 0 (0.0%) | 0 (0.0%) |
| $3,000 or more | 0 (0.0%) | 0 (0.0%) |
| Total | 704 (100.0%) | 74 (100.0%) |
Physical Housing Characteristics in Pumpkin Center
Housing Structures in Pumpkin Center
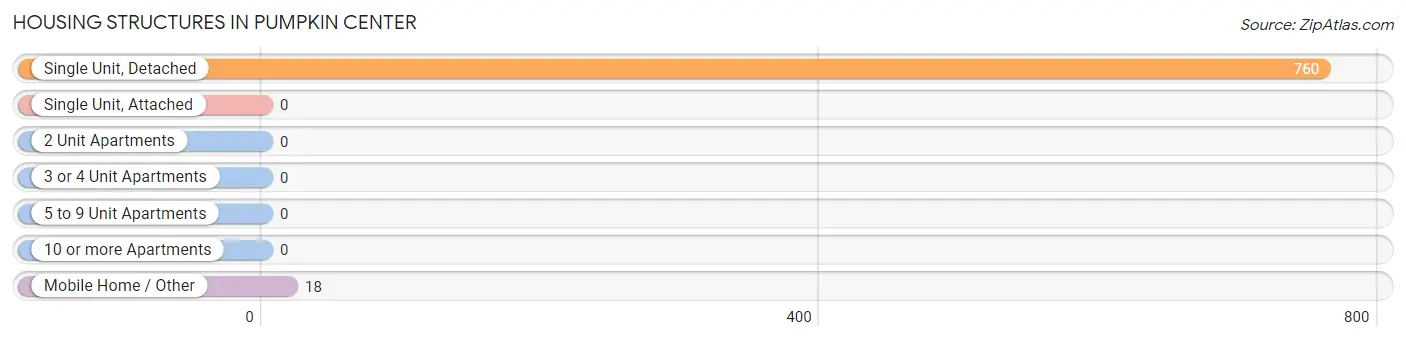
| Structure Type | # Housing Units | % Housing Units |
| Single Unit, Detached | 760 | 97.7% |
| Single Unit, Attached | 0 | 0.0% |
| 2 Unit Apartments | 0 | 0.0% |
| 3 or 4 Unit Apartments | 0 | 0.0% |
| 5 to 9 Unit Apartments | 0 | 0.0% |
| 10 or more Apartments | 0 | 0.0% |
| Mobile Home / Other | 18 | 2.3% |
| Total | 778 | 100.0% |
Housing Structures by Occupancy in Pumpkin Center
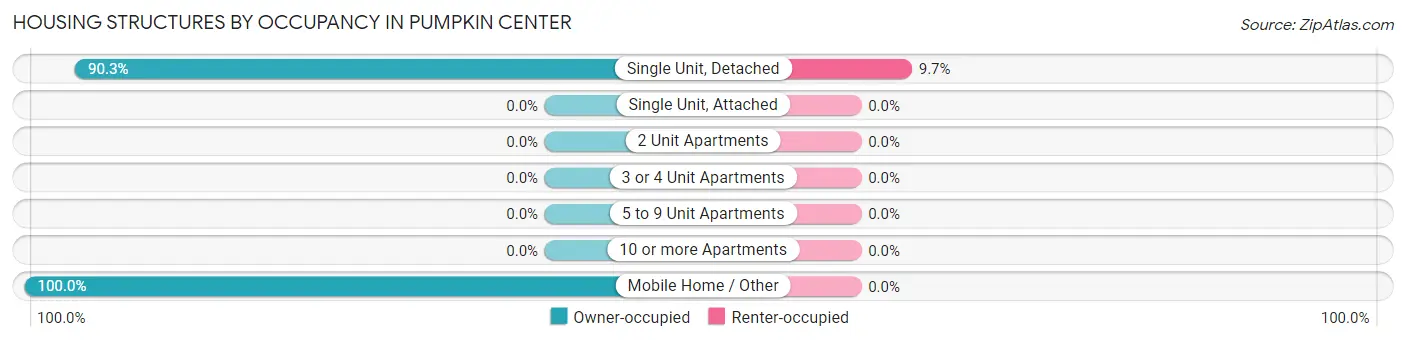
| Structure Type | Owner-occupied | Renter-occupied |
| Single Unit, Detached | 686 (90.3%) | 74 (9.7%) |
| Single Unit, Attached | 0 (0.0%) | 0 (0.0%) |
| 2 Unit Apartments | 0 (0.0%) | 0 (0.0%) |
| 3 or 4 Unit Apartments | 0 (0.0%) | 0 (0.0%) |
| 5 to 9 Unit Apartments | 0 (0.0%) | 0 (0.0%) |
| 10 or more Apartments | 0 (0.0%) | 0 (0.0%) |
| Mobile Home / Other | 18 (100.0%) | 0 (0.0%) |
| Total | 704 (90.5%) | 74 (9.5%) |
Housing Structures by Number of Rooms in Pumpkin Center
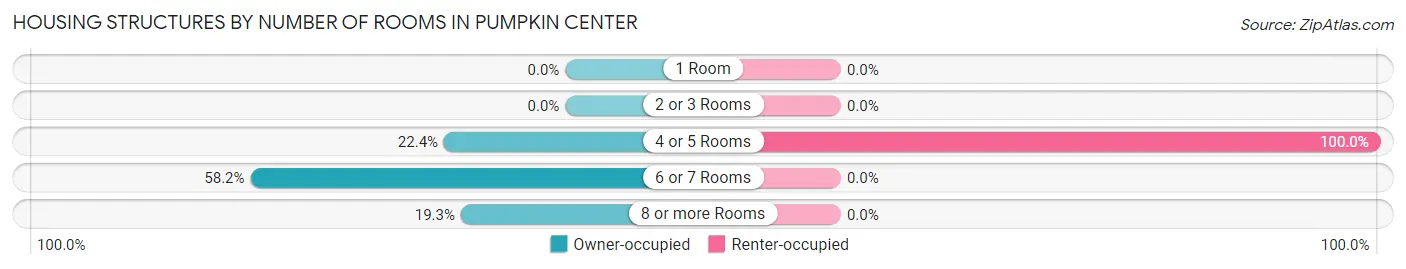
| Number of Rooms | Owner-occupied | Renter-occupied |
| 1 Room | 0 (0.0%) | 0 (0.0%) |
| 2 or 3 Rooms | 0 (0.0%) | 0 (0.0%) |
| 4 or 5 Rooms | 158 (22.4%) | 74 (100.0%) |
| 6 or 7 Rooms | 410 (58.2%) | 0 (0.0%) |
| 8 or more Rooms | 136 (19.3%) | 0 (0.0%) |
| Total | 704 (100.0%) | 74 (100.0%) |
Housing Structure by Heating Type in Pumpkin Center
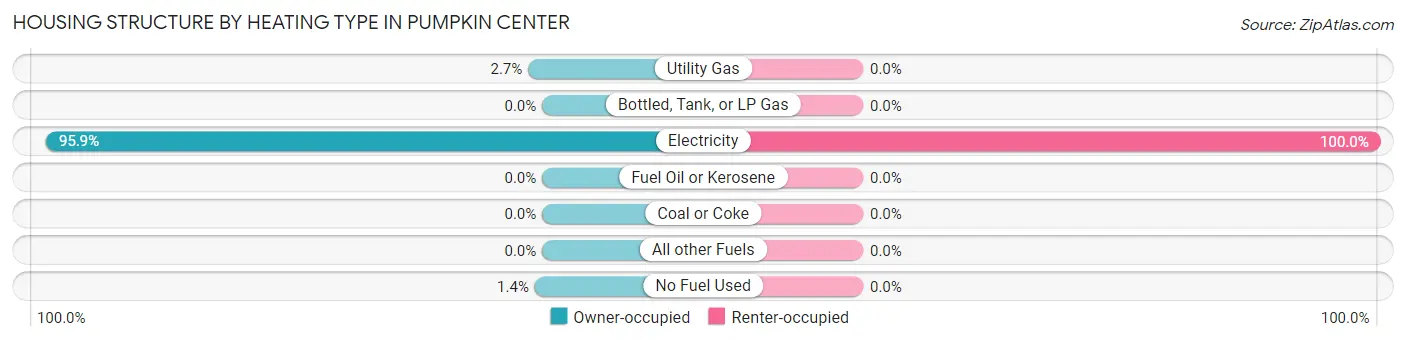
| Heating Type | Owner-occupied | Renter-occupied |
| Utility Gas | 19 (2.7%) | 0 (0.0%) |
| Bottled, Tank, or LP Gas | 0 (0.0%) | 0 (0.0%) |
| Electricity | 675 (95.9%) | 74 (100.0%) |
| Fuel Oil or Kerosene | 0 (0.0%) | 0 (0.0%) |
| Coal or Coke | 0 (0.0%) | 0 (0.0%) |
| All other Fuels | 0 (0.0%) | 0 (0.0%) |
| No Fuel Used | 10 (1.4%) | 0 (0.0%) |
| Total | 704 (100.0%) | 74 (100.0%) |
Household Vehicle Usage in Pumpkin Center
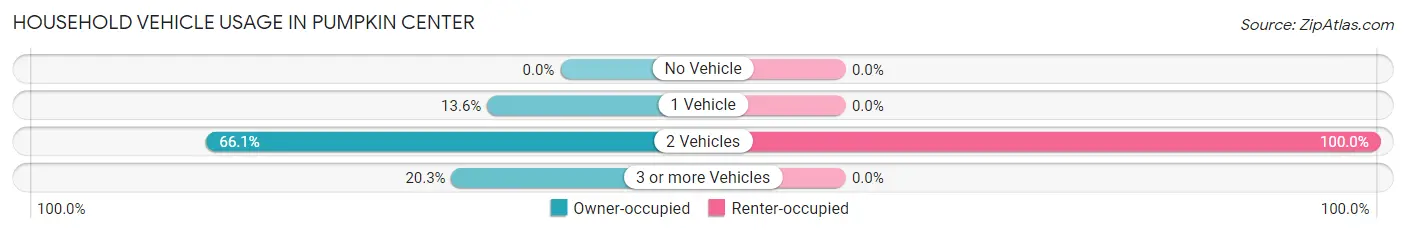
| Vehicles per Household | Owner-occupied | Renter-occupied |
| No Vehicle | 0 (0.0%) | 0 (0.0%) |
| 1 Vehicle | 96 (13.6%) | 0 (0.0%) |
| 2 Vehicles | 465 (66.0%) | 74 (100.0%) |
| 3 or more Vehicles | 143 (20.3%) | 0 (0.0%) |
| Total | 704 (100.0%) | 74 (100.0%) |
Real Estate & Mortgages in Pumpkin Center
Real Estate and Mortgage Overview in Pumpkin Center
| Characteristic | Without Mortgage | With Mortgage |
| Housing Units | 105 | 599 |
| Median Property Value | $139,200 | $161,300 |
| Median Household Income | $89,180 | $19 |
| Monthly Housing Costs | $430 | $0 |
| Real Estate Taxes | $923 | $0 |
Property Value by Mortgage Status in Pumpkin Center
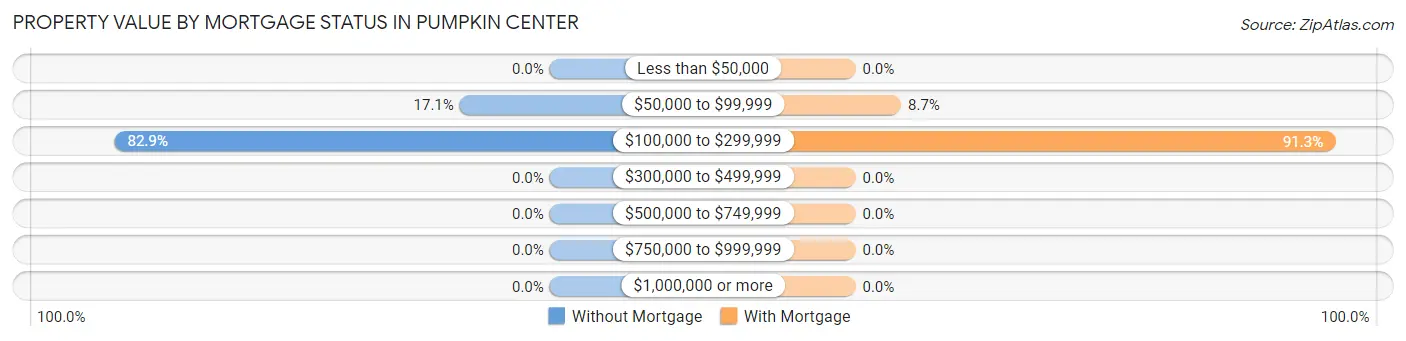
| Property Value | Without Mortgage | With Mortgage |
| Less than $50,000 | 0 (0.0%) | 0 (0.0%) |
| $50,000 to $99,999 | 18 (17.1%) | 52 (8.7%) |
| $100,000 to $299,999 | 87 (82.9%) | 547 (91.3%) |
| $300,000 to $499,999 | 0 (0.0%) | 0 (0.0%) |
| $500,000 to $749,999 | 0 (0.0%) | 0 (0.0%) |
| $750,000 to $999,999 | 0 (0.0%) | 0 (0.0%) |
| $1,000,000 or more | 0 (0.0%) | 0 (0.0%) |
| Total | 105 (100.0%) | 599 (100.0%) |
Household Income by Mortgage Status in Pumpkin Center
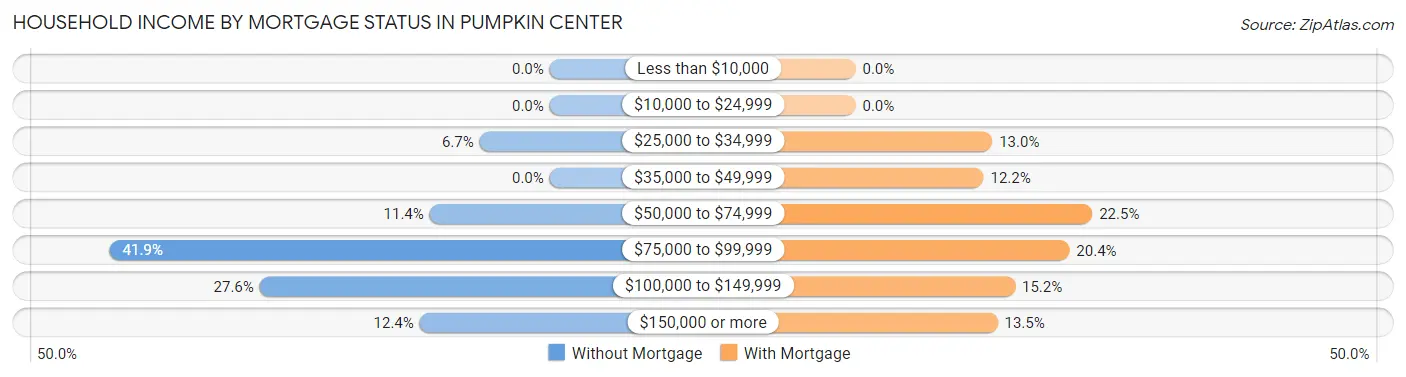
| Household Income | Without Mortgage | With Mortgage |
| Less than $10,000 | 0 (0.0%) | 0 (0.0%) |
| $10,000 to $24,999 | 0 (0.0%) | 0 (0.0%) |
| $25,000 to $34,999 | 7 (6.7%) | 78 (13.0%) |
| $35,000 to $49,999 | 0 (0.0%) | 73 (12.2%) |
| $50,000 to $74,999 | 12 (11.4%) | 135 (22.5%) |
| $75,000 to $99,999 | 44 (41.9%) | 122 (20.4%) |
| $100,000 to $149,999 | 29 (27.6%) | 91 (15.2%) |
| $150,000 or more | 13 (12.4%) | 81 (13.5%) |
| Total | 105 (100.0%) | 599 (100.0%) |
Property Value to Household Income Ratio in Pumpkin Center
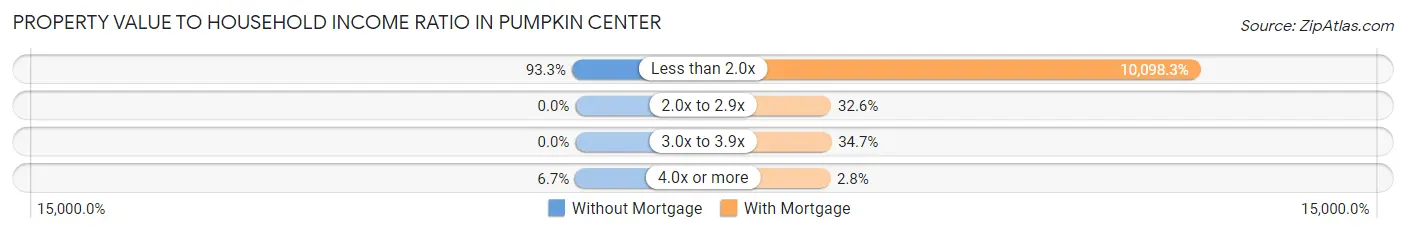
| Value-to-Income Ratio | Without Mortgage | With Mortgage |
| Less than 2.0x | 98 (93.3%) | 60,489 (10,098.3%) |
| 2.0x to 2.9x | 0 (0.0%) | 195 (32.6%) |
| 3.0x to 3.9x | 0 (0.0%) | 208 (34.7%) |
| 4.0x or more | 7 (6.7%) | 17 (2.8%) |
| Total | 105 (100.0%) | 599 (100.0%) |
Real Estate Taxes by Mortgage Status in Pumpkin Center
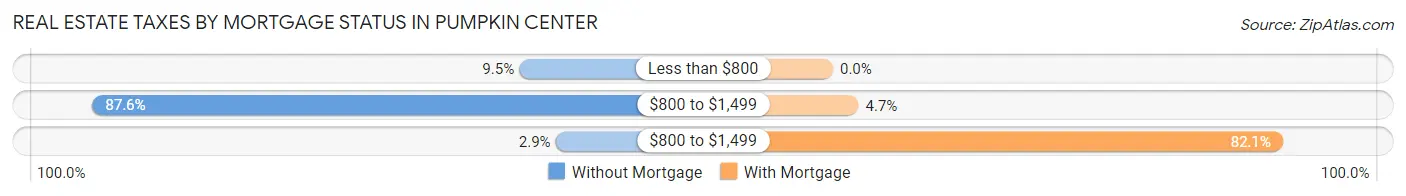
| Property Taxes | Without Mortgage | With Mortgage |
| Less than $800 | 10 (9.5%) | 0 (0.0%) |
| $800 to $1,499 | 92 (87.6%) | 28 (4.7%) |
| $800 to $1,499 | 3 (2.9%) | 492 (82.1%) |
| Total | 105 (100.0%) | 599 (100.0%) |
Health & Disability in Pumpkin Center
Health Insurance Coverage by Age in Pumpkin Center
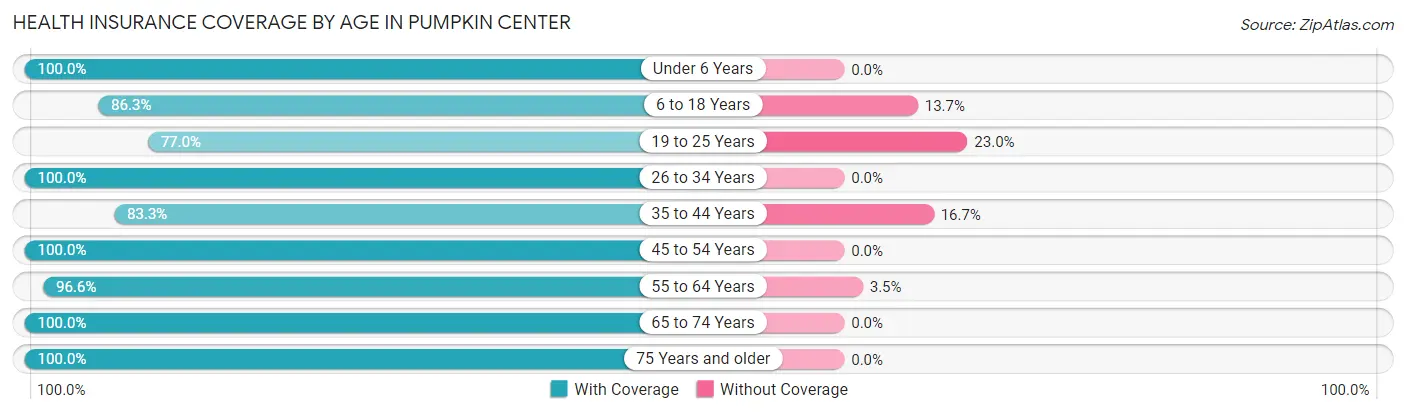
| Age Bracket | With Coverage | Without Coverage |
| Under 6 Years | 162 (100.0%) | 0 (0.0%) |
| 6 to 18 Years | 384 (86.3%) | 61 (13.7%) |
| 19 to 25 Years | 198 (77.0%) | 59 (23.0%) |
| 26 to 34 Years | 237 (100.0%) | 0 (0.0%) |
| 35 to 44 Years | 85 (83.3%) | 17 (16.7%) |
| 45 to 54 Years | 370 (100.0%) | 0 (0.0%) |
| 55 to 64 Years | 252 (96.6%) | 9 (3.5%) |
| 65 to 74 Years | 213 (100.0%) | 0 (0.0%) |
| 75 Years and older | 85 (100.0%) | 0 (0.0%) |
| Total | 1,986 (93.1%) | 146 (6.9%) |
Health Insurance Coverage by Citizenship Status in Pumpkin Center
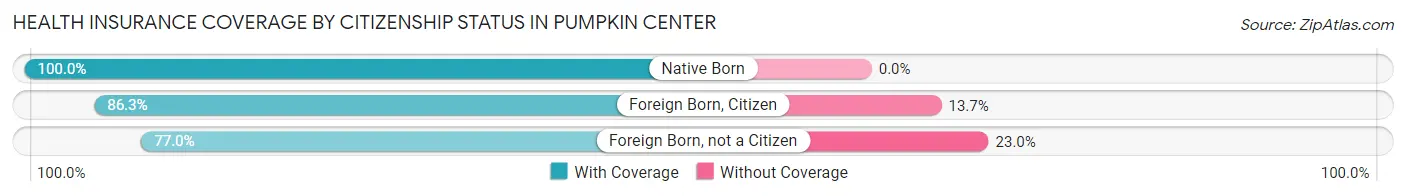
| Citizenship Status | With Coverage | Without Coverage |
| Native Born | 162 (100.0%) | 0 (0.0%) |
| Foreign Born, Citizen | 384 (86.3%) | 61 (13.7%) |
| Foreign Born, not a Citizen | 198 (77.0%) | 59 (23.0%) |
Health Insurance Coverage by Household Income in Pumpkin Center
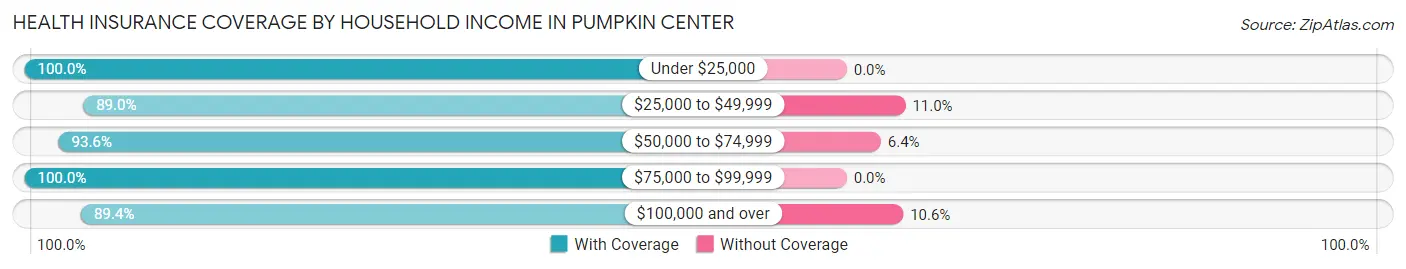
| Household Income | With Coverage | Without Coverage |
| Under $25,000 | 286 (100.0%) | 0 (0.0%) |
| $25,000 to $49,999 | 567 (89.0%) | 70 (11.0%) |
| $50,000 to $74,999 | 543 (93.6%) | 37 (6.4%) |
| $75,000 to $99,999 | 260 (100.0%) | 0 (0.0%) |
| $100,000 and over | 330 (89.4%) | 39 (10.6%) |
Public vs Private Health Insurance Coverage by Age in Pumpkin Center
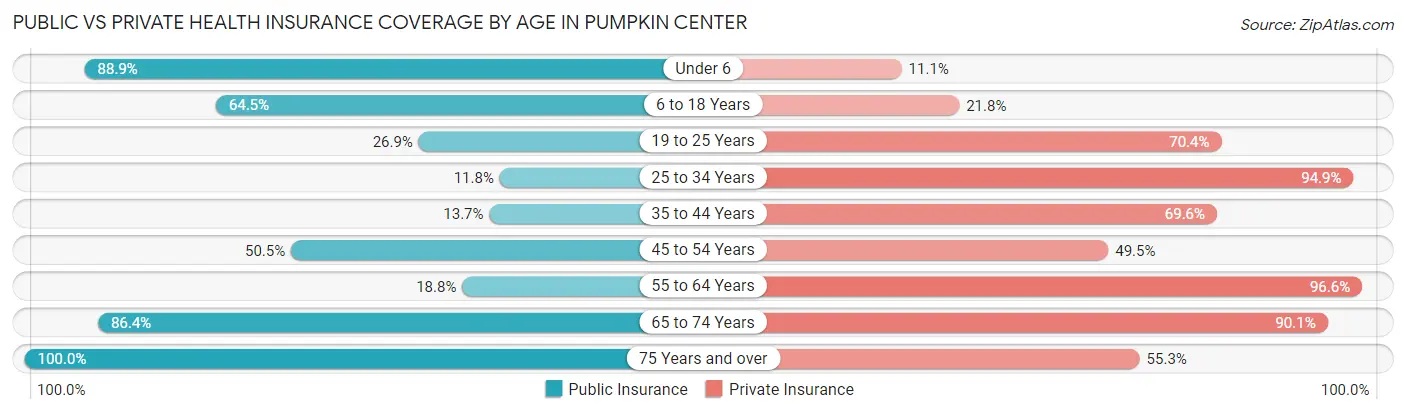
| Age Bracket | Public Insurance | Private Insurance |
| Under 6 | 144 (88.9%) | 18 (11.1%) |
| 6 to 18 Years | 287 (64.5%) | 97 (21.8%) |
| 19 to 25 Years | 69 (26.9%) | 181 (70.4%) |
| 25 to 34 Years | 28 (11.8%) | 225 (94.9%) |
| 35 to 44 Years | 14 (13.7%) | 71 (69.6%) |
| 45 to 54 Years | 187 (50.5%) | 183 (49.5%) |
| 55 to 64 Years | 49 (18.8%) | 252 (96.6%) |
| 65 to 74 Years | 184 (86.4%) | 192 (90.1%) |
| 75 Years and over | 85 (100.0%) | 47 (55.3%) |
| Total | 1,047 (49.1%) | 1,266 (59.4%) |
Disability Status by Sex by Age in Pumpkin Center
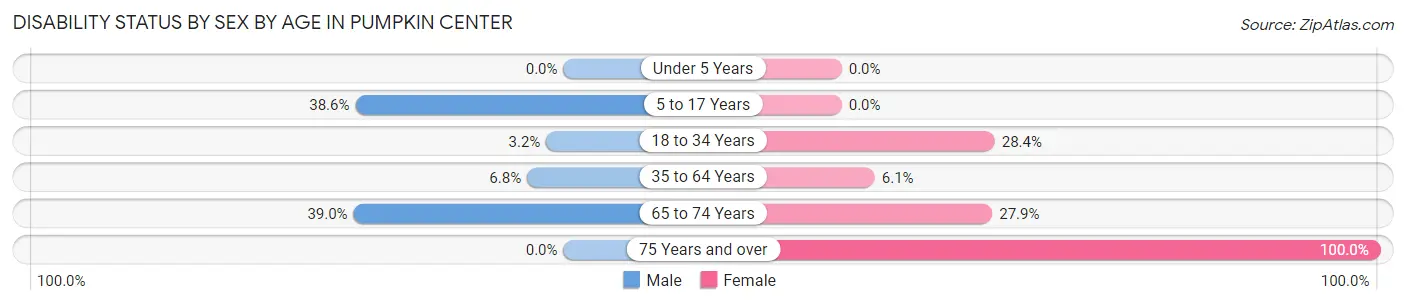
| Age Bracket | Male | Female |
| Under 5 Years | 0 (0.0%) | 0 (0.0%) |
| 5 to 17 Years | 61 (38.6%) | 0 (0.0%) |
| 18 to 34 Years | 8 (3.2%) | 69 (28.4%) |
| 35 to 64 Years | 22 (6.8%) | 25 (6.1%) |
| 65 to 74 Years | 30 (39.0%) | 38 (27.9%) |
| 75 Years and over | 0 (0.0%) | 40 (100.0%) |
Disability Class by Sex by Age in Pumpkin Center
Disability Class: Hearing Difficulty
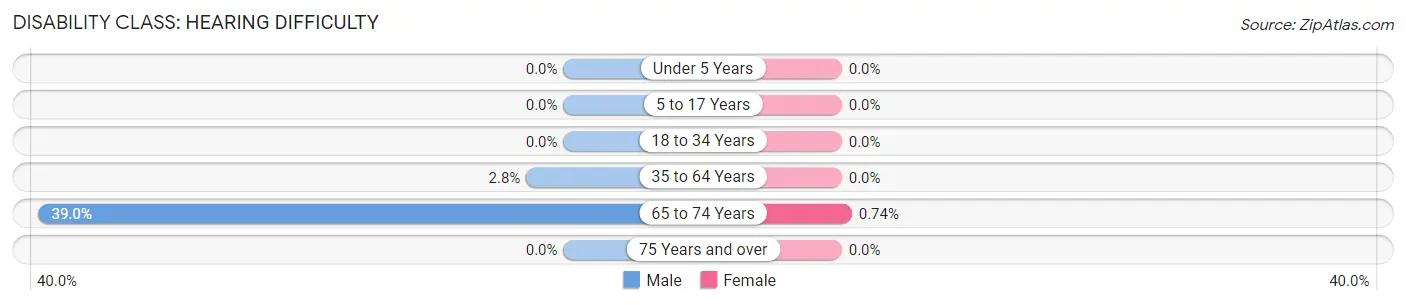
| Age Bracket | Male | Female |
| Under 5 Years | 0 (0.0%) | 0 (0.0%) |
| 5 to 17 Years | 0 (0.0%) | 0 (0.0%) |
| 18 to 34 Years | 0 (0.0%) | 0 (0.0%) |
| 35 to 64 Years | 9 (2.8%) | 0 (0.0%) |
| 65 to 74 Years | 30 (39.0%) | 1 (0.7%) |
| 75 Years and over | 0 (0.0%) | 0 (0.0%) |
Disability Class: Vision Difficulty
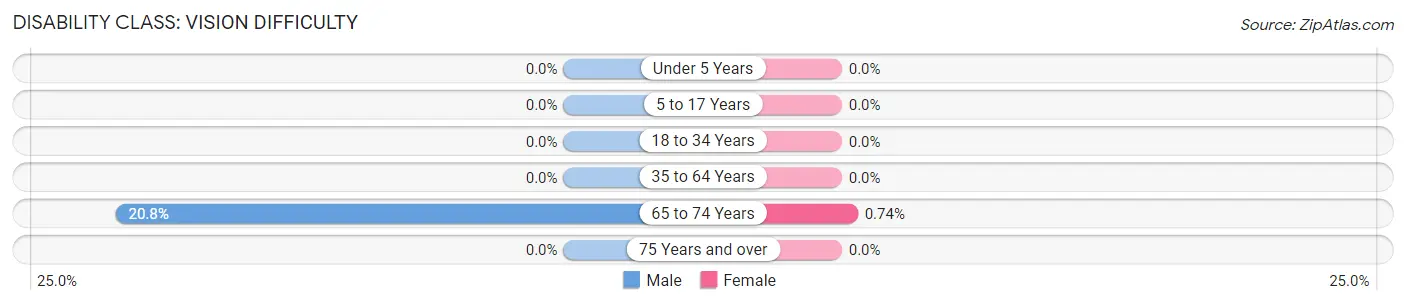
| Age Bracket | Male | Female |
| Under 5 Years | 0 (0.0%) | 0 (0.0%) |
| 5 to 17 Years | 0 (0.0%) | 0 (0.0%) |
| 18 to 34 Years | 0 (0.0%) | 0 (0.0%) |
| 35 to 64 Years | 0 (0.0%) | 0 (0.0%) |
| 65 to 74 Years | 16 (20.8%) | 1 (0.7%) |
| 75 Years and over | 0 (0.0%) | 0 (0.0%) |
Disability Class: Cognitive Difficulty
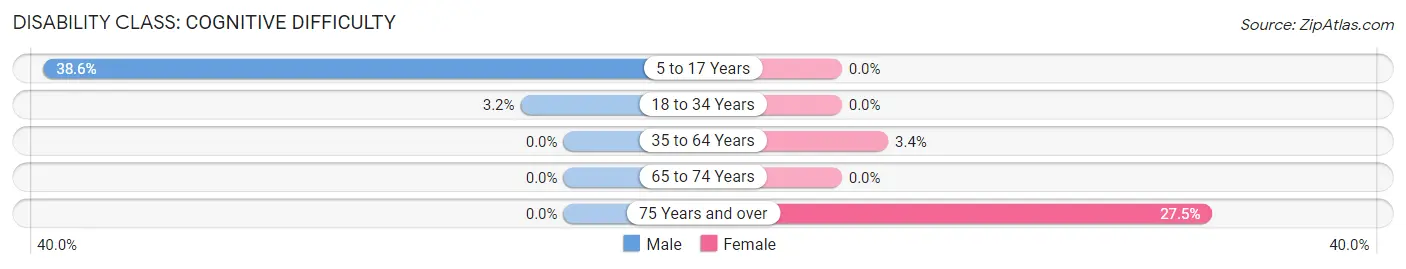
| Age Bracket | Male | Female |
| 5 to 17 Years | 61 (38.6%) | 0 (0.0%) |
| 18 to 34 Years | 8 (3.2%) | 0 (0.0%) |
| 35 to 64 Years | 0 (0.0%) | 14 (3.4%) |
| 65 to 74 Years | 0 (0.0%) | 0 (0.0%) |
| 75 Years and over | 0 (0.0%) | 11 (27.5%) |
Disability Class: Ambulatory Difficulty
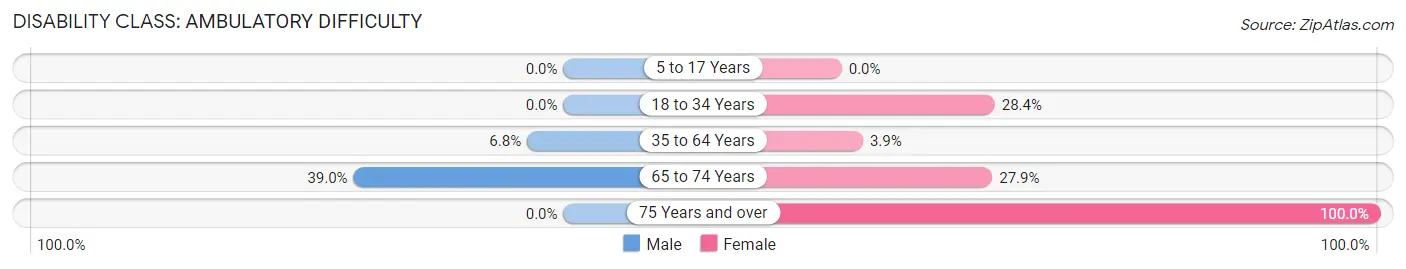
| Age Bracket | Male | Female |
| 5 to 17 Years | 0 (0.0%) | 0 (0.0%) |
| 18 to 34 Years | 0 (0.0%) | 69 (28.4%) |
| 35 to 64 Years | 22 (6.8%) | 16 (3.9%) |
| 65 to 74 Years | 30 (39.0%) | 38 (27.9%) |
| 75 Years and over | 0 (0.0%) | 40 (100.0%) |
Disability Class: Self-Care Difficulty
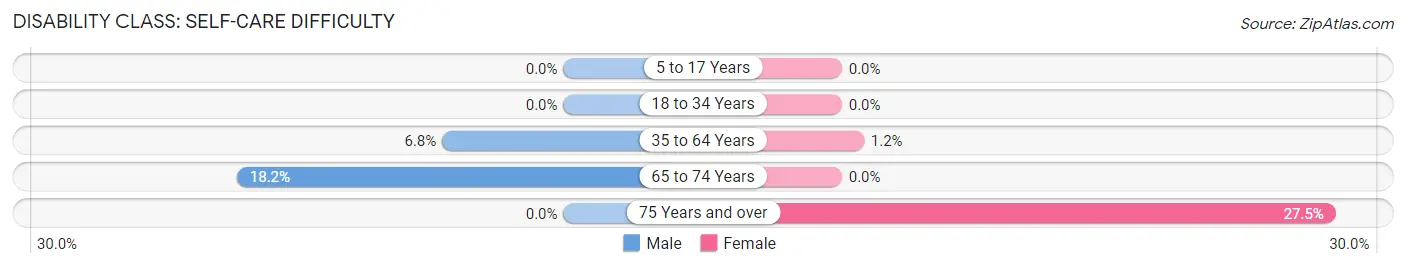
| Age Bracket | Male | Female |
| 5 to 17 Years | 0 (0.0%) | 0 (0.0%) |
| 18 to 34 Years | 0 (0.0%) | 0 (0.0%) |
| 35 to 64 Years | 22 (6.8%) | 5 (1.2%) |
| 65 to 74 Years | 14 (18.2%) | 0 (0.0%) |
| 75 Years and over | 0 (0.0%) | 11 (27.5%) |
Technology Access in Pumpkin Center
Computing Device Access in Pumpkin Center
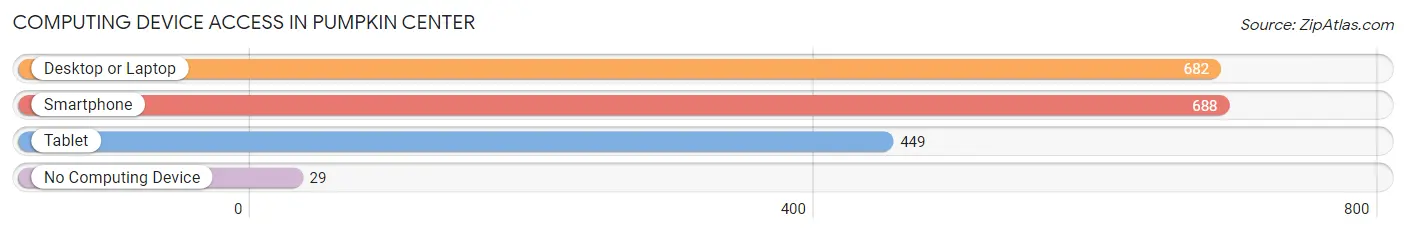
| Device Type | # Households | % Households |
| Desktop or Laptop | 682 | 87.7% |
| Smartphone | 688 | 88.4% |
| Tablet | 449 | 57.7% |
| No Computing Device | 29 | 3.7% |
| Total | 778 | 100.0% |
Internet Access in Pumpkin Center
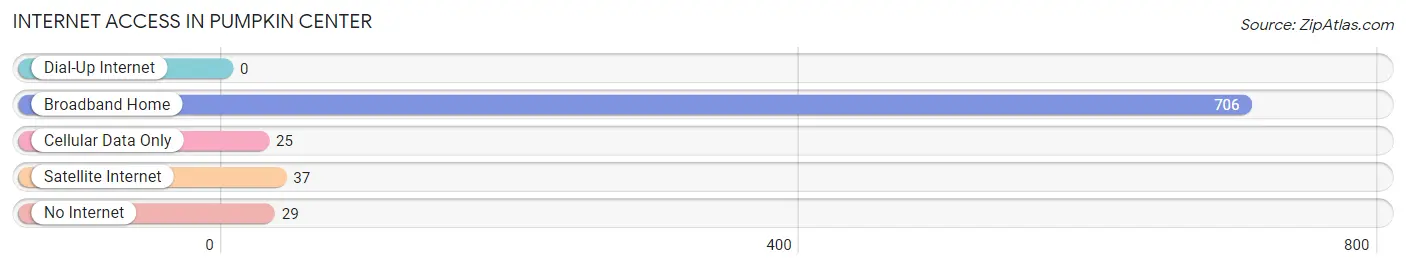
| Internet Type | # Households | % Households |
| Dial-Up Internet | 0 | 0.0% |
| Broadband Home | 706 | 90.7% |
| Cellular Data Only | 25 | 3.2% |
| Satellite Internet | 37 | 4.8% |
| No Internet | 29 | 3.7% |
| Total | 778 | 100.0% |
Pumpkin Center Summary
Pumpkin Center is an unincorporated community located in Catawba County, North Carolina. It is situated in the foothills of the Blue Ridge Mountains, approximately 20 miles northwest of Hickory. The community is named after the nearby Pumpkin Center Baptist Church, which was established in 1845.
History
The area around Pumpkin Center was first settled in the late 1700s by German and Scots-Irish immigrants. The first settlers were primarily farmers, and the area was known for its fertile soil and abundant natural resources. The community was officially established in 1845 when the Pumpkin Center Baptist Church was founded. The church was the center of the community, and it served as a place of worship, education, and social gathering.
In the late 1800s, the community began to grow and develop. The first post office was established in 1887, and the first school was built in 1895. The community also had a general store, a blacksmith shop, and a grist mill.
In the early 1900s, the community began to decline. The population decreased as people moved away in search of better economic opportunities. The post office closed in 1915, and the school closed in the 1930s.
Geography
Pumpkin Center is located in the foothills of the Blue Ridge Mountains in Catawba County, North Carolina. The community is situated on the banks of the Catawba River, approximately 20 miles northwest of Hickory. The terrain is mostly hilly and wooded, with some open fields. The climate is mild, with hot summers and cold winters.
Economy
The economy of Pumpkin Center is largely based on agriculture. The area is known for its fertile soil and abundant natural resources. The primary crops grown in the area are corn, soybeans, and tobacco. The community also has a few small businesses, including a general store, a blacksmith shop, and a grist mill.
Demographics
As of the 2010 census, the population of Pumpkin Center was 1,072. The racial makeup of the community was 97.3% White, 0.9% African American, 0.3% Native American, 0.2% Asian, and 1.3% from other races. The median household income was $37,917, and the median age was 41.7 years.
Conclusion
Pumpkin Center is a small, unincorporated community located in Catawba County, North Carolina. The community was established in 1845 and has a rich history of farming and small business. The economy is largely based on agriculture, and the population is mostly White. Pumpkin Center is a peaceful and picturesque community, and it is a great place to live and raise a family.
Common Questions
What is Per Capita Income in Pumpkin Center?
Per Capita income in Pumpkin Center is $24,474.
What is the Median Family Income in Pumpkin Center?
Median Family Income in Pumpkin Center is $61,486.
What is the Median Household income in Pumpkin Center?
Median Household Income in Pumpkin Center is $60,797.
What is Income or Wage Gap in Pumpkin Center?
Income or Wage Gap in Pumpkin Center is 11.9%.
Women in Pumpkin Center earn 88.1 cents for every dollar earned by a man.
What is Inequality or Gini Index in Pumpkin Center?
Inequality or Gini Index in Pumpkin Center is 0.32.
What is the Total Population of Pumpkin Center?
Total Population of Pumpkin Center is 2,151.
What is the Total Male Population of Pumpkin Center?
Total Male Population of Pumpkin Center is 894.
What is the Total Female Population of Pumpkin Center?
Total Female Population of Pumpkin Center is 1,257.
What is the Ratio of Males per 100 Females in Pumpkin Center?
There are 71.12 Males per 100 Females in Pumpkin Center.
What is the Ratio of Females per 100 Males in Pumpkin Center?
There are 140.60 Females per 100 Males in Pumpkin Center.
What is the Median Population Age in Pumpkin Center?
Median Population Age in Pumpkin Center is 32.8 Years.
What is the Average Family Size in Pumpkin Center
Average Family Size in Pumpkin Center is 3.0 People.
What is the Average Household Size in Pumpkin Center
Average Household Size in Pumpkin Center is 2.8 People.
How Large is the Labor Force in Pumpkin Center?
There are 846 People in the Labor Forcein in Pumpkin Center.
What is the Percentage of People in the Labor Force in Pumpkin Center?
50.8% of People are in the Labor Force in Pumpkin Center.
What is the Unemployment Rate in Pumpkin Center?
Unemployment Rate in Pumpkin Center is 6.4%.