Pine Haven, WY Map & Demographics
Pine Haven Map
Pine Haven Overview
$31,018
PER CAPITA INCOME
$77,625
AVG FAMILY INCOME
$61,000
AVG HOUSEHOLD INCOME
15.2%
WAGE / INCOME GAP [ % ]
84.8¢/ $1
WAGE / INCOME GAP [ $ ]
0.36
INEQUALITY / GINI INDEX
515
TOTAL POPULATION
257
MALE POPULATION
258
FEMALE POPULATION
99.61
MALES / 100 FEMALES
100.39
FEMALES / 100 MALES
53.2
MEDIAN AGE
3.3
AVG FAMILY SIZE
2.8
AVG HOUSEHOLD SIZE
188
LABOR FORCE [ PEOPLE ]
48.0%
PERCENT IN LABOR FORCE
1.6%
UNEMPLOYMENT RATE
Pine Haven Area Codes
Income in Pine Haven
Income Overview in Pine Haven
Per Capita Income in Pine Haven is $31,018, while median incomes of families and households are $77,625 and $61,000 respectively.
| Characteristic | Number | Measure |
| Per Capita Income | 515 | $31,018 |
| Median Family Income | 137 | $77,625 |
| Mean Family Income | 137 | $87,013 |
| Median Household Income | 186 | $61,000 |
| Mean Household Income | 186 | $81,070 |
| Income Deficit | 137 | $0 |
| Wage / Income Gap (%) | 515 | 15.19% |
| Wage / Income Gap ($) | 515 | 84.81¢ per $1 |
| Gini / Inequality Index | 515 | 0.36 |
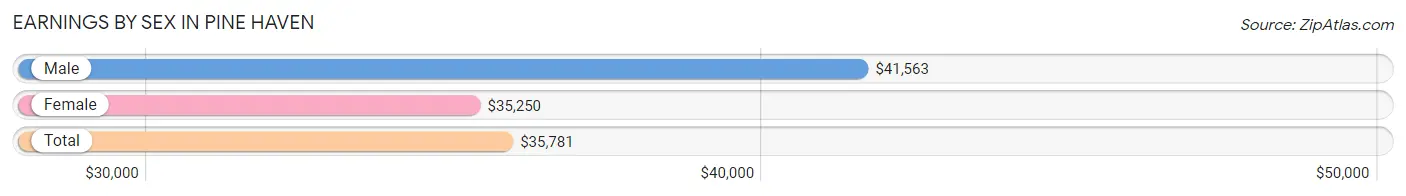
Earnings by Sex in Pine Haven
Average Earnings in Pine Haven are $35,781, $41,563 for men and $35,250 for women, a difference of 15.2%.
| Sex | Number | Average Earnings |
| Male | 127 (62.3%) | $41,563 |
| Female | 77 (37.8%) | $35,250 |
| Total | 204 (100.0%) | $35,781 |
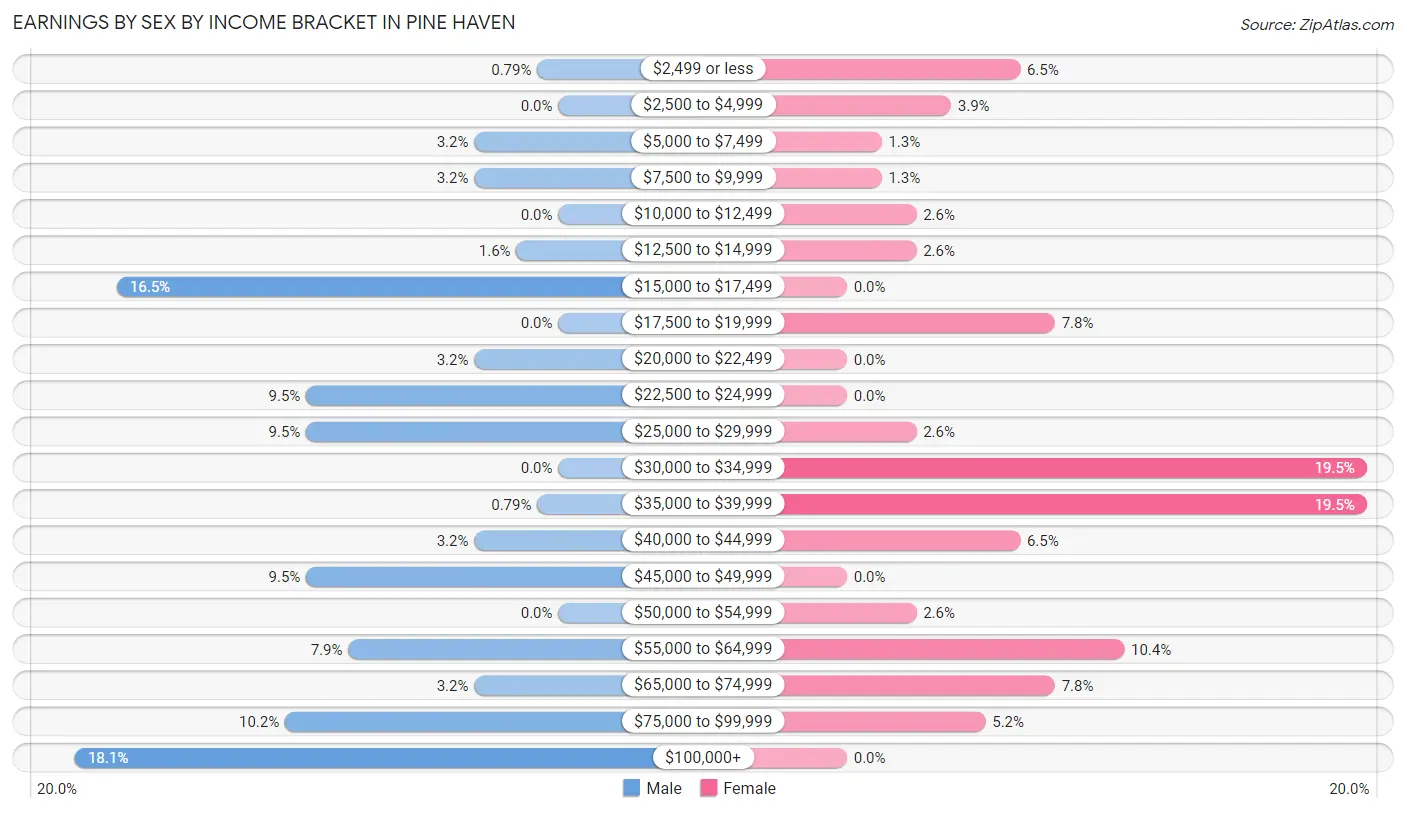
Earnings by Sex by Income Bracket in Pine Haven
The most common earnings brackets in Pine Haven are $100,000+ for men (23 | 18.1%) and $30,000 to $34,999 for women (15 | 19.5%).
| Income | Male | Female |
| $2,499 or less | 1 (0.8%) | 5 (6.5%) |
| $2,500 to $4,999 | 0 (0.0%) | 3 (3.9%) |
| $5,000 to $7,499 | 4 (3.2%) | 1 (1.3%) |
| $7,500 to $9,999 | 4 (3.2%) | 1 (1.3%) |
| $10,000 to $12,499 | 0 (0.0%) | 2 (2.6%) |
| $12,500 to $14,999 | 2 (1.6%) | 2 (2.6%) |
| $15,000 to $17,499 | 21 (16.5%) | 0 (0.0%) |
| $17,500 to $19,999 | 0 (0.0%) | 6 (7.8%) |
| $20,000 to $22,499 | 4 (3.2%) | 0 (0.0%) |
| $22,500 to $24,999 | 12 (9.5%) | 0 (0.0%) |
| $25,000 to $29,999 | 12 (9.5%) | 2 (2.6%) |
| $30,000 to $34,999 | 0 (0.0%) | 15 (19.5%) |
| $35,000 to $39,999 | 1 (0.8%) | 15 (19.5%) |
| $40,000 to $44,999 | 4 (3.2%) | 5 (6.5%) |
| $45,000 to $49,999 | 12 (9.5%) | 0 (0.0%) |
| $50,000 to $54,999 | 0 (0.0%) | 2 (2.6%) |
| $55,000 to $64,999 | 10 (7.9%) | 8 (10.4%) |
| $65,000 to $74,999 | 4 (3.2%) | 6 (7.8%) |
| $75,000 to $99,999 | 13 (10.2%) | 4 (5.2%) |
| $100,000+ | 23 (18.1%) | 0 (0.0%) |
| Total | 127 (100.0%) | 77 (100.0%) |
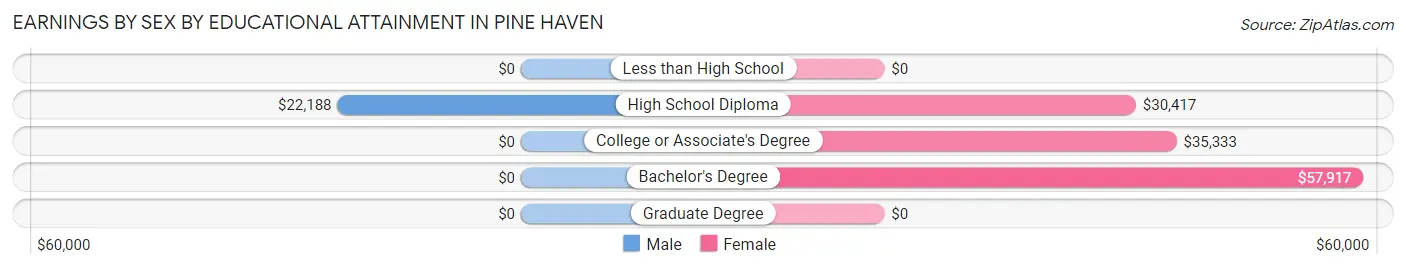
Earnings by Sex by Educational Attainment in Pine Haven
Average earnings in Pine Haven are $48,375 for men and $35,667 for women, a difference of 26.3%. Men with an educational attainment of high school diploma enjoy the highest average annual earnings of $22,188, while those with high school diploma education earn the least with $22,188. Women with an educational attainment of bachelor's degree earn the most with the average annual earnings of $57,917, while those with high school diploma education have the smallest earnings of $30,417.
| Educational Attainment | Male Income | Female Income |
| Less than High School | - | - |
| High School Diploma | $22,188 | $30,417 |
| College or Associate's Degree | - | - |
| Bachelor's Degree | - | - |
| Graduate Degree | - | - |
| Total | $48,375 | $35,667 |
Family Income in Pine Haven
Family Income Brackets in Pine Haven
According to the Pine Haven family income data, there are 33 families falling into the $50,000 to $74,999 income range, which is the most common income bracket and makes up 24.1% of all families.
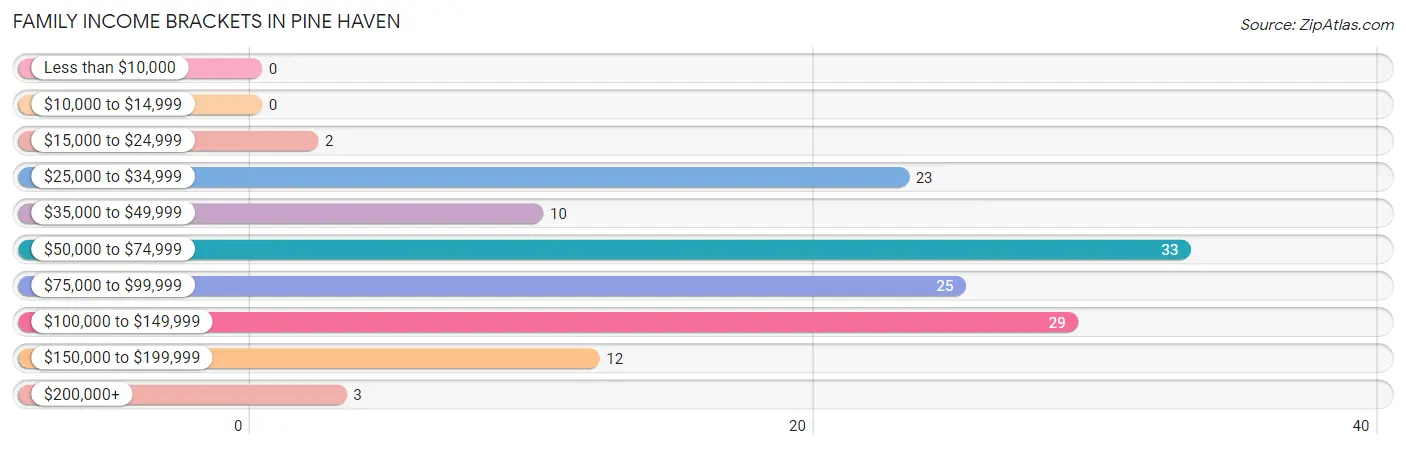
| Income Bracket | # Families | % Families |
| Less than $10,000 | 0 | 0.0% |
| $10,000 to $14,999 | 0 | 0.0% |
| $15,000 to $24,999 | 2 | 1.5% |
| $25,000 to $34,999 | 23 | 16.8% |
| $35,000 to $49,999 | 10 | 7.3% |
| $50,000 to $74,999 | 33 | 24.1% |
| $75,000 to $99,999 | 25 | 18.2% |
| $100,000 to $149,999 | 29 | 21.2% |
| $150,000 to $199,999 | 12 | 8.8% |
| $200,000+ | 3 | 2.2% |
Family Income by Famaliy Size in Pine Haven
5-person families (11 | 8.0%) account for the highest median family income in Pine Haven with $158,036 per family, while 5-person families (11 | 8.0%) have the highest median income of $31,607 per family member.
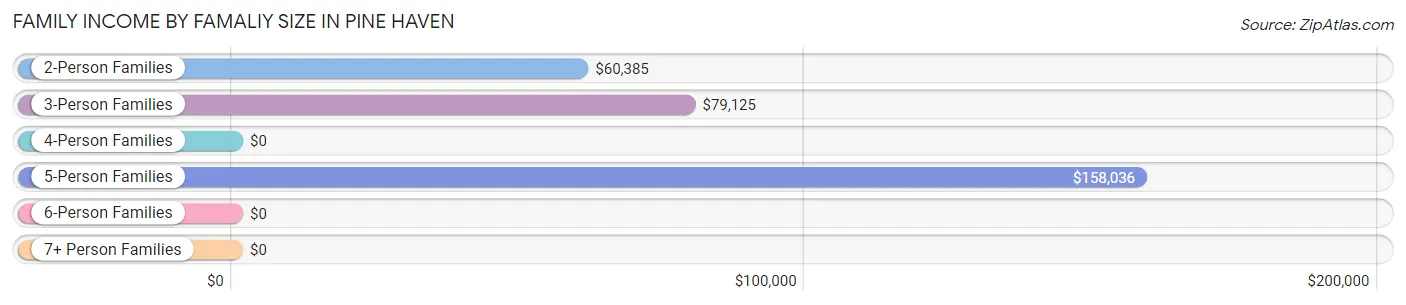
| Income Bracket | # Families | Median Income |
| 2-Person Families | 102 (74.5%) | $60,385 |
| 3-Person Families | 17 (12.4%) | $79,125 |
| 4-Person Families | 2 (1.5%) | $0 |
| 5-Person Families | 11 (8.0%) | $158,036 |
| 6-Person Families | 2 (1.5%) | $0 |
| 7+ Person Families | 3 (2.2%) | $0 |
| Total | 137 (100.0%) | $77,625 |
Family Income by Number of Earners in Pine Haven
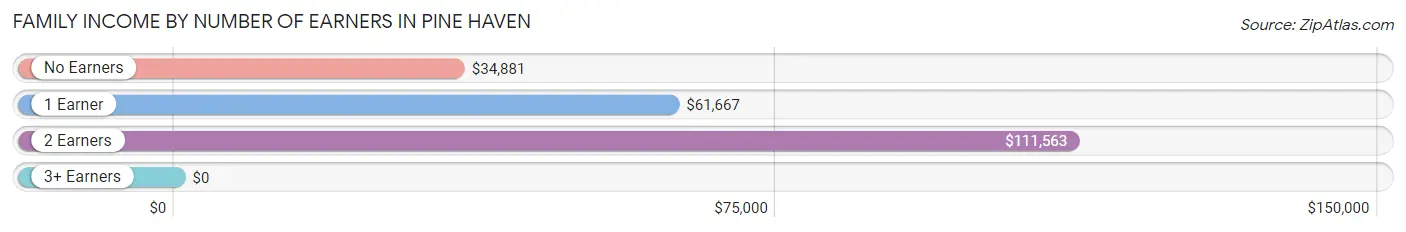
| Number of Earners | # Families | Median Income |
| No Earners | 44 (32.1%) | $34,881 |
| 1 Earner | 42 (30.7%) | $61,667 |
| 2 Earners | 47 (34.3%) | $111,563 |
| 3+ Earners | 4 (2.9%) | $0 |
| Total | 137 (100.0%) | $77,625 |
Household Income in Pine Haven
Household Income Brackets in Pine Haven
With 42 households falling in the category, the $100,000 to $149,999 income range is the most frequent in Pine Haven, accounting for 22.6% of all households.
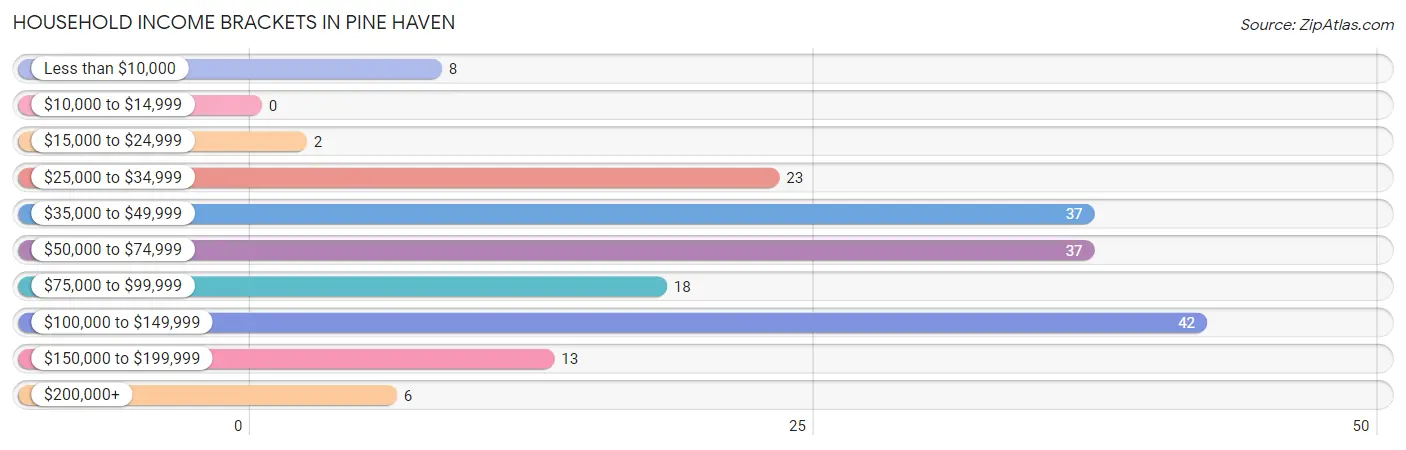
| Income Bracket | # Households | % Households |
| Less than $10,000 | 8 | 4.3% |
| $10,000 to $14,999 | 0 | 0.0% |
| $15,000 to $24,999 | 2 | 1.1% |
| $25,000 to $34,999 | 23 | 12.4% |
| $35,000 to $49,999 | 37 | 19.9% |
| $50,000 to $74,999 | 37 | 19.9% |
| $75,000 to $99,999 | 18 | 9.7% |
| $100,000 to $149,999 | 42 | 22.6% |
| $150,000 to $199,999 | 13 | 7.0% |
| $200,000+ | 6 | 3.2% |
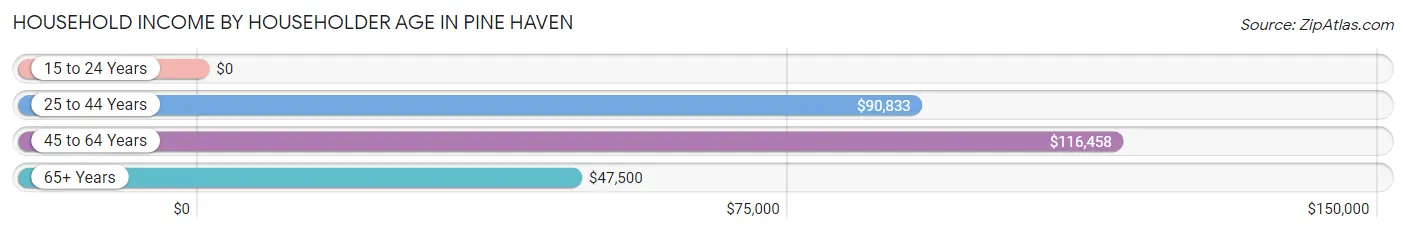
Household Income by Householder Age in Pine Haven
The median household income in Pine Haven is $61,000, with the highest median household income of $116,458 found in the 45 to 64 years age bracket for the primary householder. A total of 62 households (33.3%) fall into this category. Meanwhile, the 15 to 24 years age bracket for the primary householder has the lowest median household income of $0, with 2 households (1.1%) in this group.
| Income Bracket | # Households | Median Income |
| 15 to 24 Years | 2 (1.1%) | $0 |
| 25 to 44 Years | 28 (15.0%) | $90,833 |
| 45 to 64 Years | 62 (33.3%) | $116,458 |
| 65+ Years | 94 (50.5%) | $47,500 |
| Total | 186 (100.0%) | $61,000 |
Poverty in Pine Haven
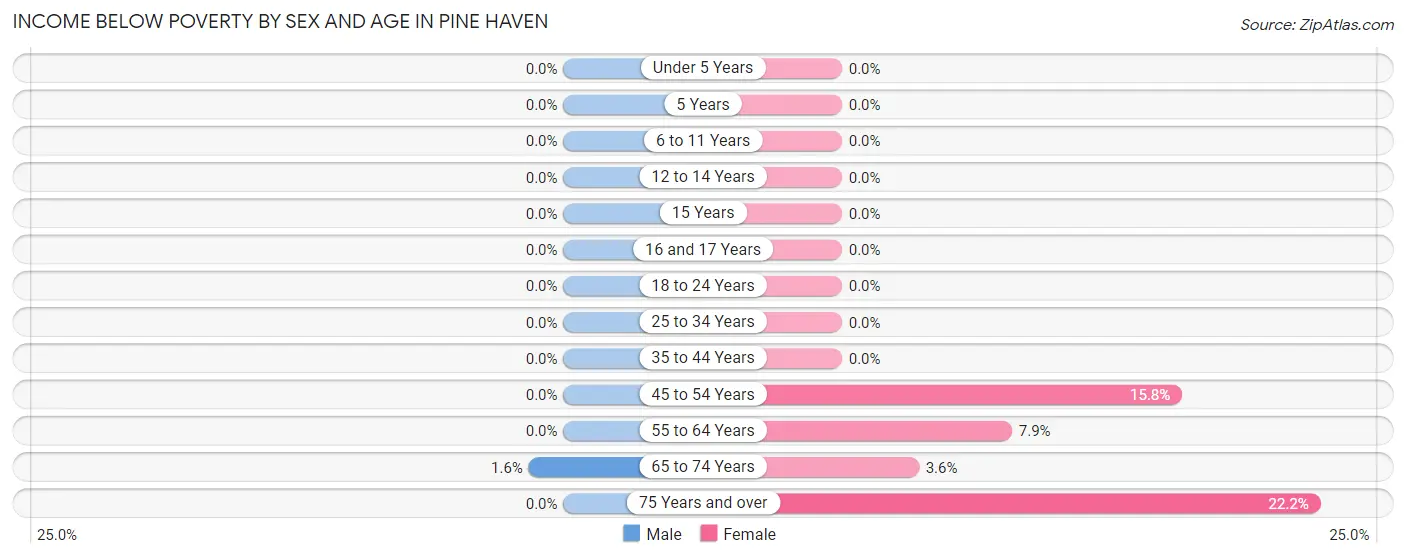
Income Below Poverty by Sex and Age in Pine Haven
With 0.4% poverty level for males and 3.9% for females among the residents of Pine Haven, 65 to 74 year old males and 75 year old and over females are the most vulnerable to poverty, with 1 males (1.6%) and 2 females (22.2%) in their respective age groups living below the poverty level.
| Age Bracket | Male | Female |
| Under 5 Years | 0 (0.0%) | 0 (0.0%) |
| 5 Years | 0 (0.0%) | 0 (0.0%) |
| 6 to 11 Years | 0 (0.0%) | 0 (0.0%) |
| 12 to 14 Years | 0 (0.0%) | 0 (0.0%) |
| 15 Years | 0 (0.0%) | 0 (0.0%) |
| 16 and 17 Years | 0 (0.0%) | 0 (0.0%) |
| 18 to 24 Years | 0 (0.0%) | 0 (0.0%) |
| 25 to 34 Years | 0 (0.0%) | 0 (0.0%) |
| 35 to 44 Years | 0 (0.0%) | 0 (0.0%) |
| 45 to 54 Years | 0 (0.0%) | 3 (15.8%) |
| 55 to 64 Years | 0 (0.0%) | 3 (7.9%) |
| 65 to 74 Years | 1 (1.6%) | 2 (3.6%) |
| 75 Years and over | 0 (0.0%) | 2 (22.2%) |
| Total | 1 (0.4%) | 10 (3.9%) |
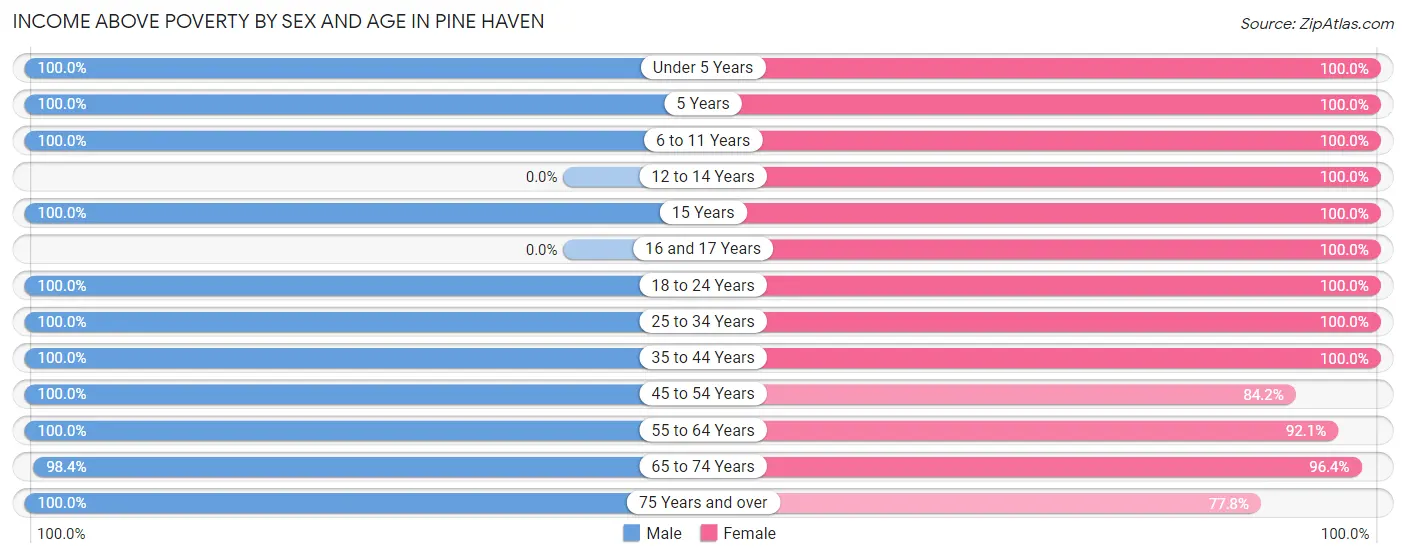
Income Above Poverty by Sex and Age in Pine Haven
According to the poverty statistics in Pine Haven, males aged under 5 years and females aged under 5 years are the age groups that are most secure financially, with 100.0% of males and 100.0% of females in these age groups living above the poverty line.
| Age Bracket | Male | Female |
| Under 5 Years | 7 (100.0%) | 20 (100.0%) |
| 5 Years | 2 (100.0%) | 37 (100.0%) |
| 6 to 11 Years | 28 (100.0%) | 20 (100.0%) |
| 12 to 14 Years | 0 (0.0%) | 3 (100.0%) |
| 15 Years | 1 (100.0%) | 5 (100.0%) |
| 16 and 17 Years | 0 (0.0%) | 3 (100.0%) |
| 18 to 24 Years | 16 (100.0%) | 2 (100.0%) |
| 25 to 34 Years | 23 (100.0%) | 31 (100.0%) |
| 35 to 44 Years | 13 (100.0%) | 15 (100.0%) |
| 45 to 54 Years | 29 (100.0%) | 16 (84.2%) |
| 55 to 64 Years | 21 (100.0%) | 35 (92.1%) |
| 65 to 74 Years | 61 (98.4%) | 54 (96.4%) |
| 75 Years and over | 55 (100.0%) | 7 (77.8%) |
| Total | 256 (99.6%) | 248 (96.1%) |
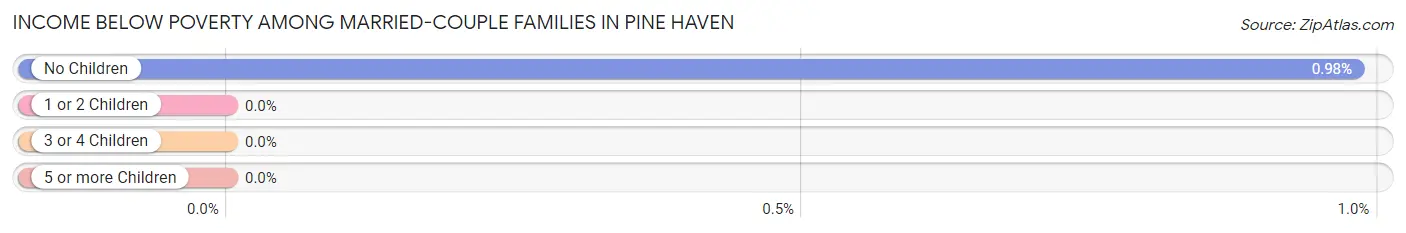
Income Below Poverty Among Married-Couple Families in Pine Haven
The poverty statistics for married-couple families in Pine Haven show that 0.8% or 1 of the total 124 families live below the poverty line. Families with no children have the highest poverty rate of 1.0%, comprising of 1 families. On the other hand, families with 1 or 2 children have the lowest poverty rate of 0.0%, which includes 0 families.
| Children | Above Poverty | Below Poverty |
| No Children | 101 (99.0%) | 1 (1.0%) |
| 1 or 2 Children | 9 (100.0%) | 0 (0.0%) |
| 3 or 4 Children | 10 (100.0%) | 0 (0.0%) |
| 5 or more Children | 3 (100.0%) | 0 (0.0%) |
| Total | 123 (99.2%) | 1 (0.8%) |
Income Below Poverty Among Single-Parent Households in Pine Haven
| Children | Single Father | Single Mother |
| No Children | 0 (0.0%) | 0 (0.0%) |
| 1 or 2 Children | 0 (0.0%) | 0 (0.0%) |
| 3 or 4 Children | 0 (0.0%) | 0 (0.0%) |
| 5 or more Children | 0 (0.0%) | 0 (0.0%) |
| Total | 0 (0.0%) | 0 (0.0%) |
Income Below Poverty Among Married-Couple vs Single-Parent Households in Pine Haven
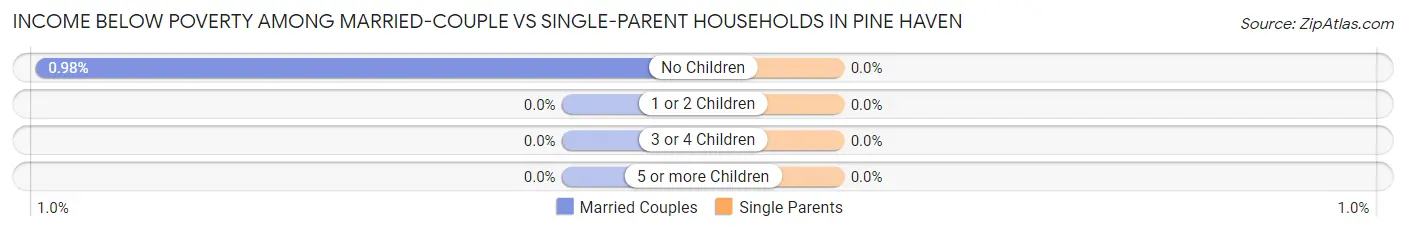
| Children | Married-Couple Families | Single-Parent Households |
| No Children | 1 (1.0%) | 0 (0.0%) |
| 1 or 2 Children | 0 (0.0%) | 0 (0.0%) |
| 3 or 4 Children | 0 (0.0%) | 0 (0.0%) |
| 5 or more Children | 0 (0.0%) | 0 (0.0%) |
| Total | 1 (0.8%) | 0 (0.0%) |
Race in Pine Haven
The most populous races in Pine Haven are White / Caucasian (487 | 94.6%), Hispanic or Latino (35 | 6.8%), and Two or more Races (15 | 2.9%).
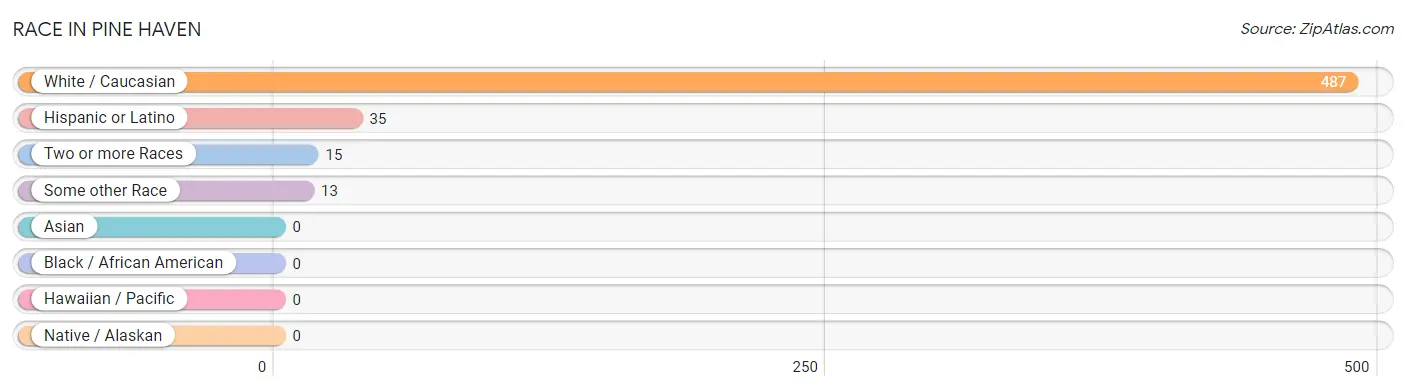
| Race | # Population | % Population |
| Asian | 0 | 0.0% |
| Black / African American | 0 | 0.0% |
| Hawaiian / Pacific | 0 | 0.0% |
| Hispanic or Latino | 35 | 6.8% |
| Native / Alaskan | 0 | 0.0% |
| White / Caucasian | 487 | 94.6% |
| Two or more Races | 15 | 2.9% |
| Some other Race | 13 | 2.5% |
| Total | 515 | 100.0% |
Ancestry in Pine Haven
The most populous ancestries reported in Pine Haven are German (152 | 29.5%), Irish (124 | 24.1%), Norwegian (52 | 10.1%), English (46 | 8.9%), and Swedish (19 | 3.7%), together accounting for 76.3% of all Pine Haven residents.
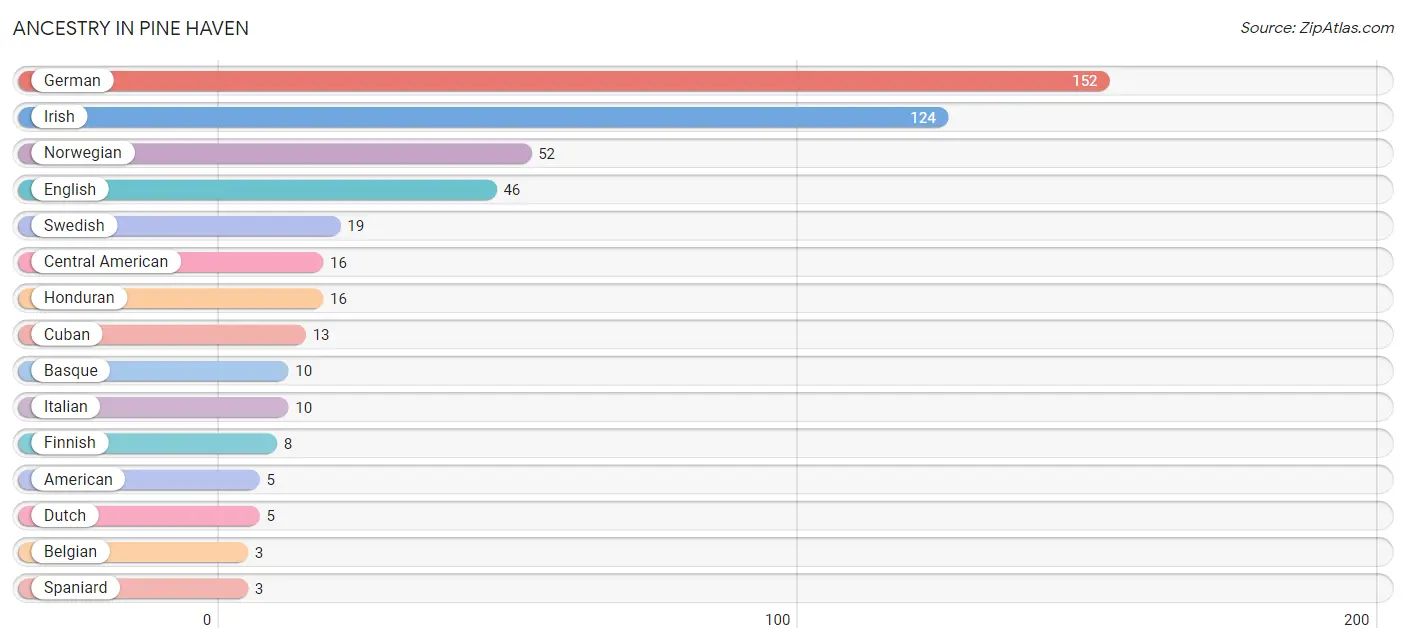
| Ancestry | # Population | % Population |
| American | 5 | 1.0% |
| Apache | 1 | 0.2% |
| Basque | 10 | 1.9% |
| Belgian | 3 | 0.6% |
| Blackfeet | 2 | 0.4% |
| Central American | 16 | 3.1% |
| Croatian | 2 | 0.4% |
| Cuban | 13 | 2.5% |
| Czech | 2 | 0.4% |
| Dutch | 5 | 1.0% |
| English | 46 | 8.9% |
| Finnish | 8 | 1.5% |
| French | 1 | 0.2% |
| German | 152 | 29.5% |
| Greek | 2 | 0.4% |
| Honduran | 16 | 3.1% |
| Irish | 124 | 24.1% |
| Italian | 10 | 1.9% |
| Mexican | 1 | 0.2% |
| Norwegian | 52 | 10.1% |
| Polish | 1 | 0.2% |
| Scandinavian | 1 | 0.2% |
| Scottish | 2 | 0.4% |
| Spaniard | 3 | 0.6% |
| Swedish | 19 | 3.7% |
| Ukrainian | 1 | 0.2% | View All 26 Rows |
Immigrants in Pine Haven

| Immigration Origin | # Population | % Population | View All 0 Rows |
Sex and Age in Pine Haven
Sex and Age in Pine Haven
The most populous age groups in Pine Haven are 70 to 74 Years (47 | 18.3%) for men and 5 to 9 Years (55 | 21.3%) for women.
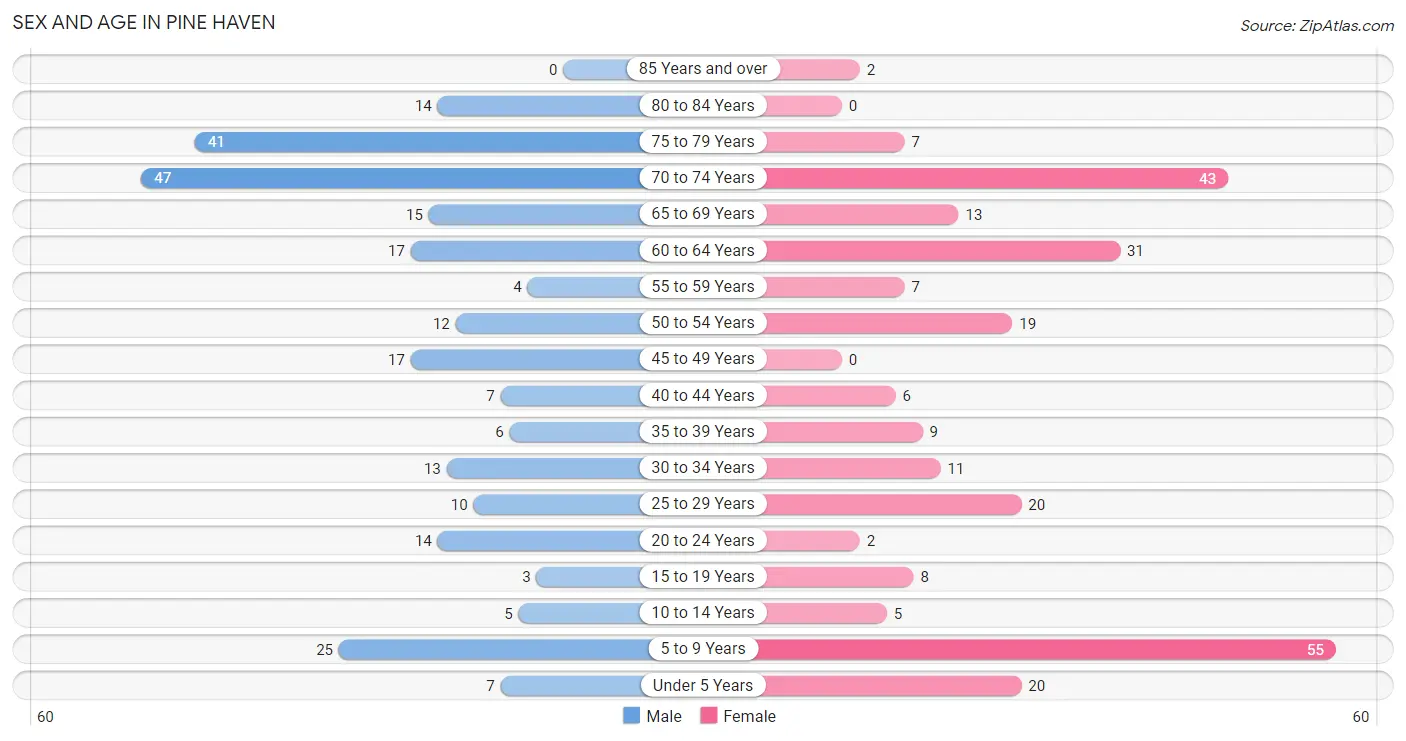
| Age Bracket | Male | Female |
| Under 5 Years | 7 (2.7%) | 20 (7.7%) |
| 5 to 9 Years | 25 (9.7%) | 55 (21.3%) |
| 10 to 14 Years | 5 (1.9%) | 5 (1.9%) |
| 15 to 19 Years | 3 (1.2%) | 8 (3.1%) |
| 20 to 24 Years | 14 (5.4%) | 2 (0.8%) |
| 25 to 29 Years | 10 (3.9%) | 20 (7.7%) |
| 30 to 34 Years | 13 (5.1%) | 11 (4.3%) |
| 35 to 39 Years | 6 (2.3%) | 9 (3.5%) |
| 40 to 44 Years | 7 (2.7%) | 6 (2.3%) |
| 45 to 49 Years | 17 (6.6%) | 0 (0.0%) |
| 50 to 54 Years | 12 (4.7%) | 19 (7.4%) |
| 55 to 59 Years | 4 (1.6%) | 7 (2.7%) |
| 60 to 64 Years | 17 (6.6%) | 31 (12.0%) |
| 65 to 69 Years | 15 (5.8%) | 13 (5.0%) |
| 70 to 74 Years | 47 (18.3%) | 43 (16.7%) |
| 75 to 79 Years | 41 (16.0%) | 7 (2.7%) |
| 80 to 84 Years | 14 (5.4%) | 0 (0.0%) |
| 85 Years and over | 0 (0.0%) | 2 (0.8%) |
| Total | 257 (100.0%) | 258 (100.0%) |
Families and Households in Pine Haven
Median Family Size in Pine Haven
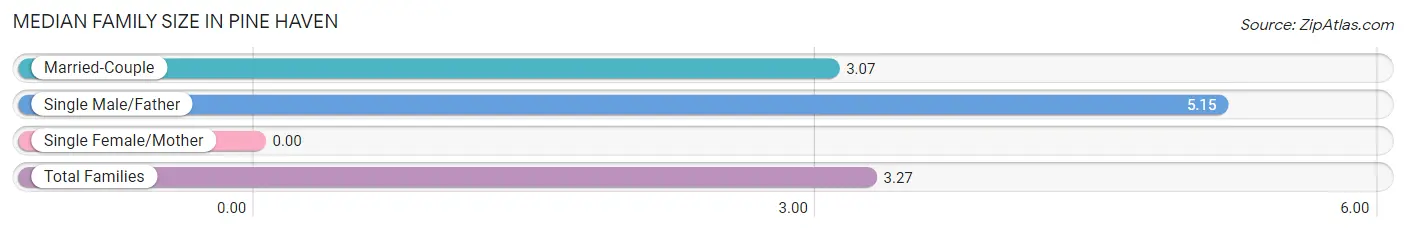
| Family Type | # Families | Family Size |
| Married-Couple | 124 (90.5%) | 3.07 |
| Single Male/Father | 13 (9.5%) | 5.15 |
| Single Female/Mother | 0 (0.0%) | - |
| Total Families | 137 (100.0%) | 3.27 |
Median Household Size in Pine Haven
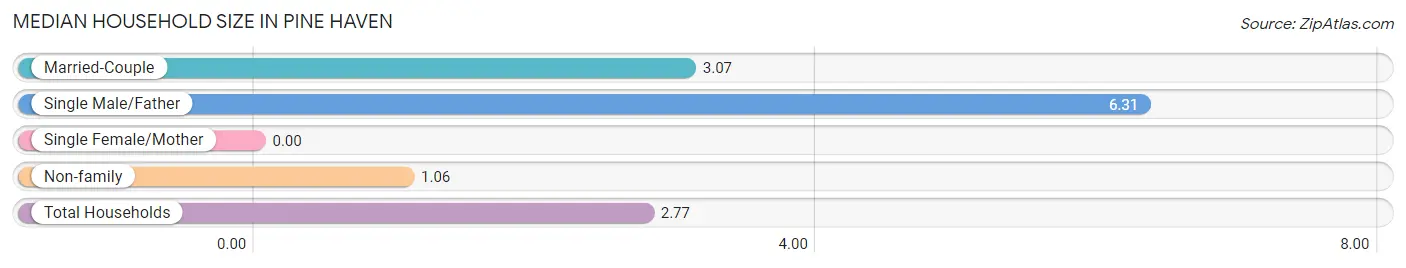
| Household Type | # Households | Household Size |
| Married-Couple | 124 (66.7%) | 3.07 |
| Single Male/Father | 13 (7.0%) | 6.31 |
| Single Female/Mother | 0 (0.0%) | - |
| Non-family | 49 (26.3%) | 1.06 |
| Total Households | 186 (100.0%) | 2.77 |
Household Size by Marriage Status in Pine Haven
Out of a total of 186 households in Pine Haven, 137 (73.7%) are family households, while 49 (26.3%) are nonfamily households. The most numerous type of family households are 2-person households, comprising 102, and the most common type of nonfamily households are 1-person households, comprising 47.
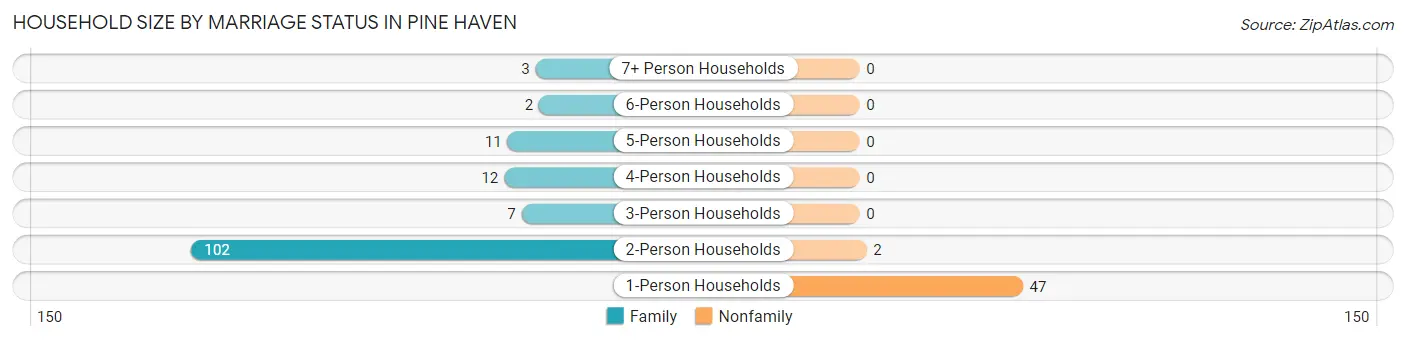
| Household Size | Family Households | Nonfamily Households |
| 1-Person Households | - | 47 (25.3%) |
| 2-Person Households | 102 (54.8%) | 2 (1.1%) |
| 3-Person Households | 7 (3.8%) | 0 (0.0%) |
| 4-Person Households | 12 (6.5%) | 0 (0.0%) |
| 5-Person Households | 11 (5.9%) | 0 (0.0%) |
| 6-Person Households | 2 (1.1%) | 0 (0.0%) |
| 7+ Person Households | 3 (1.6%) | 0 (0.0%) |
| Total | 137 (73.7%) | 49 (26.3%) |
Female Fertility in Pine Haven
Fertility by Age in Pine Haven
Average fertility rate in Pine Haven is 271.0 births per 1,000 women. Women in the age bracket of 20 to 34 years have the highest fertility rate with 485.0 births per 1,000 women. Women in the age bracket of 20 to 34 years acount for 100.0% of all women with births.
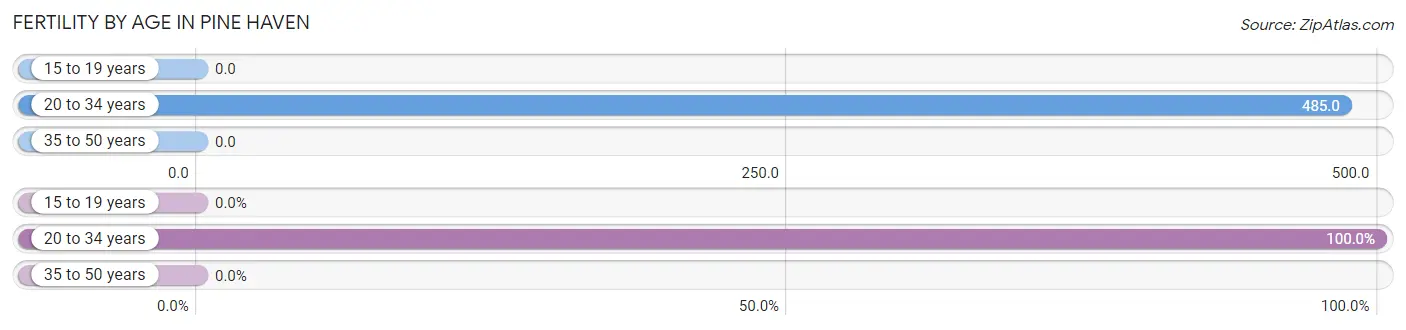
| Age Bracket | Women with Births | Births / 1,000 Women |
| 15 to 19 years | 0 (0.0%) | 0.0 |
| 20 to 34 years | 16 (100.0%) | 485.0 |
| 35 to 50 years | 0 (0.0%) | 0.0 |
| Total | 16 (100.0%) | 271.0 |
Fertility by Age by Marriage Status in Pine Haven
6.2% of women with births (16) in Pine Haven are married. The highest percentage of unmarried women with births falls into 20 to 34 years age bracket with 93.8% of them unmarried at the time of birth, while the lowest percentage of unmarried women with births belong to 20 to 34 years age bracket with 93.8% of them unmarried.
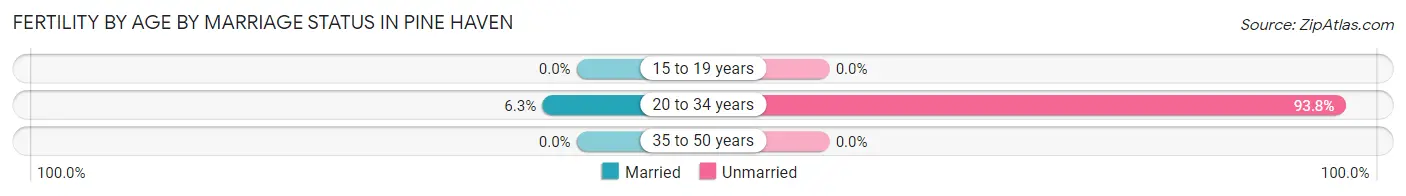
| Age Bracket | Married | Unmarried |
| 15 to 19 years | 0 (0.0%) | 0 (0.0%) |
| 20 to 34 years | 1 (6.2%) | 15 (93.8%) |
| 35 to 50 years | 0 (0.0%) | 0 (0.0%) |
| Total | 1 (6.2%) | 15 (93.8%) |
Fertility by Education in Pine Haven
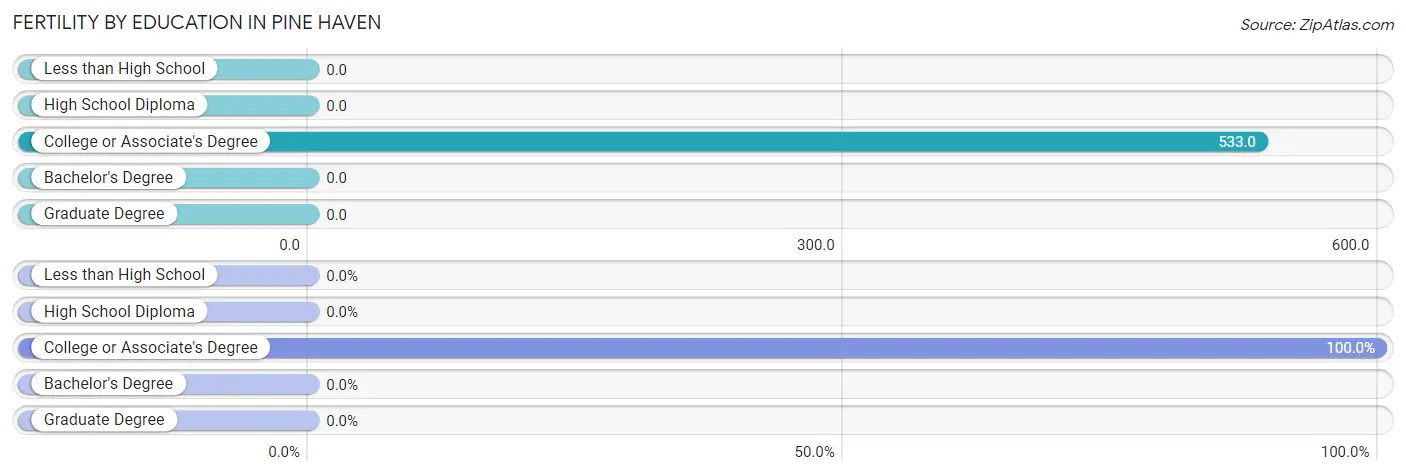
| Educational Attainment | Women with Births | Births / 1,000 Women |
| Less than High School | 0 (0.0%) | 0.0 |
| High School Diploma | 0 (0.0%) | 0.0 |
| College or Associate's Degree | 16 (100.0%) | 533.0 |
| Bachelor's Degree | 0 (0.0%) | 0.0 |
| Graduate Degree | 0 (0.0%) | 0.0 |
| Total | 16 (100.0%) | 271.0 |
Fertility by Education by Marriage Status in Pine Haven
93.8% of women with births in Pine Haven are unmarried. Women with the educational attainment of college or associate's degree are most likely to be married with 6.2% of them married at childbirth, while women with the educational attainment of college or associate's degree are least likely to be married with 93.8% of them unmarried at childbirth.
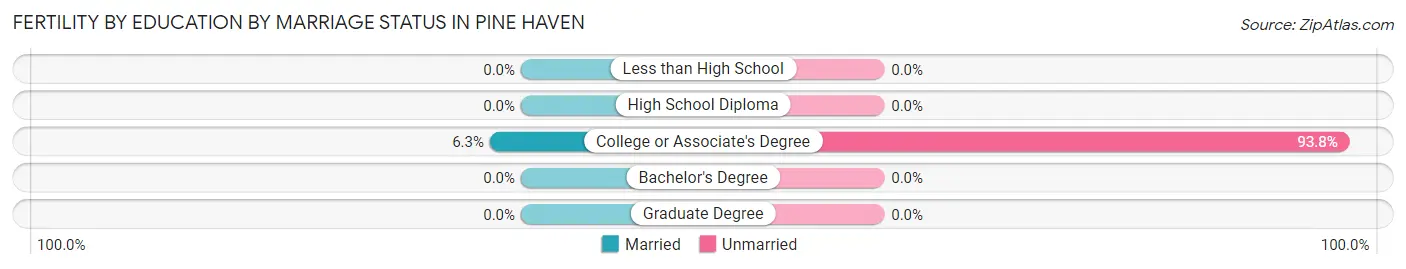
| Educational Attainment | Married | Unmarried |
| Less than High School | 0 (0.0%) | 0 (0.0%) |
| High School Diploma | 0 (0.0%) | 0 (0.0%) |
| College or Associate's Degree | 1 (6.2%) | 15 (93.8%) |
| Bachelor's Degree | 0 (0.0%) | 0 (0.0%) |
| Graduate Degree | 0 (0.0%) | 0 (0.0%) |
| Total | 1 (6.2%) | 15 (93.8%) |
Employment Characteristics in Pine Haven
Employment by Class of Employer in Pine Haven
Among the 179 employed individuals in Pine Haven, private company employees (140 | 78.2%), self-employed (incorporated) (14 | 7.8%), and not-for-profit organizations (9 | 5.0%) make up the most common classes of employment.
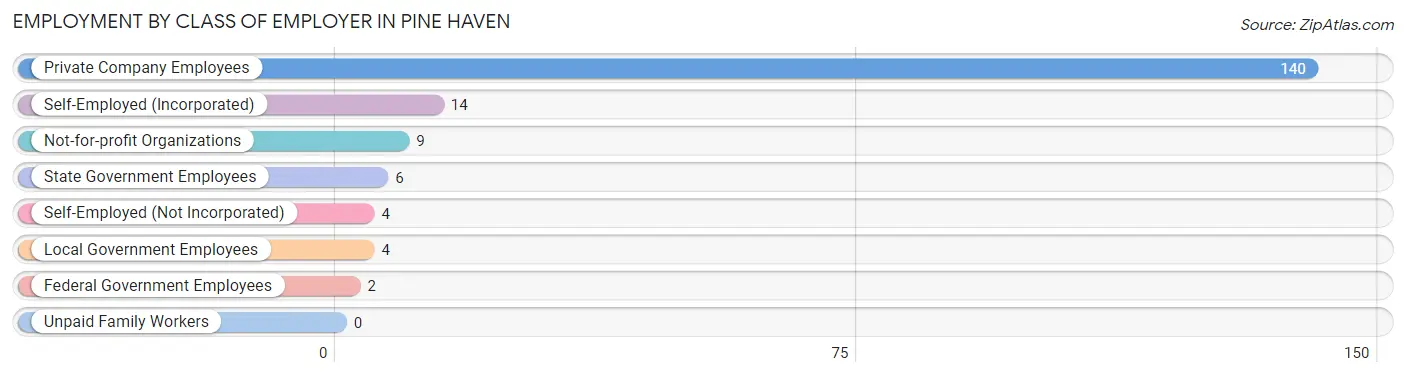
| Employer Class | # Employees | % Employees |
| Private Company Employees | 140 | 78.2% |
| Self-Employed (Incorporated) | 14 | 7.8% |
| Self-Employed (Not Incorporated) | 4 | 2.2% |
| Not-for-profit Organizations | 9 | 5.0% |
| Local Government Employees | 4 | 2.2% |
| State Government Employees | 6 | 3.4% |
| Federal Government Employees | 2 | 1.1% |
| Unpaid Family Workers | 0 | 0.0% |
| Total | 179 | 100.0% |
Employment Status by Age in Pine Haven
According to the labor force statistics for Pine Haven, out of the total population over 16 years of age (392), 48.0% or 188 individuals are in the labor force, with 1.6% or 3 of them unemployed. The age group with the highest labor force participation rate is 16 to 19 years, with 100.0% or 5 individuals in the labor force. Within the labor force, the 25 to 29 years age range has the highest percentage of unemployed individuals, with 10.0% or 3 of them being unemployed.
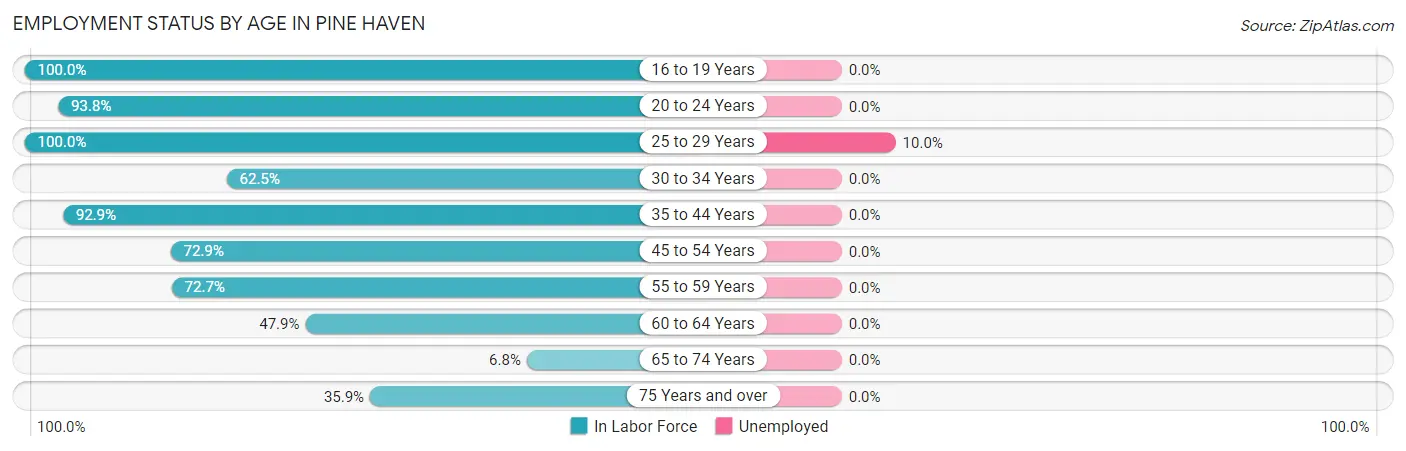
| Age Bracket | In Labor Force | Unemployed |
| 16 to 19 Years | 5 (100.0%) | 0 (0.0%) |
| 20 to 24 Years | 15 (93.8%) | 0 (0.0%) |
| 25 to 29 Years | 30 (100.0%) | 3 (10.0%) |
| 30 to 34 Years | 15 (62.5%) | 0 (0.0%) |
| 35 to 44 Years | 26 (92.9%) | 0 (0.0%) |
| 45 to 54 Years | 35 (72.9%) | 0 (0.0%) |
| 55 to 59 Years | 8 (72.7%) | 0 (0.0%) |
| 60 to 64 Years | 23 (47.9%) | 0 (0.0%) |
| 65 to 74 Years | 8 (6.8%) | 0 (0.0%) |
| 75 Years and over | 23 (35.9%) | 0 (0.0%) |
| Total | 188 (48.0%) | 3 (1.6%) |
Employment Status by Educational Attainment in Pine Haven
According to labor force statistics for Pine Haven, 72.5% of individuals (137) out of the total population between 25 and 64 years of age (189) are in the labor force, with 2.2% or 3 of them being unemployed. The group with the highest labor force participation rate are those with the educational attainment of bachelor's degree or higher, with 96.9% or 31 individuals in the labor force. Within the labor force, individuals with high school diploma education have the highest percentage of unemployment, with 10.0% or 3 of them being unemployed.
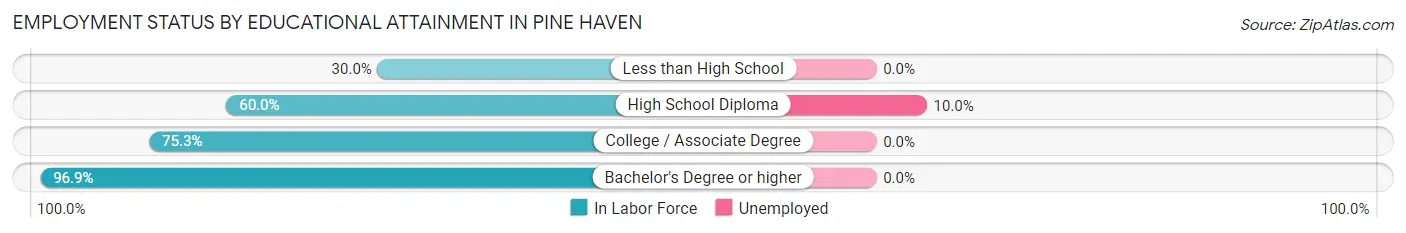
| Educational Attainment | In Labor Force | Unemployed |
| Less than High School | 3 (30.0%) | 0 (0.0%) |
| High School Diploma | 30 (60.0%) | 5 (10.0%) |
| College / Associate Degree | 73 (75.3%) | 0 (0.0%) |
| Bachelor's Degree or higher | 31 (96.9%) | 0 (0.0%) |
| Total | 137 (72.5%) | 4 (2.2%) |
Employment Occupations by Sex in Pine Haven
Management, Business, Science and Arts Occupations
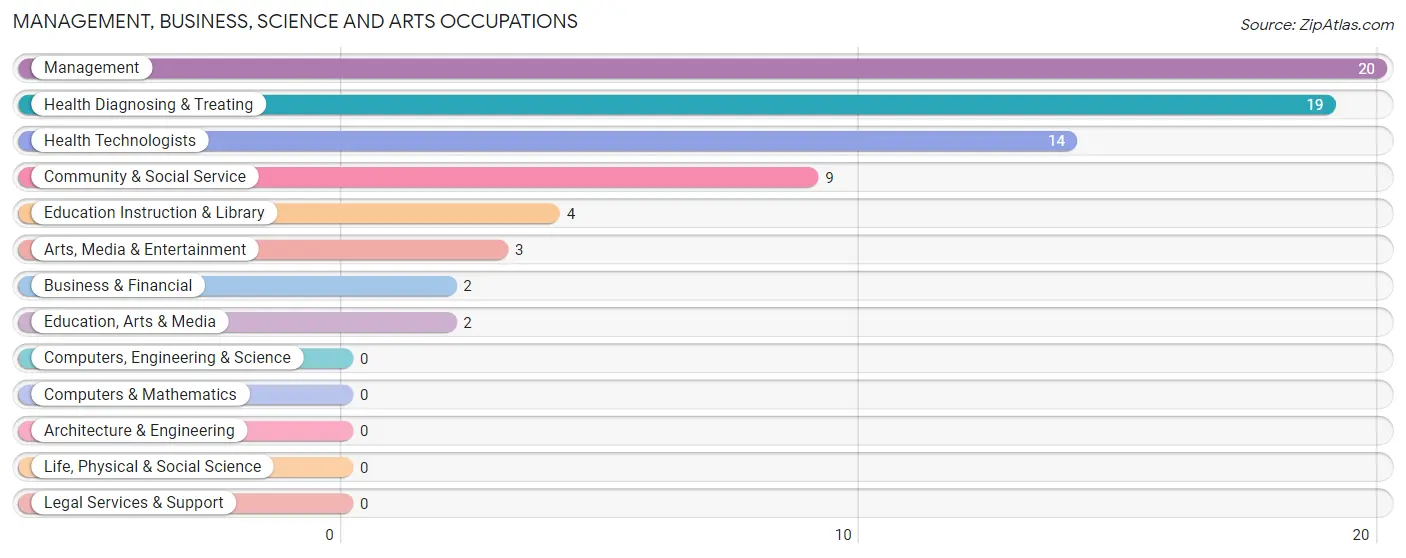
The most common Management, Business, Science and Arts occupations in Pine Haven are Management (20 | 10.8%), Health Diagnosing & Treating (19 | 10.3%), Health Technologists (14 | 7.6%), Community & Social Service (9 | 4.9%), and Education Instruction & Library (4 | 2.2%).
Management, Business, Science and Arts Occupations by Sex
Within the Management, Business, Science and Arts occupations in Pine Haven, the most male-oriented occupations are Business & Financial (100.0%), Education, Arts & Media (100.0%), and Management (90.0%), while the most female-oriented occupations are Education Instruction & Library (100.0%), Arts, Media & Entertainment (100.0%), and Health Technologists (85.7%).
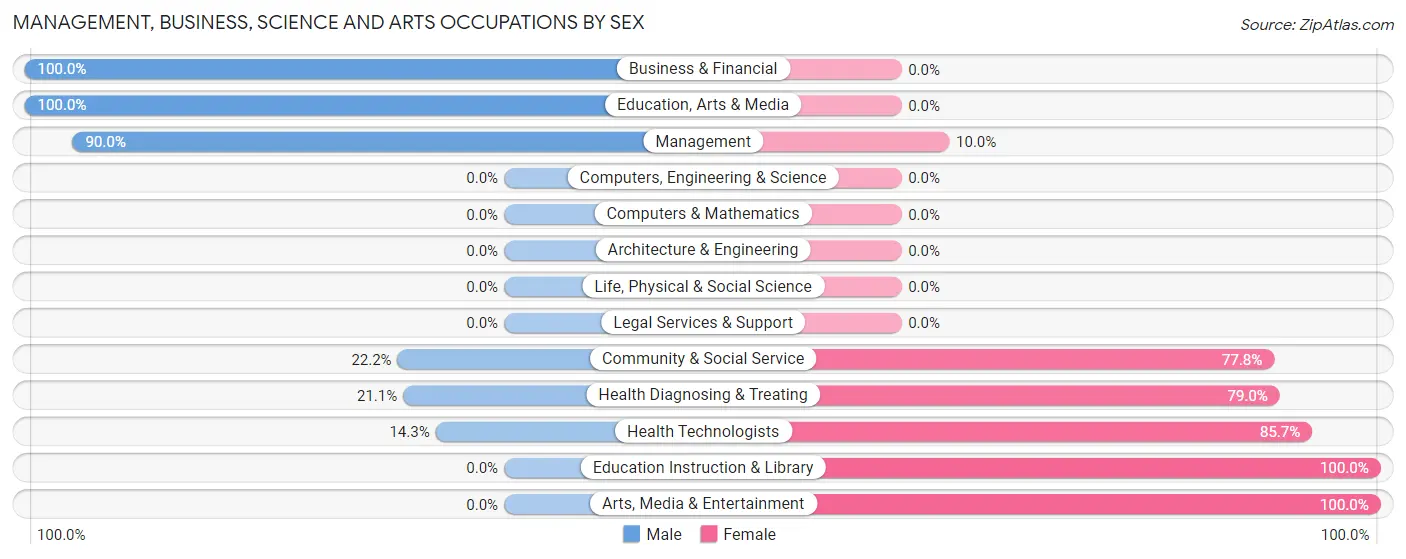
| Occupation | Male | Female |
| Management | 18 (90.0%) | 2 (10.0%) |
| Business & Financial | 2 (100.0%) | 0 (0.0%) |
| Computers, Engineering & Science | 0 (0.0%) | 0 (0.0%) |
| Computers & Mathematics | 0 (0.0%) | 0 (0.0%) |
| Architecture & Engineering | 0 (0.0%) | 0 (0.0%) |
| Life, Physical & Social Science | 0 (0.0%) | 0 (0.0%) |
| Community & Social Service | 2 (22.2%) | 7 (77.8%) |
| Education, Arts & Media | 2 (100.0%) | 0 (0.0%) |
| Legal Services & Support | 0 (0.0%) | 0 (0.0%) |
| Education Instruction & Library | 0 (0.0%) | 4 (100.0%) |
| Arts, Media & Entertainment | 0 (0.0%) | 3 (100.0%) |
| Health Diagnosing & Treating | 4 (21.0%) | 15 (78.9%) |
| Health Technologists | 2 (14.3%) | 12 (85.7%) |
| Total (Category) | 26 (52.0%) | 24 (48.0%) |
| Total (Overall) | 116 (62.7%) | 69 (37.3%) |
Services Occupations
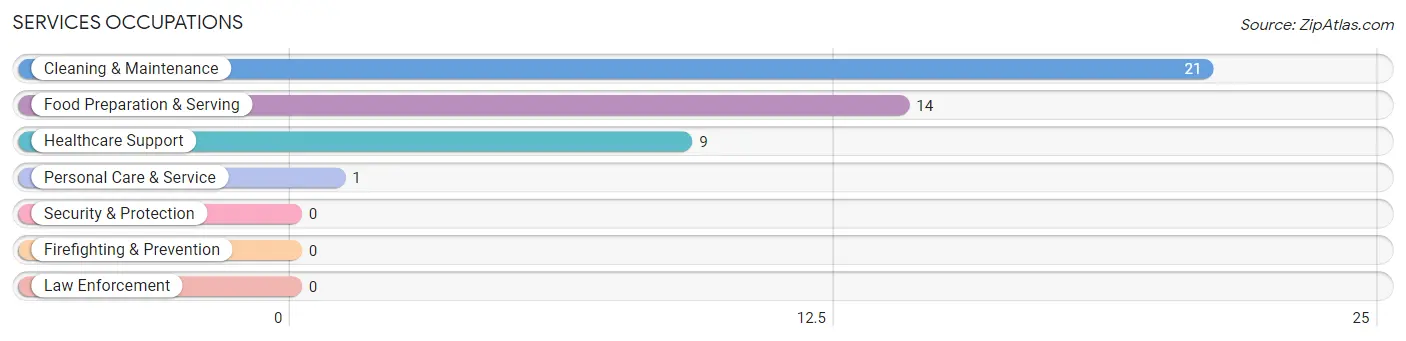
The most common Services occupations in Pine Haven are Cleaning & Maintenance (21 | 11.4%), Food Preparation & Serving (14 | 7.6%), Healthcare Support (9 | 4.9%), and Personal Care & Service (1 | 0.5%).
Services Occupations by Sex
Within the Services occupations in Pine Haven, the most male-oriented occupations are Cleaning & Maintenance (100.0%), and Food Preparation & Serving (85.7%), while the most female-oriented occupations are Healthcare Support (100.0%), Personal Care & Service (100.0%), and Food Preparation & Serving (14.3%).
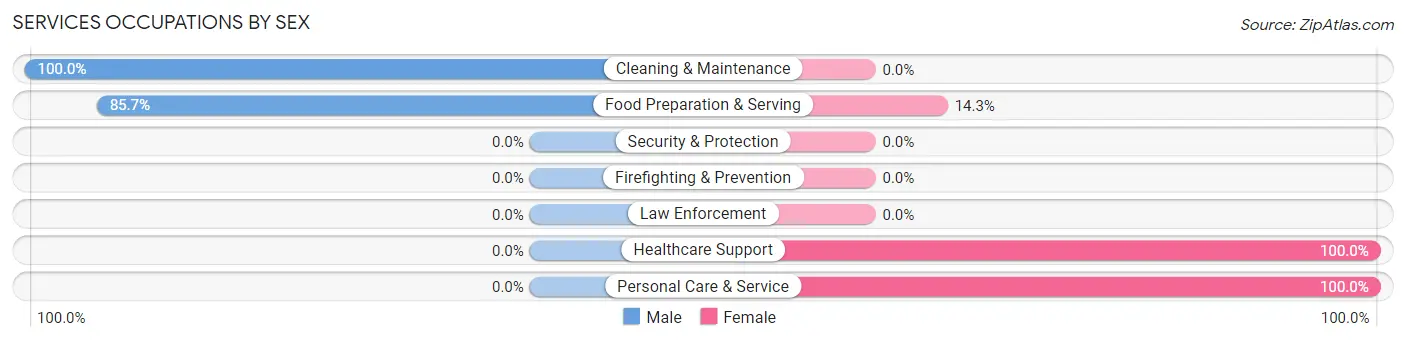
| Occupation | Male | Female |
| Healthcare Support | 0 (0.0%) | 9 (100.0%) |
| Security & Protection | 0 (0.0%) | 0 (0.0%) |
| Firefighting & Prevention | 0 (0.0%) | 0 (0.0%) |
| Law Enforcement | 0 (0.0%) | 0 (0.0%) |
| Food Preparation & Serving | 12 (85.7%) | 2 (14.3%) |
| Cleaning & Maintenance | 21 (100.0%) | 0 (0.0%) |
| Personal Care & Service | 0 (0.0%) | 1 (100.0%) |
| Total (Category) | 33 (73.3%) | 12 (26.7%) |
| Total (Overall) | 116 (62.7%) | 69 (37.3%) |
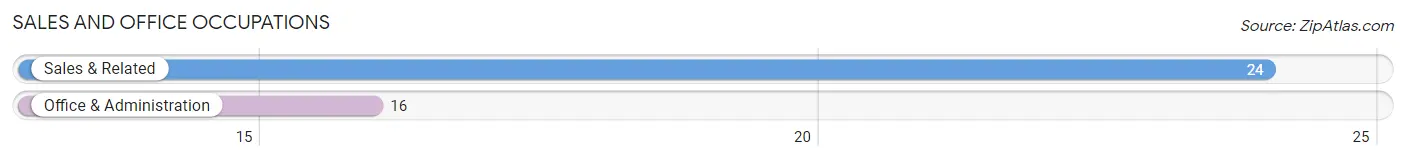
Sales and Office Occupations
The most common Sales and Office occupations in Pine Haven are Sales & Related (24 | 13.0%), and Office & Administration (16 | 8.6%).
Sales and Office Occupations by Sex

| Occupation | Male | Female |
| Sales & Related | 0 (0.0%) | 24 (100.0%) |
| Office & Administration | 7 (43.8%) | 9 (56.2%) |
| Total (Category) | 7 (17.5%) | 33 (82.5%) |
| Total (Overall) | 116 (62.7%) | 69 (37.3%) |
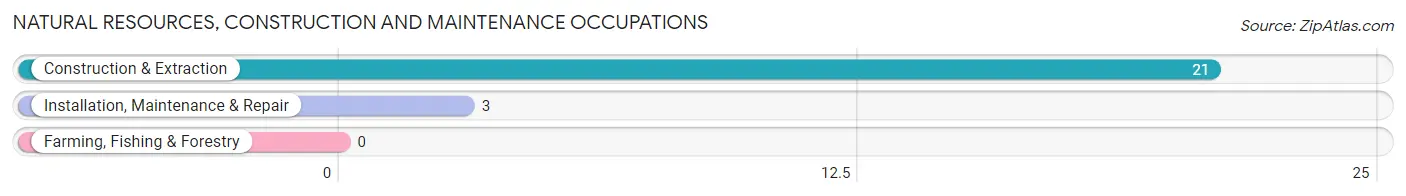
Natural Resources, Construction and Maintenance Occupations
The most common Natural Resources, Construction and Maintenance occupations in Pine Haven are Construction & Extraction (21 | 11.4%), and Installation, Maintenance & Repair (3 | 1.6%).
Natural Resources, Construction and Maintenance Occupations by Sex
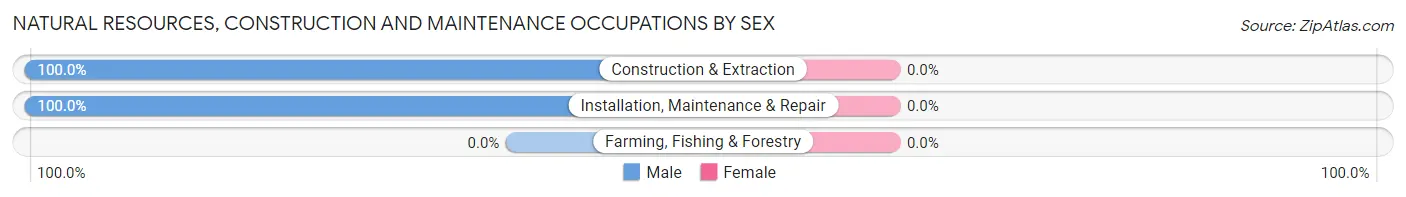
| Occupation | Male | Female |
| Farming, Fishing & Forestry | 0 (0.0%) | 0 (0.0%) |
| Construction & Extraction | 21 (100.0%) | 0 (0.0%) |
| Installation, Maintenance & Repair | 3 (100.0%) | 0 (0.0%) |
| Total (Category) | 24 (100.0%) | 0 (0.0%) |
| Total (Overall) | 116 (62.7%) | 69 (37.3%) |
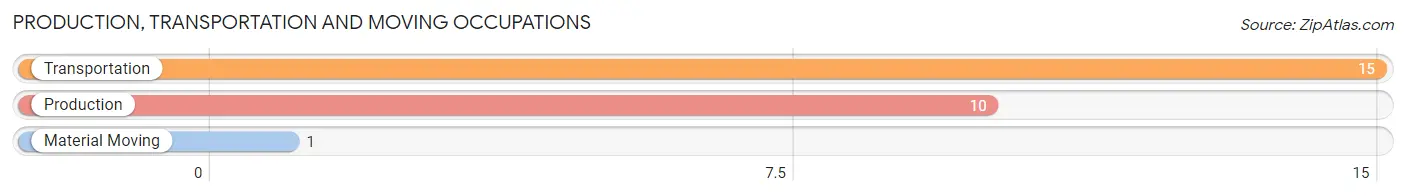
Production, Transportation and Moving Occupations
The most common Production, Transportation and Moving occupations in Pine Haven are Transportation (15 | 8.1%), Production (10 | 5.4%), and Material Moving (1 | 0.5%).
Production, Transportation and Moving Occupations by Sex
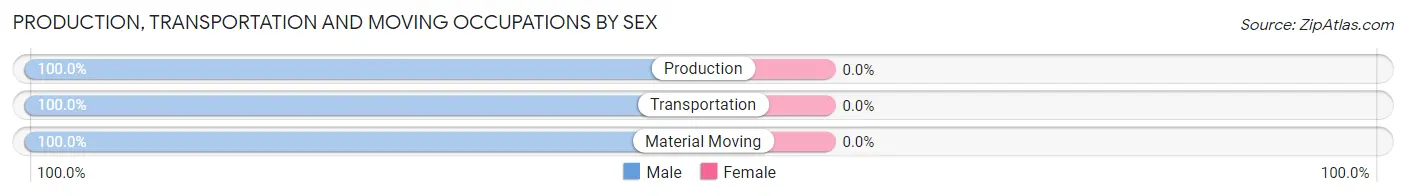
| Occupation | Male | Female |
| Production | 10 (100.0%) | 0 (0.0%) |
| Transportation | 15 (100.0%) | 0 (0.0%) |
| Material Moving | 1 (100.0%) | 0 (0.0%) |
| Total (Category) | 26 (100.0%) | 0 (0.0%) |
| Total (Overall) | 116 (62.7%) | 69 (37.3%) |
Employment Industries by Sex in Pine Haven
Employment Industries in Pine Haven
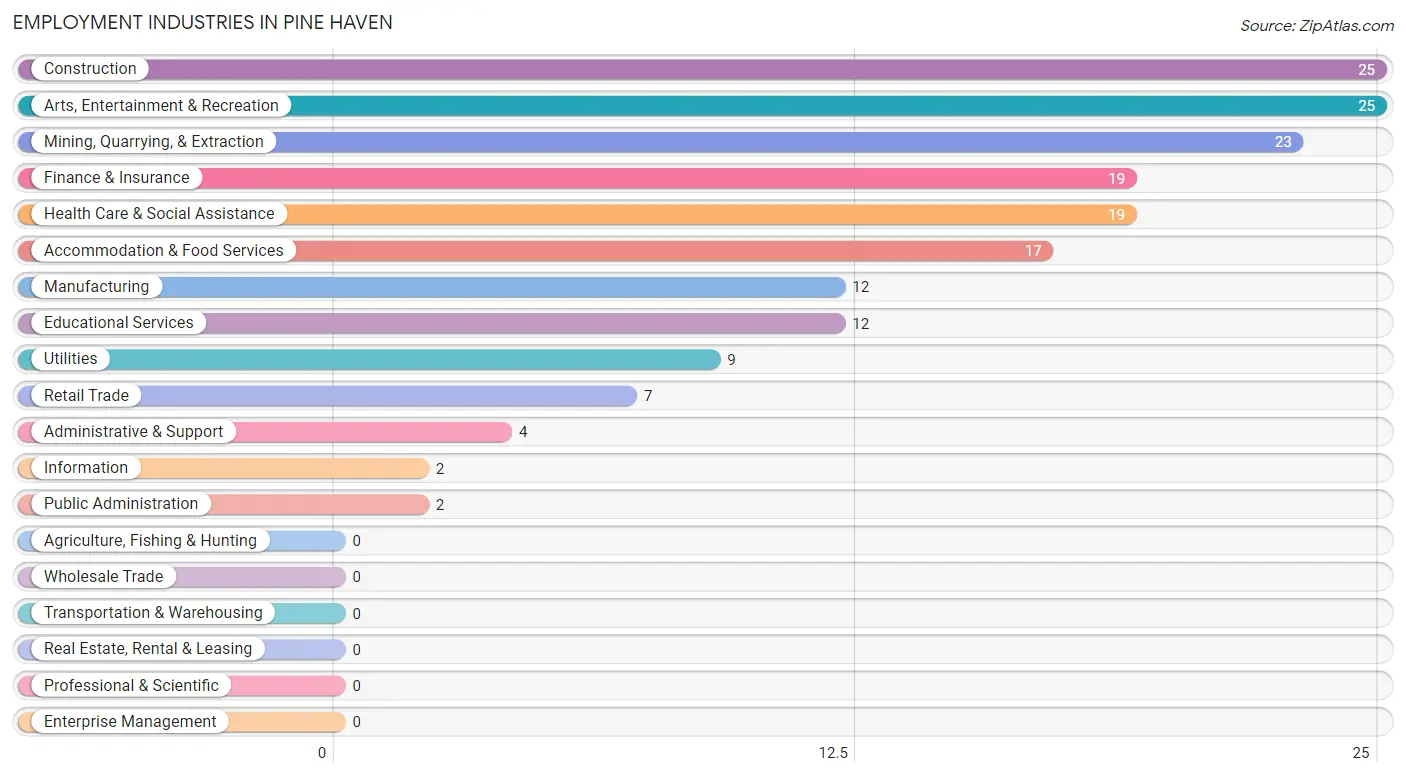
The major employment industries in Pine Haven include Construction (25 | 13.5%), Arts, Entertainment & Recreation (25 | 13.5%), Mining, Quarrying, & Extraction (23 | 12.4%), Finance & Insurance (19 | 10.3%), and Health Care & Social Assistance (19 | 10.3%).
Employment Industries by Sex in Pine Haven
The Pine Haven industries that see more men than women are Mining, Quarrying, & Extraction (100.0%), Manufacturing (100.0%), and Utilities (100.0%), whereas the industries that tend to have a higher number of women are Information (100.0%), Administrative & Support (100.0%), and Educational Services (100.0%).
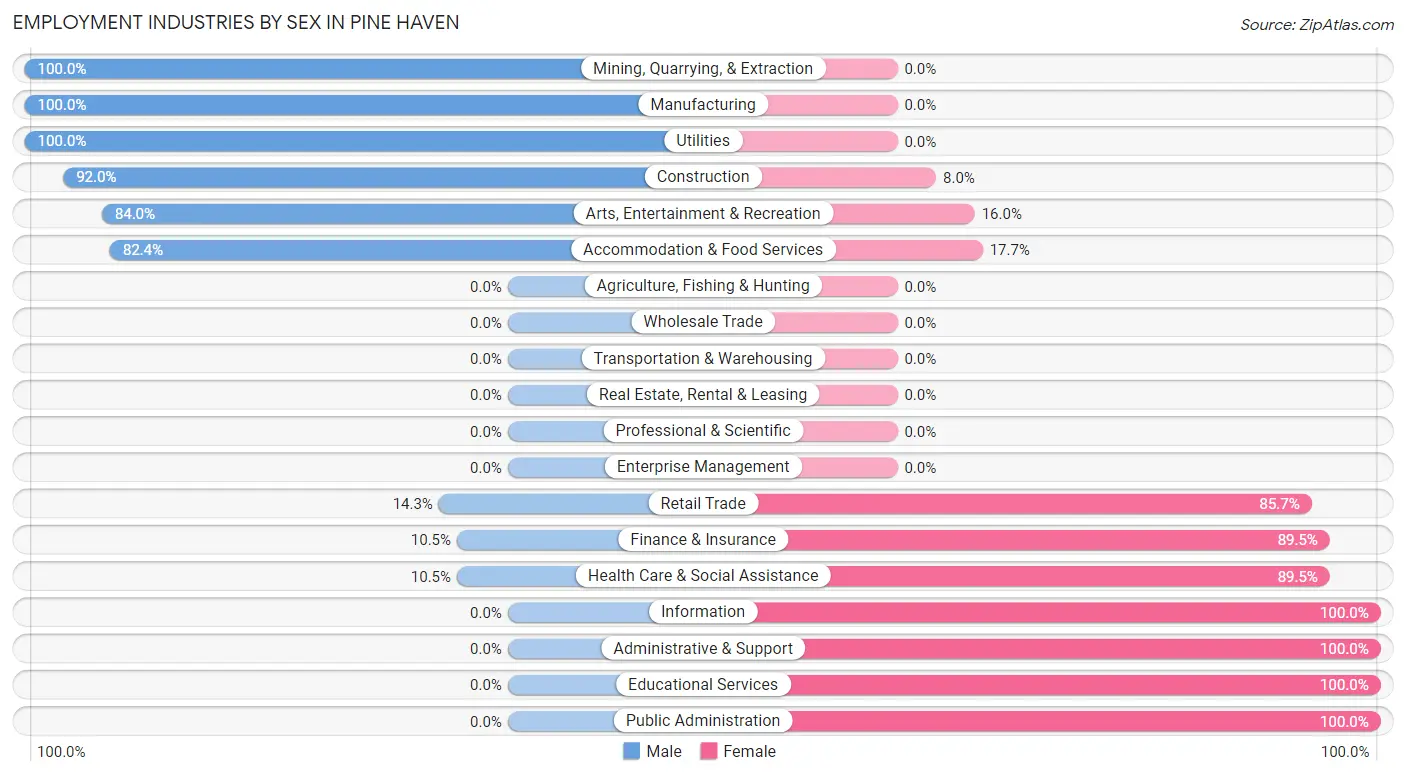
| Industry | Male | Female |
| Agriculture, Fishing & Hunting | 0 (0.0%) | 0 (0.0%) |
| Mining, Quarrying, & Extraction | 23 (100.0%) | 0 (0.0%) |
| Construction | 23 (92.0%) | 2 (8.0%) |
| Manufacturing | 12 (100.0%) | 0 (0.0%) |
| Wholesale Trade | 0 (0.0%) | 0 (0.0%) |
| Retail Trade | 1 (14.3%) | 6 (85.7%) |
| Transportation & Warehousing | 0 (0.0%) | 0 (0.0%) |
| Utilities | 9 (100.0%) | 0 (0.0%) |
| Information | 0 (0.0%) | 2 (100.0%) |
| Finance & Insurance | 2 (10.5%) | 17 (89.5%) |
| Real Estate, Rental & Leasing | 0 (0.0%) | 0 (0.0%) |
| Professional & Scientific | 0 (0.0%) | 0 (0.0%) |
| Enterprise Management | 0 (0.0%) | 0 (0.0%) |
| Administrative & Support | 0 (0.0%) | 4 (100.0%) |
| Educational Services | 0 (0.0%) | 12 (100.0%) |
| Health Care & Social Assistance | 2 (10.5%) | 17 (89.5%) |
| Arts, Entertainment & Recreation | 21 (84.0%) | 4 (16.0%) |
| Accommodation & Food Services | 14 (82.4%) | 3 (17.6%) |
| Public Administration | 0 (0.0%) | 2 (100.0%) |
| Total | 116 (62.7%) | 69 (37.3%) |
Education in Pine Haven
School Enrollment in Pine Haven
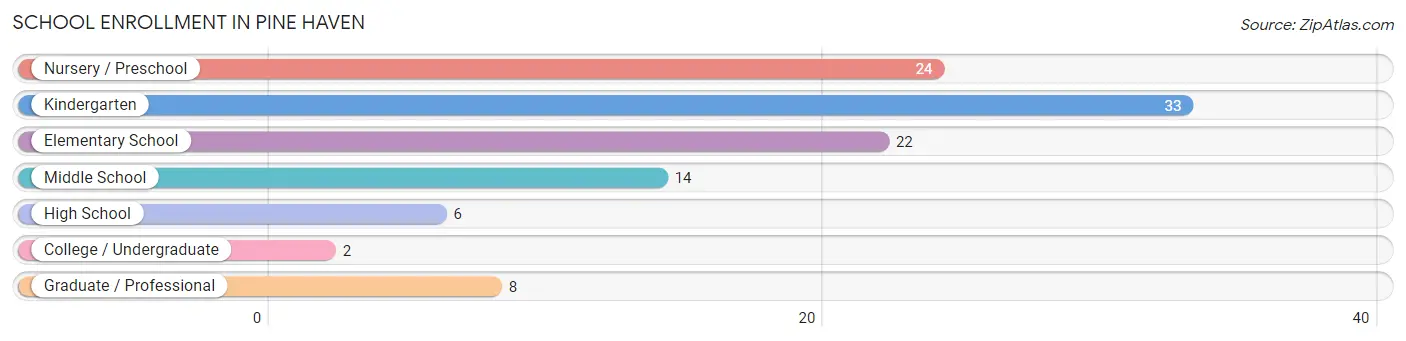
The most common levels of schooling among the 109 students in Pine Haven are kindergarten (33 | 30.3%), nursery / preschool (24 | 22.0%), and elementary school (22 | 20.2%).
| School Level | # Students | % Students |
| Nursery / Preschool | 24 | 22.0% |
| Kindergarten | 33 | 30.3% |
| Elementary School | 22 | 20.2% |
| Middle School | 14 | 12.8% |
| High School | 6 | 5.5% |
| College / Undergraduate | 2 | 1.8% |
| Graduate / Professional | 8 | 7.3% |
| Total | 109 | 100.0% |
School Enrollment by Age by Funding Source in Pine Haven
Out of a total of 109 students who are enrolled in schools in Pine Haven, 13 (11.9%) attend a private institution, while the remaining 96 (88.1%) are enrolled in public schools. The age group of 25 to 34 year olds has the highest likelihood of being enrolled in private schools, with 2 (100.0% in the age bracket) enrolled. Conversely, the age group of 10 to 14 year olds has the lowest likelihood of being enrolled in a private school, with 10 (100.0% in the age bracket) attending a public institution.
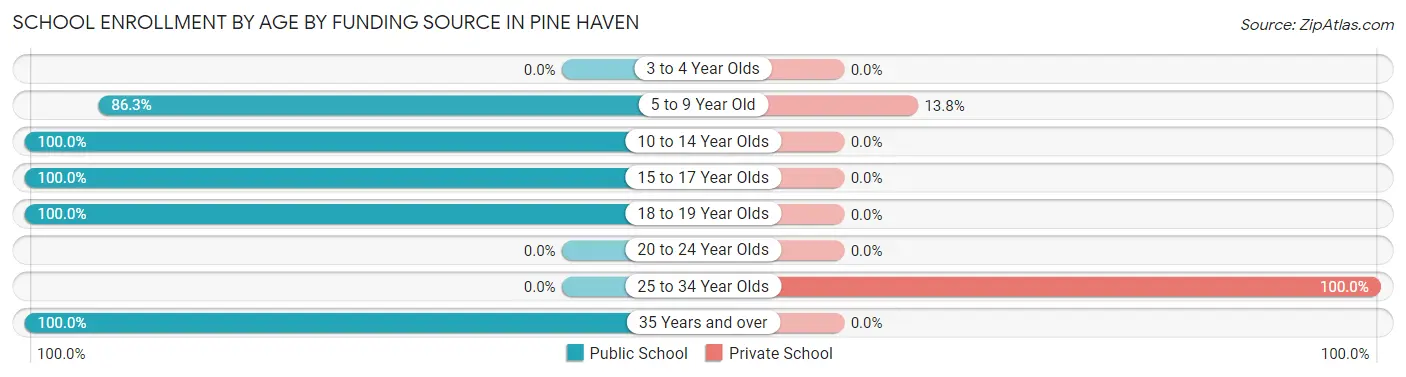
| Age Bracket | Public School | Private School |
| 3 to 4 Year Olds | 0 (0.0%) | 0 (0.0%) |
| 5 to 9 Year Old | 69 (86.3%) | 11 (13.8%) |
| 10 to 14 Year Olds | 10 (100.0%) | 0 (0.0%) |
| 15 to 17 Year Olds | 9 (100.0%) | 0 (0.0%) |
| 18 to 19 Year Olds | 2 (100.0%) | 0 (0.0%) |
| 20 to 24 Year Olds | 0 (0.0%) | 0 (0.0%) |
| 25 to 34 Year Olds | 0 (0.0%) | 2 (100.0%) |
| 35 Years and over | 6 (100.0%) | 0 (0.0%) |
| Total | 96 (88.1%) | 13 (11.9%) |
Educational Attainment by Field of Study in Pine Haven
Education (39 | 41.5%), business (25 | 26.6%), liberal arts & history (10 | 10.6%), science & technology (8 | 8.5%), and bio, nature & agricultural (4 | 4.3%) are the most common fields of study among 94 individuals in Pine Haven who have obtained a bachelor's degree or higher.
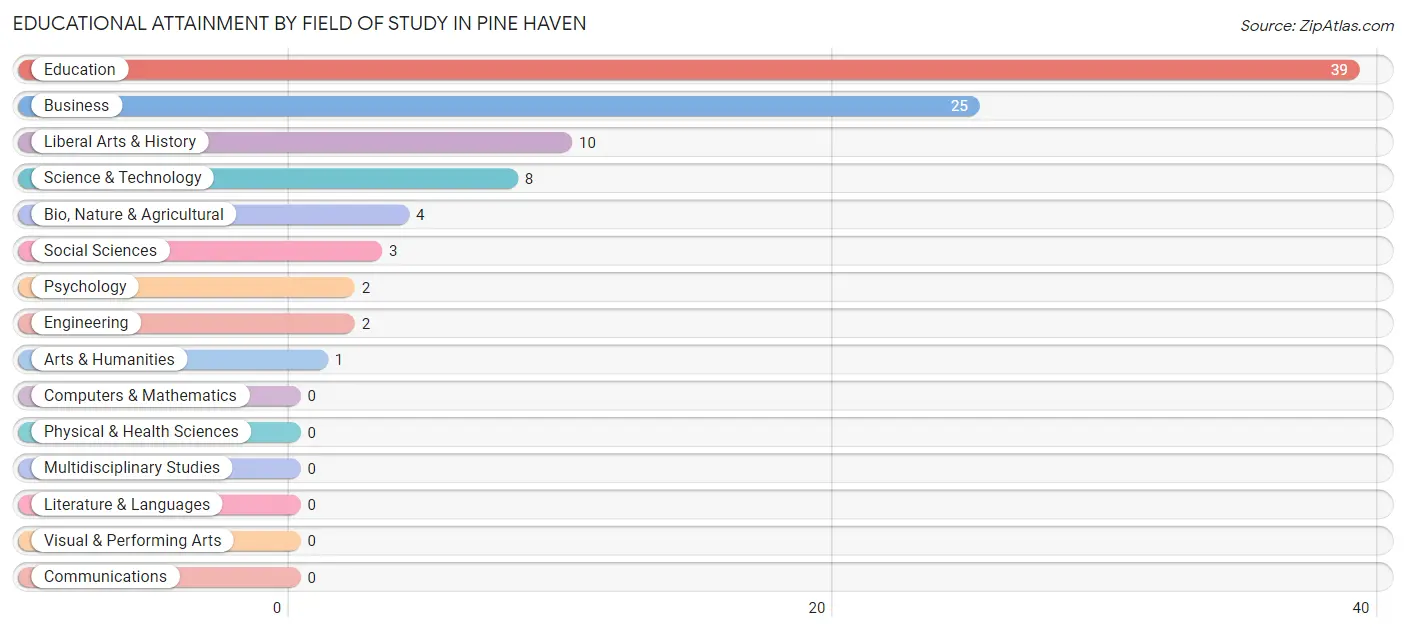
| Field of Study | # Graduates | % Graduates |
| Computers & Mathematics | 0 | 0.0% |
| Bio, Nature & Agricultural | 4 | 4.3% |
| Physical & Health Sciences | 0 | 0.0% |
| Psychology | 2 | 2.1% |
| Social Sciences | 3 | 3.2% |
| Engineering | 2 | 2.1% |
| Multidisciplinary Studies | 0 | 0.0% |
| Science & Technology | 8 | 8.5% |
| Business | 25 | 26.6% |
| Education | 39 | 41.5% |
| Literature & Languages | 0 | 0.0% |
| Liberal Arts & History | 10 | 10.6% |
| Visual & Performing Arts | 0 | 0.0% |
| Communications | 0 | 0.0% |
| Arts & Humanities | 1 | 1.1% |
| Total | 94 | 100.0% |
Transportation & Commute in Pine Haven
Vehicle Availability by Sex in Pine Haven
The most prevalent vehicle ownership categories in Pine Haven are males with 2 vehicles (40, accounting for 34.5%) and females with 2 vehicles (12, making up 63.5%).
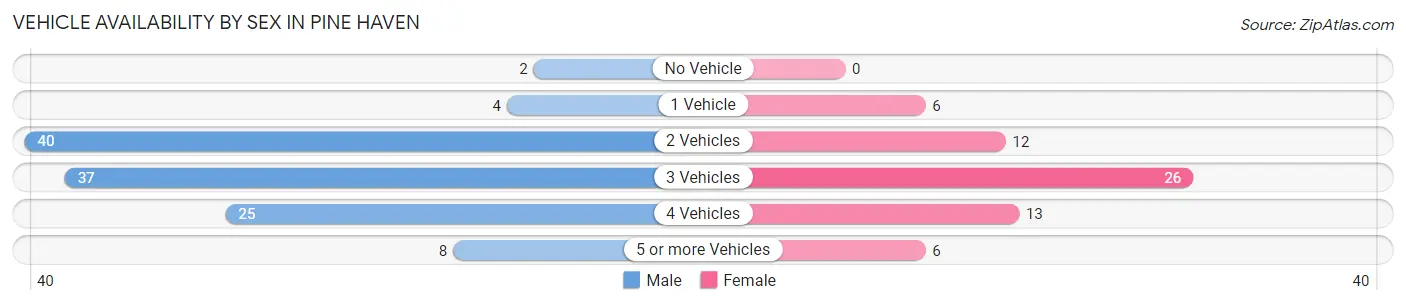
| Vehicles Available | Male | Female |
| No Vehicle | 2 (1.7%) | 0 (0.0%) |
| 1 Vehicle | 4 (3.5%) | 6 (9.5%) |
| 2 Vehicles | 40 (34.5%) | 12 (19.1%) |
| 3 Vehicles | 37 (31.9%) | 26 (41.3%) |
| 4 Vehicles | 25 (21.5%) | 13 (20.6%) |
| 5 or more Vehicles | 8 (6.9%) | 6 (9.5%) |
| Total | 116 (100.0%) | 63 (100.0%) |
Commute Time in Pine Haven
The most frequently occuring commute durations in Pine Haven are 45 to 59 minutes (51 commuters, 30.7%), less than 5 minutes (29 commuters, 17.5%), and 15 to 19 minutes (24 commuters, 14.5%).
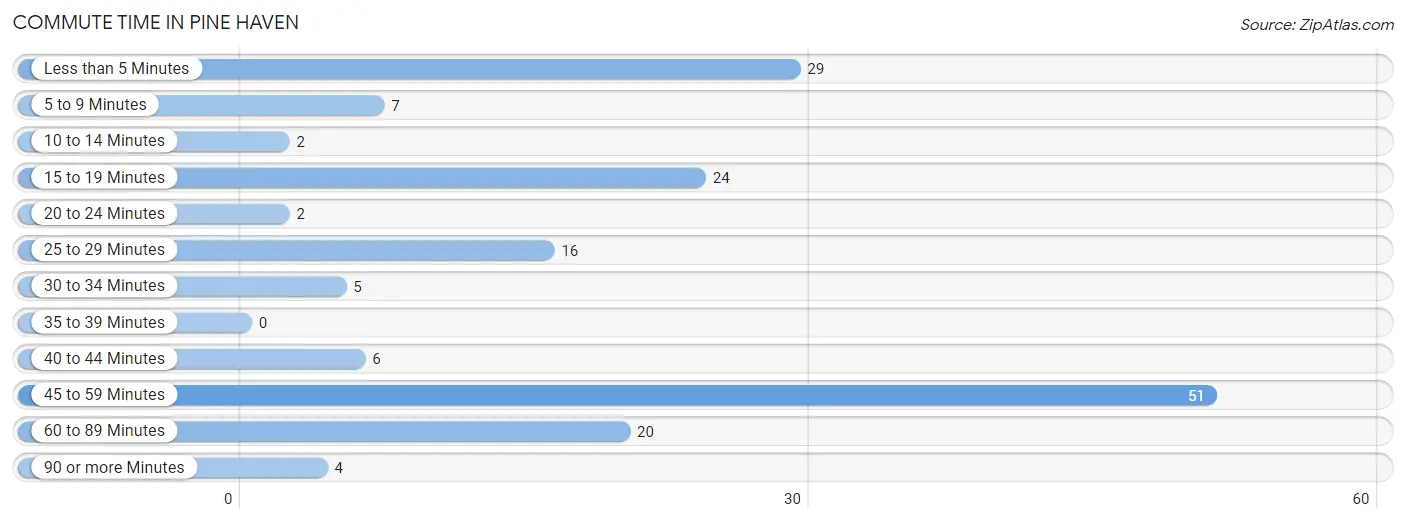
| Commute Time | # Commuters | % Commuters |
| Less than 5 Minutes | 29 | 17.5% |
| 5 to 9 Minutes | 7 | 4.2% |
| 10 to 14 Minutes | 2 | 1.2% |
| 15 to 19 Minutes | 24 | 14.5% |
| 20 to 24 Minutes | 2 | 1.2% |
| 25 to 29 Minutes | 16 | 9.6% |
| 30 to 34 Minutes | 5 | 3.0% |
| 35 to 39 Minutes | 0 | 0.0% |
| 40 to 44 Minutes | 6 | 3.6% |
| 45 to 59 Minutes | 51 | 30.7% |
| 60 to 89 Minutes | 20 | 12.0% |
| 90 or more Minutes | 4 | 2.4% |
Commute Time by Sex in Pine Haven
The most common commute times in Pine Haven are less than 5 minutes (26 commuters, 24.5%) for males and 45 to 59 minutes (34 commuters, 56.7%) for females.
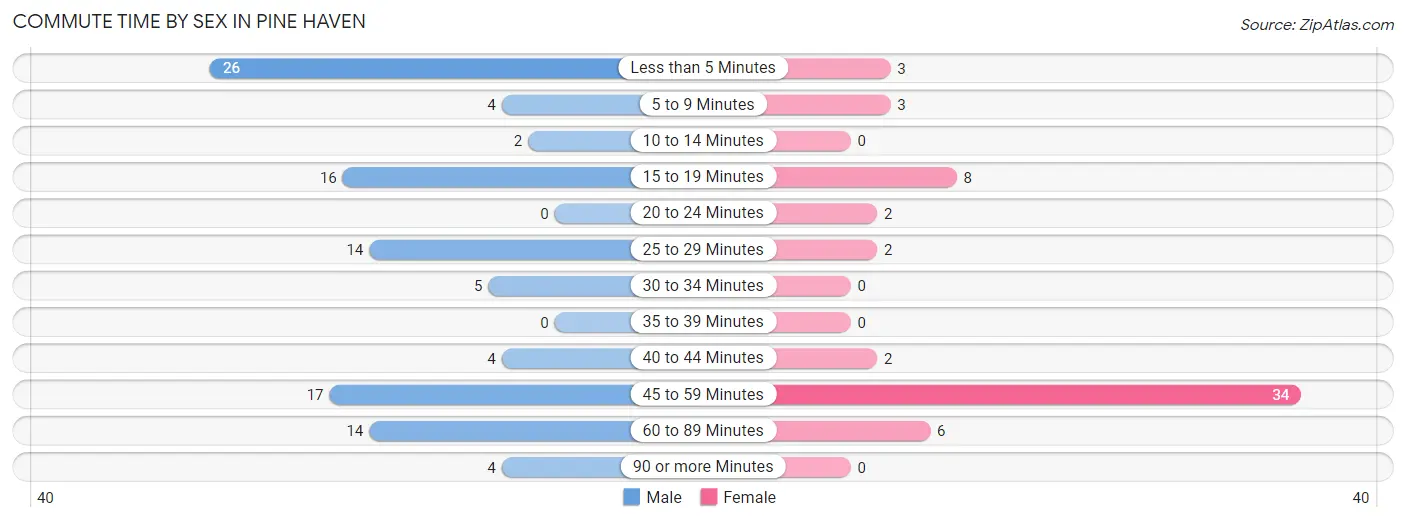
| Commute Time | Male | Female |
| Less than 5 Minutes | 26 (24.5%) | 3 (5.0%) |
| 5 to 9 Minutes | 4 (3.8%) | 3 (5.0%) |
| 10 to 14 Minutes | 2 (1.9%) | 0 (0.0%) |
| 15 to 19 Minutes | 16 (15.1%) | 8 (13.3%) |
| 20 to 24 Minutes | 0 (0.0%) | 2 (3.3%) |
| 25 to 29 Minutes | 14 (13.2%) | 2 (3.3%) |
| 30 to 34 Minutes | 5 (4.7%) | 0 (0.0%) |
| 35 to 39 Minutes | 0 (0.0%) | 0 (0.0%) |
| 40 to 44 Minutes | 4 (3.8%) | 2 (3.3%) |
| 45 to 59 Minutes | 17 (16.0%) | 34 (56.7%) |
| 60 to 89 Minutes | 14 (13.2%) | 6 (10.0%) |
| 90 or more Minutes | 4 (3.8%) | 0 (0.0%) |
Time of Departure to Work by Sex in Pine Haven
The most frequent times of departure to work in Pine Haven are 7:00 AM to 7:29 AM (24, 22.6%) for males and 7:00 AM to 7:29 AM (26, 43.3%) for females.
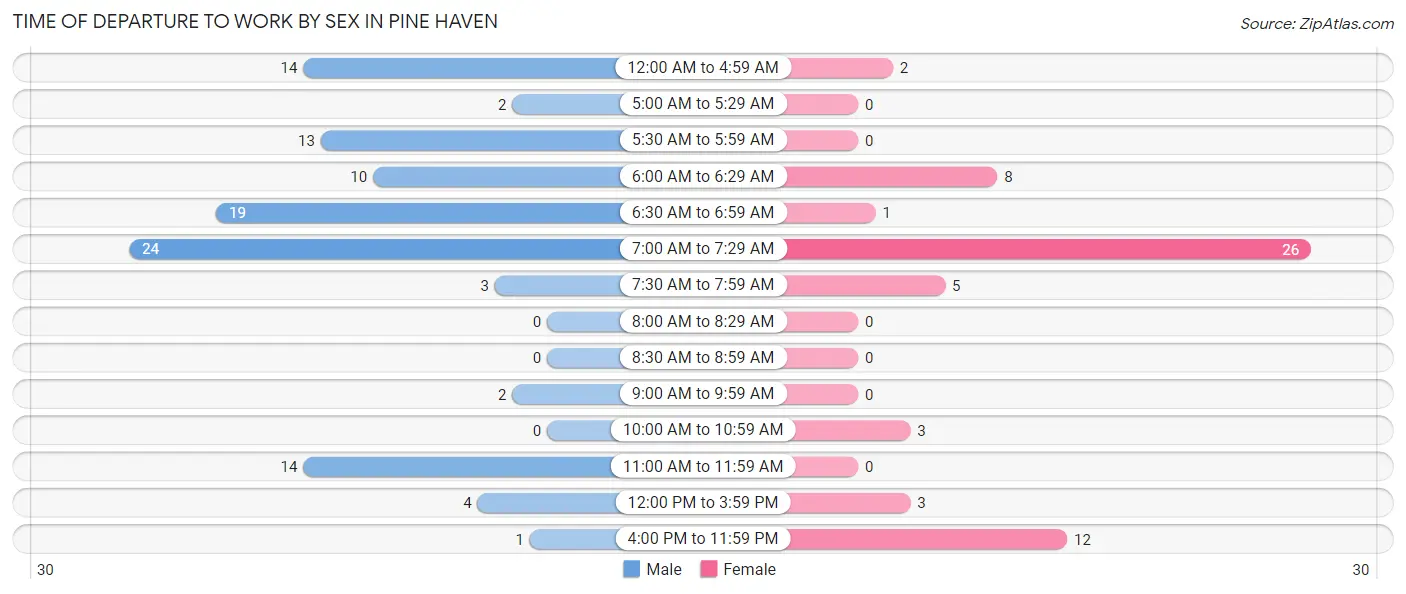
| Time of Departure | Male | Female |
| 12:00 AM to 4:59 AM | 14 (13.2%) | 2 (3.3%) |
| 5:00 AM to 5:29 AM | 2 (1.9%) | 0 (0.0%) |
| 5:30 AM to 5:59 AM | 13 (12.3%) | 0 (0.0%) |
| 6:00 AM to 6:29 AM | 10 (9.4%) | 8 (13.3%) |
| 6:30 AM to 6:59 AM | 19 (17.9%) | 1 (1.7%) |
| 7:00 AM to 7:29 AM | 24 (22.6%) | 26 (43.3%) |
| 7:30 AM to 7:59 AM | 3 (2.8%) | 5 (8.3%) |
| 8:00 AM to 8:29 AM | 0 (0.0%) | 0 (0.0%) |
| 8:30 AM to 8:59 AM | 0 (0.0%) | 0 (0.0%) |
| 9:00 AM to 9:59 AM | 2 (1.9%) | 0 (0.0%) |
| 10:00 AM to 10:59 AM | 0 (0.0%) | 3 (5.0%) |
| 11:00 AM to 11:59 AM | 14 (13.2%) | 0 (0.0%) |
| 12:00 PM to 3:59 PM | 4 (3.8%) | 3 (5.0%) |
| 4:00 PM to 11:59 PM | 1 (0.9%) | 12 (20.0%) |
| Total | 106 (100.0%) | 60 (100.0%) |
Housing Occupancy in Pine Haven
Occupancy by Ownership in Pine Haven
Of the total 186 dwellings in Pine Haven, owner-occupied units account for 172 (92.5%), while renter-occupied units make up 14 (7.5%).
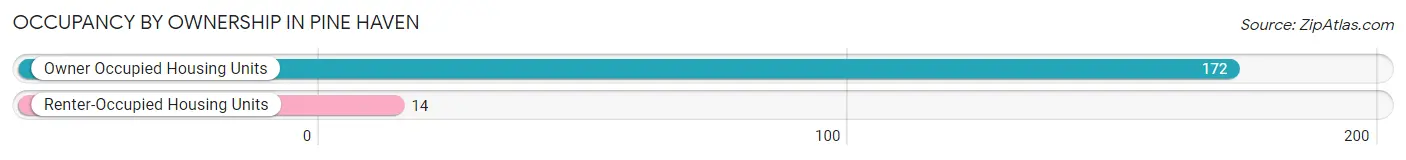
| Occupancy | # Housing Units | % Housing Units |
| Owner Occupied Housing Units | 172 | 92.5% |
| Renter-Occupied Housing Units | 14 | 7.5% |
| Total Occupied Housing Units | 186 | 100.0% |
Occupancy by Household Size in Pine Haven
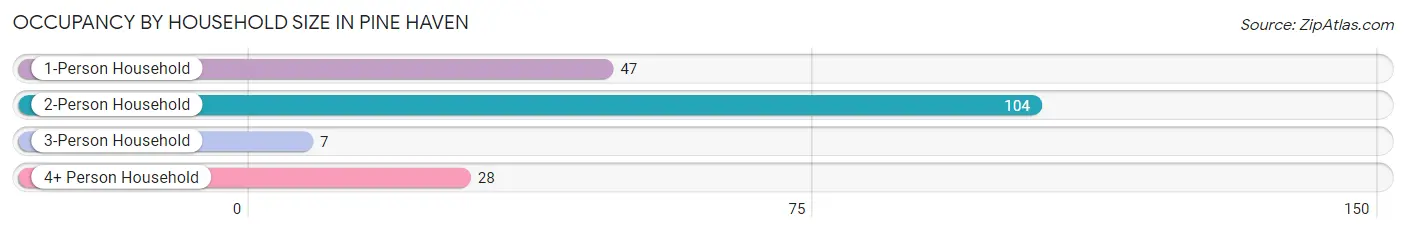
| Household Size | # Housing Units | % Housing Units |
| 1-Person Household | 47 | 25.3% |
| 2-Person Household | 104 | 55.9% |
| 3-Person Household | 7 | 3.8% |
| 4+ Person Household | 28 | 15.0% |
| Total Housing Units | 186 | 100.0% |
Occupancy by Ownership by Household Size in Pine Haven
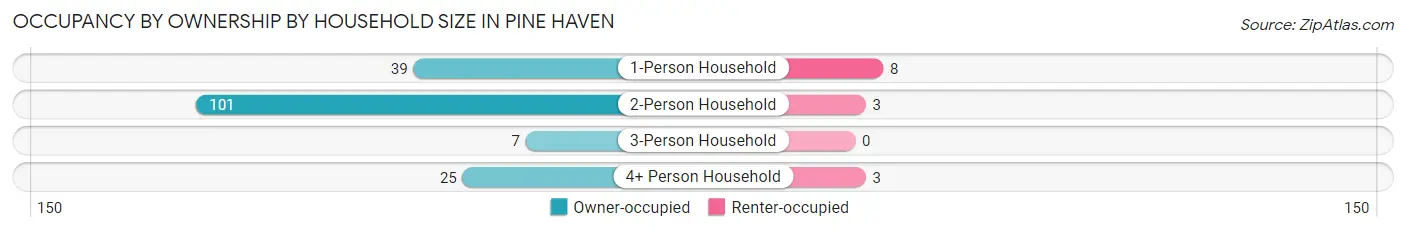
| Household Size | Owner-occupied | Renter-occupied |
| 1-Person Household | 39 (83.0%) | 8 (17.0%) |
| 2-Person Household | 101 (97.1%) | 3 (2.9%) |
| 3-Person Household | 7 (100.0%) | 0 (0.0%) |
| 4+ Person Household | 25 (89.3%) | 3 (10.7%) |
| Total Housing Units | 172 (92.5%) | 14 (7.5%) |
Occupancy by Educational Attainment in Pine Haven
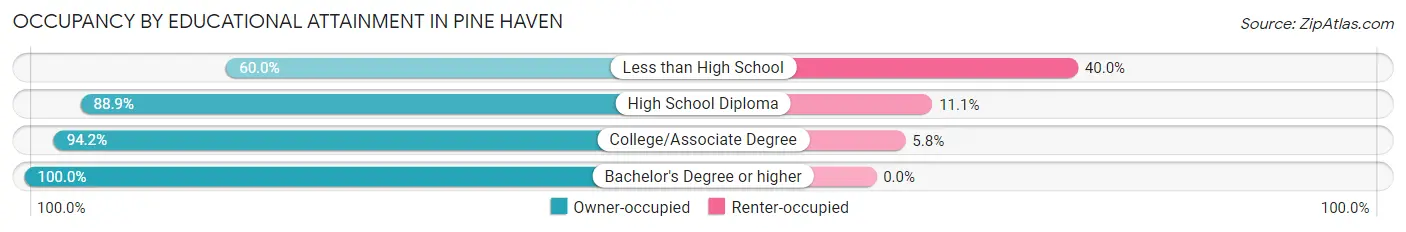
| Household Size | Owner-occupied | Renter-occupied |
| Less than High School | 3 (60.0%) | 2 (40.0%) |
| High School Diploma | 64 (88.9%) | 8 (11.1%) |
| College/Associate Degree | 65 (94.2%) | 4 (5.8%) |
| Bachelor's Degree or higher | 40 (100.0%) | 0 (0.0%) |
Occupancy by Age of Householder in Pine Haven
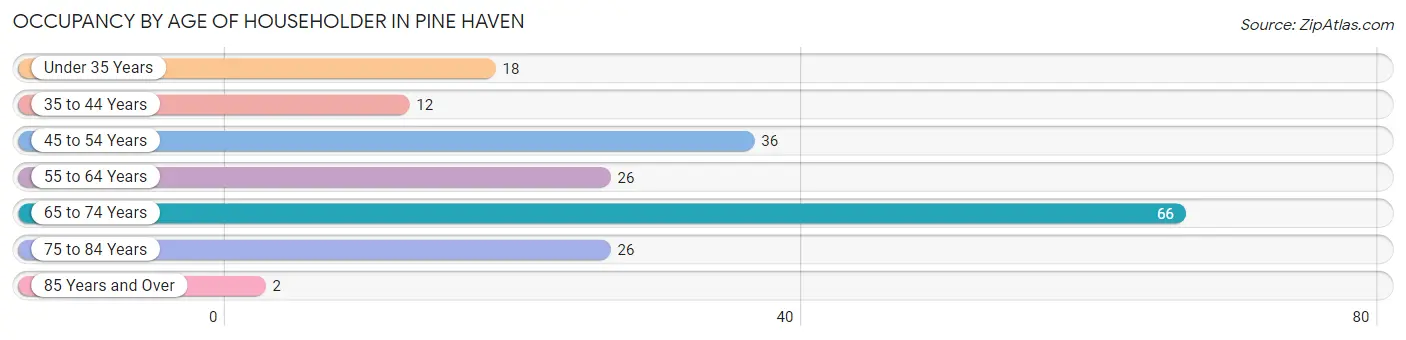
| Age Bracket | # Households | % Households |
| Under 35 Years | 18 | 9.7% |
| 35 to 44 Years | 12 | 6.5% |
| 45 to 54 Years | 36 | 19.4% |
| 55 to 64 Years | 26 | 14.0% |
| 65 to 74 Years | 66 | 35.5% |
| 75 to 84 Years | 26 | 14.0% |
| 85 Years and Over | 2 | 1.1% |
| Total | 186 | 100.0% |
Housing Finances in Pine Haven
Median Income by Occupancy in Pine Haven
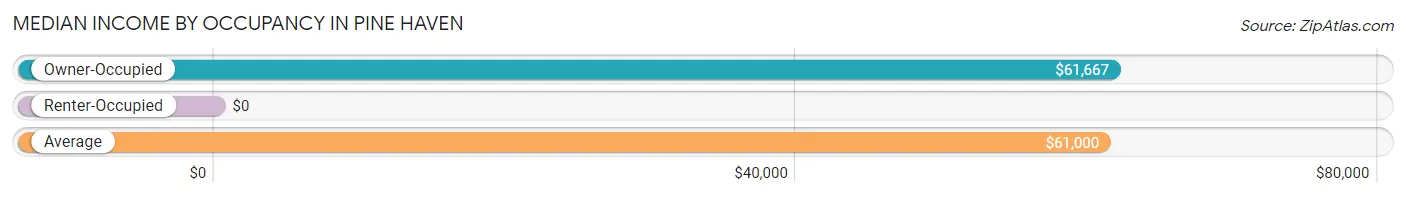
| Occupancy Type | # Households | Median Income |
| Owner-Occupied | 172 (92.5%) | $61,667 |
| Renter-Occupied | 14 (7.5%) | $0 |
| Average | 186 (100.0%) | $61,000 |
Occupancy by Householder Income Bracket in Pine Haven
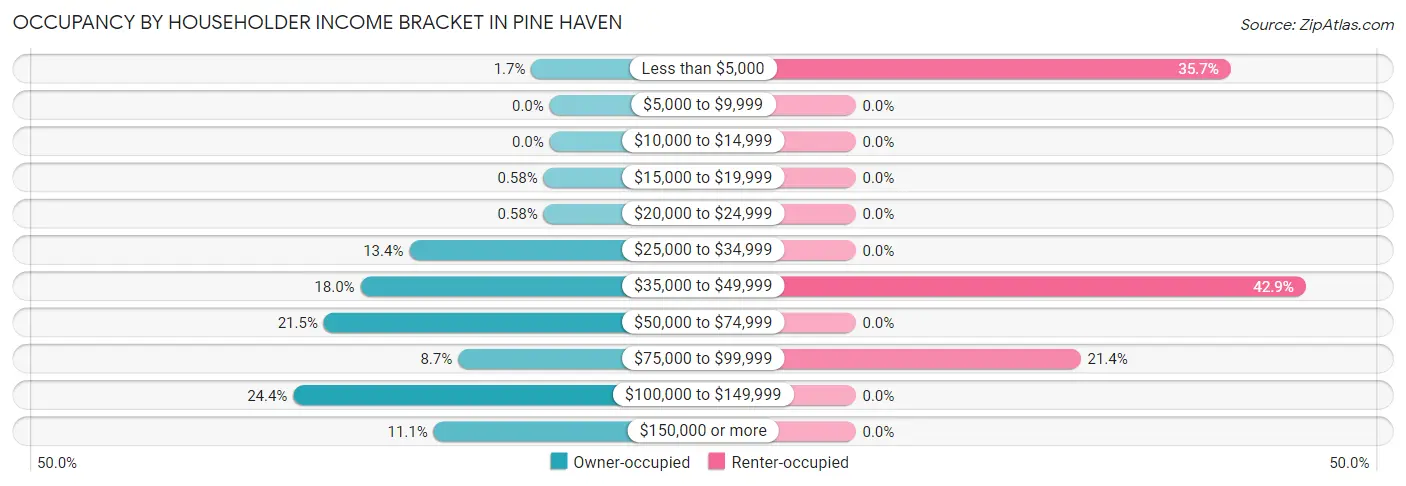
| Income Bracket | Owner-occupied | Renter-occupied |
| Less than $5,000 | 3 (1.7%) | 5 (35.7%) |
| $5,000 to $9,999 | 0 (0.0%) | 0 (0.0%) |
| $10,000 to $14,999 | 0 (0.0%) | 0 (0.0%) |
| $15,000 to $19,999 | 1 (0.6%) | 0 (0.0%) |
| $20,000 to $24,999 | 1 (0.6%) | 0 (0.0%) |
| $25,000 to $34,999 | 23 (13.4%) | 0 (0.0%) |
| $35,000 to $49,999 | 31 (18.0%) | 6 (42.9%) |
| $50,000 to $74,999 | 37 (21.5%) | 0 (0.0%) |
| $75,000 to $99,999 | 15 (8.7%) | 3 (21.4%) |
| $100,000 to $149,999 | 42 (24.4%) | 0 (0.0%) |
| $150,000 or more | 19 (11.1%) | 0 (0.0%) |
| Total | 172 (100.0%) | 14 (100.0%) |
Monthly Housing Cost Tiers in Pine Haven
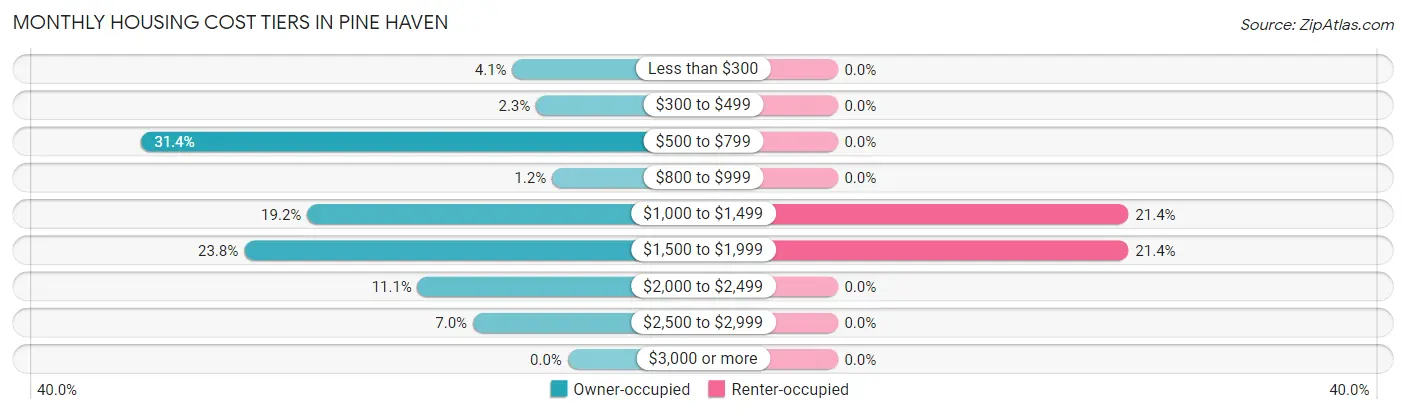
| Monthly Cost | Owner-occupied | Renter-occupied |
| Less than $300 | 7 (4.1%) | 0 (0.0%) |
| $300 to $499 | 4 (2.3%) | 0 (0.0%) |
| $500 to $799 | 54 (31.4%) | 0 (0.0%) |
| $800 to $999 | 2 (1.2%) | 0 (0.0%) |
| $1,000 to $1,499 | 33 (19.2%) | 3 (21.4%) |
| $1,500 to $1,999 | 41 (23.8%) | 3 (21.4%) |
| $2,000 to $2,499 | 19 (11.1%) | 0 (0.0%) |
| $2,500 to $2,999 | 12 (7.0%) | 0 (0.0%) |
| $3,000 or more | 0 (0.0%) | 0 (0.0%) |
| Total | 172 (100.0%) | 14 (100.0%) |
Physical Housing Characteristics in Pine Haven
Housing Structures in Pine Haven
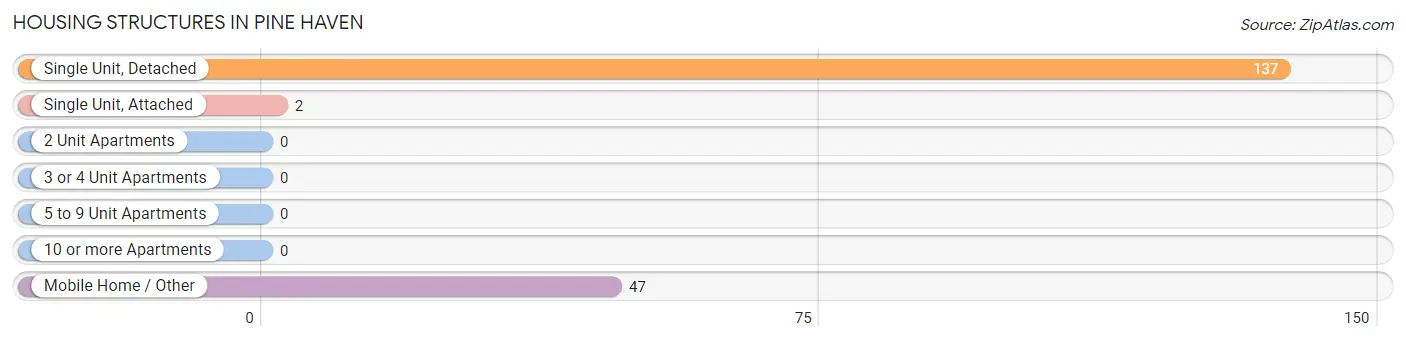
| Structure Type | # Housing Units | % Housing Units |
| Single Unit, Detached | 137 | 73.7% |
| Single Unit, Attached | 2 | 1.1% |
| 2 Unit Apartments | 0 | 0.0% |
| 3 or 4 Unit Apartments | 0 | 0.0% |
| 5 to 9 Unit Apartments | 0 | 0.0% |
| 10 or more Apartments | 0 | 0.0% |
| Mobile Home / Other | 47 | 25.3% |
| Total | 186 | 100.0% |
Housing Structures by Occupancy in Pine Haven
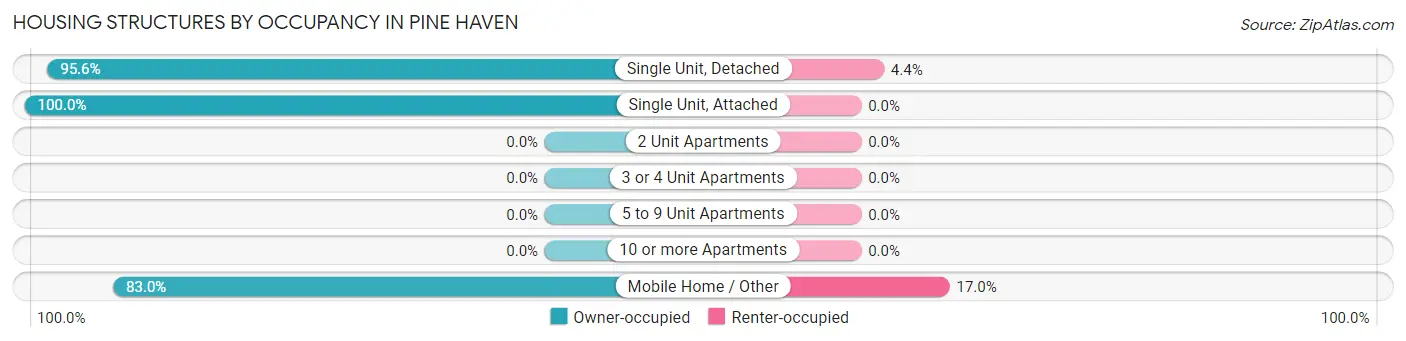
| Structure Type | Owner-occupied | Renter-occupied |
| Single Unit, Detached | 131 (95.6%) | 6 (4.4%) |
| Single Unit, Attached | 2 (100.0%) | 0 (0.0%) |
| 2 Unit Apartments | 0 (0.0%) | 0 (0.0%) |
| 3 or 4 Unit Apartments | 0 (0.0%) | 0 (0.0%) |
| 5 to 9 Unit Apartments | 0 (0.0%) | 0 (0.0%) |
| 10 or more Apartments | 0 (0.0%) | 0 (0.0%) |
| Mobile Home / Other | 39 (83.0%) | 8 (17.0%) |
| Total | 172 (92.5%) | 14 (7.5%) |
Housing Structures by Number of Rooms in Pine Haven
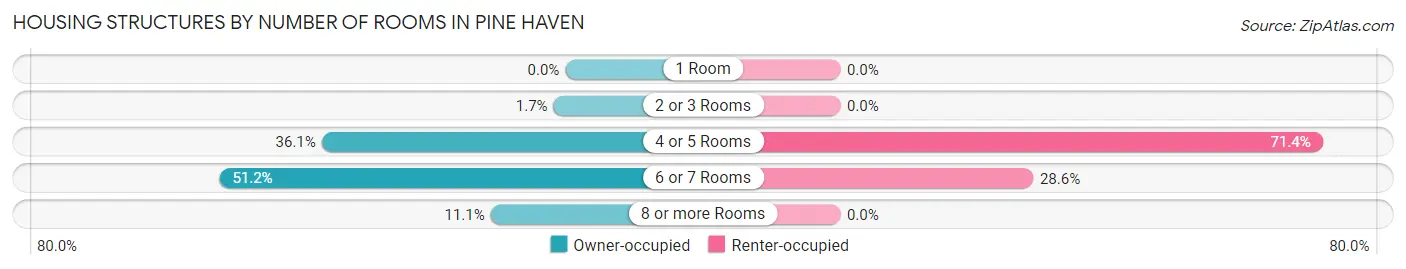
| Number of Rooms | Owner-occupied | Renter-occupied |
| 1 Room | 0 (0.0%) | 0 (0.0%) |
| 2 or 3 Rooms | 3 (1.7%) | 0 (0.0%) |
| 4 or 5 Rooms | 62 (36.0%) | 10 (71.4%) |
| 6 or 7 Rooms | 88 (51.2%) | 4 (28.6%) |
| 8 or more Rooms | 19 (11.1%) | 0 (0.0%) |
| Total | 172 (100.0%) | 14 (100.0%) |
Housing Structure by Heating Type in Pine Haven
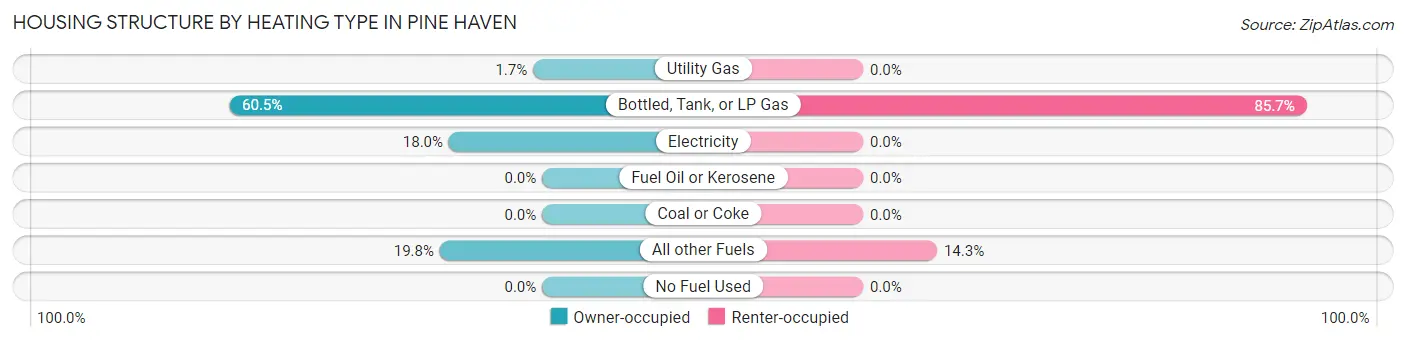
| Heating Type | Owner-occupied | Renter-occupied |
| Utility Gas | 3 (1.7%) | 0 (0.0%) |
| Bottled, Tank, or LP Gas | 104 (60.5%) | 12 (85.7%) |
| Electricity | 31 (18.0%) | 0 (0.0%) |
| Fuel Oil or Kerosene | 0 (0.0%) | 0 (0.0%) |
| Coal or Coke | 0 (0.0%) | 0 (0.0%) |
| All other Fuels | 34 (19.8%) | 2 (14.3%) |
| No Fuel Used | 0 (0.0%) | 0 (0.0%) |
| Total | 172 (100.0%) | 14 (100.0%) |
Household Vehicle Usage in Pine Haven
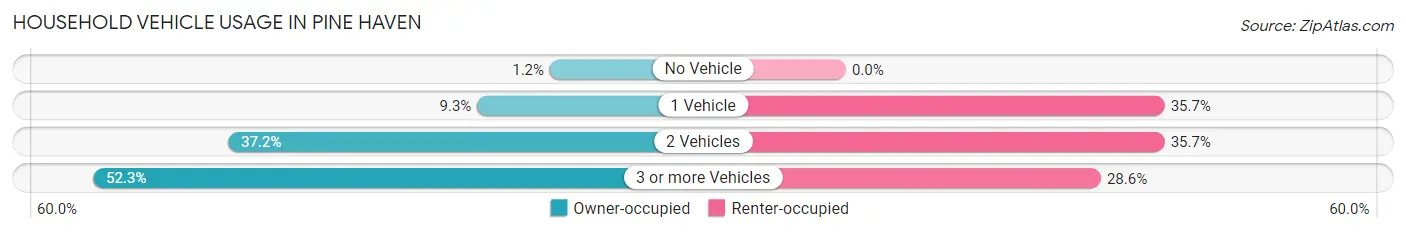
| Vehicles per Household | Owner-occupied | Renter-occupied |
| No Vehicle | 2 (1.2%) | 0 (0.0%) |
| 1 Vehicle | 16 (9.3%) | 5 (35.7%) |
| 2 Vehicles | 64 (37.2%) | 5 (35.7%) |
| 3 or more Vehicles | 90 (52.3%) | 4 (28.6%) |
| Total | 172 (100.0%) | 14 (100.0%) |
Real Estate & Mortgages in Pine Haven
Real Estate and Mortgage Overview in Pine Haven
| Characteristic | Without Mortgage | With Mortgage |
| Housing Units | 67 | 105 |
| Median Property Value | $368,800 | $260,200 |
| Median Household Income | $36,827 | $18 |
| Monthly Housing Costs | $587 | $0 |
| Real Estate Taxes | $1,460 | $4 |
Property Value by Mortgage Status in Pine Haven
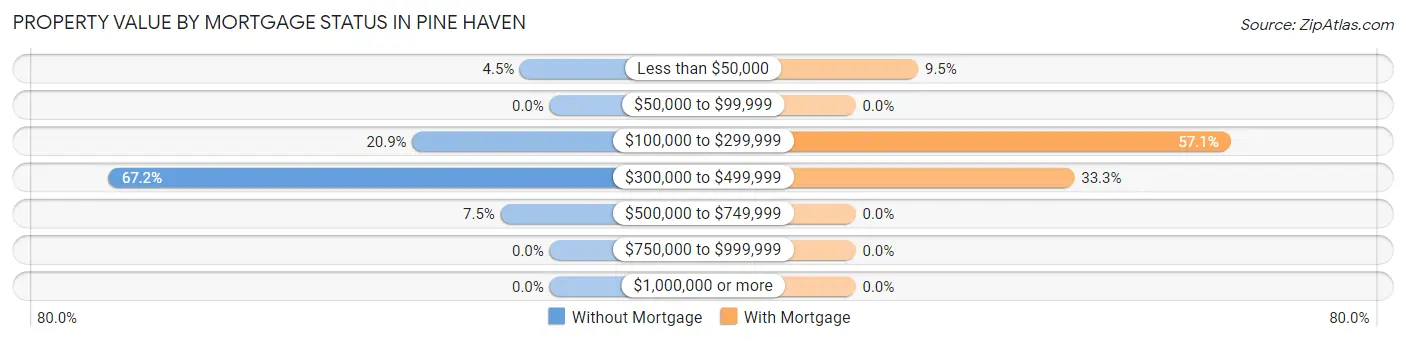
| Property Value | Without Mortgage | With Mortgage |
| Less than $50,000 | 3 (4.5%) | 10 (9.5%) |
| $50,000 to $99,999 | 0 (0.0%) | 0 (0.0%) |
| $100,000 to $299,999 | 14 (20.9%) | 60 (57.1%) |
| $300,000 to $499,999 | 45 (67.2%) | 35 (33.3%) |
| $500,000 to $749,999 | 5 (7.5%) | 0 (0.0%) |
| $750,000 to $999,999 | 0 (0.0%) | 0 (0.0%) |
| $1,000,000 or more | 0 (0.0%) | 0 (0.0%) |
| Total | 67 (100.0%) | 105 (100.0%) |
Household Income by Mortgage Status in Pine Haven
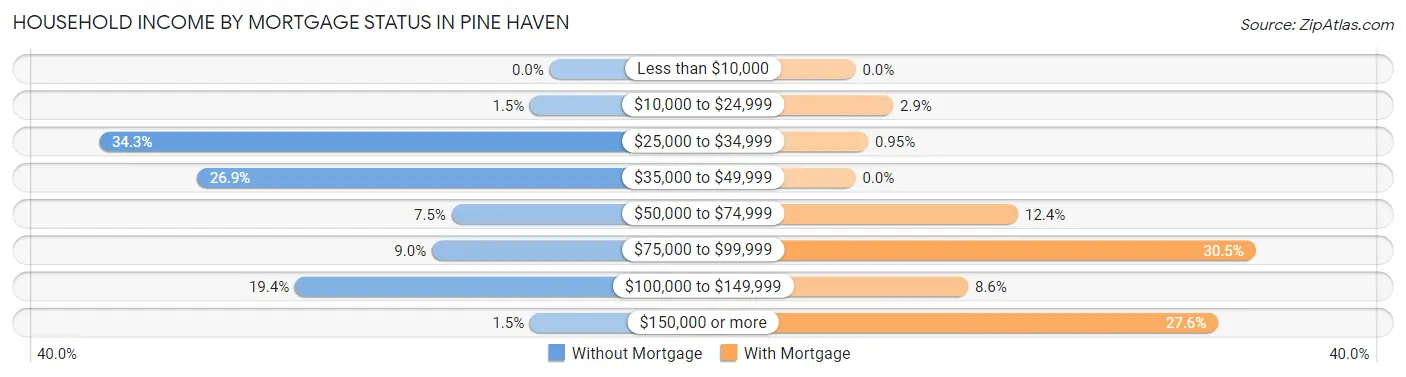
| Household Income | Without Mortgage | With Mortgage |
| Less than $10,000 | 0 (0.0%) | 0 (0.0%) |
| $10,000 to $24,999 | 1 (1.5%) | 3 (2.9%) |
| $25,000 to $34,999 | 23 (34.3%) | 1 (0.9%) |
| $35,000 to $49,999 | 18 (26.9%) | 0 (0.0%) |
| $50,000 to $74,999 | 5 (7.5%) | 13 (12.4%) |
| $75,000 to $99,999 | 6 (9.0%) | 32 (30.5%) |
| $100,000 to $149,999 | 13 (19.4%) | 9 (8.6%) |
| $150,000 or more | 1 (1.5%) | 29 (27.6%) |
| Total | 67 (100.0%) | 105 (100.0%) |
Property Value to Household Income Ratio in Pine Haven
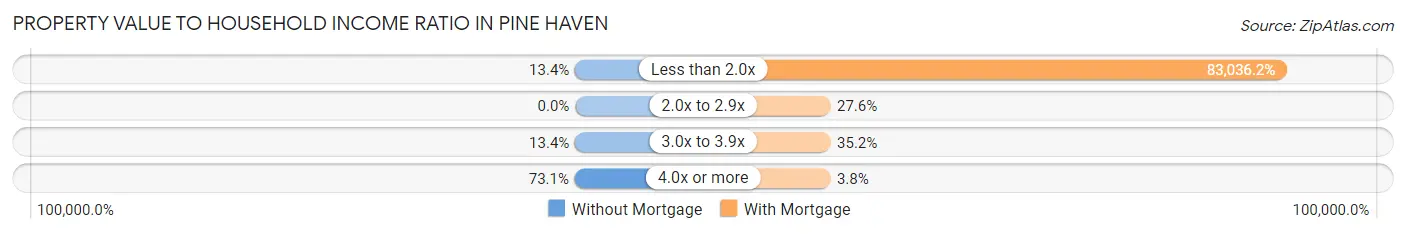
| Value-to-Income Ratio | Without Mortgage | With Mortgage |
| Less than 2.0x | 9 (13.4%) | 87,188 (83,036.2%) |
| 2.0x to 2.9x | 0 (0.0%) | 29 (27.6%) |
| 3.0x to 3.9x | 9 (13.4%) | 37 (35.2%) |
| 4.0x or more | 49 (73.1%) | 4 (3.8%) |
| Total | 67 (100.0%) | 105 (100.0%) |
Real Estate Taxes by Mortgage Status in Pine Haven
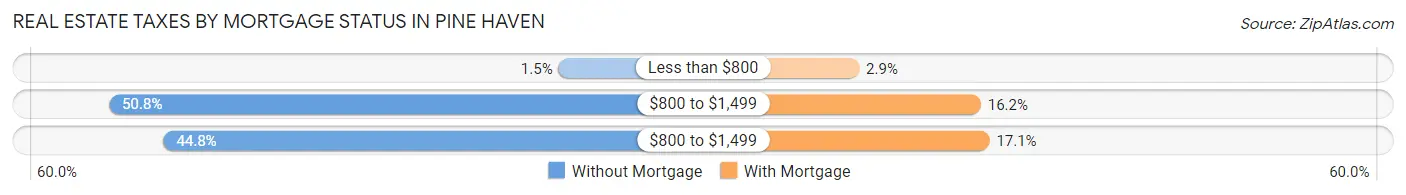
| Property Taxes | Without Mortgage | With Mortgage |
| Less than $800 | 1 (1.5%) | 3 (2.9%) |
| $800 to $1,499 | 34 (50.7%) | 17 (16.2%) |
| $800 to $1,499 | 30 (44.8%) | 18 (17.1%) |
| Total | 67 (100.0%) | 105 (100.0%) |
Health & Disability in Pine Haven
Health Insurance Coverage by Age in Pine Haven
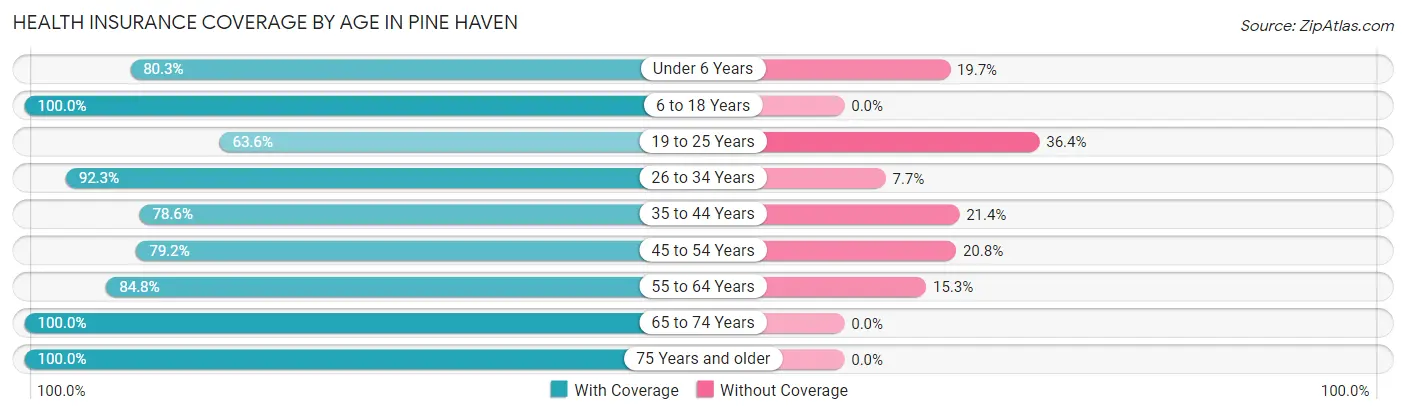
| Age Bracket | With Coverage | Without Coverage |
| Under 6 Years | 53 (80.3%) | 13 (19.7%) |
| 6 to 18 Years | 60 (100.0%) | 0 (0.0%) |
| 19 to 25 Years | 21 (63.6%) | 12 (36.4%) |
| 26 to 34 Years | 36 (92.3%) | 3 (7.7%) |
| 35 to 44 Years | 22 (78.6%) | 6 (21.4%) |
| 45 to 54 Years | 38 (79.2%) | 10 (20.8%) |
| 55 to 64 Years | 50 (84.8%) | 9 (15.2%) |
| 65 to 74 Years | 118 (100.0%) | 0 (0.0%) |
| 75 Years and older | 64 (100.0%) | 0 (0.0%) |
| Total | 462 (89.7%) | 53 (10.3%) |
Health Insurance Coverage by Citizenship Status in Pine Haven
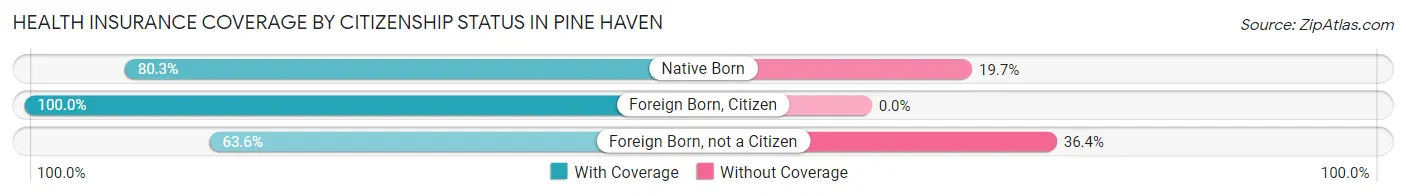
| Citizenship Status | With Coverage | Without Coverage |
| Native Born | 53 (80.3%) | 13 (19.7%) |
| Foreign Born, Citizen | 60 (100.0%) | 0 (0.0%) |
| Foreign Born, not a Citizen | 21 (63.6%) | 12 (36.4%) |
Health Insurance Coverage by Household Income in Pine Haven
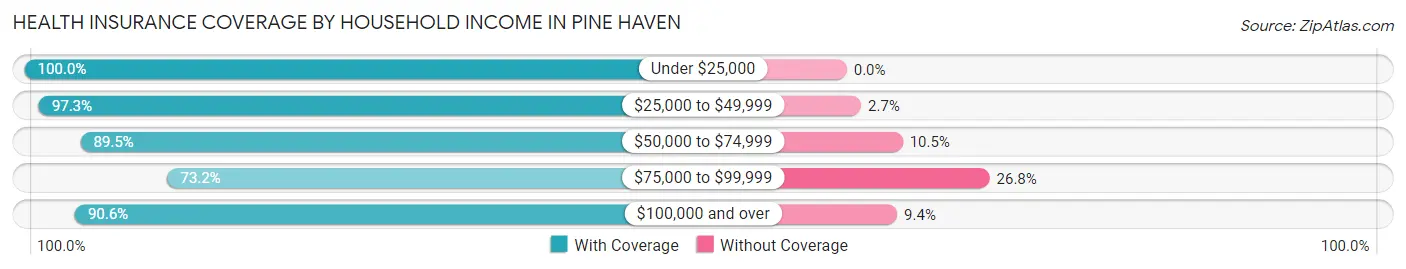
| Household Income | With Coverage | Without Coverage |
| Under $25,000 | 13 (100.0%) | 0 (0.0%) |
| $25,000 to $49,999 | 109 (97.3%) | 3 (2.7%) |
| $50,000 to $74,999 | 77 (89.5%) | 9 (10.5%) |
| $75,000 to $99,999 | 52 (73.2%) | 19 (26.8%) |
| $100,000 and over | 211 (90.6%) | 22 (9.4%) |
Public vs Private Health Insurance Coverage by Age in Pine Haven
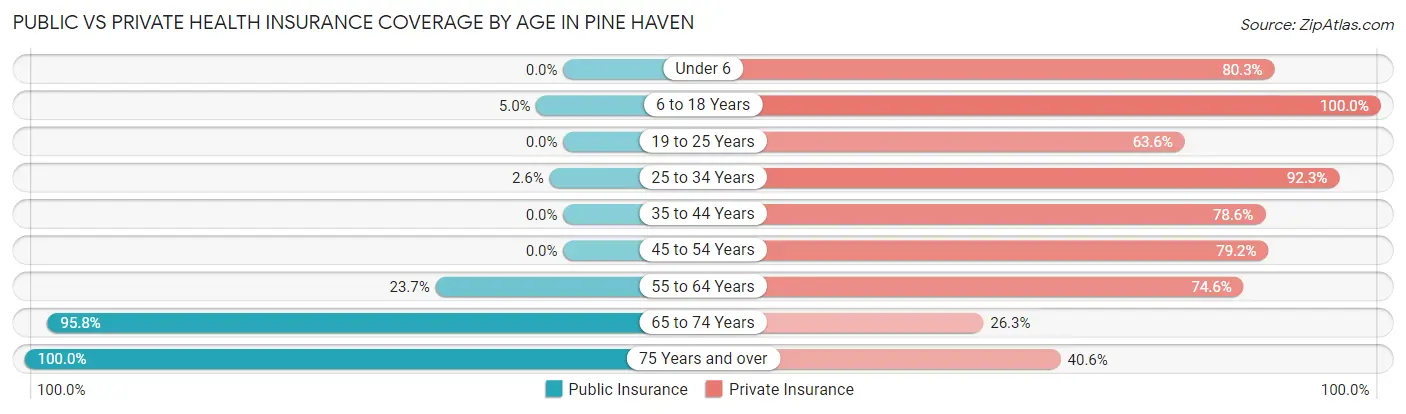
| Age Bracket | Public Insurance | Private Insurance |
| Under 6 | 0 (0.0%) | 53 (80.3%) |
| 6 to 18 Years | 3 (5.0%) | 60 (100.0%) |
| 19 to 25 Years | 0 (0.0%) | 21 (63.6%) |
| 25 to 34 Years | 1 (2.6%) | 36 (92.3%) |
| 35 to 44 Years | 0 (0.0%) | 22 (78.6%) |
| 45 to 54 Years | 0 (0.0%) | 38 (79.2%) |
| 55 to 64 Years | 14 (23.7%) | 44 (74.6%) |
| 65 to 74 Years | 113 (95.8%) | 31 (26.3%) |
| 75 Years and over | 64 (100.0%) | 26 (40.6%) |
| Total | 195 (37.9%) | 331 (64.3%) |
Disability Status by Sex by Age in Pine Haven
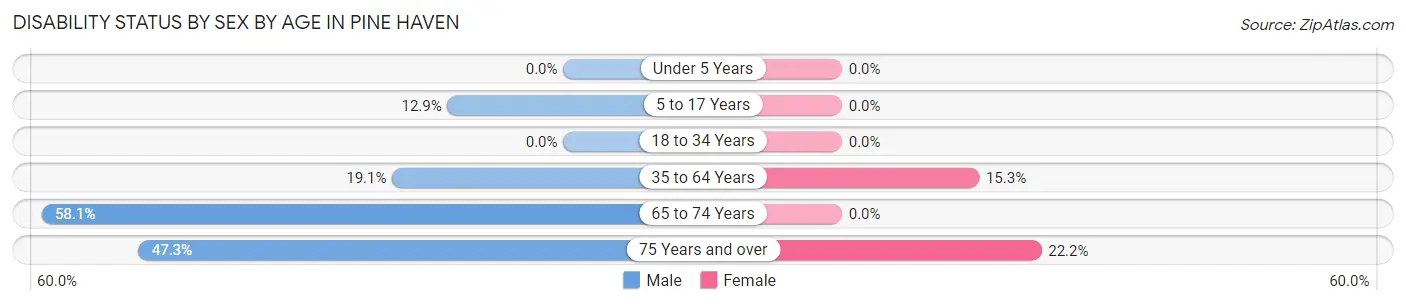
| Age Bracket | Male | Female |
| Under 5 Years | 0 (0.0%) | 0 (0.0%) |
| 5 to 17 Years | 4 (12.9%) | 0 (0.0%) |
| 18 to 34 Years | 0 (0.0%) | 0 (0.0%) |
| 35 to 64 Years | 12 (19.1%) | 11 (15.3%) |
| 65 to 74 Years | 36 (58.1%) | 0 (0.0%) |
| 75 Years and over | 26 (47.3%) | 2 (22.2%) |
Disability Class by Sex by Age in Pine Haven
Disability Class: Hearing Difficulty
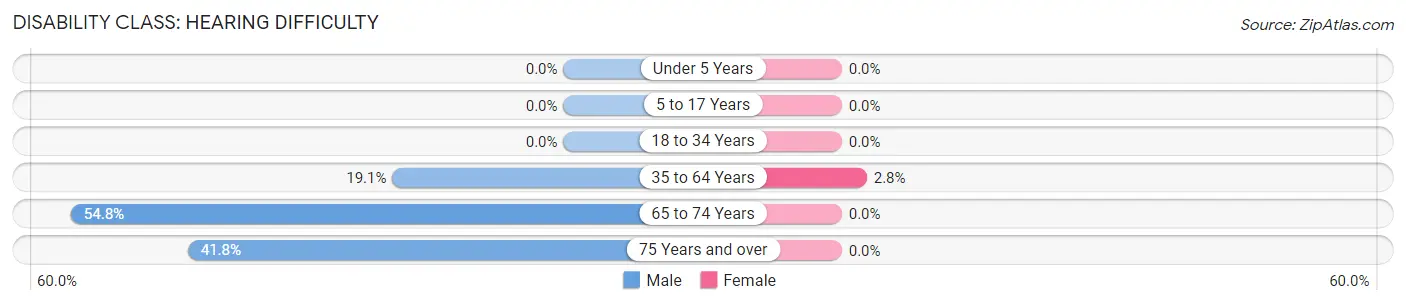
| Age Bracket | Male | Female |
| Under 5 Years | 0 (0.0%) | 0 (0.0%) |
| 5 to 17 Years | 0 (0.0%) | 0 (0.0%) |
| 18 to 34 Years | 0 (0.0%) | 0 (0.0%) |
| 35 to 64 Years | 12 (19.1%) | 2 (2.8%) |
| 65 to 74 Years | 34 (54.8%) | 0 (0.0%) |
| 75 Years and over | 23 (41.8%) | 0 (0.0%) |
Disability Class: Vision Difficulty
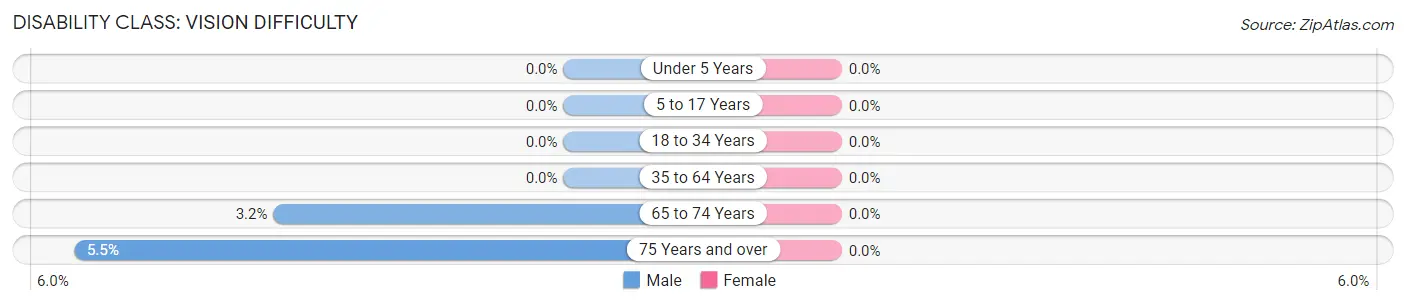
| Age Bracket | Male | Female |
| Under 5 Years | 0 (0.0%) | 0 (0.0%) |
| 5 to 17 Years | 0 (0.0%) | 0 (0.0%) |
| 18 to 34 Years | 0 (0.0%) | 0 (0.0%) |
| 35 to 64 Years | 0 (0.0%) | 0 (0.0%) |
| 65 to 74 Years | 2 (3.2%) | 0 (0.0%) |
| 75 Years and over | 3 (5.4%) | 0 (0.0%) |
Disability Class: Cognitive Difficulty
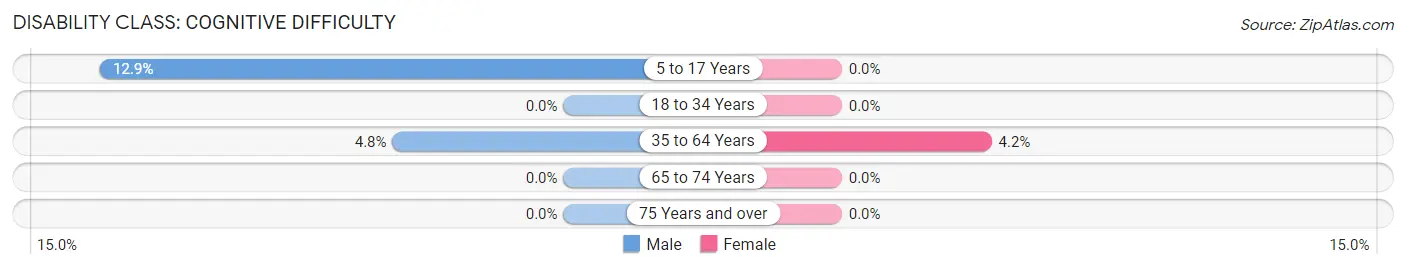
| Age Bracket | Male | Female |
| 5 to 17 Years | 4 (12.9%) | 0 (0.0%) |
| 18 to 34 Years | 0 (0.0%) | 0 (0.0%) |
| 35 to 64 Years | 3 (4.8%) | 3 (4.2%) |
| 65 to 74 Years | 0 (0.0%) | 0 (0.0%) |
| 75 Years and over | 0 (0.0%) | 0 (0.0%) |
Disability Class: Ambulatory Difficulty
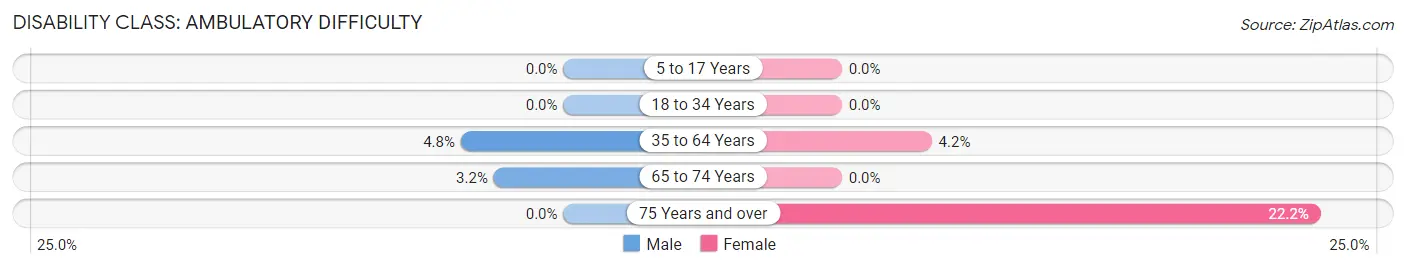
| Age Bracket | Male | Female |
| 5 to 17 Years | 0 (0.0%) | 0 (0.0%) |
| 18 to 34 Years | 0 (0.0%) | 0 (0.0%) |
| 35 to 64 Years | 3 (4.8%) | 3 (4.2%) |
| 65 to 74 Years | 2 (3.2%) | 0 (0.0%) |
| 75 Years and over | 0 (0.0%) | 2 (22.2%) |
Disability Class: Self-Care Difficulty
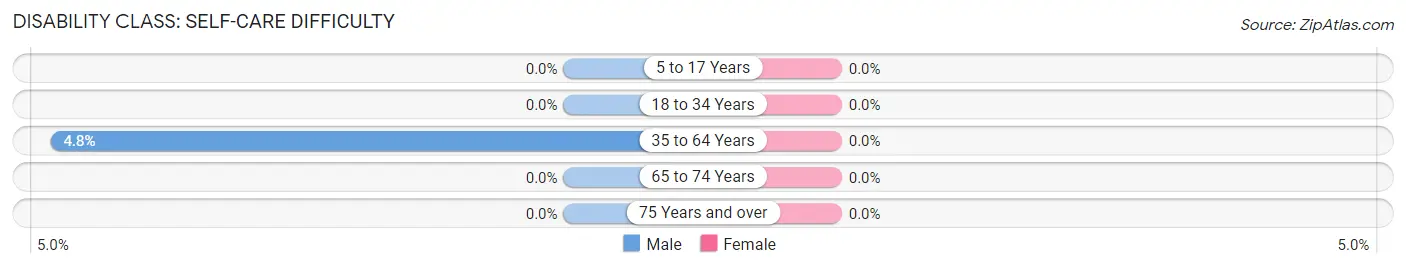
| Age Bracket | Male | Female |
| 5 to 17 Years | 0 (0.0%) | 0 (0.0%) |
| 18 to 34 Years | 0 (0.0%) | 0 (0.0%) |
| 35 to 64 Years | 3 (4.8%) | 0 (0.0%) |
| 65 to 74 Years | 0 (0.0%) | 0 (0.0%) |
| 75 Years and over | 0 (0.0%) | 0 (0.0%) |
Technology Access in Pine Haven
Computing Device Access in Pine Haven
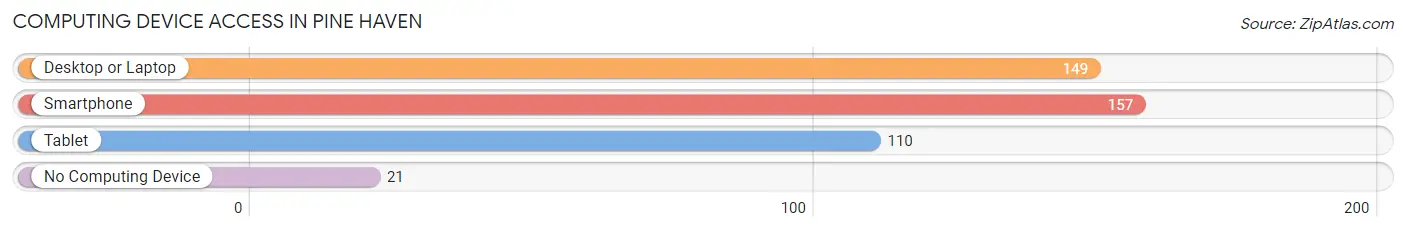
| Device Type | # Households | % Households |
| Desktop or Laptop | 149 | 80.1% |
| Smartphone | 157 | 84.4% |
| Tablet | 110 | 59.1% |
| No Computing Device | 21 | 11.3% |
| Total | 186 | 100.0% |
Internet Access in Pine Haven
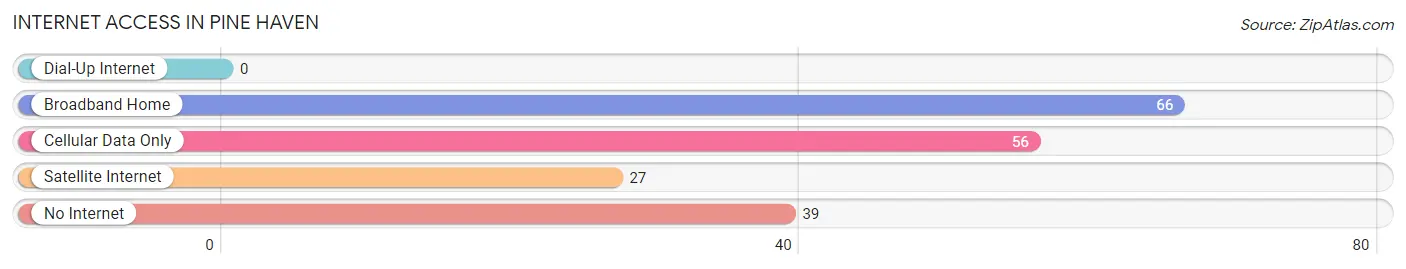
| Internet Type | # Households | % Households |
| Dial-Up Internet | 0 | 0.0% |
| Broadband Home | 66 | 35.5% |
| Cellular Data Only | 56 | 30.1% |
| Satellite Internet | 27 | 14.5% |
| No Internet | 39 | 21.0% |
| Total | 186 | 100.0% |
Pine Haven Summary
Pine Haven, Wyoming is a small town located in the northeastern corner of the state, near the border of South Dakota. It is situated in the foothills of the Black Hills, and is surrounded by rolling hills and prairies. The town has a population of approximately 500 people, and is the county seat of Crook County.
History
Pine Haven was founded in 1883 by a group of homesteaders who were looking for a place to settle and start a new life. The town was originally called “Piney”, but the name was changed to Pine Haven in 1885. The town was incorporated in 1889, and the first post office was established in 1890.
The town grew slowly, but steadily, and by the early 1900s, it had become a thriving community. The town was home to several businesses, including a general store, a blacksmith shop, a hotel, and a saloon. The town also had a school, a church, and a newspaper.
In the 1920s, the town experienced a period of growth and prosperity. The population increased, and new businesses opened, including a bank, a movie theater, and a hardware store. The town also had a library, a hospital, and a fire department.
Geography
Pine Haven is located in the northeastern corner of Wyoming, near the border of South Dakota. It is situated in the foothills of the Black Hills, and is surrounded by rolling hills and prairies. The town is located at an elevation of 4,400 feet, and has a total area of 1.2 square miles.
The climate in Pine Haven is semi-arid, with hot summers and cold winters. The average annual temperature is 48 degrees Fahrenheit, and the average annual precipitation is 16 inches.
Economy
The economy of Pine Haven is largely based on agriculture and tourism. The town is home to several farms, which produce a variety of crops, including wheat, corn, and hay. The town also has several tourist attractions, including a museum, a golf course, and a ski resort.
The town also has several small businesses, including restaurants, shops, and a gas station. The town is also home to a branch of the Crook County Bank.
Demographics
As of the 2010 census, the population of Pine Haven was 498 people. The racial makeup of the town was 97.2% White, 0.2% African American, 0.4% Native American, 0.2% Asian, 0.2% from other races, and 1.9% from two or more races. Hispanic or Latino of any race were 1.2% of the population.
The median income for a household in Pine Haven was $37,500, and the median income for a family was $41,250. The per capita income for the town was $17,845. About 11.2% of families and 13.2% of the population were below the poverty line, including 16.7% of those under age 18 and 8.3% of those age 65 or over.
Common Questions
What is Per Capita Income in Pine Haven?
Per Capita income in Pine Haven is $31,018.
What is the Median Family Income in Pine Haven?
Median Family Income in Pine Haven is $77,625.
What is the Median Household income in Pine Haven?
Median Household Income in Pine Haven is $61,000.
What is Income or Wage Gap in Pine Haven?
Income or Wage Gap in Pine Haven is 15.2%.
Women in Pine Haven earn 84.8 cents for every dollar earned by a man.
What is Inequality or Gini Index in Pine Haven?
Inequality or Gini Index in Pine Haven is 0.36.
What is the Total Population of Pine Haven?
Total Population of Pine Haven is 515.
What is the Total Male Population of Pine Haven?
Total Male Population of Pine Haven is 257.
What is the Total Female Population of Pine Haven?
Total Female Population of Pine Haven is 258.
What is the Ratio of Males per 100 Females in Pine Haven?
There are 99.61 Males per 100 Females in Pine Haven.
What is the Ratio of Females per 100 Males in Pine Haven?
There are 100.39 Females per 100 Males in Pine Haven.
What is the Median Population Age in Pine Haven?
Median Population Age in Pine Haven is 53.2 Years.
What is the Average Family Size in Pine Haven
Average Family Size in Pine Haven is 3.3 People.
What is the Average Household Size in Pine Haven
Average Household Size in Pine Haven is 2.8 People.
How Large is the Labor Force in Pine Haven?
There are 188 People in the Labor Forcein in Pine Haven.
What is the Percentage of People in the Labor Force in Pine Haven?
48.0% of People are in the Labor Force in Pine Haven.
What is the Unemployment Rate in Pine Haven?
Unemployment Rate in Pine Haven is 1.6%.