Independence, MN Map & Demographics
Independence Map
Independence Overview
$86,887
PER CAPITA INCOME
$216,328
AVG FAMILY INCOME
$191,736
AVG HOUSEHOLD INCOME
49.6%
WAGE / INCOME GAP [ % ]
50.4¢/ $1
WAGE / INCOME GAP [ $ ]
0.47
INEQUALITY / GINI INDEX
3,718
TOTAL POPULATION
1,946
MALE POPULATION
1,772
FEMALE POPULATION
109.82
MALES / 100 FEMALES
91.06
FEMALES / 100 MALES
41.9
MEDIAN AGE
3.3
AVG FAMILY SIZE
3.1
AVG HOUSEHOLD SIZE
1,808
LABOR FORCE [ PEOPLE ]
66.3%
PERCENT IN LABOR FORCE
Income in Independence
Income Overview in Independence
Per Capita Income in Independence is $86,887, while median incomes of families and households are $216,328 and $191,736 respectively.
| Characteristic | Number | Measure |
| Per Capita Income | 3,718 | $86,887 |
| Median Family Income | 1,055 | $216,328 |
| Mean Family Income | 1,055 | $264,441 |
| Median Household Income | 1,196 | $191,736 |
| Mean Household Income | 1,196 | $266,059 |
| Income Deficit | 1,055 | $0 |
| Wage / Income Gap (%) | 3,718 | 49.56% |
| Wage / Income Gap ($) | 3,718 | 50.44¢ per $1 |
| Gini / Inequality Index | 3,718 | 0.47 |
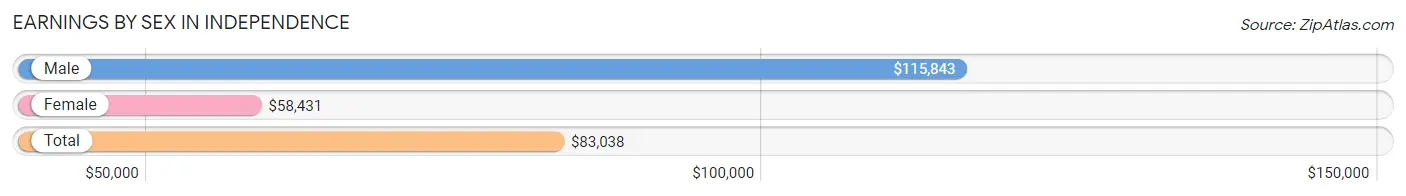
Earnings by Sex in Independence
Average Earnings in Independence are $83,038, $115,843 for men and $58,431 for women, a difference of 49.6%.
| Sex | Number | Average Earnings |
| Male | 1,021 (52.3%) | $115,843 |
| Female | 930 (47.7%) | $58,431 |
| Total | 1,951 (100.0%) | $83,038 |
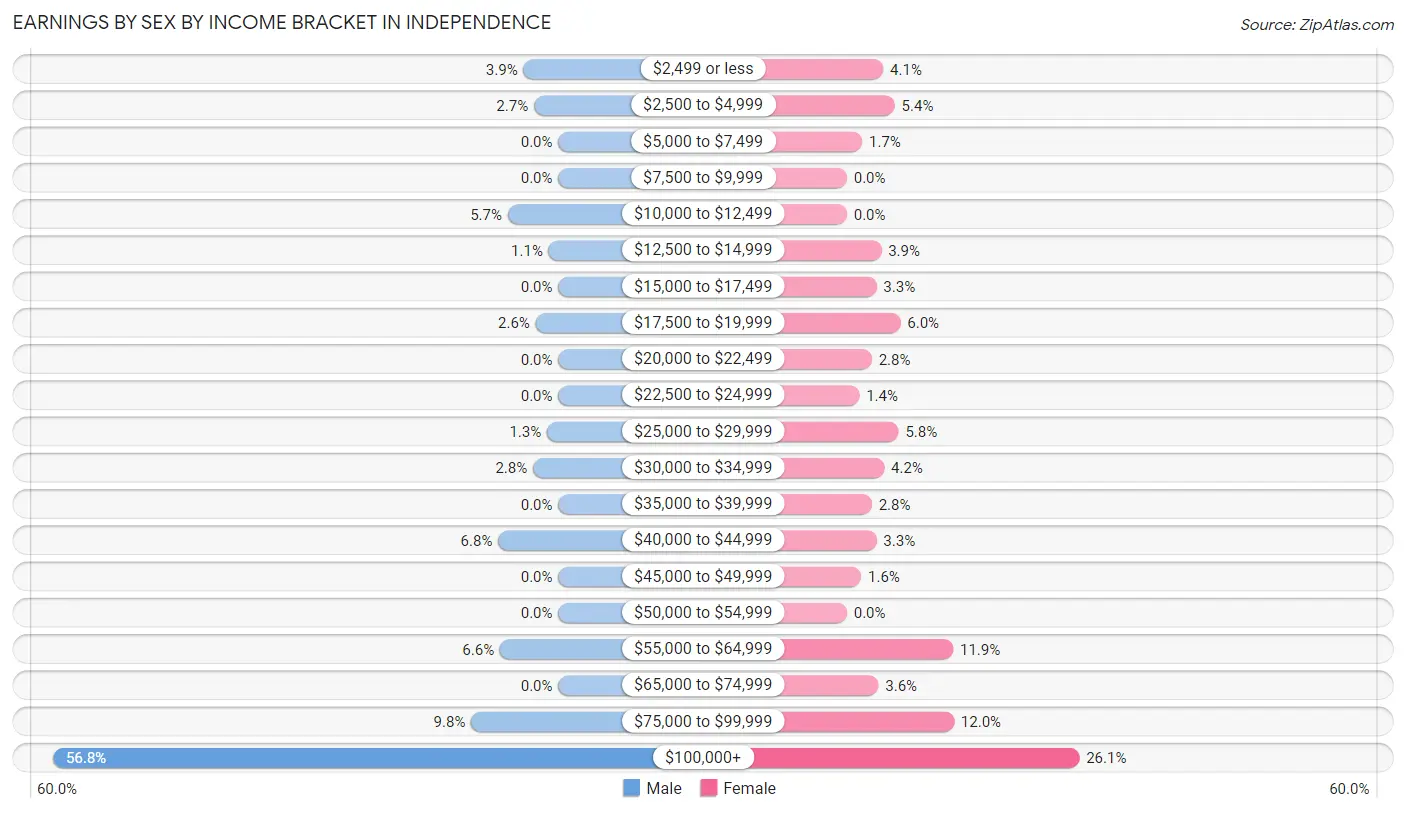
Earnings by Sex by Income Bracket in Independence
The most common earnings brackets in Independence are $100,000+ for men (580 | 56.8%) and $100,000+ for women (243 | 26.1%).
| Income | Male | Female |
| $2,499 or less | 40 (3.9%) | 38 (4.1%) |
| $2,500 to $4,999 | 28 (2.7%) | 50 (5.4%) |
| $5,000 to $7,499 | 0 (0.0%) | 16 (1.7%) |
| $7,500 to $9,999 | 0 (0.0%) | 0 (0.0%) |
| $10,000 to $12,499 | 58 (5.7%) | 0 (0.0%) |
| $12,500 to $14,999 | 11 (1.1%) | 36 (3.9%) |
| $15,000 to $17,499 | 0 (0.0%) | 31 (3.3%) |
| $17,500 to $19,999 | 26 (2.5%) | 56 (6.0%) |
| $20,000 to $22,499 | 0 (0.0%) | 26 (2.8%) |
| $22,500 to $24,999 | 0 (0.0%) | 13 (1.4%) |
| $25,000 to $29,999 | 13 (1.3%) | 54 (5.8%) |
| $30,000 to $34,999 | 29 (2.8%) | 39 (4.2%) |
| $35,000 to $39,999 | 0 (0.0%) | 26 (2.8%) |
| $40,000 to $44,999 | 69 (6.8%) | 31 (3.3%) |
| $45,000 to $49,999 | 0 (0.0%) | 15 (1.6%) |
| $50,000 to $54,999 | 0 (0.0%) | 0 (0.0%) |
| $55,000 to $64,999 | 67 (6.6%) | 111 (11.9%) |
| $65,000 to $74,999 | 0 (0.0%) | 33 (3.5%) |
| $75,000 to $99,999 | 100 (9.8%) | 112 (12.0%) |
| $100,000+ | 580 (56.8%) | 243 (26.1%) |
| Total | 1,021 (100.0%) | 930 (100.0%) |
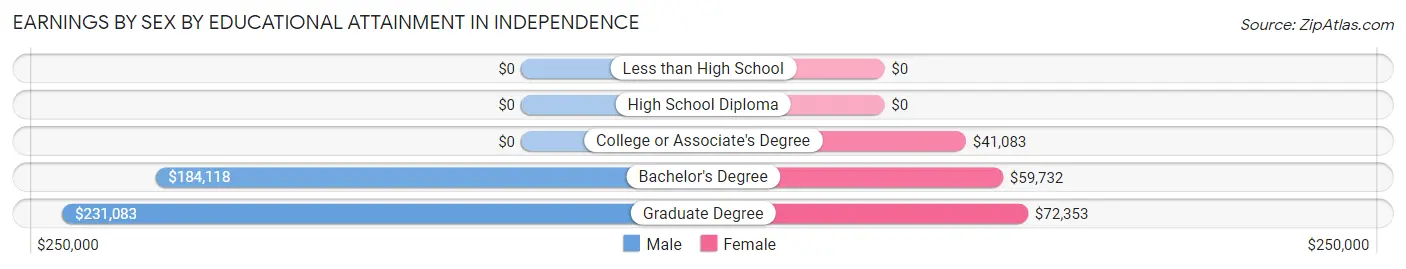
Earnings by Sex by Educational Attainment in Independence
Average earnings in Independence are $128,816 for men and $59,608 for women, a difference of 53.7%. Men with an educational attainment of graduate degree enjoy the highest average annual earnings of $231,083, while those with bachelor's degree education earn the least with $184,118. Women with an educational attainment of graduate degree earn the most with the average annual earnings of $72,353, while those with college or associate's degree education have the smallest earnings of $41,083.
| Educational Attainment | Male Income | Female Income |
| Less than High School | - | - |
| High School Diploma | - | - |
| College or Associate's Degree | - | - |
| Bachelor's Degree | $184,118 | $59,732 |
| Graduate Degree | $231,083 | $72,353 |
| Total | $128,816 | $59,608 |
Family Income in Independence
Family Income Brackets in Independence
According to the Independence family income data, there are 560 families falling into the $200,000+ income range, which is the most common income bracket and makes up 53.1% of all families.
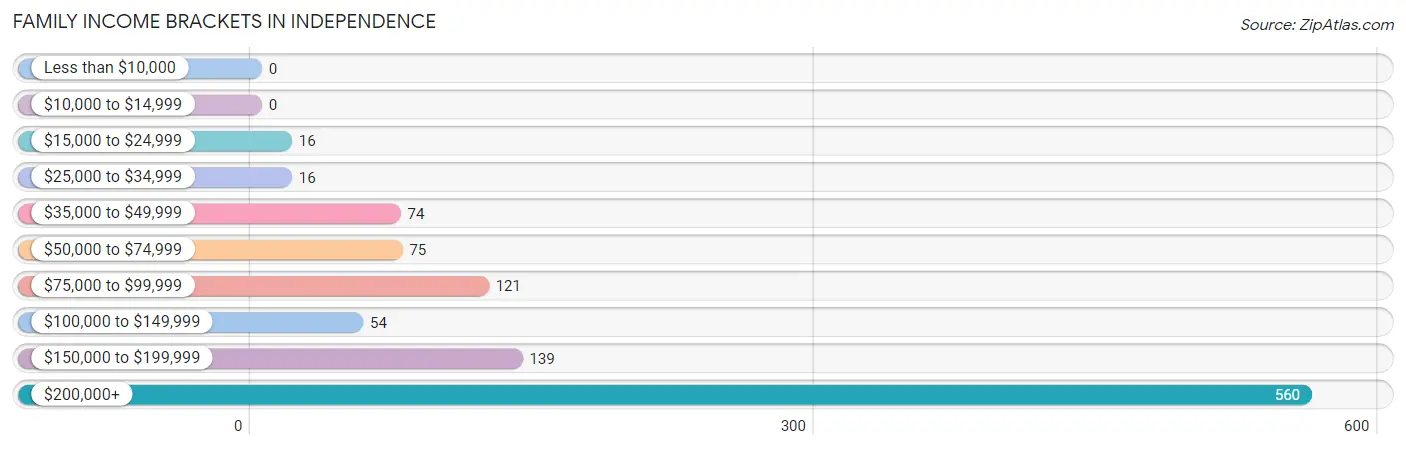
| Income Bracket | # Families | % Families |
| Less than $10,000 | 0 | 0.0% |
| $10,000 to $14,999 | 0 | 0.0% |
| $15,000 to $24,999 | 16 | 1.5% |
| $25,000 to $34,999 | 16 | 1.5% |
| $35,000 to $49,999 | 74 | 7.0% |
| $50,000 to $74,999 | 75 | 7.1% |
| $75,000 to $99,999 | 121 | 11.5% |
| $100,000 to $149,999 | 54 | 5.1% |
| $150,000 to $199,999 | 139 | 13.2% |
| $200,000+ | 560 | 53.1% |
Family Income by Famaliy Size in Independence
3-person families (72 | 6.8%) account for the highest median family income in Independence with $250,001 per family, while 3-person families (72 | 6.8%) have the highest median income of $83,334 per family member.
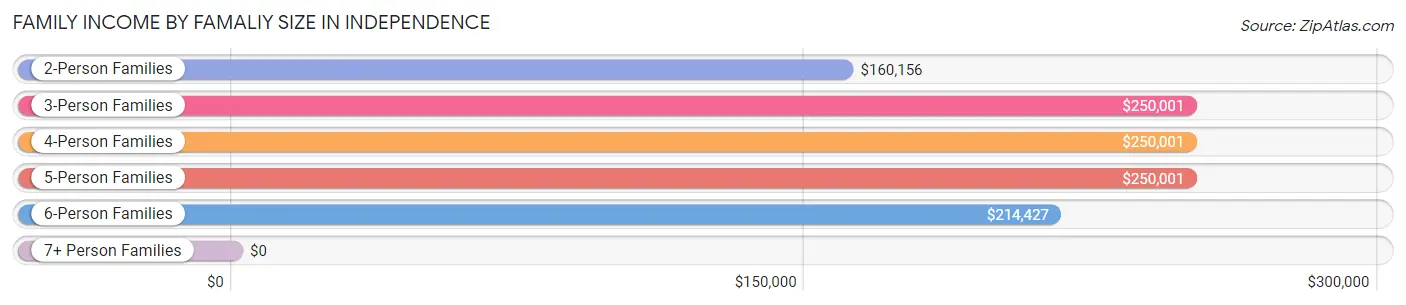
| Income Bracket | # Families | Median Income |
| 2-Person Families | 460 (43.6%) | $160,156 |
| 3-Person Families | 72 (6.8%) | $250,001 |
| 4-Person Families | 364 (34.5%) | $250,001 |
| 5-Person Families | 92 (8.7%) | $250,001 |
| 6-Person Families | 67 (6.4%) | $214,427 |
| 7+ Person Families | 0 (0.0%) | $0 |
| Total | 1,055 (100.0%) | $216,328 |
Family Income by Number of Earners in Independence
The median family income in Independence is $216,328, with families comprising 2 earners (516) having the highest median family income of $250,001, while families with no earners (166) have the lowest median family income of $80,833, accounting for 48.9% and 15.7% of families, respectively.

| Number of Earners | # Families | Median Income |
| No Earners | 166 (15.7%) | $80,833 |
| 1 Earner | 214 (20.3%) | $169,405 |
| 2 Earners | 516 (48.9%) | $250,001 |
| 3+ Earners | 159 (15.1%) | $250,001 |
| Total | 1,055 (100.0%) | $216,328 |
Household Income in Independence
Household Income Brackets in Independence
With 575 households falling in the category, the $200,000+ income range is the most frequent in Independence, accounting for 48.1% of all households.
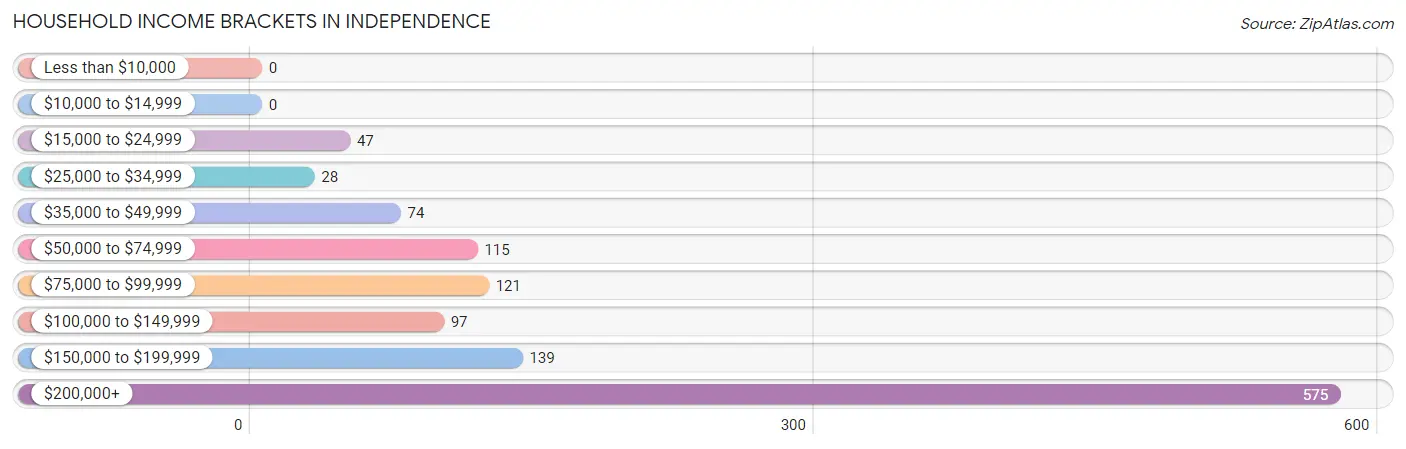
| Income Bracket | # Households | % Households |
| Less than $10,000 | 0 | 0.0% |
| $10,000 to $14,999 | 0 | 0.0% |
| $15,000 to $24,999 | 47 | 3.9% |
| $25,000 to $34,999 | 28 | 2.3% |
| $35,000 to $49,999 | 74 | 6.2% |
| $50,000 to $74,999 | 115 | 9.6% |
| $75,000 to $99,999 | 121 | 10.1% |
| $100,000 to $149,999 | 97 | 8.1% |
| $150,000 to $199,999 | 139 | 11.6% |
| $200,000+ | 575 | 48.1% |
Household Income by Householder Age in Independence
The median household income in Independence is $191,736, with the highest median household income of $250,001 found in the 25 to 44 years age bracket for the primary householder. A total of 242 households (20.2%) fall into this category.
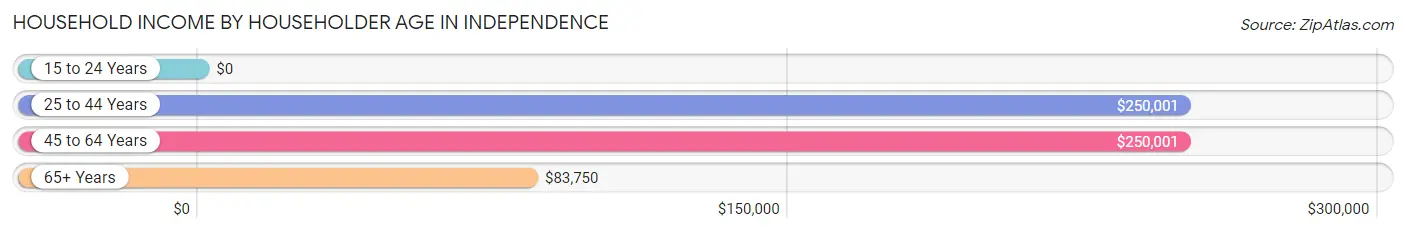
| Income Bracket | # Households | Median Income |
| 15 to 24 Years | 0 (0.0%) | $0 |
| 25 to 44 Years | 242 (20.2%) | $250,001 |
| 45 to 64 Years | 548 (45.8%) | $250,001 |
| 65+ Years | 406 (34.0%) | $83,750 |
| Total | 1,196 (100.0%) | $191,736 |
Poverty in Independence
Income Below Poverty by Sex and Age in Independence
With 0.3% poverty level for males and 0.4% for females among the residents of Independence, 25 to 34 year old males and 45 to 54 year old females are the most vulnerable to poverty, with 6 males (8.0%) and 8 females (3.3%) in their respective age groups living below the poverty level.
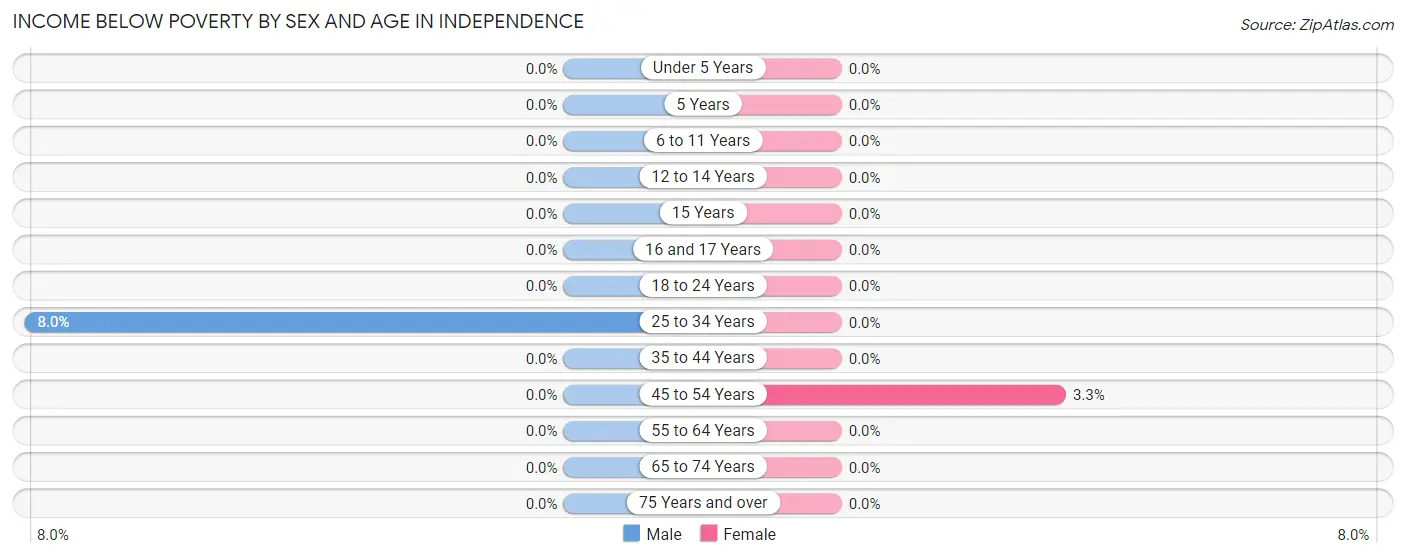
| Age Bracket | Male | Female |
| Under 5 Years | 0 (0.0%) | 0 (0.0%) |
| 5 Years | 0 (0.0%) | 0 (0.0%) |
| 6 to 11 Years | 0 (0.0%) | 0 (0.0%) |
| 12 to 14 Years | 0 (0.0%) | 0 (0.0%) |
| 15 Years | 0 (0.0%) | 0 (0.0%) |
| 16 and 17 Years | 0 (0.0%) | 0 (0.0%) |
| 18 to 24 Years | 0 (0.0%) | 0 (0.0%) |
| 25 to 34 Years | 6 (8.0%) | 0 (0.0%) |
| 35 to 44 Years | 0 (0.0%) | 0 (0.0%) |
| 45 to 54 Years | 0 (0.0%) | 8 (3.3%) |
| 55 to 64 Years | 0 (0.0%) | 0 (0.0%) |
| 65 to 74 Years | 0 (0.0%) | 0 (0.0%) |
| 75 Years and over | 0 (0.0%) | 0 (0.0%) |
| Total | 6 (0.3%) | 8 (0.4%) |
Income Above Poverty by Sex and Age in Independence
According to the poverty statistics in Independence, males aged under 5 years and females aged under 5 years are the age groups that are most secure financially, with 100.0% of males and 100.0% of females in these age groups living above the poverty line.
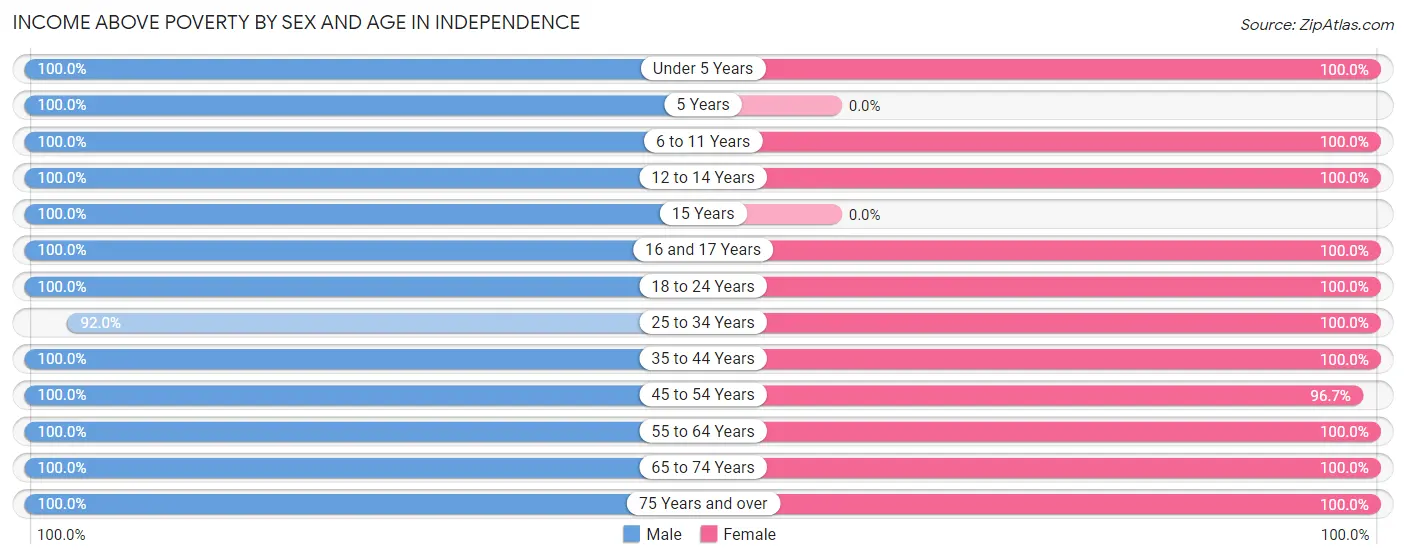
| Age Bracket | Male | Female |
| Under 5 Years | 106 (100.0%) | 162 (100.0%) |
| 5 Years | 32 (100.0%) | 0 (0.0%) |
| 6 to 11 Years | 345 (100.0%) | 149 (100.0%) |
| 12 to 14 Years | 50 (100.0%) | 81 (100.0%) |
| 15 Years | 66 (100.0%) | 0 (0.0%) |
| 16 and 17 Years | 65 (100.0%) | 14 (100.0%) |
| 18 to 24 Years | 64 (100.0%) | 88 (100.0%) |
| 25 to 34 Years | 69 (92.0%) | 99 (100.0%) |
| 35 to 44 Years | 253 (100.0%) | 263 (100.0%) |
| 45 to 54 Years | 235 (100.0%) | 232 (96.7%) |
| 55 to 64 Years | 331 (100.0%) | 320 (100.0%) |
| 65 to 74 Years | 216 (100.0%) | 239 (100.0%) |
| 75 Years and over | 108 (100.0%) | 117 (100.0%) |
| Total | 1,940 (99.7%) | 1,764 (99.6%) |
Income Below Poverty Among Married-Couple Families in Independence
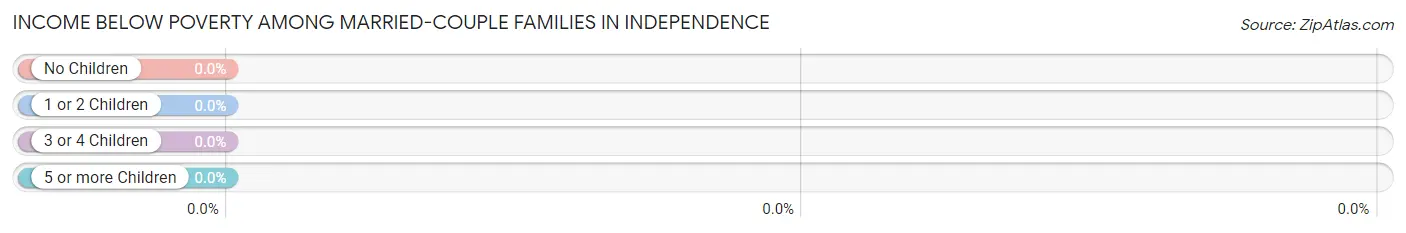
| Children | Above Poverty | Below Poverty |
| No Children | 481 (100.0%) | 0 (0.0%) |
| 1 or 2 Children | 382 (100.0%) | 0 (0.0%) |
| 3 or 4 Children | 101 (100.0%) | 0 (0.0%) |
| 5 or more Children | 0 (0.0%) | 0 (0.0%) |
| Total | 964 (100.0%) | 0 (0.0%) |
Income Below Poverty Among Single-Parent Households in Independence
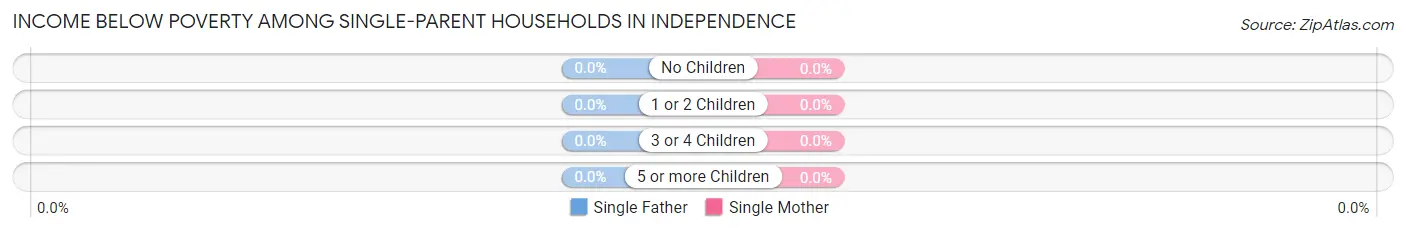
| Children | Single Father | Single Mother |
| No Children | 0 (0.0%) | 0 (0.0%) |
| 1 or 2 Children | 0 (0.0%) | 0 (0.0%) |
| 3 or 4 Children | 0 (0.0%) | 0 (0.0%) |
| 5 or more Children | 0 (0.0%) | 0 (0.0%) |
| Total | 0 (0.0%) | 0 (0.0%) |
Income Below Poverty Among Married-Couple vs Single-Parent Households in Independence
| Children | Married-Couple Families | Single-Parent Households |
| No Children | 0 (0.0%) | 0 (0.0%) |
| 1 or 2 Children | 0 (0.0%) | 0 (0.0%) |
| 3 or 4 Children | 0 (0.0%) | 0 (0.0%) |
| 5 or more Children | 0 (0.0%) | 0 (0.0%) |
| Total | 0 (0.0%) | 0 (0.0%) |
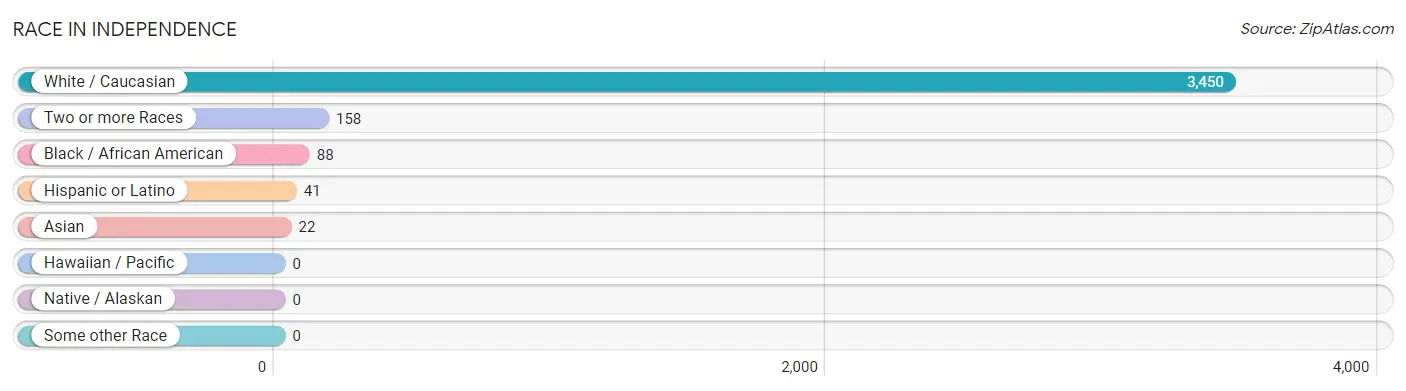
Race in Independence
The most populous races in Independence are White / Caucasian (3,450 | 92.8%), Two or more Races (158 | 4.3%), and Black / African American (88 | 2.4%).
| Race | # Population | % Population |
| Asian | 22 | 0.6% |
| Black / African American | 88 | 2.4% |
| Hawaiian / Pacific | 0 | 0.0% |
| Hispanic or Latino | 41 | 1.1% |
| Native / Alaskan | 0 | 0.0% |
| White / Caucasian | 3,450 | 92.8% |
| Two or more Races | 158 | 4.3% |
| Some other Race | 0 | 0.0% |
| Total | 3,718 | 100.0% |
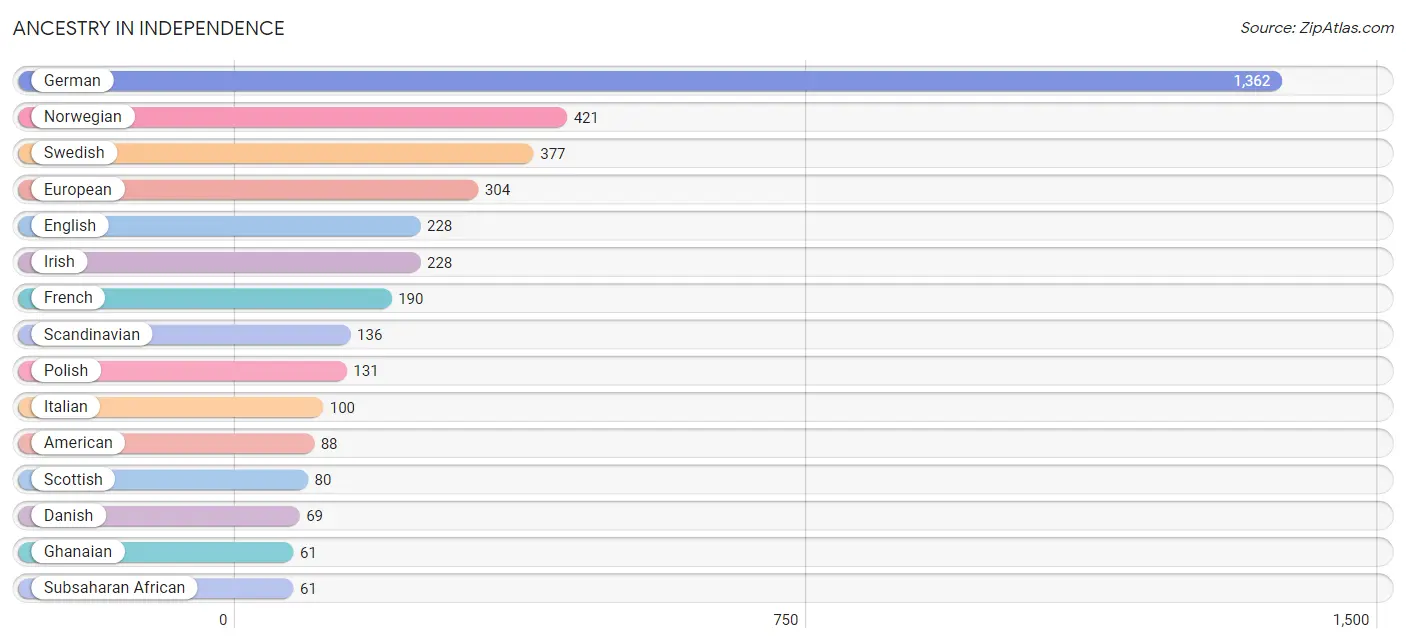
Ancestry in Independence
The most populous ancestries reported in Independence are German (1,362 | 36.6%), Norwegian (421 | 11.3%), Swedish (377 | 10.1%), European (304 | 8.2%), and English (228 | 6.1%), together accounting for 72.4% of all Independence residents.
| Ancestry | # Population | % Population |
| American | 88 | 2.4% |
| Austrian | 11 | 0.3% |
| Brazilian | 12 | 0.3% |
| Burmese | 15 | 0.4% |
| Chippewa | 16 | 0.4% |
| Czech | 23 | 0.6% |
| Danish | 69 | 1.9% |
| Dutch | 60 | 1.6% |
| Eastern European | 10 | 0.3% |
| English | 228 | 6.1% |
| European | 304 | 8.2% |
| Finnish | 32 | 0.9% |
| French | 190 | 5.1% |
| French Canadian | 11 | 0.3% |
| German | 1,362 | 36.6% |
| Ghanaian | 61 | 1.6% |
| Greek | 24 | 0.6% |
| Irish | 228 | 6.1% |
| Italian | 100 | 2.7% |
| Lithuanian | 15 | 0.4% |
| Mexican | 41 | 1.1% |
| Norwegian | 421 | 11.3% |
| Polish | 131 | 3.5% |
| Romanian | 15 | 0.4% |
| Russian | 9 | 0.2% |
| Scandinavian | 136 | 3.7% |
| Scotch-Irish | 19 | 0.5% |
| Scottish | 80 | 2.1% |
| Serbian | 15 | 0.4% |
| Sioux | 25 | 0.7% |
| Sri Lankan | 7 | 0.2% |
| Subsaharan African | 61 | 1.6% |
| Swedish | 377 | 10.1% |
| Swiss | 9 | 0.2% |
| Ukrainian | 20 | 0.5% |
| Welsh | 59 | 1.6% | View All 36 Rows |
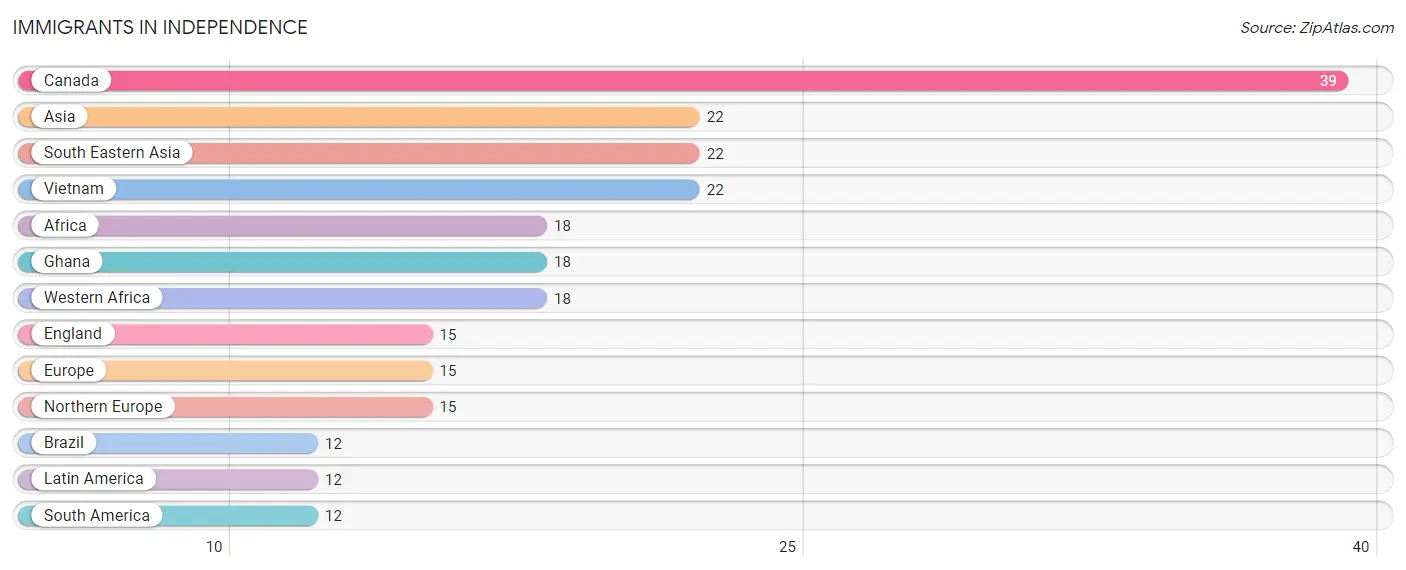
Immigrants in Independence
The most numerous immigrant groups reported in Independence came from Canada (39 | 1.1%), Asia (22 | 0.6%), South Eastern Asia (22 | 0.6%), Vietnam (22 | 0.6%), and Africa (18 | 0.5%), together accounting for 3.3% of all Independence residents.
| Immigration Origin | # Population | % Population |
| Africa | 18 | 0.5% |
| Asia | 22 | 0.6% |
| Brazil | 12 | 0.3% |
| Canada | 39 | 1.1% |
| England | 15 | 0.4% |
| Europe | 15 | 0.4% |
| Ghana | 18 | 0.5% |
| Latin America | 12 | 0.3% |
| Northern Europe | 15 | 0.4% |
| South America | 12 | 0.3% |
| South Eastern Asia | 22 | 0.6% |
| Vietnam | 22 | 0.6% |
| Western Africa | 18 | 0.5% | View All 13 Rows |
Sex and Age in Independence
Sex and Age in Independence
The most populous age groups in Independence are 5 to 9 Years (246 | 12.6%) for men and 55 to 59 Years (256 | 14.4%) for women.
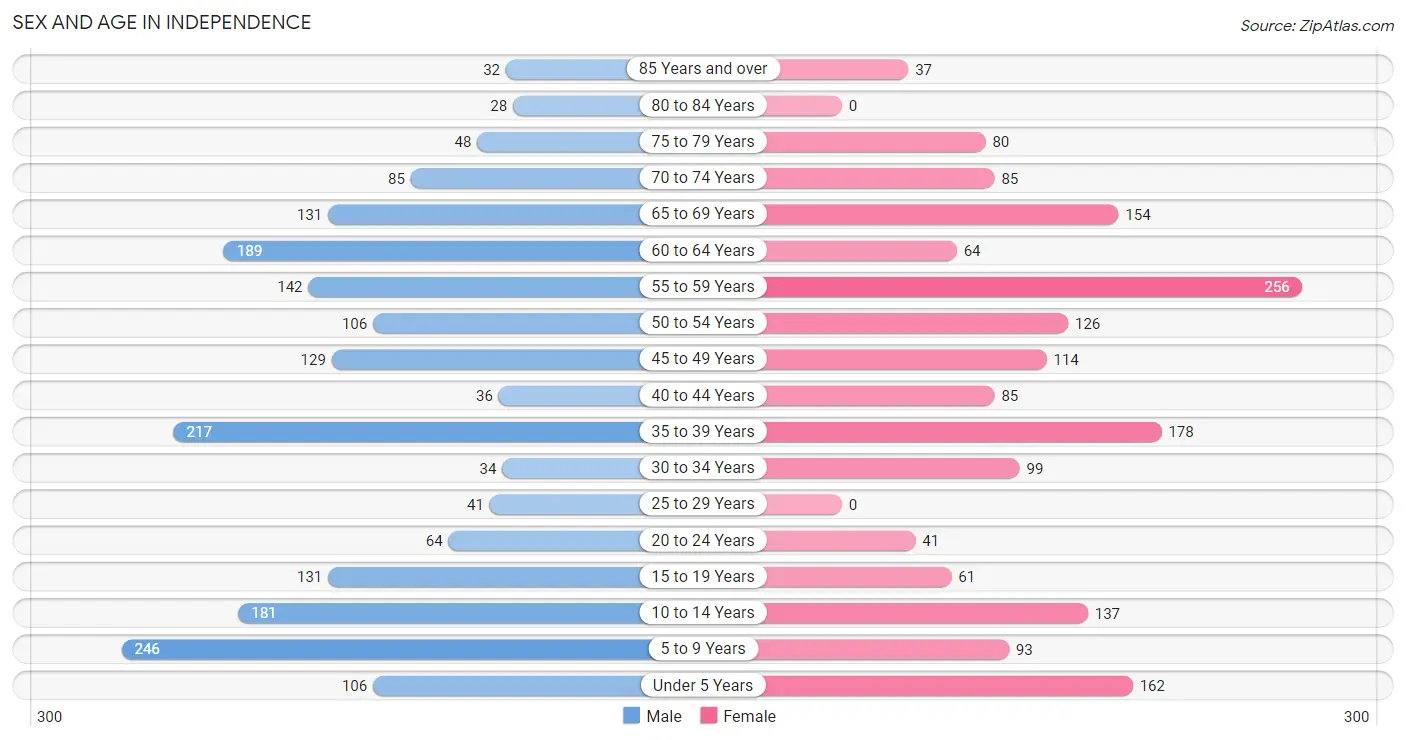
| Age Bracket | Male | Female |
| Under 5 Years | 106 (5.4%) | 162 (9.1%) |
| 5 to 9 Years | 246 (12.6%) | 93 (5.2%) |
| 10 to 14 Years | 181 (9.3%) | 137 (7.7%) |
| 15 to 19 Years | 131 (6.7%) | 61 (3.4%) |
| 20 to 24 Years | 64 (3.3%) | 41 (2.3%) |
| 25 to 29 Years | 41 (2.1%) | 0 (0.0%) |
| 30 to 34 Years | 34 (1.8%) | 99 (5.6%) |
| 35 to 39 Years | 217 (11.2%) | 178 (10.1%) |
| 40 to 44 Years | 36 (1.8%) | 85 (4.8%) |
| 45 to 49 Years | 129 (6.6%) | 114 (6.4%) |
| 50 to 54 Years | 106 (5.4%) | 126 (7.1%) |
| 55 to 59 Years | 142 (7.3%) | 256 (14.4%) |
| 60 to 64 Years | 189 (9.7%) | 64 (3.6%) |
| 65 to 69 Years | 131 (6.7%) | 154 (8.7%) |
| 70 to 74 Years | 85 (4.4%) | 85 (4.8%) |
| 75 to 79 Years | 48 (2.5%) | 80 (4.5%) |
| 80 to 84 Years | 28 (1.4%) | 0 (0.0%) |
| 85 Years and over | 32 (1.6%) | 37 (2.1%) |
| Total | 1,946 (100.0%) | 1,772 (100.0%) |
Families and Households in Independence
Median Family Size in Independence
The median family size in Independence is 3.33 persons per family, with single male/father families (13 | 1.2%) accounting for the largest median family size of 4.31 persons per family. On the other hand, married-couple families (964 | 91.4%) represent the smallest median family size with 3.30 persons per family.
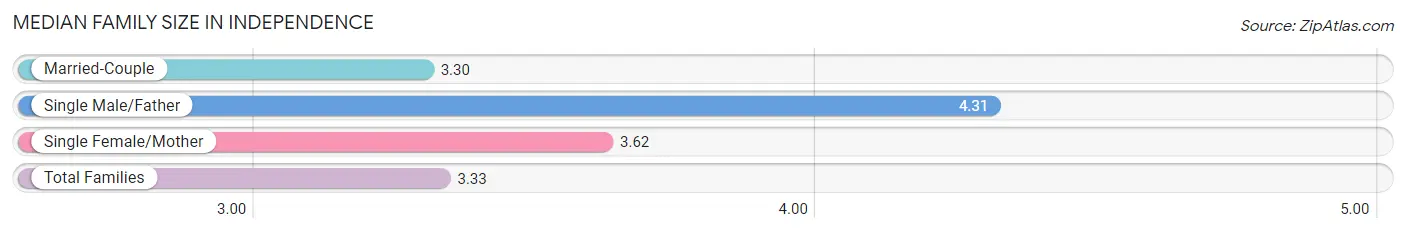
| Family Type | # Families | Family Size |
| Married-Couple | 964 (91.4%) | 3.30 |
| Single Male/Father | 13 (1.2%) | 4.31 |
| Single Female/Mother | 78 (7.4%) | 3.62 |
| Total Families | 1,055 (100.0%) | 3.33 |
Median Household Size in Independence
The median household size in Independence is 3.08 persons per household, with single male/father households (13 | 1.1%) accounting for the largest median household size of 4.31 persons per household. non-family households (141 | 11.8%) represent the smallest median household size with 1.20 persons per household.
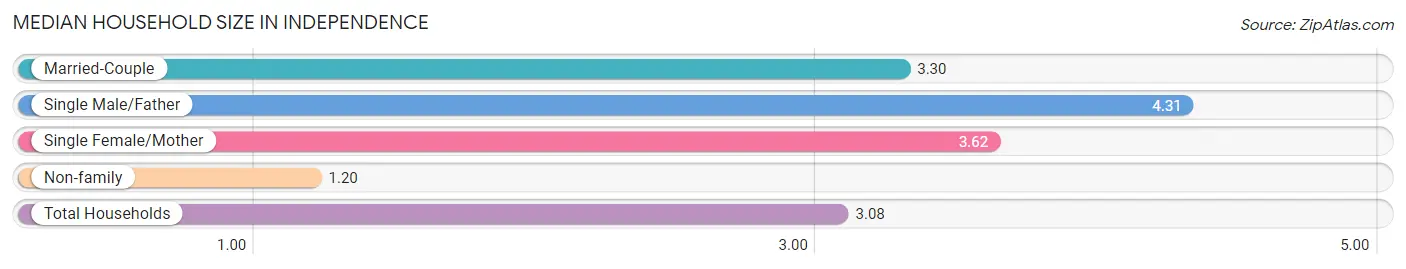
| Household Type | # Households | Household Size |
| Married-Couple | 964 (80.6%) | 3.30 |
| Single Male/Father | 13 (1.1%) | 4.31 |
| Single Female/Mother | 78 (6.5%) | 3.62 |
| Non-family | 141 (11.8%) | 1.20 |
| Total Households | 1,196 (100.0%) | 3.08 |
Household Size by Marriage Status in Independence
Out of a total of 1,196 households in Independence, 1,055 (88.2%) are family households, while 141 (11.8%) are nonfamily households. The most numerous type of family households are 2-person households, comprising 460, and the most common type of nonfamily households are 1-person households, comprising 113.
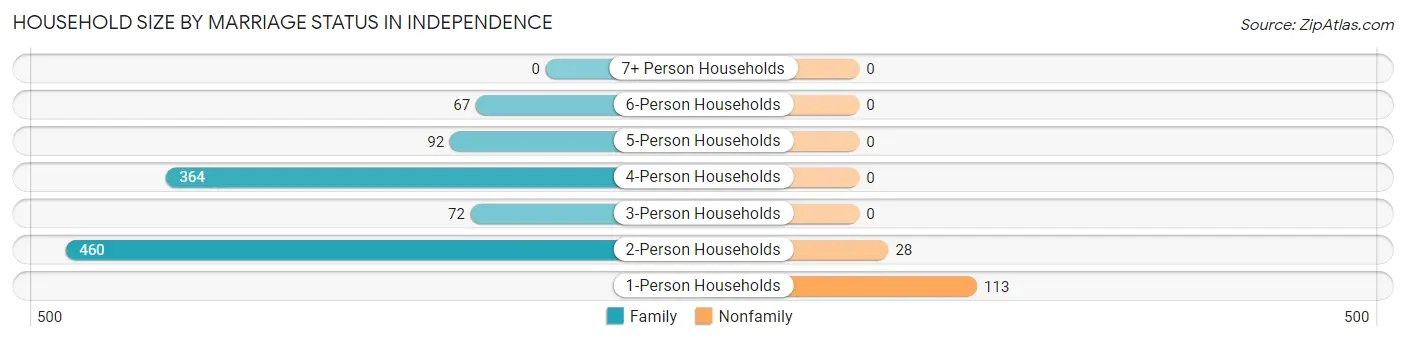
| Household Size | Family Households | Nonfamily Households |
| 1-Person Households | - | 113 (9.5%) |
| 2-Person Households | 460 (38.5%) | 28 (2.3%) |
| 3-Person Households | 72 (6.0%) | 0 (0.0%) |
| 4-Person Households | 364 (30.4%) | 0 (0.0%) |
| 5-Person Households | 92 (7.7%) | 0 (0.0%) |
| 6-Person Households | 67 (5.6%) | 0 (0.0%) |
| 7+ Person Households | 0 (0.0%) | 0 (0.0%) |
| Total | 1,055 (88.2%) | 141 (11.8%) |
Female Fertility in Independence
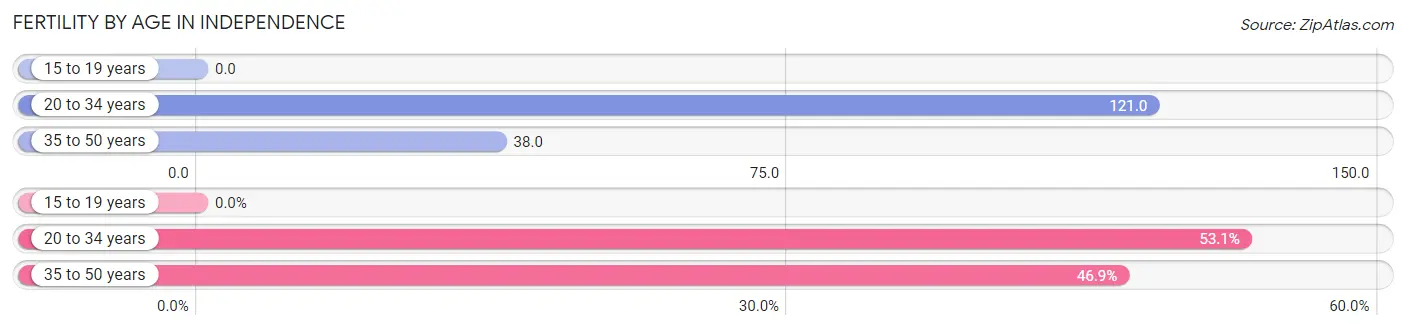
Fertility by Age in Independence
Average fertility rate in Independence is 54.0 births per 1,000 women. Women in the age bracket of 20 to 34 years have the highest fertility rate with 121.0 births per 1,000 women. Women in the age bracket of 20 to 34 years acount for 53.1% of all women with births.
| Age Bracket | Women with Births | Births / 1,000 Women |
| 15 to 19 years | 0 (0.0%) | 0.0 |
| 20 to 34 years | 17 (53.1%) | 121.0 |
| 35 to 50 years | 15 (46.9%) | 38.0 |
| Total | 32 (100.0%) | 54.0 |
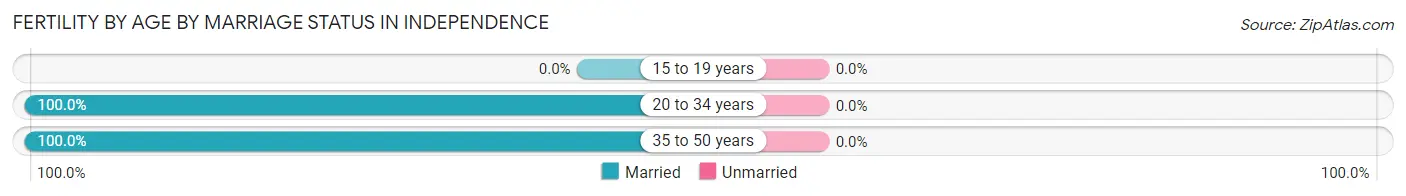
Fertility by Age by Marriage Status in Independence
| Age Bracket | Married | Unmarried |
| 15 to 19 years | 0 (0.0%) | 0 (0.0%) |
| 20 to 34 years | 17 (100.0%) | 0 (0.0%) |
| 35 to 50 years | 15 (100.0%) | 0 (0.0%) |
| Total | 32 (100.0%) | 0 (0.0%) |
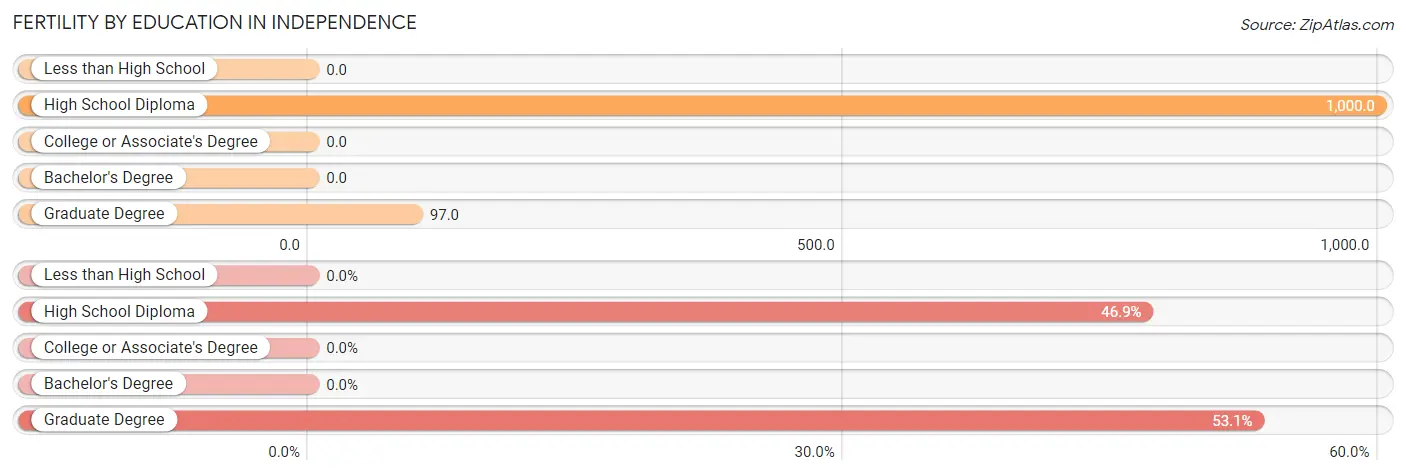
Fertility by Education in Independence
| Educational Attainment | Women with Births | Births / 1,000 Women |
| Less than High School | 0 (0.0%) | 0.0 |
| High School Diploma | 15 (46.9%) | 1,000.0 |
| College or Associate's Degree | 0 (0.0%) | 0.0 |
| Bachelor's Degree | 0 (0.0%) | 0.0 |
| Graduate Degree | 17 (53.1%) | 97.0 |
| Total | 32 (100.0%) | 54.0 |
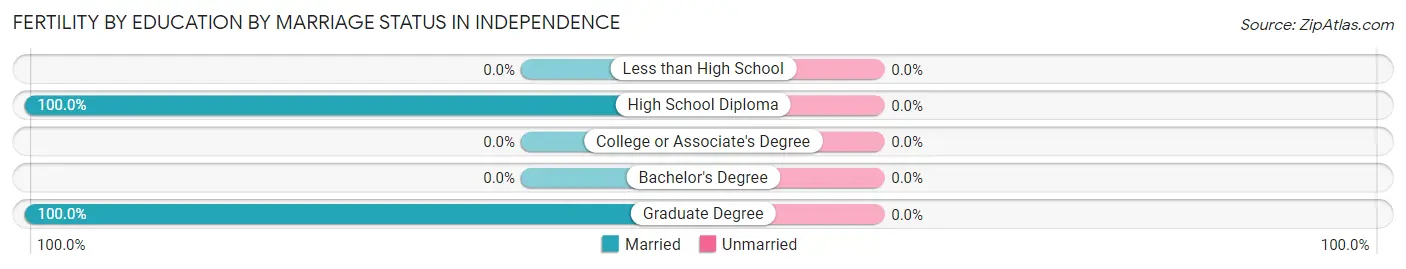
Fertility by Education by Marriage Status in Independence
| Educational Attainment | Married | Unmarried |
| Less than High School | 0 (0.0%) | 0 (0.0%) |
| High School Diploma | 15 (100.0%) | 0 (0.0%) |
| College or Associate's Degree | 0 (0.0%) | 0 (0.0%) |
| Bachelor's Degree | 0 (0.0%) | 0 (0.0%) |
| Graduate Degree | 17 (100.0%) | 0 (0.0%) |
| Total | 32 (100.0%) | 0 (0.0%) |
Employment Characteristics in Independence
Employment by Class of Employer in Independence
Among the 1,789 employed individuals in Independence, private company employees (1,133 | 63.3%), self-employed (incorporated) (224 | 12.5%), and self-employed (not incorporated) (141 | 7.9%) make up the most common classes of employment.
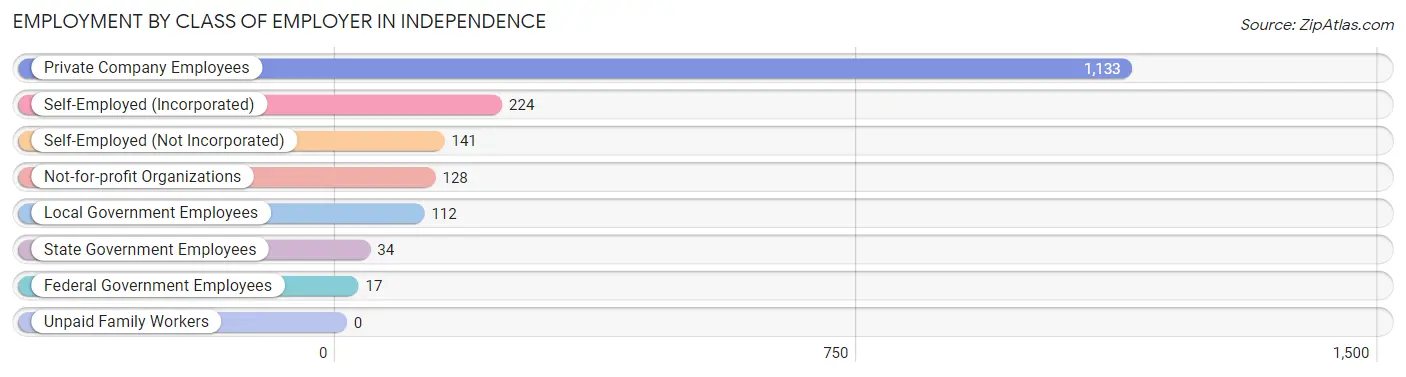
| Employer Class | # Employees | % Employees |
| Private Company Employees | 1,133 | 63.3% |
| Self-Employed (Incorporated) | 224 | 12.5% |
| Self-Employed (Not Incorporated) | 141 | 7.9% |
| Not-for-profit Organizations | 128 | 7.1% |
| Local Government Employees | 112 | 6.3% |
| State Government Employees | 34 | 1.9% |
| Federal Government Employees | 17 | 0.9% |
| Unpaid Family Workers | 0 | 0.0% |
| Total | 1,789 | 100.0% |
Employment Status by Age in Independence
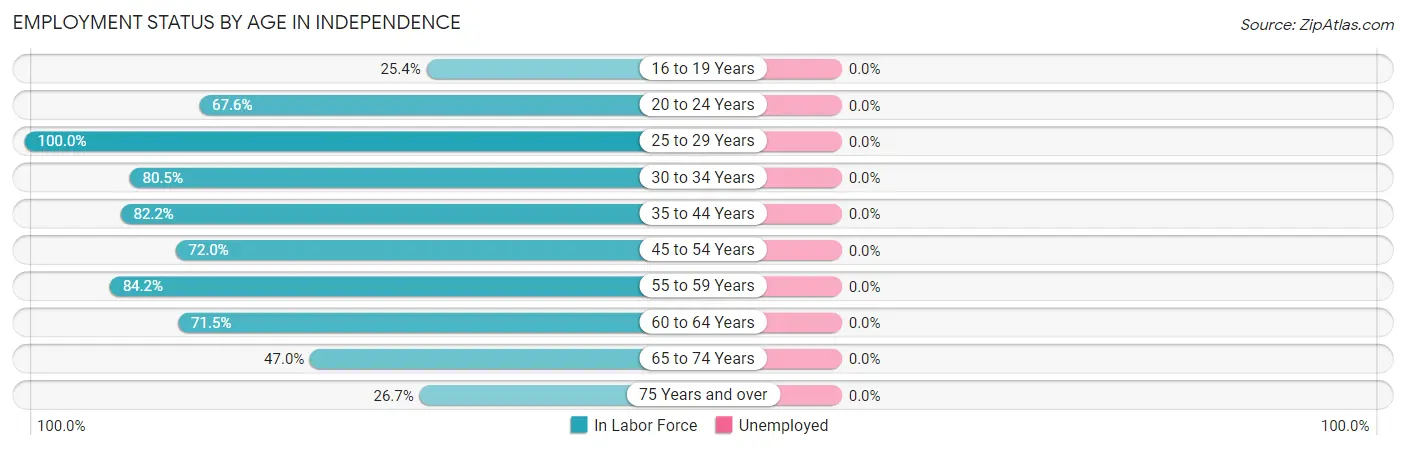
| Age Bracket | In Labor Force | Unemployed |
| 16 to 19 Years | 32 (25.4%) | 0 (0.0%) |
| 20 to 24 Years | 71 (67.6%) | 0 (0.0%) |
| 25 to 29 Years | 41 (100.0%) | 0 (0.0%) |
| 30 to 34 Years | 107 (80.5%) | 0 (0.0%) |
| 35 to 44 Years | 424 (82.2%) | 0 (0.0%) |
| 45 to 54 Years | 342 (72.0%) | 0 (0.0%) |
| 55 to 59 Years | 335 (84.2%) | 0 (0.0%) |
| 60 to 64 Years | 181 (71.5%) | 0 (0.0%) |
| 65 to 74 Years | 214 (47.0%) | 0 (0.0%) |
| 75 Years and over | 60 (26.7%) | 0 (0.0%) |
| Total | 1,808 (66.3%) | 0 (0.0%) |
Employment Status by Educational Attainment in Independence
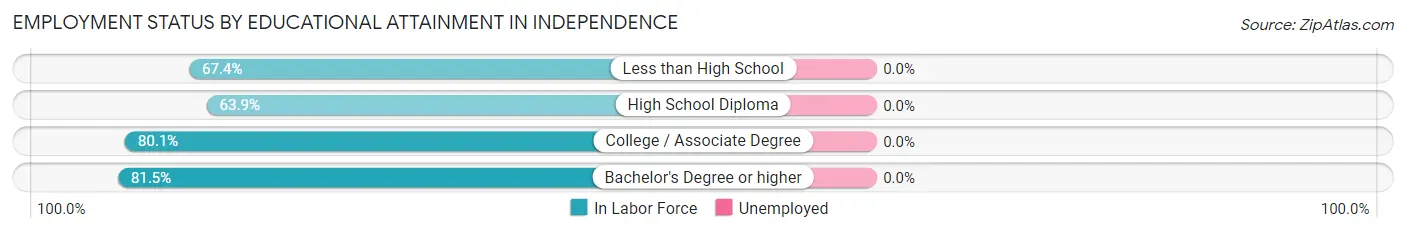
| Educational Attainment | In Labor Force | Unemployed |
| Less than High School | 60 (67.4%) | 0 (0.0%) |
| High School Diploma | 115 (63.9%) | 0 (0.0%) |
| College / Associate Degree | 302 (80.1%) | 0 (0.0%) |
| Bachelor's Degree or higher | 954 (81.5%) | 0 (0.0%) |
| Total | 1,429 (78.7%) | 0 (0.0%) |
Employment Occupations by Sex in Independence
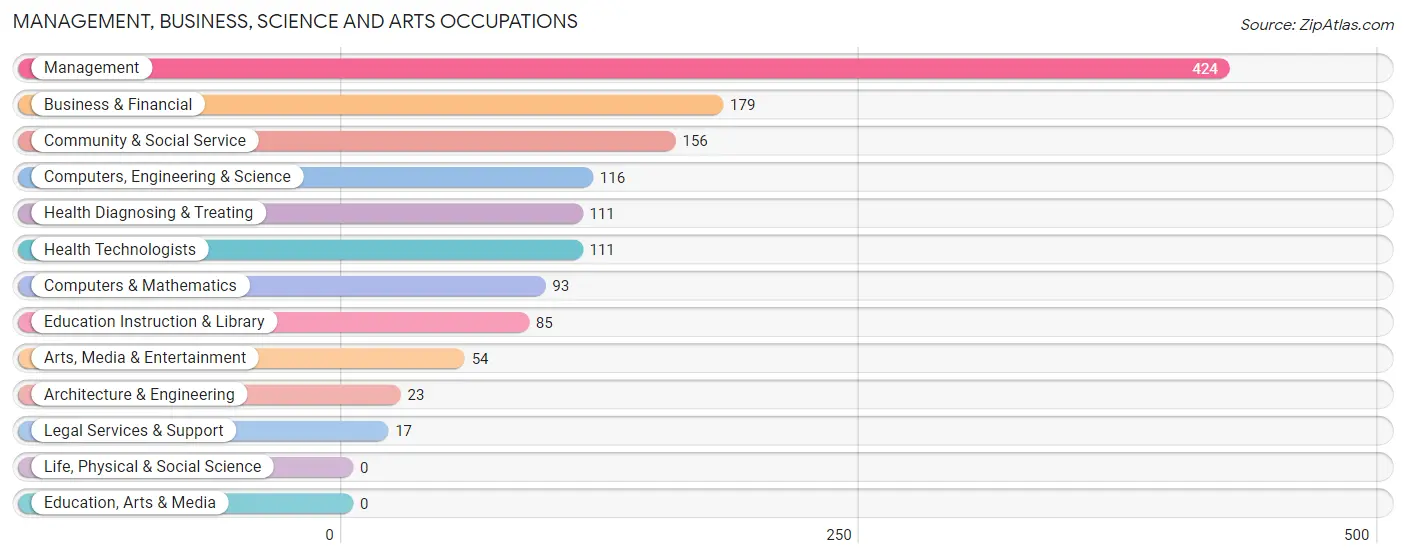
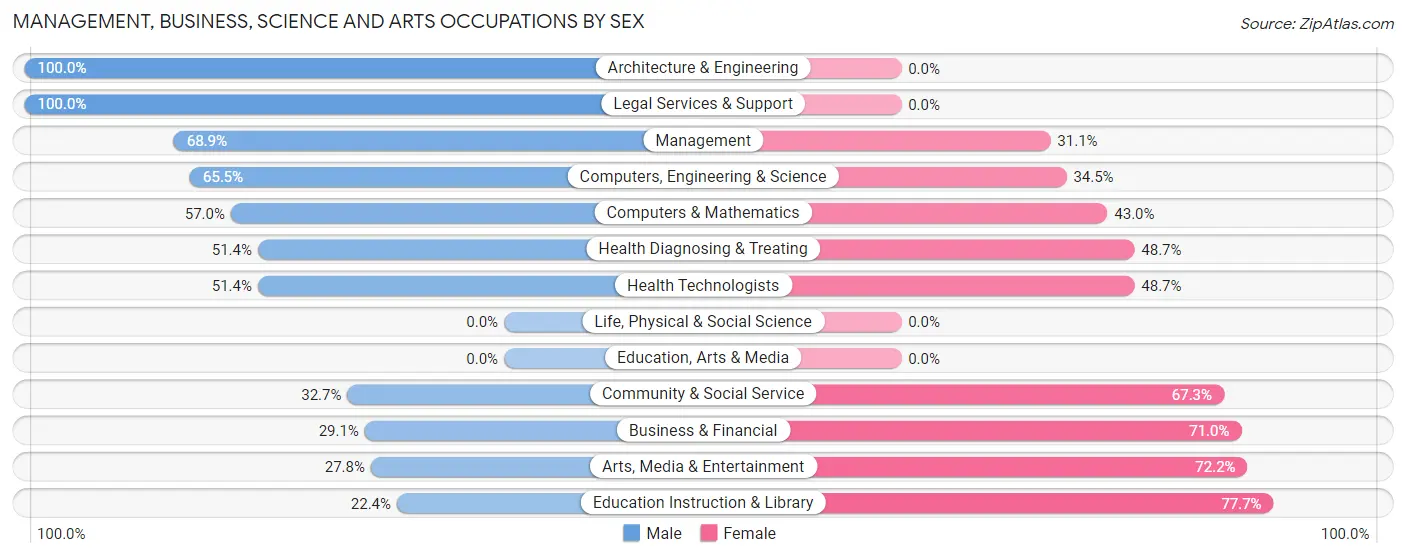
Management, Business, Science and Arts Occupations
The most common Management, Business, Science and Arts occupations in Independence are Management (424 | 23.5%), Business & Financial (179 | 9.9%), Community & Social Service (156 | 8.6%), Computers, Engineering & Science (116 | 6.4%), and Health Diagnosing & Treating (111 | 6.1%).
Management, Business, Science and Arts Occupations by Sex
Within the Management, Business, Science and Arts occupations in Independence, the most male-oriented occupations are Architecture & Engineering (100.0%), Legal Services & Support (100.0%), and Management (68.9%), while the most female-oriented occupations are Education Instruction & Library (77.6%), Arts, Media & Entertainment (72.2%), and Business & Financial (71.0%).
| Occupation | Male | Female |
| Management | 292 (68.9%) | 132 (31.1%) |
| Business & Financial | 52 (29.0%) | 127 (71.0%) |
| Computers, Engineering & Science | 76 (65.5%) | 40 (34.5%) |
| Computers & Mathematics | 53 (57.0%) | 40 (43.0%) |
| Architecture & Engineering | 23 (100.0%) | 0 (0.0%) |
| Life, Physical & Social Science | 0 (0.0%) | 0 (0.0%) |
| Community & Social Service | 51 (32.7%) | 105 (67.3%) |
| Education, Arts & Media | 0 (0.0%) | 0 (0.0%) |
| Legal Services & Support | 17 (100.0%) | 0 (0.0%) |
| Education Instruction & Library | 19 (22.4%) | 66 (77.6%) |
| Arts, Media & Entertainment | 15 (27.8%) | 39 (72.2%) |
| Health Diagnosing & Treating | 57 (51.3%) | 54 (48.6%) |
| Health Technologists | 57 (51.3%) | 54 (48.6%) |
| Total (Category) | 528 (53.5%) | 458 (46.5%) |
| Total (Overall) | 978 (54.1%) | 829 (45.9%) |
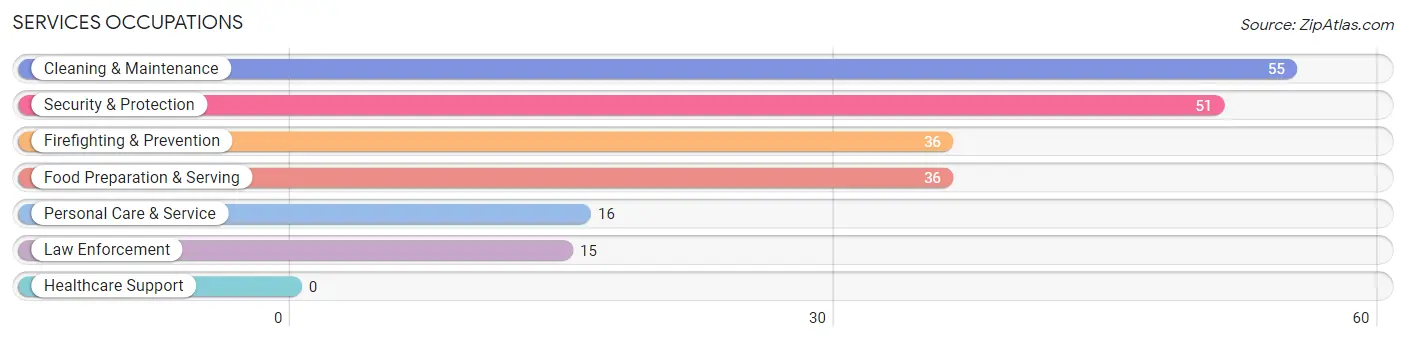
Services Occupations
The most common Services occupations in Independence are Cleaning & Maintenance (55 | 3.0%), Security & Protection (51 | 2.8%), Firefighting & Prevention (36 | 2.0%), Food Preparation & Serving (36 | 2.0%), and Personal Care & Service (16 | 0.9%).
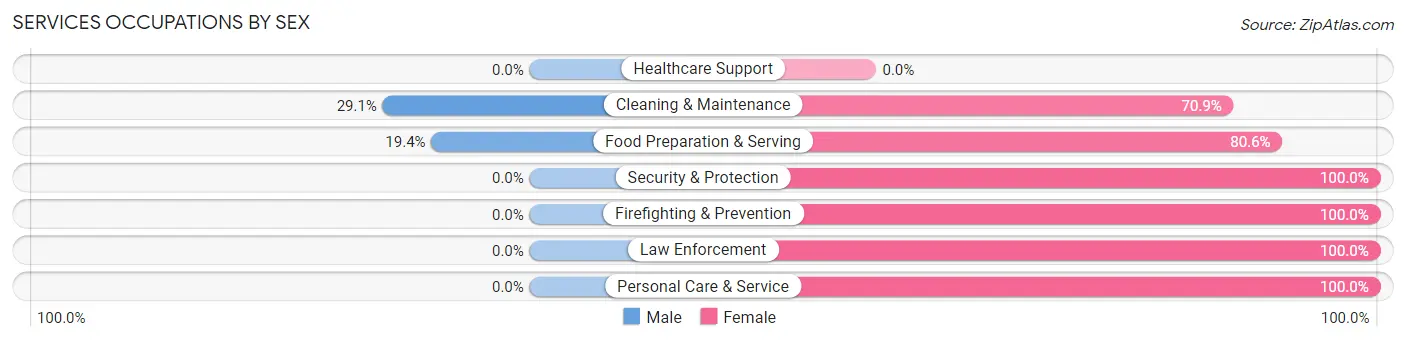
Services Occupations by Sex
Within the Services occupations in Independence, the most male-oriented occupations are Cleaning & Maintenance (29.1%), and Food Preparation & Serving (19.4%), while the most female-oriented occupations are Security & Protection (100.0%), Firefighting & Prevention (100.0%), and Law Enforcement (100.0%).
| Occupation | Male | Female |
| Healthcare Support | 0 (0.0%) | 0 (0.0%) |
| Security & Protection | 0 (0.0%) | 51 (100.0%) |
| Firefighting & Prevention | 0 (0.0%) | 36 (100.0%) |
| Law Enforcement | 0 (0.0%) | 15 (100.0%) |
| Food Preparation & Serving | 7 (19.4%) | 29 (80.6%) |
| Cleaning & Maintenance | 16 (29.1%) | 39 (70.9%) |
| Personal Care & Service | 0 (0.0%) | 16 (100.0%) |
| Total (Category) | 23 (14.6%) | 135 (85.4%) |
| Total (Overall) | 978 (54.1%) | 829 (45.9%) |
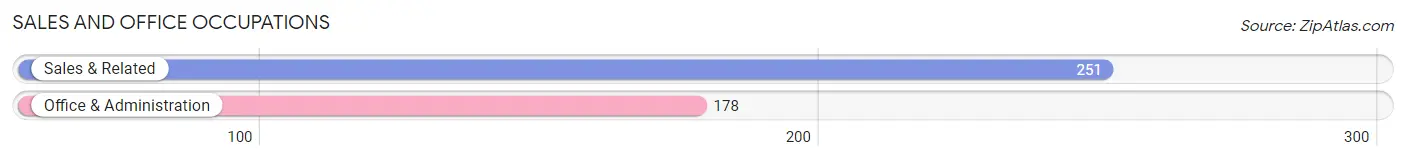
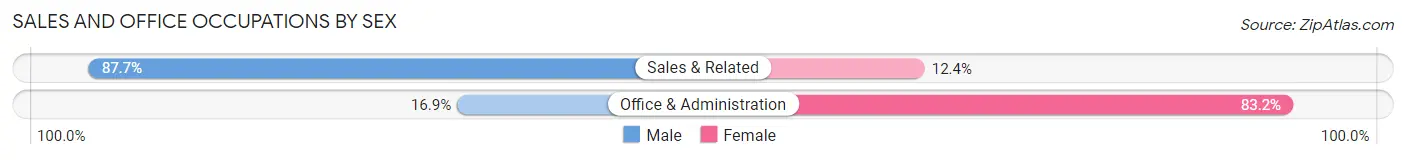
Sales and Office Occupations
The most common Sales and Office occupations in Independence are Sales & Related (251 | 13.9%), and Office & Administration (178 | 9.9%).
Sales and Office Occupations by Sex
| Occupation | Male | Female |
| Sales & Related | 220 (87.6%) | 31 (12.3%) |
| Office & Administration | 30 (16.9%) | 148 (83.2%) |
| Total (Category) | 250 (58.3%) | 179 (41.7%) |
| Total (Overall) | 978 (54.1%) | 829 (45.9%) |
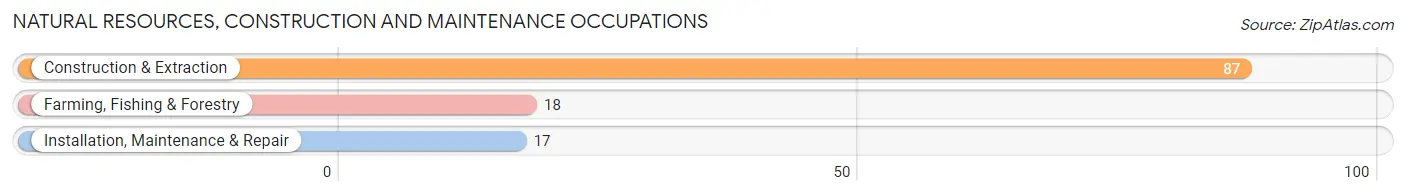
Natural Resources, Construction and Maintenance Occupations
The most common Natural Resources, Construction and Maintenance occupations in Independence are Construction & Extraction (87 | 4.8%), Farming, Fishing & Forestry (18 | 1.0%), and Installation, Maintenance & Repair (17 | 0.9%).
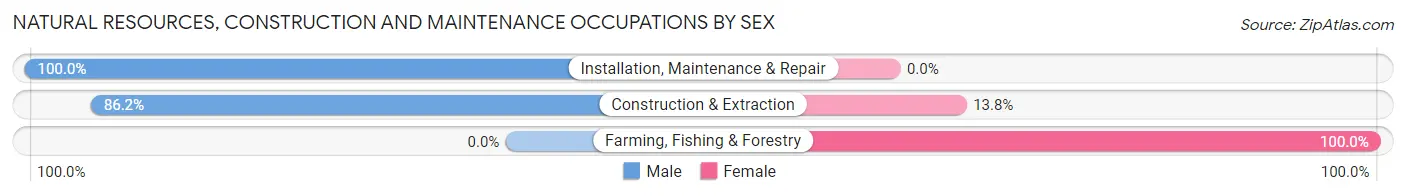
Natural Resources, Construction and Maintenance Occupations by Sex
| Occupation | Male | Female |
| Farming, Fishing & Forestry | 0 (0.0%) | 18 (100.0%) |
| Construction & Extraction | 75 (86.2%) | 12 (13.8%) |
| Installation, Maintenance & Repair | 17 (100.0%) | 0 (0.0%) |
| Total (Category) | 92 (75.4%) | 30 (24.6%) |
| Total (Overall) | 978 (54.1%) | 829 (45.9%) |
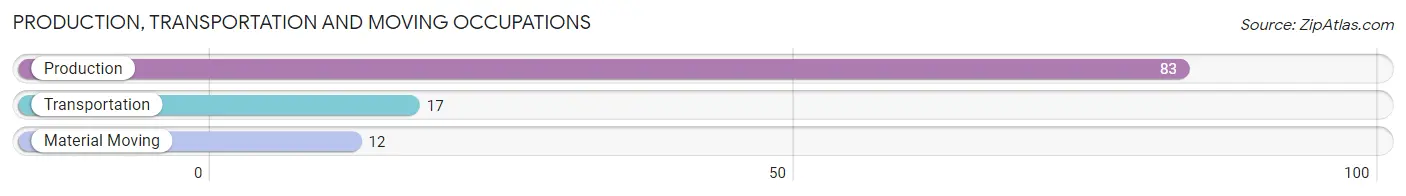
Production, Transportation and Moving Occupations
The most common Production, Transportation and Moving occupations in Independence are Production (83 | 4.6%), Transportation (17 | 0.9%), and Material Moving (12 | 0.7%).
Production, Transportation and Moving Occupations by Sex
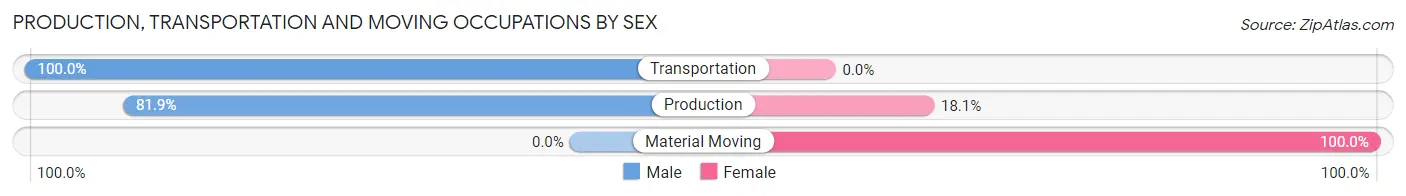
| Occupation | Male | Female |
| Production | 68 (81.9%) | 15 (18.1%) |
| Transportation | 17 (100.0%) | 0 (0.0%) |
| Material Moving | 0 (0.0%) | 12 (100.0%) |
| Total (Category) | 85 (75.9%) | 27 (24.1%) |
| Total (Overall) | 978 (54.1%) | 829 (45.9%) |
Employment Industries by Sex in Independence
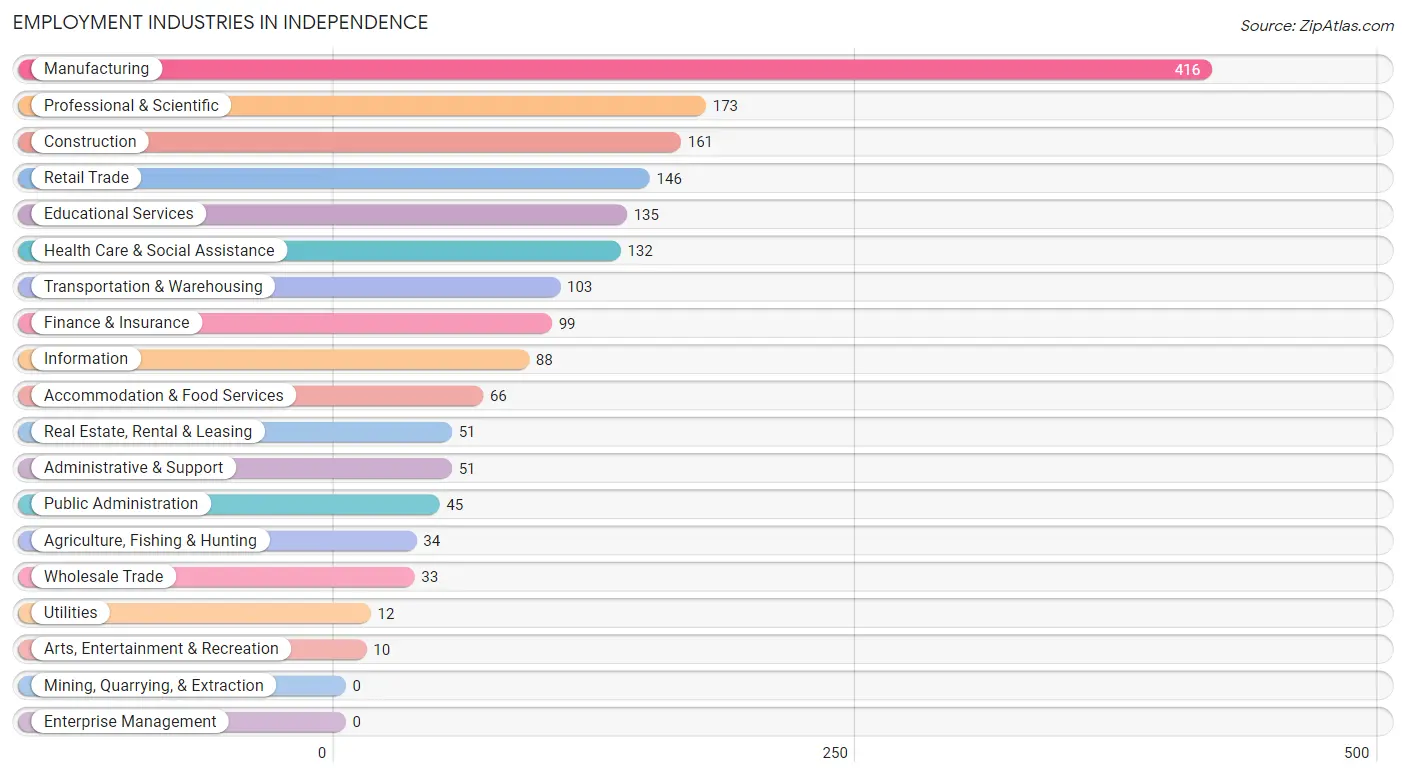
Employment Industries in Independence
The major employment industries in Independence include Manufacturing (416 | 23.0%), Professional & Scientific (173 | 9.6%), Construction (161 | 8.9%), Retail Trade (146 | 8.1%), and Educational Services (135 | 7.5%).
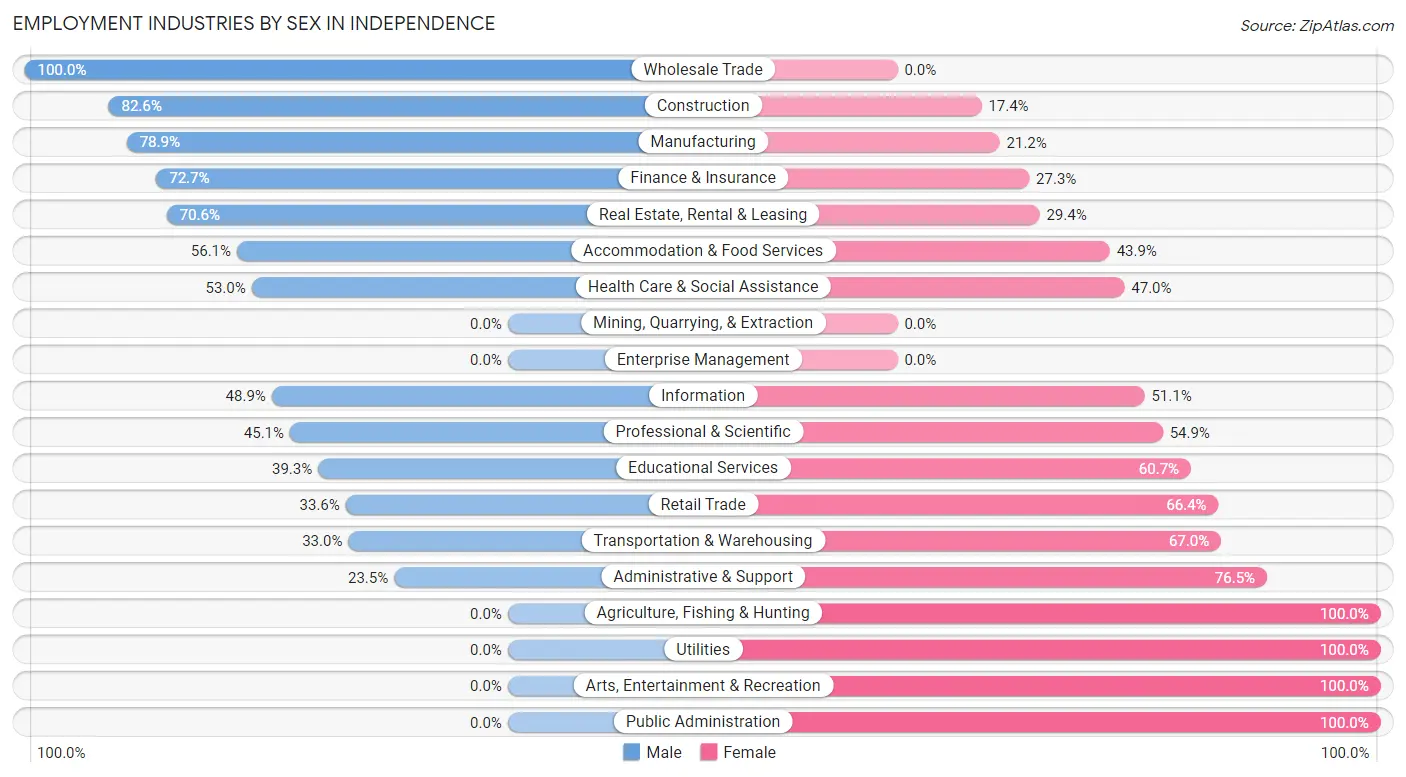
Employment Industries by Sex in Independence
The Independence industries that see more men than women are Wholesale Trade (100.0%), Construction (82.6%), and Manufacturing (78.8%), whereas the industries that tend to have a higher number of women are Agriculture, Fishing & Hunting (100.0%), Utilities (100.0%), and Arts, Entertainment & Recreation (100.0%).
| Industry | Male | Female |
| Agriculture, Fishing & Hunting | 0 (0.0%) | 34 (100.0%) |
| Mining, Quarrying, & Extraction | 0 (0.0%) | 0 (0.0%) |
| Construction | 133 (82.6%) | 28 (17.4%) |
| Manufacturing | 328 (78.8%) | 88 (21.1%) |
| Wholesale Trade | 33 (100.0%) | 0 (0.0%) |
| Retail Trade | 49 (33.6%) | 97 (66.4%) |
| Transportation & Warehousing | 34 (33.0%) | 69 (67.0%) |
| Utilities | 0 (0.0%) | 12 (100.0%) |
| Information | 43 (48.9%) | 45 (51.1%) |
| Finance & Insurance | 72 (72.7%) | 27 (27.3%) |
| Real Estate, Rental & Leasing | 36 (70.6%) | 15 (29.4%) |
| Professional & Scientific | 78 (45.1%) | 95 (54.9%) |
| Enterprise Management | 0 (0.0%) | 0 (0.0%) |
| Administrative & Support | 12 (23.5%) | 39 (76.5%) |
| Educational Services | 53 (39.3%) | 82 (60.7%) |
| Health Care & Social Assistance | 70 (53.0%) | 62 (47.0%) |
| Arts, Entertainment & Recreation | 0 (0.0%) | 10 (100.0%) |
| Accommodation & Food Services | 37 (56.1%) | 29 (43.9%) |
| Public Administration | 0 (0.0%) | 45 (100.0%) |
| Total | 978 (54.1%) | 829 (45.9%) |
Education in Independence
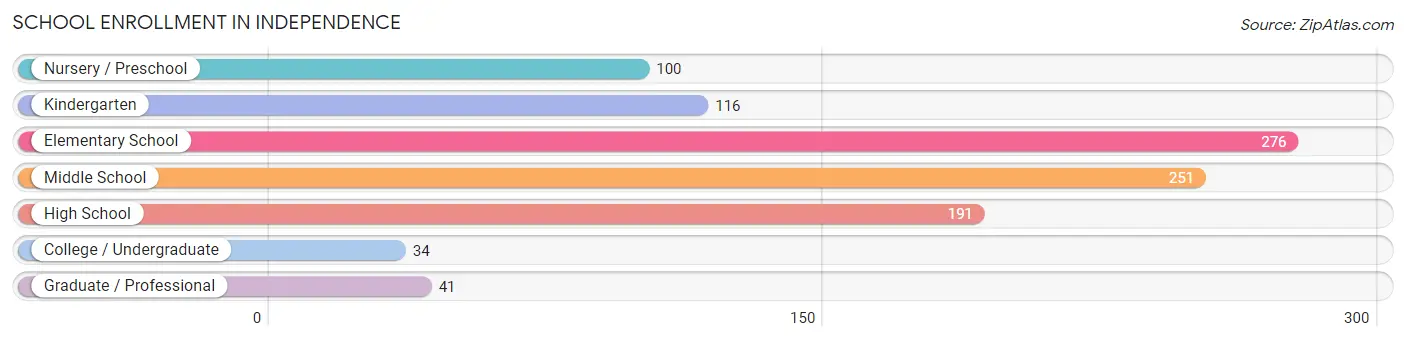
School Enrollment in Independence
The most common levels of schooling among the 1,009 students in Independence are elementary school (276 | 27.4%), middle school (251 | 24.9%), and high school (191 | 18.9%).
| School Level | # Students | % Students |
| Nursery / Preschool | 100 | 9.9% |
| Kindergarten | 116 | 11.5% |
| Elementary School | 276 | 27.4% |
| Middle School | 251 | 24.9% |
| High School | 191 | 18.9% |
| College / Undergraduate | 34 | 3.4% |
| Graduate / Professional | 41 | 4.1% |
| Total | 1,009 | 100.0% |
School Enrollment by Age by Funding Source in Independence
Out of a total of 1,009 students who are enrolled in schools in Independence, 347 (34.4%) attend a private institution, while the remaining 662 (65.6%) are enrolled in public schools. The age group of 3 to 4 year olds has the highest likelihood of being enrolled in private schools, with 100 (100.0% in the age bracket) enrolled. Conversely, the age group of 35 years and over has the lowest likelihood of being enrolled in a private school, with 25 (100.0% in the age bracket) attending a public institution.
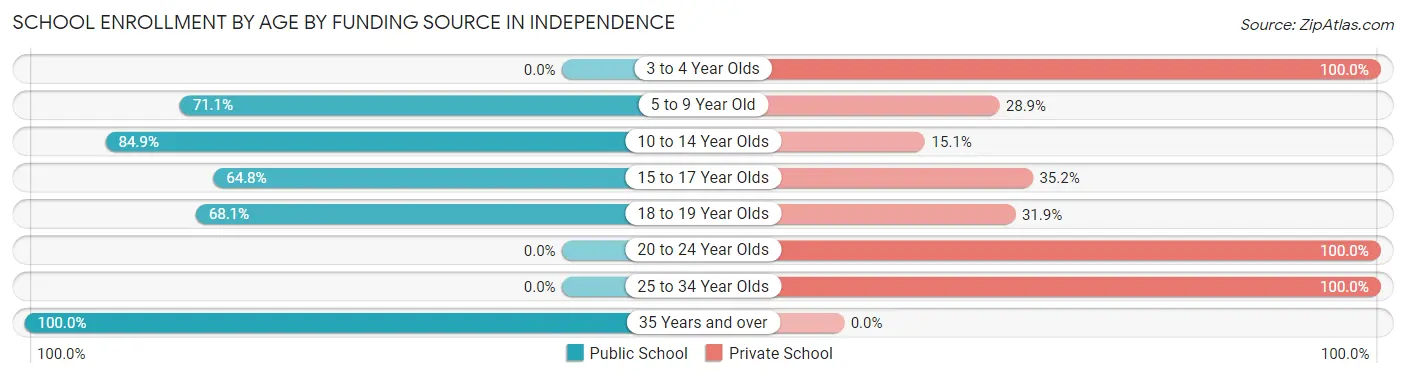
| Age Bracket | Public School | Private School |
| 3 to 4 Year Olds | 0 (0.0%) | 100 (100.0%) |
| 5 to 9 Year Old | 241 (71.1%) | 98 (28.9%) |
| 10 to 14 Year Olds | 270 (84.9%) | 48 (15.1%) |
| 15 to 17 Year Olds | 94 (64.8%) | 51 (35.2%) |
| 18 to 19 Year Olds | 32 (68.1%) | 15 (31.9%) |
| 20 to 24 Year Olds | 0 (0.0%) | 19 (100.0%) |
| 25 to 34 Year Olds | 0 (0.0%) | 16 (100.0%) |
| 35 Years and over | 25 (100.0%) | 0 (0.0%) |
| Total | 662 (65.6%) | 347 (34.4%) |
Educational Attainment by Field of Study in Independence
Business (525 | 32.4%), education (135 | 8.3%), arts & humanities (121 | 7.5%), science & technology (116 | 7.2%), and social sciences (115 | 7.1%) are the most common fields of study among 1,619 individuals in Independence who have obtained a bachelor's degree or higher.
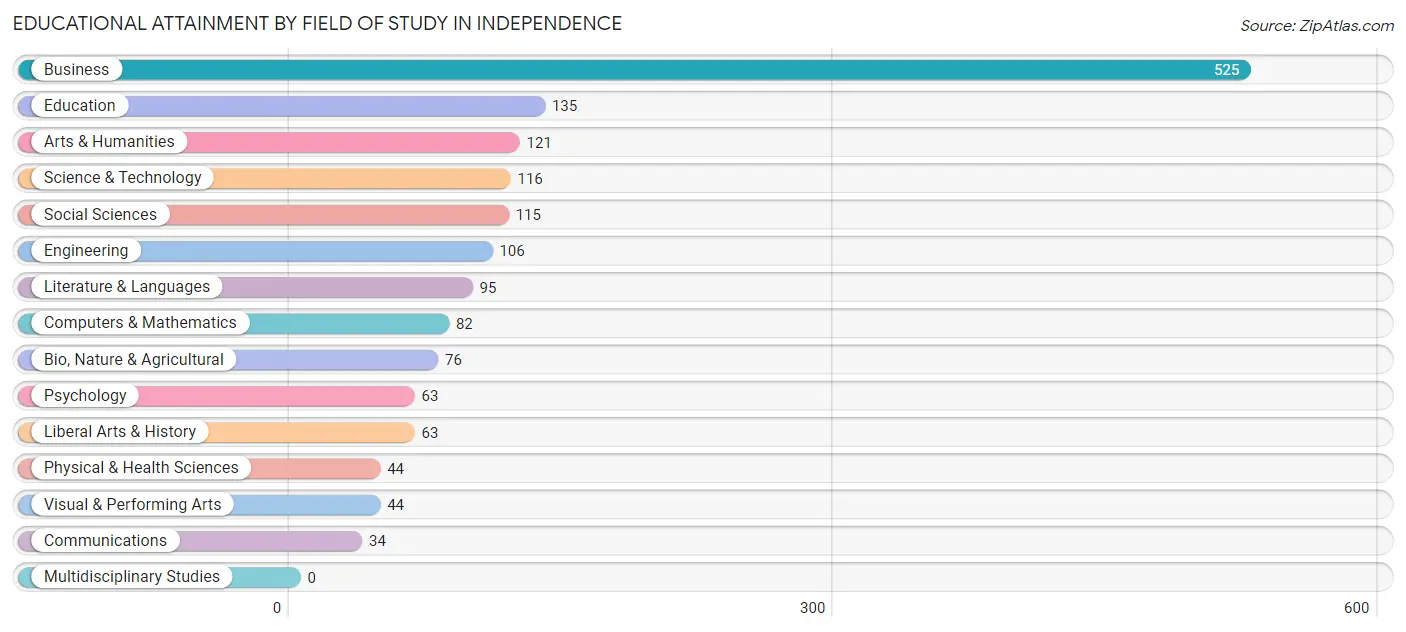
| Field of Study | # Graduates | % Graduates |
| Computers & Mathematics | 82 | 5.1% |
| Bio, Nature & Agricultural | 76 | 4.7% |
| Physical & Health Sciences | 44 | 2.7% |
| Psychology | 63 | 3.9% |
| Social Sciences | 115 | 7.1% |
| Engineering | 106 | 6.6% |
| Multidisciplinary Studies | 0 | 0.0% |
| Science & Technology | 116 | 7.2% |
| Business | 525 | 32.4% |
| Education | 135 | 8.3% |
| Literature & Languages | 95 | 5.9% |
| Liberal Arts & History | 63 | 3.9% |
| Visual & Performing Arts | 44 | 2.7% |
| Communications | 34 | 2.1% |
| Arts & Humanities | 121 | 7.5% |
| Total | 1,619 | 100.0% |
Transportation & Commute in Independence
Vehicle Availability by Sex in Independence
The most prevalent vehicle ownership categories in Independence are males with 2 vehicles (446, accounting for 46.2%) and females with 2 vehicles (323, making up 54.6%).
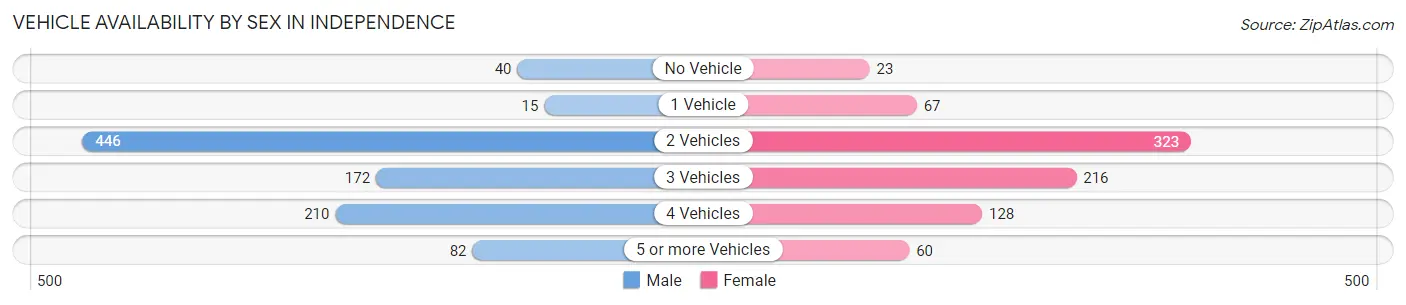
| Vehicles Available | Male | Female |
| No Vehicle | 40 (4.2%) | 23 (2.8%) |
| 1 Vehicle | 15 (1.5%) | 67 (8.2%) |
| 2 Vehicles | 446 (46.2%) | 323 (39.5%) |
| 3 Vehicles | 172 (17.8%) | 216 (26.4%) |
| 4 Vehicles | 210 (21.8%) | 128 (15.7%) |
| 5 or more Vehicles | 82 (8.5%) | 60 (7.3%) |
| Total | 965 (100.0%) | 817 (100.0%) |
Commute Time in Independence
The most frequently occuring commute durations in Independence are 20 to 24 minutes (242 commuters, 18.4%), 15 to 19 minutes (177 commuters, 13.5%), and 25 to 29 minutes (167 commuters, 12.7%).
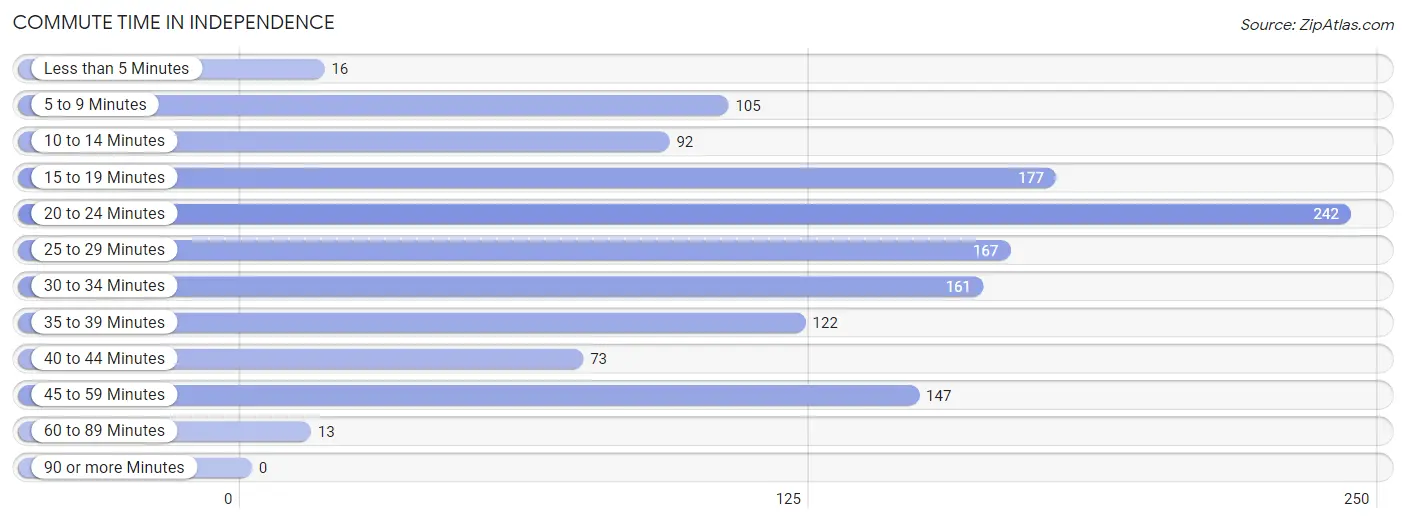
| Commute Time | # Commuters | % Commuters |
| Less than 5 Minutes | 16 | 1.2% |
| 5 to 9 Minutes | 105 | 8.0% |
| 10 to 14 Minutes | 92 | 7.0% |
| 15 to 19 Minutes | 177 | 13.5% |
| 20 to 24 Minutes | 242 | 18.4% |
| 25 to 29 Minutes | 167 | 12.7% |
| 30 to 34 Minutes | 161 | 12.2% |
| 35 to 39 Minutes | 122 | 9.3% |
| 40 to 44 Minutes | 73 | 5.6% |
| 45 to 59 Minutes | 147 | 11.2% |
| 60 to 89 Minutes | 13 | 1.0% |
| 90 or more Minutes | 0 | 0.0% |
Commute Time by Sex in Independence
The most common commute times in Independence are 20 to 24 minutes (141 commuters, 18.9%) for males and 20 to 24 minutes (101 commuters, 17.8%) for females.
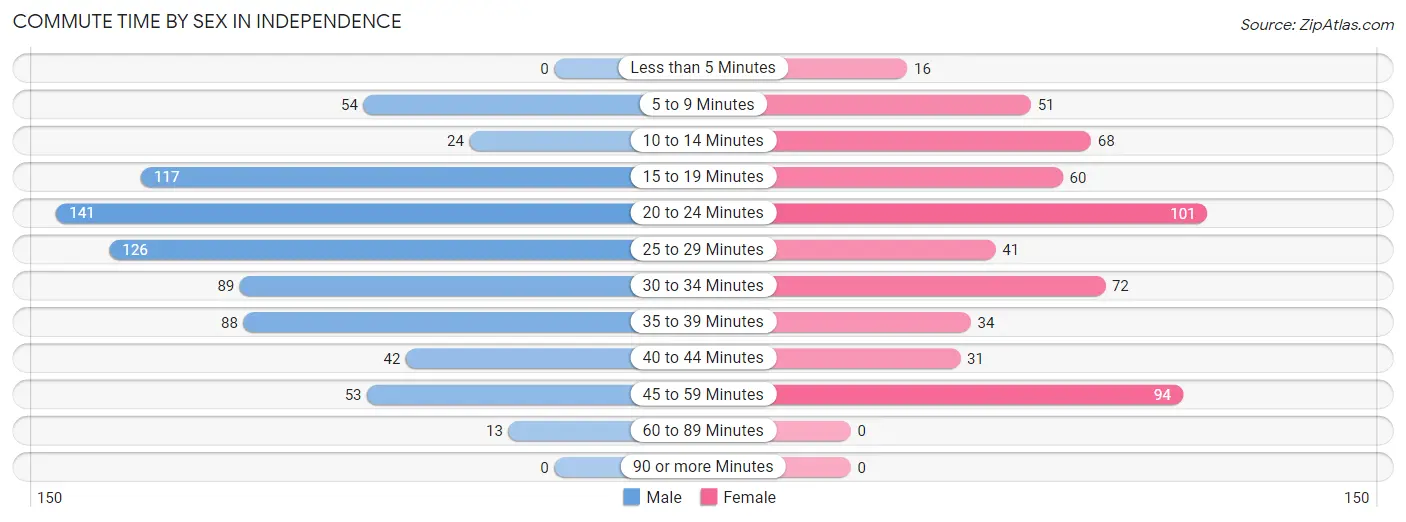
| Commute Time | Male | Female |
| Less than 5 Minutes | 0 (0.0%) | 16 (2.8%) |
| 5 to 9 Minutes | 54 (7.2%) | 51 (9.0%) |
| 10 to 14 Minutes | 24 (3.2%) | 68 (12.0%) |
| 15 to 19 Minutes | 117 (15.7%) | 60 (10.6%) |
| 20 to 24 Minutes | 141 (18.9%) | 101 (17.8%) |
| 25 to 29 Minutes | 126 (16.9%) | 41 (7.2%) |
| 30 to 34 Minutes | 89 (11.9%) | 72 (12.7%) |
| 35 to 39 Minutes | 88 (11.8%) | 34 (6.0%) |
| 40 to 44 Minutes | 42 (5.6%) | 31 (5.5%) |
| 45 to 59 Minutes | 53 (7.1%) | 94 (16.6%) |
| 60 to 89 Minutes | 13 (1.7%) | 0 (0.0%) |
| 90 or more Minutes | 0 (0.0%) | 0 (0.0%) |
Time of Departure to Work by Sex in Independence
The most frequent times of departure to work in Independence are 7:30 AM to 7:59 AM (163, 21.8%) for males and 6:30 AM to 6:59 AM (129, 22.7%) for females.
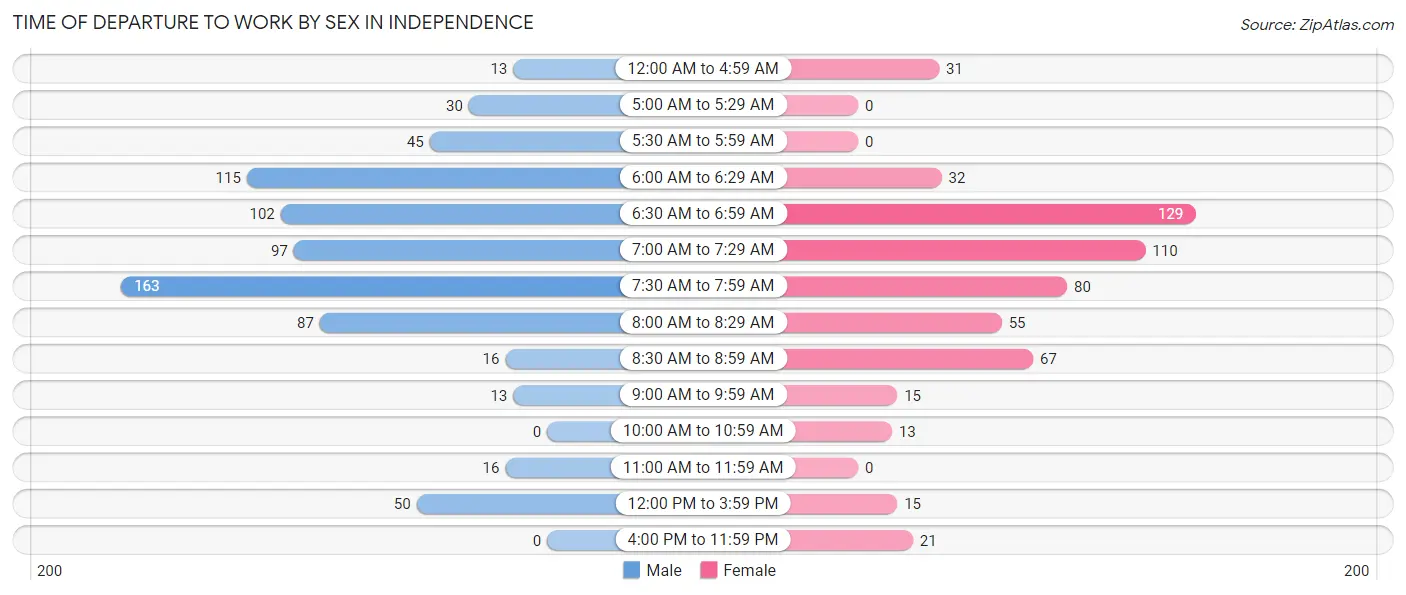
| Time of Departure | Male | Female |
| 12:00 AM to 4:59 AM | 13 (1.7%) | 31 (5.5%) |
| 5:00 AM to 5:29 AM | 30 (4.0%) | 0 (0.0%) |
| 5:30 AM to 5:59 AM | 45 (6.0%) | 0 (0.0%) |
| 6:00 AM to 6:29 AM | 115 (15.4%) | 32 (5.6%) |
| 6:30 AM to 6:59 AM | 102 (13.7%) | 129 (22.7%) |
| 7:00 AM to 7:29 AM | 97 (13.0%) | 110 (19.4%) |
| 7:30 AM to 7:59 AM | 163 (21.8%) | 80 (14.1%) |
| 8:00 AM to 8:29 AM | 87 (11.7%) | 55 (9.7%) |
| 8:30 AM to 8:59 AM | 16 (2.1%) | 67 (11.8%) |
| 9:00 AM to 9:59 AM | 13 (1.7%) | 15 (2.6%) |
| 10:00 AM to 10:59 AM | 0 (0.0%) | 13 (2.3%) |
| 11:00 AM to 11:59 AM | 16 (2.1%) | 0 (0.0%) |
| 12:00 PM to 3:59 PM | 50 (6.7%) | 15 (2.6%) |
| 4:00 PM to 11:59 PM | 0 (0.0%) | 21 (3.7%) |
| Total | 747 (100.0%) | 568 (100.0%) |
Housing Occupancy in Independence
Occupancy by Ownership in Independence
Of the total 1,196 dwellings in Independence, owner-occupied units account for 1,155 (96.6%), while renter-occupied units make up 41 (3.4%).
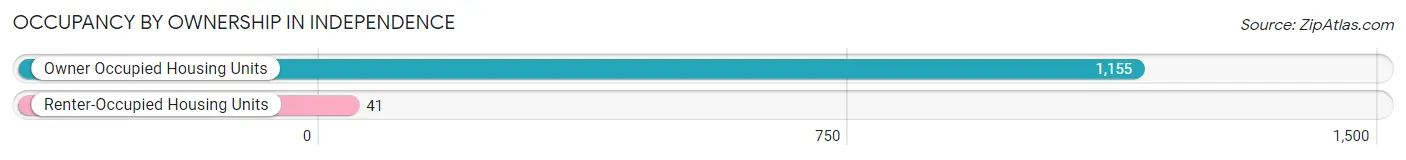
| Occupancy | # Housing Units | % Housing Units |
| Owner Occupied Housing Units | 1,155 | 96.6% |
| Renter-Occupied Housing Units | 41 | 3.4% |
| Total Occupied Housing Units | 1,196 | 100.0% |
Occupancy by Household Size in Independence
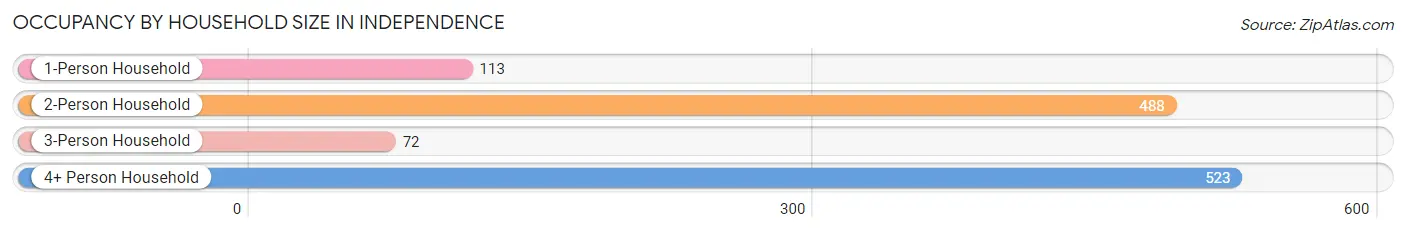
| Household Size | # Housing Units | % Housing Units |
| 1-Person Household | 113 | 9.5% |
| 2-Person Household | 488 | 40.8% |
| 3-Person Household | 72 | 6.0% |
| 4+ Person Household | 523 | 43.7% |
| Total Housing Units | 1,196 | 100.0% |
Occupancy by Ownership by Household Size in Independence
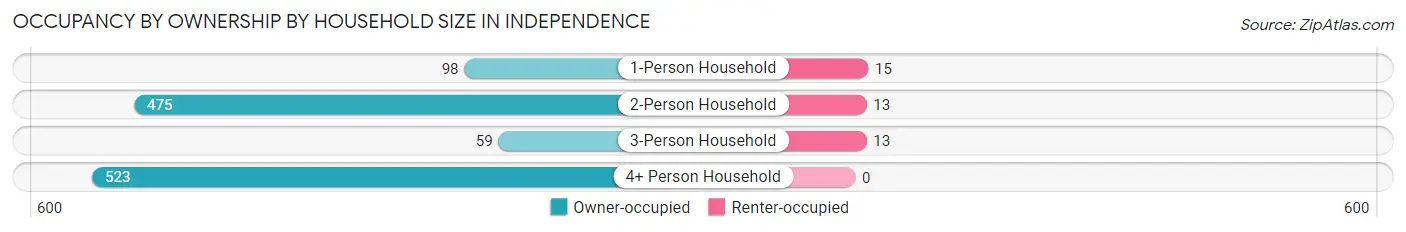
| Household Size | Owner-occupied | Renter-occupied |
| 1-Person Household | 98 (86.7%) | 15 (13.3%) |
| 2-Person Household | 475 (97.3%) | 13 (2.7%) |
| 3-Person Household | 59 (81.9%) | 13 (18.1%) |
| 4+ Person Household | 523 (100.0%) | 0 (0.0%) |
| Total Housing Units | 1,155 (96.6%) | 41 (3.4%) |
Occupancy by Educational Attainment in Independence
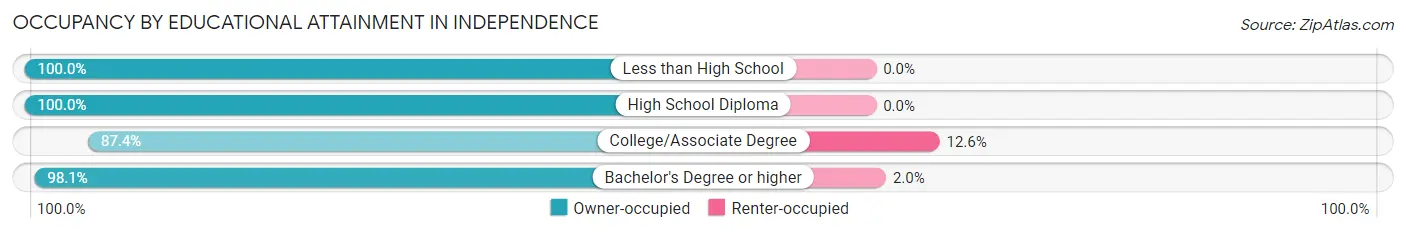
| Household Size | Owner-occupied | Renter-occupied |
| Less than High School | 36 (100.0%) | 0 (0.0%) |
| High School Diploma | 185 (100.0%) | 0 (0.0%) |
| College/Associate Degree | 181 (87.4%) | 26 (12.6%) |
| Bachelor's Degree or higher | 753 (98.1%) | 15 (1.9%) |
Occupancy by Age of Householder in Independence
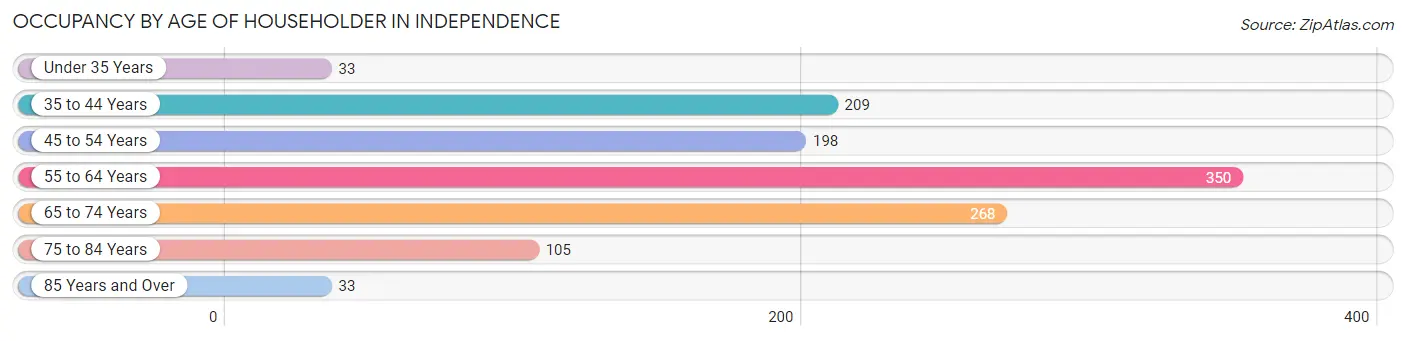
| Age Bracket | # Households | % Households |
| Under 35 Years | 33 | 2.8% |
| 35 to 44 Years | 209 | 17.5% |
| 45 to 54 Years | 198 | 16.6% |
| 55 to 64 Years | 350 | 29.3% |
| 65 to 74 Years | 268 | 22.4% |
| 75 to 84 Years | 105 | 8.8% |
| 85 Years and Over | 33 | 2.8% |
| Total | 1,196 | 100.0% |
Housing Finances in Independence
Median Income by Occupancy in Independence
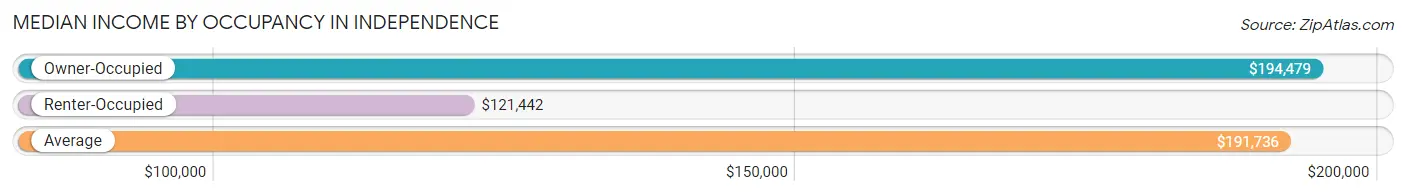
| Occupancy Type | # Households | Median Income |
| Owner-Occupied | 1,155 (96.6%) | $194,479 |
| Renter-Occupied | 41 (3.4%) | $121,442 |
| Average | 1,196 (100.0%) | $191,736 |
Occupancy by Householder Income Bracket in Independence
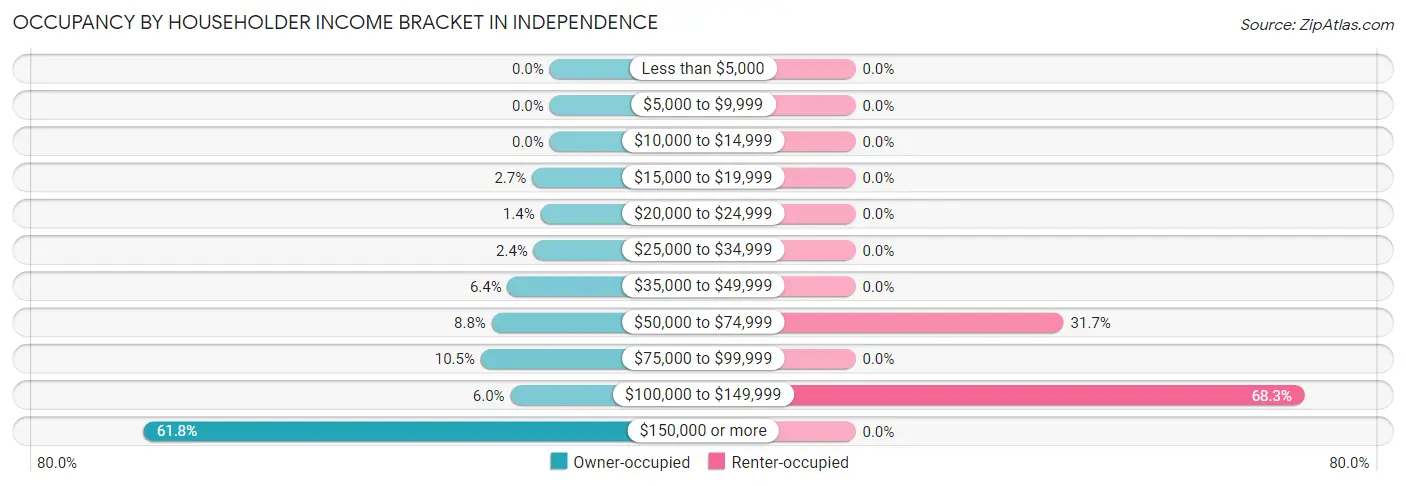
| Income Bracket | Owner-occupied | Renter-occupied |
| Less than $5,000 | 0 (0.0%) | 0 (0.0%) |
| $5,000 to $9,999 | 0 (0.0%) | 0 (0.0%) |
| $10,000 to $14,999 | 0 (0.0%) | 0 (0.0%) |
| $15,000 to $19,999 | 31 (2.7%) | 0 (0.0%) |
| $20,000 to $24,999 | 16 (1.4%) | 0 (0.0%) |
| $25,000 to $34,999 | 28 (2.4%) | 0 (0.0%) |
| $35,000 to $49,999 | 74 (6.4%) | 0 (0.0%) |
| $50,000 to $74,999 | 102 (8.8%) | 13 (31.7%) |
| $75,000 to $99,999 | 121 (10.5%) | 0 (0.0%) |
| $100,000 to $149,999 | 69 (6.0%) | 28 (68.3%) |
| $150,000 or more | 714 (61.8%) | 0 (0.0%) |
| Total | 1,155 (100.0%) | 41 (100.0%) |
Monthly Housing Cost Tiers in Independence
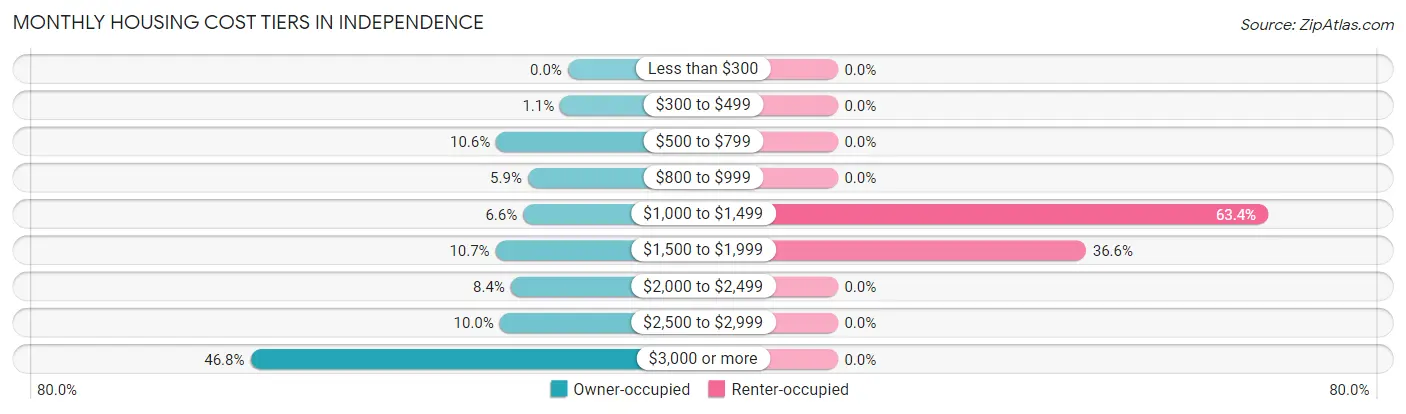
| Monthly Cost | Owner-occupied | Renter-occupied |
| Less than $300 | 0 (0.0%) | 0 (0.0%) |
| $300 to $499 | 13 (1.1%) | 0 (0.0%) |
| $500 to $799 | 122 (10.6%) | 0 (0.0%) |
| $800 to $999 | 68 (5.9%) | 0 (0.0%) |
| $1,000 to $1,499 | 76 (6.6%) | 26 (63.4%) |
| $1,500 to $1,999 | 123 (10.6%) | 15 (36.6%) |
| $2,000 to $2,499 | 97 (8.4%) | 0 (0.0%) |
| $2,500 to $2,999 | 116 (10.0%) | 0 (0.0%) |
| $3,000 or more | 540 (46.8%) | 0 (0.0%) |
| Total | 1,155 (100.0%) | 41 (100.0%) |
Physical Housing Characteristics in Independence
Housing Structures in Independence
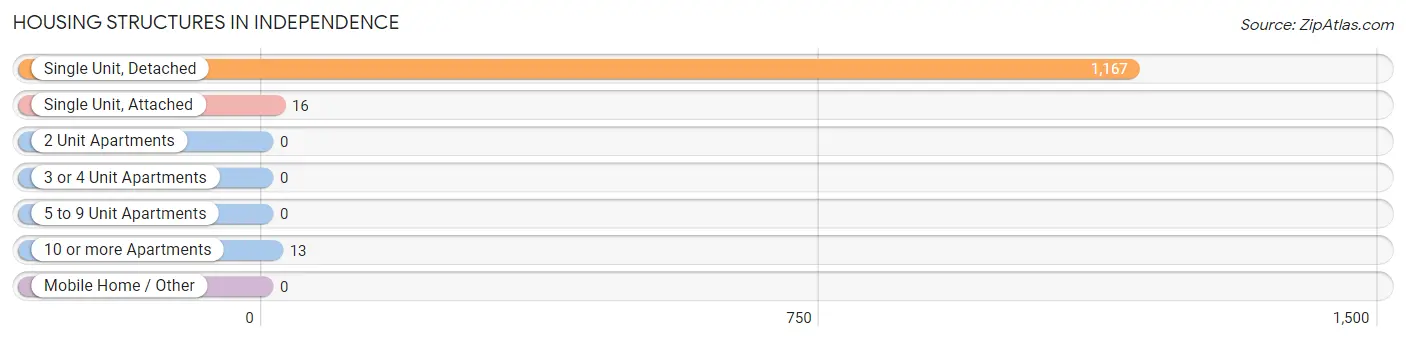
| Structure Type | # Housing Units | % Housing Units |
| Single Unit, Detached | 1,167 | 97.6% |
| Single Unit, Attached | 16 | 1.3% |
| 2 Unit Apartments | 0 | 0.0% |
| 3 or 4 Unit Apartments | 0 | 0.0% |
| 5 to 9 Unit Apartments | 0 | 0.0% |
| 10 or more Apartments | 13 | 1.1% |
| Mobile Home / Other | 0 | 0.0% |
| Total | 1,196 | 100.0% |
Housing Structures by Occupancy in Independence
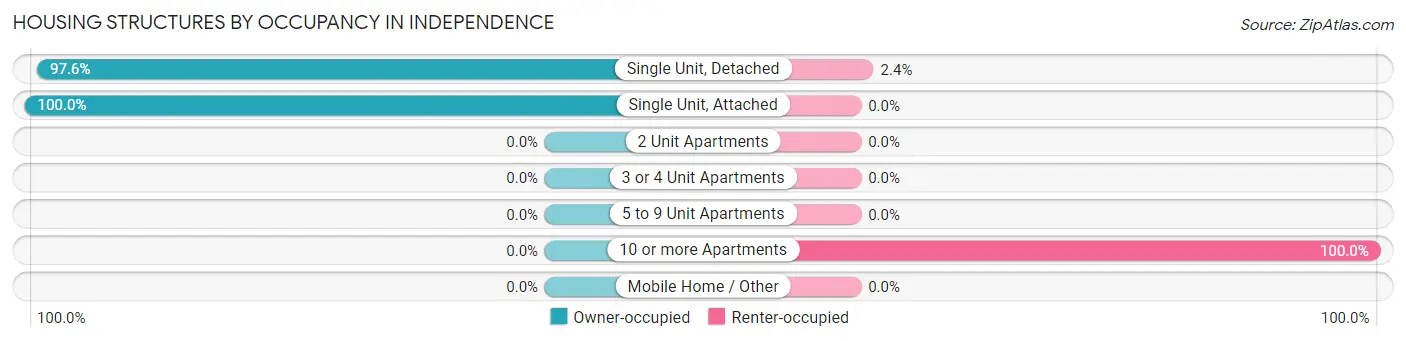
| Structure Type | Owner-occupied | Renter-occupied |
| Single Unit, Detached | 1,139 (97.6%) | 28 (2.4%) |
| Single Unit, Attached | 16 (100.0%) | 0 (0.0%) |
| 2 Unit Apartments | 0 (0.0%) | 0 (0.0%) |
| 3 or 4 Unit Apartments | 0 (0.0%) | 0 (0.0%) |
| 5 to 9 Unit Apartments | 0 (0.0%) | 0 (0.0%) |
| 10 or more Apartments | 0 (0.0%) | 13 (100.0%) |
| Mobile Home / Other | 0 (0.0%) | 0 (0.0%) |
| Total | 1,155 (96.6%) | 41 (3.4%) |
Housing Structures by Number of Rooms in Independence
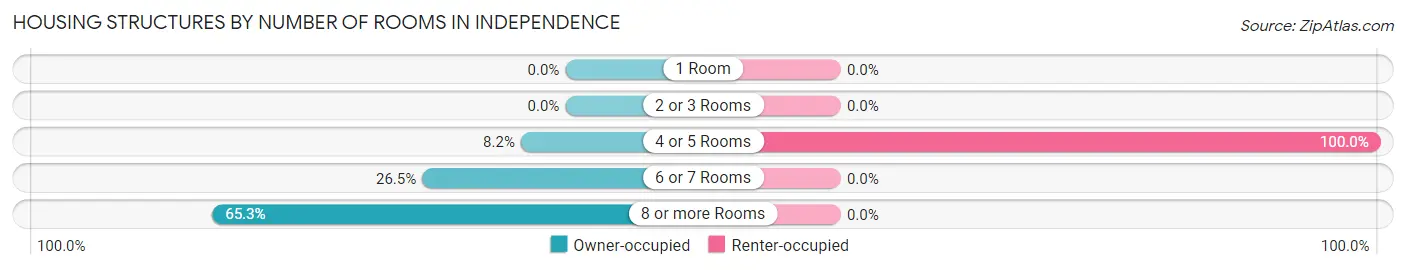
| Number of Rooms | Owner-occupied | Renter-occupied |
| 1 Room | 0 (0.0%) | 0 (0.0%) |
| 2 or 3 Rooms | 0 (0.0%) | 0 (0.0%) |
| 4 or 5 Rooms | 95 (8.2%) | 41 (100.0%) |
| 6 or 7 Rooms | 306 (26.5%) | 0 (0.0%) |
| 8 or more Rooms | 754 (65.3%) | 0 (0.0%) |
| Total | 1,155 (100.0%) | 41 (100.0%) |
Housing Structure by Heating Type in Independence
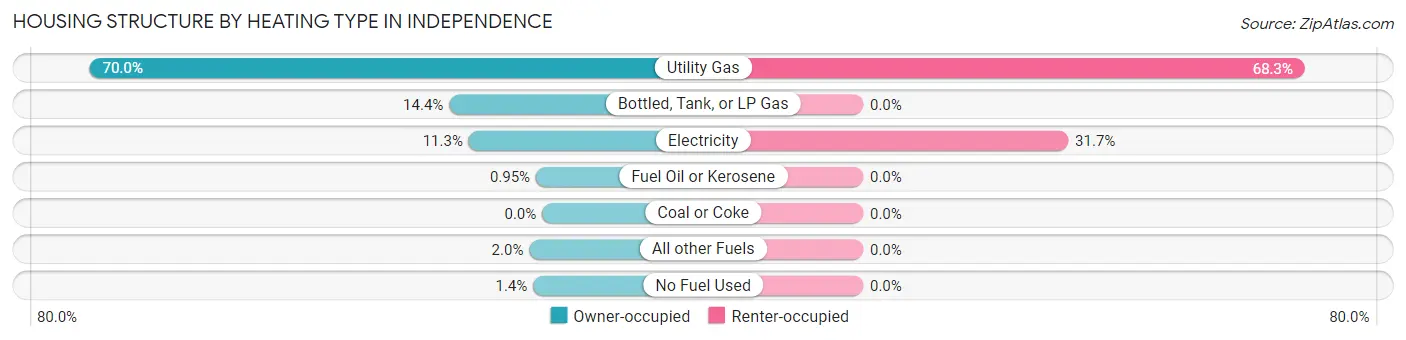
| Heating Type | Owner-occupied | Renter-occupied |
| Utility Gas | 808 (70.0%) | 28 (68.3%) |
| Bottled, Tank, or LP Gas | 166 (14.4%) | 0 (0.0%) |
| Electricity | 131 (11.3%) | 13 (31.7%) |
| Fuel Oil or Kerosene | 11 (0.9%) | 0 (0.0%) |
| Coal or Coke | 0 (0.0%) | 0 (0.0%) |
| All other Fuels | 23 (2.0%) | 0 (0.0%) |
| No Fuel Used | 16 (1.4%) | 0 (0.0%) |
| Total | 1,155 (100.0%) | 41 (100.0%) |
Household Vehicle Usage in Independence
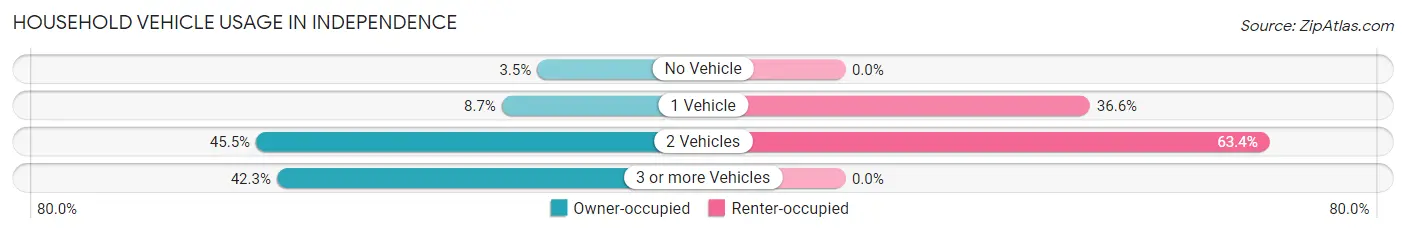
| Vehicles per Household | Owner-occupied | Renter-occupied |
| No Vehicle | 40 (3.5%) | 0 (0.0%) |
| 1 Vehicle | 101 (8.7%) | 15 (36.6%) |
| 2 Vehicles | 525 (45.5%) | 26 (63.4%) |
| 3 or more Vehicles | 489 (42.3%) | 0 (0.0%) |
| Total | 1,155 (100.0%) | 41 (100.0%) |
Real Estate & Mortgages in Independence
Real Estate and Mortgage Overview in Independence
| Characteristic | Without Mortgage | With Mortgage |
| Housing Units | 312 | 843 |
| Median Property Value | $468,700 | $794,600 |
| Median Household Income | $97,981 | $592 |
| Monthly Housing Costs | $922 | $540 |
| Real Estate Taxes | $5,496 | $0 |
Property Value by Mortgage Status in Independence
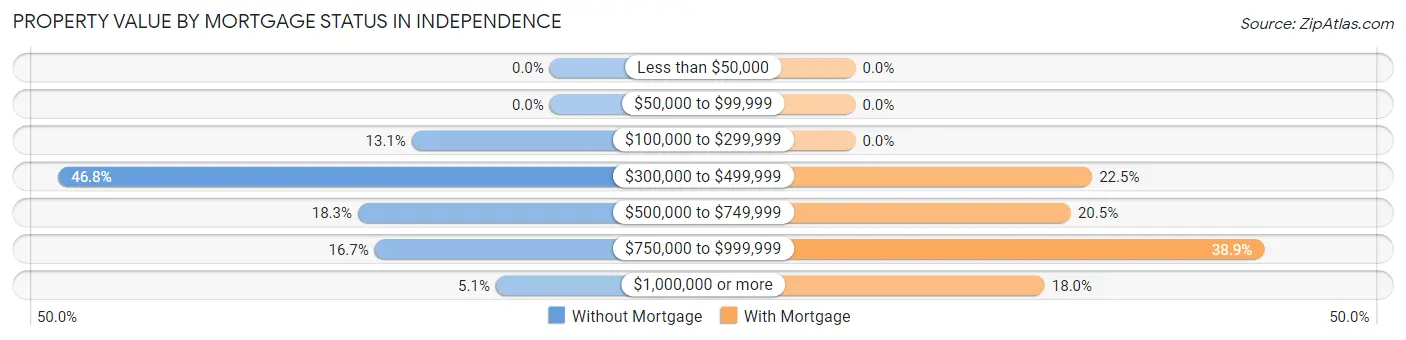
| Property Value | Without Mortgage | With Mortgage |
| Less than $50,000 | 0 (0.0%) | 0 (0.0%) |
| $50,000 to $99,999 | 0 (0.0%) | 0 (0.0%) |
| $100,000 to $299,999 | 41 (13.1%) | 0 (0.0%) |
| $300,000 to $499,999 | 146 (46.8%) | 190 (22.5%) |
| $500,000 to $749,999 | 57 (18.3%) | 173 (20.5%) |
| $750,000 to $999,999 | 52 (16.7%) | 328 (38.9%) |
| $1,000,000 or more | 16 (5.1%) | 152 (18.0%) |
| Total | 312 (100.0%) | 843 (100.0%) |
Household Income by Mortgage Status in Independence
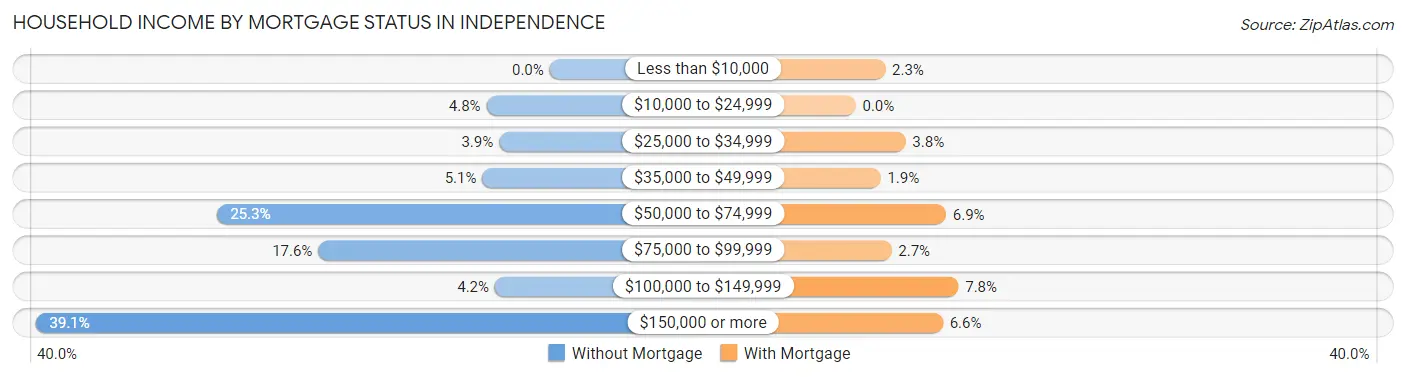
| Household Income | Without Mortgage | With Mortgage |
| Less than $10,000 | 0 (0.0%) | 19 (2.2%) |
| $10,000 to $24,999 | 15 (4.8%) | 0 (0.0%) |
| $25,000 to $34,999 | 12 (3.8%) | 32 (3.8%) |
| $35,000 to $49,999 | 16 (5.1%) | 16 (1.9%) |
| $50,000 to $74,999 | 79 (25.3%) | 58 (6.9%) |
| $75,000 to $99,999 | 55 (17.6%) | 23 (2.7%) |
| $100,000 to $149,999 | 13 (4.2%) | 66 (7.8%) |
| $150,000 or more | 122 (39.1%) | 56 (6.6%) |
| Total | 312 (100.0%) | 843 (100.0%) |
Property Value to Household Income Ratio in Independence
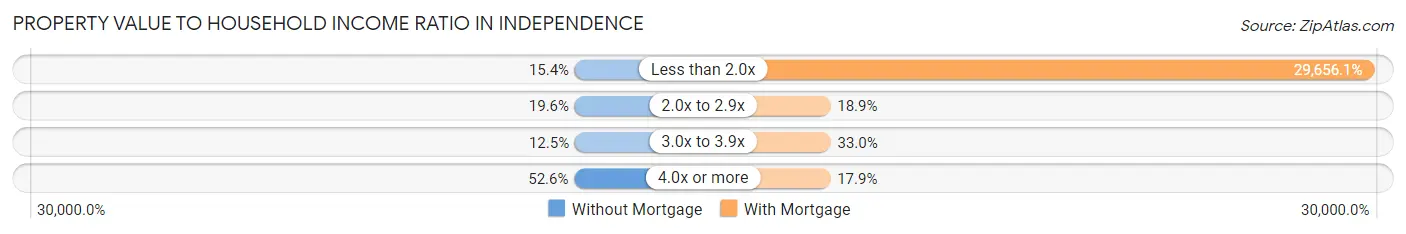
| Value-to-Income Ratio | Without Mortgage | With Mortgage |
| Less than 2.0x | 48 (15.4%) | 250,001 (29,656.1%) |
| 2.0x to 2.9x | 61 (19.6%) | 159 (18.9%) |
| 3.0x to 3.9x | 39 (12.5%) | 278 (33.0%) |
| 4.0x or more | 164 (52.6%) | 151 (17.9%) |
| Total | 312 (100.0%) | 843 (100.0%) |
Real Estate Taxes by Mortgage Status in Independence
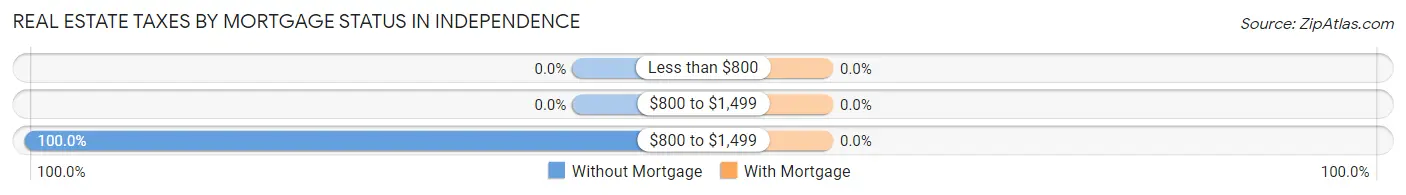
| Property Taxes | Without Mortgage | With Mortgage |
| Less than $800 | 0 (0.0%) | 0 (0.0%) |
| $800 to $1,499 | 0 (0.0%) | 0 (0.0%) |
| $800 to $1,499 | 312 (100.0%) | 0 (0.0%) |
| Total | 312 (100.0%) | 843 (100.0%) |
Health & Disability in Independence
Health Insurance Coverage by Age in Independence
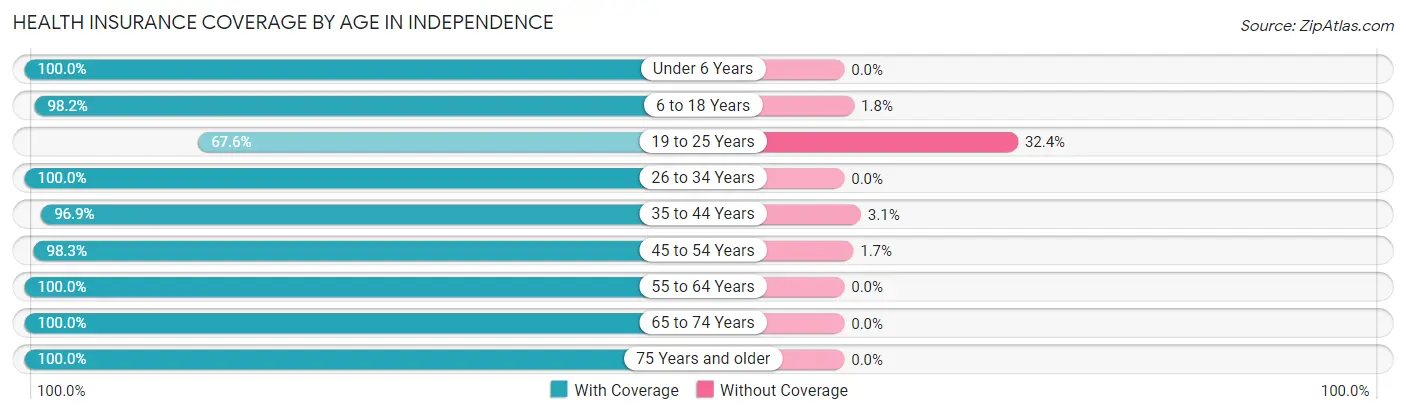
| Age Bracket | With Coverage | Without Coverage |
| Under 6 Years | 300 (100.0%) | 0 (0.0%) |
| 6 to 18 Years | 802 (98.2%) | 15 (1.8%) |
| 19 to 25 Years | 71 (67.6%) | 34 (32.4%) |
| 26 to 34 Years | 174 (100.0%) | 0 (0.0%) |
| 35 to 44 Years | 500 (96.9%) | 16 (3.1%) |
| 45 to 54 Years | 467 (98.3%) | 8 (1.7%) |
| 55 to 64 Years | 651 (100.0%) | 0 (0.0%) |
| 65 to 74 Years | 455 (100.0%) | 0 (0.0%) |
| 75 Years and older | 225 (100.0%) | 0 (0.0%) |
| Total | 3,645 (98.0%) | 73 (2.0%) |
Health Insurance Coverage by Citizenship Status in Independence
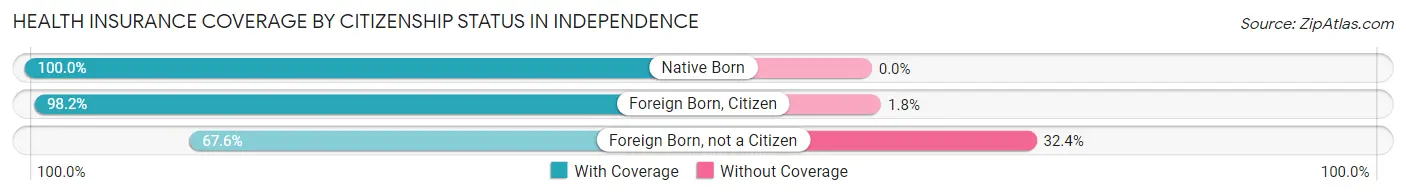
| Citizenship Status | With Coverage | Without Coverage |
| Native Born | 300 (100.0%) | 0 (0.0%) |
| Foreign Born, Citizen | 802 (98.2%) | 15 (1.8%) |
| Foreign Born, not a Citizen | 71 (67.6%) | 34 (32.4%) |
Health Insurance Coverage by Household Income in Independence
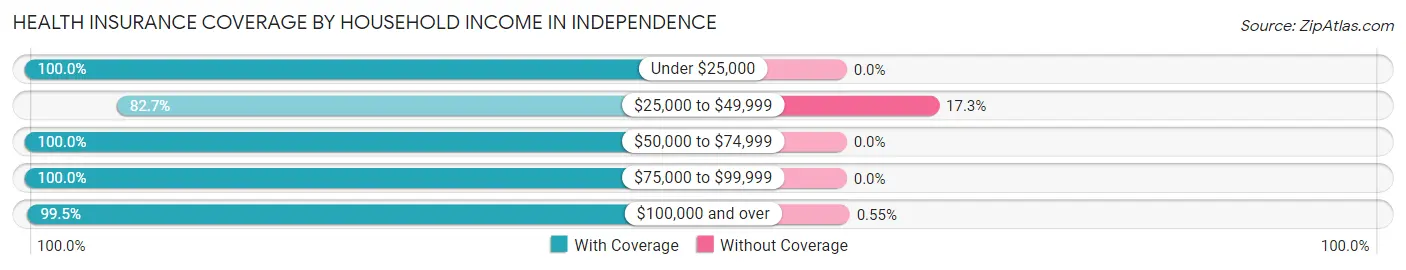
| Household Income | With Coverage | Without Coverage |
| Under $25,000 | 62 (100.0%) | 0 (0.0%) |
| $25,000 to $49,999 | 239 (82.7%) | 50 (17.3%) |
| $50,000 to $74,999 | 289 (100.0%) | 0 (0.0%) |
| $75,000 to $99,999 | 317 (100.0%) | 0 (0.0%) |
| $100,000 and over | 2,712 (99.5%) | 15 (0.5%) |
Public vs Private Health Insurance Coverage by Age in Independence
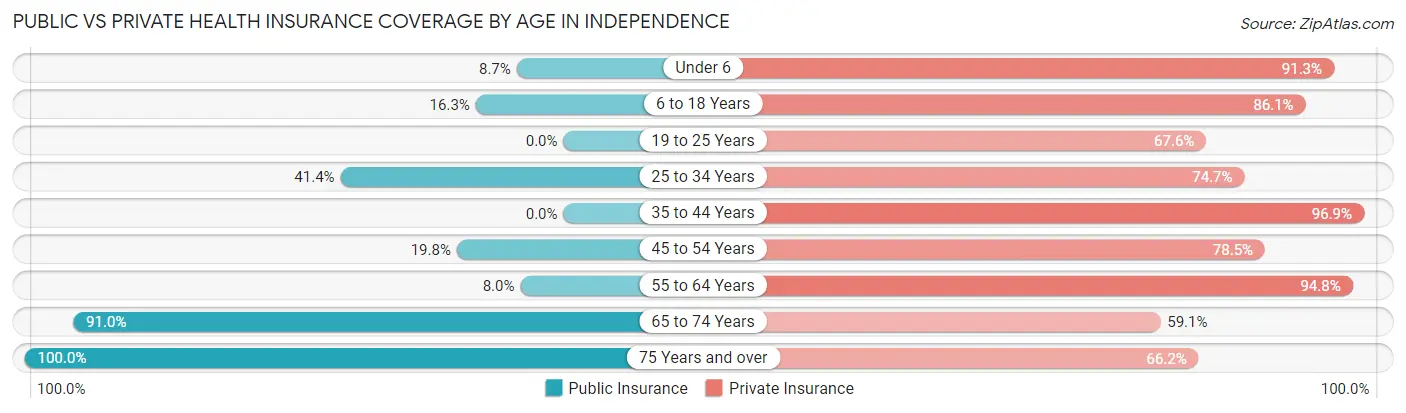
| Age Bracket | Public Insurance | Private Insurance |
| Under 6 | 26 (8.7%) | 274 (91.3%) |
| 6 to 18 Years | 133 (16.3%) | 703 (86.1%) |
| 19 to 25 Years | 0 (0.0%) | 71 (67.6%) |
| 25 to 34 Years | 72 (41.4%) | 130 (74.7%) |
| 35 to 44 Years | 0 (0.0%) | 500 (96.9%) |
| 45 to 54 Years | 94 (19.8%) | 373 (78.5%) |
| 55 to 64 Years | 52 (8.0%) | 617 (94.8%) |
| 65 to 74 Years | 414 (91.0%) | 269 (59.1%) |
| 75 Years and over | 225 (100.0%) | 149 (66.2%) |
| Total | 1,016 (27.3%) | 3,086 (83.0%) |
Disability Status by Sex by Age in Independence
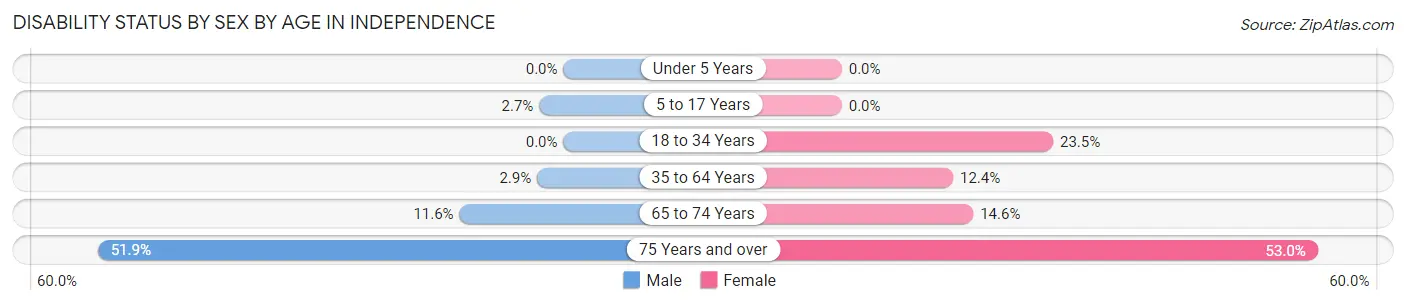
| Age Bracket | Male | Female |
| Under 5 Years | 0 (0.0%) | 0 (0.0%) |
| 5 to 17 Years | 15 (2.7%) | 0 (0.0%) |
| 18 to 34 Years | 0 (0.0%) | 44 (23.5%) |
| 35 to 64 Years | 24 (2.9%) | 102 (12.4%) |
| 65 to 74 Years | 25 (11.6%) | 35 (14.6%) |
| 75 Years and over | 56 (51.8%) | 62 (53.0%) |
Disability Class by Sex by Age in Independence
Disability Class: Hearing Difficulty
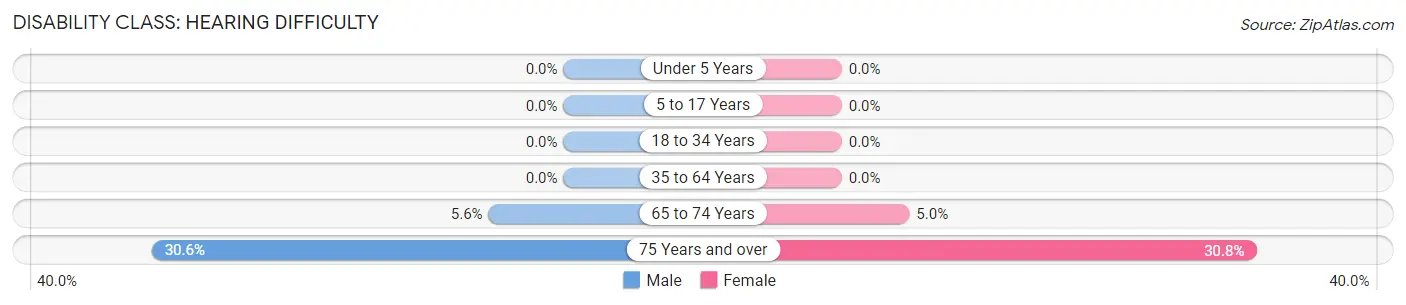
| Age Bracket | Male | Female |
| Under 5 Years | 0 (0.0%) | 0 (0.0%) |
| 5 to 17 Years | 0 (0.0%) | 0 (0.0%) |
| 18 to 34 Years | 0 (0.0%) | 0 (0.0%) |
| 35 to 64 Years | 0 (0.0%) | 0 (0.0%) |
| 65 to 74 Years | 12 (5.6%) | 12 (5.0%) |
| 75 Years and over | 33 (30.6%) | 36 (30.8%) |
Disability Class: Vision Difficulty
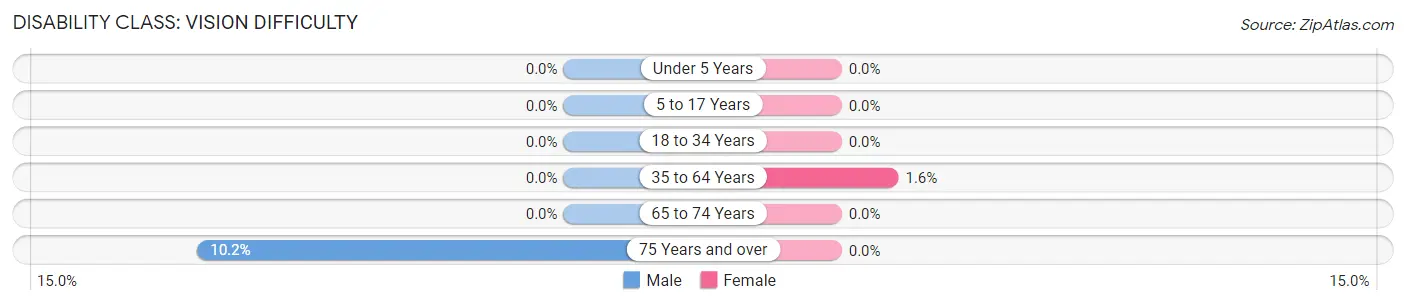
| Age Bracket | Male | Female |
| Under 5 Years | 0 (0.0%) | 0 (0.0%) |
| 5 to 17 Years | 0 (0.0%) | 0 (0.0%) |
| 18 to 34 Years | 0 (0.0%) | 0 (0.0%) |
| 35 to 64 Years | 0 (0.0%) | 13 (1.6%) |
| 65 to 74 Years | 0 (0.0%) | 0 (0.0%) |
| 75 Years and over | 11 (10.2%) | 0 (0.0%) |
Disability Class: Cognitive Difficulty
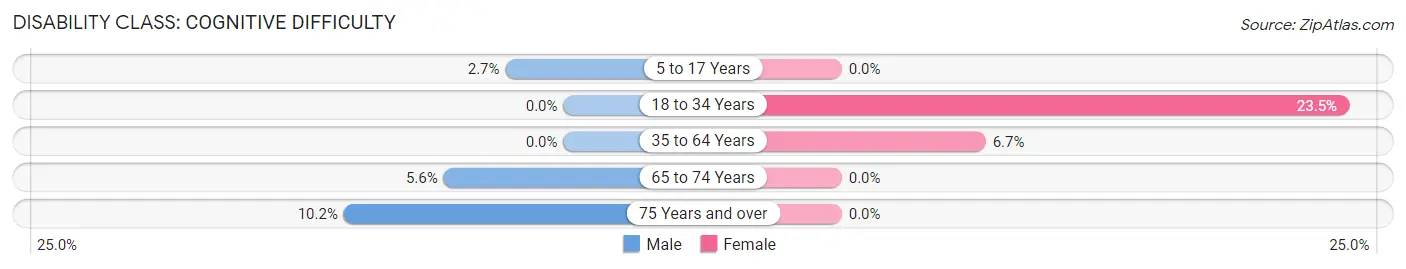
| Age Bracket | Male | Female |
| 5 to 17 Years | 15 (2.7%) | 0 (0.0%) |
| 18 to 34 Years | 0 (0.0%) | 44 (23.5%) |
| 35 to 64 Years | 0 (0.0%) | 55 (6.7%) |
| 65 to 74 Years | 12 (5.6%) | 0 (0.0%) |
| 75 Years and over | 11 (10.2%) | 0 (0.0%) |
Disability Class: Ambulatory Difficulty
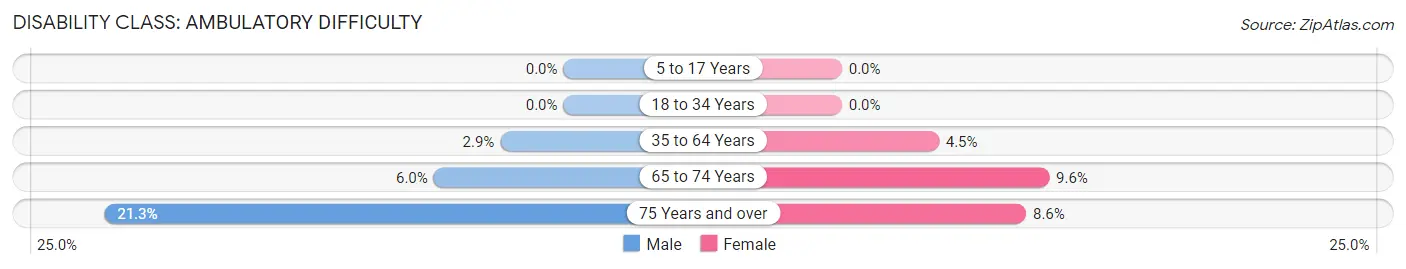
| Age Bracket | Male | Female |
| 5 to 17 Years | 0 (0.0%) | 0 (0.0%) |
| 18 to 34 Years | 0 (0.0%) | 0 (0.0%) |
| 35 to 64 Years | 24 (2.9%) | 37 (4.5%) |
| 65 to 74 Years | 13 (6.0%) | 23 (9.6%) |
| 75 Years and over | 23 (21.3%) | 10 (8.6%) |
Disability Class: Self-Care Difficulty
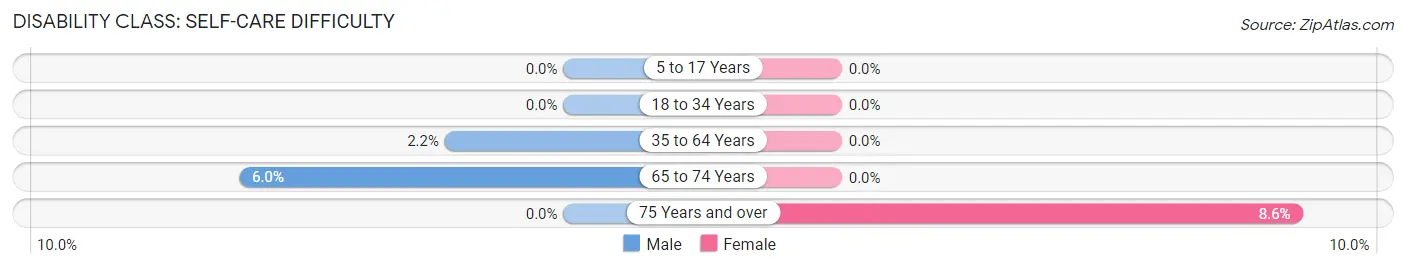
| Age Bracket | Male | Female |
| 5 to 17 Years | 0 (0.0%) | 0 (0.0%) |
| 18 to 34 Years | 0 (0.0%) | 0 (0.0%) |
| 35 to 64 Years | 18 (2.2%) | 0 (0.0%) |
| 65 to 74 Years | 13 (6.0%) | 0 (0.0%) |
| 75 Years and over | 0 (0.0%) | 10 (8.6%) |
Technology Access in Independence
Computing Device Access in Independence
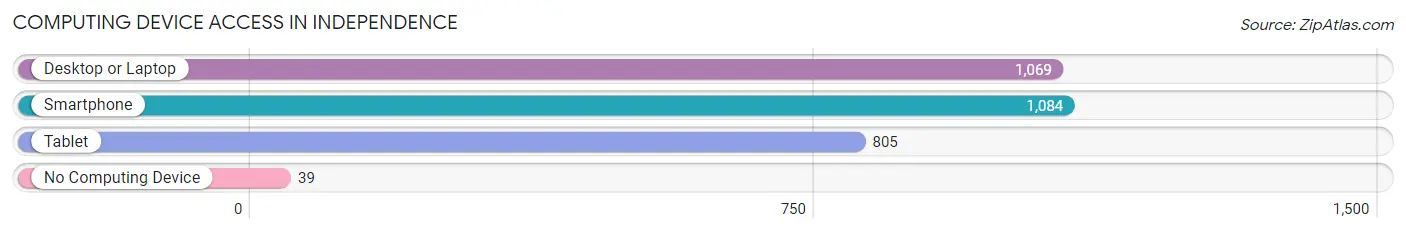
| Device Type | # Households | % Households |
| Desktop or Laptop | 1,069 | 89.4% |
| Smartphone | 1,084 | 90.6% |
| Tablet | 805 | 67.3% |
| No Computing Device | 39 | 3.3% |
| Total | 1,196 | 100.0% |
Internet Access in Independence
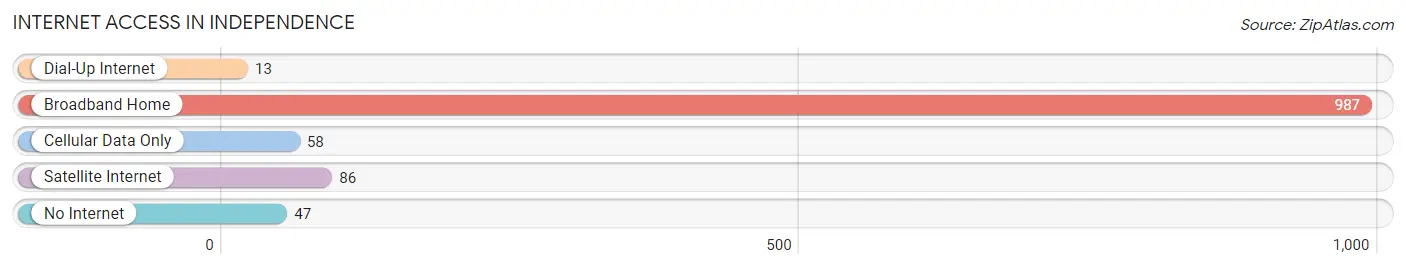
| Internet Type | # Households | % Households |
| Dial-Up Internet | 13 | 1.1% |
| Broadband Home | 987 | 82.5% |
| Cellular Data Only | 58 | 4.9% |
| Satellite Internet | 86 | 7.2% |
| No Internet | 47 | 3.9% |
| Total | 1,196 | 100.0% |
Independence Summary
Independence is a city located in Hennepin County, Minnesota, United States. The population was 8,945 at the 2010 census. It is part of the Twin Cities metropolitan area.
History
Independence was first settled in 1855 by a group of German immigrants. The town was originally called Germania, but was later changed to Independence in 1858. The town was officially incorporated in 1876.
In the late 19th century, Independence was a thriving agricultural community. The town was known for its dairy farms and its production of butter and cheese.
Geography
Independence is located in Hennepin County, Minnesota. It is situated on the west bank of the Mississippi River, about 25 miles northwest of Minneapolis. The city has a total area of 4.2 square miles, all of which is land.
The city is located in the Big Woods region of Minnesota, which is characterized by rolling hills and dense forests. The city is also located near the St. Croix River, which forms the border between Minnesota and Wisconsin.
Economy
Independence is a small city with a diverse economy. The city is home to a variety of businesses, including manufacturing, retail, and service industries.
The city is also home to several large employers, including the Hennepin County Medical Center, the University of Minnesota Medical Center, and the Minneapolis VA Medical Center.
Demographics
As of the 2010 census, there were 8,945 people, 3,541 households, and 2,092 families residing in the city. The population density was 2,092.7 people per square mile. The racial makeup of the city was 92.2% White, 2.3% African American, 0.4% Native American, 1.7% Asian, 0.1% Pacific Islander, 1.3% from other races, and 2.1% from two or more races. Hispanic or Latino of any race were 4.2% of the population.
The median income for a household in the city was $50,945, and the median income for a family was $63,945. The per capita income for the city was $25,945. About 4.2% of families and 6.2% of the population were below the poverty line, including 8.2% of those under age 18 and 4.2% of those age 65 or over.
Conclusion
Independence is a small city located in Hennepin County, Minnesota. The city has a rich history, and was first settled in 1855 by a group of German immigrants. The city has a diverse economy, and is home to a variety of businesses, including manufacturing, retail, and service industries. The population of the city is 8,945, and the median income for a household is $50,945. Independence is a vibrant city with a rich history and a diverse economy.
Common Questions
What is Per Capita Income in Independence?
Per Capita income in Independence is $86,887.
What is the Median Family Income in Independence?
Median Family Income in Independence is $216,328.
What is the Median Household income in Independence?
Median Household Income in Independence is $191,736.
What is Income or Wage Gap in Independence?
Income or Wage Gap in Independence is 49.6%.
Women in Independence earn 50.4 cents for every dollar earned by a man.
What is Inequality or Gini Index in Independence?
Inequality or Gini Index in Independence is 0.47.
What is the Total Population of Independence?
Total Population of Independence is 3,718.
What is the Total Male Population of Independence?
Total Male Population of Independence is 1,946.
What is the Total Female Population of Independence?
Total Female Population of Independence is 1,772.
What is the Ratio of Males per 100 Females in Independence?
There are 109.82 Males per 100 Females in Independence.
What is the Ratio of Females per 100 Males in Independence?
There are 91.06 Females per 100 Males in Independence.
What is the Median Population Age in Independence?
Median Population Age in Independence is 41.9 Years.
What is the Average Family Size in Independence
Average Family Size in Independence is 3.3 People.
What is the Average Household Size in Independence
Average Household Size in Independence is 3.1 People.
How Large is the Labor Force in Independence?
There are 1,808 People in the Labor Forcein in Independence.
What is the Percentage of People in the Labor Force in Independence?
66.3% of People are in the Labor Force in Independence.