DISH, TX Map & Demographics
DISH Map
DISH Overview
$53,364
PER CAPITA INCOME
$133,583
AVG FAMILY INCOME
$132,667
AVG HOUSEHOLD INCOME
32.2%
WAGE / INCOME GAP [ % ]
67.8¢/ $1
WAGE / INCOME GAP [ $ ]
0.28
INEQUALITY / GINI INDEX
537
TOTAL POPULATION
262
MALE POPULATION
275
FEMALE POPULATION
95.27
MALES / 100 FEMALES
104.96
FEMALES / 100 MALES
43.1
MEDIAN AGE
3.0
AVG FAMILY SIZE
2.7
AVG HOUSEHOLD SIZE
309
LABOR FORCE [ PEOPLE ]
72.2%
PERCENT IN LABOR FORCE
1.6%
UNEMPLOYMENT RATE
Income in DISH
Income Overview in DISH
Per Capita Income in DISH is $53,364, while median incomes of families and households are $133,583 and $132,667 respectively.
| Characteristic | Number | Measure |
| Per Capita Income | 537 | $53,364 |
| Median Family Income | 167 | $133,583 |
| Mean Family Income | 167 | $148,341 |
| Median Household Income | 196 | $132,667 |
| Mean Household Income | 196 | $143,201 |
| Income Deficit | 167 | $0 |
| Wage / Income Gap (%) | 537 | 32.24% |
| Wage / Income Gap ($) | 537 | 67.76¢ per $1 |
| Gini / Inequality Index | 537 | 0.28 |
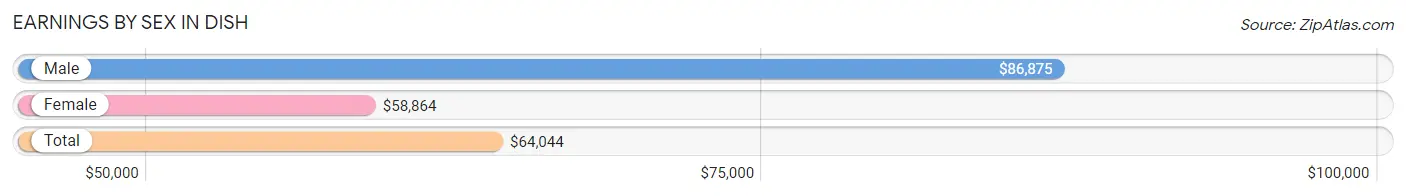
Earnings by Sex in DISH
Average Earnings in DISH are $64,044, $86,875 for men and $58,864 for women, a difference of 32.2%.
| Sex | Number | Average Earnings |
| Male | 169 (51.4%) | $86,875 |
| Female | 160 (48.6%) | $58,864 |
| Total | 329 (100.0%) | $64,044 |
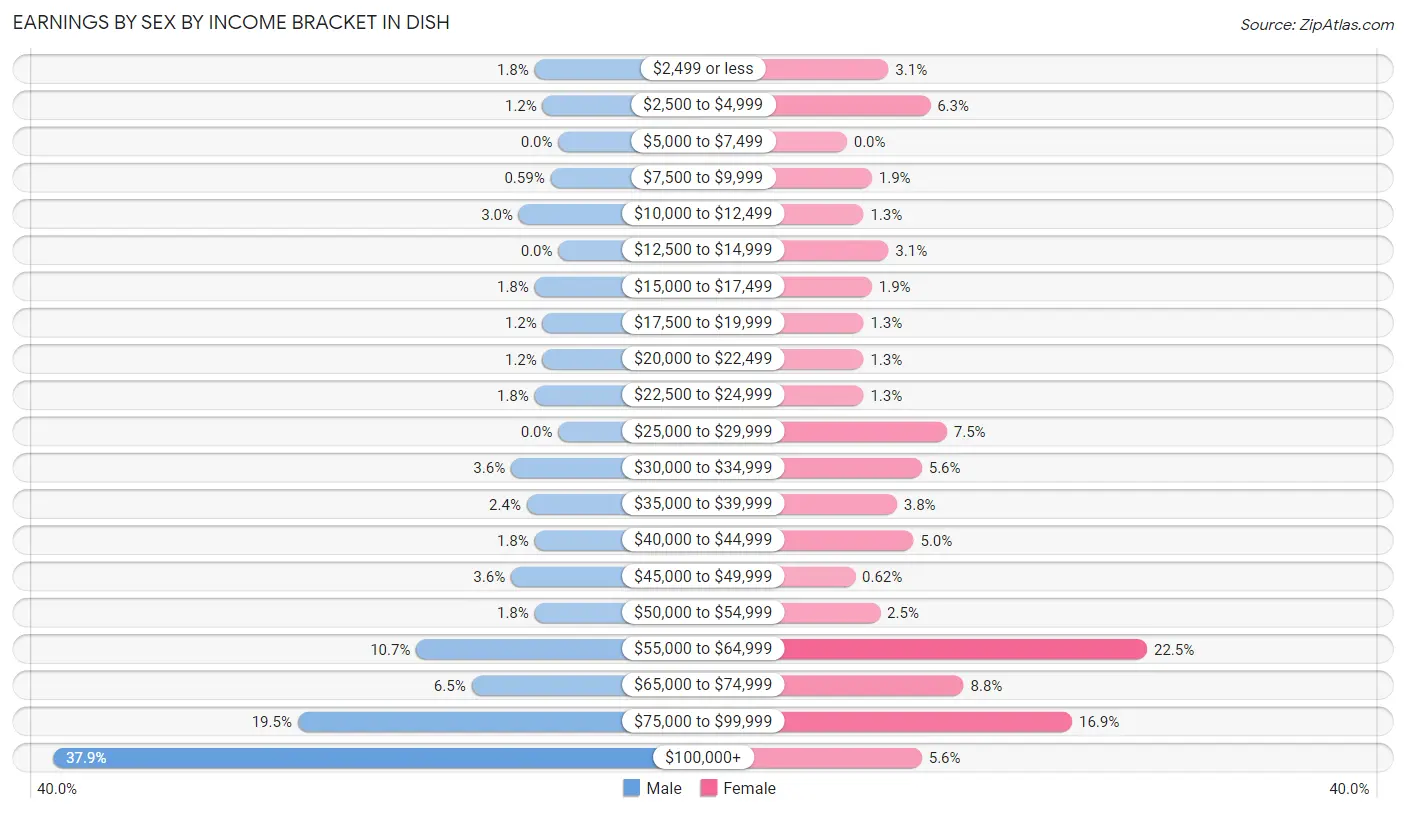
Earnings by Sex by Income Bracket in DISH
The most common earnings brackets in DISH are $100,000+ for men (64 | 37.9%) and $55,000 to $64,999 for women (36 | 22.5%).
| Income | Male | Female |
| $2,499 or less | 3 (1.8%) | 5 (3.1%) |
| $2,500 to $4,999 | 2 (1.2%) | 10 (6.2%) |
| $5,000 to $7,499 | 0 (0.0%) | 0 (0.0%) |
| $7,500 to $9,999 | 1 (0.6%) | 3 (1.9%) |
| $10,000 to $12,499 | 5 (3.0%) | 2 (1.3%) |
| $12,500 to $14,999 | 0 (0.0%) | 5 (3.1%) |
| $15,000 to $17,499 | 3 (1.8%) | 3 (1.9%) |
| $17,500 to $19,999 | 2 (1.2%) | 2 (1.3%) |
| $20,000 to $22,499 | 2 (1.2%) | 2 (1.3%) |
| $22,500 to $24,999 | 3 (1.8%) | 2 (1.3%) |
| $25,000 to $29,999 | 0 (0.0%) | 12 (7.5%) |
| $30,000 to $34,999 | 6 (3.5%) | 9 (5.6%) |
| $35,000 to $39,999 | 4 (2.4%) | 6 (3.7%) |
| $40,000 to $44,999 | 3 (1.8%) | 8 (5.0%) |
| $45,000 to $49,999 | 6 (3.5%) | 1 (0.6%) |
| $50,000 to $54,999 | 3 (1.8%) | 4 (2.5%) |
| $55,000 to $64,999 | 18 (10.6%) | 36 (22.5%) |
| $65,000 to $74,999 | 11 (6.5%) | 14 (8.7%) |
| $75,000 to $99,999 | 33 (19.5%) | 27 (16.9%) |
| $100,000+ | 64 (37.9%) | 9 (5.6%) |
| Total | 169 (100.0%) | 160 (100.0%) |
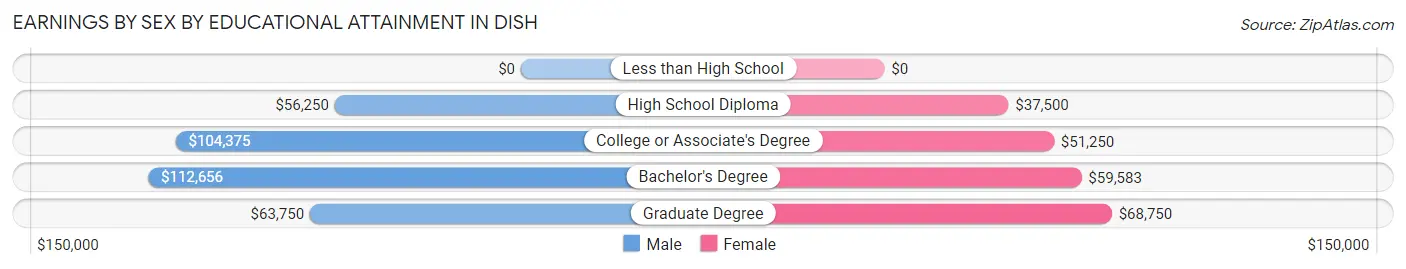
Earnings by Sex by Educational Attainment in DISH
Average earnings in DISH are $90,000 for men and $59,318 for women, a difference of 34.1%. Men with an educational attainment of bachelor's degree enjoy the highest average annual earnings of $112,656, while those with high school diploma education earn the least with $56,250. Women with an educational attainment of graduate degree earn the most with the average annual earnings of $68,750, while those with high school diploma education have the smallest earnings of $37,500.
| Educational Attainment | Male Income | Female Income |
| Less than High School | - | - |
| High School Diploma | $56,250 | $37,500 |
| College or Associate's Degree | $104,375 | $51,250 |
| Bachelor's Degree | $112,656 | $59,583 |
| Graduate Degree | $63,750 | $68,750 |
| Total | $90,000 | $59,318 |
Family Income in DISH
Family Income Brackets in DISH
According to the DISH family income data, there are 62 families falling into the $100,000 to $149,999 income range, which is the most common income bracket and makes up 37.1% of all families.
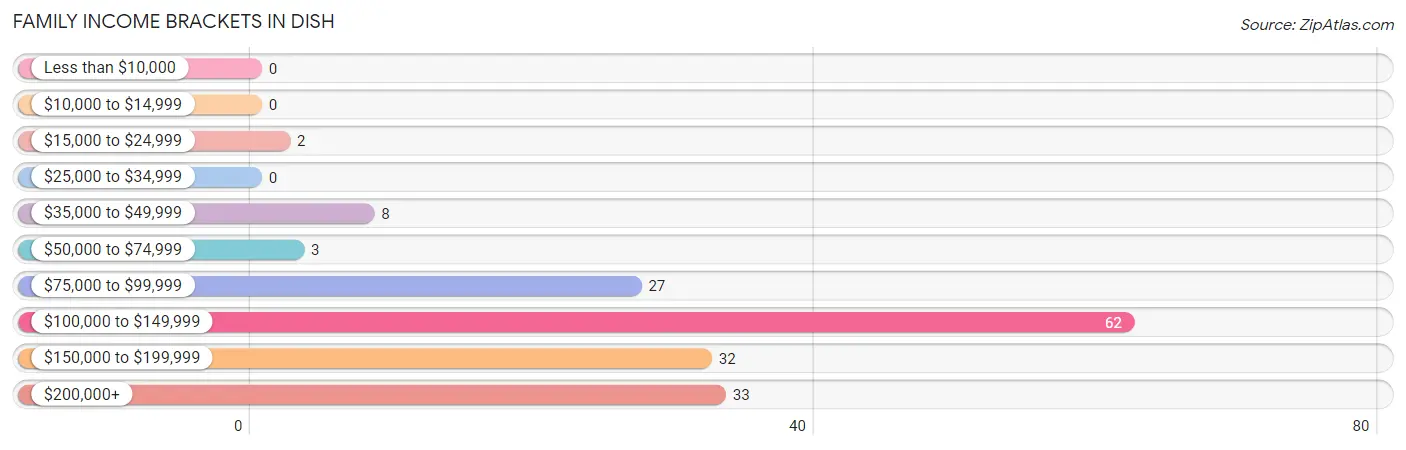
| Income Bracket | # Families | % Families |
| Less than $10,000 | 0 | 0.0% |
| $10,000 to $14,999 | 0 | 0.0% |
| $15,000 to $24,999 | 2 | 1.2% |
| $25,000 to $34,999 | 0 | 0.0% |
| $35,000 to $49,999 | 8 | 4.8% |
| $50,000 to $74,999 | 3 | 1.8% |
| $75,000 to $99,999 | 27 | 16.2% |
| $100,000 to $149,999 | 62 | 37.1% |
| $150,000 to $199,999 | 32 | 19.2% |
| $200,000+ | 33 | 19.8% |
Family Income by Famaliy Size in DISH
3-person families (37 | 22.2%) account for the highest median family income in DISH with $175,179 per family, while 2-person families (76 | 45.5%) have the highest median income of $59,166 per family member.
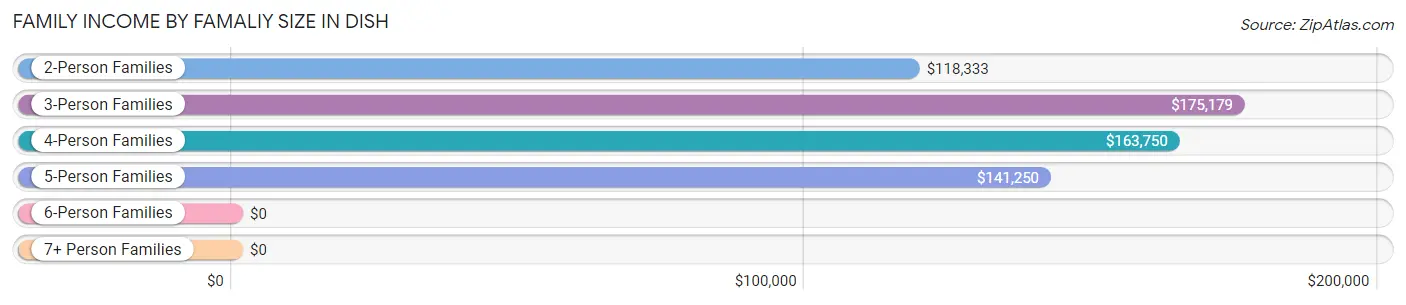
| Income Bracket | # Families | Median Income |
| 2-Person Families | 76 (45.5%) | $118,333 |
| 3-Person Families | 37 (22.2%) | $175,179 |
| 4-Person Families | 47 (28.1%) | $163,750 |
| 5-Person Families | 7 (4.2%) | $141,250 |
| 6-Person Families | 0 (0.0%) | $0 |
| 7+ Person Families | 0 (0.0%) | $0 |
| Total | 167 (100.0%) | $133,583 |
Family Income by Number of Earners in DISH
The median family income in DISH is $133,583, with families comprising 2 earners (114) having the highest median family income of $156,250, while families with no earners (12) have the lowest median family income of $86,250, accounting for 68.3% and 7.2% of families, respectively.
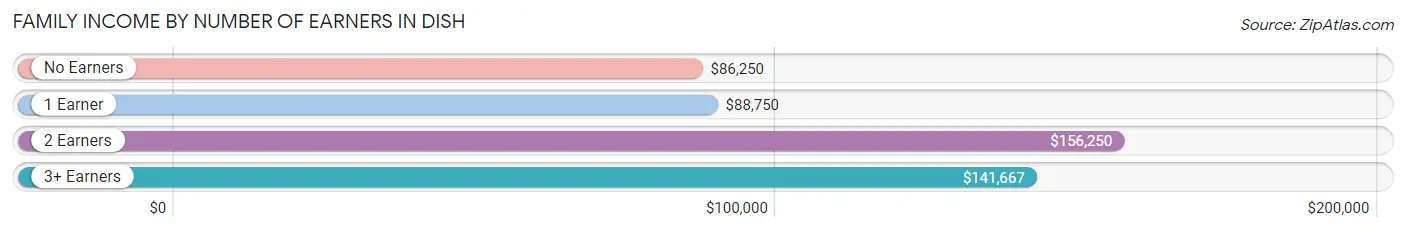
| Number of Earners | # Families | Median Income |
| No Earners | 12 (7.2%) | $86,250 |
| 1 Earner | 31 (18.6%) | $88,750 |
| 2 Earners | 114 (68.3%) | $156,250 |
| 3+ Earners | 10 (6.0%) | $141,667 |
| Total | 167 (100.0%) | $133,583 |
Household Income in DISH
Household Income Brackets in DISH
With 66 households falling in the category, the $100,000 to $149,999 income range is the most frequent in DISH, accounting for 33.7% of all households.
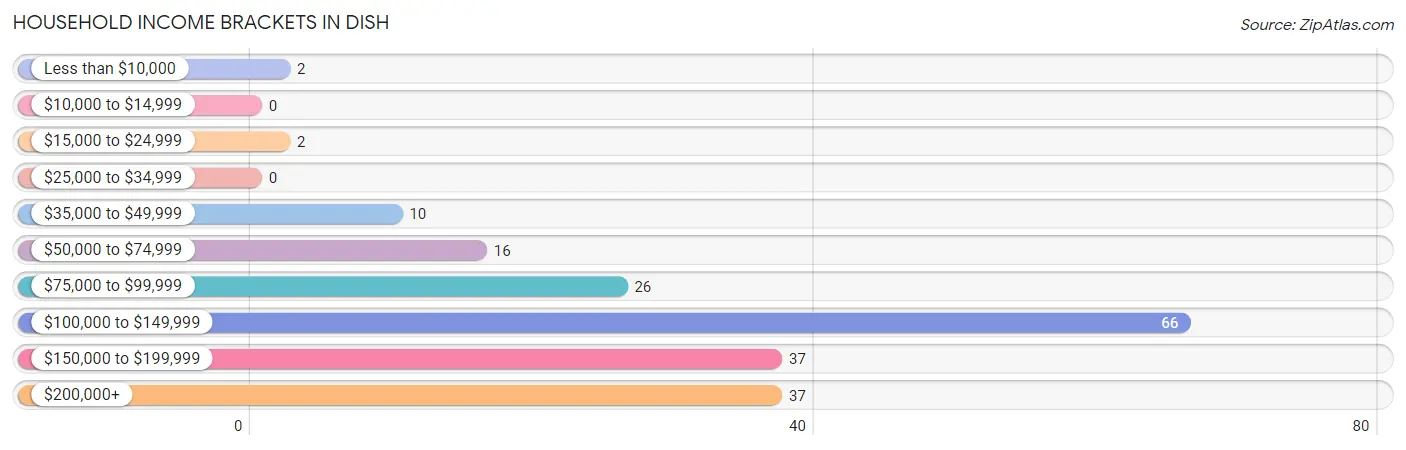
| Income Bracket | # Households | % Households |
| Less than $10,000 | 2 | 1.0% |
| $10,000 to $14,999 | 0 | 0.0% |
| $15,000 to $24,999 | 2 | 1.0% |
| $25,000 to $34,999 | 0 | 0.0% |
| $35,000 to $49,999 | 10 | 5.1% |
| $50,000 to $74,999 | 16 | 8.2% |
| $75,000 to $99,999 | 26 | 13.3% |
| $100,000 to $149,999 | 66 | 33.7% |
| $150,000 to $199,999 | 37 | 18.9% |
| $200,000+ | 37 | 18.9% |
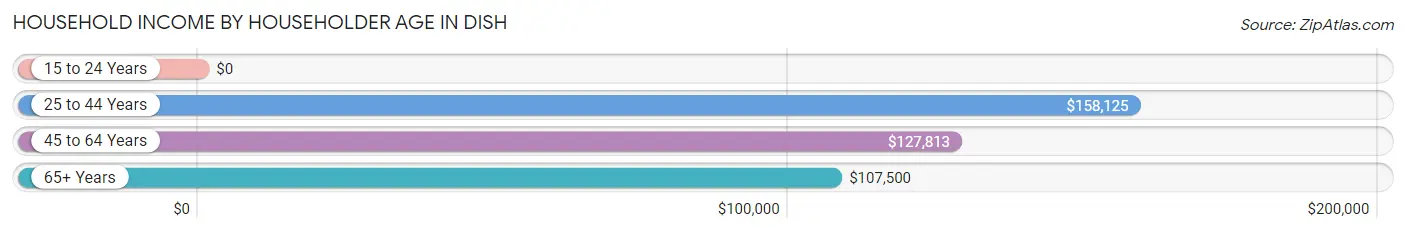
Household Income by Householder Age in DISH
The median household income in DISH is $132,667, with the highest median household income of $158,125 found in the 25 to 44 years age bracket for the primary householder. A total of 69 households (35.2%) fall into this category.
| Income Bracket | # Households | Median Income |
| 15 to 24 Years | 0 (0.0%) | $0 |
| 25 to 44 Years | 69 (35.2%) | $158,125 |
| 45 to 64 Years | 81 (41.3%) | $127,813 |
| 65+ Years | 46 (23.5%) | $107,500 |
| Total | 196 (100.0%) | $132,667 |
Poverty in DISH
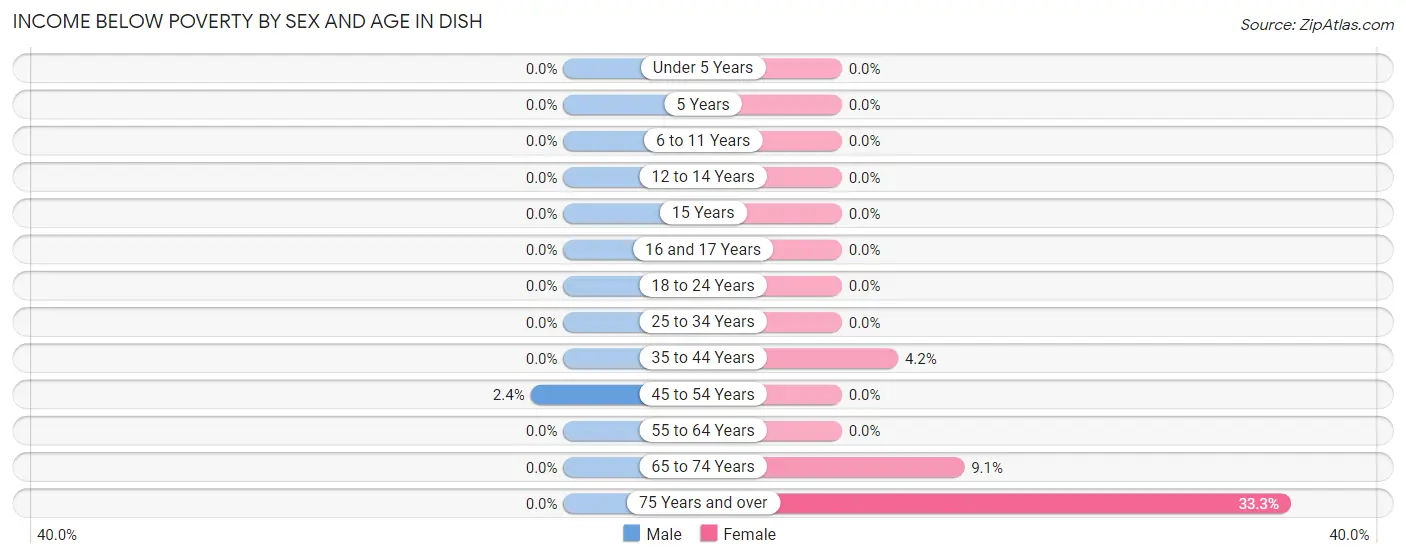
Income Below Poverty by Sex and Age in DISH
With 0.4% poverty level for males and 2.2% for females among the residents of DISH, 45 to 54 year old males and 75 year old and over females are the most vulnerable to poverty, with 1 males (2.4%) and 2 females (33.3%) in their respective age groups living below the poverty level.
| Age Bracket | Male | Female |
| Under 5 Years | 0 (0.0%) | 0 (0.0%) |
| 5 Years | 0 (0.0%) | 0 (0.0%) |
| 6 to 11 Years | 0 (0.0%) | 0 (0.0%) |
| 12 to 14 Years | 0 (0.0%) | 0 (0.0%) |
| 15 Years | 0 (0.0%) | 0 (0.0%) |
| 16 and 17 Years | 0 (0.0%) | 0 (0.0%) |
| 18 to 24 Years | 0 (0.0%) | 0 (0.0%) |
| 25 to 34 Years | 0 (0.0%) | 0 (0.0%) |
| 35 to 44 Years | 0 (0.0%) | 2 (4.2%) |
| 45 to 54 Years | 1 (2.4%) | 0 (0.0%) |
| 55 to 64 Years | 0 (0.0%) | 0 (0.0%) |
| 65 to 74 Years | 0 (0.0%) | 2 (9.1%) |
| 75 Years and over | 0 (0.0%) | 2 (33.3%) |
| Total | 1 (0.4%) | 6 (2.2%) |
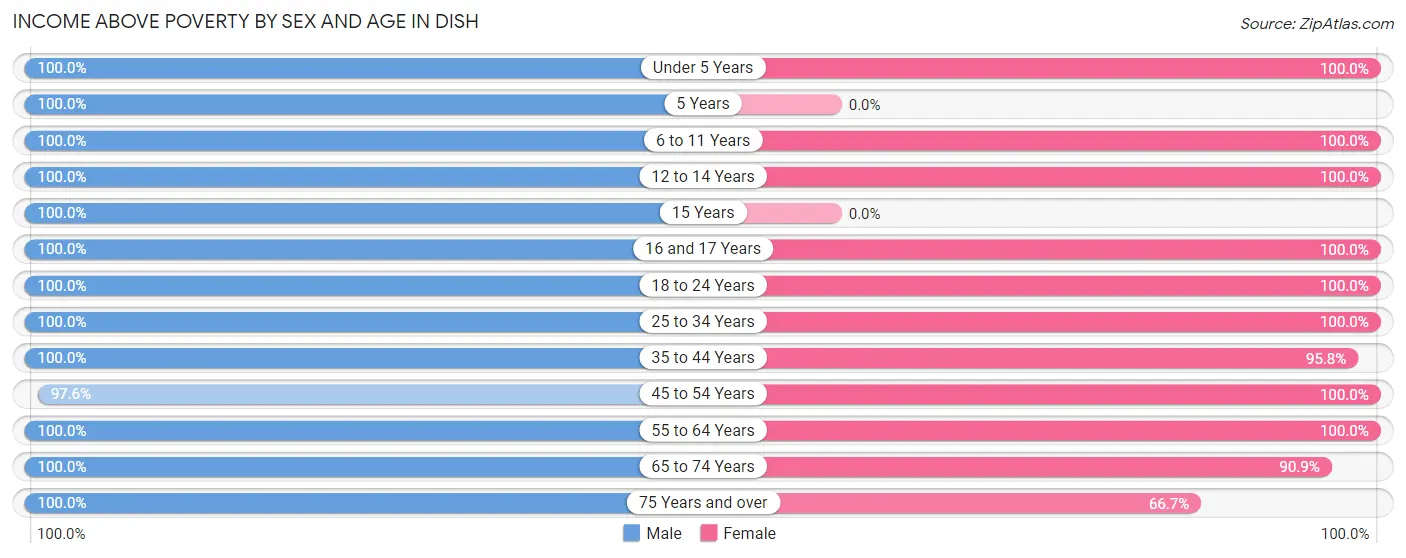
Income Above Poverty by Sex and Age in DISH
According to the poverty statistics in DISH, males aged under 5 years and females aged under 5 years are the age groups that are most secure financially, with 100.0% of males and 100.0% of females in these age groups living above the poverty line.
| Age Bracket | Male | Female |
| Under 5 Years | 2 (100.0%) | 26 (100.0%) |
| 5 Years | 11 (100.0%) | 0 (0.0%) |
| 6 to 11 Years | 9 (100.0%) | 36 (100.0%) |
| 12 to 14 Years | 7 (100.0%) | 15 (100.0%) |
| 15 Years | 2 (100.0%) | 0 (0.0%) |
| 16 and 17 Years | 7 (100.0%) | 3 (100.0%) |
| 18 to 24 Years | 18 (100.0%) | 5 (100.0%) |
| 25 to 34 Years | 4 (100.0%) | 28 (100.0%) |
| 35 to 44 Years | 69 (100.0%) | 46 (95.8%) |
| 45 to 54 Years | 40 (97.6%) | 60 (100.0%) |
| 55 to 64 Years | 36 (100.0%) | 25 (100.0%) |
| 65 to 74 Years | 31 (100.0%) | 20 (90.9%) |
| 75 Years and over | 25 (100.0%) | 4 (66.7%) |
| Total | 261 (99.6%) | 268 (97.8%) |
Income Below Poverty Among Married-Couple Families in DISH
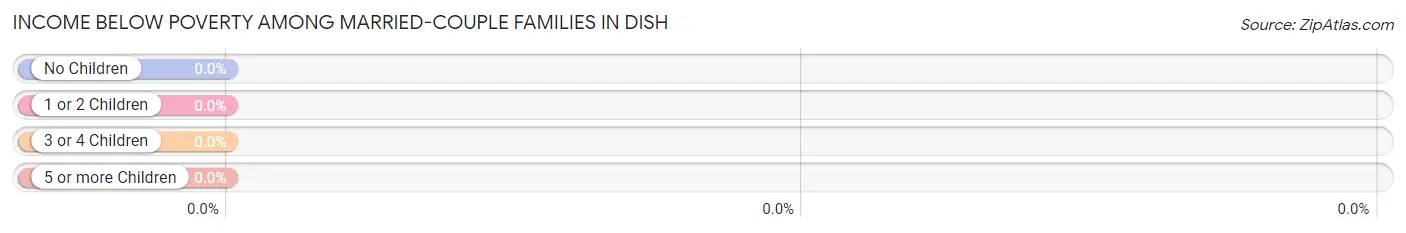
| Children | Above Poverty | Below Poverty |
| No Children | 88 (100.0%) | 0 (0.0%) |
| 1 or 2 Children | 63 (100.0%) | 0 (0.0%) |
| 3 or 4 Children | 2 (100.0%) | 0 (0.0%) |
| 5 or more Children | 0 (0.0%) | 0 (0.0%) |
| Total | 153 (100.0%) | 0 (0.0%) |
Income Below Poverty Among Single-Parent Households in DISH
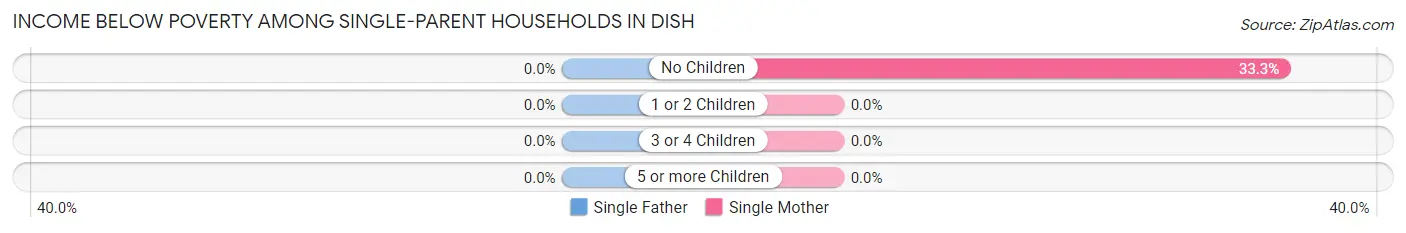
| Children | Single Father | Single Mother |
| No Children | 0 (0.0%) | 2 (33.3%) |
| 1 or 2 Children | 0 (0.0%) | 0 (0.0%) |
| 3 or 4 Children | 0 (0.0%) | 0 (0.0%) |
| 5 or more Children | 0 (0.0%) | 0 (0.0%) |
| Total | 0 (0.0%) | 2 (15.4%) |
Income Below Poverty Among Married-Couple vs Single-Parent Households in DISH
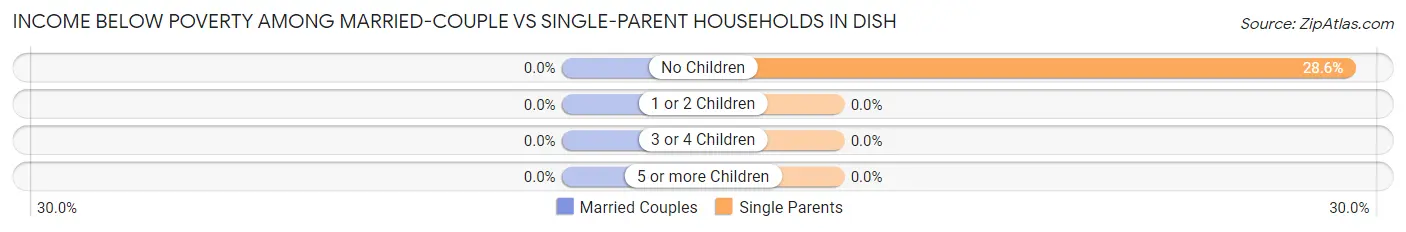
| Children | Married-Couple Families | Single-Parent Households |
| No Children | 0 (0.0%) | 2 (28.6%) |
| 1 or 2 Children | 0 (0.0%) | 0 (0.0%) |
| 3 or 4 Children | 0 (0.0%) | 0 (0.0%) |
| 5 or more Children | 0 (0.0%) | 0 (0.0%) |
| Total | 0 (0.0%) | 2 (14.3%) |
Race in DISH
The most populous races in DISH are White / Caucasian (448 | 83.4%), Hispanic or Latino (57 | 10.6%), and Some other Race (36 | 6.7%).
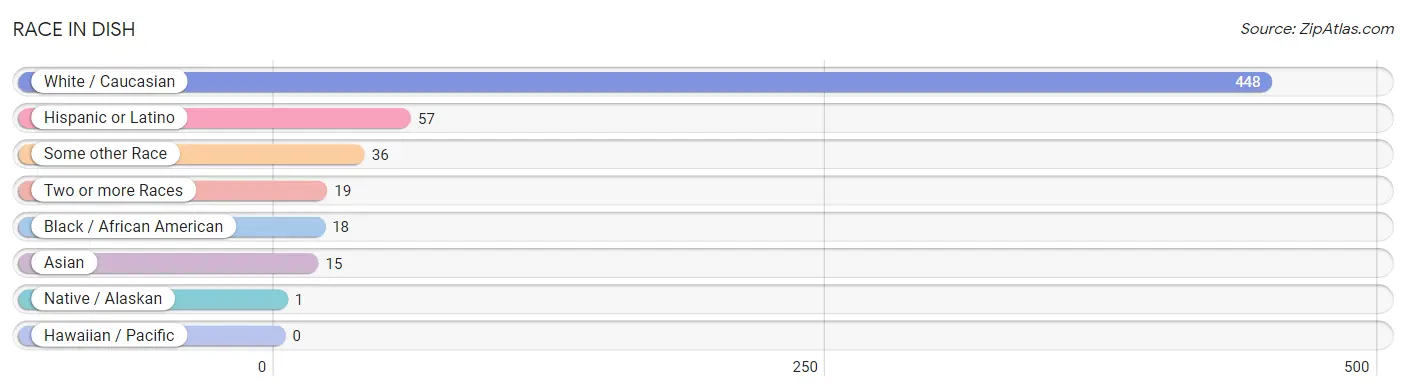
| Race | # Population | % Population |
| Asian | 15 | 2.8% |
| Black / African American | 18 | 3.4% |
| Hawaiian / Pacific | 0 | 0.0% |
| Hispanic or Latino | 57 | 10.6% |
| Native / Alaskan | 1 | 0.2% |
| White / Caucasian | 448 | 83.4% |
| Two or more Races | 19 | 3.5% |
| Some other Race | 36 | 6.7% |
| Total | 537 | 100.0% |
Ancestry in DISH
The most populous ancestries reported in DISH are English (105 | 19.6%), Irish (82 | 15.3%), American (75 | 14.0%), German (52 | 9.7%), and Mexican (30 | 5.6%), together accounting for 64.1% of all DISH residents.
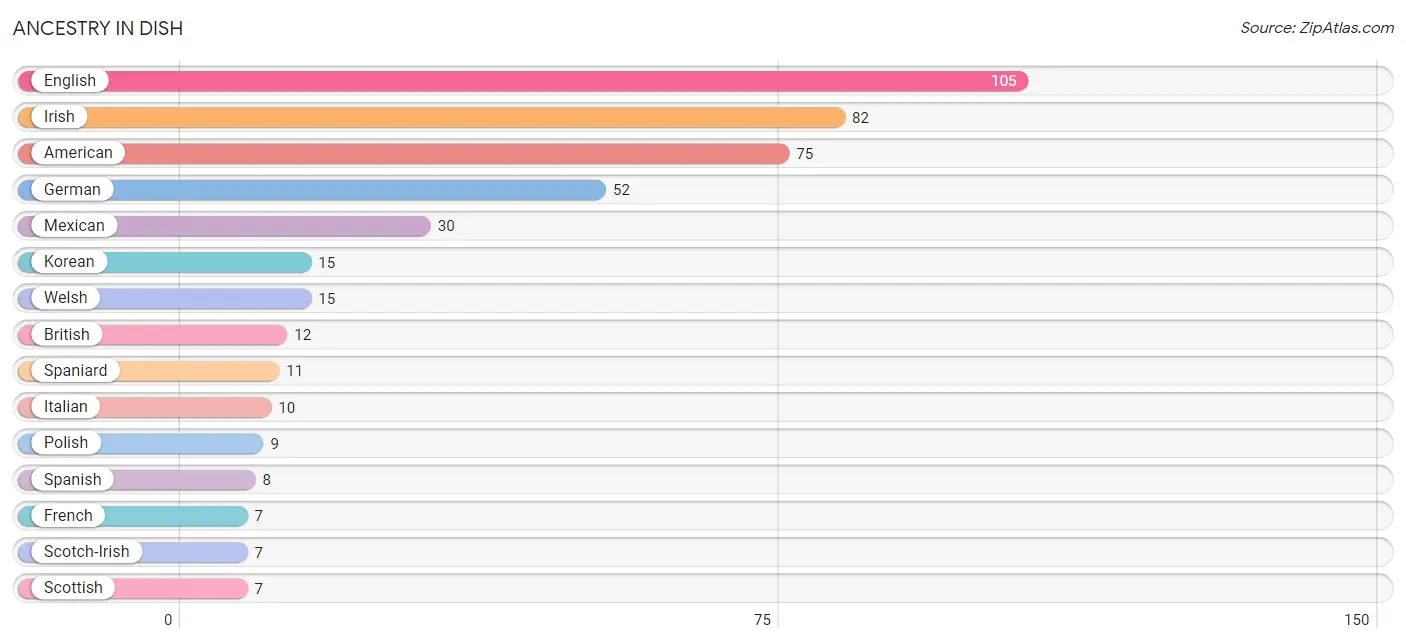
| Ancestry | # Population | % Population |
| American | 75 | 14.0% |
| British | 12 | 2.2% |
| Central American | 2 | 0.4% |
| Cherokee | 3 | 0.6% |
| Choctaw | 1 | 0.2% |
| Colombian | 3 | 0.6% |
| Czech | 2 | 0.4% |
| Dominican | 3 | 0.6% |
| Dutch | 2 | 0.4% |
| Eastern European | 2 | 0.4% |
| English | 105 | 19.6% |
| European | 6 | 1.1% |
| French | 7 | 1.3% |
| French Canadian | 2 | 0.4% |
| German | 52 | 9.7% |
| Guatemalan | 2 | 0.4% |
| Irish | 82 | 15.3% |
| Italian | 10 | 1.9% |
| Korean | 15 | 2.8% |
| Mexican | 30 | 5.6% |
| Norwegian | 4 | 0.7% |
| Polish | 9 | 1.7% |
| Scandinavian | 2 | 0.4% |
| Scotch-Irish | 7 | 1.3% |
| Scottish | 7 | 1.3% |
| South American | 3 | 0.6% |
| Spaniard | 11 | 2.1% |
| Spanish | 8 | 1.5% |
| Welsh | 15 | 2.8% | View All 29 Rows |
Immigrants in DISH
The most numerous immigrant groups reported in DISH came from Asia (5 | 0.9%), Latin America (5 | 0.9%), South Eastern Asia (5 | 0.9%), Vietnam (5 | 0.9%), and Central America (3 | 0.6%), together accounting for 4.3% of all DISH residents.
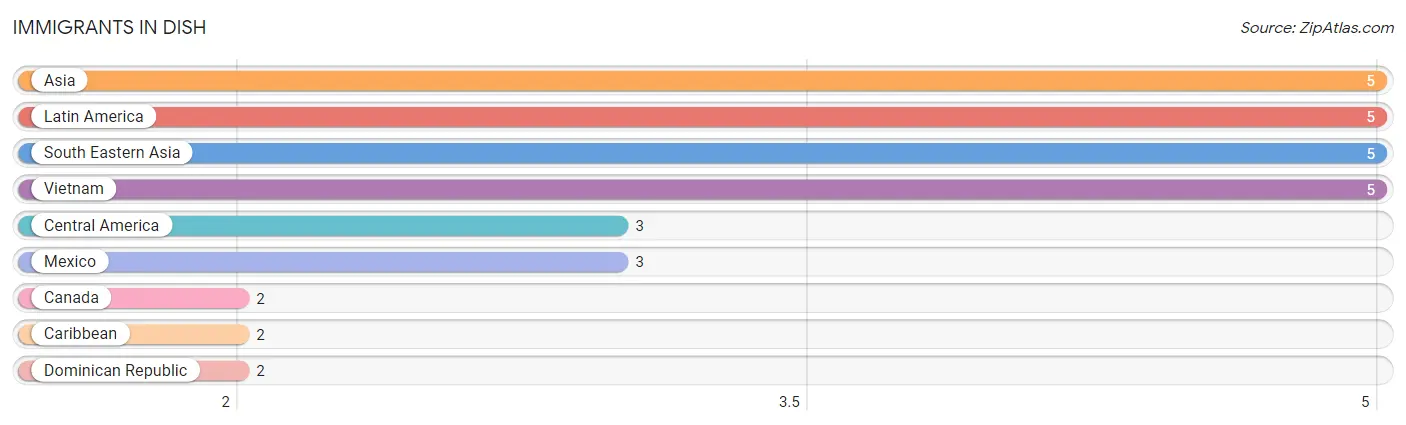
| Immigration Origin | # Population | % Population |
| Asia | 5 | 0.9% |
| Canada | 2 | 0.4% |
| Caribbean | 2 | 0.4% |
| Central America | 3 | 0.6% |
| Dominican Republic | 2 | 0.4% |
| Latin America | 5 | 0.9% |
| Mexico | 3 | 0.6% |
| South Eastern Asia | 5 | 0.9% |
| Vietnam | 5 | 0.9% | View All 9 Rows |
Sex and Age in DISH
Sex and Age in DISH
The most populous age groups in DISH are 35 to 39 Years (40 | 15.3%) for men and 50 to 54 Years (34 | 12.4%) for women.
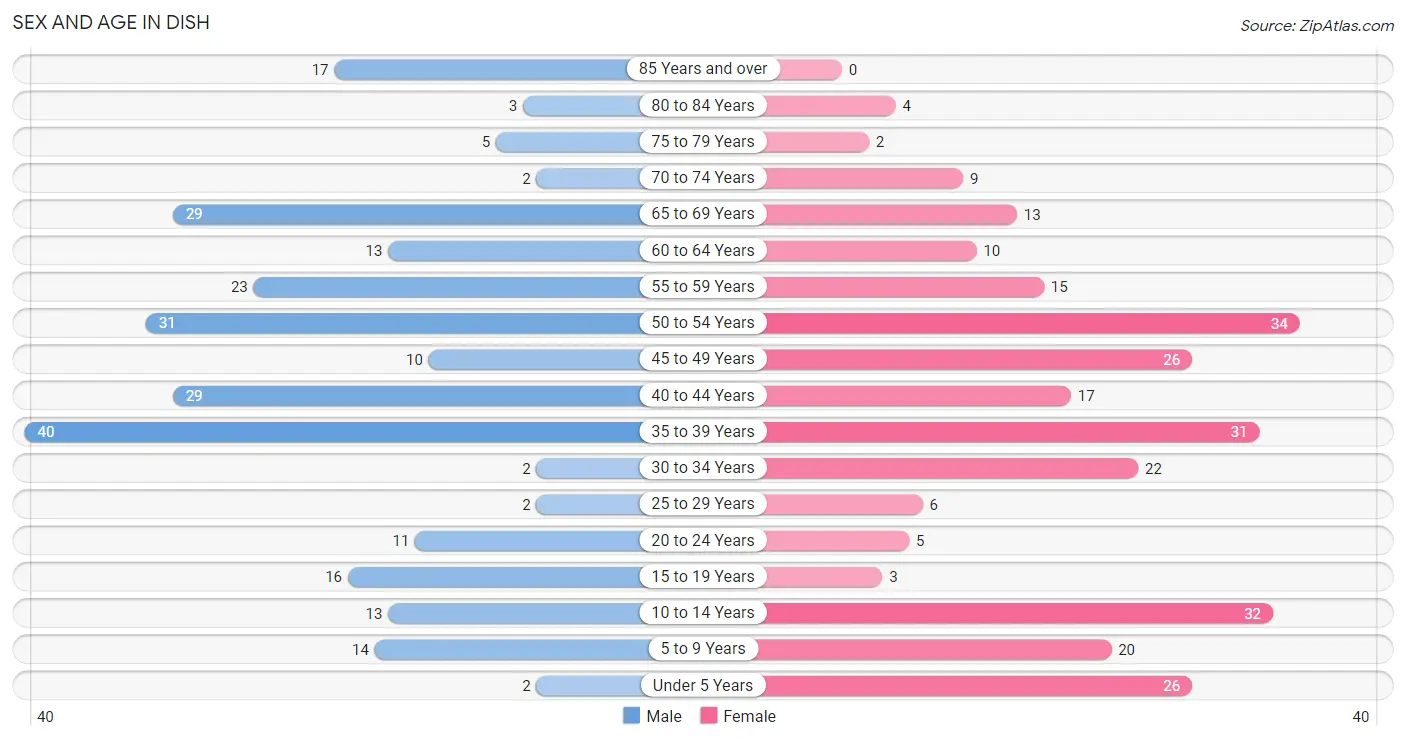
| Age Bracket | Male | Female |
| Under 5 Years | 2 (0.8%) | 26 (9.5%) |
| 5 to 9 Years | 14 (5.3%) | 20 (7.3%) |
| 10 to 14 Years | 13 (5.0%) | 32 (11.6%) |
| 15 to 19 Years | 16 (6.1%) | 3 (1.1%) |
| 20 to 24 Years | 11 (4.2%) | 5 (1.8%) |
| 25 to 29 Years | 2 (0.8%) | 6 (2.2%) |
| 30 to 34 Years | 2 (0.8%) | 22 (8.0%) |
| 35 to 39 Years | 40 (15.3%) | 31 (11.3%) |
| 40 to 44 Years | 29 (11.1%) | 17 (6.2%) |
| 45 to 49 Years | 10 (3.8%) | 26 (9.5%) |
| 50 to 54 Years | 31 (11.8%) | 34 (12.4%) |
| 55 to 59 Years | 23 (8.8%) | 15 (5.4%) |
| 60 to 64 Years | 13 (5.0%) | 10 (3.6%) |
| 65 to 69 Years | 29 (11.1%) | 13 (4.7%) |
| 70 to 74 Years | 2 (0.8%) | 9 (3.3%) |
| 75 to 79 Years | 5 (1.9%) | 2 (0.7%) |
| 80 to 84 Years | 3 (1.1%) | 4 (1.5%) |
| 85 Years and over | 17 (6.5%) | 0 (0.0%) |
| Total | 262 (100.0%) | 275 (100.0%) |
Families and Households in DISH
Median Family Size in DISH
The median family size in DISH is 2.98 persons per family, with married-couple families (153 | 91.6%) accounting for the largest median family size of 3.01 persons per family. On the other hand, single female/mother families (13 | 7.8%) represent the smallest median family size with 2.69 persons per family.
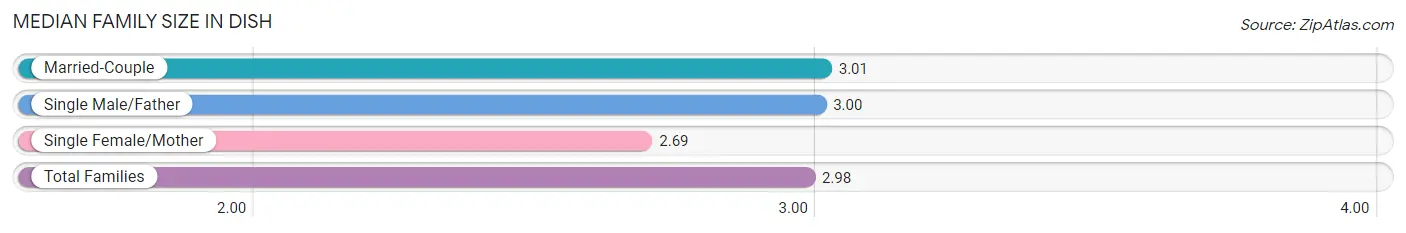
| Family Type | # Families | Family Size |
| Married-Couple | 153 (91.6%) | 3.01 |
| Single Male/Father | 1 (0.6%) | 3.00 |
| Single Female/Mother | 13 (7.8%) | 2.69 |
| Total Families | 167 (100.0%) | 2.98 |
Median Household Size in DISH
The median household size in DISH is 2.74 persons per household, with single male/father households (1 | 0.5%) accounting for the largest median household size of 6 persons per household. non-family households (29 | 14.8%) represent the smallest median household size with 1.14 persons per household.
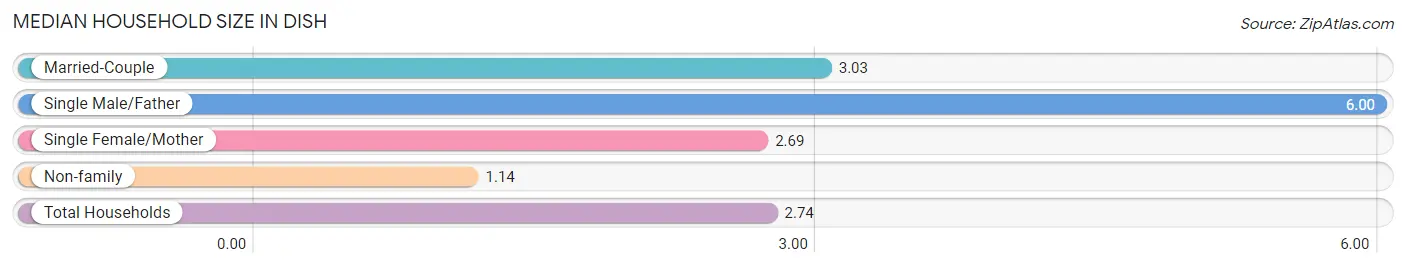
| Household Type | # Households | Household Size |
| Married-Couple | 153 (78.1%) | 3.03 |
| Single Male/Father | 1 (0.5%) | 6.00 |
| Single Female/Mother | 13 (6.6%) | 2.69 |
| Non-family | 29 (14.8%) | 1.14 |
| Total Households | 196 (100.0%) | 2.74 |
Household Size by Marriage Status in DISH
Out of a total of 196 households in DISH, 167 (85.2%) are family households, while 29 (14.8%) are nonfamily households. The most numerous type of family households are 2-person households, comprising 75, and the most common type of nonfamily households are 1-person households, comprising 26.
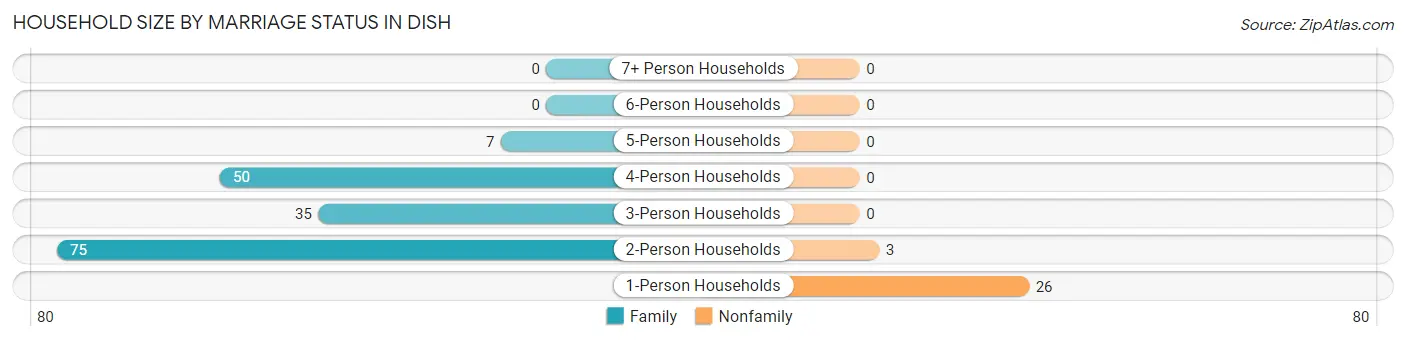
| Household Size | Family Households | Nonfamily Households |
| 1-Person Households | - | 26 (13.3%) |
| 2-Person Households | 75 (38.3%) | 3 (1.5%) |
| 3-Person Households | 35 (17.9%) | 0 (0.0%) |
| 4-Person Households | 50 (25.5%) | 0 (0.0%) |
| 5-Person Households | 7 (3.6%) | 0 (0.0%) |
| 6-Person Households | 0 (0.0%) | 0 (0.0%) |
| 7+ Person Households | 0 (0.0%) | 0 (0.0%) |
| Total | 167 (85.2%) | 29 (14.8%) |
Female Fertility in DISH
Fertility by Age in DISH
Average fertility rate in DISH is 113.0 births per 1,000 women. Women in the age bracket of 20 to 34 years have the highest fertility rate with 303.0 births per 1,000 women. Women in the age bracket of 20 to 34 years acount for 76.9% of all women with births.
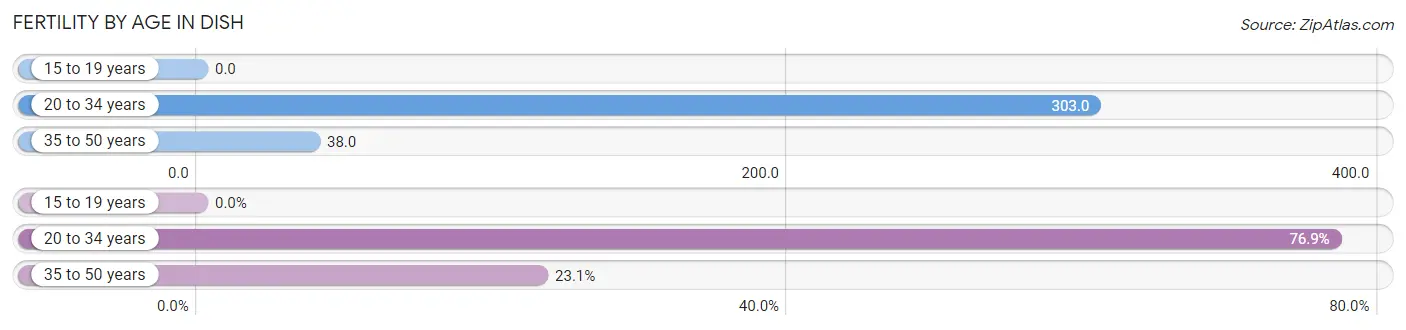
| Age Bracket | Women with Births | Births / 1,000 Women |
| 15 to 19 years | 0 (0.0%) | 0.0 |
| 20 to 34 years | 10 (76.9%) | 303.0 |
| 35 to 50 years | 3 (23.1%) | 38.0 |
| Total | 13 (100.0%) | 113.0 |
Fertility by Age by Marriage Status in DISH
84.6% of women with births (13) in DISH are married. The highest percentage of unmarried women with births falls into 20 to 34 years age bracket with 20.0% of them unmarried at the time of birth, while the lowest percentage of unmarried women with births belong to 35 to 50 years age bracket with 0.0% of them unmarried.
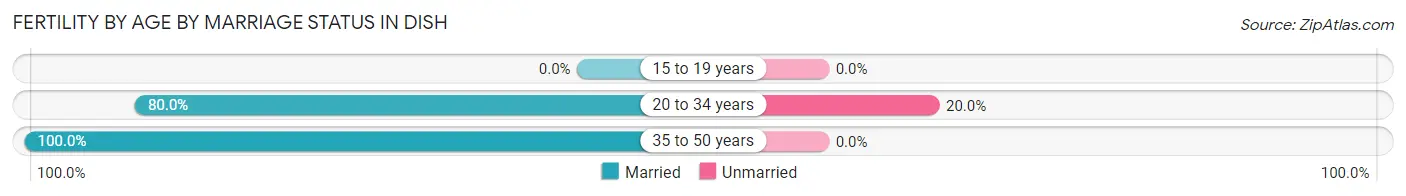
| Age Bracket | Married | Unmarried |
| 15 to 19 years | 0 (0.0%) | 0 (0.0%) |
| 20 to 34 years | 8 (80.0%) | 2 (20.0%) |
| 35 to 50 years | 3 (100.0%) | 0 (0.0%) |
| Total | 11 (84.6%) | 2 (15.4%) |
Fertility by Education in DISH
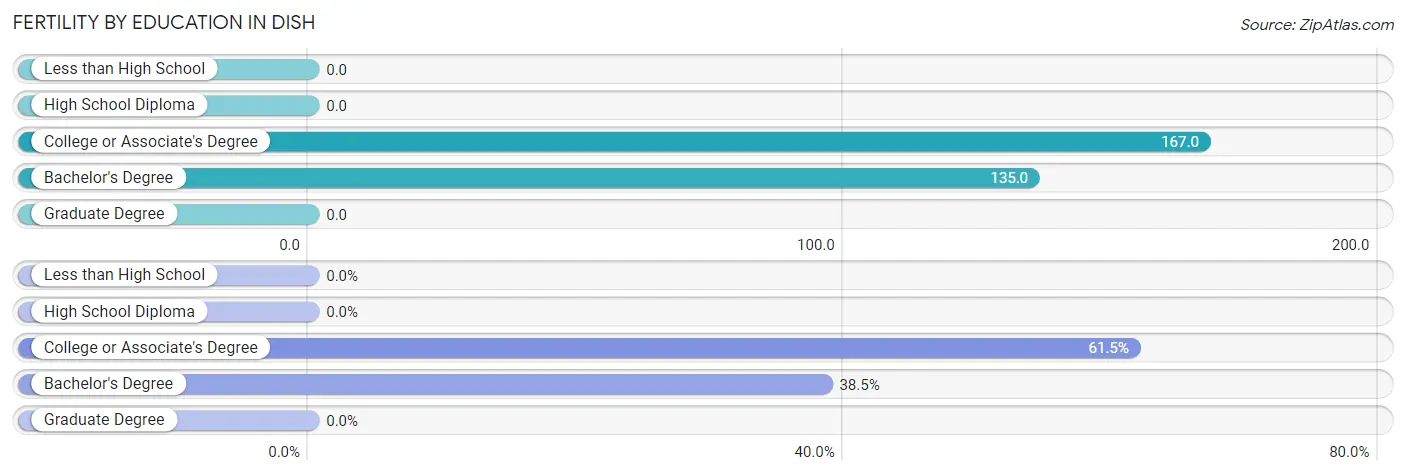
| Educational Attainment | Women with Births | Births / 1,000 Women |
| Less than High School | 0 (0.0%) | 0.0 |
| High School Diploma | 0 (0.0%) | 0.0 |
| College or Associate's Degree | 8 (61.5%) | 167.0 |
| Bachelor's Degree | 5 (38.5%) | 135.0 |
| Graduate Degree | 0 (0.0%) | 0.0 |
| Total | 13 (100.0%) | 113.0 |
Fertility by Education by Marriage Status in DISH
15.4% of women with births in DISH are unmarried. Women with the educational attainment of college or associate's degree are most likely to be married with 100.0% of them married at childbirth, while women with the educational attainment of bachelor's degree are least likely to be married with 40.0% of them unmarried at childbirth.
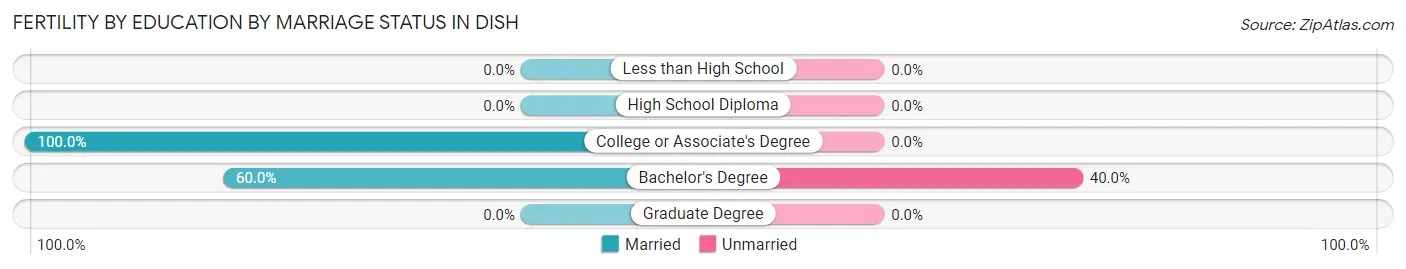
| Educational Attainment | Married | Unmarried |
| Less than High School | 0 (0.0%) | 0 (0.0%) |
| High School Diploma | 0 (0.0%) | 0 (0.0%) |
| College or Associate's Degree | 8 (100.0%) | 0 (0.0%) |
| Bachelor's Degree | 3 (60.0%) | 2 (40.0%) |
| Graduate Degree | 0 (0.0%) | 0 (0.0%) |
| Total | 11 (84.6%) | 2 (15.4%) |
Employment Characteristics in DISH
Employment by Class of Employer in DISH
Among the 300 employed individuals in DISH, private company employees (213 | 71.0%), local government employees (30 | 10.0%), and self-employed (not incorporated) (18 | 6.0%) make up the most common classes of employment.
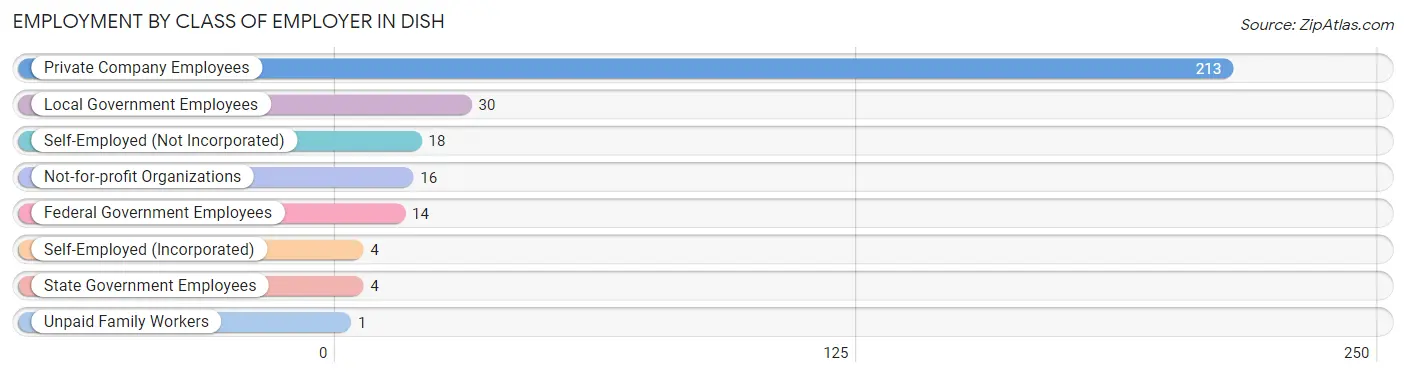
| Employer Class | # Employees | % Employees |
| Private Company Employees | 213 | 71.0% |
| Self-Employed (Incorporated) | 4 | 1.3% |
| Self-Employed (Not Incorporated) | 18 | 6.0% |
| Not-for-profit Organizations | 16 | 5.3% |
| Local Government Employees | 30 | 10.0% |
| State Government Employees | 4 | 1.3% |
| Federal Government Employees | 14 | 4.7% |
| Unpaid Family Workers | 1 | 0.3% |
| Total | 300 | 100.0% |
Employment Status by Age in DISH
According to the labor force statistics for DISH, out of the total population over 16 years of age (428), 72.2% or 309 individuals are in the labor force, with 1.6% or 5 of them unemployed. The age group with the highest labor force participation rate is 30 to 34 years, with 100.0% or 24 individuals in the labor force. Within the labor force, the 60 to 64 years age range has the highest percentage of unemployed individuals, with 20.0% or 2 of them being unemployed.
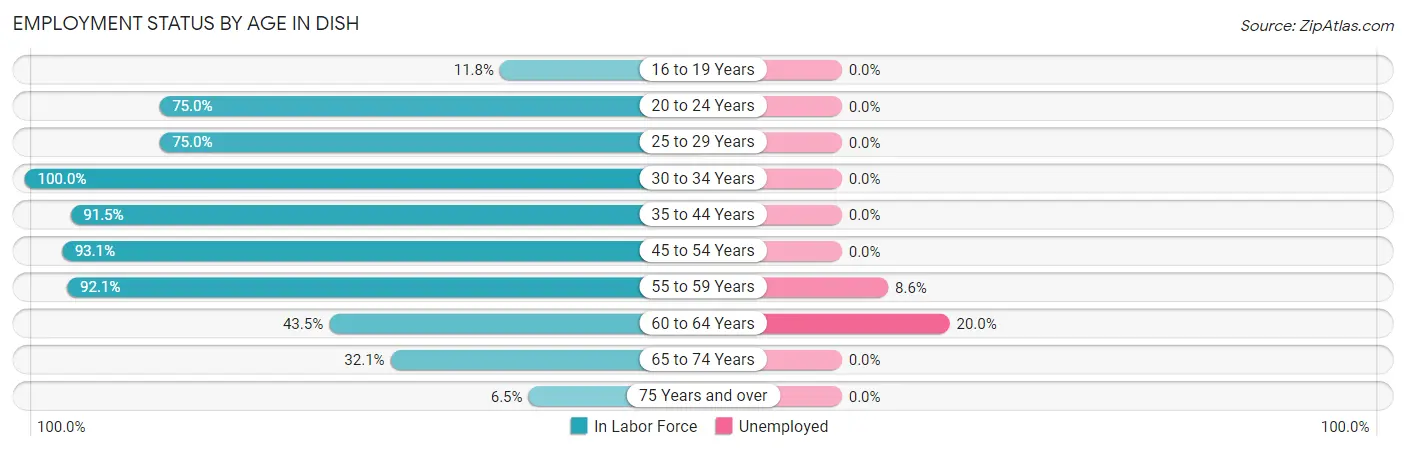
| Age Bracket | In Labor Force | Unemployed |
| 16 to 19 Years | 2 (11.8%) | 0 (0.0%) |
| 20 to 24 Years | 12 (75.0%) | 0 (0.0%) |
| 25 to 29 Years | 6 (75.0%) | 0 (0.0%) |
| 30 to 34 Years | 24 (100.0%) | 0 (0.0%) |
| 35 to 44 Years | 107 (91.5%) | 0 (0.0%) |
| 45 to 54 Years | 94 (93.1%) | 0 (0.0%) |
| 55 to 59 Years | 35 (92.1%) | 3 (8.6%) |
| 60 to 64 Years | 10 (43.5%) | 2 (20.0%) |
| 65 to 74 Years | 17 (32.1%) | 0 (0.0%) |
| 75 Years and over | 2 (6.5%) | 0 (0.0%) |
| Total | 309 (72.2%) | 5 (1.6%) |
Employment Status by Educational Attainment in DISH
According to labor force statistics for DISH, 88.7% of individuals (276) out of the total population between 25 and 64 years of age (311) are in the labor force, with 1.8% or 5 of them being unemployed. The group with the highest labor force participation rate are those with the educational attainment of less than high school, with 100.0% or 14 individuals in the labor force. Within the labor force, individuals with bachelor's degree or higher education have the highest percentage of unemployment, with 5.6% or 5 of them being unemployed.
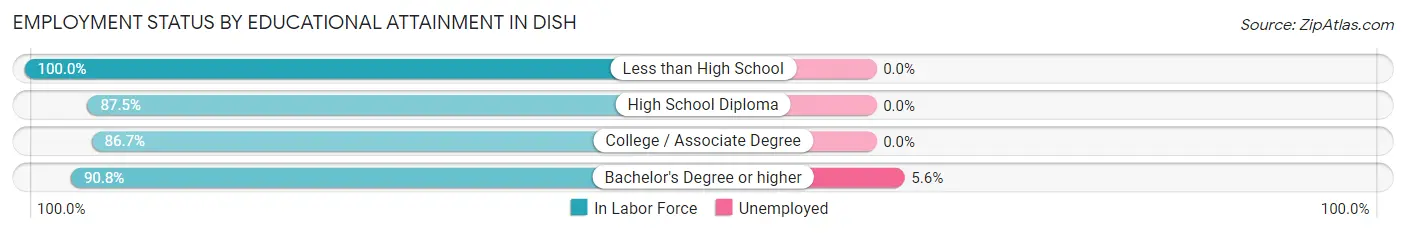
| Educational Attainment | In Labor Force | Unemployed |
| Less than High School | 14 (100.0%) | 0 (0.0%) |
| High School Diploma | 56 (87.5%) | 0 (0.0%) |
| College / Associate Degree | 117 (86.7%) | 0 (0.0%) |
| Bachelor's Degree or higher | 89 (90.8%) | 5 (5.6%) |
| Total | 276 (88.7%) | 6 (1.8%) |
Employment Occupations by Sex in DISH
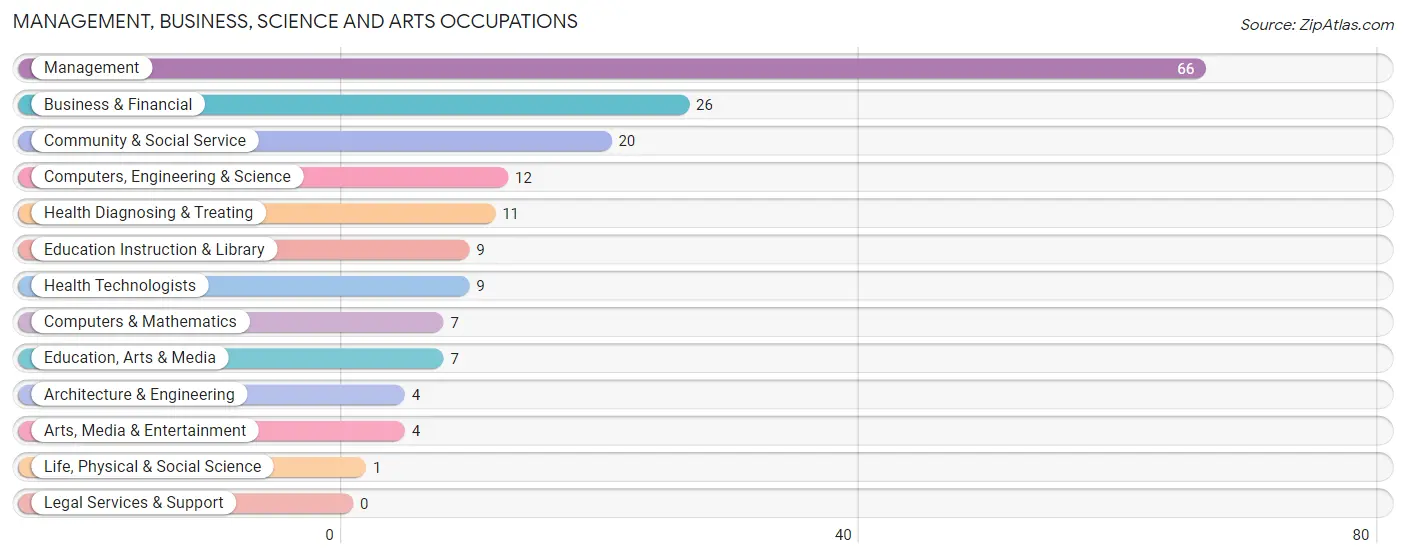
Management, Business, Science and Arts Occupations
The most common Management, Business, Science and Arts occupations in DISH are Management (66 | 21.7%), Business & Financial (26 | 8.6%), Community & Social Service (20 | 6.6%), Computers, Engineering & Science (12 | 4.0%), and Health Diagnosing & Treating (11 | 3.6%).
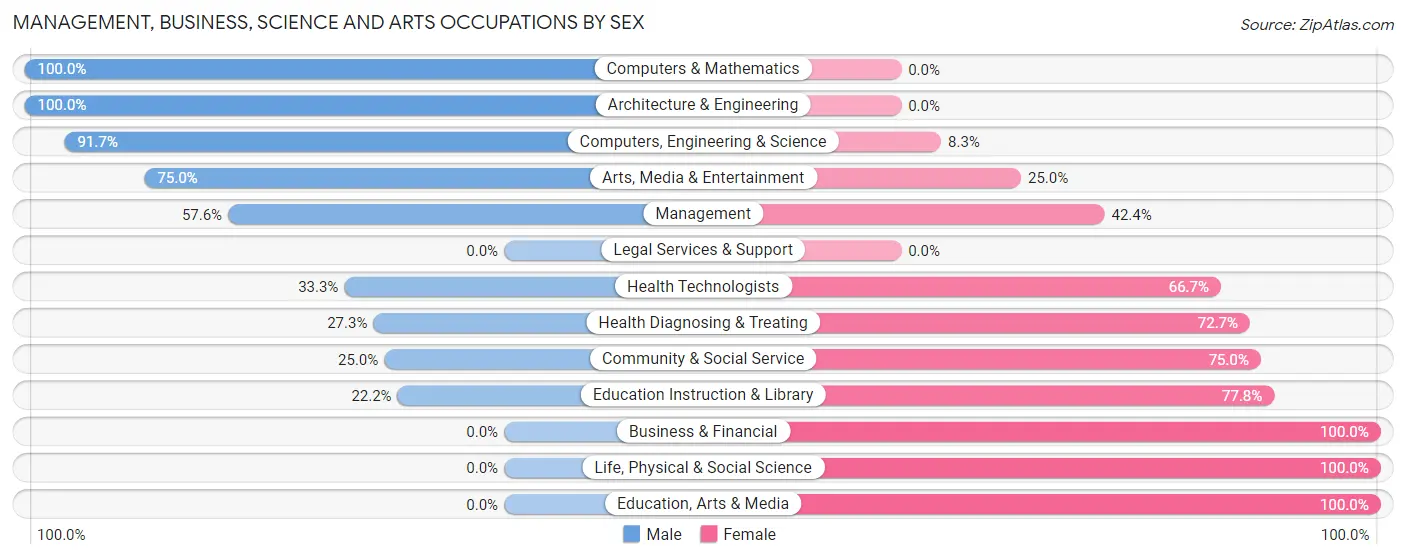
Management, Business, Science and Arts Occupations by Sex
Within the Management, Business, Science and Arts occupations in DISH, the most male-oriented occupations are Computers & Mathematics (100.0%), Architecture & Engineering (100.0%), and Computers, Engineering & Science (91.7%), while the most female-oriented occupations are Business & Financial (100.0%), Life, Physical & Social Science (100.0%), and Education, Arts & Media (100.0%).
| Occupation | Male | Female |
| Management | 38 (57.6%) | 28 (42.4%) |
| Business & Financial | 0 (0.0%) | 26 (100.0%) |
| Computers, Engineering & Science | 11 (91.7%) | 1 (8.3%) |
| Computers & Mathematics | 7 (100.0%) | 0 (0.0%) |
| Architecture & Engineering | 4 (100.0%) | 0 (0.0%) |
| Life, Physical & Social Science | 0 (0.0%) | 1 (100.0%) |
| Community & Social Service | 5 (25.0%) | 15 (75.0%) |
| Education, Arts & Media | 0 (0.0%) | 7 (100.0%) |
| Legal Services & Support | 0 (0.0%) | 0 (0.0%) |
| Education Instruction & Library | 2 (22.2%) | 7 (77.8%) |
| Arts, Media & Entertainment | 3 (75.0%) | 1 (25.0%) |
| Health Diagnosing & Treating | 3 (27.3%) | 8 (72.7%) |
| Health Technologists | 3 (33.3%) | 6 (66.7%) |
| Total (Category) | 57 (42.2%) | 78 (57.8%) |
| Total (Overall) | 157 (51.6%) | 147 (48.4%) |
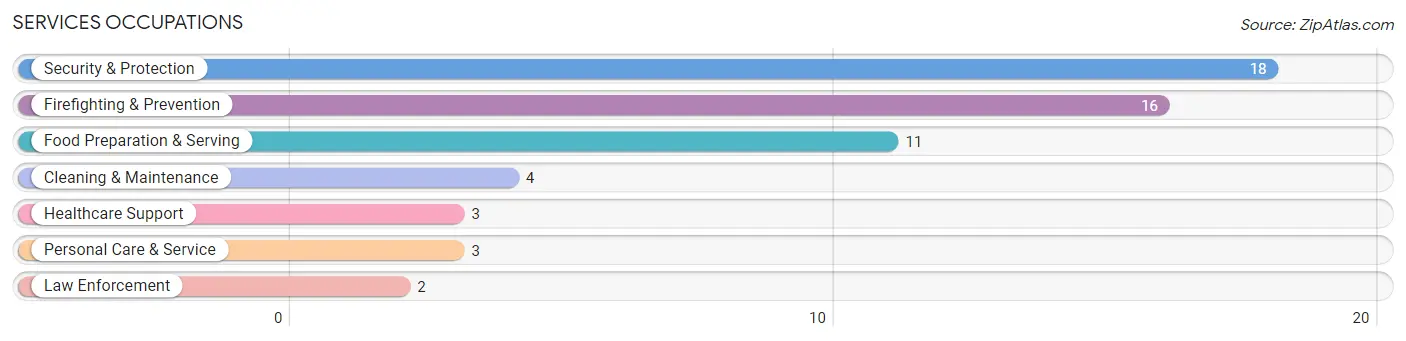
Services Occupations
The most common Services occupations in DISH are Security & Protection (18 | 5.9%), Firefighting & Prevention (16 | 5.3%), Food Preparation & Serving (11 | 3.6%), Cleaning & Maintenance (4 | 1.3%), and Healthcare Support (3 | 1.0%).
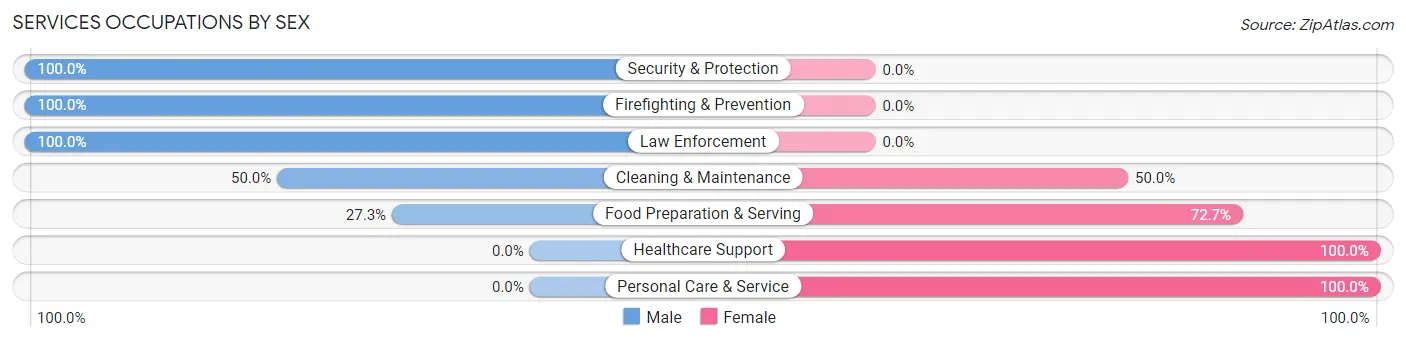
Services Occupations by Sex
Within the Services occupations in DISH, the most male-oriented occupations are Security & Protection (100.0%), Firefighting & Prevention (100.0%), and Law Enforcement (100.0%), while the most female-oriented occupations are Healthcare Support (100.0%), Personal Care & Service (100.0%), and Food Preparation & Serving (72.7%).
| Occupation | Male | Female |
| Healthcare Support | 0 (0.0%) | 3 (100.0%) |
| Security & Protection | 18 (100.0%) | 0 (0.0%) |
| Firefighting & Prevention | 16 (100.0%) | 0 (0.0%) |
| Law Enforcement | 2 (100.0%) | 0 (0.0%) |
| Food Preparation & Serving | 3 (27.3%) | 8 (72.7%) |
| Cleaning & Maintenance | 2 (50.0%) | 2 (50.0%) |
| Personal Care & Service | 0 (0.0%) | 3 (100.0%) |
| Total (Category) | 23 (59.0%) | 16 (41.0%) |
| Total (Overall) | 157 (51.6%) | 147 (48.4%) |
Sales and Office Occupations
The most common Sales and Office occupations in DISH are Office & Administration (43 | 14.1%), and Sales & Related (25 | 8.2%).

Sales and Office Occupations by Sex

| Occupation | Male | Female |
| Sales & Related | 17 (68.0%) | 8 (32.0%) |
| Office & Administration | 9 (20.9%) | 34 (79.1%) |
| Total (Category) | 26 (38.2%) | 42 (61.8%) |
| Total (Overall) | 157 (51.6%) | 147 (48.4%) |
Natural Resources, Construction and Maintenance Occupations
The most common Natural Resources, Construction and Maintenance occupations in DISH are Construction & Extraction (9 | 3.0%), and Installation, Maintenance & Repair (9 | 3.0%).
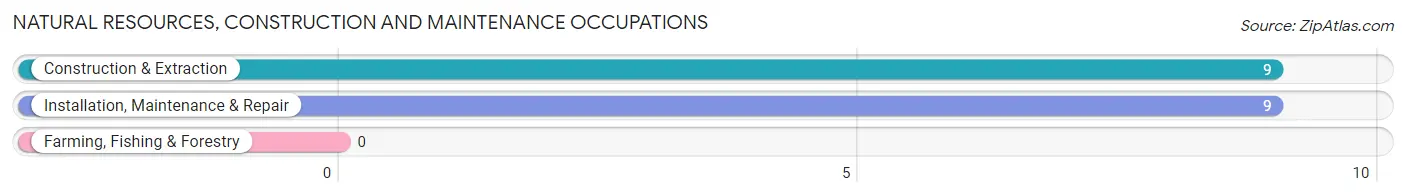
Natural Resources, Construction and Maintenance Occupations by Sex
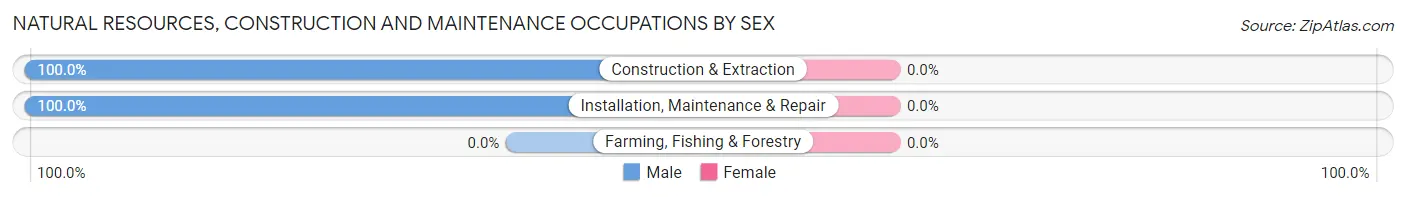
| Occupation | Male | Female |
| Farming, Fishing & Forestry | 0 (0.0%) | 0 (0.0%) |
| Construction & Extraction | 9 (100.0%) | 0 (0.0%) |
| Installation, Maintenance & Repair | 9 (100.0%) | 0 (0.0%) |
| Total (Category) | 18 (100.0%) | 0 (0.0%) |
| Total (Overall) | 157 (51.6%) | 147 (48.4%) |
Production, Transportation and Moving Occupations
The most common Production, Transportation and Moving occupations in DISH are Transportation (18 | 5.9%), Production (16 | 5.3%), and Material Moving (10 | 3.3%).
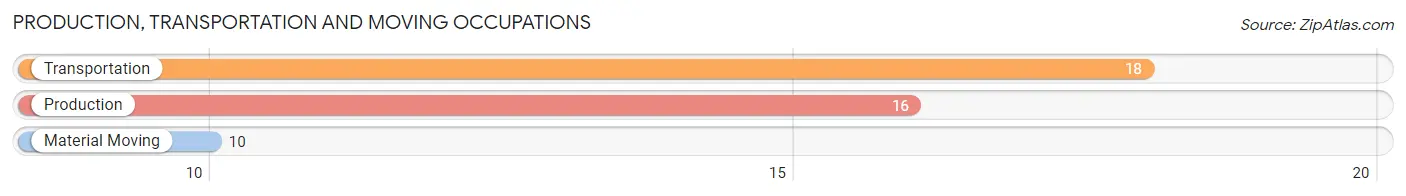
Production, Transportation and Moving Occupations by Sex
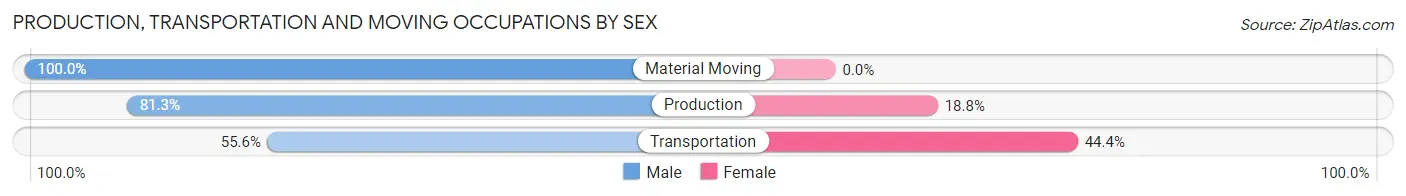
| Occupation | Male | Female |
| Production | 13 (81.2%) | 3 (18.8%) |
| Transportation | 10 (55.6%) | 8 (44.4%) |
| Material Moving | 10 (100.0%) | 0 (0.0%) |
| Total (Category) | 33 (75.0%) | 11 (25.0%) |
| Total (Overall) | 157 (51.6%) | 147 (48.4%) |
Employment Industries by Sex in DISH
Employment Industries in DISH
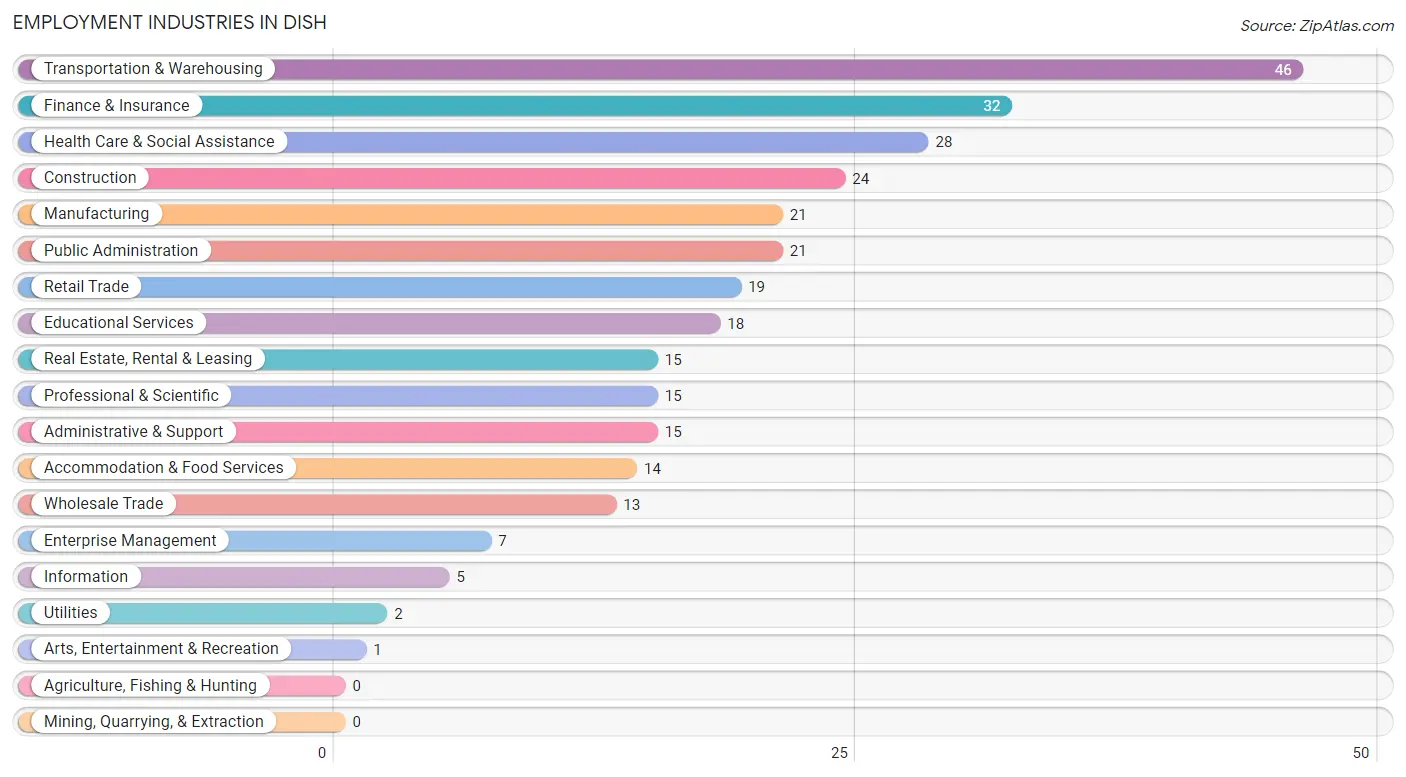
The major employment industries in DISH include Transportation & Warehousing (46 | 15.1%), Finance & Insurance (32 | 10.5%), Health Care & Social Assistance (28 | 9.2%), Construction (24 | 7.9%), and Manufacturing (21 | 6.9%).
Employment Industries by Sex in DISH
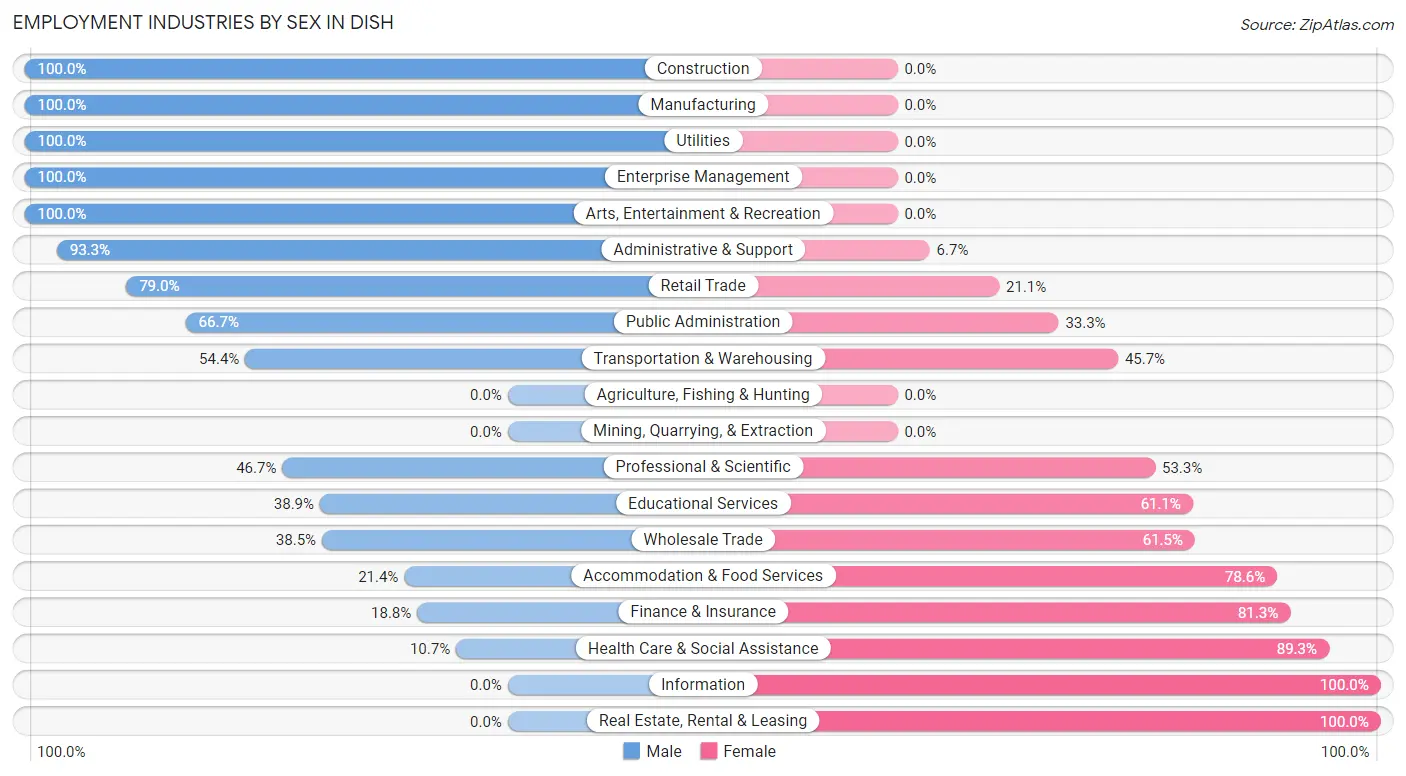
The DISH industries that see more men than women are Construction (100.0%), Manufacturing (100.0%), and Utilities (100.0%), whereas the industries that tend to have a higher number of women are Information (100.0%), Real Estate, Rental & Leasing (100.0%), and Health Care & Social Assistance (89.3%).
| Industry | Male | Female |
| Agriculture, Fishing & Hunting | 0 (0.0%) | 0 (0.0%) |
| Mining, Quarrying, & Extraction | 0 (0.0%) | 0 (0.0%) |
| Construction | 24 (100.0%) | 0 (0.0%) |
| Manufacturing | 21 (100.0%) | 0 (0.0%) |
| Wholesale Trade | 5 (38.5%) | 8 (61.5%) |
| Retail Trade | 15 (78.9%) | 4 (21.0%) |
| Transportation & Warehousing | 25 (54.3%) | 21 (45.7%) |
| Utilities | 2 (100.0%) | 0 (0.0%) |
| Information | 0 (0.0%) | 5 (100.0%) |
| Finance & Insurance | 6 (18.8%) | 26 (81.2%) |
| Real Estate, Rental & Leasing | 0 (0.0%) | 15 (100.0%) |
| Professional & Scientific | 7 (46.7%) | 8 (53.3%) |
| Enterprise Management | 7 (100.0%) | 0 (0.0%) |
| Administrative & Support | 14 (93.3%) | 1 (6.7%) |
| Educational Services | 7 (38.9%) | 11 (61.1%) |
| Health Care & Social Assistance | 3 (10.7%) | 25 (89.3%) |
| Arts, Entertainment & Recreation | 1 (100.0%) | 0 (0.0%) |
| Accommodation & Food Services | 3 (21.4%) | 11 (78.6%) |
| Public Administration | 14 (66.7%) | 7 (33.3%) |
| Total | 157 (51.6%) | 147 (48.4%) |
Education in DISH
School Enrollment in DISH
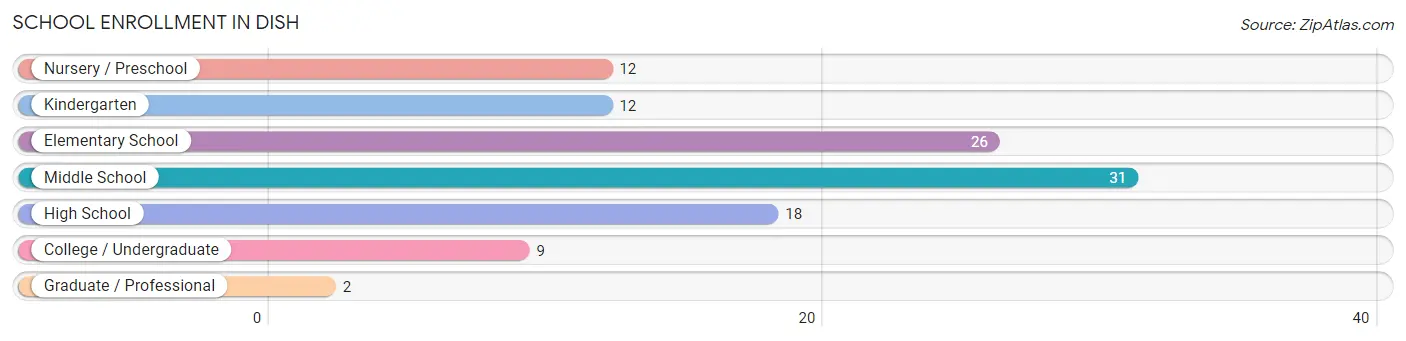
The most common levels of schooling among the 110 students in DISH are middle school (31 | 28.2%), elementary school (26 | 23.6%), and high school (18 | 16.4%).
| School Level | # Students | % Students |
| Nursery / Preschool | 12 | 10.9% |
| Kindergarten | 12 | 10.9% |
| Elementary School | 26 | 23.6% |
| Middle School | 31 | 28.2% |
| High School | 18 | 16.4% |
| College / Undergraduate | 9 | 8.2% |
| Graduate / Professional | 2 | 1.8% |
| Total | 110 | 100.0% |
School Enrollment by Age by Funding Source in DISH
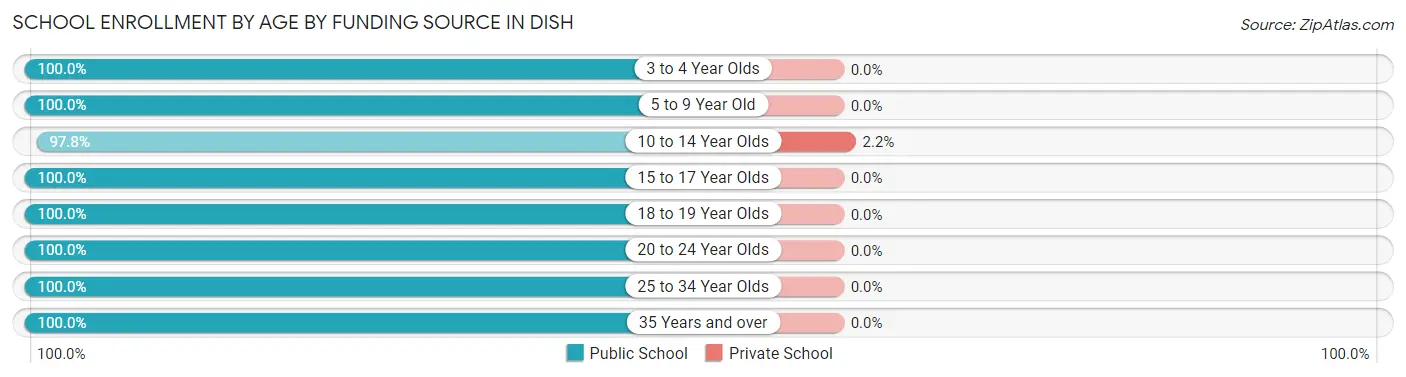
Out of a total of 110 students who are enrolled in schools in DISH, 1 (0.9%) attend a private institution, while the remaining 109 (99.1%) are enrolled in public schools. The age group of 10 to 14 year olds has the highest likelihood of being enrolled in private schools, with 1 (2.2% in the age bracket) enrolled. Conversely, the age group of 3 to 4 year olds has the lowest likelihood of being enrolled in a private school, with 2 (100.0% in the age bracket) attending a public institution.
| Age Bracket | Public School | Private School |
| 3 to 4 Year Olds | 2 (100.0%) | 0 (0.0%) |
| 5 to 9 Year Old | 34 (100.0%) | 0 (0.0%) |
| 10 to 14 Year Olds | 44 (97.8%) | 1 (2.2%) |
| 15 to 17 Year Olds | 12 (100.0%) | 0 (0.0%) |
| 18 to 19 Year Olds | 6 (100.0%) | 0 (0.0%) |
| 20 to 24 Year Olds | 5 (100.0%) | 0 (0.0%) |
| 25 to 34 Year Olds | 2 (100.0%) | 0 (0.0%) |
| 35 Years and over | 4 (100.0%) | 0 (0.0%) |
| Total | 109 (99.1%) | 1 (0.9%) |
Educational Attainment by Field of Study in DISH
Business (38 | 31.9%), education (16 | 13.5%), arts & humanities (14 | 11.8%), bio, nature & agricultural (12 | 10.1%), and communications (11 | 9.2%) are the most common fields of study among 119 individuals in DISH who have obtained a bachelor's degree or higher.
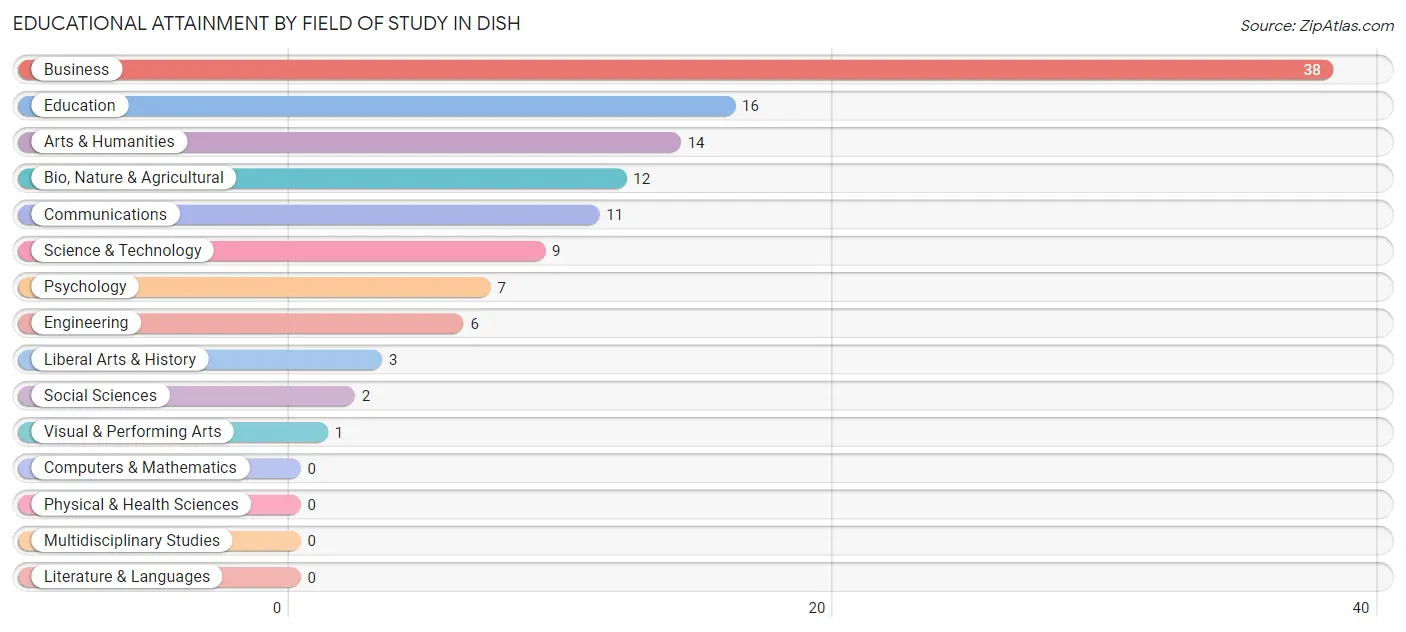
| Field of Study | # Graduates | % Graduates |
| Computers & Mathematics | 0 | 0.0% |
| Bio, Nature & Agricultural | 12 | 10.1% |
| Physical & Health Sciences | 0 | 0.0% |
| Psychology | 7 | 5.9% |
| Social Sciences | 2 | 1.7% |
| Engineering | 6 | 5.0% |
| Multidisciplinary Studies | 0 | 0.0% |
| Science & Technology | 9 | 7.6% |
| Business | 38 | 31.9% |
| Education | 16 | 13.5% |
| Literature & Languages | 0 | 0.0% |
| Liberal Arts & History | 3 | 2.5% |
| Visual & Performing Arts | 1 | 0.8% |
| Communications | 11 | 9.2% |
| Arts & Humanities | 14 | 11.8% |
| Total | 119 | 100.0% |
Transportation & Commute in DISH
Vehicle Availability by Sex in DISH
The most prevalent vehicle ownership categories in DISH are males with 2 vehicles (81, accounting for 51.6%) and females with 2 vehicles (70, making up 56.6%).
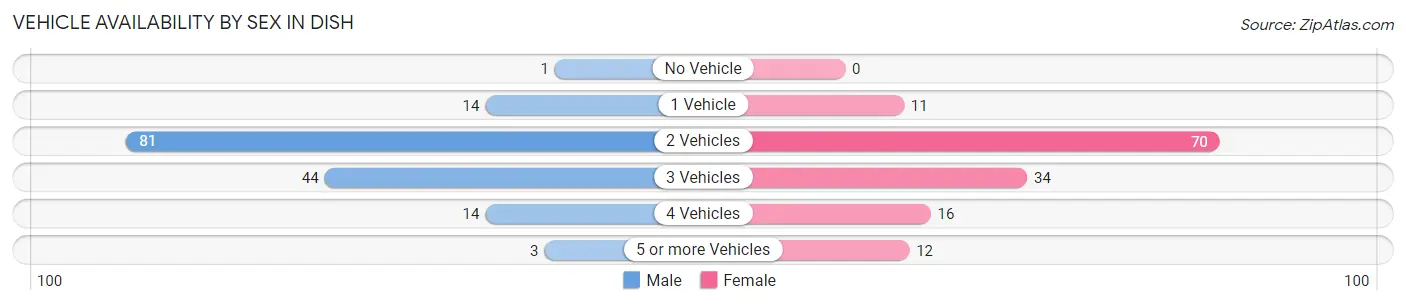
| Vehicles Available | Male | Female |
| No Vehicle | 1 (0.6%) | 0 (0.0%) |
| 1 Vehicle | 14 (8.9%) | 11 (7.7%) |
| 2 Vehicles | 81 (51.6%) | 70 (48.9%) |
| 3 Vehicles | 44 (28.0%) | 34 (23.8%) |
| 4 Vehicles | 14 (8.9%) | 16 (11.2%) |
| 5 or more Vehicles | 3 (1.9%) | 12 (8.4%) |
| Total | 157 (100.0%) | 143 (100.0%) |
Commute Time in DISH
The most frequently occuring commute durations in DISH are 45 to 59 minutes (55 commuters, 24.1%), 30 to 34 minutes (40 commuters, 17.5%), and 25 to 29 minutes (31 commuters, 13.6%).
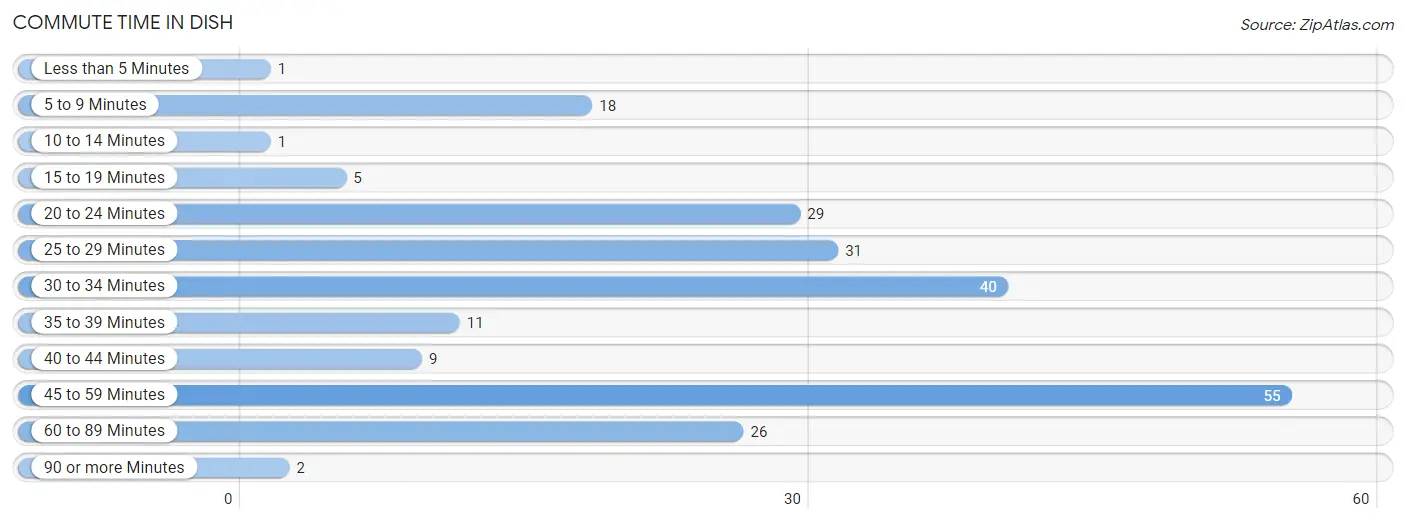
| Commute Time | # Commuters | % Commuters |
| Less than 5 Minutes | 1 | 0.4% |
| 5 to 9 Minutes | 18 | 7.9% |
| 10 to 14 Minutes | 1 | 0.4% |
| 15 to 19 Minutes | 5 | 2.2% |
| 20 to 24 Minutes | 29 | 12.7% |
| 25 to 29 Minutes | 31 | 13.6% |
| 30 to 34 Minutes | 40 | 17.5% |
| 35 to 39 Minutes | 11 | 4.8% |
| 40 to 44 Minutes | 9 | 4.0% |
| 45 to 59 Minutes | 55 | 24.1% |
| 60 to 89 Minutes | 26 | 11.4% |
| 90 or more Minutes | 2 | 0.9% |
Commute Time by Sex in DISH
The most common commute times in DISH are 45 to 59 minutes (37 commuters, 29.8%) for males and 30 to 34 minutes (38 commuters, 36.5%) for females.
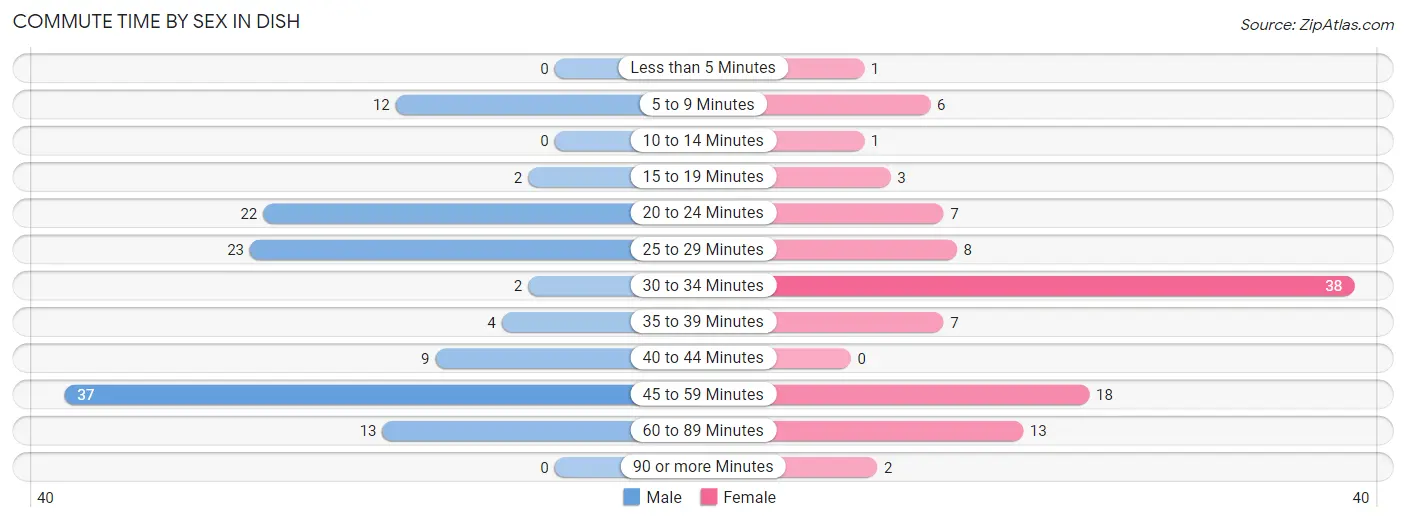
| Commute Time | Male | Female |
| Less than 5 Minutes | 0 (0.0%) | 1 (1.0%) |
| 5 to 9 Minutes | 12 (9.7%) | 6 (5.8%) |
| 10 to 14 Minutes | 0 (0.0%) | 1 (1.0%) |
| 15 to 19 Minutes | 2 (1.6%) | 3 (2.9%) |
| 20 to 24 Minutes | 22 (17.7%) | 7 (6.7%) |
| 25 to 29 Minutes | 23 (18.5%) | 8 (7.7%) |
| 30 to 34 Minutes | 2 (1.6%) | 38 (36.5%) |
| 35 to 39 Minutes | 4 (3.2%) | 7 (6.7%) |
| 40 to 44 Minutes | 9 (7.3%) | 0 (0.0%) |
| 45 to 59 Minutes | 37 (29.8%) | 18 (17.3%) |
| 60 to 89 Minutes | 13 (10.5%) | 13 (12.5%) |
| 90 or more Minutes | 0 (0.0%) | 2 (1.9%) |
Time of Departure to Work by Sex in DISH
The most frequent times of departure to work in DISH are 7:30 AM to 7:59 AM (23, 18.5%) for males and 7:00 AM to 7:29 AM (44, 42.3%) for females.
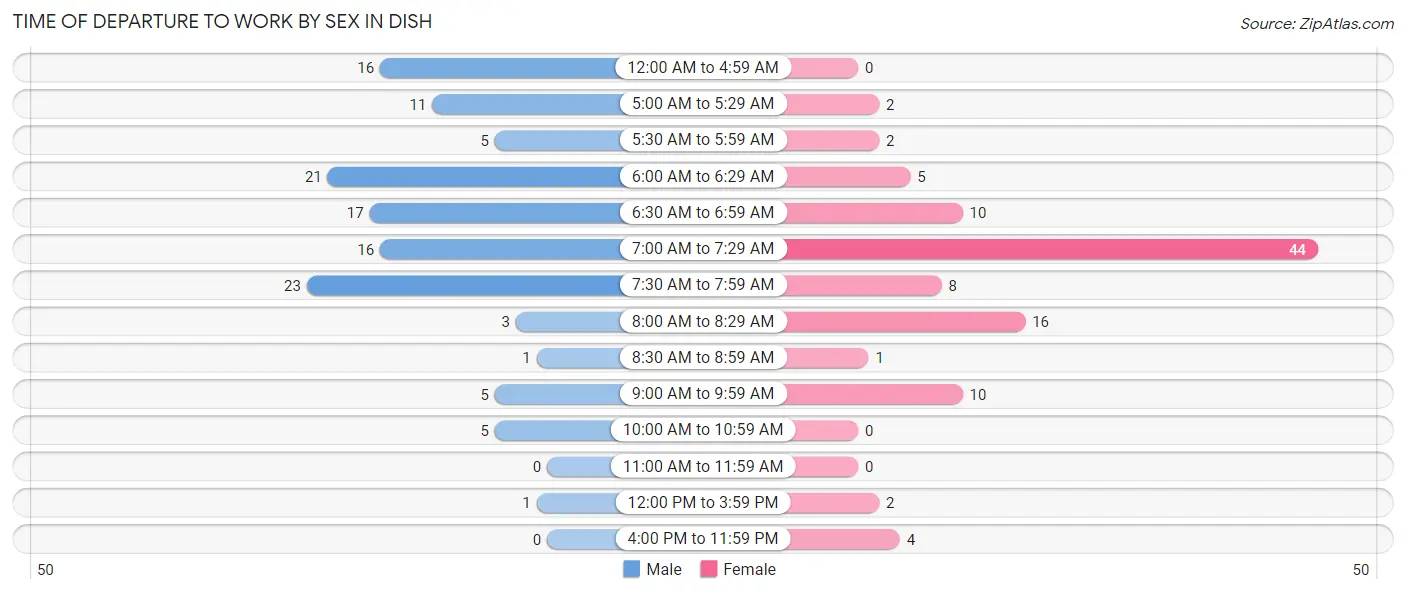
| Time of Departure | Male | Female |
| 12:00 AM to 4:59 AM | 16 (12.9%) | 0 (0.0%) |
| 5:00 AM to 5:29 AM | 11 (8.9%) | 2 (1.9%) |
| 5:30 AM to 5:59 AM | 5 (4.0%) | 2 (1.9%) |
| 6:00 AM to 6:29 AM | 21 (16.9%) | 5 (4.8%) |
| 6:30 AM to 6:59 AM | 17 (13.7%) | 10 (9.6%) |
| 7:00 AM to 7:29 AM | 16 (12.9%) | 44 (42.3%) |
| 7:30 AM to 7:59 AM | 23 (18.5%) | 8 (7.7%) |
| 8:00 AM to 8:29 AM | 3 (2.4%) | 16 (15.4%) |
| 8:30 AM to 8:59 AM | 1 (0.8%) | 1 (1.0%) |
| 9:00 AM to 9:59 AM | 5 (4.0%) | 10 (9.6%) |
| 10:00 AM to 10:59 AM | 5 (4.0%) | 0 (0.0%) |
| 11:00 AM to 11:59 AM | 0 (0.0%) | 0 (0.0%) |
| 12:00 PM to 3:59 PM | 1 (0.8%) | 2 (1.9%) |
| 4:00 PM to 11:59 PM | 0 (0.0%) | 4 (3.8%) |
| Total | 124 (100.0%) | 104 (100.0%) |
Housing Occupancy in DISH
Occupancy by Ownership in DISH
Of the total 196 dwellings in DISH, owner-occupied units account for 193 (98.5%), while renter-occupied units make up 3 (1.5%).
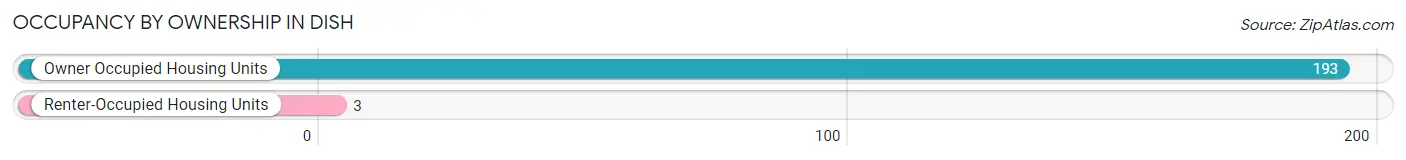
| Occupancy | # Housing Units | % Housing Units |
| Owner Occupied Housing Units | 193 | 98.5% |
| Renter-Occupied Housing Units | 3 | 1.5% |
| Total Occupied Housing Units | 196 | 100.0% |
Occupancy by Household Size in DISH
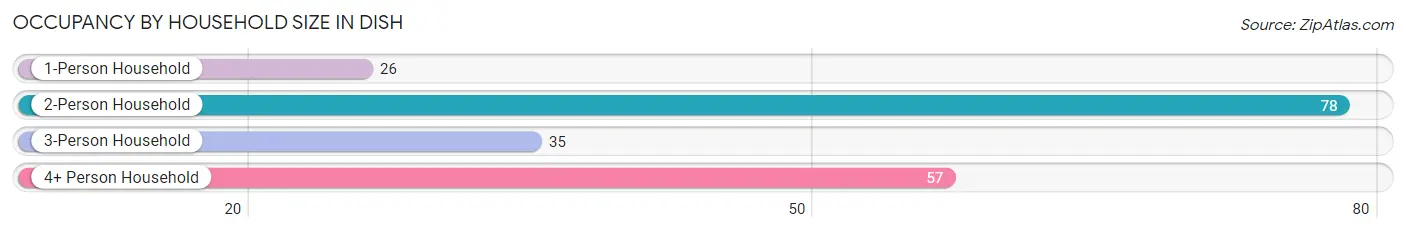
| Household Size | # Housing Units | % Housing Units |
| 1-Person Household | 26 | 13.3% |
| 2-Person Household | 78 | 39.8% |
| 3-Person Household | 35 | 17.9% |
| 4+ Person Household | 57 | 29.1% |
| Total Housing Units | 196 | 100.0% |
Occupancy by Ownership by Household Size in DISH
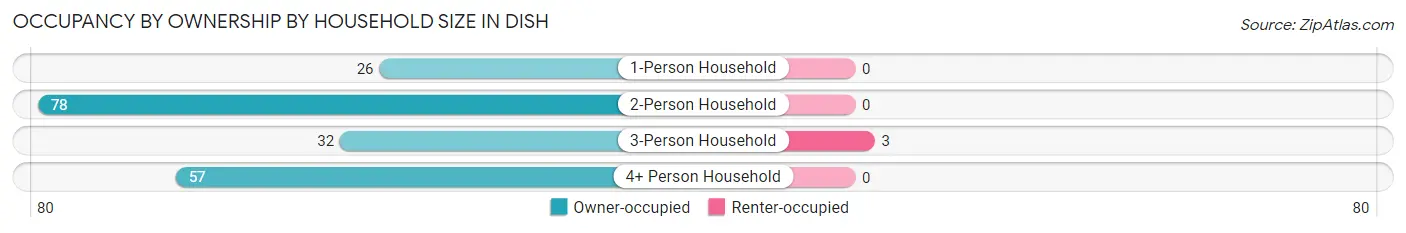
| Household Size | Owner-occupied | Renter-occupied |
| 1-Person Household | 26 (100.0%) | 0 (0.0%) |
| 2-Person Household | 78 (100.0%) | 0 (0.0%) |
| 3-Person Household | 32 (91.4%) | 3 (8.6%) |
| 4+ Person Household | 57 (100.0%) | 0 (0.0%) |
| Total Housing Units | 193 (98.5%) | 3 (1.5%) |
Occupancy by Educational Attainment in DISH
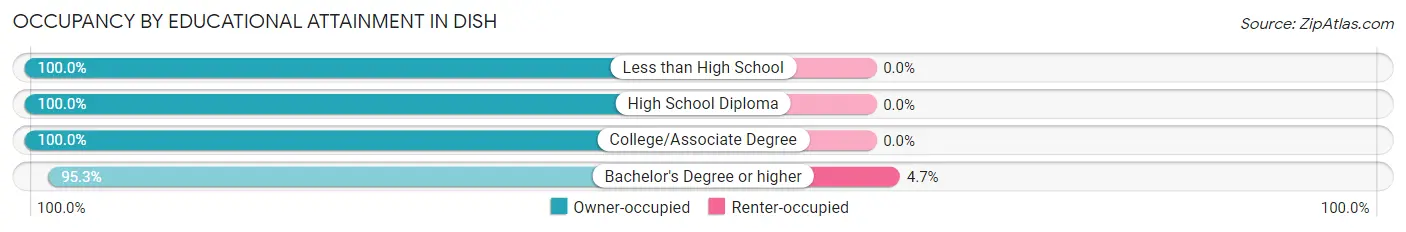
| Household Size | Owner-occupied | Renter-occupied |
| Less than High School | 7 (100.0%) | 0 (0.0%) |
| High School Diploma | 30 (100.0%) | 0 (0.0%) |
| College/Associate Degree | 95 (100.0%) | 0 (0.0%) |
| Bachelor's Degree or higher | 61 (95.3%) | 3 (4.7%) |
Occupancy by Age of Householder in DISH
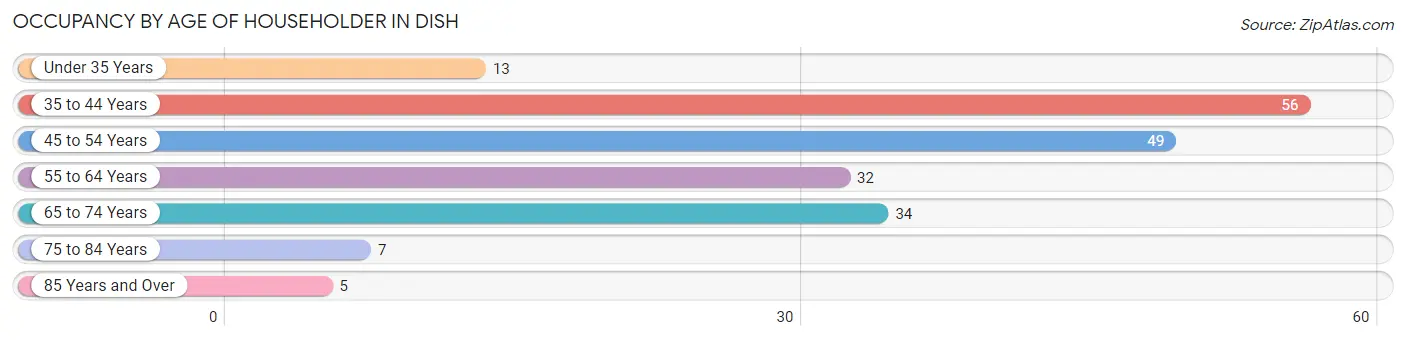
| Age Bracket | # Households | % Households |
| Under 35 Years | 13 | 6.6% |
| 35 to 44 Years | 56 | 28.6% |
| 45 to 54 Years | 49 | 25.0% |
| 55 to 64 Years | 32 | 16.3% |
| 65 to 74 Years | 34 | 17.3% |
| 75 to 84 Years | 7 | 3.6% |
| 85 Years and Over | 5 | 2.5% |
| Total | 196 | 100.0% |
Housing Finances in DISH
Median Income by Occupancy in DISH
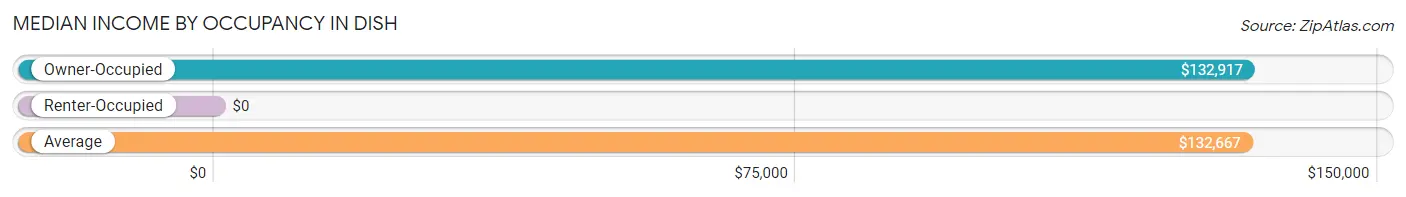
| Occupancy Type | # Households | Median Income |
| Owner-Occupied | 193 (98.5%) | $132,917 |
| Renter-Occupied | 3 (1.5%) | $0 |
| Average | 196 (100.0%) | $132,667 |
Occupancy by Householder Income Bracket in DISH
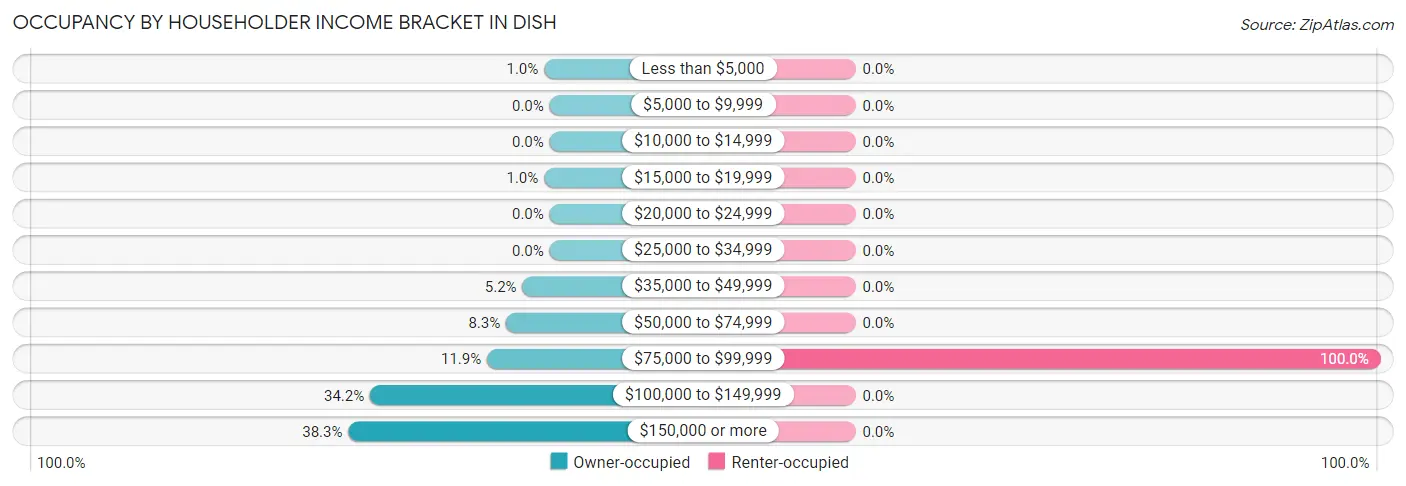
| Income Bracket | Owner-occupied | Renter-occupied |
| Less than $5,000 | 2 (1.0%) | 0 (0.0%) |
| $5,000 to $9,999 | 0 (0.0%) | 0 (0.0%) |
| $10,000 to $14,999 | 0 (0.0%) | 0 (0.0%) |
| $15,000 to $19,999 | 2 (1.0%) | 0 (0.0%) |
| $20,000 to $24,999 | 0 (0.0%) | 0 (0.0%) |
| $25,000 to $34,999 | 0 (0.0%) | 0 (0.0%) |
| $35,000 to $49,999 | 10 (5.2%) | 0 (0.0%) |
| $50,000 to $74,999 | 16 (8.3%) | 0 (0.0%) |
| $75,000 to $99,999 | 23 (11.9%) | 3 (100.0%) |
| $100,000 to $149,999 | 66 (34.2%) | 0 (0.0%) |
| $150,000 or more | 74 (38.3%) | 0 (0.0%) |
| Total | 193 (100.0%) | 3 (100.0%) |
Monthly Housing Cost Tiers in DISH
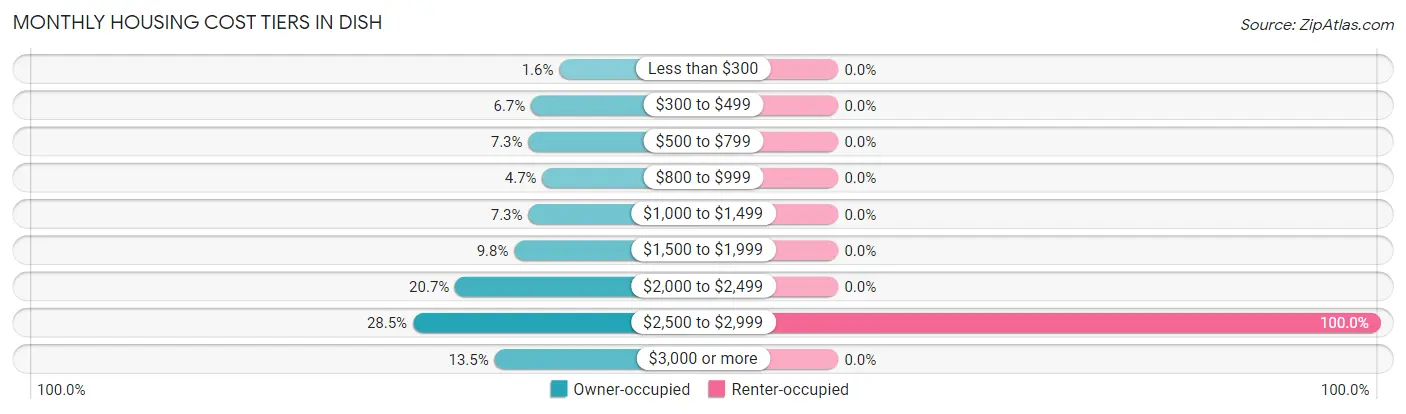
| Monthly Cost | Owner-occupied | Renter-occupied |
| Less than $300 | 3 (1.5%) | 0 (0.0%) |
| $300 to $499 | 13 (6.7%) | 0 (0.0%) |
| $500 to $799 | 14 (7.2%) | 0 (0.0%) |
| $800 to $999 | 9 (4.7%) | 0 (0.0%) |
| $1,000 to $1,499 | 14 (7.2%) | 0 (0.0%) |
| $1,500 to $1,999 | 19 (9.8%) | 0 (0.0%) |
| $2,000 to $2,499 | 40 (20.7%) | 0 (0.0%) |
| $2,500 to $2,999 | 55 (28.5%) | 3 (100.0%) |
| $3,000 or more | 26 (13.5%) | 0 (0.0%) |
| Total | 193 (100.0%) | 3 (100.0%) |
Physical Housing Characteristics in DISH
Housing Structures in DISH
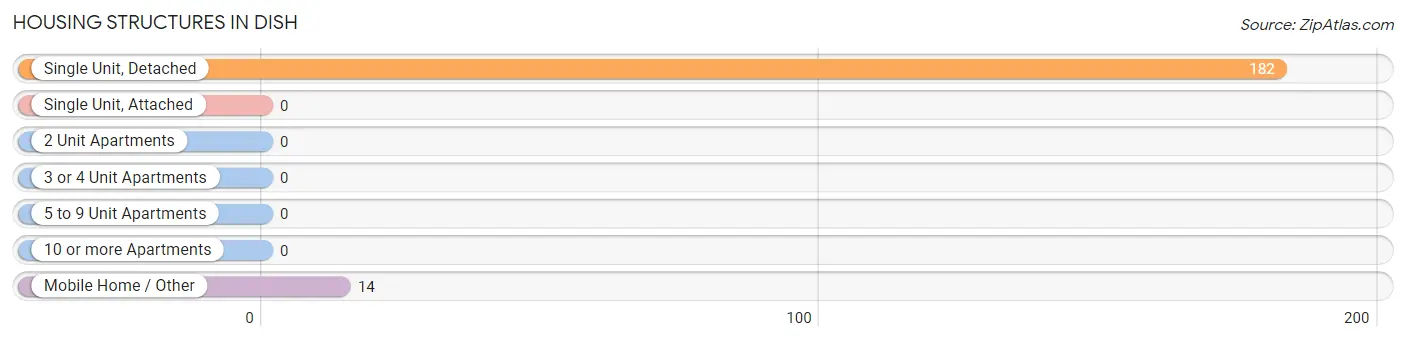
| Structure Type | # Housing Units | % Housing Units |
| Single Unit, Detached | 182 | 92.9% |
| Single Unit, Attached | 0 | 0.0% |
| 2 Unit Apartments | 0 | 0.0% |
| 3 or 4 Unit Apartments | 0 | 0.0% |
| 5 to 9 Unit Apartments | 0 | 0.0% |
| 10 or more Apartments | 0 | 0.0% |
| Mobile Home / Other | 14 | 7.1% |
| Total | 196 | 100.0% |
Housing Structures by Occupancy in DISH
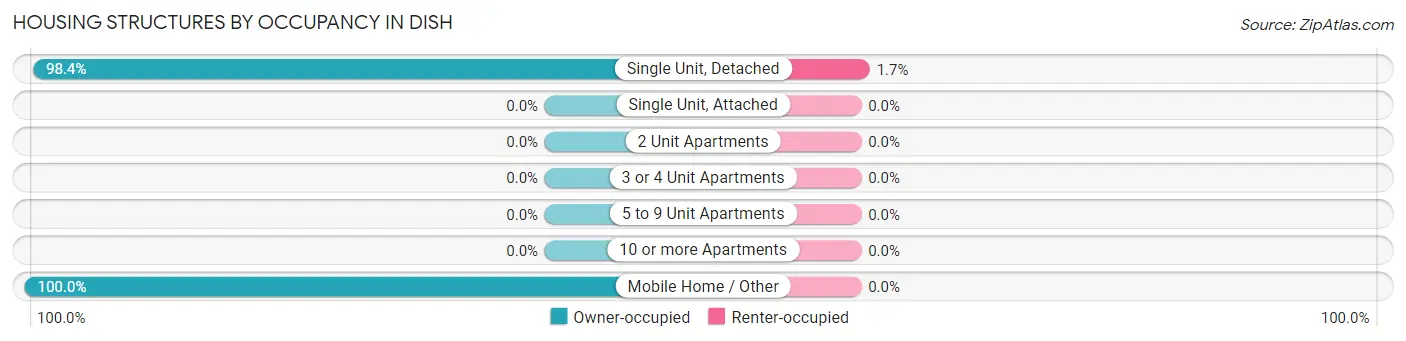
| Structure Type | Owner-occupied | Renter-occupied |
| Single Unit, Detached | 179 (98.4%) | 3 (1.7%) |
| Single Unit, Attached | 0 (0.0%) | 0 (0.0%) |
| 2 Unit Apartments | 0 (0.0%) | 0 (0.0%) |
| 3 or 4 Unit Apartments | 0 (0.0%) | 0 (0.0%) |
| 5 to 9 Unit Apartments | 0 (0.0%) | 0 (0.0%) |
| 10 or more Apartments | 0 (0.0%) | 0 (0.0%) |
| Mobile Home / Other | 14 (100.0%) | 0 (0.0%) |
| Total | 193 (98.5%) | 3 (1.5%) |
Housing Structures by Number of Rooms in DISH
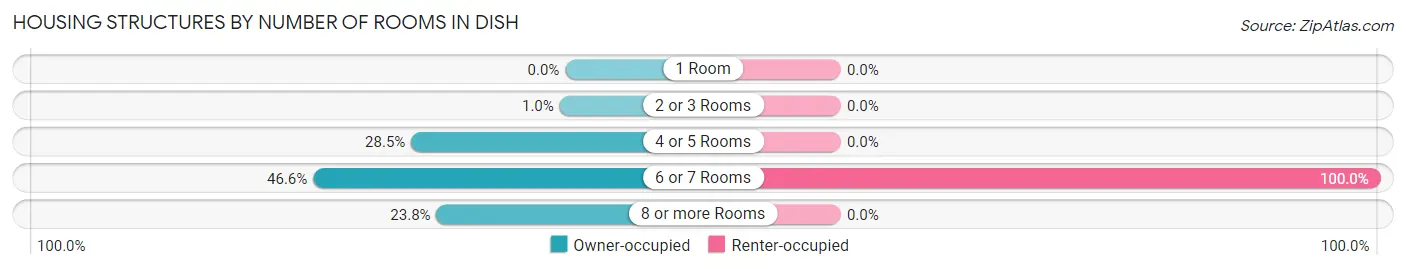
| Number of Rooms | Owner-occupied | Renter-occupied |
| 1 Room | 0 (0.0%) | 0 (0.0%) |
| 2 or 3 Rooms | 2 (1.0%) | 0 (0.0%) |
| 4 or 5 Rooms | 55 (28.5%) | 0 (0.0%) |
| 6 or 7 Rooms | 90 (46.6%) | 3 (100.0%) |
| 8 or more Rooms | 46 (23.8%) | 0 (0.0%) |
| Total | 193 (100.0%) | 3 (100.0%) |
Housing Structure by Heating Type in DISH
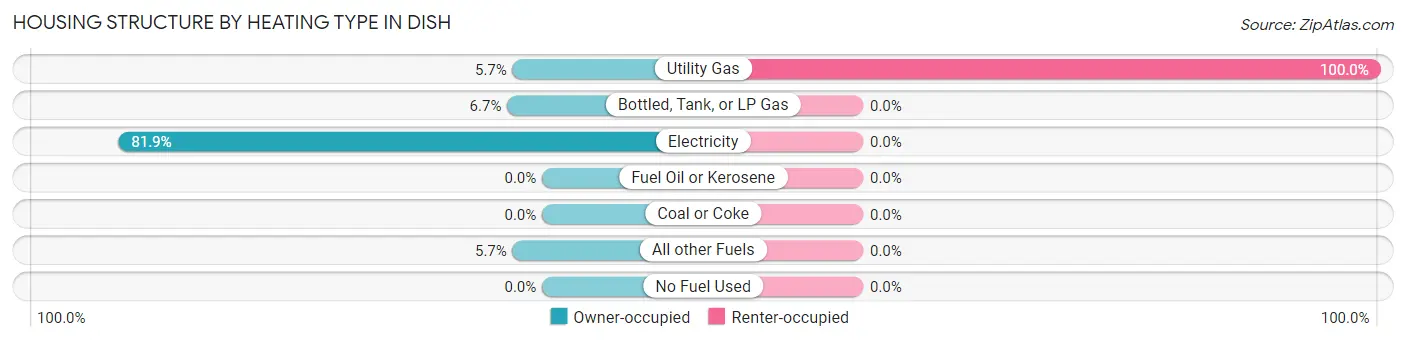
| Heating Type | Owner-occupied | Renter-occupied |
| Utility Gas | 11 (5.7%) | 3 (100.0%) |
| Bottled, Tank, or LP Gas | 13 (6.7%) | 0 (0.0%) |
| Electricity | 158 (81.9%) | 0 (0.0%) |
| Fuel Oil or Kerosene | 0 (0.0%) | 0 (0.0%) |
| Coal or Coke | 0 (0.0%) | 0 (0.0%) |
| All other Fuels | 11 (5.7%) | 0 (0.0%) |
| No Fuel Used | 0 (0.0%) | 0 (0.0%) |
| Total | 193 (100.0%) | 3 (100.0%) |
Household Vehicle Usage in DISH
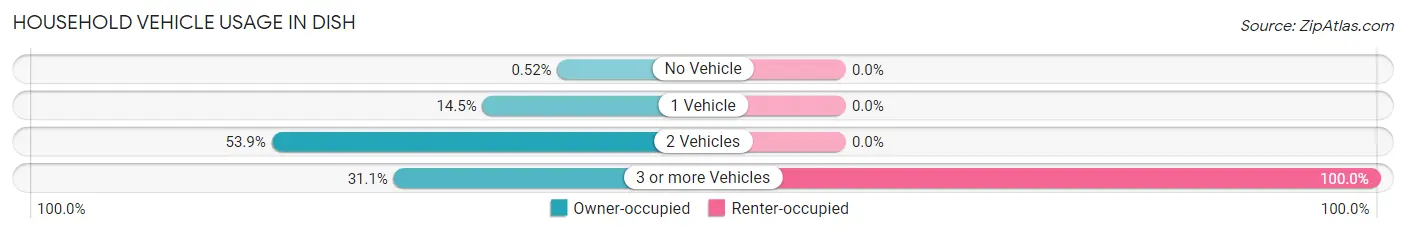
| Vehicles per Household | Owner-occupied | Renter-occupied |
| No Vehicle | 1 (0.5%) | 0 (0.0%) |
| 1 Vehicle | 28 (14.5%) | 0 (0.0%) |
| 2 Vehicles | 104 (53.9%) | 0 (0.0%) |
| 3 or more Vehicles | 60 (31.1%) | 3 (100.0%) |
| Total | 193 (100.0%) | 3 (100.0%) |
Real Estate & Mortgages in DISH
Real Estate and Mortgage Overview in DISH
| Characteristic | Without Mortgage | With Mortgage |
| Housing Units | 37 | 156 |
| Median Property Value | $339,300 | $433,300 |
| Median Household Income | $75,625 | $70 |
| Monthly Housing Costs | $650 | $26 |
| Real Estate Taxes | $4,563 | $3 |
Property Value by Mortgage Status in DISH
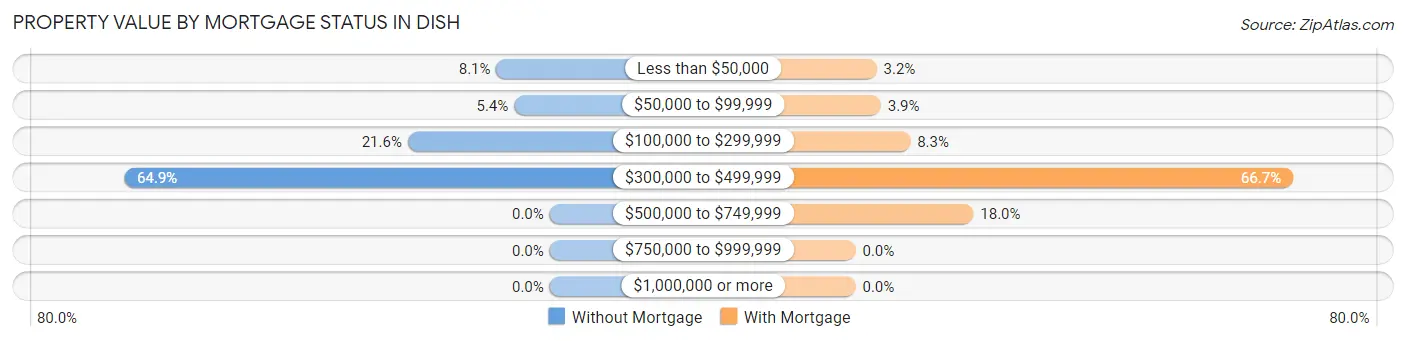
| Property Value | Without Mortgage | With Mortgage |
| Less than $50,000 | 3 (8.1%) | 5 (3.2%) |
| $50,000 to $99,999 | 2 (5.4%) | 6 (3.8%) |
| $100,000 to $299,999 | 8 (21.6%) | 13 (8.3%) |
| $300,000 to $499,999 | 24 (64.9%) | 104 (66.7%) |
| $500,000 to $749,999 | 0 (0.0%) | 28 (17.9%) |
| $750,000 to $999,999 | 0 (0.0%) | 0 (0.0%) |
| $1,000,000 or more | 0 (0.0%) | 0 (0.0%) |
| Total | 37 (100.0%) | 156 (100.0%) |
Household Income by Mortgage Status in DISH
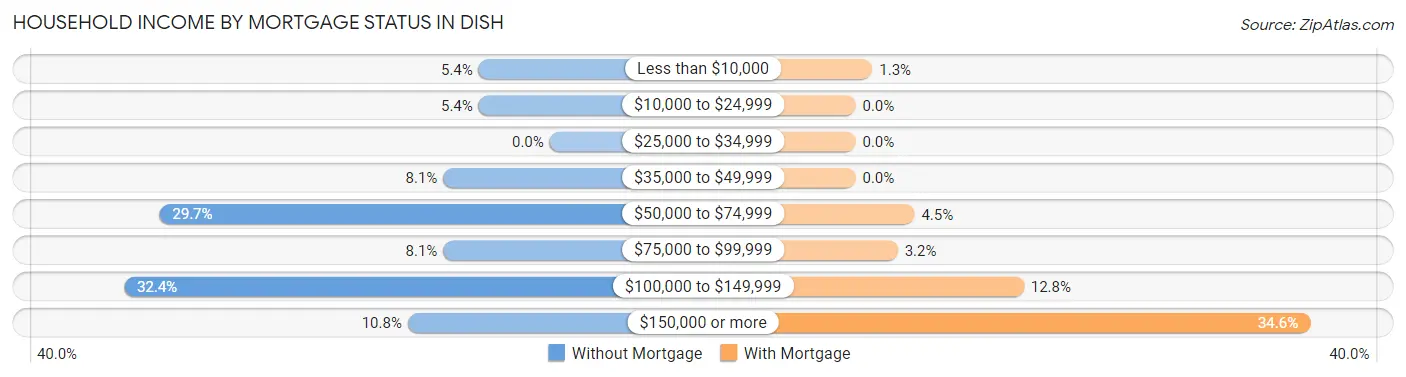
| Household Income | Without Mortgage | With Mortgage |
| Less than $10,000 | 2 (5.4%) | 2 (1.3%) |
| $10,000 to $24,999 | 2 (5.4%) | 0 (0.0%) |
| $25,000 to $34,999 | 0 (0.0%) | 0 (0.0%) |
| $35,000 to $49,999 | 3 (8.1%) | 0 (0.0%) |
| $50,000 to $74,999 | 11 (29.7%) | 7 (4.5%) |
| $75,000 to $99,999 | 3 (8.1%) | 5 (3.2%) |
| $100,000 to $149,999 | 12 (32.4%) | 20 (12.8%) |
| $150,000 or more | 4 (10.8%) | 54 (34.6%) |
| Total | 37 (100.0%) | 156 (100.0%) |
Property Value to Household Income Ratio in DISH
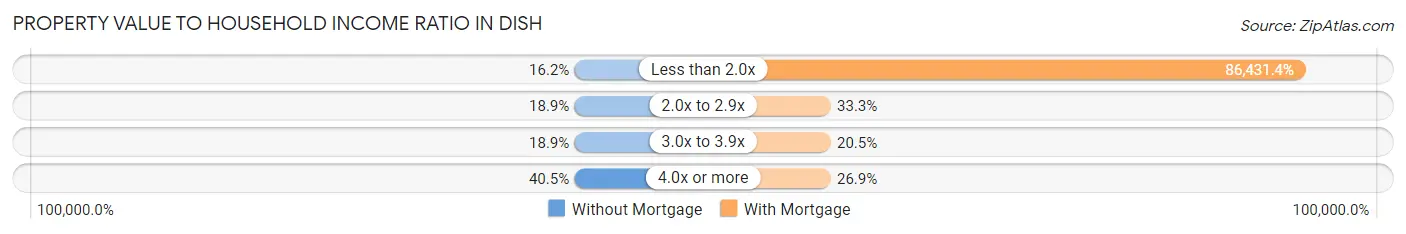
| Value-to-Income Ratio | Without Mortgage | With Mortgage |
| Less than 2.0x | 6 (16.2%) | 134,833 (86,431.4%) |
| 2.0x to 2.9x | 7 (18.9%) | 52 (33.3%) |
| 3.0x to 3.9x | 7 (18.9%) | 32 (20.5%) |
| 4.0x or more | 15 (40.5%) | 42 (26.9%) |
| Total | 37 (100.0%) | 156 (100.0%) |
Real Estate Taxes by Mortgage Status in DISH
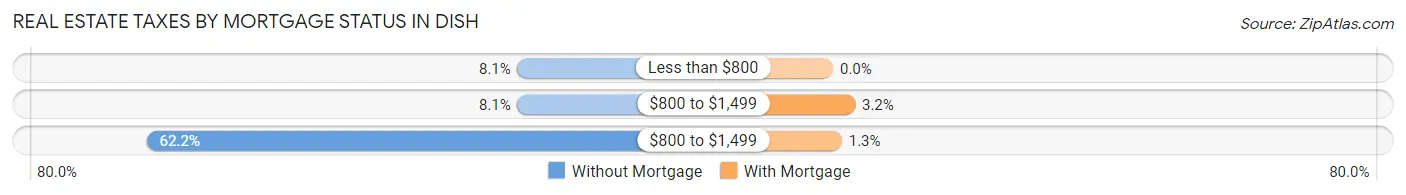
| Property Taxes | Without Mortgage | With Mortgage |
| Less than $800 | 3 (8.1%) | 0 (0.0%) |
| $800 to $1,499 | 3 (8.1%) | 5 (3.2%) |
| $800 to $1,499 | 23 (62.2%) | 2 (1.3%) |
| Total | 37 (100.0%) | 156 (100.0%) |
Health & Disability in DISH
Health Insurance Coverage by Age in DISH
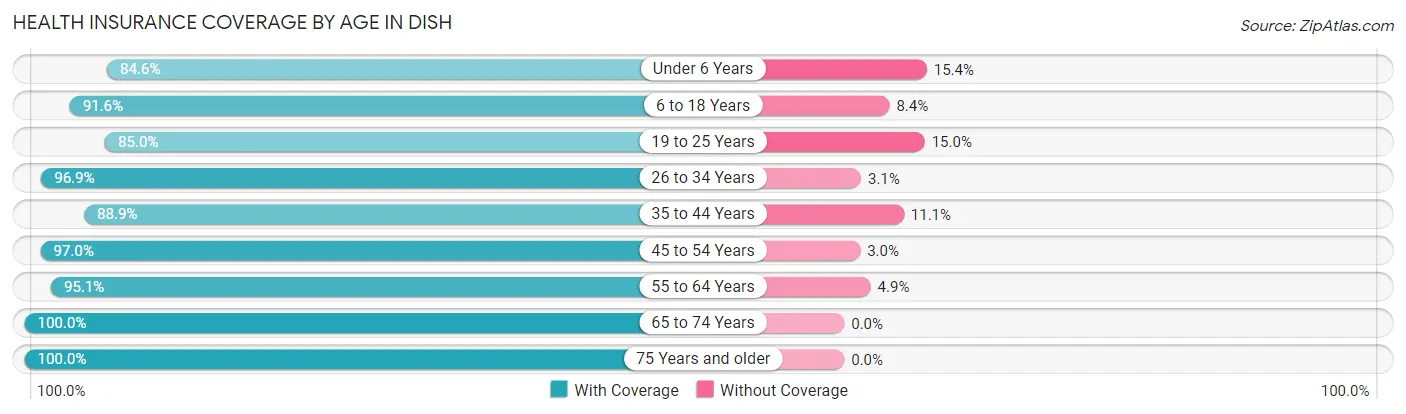
| Age Bracket | With Coverage | Without Coverage |
| Under 6 Years | 33 (84.6%) | 6 (15.4%) |
| 6 to 18 Years | 76 (91.6%) | 7 (8.4%) |
| 19 to 25 Years | 17 (85.0%) | 3 (15.0%) |
| 26 to 34 Years | 31 (96.9%) | 1 (3.1%) |
| 35 to 44 Years | 104 (88.9%) | 13 (11.1%) |
| 45 to 54 Years | 98 (97.0%) | 3 (3.0%) |
| 55 to 64 Years | 58 (95.1%) | 3 (4.9%) |
| 65 to 74 Years | 53 (100.0%) | 0 (0.0%) |
| 75 Years and older | 31 (100.0%) | 0 (0.0%) |
| Total | 501 (93.3%) | 36 (6.7%) |
Health Insurance Coverage by Citizenship Status in DISH
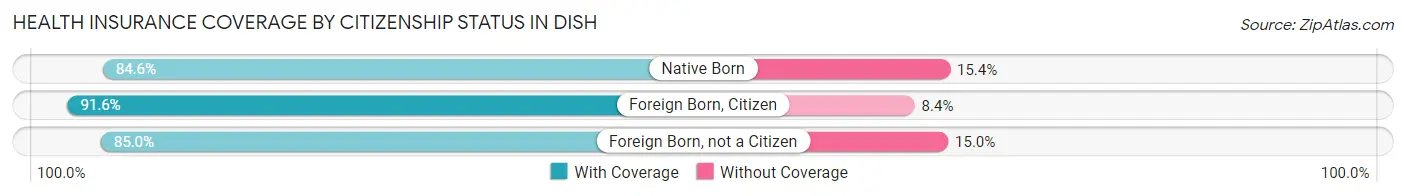
| Citizenship Status | With Coverage | Without Coverage |
| Native Born | 33 (84.6%) | 6 (15.4%) |
| Foreign Born, Citizen | 76 (91.6%) | 7 (8.4%) |
| Foreign Born, not a Citizen | 17 (85.0%) | 3 (15.0%) |
Health Insurance Coverage by Household Income in DISH
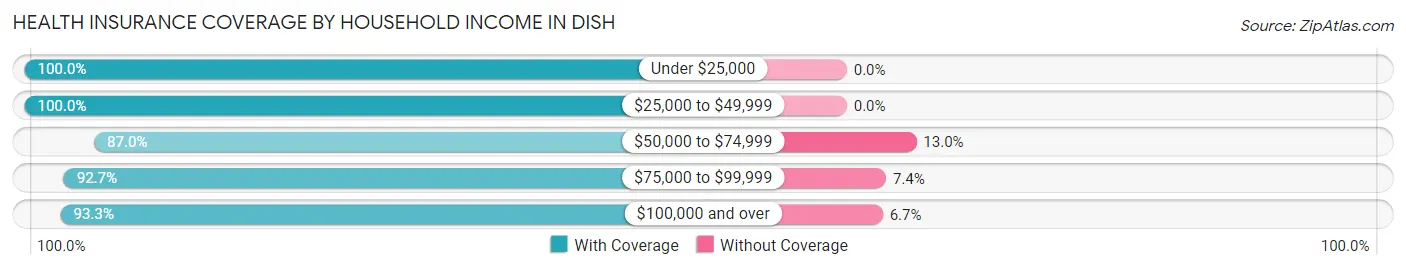
| Household Income | With Coverage | Without Coverage |
| Under $25,000 | 5 (100.0%) | 0 (0.0%) |
| $25,000 to $49,999 | 25 (100.0%) | 0 (0.0%) |
| $50,000 to $74,999 | 20 (87.0%) | 3 (13.0%) |
| $75,000 to $99,999 | 63 (92.6%) | 5 (7.3%) |
| $100,000 and over | 388 (93.3%) | 28 (6.7%) |
Public vs Private Health Insurance Coverage by Age in DISH
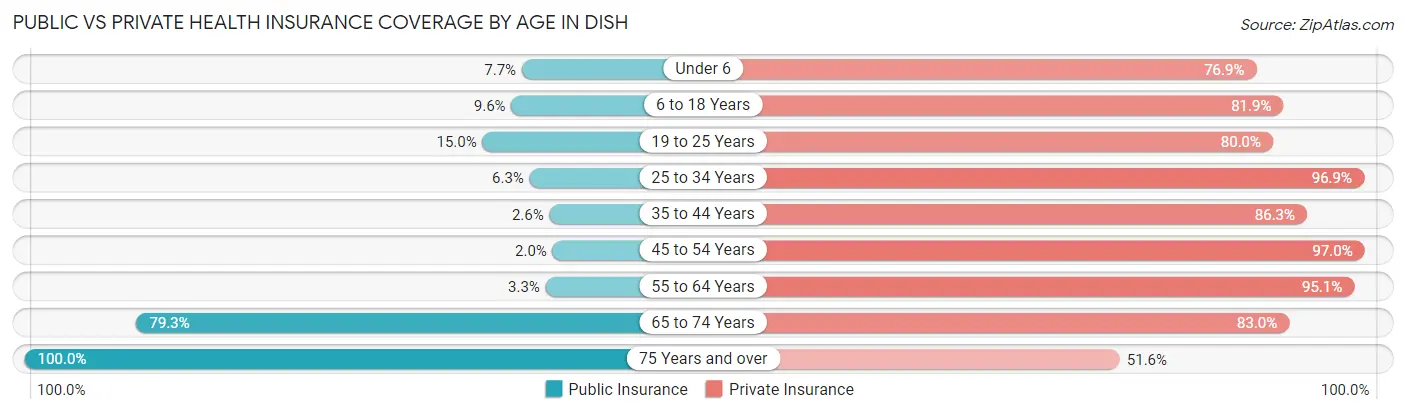
| Age Bracket | Public Insurance | Private Insurance |
| Under 6 | 3 (7.7%) | 30 (76.9%) |
| 6 to 18 Years | 8 (9.6%) | 68 (81.9%) |
| 19 to 25 Years | 3 (15.0%) | 16 (80.0%) |
| 25 to 34 Years | 2 (6.2%) | 31 (96.9%) |
| 35 to 44 Years | 3 (2.6%) | 101 (86.3%) |
| 45 to 54 Years | 2 (2.0%) | 98 (97.0%) |
| 55 to 64 Years | 2 (3.3%) | 58 (95.1%) |
| 65 to 74 Years | 42 (79.2%) | 44 (83.0%) |
| 75 Years and over | 31 (100.0%) | 16 (51.6%) |
| Total | 96 (17.9%) | 462 (86.0%) |
Disability Status by Sex by Age in DISH
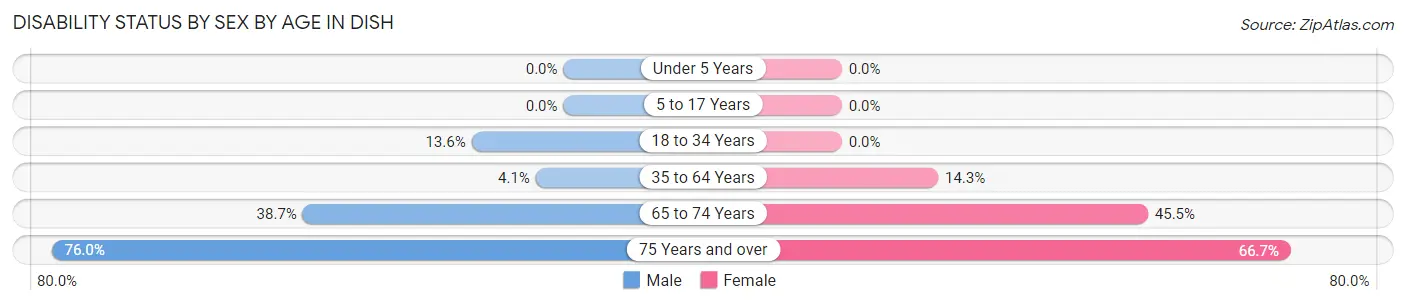
| Age Bracket | Male | Female |
| Under 5 Years | 0 (0.0%) | 0 (0.0%) |
| 5 to 17 Years | 0 (0.0%) | 0 (0.0%) |
| 18 to 34 Years | 3 (13.6%) | 0 (0.0%) |
| 35 to 64 Years | 6 (4.1%) | 19 (14.3%) |
| 65 to 74 Years | 12 (38.7%) | 10 (45.5%) |
| 75 Years and over | 19 (76.0%) | 4 (66.7%) |
Disability Class by Sex by Age in DISH
Disability Class: Hearing Difficulty
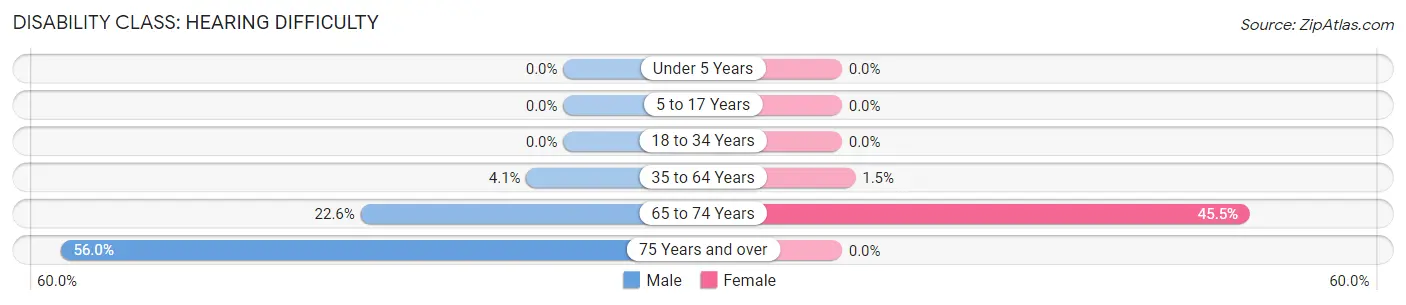
| Age Bracket | Male | Female |
| Under 5 Years | 0 (0.0%) | 0 (0.0%) |
| 5 to 17 Years | 0 (0.0%) | 0 (0.0%) |
| 18 to 34 Years | 0 (0.0%) | 0 (0.0%) |
| 35 to 64 Years | 6 (4.1%) | 2 (1.5%) |
| 65 to 74 Years | 7 (22.6%) | 10 (45.5%) |
| 75 Years and over | 14 (56.0%) | 0 (0.0%) |
Disability Class: Vision Difficulty
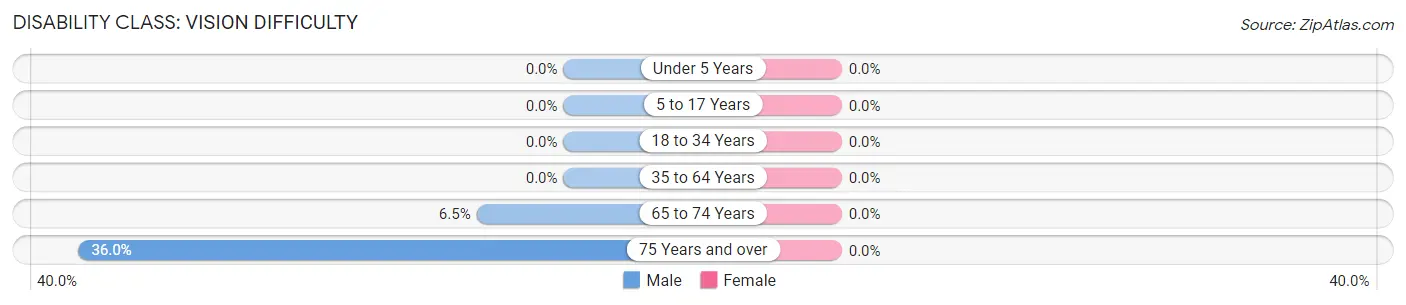
| Age Bracket | Male | Female |
| Under 5 Years | 0 (0.0%) | 0 (0.0%) |
| 5 to 17 Years | 0 (0.0%) | 0 (0.0%) |
| 18 to 34 Years | 0 (0.0%) | 0 (0.0%) |
| 35 to 64 Years | 0 (0.0%) | 0 (0.0%) |
| 65 to 74 Years | 2 (6.5%) | 0 (0.0%) |
| 75 Years and over | 9 (36.0%) | 0 (0.0%) |
Disability Class: Cognitive Difficulty
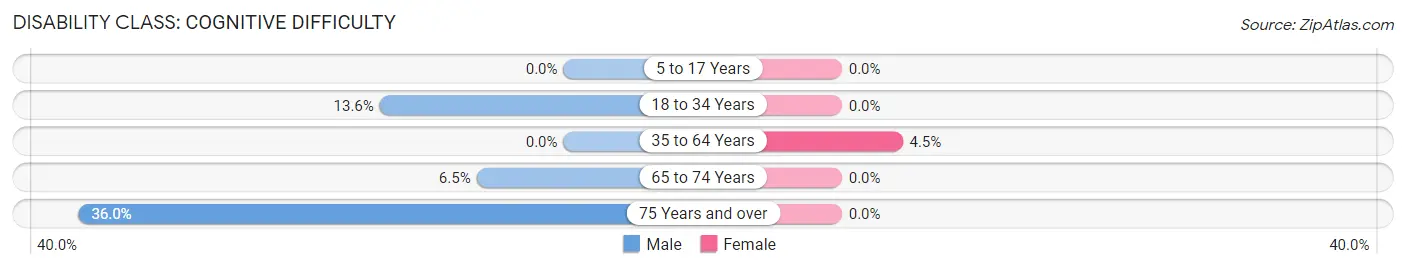
| Age Bracket | Male | Female |
| 5 to 17 Years | 0 (0.0%) | 0 (0.0%) |
| 18 to 34 Years | 3 (13.6%) | 0 (0.0%) |
| 35 to 64 Years | 0 (0.0%) | 6 (4.5%) |
| 65 to 74 Years | 2 (6.5%) | 0 (0.0%) |
| 75 Years and over | 9 (36.0%) | 0 (0.0%) |
Disability Class: Ambulatory Difficulty
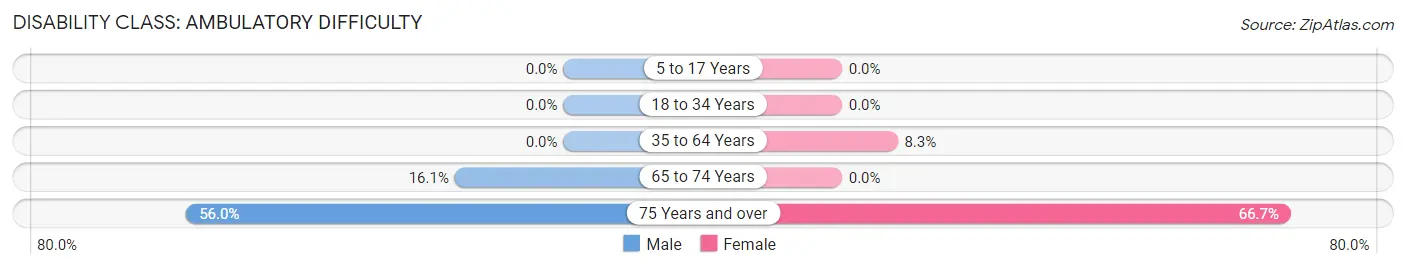
| Age Bracket | Male | Female |
| 5 to 17 Years | 0 (0.0%) | 0 (0.0%) |
| 18 to 34 Years | 0 (0.0%) | 0 (0.0%) |
| 35 to 64 Years | 0 (0.0%) | 11 (8.3%) |
| 65 to 74 Years | 5 (16.1%) | 0 (0.0%) |
| 75 Years and over | 14 (56.0%) | 4 (66.7%) |
Disability Class: Self-Care Difficulty
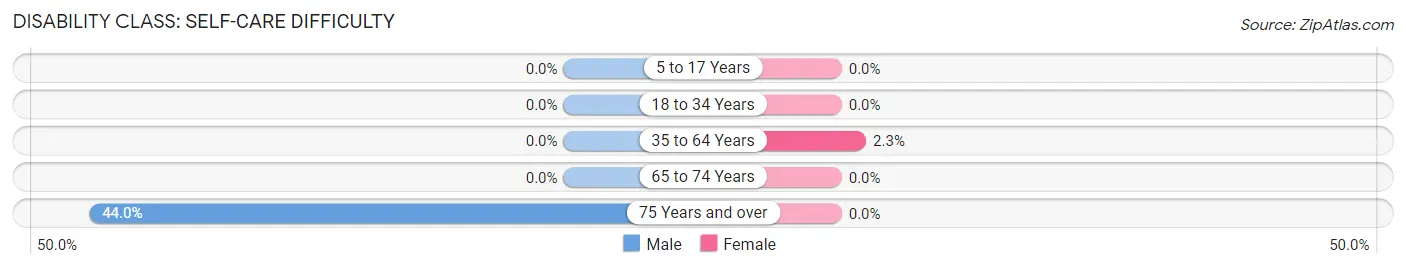
| Age Bracket | Male | Female |
| 5 to 17 Years | 0 (0.0%) | 0 (0.0%) |
| 18 to 34 Years | 0 (0.0%) | 0 (0.0%) |
| 35 to 64 Years | 0 (0.0%) | 3 (2.3%) |
| 65 to 74 Years | 0 (0.0%) | 0 (0.0%) |
| 75 Years and over | 11 (44.0%) | 0 (0.0%) |
Technology Access in DISH
Computing Device Access in DISH
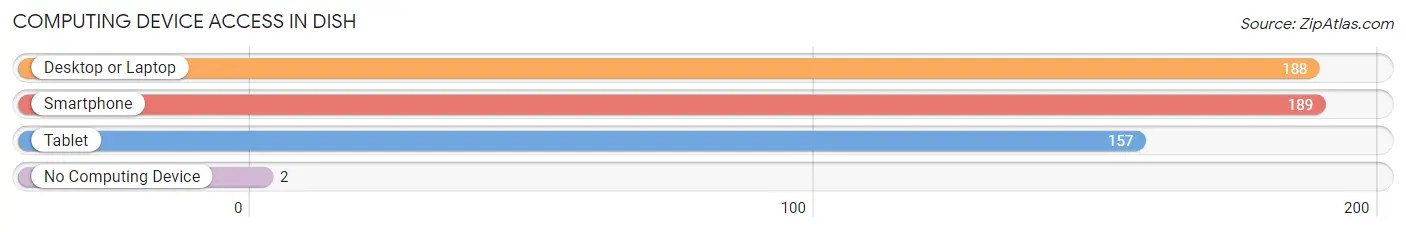
| Device Type | # Households | % Households |
| Desktop or Laptop | 188 | 95.9% |
| Smartphone | 189 | 96.4% |
| Tablet | 157 | 80.1% |
| No Computing Device | 2 | 1.0% |
| Total | 196 | 100.0% |
Internet Access in DISH
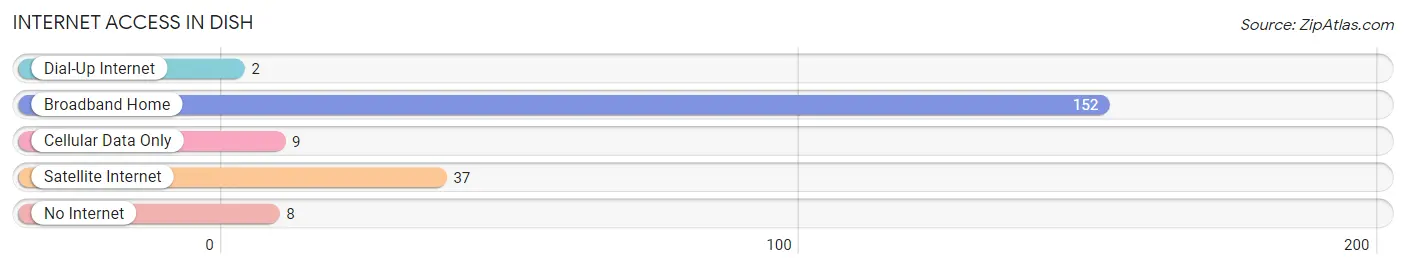
| Internet Type | # Households | % Households |
| Dial-Up Internet | 2 | 1.0% |
| Broadband Home | 152 | 77.5% |
| Cellular Data Only | 9 | 4.6% |
| Satellite Internet | 37 | 18.9% |
| No Internet | 8 | 4.1% |
| Total | 196 | 100.0% |
DISH Summary
TX History
Texas is a state located in the south-central region of the United States. It is the second largest state in the country, both in terms of population and land area. Texas has a rich and varied history, beginning with its Native American inhabitants and continuing through its Spanish, Mexican, and American periods.
The first inhabitants of Texas were Native American tribes, including the Apache, Comanche, and Caddo. These tribes lived in the area for thousands of years before the arrival of Europeans. In 1519, Spanish explorer Alonso Alvarez de Pineda became the first European to explore the area. He was followed by other Spanish explorers, including Francisco Vásquez de Coronado and Hernando de Soto.
In 1690, the Spanish established a mission in East Texas, which was the first permanent European settlement in the area. The mission was part of a larger effort to colonize the region and convert the Native Americans to Christianity. The Spanish also established several presidios, or military forts, in the area.
In 1821, Mexico won its independence from Spain and Texas became part of the newly formed Mexican Republic. During this period, the area was known as Tejas and was sparsely populated. In 1835, a group of American settlers in Texas declared their independence from Mexico and formed the Republic of Texas. This led to the Texas Revolution, which lasted from 1835 to 1836. The Texans were victorious and Texas became an independent nation.
In 1845, Texas was annexed by the United States and became the 28th state. During the American Civil War, Texas seceded from the Union and joined the Confederate States of America. After the war, Texas was readmitted to the Union in 1870.
In the late 19th and early 20th centuries, Texas experienced a period of rapid growth and development. This was due in part to the discovery of oil in the state in 1901. The oil industry helped to transform Texas into an economic powerhouse and the state’s population grew rapidly.
Today, Texas is one of the most populous and economically powerful states in the country. It is home to a diverse population and is known for its vibrant culture and rich history.
Geography
Texas is located in the south-central region of the United States. It is bordered by Oklahoma to the north, Arkansas to the northeast, Louisiana to the east, New Mexico to the west, and Mexico to the south.
Texas is the second largest state in the country, both in terms of population and land area. It covers an area of 268,820 square miles, making it larger than France and Germany combined.
Texas is divided into four distinct geographic regions: the Gulf Coastal Plains, the Great Plains, the Edwards Plateau, and the Basin and Range Province. The Gulf Coastal Plains are located along the Gulf of Mexico and are characterized by flat terrain and sandy beaches. The Great Plains are located in the northern part of the state and are characterized by rolling hills and grasslands. The Edwards Plateau is located in the central part of the state and is characterized by limestone hills and canyons. The Basin and Range Province is located in the western part of the state and is characterized by mountains and desert.
Economy
Texas has a diverse and vibrant economy. It is the second largest economy in the United States, behind only California.
The state’s economy is driven by a variety of industries, including energy, technology, manufacturing, finance, and tourism. The energy industry is the largest sector of the economy, accounting for nearly one-third of the state’s GDP. The technology sector is also a major contributor to the economy, with many of the world’s largest technology companies based in Texas.
The state is also home to a large agricultural sector, with crops such as cotton, corn, and wheat being grown in the state. Livestock is also an important part of the state’s economy, with cattle, sheep, and goats being raised in the state.
Demographics
As of 2019, Texas had an estimated population of 29 million people. This makes it the second most populous state in the country, behind only California.
The state is home to a diverse population, with people of many different racial and ethnic backgrounds. The largest racial group in the state is White, accounting for 43.5% of the population. The second largest group is Hispanic or Latino, accounting for 39.4% of the population. Other racial groups include African American (12.8%), Asian (3.8%), and Native American (0.7%).
The state’s population is also diverse in terms of religion. The largest religious group in the state is Christian, accounting for 75.2% of the population. Other religious groups include Jewish (2.2%), Muslim (1.3%), and Buddhist (0.5%).
Conclusion
Texas is a large and diverse state with a rich history and vibrant culture. It is home to a diverse population and has a diverse economy, driven by a variety of industries. The state is also home to a variety of geographic regions, from the Gulf Coastal Plains to the Basin and Range Province. Texas is an important part of the United States and its economy and culture will continue to shape the nation for years to come.
Common Questions
What is Per Capita Income in DISH?
Per Capita income in DISH is $53,364.
What is the Median Family Income in DISH?
Median Family Income in DISH is $133,583.
What is the Median Household income in DISH?
Median Household Income in DISH is $132,667.
What is Income or Wage Gap in DISH?
Income or Wage Gap in DISH is 32.2%.
Women in DISH earn 67.8 cents for every dollar earned by a man.
What is Inequality or Gini Index in DISH?
Inequality or Gini Index in DISH is 0.28.
What is the Total Population of DISH?
Total Population of DISH is 537.
What is the Total Male Population of DISH?
Total Male Population of DISH is 262.
What is the Total Female Population of DISH?
Total Female Population of DISH is 275.
What is the Ratio of Males per 100 Females in DISH?
There are 95.27 Males per 100 Females in DISH.
What is the Ratio of Females per 100 Males in DISH?
There are 104.96 Females per 100 Males in DISH.
What is the Median Population Age in DISH?
Median Population Age in DISH is 43.1 Years.
What is the Average Family Size in DISH
Average Family Size in DISH is 3.0 People.
What is the Average Household Size in DISH
Average Household Size in DISH is 2.7 People.
How Large is the Labor Force in DISH?
There are 309 People in the Labor Forcein in DISH.
What is the Percentage of People in the Labor Force in DISH?
72.2% of People are in the Labor Force in DISH.
What is the Unemployment Rate in DISH?
Unemployment Rate in DISH is 1.6%.