Sewall s Point, FL Map & Demographics
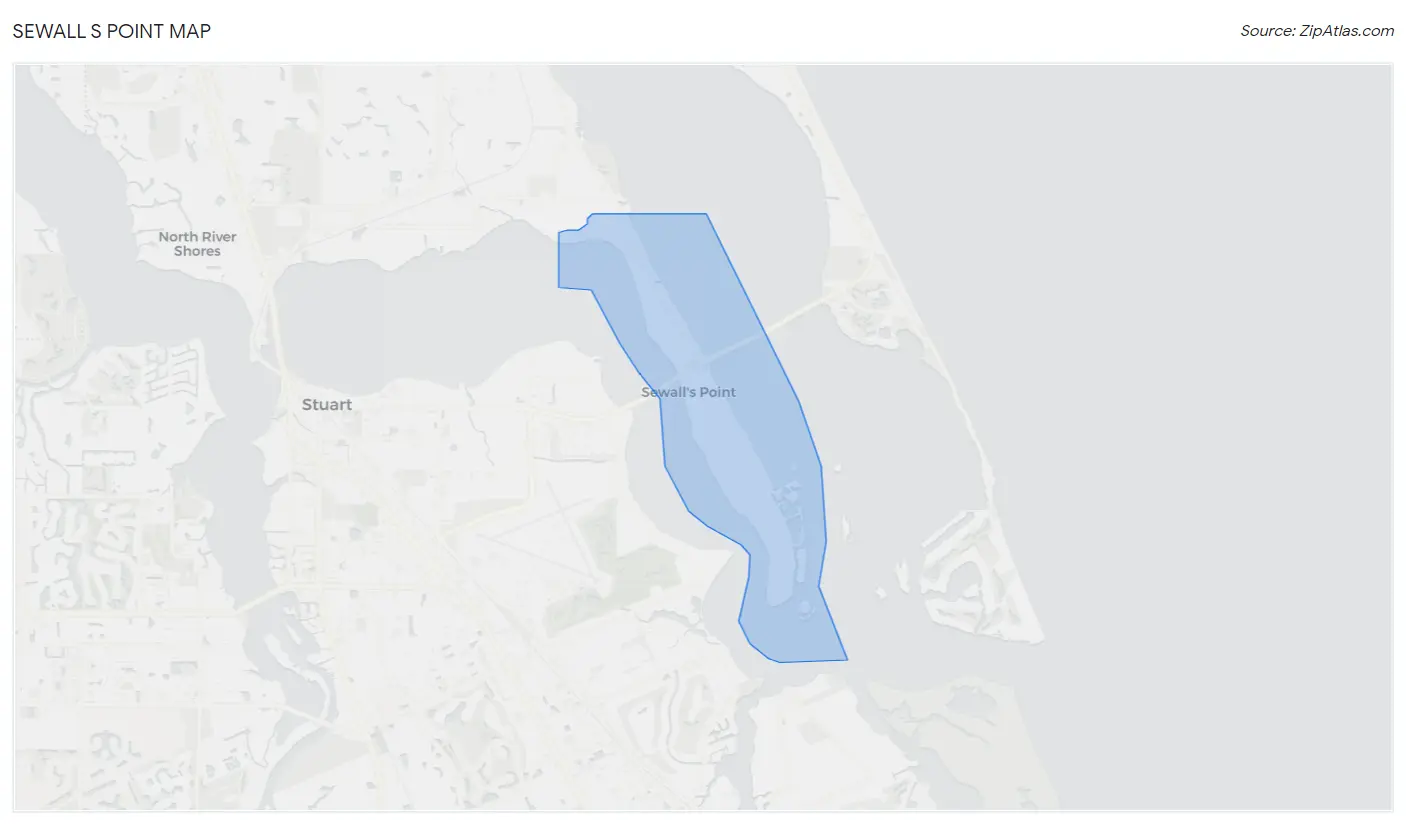
Sewall s Point Map
Sewall s Point Overview
$100,933
PER CAPITA INCOME
$162,857
AVG FAMILY INCOME
$122,391
AVG HOUSEHOLD INCOME
26.6%
WAGE / INCOME GAP [ % ]
73.4¢/ $1
WAGE / INCOME GAP [ $ ]
0.47
INEQUALITY / GINI INDEX
1,922
TOTAL POPULATION
1,020
MALE POPULATION
902
FEMALE POPULATION
113.08
MALES / 100 FEMALES
88.43
FEMALES / 100 MALES
61.7
MEDIAN AGE
2.6
AVG FAMILY SIZE
2.2
AVG HOUSEHOLD SIZE
924
LABOR FORCE [ PEOPLE ]
53.4%
PERCENT IN LABOR FORCE
2.1%
UNEMPLOYMENT RATE
Income in Sewall s Point
Income Overview in Sewall s Point
Per Capita Income in Sewall s Point is $100,933, while median incomes of families and households are $162,857 and $122,391 respectively.
| Characteristic | Number | Measure |
| Per Capita Income | 1,922 | $100,933 |
| Median Family Income | 578 | $162,857 |
| Mean Family Income | 578 | $254,981 |
| Median Household Income | 870 | $122,391 |
| Mean Household Income | 870 | $219,188 |
| Income Deficit | 578 | $0 |
| Wage / Income Gap (%) | 1,922 | 26.64% |
| Wage / Income Gap ($) | 1,922 | 73.36¢ per $1 |
| Gini / Inequality Index | 1,922 | 0.47 |
Earnings by Sex in Sewall s Point
Average Earnings in Sewall s Point are $78,542, $81,250 for men and $59,607 for women, a difference of 26.6%.
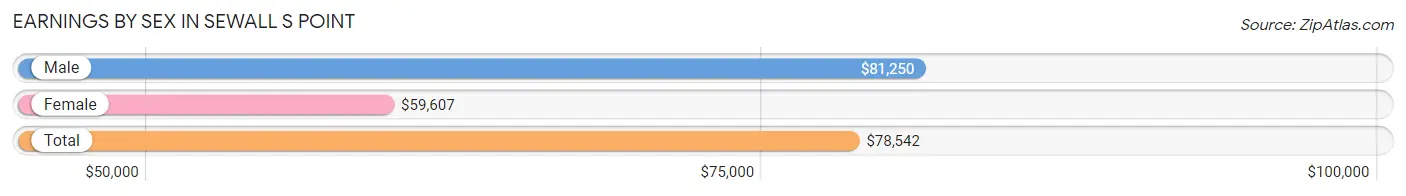
| Sex | Number | Average Earnings |
| Male | 580 (58.8%) | $81,250 |
| Female | 407 (41.2%) | $59,607 |
| Total | 987 (100.0%) | $78,542 |
Earnings by Sex by Income Bracket in Sewall s Point
The most common earnings brackets in Sewall s Point are $100,000+ for men (233 | 40.2%) and $100,000+ for women (96 | 23.6%).
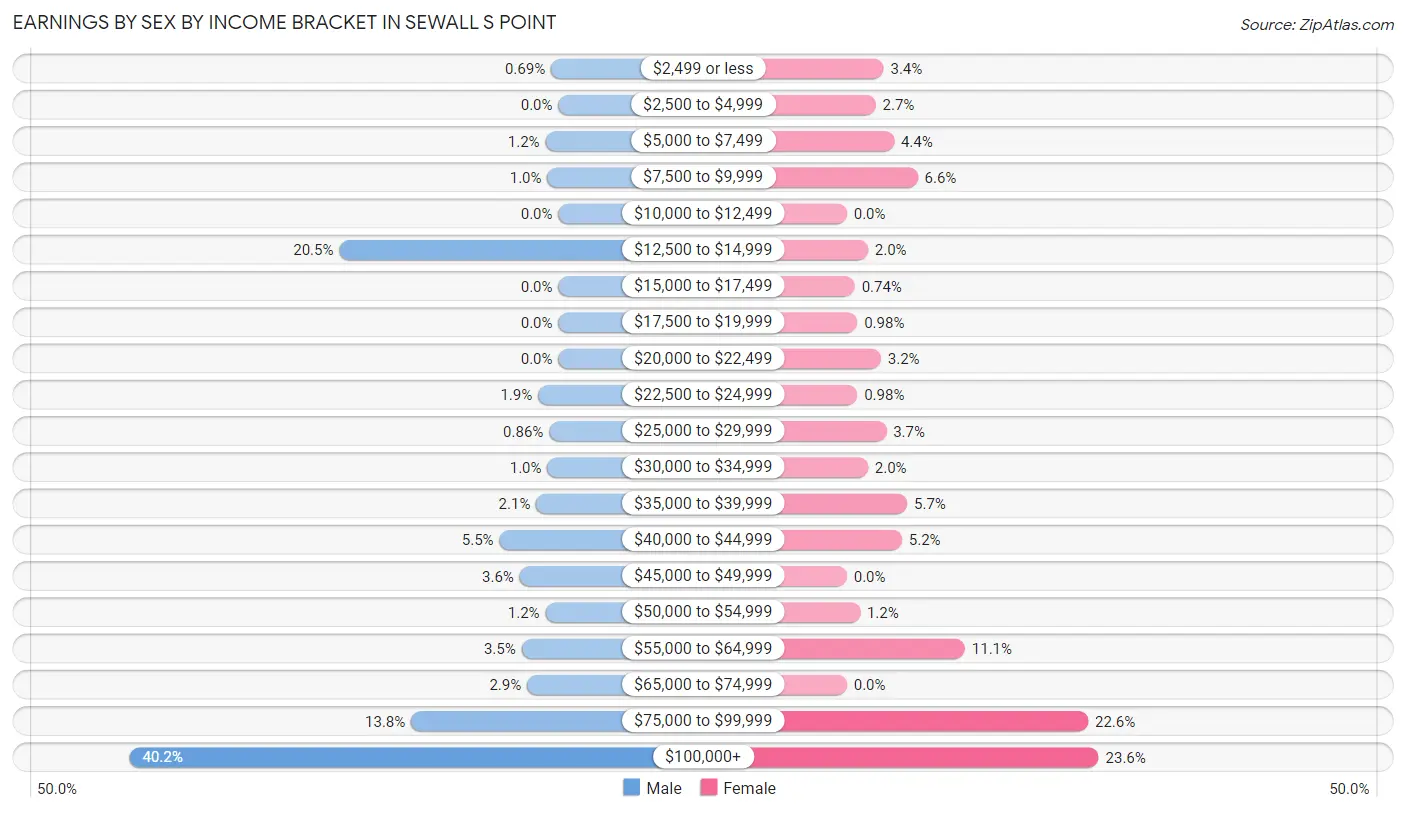
| Income | Male | Female |
| $2,499 or less | 4 (0.7%) | 14 (3.4%) |
| $2,500 to $4,999 | 0 (0.0%) | 11 (2.7%) |
| $5,000 to $7,499 | 7 (1.2%) | 18 (4.4%) |
| $7,500 to $9,999 | 6 (1.0%) | 27 (6.6%) |
| $10,000 to $12,499 | 0 (0.0%) | 0 (0.0%) |
| $12,500 to $14,999 | 119 (20.5%) | 8 (2.0%) |
| $15,000 to $17,499 | 0 (0.0%) | 3 (0.7%) |
| $17,500 to $19,999 | 0 (0.0%) | 4 (1.0%) |
| $20,000 to $22,499 | 0 (0.0%) | 13 (3.2%) |
| $22,500 to $24,999 | 11 (1.9%) | 4 (1.0%) |
| $25,000 to $29,999 | 5 (0.9%) | 15 (3.7%) |
| $30,000 to $34,999 | 6 (1.0%) | 8 (2.0%) |
| $35,000 to $39,999 | 12 (2.1%) | 23 (5.7%) |
| $40,000 to $44,999 | 32 (5.5%) | 21 (5.2%) |
| $45,000 to $49,999 | 21 (3.6%) | 0 (0.0%) |
| $50,000 to $54,999 | 7 (1.2%) | 5 (1.2%) |
| $55,000 to $64,999 | 20 (3.5%) | 45 (11.1%) |
| $65,000 to $74,999 | 17 (2.9%) | 0 (0.0%) |
| $75,000 to $99,999 | 80 (13.8%) | 92 (22.6%) |
| $100,000+ | 233 (40.2%) | 96 (23.6%) |
| Total | 580 (100.0%) | 407 (100.0%) |
Earnings by Sex by Educational Attainment in Sewall s Point
Average earnings in Sewall s Point are $81,250 for men and $61,125 for women, a difference of 24.8%. Men with an educational attainment of graduate degree enjoy the highest average annual earnings of $175,903, while those with college or associate's degree education earn the least with $46,964. Women with an educational attainment of graduate degree earn the most with the average annual earnings of $110,066, while those with bachelor's degree education have the smallest earnings of $87,842.
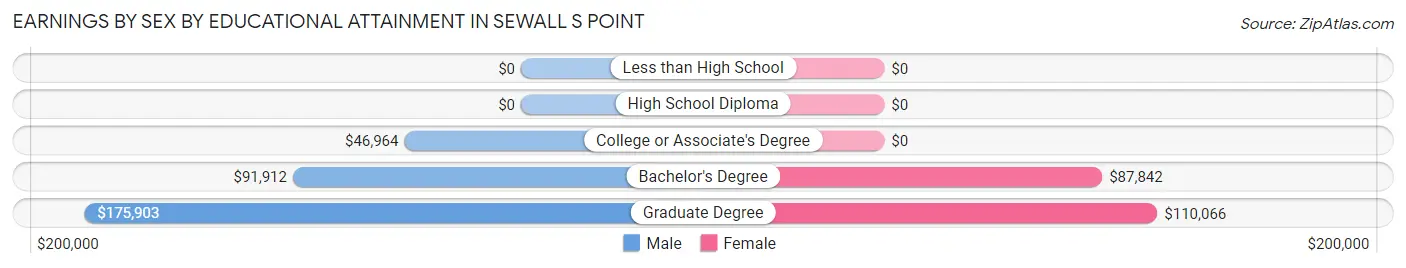
| Educational Attainment | Male Income | Female Income |
| Less than High School | - | - |
| High School Diploma | - | - |
| College or Associate's Degree | $46,964 | $0 |
| Bachelor's Degree | $91,912 | $87,842 |
| Graduate Degree | $175,903 | $110,066 |
| Total | $81,250 | $61,125 |
Family Income in Sewall s Point
Family Income Brackets in Sewall s Point
According to the Sewall s Point family income data, there are 249 families falling into the $200,000+ income range, which is the most common income bracket and makes up 43.1% of all families.
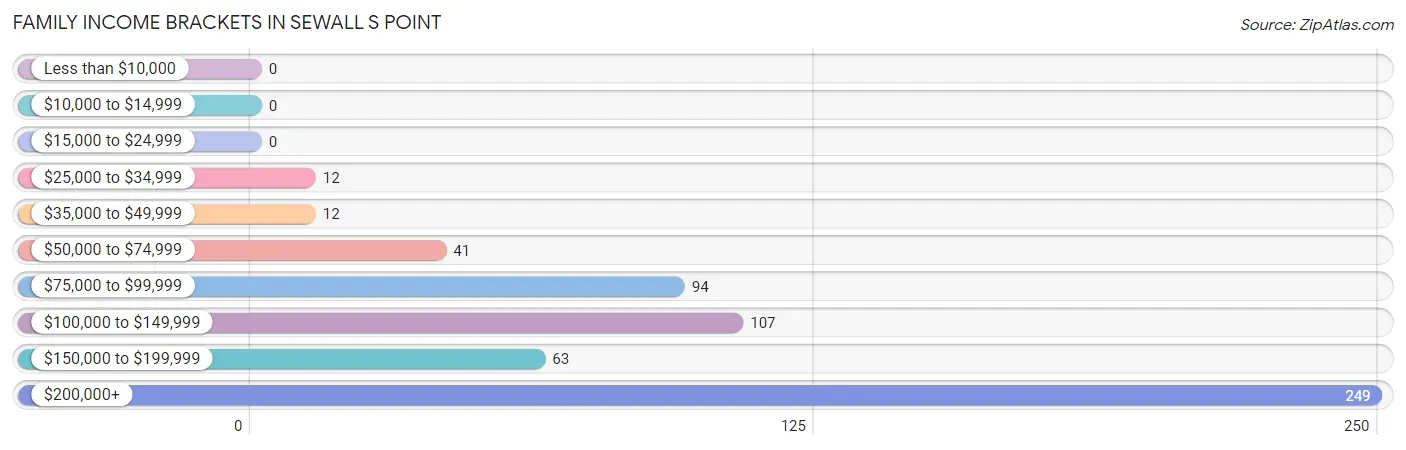
| Income Bracket | # Families | % Families |
| Less than $10,000 | 0 | 0.0% |
| $10,000 to $14,999 | 0 | 0.0% |
| $15,000 to $24,999 | 0 | 0.0% |
| $25,000 to $34,999 | 12 | 2.1% |
| $35,000 to $49,999 | 12 | 2.1% |
| $50,000 to $74,999 | 41 | 7.1% |
| $75,000 to $99,999 | 94 | 16.3% |
| $100,000 to $149,999 | 107 | 18.5% |
| $150,000 to $199,999 | 63 | 10.9% |
| $200,000+ | 249 | 43.1% |
Family Income by Famaliy Size in Sewall s Point
4-person families (80 | 13.8%) account for the highest median family income in Sewall s Point with $221,250 per family, while 2-person families (419 | 72.5%) have the highest median income of $79,132 per family member.
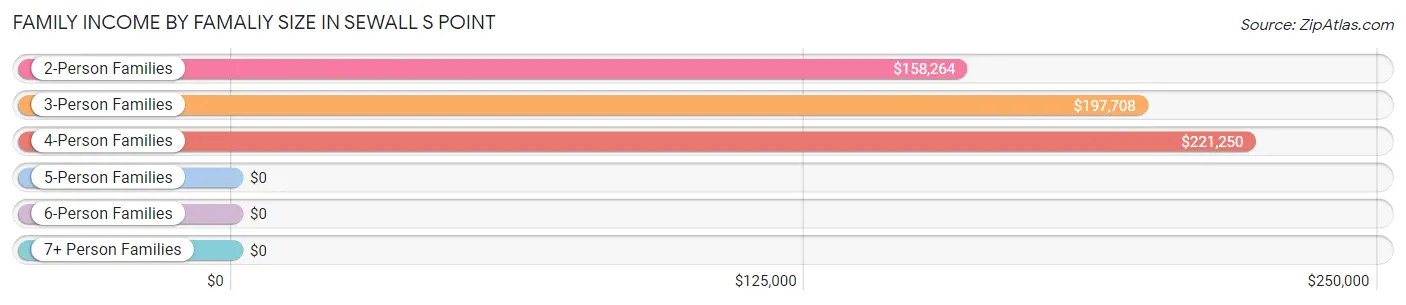
| Income Bracket | # Families | Median Income |
| 2-Person Families | 419 (72.5%) | $158,264 |
| 3-Person Families | 63 (10.9%) | $197,708 |
| 4-Person Families | 80 (13.8%) | $221,250 |
| 5-Person Families | 14 (2.4%) | $0 |
| 6-Person Families | 2 (0.4%) | $0 |
| 7+ Person Families | 0 (0.0%) | $0 |
| Total | 578 (100.0%) | $162,857 |
Family Income by Number of Earners in Sewall s Point
The median family income in Sewall s Point is $162,857, with families comprising 2 earners (181) having the highest median family income of $232,396, while families with 1 earner (200) have the lowest median family income of $120,000, accounting for 31.3% and 34.6% of families, respectively.
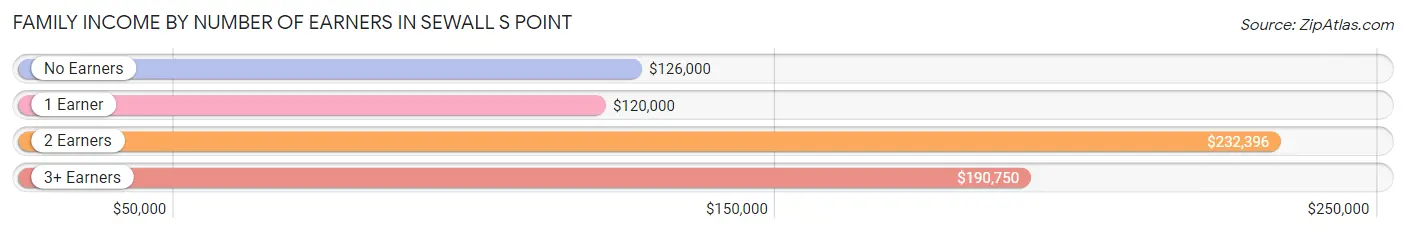
| Number of Earners | # Families | Median Income |
| No Earners | 178 (30.8%) | $126,000 |
| 1 Earner | 200 (34.6%) | $120,000 |
| 2 Earners | 181 (31.3%) | $232,396 |
| 3+ Earners | 19 (3.3%) | $190,750 |
| Total | 578 (100.0%) | $162,857 |
Household Income in Sewall s Point
Household Income Brackets in Sewall s Point
With 305 households falling in the category, the $200,000+ income range is the most frequent in Sewall s Point, accounting for 35.1% of all households.
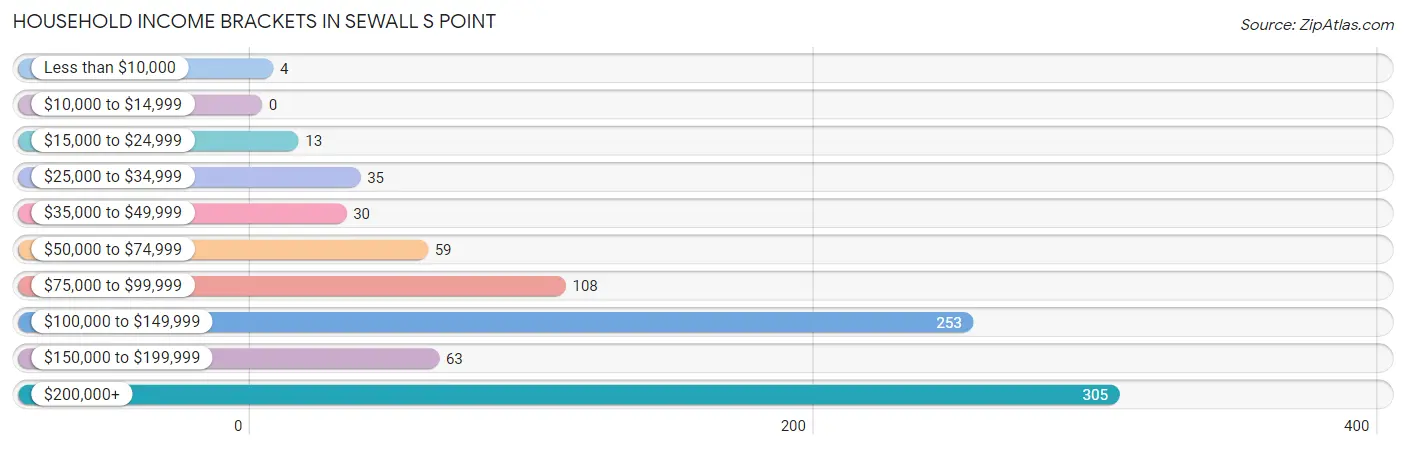
| Income Bracket | # Households | % Households |
| Less than $10,000 | 4 | 0.5% |
| $10,000 to $14,999 | 0 | 0.0% |
| $15,000 to $24,999 | 13 | 1.5% |
| $25,000 to $34,999 | 35 | 4.0% |
| $35,000 to $49,999 | 30 | 3.4% |
| $50,000 to $74,999 | 59 | 6.8% |
| $75,000 to $99,999 | 108 | 12.4% |
| $100,000 to $149,999 | 253 | 29.1% |
| $150,000 to $199,999 | 63 | 7.2% |
| $200,000+ | 305 | 35.1% |
Household Income by Householder Age in Sewall s Point
The median household income in Sewall s Point is $122,391, with the highest median household income of $192,891 found in the 45 to 64 years age bracket for the primary householder. A total of 293 households (33.7%) fall into this category. Meanwhile, the 15 to 24 years age bracket for the primary householder has the lowest median household income of $0, with 5 households (0.6%) in this group.
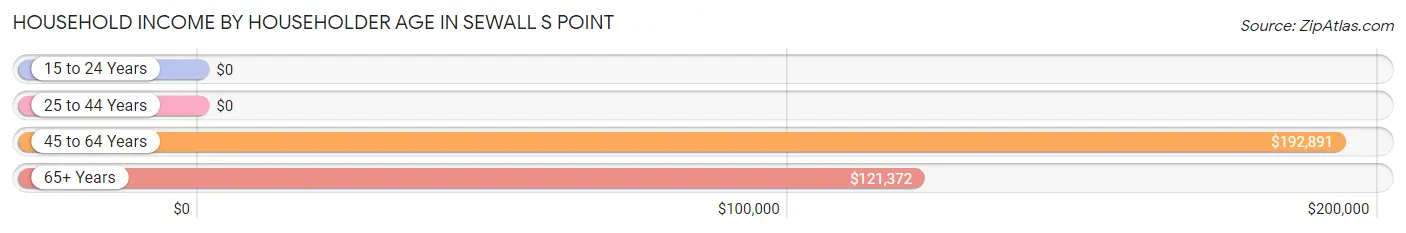
| Income Bracket | # Households | Median Income |
| 15 to 24 Years | 5 (0.6%) | $0 |
| 25 to 44 Years | 64 (7.4%) | $0 |
| 45 to 64 Years | 293 (33.7%) | $192,891 |
| 65+ Years | 508 (58.4%) | $121,372 |
| Total | 870 (100.0%) | $122,391 |
Poverty in Sewall s Point
Income Below Poverty by Sex and Age in Sewall s Point
With 0.4% poverty level for males and 1.9% for females among the residents of Sewall s Point, 55 to 64 year old males and 55 to 64 year old females are the most vulnerable to poverty, with 4 males (2.1%) and 9 females (6.1%) in their respective age groups living below the poverty level.
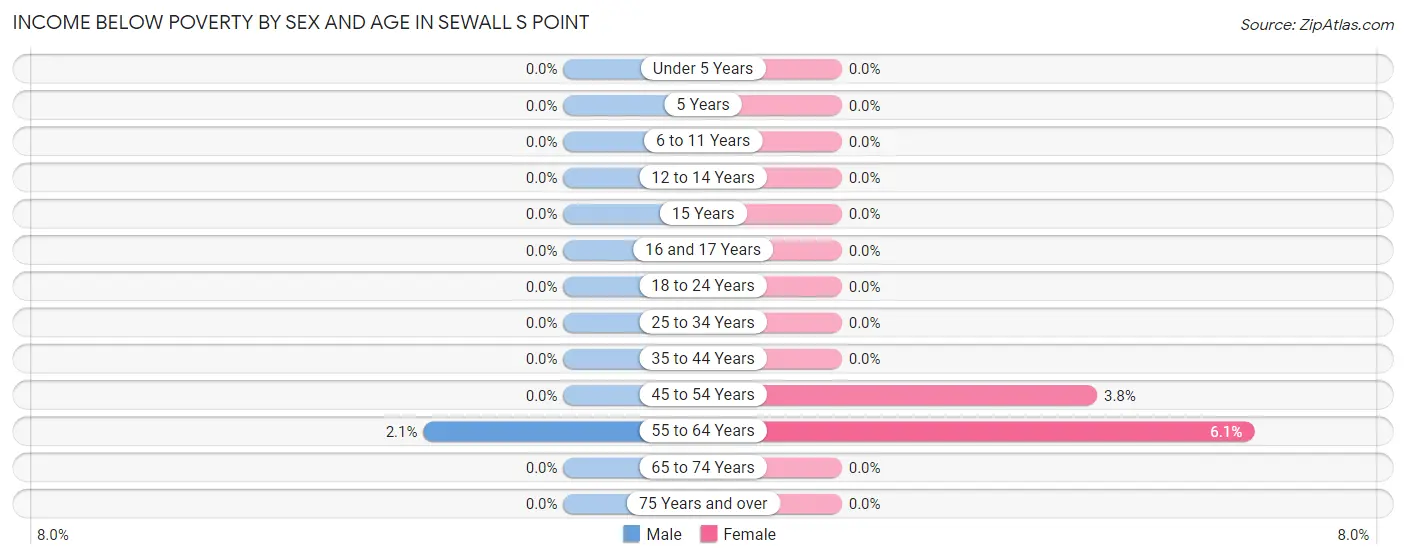
| Age Bracket | Male | Female |
| Under 5 Years | 0 (0.0%) | 0 (0.0%) |
| 5 Years | 0 (0.0%) | 0 (0.0%) |
| 6 to 11 Years | 0 (0.0%) | 0 (0.0%) |
| 12 to 14 Years | 0 (0.0%) | 0 (0.0%) |
| 15 Years | 0 (0.0%) | 0 (0.0%) |
| 16 and 17 Years | 0 (0.0%) | 0 (0.0%) |
| 18 to 24 Years | 0 (0.0%) | 0 (0.0%) |
| 25 to 34 Years | 0 (0.0%) | 0 (0.0%) |
| 35 to 44 Years | 0 (0.0%) | 0 (0.0%) |
| 45 to 54 Years | 0 (0.0%) | 8 (3.8%) |
| 55 to 64 Years | 4 (2.1%) | 9 (6.1%) |
| 65 to 74 Years | 0 (0.0%) | 0 (0.0%) |
| 75 Years and over | 0 (0.0%) | 0 (0.0%) |
| Total | 4 (0.4%) | 17 (1.9%) |
Income Above Poverty by Sex and Age in Sewall s Point
According to the poverty statistics in Sewall s Point, males aged under 5 years and females aged under 5 years are the age groups that are most secure financially, with 100.0% of males and 100.0% of females in these age groups living above the poverty line.
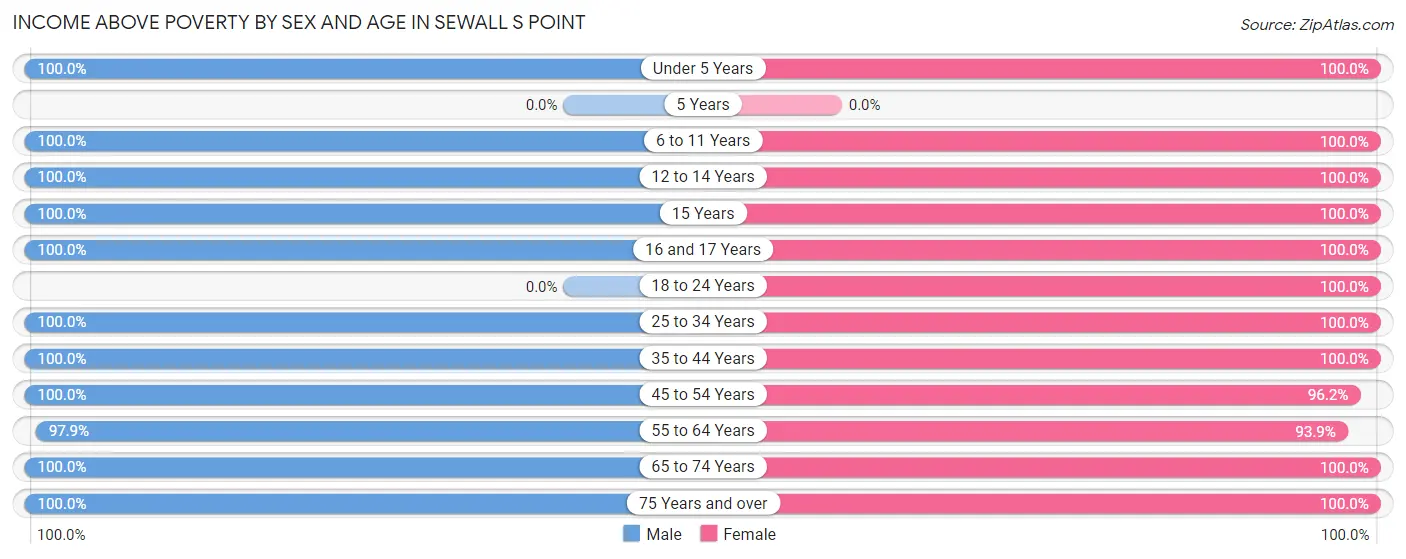
| Age Bracket | Male | Female |
| Under 5 Years | 30 (100.0%) | 6 (100.0%) |
| 5 Years | 0 (0.0%) | 0 (0.0%) |
| 6 to 11 Years | 70 (100.0%) | 32 (100.0%) |
| 12 to 14 Years | 17 (100.0%) | 19 (100.0%) |
| 15 Years | 15 (100.0%) | 3 (100.0%) |
| 16 and 17 Years | 24 (100.0%) | 44 (100.0%) |
| 18 to 24 Years | 0 (0.0%) | 28 (100.0%) |
| 25 to 34 Years | 47 (100.0%) | 31 (100.0%) |
| 35 to 44 Years | 46 (100.0%) | 52 (100.0%) |
| 45 to 54 Years | 81 (100.0%) | 203 (96.2%) |
| 55 to 64 Years | 188 (97.9%) | 138 (93.9%) |
| 65 to 74 Years | 341 (100.0%) | 171 (100.0%) |
| 75 Years and over | 157 (100.0%) | 158 (100.0%) |
| Total | 1,016 (99.6%) | 885 (98.1%) |
Income Below Poverty Among Married-Couple Families in Sewall s Point
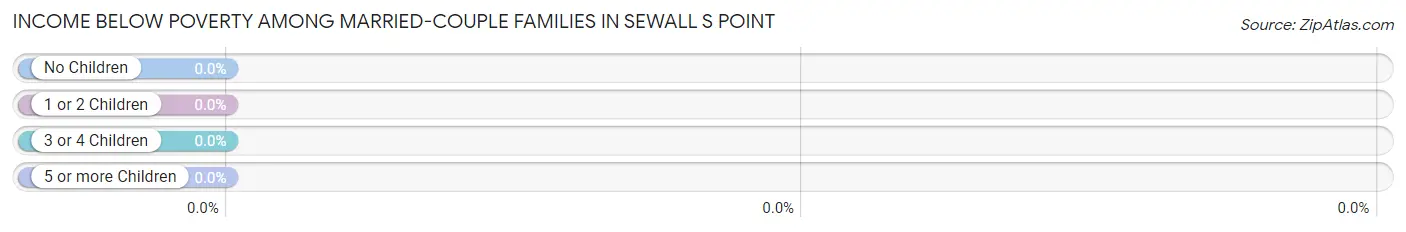
| Children | Above Poverty | Below Poverty |
| No Children | 453 (100.0%) | 0 (0.0%) |
| 1 or 2 Children | 97 (100.0%) | 0 (0.0%) |
| 3 or 4 Children | 8 (100.0%) | 0 (0.0%) |
| 5 or more Children | 0 (0.0%) | 0 (0.0%) |
| Total | 558 (100.0%) | 0 (0.0%) |
Income Below Poverty Among Single-Parent Households in Sewall s Point
| Children | Single Father | Single Mother |
| No Children | 0 (0.0%) | 0 (0.0%) |
| 1 or 2 Children | 0 (0.0%) | 0 (0.0%) |
| 3 or 4 Children | 0 (0.0%) | 0 (0.0%) |
| 5 or more Children | 0 (0.0%) | 0 (0.0%) |
| Total | 0 (0.0%) | 0 (0.0%) |
Income Below Poverty Among Married-Couple vs Single-Parent Households in Sewall s Point
| Children | Married-Couple Families | Single-Parent Households |
| No Children | 0 (0.0%) | 0 (0.0%) |
| 1 or 2 Children | 0 (0.0%) | 0 (0.0%) |
| 3 or 4 Children | 0 (0.0%) | 0 (0.0%) |
| 5 or more Children | 0 (0.0%) | 0 (0.0%) |
| Total | 0 (0.0%) | 0 (0.0%) |
Race in Sewall s Point
The most populous races in Sewall s Point are White / Caucasian (1,732 | 90.1%), Hispanic or Latino (134 | 7.0%), and Two or more Races (107 | 5.6%).
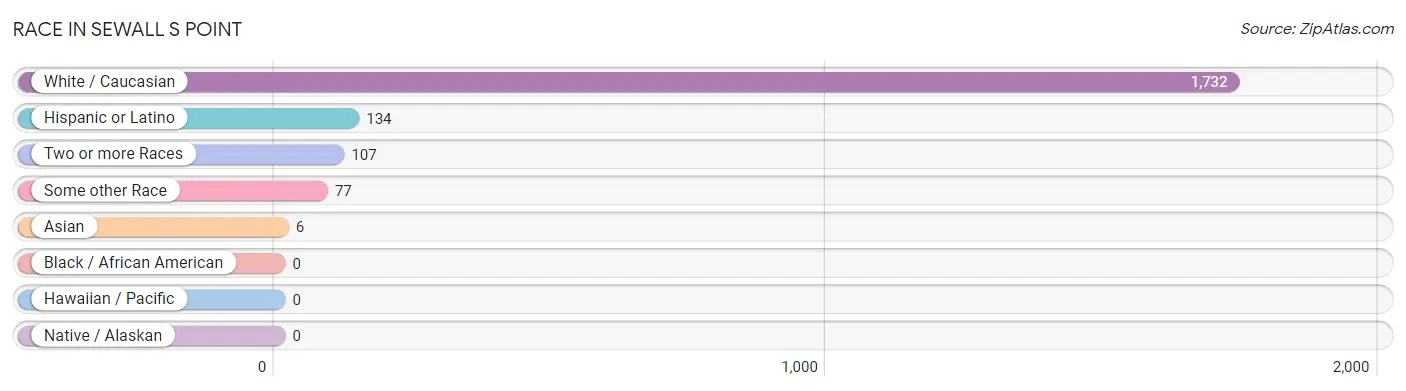
| Race | # Population | % Population |
| Asian | 6 | 0.3% |
| Black / African American | 0 | 0.0% |
| Hawaiian / Pacific | 0 | 0.0% |
| Hispanic or Latino | 134 | 7.0% |
| Native / Alaskan | 0 | 0.0% |
| White / Caucasian | 1,732 | 90.1% |
| Two or more Races | 107 | 5.6% |
| Some other Race | 77 | 4.0% |
| Total | 1,922 | 100.0% |
Ancestry in Sewall s Point
The most populous ancestries reported in Sewall s Point are Irish (329 | 17.1%), English (264 | 13.7%), German (232 | 12.1%), Italian (191 | 9.9%), and Scottish (180 | 9.4%), together accounting for 62.2% of all Sewall s Point residents.
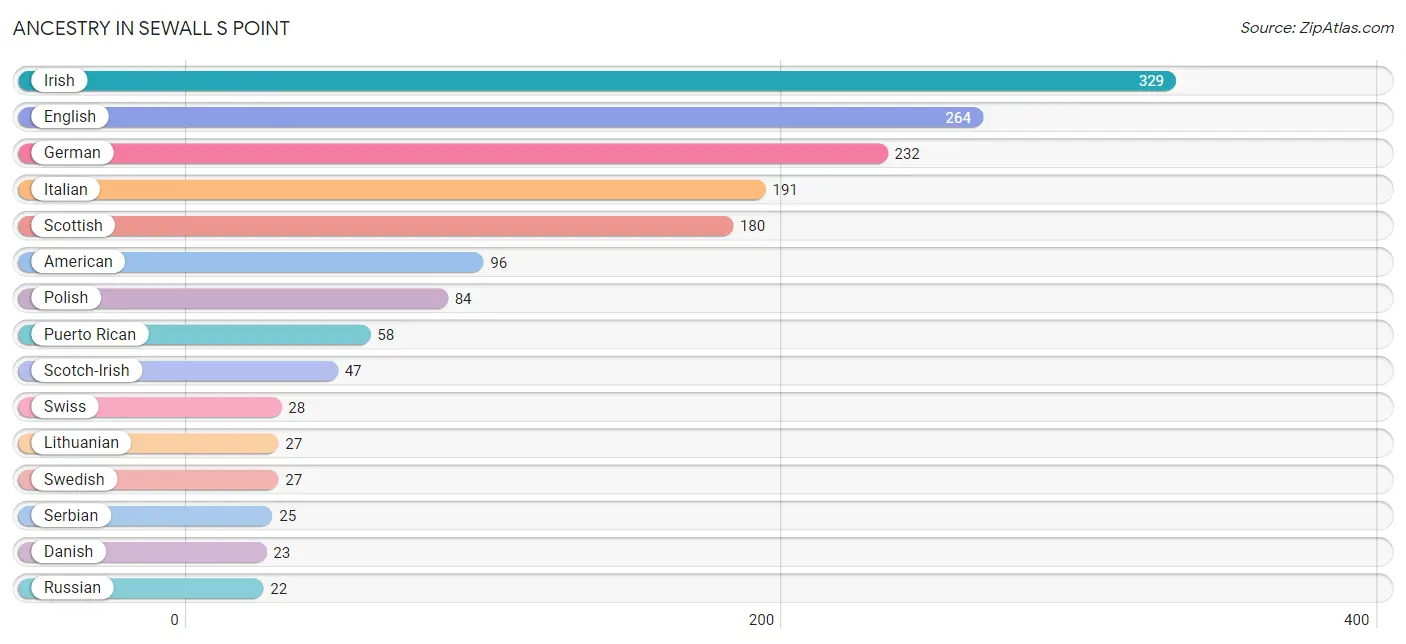
| Ancestry | # Population | % Population |
| American | 96 | 5.0% |
| Arab | 13 | 0.7% |
| Austrian | 11 | 0.6% |
| Brazilian | 15 | 0.8% |
| British | 14 | 0.7% |
| Canadian | 13 | 0.7% |
| Cherokee | 4 | 0.2% |
| Cuban | 15 | 0.8% |
| Danish | 23 | 1.2% |
| Dutch | 7 | 0.4% |
| Eastern European | 9 | 0.5% |
| English | 264 | 13.7% |
| European | 17 | 0.9% |
| Finnish | 10 | 0.5% |
| French | 21 | 1.1% |
| German | 232 | 12.1% |
| Greek | 6 | 0.3% |
| Hungarian | 16 | 0.8% |
| Irish | 329 | 17.1% |
| Italian | 191 | 9.9% |
| Korean | 15 | 0.8% |
| Latvian | 13 | 0.7% |
| Lebanese | 8 | 0.4% |
| Lithuanian | 27 | 1.4% |
| Mexican | 7 | 0.4% |
| Northern European | 7 | 0.4% |
| Norwegian | 17 | 0.9% |
| Palestinian | 5 | 0.3% |
| Polish | 84 | 4.4% |
| Puerto Rican | 58 | 3.0% |
| Romanian | 10 | 0.5% |
| Russian | 22 | 1.1% |
| Scandinavian | 18 | 0.9% |
| Scotch-Irish | 47 | 2.5% |
| Scottish | 180 | 9.4% |
| Serbian | 25 | 1.3% |
| South American | 17 | 0.9% |
| Spaniard | 4 | 0.2% |
| Spanish | 7 | 0.4% |
| Swedish | 27 | 1.4% |
| Swiss | 28 | 1.5% |
| Ukrainian | 11 | 0.6% |
| Venezuelan | 17 | 0.9% |
| Welsh | 16 | 0.8% | View All 44 Rows |
Immigrants in Sewall s Point
The most numerous immigrant groups reported in Sewall s Point came from Europe (82 | 4.3%), Latin America (57 | 3.0%), Northern Europe (37 | 1.9%), Asia (36 | 1.9%), and Western Europe (35 | 1.8%), together accounting for 12.9% of all Sewall s Point residents.
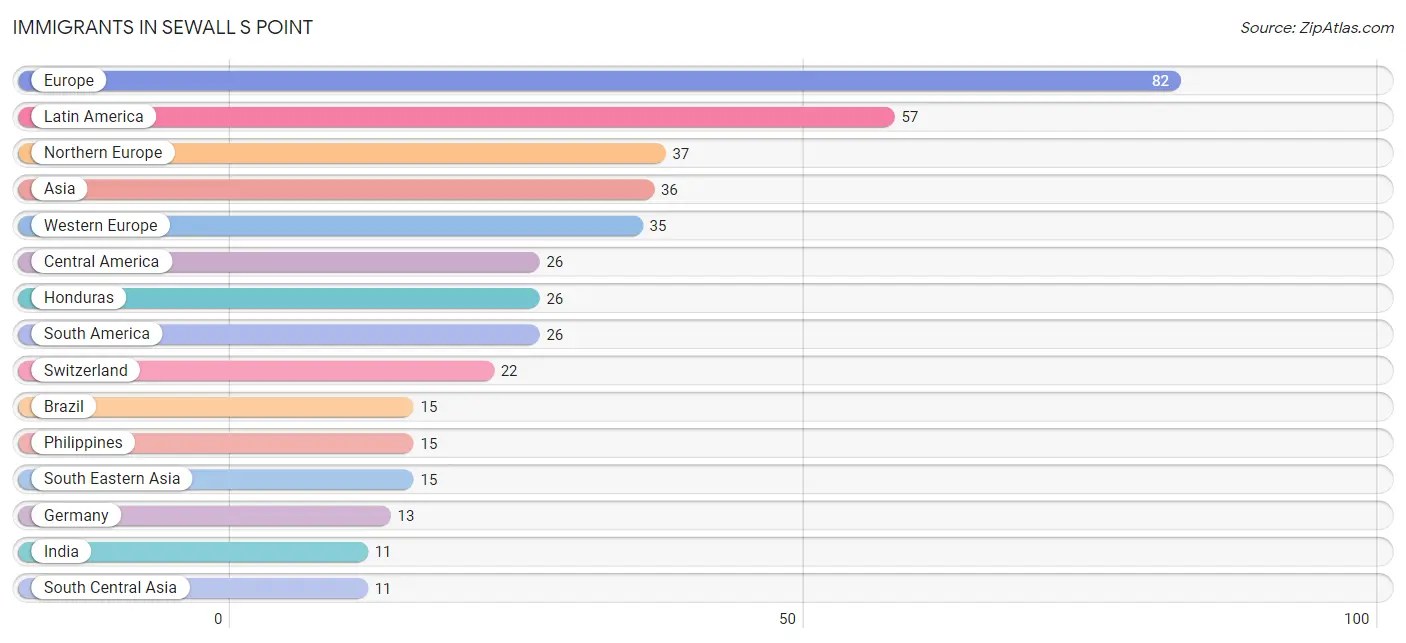
| Immigration Origin | # Population | % Population |
| Asia | 36 | 1.9% |
| Brazil | 15 | 0.8% |
| Caribbean | 5 | 0.3% |
| Central America | 26 | 1.3% |
| Cuba | 5 | 0.3% |
| Denmark | 4 | 0.2% |
| Eastern Europe | 10 | 0.5% |
| England | 5 | 0.3% |
| Europe | 82 | 4.3% |
| Germany | 13 | 0.7% |
| Honduras | 26 | 1.3% |
| India | 11 | 0.6% |
| Latin America | 57 | 3.0% |
| Lebanon | 4 | 0.2% |
| Northern Europe | 37 | 1.9% |
| Philippines | 15 | 0.8% |
| Serbia | 10 | 0.5% |
| South America | 26 | 1.3% |
| South Central Asia | 11 | 0.6% |
| South Eastern Asia | 15 | 0.8% |
| Sweden | 8 | 0.4% |
| Switzerland | 22 | 1.1% |
| Turkey | 6 | 0.3% |
| Venezuela | 11 | 0.6% |
| Western Asia | 10 | 0.5% |
| Western Europe | 35 | 1.8% | View All 26 Rows |
Sex and Age in Sewall s Point
Sex and Age in Sewall s Point
The most populous age groups in Sewall s Point are 65 to 69 Years (231 | 22.7%) for men and 50 to 54 Years (169 | 18.7%) for women.
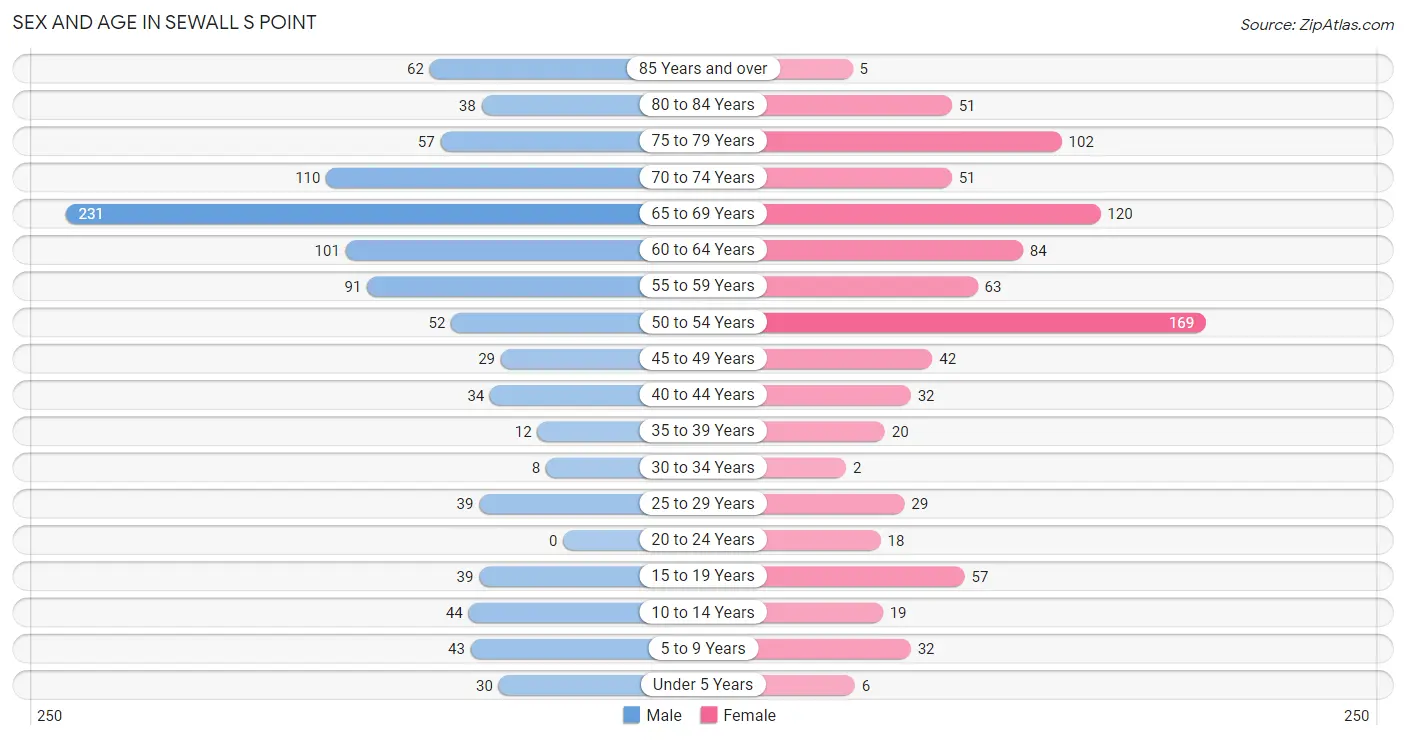
| Age Bracket | Male | Female |
| Under 5 Years | 30 (2.9%) | 6 (0.7%) |
| 5 to 9 Years | 43 (4.2%) | 32 (3.5%) |
| 10 to 14 Years | 44 (4.3%) | 19 (2.1%) |
| 15 to 19 Years | 39 (3.8%) | 57 (6.3%) |
| 20 to 24 Years | 0 (0.0%) | 18 (2.0%) |
| 25 to 29 Years | 39 (3.8%) | 29 (3.2%) |
| 30 to 34 Years | 8 (0.8%) | 2 (0.2%) |
| 35 to 39 Years | 12 (1.2%) | 20 (2.2%) |
| 40 to 44 Years | 34 (3.3%) | 32 (3.5%) |
| 45 to 49 Years | 29 (2.8%) | 42 (4.7%) |
| 50 to 54 Years | 52 (5.1%) | 169 (18.7%) |
| 55 to 59 Years | 91 (8.9%) | 63 (7.0%) |
| 60 to 64 Years | 101 (9.9%) | 84 (9.3%) |
| 65 to 69 Years | 231 (22.7%) | 120 (13.3%) |
| 70 to 74 Years | 110 (10.8%) | 51 (5.7%) |
| 75 to 79 Years | 57 (5.6%) | 102 (11.3%) |
| 80 to 84 Years | 38 (3.7%) | 51 (5.7%) |
| 85 Years and over | 62 (6.1%) | 5 (0.5%) |
| Total | 1,020 (100.0%) | 902 (100.0%) |
Families and Households in Sewall s Point
Median Family Size in Sewall s Point
The median family size in Sewall s Point is 2.62 persons per family, with single male/father families (13 | 2.2%) accounting for the largest median family size of 4.54 persons per family. On the other hand, single female/mother families (7 | 1.2%) represent the smallest median family size with 2.43 persons per family.
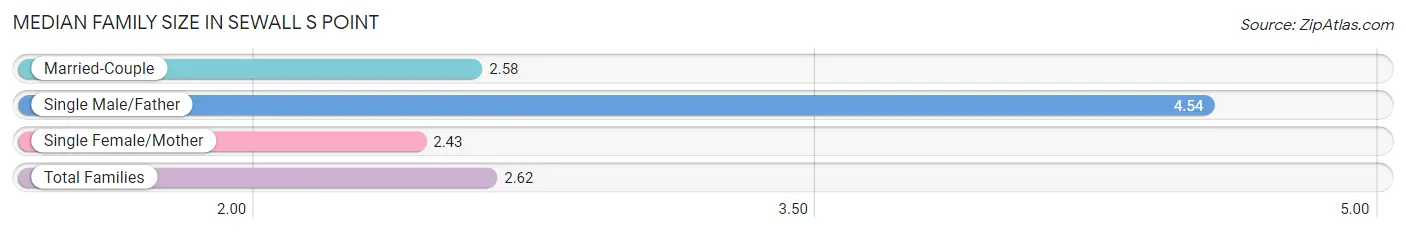
| Family Type | # Families | Family Size |
| Married-Couple | 558 (96.5%) | 2.58 |
| Single Male/Father | 13 (2.2%) | 4.54 |
| Single Female/Mother | 7 (1.2%) | 2.43 |
| Total Families | 578 (100.0%) | 2.62 |
Median Household Size in Sewall s Point
The median household size in Sewall s Point is 2.21 persons per household, with single male/father households (13 | 1.5%) accounting for the largest median household size of 4.54 persons per household. non-family households (292 | 33.6%) represent the smallest median household size with 1.39 persons per household.
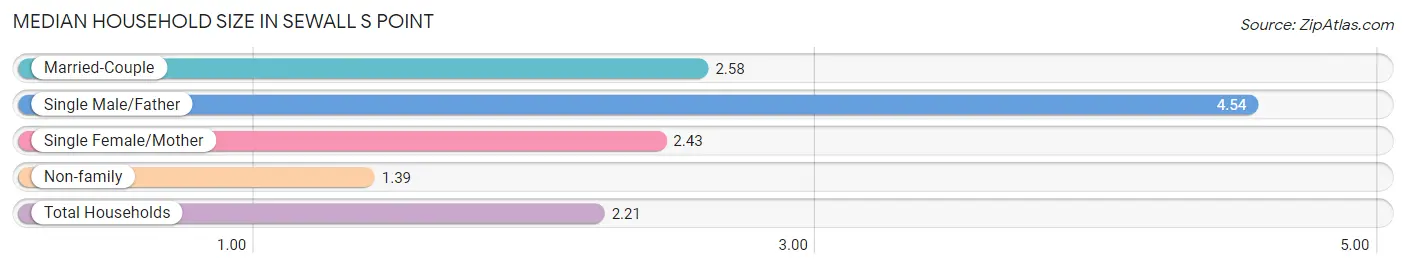
| Household Type | # Households | Household Size |
| Married-Couple | 558 (64.1%) | 2.58 |
| Single Male/Father | 13 (1.5%) | 4.54 |
| Single Female/Mother | 7 (0.8%) | 2.43 |
| Non-family | 292 (33.6%) | 1.39 |
| Total Households | 870 (100.0%) | 2.21 |
Household Size by Marriage Status in Sewall s Point
Out of a total of 870 households in Sewall s Point, 578 (66.4%) are family households, while 292 (33.6%) are nonfamily households. The most numerous type of family households are 2-person households, comprising 419, and the most common type of nonfamily households are 2-person households, comprising 162.
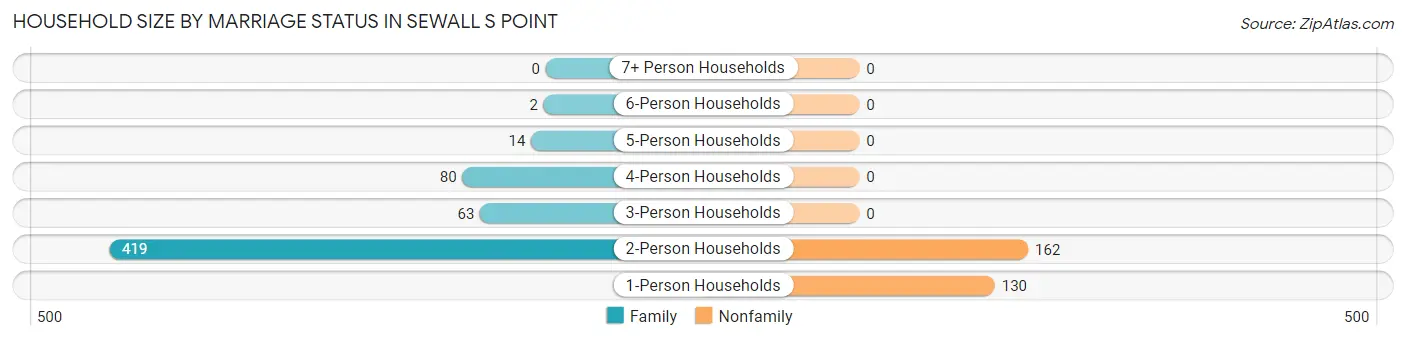
| Household Size | Family Households | Nonfamily Households |
| 1-Person Households | - | 130 (14.9%) |
| 2-Person Households | 419 (48.2%) | 162 (18.6%) |
| 3-Person Households | 63 (7.2%) | 0 (0.0%) |
| 4-Person Households | 80 (9.2%) | 0 (0.0%) |
| 5-Person Households | 14 (1.6%) | 0 (0.0%) |
| 6-Person Households | 2 (0.2%) | 0 (0.0%) |
| 7+ Person Households | 0 (0.0%) | 0 (0.0%) |
| Total | 578 (66.4%) | 292 (33.6%) |
Female Fertility in Sewall s Point
Fertility by Age in Sewall s Point
| Age Bracket | Women with Births | Births / 1,000 Women |
| 15 to 19 years | 0 (0.0%) | 0.0 |
| 20 to 34 years | 0 (0.0%) | 0.0 |
| 35 to 50 years | 0 (0.0%) | 0.0 |
| Total | 0 (0.0%) | 0.0 |
Fertility by Age by Marriage Status in Sewall s Point
| Age Bracket | Married | Unmarried |
| 15 to 19 years | 0 (0.0%) | 0 (0.0%) |
| 20 to 34 years | 0 (0.0%) | 0 (0.0%) |
| 35 to 50 years | 0 (0.0%) | 0 (0.0%) |
| Total | 0 (0.0%) | 0 (0.0%) |
Fertility by Education in Sewall s Point
| Educational Attainment | Women with Births | Births / 1,000 Women |
| Less than High School | 0 (0.0%) | 0.0 |
| High School Diploma | 0 (0.0%) | 0.0 |
| College or Associate's Degree | 0 (0.0%) | 0.0 |
| Bachelor's Degree | 0 (0.0%) | 0.0 |
| Graduate Degree | 0 (0.0%) | 0.0 |
| Total | 0 (0.0%) | 0.0 |
Fertility by Education by Marriage Status in Sewall s Point
| Educational Attainment | Married | Unmarried |
| Less than High School | 0 (0.0%) | 0 (0.0%) |
| High School Diploma | 0 (0.0%) | 0 (0.0%) |
| College or Associate's Degree | 0 (0.0%) | 0 (0.0%) |
| Bachelor's Degree | 0 (0.0%) | 0 (0.0%) |
| Graduate Degree | 0 (0.0%) | 0 (0.0%) |
| Total | 0 (0.0%) | 0 (0.0%) |
Employment Characteristics in Sewall s Point
Employment by Class of Employer in Sewall s Point
Among the 897 employed individuals in Sewall s Point, private company employees (544 | 60.7%), self-employed (incorporated) (167 | 18.6%), and self-employed (not incorporated) (64 | 7.1%) make up the most common classes of employment.
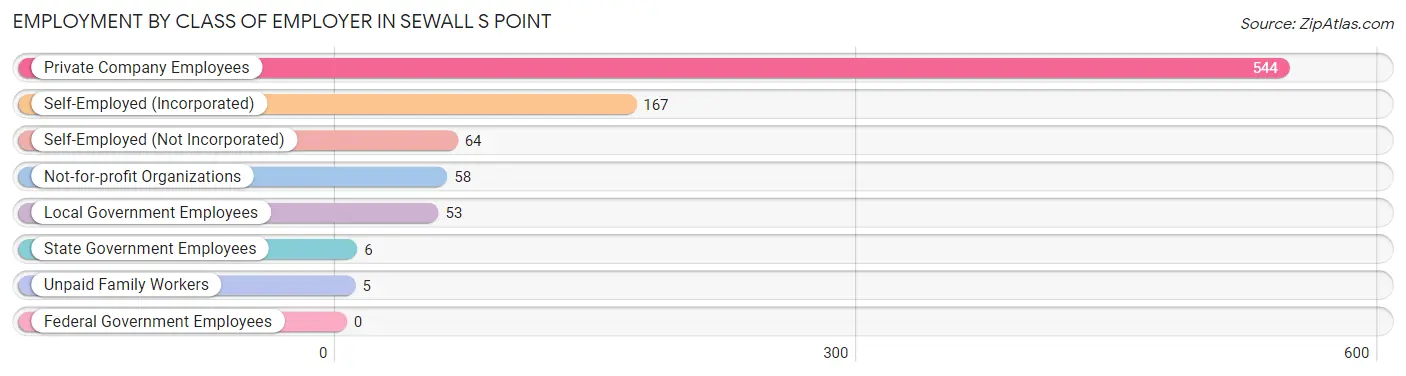
| Employer Class | # Employees | % Employees |
| Private Company Employees | 544 | 60.7% |
| Self-Employed (Incorporated) | 167 | 18.6% |
| Self-Employed (Not Incorporated) | 64 | 7.1% |
| Not-for-profit Organizations | 58 | 6.5% |
| Local Government Employees | 53 | 5.9% |
| State Government Employees | 6 | 0.7% |
| Federal Government Employees | 0 | 0.0% |
| Unpaid Family Workers | 5 | 0.6% |
| Total | 897 | 100.0% |
Employment Status by Age in Sewall s Point
According to the labor force statistics for Sewall s Point, out of the total population over 16 years of age (1,730), 53.4% or 924 individuals are in the labor force, with 2.1% or 19 of them unemployed. The age group with the highest labor force participation rate is 30 to 34 years, with 100.0% or 10 individuals in the labor force. Within the labor force, the 25 to 29 years age range has the highest percentage of unemployed individuals, with 22.0% or 13 of them being unemployed.
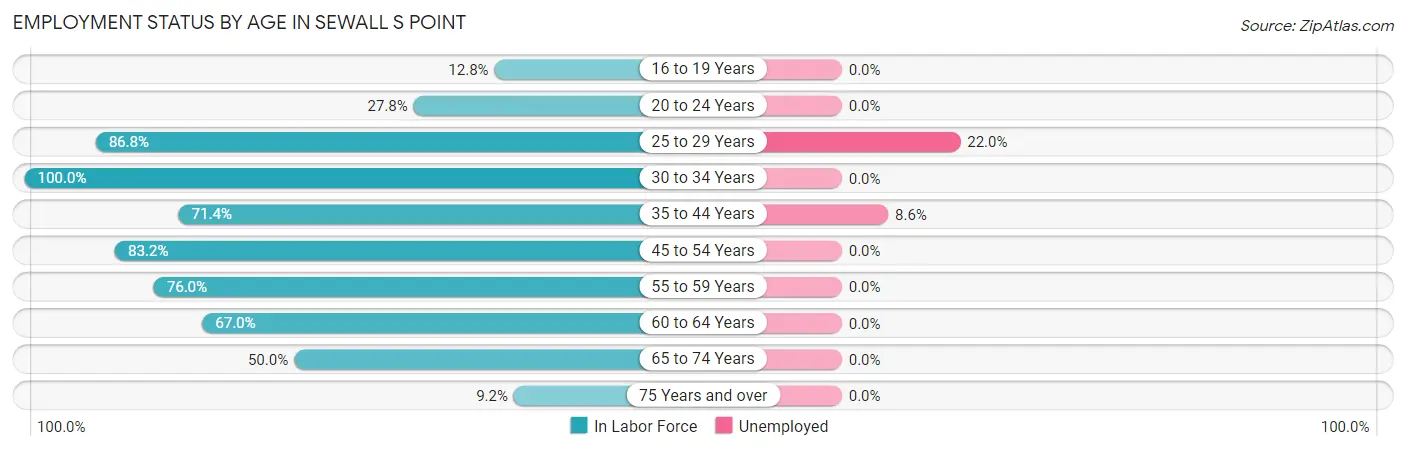
| Age Bracket | In Labor Force | Unemployed |
| 16 to 19 Years | 10 (12.8%) | 0 (0.0%) |
| 20 to 24 Years | 5 (27.8%) | 0 (0.0%) |
| 25 to 29 Years | 59 (86.8%) | 13 (22.0%) |
| 30 to 34 Years | 10 (100.0%) | 0 (0.0%) |
| 35 to 44 Years | 70 (71.4%) | 6 (8.6%) |
| 45 to 54 Years | 243 (83.2%) | 0 (0.0%) |
| 55 to 59 Years | 117 (76.0%) | 0 (0.0%) |
| 60 to 64 Years | 124 (67.0%) | 0 (0.0%) |
| 65 to 74 Years | 256 (50.0%) | 0 (0.0%) |
| 75 Years and over | 29 (9.2%) | 0 (0.0%) |
| Total | 924 (53.4%) | 19 (2.1%) |
Employment Status by Educational Attainment in Sewall s Point
According to labor force statistics for Sewall s Point, 77.2% of individuals (623) out of the total population between 25 and 64 years of age (807) are in the labor force, with 3.0% or 19 of them being unemployed. The group with the highest labor force participation rate are those with the educational attainment of bachelor's degree or higher, with 82.7% or 464 individuals in the labor force. Within the labor force, individuals with bachelor's degree or higher education have the highest percentage of unemployment, with 4.1% or 19 of them being unemployed.
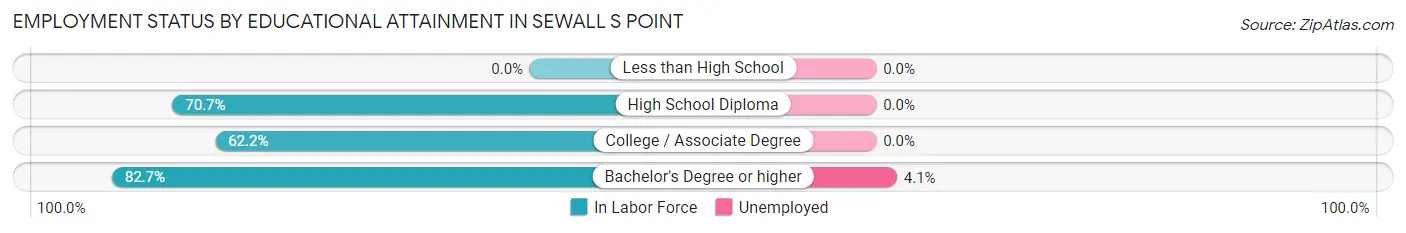
| Educational Attainment | In Labor Force | Unemployed |
| Less than High School | 0 (0.0%) | 0 (0.0%) |
| High School Diploma | 70 (70.7%) | 0 (0.0%) |
| College / Associate Degree | 89 (62.2%) | 0 (0.0%) |
| Bachelor's Degree or higher | 464 (82.7%) | 23 (4.1%) |
| Total | 623 (77.2%) | 24 (3.0%) |
Employment Occupations by Sex in Sewall s Point
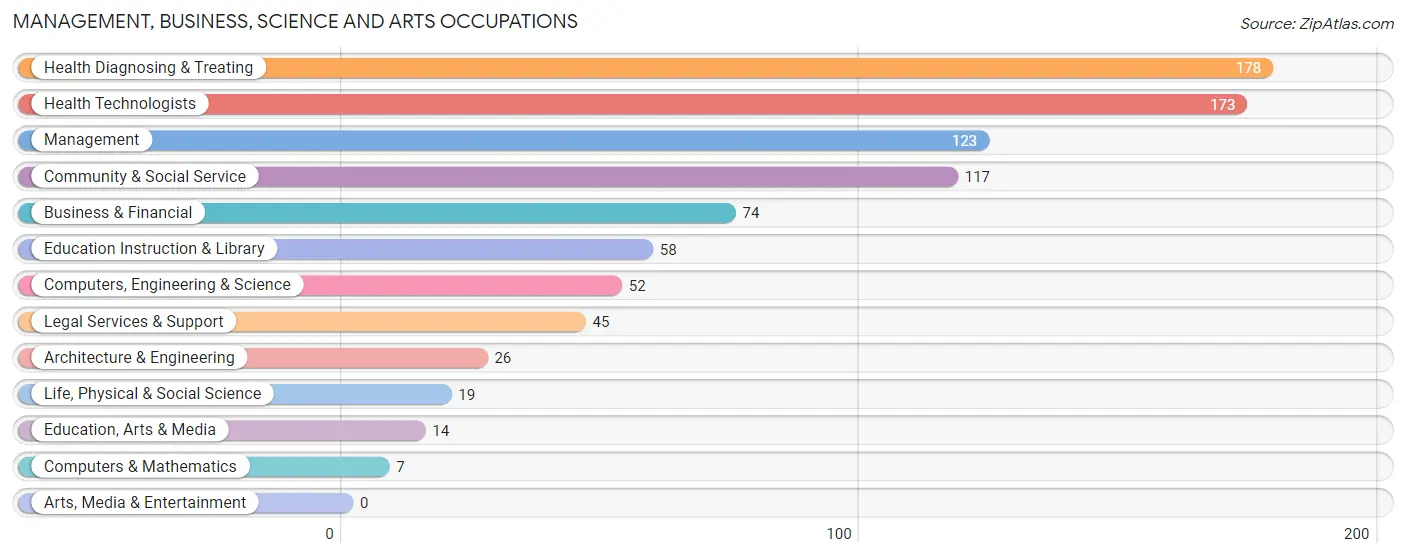
Management, Business, Science and Arts Occupations
The most common Management, Business, Science and Arts occupations in Sewall s Point are Health Diagnosing & Treating (178 | 19.7%), Health Technologists (173 | 19.1%), Management (123 | 13.6%), Community & Social Service (117 | 12.9%), and Business & Financial (74 | 8.2%).
Management, Business, Science and Arts Occupations by Sex
Within the Management, Business, Science and Arts occupations in Sewall s Point, the most male-oriented occupations are Computers & Mathematics (100.0%), Education, Arts & Media (100.0%), and Legal Services & Support (88.9%), while the most female-oriented occupations are Life, Physical & Social Science (100.0%), Health Technologists (65.3%), and Health Diagnosing & Treating (63.5%).
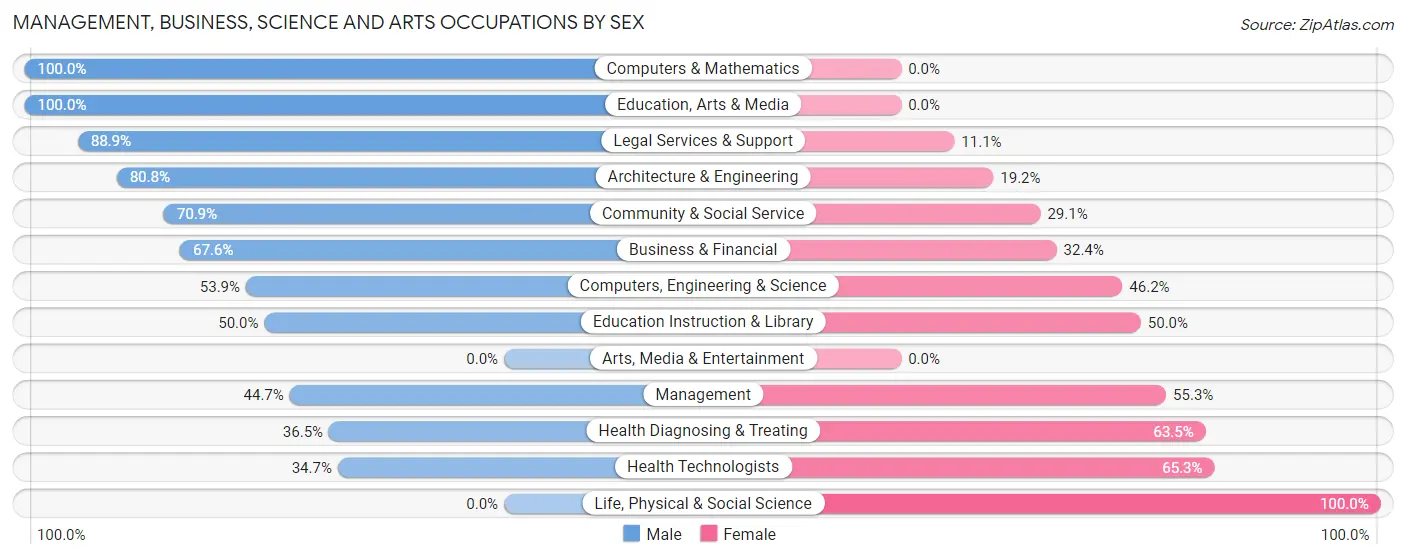
| Occupation | Male | Female |
| Management | 55 (44.7%) | 68 (55.3%) |
| Business & Financial | 50 (67.6%) | 24 (32.4%) |
| Computers, Engineering & Science | 28 (53.8%) | 24 (46.2%) |
| Computers & Mathematics | 7 (100.0%) | 0 (0.0%) |
| Architecture & Engineering | 21 (80.8%) | 5 (19.2%) |
| Life, Physical & Social Science | 0 (0.0%) | 19 (100.0%) |
| Community & Social Service | 83 (70.9%) | 34 (29.1%) |
| Education, Arts & Media | 14 (100.0%) | 0 (0.0%) |
| Legal Services & Support | 40 (88.9%) | 5 (11.1%) |
| Education Instruction & Library | 29 (50.0%) | 29 (50.0%) |
| Arts, Media & Entertainment | 0 (0.0%) | 0 (0.0%) |
| Health Diagnosing & Treating | 65 (36.5%) | 113 (63.5%) |
| Health Technologists | 60 (34.7%) | 113 (65.3%) |
| Total (Category) | 281 (51.6%) | 263 (48.3%) |
| Total (Overall) | 532 (58.9%) | 372 (41.1%) |
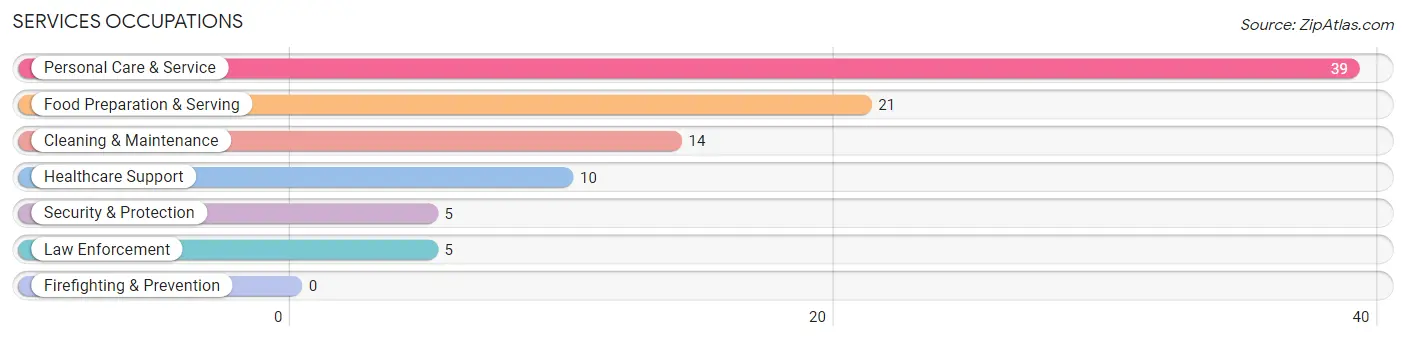
Services Occupations
The most common Services occupations in Sewall s Point are Personal Care & Service (39 | 4.3%), Food Preparation & Serving (21 | 2.3%), Cleaning & Maintenance (14 | 1.5%), Healthcare Support (10 | 1.1%), and Security & Protection (5 | 0.5%).
Services Occupations by Sex
Within the Services occupations in Sewall s Point, the most male-oriented occupations are Security & Protection (100.0%), Law Enforcement (100.0%), and Food Preparation & Serving (100.0%), while the most female-oriented occupations are Healthcare Support (100.0%), and Personal Care & Service (48.7%).
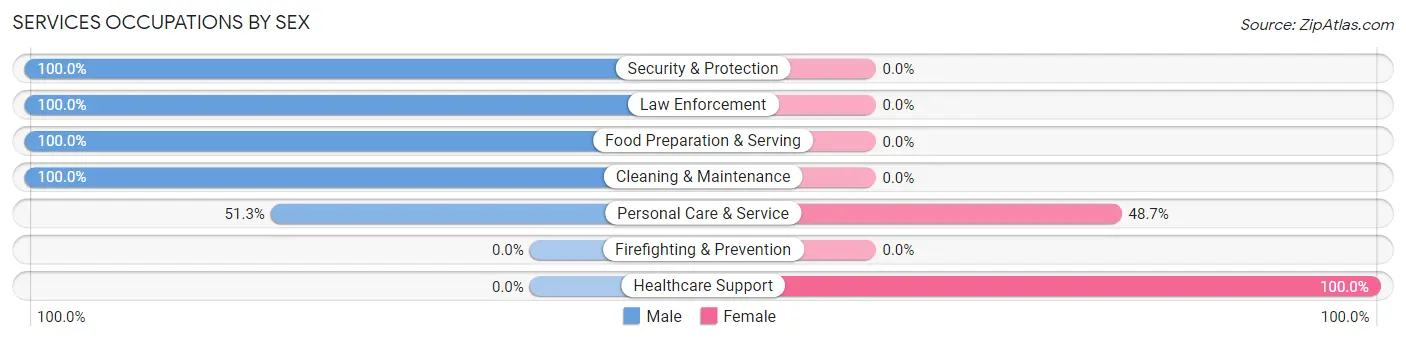
| Occupation | Male | Female |
| Healthcare Support | 0 (0.0%) | 10 (100.0%) |
| Security & Protection | 5 (100.0%) | 0 (0.0%) |
| Firefighting & Prevention | 0 (0.0%) | 0 (0.0%) |
| Law Enforcement | 5 (100.0%) | 0 (0.0%) |
| Food Preparation & Serving | 21 (100.0%) | 0 (0.0%) |
| Cleaning & Maintenance | 14 (100.0%) | 0 (0.0%) |
| Personal Care & Service | 20 (51.3%) | 19 (48.7%) |
| Total (Category) | 60 (67.4%) | 29 (32.6%) |
| Total (Overall) | 532 (58.9%) | 372 (41.1%) |
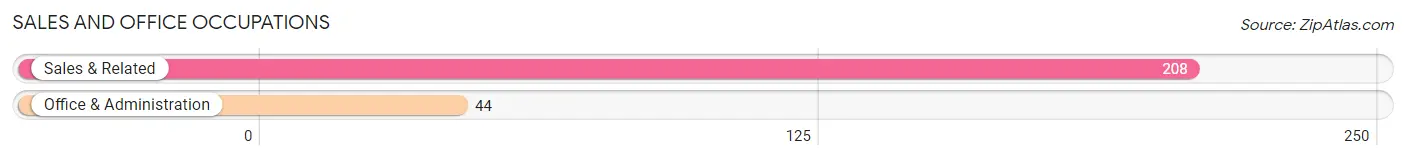
Sales and Office Occupations
The most common Sales and Office occupations in Sewall s Point are Sales & Related (208 | 23.0%), and Office & Administration (44 | 4.9%).
Sales and Office Occupations by Sex
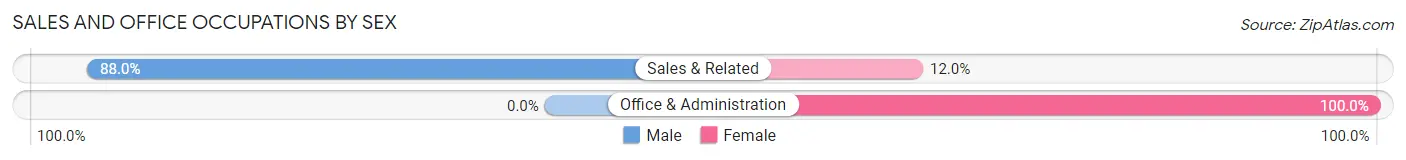
| Occupation | Male | Female |
| Sales & Related | 183 (88.0%) | 25 (12.0%) |
| Office & Administration | 0 (0.0%) | 44 (100.0%) |
| Total (Category) | 183 (72.6%) | 69 (27.4%) |
| Total (Overall) | 532 (58.9%) | 372 (41.1%) |
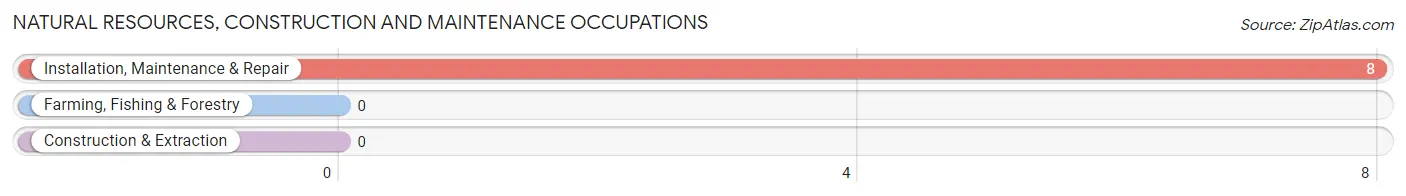
Natural Resources, Construction and Maintenance Occupations
The most common Natural Resources, Construction and Maintenance occupations in Sewall s Point are , and Installation, Maintenance & Repair (8 | 0.9%).
Natural Resources, Construction and Maintenance Occupations by Sex
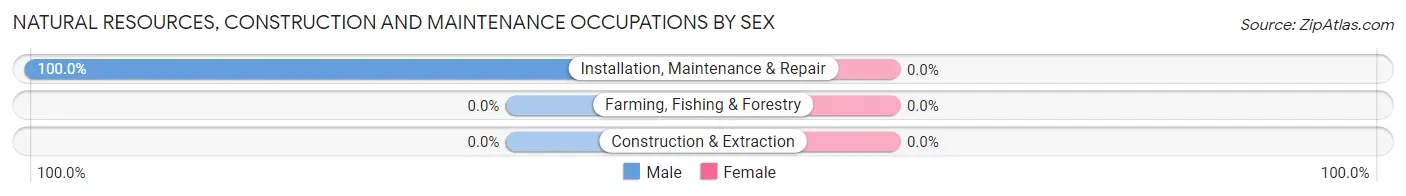
| Occupation | Male | Female |
| Farming, Fishing & Forestry | 0 (0.0%) | 0 (0.0%) |
| Construction & Extraction | 0 (0.0%) | 0 (0.0%) |
| Installation, Maintenance & Repair | 8 (100.0%) | 0 (0.0%) |
| Total (Category) | 8 (100.0%) | 0 (0.0%) |
| Total (Overall) | 532 (58.9%) | 372 (41.1%) |
Production, Transportation and Moving Occupations
The most common Production, Transportation and Moving occupations in Sewall s Point are , and Transportation (11 | 1.2%).
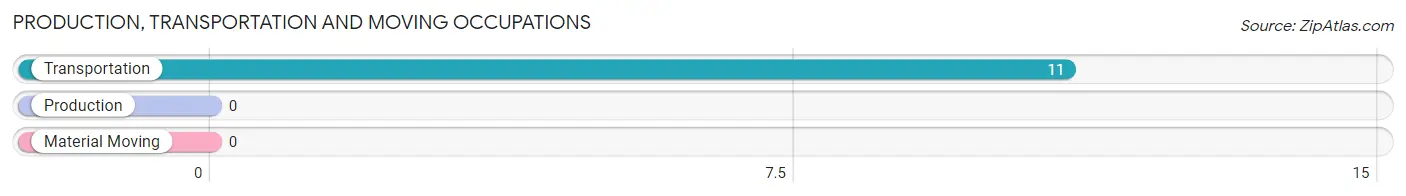
Production, Transportation and Moving Occupations by Sex
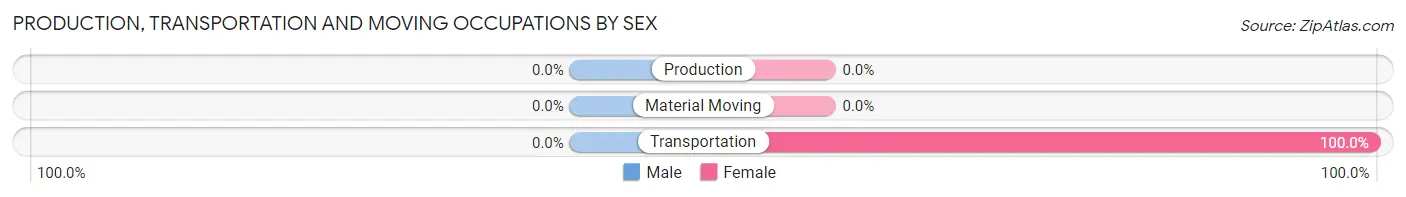
| Occupation | Male | Female |
| Production | 0 (0.0%) | 0 (0.0%) |
| Transportation | 0 (0.0%) | 11 (100.0%) |
| Material Moving | 0 (0.0%) | 0 (0.0%) |
| Total (Category) | 0 (0.0%) | 11 (100.0%) |
| Total (Overall) | 532 (58.9%) | 372 (41.1%) |
Employment Industries by Sex in Sewall s Point
Employment Industries in Sewall s Point
The major employment industries in Sewall s Point include Health Care & Social Assistance (224 | 24.8%), Retail Trade (156 | 17.3%), Professional & Scientific (125 | 13.8%), Educational Services (73 | 8.1%), and Real Estate, Rental & Leasing (51 | 5.6%).
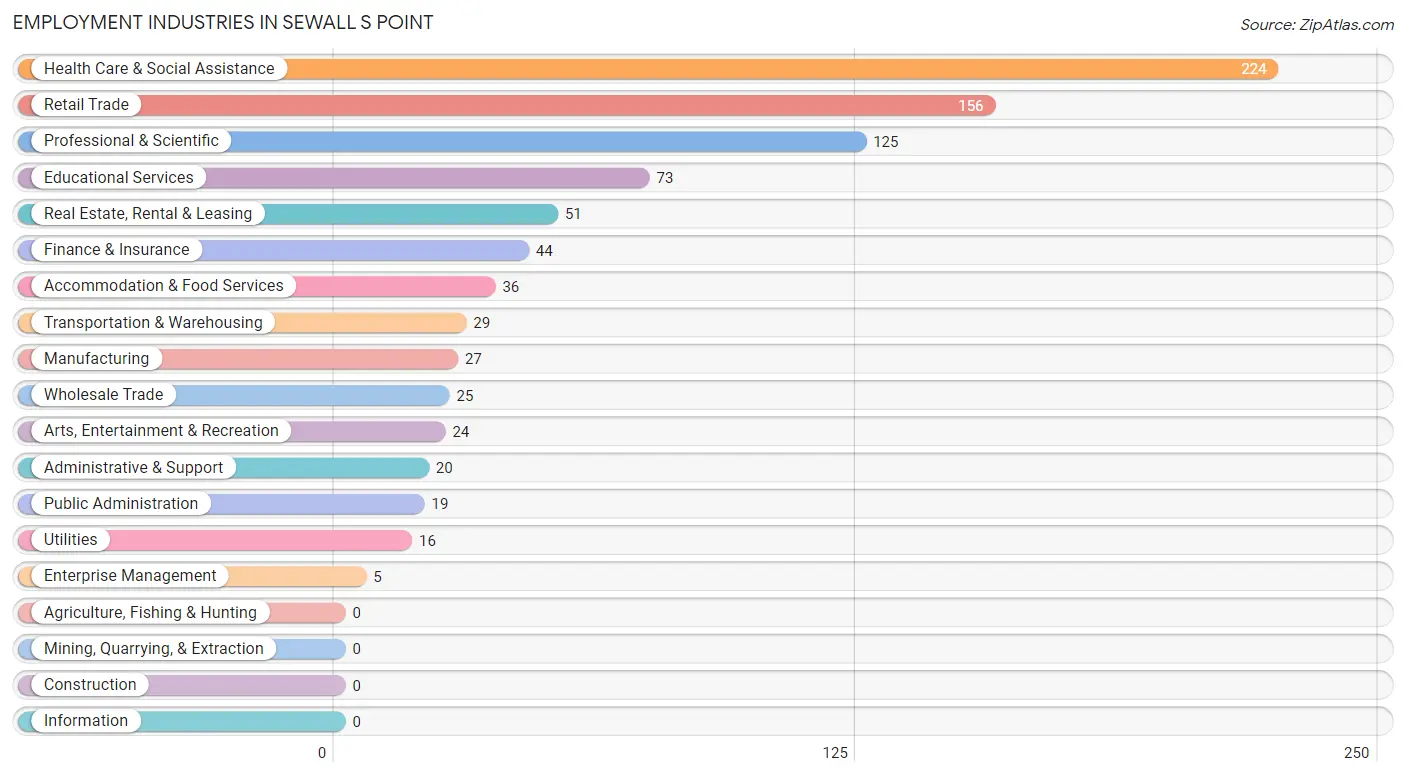
Employment Industries by Sex in Sewall s Point
The Sewall s Point industries that see more men than women are Utilities (100.0%), Retail Trade (96.2%), and Wholesale Trade (84.0%), whereas the industries that tend to have a higher number of women are Enterprise Management (100.0%), Health Care & Social Assistance (72.8%), and Finance & Insurance (70.5%).
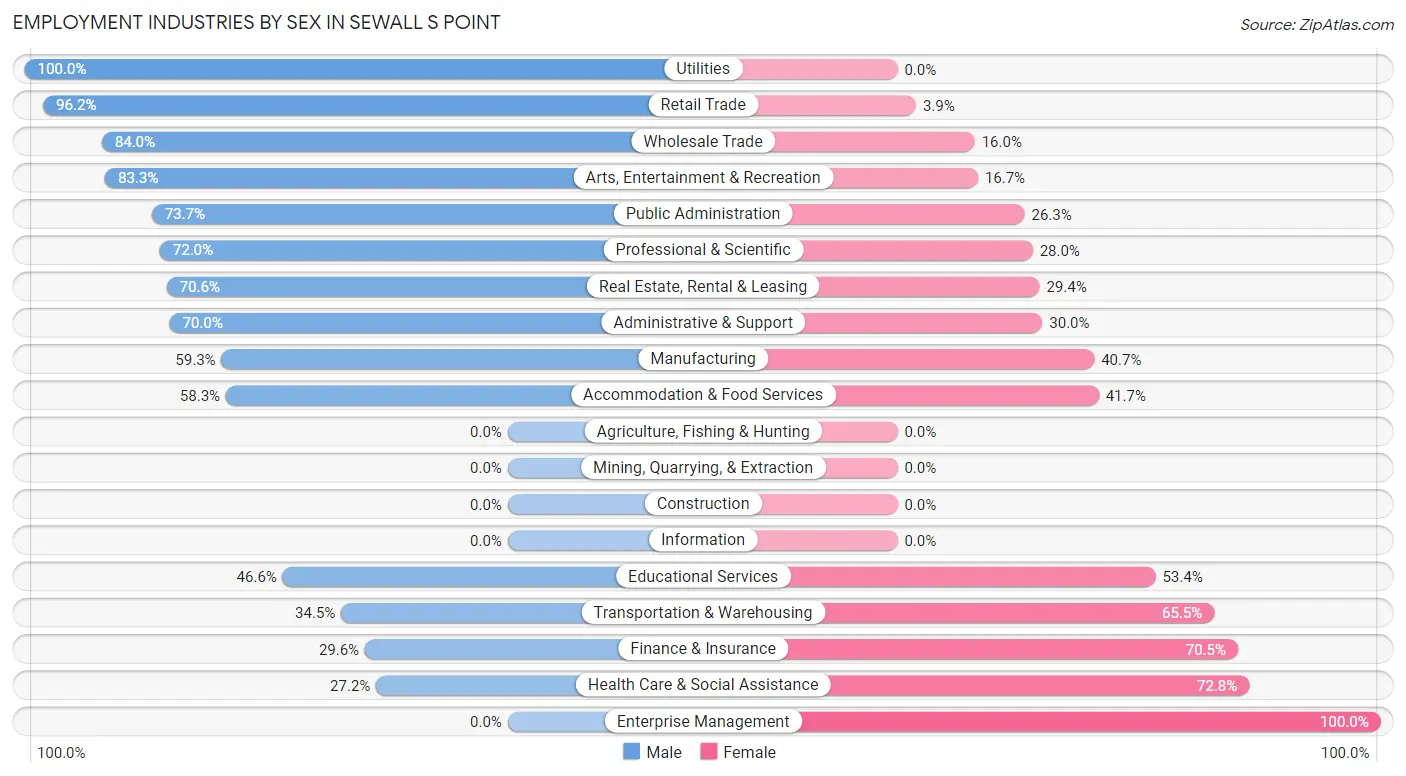
| Industry | Male | Female |
| Agriculture, Fishing & Hunting | 0 (0.0%) | 0 (0.0%) |
| Mining, Quarrying, & Extraction | 0 (0.0%) | 0 (0.0%) |
| Construction | 0 (0.0%) | 0 (0.0%) |
| Manufacturing | 16 (59.3%) | 11 (40.7%) |
| Wholesale Trade | 21 (84.0%) | 4 (16.0%) |
| Retail Trade | 150 (96.2%) | 6 (3.8%) |
| Transportation & Warehousing | 10 (34.5%) | 19 (65.5%) |
| Utilities | 16 (100.0%) | 0 (0.0%) |
| Information | 0 (0.0%) | 0 (0.0%) |
| Finance & Insurance | 13 (29.5%) | 31 (70.5%) |
| Real Estate, Rental & Leasing | 36 (70.6%) | 15 (29.4%) |
| Professional & Scientific | 90 (72.0%) | 35 (28.0%) |
| Enterprise Management | 0 (0.0%) | 5 (100.0%) |
| Administrative & Support | 14 (70.0%) | 6 (30.0%) |
| Educational Services | 34 (46.6%) | 39 (53.4%) |
| Health Care & Social Assistance | 61 (27.2%) | 163 (72.8%) |
| Arts, Entertainment & Recreation | 20 (83.3%) | 4 (16.7%) |
| Accommodation & Food Services | 21 (58.3%) | 15 (41.7%) |
| Public Administration | 14 (73.7%) | 5 (26.3%) |
| Total | 532 (58.9%) | 372 (41.1%) |
Education in Sewall s Point
School Enrollment in Sewall s Point
The most common levels of schooling among the 258 students in Sewall s Point are high school (86 | 33.3%), elementary school (72 | 27.9%), and middle school (45 | 17.4%).
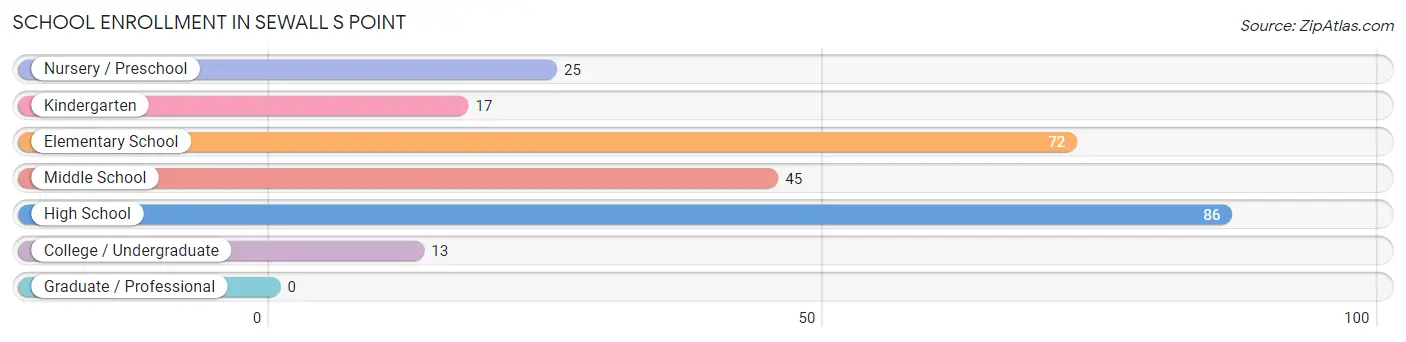
| School Level | # Students | % Students |
| Nursery / Preschool | 25 | 9.7% |
| Kindergarten | 17 | 6.6% |
| Elementary School | 72 | 27.9% |
| Middle School | 45 | 17.4% |
| High School | 86 | 33.3% |
| College / Undergraduate | 13 | 5.0% |
| Graduate / Professional | 0 | 0.0% |
| Total | 258 | 100.0% |
School Enrollment by Age by Funding Source in Sewall s Point
Out of a total of 258 students who are enrolled in schools in Sewall s Point, 88 (34.1%) attend a private institution, while the remaining 170 (65.9%) are enrolled in public schools. The age group of 10 to 14 year olds has the highest likelihood of being enrolled in private schools, with 36 (57.1% in the age bracket) enrolled. Conversely, the age group of 18 to 19 year olds has the lowest likelihood of being enrolled in a private school, with 10 (100.0% in the age bracket) attending a public institution.
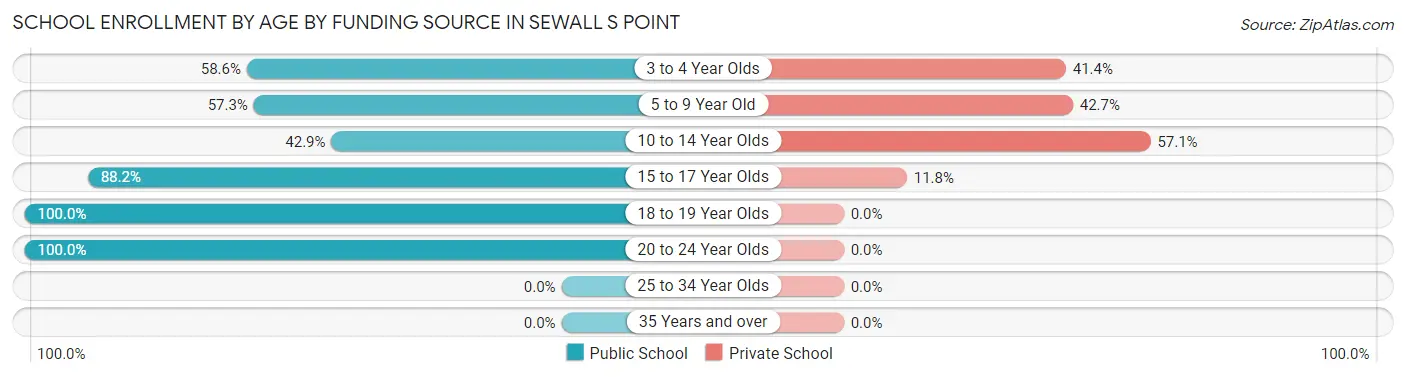
| Age Bracket | Public School | Private School |
| 3 to 4 Year Olds | 17 (58.6%) | 12 (41.4%) |
| 5 to 9 Year Old | 43 (57.3%) | 32 (42.7%) |
| 10 to 14 Year Olds | 27 (42.9%) | 36 (57.1%) |
| 15 to 17 Year Olds | 60 (88.2%) | 8 (11.8%) |
| 18 to 19 Year Olds | 10 (100.0%) | 0 (0.0%) |
| 20 to 24 Year Olds | 13 (100.0%) | 0 (0.0%) |
| 25 to 34 Year Olds | 0 (0.0%) | 0 (0.0%) |
| 35 Years and over | 0 (0.0%) | 0 (0.0%) |
| Total | 170 (65.9%) | 88 (34.1%) |
Educational Attainment by Field of Study in Sewall s Point
Business (252 | 23.4%), psychology (123 | 11.4%), science & technology (94 | 8.7%), arts & humanities (92 | 8.6%), and social sciences (86 | 8.0%) are the most common fields of study among 1,076 individuals in Sewall s Point who have obtained a bachelor's degree or higher.
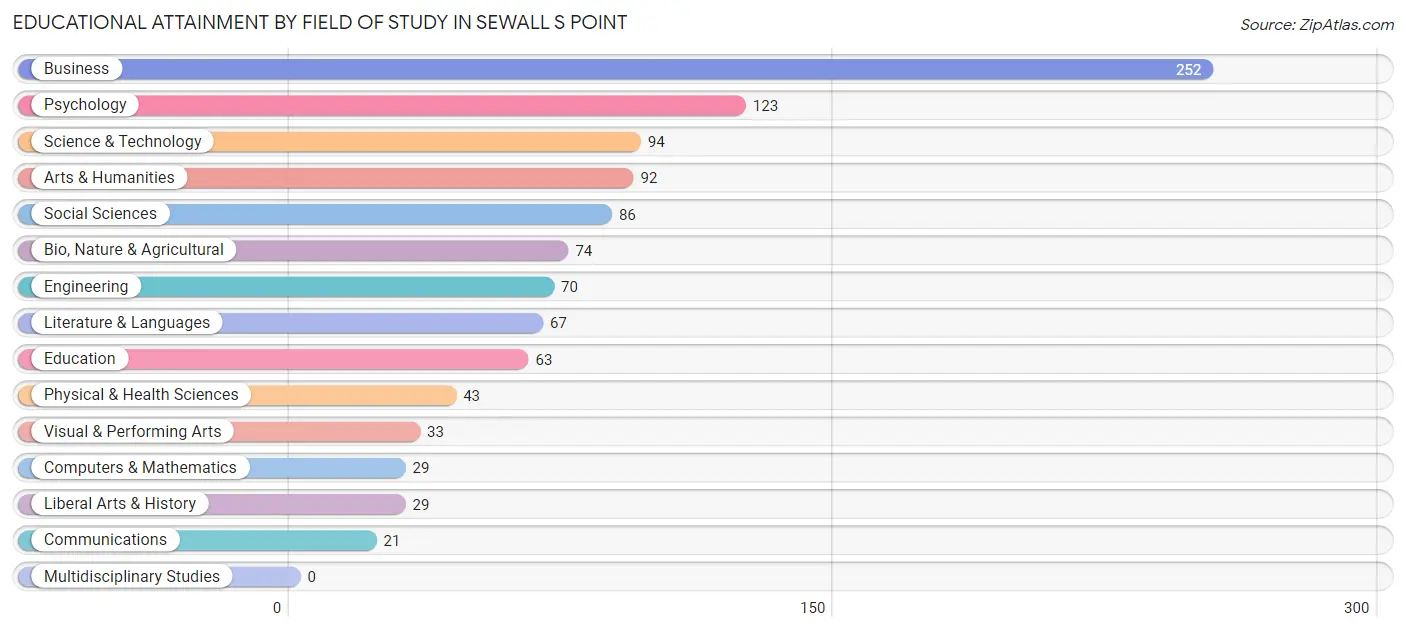
| Field of Study | # Graduates | % Graduates |
| Computers & Mathematics | 29 | 2.7% |
| Bio, Nature & Agricultural | 74 | 6.9% |
| Physical & Health Sciences | 43 | 4.0% |
| Psychology | 123 | 11.4% |
| Social Sciences | 86 | 8.0% |
| Engineering | 70 | 6.5% |
| Multidisciplinary Studies | 0 | 0.0% |
| Science & Technology | 94 | 8.7% |
| Business | 252 | 23.4% |
| Education | 63 | 5.9% |
| Literature & Languages | 67 | 6.2% |
| Liberal Arts & History | 29 | 2.7% |
| Visual & Performing Arts | 33 | 3.1% |
| Communications | 21 | 1.9% |
| Arts & Humanities | 92 | 8.6% |
| Total | 1,076 | 100.0% |
Transportation & Commute in Sewall s Point
Vehicle Availability by Sex in Sewall s Point
The most prevalent vehicle ownership categories in Sewall s Point are males with 3 vehicles (267, accounting for 50.2%) and females with 3 vehicles (130, making up 73.2%).
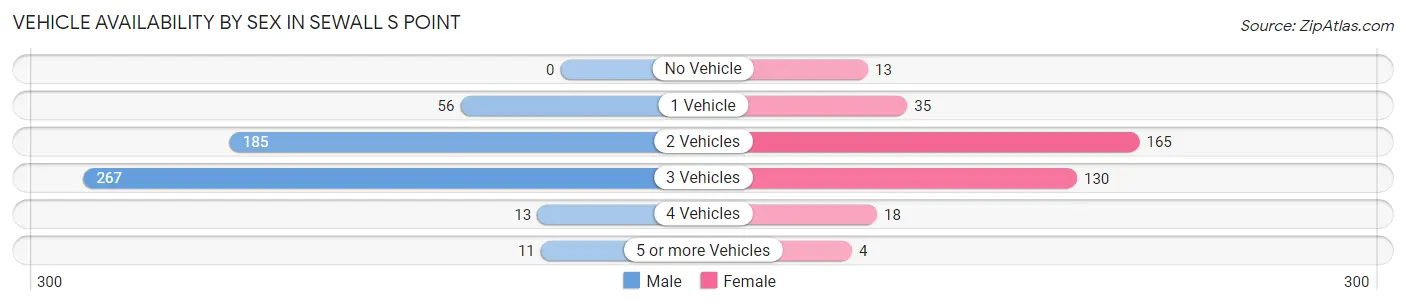
| Vehicles Available | Male | Female |
| No Vehicle | 0 (0.0%) | 13 (3.6%) |
| 1 Vehicle | 56 (10.5%) | 35 (9.6%) |
| 2 Vehicles | 185 (34.8%) | 165 (45.2%) |
| 3 Vehicles | 267 (50.2%) | 130 (35.6%) |
| 4 Vehicles | 13 (2.4%) | 18 (4.9%) |
| 5 or more Vehicles | 11 (2.1%) | 4 (1.1%) |
| Total | 532 (100.0%) | 365 (100.0%) |
Commute Time in Sewall s Point
The most frequently occuring commute durations in Sewall s Point are 5 to 9 minutes (251 commuters, 36.4%), 10 to 14 minutes (104 commuters, 15.1%), and 20 to 24 minutes (103 commuters, 14.9%).
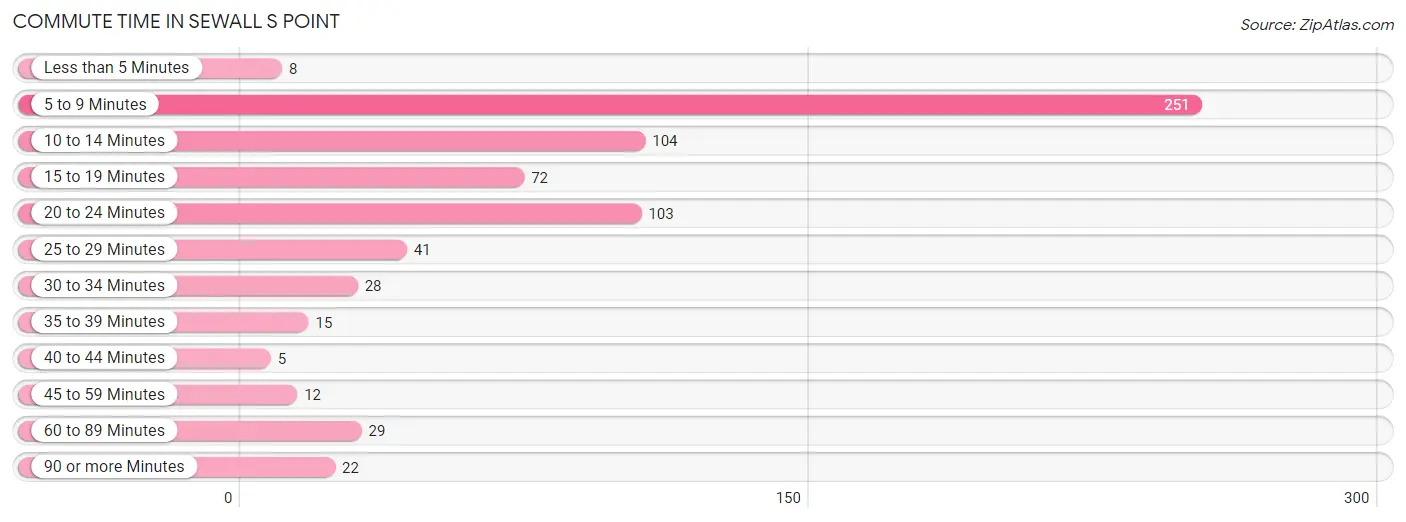
| Commute Time | # Commuters | % Commuters |
| Less than 5 Minutes | 8 | 1.2% |
| 5 to 9 Minutes | 251 | 36.4% |
| 10 to 14 Minutes | 104 | 15.1% |
| 15 to 19 Minutes | 72 | 10.4% |
| 20 to 24 Minutes | 103 | 14.9% |
| 25 to 29 Minutes | 41 | 5.9% |
| 30 to 34 Minutes | 28 | 4.1% |
| 35 to 39 Minutes | 15 | 2.2% |
| 40 to 44 Minutes | 5 | 0.7% |
| 45 to 59 Minutes | 12 | 1.7% |
| 60 to 89 Minutes | 29 | 4.2% |
| 90 or more Minutes | 22 | 3.2% |
Commute Time by Sex in Sewall s Point
The most common commute times in Sewall s Point are 5 to 9 minutes (165 commuters, 40.1%) for males and 5 to 9 minutes (86 commuters, 30.9%) for females.
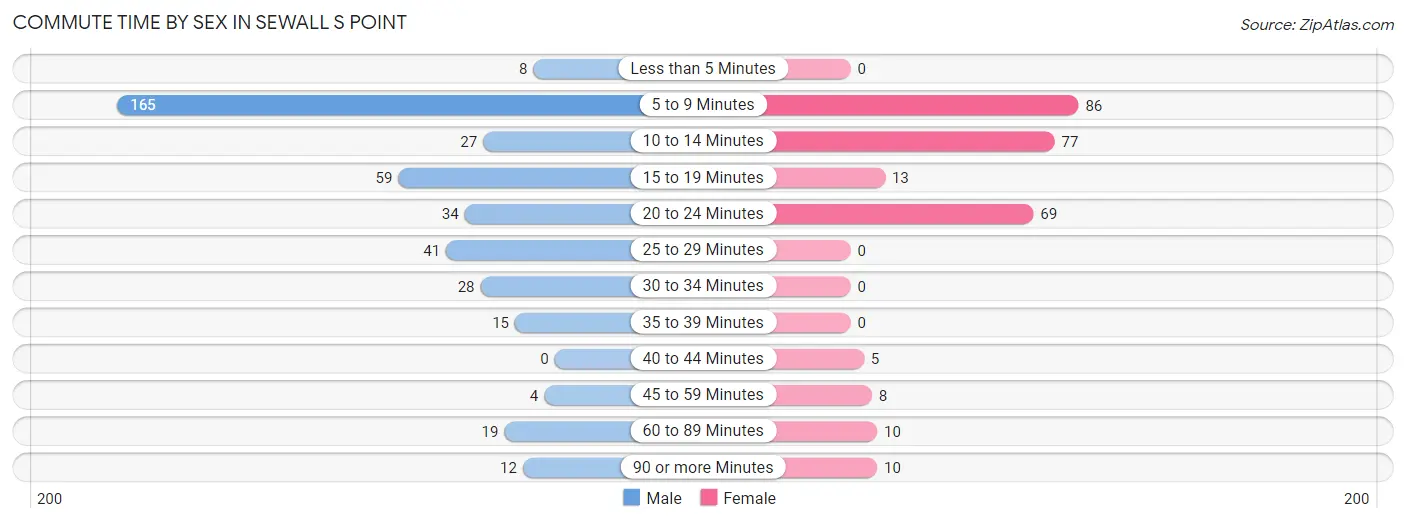
| Commute Time | Male | Female |
| Less than 5 Minutes | 8 (1.9%) | 0 (0.0%) |
| 5 to 9 Minutes | 165 (40.1%) | 86 (30.9%) |
| 10 to 14 Minutes | 27 (6.6%) | 77 (27.7%) |
| 15 to 19 Minutes | 59 (14.3%) | 13 (4.7%) |
| 20 to 24 Minutes | 34 (8.3%) | 69 (24.8%) |
| 25 to 29 Minutes | 41 (10.0%) | 0 (0.0%) |
| 30 to 34 Minutes | 28 (6.8%) | 0 (0.0%) |
| 35 to 39 Minutes | 15 (3.6%) | 0 (0.0%) |
| 40 to 44 Minutes | 0 (0.0%) | 5 (1.8%) |
| 45 to 59 Minutes | 4 (1.0%) | 8 (2.9%) |
| 60 to 89 Minutes | 19 (4.6%) | 10 (3.6%) |
| 90 or more Minutes | 12 (2.9%) | 10 (3.6%) |
Time of Departure to Work by Sex in Sewall s Point
The most frequent times of departure to work in Sewall s Point are 8:30 AM to 8:59 AM (144, 34.9%) for males and 9:00 AM to 9:59 AM (86, 30.9%) for females.
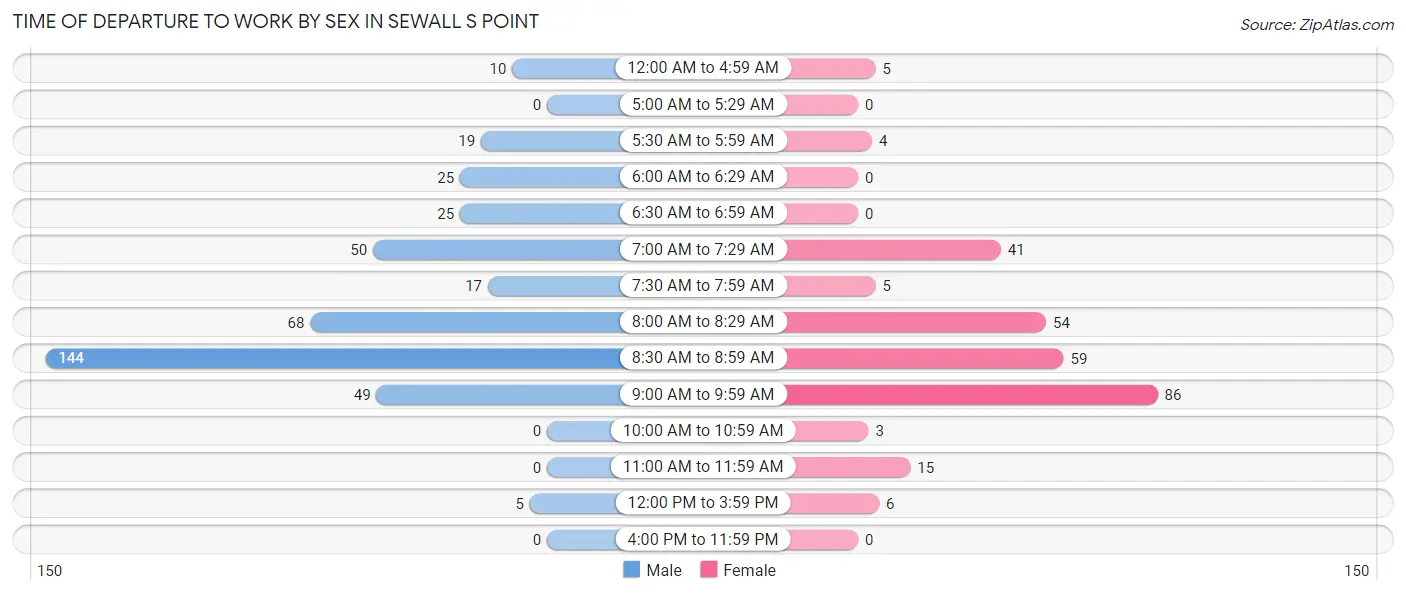
| Time of Departure | Male | Female |
| 12:00 AM to 4:59 AM | 10 (2.4%) | 5 (1.8%) |
| 5:00 AM to 5:29 AM | 0 (0.0%) | 0 (0.0%) |
| 5:30 AM to 5:59 AM | 19 (4.6%) | 4 (1.4%) |
| 6:00 AM to 6:29 AM | 25 (6.1%) | 0 (0.0%) |
| 6:30 AM to 6:59 AM | 25 (6.1%) | 0 (0.0%) |
| 7:00 AM to 7:29 AM | 50 (12.1%) | 41 (14.7%) |
| 7:30 AM to 7:59 AM | 17 (4.1%) | 5 (1.8%) |
| 8:00 AM to 8:29 AM | 68 (16.5%) | 54 (19.4%) |
| 8:30 AM to 8:59 AM | 144 (34.9%) | 59 (21.2%) |
| 9:00 AM to 9:59 AM | 49 (11.9%) | 86 (30.9%) |
| 10:00 AM to 10:59 AM | 0 (0.0%) | 3 (1.1%) |
| 11:00 AM to 11:59 AM | 0 (0.0%) | 15 (5.4%) |
| 12:00 PM to 3:59 PM | 5 (1.2%) | 6 (2.2%) |
| 4:00 PM to 11:59 PM | 0 (0.0%) | 0 (0.0%) |
| Total | 412 (100.0%) | 278 (100.0%) |
Housing Occupancy in Sewall s Point
Occupancy by Ownership in Sewall s Point
Of the total 870 dwellings in Sewall s Point, owner-occupied units account for 825 (94.8%), while renter-occupied units make up 45 (5.2%).
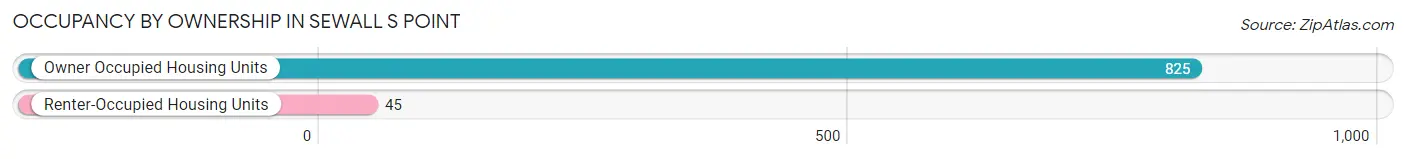
| Occupancy | # Housing Units | % Housing Units |
| Owner Occupied Housing Units | 825 | 94.8% |
| Renter-Occupied Housing Units | 45 | 5.2% |
| Total Occupied Housing Units | 870 | 100.0% |
Occupancy by Household Size in Sewall s Point
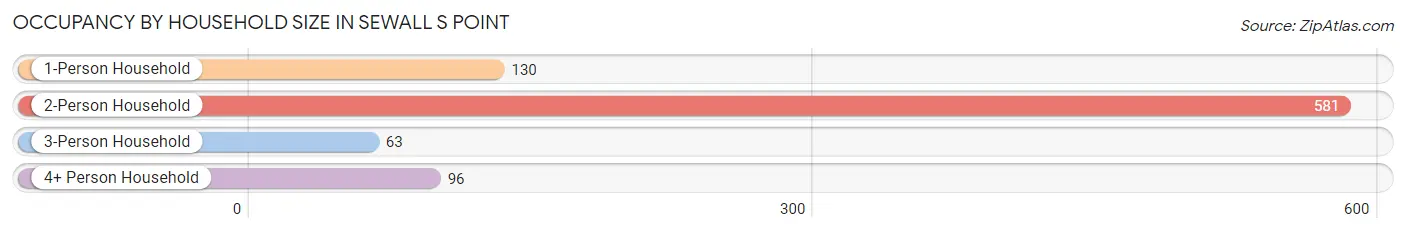
| Household Size | # Housing Units | % Housing Units |
| 1-Person Household | 130 | 14.9% |
| 2-Person Household | 581 | 66.8% |
| 3-Person Household | 63 | 7.2% |
| 4+ Person Household | 96 | 11.0% |
| Total Housing Units | 870 | 100.0% |
Occupancy by Ownership by Household Size in Sewall s Point
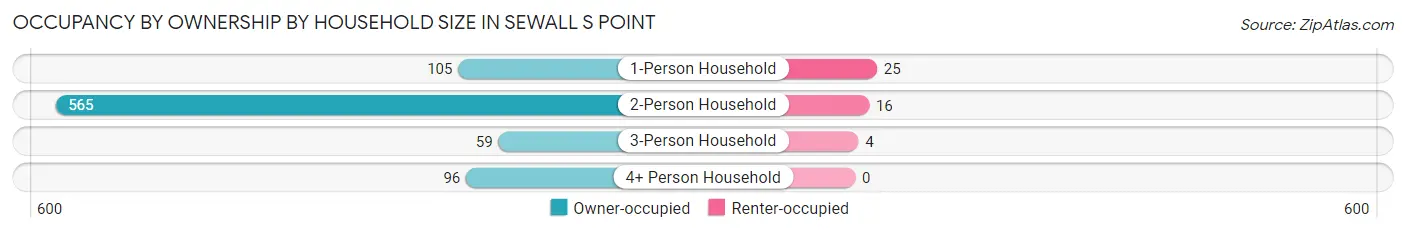
| Household Size | Owner-occupied | Renter-occupied |
| 1-Person Household | 105 (80.8%) | 25 (19.2%) |
| 2-Person Household | 565 (97.3%) | 16 (2.8%) |
| 3-Person Household | 59 (93.6%) | 4 (6.4%) |
| 4+ Person Household | 96 (100.0%) | 0 (0.0%) |
| Total Housing Units | 825 (94.8%) | 45 (5.2%) |
Occupancy by Educational Attainment in Sewall s Point
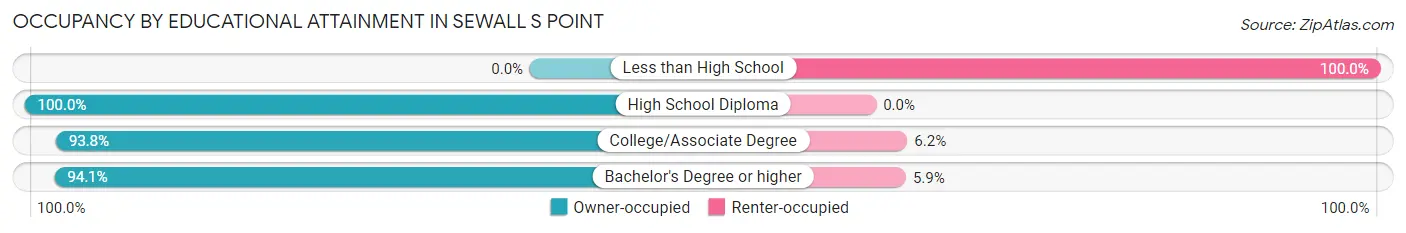
| Household Size | Owner-occupied | Renter-occupied |
| Less than High School | 0 (0.0%) | 6 (100.0%) |
| High School Diploma | 209 (100.0%) | 0 (0.0%) |
| College/Associate Degree | 91 (93.8%) | 6 (6.2%) |
| Bachelor's Degree or higher | 525 (94.1%) | 33 (5.9%) |
Occupancy by Age of Householder in Sewall s Point
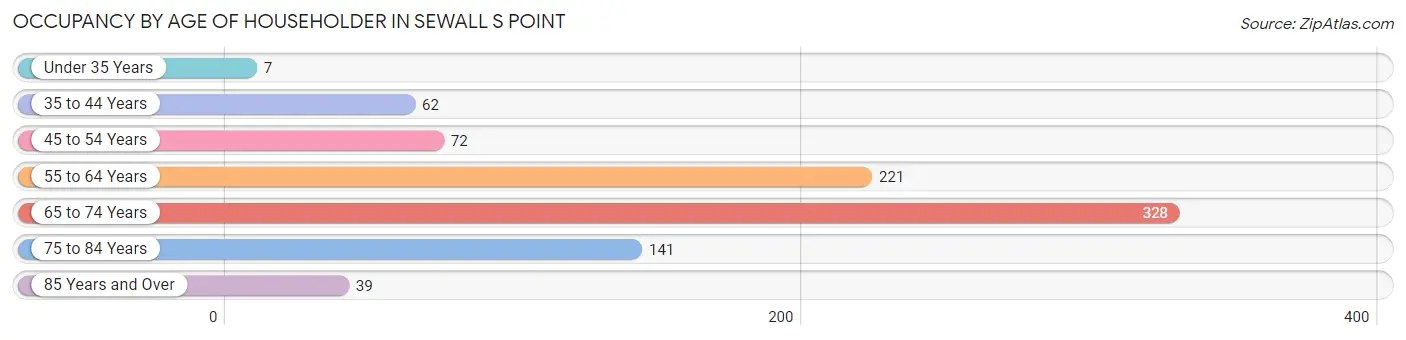
| Age Bracket | # Households | % Households |
| Under 35 Years | 7 | 0.8% |
| 35 to 44 Years | 62 | 7.1% |
| 45 to 54 Years | 72 | 8.3% |
| 55 to 64 Years | 221 | 25.4% |
| 65 to 74 Years | 328 | 37.7% |
| 75 to 84 Years | 141 | 16.2% |
| 85 Years and Over | 39 | 4.5% |
| Total | 870 | 100.0% |
Housing Finances in Sewall s Point
Median Income by Occupancy in Sewall s Point
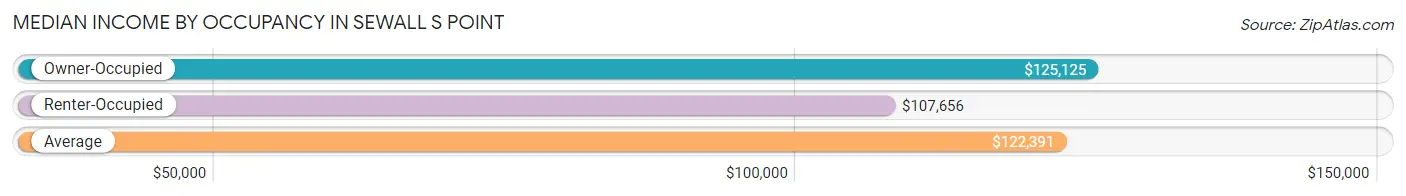
| Occupancy Type | # Households | Median Income |
| Owner-Occupied | 825 (94.8%) | $125,125 |
| Renter-Occupied | 45 (5.2%) | $107,656 |
| Average | 870 (100.0%) | $122,391 |
Occupancy by Householder Income Bracket in Sewall s Point
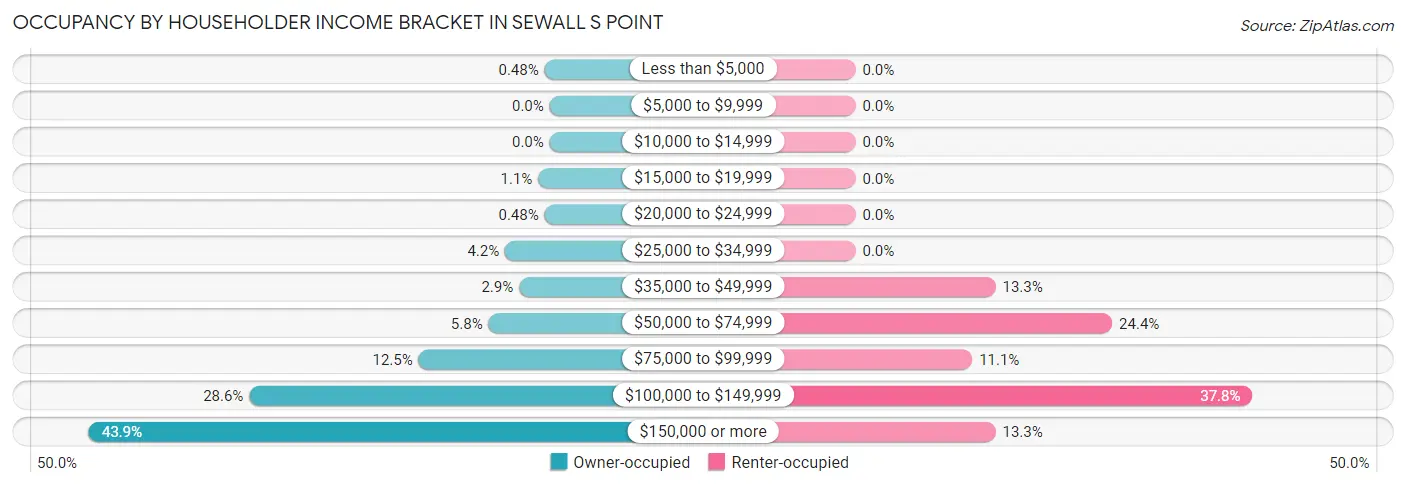
| Income Bracket | Owner-occupied | Renter-occupied |
| Less than $5,000 | 4 (0.5%) | 0 (0.0%) |
| $5,000 to $9,999 | 0 (0.0%) | 0 (0.0%) |
| $10,000 to $14,999 | 0 (0.0%) | 0 (0.0%) |
| $15,000 to $19,999 | 9 (1.1%) | 0 (0.0%) |
| $20,000 to $24,999 | 4 (0.5%) | 0 (0.0%) |
| $25,000 to $34,999 | 35 (4.2%) | 0 (0.0%) |
| $35,000 to $49,999 | 24 (2.9%) | 6 (13.3%) |
| $50,000 to $74,999 | 48 (5.8%) | 11 (24.4%) |
| $75,000 to $99,999 | 103 (12.5%) | 5 (11.1%) |
| $100,000 to $149,999 | 236 (28.6%) | 17 (37.8%) |
| $150,000 or more | 362 (43.9%) | 6 (13.3%) |
| Total | 825 (100.0%) | 45 (100.0%) |
Monthly Housing Cost Tiers in Sewall s Point
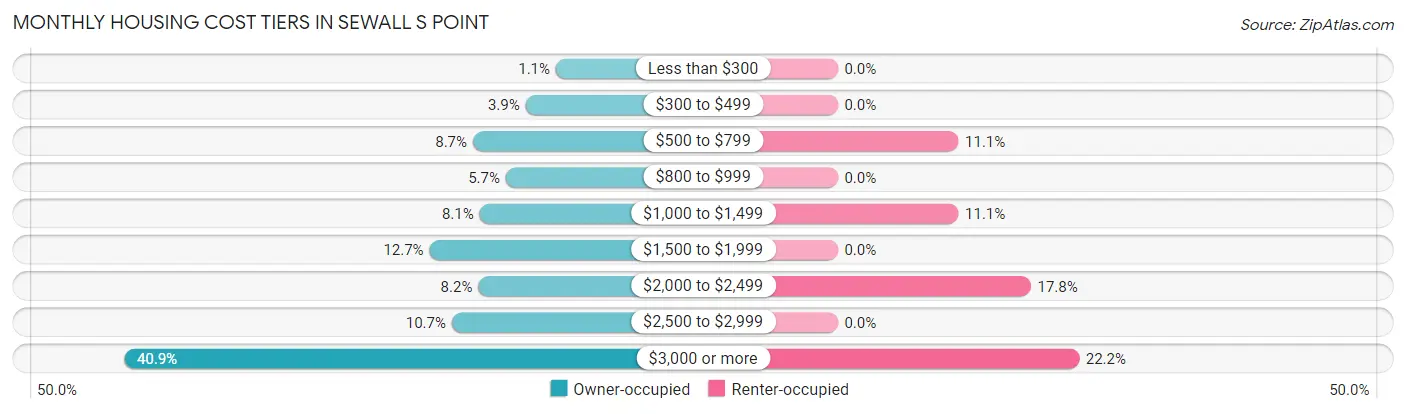
| Monthly Cost | Owner-occupied | Renter-occupied |
| Less than $300 | 9 (1.1%) | 0 (0.0%) |
| $300 to $499 | 32 (3.9%) | 0 (0.0%) |
| $500 to $799 | 72 (8.7%) | 5 (11.1%) |
| $800 to $999 | 47 (5.7%) | 0 (0.0%) |
| $1,000 to $1,499 | 67 (8.1%) | 5 (11.1%) |
| $1,500 to $1,999 | 105 (12.7%) | 0 (0.0%) |
| $2,000 to $2,499 | 68 (8.2%) | 8 (17.8%) |
| $2,500 to $2,999 | 88 (10.7%) | 0 (0.0%) |
| $3,000 or more | 337 (40.8%) | 10 (22.2%) |
| Total | 825 (100.0%) | 45 (100.0%) |
Physical Housing Characteristics in Sewall s Point
Housing Structures in Sewall s Point
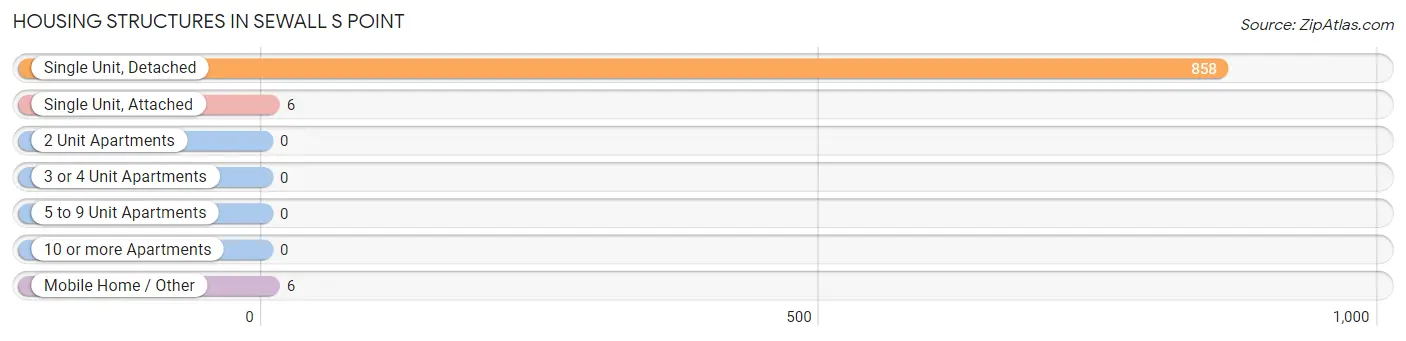
| Structure Type | # Housing Units | % Housing Units |
| Single Unit, Detached | 858 | 98.6% |
| Single Unit, Attached | 6 | 0.7% |
| 2 Unit Apartments | 0 | 0.0% |
| 3 or 4 Unit Apartments | 0 | 0.0% |
| 5 to 9 Unit Apartments | 0 | 0.0% |
| 10 or more Apartments | 0 | 0.0% |
| Mobile Home / Other | 6 | 0.7% |
| Total | 870 | 100.0% |
Housing Structures by Occupancy in Sewall s Point
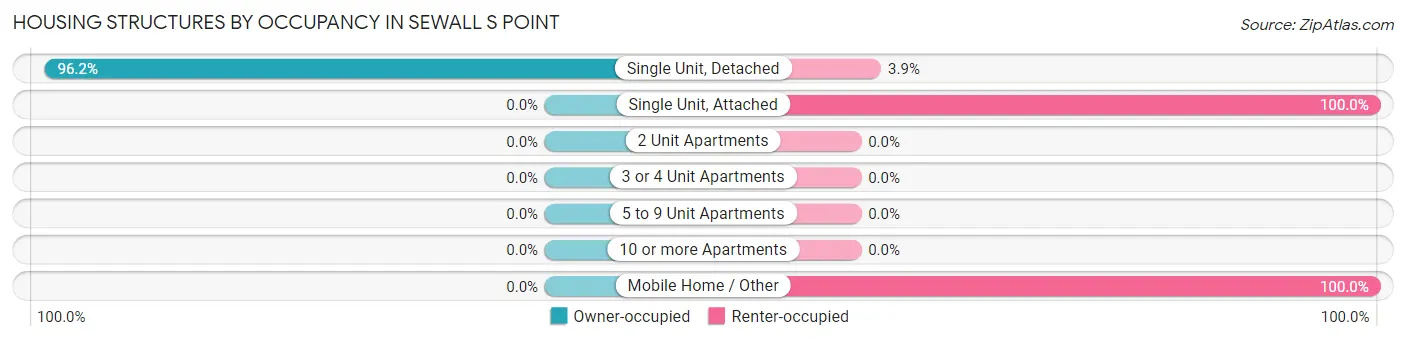
| Structure Type | Owner-occupied | Renter-occupied |
| Single Unit, Detached | 825 (96.2%) | 33 (3.8%) |
| Single Unit, Attached | 0 (0.0%) | 6 (100.0%) |
| 2 Unit Apartments | 0 (0.0%) | 0 (0.0%) |
| 3 or 4 Unit Apartments | 0 (0.0%) | 0 (0.0%) |
| 5 to 9 Unit Apartments | 0 (0.0%) | 0 (0.0%) |
| 10 or more Apartments | 0 (0.0%) | 0 (0.0%) |
| Mobile Home / Other | 0 (0.0%) | 6 (100.0%) |
| Total | 825 (94.8%) | 45 (5.2%) |
Housing Structures by Number of Rooms in Sewall s Point
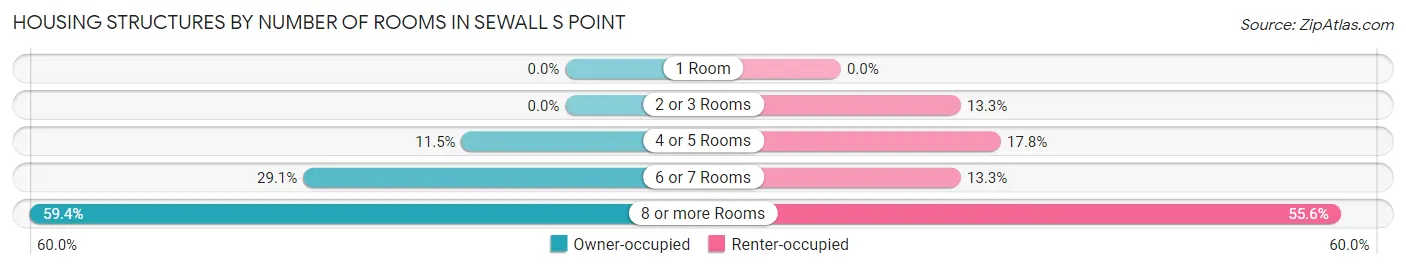
| Number of Rooms | Owner-occupied | Renter-occupied |
| 1 Room | 0 (0.0%) | 0 (0.0%) |
| 2 or 3 Rooms | 0 (0.0%) | 6 (13.3%) |
| 4 or 5 Rooms | 95 (11.5%) | 8 (17.8%) |
| 6 or 7 Rooms | 240 (29.1%) | 6 (13.3%) |
| 8 or more Rooms | 490 (59.4%) | 25 (55.6%) |
| Total | 825 (100.0%) | 45 (100.0%) |
Housing Structure by Heating Type in Sewall s Point
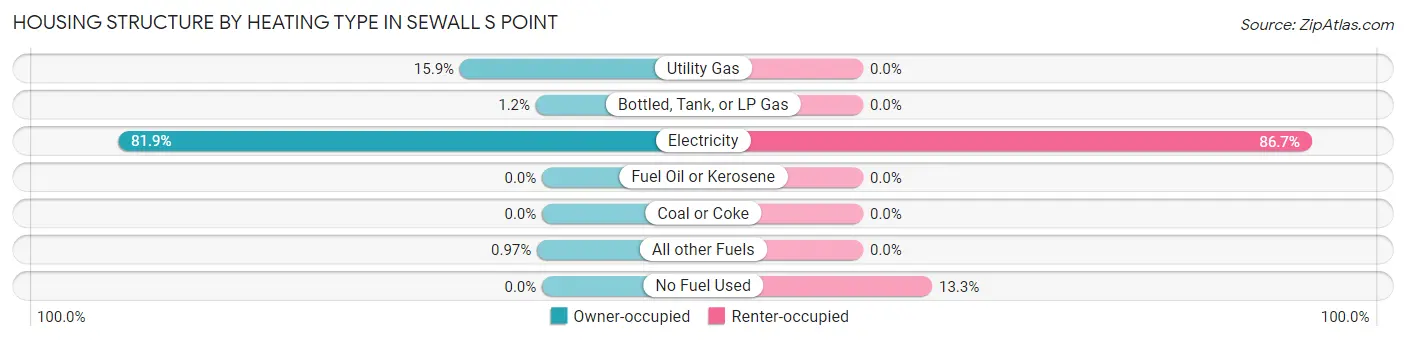
| Heating Type | Owner-occupied | Renter-occupied |
| Utility Gas | 131 (15.9%) | 0 (0.0%) |
| Bottled, Tank, or LP Gas | 10 (1.2%) | 0 (0.0%) |
| Electricity | 676 (81.9%) | 39 (86.7%) |
| Fuel Oil or Kerosene | 0 (0.0%) | 0 (0.0%) |
| Coal or Coke | 0 (0.0%) | 0 (0.0%) |
| All other Fuels | 8 (1.0%) | 0 (0.0%) |
| No Fuel Used | 0 (0.0%) | 6 (13.3%) |
| Total | 825 (100.0%) | 45 (100.0%) |
Household Vehicle Usage in Sewall s Point
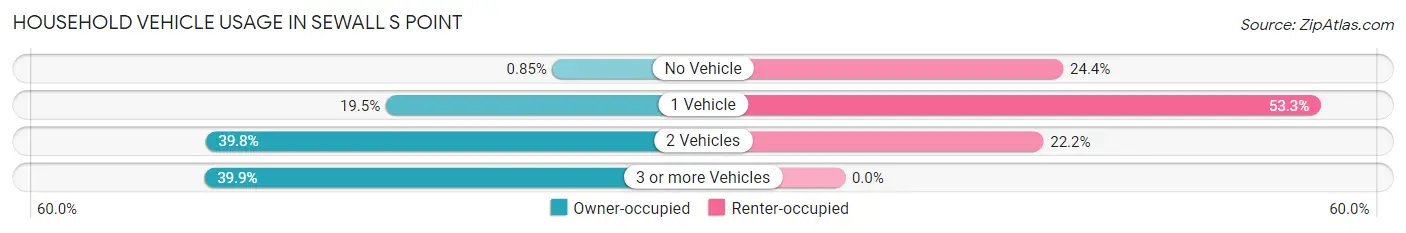
| Vehicles per Household | Owner-occupied | Renter-occupied |
| No Vehicle | 7 (0.9%) | 11 (24.4%) |
| 1 Vehicle | 161 (19.5%) | 24 (53.3%) |
| 2 Vehicles | 328 (39.8%) | 10 (22.2%) |
| 3 or more Vehicles | 329 (39.9%) | 0 (0.0%) |
| Total | 825 (100.0%) | 45 (100.0%) |
Real Estate & Mortgages in Sewall s Point
Real Estate and Mortgage Overview in Sewall s Point
| Characteristic | Without Mortgage | With Mortgage |
| Housing Units | 425 | 400 |
| Median Property Value | $903,700 | $1,192,300 |
| Median Household Income | $122,039 | $170 |
| Monthly Housing Costs | $1,455 | $281 |
| Real Estate Taxes | $6,932 | $0 |
Property Value by Mortgage Status in Sewall s Point
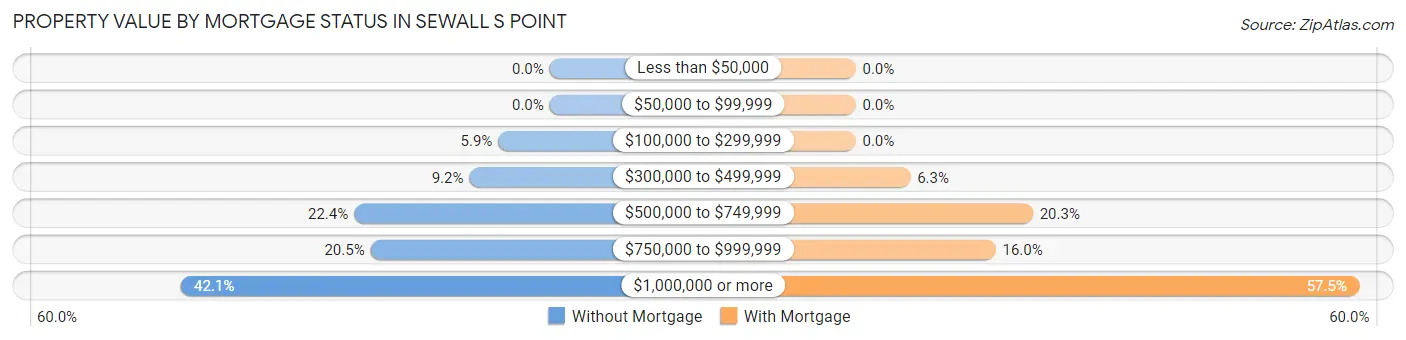
| Property Value | Without Mortgage | With Mortgage |
| Less than $50,000 | 0 (0.0%) | 0 (0.0%) |
| $50,000 to $99,999 | 0 (0.0%) | 0 (0.0%) |
| $100,000 to $299,999 | 25 (5.9%) | 0 (0.0%) |
| $300,000 to $499,999 | 39 (9.2%) | 25 (6.2%) |
| $500,000 to $749,999 | 95 (22.4%) | 81 (20.3%) |
| $750,000 to $999,999 | 87 (20.5%) | 64 (16.0%) |
| $1,000,000 or more | 179 (42.1%) | 230 (57.5%) |
| Total | 425 (100.0%) | 400 (100.0%) |
Household Income by Mortgage Status in Sewall s Point
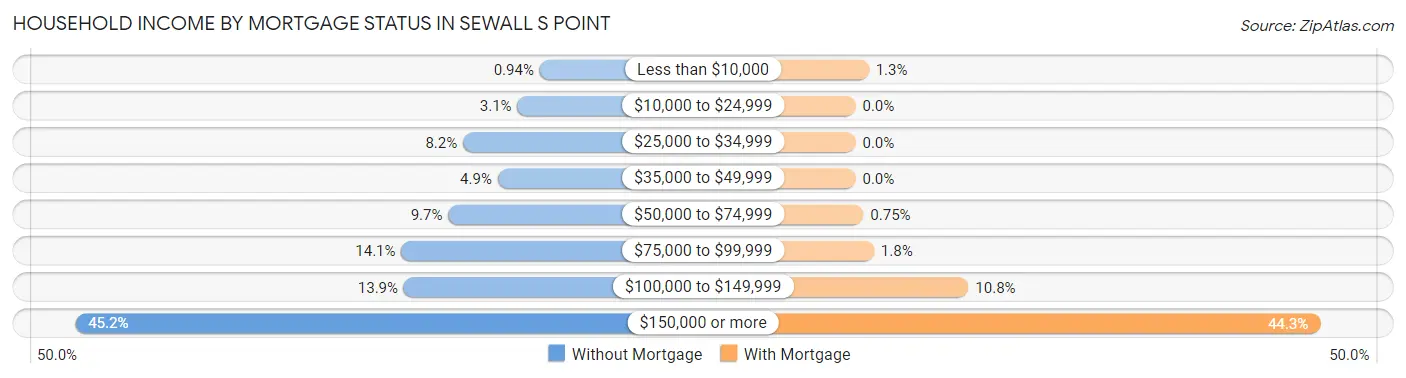
| Household Income | Without Mortgage | With Mortgage |
| Less than $10,000 | 4 (0.9%) | 5 (1.3%) |
| $10,000 to $24,999 | 13 (3.1%) | 0 (0.0%) |
| $25,000 to $34,999 | 35 (8.2%) | 0 (0.0%) |
| $35,000 to $49,999 | 21 (4.9%) | 0 (0.0%) |
| $50,000 to $74,999 | 41 (9.7%) | 3 (0.7%) |
| $75,000 to $99,999 | 60 (14.1%) | 7 (1.8%) |
| $100,000 to $149,999 | 59 (13.9%) | 43 (10.7%) |
| $150,000 or more | 192 (45.2%) | 177 (44.3%) |
| Total | 425 (100.0%) | 400 (100.0%) |
Property Value to Household Income Ratio in Sewall s Point
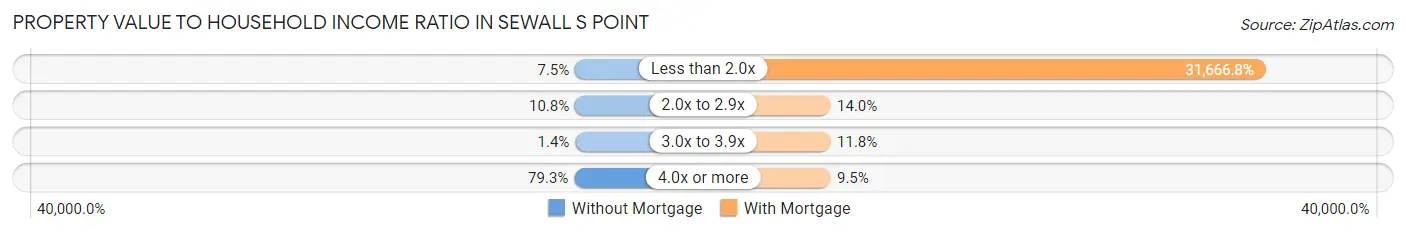
| Value-to-Income Ratio | Without Mortgage | With Mortgage |
| Less than 2.0x | 32 (7.5%) | 126,667 (31,666.8%) |
| 2.0x to 2.9x | 46 (10.8%) | 56 (14.0%) |
| 3.0x to 3.9x | 6 (1.4%) | 47 (11.7%) |
| 4.0x or more | 337 (79.3%) | 38 (9.5%) |
| Total | 425 (100.0%) | 400 (100.0%) |
Real Estate Taxes by Mortgage Status in Sewall s Point
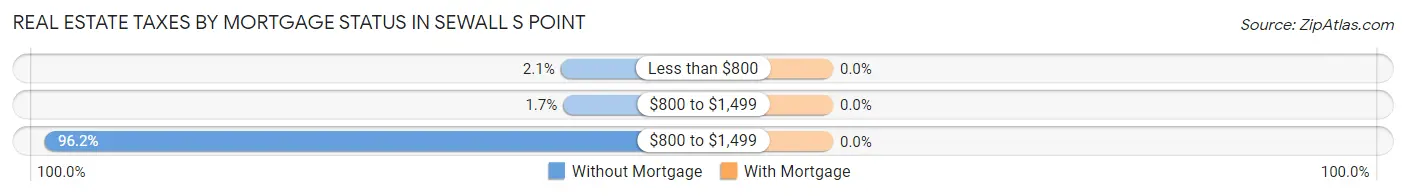
| Property Taxes | Without Mortgage | With Mortgage |
| Less than $800 | 9 (2.1%) | 0 (0.0%) |
| $800 to $1,499 | 7 (1.7%) | 0 (0.0%) |
| $800 to $1,499 | 409 (96.2%) | 0 (0.0%) |
| Total | 425 (100.0%) | 400 (100.0%) |
Health & Disability in Sewall s Point
Health Insurance Coverage by Age in Sewall s Point
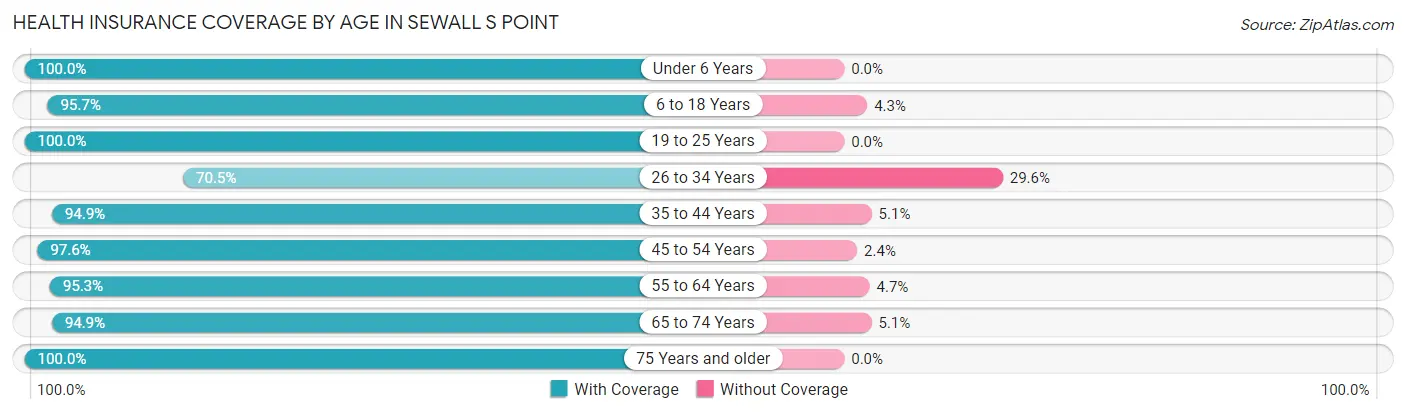
| Age Bracket | With Coverage | Without Coverage |
| Under 6 Years | 36 (100.0%) | 0 (0.0%) |
| 6 to 18 Years | 224 (95.7%) | 10 (4.3%) |
| 19 to 25 Years | 52 (100.0%) | 0 (0.0%) |
| 26 to 34 Years | 31 (70.5%) | 13 (29.5%) |
| 35 to 44 Years | 93 (94.9%) | 5 (5.1%) |
| 45 to 54 Years | 285 (97.6%) | 7 (2.4%) |
| 55 to 64 Years | 323 (95.3%) | 16 (4.7%) |
| 65 to 74 Years | 486 (94.9%) | 26 (5.1%) |
| 75 Years and older | 315 (100.0%) | 0 (0.0%) |
| Total | 1,845 (96.0%) | 77 (4.0%) |
Health Insurance Coverage by Citizenship Status in Sewall s Point
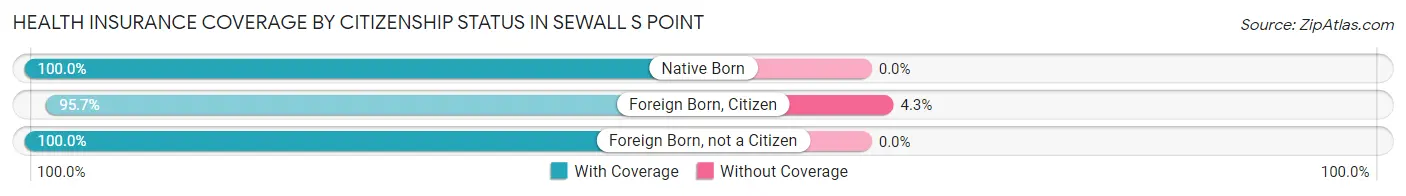
| Citizenship Status | With Coverage | Without Coverage |
| Native Born | 36 (100.0%) | 0 (0.0%) |
| Foreign Born, Citizen | 224 (95.7%) | 10 (4.3%) |
| Foreign Born, not a Citizen | 52 (100.0%) | 0 (0.0%) |
Health Insurance Coverage by Household Income in Sewall s Point
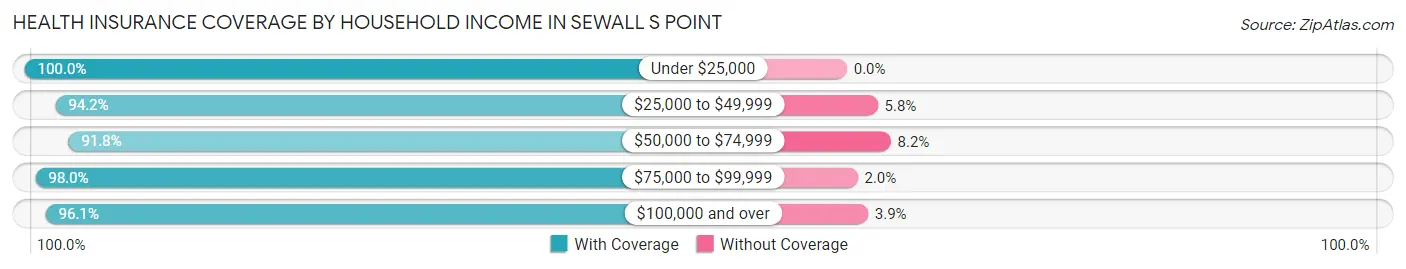
| Household Income | With Coverage | Without Coverage |
| Under $25,000 | 17 (100.0%) | 0 (0.0%) |
| $25,000 to $49,999 | 98 (94.2%) | 6 (5.8%) |
| $50,000 to $74,999 | 123 (91.8%) | 11 (8.2%) |
| $75,000 to $99,999 | 292 (98.0%) | 6 (2.0%) |
| $100,000 and over | 1,315 (96.1%) | 54 (3.9%) |
Public vs Private Health Insurance Coverage by Age in Sewall s Point
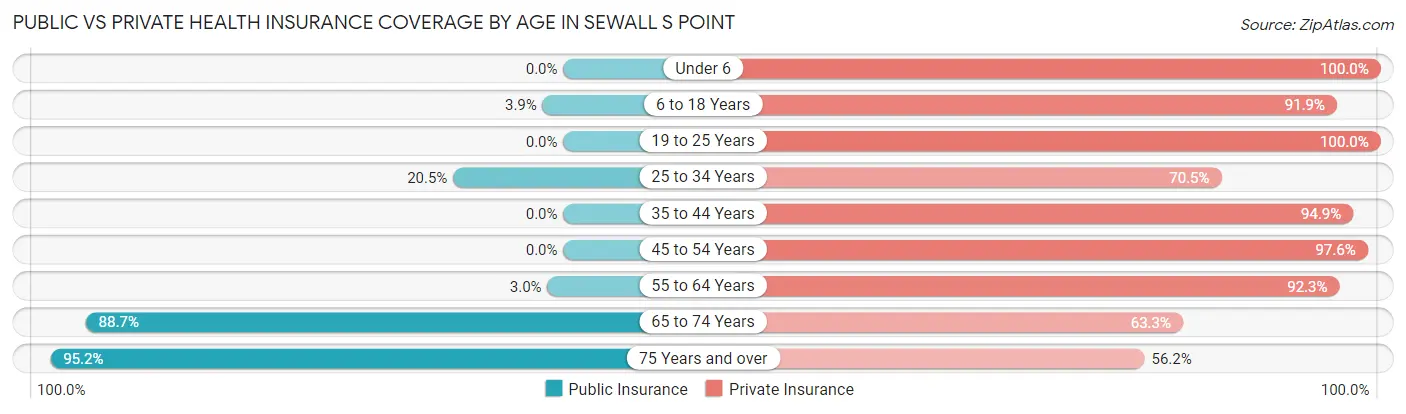
| Age Bracket | Public Insurance | Private Insurance |
| Under 6 | 0 (0.0%) | 36 (100.0%) |
| 6 to 18 Years | 9 (3.8%) | 215 (91.9%) |
| 19 to 25 Years | 0 (0.0%) | 52 (100.0%) |
| 25 to 34 Years | 9 (20.4%) | 31 (70.5%) |
| 35 to 44 Years | 0 (0.0%) | 93 (94.9%) |
| 45 to 54 Years | 0 (0.0%) | 285 (97.6%) |
| 55 to 64 Years | 10 (2.9%) | 313 (92.3%) |
| 65 to 74 Years | 454 (88.7%) | 324 (63.3%) |
| 75 Years and over | 300 (95.2%) | 177 (56.2%) |
| Total | 782 (40.7%) | 1,526 (79.4%) |
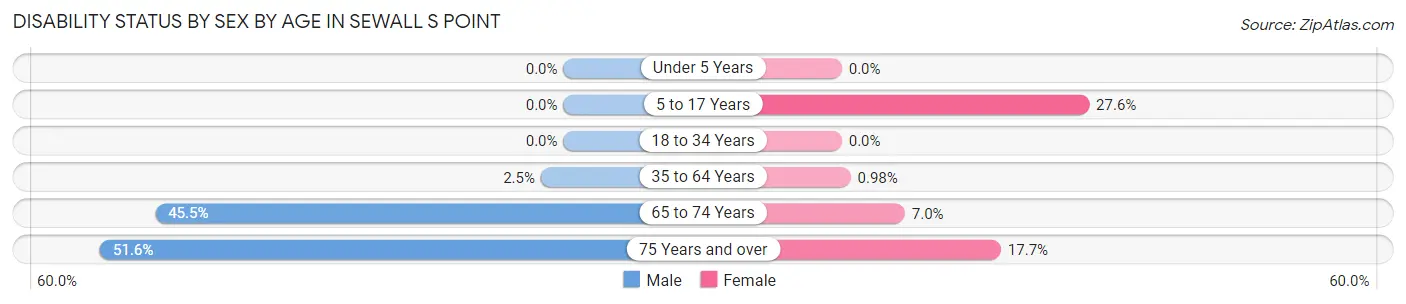
Disability Status by Sex by Age in Sewall s Point
| Age Bracket | Male | Female |
| Under 5 Years | 0 (0.0%) | 0 (0.0%) |
| 5 to 17 Years | 0 (0.0%) | 27 (27.6%) |
| 18 to 34 Years | 0 (0.0%) | 0 (0.0%) |
| 35 to 64 Years | 8 (2.5%) | 4 (1.0%) |
| 65 to 74 Years | 155 (45.5%) | 12 (7.0%) |
| 75 Years and over | 81 (51.6%) | 28 (17.7%) |
Disability Class by Sex by Age in Sewall s Point
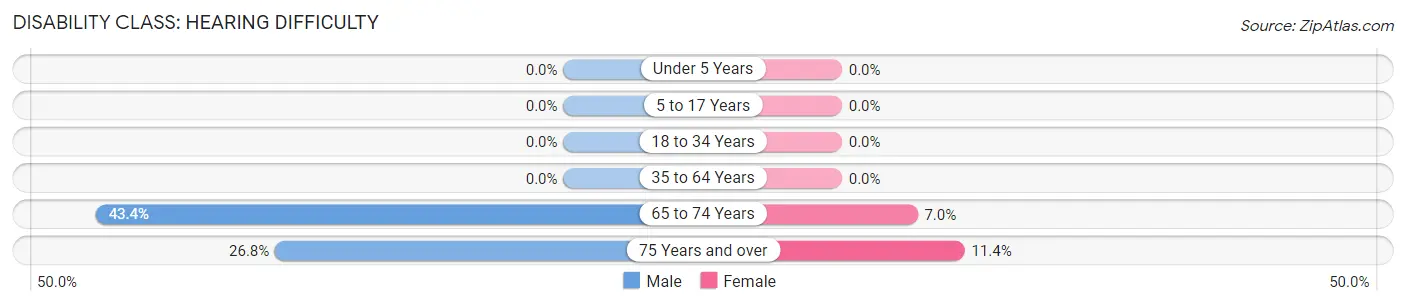
Disability Class: Hearing Difficulty
| Age Bracket | Male | Female |
| Under 5 Years | 0 (0.0%) | 0 (0.0%) |
| 5 to 17 Years | 0 (0.0%) | 0 (0.0%) |
| 18 to 34 Years | 0 (0.0%) | 0 (0.0%) |
| 35 to 64 Years | 0 (0.0%) | 0 (0.0%) |
| 65 to 74 Years | 148 (43.4%) | 12 (7.0%) |
| 75 Years and over | 42 (26.8%) | 18 (11.4%) |
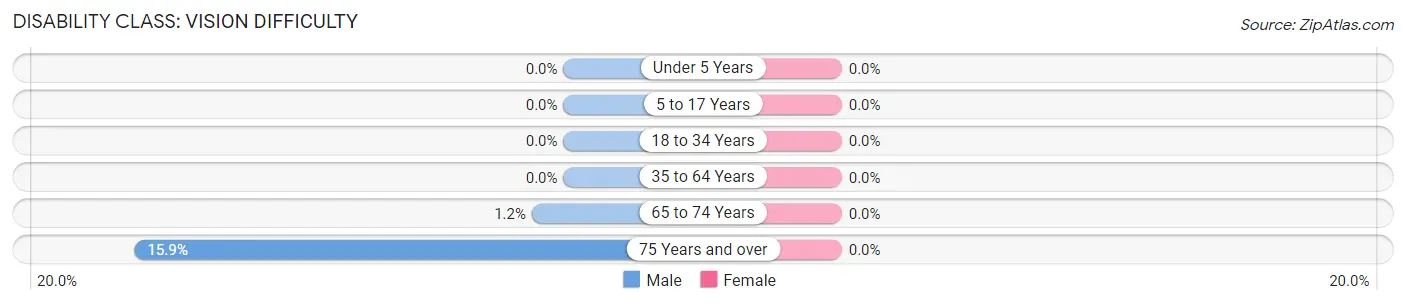
Disability Class: Vision Difficulty
| Age Bracket | Male | Female |
| Under 5 Years | 0 (0.0%) | 0 (0.0%) |
| 5 to 17 Years | 0 (0.0%) | 0 (0.0%) |
| 18 to 34 Years | 0 (0.0%) | 0 (0.0%) |
| 35 to 64 Years | 0 (0.0%) | 0 (0.0%) |
| 65 to 74 Years | 4 (1.2%) | 0 (0.0%) |
| 75 Years and over | 25 (15.9%) | 0 (0.0%) |
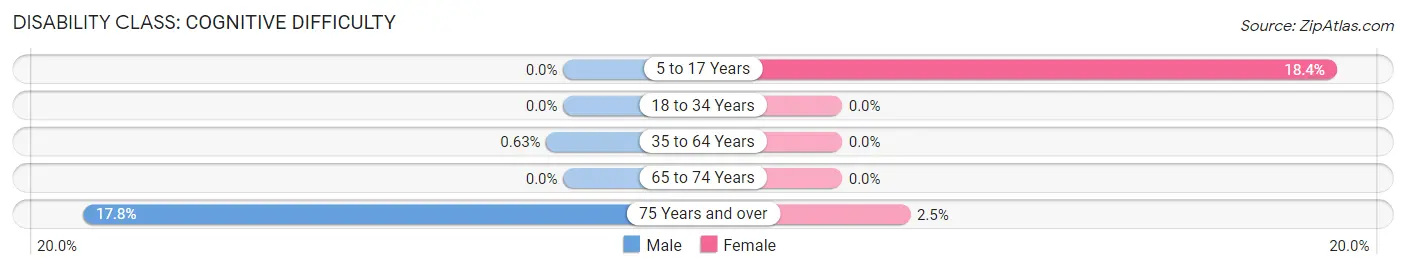
Disability Class: Cognitive Difficulty
| Age Bracket | Male | Female |
| 5 to 17 Years | 0 (0.0%) | 18 (18.4%) |
| 18 to 34 Years | 0 (0.0%) | 0 (0.0%) |
| 35 to 64 Years | 2 (0.6%) | 0 (0.0%) |
| 65 to 74 Years | 0 (0.0%) | 0 (0.0%) |
| 75 Years and over | 28 (17.8%) | 4 (2.5%) |
Disability Class: Ambulatory Difficulty
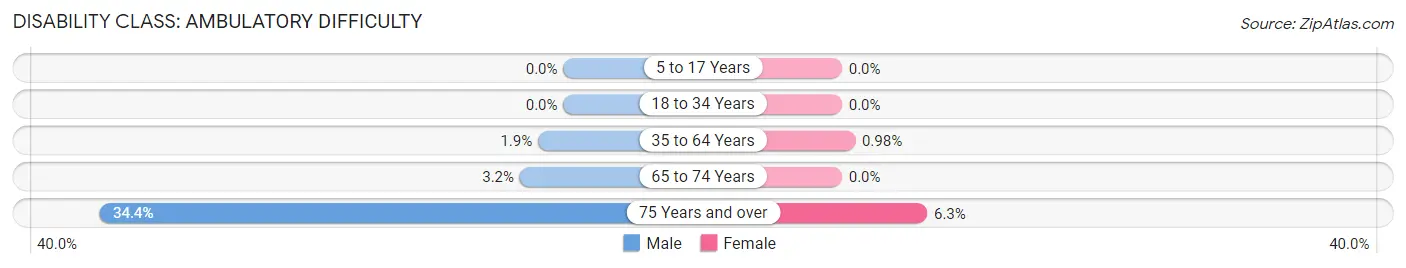
| Age Bracket | Male | Female |
| 5 to 17 Years | 0 (0.0%) | 0 (0.0%) |
| 18 to 34 Years | 0 (0.0%) | 0 (0.0%) |
| 35 to 64 Years | 6 (1.9%) | 4 (1.0%) |
| 65 to 74 Years | 11 (3.2%) | 0 (0.0%) |
| 75 Years and over | 54 (34.4%) | 10 (6.3%) |
Disability Class: Self-Care Difficulty
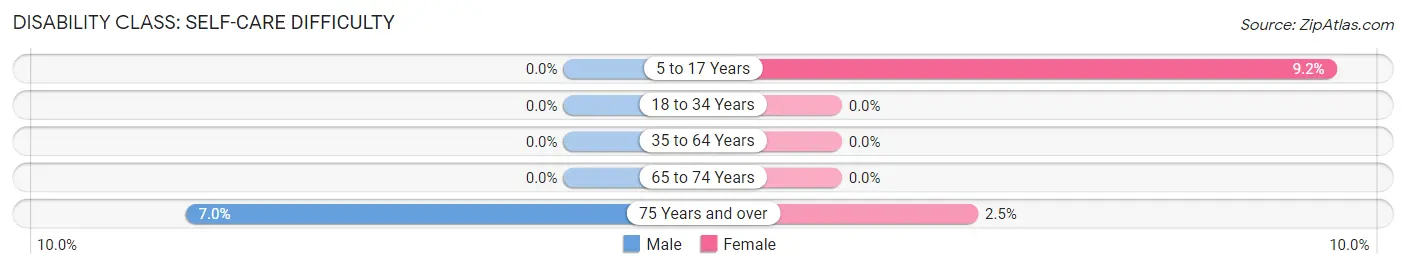
| Age Bracket | Male | Female |
| 5 to 17 Years | 0 (0.0%) | 9 (9.2%) |
| 18 to 34 Years | 0 (0.0%) | 0 (0.0%) |
| 35 to 64 Years | 0 (0.0%) | 0 (0.0%) |
| 65 to 74 Years | 0 (0.0%) | 0 (0.0%) |
| 75 Years and over | 11 (7.0%) | 4 (2.5%) |
Technology Access in Sewall s Point
Computing Device Access in Sewall s Point
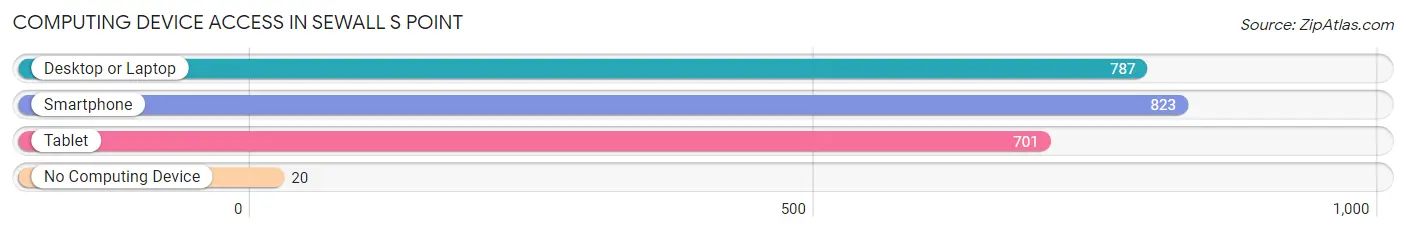
| Device Type | # Households | % Households |
| Desktop or Laptop | 787 | 90.5% |
| Smartphone | 823 | 94.6% |
| Tablet | 701 | 80.6% |
| No Computing Device | 20 | 2.3% |
| Total | 870 | 100.0% |
Internet Access in Sewall s Point
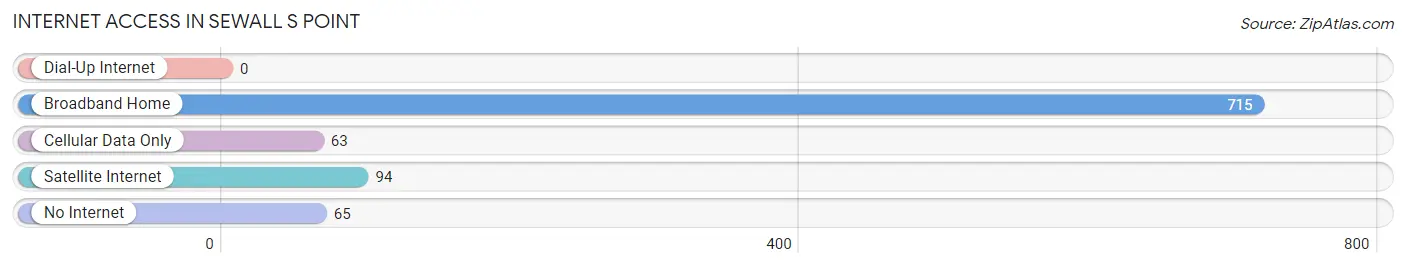
| Internet Type | # Households | % Households |
| Dial-Up Internet | 0 | 0.0% |
| Broadband Home | 715 | 82.2% |
| Cellular Data Only | 63 | 7.2% |
| Satellite Internet | 94 | 10.8% |
| No Internet | 65 | 7.5% |
| Total | 870 | 100.0% |
Sewall s Point Summary
Sewall’s Point is a small town located in Martin County, Florida. It is situated on the St. Lucie River, just south of Stuart. The town is known for its beautiful views of the river and its lush vegetation. It is also home to a variety of wildlife, including manatees, dolphins, and sea turtles.
History
Sewall’s Point was first settled in the late 1800s by a group of settlers from Maine. The town was named after the Sewall family, who were among the first settlers. The town was originally a fishing village, and the Sewall family was known for their fishing skills.
In the early 1900s, the town began to grow and develop. The first post office was established in 1910, and the first school was built in 1912. The town was incorporated in 1925, and the population grew steadily over the next few decades.
In the 1950s, the town began to attract more tourists and retirees. The population grew rapidly, and the town began to develop more amenities, such as a library, a golf course, and a marina.
Geography
Sewall’s Point is located on the St. Lucie River, just south of Stuart. The town is situated on a peninsula, and is surrounded by the Indian River Lagoon to the east and the St. Lucie River to the west. The town is known for its beautiful views of the river and its lush vegetation.
The town is located in Martin County, and is part of the Port St. Lucie Metropolitan Statistical Area. The town is located about 25 miles south of West Palm Beach, and about 50 miles north of Miami.
Economy
Sewall’s Point is a small town, and the economy is largely based on tourism and retirement. The town is known for its beautiful views of the river and its lush vegetation, and it attracts many tourists and retirees each year.
The town is also home to a variety of businesses, including restaurants, shops, and marinas. The town is also home to a number of professional services, such as lawyers, accountants, and real estate agents.
Demographics
As of the 2010 census, the population of Sewall’s Point was 2,621. The population is largely white (94.3%), with a small percentage of African Americans (2.2%) and Hispanics (2.5%). The median household income is $87,917, and the median home value is $541,000.
The town is largely made up of retirees, with about 40% of the population over the age of 65. The town is also home to a number of young families, with about 25% of the population under the age of 18.
Conclusion
Sewall’s Point is a small town located in Martin County, Florida. It is situated on the St. Lucie River, just south of Stuart. The town is known for its beautiful views of the river and its lush vegetation. It is also home to a variety of wildlife, including manatees, dolphins, and sea turtles. The town is largely made up of retirees, and the economy is largely based on tourism and retirement. The town is also home to a variety of businesses, including restaurants, shops, and marinas.
Common Questions
What is Per Capita Income in Sewall s Point?
Per Capita income in Sewall s Point is $100,933.
What is the Median Family Income in Sewall s Point?
Median Family Income in Sewall s Point is $162,857.
What is the Median Household income in Sewall s Point?
Median Household Income in Sewall s Point is $122,391.
What is Income or Wage Gap in Sewall s Point?
Income or Wage Gap in Sewall s Point is 26.6%.
Women in Sewall s Point earn 73.4 cents for every dollar earned by a man.
What is Inequality or Gini Index in Sewall s Point?
Inequality or Gini Index in Sewall s Point is 0.47.
What is the Total Population of Sewall s Point?
Total Population of Sewall s Point is 1,922.
What is the Total Male Population of Sewall s Point?
Total Male Population of Sewall s Point is 1,020.
What is the Total Female Population of Sewall s Point?
Total Female Population of Sewall s Point is 902.
What is the Ratio of Males per 100 Females in Sewall s Point?
There are 113.08 Males per 100 Females in Sewall s Point.
What is the Ratio of Females per 100 Males in Sewall s Point?
There are 88.43 Females per 100 Males in Sewall s Point.
What is the Median Population Age in Sewall s Point?
Median Population Age in Sewall s Point is 61.7 Years.
What is the Average Family Size in Sewall s Point
Average Family Size in Sewall s Point is 2.6 People.
What is the Average Household Size in Sewall s Point
Average Household Size in Sewall s Point is 2.2 People.
How Large is the Labor Force in Sewall s Point?
There are 924 People in the Labor Forcein in Sewall s Point.
What is the Percentage of People in the Labor Force in Sewall s Point?
53.4% of People are in the Labor Force in Sewall s Point.
What is the Unemployment Rate in Sewall s Point?
Unemployment Rate in Sewall s Point is 2.1%.