Central Gardens, TX Map & Demographics
Central Gardens Map
Central Gardens Overview
$50,040
PER CAPITA INCOME
$144,332
AVG FAMILY INCOME
$98,750
AVG HOUSEHOLD INCOME
43.0%
WAGE / INCOME GAP [ % ]
57.0¢/ $1
WAGE / INCOME GAP [ $ ]
0.37
INEQUALITY / GINI INDEX
3,627
TOTAL POPULATION
1,809
MALE POPULATION
1,818
FEMALE POPULATION
99.50
MALES / 100 FEMALES
100.50
FEMALES / 100 MALES
43.8
MEDIAN AGE
3.0
AVG FAMILY SIZE
2.2
AVG HOUSEHOLD SIZE
2,065
LABOR FORCE [ PEOPLE ]
67.3%
PERCENT IN LABOR FORCE
2.6%
UNEMPLOYMENT RATE
Income in Central Gardens
Income Overview in Central Gardens
Per Capita Income in Central Gardens is $50,040, while median incomes of families and households are $144,332 and $98,750 respectively.
| Characteristic | Number | Measure |
| Per Capita Income | 3,627 | $50,040 |
| Median Family Income | 955 | $144,332 |
| Mean Family Income | 955 | $143,482 |
| Median Household Income | 1,618 | $98,750 |
| Mean Household Income | 1,618 | $111,497 |
| Income Deficit | 955 | $0 |
| Wage / Income Gap (%) | 3,627 | 43.04% |
| Wage / Income Gap ($) | 3,627 | 56.96¢ per $1 |
| Gini / Inequality Index | 3,627 | 0.37 |
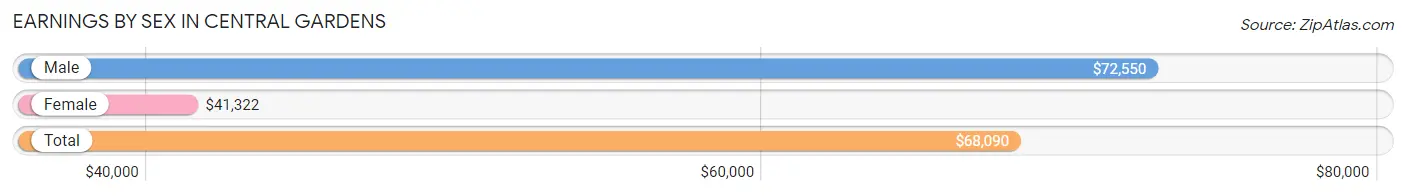
Earnings by Sex in Central Gardens
Average Earnings in Central Gardens are $68,090, $72,550 for men and $41,322 for women, a difference of 43.0%.
| Sex | Number | Average Earnings |
| Male | 1,197 (57.4%) | $72,550 |
| Female | 889 (42.6%) | $41,322 |
| Total | 2,086 (100.0%) | $68,090 |
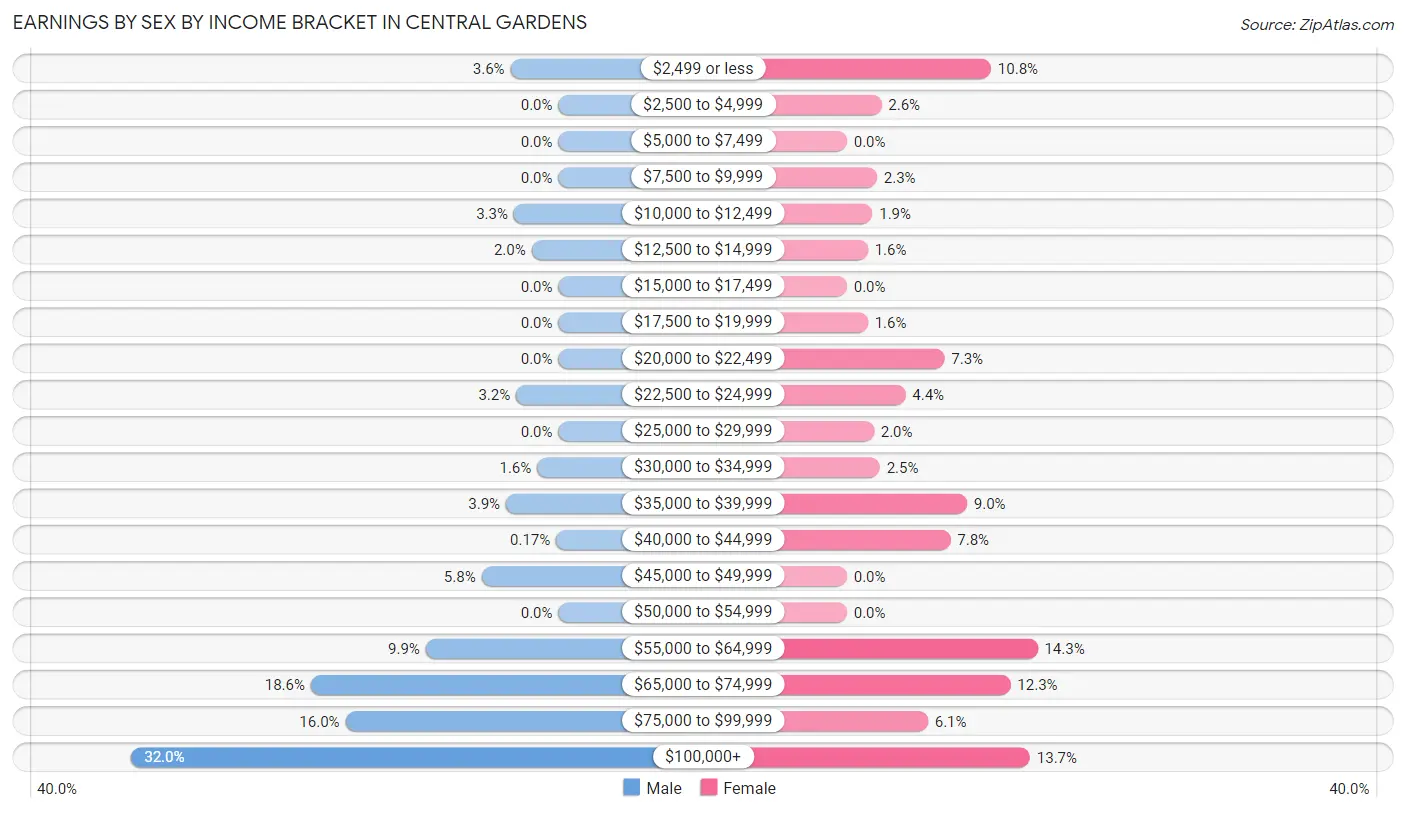
Earnings by Sex by Income Bracket in Central Gardens
The most common earnings brackets in Central Gardens are $100,000+ for men (383 | 32.0%) and $55,000 to $64,999 for women (127 | 14.3%).
| Income | Male | Female |
| $2,499 or less | 43 (3.6%) | 96 (10.8%) |
| $2,500 to $4,999 | 0 (0.0%) | 23 (2.6%) |
| $5,000 to $7,499 | 0 (0.0%) | 0 (0.0%) |
| $7,500 to $9,999 | 0 (0.0%) | 20 (2.2%) |
| $10,000 to $12,499 | 40 (3.3%) | 17 (1.9%) |
| $12,500 to $14,999 | 24 (2.0%) | 14 (1.6%) |
| $15,000 to $17,499 | 0 (0.0%) | 0 (0.0%) |
| $17,500 to $19,999 | 0 (0.0%) | 14 (1.6%) |
| $20,000 to $22,499 | 0 (0.0%) | 65 (7.3%) |
| $22,500 to $24,999 | 38 (3.2%) | 39 (4.4%) |
| $25,000 to $29,999 | 0 (0.0%) | 18 (2.0%) |
| $30,000 to $34,999 | 19 (1.6%) | 22 (2.5%) |
| $35,000 to $39,999 | 47 (3.9%) | 80 (9.0%) |
| $40,000 to $44,999 | 2 (0.2%) | 69 (7.8%) |
| $45,000 to $49,999 | 69 (5.8%) | 0 (0.0%) |
| $50,000 to $54,999 | 0 (0.0%) | 0 (0.0%) |
| $55,000 to $64,999 | 119 (9.9%) | 127 (14.3%) |
| $65,000 to $74,999 | 222 (18.5%) | 109 (12.3%) |
| $75,000 to $99,999 | 191 (16.0%) | 54 (6.1%) |
| $100,000+ | 383 (32.0%) | 122 (13.7%) |
| Total | 1,197 (100.0%) | 889 (100.0%) |
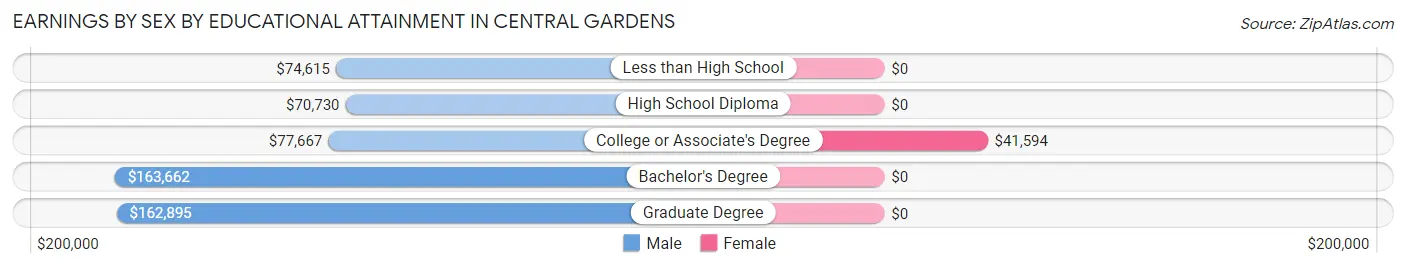
Earnings by Sex by Educational Attainment in Central Gardens
Average earnings in Central Gardens are $79,750 for men and $57,951 for women, a difference of 27.3%. Men with an educational attainment of bachelor's degree enjoy the highest average annual earnings of $163,662, while those with high school diploma education earn the least with $70,730. Women with an educational attainment of college or associate's degree earn the most with the average annual earnings of $41,594, while those with college or associate's degree education have the smallest earnings of $41,594.
| Educational Attainment | Male Income | Female Income |
| Less than High School | $74,615 | $0 |
| High School Diploma | $70,730 | $0 |
| College or Associate's Degree | $77,667 | $41,594 |
| Bachelor's Degree | $163,662 | $0 |
| Graduate Degree | $162,895 | $0 |
| Total | $79,750 | $57,951 |
Family Income in Central Gardens
Family Income Brackets in Central Gardens
According to the Central Gardens family income data, there are 232 families falling into the $150,000 to $199,999 income range, which is the most common income bracket and makes up 24.3% of all families.
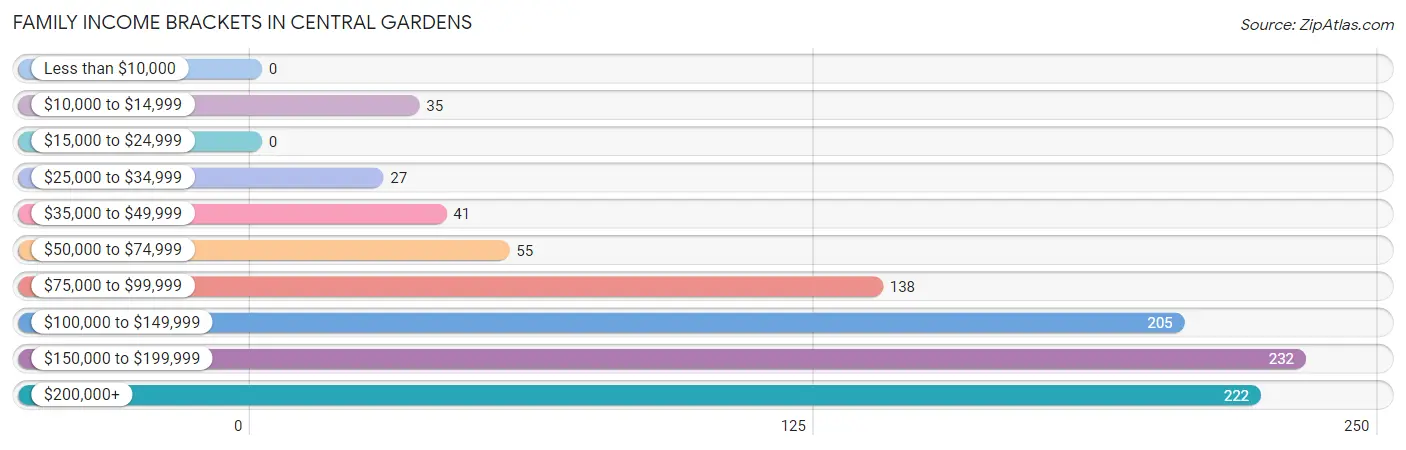
| Income Bracket | # Families | % Families |
| Less than $10,000 | 0 | 0.0% |
| $10,000 to $14,999 | 35 | 3.7% |
| $15,000 to $24,999 | 0 | 0.0% |
| $25,000 to $34,999 | 27 | 2.8% |
| $35,000 to $49,999 | 41 | 4.3% |
| $50,000 to $74,999 | 55 | 5.8% |
| $75,000 to $99,999 | 138 | 14.5% |
| $100,000 to $149,999 | 205 | 21.5% |
| $150,000 to $199,999 | 232 | 24.3% |
| $200,000+ | 222 | 23.2% |
Family Income by Famaliy Size in Central Gardens
4-person families (86 | 9.0%) account for the highest median family income in Central Gardens with $195,738 per family, while 3-person families (296 | 31.0%) have the highest median income of $60,509 per family member.
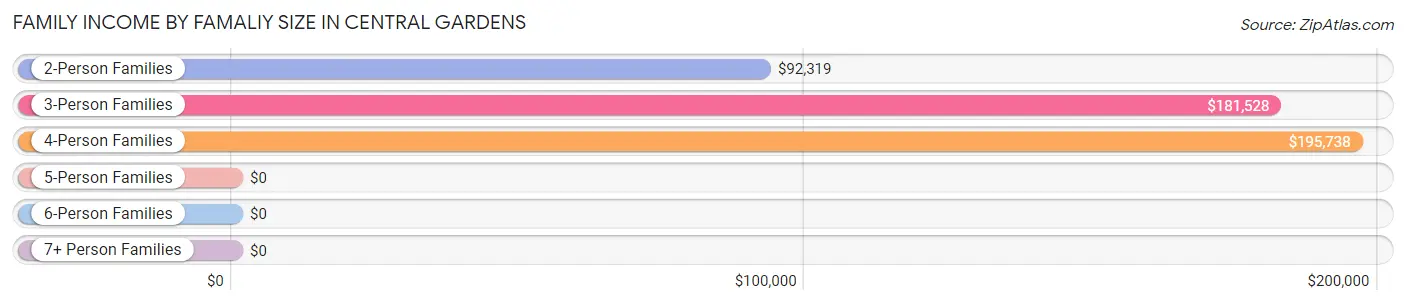
| Income Bracket | # Families | Median Income |
| 2-Person Families | 441 (46.2%) | $92,319 |
| 3-Person Families | 296 (31.0%) | $181,528 |
| 4-Person Families | 86 (9.0%) | $195,738 |
| 5-Person Families | 88 (9.2%) | $0 |
| 6-Person Families | 44 (4.6%) | $0 |
| 7+ Person Families | 0 (0.0%) | $0 |
| Total | 955 (100.0%) | $144,332 |
Family Income by Number of Earners in Central Gardens
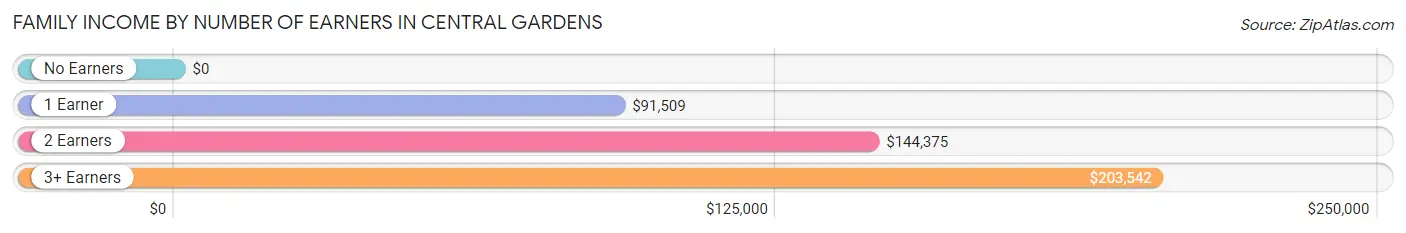
| Number of Earners | # Families | Median Income |
| No Earners | 131 (13.7%) | $0 |
| 1 Earner | 314 (32.9%) | $91,509 |
| 2 Earners | 306 (32.0%) | $144,375 |
| 3+ Earners | 204 (21.4%) | $203,542 |
| Total | 955 (100.0%) | $144,332 |
Household Income in Central Gardens
Household Income Brackets in Central Gardens
With 328 households falling in the category, the $150,000 to $199,999 income range is the most frequent in Central Gardens, accounting for 20.3% of all households. In contrast, only 15 households (0.9%) fall into the less than $10,000 income bracket, making it the least populous group.
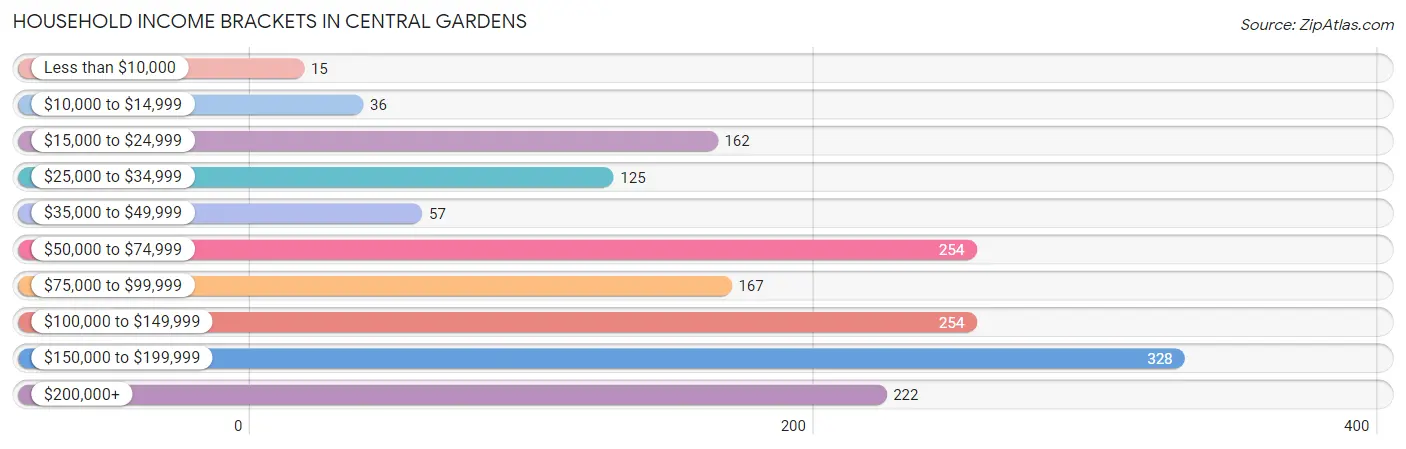
| Income Bracket | # Households | % Households |
| Less than $10,000 | 15 | 0.9% |
| $10,000 to $14,999 | 36 | 2.2% |
| $15,000 to $24,999 | 162 | 10.0% |
| $25,000 to $34,999 | 125 | 7.7% |
| $35,000 to $49,999 | 57 | 3.5% |
| $50,000 to $74,999 | 254 | 15.7% |
| $75,000 to $99,999 | 167 | 10.3% |
| $100,000 to $149,999 | 254 | 15.7% |
| $150,000 to $199,999 | 328 | 20.3% |
| $200,000+ | 222 | 13.7% |
Household Income by Householder Age in Central Gardens
The median household income in Central Gardens is $98,750, with the highest median household income of $142,656 found in the 25 to 44 years age bracket for the primary householder. A total of 311 households (19.2%) fall into this category. Meanwhile, the 15 to 24 years age bracket for the primary householder has the lowest median household income of $0, with 30 households (1.8%) in this group.
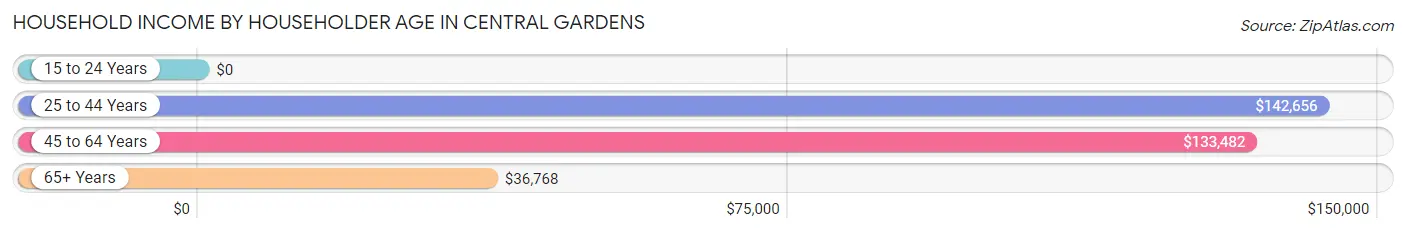
| Income Bracket | # Households | Median Income |
| 15 to 24 Years | 30 (1.8%) | $0 |
| 25 to 44 Years | 311 (19.2%) | $142,656 |
| 45 to 64 Years | 859 (53.1%) | $133,482 |
| 65+ Years | 418 (25.8%) | $36,768 |
| Total | 1,618 (100.0%) | $98,750 |
Poverty in Central Gardens
Income Below Poverty by Sex and Age in Central Gardens
With 0.3% poverty level for males and 10.1% for females among the residents of Central Gardens, 65 to 74 year old males and under 5 year old females are the most vulnerable to poverty, with 2 males (1.5%) and 51 females (78.5%) in their respective age groups living below the poverty level.
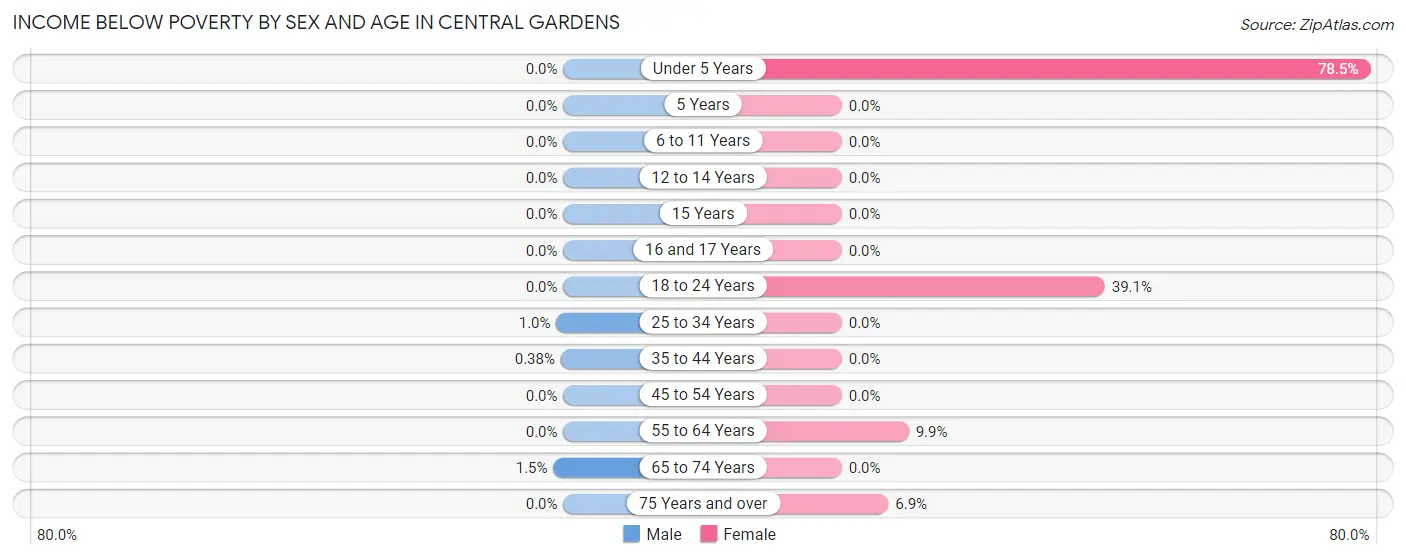
| Age Bracket | Male | Female |
| Under 5 Years | 0 (0.0%) | 51 (78.5%) |
| 5 Years | 0 (0.0%) | 0 (0.0%) |
| 6 to 11 Years | 0 (0.0%) | 0 (0.0%) |
| 12 to 14 Years | 0 (0.0%) | 0 (0.0%) |
| 15 Years | 0 (0.0%) | 0 (0.0%) |
| 16 and 17 Years | 0 (0.0%) | 0 (0.0%) |
| 18 to 24 Years | 0 (0.0%) | 82 (39.1%) |
| 25 to 34 Years | 2 (1.0%) | 0 (0.0%) |
| 35 to 44 Years | 1 (0.4%) | 0 (0.0%) |
| 45 to 54 Years | 0 (0.0%) | 0 (0.0%) |
| 55 to 64 Years | 0 (0.0%) | 35 (9.9%) |
| 65 to 74 Years | 2 (1.5%) | 0 (0.0%) |
| 75 Years and over | 0 (0.0%) | 15 (6.9%) |
| Total | 5 (0.3%) | 183 (10.1%) |
Income Above Poverty by Sex and Age in Central Gardens
According to the poverty statistics in Central Gardens, males aged under 5 years and females aged 6 to 11 years are the age groups that are most secure financially, with 100.0% of males and 100.0% of females in these age groups living above the poverty line.
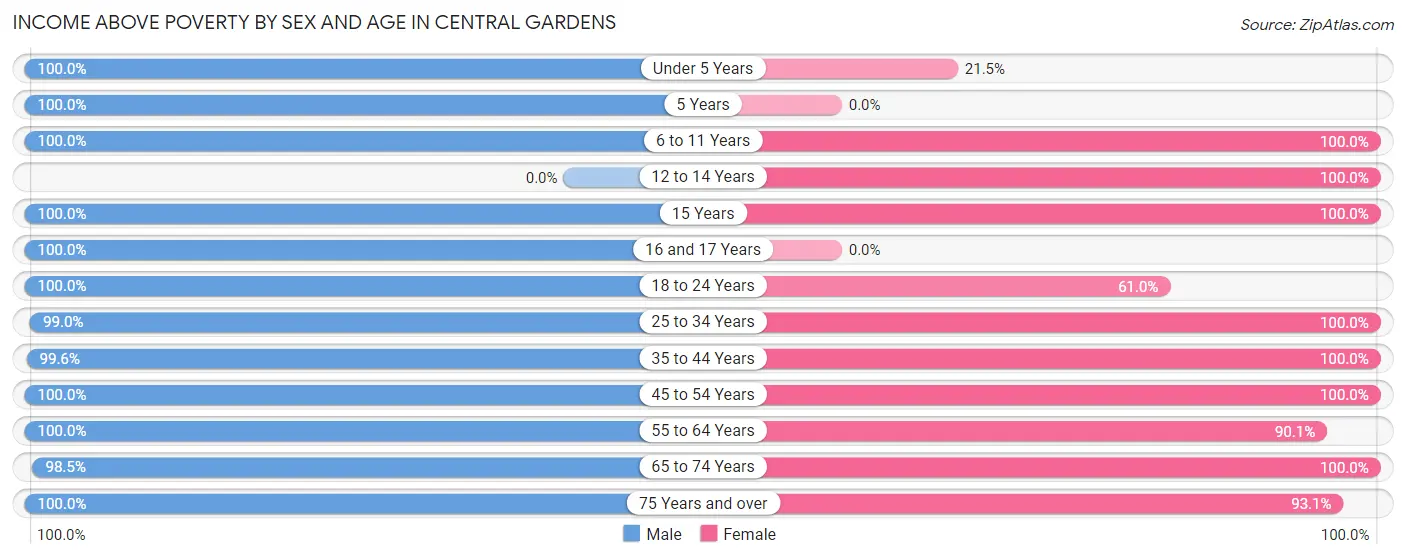
| Age Bracket | Male | Female |
| Under 5 Years | 16 (100.0%) | 14 (21.5%) |
| 5 Years | 111 (100.0%) | 0 (0.0%) |
| 6 to 11 Years | 72 (100.0%) | 79 (100.0%) |
| 12 to 14 Years | 0 (0.0%) | 126 (100.0%) |
| 15 Years | 28 (100.0%) | 61 (100.0%) |
| 16 and 17 Years | 114 (100.0%) | 0 (0.0%) |
| 18 to 24 Years | 143 (100.0%) | 128 (61.0%) |
| 25 to 34 Years | 190 (99.0%) | 47 (100.0%) |
| 35 to 44 Years | 260 (99.6%) | 316 (100.0%) |
| 45 to 54 Years | 336 (100.0%) | 209 (100.0%) |
| 55 to 64 Years | 286 (100.0%) | 317 (90.1%) |
| 65 to 74 Years | 133 (98.5%) | 136 (100.0%) |
| 75 Years and over | 115 (100.0%) | 202 (93.1%) |
| Total | 1,804 (99.7%) | 1,635 (89.9%) |
Income Below Poverty Among Married-Couple Families in Central Gardens
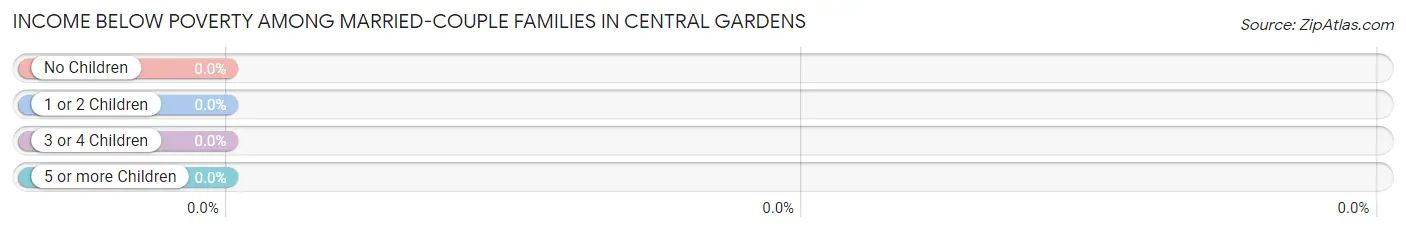
| Children | Above Poverty | Below Poverty |
| No Children | 576 (100.0%) | 0 (0.0%) |
| 1 or 2 Children | 150 (100.0%) | 0 (0.0%) |
| 3 or 4 Children | 107 (100.0%) | 0 (0.0%) |
| 5 or more Children | 0 (0.0%) | 0 (0.0%) |
| Total | 833 (100.0%) | 0 (0.0%) |
Income Below Poverty Among Single-Parent Households in Central Gardens
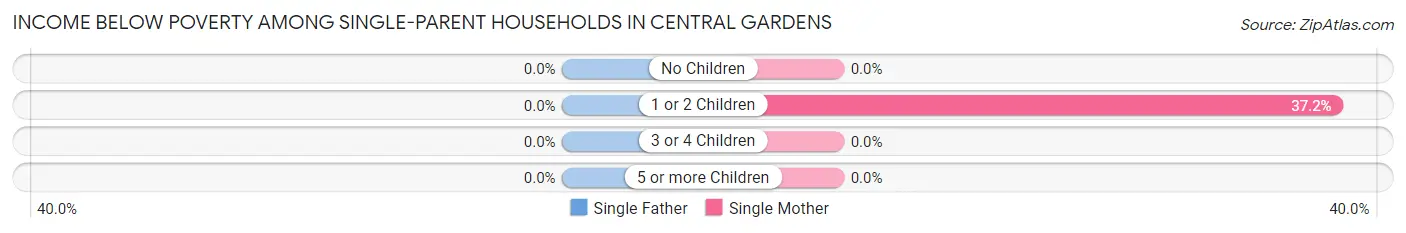
| Children | Single Father | Single Mother |
| No Children | 0 (0.0%) | 0 (0.0%) |
| 1 or 2 Children | 0 (0.0%) | 35 (37.2%) |
| 3 or 4 Children | 0 (0.0%) | 0 (0.0%) |
| 5 or more Children | 0 (0.0%) | 0 (0.0%) |
| Total | 0 (0.0%) | 35 (37.2%) |
Income Below Poverty Among Married-Couple vs Single-Parent Households in Central Gardens
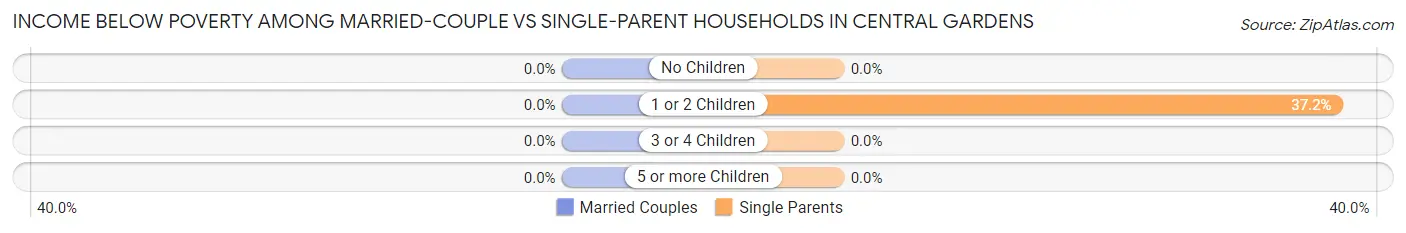
| Children | Married-Couple Families | Single-Parent Households |
| No Children | 0 (0.0%) | 0 (0.0%) |
| 1 or 2 Children | 0 (0.0%) | 35 (37.2%) |
| 3 or 4 Children | 0 (0.0%) | 0 (0.0%) |
| 5 or more Children | 0 (0.0%) | 0 (0.0%) |
| Total | 0 (0.0%) | 35 (28.7%) |
Race in Central Gardens
The most populous races in Central Gardens are White / Caucasian (3,032 | 83.6%), Hispanic or Latino (423 | 11.7%), and Two or more Races (346 | 9.5%).
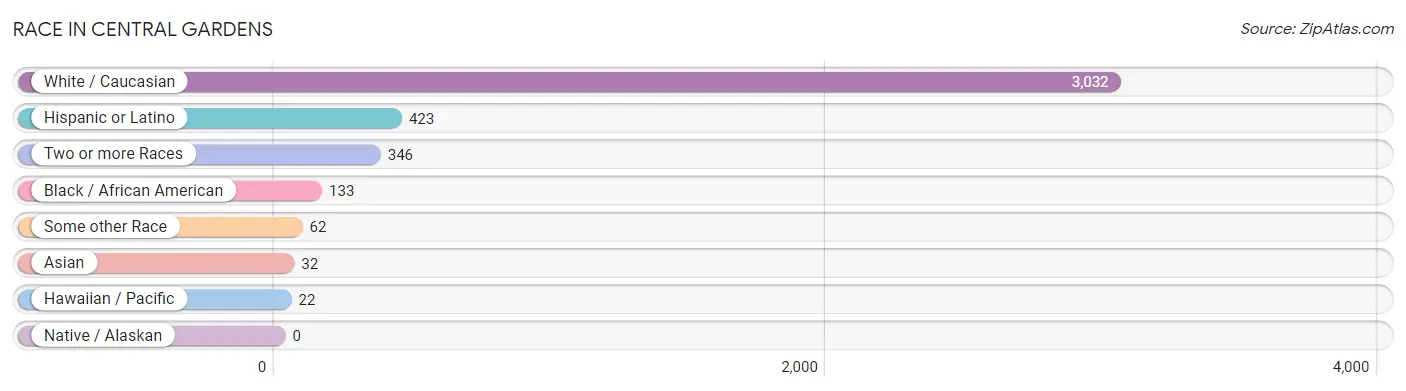
| Race | # Population | % Population |
| Asian | 32 | 0.9% |
| Black / African American | 133 | 3.7% |
| Hawaiian / Pacific | 22 | 0.6% |
| Hispanic or Latino | 423 | 11.7% |
| Native / Alaskan | 0 | 0.0% |
| White / Caucasian | 3,032 | 83.6% |
| Two or more Races | 346 | 9.5% |
| Some other Race | 62 | 1.7% |
| Total | 3,627 | 100.0% |
Ancestry in Central Gardens
The most populous ancestries reported in Central Gardens are Irish (784 | 21.6%), French (386 | 10.6%), German (282 | 7.8%), Scotch-Irish (271 | 7.5%), and Mexican (247 | 6.8%), together accounting for 54.3% of all Central Gardens residents.
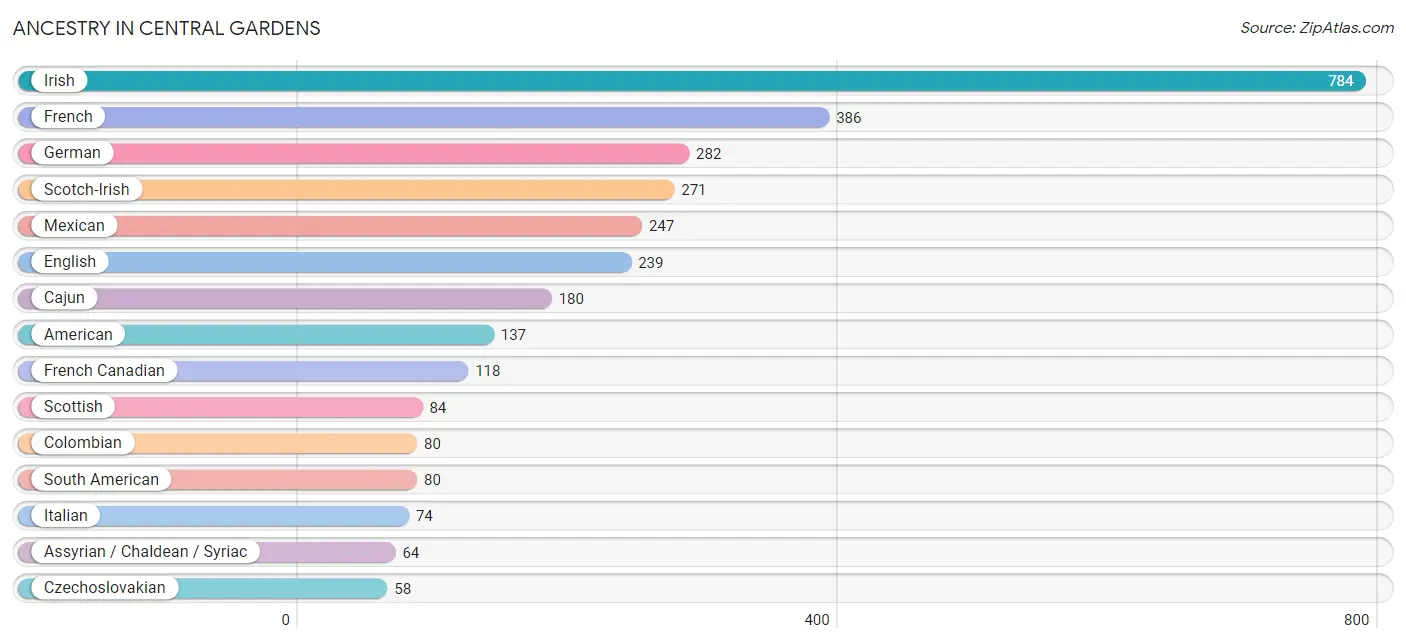
| Ancestry | # Population | % Population |
| American | 137 | 3.8% |
| Assyrian / Chaldean / Syriac | 64 | 1.8% |
| Cajun | 180 | 5.0% |
| Central American | 2 | 0.1% |
| Colombian | 80 | 2.2% |
| Czech | 14 | 0.4% |
| Czechoslovakian | 58 | 1.6% |
| Dutch | 22 | 0.6% |
| English | 239 | 6.6% |
| European | 8 | 0.2% |
| French | 386 | 10.6% |
| French Canadian | 118 | 3.3% |
| German | 282 | 7.8% |
| Indian (Asian) | 32 | 0.9% |
| Irish | 784 | 21.6% |
| Italian | 74 | 2.0% |
| Mexican | 247 | 6.8% |
| Native Hawaiian | 22 | 0.6% |
| Nicaraguan | 2 | 0.1% |
| Puerto Rican | 55 | 1.5% |
| Scotch-Irish | 271 | 7.5% |
| Scottish | 84 | 2.3% |
| Sioux | 43 | 1.2% |
| South American | 80 | 2.2% |
| Spanish | 39 | 1.1% | View All 25 Rows |
Immigrants in Central Gardens
The most numerous immigrant groups reported in Central Gardens came from Central America (111 | 3.1%), Latin America (111 | 3.1%), Mexico (109 | 3.0%), Asia (32 | 0.9%), and China (32 | 0.9%), together accounting for 10.9% of all Central Gardens residents.
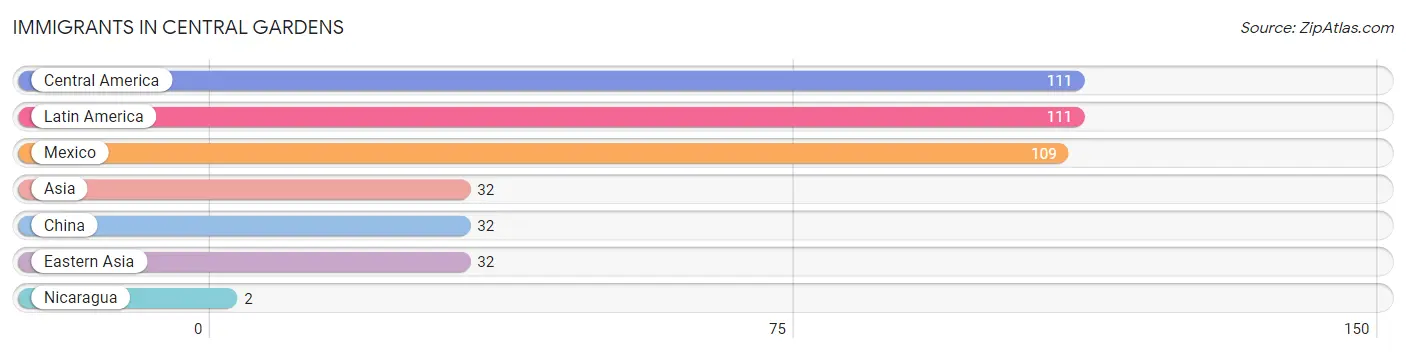
| Immigration Origin | # Population | % Population |
| Asia | 32 | 0.9% |
| Central America | 111 | 3.1% |
| China | 32 | 0.9% |
| Eastern Asia | 32 | 0.9% |
| Latin America | 111 | 3.1% |
| Mexico | 109 | 3.0% |
| Nicaragua | 2 | 0.1% | View All 7 Rows |
Sex and Age in Central Gardens
Sex and Age in Central Gardens
The most populous age groups in Central Gardens are 50 to 54 Years (227 | 12.6%) for men and 15 to 19 Years (199 | 11.0%) for women.
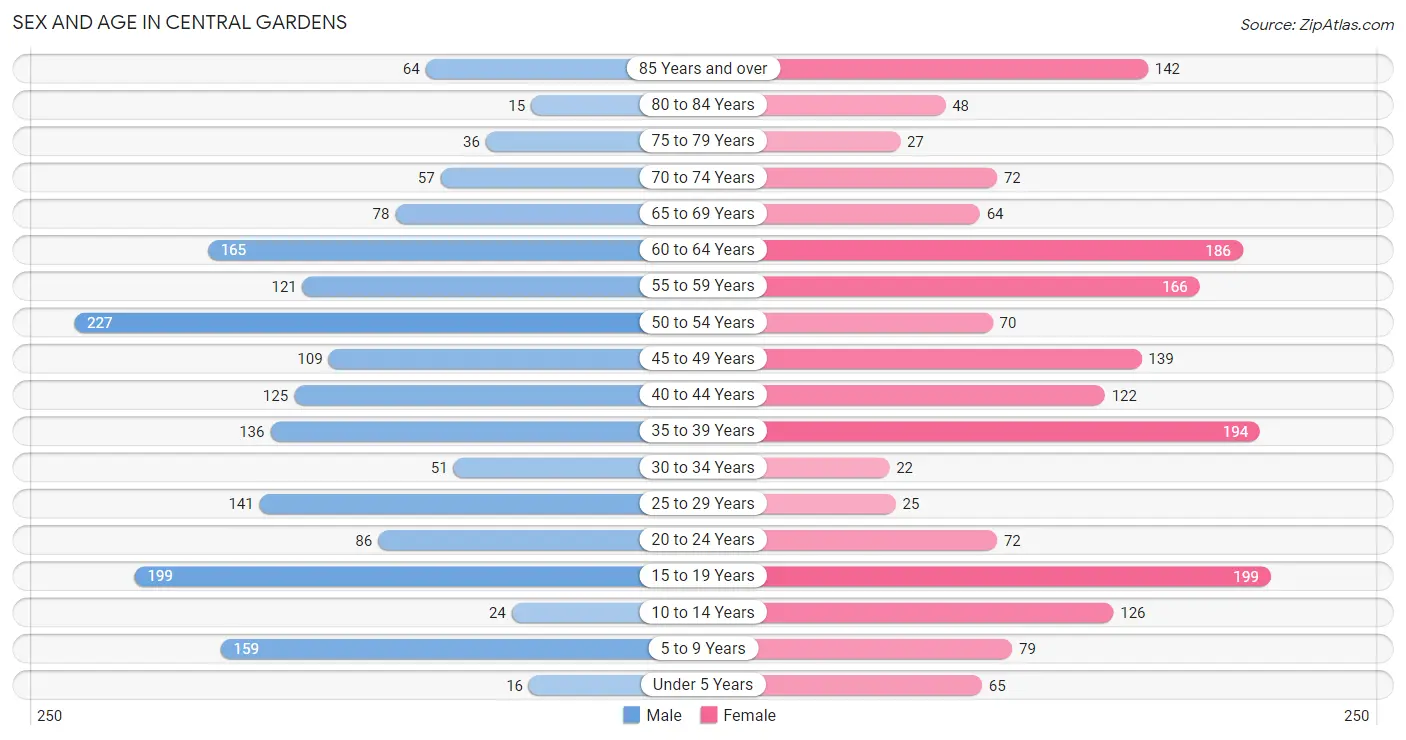
| Age Bracket | Male | Female |
| Under 5 Years | 16 (0.9%) | 65 (3.6%) |
| 5 to 9 Years | 159 (8.8%) | 79 (4.3%) |
| 10 to 14 Years | 24 (1.3%) | 126 (6.9%) |
| 15 to 19 Years | 199 (11.0%) | 199 (11.0%) |
| 20 to 24 Years | 86 (4.8%) | 72 (4.0%) |
| 25 to 29 Years | 141 (7.8%) | 25 (1.4%) |
| 30 to 34 Years | 51 (2.8%) | 22 (1.2%) |
| 35 to 39 Years | 136 (7.5%) | 194 (10.7%) |
| 40 to 44 Years | 125 (6.9%) | 122 (6.7%) |
| 45 to 49 Years | 109 (6.0%) | 139 (7.6%) |
| 50 to 54 Years | 227 (12.6%) | 70 (3.8%) |
| 55 to 59 Years | 121 (6.7%) | 166 (9.1%) |
| 60 to 64 Years | 165 (9.1%) | 186 (10.2%) |
| 65 to 69 Years | 78 (4.3%) | 64 (3.5%) |
| 70 to 74 Years | 57 (3.2%) | 72 (4.0%) |
| 75 to 79 Years | 36 (2.0%) | 27 (1.5%) |
| 80 to 84 Years | 15 (0.8%) | 48 (2.6%) |
| 85 Years and over | 64 (3.5%) | 142 (7.8%) |
| Total | 1,809 (100.0%) | 1,818 (100.0%) |
Families and Households in Central Gardens
Median Family Size in Central Gardens
The median family size in Central Gardens is 3.02 persons per family, with single female/mother families (94 | 9.8%) accounting for the largest median family size of 4.62 persons per family. On the other hand, single male/father families (28 | 2.9%) represent the smallest median family size with 1.89 persons per family.
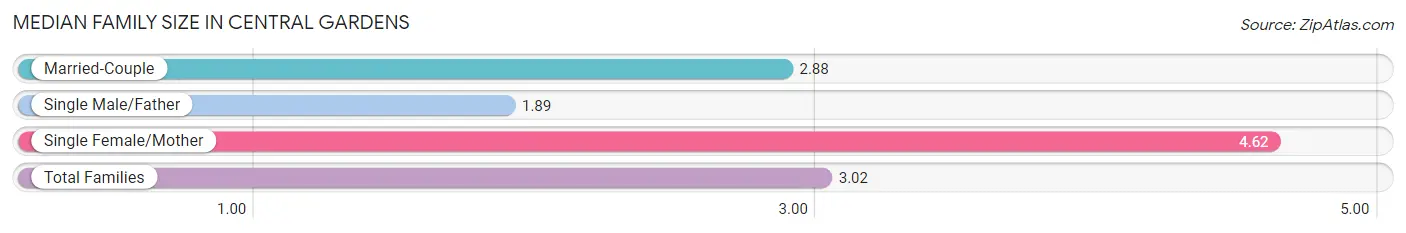
| Family Type | # Families | Family Size |
| Married-Couple | 833 (87.2%) | 2.88 |
| Single Male/Father | 28 (2.9%) | 1.89 |
| Single Female/Mother | 94 (9.8%) | 4.62 |
| Total Families | 955 (100.0%) | 3.02 |
Median Household Size in Central Gardens
The median household size in Central Gardens is 2.24 persons per household, with single female/mother households (94 | 5.8%) accounting for the largest median household size of 4.62 persons per household. non-family households (663 | 41.0%) represent the smallest median household size with 1.07 persons per household.
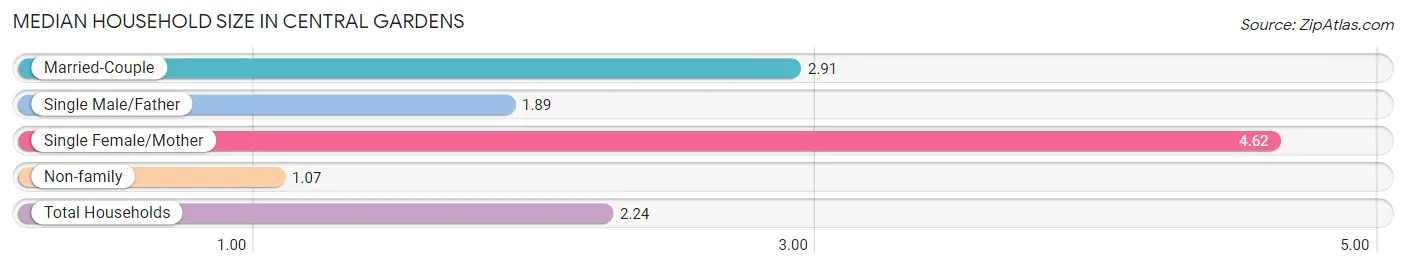
| Household Type | # Households | Household Size |
| Married-Couple | 833 (51.5%) | 2.91 |
| Single Male/Father | 28 (1.7%) | 1.89 |
| Single Female/Mother | 94 (5.8%) | 4.62 |
| Non-family | 663 (41.0%) | 1.07 |
| Total Households | 1,618 (100.0%) | 2.24 |
Household Size by Marriage Status in Central Gardens
Out of a total of 1,618 households in Central Gardens, 955 (59.0%) are family households, while 663 (41.0%) are nonfamily households. The most numerous type of family households are 2-person households, comprising 441, and the most common type of nonfamily households are 1-person households, comprising 631.
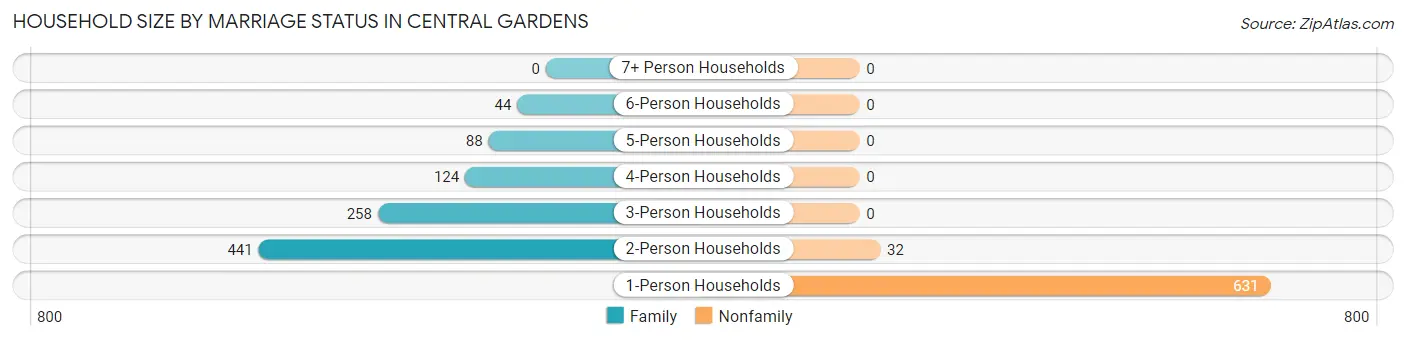
| Household Size | Family Households | Nonfamily Households |
| 1-Person Households | - | 631 (39.0%) |
| 2-Person Households | 441 (27.3%) | 32 (2.0%) |
| 3-Person Households | 258 (16.0%) | 0 (0.0%) |
| 4-Person Households | 124 (7.7%) | 0 (0.0%) |
| 5-Person Households | 88 (5.4%) | 0 (0.0%) |
| 6-Person Households | 44 (2.7%) | 0 (0.0%) |
| 7+ Person Households | 0 (0.0%) | 0 (0.0%) |
| Total | 955 (59.0%) | 663 (41.0%) |
Female Fertility in Central Gardens
Fertility by Age in Central Gardens
Average fertility rate in Central Gardens is 106.0 births per 1,000 women. Women in the age bracket of 15 to 19 years have the highest fertility rate with 412.0 births per 1,000 women. Women in the age bracket of 15 to 19 years acount for 100.0% of all women with births.
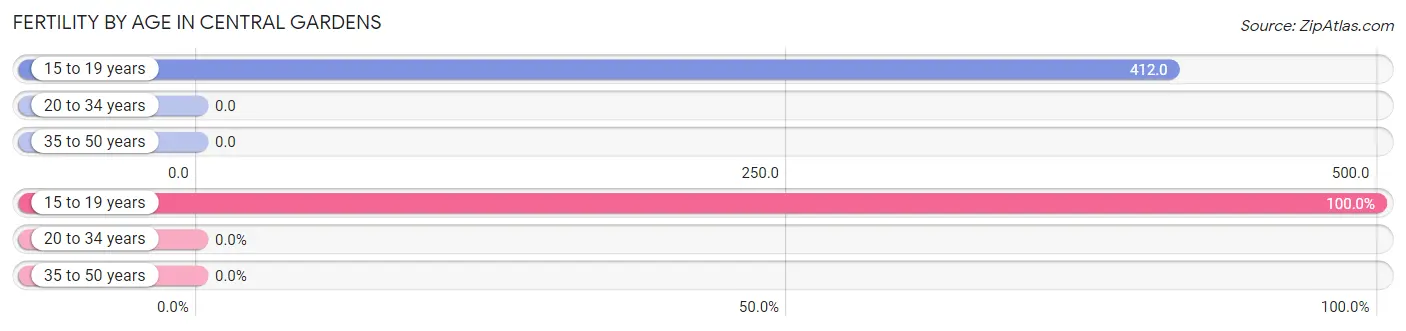
| Age Bracket | Women with Births | Births / 1,000 Women |
| 15 to 19 years | 82 (100.0%) | 412.0 |
| 20 to 34 years | 0 (0.0%) | 0.0 |
| 35 to 50 years | 0 (0.0%) | 0.0 |
| Total | 82 (100.0%) | 106.0 |
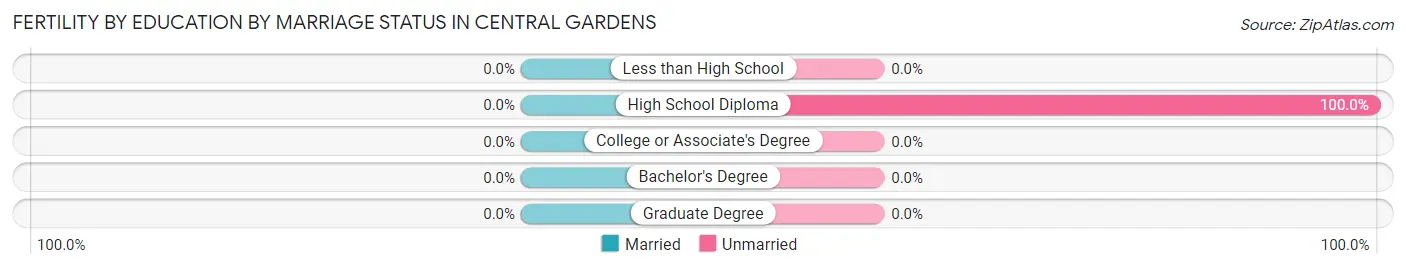
Fertility by Age by Marriage Status in Central Gardens
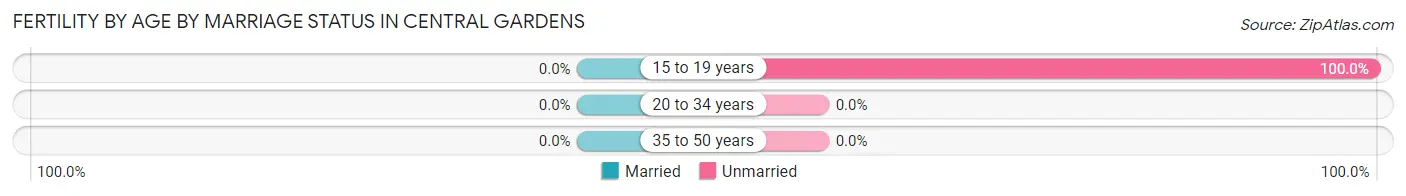
| Age Bracket | Married | Unmarried |
| 15 to 19 years | 0 (0.0%) | 82 (100.0%) |
| 20 to 34 years | 0 (0.0%) | 0 (0.0%) |
| 35 to 50 years | 0 (0.0%) | 0 (0.0%) |
| Total | 0 (0.0%) | 82 (100.0%) |
Fertility by Education in Central Gardens
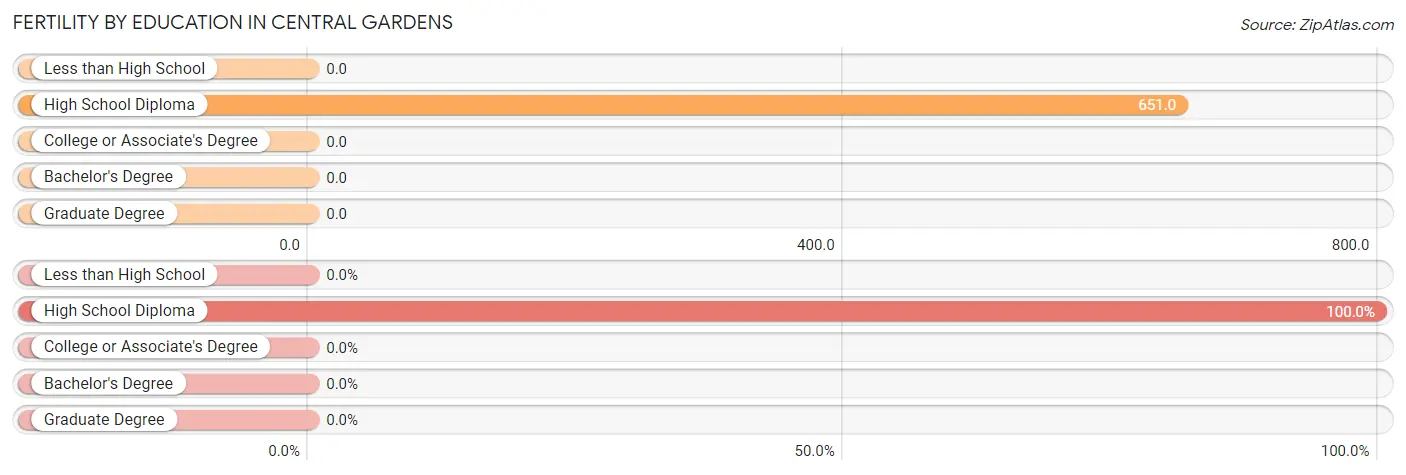
| Educational Attainment | Women with Births | Births / 1,000 Women |
| Less than High School | 0 (0.0%) | 0.0 |
| High School Diploma | 82 (100.0%) | 651.0 |
| College or Associate's Degree | 0 (0.0%) | 0.0 |
| Bachelor's Degree | 0 (0.0%) | 0.0 |
| Graduate Degree | 0 (0.0%) | 0.0 |
| Total | 82 (100.0%) | 106.0 |
Fertility by Education by Marriage Status in Central Gardens
| Educational Attainment | Married | Unmarried |
| Less than High School | 0 (0.0%) | 0 (0.0%) |
| High School Diploma | 0 (0.0%) | 82 (100.0%) |
| College or Associate's Degree | 0 (0.0%) | 0 (0.0%) |
| Bachelor's Degree | 0 (0.0%) | 0 (0.0%) |
| Graduate Degree | 0 (0.0%) | 0 (0.0%) |
| Total | 0 (0.0%) | 82 (100.0%) |
Employment Characteristics in Central Gardens
Employment by Class of Employer in Central Gardens
Among the 1,980 employed individuals in Central Gardens, private company employees (1,738 | 87.8%), not-for-profit organizations (77 | 3.9%), and self-employed (not incorporated) (49 | 2.5%) make up the most common classes of employment.
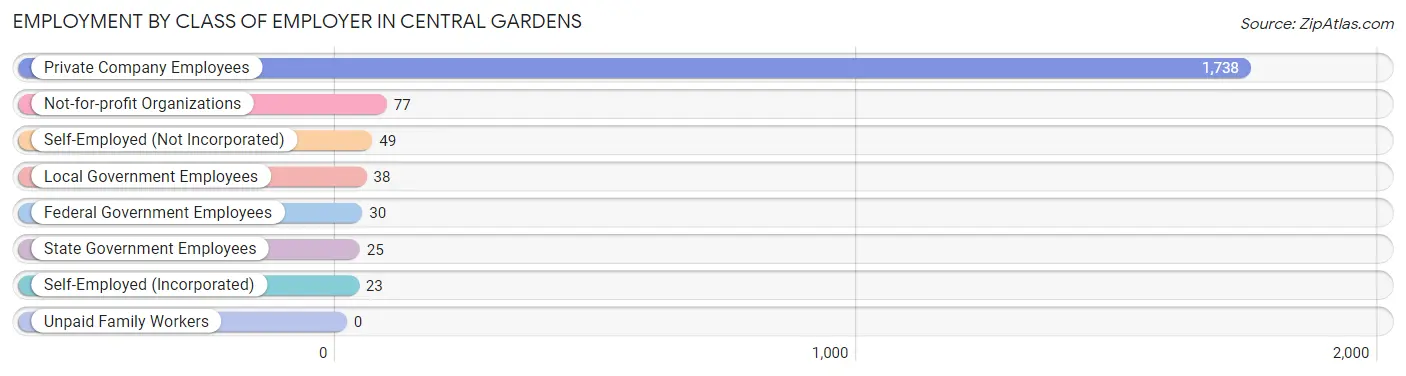
| Employer Class | # Employees | % Employees |
| Private Company Employees | 1,738 | 87.8% |
| Self-Employed (Incorporated) | 23 | 1.2% |
| Self-Employed (Not Incorporated) | 49 | 2.5% |
| Not-for-profit Organizations | 77 | 3.9% |
| Local Government Employees | 38 | 1.9% |
| State Government Employees | 25 | 1.3% |
| Federal Government Employees | 30 | 1.5% |
| Unpaid Family Workers | 0 | 0.0% |
| Total | 1,980 | 100.0% |
Employment Status by Age in Central Gardens
According to the labor force statistics for Central Gardens, out of the total population over 16 years of age (3,069), 67.3% or 2,065 individuals are in the labor force, with 2.6% or 54 of them unemployed. The age group with the highest labor force participation rate is 30 to 34 years, with 100.0% or 73 individuals in the labor force. Within the labor force, the 20 to 24 years age range has the highest percentage of unemployed individuals, with 19.5% or 25 of them being unemployed.
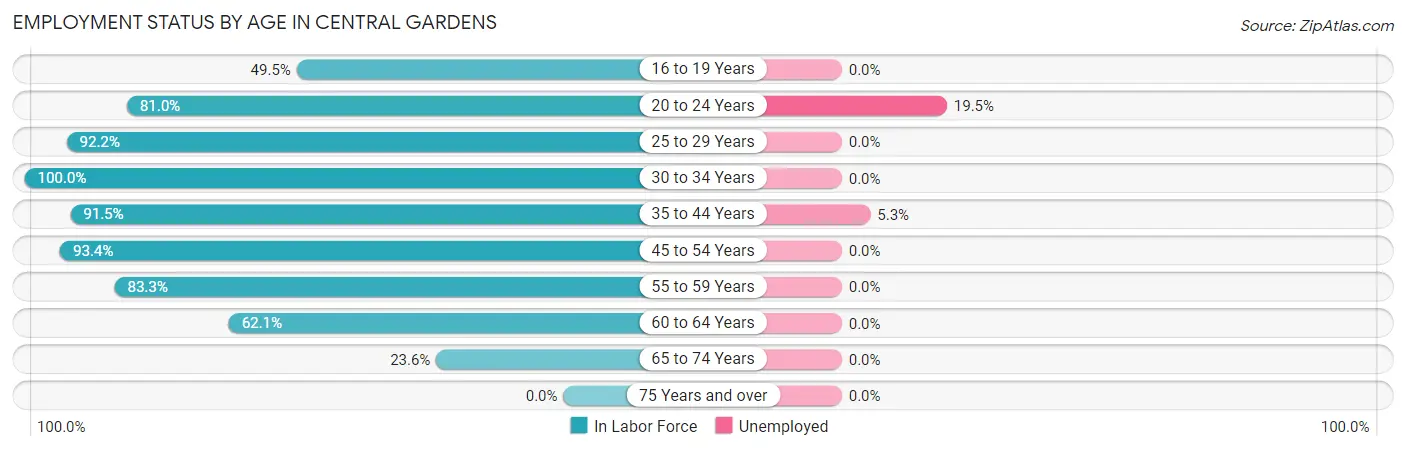
| Age Bracket | In Labor Force | Unemployed |
| 16 to 19 Years | 153 (49.5%) | 0 (0.0%) |
| 20 to 24 Years | 128 (81.0%) | 25 (19.5%) |
| 25 to 29 Years | 153 (92.2%) | 0 (0.0%) |
| 30 to 34 Years | 73 (100.0%) | 0 (0.0%) |
| 35 to 44 Years | 528 (91.5%) | 28 (5.3%) |
| 45 to 54 Years | 509 (93.4%) | 0 (0.0%) |
| 55 to 59 Years | 239 (83.3%) | 0 (0.0%) |
| 60 to 64 Years | 218 (62.1%) | 0 (0.0%) |
| 65 to 74 Years | 64 (23.6%) | 0 (0.0%) |
| 75 Years and over | 0 (0.0%) | 0 (0.0%) |
| Total | 2,065 (67.3%) | 54 (2.6%) |
Employment Status by Educational Attainment in Central Gardens
According to labor force statistics for Central Gardens, 86.0% of individuals (1,719) out of the total population between 25 and 64 years of age (1,999) are in the labor force, with 1.6% or 28 of them being unemployed. The group with the highest labor force participation rate are those with the educational attainment of less than high school, with 97.8% or 45 individuals in the labor force. Within the labor force, individuals with college / associate degree education have the highest percentage of unemployment, with 3.6% or 28 of them being unemployed.
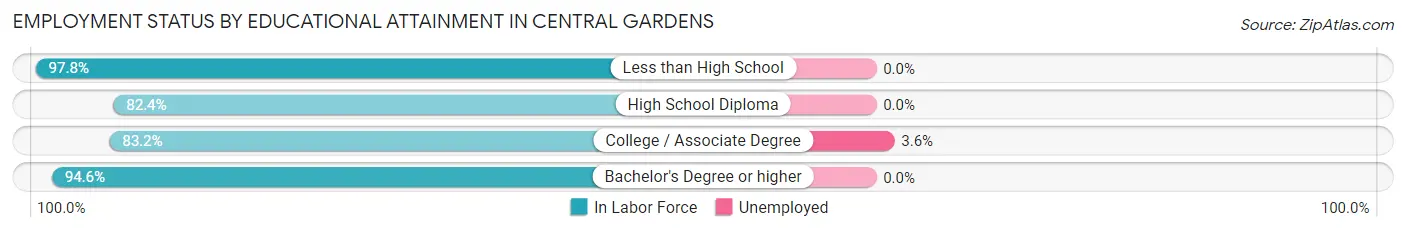
| Educational Attainment | In Labor Force | Unemployed |
| Less than High School | 45 (97.8%) | 0 (0.0%) |
| High School Diploma | 440 (82.4%) | 0 (0.0%) |
| College / Associate Degree | 783 (83.2%) | 34 (3.6%) |
| Bachelor's Degree or higher | 452 (94.6%) | 0 (0.0%) |
| Total | 1,719 (86.0%) | 32 (1.6%) |
Employment Occupations by Sex in Central Gardens
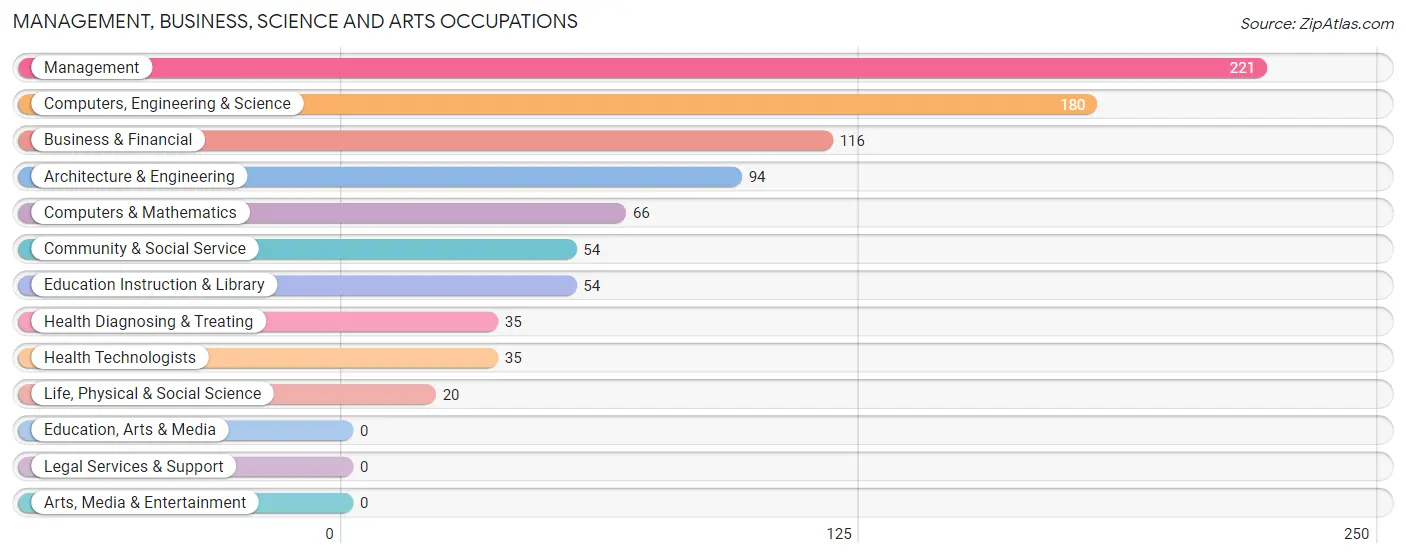
Management, Business, Science and Arts Occupations
The most common Management, Business, Science and Arts occupations in Central Gardens are Management (221 | 11.0%), Computers, Engineering & Science (180 | 8.9%), Business & Financial (116 | 5.8%), Architecture & Engineering (94 | 4.7%), and Computers & Mathematics (66 | 3.3%).
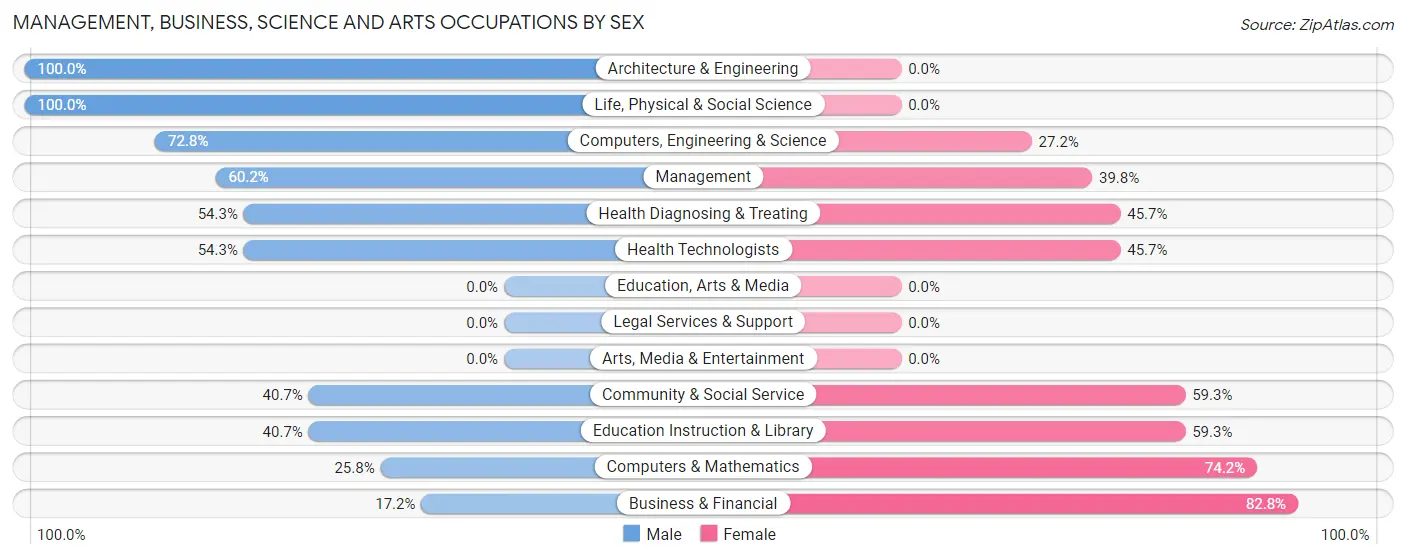
Management, Business, Science and Arts Occupations by Sex
Within the Management, Business, Science and Arts occupations in Central Gardens, the most male-oriented occupations are Architecture & Engineering (100.0%), Life, Physical & Social Science (100.0%), and Computers, Engineering & Science (72.8%), while the most female-oriented occupations are Business & Financial (82.8%), Computers & Mathematics (74.2%), and Community & Social Service (59.3%).
| Occupation | Male | Female |
| Management | 133 (60.2%) | 88 (39.8%) |
| Business & Financial | 20 (17.2%) | 96 (82.8%) |
| Computers, Engineering & Science | 131 (72.8%) | 49 (27.2%) |
| Computers & Mathematics | 17 (25.8%) | 49 (74.2%) |
| Architecture & Engineering | 94 (100.0%) | 0 (0.0%) |
| Life, Physical & Social Science | 20 (100.0%) | 0 (0.0%) |
| Community & Social Service | 22 (40.7%) | 32 (59.3%) |
| Education, Arts & Media | 0 (0.0%) | 0 (0.0%) |
| Legal Services & Support | 0 (0.0%) | 0 (0.0%) |
| Education Instruction & Library | 22 (40.7%) | 32 (59.3%) |
| Arts, Media & Entertainment | 0 (0.0%) | 0 (0.0%) |
| Health Diagnosing & Treating | 19 (54.3%) | 16 (45.7%) |
| Health Technologists | 19 (54.3%) | 16 (45.7%) |
| Total (Category) | 325 (53.6%) | 281 (46.4%) |
| Total (Overall) | 1,171 (58.2%) | 841 (41.8%) |
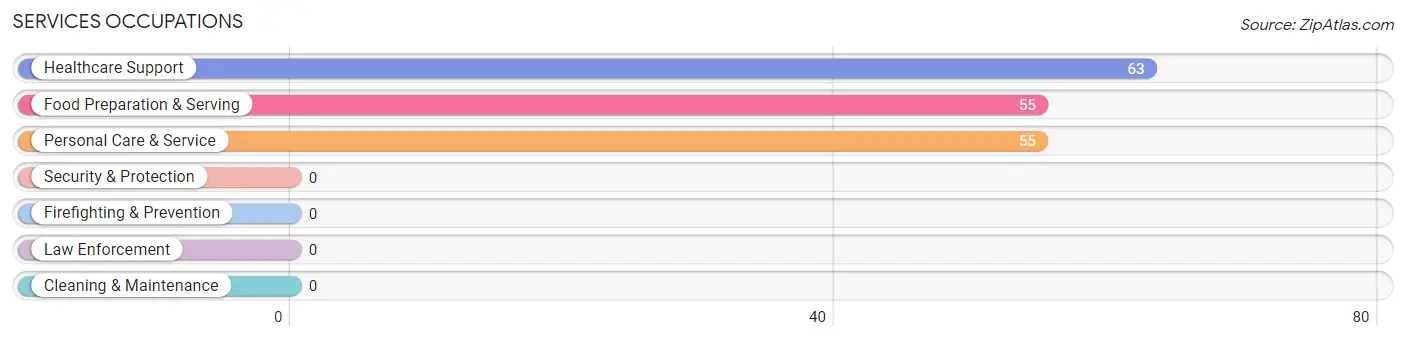
Services Occupations
The most common Services occupations in Central Gardens are Healthcare Support (63 | 3.1%), Food Preparation & Serving (55 | 2.7%), and Personal Care & Service (55 | 2.7%).
Services Occupations by Sex
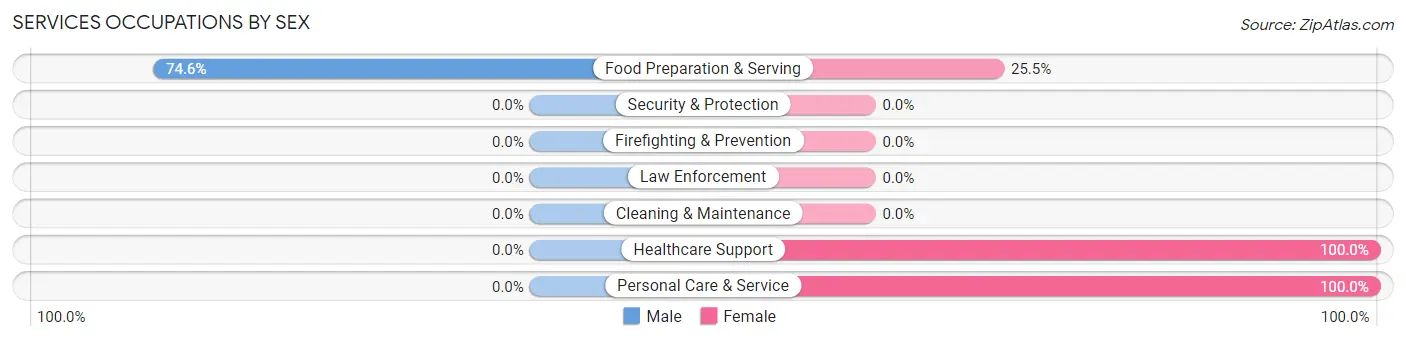
| Occupation | Male | Female |
| Healthcare Support | 0 (0.0%) | 63 (100.0%) |
| Security & Protection | 0 (0.0%) | 0 (0.0%) |
| Firefighting & Prevention | 0 (0.0%) | 0 (0.0%) |
| Law Enforcement | 0 (0.0%) | 0 (0.0%) |
| Food Preparation & Serving | 41 (74.6%) | 14 (25.5%) |
| Cleaning & Maintenance | 0 (0.0%) | 0 (0.0%) |
| Personal Care & Service | 0 (0.0%) | 55 (100.0%) |
| Total (Category) | 41 (23.7%) | 132 (76.3%) |
| Total (Overall) | 1,171 (58.2%) | 841 (41.8%) |
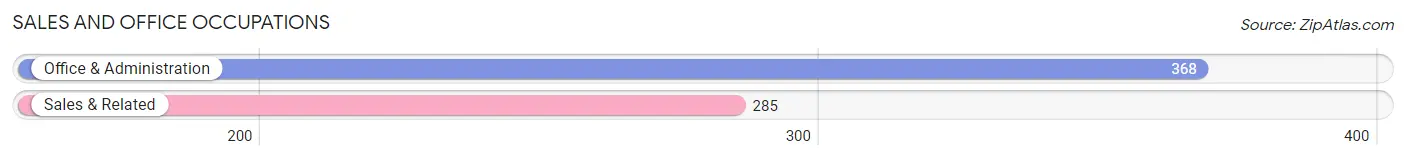
Sales and Office Occupations
The most common Sales and Office occupations in Central Gardens are Office & Administration (368 | 18.3%), and Sales & Related (285 | 14.2%).
Sales and Office Occupations by Sex
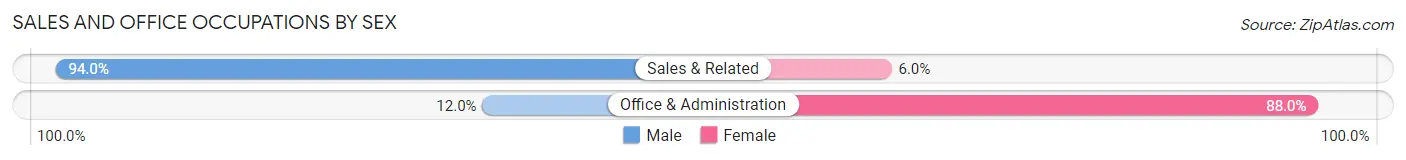
| Occupation | Male | Female |
| Sales & Related | 268 (94.0%) | 17 (6.0%) |
| Office & Administration | 44 (12.0%) | 324 (88.0%) |
| Total (Category) | 312 (47.8%) | 341 (52.2%) |
| Total (Overall) | 1,171 (58.2%) | 841 (41.8%) |
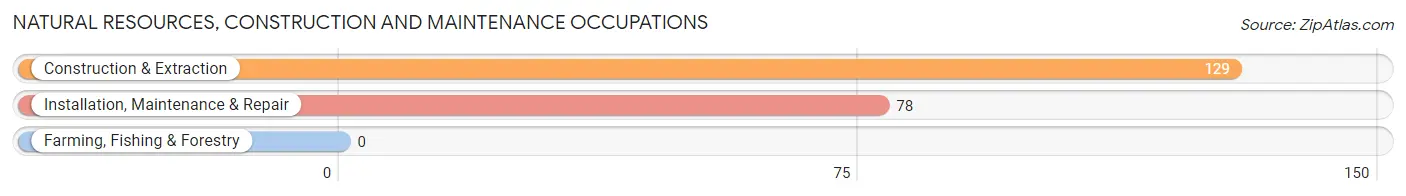
Natural Resources, Construction and Maintenance Occupations
The most common Natural Resources, Construction and Maintenance occupations in Central Gardens are Construction & Extraction (129 | 6.4%), and Installation, Maintenance & Repair (78 | 3.9%).
Natural Resources, Construction and Maintenance Occupations by Sex
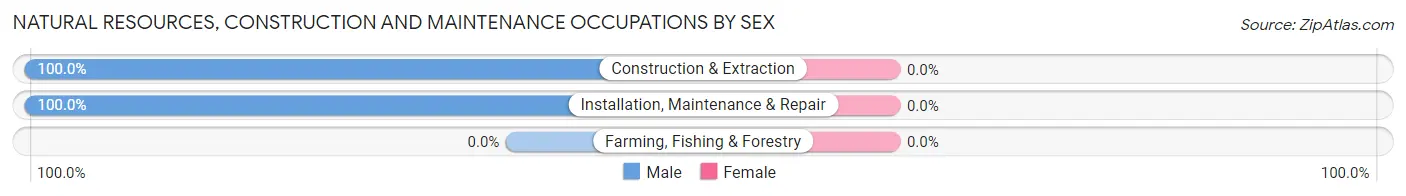
| Occupation | Male | Female |
| Farming, Fishing & Forestry | 0 (0.0%) | 0 (0.0%) |
| Construction & Extraction | 129 (100.0%) | 0 (0.0%) |
| Installation, Maintenance & Repair | 78 (100.0%) | 0 (0.0%) |
| Total (Category) | 207 (100.0%) | 0 (0.0%) |
| Total (Overall) | 1,171 (58.2%) | 841 (41.8%) |
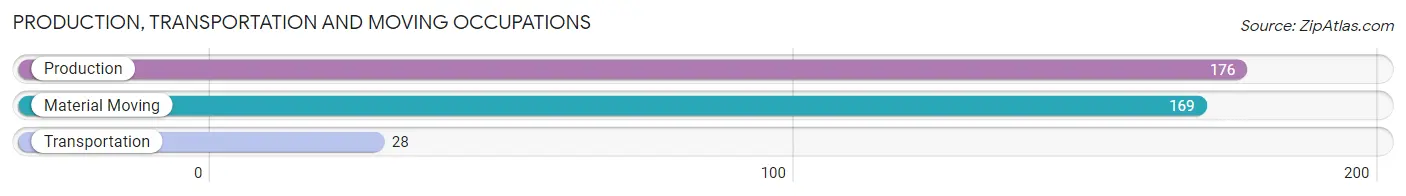
Production, Transportation and Moving Occupations
The most common Production, Transportation and Moving occupations in Central Gardens are Production (176 | 8.7%), Material Moving (169 | 8.4%), and Transportation (28 | 1.4%).
Production, Transportation and Moving Occupations by Sex
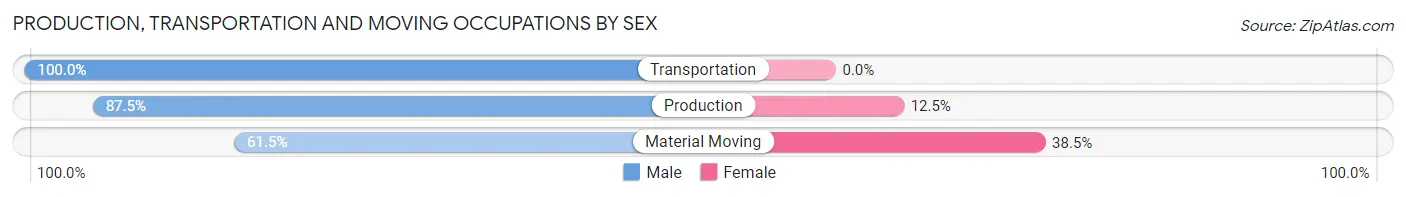
| Occupation | Male | Female |
| Production | 154 (87.5%) | 22 (12.5%) |
| Transportation | 28 (100.0%) | 0 (0.0%) |
| Material Moving | 104 (61.5%) | 65 (38.5%) |
| Total (Category) | 286 (76.7%) | 87 (23.3%) |
| Total (Overall) | 1,171 (58.2%) | 841 (41.8%) |
Employment Industries by Sex in Central Gardens
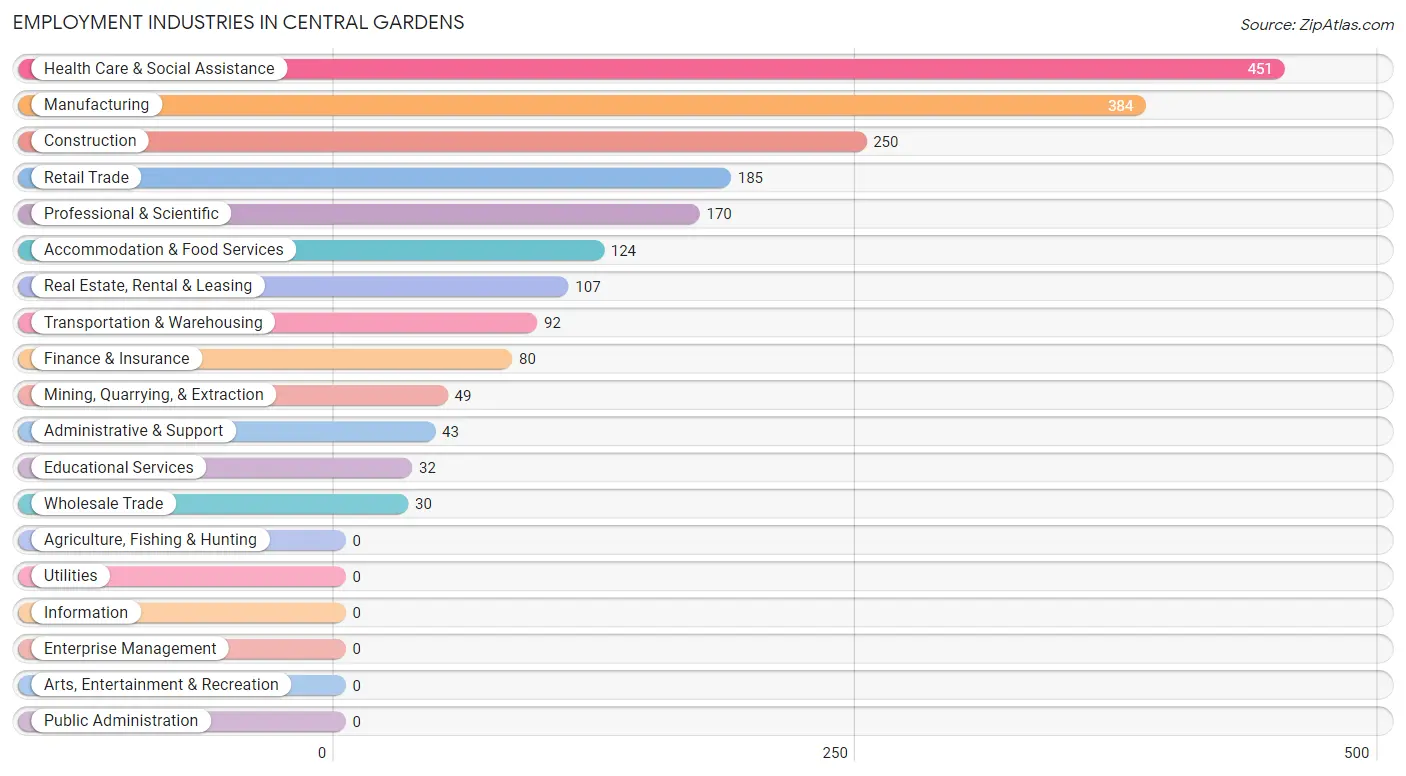
Employment Industries in Central Gardens
The major employment industries in Central Gardens include Health Care & Social Assistance (451 | 22.4%), Manufacturing (384 | 19.1%), Construction (250 | 12.4%), Retail Trade (185 | 9.2%), and Professional & Scientific (170 | 8.5%).
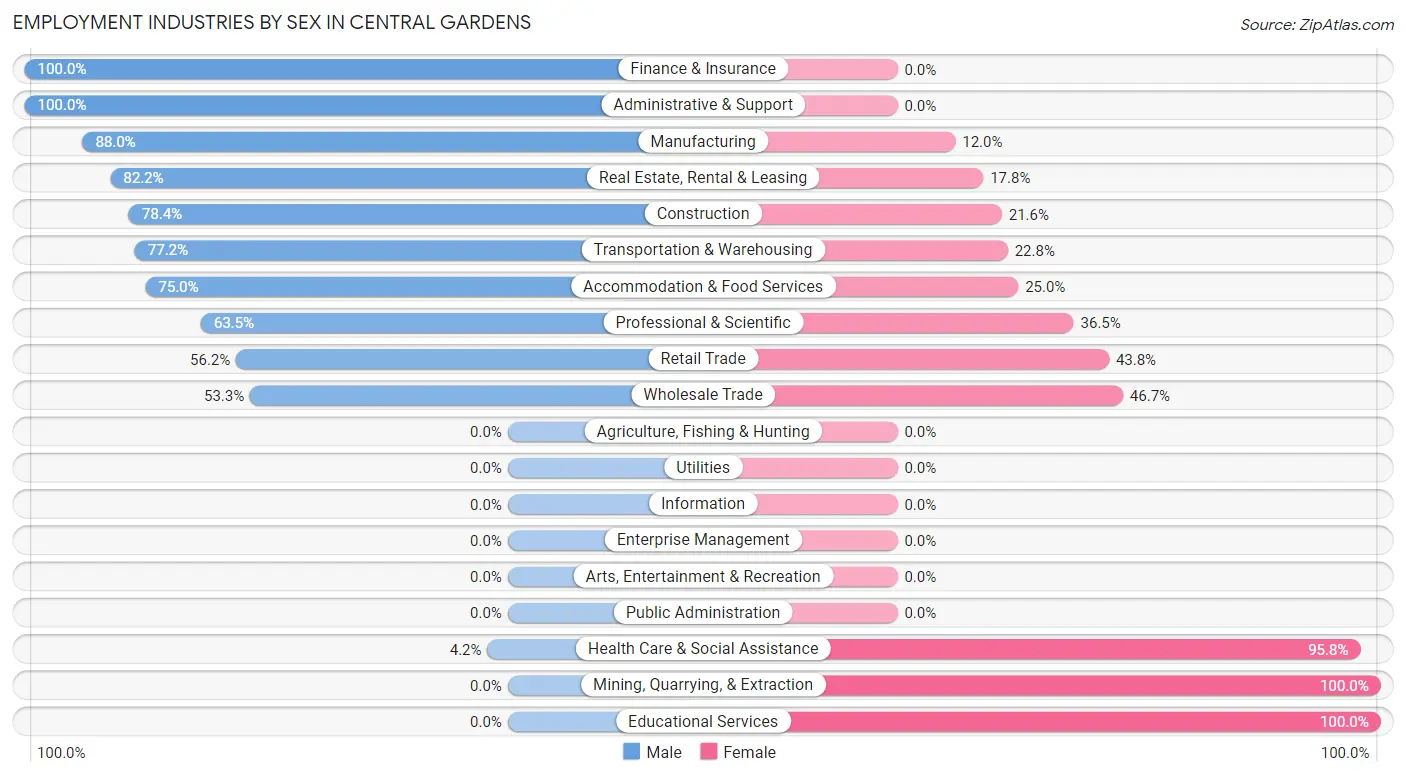
Employment Industries by Sex in Central Gardens
The Central Gardens industries that see more men than women are Finance & Insurance (100.0%), Administrative & Support (100.0%), and Manufacturing (88.0%), whereas the industries that tend to have a higher number of women are Mining, Quarrying, & Extraction (100.0%), Educational Services (100.0%), and Health Care & Social Assistance (95.8%).
| Industry | Male | Female |
| Agriculture, Fishing & Hunting | 0 (0.0%) | 0 (0.0%) |
| Mining, Quarrying, & Extraction | 0 (0.0%) | 49 (100.0%) |
| Construction | 196 (78.4%) | 54 (21.6%) |
| Manufacturing | 338 (88.0%) | 46 (12.0%) |
| Wholesale Trade | 16 (53.3%) | 14 (46.7%) |
| Retail Trade | 104 (56.2%) | 81 (43.8%) |
| Transportation & Warehousing | 71 (77.2%) | 21 (22.8%) |
| Utilities | 0 (0.0%) | 0 (0.0%) |
| Information | 0 (0.0%) | 0 (0.0%) |
| Finance & Insurance | 80 (100.0%) | 0 (0.0%) |
| Real Estate, Rental & Leasing | 88 (82.2%) | 19 (17.8%) |
| Professional & Scientific | 108 (63.5%) | 62 (36.5%) |
| Enterprise Management | 0 (0.0%) | 0 (0.0%) |
| Administrative & Support | 43 (100.0%) | 0 (0.0%) |
| Educational Services | 0 (0.0%) | 32 (100.0%) |
| Health Care & Social Assistance | 19 (4.2%) | 432 (95.8%) |
| Arts, Entertainment & Recreation | 0 (0.0%) | 0 (0.0%) |
| Accommodation & Food Services | 93 (75.0%) | 31 (25.0%) |
| Public Administration | 0 (0.0%) | 0 (0.0%) |
| Total | 1,171 (58.2%) | 841 (41.8%) |
Education in Central Gardens
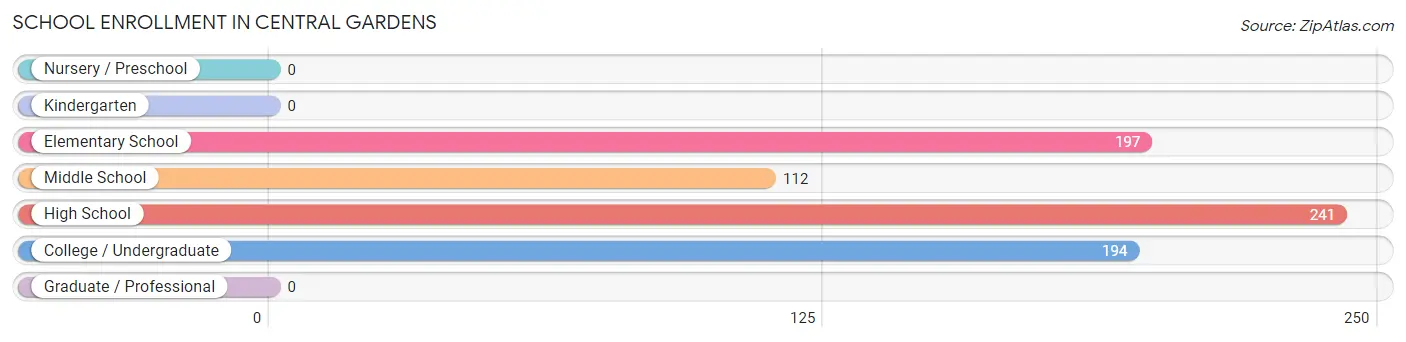
School Enrollment in Central Gardens
The most common levels of schooling among the 744 students in Central Gardens are high school (241 | 32.4%), elementary school (197 | 26.5%), and college / undergraduate (194 | 26.1%).
| School Level | # Students | % Students |
| Nursery / Preschool | 0 | 0.0% |
| Kindergarten | 0 | 0.0% |
| Elementary School | 197 | 26.5% |
| Middle School | 112 | 15.0% |
| High School | 241 | 32.4% |
| College / Undergraduate | 194 | 26.1% |
| Graduate / Professional | 0 | 0.0% |
| Total | 744 | 100.0% |
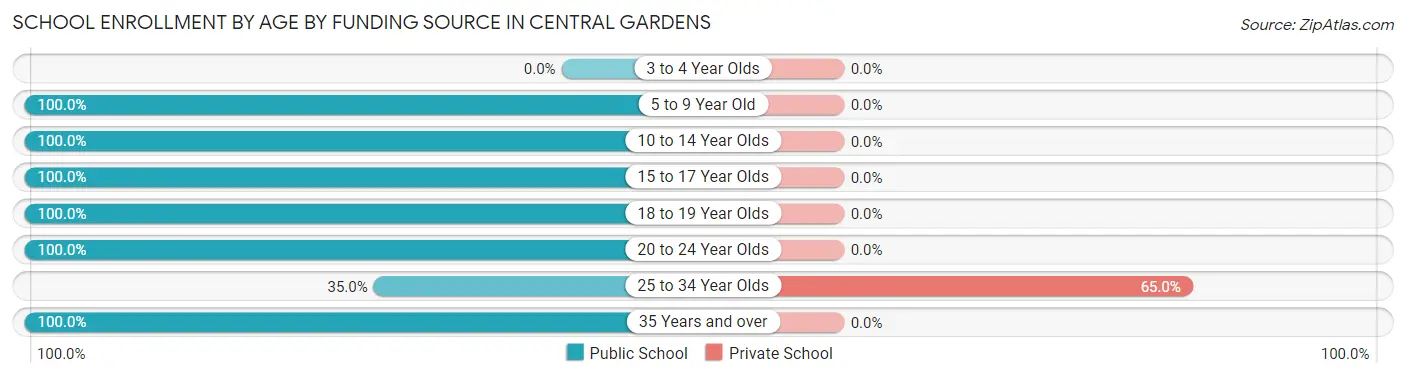
School Enrollment by Age by Funding Source in Central Gardens
Out of a total of 744 students who are enrolled in schools in Central Gardens, 26 (3.5%) attend a private institution, while the remaining 718 (96.5%) are enrolled in public schools. The age group of 25 to 34 year olds has the highest likelihood of being enrolled in private schools, with 26 (65.0% in the age bracket) enrolled. Conversely, the age group of 5 to 9 year old has the lowest likelihood of being enrolled in a private school, with 197 (100.0% in the age bracket) attending a public institution.
| Age Bracket | Public School | Private School |
| 3 to 4 Year Olds | 0 (0.0%) | 0 (0.0%) |
| 5 to 9 Year Old | 197 (100.0%) | 0 (0.0%) |
| 10 to 14 Year Olds | 150 (100.0%) | 0 (0.0%) |
| 15 to 17 Year Olds | 203 (100.0%) | 0 (0.0%) |
| 18 to 19 Year Olds | 113 (100.0%) | 0 (0.0%) |
| 20 to 24 Year Olds | 29 (100.0%) | 0 (0.0%) |
| 25 to 34 Year Olds | 14 (35.0%) | 26 (65.0%) |
| 35 Years and over | 12 (100.0%) | 0 (0.0%) |
| Total | 718 (96.5%) | 26 (3.5%) |
Educational Attainment by Field of Study in Central Gardens
Business (264 | 37.3%), bio, nature & agricultural (130 | 18.4%), science & technology (89 | 12.6%), education (71 | 10.0%), and physical & health sciences (57 | 8.1%) are the most common fields of study among 707 individuals in Central Gardens who have obtained a bachelor's degree or higher.
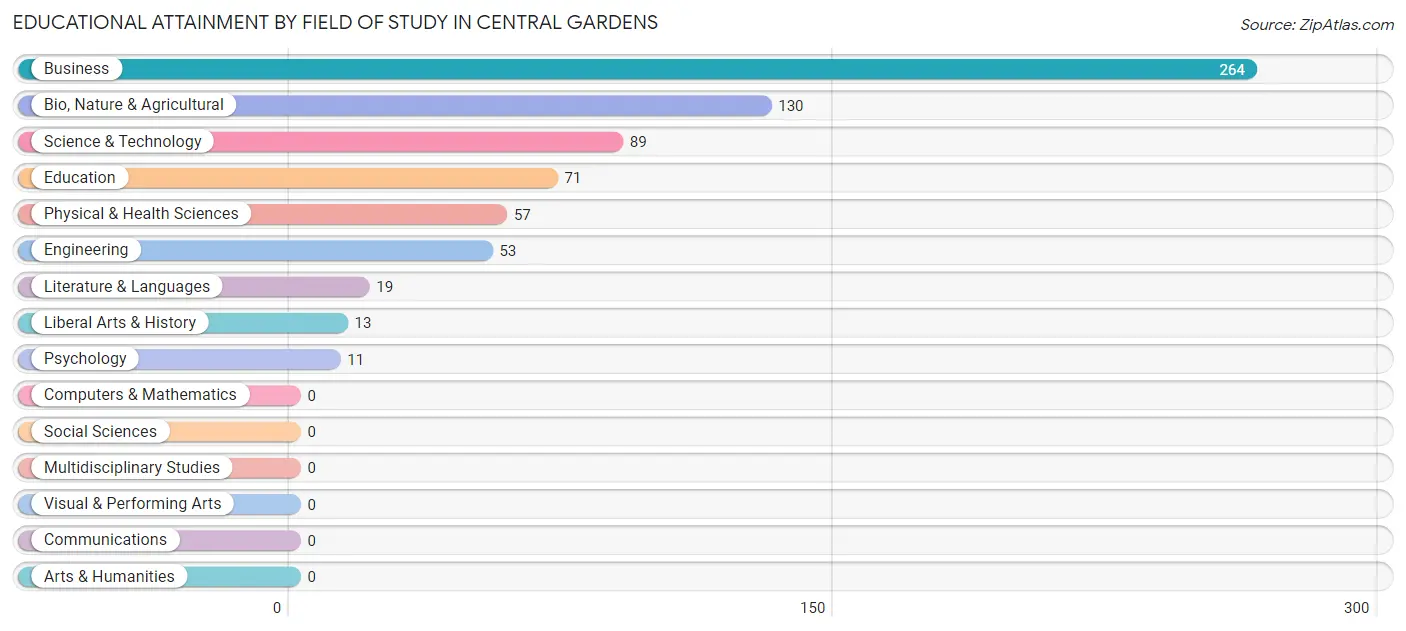
| Field of Study | # Graduates | % Graduates |
| Computers & Mathematics | 0 | 0.0% |
| Bio, Nature & Agricultural | 130 | 18.4% |
| Physical & Health Sciences | 57 | 8.1% |
| Psychology | 11 | 1.6% |
| Social Sciences | 0 | 0.0% |
| Engineering | 53 | 7.5% |
| Multidisciplinary Studies | 0 | 0.0% |
| Science & Technology | 89 | 12.6% |
| Business | 264 | 37.3% |
| Education | 71 | 10.0% |
| Literature & Languages | 19 | 2.7% |
| Liberal Arts & History | 13 | 1.8% |
| Visual & Performing Arts | 0 | 0.0% |
| Communications | 0 | 0.0% |
| Arts & Humanities | 0 | 0.0% |
| Total | 707 | 100.0% |
Transportation & Commute in Central Gardens
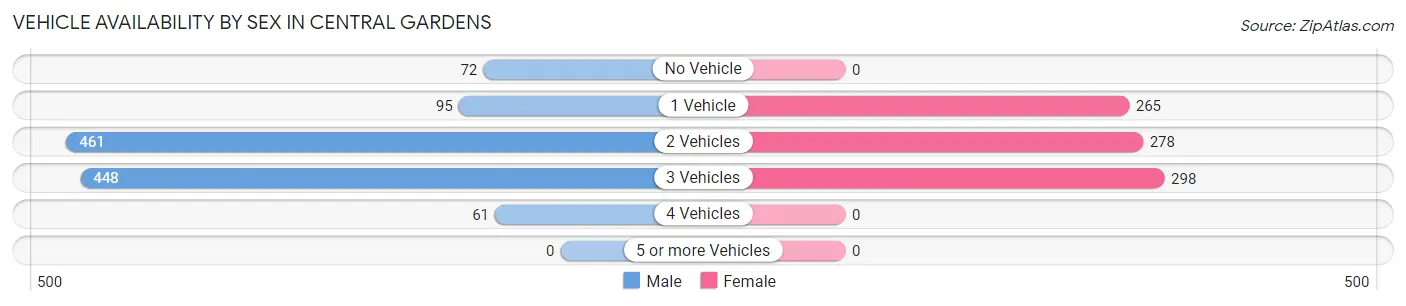
Vehicle Availability by Sex in Central Gardens
The most prevalent vehicle ownership categories in Central Gardens are males with 2 vehicles (461, accounting for 40.6%) and females with 2 vehicles (278, making up 54.8%).
| Vehicles Available | Male | Female |
| No Vehicle | 72 (6.3%) | 0 (0.0%) |
| 1 Vehicle | 95 (8.4%) | 265 (31.5%) |
| 2 Vehicles | 461 (40.6%) | 278 (33.1%) |
| 3 Vehicles | 448 (39.4%) | 298 (35.4%) |
| 4 Vehicles | 61 (5.4%) | 0 (0.0%) |
| 5 or more Vehicles | 0 (0.0%) | 0 (0.0%) |
| Total | 1,137 (100.0%) | 841 (100.0%) |
Commute Time in Central Gardens
The most frequently occuring commute durations in Central Gardens are 15 to 19 minutes (758 commuters, 40.5%), 10 to 14 minutes (356 commuters, 19.0%), and 5 to 9 minutes (246 commuters, 13.2%).
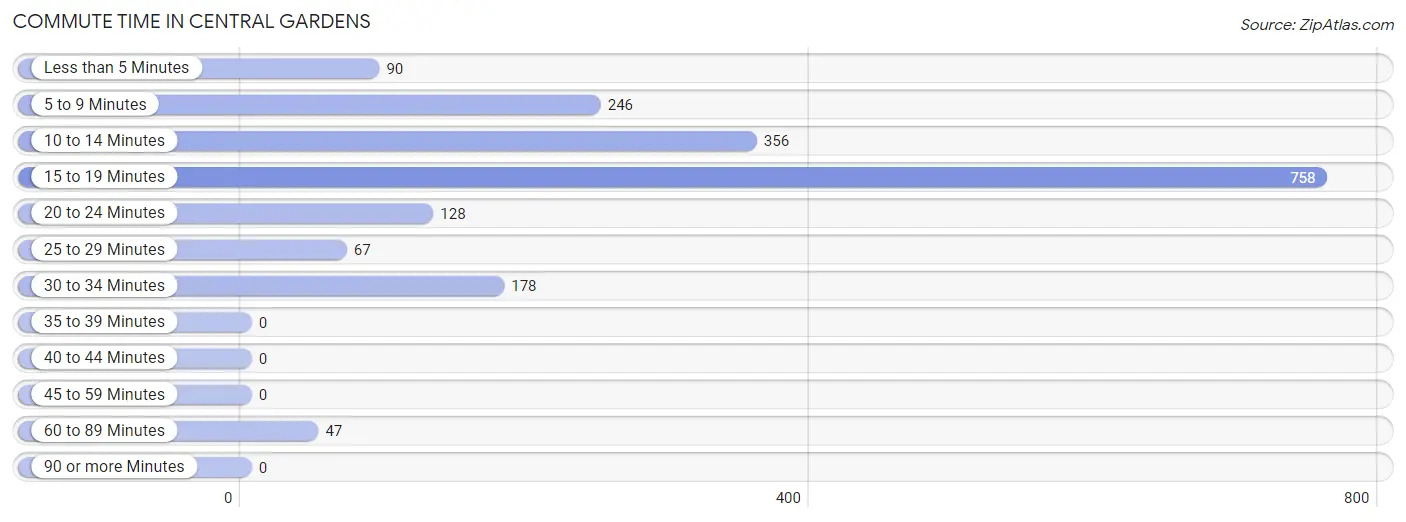
| Commute Time | # Commuters | % Commuters |
| Less than 5 Minutes | 90 | 4.8% |
| 5 to 9 Minutes | 246 | 13.2% |
| 10 to 14 Minutes | 356 | 19.0% |
| 15 to 19 Minutes | 758 | 40.5% |
| 20 to 24 Minutes | 128 | 6.8% |
| 25 to 29 Minutes | 67 | 3.6% |
| 30 to 34 Minutes | 178 | 9.5% |
| 35 to 39 Minutes | 0 | 0.0% |
| 40 to 44 Minutes | 0 | 0.0% |
| 45 to 59 Minutes | 0 | 0.0% |
| 60 to 89 Minutes | 47 | 2.5% |
| 90 or more Minutes | 0 | 0.0% |
Commute Time by Sex in Central Gardens
The most common commute times in Central Gardens are 15 to 19 minutes (473 commuters, 41.5%) for males and 10 to 14 minutes (319 commuters, 43.6%) for females.
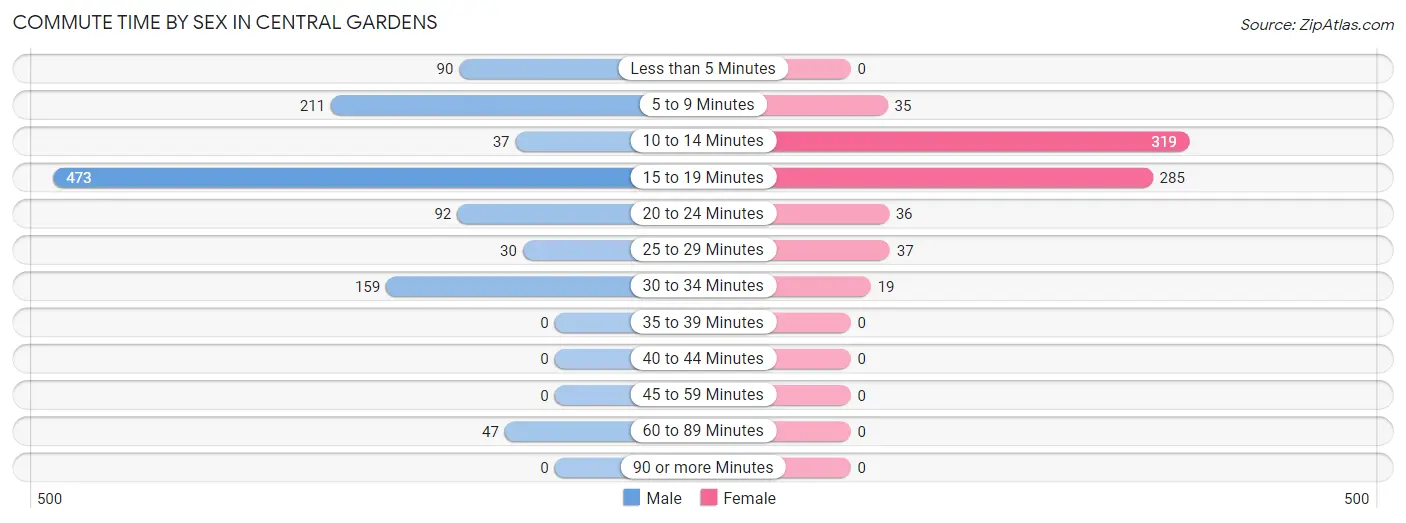
| Commute Time | Male | Female |
| Less than 5 Minutes | 90 (7.9%) | 0 (0.0%) |
| 5 to 9 Minutes | 211 (18.5%) | 35 (4.8%) |
| 10 to 14 Minutes | 37 (3.3%) | 319 (43.6%) |
| 15 to 19 Minutes | 473 (41.5%) | 285 (39.0%) |
| 20 to 24 Minutes | 92 (8.1%) | 36 (4.9%) |
| 25 to 29 Minutes | 30 (2.6%) | 37 (5.1%) |
| 30 to 34 Minutes | 159 (14.0%) | 19 (2.6%) |
| 35 to 39 Minutes | 0 (0.0%) | 0 (0.0%) |
| 40 to 44 Minutes | 0 (0.0%) | 0 (0.0%) |
| 45 to 59 Minutes | 0 (0.0%) | 0 (0.0%) |
| 60 to 89 Minutes | 47 (4.1%) | 0 (0.0%) |
| 90 or more Minutes | 0 (0.0%) | 0 (0.0%) |
Time of Departure to Work by Sex in Central Gardens
The most frequent times of departure to work in Central Gardens are 6:00 AM to 6:29 AM (285, 25.0%) for males and 7:00 AM to 7:29 AM (149, 20.4%) for females.
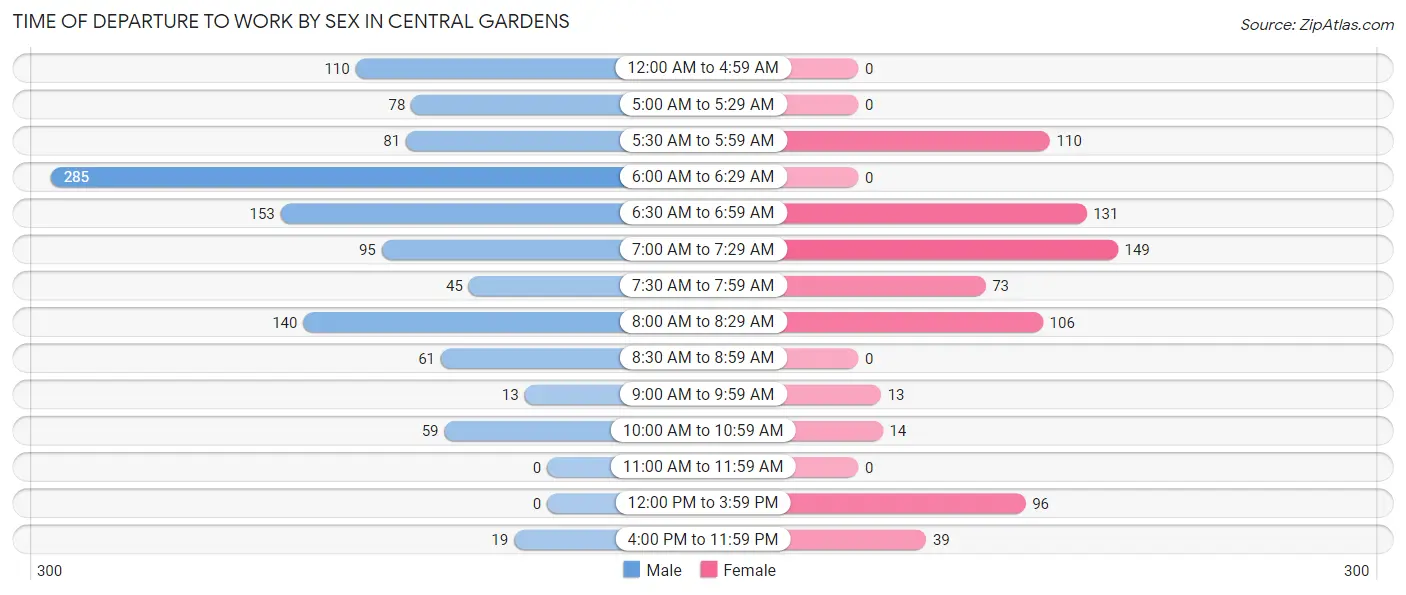
| Time of Departure | Male | Female |
| 12:00 AM to 4:59 AM | 110 (9.7%) | 0 (0.0%) |
| 5:00 AM to 5:29 AM | 78 (6.9%) | 0 (0.0%) |
| 5:30 AM to 5:59 AM | 81 (7.1%) | 110 (15.0%) |
| 6:00 AM to 6:29 AM | 285 (25.0%) | 0 (0.0%) |
| 6:30 AM to 6:59 AM | 153 (13.4%) | 131 (17.9%) |
| 7:00 AM to 7:29 AM | 95 (8.3%) | 149 (20.4%) |
| 7:30 AM to 7:59 AM | 45 (4.0%) | 73 (10.0%) |
| 8:00 AM to 8:29 AM | 140 (12.3%) | 106 (14.5%) |
| 8:30 AM to 8:59 AM | 61 (5.4%) | 0 (0.0%) |
| 9:00 AM to 9:59 AM | 13 (1.1%) | 13 (1.8%) |
| 10:00 AM to 10:59 AM | 59 (5.2%) | 14 (1.9%) |
| 11:00 AM to 11:59 AM | 0 (0.0%) | 0 (0.0%) |
| 12:00 PM to 3:59 PM | 0 (0.0%) | 96 (13.1%) |
| 4:00 PM to 11:59 PM | 19 (1.7%) | 39 (5.3%) |
| Total | 1,139 (100.0%) | 731 (100.0%) |
Housing Occupancy in Central Gardens
Occupancy by Ownership in Central Gardens
Of the total 1,618 dwellings in Central Gardens, owner-occupied units account for 1,263 (78.1%), while renter-occupied units make up 355 (21.9%).
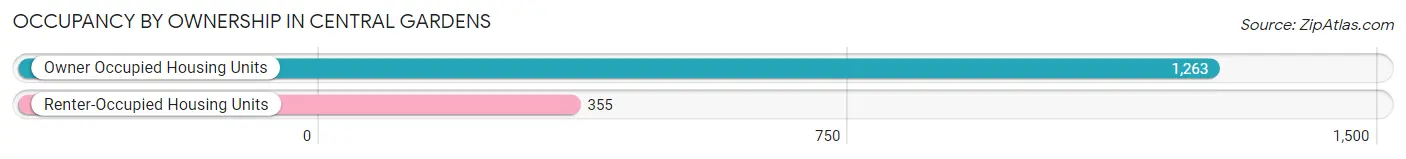
| Occupancy | # Housing Units | % Housing Units |
| Owner Occupied Housing Units | 1,263 | 78.1% |
| Renter-Occupied Housing Units | 355 | 21.9% |
| Total Occupied Housing Units | 1,618 | 100.0% |
Occupancy by Household Size in Central Gardens
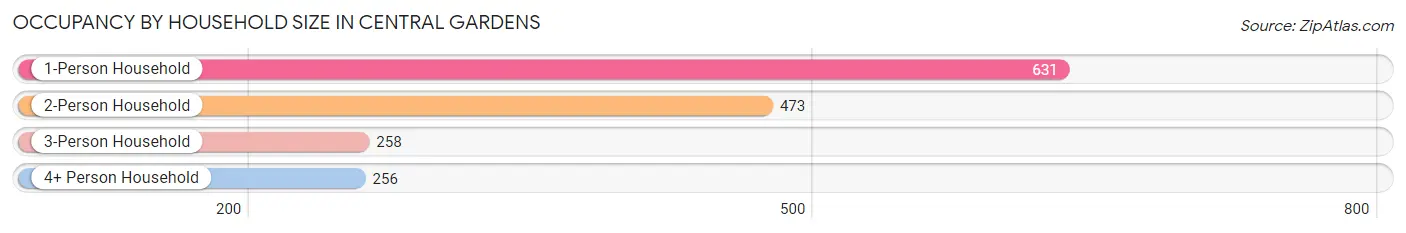
| Household Size | # Housing Units | % Housing Units |
| 1-Person Household | 631 | 39.0% |
| 2-Person Household | 473 | 29.2% |
| 3-Person Household | 258 | 16.0% |
| 4+ Person Household | 256 | 15.8% |
| Total Housing Units | 1,618 | 100.0% |
Occupancy by Ownership by Household Size in Central Gardens
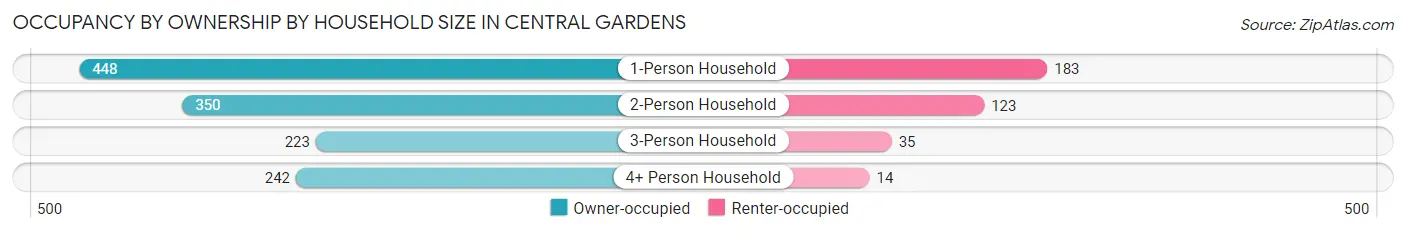
| Household Size | Owner-occupied | Renter-occupied |
| 1-Person Household | 448 (71.0%) | 183 (29.0%) |
| 2-Person Household | 350 (74.0%) | 123 (26.0%) |
| 3-Person Household | 223 (86.4%) | 35 (13.6%) |
| 4+ Person Household | 242 (94.5%) | 14 (5.5%) |
| Total Housing Units | 1,263 (78.1%) | 355 (21.9%) |
Occupancy by Educational Attainment in Central Gardens
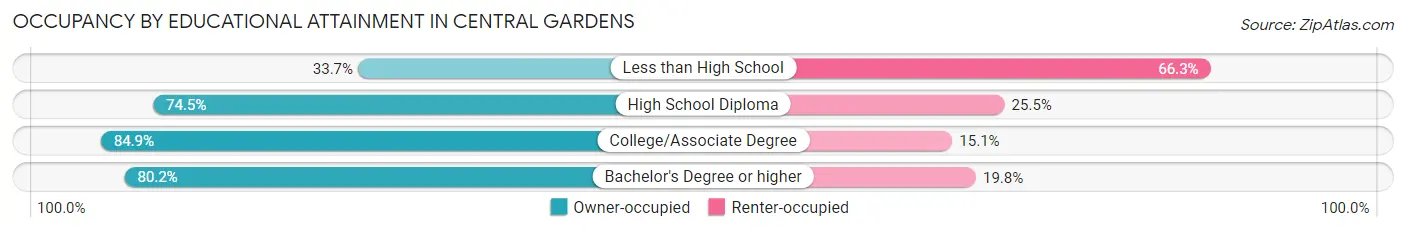
| Household Size | Owner-occupied | Renter-occupied |
| Less than High School | 28 (33.7%) | 55 (66.3%) |
| High School Diploma | 351 (74.5%) | 120 (25.5%) |
| College/Associate Degree | 556 (84.9%) | 99 (15.1%) |
| Bachelor's Degree or higher | 328 (80.2%) | 81 (19.8%) |
Occupancy by Age of Householder in Central Gardens
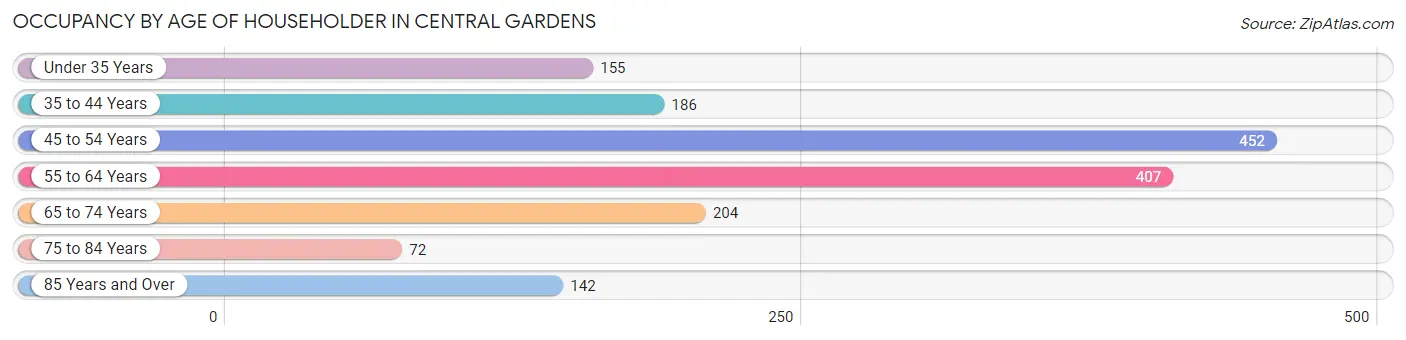
| Age Bracket | # Households | % Households |
| Under 35 Years | 155 | 9.6% |
| 35 to 44 Years | 186 | 11.5% |
| 45 to 54 Years | 452 | 27.9% |
| 55 to 64 Years | 407 | 25.2% |
| 65 to 74 Years | 204 | 12.6% |
| 75 to 84 Years | 72 | 4.4% |
| 85 Years and Over | 142 | 8.8% |
| Total | 1,618 | 100.0% |
Housing Finances in Central Gardens
Median Income by Occupancy in Central Gardens
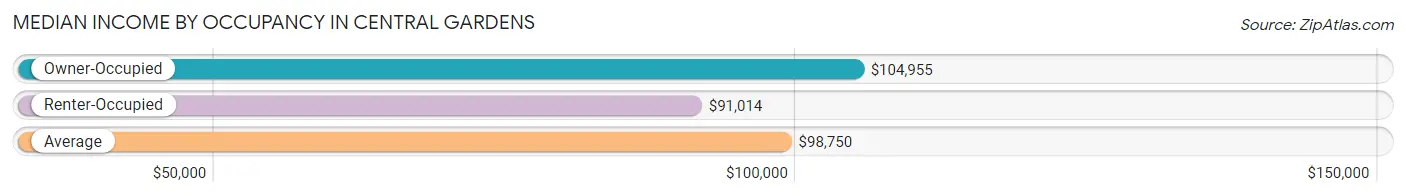
| Occupancy Type | # Households | Median Income |
| Owner-Occupied | 1,263 (78.1%) | $104,955 |
| Renter-Occupied | 355 (21.9%) | $91,014 |
| Average | 1,618 (100.0%) | $98,750 |
Occupancy by Householder Income Bracket in Central Gardens
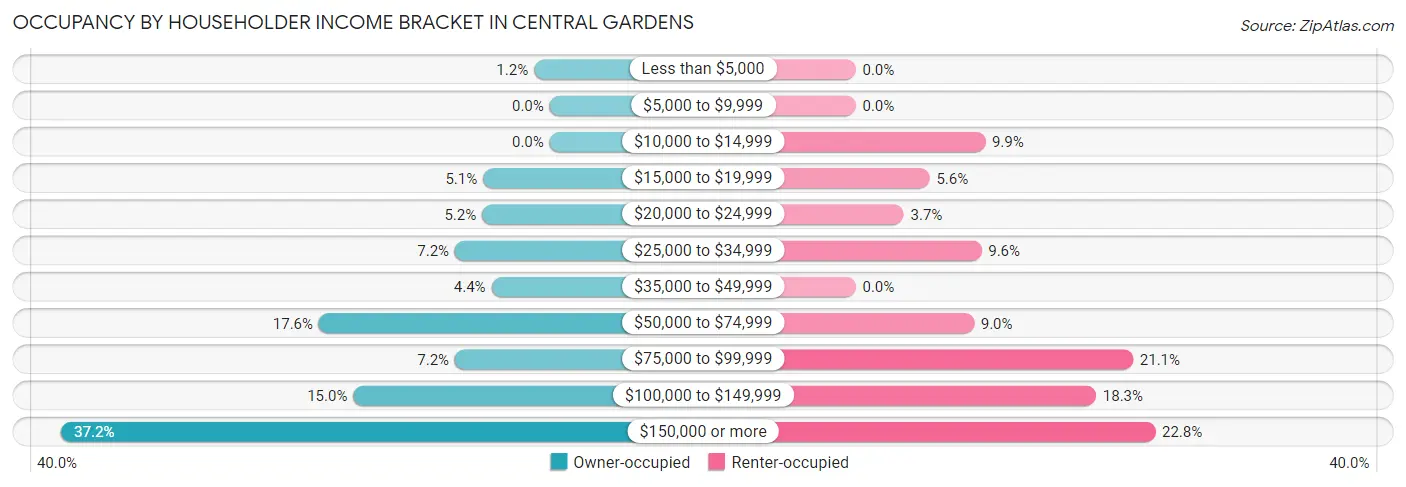
| Income Bracket | Owner-occupied | Renter-occupied |
| Less than $5,000 | 15 (1.2%) | 0 (0.0%) |
| $5,000 to $9,999 | 0 (0.0%) | 0 (0.0%) |
| $10,000 to $14,999 | 0 (0.0%) | 35 (9.9%) |
| $15,000 to $19,999 | 64 (5.1%) | 20 (5.6%) |
| $20,000 to $24,999 | 65 (5.1%) | 13 (3.7%) |
| $25,000 to $34,999 | 91 (7.2%) | 34 (9.6%) |
| $35,000 to $49,999 | 56 (4.4%) | 0 (0.0%) |
| $50,000 to $74,999 | 222 (17.6%) | 32 (9.0%) |
| $75,000 to $99,999 | 91 (7.2%) | 75 (21.1%) |
| $100,000 to $149,999 | 189 (15.0%) | 65 (18.3%) |
| $150,000 or more | 470 (37.2%) | 81 (22.8%) |
| Total | 1,263 (100.0%) | 355 (100.0%) |
Monthly Housing Cost Tiers in Central Gardens
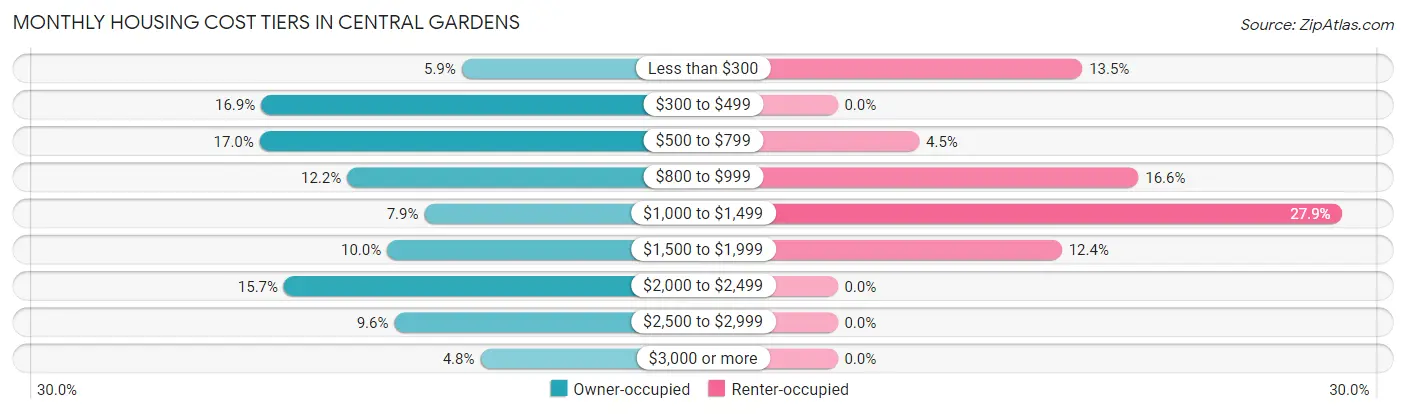
| Monthly Cost | Owner-occupied | Renter-occupied |
| Less than $300 | 74 (5.9%) | 48 (13.5%) |
| $300 to $499 | 214 (16.9%) | 0 (0.0%) |
| $500 to $799 | 215 (17.0%) | 16 (4.5%) |
| $800 to $999 | 154 (12.2%) | 59 (16.6%) |
| $1,000 to $1,499 | 100 (7.9%) | 99 (27.9%) |
| $1,500 to $1,999 | 126 (10.0%) | 44 (12.4%) |
| $2,000 to $2,499 | 198 (15.7%) | 0 (0.0%) |
| $2,500 to $2,999 | 121 (9.6%) | 0 (0.0%) |
| $3,000 or more | 61 (4.8%) | 0 (0.0%) |
| Total | 1,263 (100.0%) | 355 (100.0%) |
Physical Housing Characteristics in Central Gardens
Housing Structures in Central Gardens
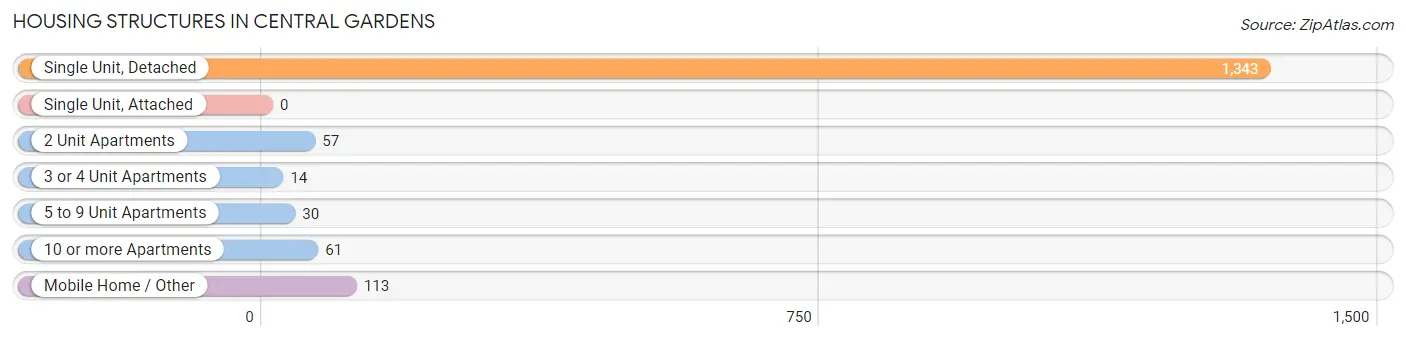
| Structure Type | # Housing Units | % Housing Units |
| Single Unit, Detached | 1,343 | 83.0% |
| Single Unit, Attached | 0 | 0.0% |
| 2 Unit Apartments | 57 | 3.5% |
| 3 or 4 Unit Apartments | 14 | 0.9% |
| 5 to 9 Unit Apartments | 30 | 1.8% |
| 10 or more Apartments | 61 | 3.8% |
| Mobile Home / Other | 113 | 7.0% |
| Total | 1,618 | 100.0% |
Housing Structures by Occupancy in Central Gardens
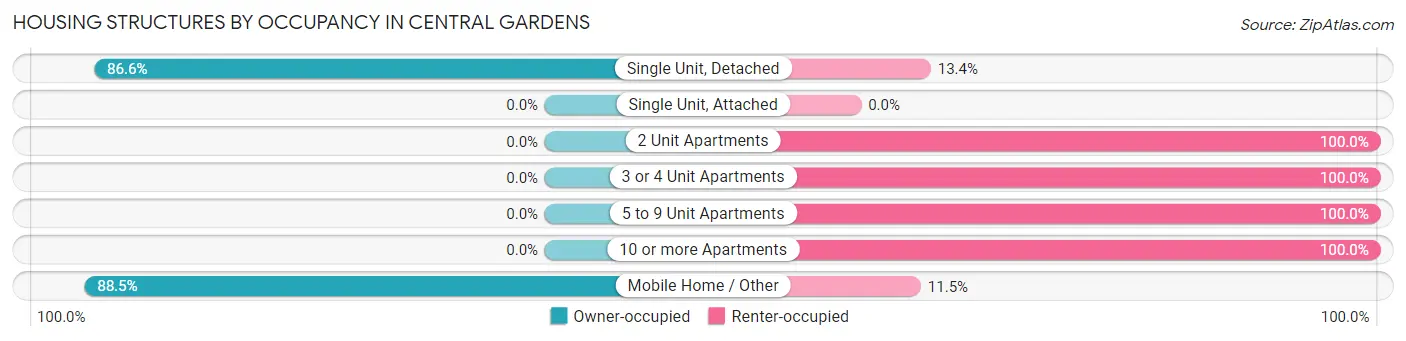
| Structure Type | Owner-occupied | Renter-occupied |
| Single Unit, Detached | 1,163 (86.6%) | 180 (13.4%) |
| Single Unit, Attached | 0 (0.0%) | 0 (0.0%) |
| 2 Unit Apartments | 0 (0.0%) | 57 (100.0%) |
| 3 or 4 Unit Apartments | 0 (0.0%) | 14 (100.0%) |
| 5 to 9 Unit Apartments | 0 (0.0%) | 30 (100.0%) |
| 10 or more Apartments | 0 (0.0%) | 61 (100.0%) |
| Mobile Home / Other | 100 (88.5%) | 13 (11.5%) |
| Total | 1,263 (78.1%) | 355 (21.9%) |
Housing Structures by Number of Rooms in Central Gardens
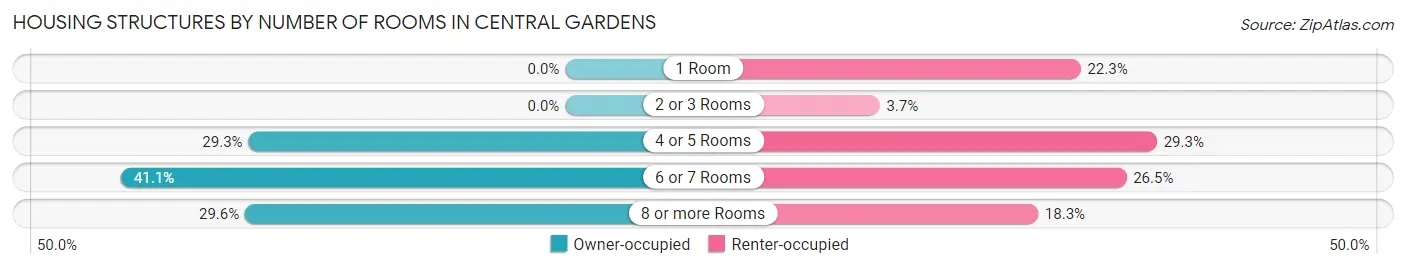
| Number of Rooms | Owner-occupied | Renter-occupied |
| 1 Room | 0 (0.0%) | 79 (22.3%) |
| 2 or 3 Rooms | 0 (0.0%) | 13 (3.7%) |
| 4 or 5 Rooms | 370 (29.3%) | 104 (29.3%) |
| 6 or 7 Rooms | 519 (41.1%) | 94 (26.5%) |
| 8 or more Rooms | 374 (29.6%) | 65 (18.3%) |
| Total | 1,263 (100.0%) | 355 (100.0%) |
Housing Structure by Heating Type in Central Gardens
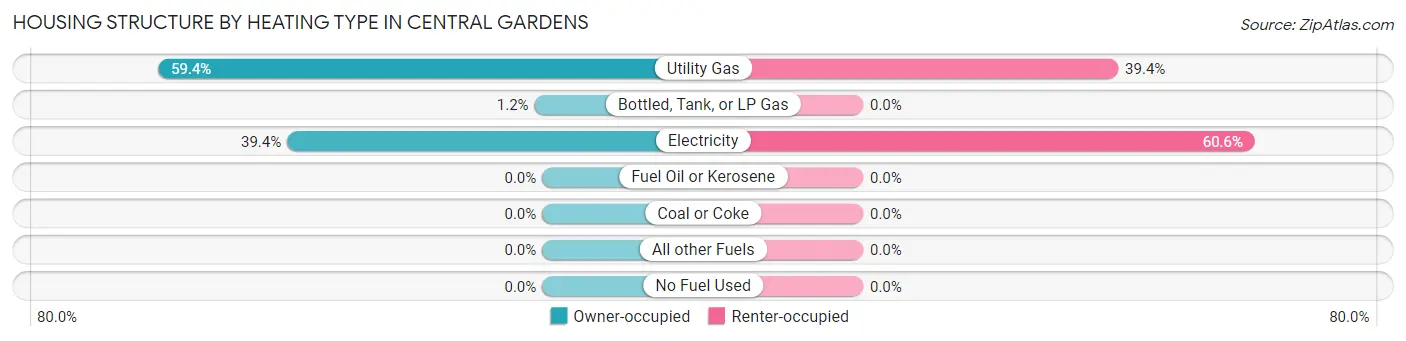
| Heating Type | Owner-occupied | Renter-occupied |
| Utility Gas | 750 (59.4%) | 140 (39.4%) |
| Bottled, Tank, or LP Gas | 15 (1.2%) | 0 (0.0%) |
| Electricity | 498 (39.4%) | 215 (60.6%) |
| Fuel Oil or Kerosene | 0 (0.0%) | 0 (0.0%) |
| Coal or Coke | 0 (0.0%) | 0 (0.0%) |
| All other Fuels | 0 (0.0%) | 0 (0.0%) |
| No Fuel Used | 0 (0.0%) | 0 (0.0%) |
| Total | 1,263 (100.0%) | 355 (100.0%) |
Household Vehicle Usage in Central Gardens
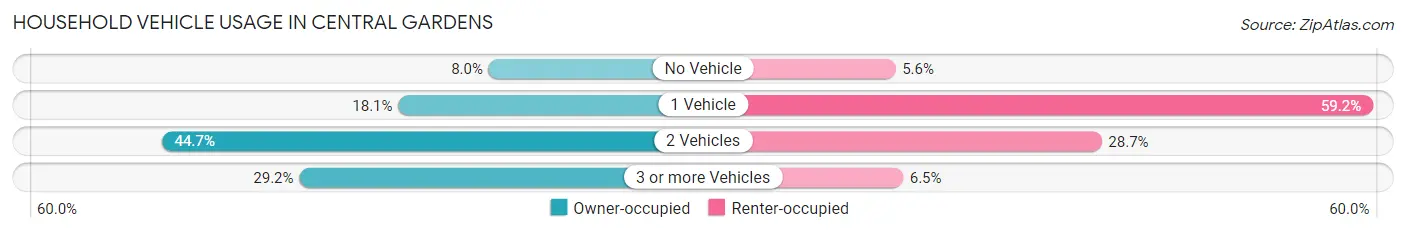
| Vehicles per Household | Owner-occupied | Renter-occupied |
| No Vehicle | 101 (8.0%) | 20 (5.6%) |
| 1 Vehicle | 229 (18.1%) | 210 (59.2%) |
| 2 Vehicles | 564 (44.7%) | 102 (28.7%) |
| 3 or more Vehicles | 369 (29.2%) | 23 (6.5%) |
| Total | 1,263 (100.0%) | 355 (100.0%) |
Real Estate & Mortgages in Central Gardens
Real Estate and Mortgage Overview in Central Gardens
| Characteristic | Without Mortgage | With Mortgage |
| Housing Units | 663 | 600 |
| Median Property Value | $245,100 | $251,900 |
| Median Household Income | $67,969 | $354 |
| Monthly Housing Costs | $541 | $61 |
| Real Estate Taxes | $2,059 | $0 |
Property Value by Mortgage Status in Central Gardens
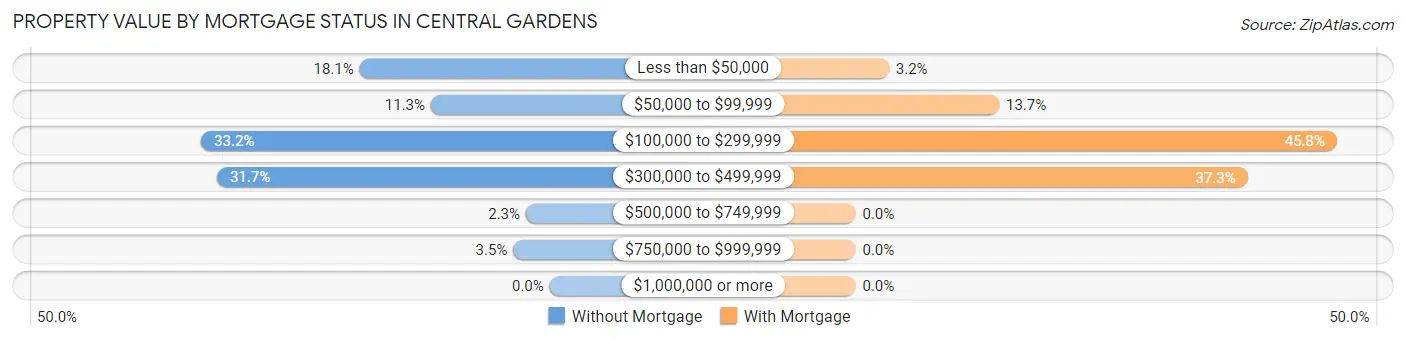
| Property Value | Without Mortgage | With Mortgage |
| Less than $50,000 | 120 (18.1%) | 19 (3.2%) |
| $50,000 to $99,999 | 75 (11.3%) | 82 (13.7%) |
| $100,000 to $299,999 | 220 (33.2%) | 275 (45.8%) |
| $300,000 to $499,999 | 210 (31.7%) | 224 (37.3%) |
| $500,000 to $749,999 | 15 (2.3%) | 0 (0.0%) |
| $750,000 to $999,999 | 23 (3.5%) | 0 (0.0%) |
| $1,000,000 or more | 0 (0.0%) | 0 (0.0%) |
| Total | 663 (100.0%) | 600 (100.0%) |
Household Income by Mortgage Status in Central Gardens
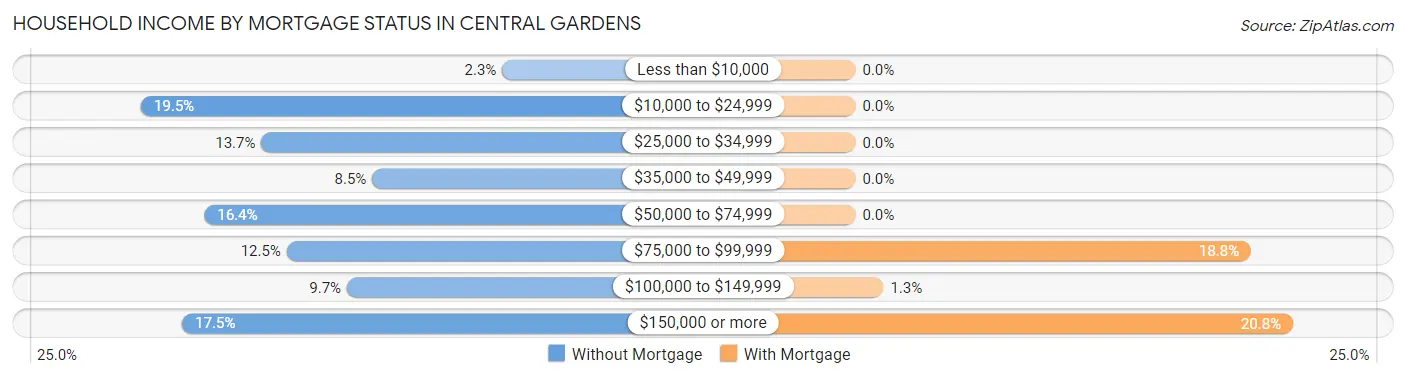
| Household Income | Without Mortgage | With Mortgage |
| Less than $10,000 | 15 (2.3%) | 0 (0.0%) |
| $10,000 to $24,999 | 129 (19.5%) | 0 (0.0%) |
| $25,000 to $34,999 | 91 (13.7%) | 0 (0.0%) |
| $35,000 to $49,999 | 56 (8.5%) | 0 (0.0%) |
| $50,000 to $74,999 | 109 (16.4%) | 0 (0.0%) |
| $75,000 to $99,999 | 83 (12.5%) | 113 (18.8%) |
| $100,000 to $149,999 | 64 (9.7%) | 8 (1.3%) |
| $150,000 or more | 116 (17.5%) | 125 (20.8%) |
| Total | 663 (100.0%) | 600 (100.0%) |
Property Value to Household Income Ratio in Central Gardens
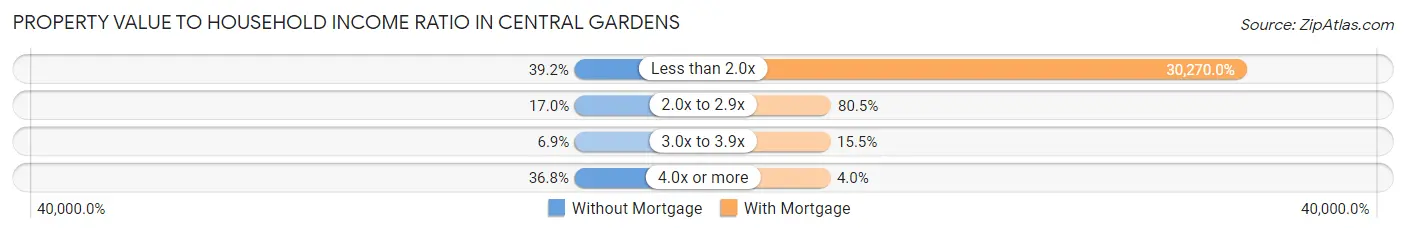
| Value-to-Income Ratio | Without Mortgage | With Mortgage |
| Less than 2.0x | 260 (39.2%) | 181,620 (30,270.0%) |
| 2.0x to 2.9x | 113 (17.0%) | 483 (80.5%) |
| 3.0x to 3.9x | 46 (6.9%) | 93 (15.5%) |
| 4.0x or more | 244 (36.8%) | 24 (4.0%) |
| Total | 663 (100.0%) | 600 (100.0%) |
Real Estate Taxes by Mortgage Status in Central Gardens
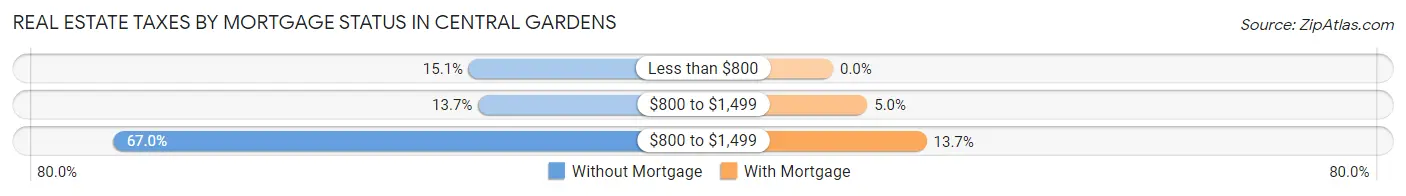
| Property Taxes | Without Mortgage | With Mortgage |
| Less than $800 | 100 (15.1%) | 0 (0.0%) |
| $800 to $1,499 | 91 (13.7%) | 30 (5.0%) |
| $800 to $1,499 | 444 (67.0%) | 82 (13.7%) |
| Total | 663 (100.0%) | 600 (100.0%) |
Health & Disability in Central Gardens
Health Insurance Coverage by Age in Central Gardens
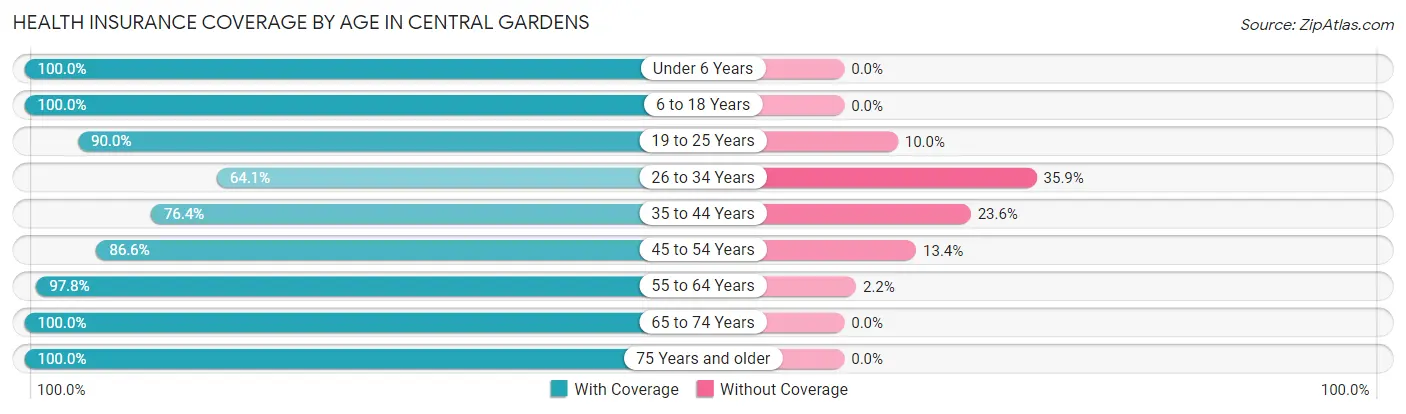
| Age Bracket | With Coverage | Without Coverage |
| Under 6 Years | 192 (100.0%) | 0 (0.0%) |
| 6 to 18 Years | 494 (100.0%) | 0 (0.0%) |
| 19 to 25 Years | 307 (90.0%) | 34 (10.0%) |
| 26 to 34 Years | 152 (64.1%) | 85 (35.9%) |
| 35 to 44 Years | 441 (76.4%) | 136 (23.6%) |
| 45 to 54 Years | 472 (86.6%) | 73 (13.4%) |
| 55 to 64 Years | 624 (97.8%) | 14 (2.2%) |
| 65 to 74 Years | 271 (100.0%) | 0 (0.0%) |
| 75 Years and older | 332 (100.0%) | 0 (0.0%) |
| Total | 3,285 (90.6%) | 342 (9.4%) |
Health Insurance Coverage by Citizenship Status in Central Gardens
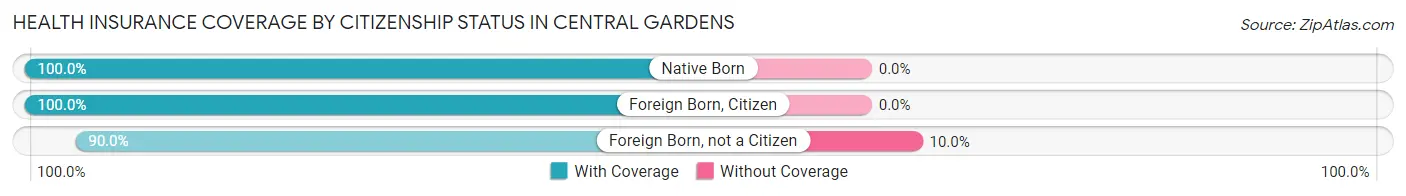
| Citizenship Status | With Coverage | Without Coverage |
| Native Born | 192 (100.0%) | 0 (0.0%) |
| Foreign Born, Citizen | 494 (100.0%) | 0 (0.0%) |
| Foreign Born, not a Citizen | 307 (90.0%) | 34 (10.0%) |
Health Insurance Coverage by Household Income in Central Gardens
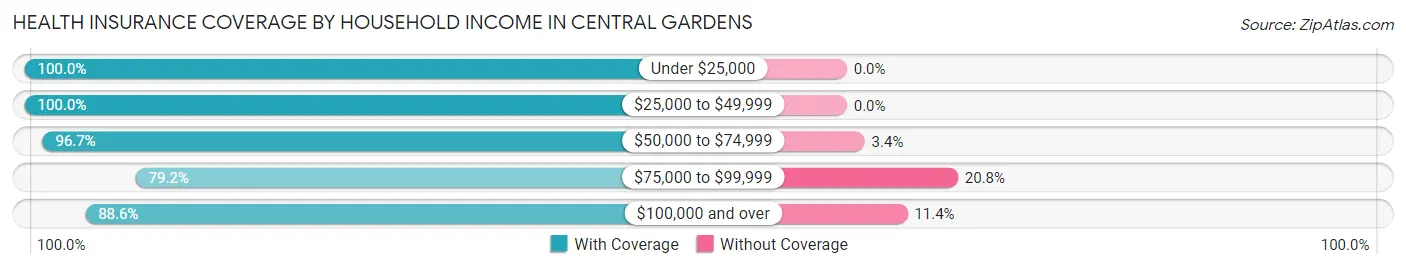
| Household Income | With Coverage | Without Coverage |
| Under $25,000 | 345 (100.0%) | 0 (0.0%) |
| $25,000 to $49,999 | 303 (100.0%) | 0 (0.0%) |
| $50,000 to $74,999 | 346 (96.7%) | 12 (3.4%) |
| $75,000 to $99,999 | 236 (79.2%) | 62 (20.8%) |
| $100,000 and over | 2,053 (88.6%) | 263 (11.4%) |
Public vs Private Health Insurance Coverage by Age in Central Gardens
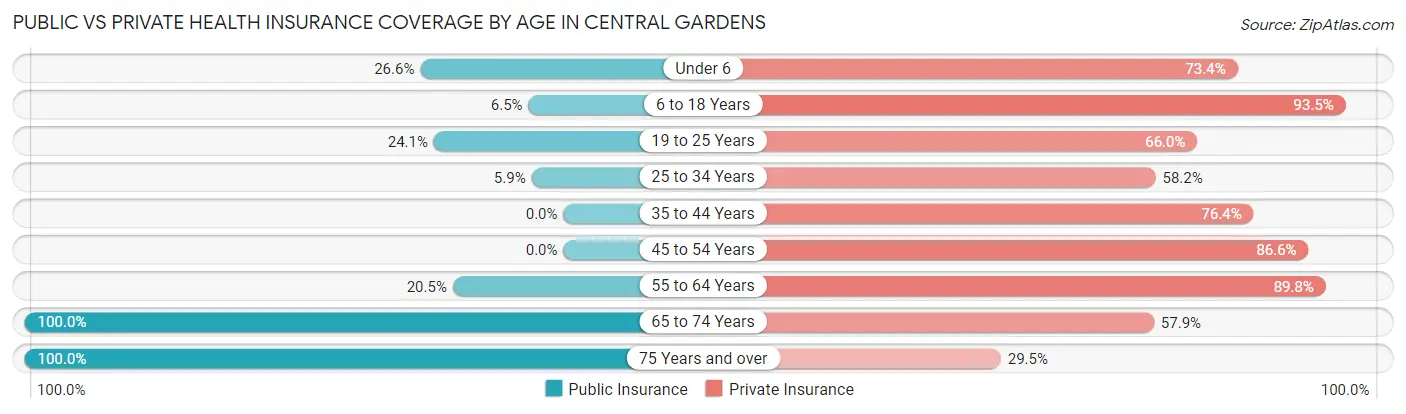
| Age Bracket | Public Insurance | Private Insurance |
| Under 6 | 51 (26.6%) | 141 (73.4%) |
| 6 to 18 Years | 32 (6.5%) | 462 (93.5%) |
| 19 to 25 Years | 82 (24.0%) | 225 (66.0%) |
| 25 to 34 Years | 14 (5.9%) | 138 (58.2%) |
| 35 to 44 Years | 0 (0.0%) | 441 (76.4%) |
| 45 to 54 Years | 0 (0.0%) | 472 (86.6%) |
| 55 to 64 Years | 131 (20.5%) | 573 (89.8%) |
| 65 to 74 Years | 271 (100.0%) | 157 (57.9%) |
| 75 Years and over | 332 (100.0%) | 98 (29.5%) |
| Total | 913 (25.2%) | 2,707 (74.6%) |
Disability Status by Sex by Age in Central Gardens
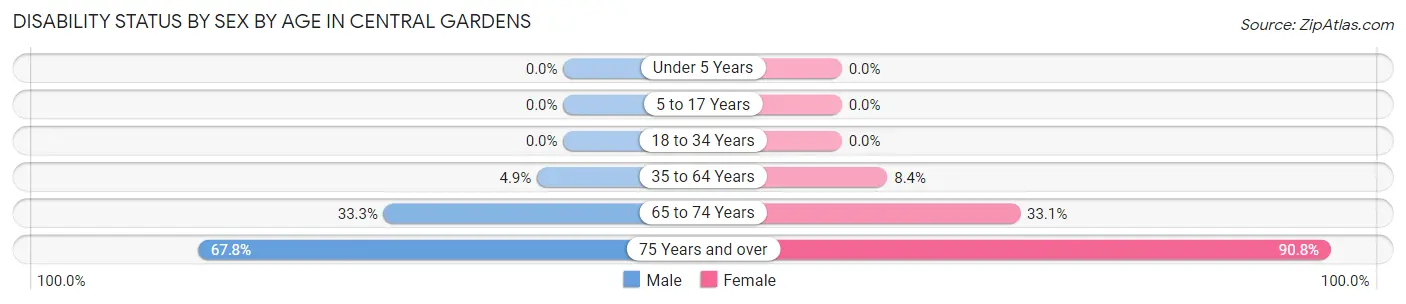
| Age Bracket | Male | Female |
| Under 5 Years | 0 (0.0%) | 0 (0.0%) |
| 5 to 17 Years | 0 (0.0%) | 0 (0.0%) |
| 18 to 34 Years | 0 (0.0%) | 0 (0.0%) |
| 35 to 64 Years | 43 (4.9%) | 74 (8.4%) |
| 65 to 74 Years | 45 (33.3%) | 45 (33.1%) |
| 75 Years and over | 78 (67.8%) | 197 (90.8%) |
Disability Class by Sex by Age in Central Gardens
Disability Class: Hearing Difficulty
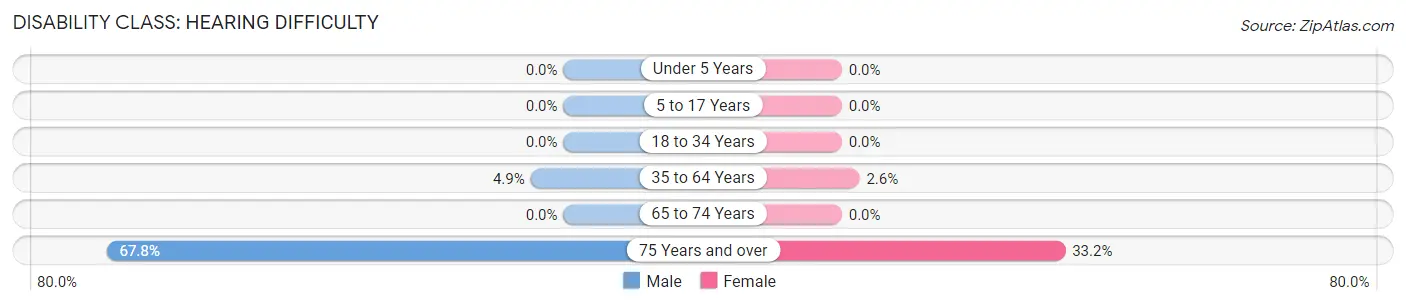
| Age Bracket | Male | Female |
| Under 5 Years | 0 (0.0%) | 0 (0.0%) |
| 5 to 17 Years | 0 (0.0%) | 0 (0.0%) |
| 18 to 34 Years | 0 (0.0%) | 0 (0.0%) |
| 35 to 64 Years | 43 (4.9%) | 23 (2.6%) |
| 65 to 74 Years | 0 (0.0%) | 0 (0.0%) |
| 75 Years and over | 78 (67.8%) | 72 (33.2%) |
Disability Class: Vision Difficulty
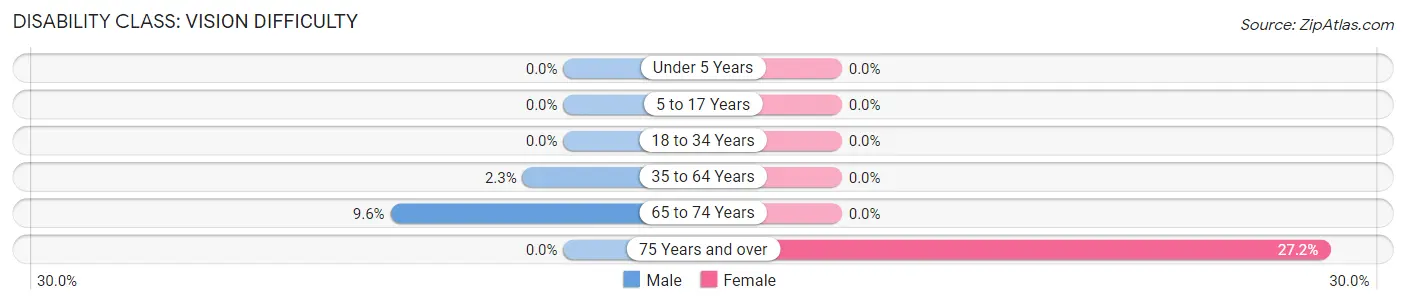
| Age Bracket | Male | Female |
| Under 5 Years | 0 (0.0%) | 0 (0.0%) |
| 5 to 17 Years | 0 (0.0%) | 0 (0.0%) |
| 18 to 34 Years | 0 (0.0%) | 0 (0.0%) |
| 35 to 64 Years | 20 (2.3%) | 0 (0.0%) |
| 65 to 74 Years | 13 (9.6%) | 0 (0.0%) |
| 75 Years and over | 0 (0.0%) | 59 (27.2%) |
Disability Class: Cognitive Difficulty
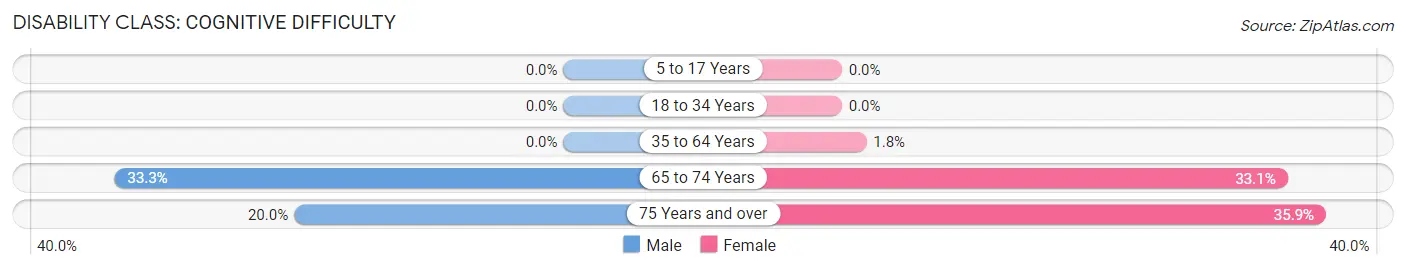
| Age Bracket | Male | Female |
| 5 to 17 Years | 0 (0.0%) | 0 (0.0%) |
| 18 to 34 Years | 0 (0.0%) | 0 (0.0%) |
| 35 to 64 Years | 0 (0.0%) | 16 (1.8%) |
| 65 to 74 Years | 45 (33.3%) | 45 (33.1%) |
| 75 Years and over | 23 (20.0%) | 78 (35.9%) |
Disability Class: Ambulatory Difficulty
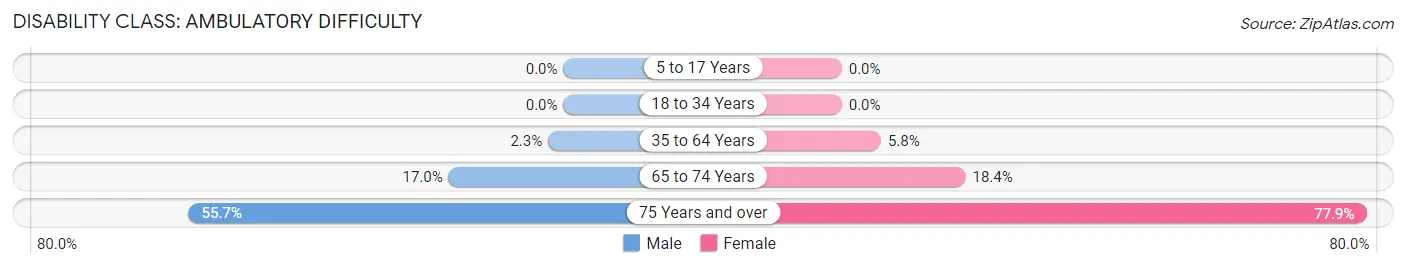
| Age Bracket | Male | Female |
| 5 to 17 Years | 0 (0.0%) | 0 (0.0%) |
| 18 to 34 Years | 0 (0.0%) | 0 (0.0%) |
| 35 to 64 Years | 20 (2.3%) | 51 (5.8%) |
| 65 to 74 Years | 23 (17.0%) | 25 (18.4%) |
| 75 Years and over | 64 (55.6%) | 169 (77.9%) |
Disability Class: Self-Care Difficulty
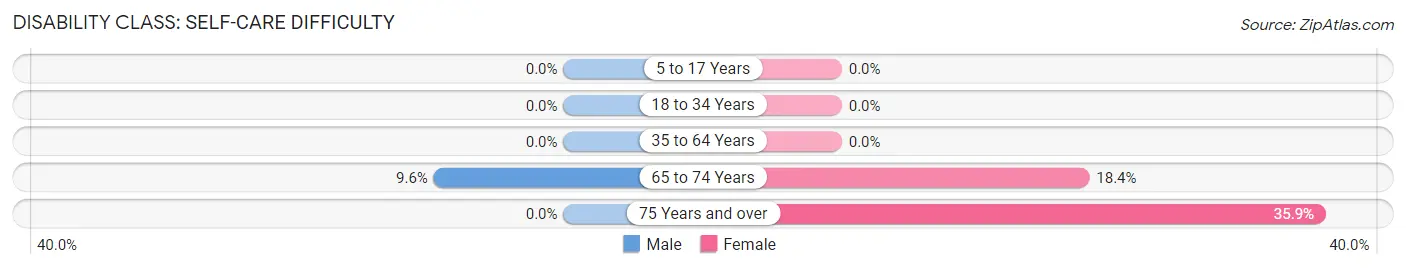
| Age Bracket | Male | Female |
| 5 to 17 Years | 0 (0.0%) | 0 (0.0%) |
| 18 to 34 Years | 0 (0.0%) | 0 (0.0%) |
| 35 to 64 Years | 0 (0.0%) | 0 (0.0%) |
| 65 to 74 Years | 13 (9.6%) | 25 (18.4%) |
| 75 Years and over | 0 (0.0%) | 78 (35.9%) |
Technology Access in Central Gardens
Computing Device Access in Central Gardens
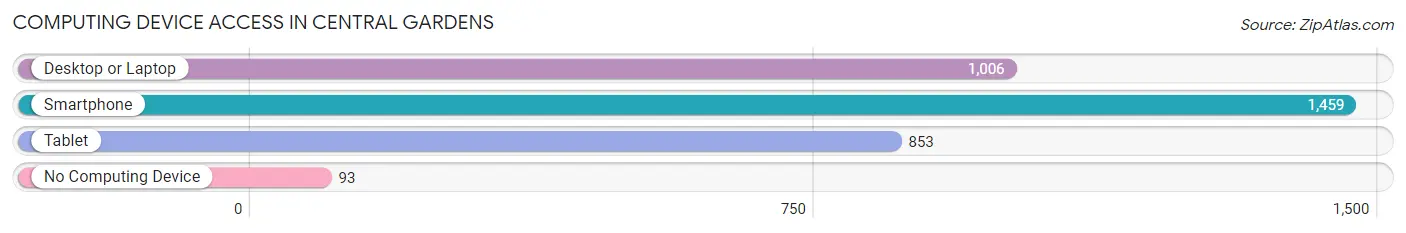
| Device Type | # Households | % Households |
| Desktop or Laptop | 1,006 | 62.2% |
| Smartphone | 1,459 | 90.2% |
| Tablet | 853 | 52.7% |
| No Computing Device | 93 | 5.8% |
| Total | 1,618 | 100.0% |
Internet Access in Central Gardens
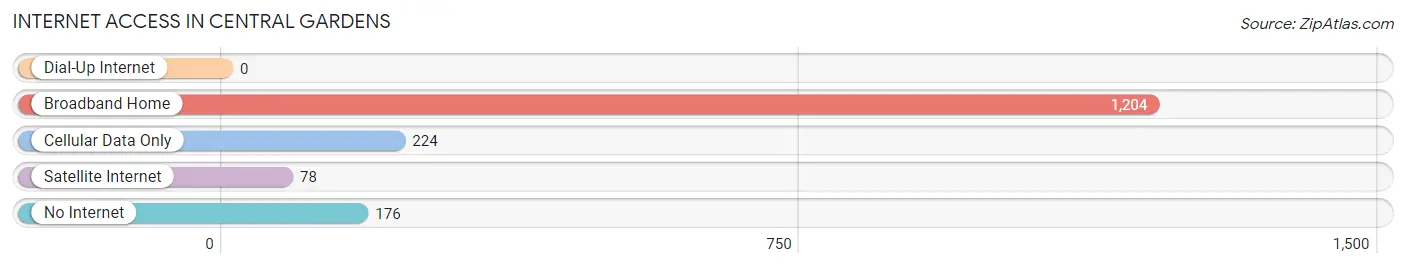
| Internet Type | # Households | % Households |
| Dial-Up Internet | 0 | 0.0% |
| Broadband Home | 1,204 | 74.4% |
| Cellular Data Only | 224 | 13.8% |
| Satellite Internet | 78 | 4.8% |
| No Internet | 176 | 10.9% |
| Total | 1,618 | 100.0% |
Central Gardens Summary
Introduction
Central Gardens is a small unincorporated community located in the state of Texas, United States. It is situated in the southeastern part of the state, in the county of Harris. The community is located near the city of Houston, and is part of the Houston–The Woodlands–Sugar Land metropolitan area. Central Gardens is a small, rural community with a population of just over 1,000 people. The community is known for its rural charm and its close-knit community.
History
Central Gardens was first settled in the late 1800s by a group of German immigrants. The community was originally known as “Garden Valley” and was a small farming community. The community was later renamed “Central Gardens” in the early 1900s. The name was chosen to reflect the area’s agricultural roots.
In the early 1900s, the community began to grow and develop. The first school was built in the area in 1910, and the first post office was established in 1912. The community continued to grow and develop throughout the 20th century. In the 1950s, the community was connected to the Houston metropolitan area by the construction of the Houston Ship Channel. This allowed for increased economic development in the area.
Geography
Central Gardens is located in the southeastern part of the state of Texas, in the county of Harris. The community is situated near the city of Houston, and is part of the Houston–The Woodlands–Sugar Land metropolitan area. The community is located at an elevation of approximately 30 feet above sea level.
The climate in Central Gardens is classified as humid subtropical. The area experiences hot, humid summers and mild winters. The average annual temperature is around 70 degrees Fahrenheit. The average annual precipitation is around 50 inches.
Economy
The economy of Central Gardens is largely based on agriculture. The area is home to several farms and ranches, which produce a variety of crops and livestock. The community is also home to several small businesses, including restaurants, retail stores, and service providers.
The community is also home to several oil and gas companies, which are involved in the exploration and production of oil and gas in the area. The community is also home to several manufacturing companies, which produce a variety of products.
Demographics
As of the 2010 census, the population of Central Gardens was 1,072. The racial makeup of the community was 79.3% White, 15.2% African American, 0.7% Native American, 0.7% Asian, 0.1% Pacific Islander, and 3.8% from other races. The median household income was $45,000, and the median family income was $50,000.
Conclusion
Central Gardens is a small, rural community located in the southeastern part of the state of Texas. The community is known for its rural charm and its close-knit community. The economy of Central Gardens is largely based on agriculture, and the area is home to several small businesses. The population of Central Gardens is just over 1,000 people, and the racial makeup of the community is predominantly White.
Common Questions
What is Per Capita Income in Central Gardens?
Per Capita income in Central Gardens is $50,040.
What is the Median Family Income in Central Gardens?
Median Family Income in Central Gardens is $144,332.
What is the Median Household income in Central Gardens?
Median Household Income in Central Gardens is $98,750.
What is Income or Wage Gap in Central Gardens?
Income or Wage Gap in Central Gardens is 43.0%.
Women in Central Gardens earn 57.0 cents for every dollar earned by a man.
What is Inequality or Gini Index in Central Gardens?
Inequality or Gini Index in Central Gardens is 0.37.
What is the Total Population of Central Gardens?
Total Population of Central Gardens is 3,627.
What is the Total Male Population of Central Gardens?
Total Male Population of Central Gardens is 1,809.
What is the Total Female Population of Central Gardens?
Total Female Population of Central Gardens is 1,818.
What is the Ratio of Males per 100 Females in Central Gardens?
There are 99.50 Males per 100 Females in Central Gardens.
What is the Ratio of Females per 100 Males in Central Gardens?
There are 100.50 Females per 100 Males in Central Gardens.
What is the Median Population Age in Central Gardens?
Median Population Age in Central Gardens is 43.8 Years.
What is the Average Family Size in Central Gardens
Average Family Size in Central Gardens is 3.0 People.
What is the Average Household Size in Central Gardens
Average Household Size in Central Gardens is 2.2 People.
How Large is the Labor Force in Central Gardens?
There are 2,065 People in the Labor Forcein in Central Gardens.
What is the Percentage of People in the Labor Force in Central Gardens?
67.3% of People are in the Labor Force in Central Gardens.
What is the Unemployment Rate in Central Gardens?
Unemployment Rate in Central Gardens is 2.6%.