Spring Valley, KY Map & Demographics
Spring Valley Map
Spring Valley Overview
$51,500
PER CAPITA INCOME
$156,250
AVG FAMILY INCOME
$148,750
AVG HOUSEHOLD INCOME
48.9%
WAGE / INCOME GAP [ % ]
51.1¢/ $1
WAGE / INCOME GAP [ $ ]
0.31
INEQUALITY / GINI INDEX
859
TOTAL POPULATION
383
MALE POPULATION
476
FEMALE POPULATION
80.46
MALES / 100 FEMALES
124.28
FEMALES / 100 MALES
37.3
MEDIAN AGE
3.5
AVG FAMILY SIZE
3.3
AVG HOUSEHOLD SIZE
403
LABOR FORCE [ PEOPLE ]
71.2%
PERCENT IN LABOR FORCE
2.0%
UNEMPLOYMENT RATE
Spring Valley Area Codes
Income in Spring Valley
Income Overview in Spring Valley
Per Capita Income in Spring Valley is $51,500, while median incomes of families and households are $156,250 and $148,750 respectively.
| Characteristic | Number | Measure |
| Per Capita Income | 859 | $51,500 |
| Median Family Income | 233 | $156,250 |
| Mean Family Income | 233 | $180,329 |
| Median Household Income | 263 | $148,750 |
| Mean Household Income | 263 | $169,973 |
| Income Deficit | 233 | $0 |
| Wage / Income Gap (%) | 859 | 48.88% |
| Wage / Income Gap ($) | 859 | 51.12¢ per $1 |
| Gini / Inequality Index | 859 | 0.31 |
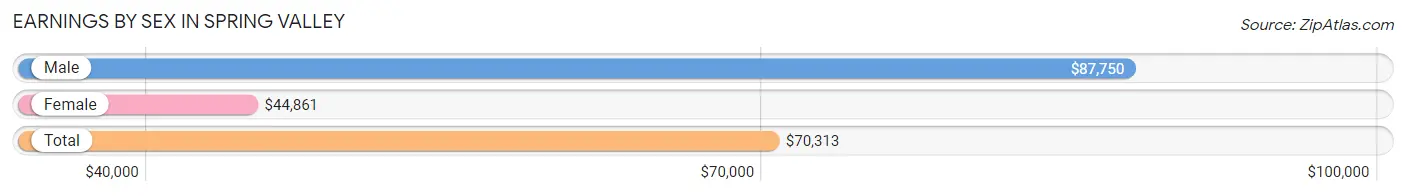
Earnings by Sex in Spring Valley
Average Earnings in Spring Valley are $70,313, $87,750 for men and $44,861 for women, a difference of 48.9%.
| Sex | Number | Average Earnings |
| Male | 216 (51.5%) | $87,750 |
| Female | 203 (48.4%) | $44,861 |
| Total | 419 (100.0%) | $70,313 |
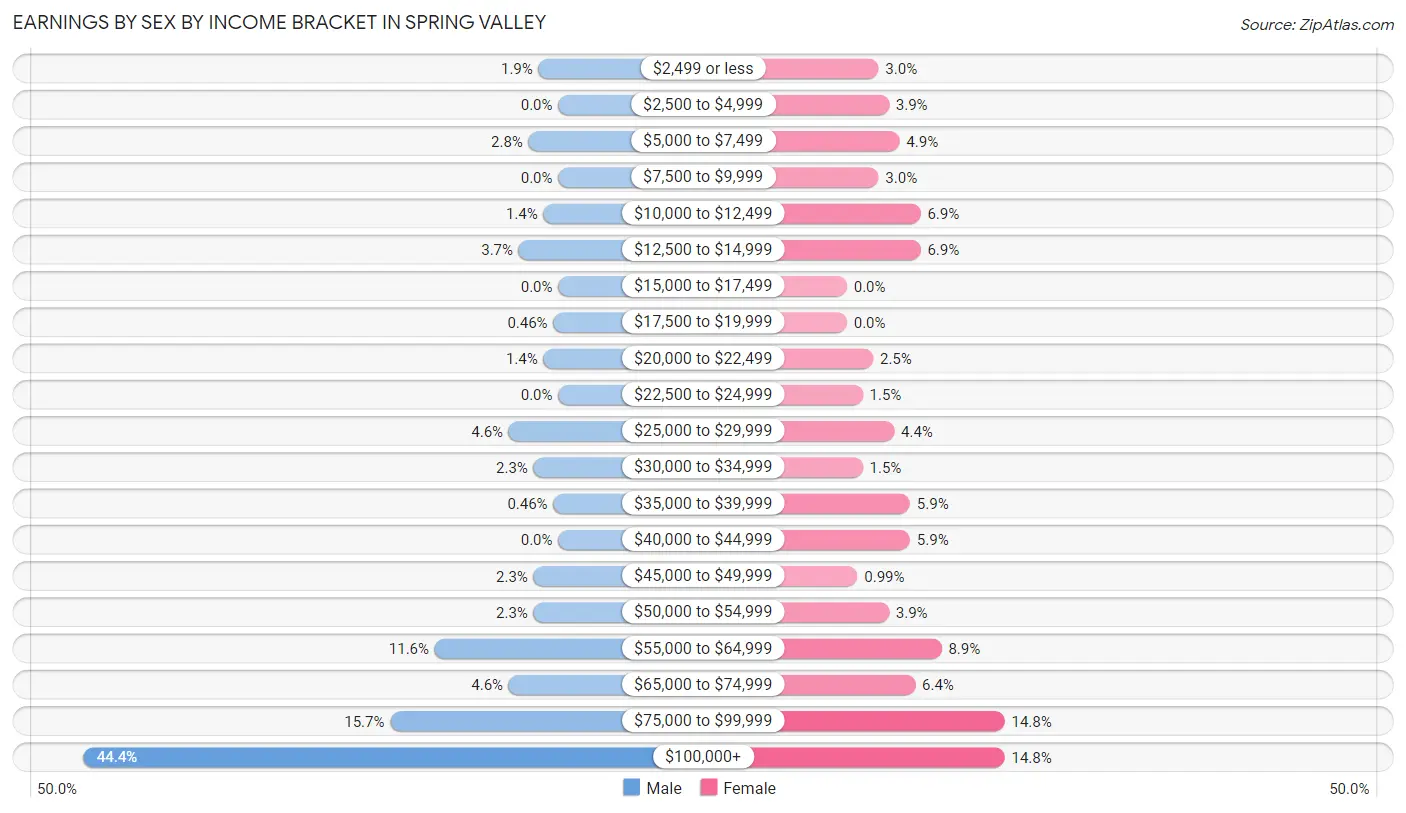
Earnings by Sex by Income Bracket in Spring Valley
The most common earnings brackets in Spring Valley are $100,000+ for men (96 | 44.4%) and $75,000 to $99,999 for women (30 | 14.8%).
| Income | Male | Female |
| $2,499 or less | 4 (1.8%) | 6 (3.0%) |
| $2,500 to $4,999 | 0 (0.0%) | 8 (3.9%) |
| $5,000 to $7,499 | 6 (2.8%) | 10 (4.9%) |
| $7,500 to $9,999 | 0 (0.0%) | 6 (3.0%) |
| $10,000 to $12,499 | 3 (1.4%) | 14 (6.9%) |
| $12,500 to $14,999 | 8 (3.7%) | 14 (6.9%) |
| $15,000 to $17,499 | 0 (0.0%) | 0 (0.0%) |
| $17,500 to $19,999 | 1 (0.5%) | 0 (0.0%) |
| $20,000 to $22,499 | 3 (1.4%) | 5 (2.5%) |
| $22,500 to $24,999 | 0 (0.0%) | 3 (1.5%) |
| $25,000 to $29,999 | 10 (4.6%) | 9 (4.4%) |
| $30,000 to $34,999 | 5 (2.3%) | 3 (1.5%) |
| $35,000 to $39,999 | 1 (0.5%) | 12 (5.9%) |
| $40,000 to $44,999 | 0 (0.0%) | 12 (5.9%) |
| $45,000 to $49,999 | 5 (2.3%) | 2 (1.0%) |
| $50,000 to $54,999 | 5 (2.3%) | 8 (3.9%) |
| $55,000 to $64,999 | 25 (11.6%) | 18 (8.9%) |
| $65,000 to $74,999 | 10 (4.6%) | 13 (6.4%) |
| $75,000 to $99,999 | 34 (15.7%) | 30 (14.8%) |
| $100,000+ | 96 (44.4%) | 30 (14.8%) |
| Total | 216 (100.0%) | 203 (100.0%) |
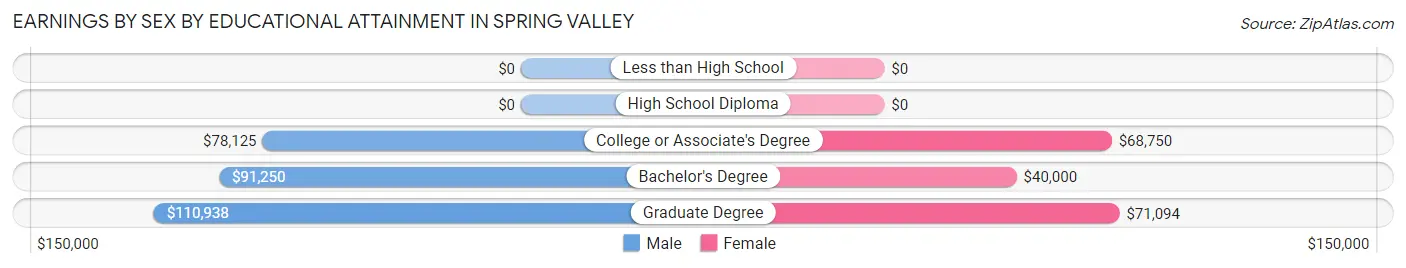
Earnings by Sex by Educational Attainment in Spring Valley
Average earnings in Spring Valley are $89,125 for men and $55,694 for women, a difference of 37.5%. Men with an educational attainment of graduate degree enjoy the highest average annual earnings of $110,938, while those with college or associate's degree education earn the least with $78,125. Women with an educational attainment of graduate degree earn the most with the average annual earnings of $71,094, while those with bachelor's degree education have the smallest earnings of $40,000.
| Educational Attainment | Male Income | Female Income |
| Less than High School | - | - |
| High School Diploma | - | - |
| College or Associate's Degree | $78,125 | $68,750 |
| Bachelor's Degree | $91,250 | $40,000 |
| Graduate Degree | $110,938 | $71,094 |
| Total | $89,125 | $55,694 |
Family Income in Spring Valley
Family Income Brackets in Spring Valley
According to the Spring Valley family income data, there are 86 families falling into the $100,000 to $149,999 income range, which is the most common income bracket and makes up 36.9% of all families.
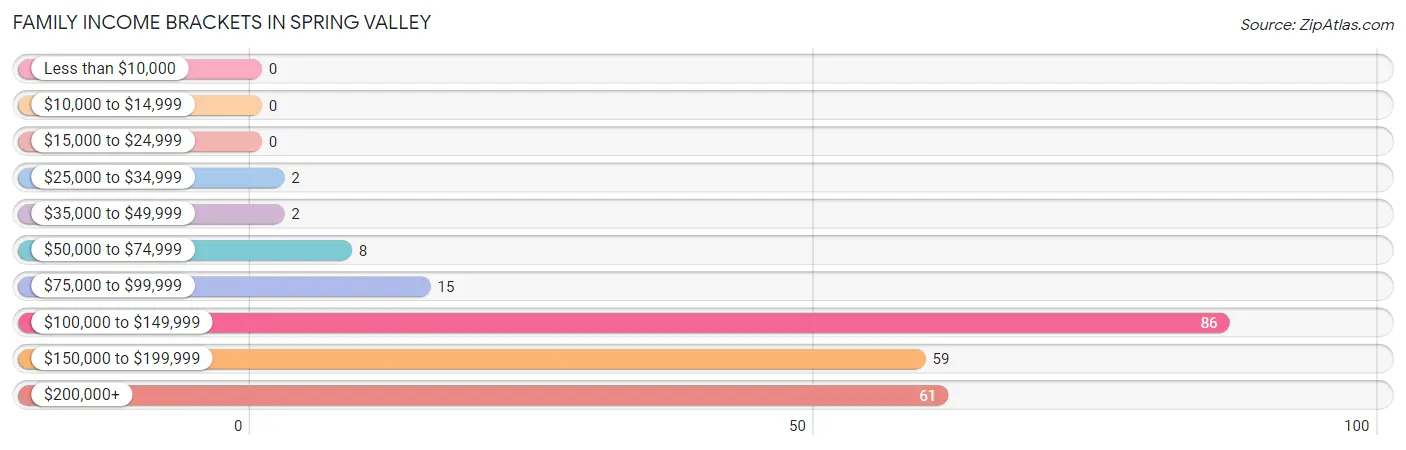
| Income Bracket | # Families | % Families |
| Less than $10,000 | 0 | 0.0% |
| $10,000 to $14,999 | 0 | 0.0% |
| $15,000 to $24,999 | 0 | 0.0% |
| $25,000 to $34,999 | 2 | 0.9% |
| $35,000 to $49,999 | 2 | 0.9% |
| $50,000 to $74,999 | 8 | 3.4% |
| $75,000 to $99,999 | 15 | 6.4% |
| $100,000 to $149,999 | 86 | 36.9% |
| $150,000 to $199,999 | 59 | 25.3% |
| $200,000+ | 61 | 26.2% |
Family Income by Famaliy Size in Spring Valley
4-person families (48 | 20.6%) account for the highest median family income in Spring Valley with $183,333 per family, while 2-person families (83 | 35.6%) have the highest median income of $74,140 per family member.
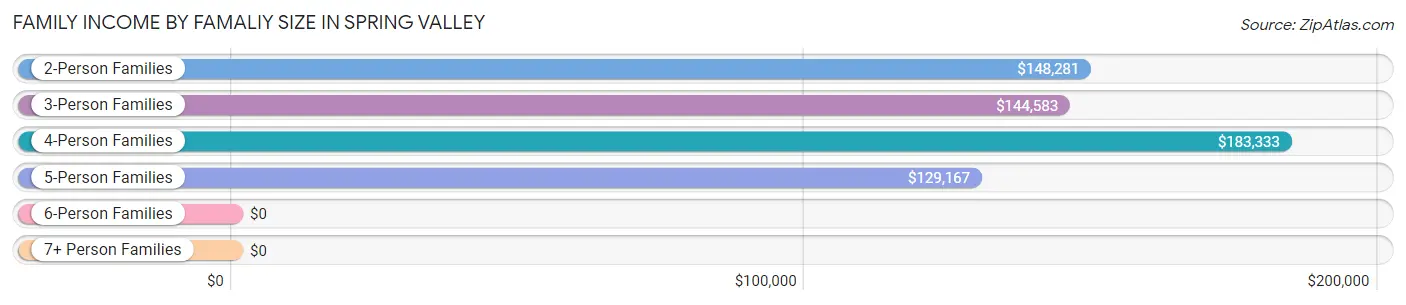
| Income Bracket | # Families | Median Income |
| 2-Person Families | 83 (35.6%) | $148,281 |
| 3-Person Families | 35 (15.0%) | $144,583 |
| 4-Person Families | 48 (20.6%) | $183,333 |
| 5-Person Families | 58 (24.9%) | $129,167 |
| 6-Person Families | 6 (2.6%) | $0 |
| 7+ Person Families | 3 (1.3%) | $0 |
| Total | 233 (100.0%) | $156,250 |
Family Income by Number of Earners in Spring Valley
The median family income in Spring Valley is $156,250, with families comprising 3+ earners (26) having the highest median family income of $193,750, while families with no earners (19) have the lowest median family income of $106,875, accounting for 11.2% and 8.2% of families, respectively.
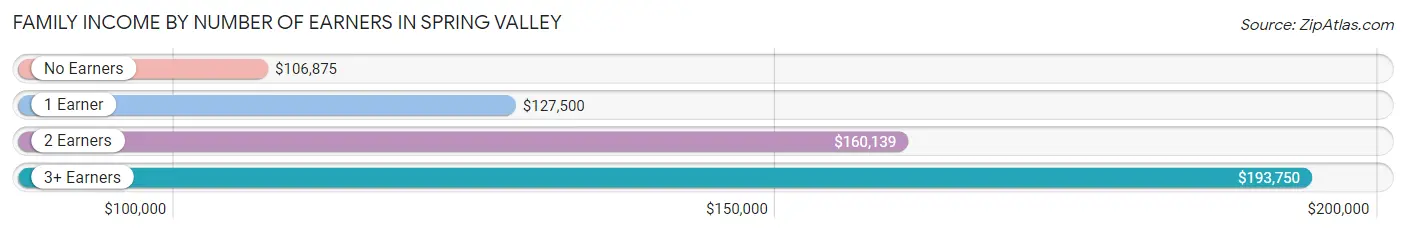
| Number of Earners | # Families | Median Income |
| No Earners | 19 (8.2%) | $106,875 |
| 1 Earner | 64 (27.5%) | $127,500 |
| 2 Earners | 124 (53.2%) | $160,139 |
| 3+ Earners | 26 (11.2%) | $193,750 |
| Total | 233 (100.0%) | $156,250 |
Household Income in Spring Valley
Household Income Brackets in Spring Valley
With 87 households falling in the category, the $100,000 to $149,999 income range is the most frequent in Spring Valley, accounting for 33.1% of all households. In contrast, only 1 households (0.4%) fall into the $10,000 to $14,999 income bracket, making it the least populous group.
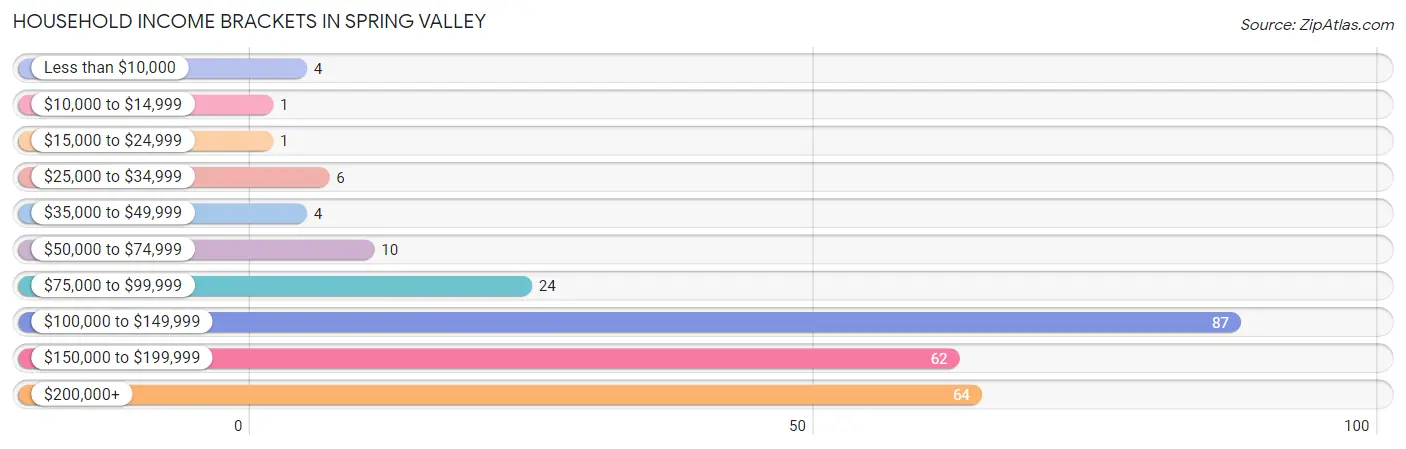
| Income Bracket | # Households | % Households |
| Less than $10,000 | 4 | 1.5% |
| $10,000 to $14,999 | 1 | 0.4% |
| $15,000 to $24,999 | 1 | 0.4% |
| $25,000 to $34,999 | 6 | 2.3% |
| $35,000 to $49,999 | 4 | 1.5% |
| $50,000 to $74,999 | 10 | 3.8% |
| $75,000 to $99,999 | 24 | 9.1% |
| $100,000 to $149,999 | 87 | 33.1% |
| $150,000 to $199,999 | 62 | 23.6% |
| $200,000+ | 64 | 24.3% |
Household Income by Householder Age in Spring Valley
The median household income in Spring Valley is $148,750, with the highest median household income of $181,250 found in the 45 to 64 years age bracket for the primary householder. A total of 92 households (35.0%) fall into this category.
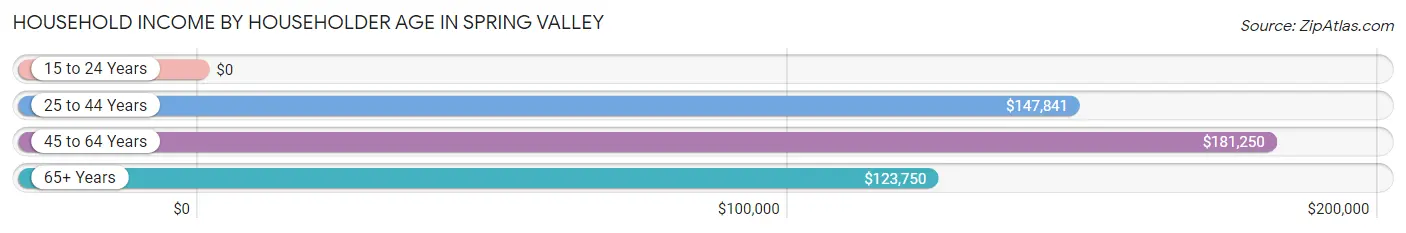
| Income Bracket | # Households | Median Income |
| 15 to 24 Years | 0 (0.0%) | $0 |
| 25 to 44 Years | 107 (40.7%) | $147,841 |
| 45 to 64 Years | 92 (35.0%) | $181,250 |
| 65+ Years | 64 (24.3%) | $123,750 |
| Total | 263 (100.0%) | $148,750 |
Poverty in Spring Valley
Income Below Poverty by Sex and Age in Spring Valley
With 0.3% poverty level for males and 0.8% for females among the residents of Spring Valley, 55 to 64 year old males and 75 year old and over females are the most vulnerable to poverty, with 1 males (2.9%) and 2 females (8.3%) in their respective age groups living below the poverty level.
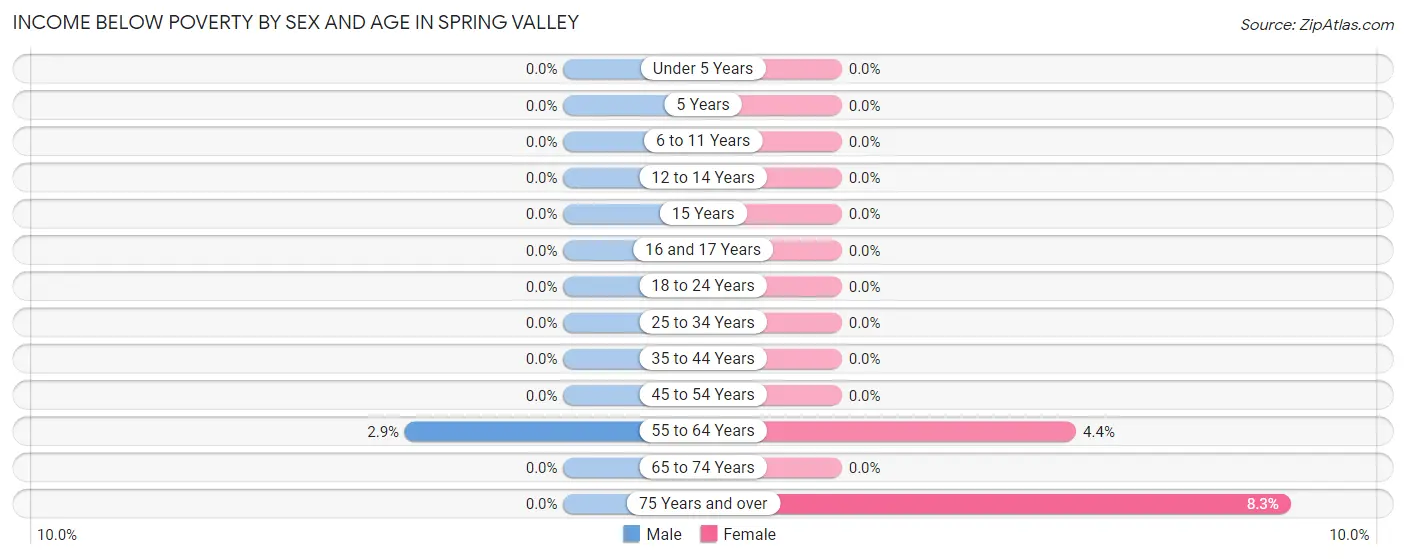
| Age Bracket | Male | Female |
| Under 5 Years | 0 (0.0%) | 0 (0.0%) |
| 5 Years | 0 (0.0%) | 0 (0.0%) |
| 6 to 11 Years | 0 (0.0%) | 0 (0.0%) |
| 12 to 14 Years | 0 (0.0%) | 0 (0.0%) |
| 15 Years | 0 (0.0%) | 0 (0.0%) |
| 16 and 17 Years | 0 (0.0%) | 0 (0.0%) |
| 18 to 24 Years | 0 (0.0%) | 0 (0.0%) |
| 25 to 34 Years | 0 (0.0%) | 0 (0.0%) |
| 35 to 44 Years | 0 (0.0%) | 0 (0.0%) |
| 45 to 54 Years | 0 (0.0%) | 0 (0.0%) |
| 55 to 64 Years | 1 (2.9%) | 2 (4.3%) |
| 65 to 74 Years | 0 (0.0%) | 0 (0.0%) |
| 75 Years and over | 0 (0.0%) | 2 (8.3%) |
| Total | 1 (0.3%) | 4 (0.8%) |
Income Above Poverty by Sex and Age in Spring Valley
According to the poverty statistics in Spring Valley, males aged under 5 years and females aged under 5 years are the age groups that are most secure financially, with 100.0% of males and 100.0% of females in these age groups living above the poverty line.
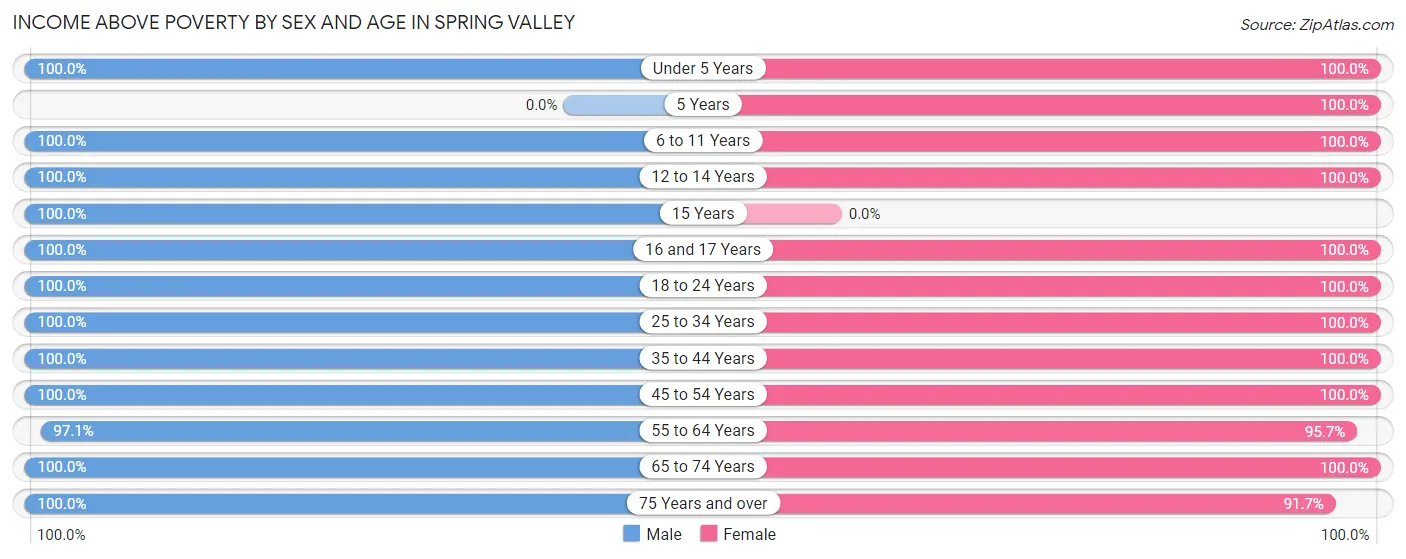
| Age Bracket | Male | Female |
| Under 5 Years | 15 (100.0%) | 61 (100.0%) |
| 5 Years | 0 (0.0%) | 15 (100.0%) |
| 6 to 11 Years | 48 (100.0%) | 89 (100.0%) |
| 12 to 14 Years | 33 (100.0%) | 26 (100.0%) |
| 15 Years | 6 (100.0%) | 0 (0.0%) |
| 16 and 17 Years | 15 (100.0%) | 14 (100.0%) |
| 18 to 24 Years | 15 (100.0%) | 22 (100.0%) |
| 25 to 34 Years | 27 (100.0%) | 18 (100.0%) |
| 35 to 44 Years | 75 (100.0%) | 92 (100.0%) |
| 45 to 54 Years | 54 (100.0%) | 43 (100.0%) |
| 55 to 64 Years | 33 (97.1%) | 44 (95.7%) |
| 65 to 74 Years | 31 (100.0%) | 26 (100.0%) |
| 75 Years and over | 30 (100.0%) | 22 (91.7%) |
| Total | 382 (99.7%) | 472 (99.2%) |
Income Below Poverty Among Married-Couple Families in Spring Valley
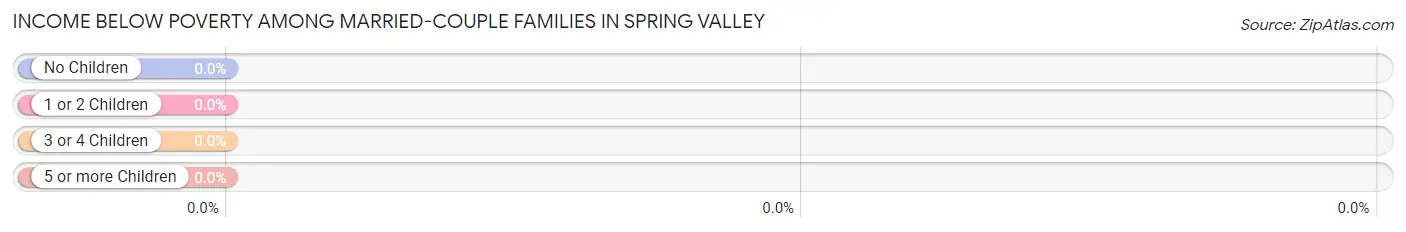
| Children | Above Poverty | Below Poverty |
| No Children | 99 (100.0%) | 0 (0.0%) |
| 1 or 2 Children | 67 (100.0%) | 0 (0.0%) |
| 3 or 4 Children | 59 (100.0%) | 0 (0.0%) |
| 5 or more Children | 0 (0.0%) | 0 (0.0%) |
| Total | 225 (100.0%) | 0 (0.0%) |
Income Below Poverty Among Single-Parent Households in Spring Valley
| Children | Single Father | Single Mother |
| No Children | 0 (0.0%) | 0 (0.0%) |
| 1 or 2 Children | 0 (0.0%) | 0 (0.0%) |
| 3 or 4 Children | 0 (0.0%) | 0 (0.0%) |
| 5 or more Children | 0 (0.0%) | 0 (0.0%) |
| Total | 0 (0.0%) | 0 (0.0%) |
Income Below Poverty Among Married-Couple vs Single-Parent Households in Spring Valley
| Children | Married-Couple Families | Single-Parent Households |
| No Children | 0 (0.0%) | 0 (0.0%) |
| 1 or 2 Children | 0 (0.0%) | 0 (0.0%) |
| 3 or 4 Children | 0 (0.0%) | 0 (0.0%) |
| 5 or more Children | 0 (0.0%) | 0 (0.0%) |
| Total | 0 (0.0%) | 0 (0.0%) |
Race in Spring Valley
The most populous races in Spring Valley are White / Caucasian (810 | 94.3%), Black / African American (23 | 2.7%), and Hispanic or Latino (20 | 2.3%).
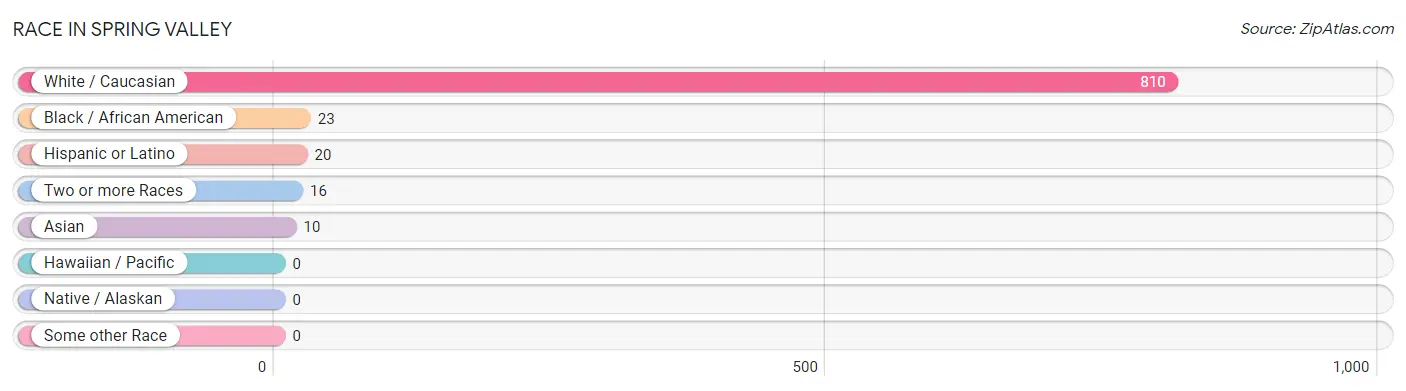
| Race | # Population | % Population |
| Asian | 10 | 1.2% |
| Black / African American | 23 | 2.7% |
| Hawaiian / Pacific | 0 | 0.0% |
| Hispanic or Latino | 20 | 2.3% |
| Native / Alaskan | 0 | 0.0% |
| White / Caucasian | 810 | 94.3% |
| Two or more Races | 16 | 1.9% |
| Some other Race | 0 | 0.0% |
| Total | 859 | 100.0% |
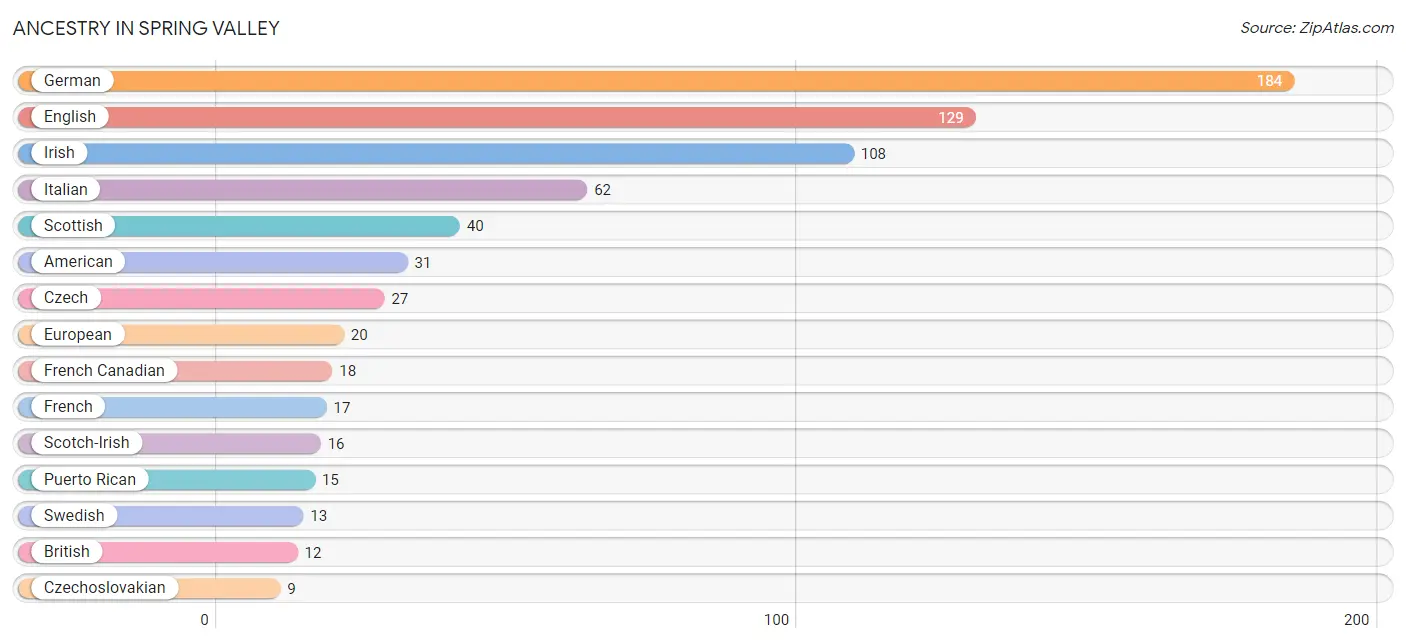
Ancestry in Spring Valley
The most populous ancestries reported in Spring Valley are German (184 | 21.4%), English (129 | 15.0%), Irish (108 | 12.6%), Italian (62 | 7.2%), and Scottish (40 | 4.7%), together accounting for 60.9% of all Spring Valley residents.
| Ancestry | # Population | % Population |
| American | 31 | 3.6% |
| Arab | 4 | 0.5% |
| Austrian | 2 | 0.2% |
| Belgian | 2 | 0.2% |
| British | 12 | 1.4% |
| Burmese | 7 | 0.8% |
| Colombian | 4 | 0.5% |
| Czech | 27 | 3.1% |
| Czechoslovakian | 9 | 1.1% |
| Dutch | 2 | 0.2% |
| Eastern European | 5 | 0.6% |
| English | 129 | 15.0% |
| Ethiopian | 9 | 1.1% |
| European | 20 | 2.3% |
| French | 17 | 2.0% |
| French Canadian | 18 | 2.1% |
| German | 184 | 21.4% |
| Irish | 108 | 12.6% |
| Italian | 62 | 7.2% |
| Lebanese | 4 | 0.5% |
| Mexican | 1 | 0.1% |
| Norwegian | 3 | 0.4% |
| Pakistani | 6 | 0.7% |
| Polish | 2 | 0.2% |
| Puerto Rican | 15 | 1.8% |
| Russian | 2 | 0.2% |
| Scotch-Irish | 16 | 1.9% |
| Scottish | 40 | 4.7% |
| South American | 4 | 0.5% |
| Subsaharan African | 9 | 1.1% |
| Swedish | 13 | 1.5% |
| Swiss | 5 | 0.6% |
| Thai | 8 | 0.9% |
| Yugoslavian | 9 | 1.1% | View All 34 Rows |
Immigrants in Spring Valley
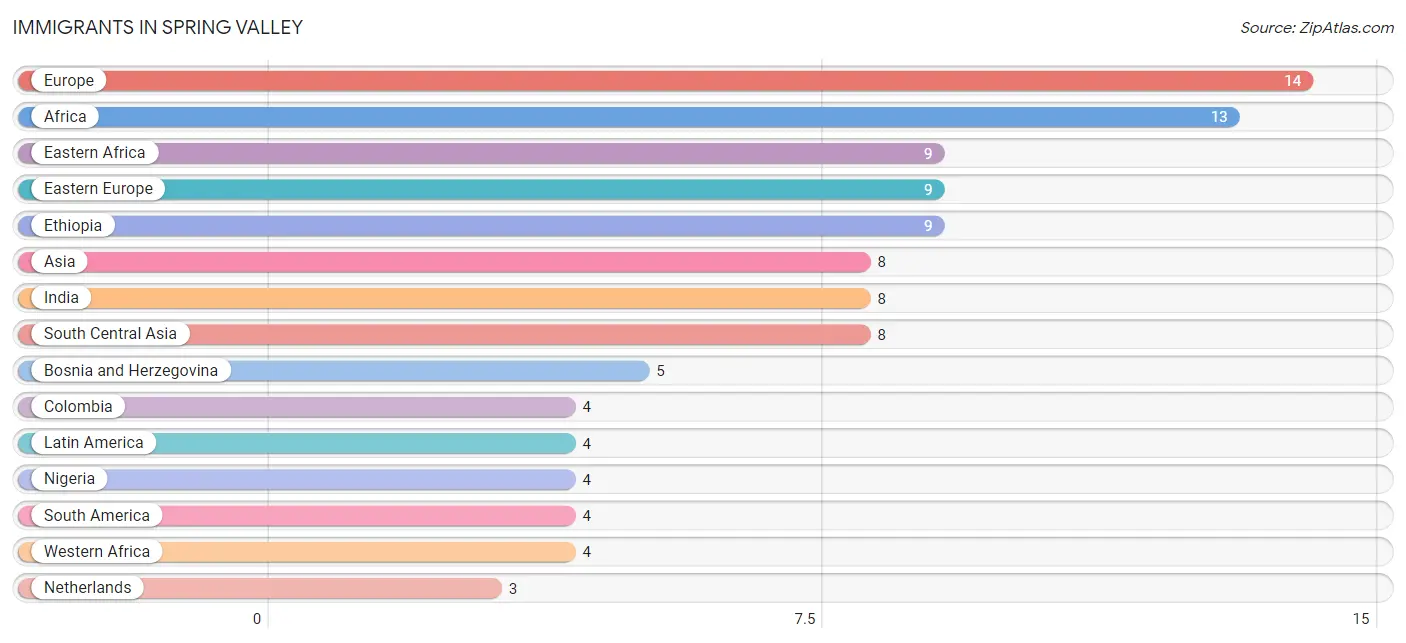
The most numerous immigrant groups reported in Spring Valley came from Europe (14 | 1.6%), Africa (13 | 1.5%), Eastern Africa (9 | 1.1%), Eastern Europe (9 | 1.1%), and Ethiopia (9 | 1.1%), together accounting for 6.3% of all Spring Valley residents.
| Immigration Origin | # Population | % Population |
| Africa | 13 | 1.5% |
| Asia | 8 | 0.9% |
| Bosnia and Herzegovina | 5 | 0.6% |
| Colombia | 4 | 0.5% |
| Eastern Africa | 9 | 1.1% |
| Eastern Europe | 9 | 1.1% |
| Ethiopia | 9 | 1.1% |
| Europe | 14 | 1.6% |
| India | 8 | 0.9% |
| Latin America | 4 | 0.5% |
| Netherlands | 3 | 0.4% |
| Nigeria | 4 | 0.5% |
| Northern Europe | 2 | 0.2% |
| South America | 4 | 0.5% |
| South Central Asia | 8 | 0.9% |
| Western Africa | 4 | 0.5% |
| Western Europe | 3 | 0.4% | View All 17 Rows |
Sex and Age in Spring Valley
Sex and Age in Spring Valley
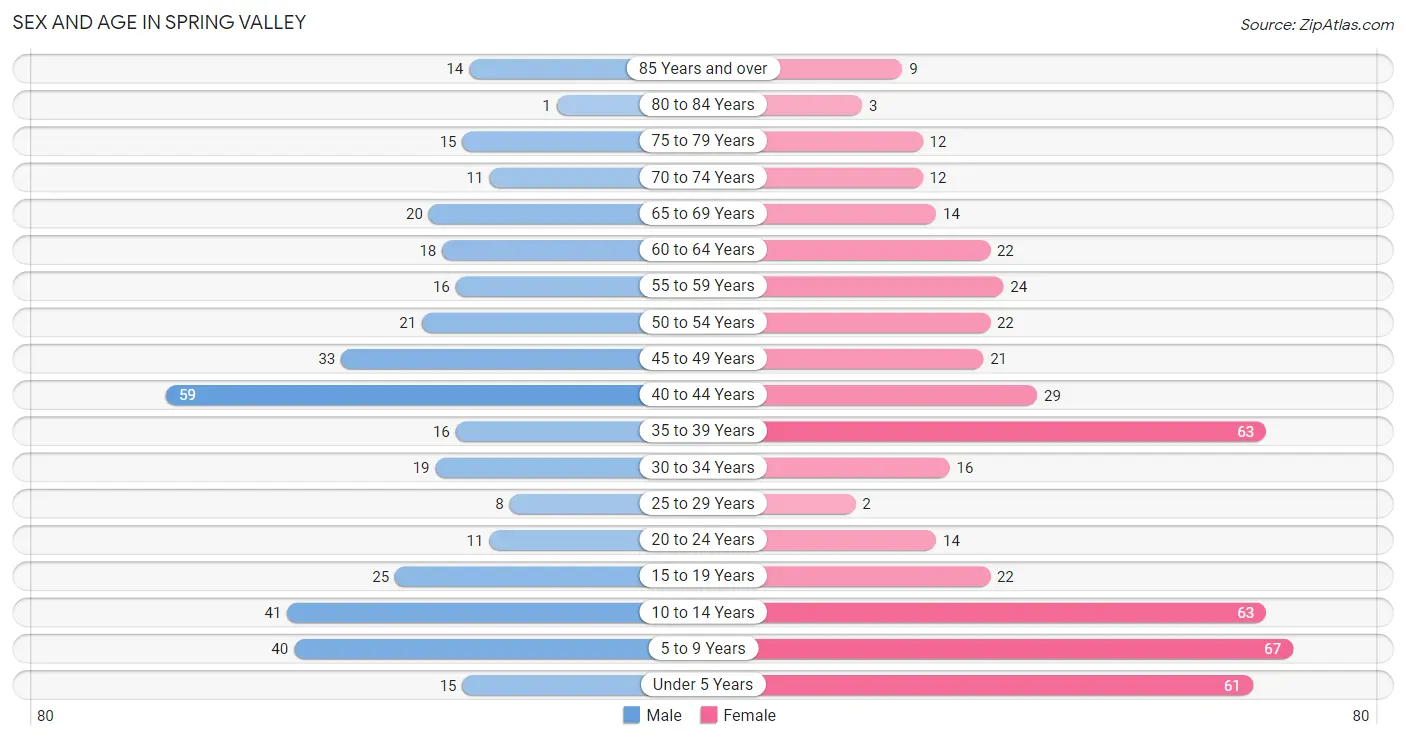
The most populous age groups in Spring Valley are 40 to 44 Years (59 | 15.4%) for men and 5 to 9 Years (67 | 14.1%) for women.
| Age Bracket | Male | Female |
| Under 5 Years | 15 (3.9%) | 61 (12.8%) |
| 5 to 9 Years | 40 (10.4%) | 67 (14.1%) |
| 10 to 14 Years | 41 (10.7%) | 63 (13.2%) |
| 15 to 19 Years | 25 (6.5%) | 22 (4.6%) |
| 20 to 24 Years | 11 (2.9%) | 14 (2.9%) |
| 25 to 29 Years | 8 (2.1%) | 2 (0.4%) |
| 30 to 34 Years | 19 (5.0%) | 16 (3.4%) |
| 35 to 39 Years | 16 (4.2%) | 63 (13.2%) |
| 40 to 44 Years | 59 (15.4%) | 29 (6.1%) |
| 45 to 49 Years | 33 (8.6%) | 21 (4.4%) |
| 50 to 54 Years | 21 (5.5%) | 22 (4.6%) |
| 55 to 59 Years | 16 (4.2%) | 24 (5.0%) |
| 60 to 64 Years | 18 (4.7%) | 22 (4.6%) |
| 65 to 69 Years | 20 (5.2%) | 14 (2.9%) |
| 70 to 74 Years | 11 (2.9%) | 12 (2.5%) |
| 75 to 79 Years | 15 (3.9%) | 12 (2.5%) |
| 80 to 84 Years | 1 (0.3%) | 3 (0.6%) |
| 85 Years and over | 14 (3.7%) | 9 (1.9%) |
| Total | 383 (100.0%) | 476 (100.0%) |
Families and Households in Spring Valley
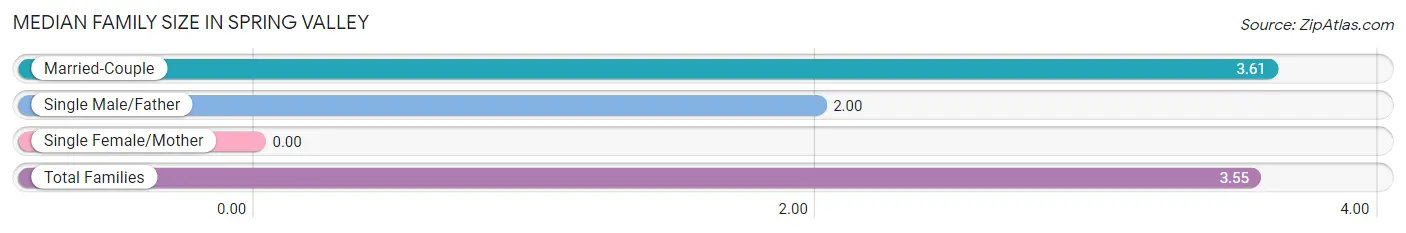
Median Family Size in Spring Valley
| Family Type | # Families | Family Size |
| Married-Couple | 225 (96.6%) | 3.61 |
| Single Male/Father | 8 (3.4%) | 2.00 |
| Single Female/Mother | 0 (0.0%) | - |
| Total Families | 233 (100.0%) | 3.55 |
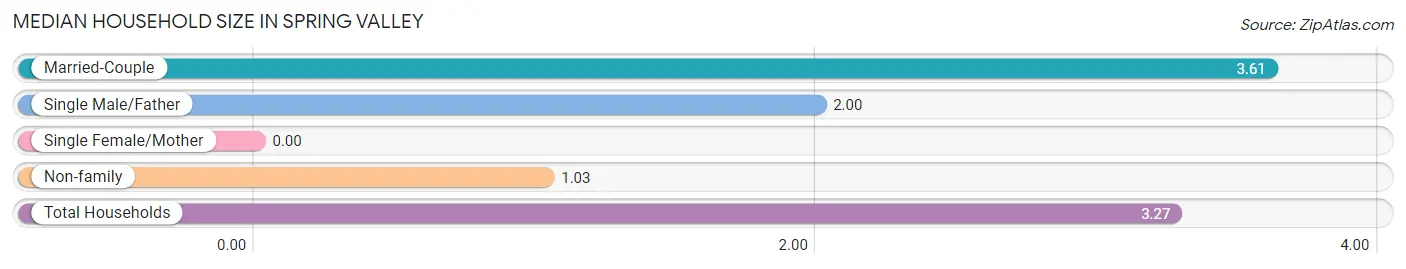
Median Household Size in Spring Valley
| Household Type | # Households | Household Size |
| Married-Couple | 225 (85.6%) | 3.61 |
| Single Male/Father | 8 (3.0%) | 2.00 |
| Single Female/Mother | 0 (0.0%) | - |
| Non-family | 30 (11.4%) | 1.03 |
| Total Households | 263 (100.0%) | 3.27 |
Household Size by Marriage Status in Spring Valley
Out of a total of 263 households in Spring Valley, 233 (88.6%) are family households, while 30 (11.4%) are nonfamily households. The most numerous type of family households are 2-person households, comprising 83, and the most common type of nonfamily households are 1-person households, comprising 29.
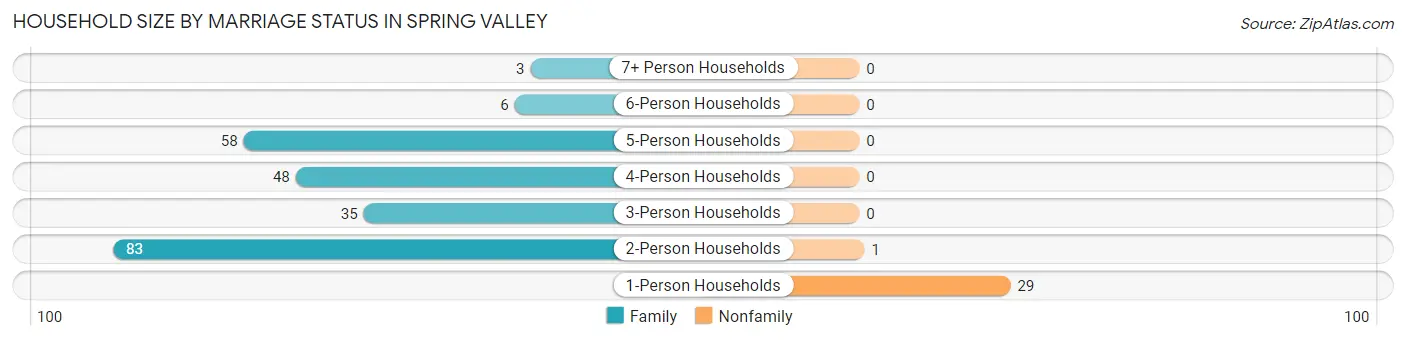
| Household Size | Family Households | Nonfamily Households |
| 1-Person Households | - | 29 (11.0%) |
| 2-Person Households | 83 (31.6%) | 1 (0.4%) |
| 3-Person Households | 35 (13.3%) | 0 (0.0%) |
| 4-Person Households | 48 (18.2%) | 0 (0.0%) |
| 5-Person Households | 58 (22.1%) | 0 (0.0%) |
| 6-Person Households | 6 (2.3%) | 0 (0.0%) |
| 7+ Person Households | 3 (1.1%) | 0 (0.0%) |
| Total | 233 (88.6%) | 30 (11.4%) |
Female Fertility in Spring Valley
Fertility by Age in Spring Valley
Average fertility rate in Spring Valley is 101.0 births per 1,000 women. Women in the age bracket of 20 to 34 years have the highest fertility rate with 250.0 births per 1,000 women. Women in the age bracket of 35 to 50 years acount for 55.6% of all women with births.
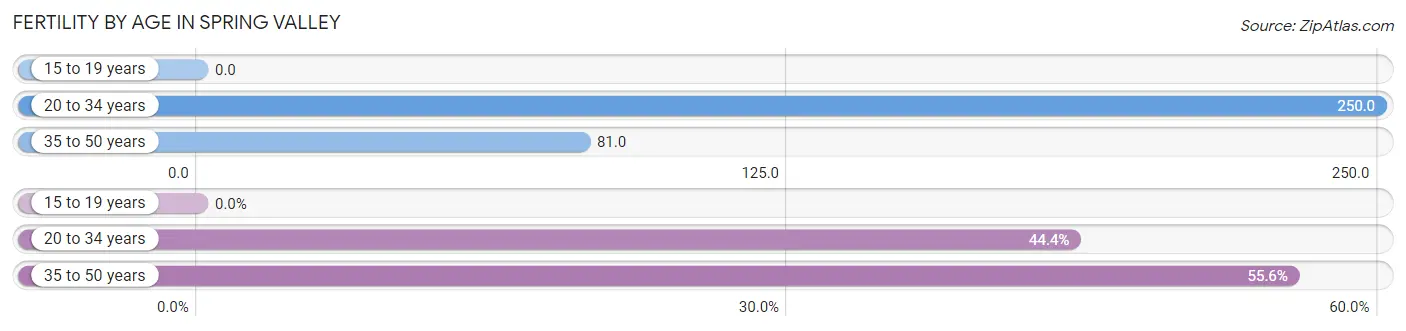
| Age Bracket | Women with Births | Births / 1,000 Women |
| 15 to 19 years | 0 (0.0%) | 0.0 |
| 20 to 34 years | 8 (44.4%) | 250.0 |
| 35 to 50 years | 10 (55.6%) | 81.0 |
| Total | 18 (100.0%) | 101.0 |
Fertility by Age by Marriage Status in Spring Valley
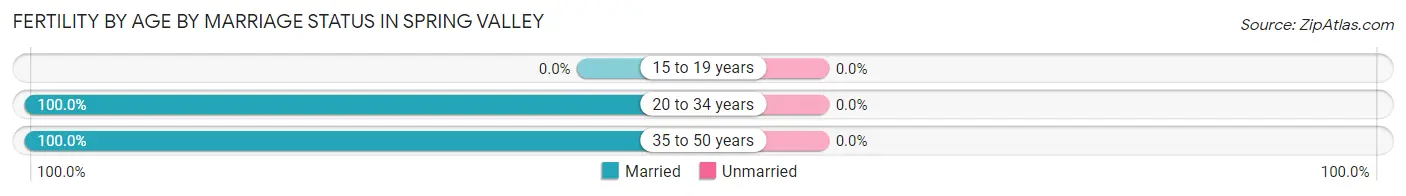
| Age Bracket | Married | Unmarried |
| 15 to 19 years | 0 (0.0%) | 0 (0.0%) |
| 20 to 34 years | 8 (100.0%) | 0 (0.0%) |
| 35 to 50 years | 10 (100.0%) | 0 (0.0%) |
| Total | 18 (100.0%) | 0 (0.0%) |
Fertility by Education in Spring Valley
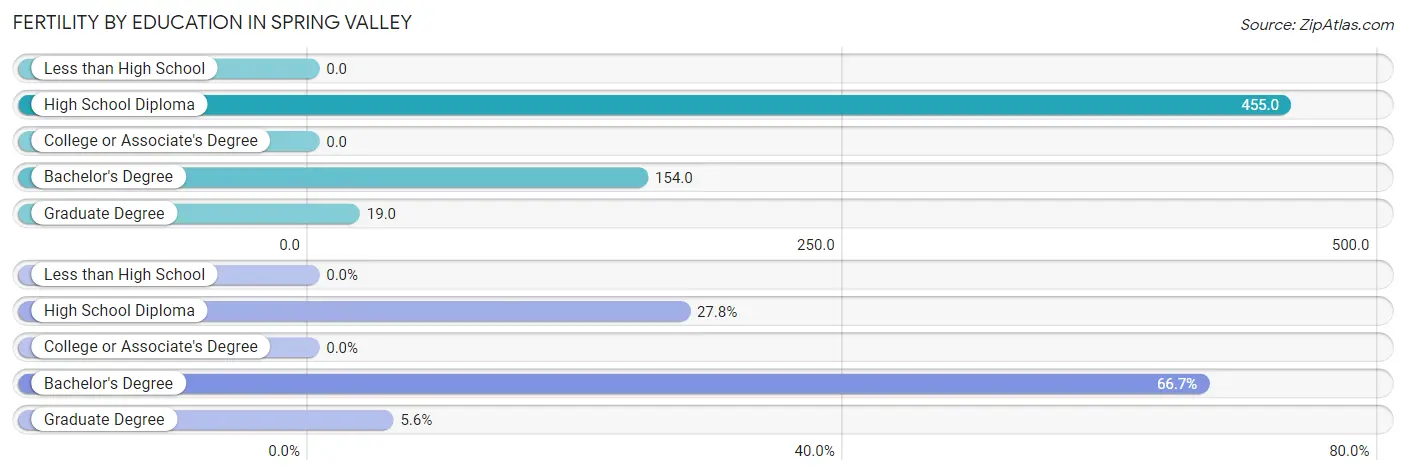
| Educational Attainment | Women with Births | Births / 1,000 Women |
| Less than High School | 0 (0.0%) | 0.0 |
| High School Diploma | 5 (27.8%) | 455.0 |
| College or Associate's Degree | 0 (0.0%) | 0.0 |
| Bachelor's Degree | 12 (66.7%) | 154.0 |
| Graduate Degree | 1 (5.6%) | 19.0 |
| Total | 18 (100.0%) | 101.0 |
Fertility by Education by Marriage Status in Spring Valley
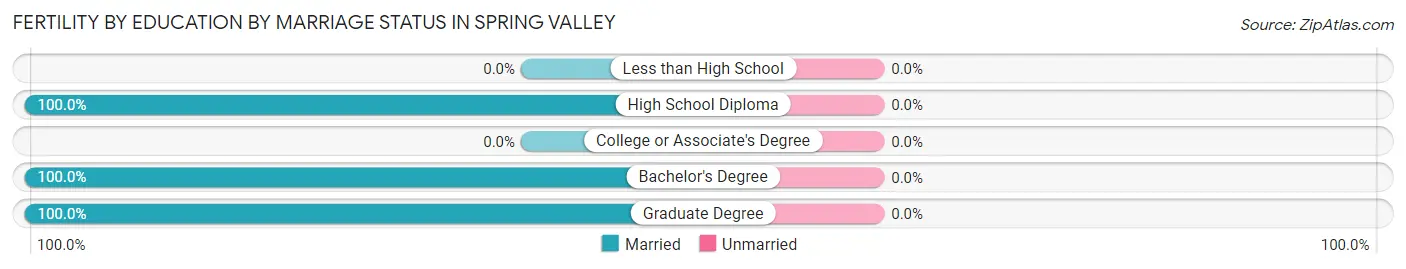
| Educational Attainment | Married | Unmarried |
| Less than High School | 0 (0.0%) | 0 (0.0%) |
| High School Diploma | 5 (100.0%) | 0 (0.0%) |
| College or Associate's Degree | 0 (0.0%) | 0 (0.0%) |
| Bachelor's Degree | 12 (100.0%) | 0 (0.0%) |
| Graduate Degree | 1 (100.0%) | 0 (0.0%) |
| Total | 18 (100.0%) | 0 (0.0%) |
Employment Characteristics in Spring Valley
Employment by Class of Employer in Spring Valley
Among the 379 employed individuals in Spring Valley, private company employees (262 | 69.1%), not-for-profit organizations (31 | 8.2%), and local government employees (30 | 7.9%) make up the most common classes of employment.
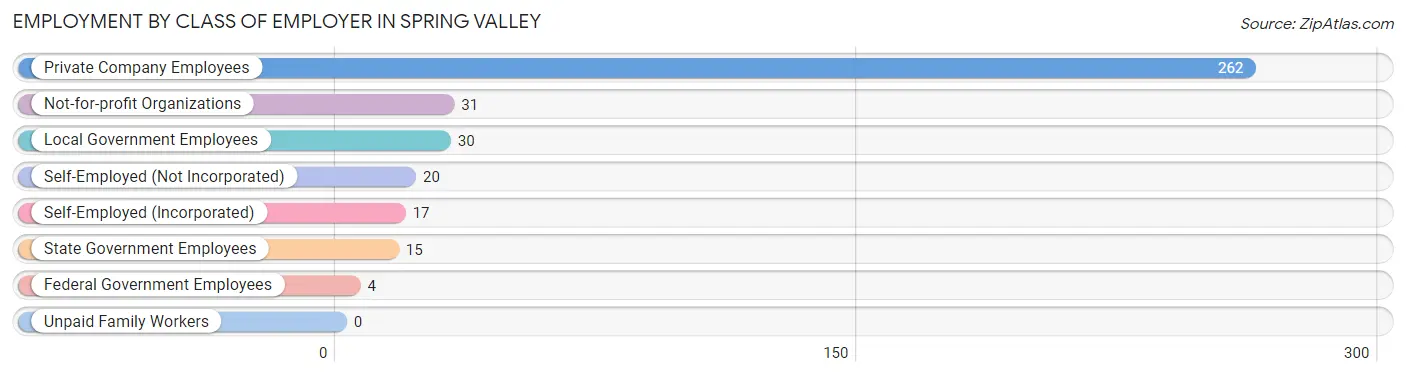
| Employer Class | # Employees | % Employees |
| Private Company Employees | 262 | 69.1% |
| Self-Employed (Incorporated) | 17 | 4.5% |
| Self-Employed (Not Incorporated) | 20 | 5.3% |
| Not-for-profit Organizations | 31 | 8.2% |
| Local Government Employees | 30 | 7.9% |
| State Government Employees | 15 | 4.0% |
| Federal Government Employees | 4 | 1.1% |
| Unpaid Family Workers | 0 | 0.0% |
| Total | 379 | 100.0% |
Employment Status by Age in Spring Valley
According to the labor force statistics for Spring Valley, out of the total population over 16 years of age (566), 71.2% or 403 individuals are in the labor force, with 2.0% or 8 of them unemployed. The age group with the highest labor force participation rate is 25 to 29 years, with 100.0% or 10 individuals in the labor force. Within the labor force, the 45 to 54 years age range has the highest percentage of unemployed individuals, with 8.8% or 8 of them being unemployed.
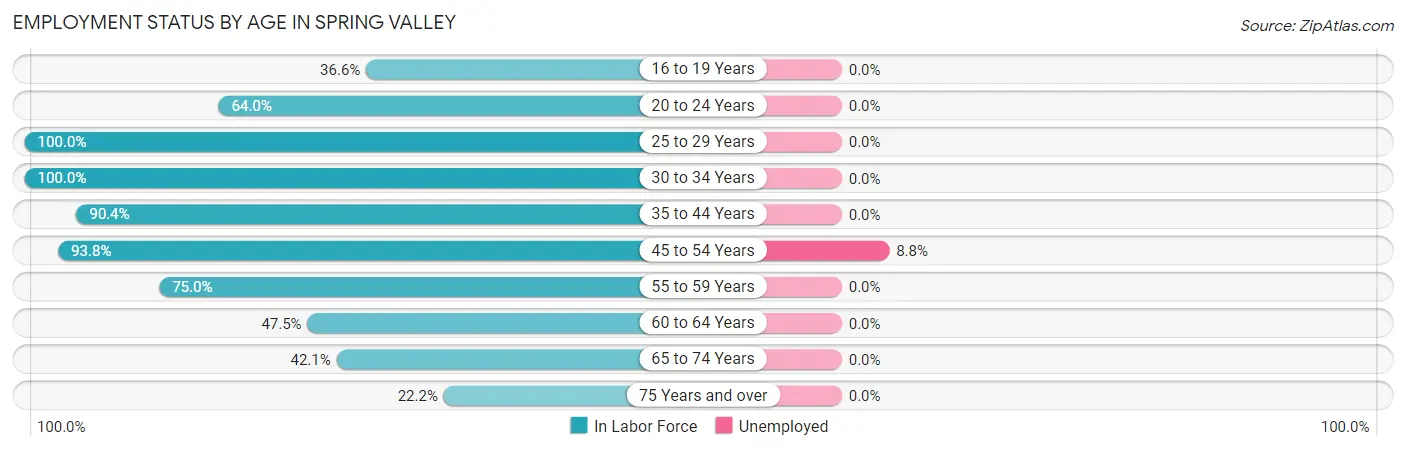
| Age Bracket | In Labor Force | Unemployed |
| 16 to 19 Years | 15 (36.6%) | 0 (0.0%) |
| 20 to 24 Years | 16 (64.0%) | 0 (0.0%) |
| 25 to 29 Years | 10 (100.0%) | 0 (0.0%) |
| 30 to 34 Years | 35 (100.0%) | 0 (0.0%) |
| 35 to 44 Years | 151 (90.4%) | 0 (0.0%) |
| 45 to 54 Years | 91 (93.8%) | 8 (8.8%) |
| 55 to 59 Years | 30 (75.0%) | 0 (0.0%) |
| 60 to 64 Years | 19 (47.5%) | 0 (0.0%) |
| 65 to 74 Years | 24 (42.1%) | 0 (0.0%) |
| 75 Years and over | 12 (22.2%) | 0 (0.0%) |
| Total | 403 (71.2%) | 8 (2.0%) |
Employment Status by Educational Attainment in Spring Valley
According to labor force statistics for Spring Valley, 86.4% of individuals (336) out of the total population between 25 and 64 years of age (389) are in the labor force, with 2.4% or 8 of them being unemployed. The group with the highest labor force participation rate are those with the educational attainment of bachelor's degree or higher, with 91.4% or 276 individuals in the labor force. Within the labor force, individuals with college / associate degree education have the highest percentage of unemployment, with 5.9% or 3 of them being unemployed.
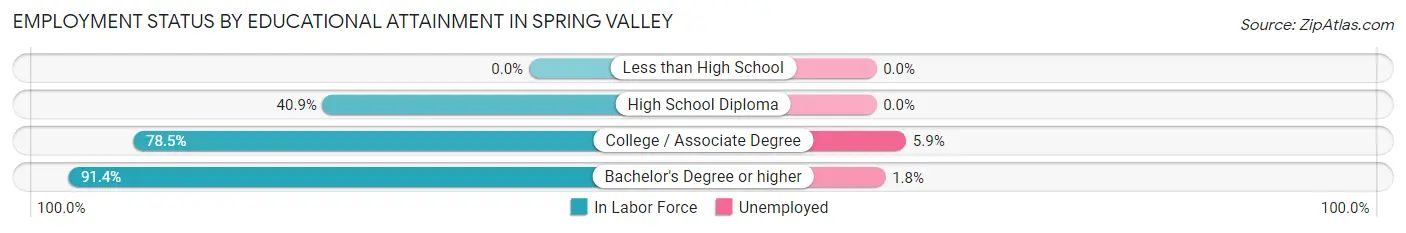
| Educational Attainment | In Labor Force | Unemployed |
| Less than High School | 0 (0.0%) | 0 (0.0%) |
| High School Diploma | 9 (40.9%) | 0 (0.0%) |
| College / Associate Degree | 51 (78.5%) | 4 (5.9%) |
| Bachelor's Degree or higher | 276 (91.4%) | 5 (1.8%) |
| Total | 336 (86.4%) | 9 (2.4%) |
Employment Occupations by Sex in Spring Valley
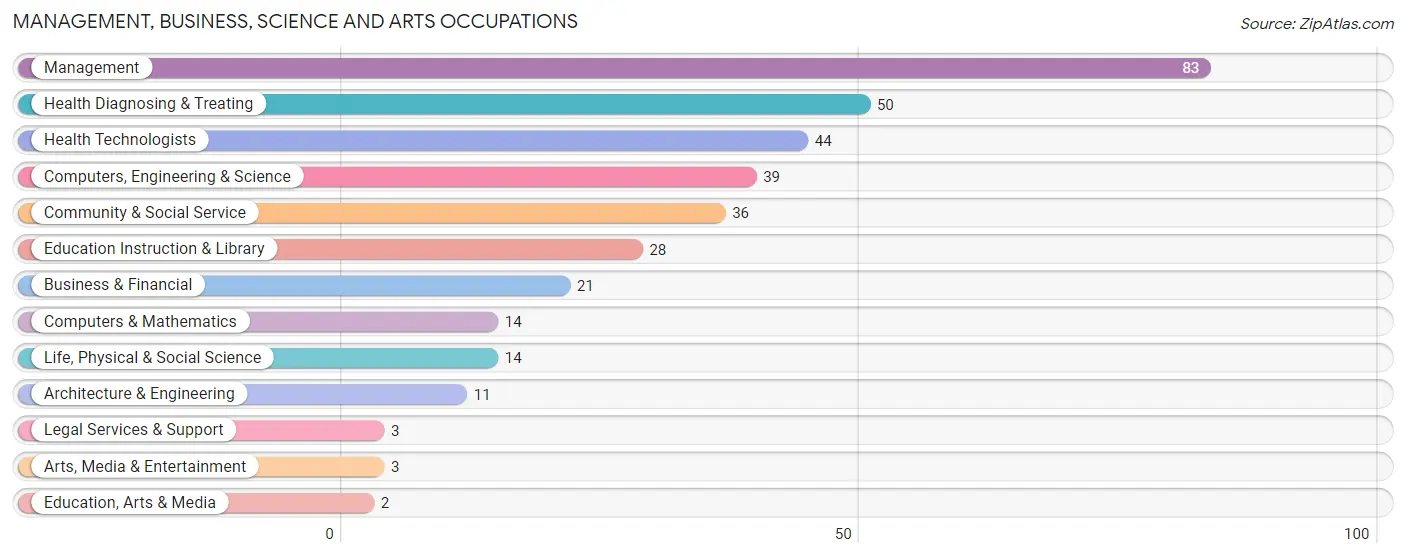
Management, Business, Science and Arts Occupations
The most common Management, Business, Science and Arts occupations in Spring Valley are Management (83 | 21.0%), Health Diagnosing & Treating (50 | 12.7%), Health Technologists (44 | 11.1%), Computers, Engineering & Science (39 | 9.9%), and Community & Social Service (36 | 9.1%).
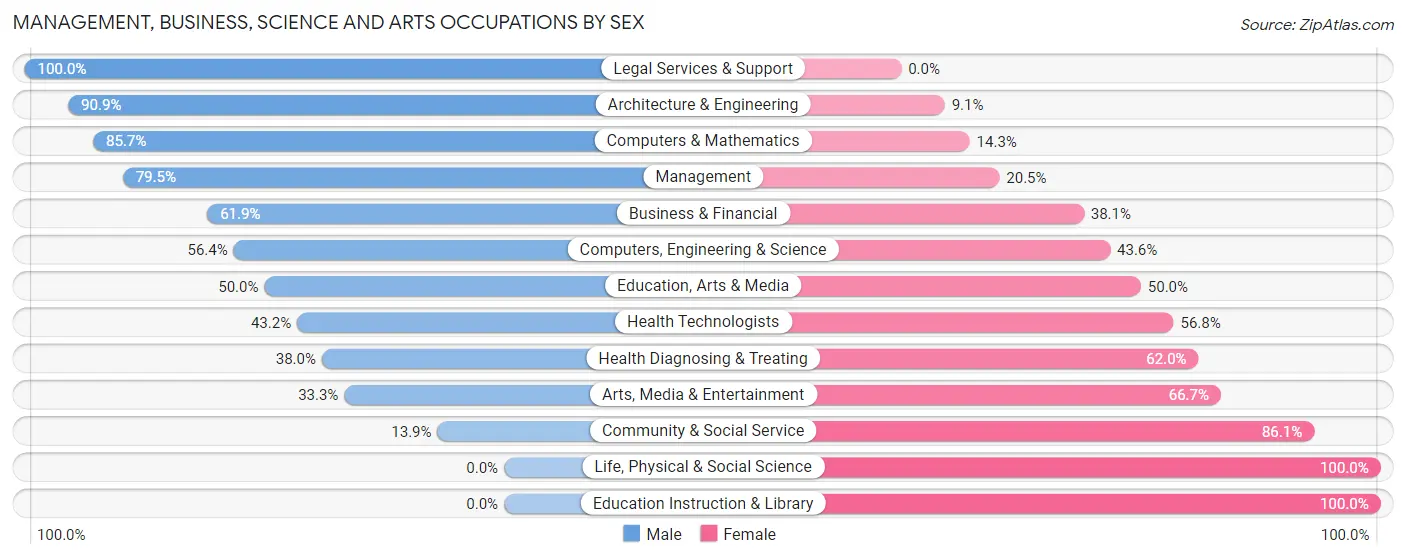
Management, Business, Science and Arts Occupations by Sex
Within the Management, Business, Science and Arts occupations in Spring Valley, the most male-oriented occupations are Legal Services & Support (100.0%), Architecture & Engineering (90.9%), and Computers & Mathematics (85.7%), while the most female-oriented occupations are Life, Physical & Social Science (100.0%), Education Instruction & Library (100.0%), and Community & Social Service (86.1%).
| Occupation | Male | Female |
| Management | 66 (79.5%) | 17 (20.5%) |
| Business & Financial | 13 (61.9%) | 8 (38.1%) |
| Computers, Engineering & Science | 22 (56.4%) | 17 (43.6%) |
| Computers & Mathematics | 12 (85.7%) | 2 (14.3%) |
| Architecture & Engineering | 10 (90.9%) | 1 (9.1%) |
| Life, Physical & Social Science | 0 (0.0%) | 14 (100.0%) |
| Community & Social Service | 5 (13.9%) | 31 (86.1%) |
| Education, Arts & Media | 1 (50.0%) | 1 (50.0%) |
| Legal Services & Support | 3 (100.0%) | 0 (0.0%) |
| Education Instruction & Library | 0 (0.0%) | 28 (100.0%) |
| Arts, Media & Entertainment | 1 (33.3%) | 2 (66.7%) |
| Health Diagnosing & Treating | 19 (38.0%) | 31 (62.0%) |
| Health Technologists | 19 (43.2%) | 25 (56.8%) |
| Total (Category) | 125 (54.6%) | 104 (45.4%) |
| Total (Overall) | 210 (53.2%) | 185 (46.8%) |
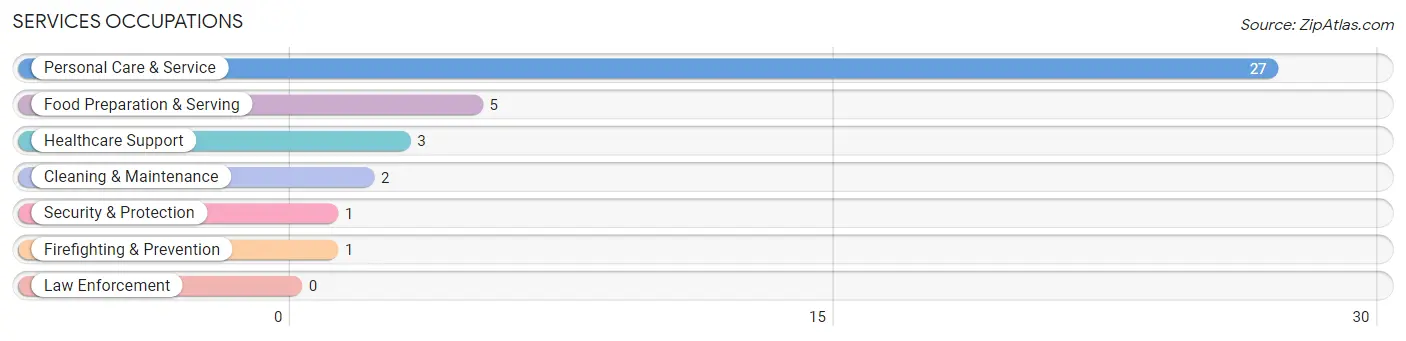
Services Occupations
The most common Services occupations in Spring Valley are Personal Care & Service (27 | 6.8%), Food Preparation & Serving (5 | 1.3%), Healthcare Support (3 | 0.8%), Cleaning & Maintenance (2 | 0.5%), and Security & Protection (1 | 0.3%).
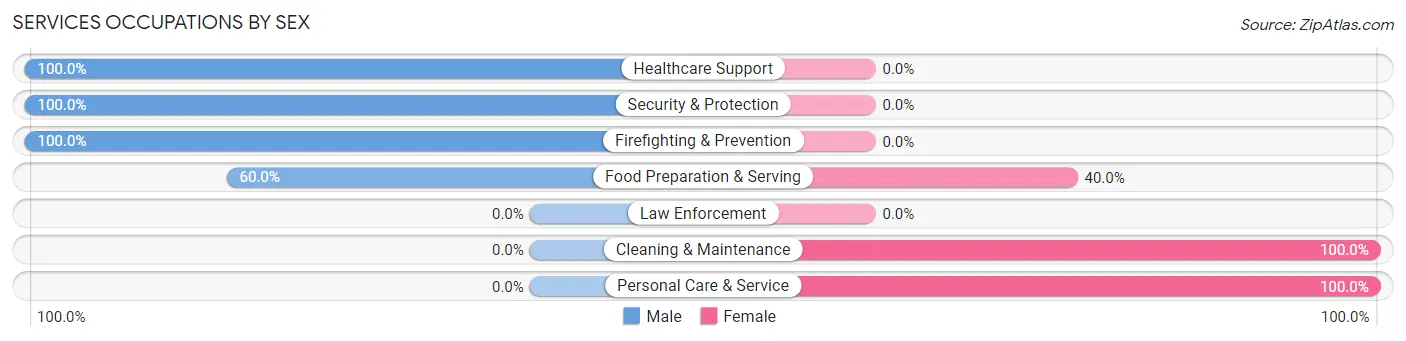
Services Occupations by Sex
Within the Services occupations in Spring Valley, the most male-oriented occupations are Healthcare Support (100.0%), Security & Protection (100.0%), and Firefighting & Prevention (100.0%), while the most female-oriented occupations are Cleaning & Maintenance (100.0%), Personal Care & Service (100.0%), and Food Preparation & Serving (40.0%).
| Occupation | Male | Female |
| Healthcare Support | 3 (100.0%) | 0 (0.0%) |
| Security & Protection | 1 (100.0%) | 0 (0.0%) |
| Firefighting & Prevention | 1 (100.0%) | 0 (0.0%) |
| Law Enforcement | 0 (0.0%) | 0 (0.0%) |
| Food Preparation & Serving | 3 (60.0%) | 2 (40.0%) |
| Cleaning & Maintenance | 0 (0.0%) | 2 (100.0%) |
| Personal Care & Service | 0 (0.0%) | 27 (100.0%) |
| Total (Category) | 7 (18.4%) | 31 (81.6%) |
| Total (Overall) | 210 (53.2%) | 185 (46.8%) |
Sales and Office Occupations
The most common Sales and Office occupations in Spring Valley are Sales & Related (58 | 14.7%), and Office & Administration (31 | 7.9%).
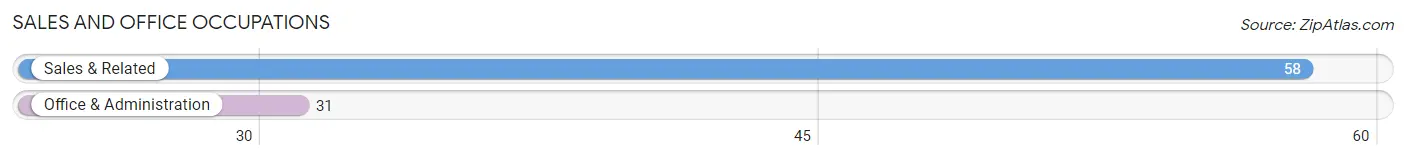
Sales and Office Occupations by Sex
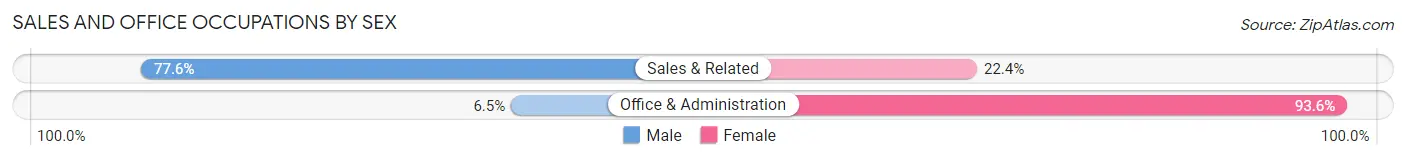
| Occupation | Male | Female |
| Sales & Related | 45 (77.6%) | 13 (22.4%) |
| Office & Administration | 2 (6.5%) | 29 (93.5%) |
| Total (Category) | 47 (52.8%) | 42 (47.2%) |
| Total (Overall) | 210 (53.2%) | 185 (46.8%) |
Natural Resources, Construction and Maintenance Occupations
The most common Natural Resources, Construction and Maintenance occupations in Spring Valley are Construction & Extraction (5 | 1.3%), and Installation, Maintenance & Repair (1 | 0.3%).
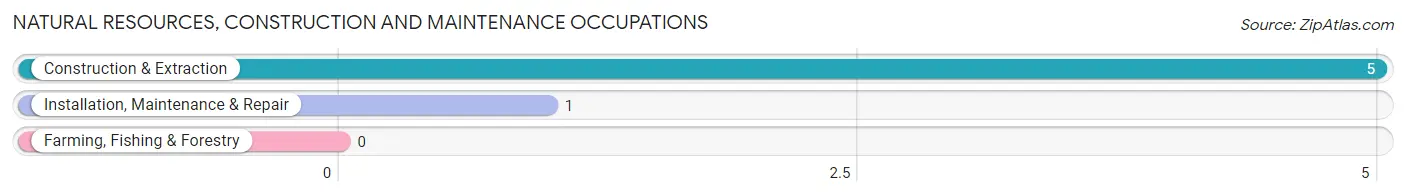
Natural Resources, Construction and Maintenance Occupations by Sex
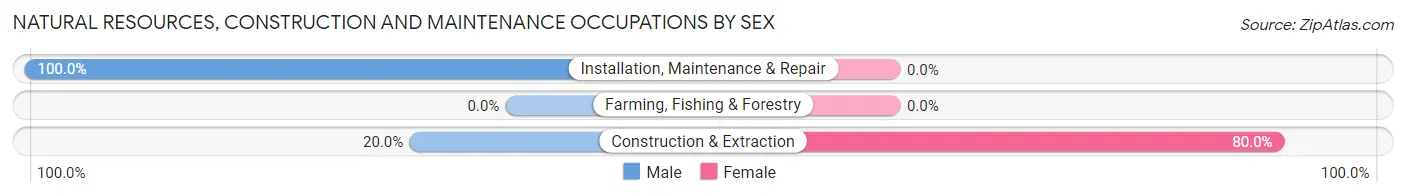
| Occupation | Male | Female |
| Farming, Fishing & Forestry | 0 (0.0%) | 0 (0.0%) |
| Construction & Extraction | 1 (20.0%) | 4 (80.0%) |
| Installation, Maintenance & Repair | 1 (100.0%) | 0 (0.0%) |
| Total (Category) | 2 (33.3%) | 4 (66.7%) |
| Total (Overall) | 210 (53.2%) | 185 (46.8%) |
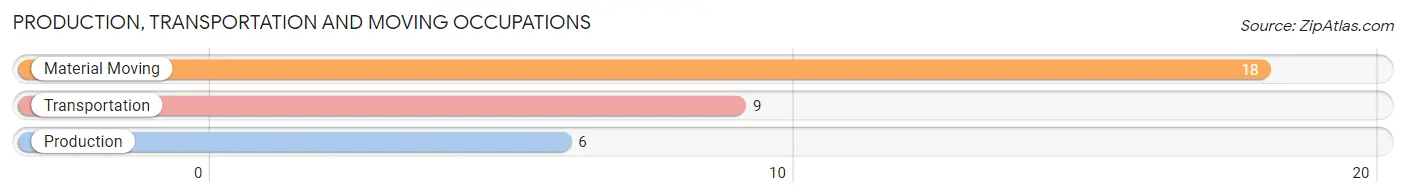
Production, Transportation and Moving Occupations
The most common Production, Transportation and Moving occupations in Spring Valley are Material Moving (18 | 4.6%), Transportation (9 | 2.3%), and Production (6 | 1.5%).
Production, Transportation and Moving Occupations by Sex
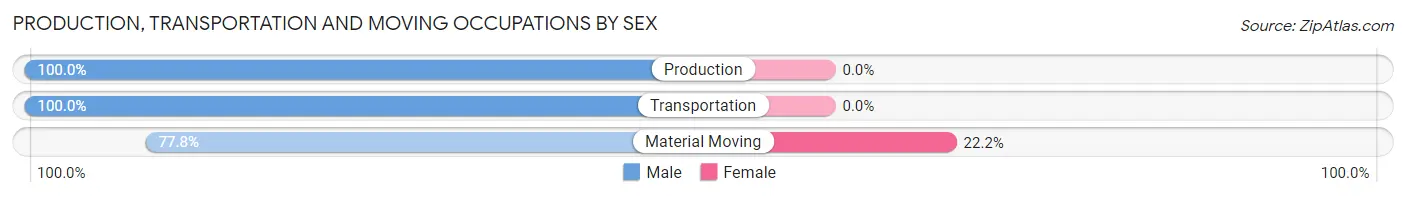
| Occupation | Male | Female |
| Production | 6 (100.0%) | 0 (0.0%) |
| Transportation | 9 (100.0%) | 0 (0.0%) |
| Material Moving | 14 (77.8%) | 4 (22.2%) |
| Total (Category) | 29 (87.9%) | 4 (12.1%) |
| Total (Overall) | 210 (53.2%) | 185 (46.8%) |
Employment Industries by Sex in Spring Valley
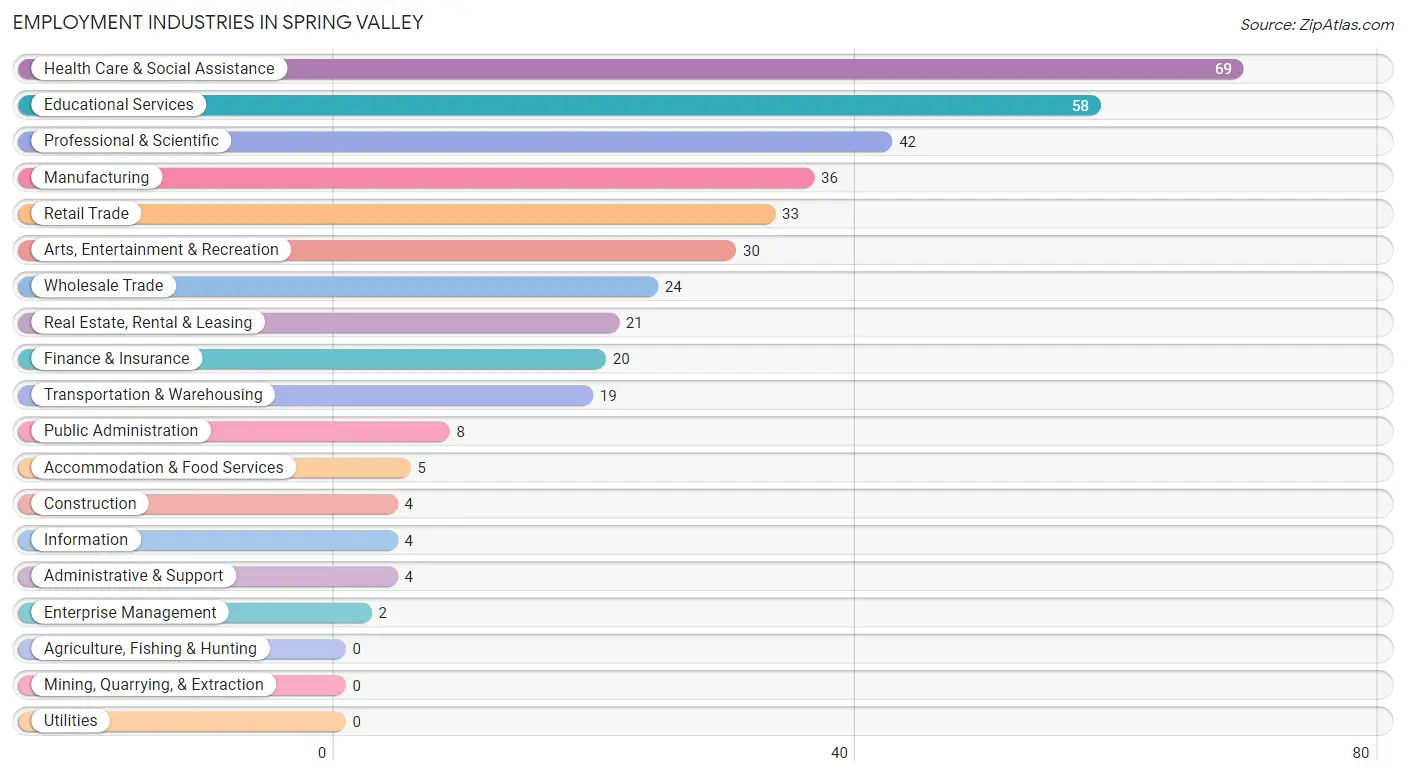
Employment Industries in Spring Valley
The major employment industries in Spring Valley include Health Care & Social Assistance (69 | 17.5%), Educational Services (58 | 14.7%), Professional & Scientific (42 | 10.6%), Manufacturing (36 | 9.1%), and Retail Trade (33 | 8.4%).
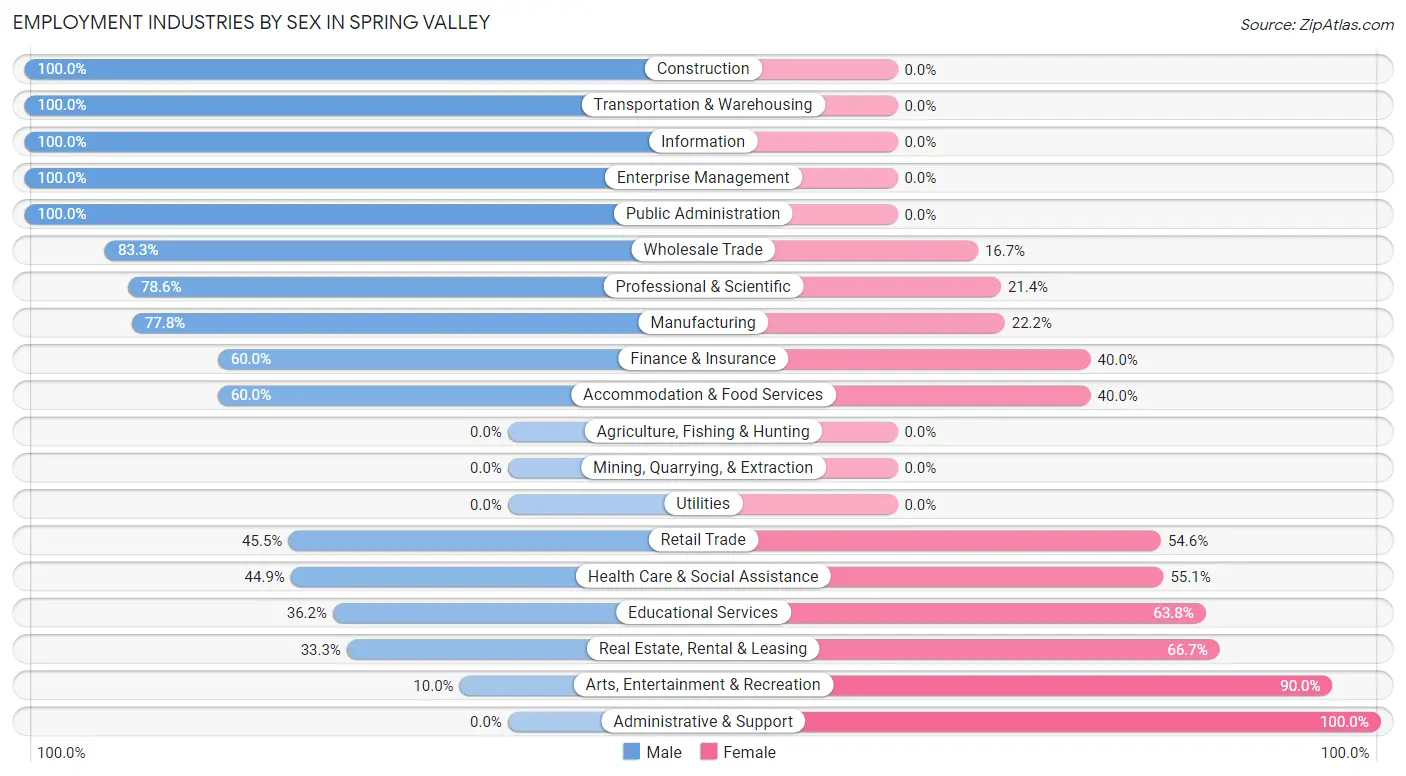
Employment Industries by Sex in Spring Valley
The Spring Valley industries that see more men than women are Construction (100.0%), Transportation & Warehousing (100.0%), and Information (100.0%), whereas the industries that tend to have a higher number of women are Administrative & Support (100.0%), Arts, Entertainment & Recreation (90.0%), and Real Estate, Rental & Leasing (66.7%).
| Industry | Male | Female |
| Agriculture, Fishing & Hunting | 0 (0.0%) | 0 (0.0%) |
| Mining, Quarrying, & Extraction | 0 (0.0%) | 0 (0.0%) |
| Construction | 4 (100.0%) | 0 (0.0%) |
| Manufacturing | 28 (77.8%) | 8 (22.2%) |
| Wholesale Trade | 20 (83.3%) | 4 (16.7%) |
| Retail Trade | 15 (45.5%) | 18 (54.5%) |
| Transportation & Warehousing | 19 (100.0%) | 0 (0.0%) |
| Utilities | 0 (0.0%) | 0 (0.0%) |
| Information | 4 (100.0%) | 0 (0.0%) |
| Finance & Insurance | 12 (60.0%) | 8 (40.0%) |
| Real Estate, Rental & Leasing | 7 (33.3%) | 14 (66.7%) |
| Professional & Scientific | 33 (78.6%) | 9 (21.4%) |
| Enterprise Management | 2 (100.0%) | 0 (0.0%) |
| Administrative & Support | 0 (0.0%) | 4 (100.0%) |
| Educational Services | 21 (36.2%) | 37 (63.8%) |
| Health Care & Social Assistance | 31 (44.9%) | 38 (55.1%) |
| Arts, Entertainment & Recreation | 3 (10.0%) | 27 (90.0%) |
| Accommodation & Food Services | 3 (60.0%) | 2 (40.0%) |
| Public Administration | 8 (100.0%) | 0 (0.0%) |
| Total | 210 (53.2%) | 185 (46.8%) |
Education in Spring Valley
School Enrollment in Spring Valley
The most common levels of schooling among the 310 students in Spring Valley are elementary school (95 | 30.6%), middle school (95 | 30.6%), and high school (42 | 13.6%).
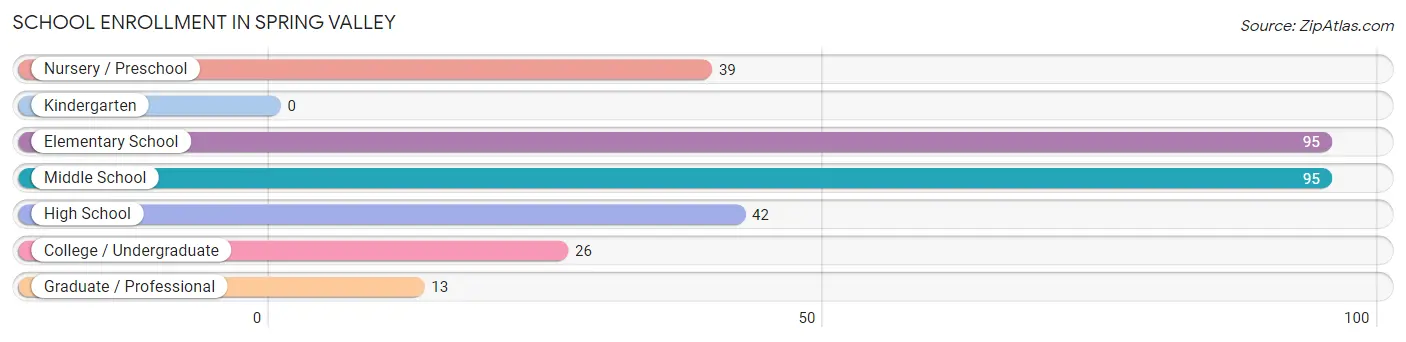
| School Level | # Students | % Students |
| Nursery / Preschool | 39 | 12.6% |
| Kindergarten | 0 | 0.0% |
| Elementary School | 95 | 30.6% |
| Middle School | 95 | 30.6% |
| High School | 42 | 13.6% |
| College / Undergraduate | 26 | 8.4% |
| Graduate / Professional | 13 | 4.2% |
| Total | 310 | 100.0% |
School Enrollment by Age by Funding Source in Spring Valley
Out of a total of 310 students who are enrolled in schools in Spring Valley, 170 (54.8%) attend a private institution, while the remaining 140 (45.2%) are enrolled in public schools. The age group of 3 to 4 year olds has the highest likelihood of being enrolled in private schools, with 16 (66.7% in the age bracket) enrolled. Conversely, the age group of 20 to 24 year olds has the lowest likelihood of being enrolled in a private school, with 13 (59.1% in the age bracket) attending a public institution.
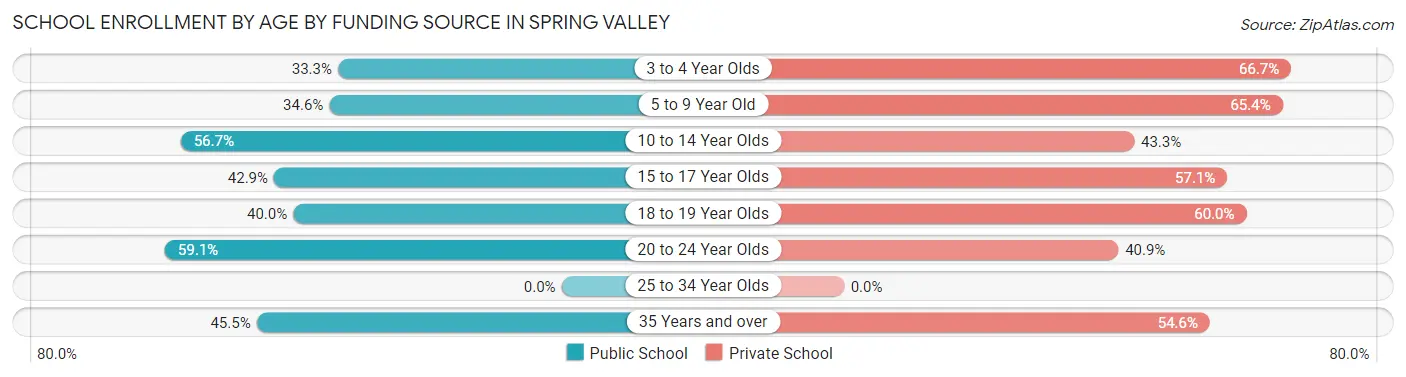
| Age Bracket | Public School | Private School |
| 3 to 4 Year Olds | 8 (33.3%) | 16 (66.7%) |
| 5 to 9 Year Old | 36 (34.6%) | 68 (65.4%) |
| 10 to 14 Year Olds | 59 (56.7%) | 45 (43.3%) |
| 15 to 17 Year Olds | 15 (42.9%) | 20 (57.1%) |
| 18 to 19 Year Olds | 4 (40.0%) | 6 (60.0%) |
| 20 to 24 Year Olds | 13 (59.1%) | 9 (40.9%) |
| 25 to 34 Year Olds | 0 (0.0%) | 0 (0.0%) |
| 35 Years and over | 5 (45.5%) | 6 (54.5%) |
| Total | 140 (45.2%) | 170 (54.8%) |
Educational Attainment by Field of Study in Spring Valley
Business (82 | 20.9%), education (43 | 11.0%), bio, nature & agricultural (36 | 9.2%), social sciences (34 | 8.7%), and visual & performing arts (30 | 7.6%) are the most common fields of study among 392 individuals in Spring Valley who have obtained a bachelor's degree or higher.
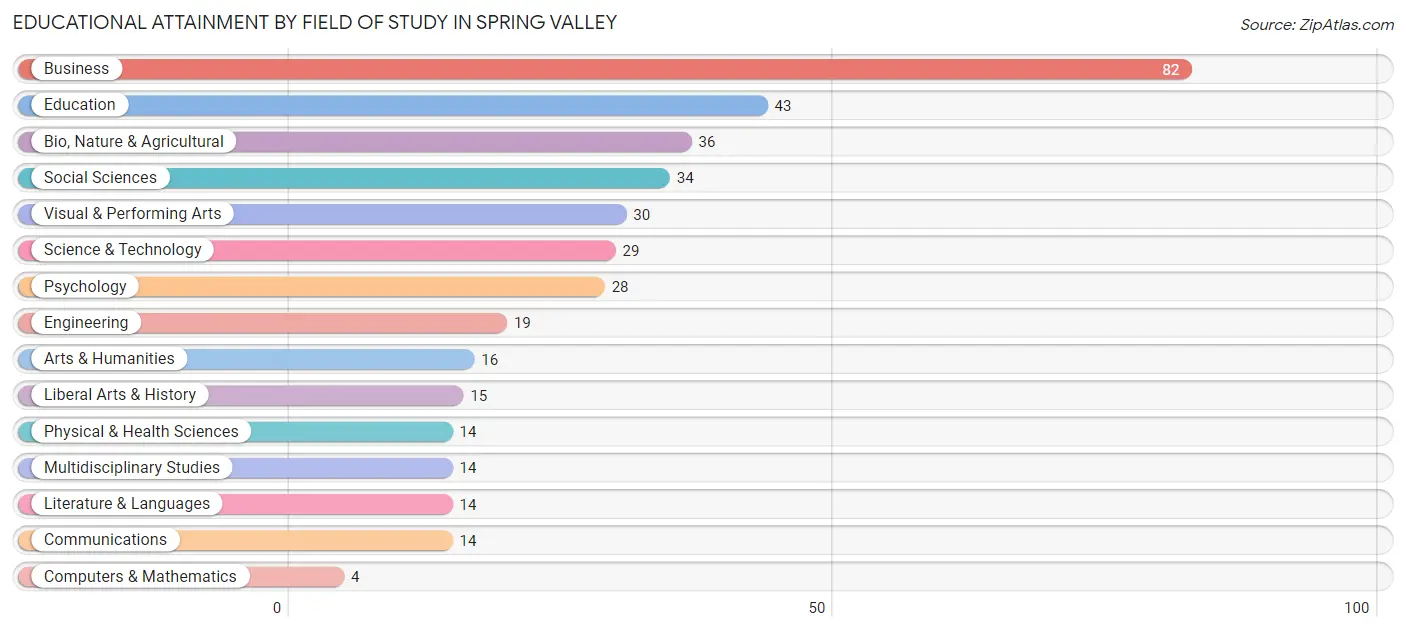
| Field of Study | # Graduates | % Graduates |
| Computers & Mathematics | 4 | 1.0% |
| Bio, Nature & Agricultural | 36 | 9.2% |
| Physical & Health Sciences | 14 | 3.6% |
| Psychology | 28 | 7.1% |
| Social Sciences | 34 | 8.7% |
| Engineering | 19 | 4.9% |
| Multidisciplinary Studies | 14 | 3.6% |
| Science & Technology | 29 | 7.4% |
| Business | 82 | 20.9% |
| Education | 43 | 11.0% |
| Literature & Languages | 14 | 3.6% |
| Liberal Arts & History | 15 | 3.8% |
| Visual & Performing Arts | 30 | 7.6% |
| Communications | 14 | 3.6% |
| Arts & Humanities | 16 | 4.1% |
| Total | 392 | 100.0% |
Transportation & Commute in Spring Valley
Vehicle Availability by Sex in Spring Valley
The most prevalent vehicle ownership categories in Spring Valley are males with 2 vehicles (145, accounting for 69.1%) and females with 2 vehicles (108, making up 85.8%).
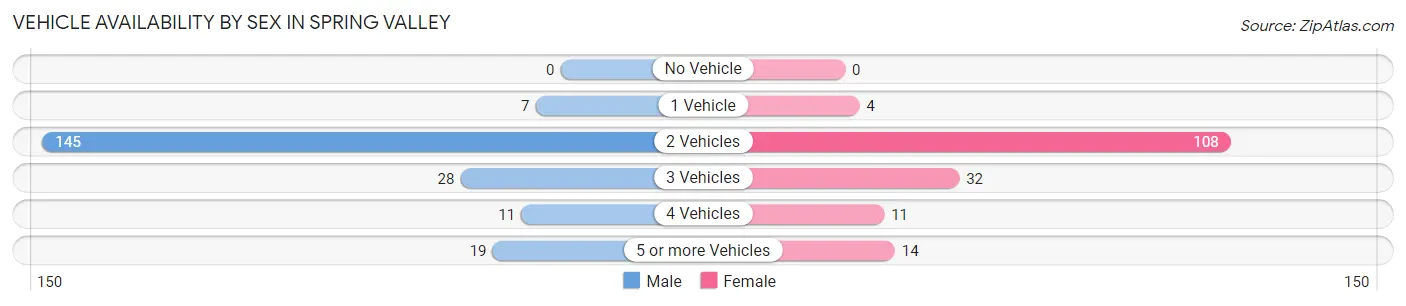
| Vehicles Available | Male | Female |
| No Vehicle | 0 (0.0%) | 0 (0.0%) |
| 1 Vehicle | 7 (3.3%) | 4 (2.4%) |
| 2 Vehicles | 145 (69.1%) | 108 (63.9%) |
| 3 Vehicles | 28 (13.3%) | 32 (18.9%) |
| 4 Vehicles | 11 (5.2%) | 11 (6.5%) |
| 5 or more Vehicles | 19 (9.0%) | 14 (8.3%) |
| Total | 210 (100.0%) | 169 (100.0%) |
Commute Time in Spring Valley
The most frequently occuring commute durations in Spring Valley are 20 to 24 minutes (83 commuters, 27.9%), 15 to 19 minutes (65 commuters, 21.8%), and 30 to 34 minutes (51 commuters, 17.1%).
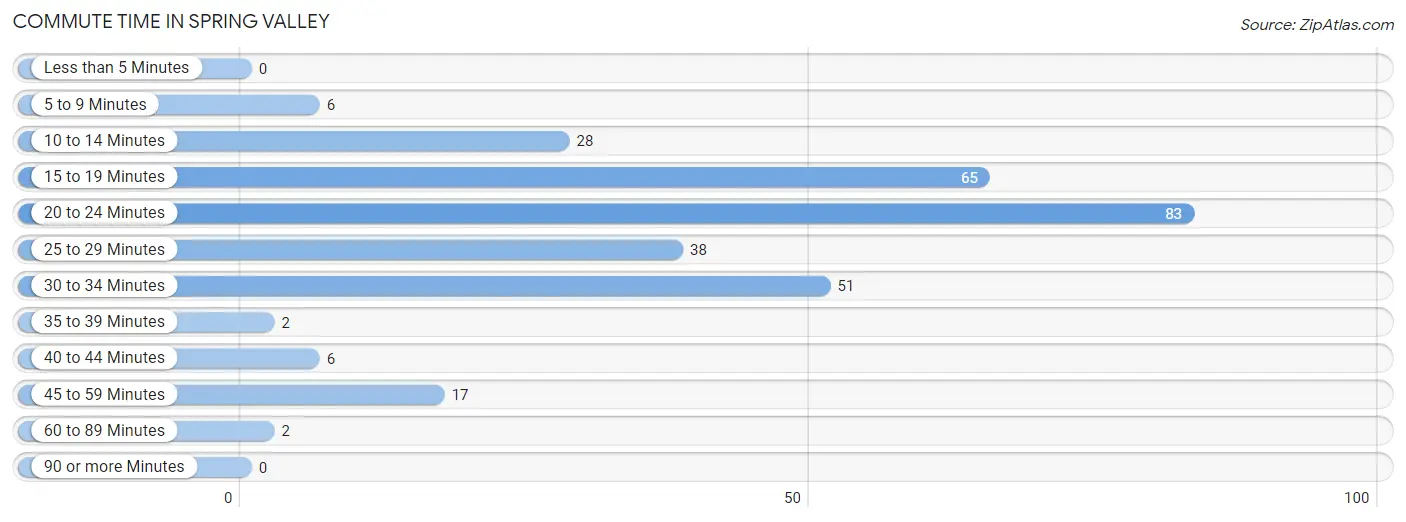
| Commute Time | # Commuters | % Commuters |
| Less than 5 Minutes | 0 | 0.0% |
| 5 to 9 Minutes | 6 | 2.0% |
| 10 to 14 Minutes | 28 | 9.4% |
| 15 to 19 Minutes | 65 | 21.8% |
| 20 to 24 Minutes | 83 | 27.9% |
| 25 to 29 Minutes | 38 | 12.8% |
| 30 to 34 Minutes | 51 | 17.1% |
| 35 to 39 Minutes | 2 | 0.7% |
| 40 to 44 Minutes | 6 | 2.0% |
| 45 to 59 Minutes | 17 | 5.7% |
| 60 to 89 Minutes | 2 | 0.7% |
| 90 or more Minutes | 0 | 0.0% |
Commute Time by Sex in Spring Valley
The most common commute times in Spring Valley are 20 to 24 minutes (47 commuters, 29.9%) for males and 15 to 19 minutes (36 commuters, 25.5%) for females.
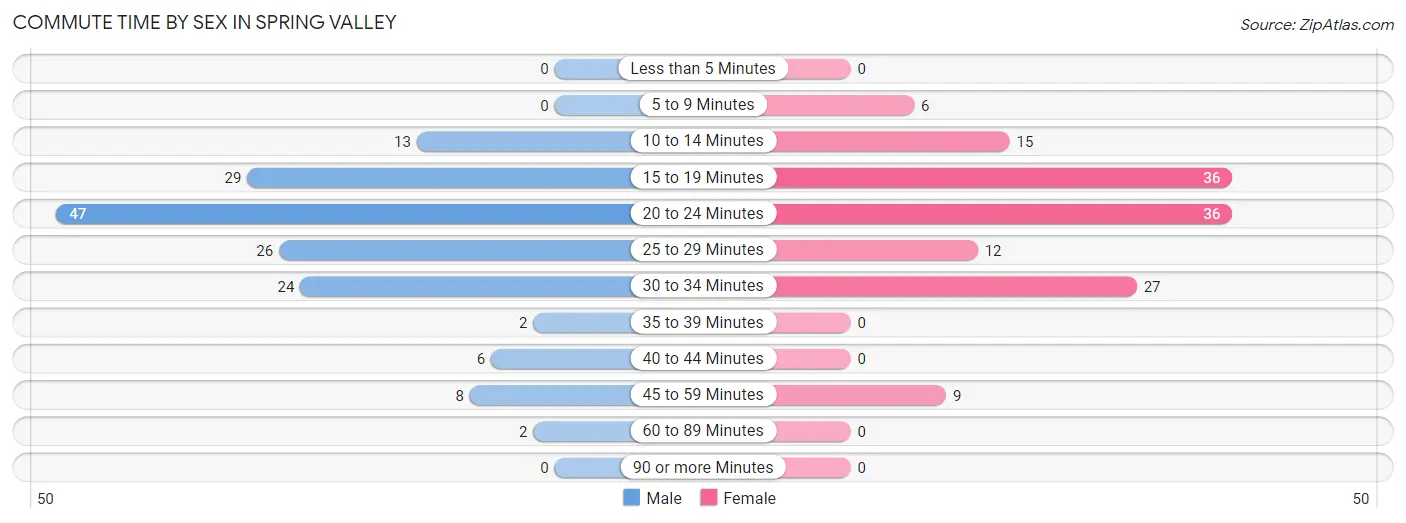
| Commute Time | Male | Female |
| Less than 5 Minutes | 0 (0.0%) | 0 (0.0%) |
| 5 to 9 Minutes | 0 (0.0%) | 6 (4.3%) |
| 10 to 14 Minutes | 13 (8.3%) | 15 (10.6%) |
| 15 to 19 Minutes | 29 (18.5%) | 36 (25.5%) |
| 20 to 24 Minutes | 47 (29.9%) | 36 (25.5%) |
| 25 to 29 Minutes | 26 (16.6%) | 12 (8.5%) |
| 30 to 34 Minutes | 24 (15.3%) | 27 (19.2%) |
| 35 to 39 Minutes | 2 (1.3%) | 0 (0.0%) |
| 40 to 44 Minutes | 6 (3.8%) | 0 (0.0%) |
| 45 to 59 Minutes | 8 (5.1%) | 9 (6.4%) |
| 60 to 89 Minutes | 2 (1.3%) | 0 (0.0%) |
| 90 or more Minutes | 0 (0.0%) | 0 (0.0%) |
Time of Departure to Work by Sex in Spring Valley
The most frequent times of departure to work in Spring Valley are 7:00 AM to 7:29 AM (39, 24.8%) for males and 7:00 AM to 7:29 AM (33, 23.4%) for females.
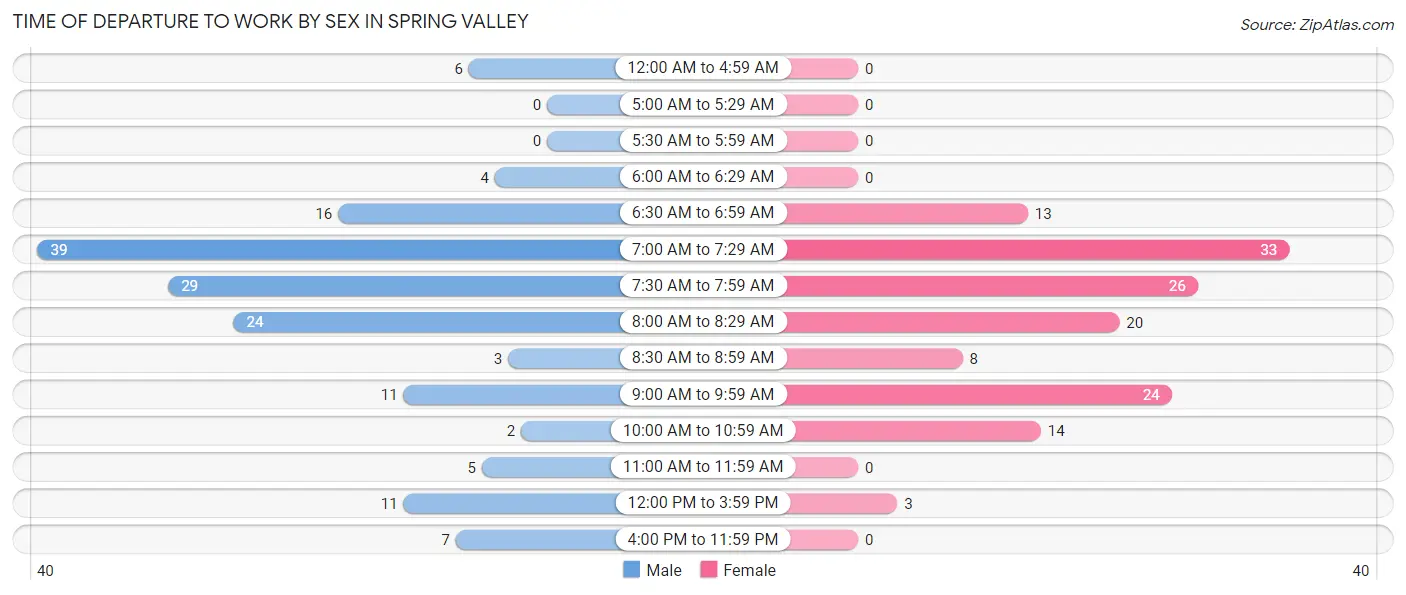
| Time of Departure | Male | Female |
| 12:00 AM to 4:59 AM | 6 (3.8%) | 0 (0.0%) |
| 5:00 AM to 5:29 AM | 0 (0.0%) | 0 (0.0%) |
| 5:30 AM to 5:59 AM | 0 (0.0%) | 0 (0.0%) |
| 6:00 AM to 6:29 AM | 4 (2.5%) | 0 (0.0%) |
| 6:30 AM to 6:59 AM | 16 (10.2%) | 13 (9.2%) |
| 7:00 AM to 7:29 AM | 39 (24.8%) | 33 (23.4%) |
| 7:30 AM to 7:59 AM | 29 (18.5%) | 26 (18.4%) |
| 8:00 AM to 8:29 AM | 24 (15.3%) | 20 (14.2%) |
| 8:30 AM to 8:59 AM | 3 (1.9%) | 8 (5.7%) |
| 9:00 AM to 9:59 AM | 11 (7.0%) | 24 (17.0%) |
| 10:00 AM to 10:59 AM | 2 (1.3%) | 14 (9.9%) |
| 11:00 AM to 11:59 AM | 5 (3.2%) | 0 (0.0%) |
| 12:00 PM to 3:59 PM | 11 (7.0%) | 3 (2.1%) |
| 4:00 PM to 11:59 PM | 7 (4.5%) | 0 (0.0%) |
| Total | 157 (100.0%) | 141 (100.0%) |
Housing Occupancy in Spring Valley
Occupancy by Ownership in Spring Valley
Of the total 263 dwellings in Spring Valley, owner-occupied units account for 263 (100.0%), while renter-occupied units make up 0 (0.0%).
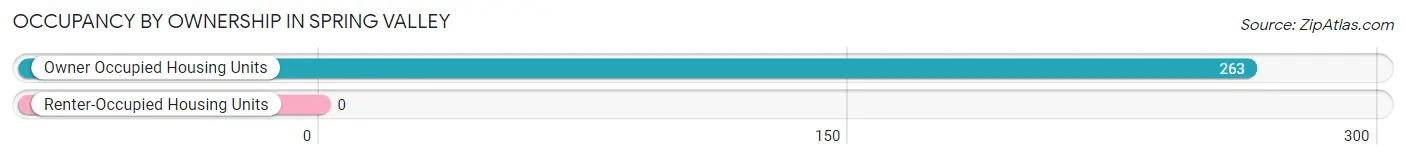
| Occupancy | # Housing Units | % Housing Units |
| Owner Occupied Housing Units | 263 | 100.0% |
| Renter-Occupied Housing Units | 0 | 0.0% |
| Total Occupied Housing Units | 263 | 100.0% |
Occupancy by Household Size in Spring Valley
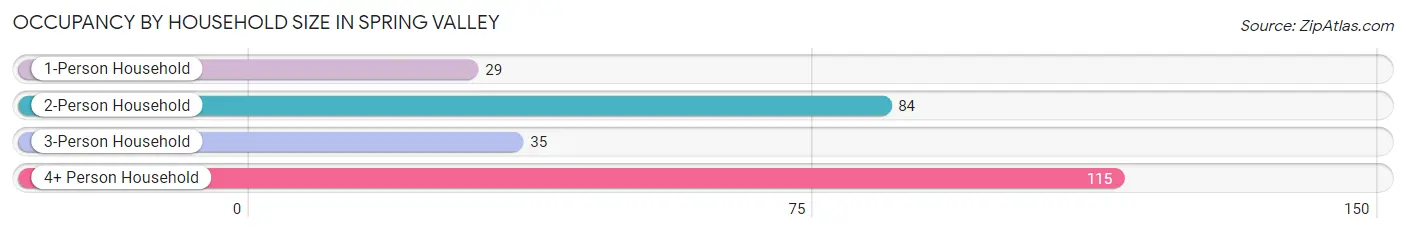
| Household Size | # Housing Units | % Housing Units |
| 1-Person Household | 29 | 11.0% |
| 2-Person Household | 84 | 31.9% |
| 3-Person Household | 35 | 13.3% |
| 4+ Person Household | 115 | 43.7% |
| Total Housing Units | 263 | 100.0% |
Occupancy by Ownership by Household Size in Spring Valley
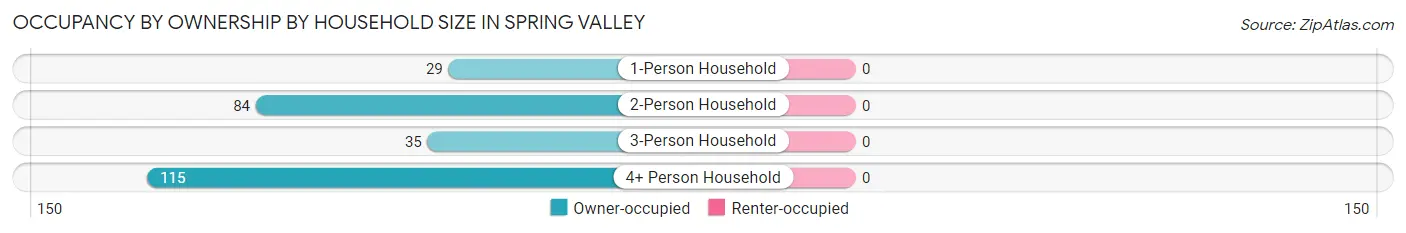
| Household Size | Owner-occupied | Renter-occupied |
| 1-Person Household | 29 (100.0%) | 0 (0.0%) |
| 2-Person Household | 84 (100.0%) | 0 (0.0%) |
| 3-Person Household | 35 (100.0%) | 0 (0.0%) |
| 4+ Person Household | 115 (100.0%) | 0 (0.0%) |
| Total Housing Units | 263 (100.0%) | 0 (0.0%) |
Occupancy by Educational Attainment in Spring Valley
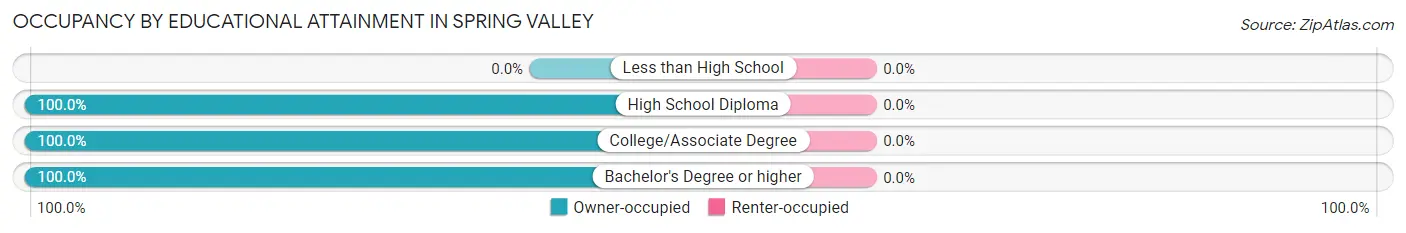
| Household Size | Owner-occupied | Renter-occupied |
| Less than High School | 0 (0.0%) | 0 (0.0%) |
| High School Diploma | 8 (100.0%) | 0 (0.0%) |
| College/Associate Degree | 54 (100.0%) | 0 (0.0%) |
| Bachelor's Degree or higher | 201 (100.0%) | 0 (0.0%) |
Occupancy by Age of Householder in Spring Valley
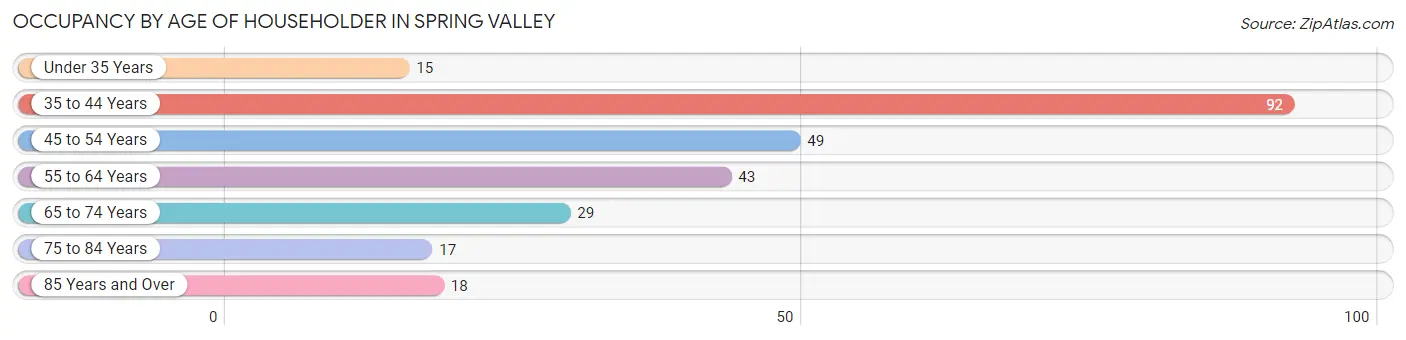
| Age Bracket | # Households | % Households |
| Under 35 Years | 15 | 5.7% |
| 35 to 44 Years | 92 | 35.0% |
| 45 to 54 Years | 49 | 18.6% |
| 55 to 64 Years | 43 | 16.4% |
| 65 to 74 Years | 29 | 11.0% |
| 75 to 84 Years | 17 | 6.5% |
| 85 Years and Over | 18 | 6.8% |
| Total | 263 | 100.0% |
Housing Finances in Spring Valley
Median Income by Occupancy in Spring Valley
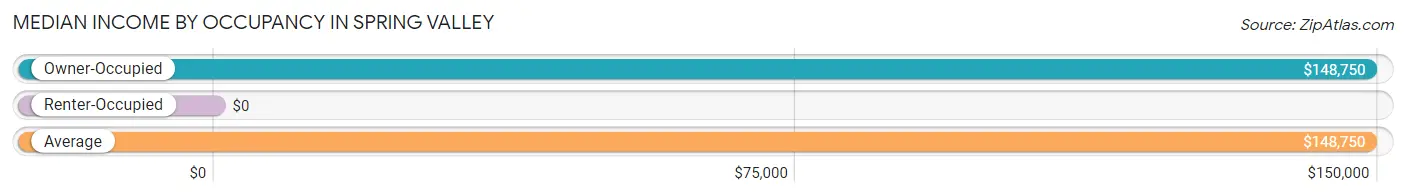
| Occupancy Type | # Households | Median Income |
| Owner-Occupied | 263 (100.0%) | $148,750 |
| Renter-Occupied | 0 (0.0%) | $0 |
| Average | 263 (100.0%) | $148,750 |
Occupancy by Householder Income Bracket in Spring Valley
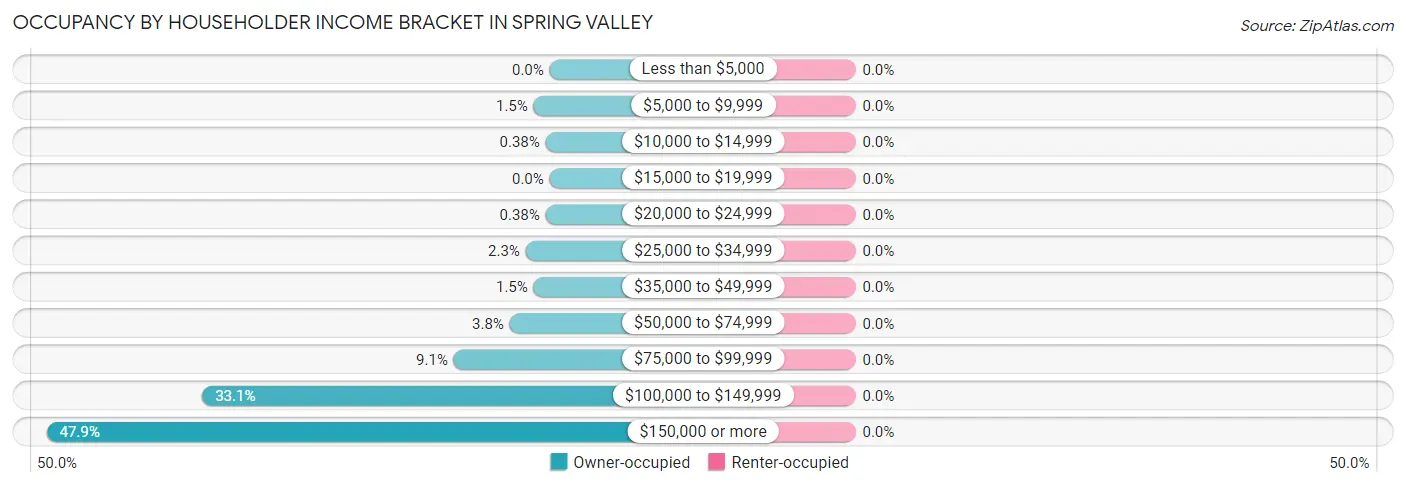
| Income Bracket | Owner-occupied | Renter-occupied |
| Less than $5,000 | 0 (0.0%) | 0 (0.0%) |
| $5,000 to $9,999 | 4 (1.5%) | 0 (0.0%) |
| $10,000 to $14,999 | 1 (0.4%) | 0 (0.0%) |
| $15,000 to $19,999 | 0 (0.0%) | 0 (0.0%) |
| $20,000 to $24,999 | 1 (0.4%) | 0 (0.0%) |
| $25,000 to $34,999 | 6 (2.3%) | 0 (0.0%) |
| $35,000 to $49,999 | 4 (1.5%) | 0 (0.0%) |
| $50,000 to $74,999 | 10 (3.8%) | 0 (0.0%) |
| $75,000 to $99,999 | 24 (9.1%) | 0 (0.0%) |
| $100,000 to $149,999 | 87 (33.1%) | 0 (0.0%) |
| $150,000 or more | 126 (47.9%) | 0 (0.0%) |
| Total | 263 (100.0%) | 0 (0.0%) |
Monthly Housing Cost Tiers in Spring Valley
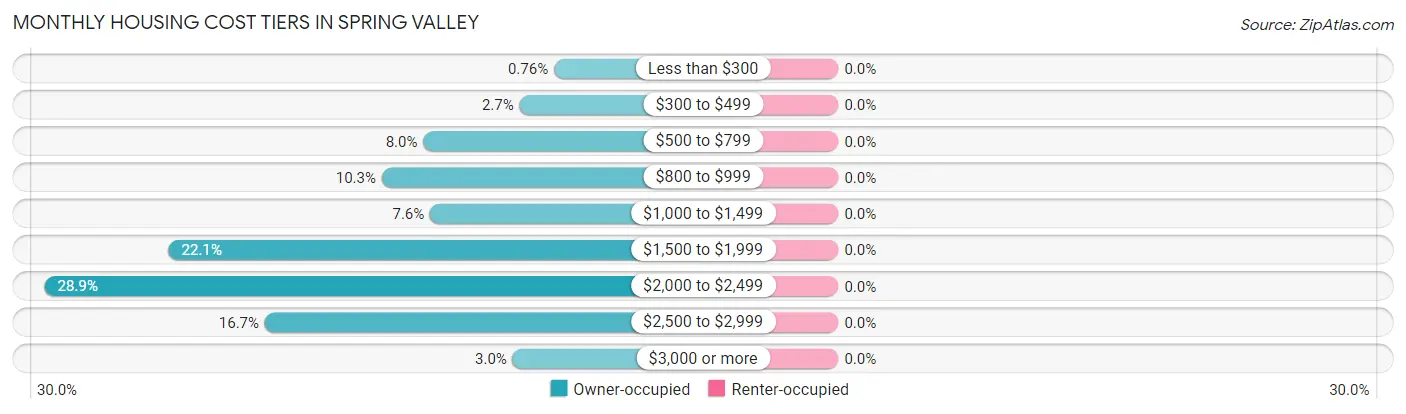
| Monthly Cost | Owner-occupied | Renter-occupied |
| Less than $300 | 2 (0.8%) | 0 (0.0%) |
| $300 to $499 | 7 (2.7%) | 0 (0.0%) |
| $500 to $799 | 21 (8.0%) | 0 (0.0%) |
| $800 to $999 | 27 (10.3%) | 0 (0.0%) |
| $1,000 to $1,499 | 20 (7.6%) | 0 (0.0%) |
| $1,500 to $1,999 | 58 (22.1%) | 0 (0.0%) |
| $2,000 to $2,499 | 76 (28.9%) | 0 (0.0%) |
| $2,500 to $2,999 | 44 (16.7%) | 0 (0.0%) |
| $3,000 or more | 8 (3.0%) | 0 (0.0%) |
| Total | 263 (100.0%) | 0 (0.0%) |
Physical Housing Characteristics in Spring Valley
Housing Structures in Spring Valley
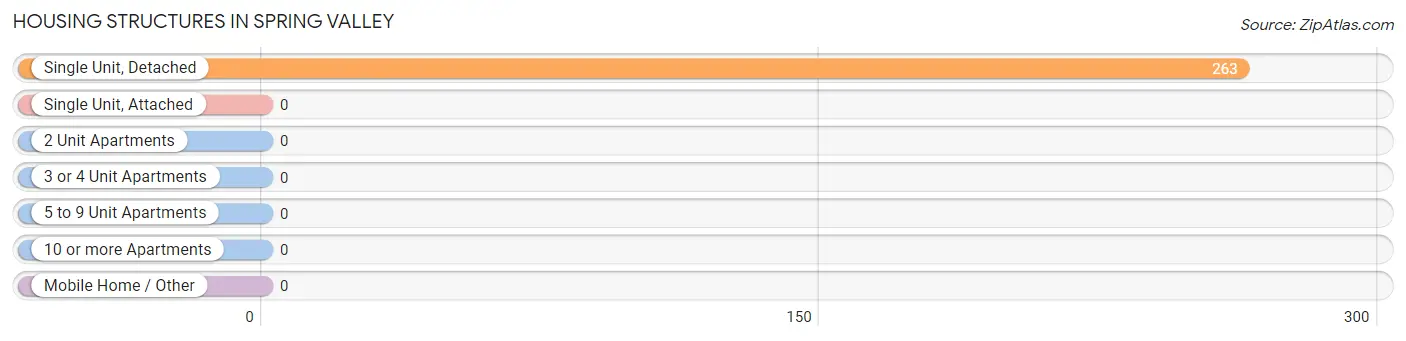
| Structure Type | # Housing Units | % Housing Units |
| Single Unit, Detached | 263 | 100.0% |
| Single Unit, Attached | 0 | 0.0% |
| 2 Unit Apartments | 0 | 0.0% |
| 3 or 4 Unit Apartments | 0 | 0.0% |
| 5 to 9 Unit Apartments | 0 | 0.0% |
| 10 or more Apartments | 0 | 0.0% |
| Mobile Home / Other | 0 | 0.0% |
| Total | 263 | 100.0% |
Housing Structures by Occupancy in Spring Valley
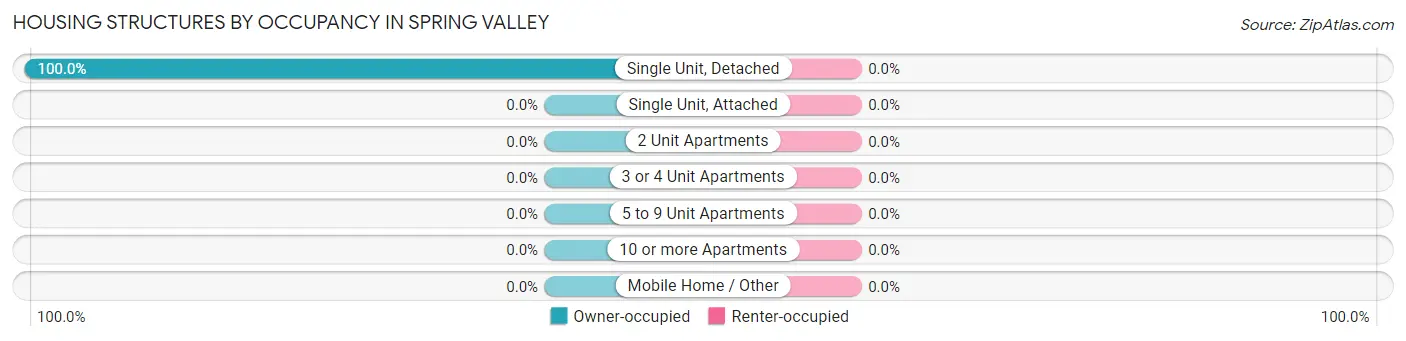
| Structure Type | Owner-occupied | Renter-occupied |
| Single Unit, Detached | 263 (100.0%) | 0 (0.0%) |
| Single Unit, Attached | 0 (0.0%) | 0 (0.0%) |
| 2 Unit Apartments | 0 (0.0%) | 0 (0.0%) |
| 3 or 4 Unit Apartments | 0 (0.0%) | 0 (0.0%) |
| 5 to 9 Unit Apartments | 0 (0.0%) | 0 (0.0%) |
| 10 or more Apartments | 0 (0.0%) | 0 (0.0%) |
| Mobile Home / Other | 0 (0.0%) | 0 (0.0%) |
| Total | 263 (100.0%) | 0 (0.0%) |
Housing Structures by Number of Rooms in Spring Valley
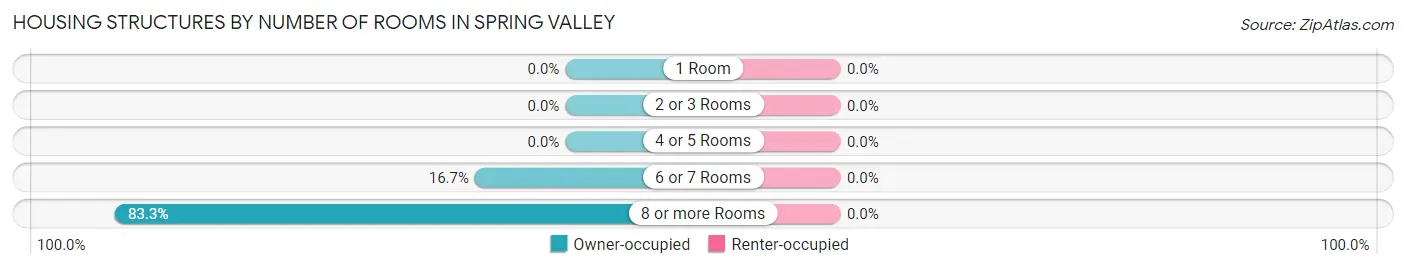
| Number of Rooms | Owner-occupied | Renter-occupied |
| 1 Room | 0 (0.0%) | 0 (0.0%) |
| 2 or 3 Rooms | 0 (0.0%) | 0 (0.0%) |
| 4 or 5 Rooms | 0 (0.0%) | 0 (0.0%) |
| 6 or 7 Rooms | 44 (16.7%) | 0 (0.0%) |
| 8 or more Rooms | 219 (83.3%) | 0 (0.0%) |
| Total | 263 (100.0%) | 0 (0.0%) |
Housing Structure by Heating Type in Spring Valley
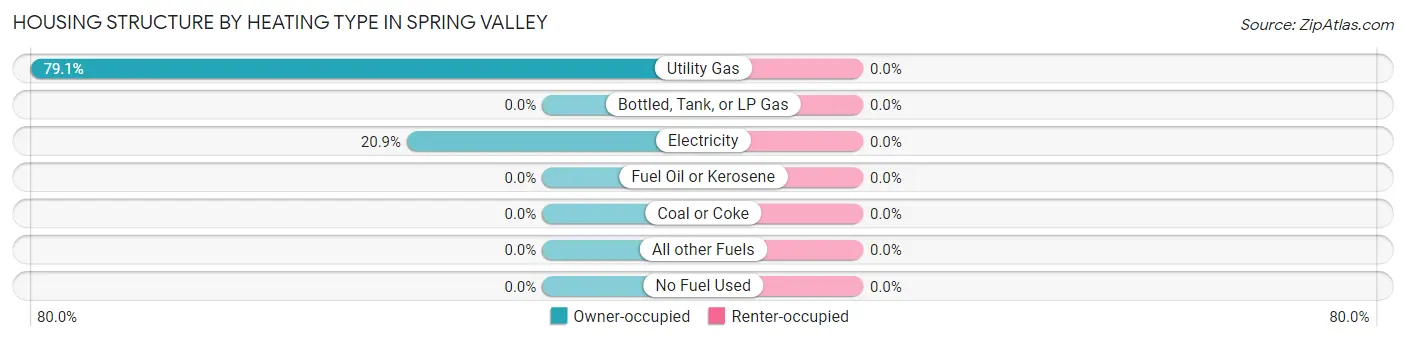
| Heating Type | Owner-occupied | Renter-occupied |
| Utility Gas | 208 (79.1%) | 0 (0.0%) |
| Bottled, Tank, or LP Gas | 0 (0.0%) | 0 (0.0%) |
| Electricity | 55 (20.9%) | 0 (0.0%) |
| Fuel Oil or Kerosene | 0 (0.0%) | 0 (0.0%) |
| Coal or Coke | 0 (0.0%) | 0 (0.0%) |
| All other Fuels | 0 (0.0%) | 0 (0.0%) |
| No Fuel Used | 0 (0.0%) | 0 (0.0%) |
| Total | 263 (100.0%) | 0 (0.0%) |
Household Vehicle Usage in Spring Valley
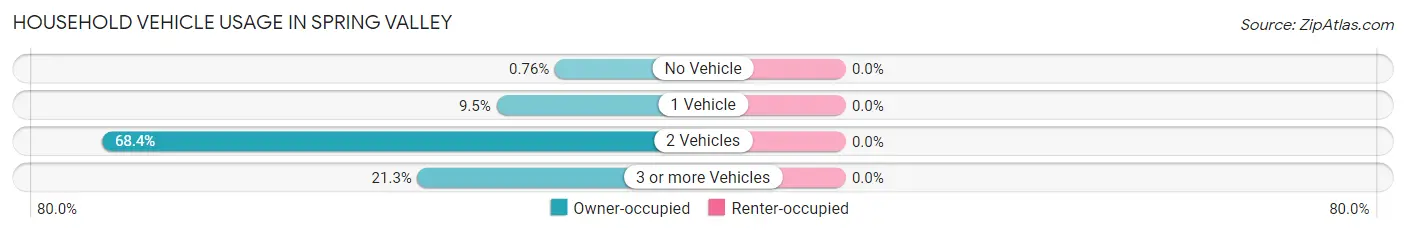
| Vehicles per Household | Owner-occupied | Renter-occupied |
| No Vehicle | 2 (0.8%) | 0 (0.0%) |
| 1 Vehicle | 25 (9.5%) | 0 (0.0%) |
| 2 Vehicles | 180 (68.4%) | 0 (0.0%) |
| 3 or more Vehicles | 56 (21.3%) | 0 (0.0%) |
| Total | 263 (100.0%) | 0 (0.0%) |
Real Estate & Mortgages in Spring Valley
Real Estate and Mortgage Overview in Spring Valley
| Characteristic | Without Mortgage | With Mortgage |
| Housing Units | 62 | 201 |
| Median Property Value | $416,700 | $382,600 |
| Median Household Income | $110,000 | $101 |
| Monthly Housing Costs | $806 | $8 |
| Real Estate Taxes | $3,591 | $0 |
Property Value by Mortgage Status in Spring Valley
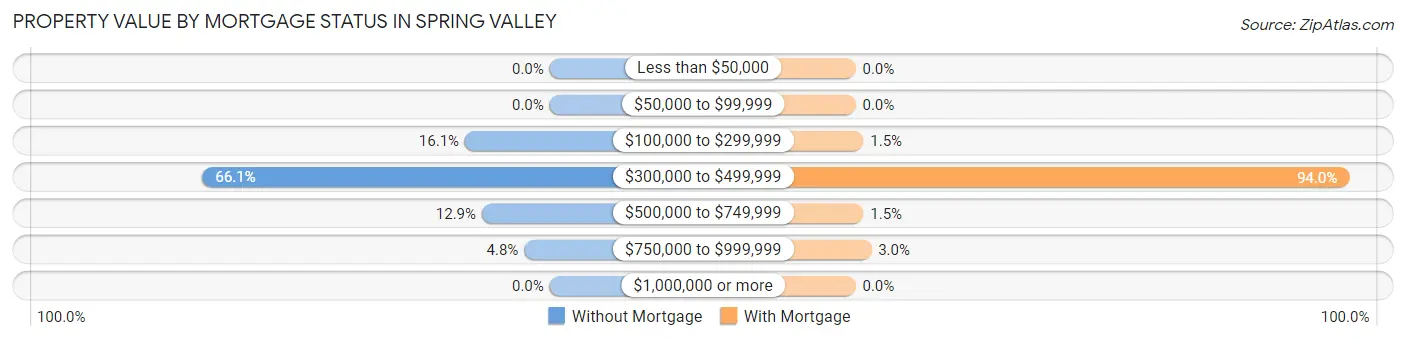
| Property Value | Without Mortgage | With Mortgage |
| Less than $50,000 | 0 (0.0%) | 0 (0.0%) |
| $50,000 to $99,999 | 0 (0.0%) | 0 (0.0%) |
| $100,000 to $299,999 | 10 (16.1%) | 3 (1.5%) |
| $300,000 to $499,999 | 41 (66.1%) | 189 (94.0%) |
| $500,000 to $749,999 | 8 (12.9%) | 3 (1.5%) |
| $750,000 to $999,999 | 3 (4.8%) | 6 (3.0%) |
| $1,000,000 or more | 0 (0.0%) | 0 (0.0%) |
| Total | 62 (100.0%) | 201 (100.0%) |
Household Income by Mortgage Status in Spring Valley
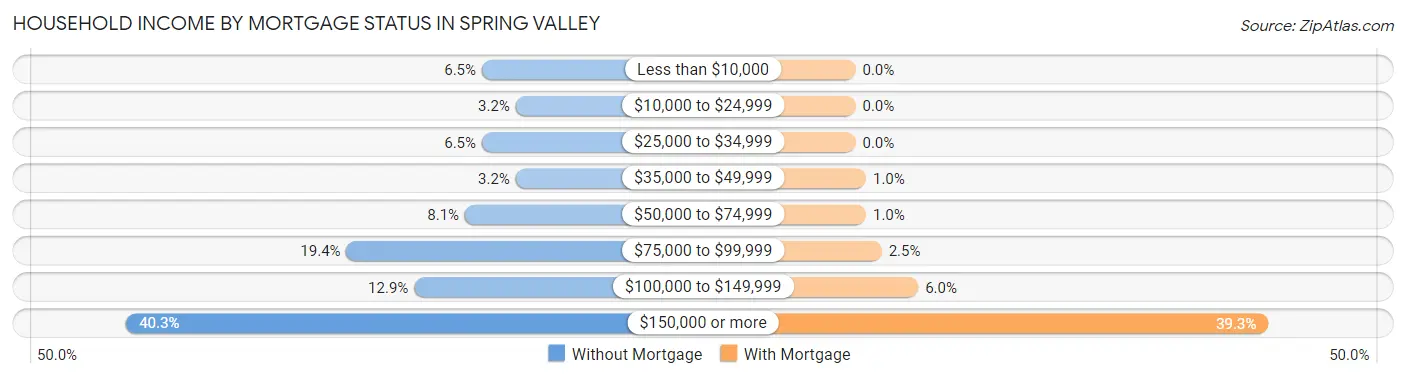
| Household Income | Without Mortgage | With Mortgage |
| Less than $10,000 | 4 (6.5%) | 0 (0.0%) |
| $10,000 to $24,999 | 2 (3.2%) | 0 (0.0%) |
| $25,000 to $34,999 | 4 (6.5%) | 0 (0.0%) |
| $35,000 to $49,999 | 2 (3.2%) | 2 (1.0%) |
| $50,000 to $74,999 | 5 (8.1%) | 2 (1.0%) |
| $75,000 to $99,999 | 12 (19.4%) | 5 (2.5%) |
| $100,000 to $149,999 | 8 (12.9%) | 12 (6.0%) |
| $150,000 or more | 25 (40.3%) | 79 (39.3%) |
| Total | 62 (100.0%) | 201 (100.0%) |
Property Value to Household Income Ratio in Spring Valley
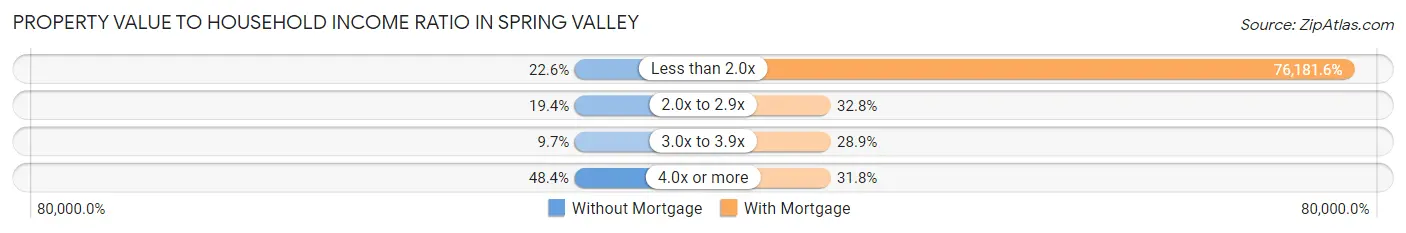
| Value-to-Income Ratio | Without Mortgage | With Mortgage |
| Less than 2.0x | 14 (22.6%) | 153,125 (76,181.6%) |
| 2.0x to 2.9x | 12 (19.4%) | 66 (32.8%) |
| 3.0x to 3.9x | 6 (9.7%) | 58 (28.9%) |
| 4.0x or more | 30 (48.4%) | 64 (31.8%) |
| Total | 62 (100.0%) | 201 (100.0%) |
Real Estate Taxes by Mortgage Status in Spring Valley
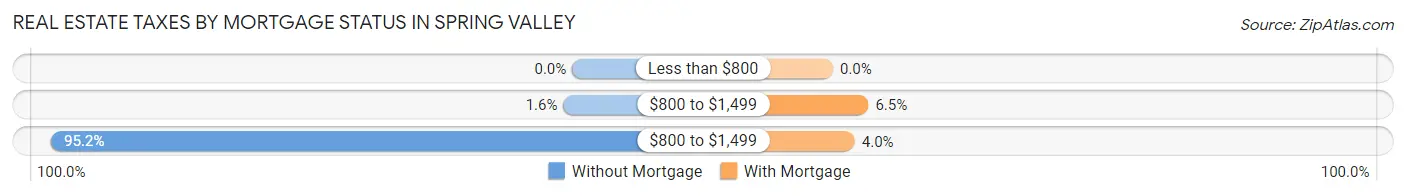
| Property Taxes | Without Mortgage | With Mortgage |
| Less than $800 | 0 (0.0%) | 0 (0.0%) |
| $800 to $1,499 | 1 (1.6%) | 13 (6.5%) |
| $800 to $1,499 | 59 (95.2%) | 8 (4.0%) |
| Total | 62 (100.0%) | 201 (100.0%) |
Health & Disability in Spring Valley
Health Insurance Coverage by Age in Spring Valley
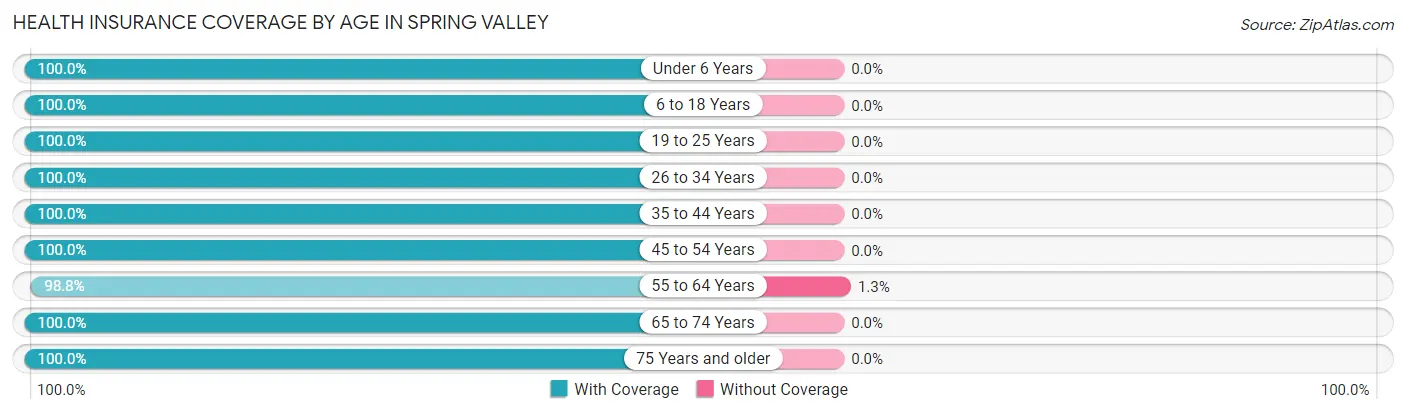
| Age Bracket | With Coverage | Without Coverage |
| Under 6 Years | 91 (100.0%) | 0 (0.0%) |
| 6 to 18 Years | 237 (100.0%) | 0 (0.0%) |
| 19 to 25 Years | 35 (100.0%) | 0 (0.0%) |
| 26 to 34 Years | 41 (100.0%) | 0 (0.0%) |
| 35 to 44 Years | 167 (100.0%) | 0 (0.0%) |
| 45 to 54 Years | 97 (100.0%) | 0 (0.0%) |
| 55 to 64 Years | 79 (98.8%) | 1 (1.3%) |
| 65 to 74 Years | 57 (100.0%) | 0 (0.0%) |
| 75 Years and older | 54 (100.0%) | 0 (0.0%) |
| Total | 858 (99.9%) | 1 (0.1%) |
Health Insurance Coverage by Citizenship Status in Spring Valley
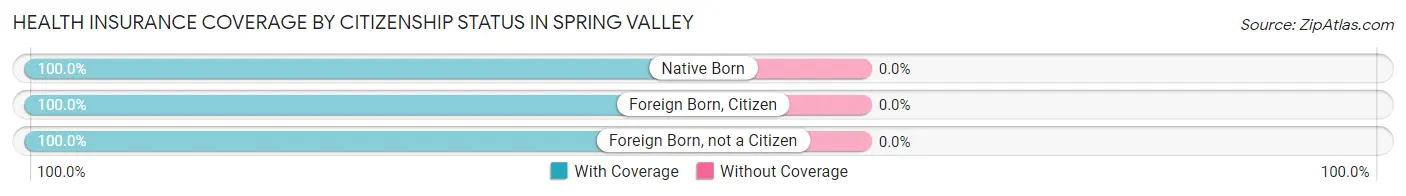
| Citizenship Status | With Coverage | Without Coverage |
| Native Born | 91 (100.0%) | 0 (0.0%) |
| Foreign Born, Citizen | 237 (100.0%) | 0 (0.0%) |
| Foreign Born, not a Citizen | 35 (100.0%) | 0 (0.0%) |
Health Insurance Coverage by Household Income in Spring Valley
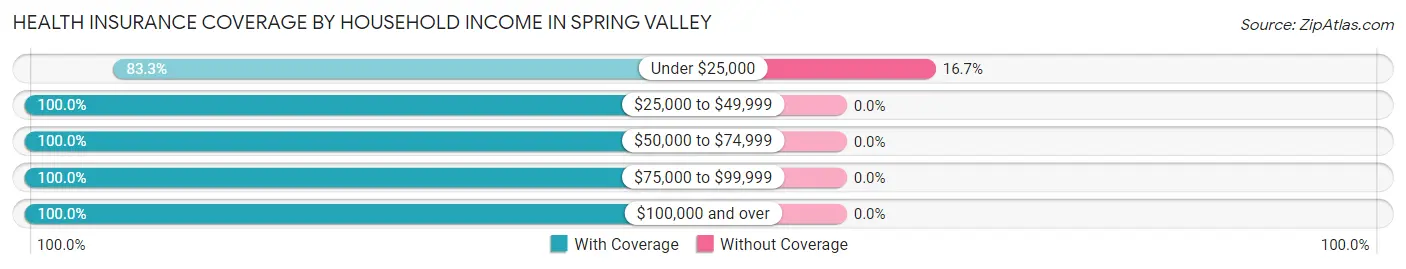
| Household Income | With Coverage | Without Coverage |
| Under $25,000 | 5 (83.3%) | 1 (16.7%) |
| $25,000 to $49,999 | 14 (100.0%) | 0 (0.0%) |
| $50,000 to $74,999 | 18 (100.0%) | 0 (0.0%) |
| $75,000 to $99,999 | 48 (100.0%) | 0 (0.0%) |
| $100,000 and over | 773 (100.0%) | 0 (0.0%) |
Public vs Private Health Insurance Coverage by Age in Spring Valley
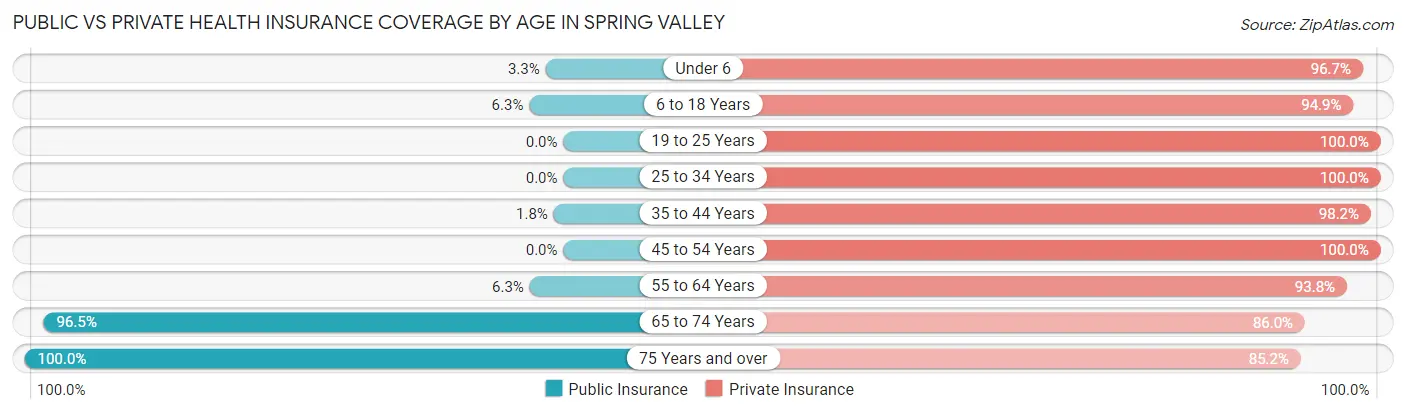
| Age Bracket | Public Insurance | Private Insurance |
| Under 6 | 3 (3.3%) | 88 (96.7%) |
| 6 to 18 Years | 15 (6.3%) | 225 (94.9%) |
| 19 to 25 Years | 0 (0.0%) | 35 (100.0%) |
| 25 to 34 Years | 0 (0.0%) | 41 (100.0%) |
| 35 to 44 Years | 3 (1.8%) | 164 (98.2%) |
| 45 to 54 Years | 0 (0.0%) | 97 (100.0%) |
| 55 to 64 Years | 5 (6.2%) | 75 (93.8%) |
| 65 to 74 Years | 55 (96.5%) | 49 (86.0%) |
| 75 Years and over | 54 (100.0%) | 46 (85.2%) |
| Total | 135 (15.7%) | 820 (95.5%) |
Disability Status by Sex by Age in Spring Valley
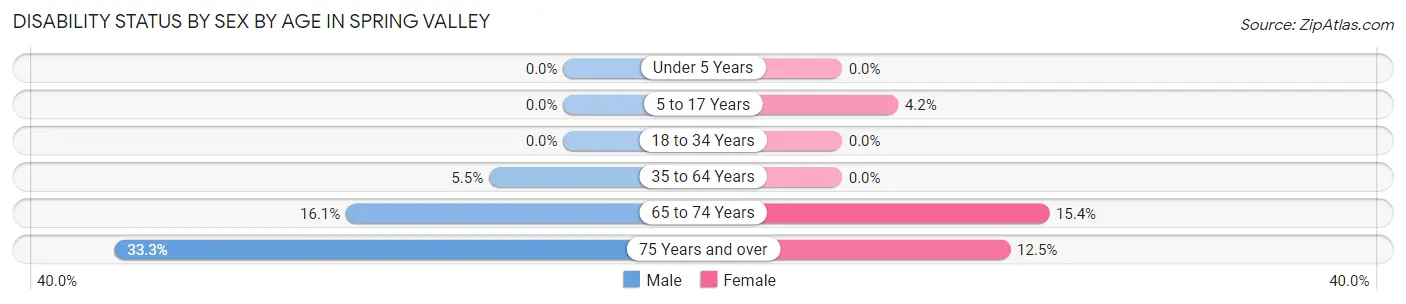
| Age Bracket | Male | Female |
| Under 5 Years | 0 (0.0%) | 0 (0.0%) |
| 5 to 17 Years | 0 (0.0%) | 6 (4.2%) |
| 18 to 34 Years | 0 (0.0%) | 0 (0.0%) |
| 35 to 64 Years | 9 (5.5%) | 0 (0.0%) |
| 65 to 74 Years | 5 (16.1%) | 4 (15.4%) |
| 75 Years and over | 10 (33.3%) | 3 (12.5%) |
Disability Class by Sex by Age in Spring Valley
Disability Class: Hearing Difficulty
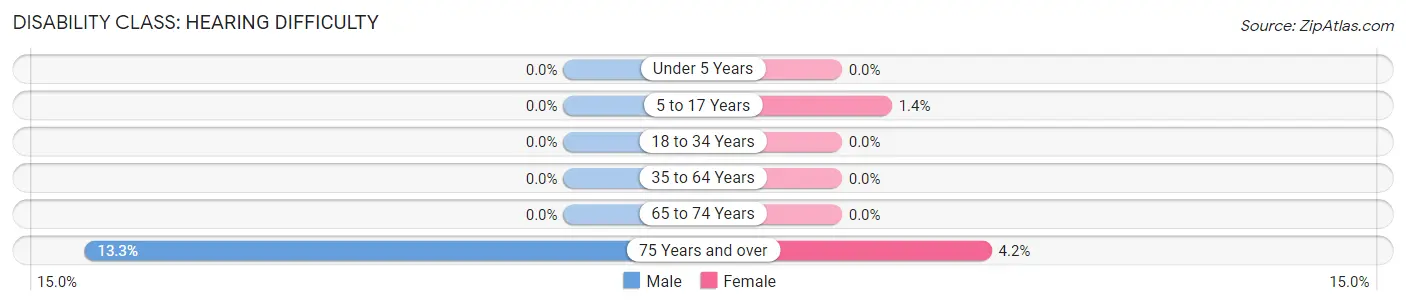
| Age Bracket | Male | Female |
| Under 5 Years | 0 (0.0%) | 0 (0.0%) |
| 5 to 17 Years | 0 (0.0%) | 2 (1.4%) |
| 18 to 34 Years | 0 (0.0%) | 0 (0.0%) |
| 35 to 64 Years | 0 (0.0%) | 0 (0.0%) |
| 65 to 74 Years | 0 (0.0%) | 0 (0.0%) |
| 75 Years and over | 4 (13.3%) | 1 (4.2%) |
Disability Class: Vision Difficulty
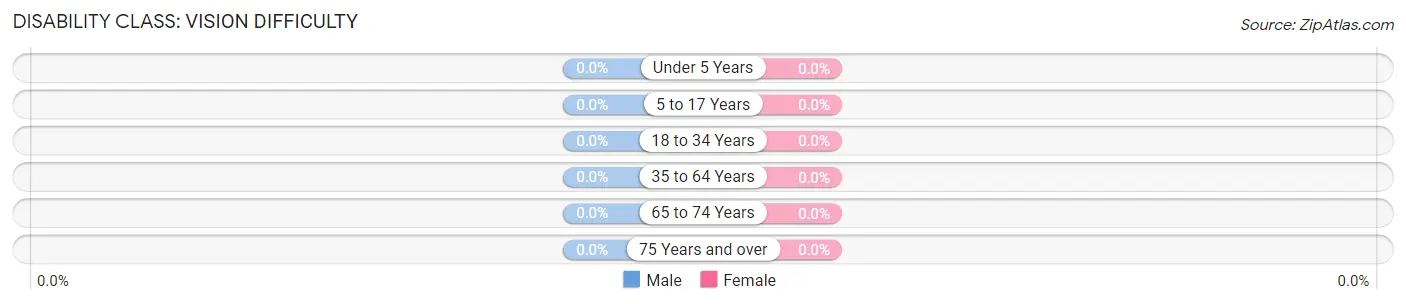
| Age Bracket | Male | Female |
| Under 5 Years | 0 (0.0%) | 0 (0.0%) |
| 5 to 17 Years | 0 (0.0%) | 0 (0.0%) |
| 18 to 34 Years | 0 (0.0%) | 0 (0.0%) |
| 35 to 64 Years | 0 (0.0%) | 0 (0.0%) |
| 65 to 74 Years | 0 (0.0%) | 0 (0.0%) |
| 75 Years and over | 0 (0.0%) | 0 (0.0%) |
Disability Class: Cognitive Difficulty
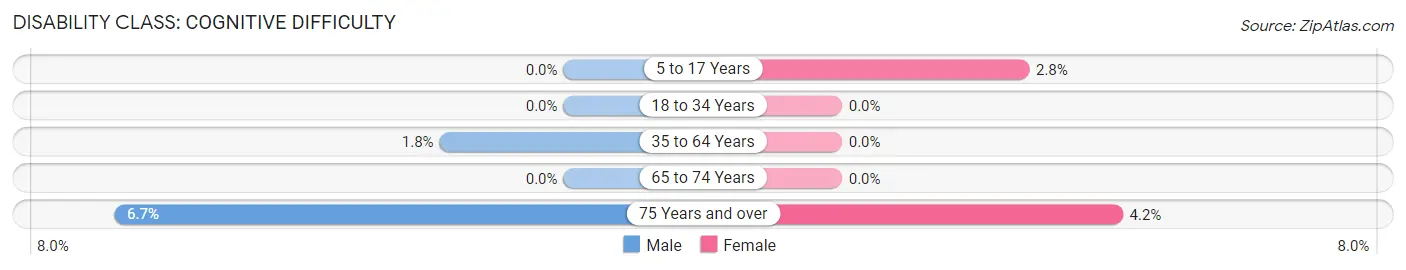
| Age Bracket | Male | Female |
| 5 to 17 Years | 0 (0.0%) | 4 (2.8%) |
| 18 to 34 Years | 0 (0.0%) | 0 (0.0%) |
| 35 to 64 Years | 3 (1.8%) | 0 (0.0%) |
| 65 to 74 Years | 0 (0.0%) | 0 (0.0%) |
| 75 Years and over | 2 (6.7%) | 1 (4.2%) |
Disability Class: Ambulatory Difficulty
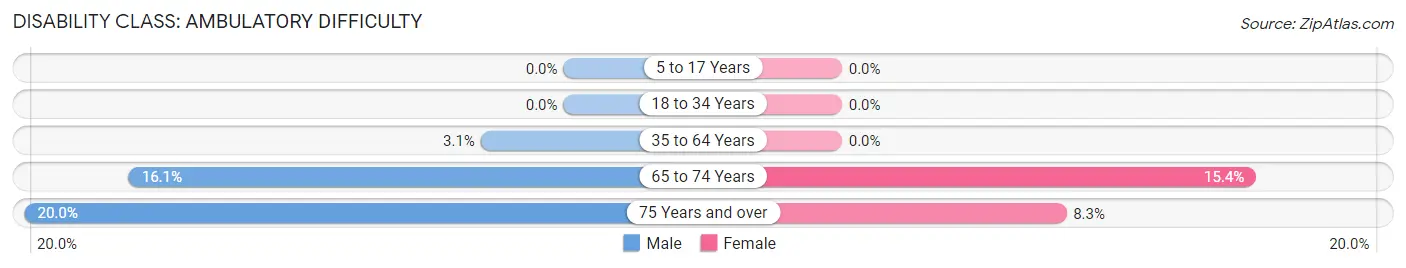
| Age Bracket | Male | Female |
| 5 to 17 Years | 0 (0.0%) | 0 (0.0%) |
| 18 to 34 Years | 0 (0.0%) | 0 (0.0%) |
| 35 to 64 Years | 5 (3.1%) | 0 (0.0%) |
| 65 to 74 Years | 5 (16.1%) | 4 (15.4%) |
| 75 Years and over | 6 (20.0%) | 2 (8.3%) |
Disability Class: Self-Care Difficulty
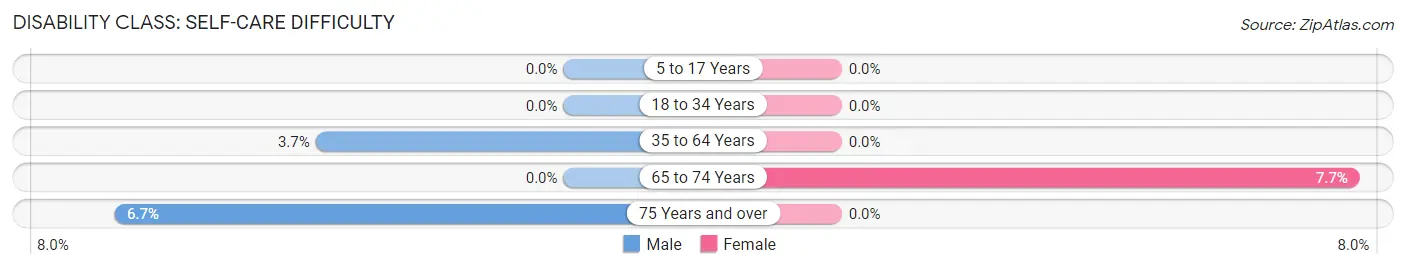
| Age Bracket | Male | Female |
| 5 to 17 Years | 0 (0.0%) | 0 (0.0%) |
| 18 to 34 Years | 0 (0.0%) | 0 (0.0%) |
| 35 to 64 Years | 6 (3.7%) | 0 (0.0%) |
| 65 to 74 Years | 0 (0.0%) | 2 (7.7%) |
| 75 Years and over | 2 (6.7%) | 0 (0.0%) |
Technology Access in Spring Valley
Computing Device Access in Spring Valley
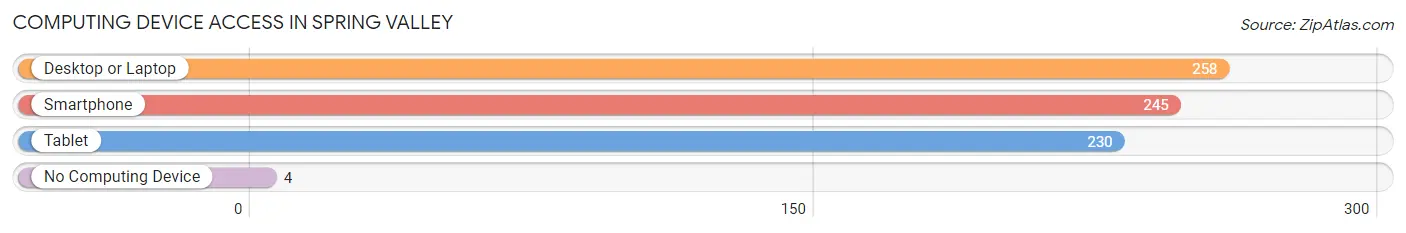
| Device Type | # Households | % Households |
| Desktop or Laptop | 258 | 98.1% |
| Smartphone | 245 | 93.2% |
| Tablet | 230 | 87.5% |
| No Computing Device | 4 | 1.5% |
| Total | 263 | 100.0% |
Internet Access in Spring Valley
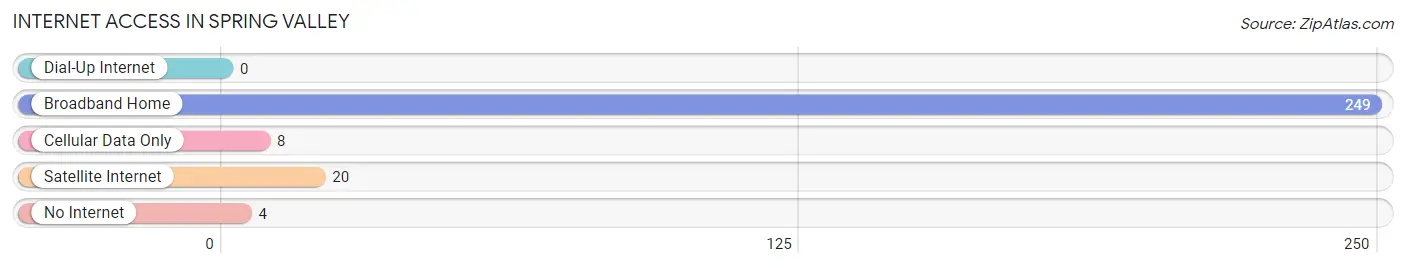
| Internet Type | # Households | % Households |
| Dial-Up Internet | 0 | 0.0% |
| Broadband Home | 249 | 94.7% |
| Cellular Data Only | 8 | 3.0% |
| Satellite Internet | 20 | 7.6% |
| No Internet | 4 | 1.5% |
| Total | 263 | 100.0% |
Spring Valley Summary
Introduction
Spring Valley is a small unincorporated community located in the state of Kentucky. It is situated in the western part of the state, in the county of Warren. The community is located near the city of Bowling Green, and is part of the Bowling Green Metropolitan Statistical Area. The population of Spring Valley was estimated to be around 1,000 people in the year 2000.
History
The history of Spring Valley dates back to the early 1800s. The area was first settled by a group of settlers from Virginia, who were looking for a place to settle and start a new life. The settlers named the area Spring Valley, due to the abundance of springs in the area. The area was mainly used for farming and raising livestock.
In the late 1800s, the area began to grow and develop. The first post office was established in 1883, and the first school was built in 1885. The area also saw the construction of several churches, stores, and other businesses.
In the early 1900s, the area began to experience a population boom. This was due to the influx of new settlers from other parts of the country, as well as the growth of the local economy. The population of Spring Valley continued to grow throughout the 20th century, and by the year 2000, the population was estimated to be around 1,000 people.
Geography
Spring Valley is located in the western part of the state of Kentucky, in the county of Warren. The community is situated near the city of Bowling Green, and is part of the Bowling Green Metropolitan Statistical Area. The area is mainly rural, with rolling hills and farmland. The climate in the area is generally mild, with hot summers and cold winters.
Economy
The economy of Spring Valley is mainly based on agriculture and livestock. The area is home to several farms, which produce a variety of crops, including corn, soybeans, wheat, and hay. The area is also home to several livestock farms, which raise cattle, sheep, and hogs.
In addition to agriculture, the area is also home to several small businesses, including restaurants, stores, and other services. The area is also home to several manufacturing companies, which produce a variety of products, including furniture, clothing, and automotive parts.
Demographics
As of the year 2000, the population of Spring Valley was estimated to be around 1,000 people. The population is mainly composed of white individuals, with a small percentage of African Americans and other minorities. The median household income in the area is around $35,000, and the median home value is around $90,000.
Conclusion
Spring Valley is a small unincorporated community located in the state of Kentucky. The area has a rich history, dating back to the early 1800s. The economy of the area is mainly based on agriculture and livestock, and the population is mainly composed of white individuals. The area is home to several small businesses, and the median household income is around $35,000.
Common Questions
What is Per Capita Income in Spring Valley?
Per Capita income in Spring Valley is $51,500.
What is the Median Family Income in Spring Valley?
Median Family Income in Spring Valley is $156,250.
What is the Median Household income in Spring Valley?
Median Household Income in Spring Valley is $148,750.
What is Income or Wage Gap in Spring Valley?
Income or Wage Gap in Spring Valley is 48.9%.
Women in Spring Valley earn 51.1 cents for every dollar earned by a man.
What is Inequality or Gini Index in Spring Valley?
Inequality or Gini Index in Spring Valley is 0.31.
What is the Total Population of Spring Valley?
Total Population of Spring Valley is 859.
What is the Total Male Population of Spring Valley?
Total Male Population of Spring Valley is 383.
What is the Total Female Population of Spring Valley?
Total Female Population of Spring Valley is 476.
What is the Ratio of Males per 100 Females in Spring Valley?
There are 80.46 Males per 100 Females in Spring Valley.
What is the Ratio of Females per 100 Males in Spring Valley?
There are 124.28 Females per 100 Males in Spring Valley.
What is the Median Population Age in Spring Valley?
Median Population Age in Spring Valley is 37.3 Years.
What is the Average Family Size in Spring Valley
Average Family Size in Spring Valley is 3.5 People.
What is the Average Household Size in Spring Valley
Average Household Size in Spring Valley is 3.3 People.
How Large is the Labor Force in Spring Valley?
There are 403 People in the Labor Forcein in Spring Valley.
What is the Percentage of People in the Labor Force in Spring Valley?
71.2% of People are in the Labor Force in Spring Valley.
What is the Unemployment Rate in Spring Valley?
Unemployment Rate in Spring Valley is 2.0%.