Eastborough, KS Map & Demographics
Eastborough Map
Eastborough Overview
$104,372
PER CAPITA INCOME
$228,456
AVG FAMILY INCOME
$187,750
AVG HOUSEHOLD INCOME
58.9%
WAGE / INCOME GAP [ % ]
41.1¢/ $1
WAGE / INCOME GAP [ $ ]
0.46
INEQUALITY / GINI INDEX
712
TOTAL POPULATION
350
MALE POPULATION
362
FEMALE POPULATION
96.69
MALES / 100 FEMALES
103.43
FEMALES / 100 MALES
54.9
MEDIAN AGE
2.7
AVG FAMILY SIZE
2.3
AVG HOUSEHOLD SIZE
371
LABOR FORCE [ PEOPLE ]
63.2%
PERCENT IN LABOR FORCE
1.3%
UNEMPLOYMENT RATE
Eastborough Area Codes
Income in Eastborough
Income Overview in Eastborough
Per Capita Income in Eastborough is $104,372, while median incomes of families and households are $228,456 and $187,750 respectively.
| Characteristic | Number | Measure |
| Per Capita Income | 712 | $104,372 |
| Median Family Income | 227 | $228,456 |
| Mean Family Income | 227 | $279,316 |
| Median Household Income | 315 | $187,750 |
| Mean Household Income | 315 | $237,997 |
| Income Deficit | 227 | $0 |
| Wage / Income Gap (%) | 712 | 58.94% |
| Wage / Income Gap ($) | 712 | 41.06¢ per $1 |
| Gini / Inequality Index | 712 | 0.46 |
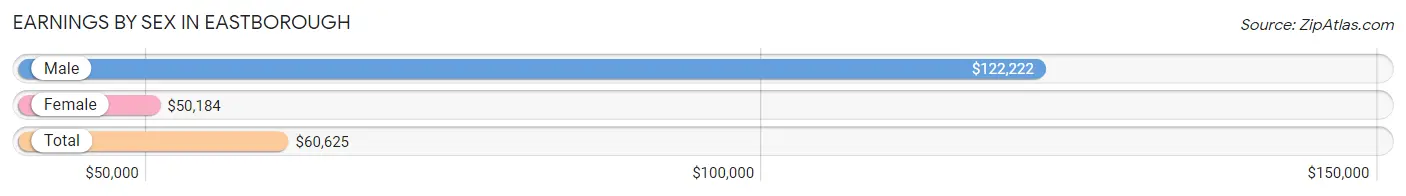
Earnings by Sex in Eastborough
Average Earnings in Eastborough are $60,625, $122,222 for men and $50,184 for women, a difference of 58.9%.
| Sex | Number | Average Earnings |
| Male | 218 (55.5%) | $122,222 |
| Female | 175 (44.5%) | $50,184 |
| Total | 393 (100.0%) | $60,625 |
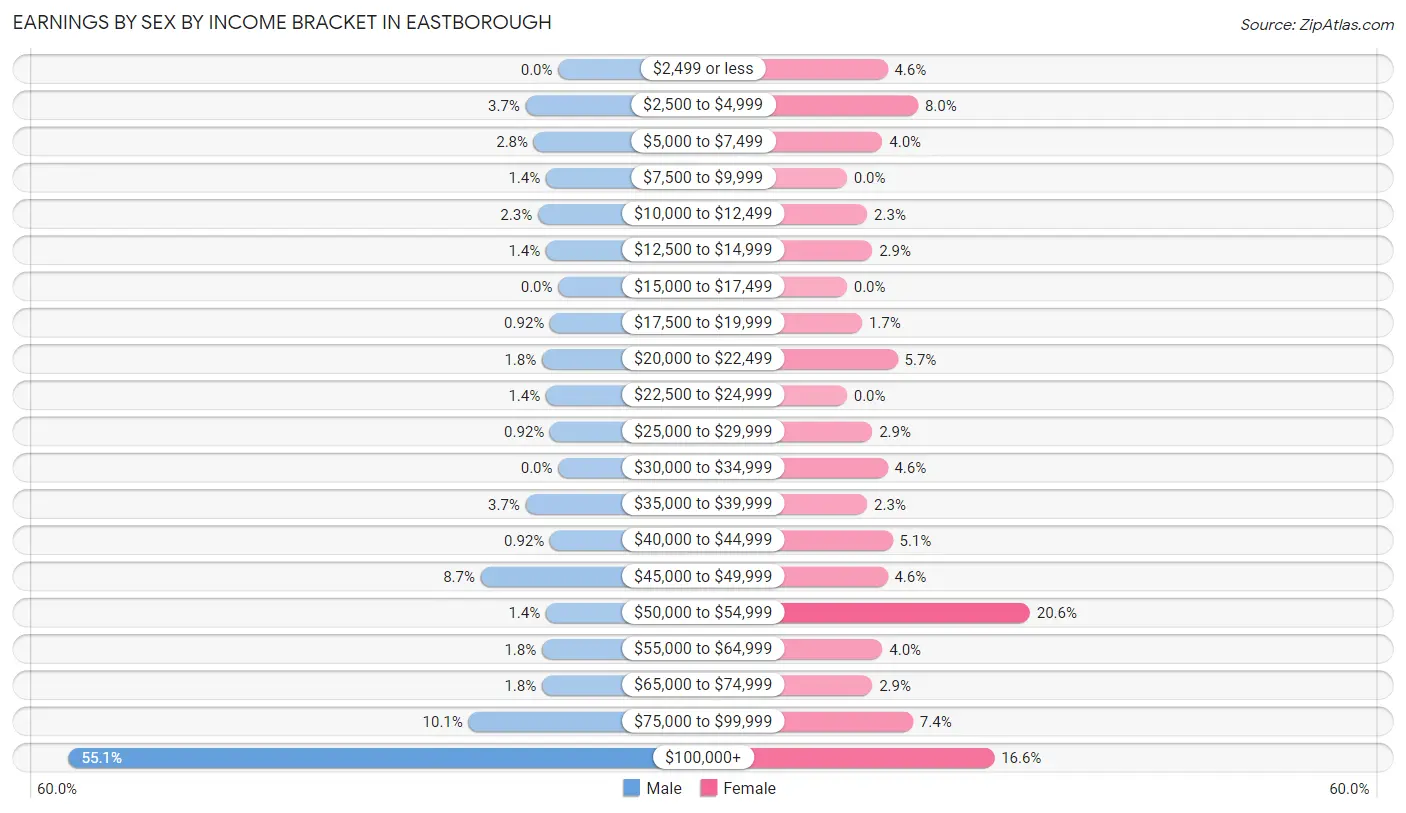
Earnings by Sex by Income Bracket in Eastborough
The most common earnings brackets in Eastborough are $100,000+ for men (120 | 55.0%) and $50,000 to $54,999 for women (36 | 20.6%).
| Income | Male | Female |
| $2,499 or less | 0 (0.0%) | 8 (4.6%) |
| $2,500 to $4,999 | 8 (3.7%) | 14 (8.0%) |
| $5,000 to $7,499 | 6 (2.8%) | 7 (4.0%) |
| $7,500 to $9,999 | 3 (1.4%) | 0 (0.0%) |
| $10,000 to $12,499 | 5 (2.3%) | 4 (2.3%) |
| $12,500 to $14,999 | 3 (1.4%) | 5 (2.9%) |
| $15,000 to $17,499 | 0 (0.0%) | 0 (0.0%) |
| $17,500 to $19,999 | 2 (0.9%) | 3 (1.7%) |
| $20,000 to $22,499 | 4 (1.8%) | 10 (5.7%) |
| $22,500 to $24,999 | 3 (1.4%) | 0 (0.0%) |
| $25,000 to $29,999 | 2 (0.9%) | 5 (2.9%) |
| $30,000 to $34,999 | 0 (0.0%) | 8 (4.6%) |
| $35,000 to $39,999 | 8 (3.7%) | 4 (2.3%) |
| $40,000 to $44,999 | 2 (0.9%) | 9 (5.1%) |
| $45,000 to $49,999 | 19 (8.7%) | 8 (4.6%) |
| $50,000 to $54,999 | 3 (1.4%) | 36 (20.6%) |
| $55,000 to $64,999 | 4 (1.8%) | 7 (4.0%) |
| $65,000 to $74,999 | 4 (1.8%) | 5 (2.9%) |
| $75,000 to $99,999 | 22 (10.1%) | 13 (7.4%) |
| $100,000+ | 120 (55.0%) | 29 (16.6%) |
| Total | 218 (100.0%) | 175 (100.0%) |
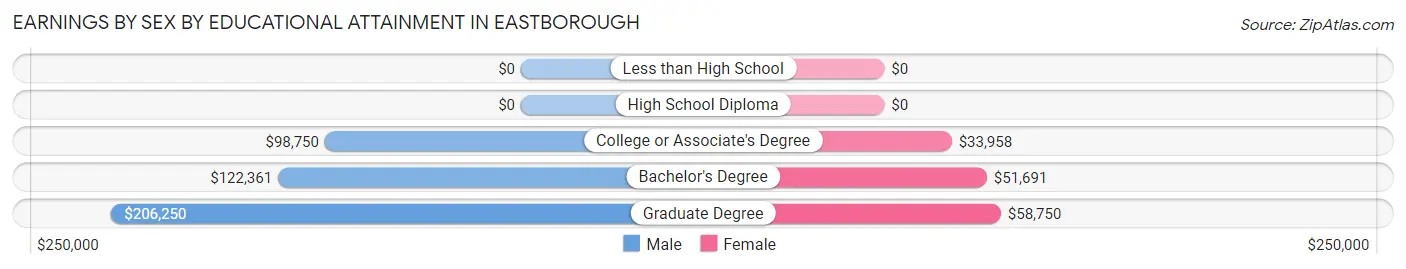
Earnings by Sex by Educational Attainment in Eastborough
Average earnings in Eastborough are $135,000 for men and $50,735 for women, a difference of 62.4%. Men with an educational attainment of graduate degree enjoy the highest average annual earnings of $206,250, while those with college or associate's degree education earn the least with $98,750. Women with an educational attainment of graduate degree earn the most with the average annual earnings of $58,750, while those with college or associate's degree education have the smallest earnings of $33,958.
| Educational Attainment | Male Income | Female Income |
| Less than High School | - | - |
| High School Diploma | - | - |
| College or Associate's Degree | $98,750 | $33,958 |
| Bachelor's Degree | $122,361 | $51,691 |
| Graduate Degree | $206,250 | $58,750 |
| Total | $135,000 | $50,735 |
Family Income in Eastborough
Family Income Brackets in Eastborough
According to the Eastborough family income data, there are 129 families falling into the $200,000+ income range, which is the most common income bracket and makes up 56.8% of all families.
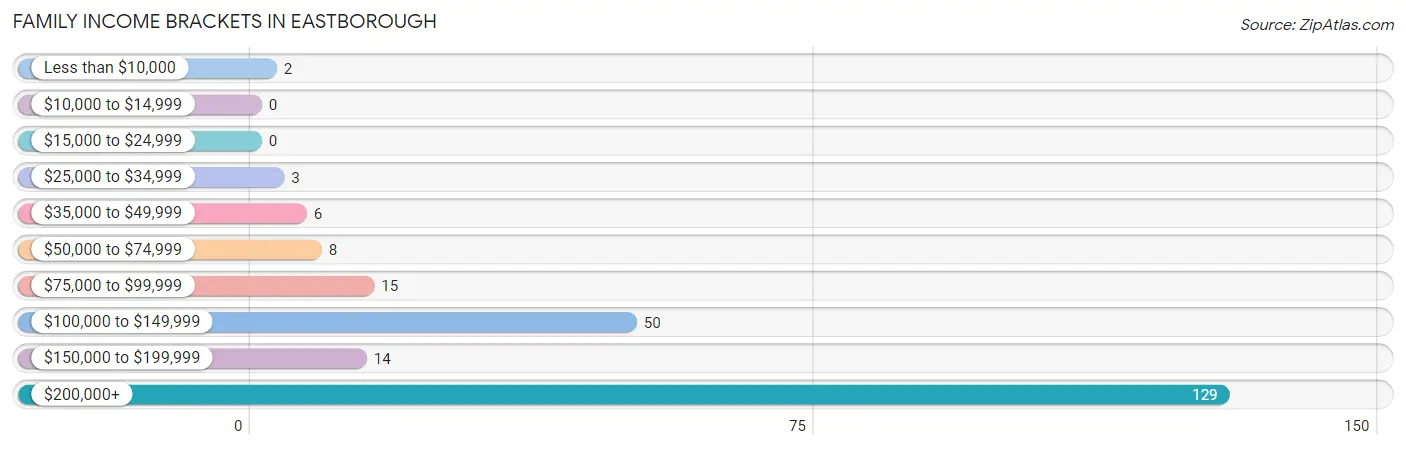
| Income Bracket | # Families | % Families |
| Less than $10,000 | 2 | 0.9% |
| $10,000 to $14,999 | 0 | 0.0% |
| $15,000 to $24,999 | 0 | 0.0% |
| $25,000 to $34,999 | 3 | 1.3% |
| $35,000 to $49,999 | 6 | 2.6% |
| $50,000 to $74,999 | 8 | 3.5% |
| $75,000 to $99,999 | 15 | 6.6% |
| $100,000 to $149,999 | 50 | 22.0% |
| $150,000 to $199,999 | 14 | 6.2% |
| $200,000+ | 129 | 56.8% |
Family Income by Famaliy Size in Eastborough
5-person families (19 | 8.4%) account for the highest median family income in Eastborough with $244,028 per family, while 2-person families (136 | 59.9%) have the highest median income of $81,250 per family member.
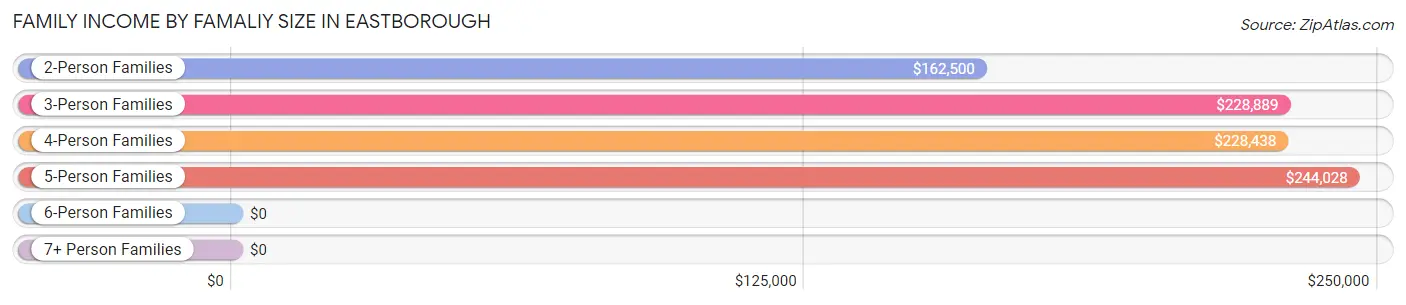
| Income Bracket | # Families | Median Income |
| 2-Person Families | 136 (59.9%) | $162,500 |
| 3-Person Families | 36 (15.9%) | $228,889 |
| 4-Person Families | 30 (13.2%) | $228,438 |
| 5-Person Families | 19 (8.4%) | $244,028 |
| 6-Person Families | 3 (1.3%) | $0 |
| 7+ Person Families | 3 (1.3%) | $0 |
| Total | 227 (100.0%) | $228,456 |
Family Income by Number of Earners in Eastborough
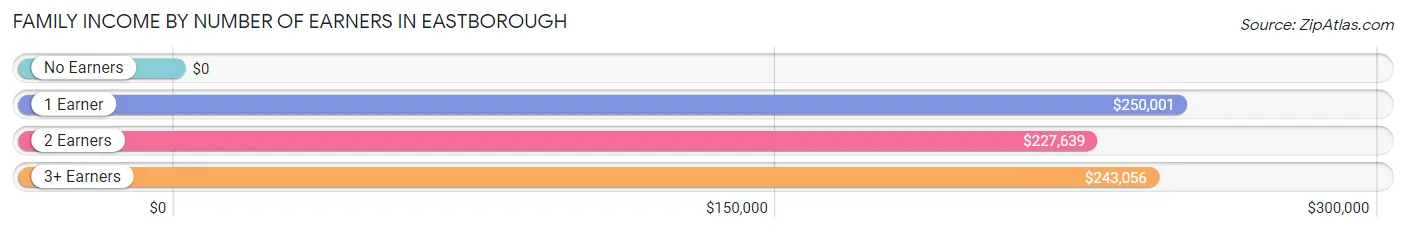
| Number of Earners | # Families | Median Income |
| No Earners | 41 (18.1%) | $0 |
| 1 Earner | 47 (20.7%) | $250,001 |
| 2 Earners | 117 (51.5%) | $227,639 |
| 3+ Earners | 22 (9.7%) | $243,056 |
| Total | 227 (100.0%) | $228,456 |
Household Income in Eastborough
Household Income Brackets in Eastborough
With 150 households falling in the category, the $200,000+ income range is the most frequent in Eastborough, accounting for 47.6% of all households.
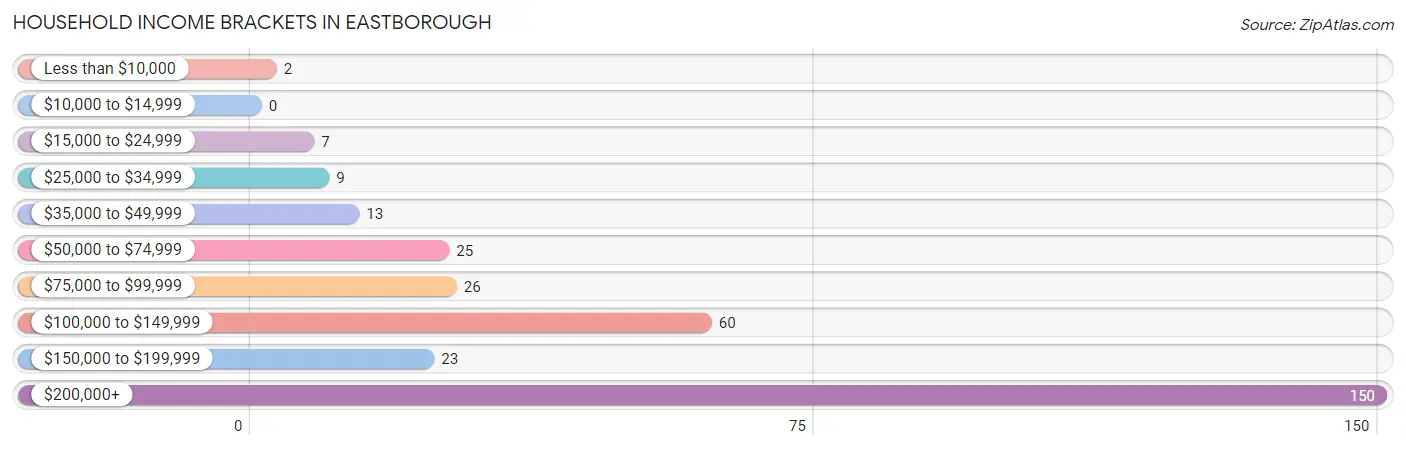
| Income Bracket | # Households | % Households |
| Less than $10,000 | 2 | 0.6% |
| $10,000 to $14,999 | 0 | 0.0% |
| $15,000 to $24,999 | 7 | 2.2% |
| $25,000 to $34,999 | 9 | 2.9% |
| $35,000 to $49,999 | 13 | 4.1% |
| $50,000 to $74,999 | 25 | 7.9% |
| $75,000 to $99,999 | 26 | 8.3% |
| $100,000 to $149,999 | 60 | 19.0% |
| $150,000 to $199,999 | 23 | 7.3% |
| $200,000+ | 150 | 47.6% |
Household Income by Householder Age in Eastborough
The median household income in Eastborough is $187,750, with the highest median household income of $243,125 found in the 25 to 44 years age bracket for the primary householder. A total of 42 households (13.3%) fall into this category.
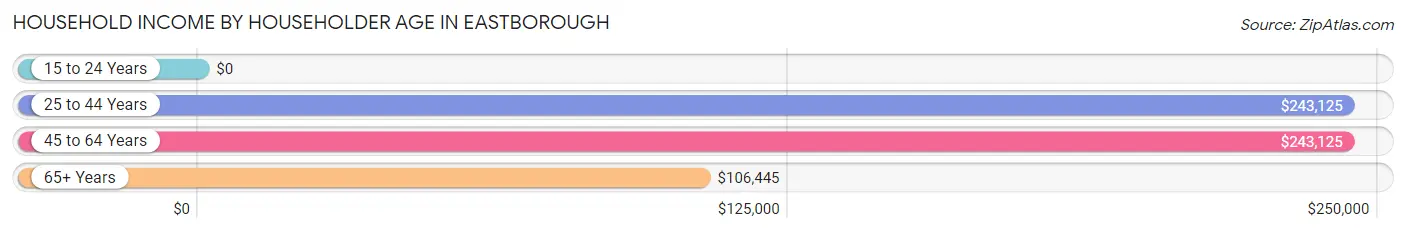
| Income Bracket | # Households | Median Income |
| 15 to 24 Years | 0 (0.0%) | $0 |
| 25 to 44 Years | 42 (13.3%) | $243,125 |
| 45 to 64 Years | 120 (38.1%) | $243,125 |
| 65+ Years | 153 (48.6%) | $106,445 |
| Total | 315 (100.0%) | $187,750 |
Poverty in Eastborough
Income Below Poverty by Sex and Age in Eastborough
With 0.3% poverty level for males and 0.6% for females among the residents of Eastborough, 75 year old and over males and 65 to 74 year old females are the most vulnerable to poverty, with 1 males (2.9%) and 2 females (2.4%) in their respective age groups living below the poverty level.
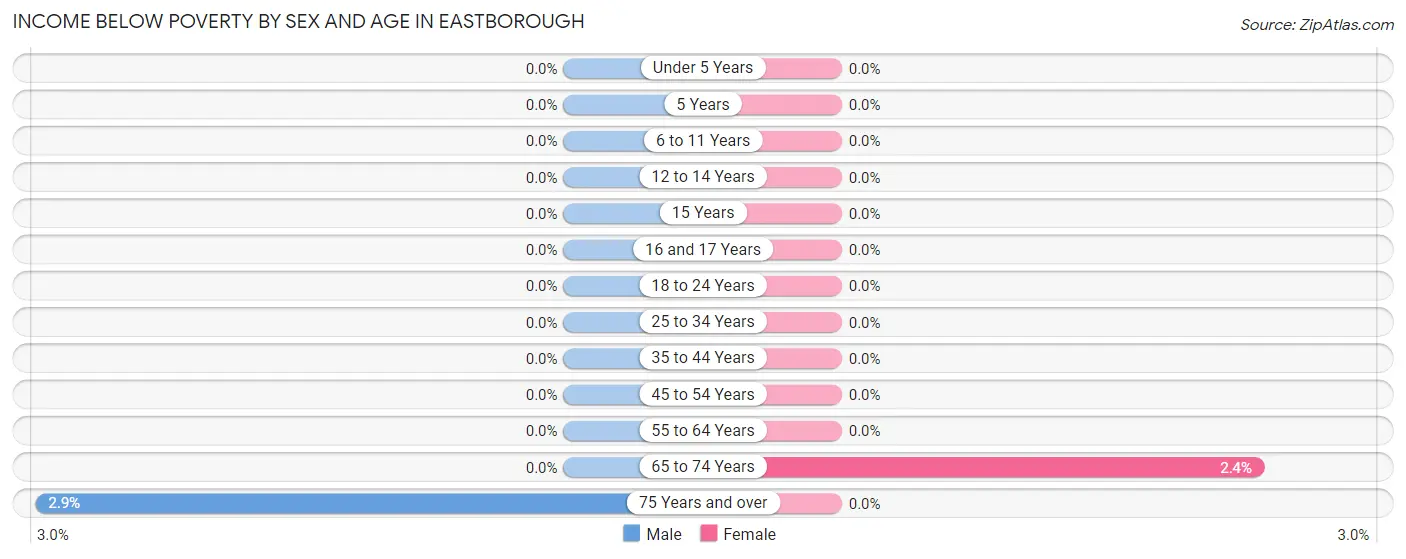
| Age Bracket | Male | Female |
| Under 5 Years | 0 (0.0%) | 0 (0.0%) |
| 5 Years | 0 (0.0%) | 0 (0.0%) |
| 6 to 11 Years | 0 (0.0%) | 0 (0.0%) |
| 12 to 14 Years | 0 (0.0%) | 0 (0.0%) |
| 15 Years | 0 (0.0%) | 0 (0.0%) |
| 16 and 17 Years | 0 (0.0%) | 0 (0.0%) |
| 18 to 24 Years | 0 (0.0%) | 0 (0.0%) |
| 25 to 34 Years | 0 (0.0%) | 0 (0.0%) |
| 35 to 44 Years | 0 (0.0%) | 0 (0.0%) |
| 45 to 54 Years | 0 (0.0%) | 0 (0.0%) |
| 55 to 64 Years | 0 (0.0%) | 0 (0.0%) |
| 65 to 74 Years | 0 (0.0%) | 2 (2.4%) |
| 75 Years and over | 1 (2.9%) | 0 (0.0%) |
| Total | 1 (0.3%) | 2 (0.6%) |
Income Above Poverty by Sex and Age in Eastborough
According to the poverty statistics in Eastborough, males aged under 5 years and females aged under 5 years are the age groups that are most secure financially, with 100.0% of males and 100.0% of females in these age groups living above the poverty line.
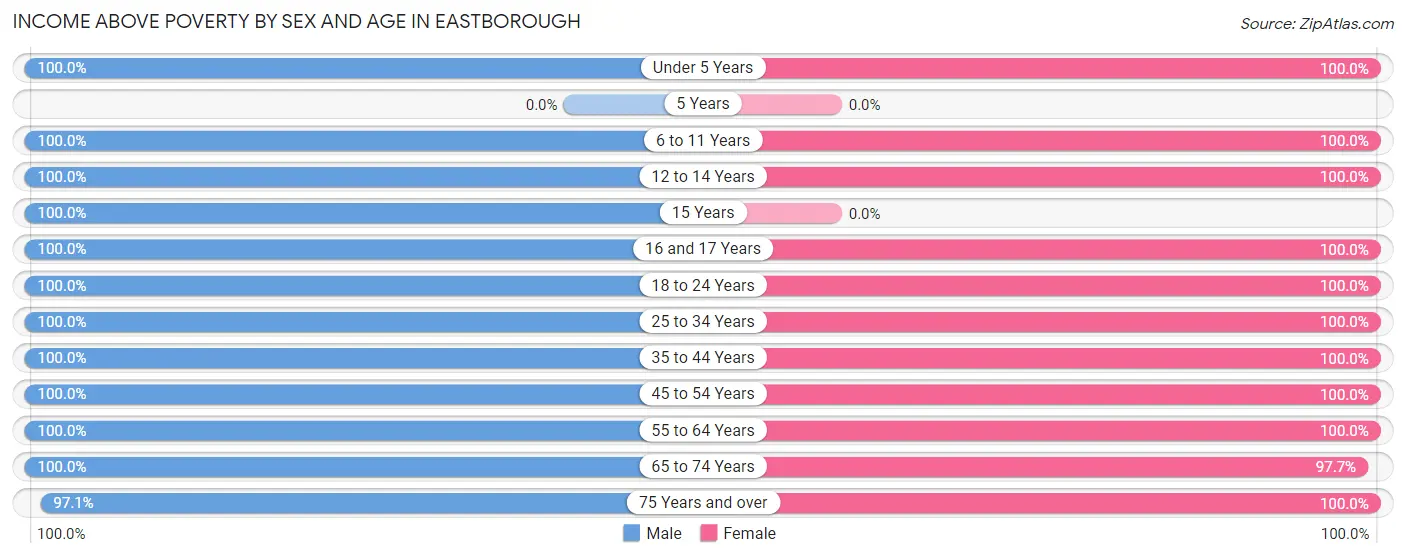
| Age Bracket | Male | Female |
| Under 5 Years | 5 (100.0%) | 4 (100.0%) |
| 5 Years | 0 (0.0%) | 0 (0.0%) |
| 6 to 11 Years | 18 (100.0%) | 30 (100.0%) |
| 12 to 14 Years | 11 (100.0%) | 26 (100.0%) |
| 15 Years | 28 (100.0%) | 0 (0.0%) |
| 16 and 17 Years | 13 (100.0%) | 11 (100.0%) |
| 18 to 24 Years | 7 (100.0%) | 10 (100.0%) |
| 25 to 34 Years | 8 (100.0%) | 5 (100.0%) |
| 35 to 44 Years | 31 (100.0%) | 36 (100.0%) |
| 45 to 54 Years | 48 (100.0%) | 63 (100.0%) |
| 55 to 64 Years | 70 (100.0%) | 51 (100.0%) |
| 65 to 74 Years | 77 (100.0%) | 83 (97.7%) |
| 75 Years and over | 33 (97.1%) | 38 (100.0%) |
| Total | 349 (99.7%) | 357 (99.4%) |
Income Below Poverty Among Married-Couple Families in Eastborough
The poverty statistics for married-couple families in Eastborough show that 0.9% or 2 of the total 215 families live below the poverty line. Families with no children have the highest poverty rate of 1.3%, comprising of 2 families. On the other hand, families with 1 or 2 children have the lowest poverty rate of 0.0%, which includes 0 families.
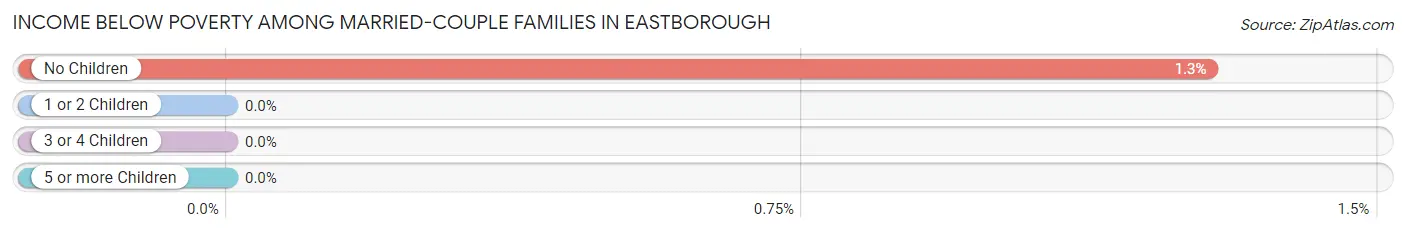
| Children | Above Poverty | Below Poverty |
| No Children | 154 (98.7%) | 2 (1.3%) |
| 1 or 2 Children | 34 (100.0%) | 0 (0.0%) |
| 3 or 4 Children | 22 (100.0%) | 0 (0.0%) |
| 5 or more Children | 3 (100.0%) | 0 (0.0%) |
| Total | 213 (99.1%) | 2 (0.9%) |
Income Below Poverty Among Single-Parent Households in Eastborough
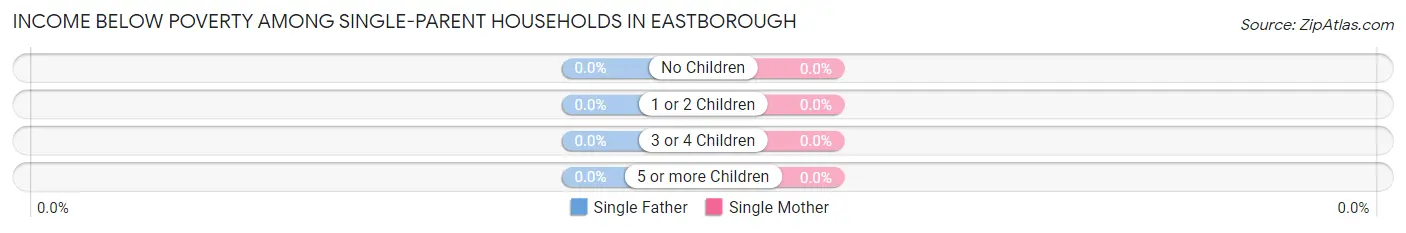
| Children | Single Father | Single Mother |
| No Children | 0 (0.0%) | 0 (0.0%) |
| 1 or 2 Children | 0 (0.0%) | 0 (0.0%) |
| 3 or 4 Children | 0 (0.0%) | 0 (0.0%) |
| 5 or more Children | 0 (0.0%) | 0 (0.0%) |
| Total | 0 (0.0%) | 0 (0.0%) |
Income Below Poverty Among Married-Couple vs Single-Parent Households in Eastborough
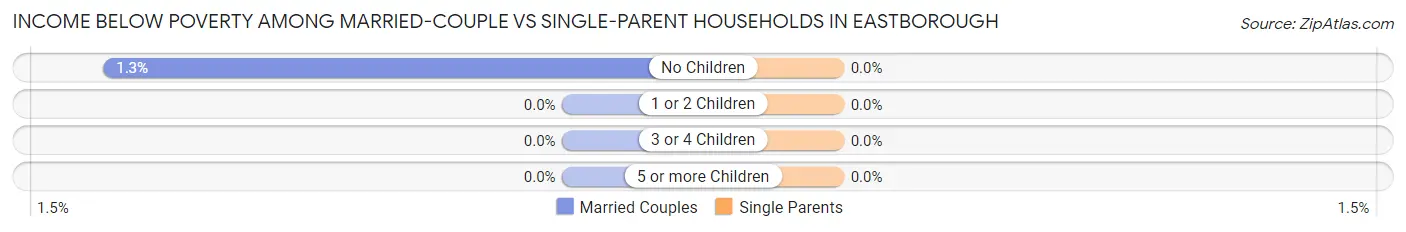
| Children | Married-Couple Families | Single-Parent Households |
| No Children | 2 (1.3%) | 0 (0.0%) |
| 1 or 2 Children | 0 (0.0%) | 0 (0.0%) |
| 3 or 4 Children | 0 (0.0%) | 0 (0.0%) |
| 5 or more Children | 0 (0.0%) | 0 (0.0%) |
| Total | 2 (0.9%) | 0 (0.0%) |
Race in Eastborough
The most populous races in Eastborough are White / Caucasian (700 | 98.3%), Hispanic or Latino (13 | 1.8%), and Black / African American (9 | 1.3%).
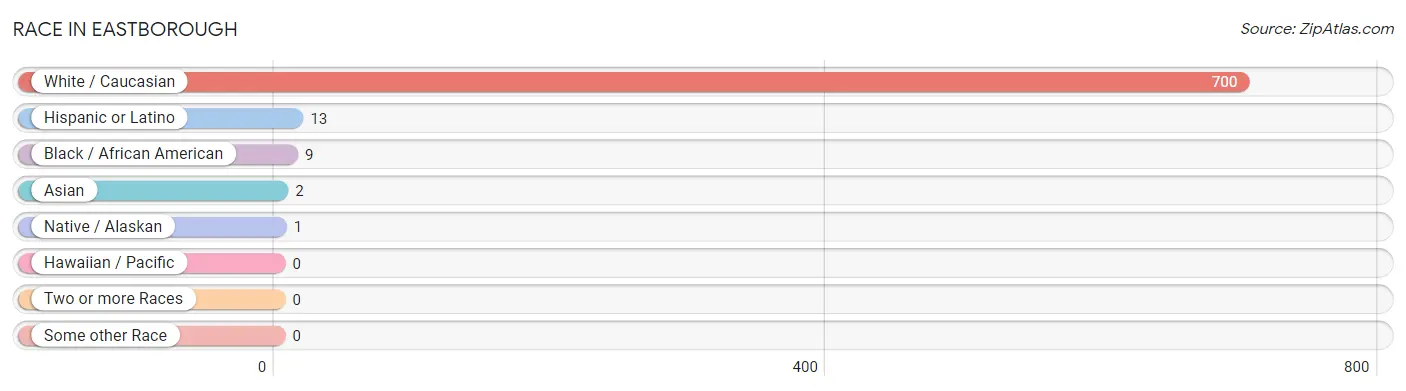
| Race | # Population | % Population |
| Asian | 2 | 0.3% |
| Black / African American | 9 | 1.3% |
| Hawaiian / Pacific | 0 | 0.0% |
| Hispanic or Latino | 13 | 1.8% |
| Native / Alaskan | 1 | 0.1% |
| White / Caucasian | 700 | 98.3% |
| Two or more Races | 0 | 0.0% |
| Some other Race | 0 | 0.0% |
| Total | 712 | 100.0% |
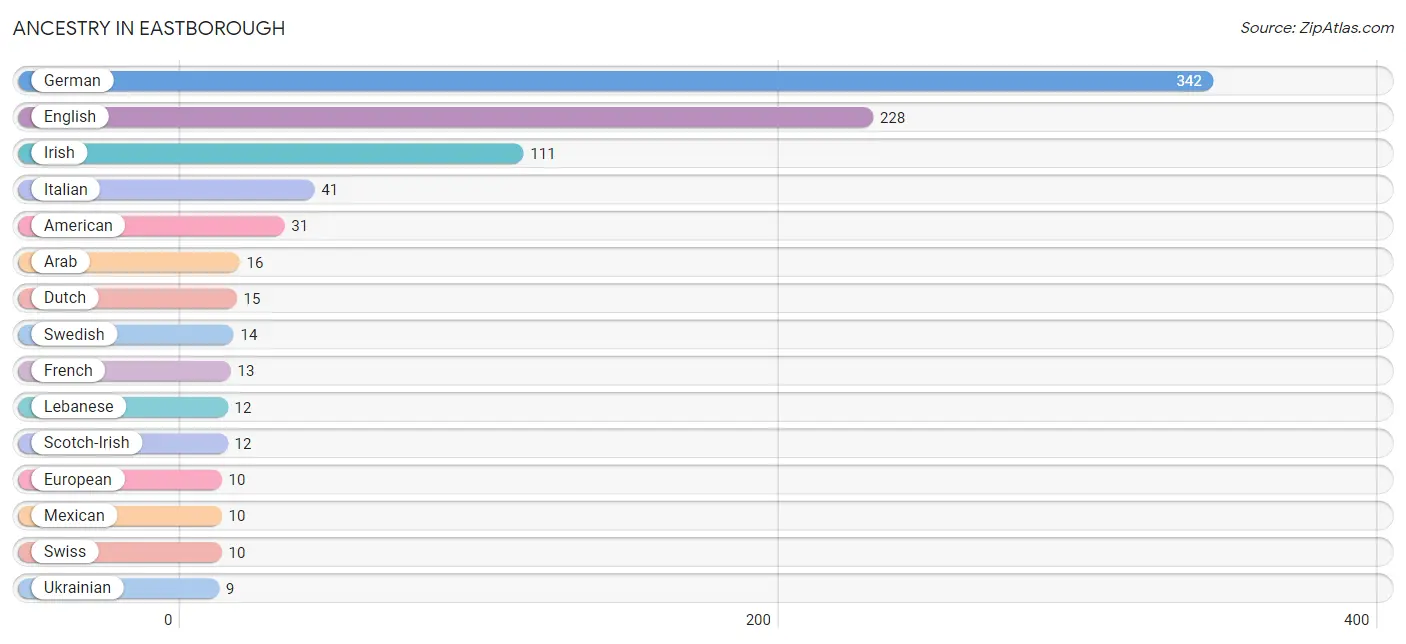
Ancestry in Eastborough
The most populous ancestries reported in Eastborough are German (342 | 48.0%), English (228 | 32.0%), Irish (111 | 15.6%), Italian (41 | 5.8%), and American (31 | 4.3%), together accounting for 105.8% of all Eastborough residents.
| Ancestry | # Population | % Population |
| American | 31 | 4.3% |
| Arab | 16 | 2.2% |
| British | 4 | 0.6% |
| Canadian | 2 | 0.3% |
| Croatian | 2 | 0.3% |
| Czech | 7 | 1.0% |
| Czechoslovakian | 2 | 0.3% |
| Danish | 5 | 0.7% |
| Dutch | 15 | 2.1% |
| Eastern European | 6 | 0.8% |
| English | 228 | 32.0% |
| European | 10 | 1.4% |
| Finnish | 3 | 0.4% |
| French | 13 | 1.8% |
| French Canadian | 8 | 1.1% |
| German | 342 | 48.0% |
| Greek | 3 | 0.4% |
| Indian (Asian) | 2 | 0.3% |
| Irish | 111 | 15.6% |
| Italian | 41 | 5.8% |
| Lebanese | 12 | 1.7% |
| Mexican | 10 | 1.4% |
| Northern European | 5 | 0.7% |
| Norwegian | 4 | 0.6% |
| Polish | 3 | 0.4% |
| Russian | 3 | 0.4% |
| Scotch-Irish | 12 | 1.7% |
| Scottish | 5 | 0.7% |
| Slavic | 3 | 0.4% |
| Slovene | 2 | 0.3% |
| Swedish | 14 | 2.0% |
| Swiss | 10 | 1.4% |
| Syrian | 4 | 0.6% |
| Ukrainian | 9 | 1.3% |
| Welsh | 7 | 1.0% |
| Yugoslavian | 3 | 0.4% | View All 36 Rows |
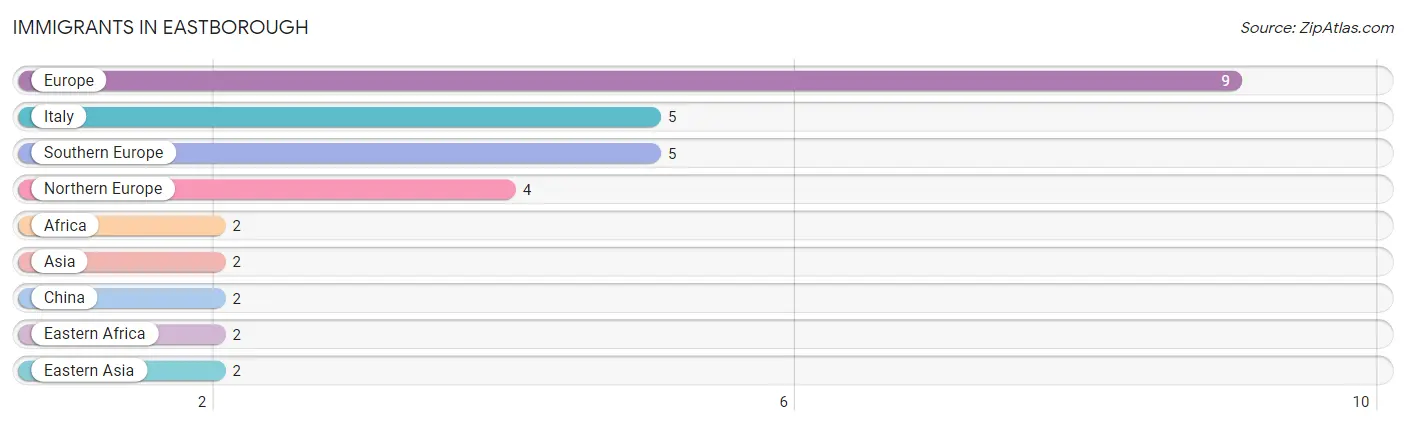
Immigrants in Eastborough
The most numerous immigrant groups reported in Eastborough came from Europe (9 | 1.3%), Italy (5 | 0.7%), Southern Europe (5 | 0.7%), Northern Europe (4 | 0.6%), and Africa (2 | 0.3%), together accounting for 3.5% of all Eastborough residents.
| Immigration Origin | # Population | % Population |
| Africa | 2 | 0.3% |
| Asia | 2 | 0.3% |
| China | 2 | 0.3% |
| Eastern Africa | 2 | 0.3% |
| Eastern Asia | 2 | 0.3% |
| Europe | 9 | 1.3% |
| Italy | 5 | 0.7% |
| Northern Europe | 4 | 0.6% |
| Southern Europe | 5 | 0.7% | View All 9 Rows |
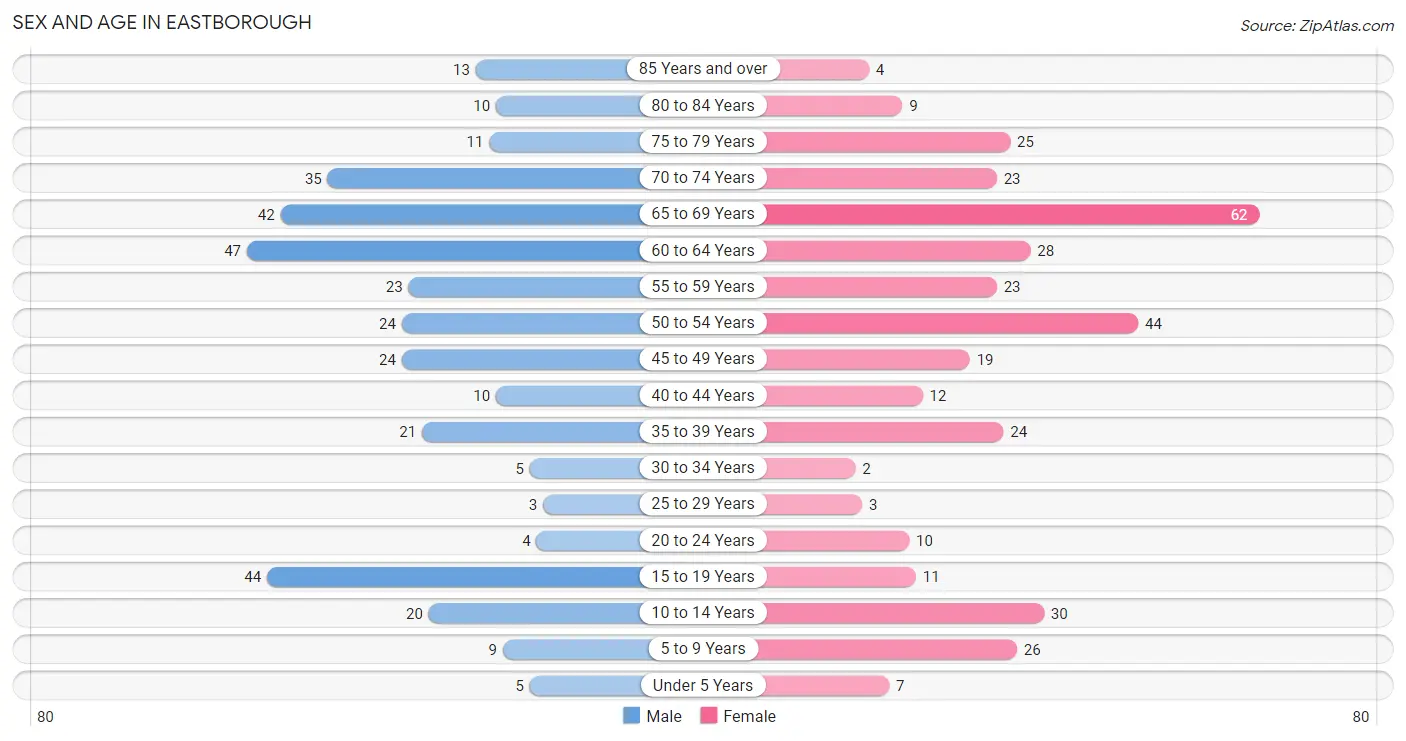
Sex and Age in Eastborough
Sex and Age in Eastborough
The most populous age groups in Eastborough are 60 to 64 Years (47 | 13.4%) for men and 65 to 69 Years (62 | 17.1%) for women.
| Age Bracket | Male | Female |
| Under 5 Years | 5 (1.4%) | 7 (1.9%) |
| 5 to 9 Years | 9 (2.6%) | 26 (7.2%) |
| 10 to 14 Years | 20 (5.7%) | 30 (8.3%) |
| 15 to 19 Years | 44 (12.6%) | 11 (3.0%) |
| 20 to 24 Years | 4 (1.1%) | 10 (2.8%) |
| 25 to 29 Years | 3 (0.9%) | 3 (0.8%) |
| 30 to 34 Years | 5 (1.4%) | 2 (0.5%) |
| 35 to 39 Years | 21 (6.0%) | 24 (6.6%) |
| 40 to 44 Years | 10 (2.9%) | 12 (3.3%) |
| 45 to 49 Years | 24 (6.9%) | 19 (5.2%) |
| 50 to 54 Years | 24 (6.9%) | 44 (12.1%) |
| 55 to 59 Years | 23 (6.6%) | 23 (6.4%) |
| 60 to 64 Years | 47 (13.4%) | 28 (7.7%) |
| 65 to 69 Years | 42 (12.0%) | 62 (17.1%) |
| 70 to 74 Years | 35 (10.0%) | 23 (6.4%) |
| 75 to 79 Years | 11 (3.1%) | 25 (6.9%) |
| 80 to 84 Years | 10 (2.9%) | 9 (2.5%) |
| 85 Years and over | 13 (3.7%) | 4 (1.1%) |
| Total | 350 (100.0%) | 362 (100.0%) |
Families and Households in Eastborough
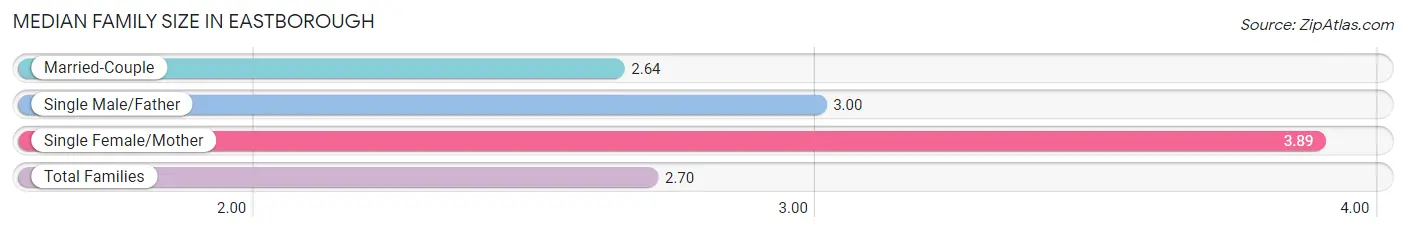
Median Family Size in Eastborough
The median family size in Eastborough is 2.70 persons per family, with single female/mother families (9 | 4.0%) accounting for the largest median family size of 3.89 persons per family. On the other hand, married-couple families (215 | 94.7%) represent the smallest median family size with 2.64 persons per family.
| Family Type | # Families | Family Size |
| Married-Couple | 215 (94.7%) | 2.64 |
| Single Male/Father | 3 (1.3%) | 3.00 |
| Single Female/Mother | 9 (4.0%) | 3.89 |
| Total Families | 227 (100.0%) | 2.70 |
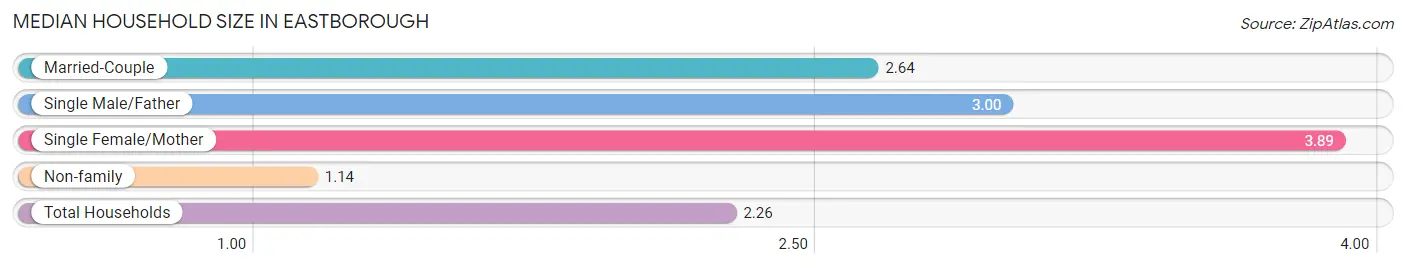
Median Household Size in Eastborough
The median household size in Eastborough is 2.26 persons per household, with single female/mother households (9 | 2.9%) accounting for the largest median household size of 3.89 persons per household. non-family households (88 | 27.9%) represent the smallest median household size with 1.14 persons per household.
| Household Type | # Households | Household Size |
| Married-Couple | 215 (68.2%) | 2.64 |
| Single Male/Father | 3 (0.9%) | 3.00 |
| Single Female/Mother | 9 (2.9%) | 3.89 |
| Non-family | 88 (27.9%) | 1.14 |
| Total Households | 315 (100.0%) | 2.26 |
Household Size by Marriage Status in Eastborough
Out of a total of 315 households in Eastborough, 227 (72.1%) are family households, while 88 (27.9%) are nonfamily households. The most numerous type of family households are 2-person households, comprising 136, and the most common type of nonfamily households are 1-person households, comprising 77.
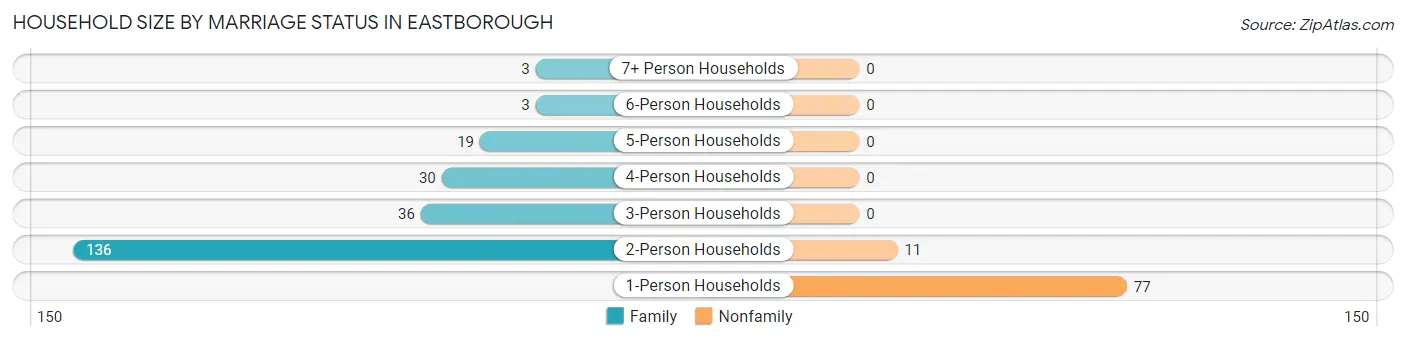
| Household Size | Family Households | Nonfamily Households |
| 1-Person Households | - | 77 (24.4%) |
| 2-Person Households | 136 (43.2%) | 11 (3.5%) |
| 3-Person Households | 36 (11.4%) | 0 (0.0%) |
| 4-Person Households | 30 (9.5%) | 0 (0.0%) |
| 5-Person Households | 19 (6.0%) | 0 (0.0%) |
| 6-Person Households | 3 (0.9%) | 0 (0.0%) |
| 7+ Person Households | 3 (0.9%) | 0 (0.0%) |
| Total | 227 (72.1%) | 88 (27.9%) |
Female Fertility in Eastborough
Fertility by Age in Eastborough
| Age Bracket | Women with Births | Births / 1,000 Women |
| 15 to 19 years | 0 (0.0%) | 0.0 |
| 20 to 34 years | 0 (0.0%) | 0.0 |
| 35 to 50 years | 0 (0.0%) | 0.0 |
| Total | 0 (0.0%) | 0.0 |
Fertility by Age by Marriage Status in Eastborough
| Age Bracket | Married | Unmarried |
| 15 to 19 years | 0 (0.0%) | 0 (0.0%) |
| 20 to 34 years | 0 (0.0%) | 0 (0.0%) |
| 35 to 50 years | 0 (0.0%) | 0 (0.0%) |
| Total | 0 (0.0%) | 0 (0.0%) |
Fertility by Education in Eastborough
| Educational Attainment | Women with Births | Births / 1,000 Women |
| Less than High School | 0 (0.0%) | 0.0 |
| High School Diploma | 0 (0.0%) | 0.0 |
| College or Associate's Degree | 0 (0.0%) | 0.0 |
| Bachelor's Degree | 0 (0.0%) | 0.0 |
| Graduate Degree | 0 (0.0%) | 0.0 |
| Total | 0 (0.0%) | 0.0 |
Fertility by Education by Marriage Status in Eastborough
| Educational Attainment | Married | Unmarried |
| Less than High School | 0 (0.0%) | 0 (0.0%) |
| High School Diploma | 0 (0.0%) | 0 (0.0%) |
| College or Associate's Degree | 0 (0.0%) | 0 (0.0%) |
| Bachelor's Degree | 0 (0.0%) | 0 (0.0%) |
| Graduate Degree | 0 (0.0%) | 0 (0.0%) |
| Total | 0 (0.0%) | 0 (0.0%) |
Employment Characteristics in Eastborough
Employment by Class of Employer in Eastborough
Among the 364 employed individuals in Eastborough, private company employees (171 | 47.0%), not-for-profit organizations (83 | 22.8%), and self-employed (not incorporated) (52 | 14.3%) make up the most common classes of employment.
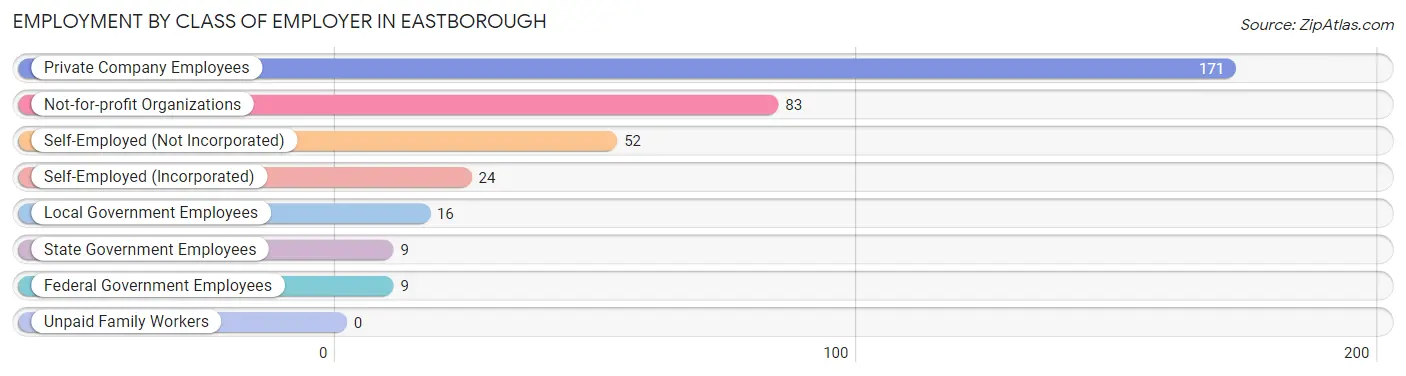
| Employer Class | # Employees | % Employees |
| Private Company Employees | 171 | 47.0% |
| Self-Employed (Incorporated) | 24 | 6.6% |
| Self-Employed (Not Incorporated) | 52 | 14.3% |
| Not-for-profit Organizations | 83 | 22.8% |
| Local Government Employees | 16 | 4.4% |
| State Government Employees | 9 | 2.5% |
| Federal Government Employees | 9 | 2.5% |
| Unpaid Family Workers | 0 | 0.0% |
| Total | 364 | 100.0% |
Employment Status by Age in Eastborough
According to the labor force statistics for Eastborough, out of the total population over 16 years of age (587), 63.2% or 371 individuals are in the labor force, with 1.3% or 5 of them unemployed. The age group with the highest labor force participation rate is 25 to 29 years, with 100.0% or 6 individuals in the labor force. Within the labor force, the 60 to 64 years age range has the highest percentage of unemployed individuals, with 8.5% or 5 of them being unemployed.
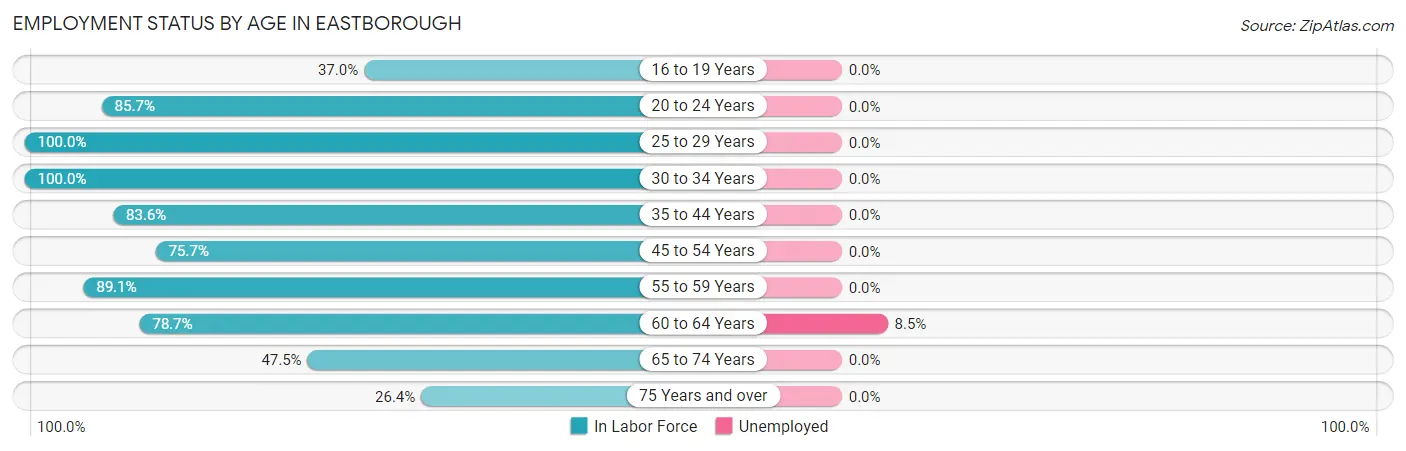
| Age Bracket | In Labor Force | Unemployed |
| 16 to 19 Years | 10 (37.0%) | 0 (0.0%) |
| 20 to 24 Years | 12 (85.7%) | 0 (0.0%) |
| 25 to 29 Years | 6 (100.0%) | 0 (0.0%) |
| 30 to 34 Years | 7 (100.0%) | 0 (0.0%) |
| 35 to 44 Years | 56 (83.6%) | 0 (0.0%) |
| 45 to 54 Years | 84 (75.7%) | 0 (0.0%) |
| 55 to 59 Years | 41 (89.1%) | 0 (0.0%) |
| 60 to 64 Years | 59 (78.7%) | 5 (8.5%) |
| 65 to 74 Years | 77 (47.5%) | 0 (0.0%) |
| 75 Years and over | 19 (26.4%) | 0 (0.0%) |
| Total | 371 (63.2%) | 5 (1.3%) |
Employment Status by Educational Attainment in Eastborough
According to labor force statistics for Eastborough, 81.1% of individuals (253) out of the total population between 25 and 64 years of age (312) are in the labor force, with 2.0% or 5 of them being unemployed. The group with the highest labor force participation rate are those with the educational attainment of high school diploma, with 100.0% or 14 individuals in the labor force. Within the labor force, individuals with bachelor's degree or higher education have the highest percentage of unemployment, with 2.6% or 5 of them being unemployed.
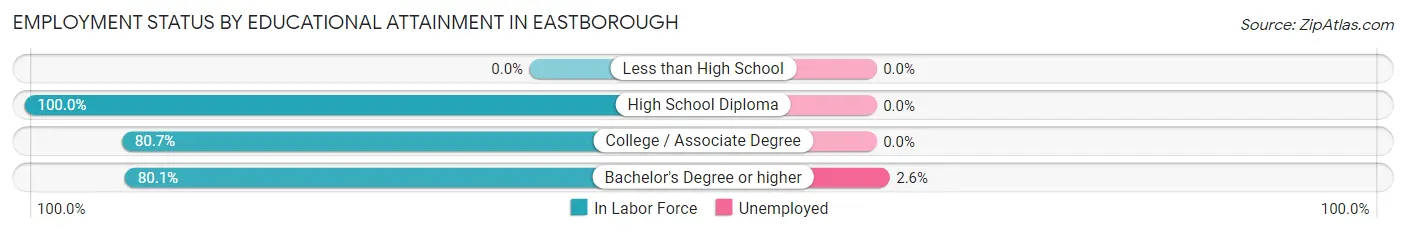
| Educational Attainment | In Labor Force | Unemployed |
| Less than High School | 0 (0.0%) | 0 (0.0%) |
| High School Diploma | 14 (100.0%) | 0 (0.0%) |
| College / Associate Degree | 46 (80.7%) | 0 (0.0%) |
| Bachelor's Degree or higher | 193 (80.1%) | 6 (2.6%) |
| Total | 253 (81.1%) | 6 (2.0%) |
Employment Occupations by Sex in Eastborough
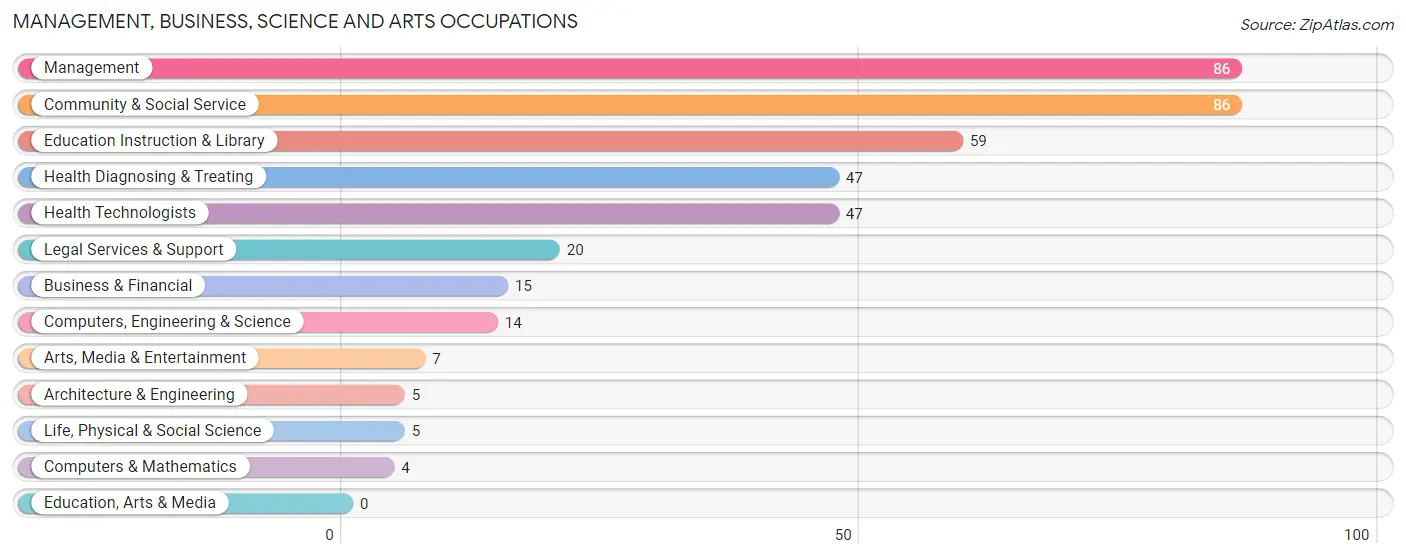
Management, Business, Science and Arts Occupations
The most common Management, Business, Science and Arts occupations in Eastborough are Management (86 | 23.5%), Community & Social Service (86 | 23.5%), Education Instruction & Library (59 | 16.1%), Health Diagnosing & Treating (47 | 12.8%), and Health Technologists (47 | 12.8%).
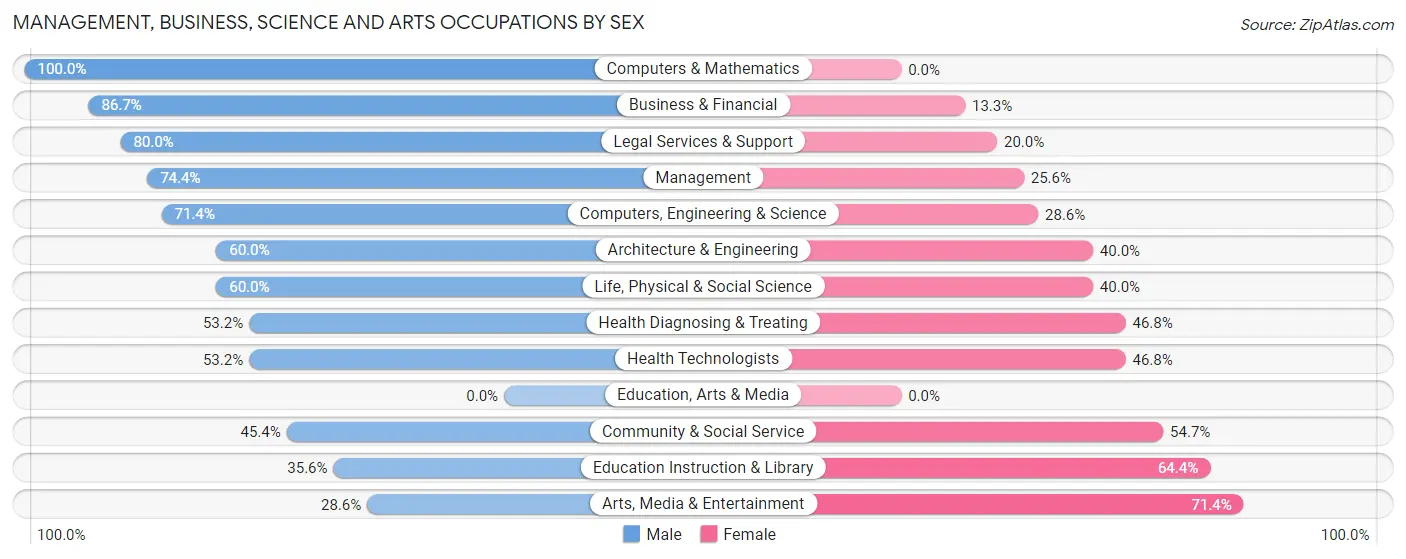
Management, Business, Science and Arts Occupations by Sex
Within the Management, Business, Science and Arts occupations in Eastborough, the most male-oriented occupations are Computers & Mathematics (100.0%), Business & Financial (86.7%), and Legal Services & Support (80.0%), while the most female-oriented occupations are Arts, Media & Entertainment (71.4%), Education Instruction & Library (64.4%), and Community & Social Service (54.6%).
| Occupation | Male | Female |
| Management | 64 (74.4%) | 22 (25.6%) |
| Business & Financial | 13 (86.7%) | 2 (13.3%) |
| Computers, Engineering & Science | 10 (71.4%) | 4 (28.6%) |
| Computers & Mathematics | 4 (100.0%) | 0 (0.0%) |
| Architecture & Engineering | 3 (60.0%) | 2 (40.0%) |
| Life, Physical & Social Science | 3 (60.0%) | 2 (40.0%) |
| Community & Social Service | 39 (45.4%) | 47 (54.6%) |
| Education, Arts & Media | 0 (0.0%) | 0 (0.0%) |
| Legal Services & Support | 16 (80.0%) | 4 (20.0%) |
| Education Instruction & Library | 21 (35.6%) | 38 (64.4%) |
| Arts, Media & Entertainment | 2 (28.6%) | 5 (71.4%) |
| Health Diagnosing & Treating | 25 (53.2%) | 22 (46.8%) |
| Health Technologists | 25 (53.2%) | 22 (46.8%) |
| Total (Category) | 151 (60.9%) | 97 (39.1%) |
| Total (Overall) | 205 (56.0%) | 161 (44.0%) |
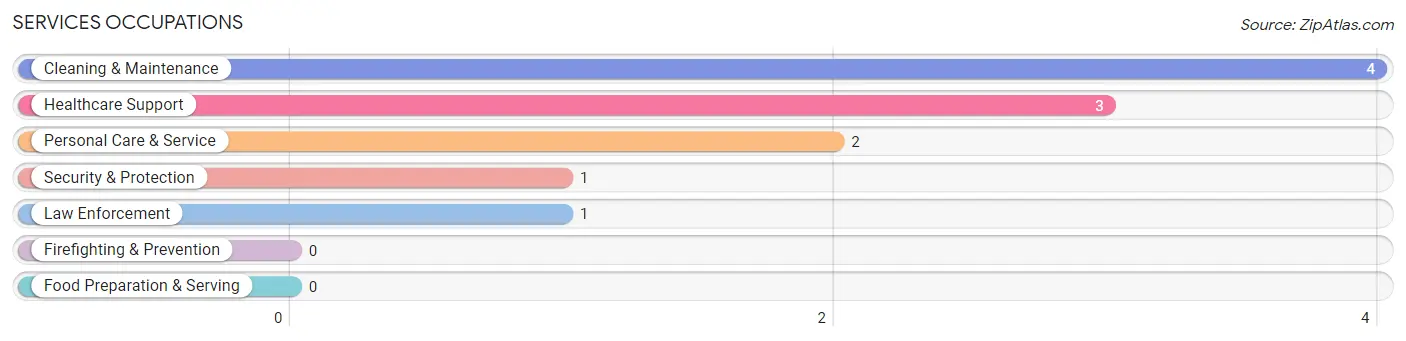
Services Occupations
The most common Services occupations in Eastborough are Cleaning & Maintenance (4 | 1.1%), Healthcare Support (3 | 0.8%), Personal Care & Service (2 | 0.5%), Security & Protection (1 | 0.3%), and Law Enforcement (1 | 0.3%).
Services Occupations by Sex
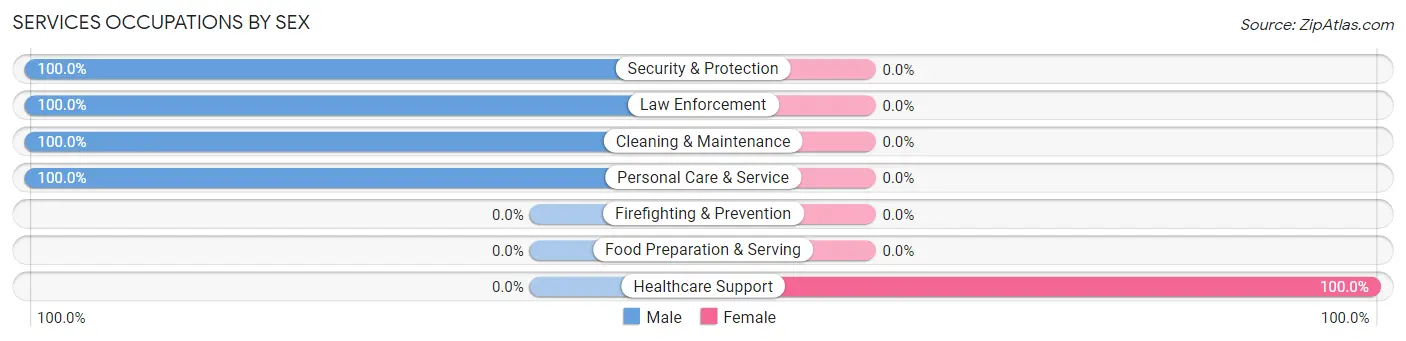
| Occupation | Male | Female |
| Healthcare Support | 0 (0.0%) | 3 (100.0%) |
| Security & Protection | 1 (100.0%) | 0 (0.0%) |
| Firefighting & Prevention | 0 (0.0%) | 0 (0.0%) |
| Law Enforcement | 1 (100.0%) | 0 (0.0%) |
| Food Preparation & Serving | 0 (0.0%) | 0 (0.0%) |
| Cleaning & Maintenance | 4 (100.0%) | 0 (0.0%) |
| Personal Care & Service | 2 (100.0%) | 0 (0.0%) |
| Total (Category) | 7 (70.0%) | 3 (30.0%) |
| Total (Overall) | 205 (56.0%) | 161 (44.0%) |
Sales and Office Occupations
The most common Sales and Office occupations in Eastborough are Sales & Related (52 | 14.2%), and Office & Administration (30 | 8.2%).
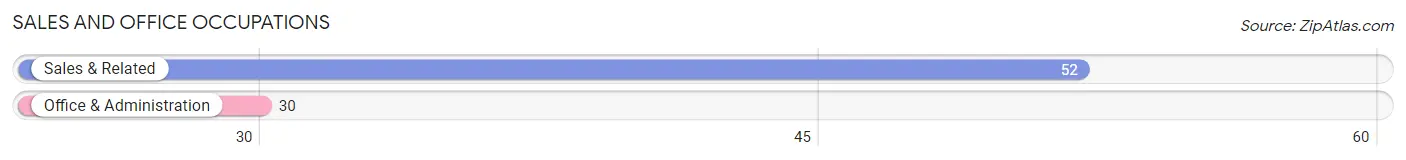
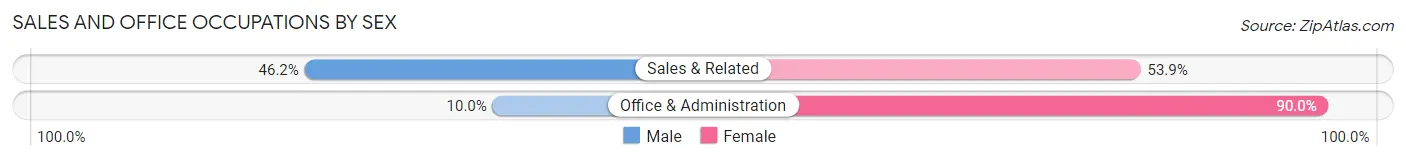
Sales and Office Occupations by Sex
| Occupation | Male | Female |
| Sales & Related | 24 (46.2%) | 28 (53.8%) |
| Office & Administration | 3 (10.0%) | 27 (90.0%) |
| Total (Category) | 27 (32.9%) | 55 (67.1%) |
| Total (Overall) | 205 (56.0%) | 161 (44.0%) |
Natural Resources, Construction and Maintenance Occupations
The most common Natural Resources, Construction and Maintenance occupations in Eastborough are Installation, Maintenance & Repair (8 | 2.2%), and Construction & Extraction (2 | 0.5%).
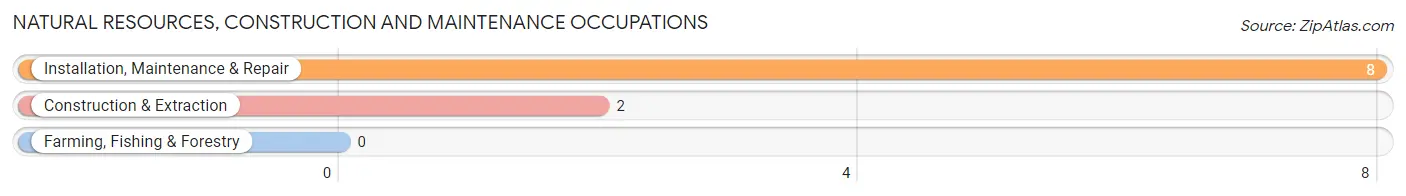
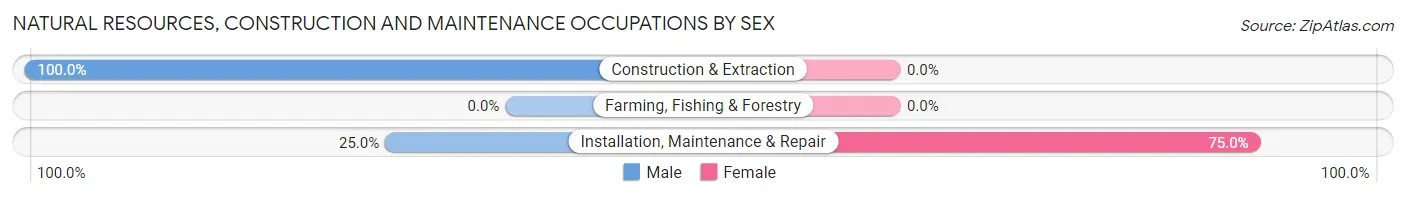
Natural Resources, Construction and Maintenance Occupations by Sex
| Occupation | Male | Female |
| Farming, Fishing & Forestry | 0 (0.0%) | 0 (0.0%) |
| Construction & Extraction | 2 (100.0%) | 0 (0.0%) |
| Installation, Maintenance & Repair | 2 (25.0%) | 6 (75.0%) |
| Total (Category) | 4 (40.0%) | 6 (60.0%) |
| Total (Overall) | 205 (56.0%) | 161 (44.0%) |
Production, Transportation and Moving Occupations
The most common Production, Transportation and Moving occupations in Eastborough are Transportation (9 | 2.5%), and Material Moving (7 | 1.9%).
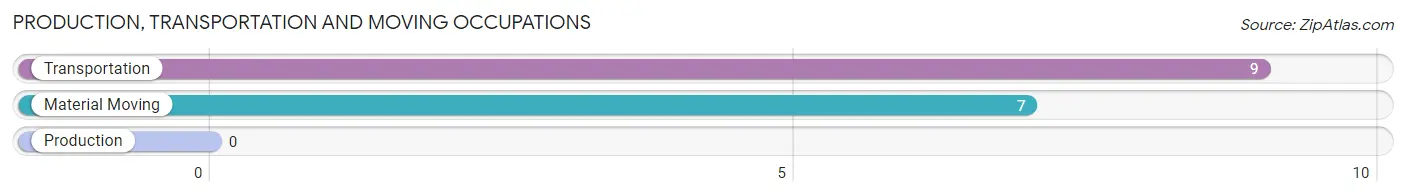
Production, Transportation and Moving Occupations by Sex
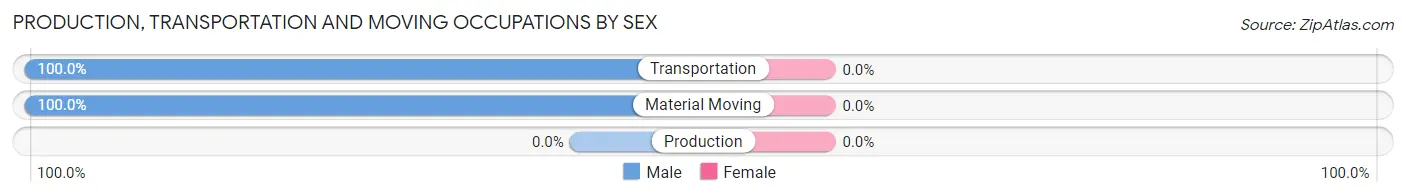
| Occupation | Male | Female |
| Production | 0 (0.0%) | 0 (0.0%) |
| Transportation | 9 (100.0%) | 0 (0.0%) |
| Material Moving | 7 (100.0%) | 0 (0.0%) |
| Total (Category) | 16 (100.0%) | 0 (0.0%) |
| Total (Overall) | 205 (56.0%) | 161 (44.0%) |
Employment Industries by Sex in Eastborough
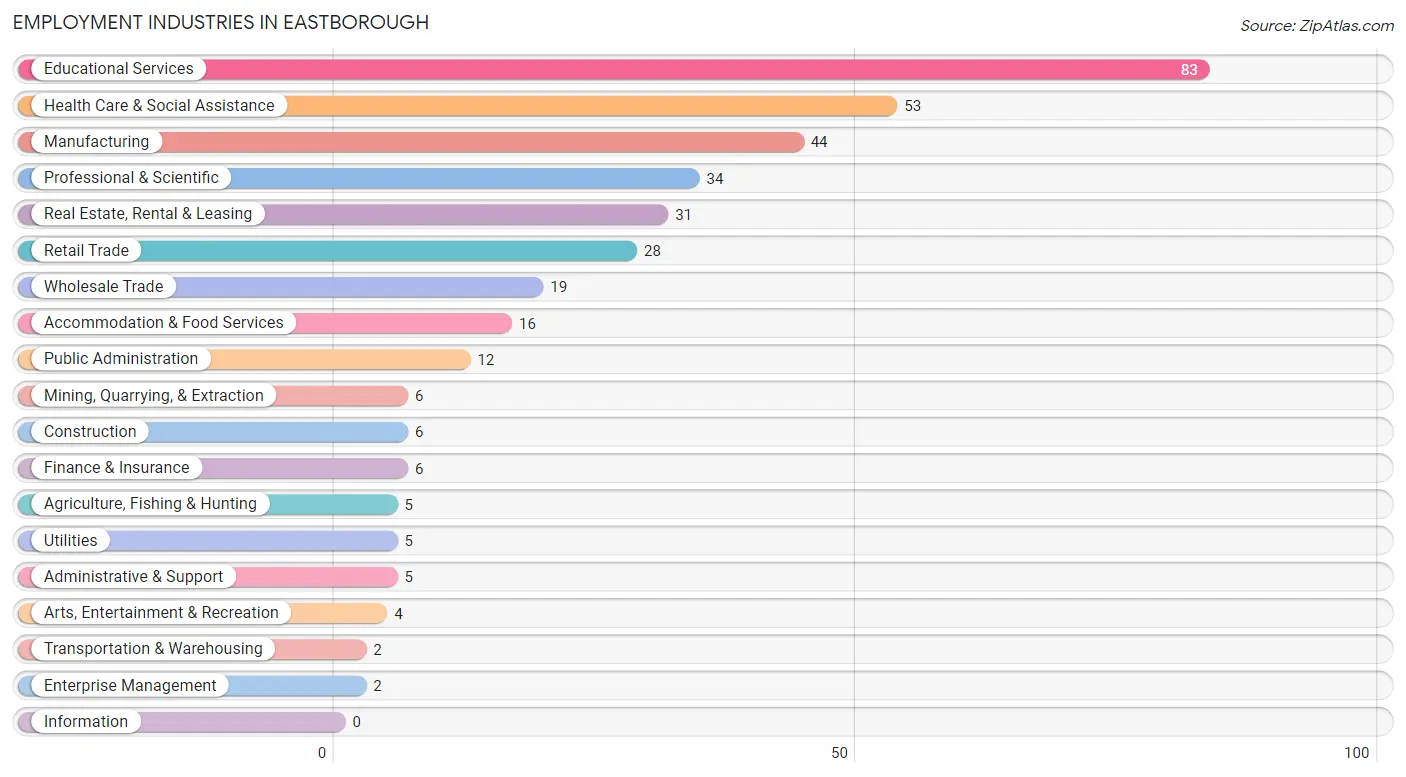
Employment Industries in Eastborough
The major employment industries in Eastborough include Educational Services (83 | 22.7%), Health Care & Social Assistance (53 | 14.5%), Manufacturing (44 | 12.0%), Professional & Scientific (34 | 9.3%), and Real Estate, Rental & Leasing (31 | 8.5%).
Employment Industries by Sex in Eastborough
The Eastborough industries that see more men than women are Agriculture, Fishing & Hunting (100.0%), Mining, Quarrying, & Extraction (100.0%), and Wholesale Trade (100.0%), whereas the industries that tend to have a higher number of women are Retail Trade (85.7%), Educational Services (60.2%), and Professional & Scientific (58.8%).
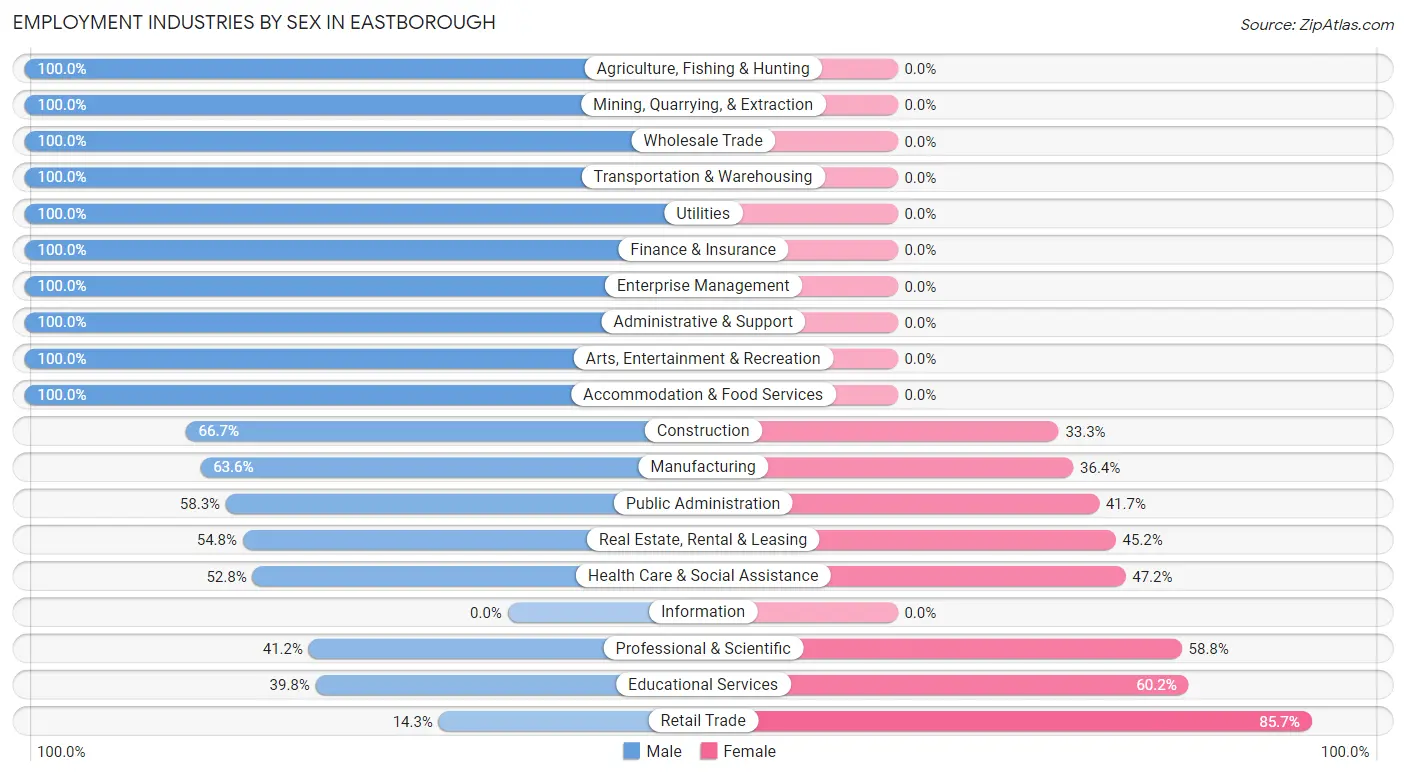
| Industry | Male | Female |
| Agriculture, Fishing & Hunting | 5 (100.0%) | 0 (0.0%) |
| Mining, Quarrying, & Extraction | 6 (100.0%) | 0 (0.0%) |
| Construction | 4 (66.7%) | 2 (33.3%) |
| Manufacturing | 28 (63.6%) | 16 (36.4%) |
| Wholesale Trade | 19 (100.0%) | 0 (0.0%) |
| Retail Trade | 4 (14.3%) | 24 (85.7%) |
| Transportation & Warehousing | 2 (100.0%) | 0 (0.0%) |
| Utilities | 5 (100.0%) | 0 (0.0%) |
| Information | 0 (0.0%) | 0 (0.0%) |
| Finance & Insurance | 6 (100.0%) | 0 (0.0%) |
| Real Estate, Rental & Leasing | 17 (54.8%) | 14 (45.2%) |
| Professional & Scientific | 14 (41.2%) | 20 (58.8%) |
| Enterprise Management | 2 (100.0%) | 0 (0.0%) |
| Administrative & Support | 5 (100.0%) | 0 (0.0%) |
| Educational Services | 33 (39.8%) | 50 (60.2%) |
| Health Care & Social Assistance | 28 (52.8%) | 25 (47.2%) |
| Arts, Entertainment & Recreation | 4 (100.0%) | 0 (0.0%) |
| Accommodation & Food Services | 16 (100.0%) | 0 (0.0%) |
| Public Administration | 7 (58.3%) | 5 (41.7%) |
| Total | 205 (56.0%) | 161 (44.0%) |
Education in Eastborough
School Enrollment in Eastborough
The most common levels of schooling among the 161 students in Eastborough are high school (57 | 35.4%), elementary school (44 | 27.3%), and middle school (39 | 24.2%).
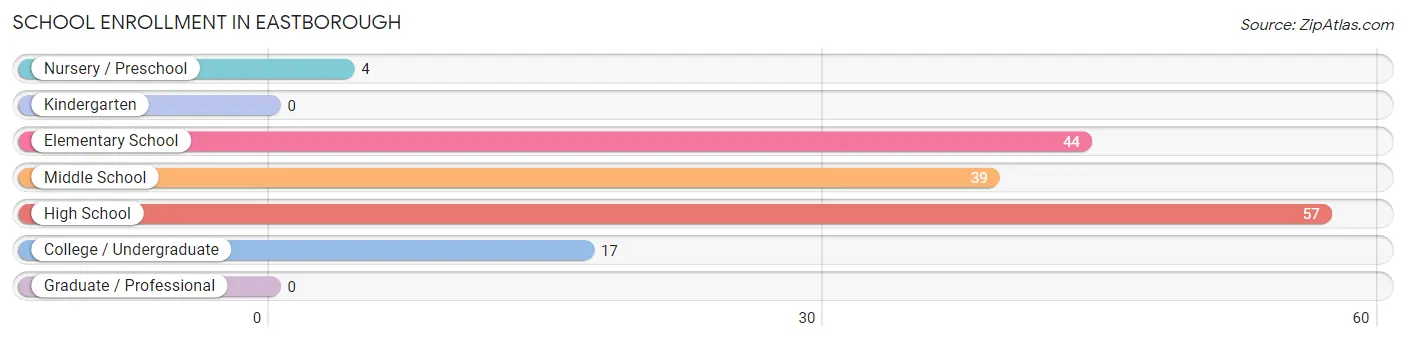
| School Level | # Students | % Students |
| Nursery / Preschool | 4 | 2.5% |
| Kindergarten | 0 | 0.0% |
| Elementary School | 44 | 27.3% |
| Middle School | 39 | 24.2% |
| High School | 57 | 35.4% |
| College / Undergraduate | 17 | 10.6% |
| Graduate / Professional | 0 | 0.0% |
| Total | 161 | 100.0% |
School Enrollment by Age by Funding Source in Eastborough
Out of a total of 161 students who are enrolled in schools in Eastborough, 95 (59.0%) attend a private institution, while the remaining 66 (41.0%) are enrolled in public schools. The age group of 3 to 4 year olds has the highest likelihood of being enrolled in private schools, with 4 (100.0% in the age bracket) enrolled. Conversely, the age group of 18 to 19 year olds has the lowest likelihood of being enrolled in a private school, with 3 (100.0% in the age bracket) attending a public institution.
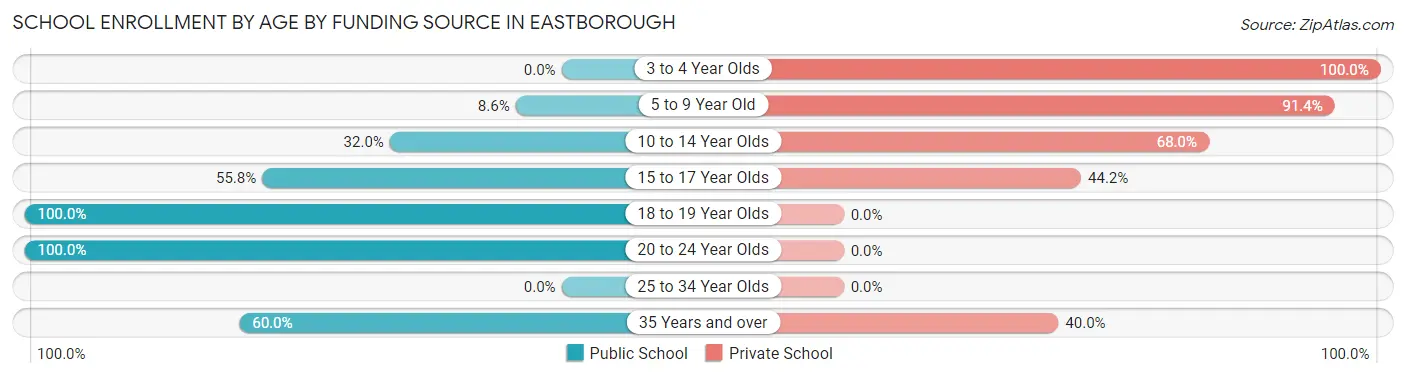
| Age Bracket | Public School | Private School |
| 3 to 4 Year Olds | 0 (0.0%) | 4 (100.0%) |
| 5 to 9 Year Old | 3 (8.6%) | 32 (91.4%) |
| 10 to 14 Year Olds | 16 (32.0%) | 34 (68.0%) |
| 15 to 17 Year Olds | 29 (55.8%) | 23 (44.2%) |
| 18 to 19 Year Olds | 3 (100.0%) | 0 (0.0%) |
| 20 to 24 Year Olds | 12 (100.0%) | 0 (0.0%) |
| 25 to 34 Year Olds | 0 (0.0%) | 0 (0.0%) |
| 35 Years and over | 3 (60.0%) | 2 (40.0%) |
| Total | 66 (41.0%) | 95 (59.0%) |
Educational Attainment by Field of Study in Eastborough
Business (123 | 26.1%), education (69 | 14.6%), science & technology (42 | 8.9%), social sciences (40 | 8.5%), and bio, nature & agricultural (34 | 7.2%) are the most common fields of study among 472 individuals in Eastborough who have obtained a bachelor's degree or higher.
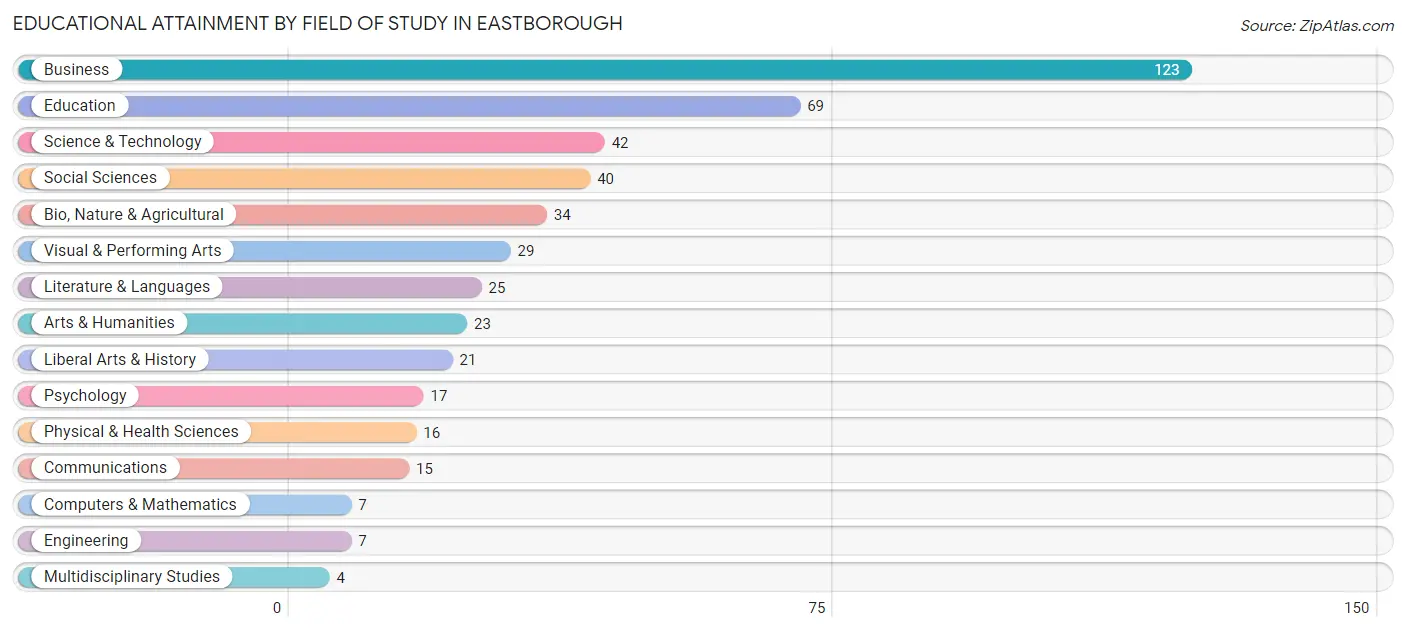
| Field of Study | # Graduates | % Graduates |
| Computers & Mathematics | 7 | 1.5% |
| Bio, Nature & Agricultural | 34 | 7.2% |
| Physical & Health Sciences | 16 | 3.4% |
| Psychology | 17 | 3.6% |
| Social Sciences | 40 | 8.5% |
| Engineering | 7 | 1.5% |
| Multidisciplinary Studies | 4 | 0.9% |
| Science & Technology | 42 | 8.9% |
| Business | 123 | 26.1% |
| Education | 69 | 14.6% |
| Literature & Languages | 25 | 5.3% |
| Liberal Arts & History | 21 | 4.4% |
| Visual & Performing Arts | 29 | 6.1% |
| Communications | 15 | 3.2% |
| Arts & Humanities | 23 | 4.9% |
| Total | 472 | 100.0% |
Transportation & Commute in Eastborough
Vehicle Availability by Sex in Eastborough
The most prevalent vehicle ownership categories in Eastborough are males with 2 vehicles (87, accounting for 42.9%) and females with 2 vehicles (82, making up 54.0%).
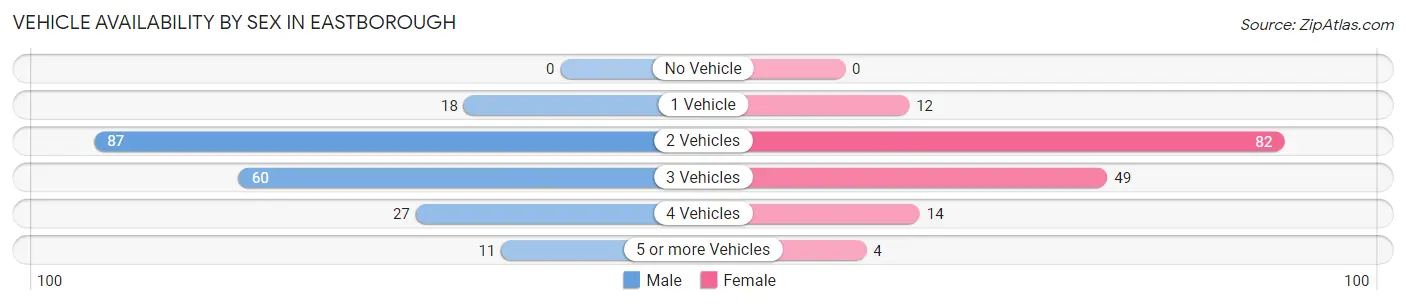
| Vehicles Available | Male | Female |
| No Vehicle | 0 (0.0%) | 0 (0.0%) |
| 1 Vehicle | 18 (8.9%) | 12 (7.4%) |
| 2 Vehicles | 87 (42.9%) | 82 (50.9%) |
| 3 Vehicles | 60 (29.6%) | 49 (30.4%) |
| 4 Vehicles | 27 (13.3%) | 14 (8.7%) |
| 5 or more Vehicles | 11 (5.4%) | 4 (2.5%) |
| Total | 203 (100.0%) | 161 (100.0%) |
Commute Time in Eastborough
The most frequently occuring commute durations in Eastborough are 10 to 14 minutes (99 commuters, 34.0%), 15 to 19 minutes (58 commuters, 19.9%), and 5 to 9 minutes (46 commuters, 15.8%).
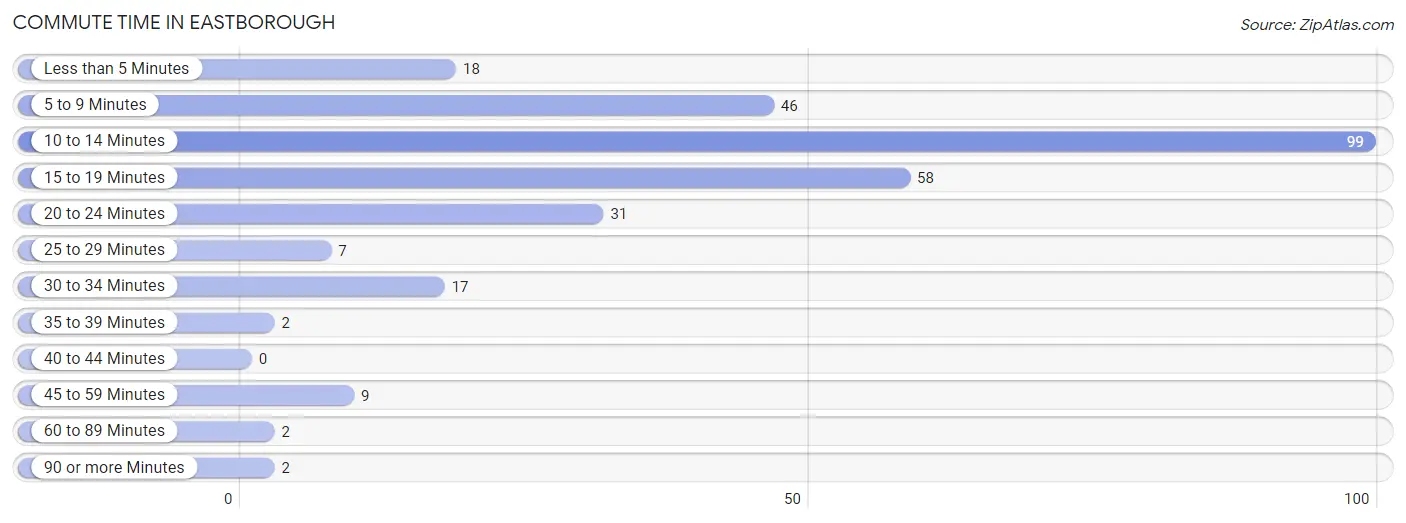
| Commute Time | # Commuters | % Commuters |
| Less than 5 Minutes | 18 | 6.2% |
| 5 to 9 Minutes | 46 | 15.8% |
| 10 to 14 Minutes | 99 | 34.0% |
| 15 to 19 Minutes | 58 | 19.9% |
| 20 to 24 Minutes | 31 | 10.6% |
| 25 to 29 Minutes | 7 | 2.4% |
| 30 to 34 Minutes | 17 | 5.8% |
| 35 to 39 Minutes | 2 | 0.7% |
| 40 to 44 Minutes | 0 | 0.0% |
| 45 to 59 Minutes | 9 | 3.1% |
| 60 to 89 Minutes | 2 | 0.7% |
| 90 or more Minutes | 2 | 0.7% |
Commute Time by Sex in Eastborough
The most common commute times in Eastborough are 10 to 14 minutes (55 commuters, 30.2%) for males and 10 to 14 minutes (44 commuters, 40.4%) for females.
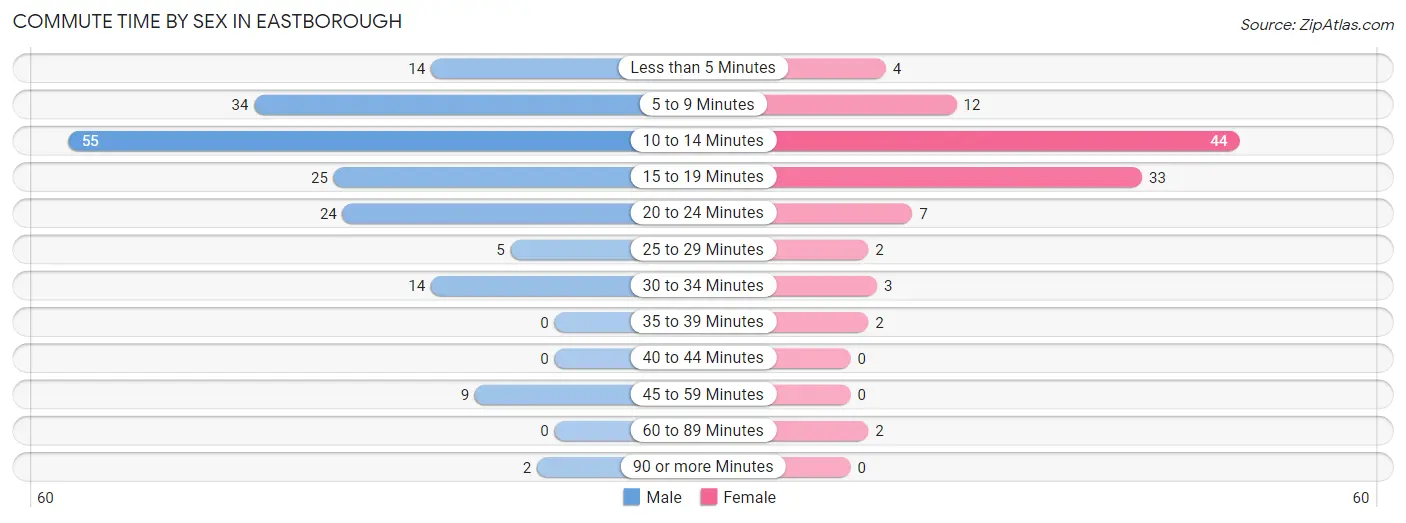
| Commute Time | Male | Female |
| Less than 5 Minutes | 14 (7.7%) | 4 (3.7%) |
| 5 to 9 Minutes | 34 (18.7%) | 12 (11.0%) |
| 10 to 14 Minutes | 55 (30.2%) | 44 (40.4%) |
| 15 to 19 Minutes | 25 (13.7%) | 33 (30.3%) |
| 20 to 24 Minutes | 24 (13.2%) | 7 (6.4%) |
| 25 to 29 Minutes | 5 (2.8%) | 2 (1.8%) |
| 30 to 34 Minutes | 14 (7.7%) | 3 (2.8%) |
| 35 to 39 Minutes | 0 (0.0%) | 2 (1.8%) |
| 40 to 44 Minutes | 0 (0.0%) | 0 (0.0%) |
| 45 to 59 Minutes | 9 (5.0%) | 0 (0.0%) |
| 60 to 89 Minutes | 0 (0.0%) | 2 (1.8%) |
| 90 or more Minutes | 2 (1.1%) | 0 (0.0%) |
Time of Departure to Work by Sex in Eastborough
The most frequent times of departure to work in Eastborough are 8:00 AM to 8:29 AM (34, 18.7%) for males and 8:00 AM to 8:29 AM (23, 21.1%) for females.
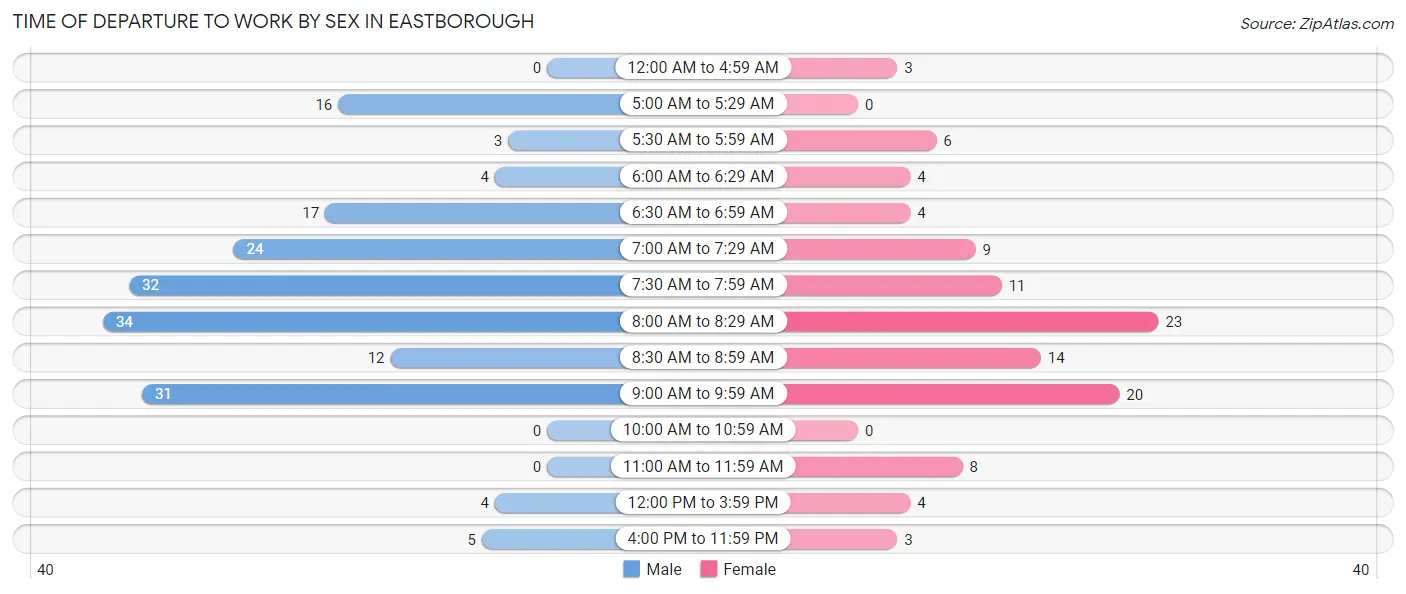
| Time of Departure | Male | Female |
| 12:00 AM to 4:59 AM | 0 (0.0%) | 3 (2.8%) |
| 5:00 AM to 5:29 AM | 16 (8.8%) | 0 (0.0%) |
| 5:30 AM to 5:59 AM | 3 (1.7%) | 6 (5.5%) |
| 6:00 AM to 6:29 AM | 4 (2.2%) | 4 (3.7%) |
| 6:30 AM to 6:59 AM | 17 (9.3%) | 4 (3.7%) |
| 7:00 AM to 7:29 AM | 24 (13.2%) | 9 (8.3%) |
| 7:30 AM to 7:59 AM | 32 (17.6%) | 11 (10.1%) |
| 8:00 AM to 8:29 AM | 34 (18.7%) | 23 (21.1%) |
| 8:30 AM to 8:59 AM | 12 (6.6%) | 14 (12.8%) |
| 9:00 AM to 9:59 AM | 31 (17.0%) | 20 (18.3%) |
| 10:00 AM to 10:59 AM | 0 (0.0%) | 0 (0.0%) |
| 11:00 AM to 11:59 AM | 0 (0.0%) | 8 (7.3%) |
| 12:00 PM to 3:59 PM | 4 (2.2%) | 4 (3.7%) |
| 4:00 PM to 11:59 PM | 5 (2.8%) | 3 (2.8%) |
| Total | 182 (100.0%) | 109 (100.0%) |
Housing Occupancy in Eastborough
Occupancy by Ownership in Eastborough
Of the total 315 dwellings in Eastborough, owner-occupied units account for 300 (95.2%), while renter-occupied units make up 15 (4.8%).
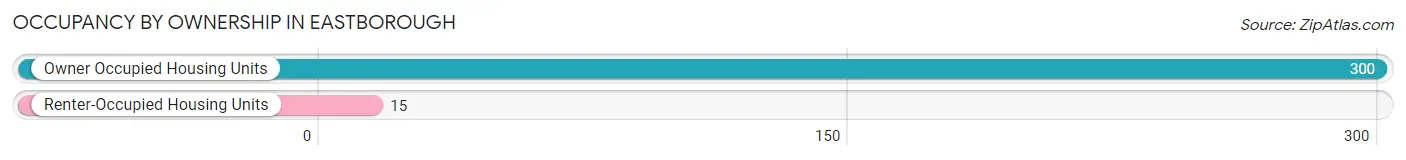
| Occupancy | # Housing Units | % Housing Units |
| Owner Occupied Housing Units | 300 | 95.2% |
| Renter-Occupied Housing Units | 15 | 4.8% |
| Total Occupied Housing Units | 315 | 100.0% |
Occupancy by Household Size in Eastborough
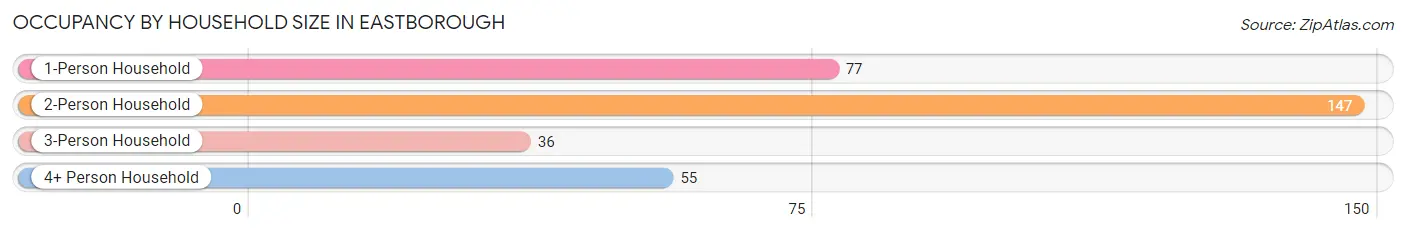
| Household Size | # Housing Units | % Housing Units |
| 1-Person Household | 77 | 24.4% |
| 2-Person Household | 147 | 46.7% |
| 3-Person Household | 36 | 11.4% |
| 4+ Person Household | 55 | 17.5% |
| Total Housing Units | 315 | 100.0% |
Occupancy by Ownership by Household Size in Eastborough
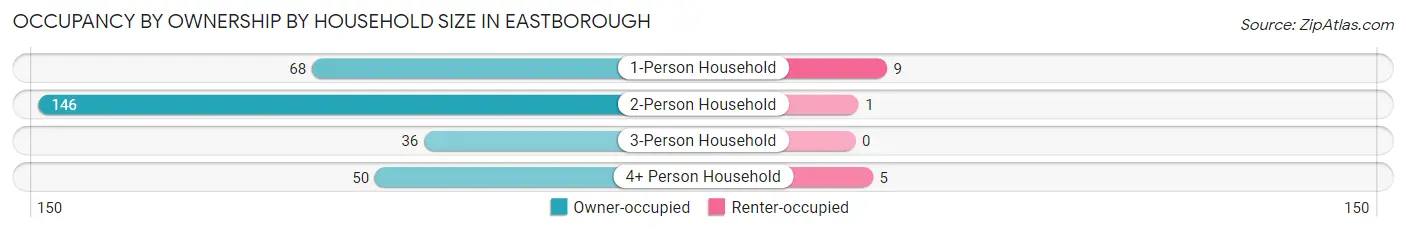
| Household Size | Owner-occupied | Renter-occupied |
| 1-Person Household | 68 (88.3%) | 9 (11.7%) |
| 2-Person Household | 146 (99.3%) | 1 (0.7%) |
| 3-Person Household | 36 (100.0%) | 0 (0.0%) |
| 4+ Person Household | 50 (90.9%) | 5 (9.1%) |
| Total Housing Units | 300 (95.2%) | 15 (4.8%) |
Occupancy by Educational Attainment in Eastborough
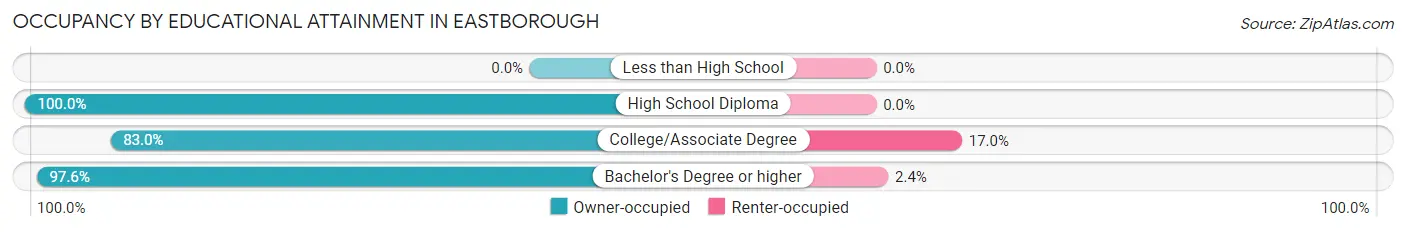
| Household Size | Owner-occupied | Renter-occupied |
| Less than High School | 0 (0.0%) | 0 (0.0%) |
| High School Diploma | 8 (100.0%) | 0 (0.0%) |
| College/Associate Degree | 44 (83.0%) | 9 (17.0%) |
| Bachelor's Degree or higher | 248 (97.6%) | 6 (2.4%) |
Occupancy by Age of Householder in Eastborough
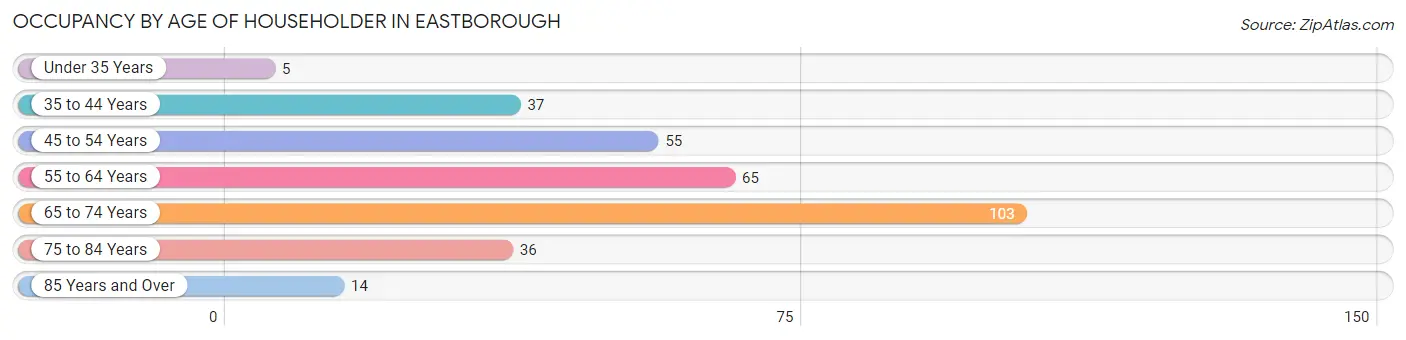
| Age Bracket | # Households | % Households |
| Under 35 Years | 5 | 1.6% |
| 35 to 44 Years | 37 | 11.7% |
| 45 to 54 Years | 55 | 17.5% |
| 55 to 64 Years | 65 | 20.6% |
| 65 to 74 Years | 103 | 32.7% |
| 75 to 84 Years | 36 | 11.4% |
| 85 Years and Over | 14 | 4.4% |
| Total | 315 | 100.0% |
Housing Finances in Eastborough
Median Income by Occupancy in Eastborough
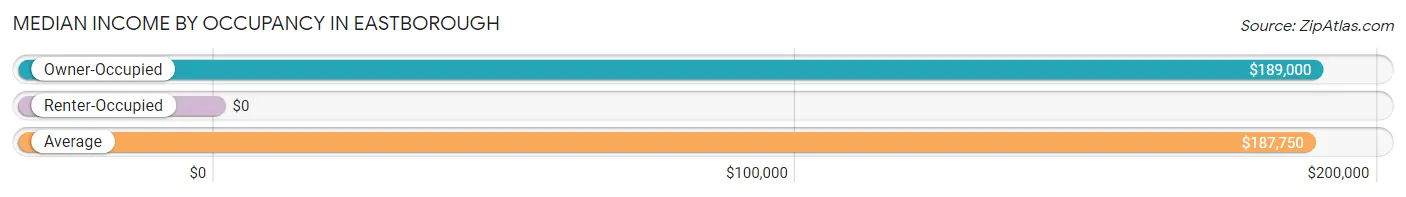
| Occupancy Type | # Households | Median Income |
| Owner-Occupied | 300 (95.2%) | $189,000 |
| Renter-Occupied | 15 (4.8%) | $0 |
| Average | 315 (100.0%) | $187,750 |
Occupancy by Householder Income Bracket in Eastborough
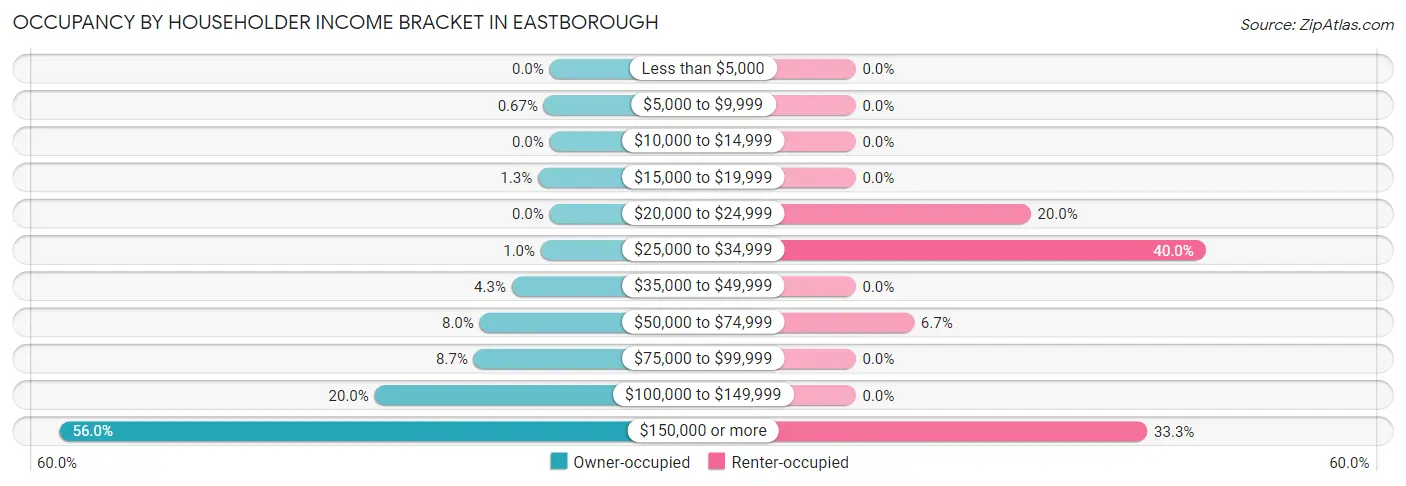
| Income Bracket | Owner-occupied | Renter-occupied |
| Less than $5,000 | 0 (0.0%) | 0 (0.0%) |
| $5,000 to $9,999 | 2 (0.7%) | 0 (0.0%) |
| $10,000 to $14,999 | 0 (0.0%) | 0 (0.0%) |
| $15,000 to $19,999 | 4 (1.3%) | 0 (0.0%) |
| $20,000 to $24,999 | 0 (0.0%) | 3 (20.0%) |
| $25,000 to $34,999 | 3 (1.0%) | 6 (40.0%) |
| $35,000 to $49,999 | 13 (4.3%) | 0 (0.0%) |
| $50,000 to $74,999 | 24 (8.0%) | 1 (6.7%) |
| $75,000 to $99,999 | 26 (8.7%) | 0 (0.0%) |
| $100,000 to $149,999 | 60 (20.0%) | 0 (0.0%) |
| $150,000 or more | 168 (56.0%) | 5 (33.3%) |
| Total | 300 (100.0%) | 15 (100.0%) |
Monthly Housing Cost Tiers in Eastborough
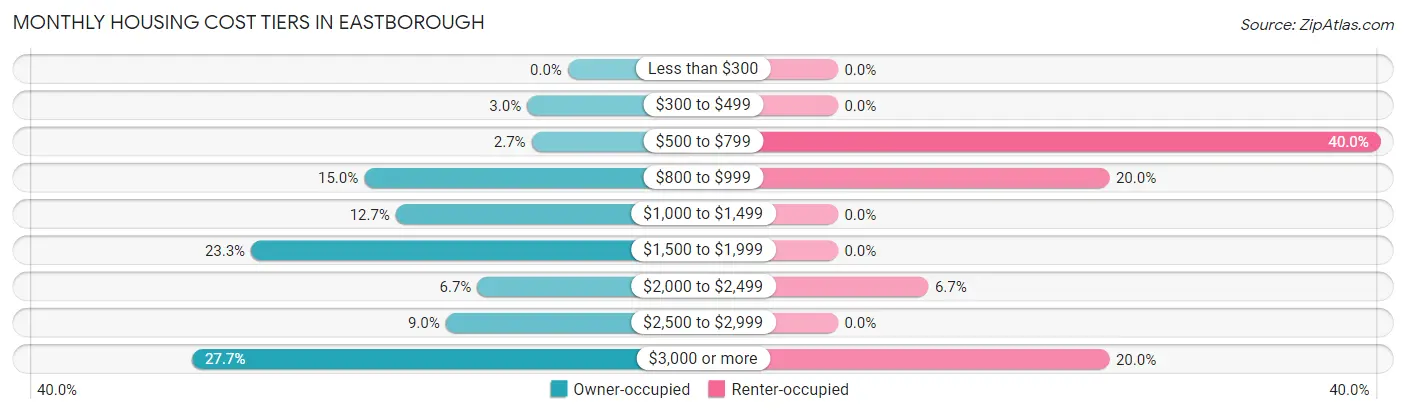
| Monthly Cost | Owner-occupied | Renter-occupied |
| Less than $300 | 0 (0.0%) | 0 (0.0%) |
| $300 to $499 | 9 (3.0%) | 0 (0.0%) |
| $500 to $799 | 8 (2.7%) | 6 (40.0%) |
| $800 to $999 | 45 (15.0%) | 3 (20.0%) |
| $1,000 to $1,499 | 38 (12.7%) | 0 (0.0%) |
| $1,500 to $1,999 | 70 (23.3%) | 0 (0.0%) |
| $2,000 to $2,499 | 20 (6.7%) | 1 (6.7%) |
| $2,500 to $2,999 | 27 (9.0%) | 0 (0.0%) |
| $3,000 or more | 83 (27.7%) | 3 (20.0%) |
| Total | 300 (100.0%) | 15 (100.0%) |
Physical Housing Characteristics in Eastborough
Housing Structures in Eastborough
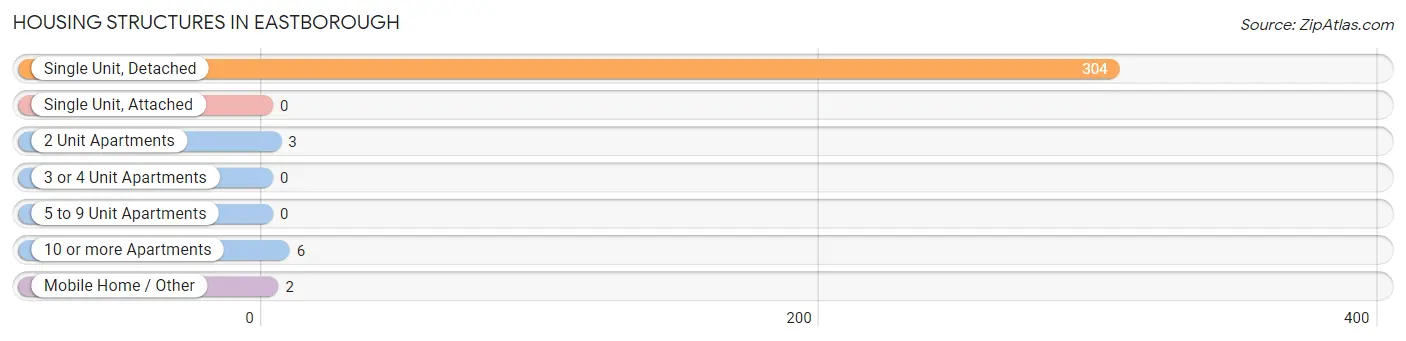
| Structure Type | # Housing Units | % Housing Units |
| Single Unit, Detached | 304 | 96.5% |
| Single Unit, Attached | 0 | 0.0% |
| 2 Unit Apartments | 3 | 0.9% |
| 3 or 4 Unit Apartments | 0 | 0.0% |
| 5 to 9 Unit Apartments | 0 | 0.0% |
| 10 or more Apartments | 6 | 1.9% |
| Mobile Home / Other | 2 | 0.6% |
| Total | 315 | 100.0% |
Housing Structures by Occupancy in Eastborough
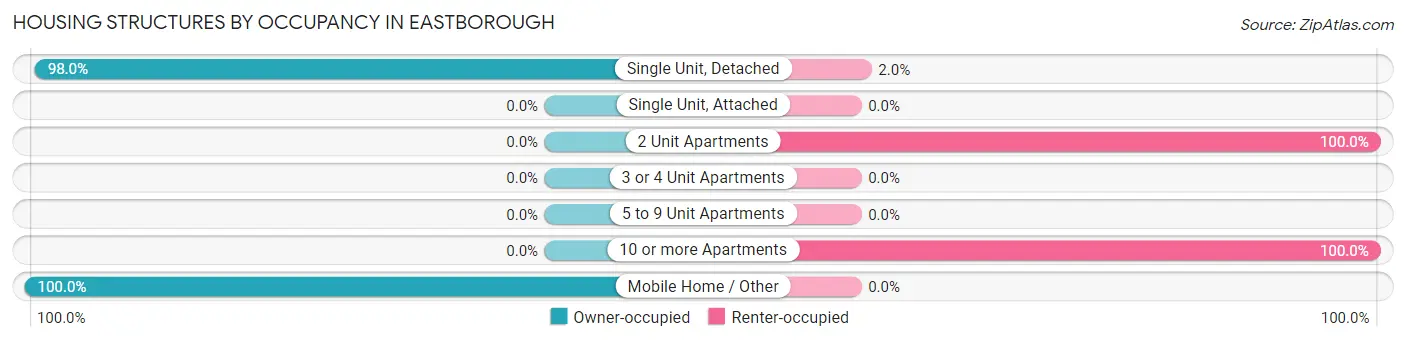
| Structure Type | Owner-occupied | Renter-occupied |
| Single Unit, Detached | 298 (98.0%) | 6 (2.0%) |
| Single Unit, Attached | 0 (0.0%) | 0 (0.0%) |
| 2 Unit Apartments | 0 (0.0%) | 3 (100.0%) |
| 3 or 4 Unit Apartments | 0 (0.0%) | 0 (0.0%) |
| 5 to 9 Unit Apartments | 0 (0.0%) | 0 (0.0%) |
| 10 or more Apartments | 0 (0.0%) | 6 (100.0%) |
| Mobile Home / Other | 2 (100.0%) | 0 (0.0%) |
| Total | 300 (95.2%) | 15 (4.8%) |
Housing Structures by Number of Rooms in Eastborough
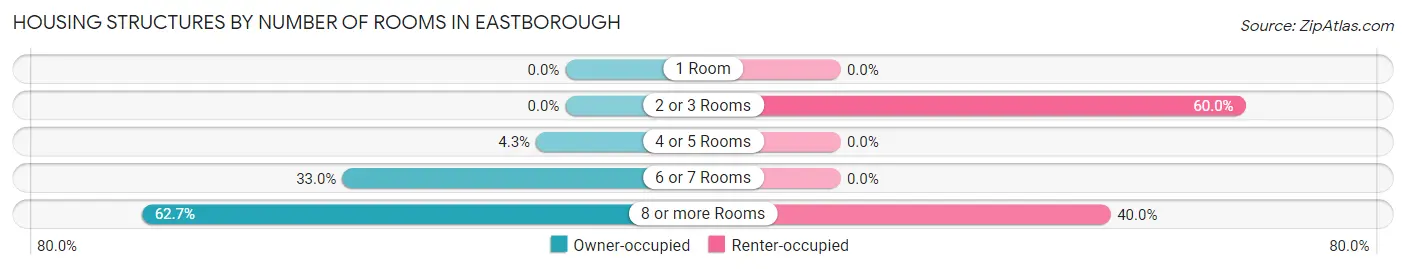
| Number of Rooms | Owner-occupied | Renter-occupied |
| 1 Room | 0 (0.0%) | 0 (0.0%) |
| 2 or 3 Rooms | 0 (0.0%) | 9 (60.0%) |
| 4 or 5 Rooms | 13 (4.3%) | 0 (0.0%) |
| 6 or 7 Rooms | 99 (33.0%) | 0 (0.0%) |
| 8 or more Rooms | 188 (62.7%) | 6 (40.0%) |
| Total | 300 (100.0%) | 15 (100.0%) |
Housing Structure by Heating Type in Eastborough
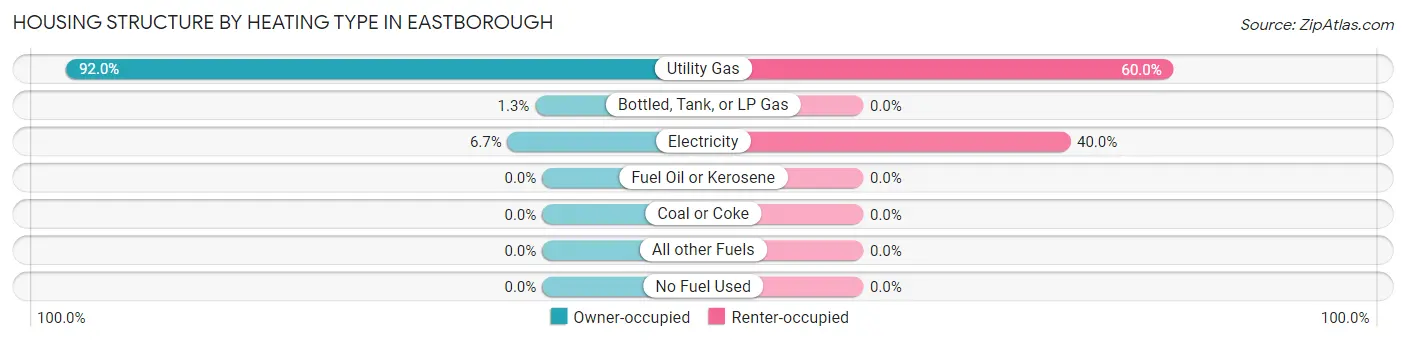
| Heating Type | Owner-occupied | Renter-occupied |
| Utility Gas | 276 (92.0%) | 9 (60.0%) |
| Bottled, Tank, or LP Gas | 4 (1.3%) | 0 (0.0%) |
| Electricity | 20 (6.7%) | 6 (40.0%) |
| Fuel Oil or Kerosene | 0 (0.0%) | 0 (0.0%) |
| Coal or Coke | 0 (0.0%) | 0 (0.0%) |
| All other Fuels | 0 (0.0%) | 0 (0.0%) |
| No Fuel Used | 0 (0.0%) | 0 (0.0%) |
| Total | 300 (100.0%) | 15 (100.0%) |
Household Vehicle Usage in Eastborough
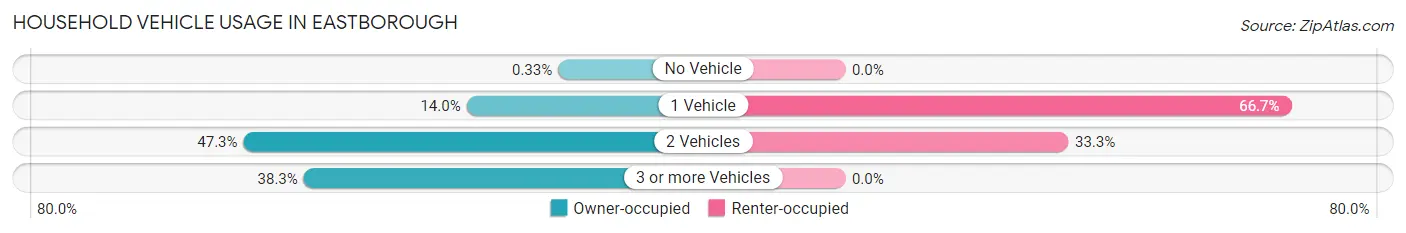
| Vehicles per Household | Owner-occupied | Renter-occupied |
| No Vehicle | 1 (0.3%) | 0 (0.0%) |
| 1 Vehicle | 42 (14.0%) | 10 (66.7%) |
| 2 Vehicles | 142 (47.3%) | 5 (33.3%) |
| 3 or more Vehicles | 115 (38.3%) | 0 (0.0%) |
| Total | 300 (100.0%) | 15 (100.0%) |
Real Estate & Mortgages in Eastborough
Real Estate and Mortgage Overview in Eastborough
| Characteristic | Without Mortgage | With Mortgage |
| Housing Units | 123 | 177 |
| Median Property Value | $382,700 | $442,700 |
| Median Household Income | $114,063 | $117 |
| Monthly Housing Costs | $998 | $83 |
| Real Estate Taxes | $5,335 | $0 |
Property Value by Mortgage Status in Eastborough
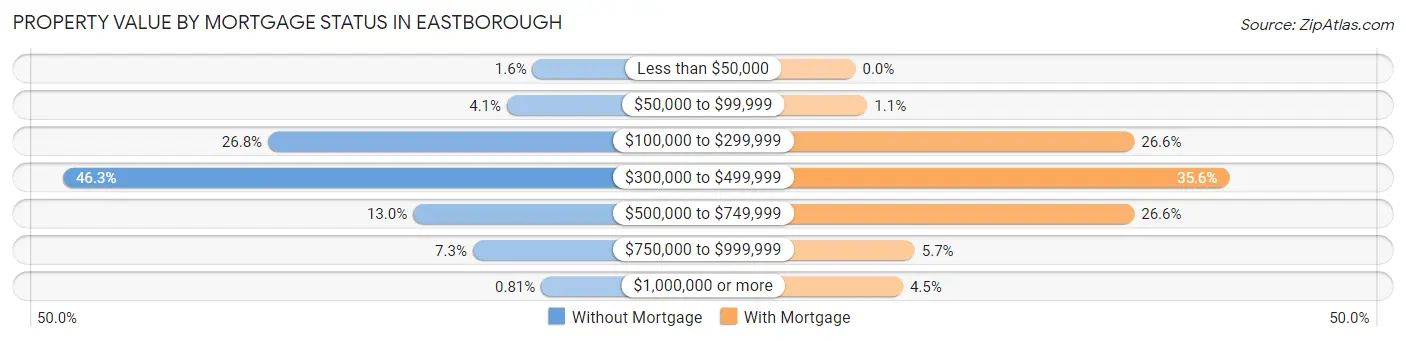
| Property Value | Without Mortgage | With Mortgage |
| Less than $50,000 | 2 (1.6%) | 0 (0.0%) |
| $50,000 to $99,999 | 5 (4.1%) | 2 (1.1%) |
| $100,000 to $299,999 | 33 (26.8%) | 47 (26.6%) |
| $300,000 to $499,999 | 57 (46.3%) | 63 (35.6%) |
| $500,000 to $749,999 | 16 (13.0%) | 47 (26.6%) |
| $750,000 to $999,999 | 9 (7.3%) | 10 (5.7%) |
| $1,000,000 or more | 1 (0.8%) | 8 (4.5%) |
| Total | 123 (100.0%) | 177 (100.0%) |
Household Income by Mortgage Status in Eastborough
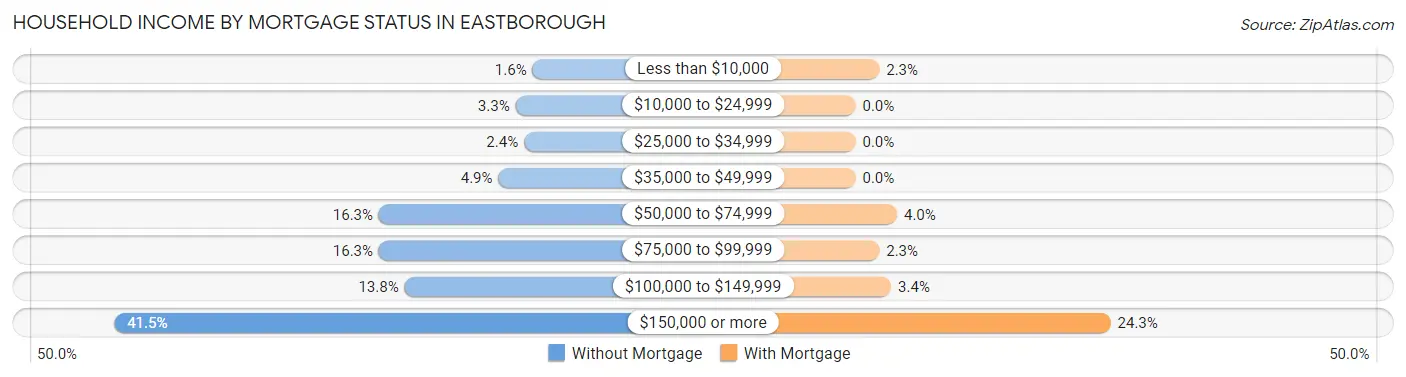
| Household Income | Without Mortgage | With Mortgage |
| Less than $10,000 | 2 (1.6%) | 4 (2.3%) |
| $10,000 to $24,999 | 4 (3.3%) | 0 (0.0%) |
| $25,000 to $34,999 | 3 (2.4%) | 0 (0.0%) |
| $35,000 to $49,999 | 6 (4.9%) | 0 (0.0%) |
| $50,000 to $74,999 | 20 (16.3%) | 7 (4.0%) |
| $75,000 to $99,999 | 20 (16.3%) | 4 (2.3%) |
| $100,000 to $149,999 | 17 (13.8%) | 6 (3.4%) |
| $150,000 or more | 51 (41.5%) | 43 (24.3%) |
| Total | 123 (100.0%) | 177 (100.0%) |
Property Value to Household Income Ratio in Eastborough
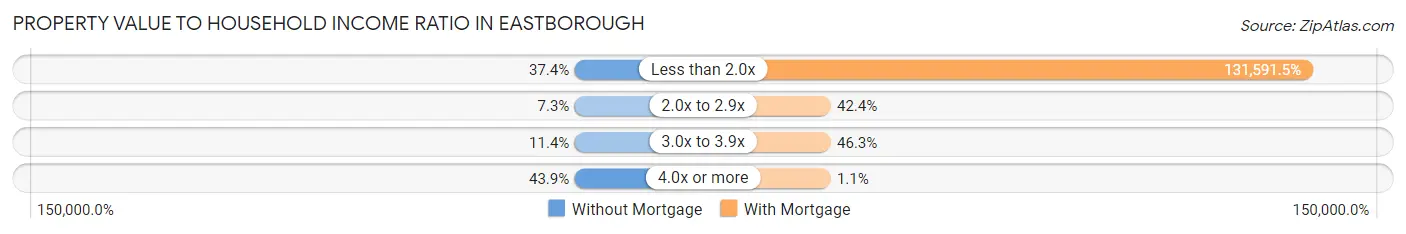
| Value-to-Income Ratio | Without Mortgage | With Mortgage |
| Less than 2.0x | 46 (37.4%) | 232,917 (131,591.5%) |
| 2.0x to 2.9x | 9 (7.3%) | 75 (42.4%) |
| 3.0x to 3.9x | 14 (11.4%) | 82 (46.3%) |
| 4.0x or more | 54 (43.9%) | 2 (1.1%) |
| Total | 123 (100.0%) | 177 (100.0%) |
Real Estate Taxes by Mortgage Status in Eastborough
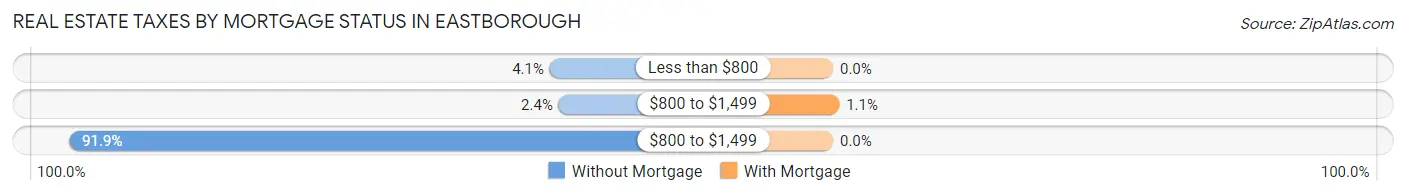
| Property Taxes | Without Mortgage | With Mortgage |
| Less than $800 | 5 (4.1%) | 0 (0.0%) |
| $800 to $1,499 | 3 (2.4%) | 2 (1.1%) |
| $800 to $1,499 | 113 (91.9%) | 0 (0.0%) |
| Total | 123 (100.0%) | 177 (100.0%) |
Health & Disability in Eastborough
Health Insurance Coverage by Age in Eastborough
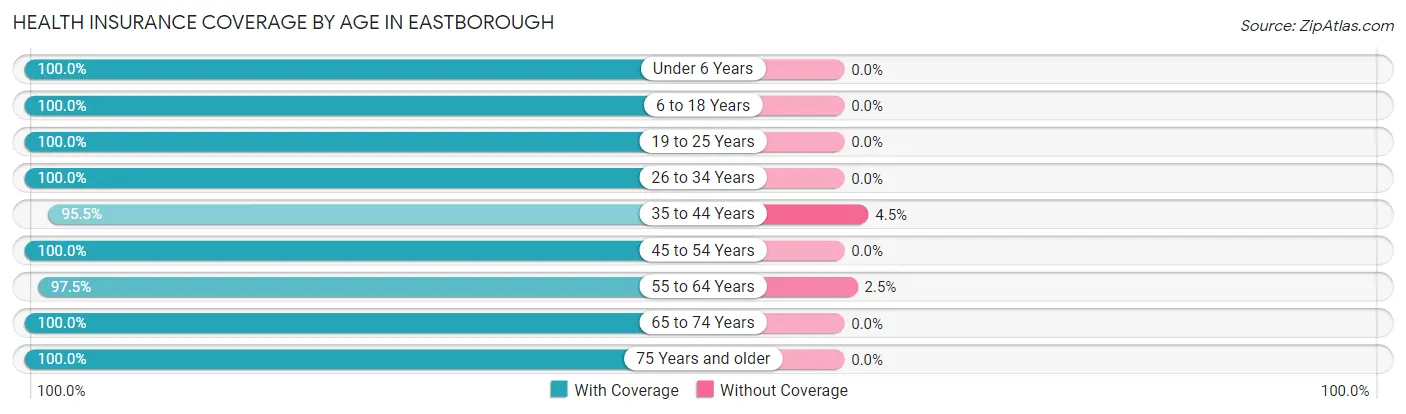
| Age Bracket | With Coverage | Without Coverage |
| Under 6 Years | 12 (100.0%) | 0 (0.0%) |
| 6 to 18 Years | 140 (100.0%) | 0 (0.0%) |
| 19 to 25 Years | 14 (100.0%) | 0 (0.0%) |
| 26 to 34 Years | 13 (100.0%) | 0 (0.0%) |
| 35 to 44 Years | 64 (95.5%) | 3 (4.5%) |
| 45 to 54 Years | 111 (100.0%) | 0 (0.0%) |
| 55 to 64 Years | 118 (97.5%) | 3 (2.5%) |
| 65 to 74 Years | 162 (100.0%) | 0 (0.0%) |
| 75 Years and older | 72 (100.0%) | 0 (0.0%) |
| Total | 706 (99.2%) | 6 (0.8%) |
Health Insurance Coverage by Citizenship Status in Eastborough
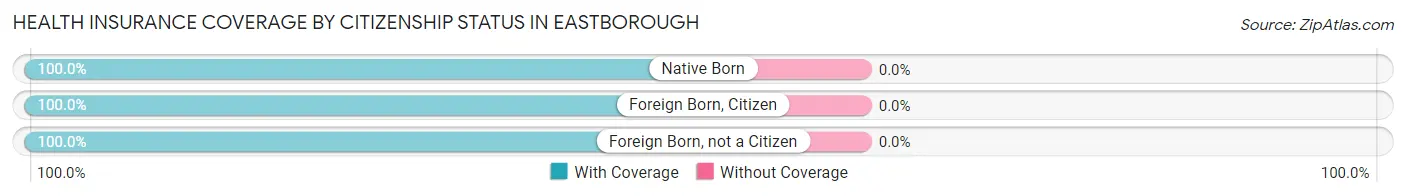
| Citizenship Status | With Coverage | Without Coverage |
| Native Born | 12 (100.0%) | 0 (0.0%) |
| Foreign Born, Citizen | 140 (100.0%) | 0 (0.0%) |
| Foreign Born, not a Citizen | 14 (100.0%) | 0 (0.0%) |
Health Insurance Coverage by Household Income in Eastborough
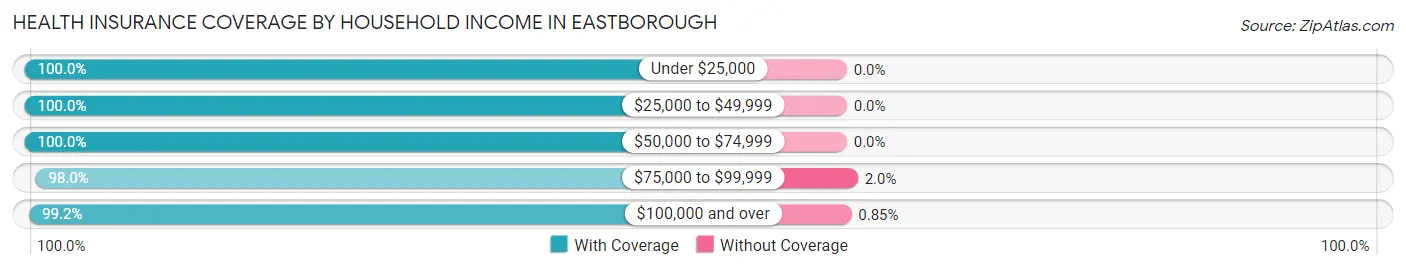
| Household Income | With Coverage | Without Coverage |
| Under $25,000 | 10 (100.0%) | 0 (0.0%) |
| $25,000 to $49,999 | 31 (100.0%) | 0 (0.0%) |
| $50,000 to $74,999 | 35 (100.0%) | 0 (0.0%) |
| $75,000 to $99,999 | 48 (98.0%) | 1 (2.0%) |
| $100,000 and over | 582 (99.2%) | 5 (0.9%) |
Public vs Private Health Insurance Coverage by Age in Eastborough
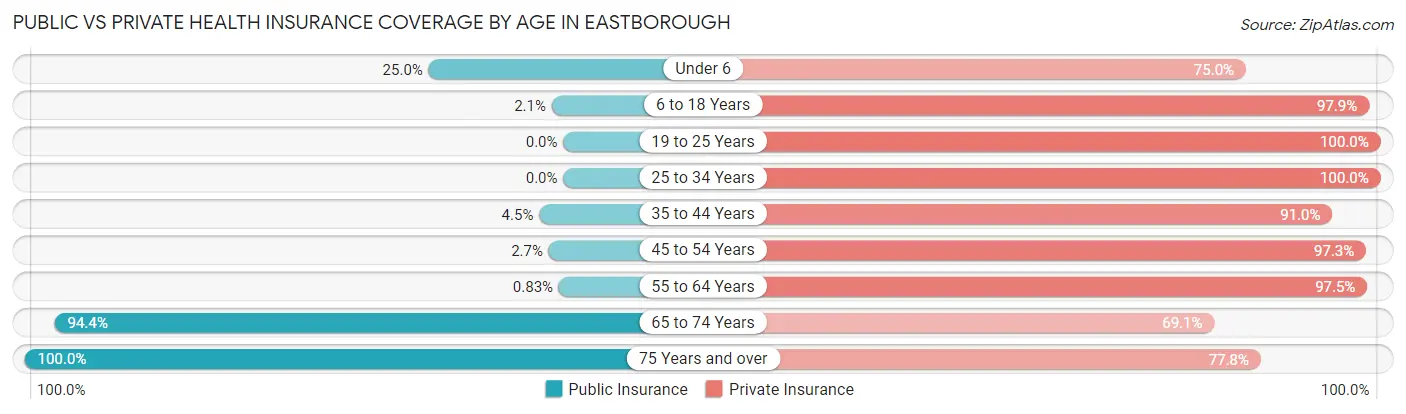
| Age Bracket | Public Insurance | Private Insurance |
| Under 6 | 3 (25.0%) | 9 (75.0%) |
| 6 to 18 Years | 3 (2.1%) | 137 (97.9%) |
| 19 to 25 Years | 0 (0.0%) | 14 (100.0%) |
| 25 to 34 Years | 0 (0.0%) | 13 (100.0%) |
| 35 to 44 Years | 3 (4.5%) | 61 (91.0%) |
| 45 to 54 Years | 3 (2.7%) | 108 (97.3%) |
| 55 to 64 Years | 1 (0.8%) | 118 (97.5%) |
| 65 to 74 Years | 153 (94.4%) | 112 (69.1%) |
| 75 Years and over | 72 (100.0%) | 56 (77.8%) |
| Total | 238 (33.4%) | 628 (88.2%) |
Disability Status by Sex by Age in Eastborough
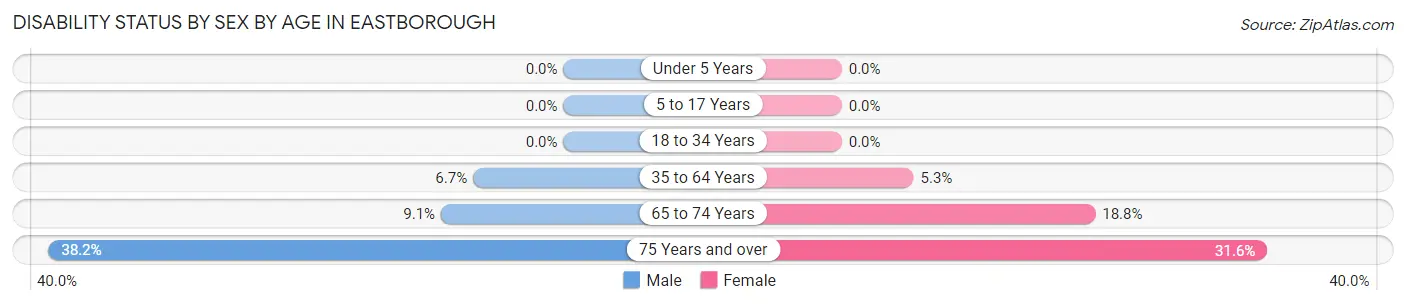
| Age Bracket | Male | Female |
| Under 5 Years | 0 (0.0%) | 0 (0.0%) |
| 5 to 17 Years | 0 (0.0%) | 0 (0.0%) |
| 18 to 34 Years | 0 (0.0%) | 0 (0.0%) |
| 35 to 64 Years | 10 (6.7%) | 8 (5.3%) |
| 65 to 74 Years | 7 (9.1%) | 16 (18.8%) |
| 75 Years and over | 13 (38.2%) | 12 (31.6%) |
Disability Class by Sex by Age in Eastborough
Disability Class: Hearing Difficulty
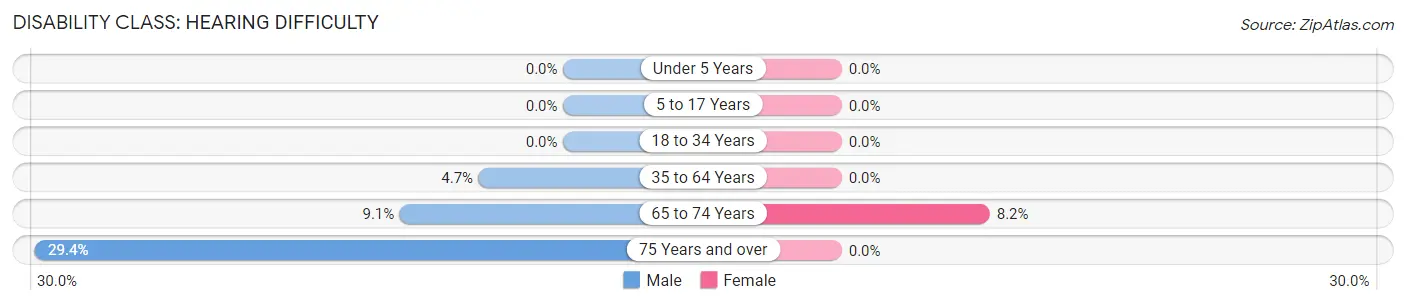
| Age Bracket | Male | Female |
| Under 5 Years | 0 (0.0%) | 0 (0.0%) |
| 5 to 17 Years | 0 (0.0%) | 0 (0.0%) |
| 18 to 34 Years | 0 (0.0%) | 0 (0.0%) |
| 35 to 64 Years | 7 (4.7%) | 0 (0.0%) |
| 65 to 74 Years | 7 (9.1%) | 7 (8.2%) |
| 75 Years and over | 10 (29.4%) | 0 (0.0%) |
Disability Class: Vision Difficulty
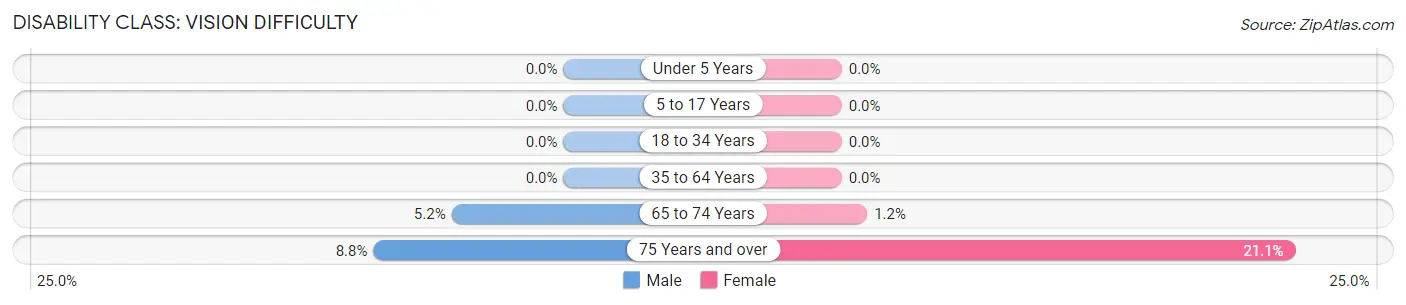
| Age Bracket | Male | Female |
| Under 5 Years | 0 (0.0%) | 0 (0.0%) |
| 5 to 17 Years | 0 (0.0%) | 0 (0.0%) |
| 18 to 34 Years | 0 (0.0%) | 0 (0.0%) |
| 35 to 64 Years | 0 (0.0%) | 0 (0.0%) |
| 65 to 74 Years | 4 (5.2%) | 1 (1.2%) |
| 75 Years and over | 3 (8.8%) | 8 (21.0%) |
Disability Class: Cognitive Difficulty
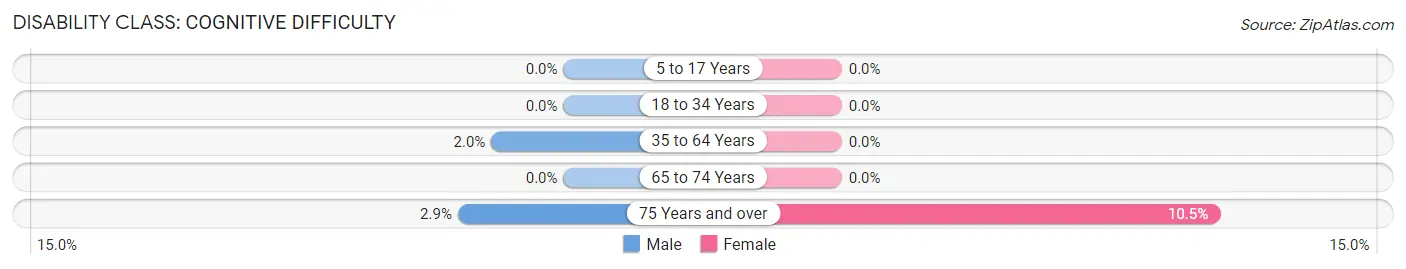
| Age Bracket | Male | Female |
| 5 to 17 Years | 0 (0.0%) | 0 (0.0%) |
| 18 to 34 Years | 0 (0.0%) | 0 (0.0%) |
| 35 to 64 Years | 3 (2.0%) | 0 (0.0%) |
| 65 to 74 Years | 0 (0.0%) | 0 (0.0%) |
| 75 Years and over | 1 (2.9%) | 4 (10.5%) |
Disability Class: Ambulatory Difficulty
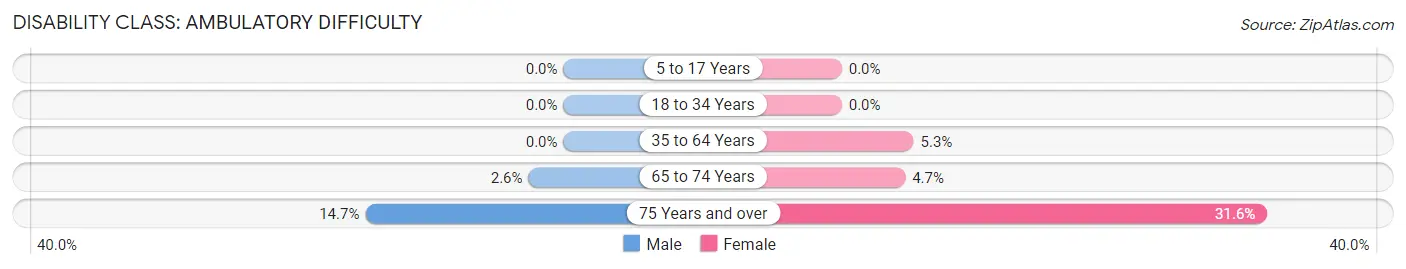
| Age Bracket | Male | Female |
| 5 to 17 Years | 0 (0.0%) | 0 (0.0%) |
| 18 to 34 Years | 0 (0.0%) | 0 (0.0%) |
| 35 to 64 Years | 0 (0.0%) | 8 (5.3%) |
| 65 to 74 Years | 2 (2.6%) | 4 (4.7%) |
| 75 Years and over | 5 (14.7%) | 12 (31.6%) |
Disability Class: Self-Care Difficulty
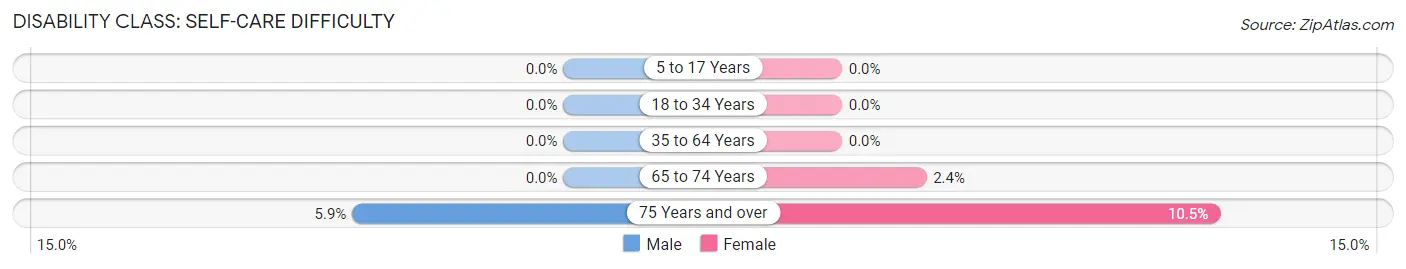
| Age Bracket | Male | Female |
| 5 to 17 Years | 0 (0.0%) | 0 (0.0%) |
| 18 to 34 Years | 0 (0.0%) | 0 (0.0%) |
| 35 to 64 Years | 0 (0.0%) | 0 (0.0%) |
| 65 to 74 Years | 0 (0.0%) | 2 (2.4%) |
| 75 Years and over | 2 (5.9%) | 4 (10.5%) |
Technology Access in Eastborough
Computing Device Access in Eastborough
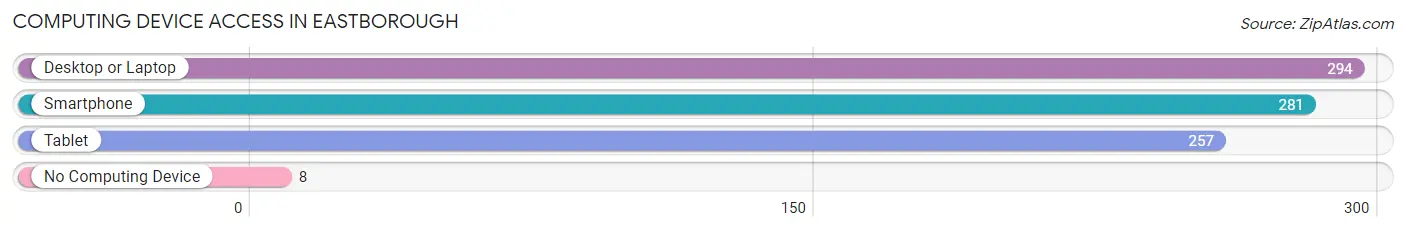
| Device Type | # Households | % Households |
| Desktop or Laptop | 294 | 93.3% |
| Smartphone | 281 | 89.2% |
| Tablet | 257 | 81.6% |
| No Computing Device | 8 | 2.5% |
| Total | 315 | 100.0% |
Internet Access in Eastborough
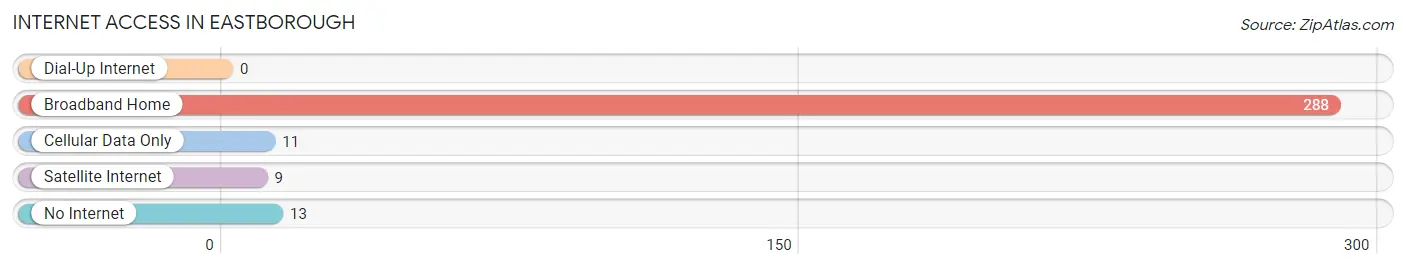
| Internet Type | # Households | % Households |
| Dial-Up Internet | 0 | 0.0% |
| Broadband Home | 288 | 91.4% |
| Cellular Data Only | 11 | 3.5% |
| Satellite Internet | 9 | 2.9% |
| No Internet | 13 | 4.1% |
| Total | 315 | 100.0% |
Eastborough Summary
Eastborough, Kansas is a small city located in Sedgwick County, Kansas. It is a suburb of Wichita, the largest city in the state. The city was founded in 1887 and incorporated in 1951. As of the 2010 census, the population of Eastborough was 1,845.
Geography
Eastborough is located at 37°41'25" North, 97°17'45" West (37.690278, -97.295833). It is situated in the Arkansas River Valley, about 8 miles east of Wichita. The city has a total area of 1.2 square miles, all of which is land.
Climate
Eastborough has a humid subtropical climate, with hot, humid summers and cold, dry winters. The average annual temperature is 61°F, with an average high of 87°F in July and an average low of 34°F in January. The average annual precipitation is 33.5 inches, with an average of 4.5 inches of snowfall per year.
Demographics
As of the 2010 census, there were 1,845 people, 745 households, and 517 families residing in Eastborough. The population density was 1,539.2 people per square mile. The racial makeup of the city was 87.2% White, 5.2% African American, 0.7% Native American, 1.2% Asian, 0.1% Pacific Islander, 2.7% from other races, and 2.9% from two or more races. Hispanic or Latino of any race were 6.2% of the population.
There were 745 households, out of which 28.2% had children under the age of 18 living with them, 51.7% were married couples living together, 11.7% had a female householder with no husband present, and 32.2% were non-families. 27.2% of all households were made up of individuals, and 10.2% had someone living alone who was 65 years of age or older. The average household size was 2.47 and the average family size was 3.00.
The median age in Eastborough was 39.2 years. 24.2% of residents were under the age of 18; 7.2% were between the ages of 18 and 24; 25.2% were from 25 to 44; 28.2% were from 45 to 64; and 15.2% were 65 years of age or older. The gender makeup of the city was 48.2% male and 51.8% female.
Economy
Eastborough's economy is largely based on the service industry. The city is home to several restaurants, retail stores, and other businesses. The city also has a small manufacturing sector, with several companies producing industrial and consumer products.
The median household income in Eastborough was $50,938 in 2018, and the median family income was $60,938. The per capita income was $25,938. About 8.2% of families and 10.2% of the population were below the poverty line, including 14.2% of those under age 18 and 8.2% of those age 65 or over.
Education
Eastborough is served by the Wichita Public Schools district. The city is home to Eastborough Elementary School, which serves students in grades K-5. The city is also home to Eastborough Middle School, which serves students in grades 6-8, and Eastborough High School, which serves students in grades 9-12.
Conclusion
Eastborough, Kansas is a small city located in Sedgwick County, Kansas. It is a suburb of Wichita, the largest city in the state. The city was founded in 1887 and incorporated in 1951. As of the 2010 census, the population of Eastborough was 1,845. The city has a humid subtropical climate, with hot, humid summers and cold, dry winters. The economy of Eastborough is largely based on the service industry, with a small manufacturing sector. The city is served by the Wichita Public Schools district, and is home to Eastborough Elementary School, Eastborough Middle School, and Eastborough High School.
Common Questions
What is Per Capita Income in Eastborough?
Per Capita income in Eastborough is $104,372.
What is the Median Family Income in Eastborough?
Median Family Income in Eastborough is $228,456.
What is the Median Household income in Eastborough?
Median Household Income in Eastborough is $187,750.
What is Income or Wage Gap in Eastborough?
Income or Wage Gap in Eastborough is 58.9%.
Women in Eastborough earn 41.1 cents for every dollar earned by a man.
What is Inequality or Gini Index in Eastborough?
Inequality or Gini Index in Eastborough is 0.46.
What is the Total Population of Eastborough?
Total Population of Eastborough is 712.
What is the Total Male Population of Eastborough?
Total Male Population of Eastborough is 350.
What is the Total Female Population of Eastborough?
Total Female Population of Eastborough is 362.
What is the Ratio of Males per 100 Females in Eastborough?
There are 96.69 Males per 100 Females in Eastborough.
What is the Ratio of Females per 100 Males in Eastborough?
There are 103.43 Females per 100 Males in Eastborough.
What is the Median Population Age in Eastborough?
Median Population Age in Eastborough is 54.9 Years.
What is the Average Family Size in Eastborough
Average Family Size in Eastborough is 2.7 People.
What is the Average Household Size in Eastborough
Average Household Size in Eastborough is 2.3 People.
How Large is the Labor Force in Eastborough?
There are 371 People in the Labor Forcein in Eastborough.
What is the Percentage of People in the Labor Force in Eastborough?
63.2% of People are in the Labor Force in Eastborough.
What is the Unemployment Rate in Eastborough?
Unemployment Rate in Eastborough is 1.3%.