Pine, AZ Map & Demographics
Pine Map
Pine Overview
$38,398
PER CAPITA INCOME
$73,704
AVG FAMILY INCOME
$54,720
AVG HOUSEHOLD INCOME
16.6%
WAGE / INCOME GAP [ % ]
83.4¢/ $1
WAGE / INCOME GAP [ $ ]
0.35
INEQUALITY / GINI INDEX
1,526
TOTAL POPULATION
772
MALE POPULATION
754
FEMALE POPULATION
102.39
MALES / 100 FEMALES
97.67
FEMALES / 100 MALES
68.7
MEDIAN AGE
2.2
AVG FAMILY SIZE
1.8
AVG HOUSEHOLD SIZE
456
LABOR FORCE [ PEOPLE ]
30.8%
PERCENT IN LABOR FORCE
Pine Zip Codes
Pine Area Codes
Income in Pine
Income Overview in Pine
Per Capita Income in Pine is $38,398, while median incomes of families and households are $73,704 and $54,720 respectively.
| Characteristic | Number | Measure |
| Per Capita Income | 1,526 | $38,398 |
| Median Family Income | 528 | $73,704 |
| Mean Family Income | 528 | $81,054 |
| Median Household Income | 829 | $54,720 |
| Mean Household Income | 829 | $68,580 |
| Income Deficit | 528 | $0 |
| Wage / Income Gap (%) | 1,526 | 16.57% |
| Wage / Income Gap ($) | 1,526 | 83.43¢ per $1 |
| Gini / Inequality Index | 1,526 | 0.35 |
Earnings by Sex in Pine
Average Earnings in Pine are $47,269, $49,402 for men and $41,218 for women, a difference of 16.6%.
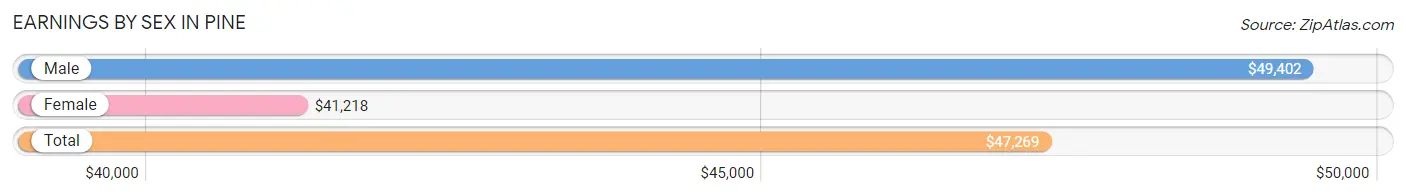
| Sex | Number | Average Earnings |
| Male | 309 (58.4%) | $49,402 |
| Female | 220 (41.6%) | $41,218 |
| Total | 529 (100.0%) | $47,269 |
Earnings by Sex by Income Bracket in Pine
The most common earnings brackets in Pine are $75,000 to $99,999 for men (91 | 29.4%) and $50,000 to $54,999 for women (58 | 26.4%).
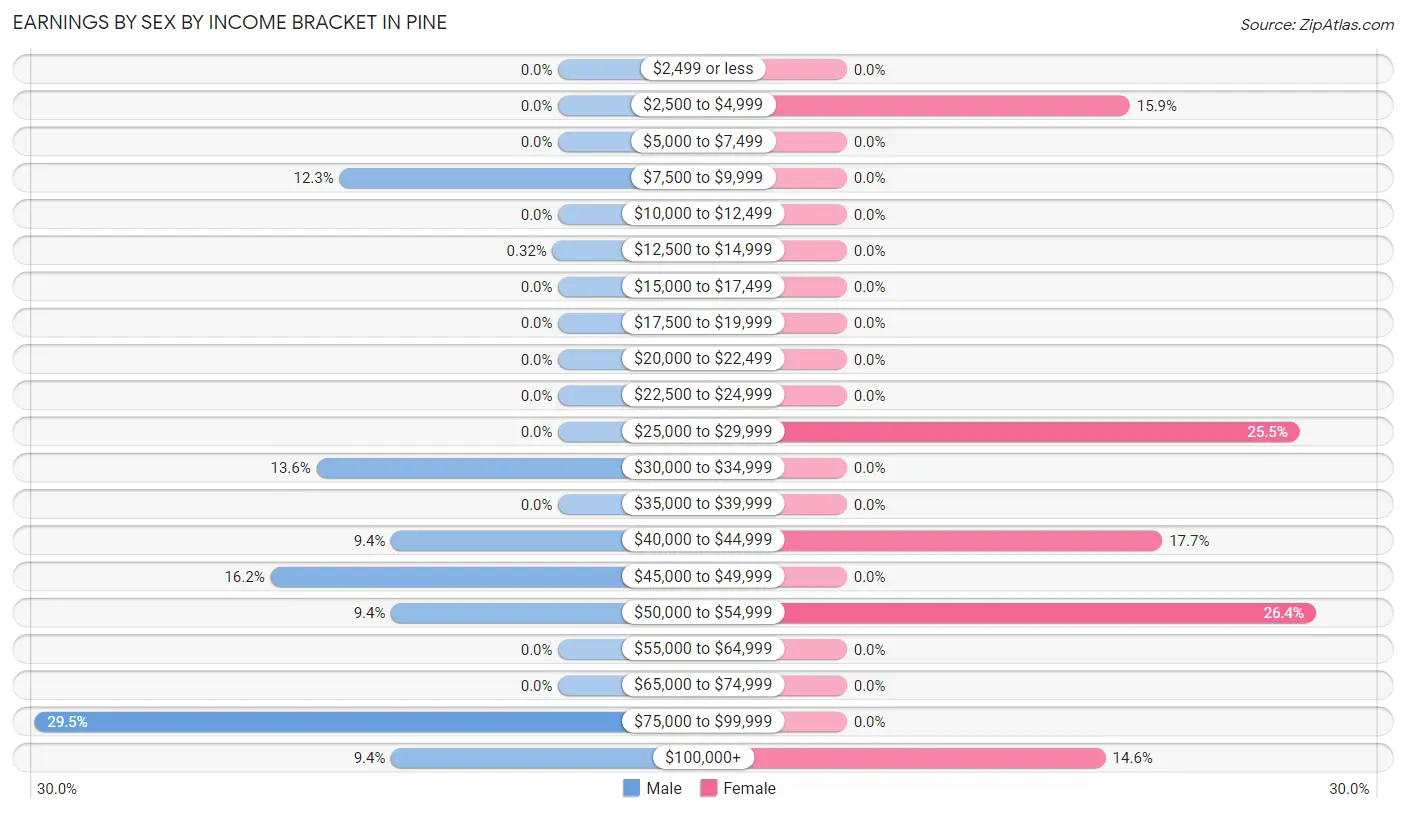
| Income | Male | Female |
| $2,499 or less | 0 (0.0%) | 0 (0.0%) |
| $2,500 to $4,999 | 0 (0.0%) | 35 (15.9%) |
| $5,000 to $7,499 | 0 (0.0%) | 0 (0.0%) |
| $7,500 to $9,999 | 38 (12.3%) | 0 (0.0%) |
| $10,000 to $12,499 | 0 (0.0%) | 0 (0.0%) |
| $12,500 to $14,999 | 1 (0.3%) | 0 (0.0%) |
| $15,000 to $17,499 | 0 (0.0%) | 0 (0.0%) |
| $17,500 to $19,999 | 0 (0.0%) | 0 (0.0%) |
| $20,000 to $22,499 | 0 (0.0%) | 0 (0.0%) |
| $22,500 to $24,999 | 0 (0.0%) | 0 (0.0%) |
| $25,000 to $29,999 | 0 (0.0%) | 56 (25.5%) |
| $30,000 to $34,999 | 42 (13.6%) | 0 (0.0%) |
| $35,000 to $39,999 | 0 (0.0%) | 0 (0.0%) |
| $40,000 to $44,999 | 29 (9.4%) | 39 (17.7%) |
| $45,000 to $49,999 | 50 (16.2%) | 0 (0.0%) |
| $50,000 to $54,999 | 29 (9.4%) | 58 (26.4%) |
| $55,000 to $64,999 | 0 (0.0%) | 0 (0.0%) |
| $65,000 to $74,999 | 0 (0.0%) | 0 (0.0%) |
| $75,000 to $99,999 | 91 (29.4%) | 0 (0.0%) |
| $100,000+ | 29 (9.4%) | 32 (14.5%) |
| Total | 309 (100.0%) | 220 (100.0%) |
Earnings by Sex by Educational Attainment in Pine
| Educational Attainment | Male Income | Female Income |
| Less than High School | - | - |
| High School Diploma | - | - |
| College or Associate's Degree | - | - |
| Bachelor's Degree | - | - |
| Graduate Degree | - | - |
| Total | $53,276 | $42,340 |
Family Income in Pine
Family Income Brackets in Pine
According to the Pine family income data, there are 114 families falling into the $35,000 to $49,999 income range, which is the most common income bracket and makes up 21.6% of all families.
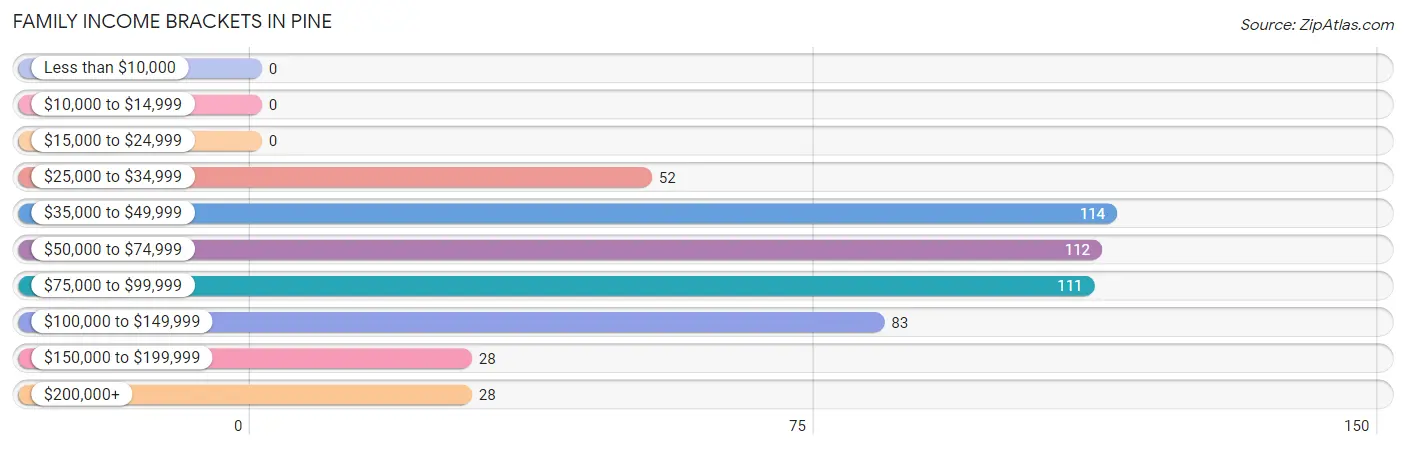
| Income Bracket | # Families | % Families |
| Less than $10,000 | 0 | 0.0% |
| $10,000 to $14,999 | 0 | 0.0% |
| $15,000 to $24,999 | 0 | 0.0% |
| $25,000 to $34,999 | 52 | 9.8% |
| $35,000 to $49,999 | 114 | 21.6% |
| $50,000 to $74,999 | 112 | 21.2% |
| $75,000 to $99,999 | 111 | 21.0% |
| $100,000 to $149,999 | 83 | 15.7% |
| $150,000 to $199,999 | 28 | 5.3% |
| $200,000+ | 28 | 5.3% |
Family Income by Famaliy Size in Pine
2-person families (491 | 93.0%) account for the highest median family income in Pine with $61,991 per family, while 2-person families (491 | 93.0%) have the highest median income of $30,996 per family member.
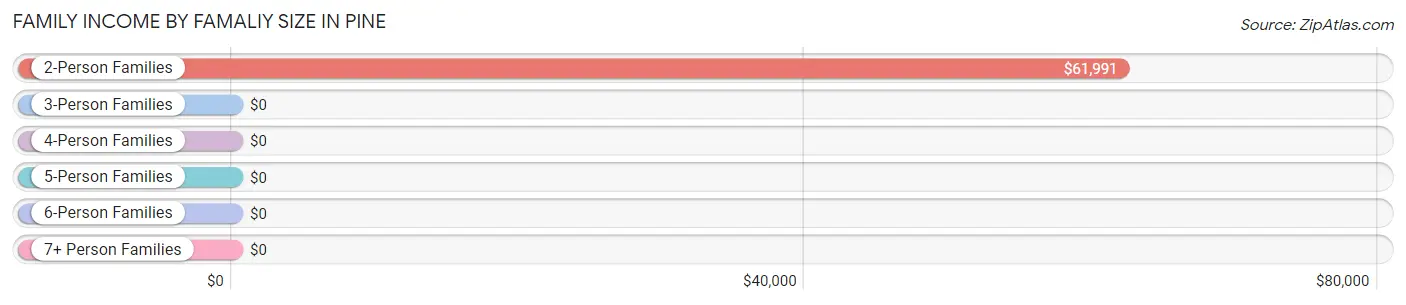
| Income Bracket | # Families | Median Income |
| 2-Person Families | 491 (93.0%) | $61,991 |
| 3-Person Families | 37 (7.0%) | $0 |
| 4-Person Families | 0 (0.0%) | $0 |
| 5-Person Families | 0 (0.0%) | $0 |
| 6-Person Families | 0 (0.0%) | $0 |
| 7+ Person Families | 0 (0.0%) | $0 |
| Total | 528 (100.0%) | $73,704 |
Family Income by Number of Earners in Pine
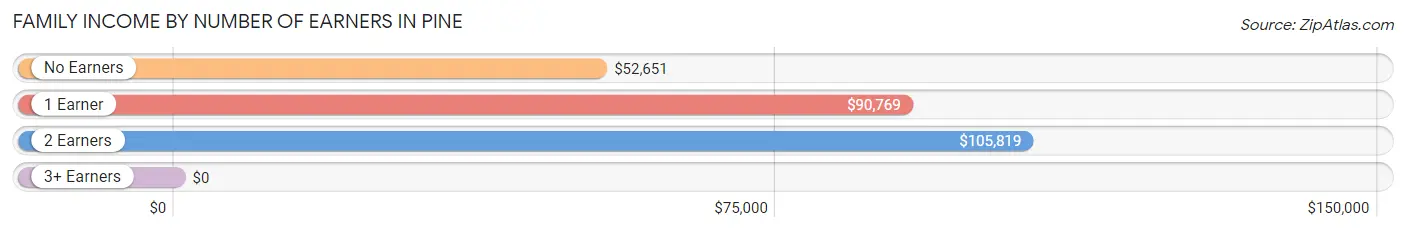
| Number of Earners | # Families | Median Income |
| No Earners | 235 (44.5%) | $52,651 |
| 1 Earner | 198 (37.5%) | $90,769 |
| 2 Earners | 95 (18.0%) | $105,819 |
| 3+ Earners | 0 (0.0%) | $0 |
| Total | 528 (100.0%) | $73,704 |
Household Income in Pine
Household Income Brackets in Pine
With 183 households falling in the category, the $75,000 to $99,999 income range is the most frequent in Pine, accounting for 22.1% of all households. In contrast, only 28 households (3.4%) fall into the $150,000 to $199,999 income bracket, making it the least populous group.
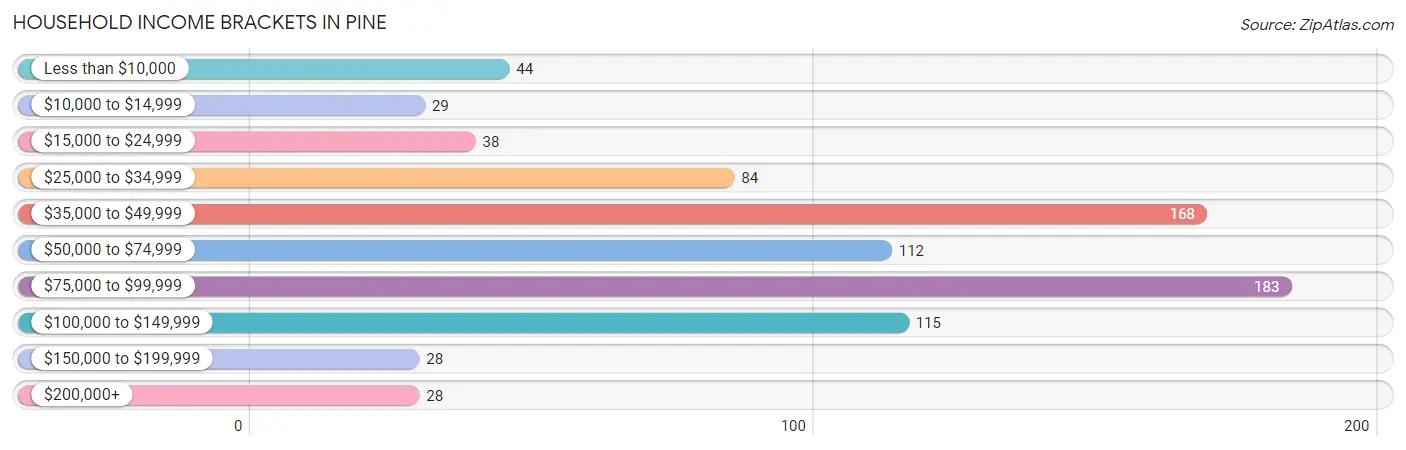
| Income Bracket | # Households | % Households |
| Less than $10,000 | 44 | 5.3% |
| $10,000 to $14,999 | 29 | 3.5% |
| $15,000 to $24,999 | 38 | 4.6% |
| $25,000 to $34,999 | 84 | 10.1% |
| $35,000 to $49,999 | 168 | 20.3% |
| $50,000 to $74,999 | 112 | 13.5% |
| $75,000 to $99,999 | 183 | 22.1% |
| $100,000 to $149,999 | 115 | 13.9% |
| $150,000 to $199,999 | 28 | 3.4% |
| $200,000+ | 28 | 3.4% |
Household Income by Householder Age in Pine
The median household income in Pine is $54,720, with the highest median household income of $95,987 found in the 45 to 64 years age bracket for the primary householder. A total of 168 households (20.3%) fall into this category. Meanwhile, the 15 to 24 years age bracket for the primary householder has the lowest median household income of $0, with 29 households (3.5%) in this group.
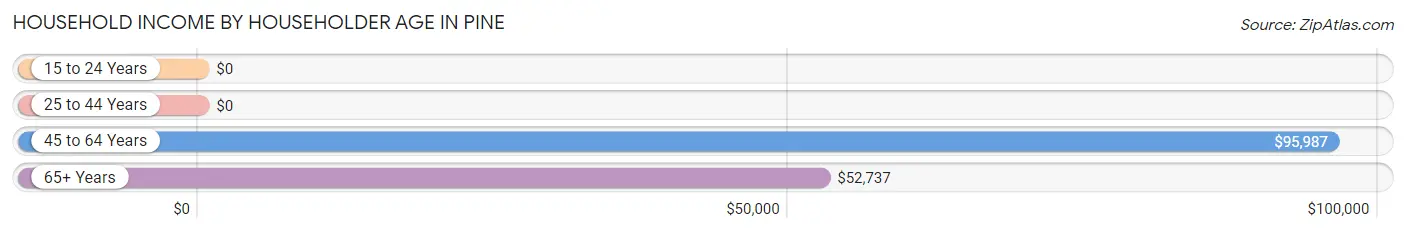
| Income Bracket | # Households | Median Income |
| 15 to 24 Years | 29 (3.5%) | $0 |
| 25 to 44 Years | 37 (4.5%) | $0 |
| 45 to 64 Years | 168 (20.3%) | $95,987 |
| 65+ Years | 595 (71.8%) | $52,737 |
| Total | 829 (100.0%) | $54,720 |
Poverty in Pine
Income Below Poverty by Sex and Age in Pine
With 0.1% poverty level for males and 18.3% for females among the residents of Pine, 45 to 54 year old males and 18 to 24 year old females are the most vulnerable to poverty, with 1 males (4.2%) and 35 females (100.0%) in their respective age groups living below the poverty level.
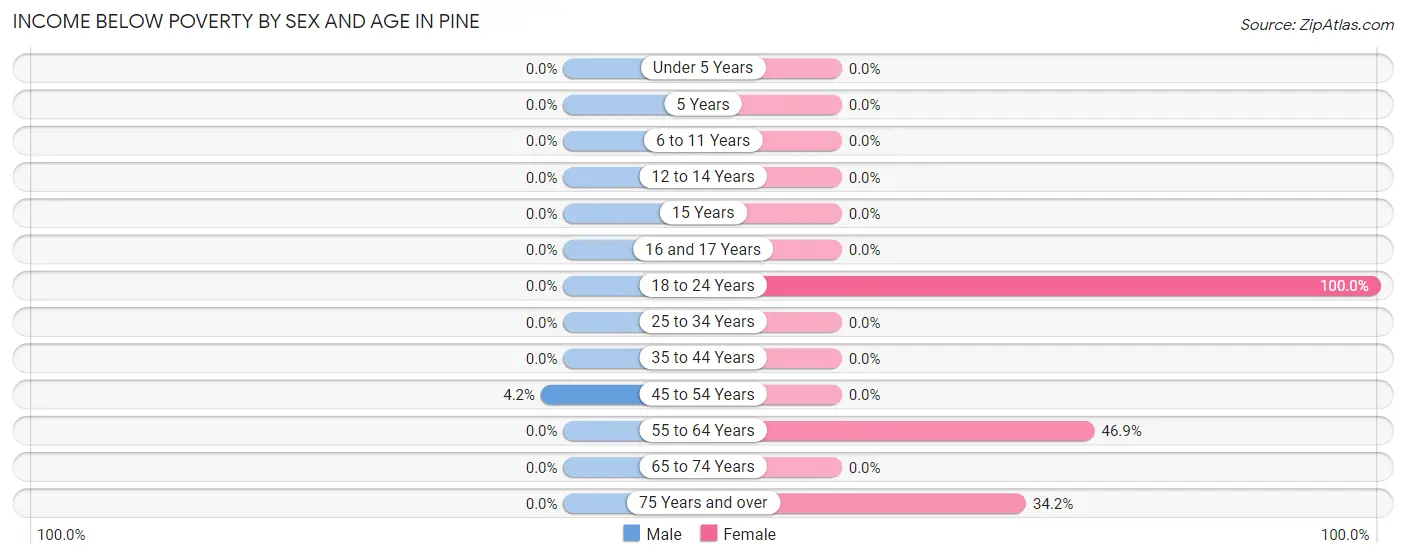
| Age Bracket | Male | Female |
| Under 5 Years | 0 (0.0%) | 0 (0.0%) |
| 5 Years | 0 (0.0%) | 0 (0.0%) |
| 6 to 11 Years | 0 (0.0%) | 0 (0.0%) |
| 12 to 14 Years | 0 (0.0%) | 0 (0.0%) |
| 15 Years | 0 (0.0%) | 0 (0.0%) |
| 16 and 17 Years | 0 (0.0%) | 0 (0.0%) |
| 18 to 24 Years | 0 (0.0%) | 35 (100.0%) |
| 25 to 34 Years | 0 (0.0%) | 0 (0.0%) |
| 35 to 44 Years | 0 (0.0%) | 0 (0.0%) |
| 45 to 54 Years | 1 (4.2%) | 0 (0.0%) |
| 55 to 64 Years | 0 (0.0%) | 38 (46.9%) |
| 65 to 74 Years | 0 (0.0%) | 0 (0.0%) |
| 75 Years and over | 0 (0.0%) | 65 (34.2%) |
| Total | 1 (0.1%) | 138 (18.3%) |
Income Above Poverty by Sex and Age in Pine
According to the poverty statistics in Pine, males aged under 5 years and females aged 35 to 44 years are the age groups that are most secure financially, with 100.0% of males and 100.0% of females in these age groups living above the poverty line.
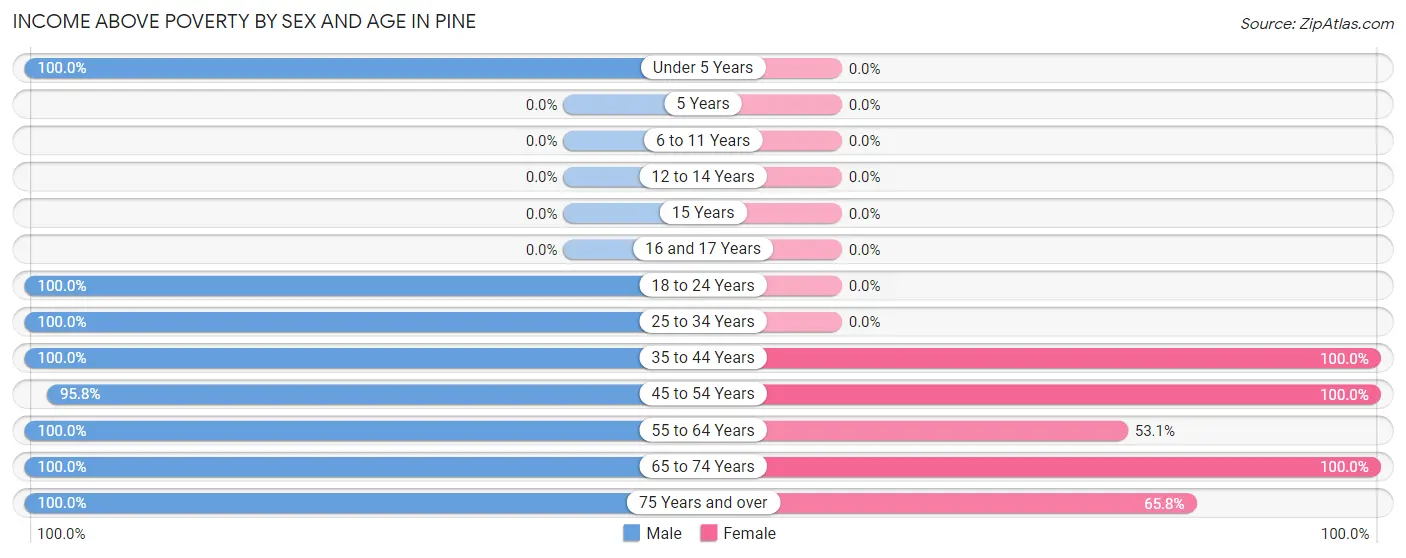
| Age Bracket | Male | Female |
| Under 5 Years | 46 (100.0%) | 0 (0.0%) |
| 5 Years | 0 (0.0%) | 0 (0.0%) |
| 6 to 11 Years | 0 (0.0%) | 0 (0.0%) |
| 12 to 14 Years | 0 (0.0%) | 0 (0.0%) |
| 15 Years | 0 (0.0%) | 0 (0.0%) |
| 16 and 17 Years | 0 (0.0%) | 0 (0.0%) |
| 18 to 24 Years | 29 (100.0%) | 0 (0.0%) |
| 25 to 34 Years | 42 (100.0%) | 0 (0.0%) |
| 35 to 44 Years | 66 (100.0%) | 20 (100.0%) |
| 45 to 54 Years | 23 (95.8%) | 125 (100.0%) |
| 55 to 64 Years | 95 (100.0%) | 43 (53.1%) |
| 65 to 74 Years | 221 (100.0%) | 303 (100.0%) |
| 75 Years and over | 249 (100.0%) | 125 (65.8%) |
| Total | 771 (99.9%) | 616 (81.7%) |
Income Below Poverty Among Married-Couple Families in Pine
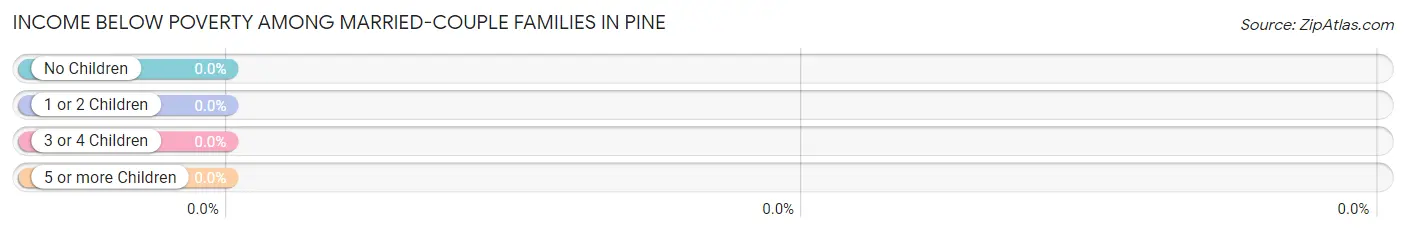
| Children | Above Poverty | Below Poverty |
| No Children | 471 (100.0%) | 0 (0.0%) |
| 1 or 2 Children | 0 (0.0%) | 0 (0.0%) |
| 3 or 4 Children | 0 (0.0%) | 0 (0.0%) |
| 5 or more Children | 0 (0.0%) | 0 (0.0%) |
| Total | 471 (100.0%) | 0 (0.0%) |
Income Below Poverty Among Single-Parent Households in Pine
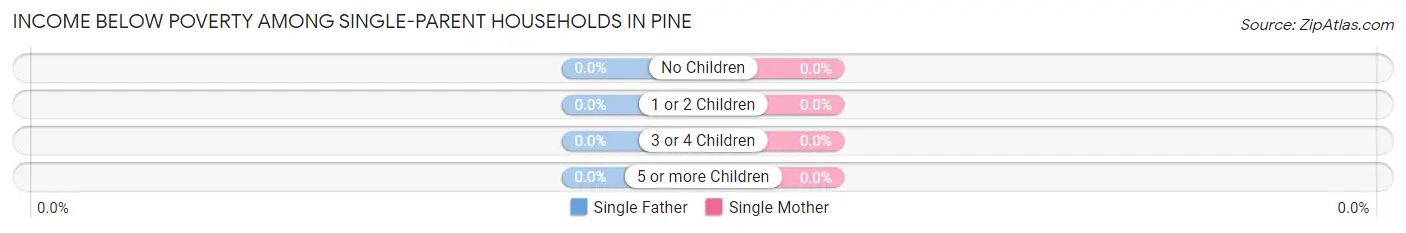
| Children | Single Father | Single Mother |
| No Children | 0 (0.0%) | 0 (0.0%) |
| 1 or 2 Children | 0 (0.0%) | 0 (0.0%) |
| 3 or 4 Children | 0 (0.0%) | 0 (0.0%) |
| 5 or more Children | 0 (0.0%) | 0 (0.0%) |
| Total | 0 (0.0%) | 0 (0.0%) |
Income Below Poverty Among Married-Couple vs Single-Parent Households in Pine
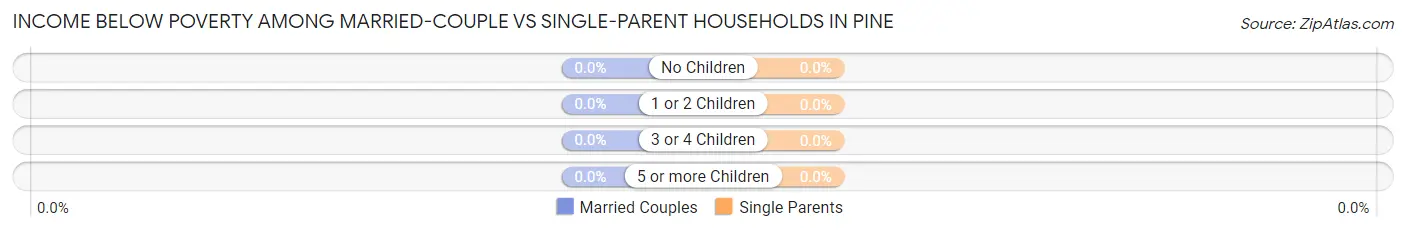
| Children | Married-Couple Families | Single-Parent Households |
| No Children | 0 (0.0%) | 0 (0.0%) |
| 1 or 2 Children | 0 (0.0%) | 0 (0.0%) |
| 3 or 4 Children | 0 (0.0%) | 0 (0.0%) |
| 5 or more Children | 0 (0.0%) | 0 (0.0%) |
| Total | 0 (0.0%) | 0 (0.0%) |
Race in Pine
The most populous races in Pine are White / Caucasian (1,468 | 96.2%), Hispanic or Latino (58 | 3.8%), and Some other Race (58 | 3.8%).
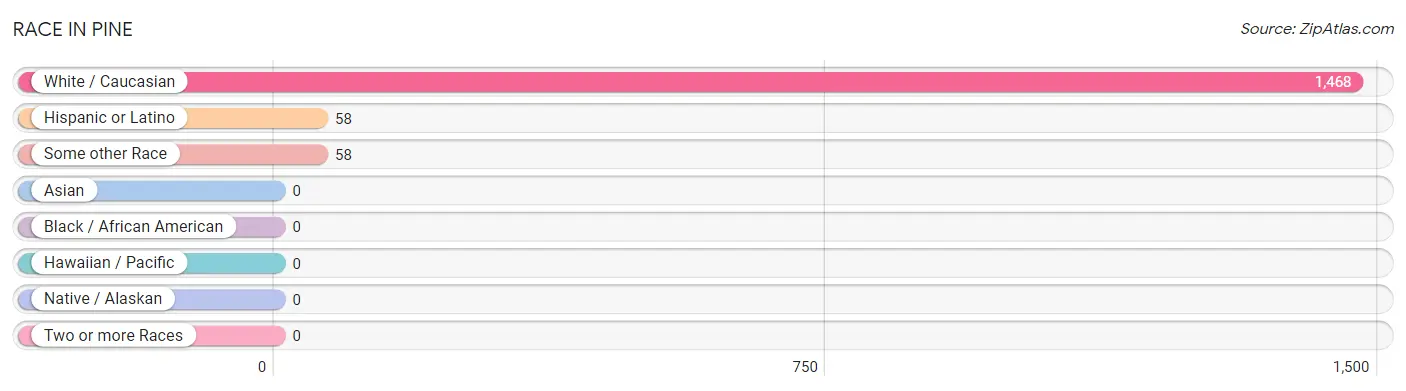
| Race | # Population | % Population |
| Asian | 0 | 0.0% |
| Black / African American | 0 | 0.0% |
| Hawaiian / Pacific | 0 | 0.0% |
| Hispanic or Latino | 58 | 3.8% |
| Native / Alaskan | 0 | 0.0% |
| White / Caucasian | 1,468 | 96.2% |
| Two or more Races | 0 | 0.0% |
| Some other Race | 58 | 3.8% |
| Total | 1,526 | 100.0% |
Ancestry in Pine
The most populous ancestries reported in Pine are English (590 | 38.7%), Irish (396 | 26.0%), German (187 | 12.2%), Italian (137 | 9.0%), and Norwegian (110 | 7.2%), together accounting for 93.0% of all Pine residents.
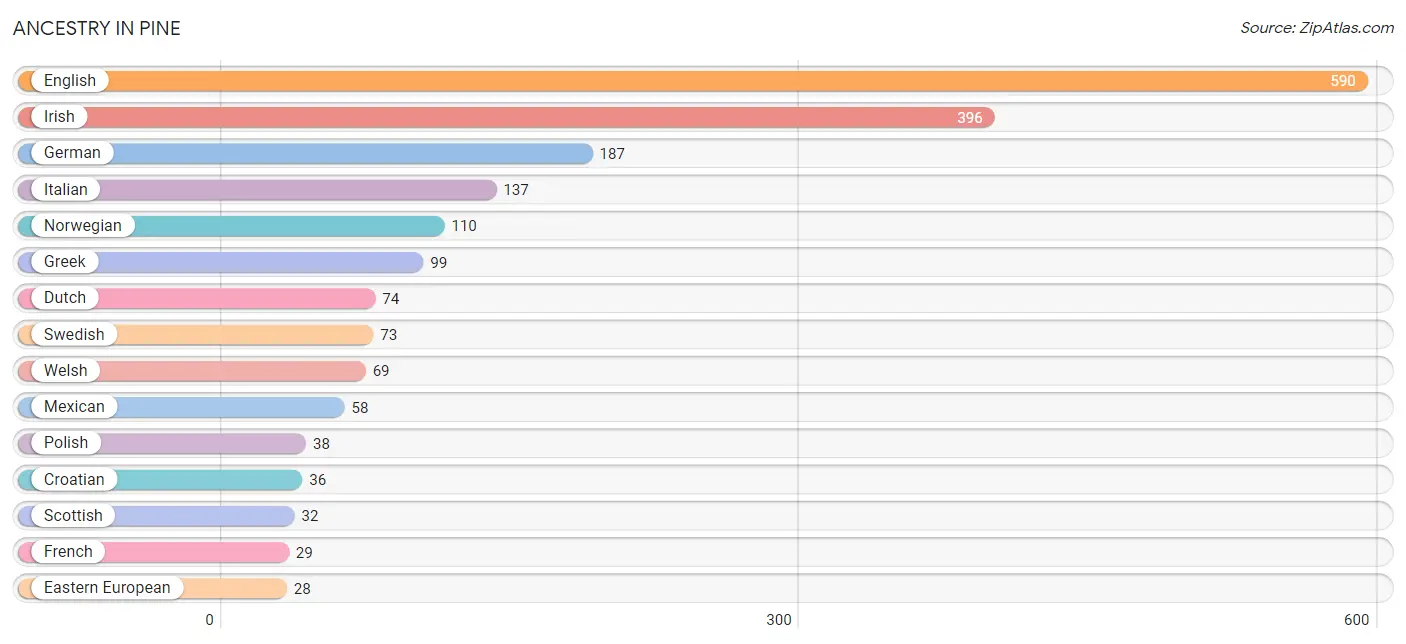
| Ancestry | # Population | % Population |
| American | 26 | 1.7% |
| Croatian | 36 | 2.4% |
| Dutch | 74 | 4.9% |
| Eastern European | 28 | 1.8% |
| English | 590 | 38.7% |
| French | 29 | 1.9% |
| German | 187 | 12.2% |
| Greek | 99 | 6.5% |
| Irish | 396 | 26.0% |
| Italian | 137 | 9.0% |
| Mexican | 58 | 3.8% |
| Norwegian | 110 | 7.2% |
| Polish | 38 | 2.5% |
| Portuguese | 23 | 1.5% |
| Scottish | 32 | 2.1% |
| Swedish | 73 | 4.8% |
| Welsh | 69 | 4.5% | View All 17 Rows |
Immigrants in Pine

| Immigration Origin | # Population | % Population | View All 0 Rows |
Sex and Age in Pine
Sex and Age in Pine
The most populous age groups in Pine are 75 to 79 Years (151 | 19.6%) for men and 65 to 69 Years (215 | 28.5%) for women.
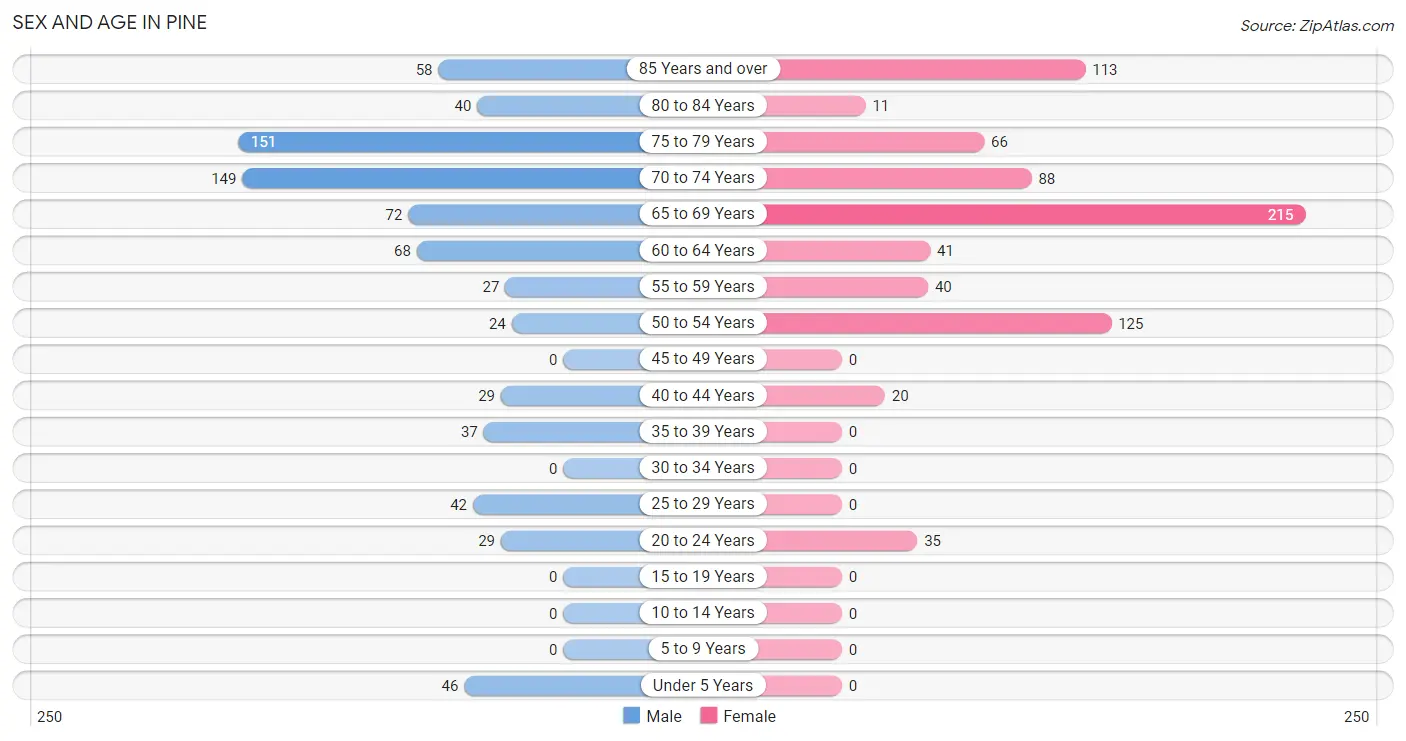
| Age Bracket | Male | Female |
| Under 5 Years | 46 (6.0%) | 0 (0.0%) |
| 5 to 9 Years | 0 (0.0%) | 0 (0.0%) |
| 10 to 14 Years | 0 (0.0%) | 0 (0.0%) |
| 15 to 19 Years | 0 (0.0%) | 0 (0.0%) |
| 20 to 24 Years | 29 (3.8%) | 35 (4.6%) |
| 25 to 29 Years | 42 (5.4%) | 0 (0.0%) |
| 30 to 34 Years | 0 (0.0%) | 0 (0.0%) |
| 35 to 39 Years | 37 (4.8%) | 0 (0.0%) |
| 40 to 44 Years | 29 (3.8%) | 20 (2.6%) |
| 45 to 49 Years | 0 (0.0%) | 0 (0.0%) |
| 50 to 54 Years | 24 (3.1%) | 125 (16.6%) |
| 55 to 59 Years | 27 (3.5%) | 40 (5.3%) |
| 60 to 64 Years | 68 (8.8%) | 41 (5.4%) |
| 65 to 69 Years | 72 (9.3%) | 215 (28.5%) |
| 70 to 74 Years | 149 (19.3%) | 88 (11.7%) |
| 75 to 79 Years | 151 (19.6%) | 66 (8.7%) |
| 80 to 84 Years | 40 (5.2%) | 11 (1.5%) |
| 85 Years and over | 58 (7.5%) | 113 (15.0%) |
| Total | 772 (100.0%) | 754 (100.0%) |
Families and Households in Pine
Median Family Size in Pine
The median family size in Pine is 2.19 persons per family, with single male/father families (29 | 5.5%) accounting for the largest median family size of 2.59 persons per family. On the other hand, single female/mother families (28 | 5.3%) represent the smallest median family size with 2.04 persons per family.
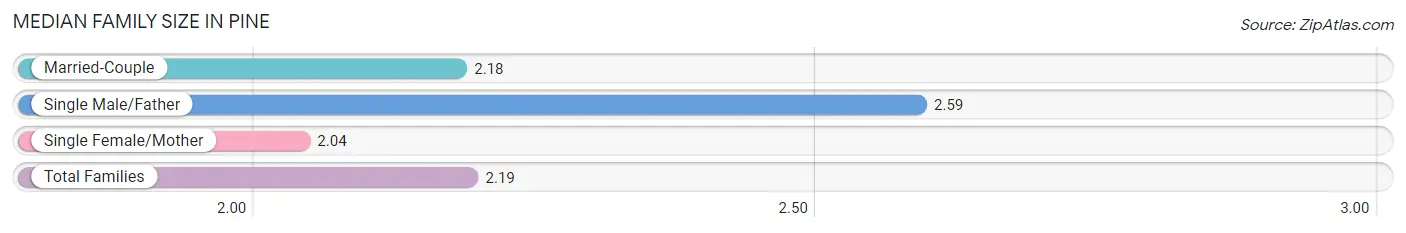
| Family Type | # Families | Family Size |
| Married-Couple | 471 (89.2%) | 2.18 |
| Single Male/Father | 29 (5.5%) | 2.59 |
| Single Female/Mother | 28 (5.3%) | 2.04 |
| Total Families | 528 (100.0%) | 2.19 |
Median Household Size in Pine
The median household size in Pine is 1.84 persons per household, with single male/father households (29 | 3.5%) accounting for the largest median household size of 3.79 persons per household. non-family households (301 | 36.3%) represent the smallest median household size with 1.10 persons per household.
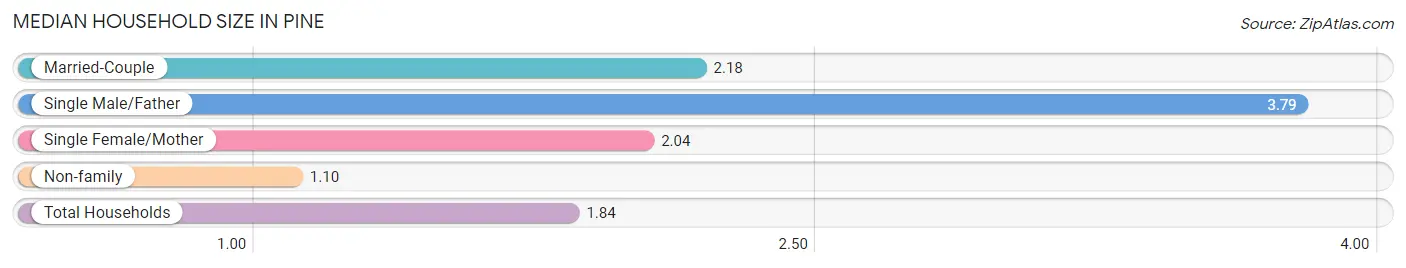
| Household Type | # Households | Household Size |
| Married-Couple | 471 (56.8%) | 2.18 |
| Single Male/Father | 29 (3.5%) | 3.79 |
| Single Female/Mother | 28 (3.4%) | 2.04 |
| Non-family | 301 (36.3%) | 1.10 |
| Total Households | 829 (100.0%) | 1.84 |
Household Size by Marriage Status in Pine
Out of a total of 829 households in Pine, 528 (63.7%) are family households, while 301 (36.3%) are nonfamily households. The most numerous type of family households are 2-person households, comprising 462, and the most common type of nonfamily households are 1-person households, comprising 274.
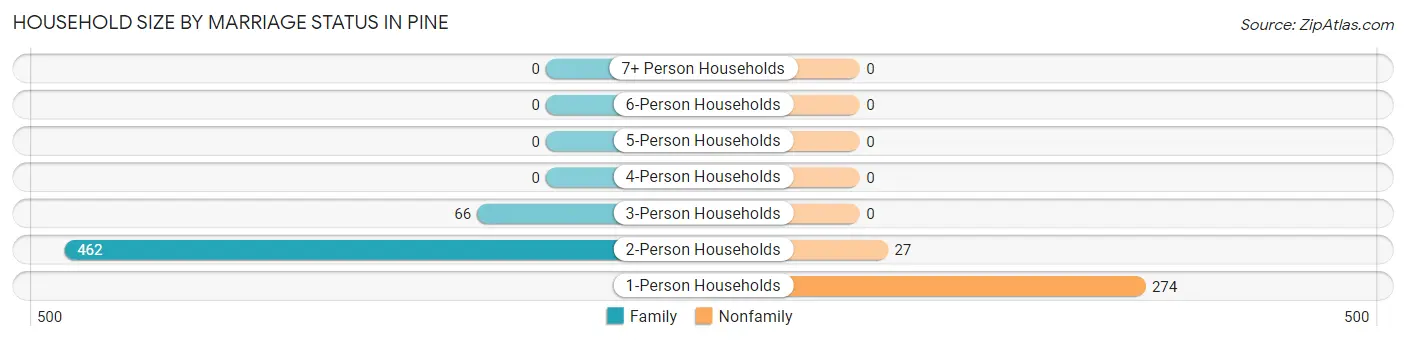
| Household Size | Family Households | Nonfamily Households |
| 1-Person Households | - | 274 (33.1%) |
| 2-Person Households | 462 (55.7%) | 27 (3.3%) |
| 3-Person Households | 66 (8.0%) | 0 (0.0%) |
| 4-Person Households | 0 (0.0%) | 0 (0.0%) |
| 5-Person Households | 0 (0.0%) | 0 (0.0%) |
| 6-Person Households | 0 (0.0%) | 0 (0.0%) |
| 7+ Person Households | 0 (0.0%) | 0 (0.0%) |
| Total | 528 (63.7%) | 301 (36.3%) |
Female Fertility in Pine
Fertility by Age in Pine
Average fertility rate in Pine is 422.0 births per 1,000 women. Women in the age bracket of 20 to 34 years have the highest fertility rate with 1,000.0 births per 1,000 women. Women in the age bracket of 20 to 34 years acount for 100.0% of all women with births.
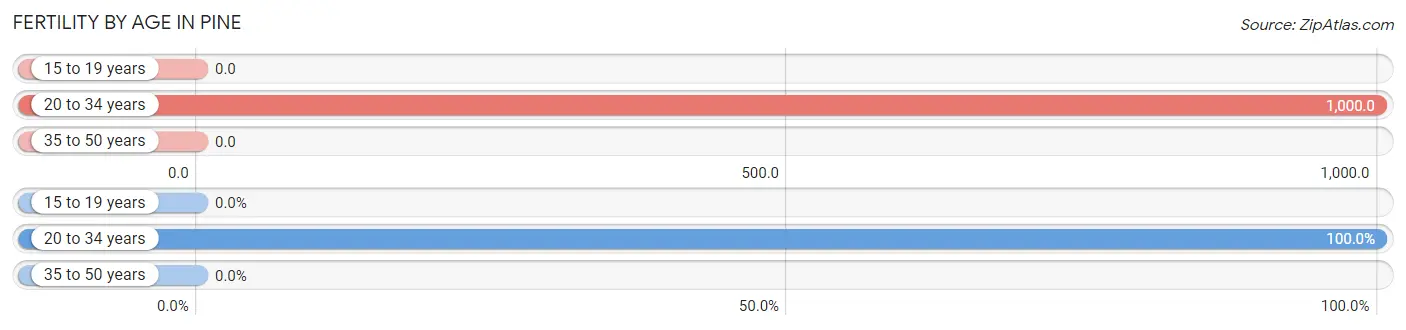
| Age Bracket | Women with Births | Births / 1,000 Women |
| 15 to 19 years | 0 (0.0%) | 0.0 |
| 20 to 34 years | 35 (100.0%) | 1,000.0 |
| 35 to 50 years | 0 (0.0%) | 0.0 |
| Total | 35 (100.0%) | 422.0 |
Fertility by Age by Marriage Status in Pine
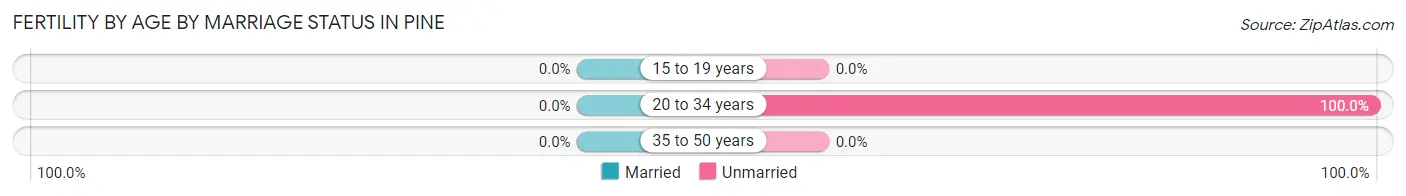
| Age Bracket | Married | Unmarried |
| 15 to 19 years | 0 (0.0%) | 0 (0.0%) |
| 20 to 34 years | 0 (0.0%) | 35 (100.0%) |
| 35 to 50 years | 0 (0.0%) | 0 (0.0%) |
| Total | 0 (0.0%) | 35 (100.0%) |
Fertility by Education in Pine
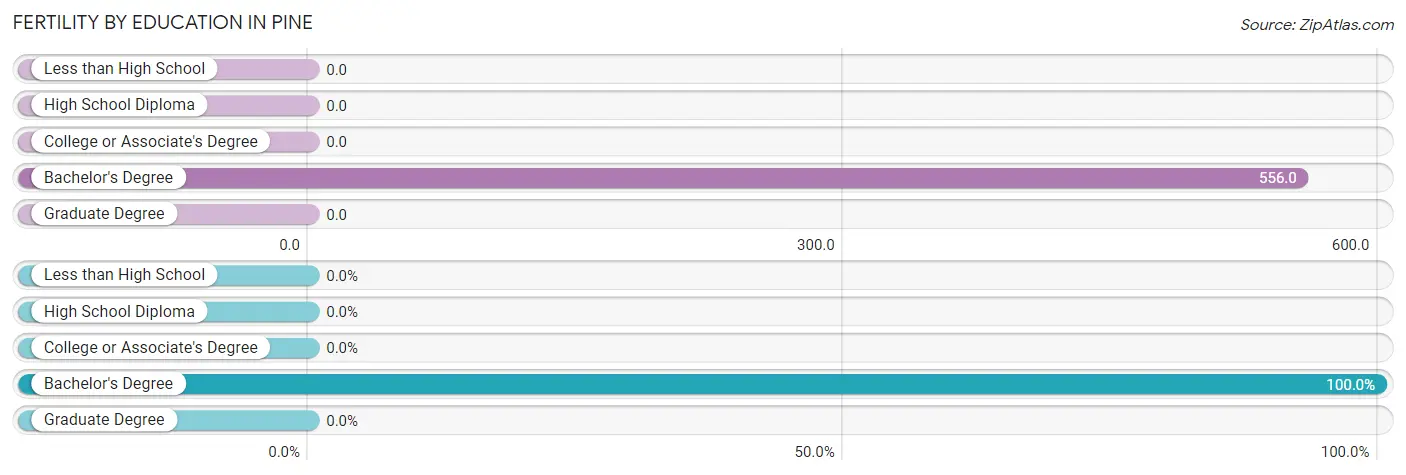
| Educational Attainment | Women with Births | Births / 1,000 Women |
| Less than High School | 0 (0.0%) | 0.0 |
| High School Diploma | 0 (0.0%) | 0.0 |
| College or Associate's Degree | 0 (0.0%) | 0.0 |
| Bachelor's Degree | 35 (100.0%) | 556.0 |
| Graduate Degree | 0 (0.0%) | 0.0 |
| Total | 35 (100.0%) | 422.0 |
Fertility by Education by Marriage Status in Pine
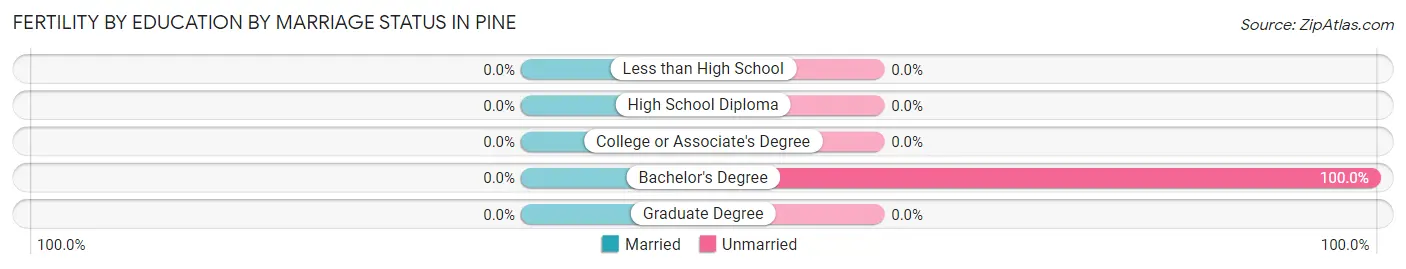
| Educational Attainment | Married | Unmarried |
| Less than High School | 0 (0.0%) | 0 (0.0%) |
| High School Diploma | 0 (0.0%) | 0 (0.0%) |
| College or Associate's Degree | 0 (0.0%) | 0 (0.0%) |
| Bachelor's Degree | 0 (0.0%) | 35 (100.0%) |
| Graduate Degree | 0 (0.0%) | 0 (0.0%) |
| Total | 0 (0.0%) | 35 (100.0%) |
Employment Characteristics in Pine
Employment by Class of Employer in Pine
Among the 456 employed individuals in Pine, private company employees (320 | 70.2%), state government employees (59 | 12.9%), and not-for-profit organizations (54 | 11.8%) make up the most common classes of employment.
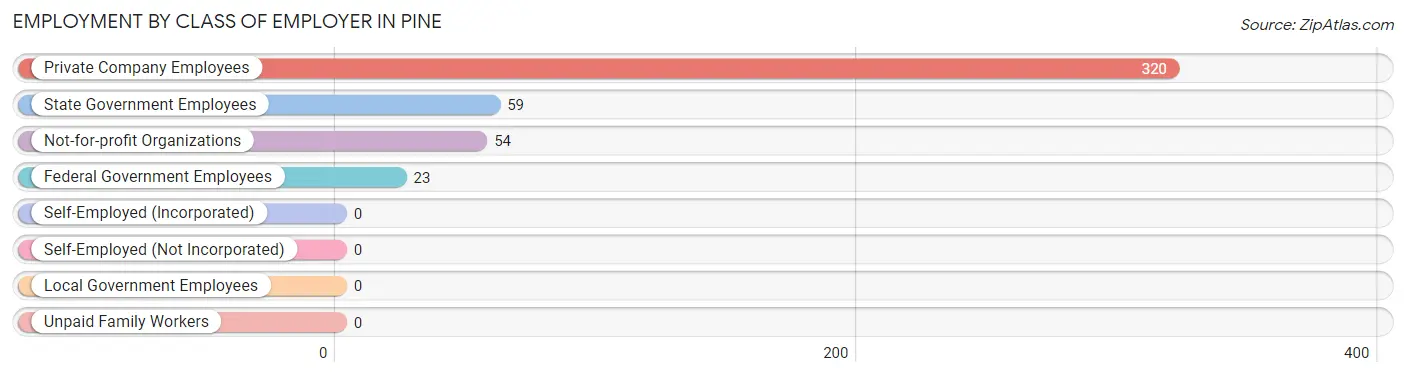
| Employer Class | # Employees | % Employees |
| Private Company Employees | 320 | 70.2% |
| Self-Employed (Incorporated) | 0 | 0.0% |
| Self-Employed (Not Incorporated) | 0 | 0.0% |
| Not-for-profit Organizations | 54 | 11.8% |
| Local Government Employees | 0 | 0.0% |
| State Government Employees | 59 | 12.9% |
| Federal Government Employees | 23 | 5.0% |
| Unpaid Family Workers | 0 | 0.0% |
| Total | 456 | 100.0% |
Employment Status by Age in Pine
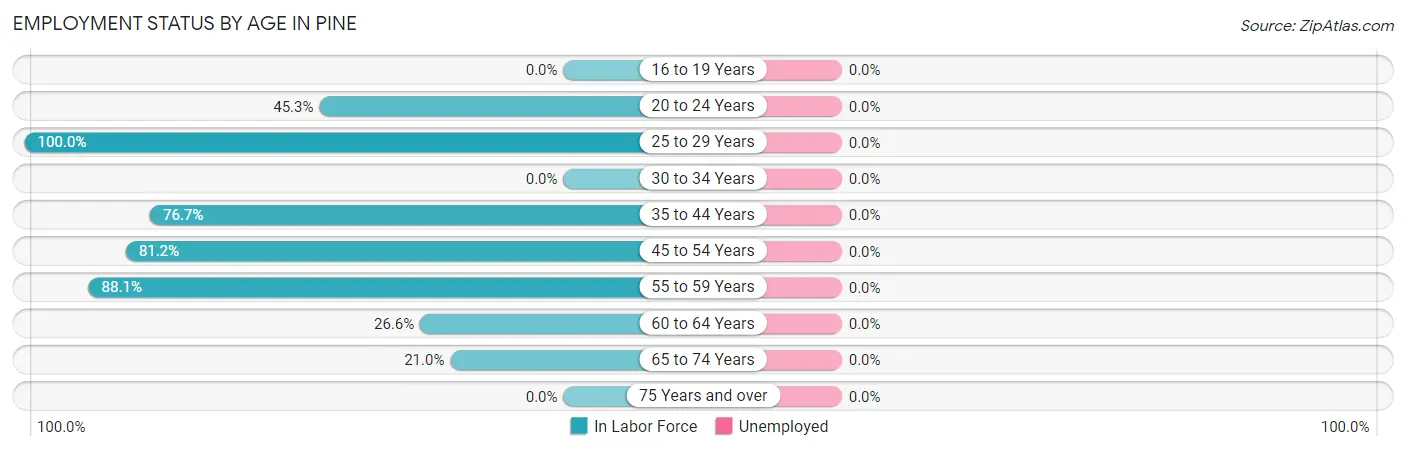
| Age Bracket | In Labor Force | Unemployed |
| 16 to 19 Years | 0 (0.0%) | 0 (0.0%) |
| 20 to 24 Years | 29 (45.3%) | 0 (0.0%) |
| 25 to 29 Years | 42 (100.0%) | 0 (0.0%) |
| 30 to 34 Years | 0 (0.0%) | 0 (0.0%) |
| 35 to 44 Years | 66 (76.7%) | 0 (0.0%) |
| 45 to 54 Years | 121 (81.2%) | 0 (0.0%) |
| 55 to 59 Years | 59 (88.1%) | 0 (0.0%) |
| 60 to 64 Years | 29 (26.6%) | 0 (0.0%) |
| 65 to 74 Years | 110 (21.0%) | 0 (0.0%) |
| 75 Years and over | 0 (0.0%) | 0 (0.0%) |
| Total | 456 (30.8%) | 0 (0.0%) |
Employment Status by Educational Attainment in Pine
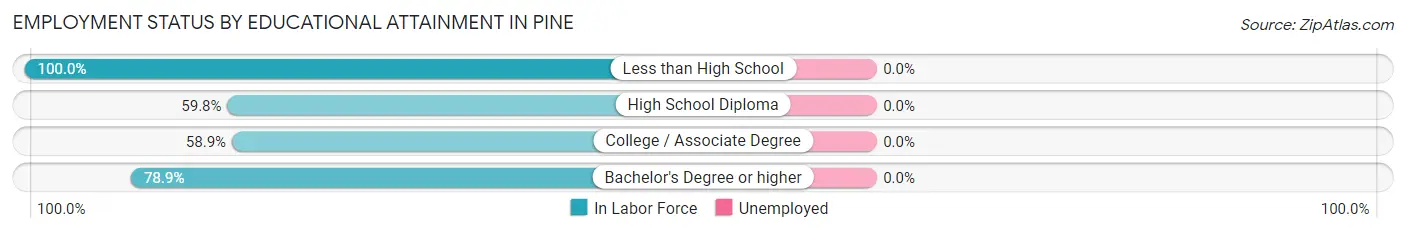
| Educational Attainment | In Labor Force | Unemployed |
| Less than High School | 29 (100.0%) | 0 (0.0%) |
| High School Diploma | 76 (59.8%) | 0 (0.0%) |
| College / Associate Degree | 66 (58.9%) | 0 (0.0%) |
| Bachelor's Degree or higher | 146 (78.9%) | 0 (0.0%) |
| Total | 317 (70.0%) | 0 (0.0%) |
Employment Occupations by Sex in Pine
Management, Business, Science and Arts Occupations
The most common Management, Business, Science and Arts occupations in Pine are Management (119 | 26.1%), Community & Social Service (92 | 20.2%), Arts, Media & Entertainment (65 | 14.2%), Health Diagnosing & Treating (54 | 11.8%), and Health Technologists (54 | 11.8%).
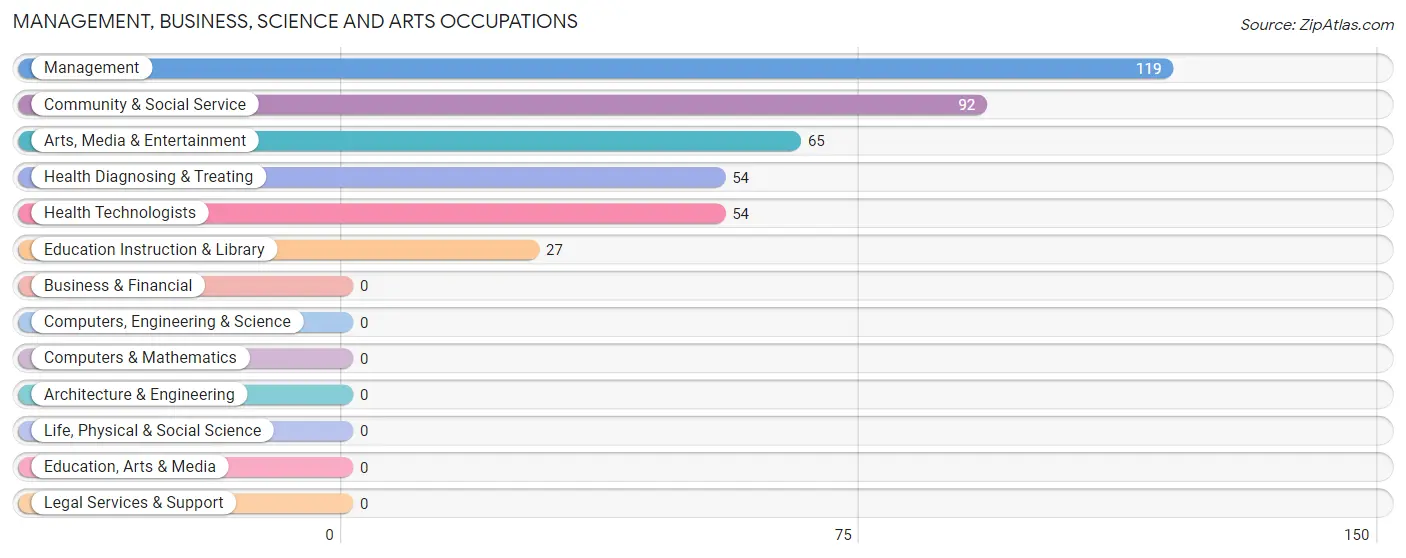
Management, Business, Science and Arts Occupations by Sex
Within the Management, Business, Science and Arts occupations in Pine, the most male-oriented occupations are Education Instruction & Library (100.0%), Health Diagnosing & Treating (100.0%), and Health Technologists (100.0%), while the most female-oriented occupations are Management (75.6%), Arts, Media & Entertainment (43.1%), and Community & Social Service (30.4%).
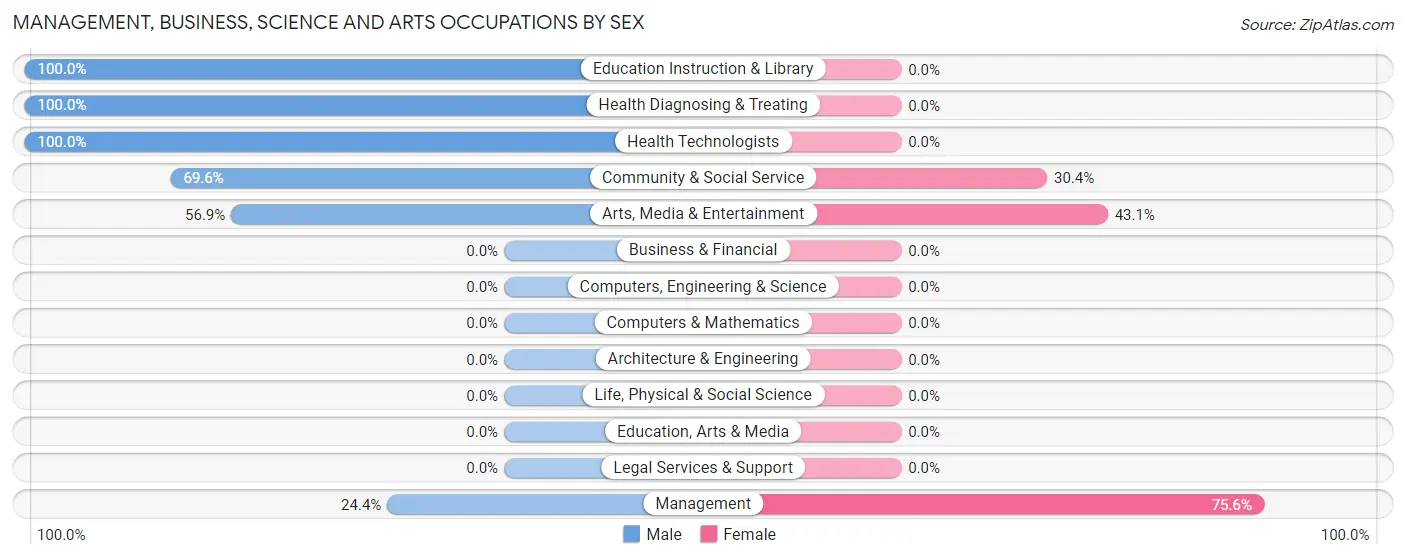
| Occupation | Male | Female |
| Management | 29 (24.4%) | 90 (75.6%) |
| Business & Financial | 0 (0.0%) | 0 (0.0%) |
| Computers, Engineering & Science | 0 (0.0%) | 0 (0.0%) |
| Computers & Mathematics | 0 (0.0%) | 0 (0.0%) |
| Architecture & Engineering | 0 (0.0%) | 0 (0.0%) |
| Life, Physical & Social Science | 0 (0.0%) | 0 (0.0%) |
| Community & Social Service | 64 (69.6%) | 28 (30.4%) |
| Education, Arts & Media | 0 (0.0%) | 0 (0.0%) |
| Legal Services & Support | 0 (0.0%) | 0 (0.0%) |
| Education Instruction & Library | 27 (100.0%) | 0 (0.0%) |
| Arts, Media & Entertainment | 37 (56.9%) | 28 (43.1%) |
| Health Diagnosing & Treating | 54 (100.0%) | 0 (0.0%) |
| Health Technologists | 54 (100.0%) | 0 (0.0%) |
| Total (Category) | 147 (55.5%) | 118 (44.5%) |
| Total (Overall) | 271 (59.4%) | 185 (40.6%) |
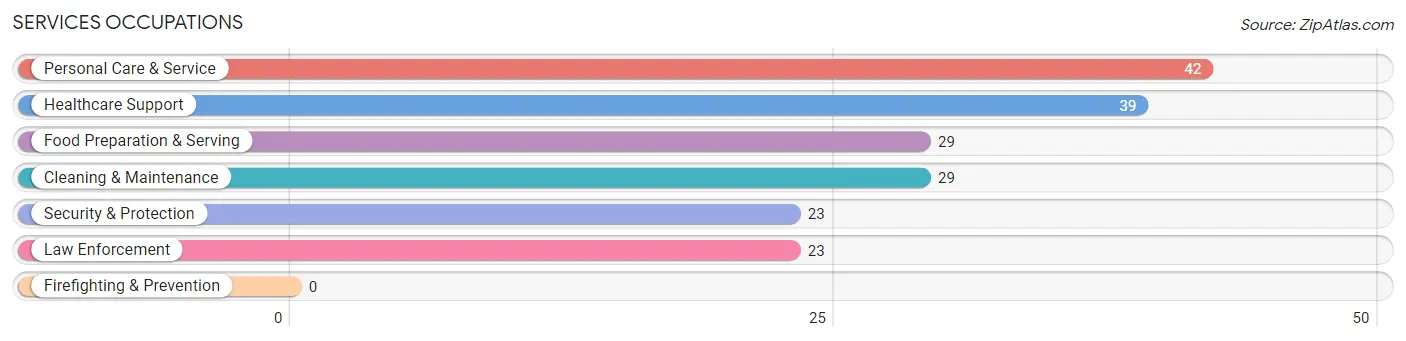
Services Occupations
The most common Services occupations in Pine are Personal Care & Service (42 | 9.2%), Healthcare Support (39 | 8.6%), Food Preparation & Serving (29 | 6.4%), Cleaning & Maintenance (29 | 6.4%), and Security & Protection (23 | 5.0%).
Services Occupations by Sex
Within the Services occupations in Pine, the most male-oriented occupations are Security & Protection (100.0%), Law Enforcement (100.0%), and Cleaning & Maintenance (100.0%), while the most female-oriented occupations are Healthcare Support (100.0%), and Food Preparation & Serving (96.6%).
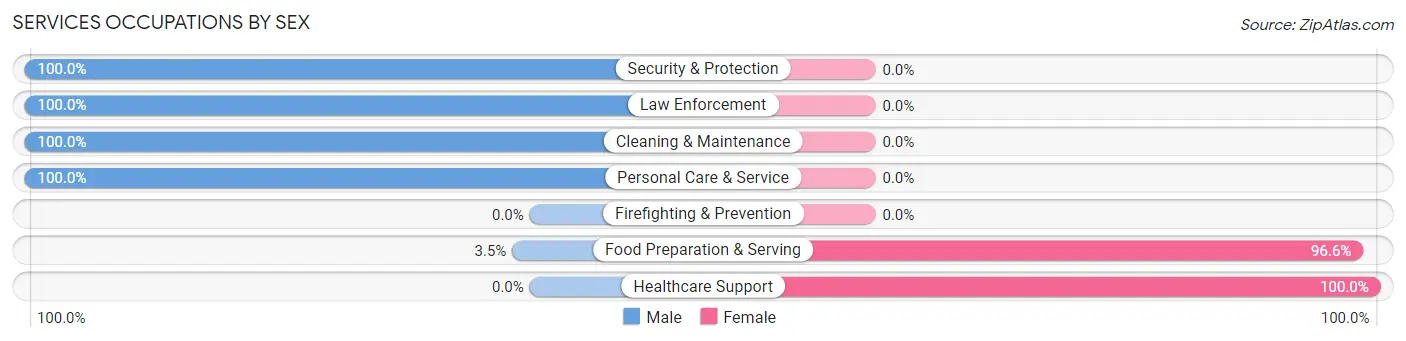
| Occupation | Male | Female |
| Healthcare Support | 0 (0.0%) | 39 (100.0%) |
| Security & Protection | 23 (100.0%) | 0 (0.0%) |
| Firefighting & Prevention | 0 (0.0%) | 0 (0.0%) |
| Law Enforcement | 23 (100.0%) | 0 (0.0%) |
| Food Preparation & Serving | 1 (3.5%) | 28 (96.6%) |
| Cleaning & Maintenance | 29 (100.0%) | 0 (0.0%) |
| Personal Care & Service | 42 (100.0%) | 0 (0.0%) |
| Total (Category) | 95 (58.6%) | 67 (41.4%) |
| Total (Overall) | 271 (59.4%) | 185 (40.6%) |
Sales and Office Occupations
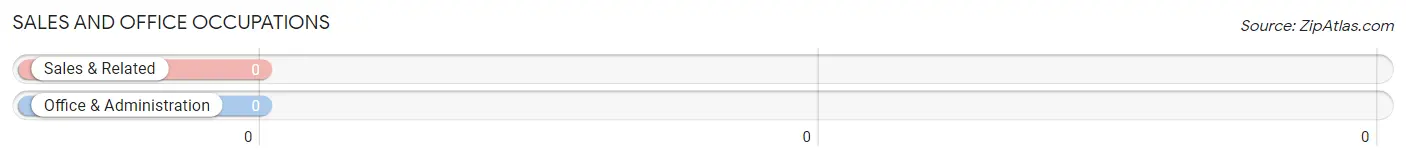
Sales and Office Occupations by Sex
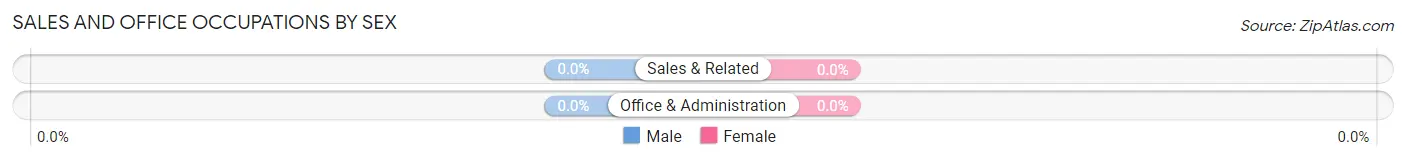
| Occupation | Male | Female |
| Sales & Related | 0 (0.0%) | 0 (0.0%) |
| Office & Administration | 0 (0.0%) | 0 (0.0%) |
| Total (Category) | 0 (0.0%) | 0 (0.0%) |
| Total (Overall) | 271 (59.4%) | 185 (40.6%) |
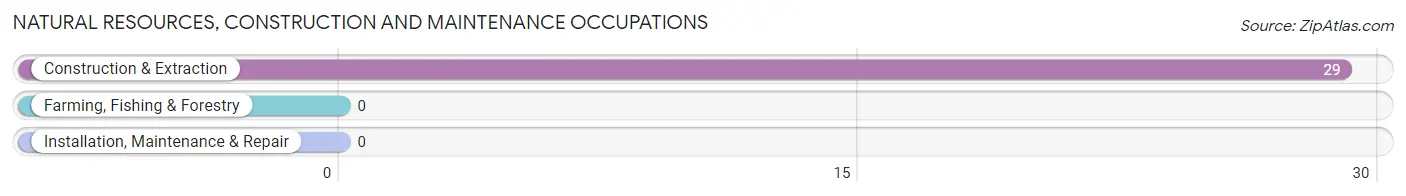
Natural Resources, Construction and Maintenance Occupations
The most common Natural Resources, Construction and Maintenance occupations in Pine are , and Construction & Extraction (29 | 6.4%).
Natural Resources, Construction and Maintenance Occupations by Sex
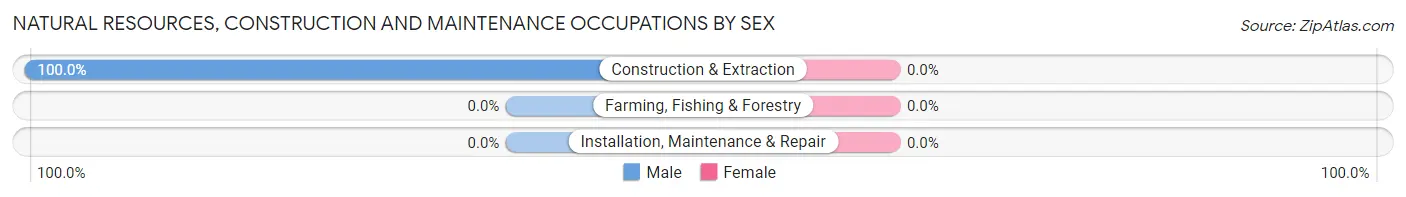
| Occupation | Male | Female |
| Farming, Fishing & Forestry | 0 (0.0%) | 0 (0.0%) |
| Construction & Extraction | 29 (100.0%) | 0 (0.0%) |
| Installation, Maintenance & Repair | 0 (0.0%) | 0 (0.0%) |
| Total (Category) | 29 (100.0%) | 0 (0.0%) |
| Total (Overall) | 271 (59.4%) | 185 (40.6%) |
Production, Transportation and Moving Occupations
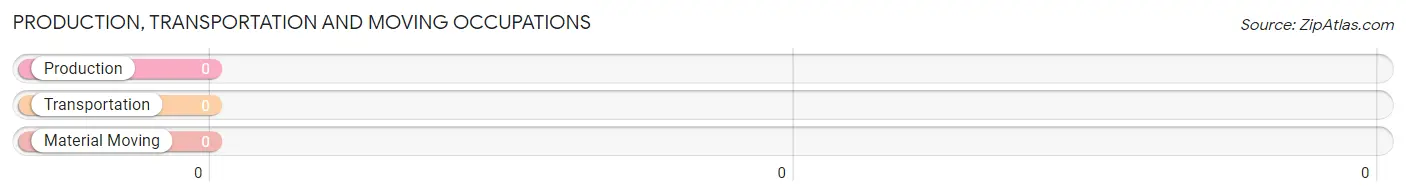
Production, Transportation and Moving Occupations by Sex
| Occupation | Male | Female |
| Production | 0 (0.0%) | 0 (0.0%) |
| Transportation | 0 (0.0%) | 0 (0.0%) |
| Material Moving | 0 (0.0%) | 0 (0.0%) |
| Total (Category) | 0 (0.0%) | 0 (0.0%) |
| Total (Overall) | 271 (59.4%) | 185 (40.6%) |
Employment Industries by Sex in Pine
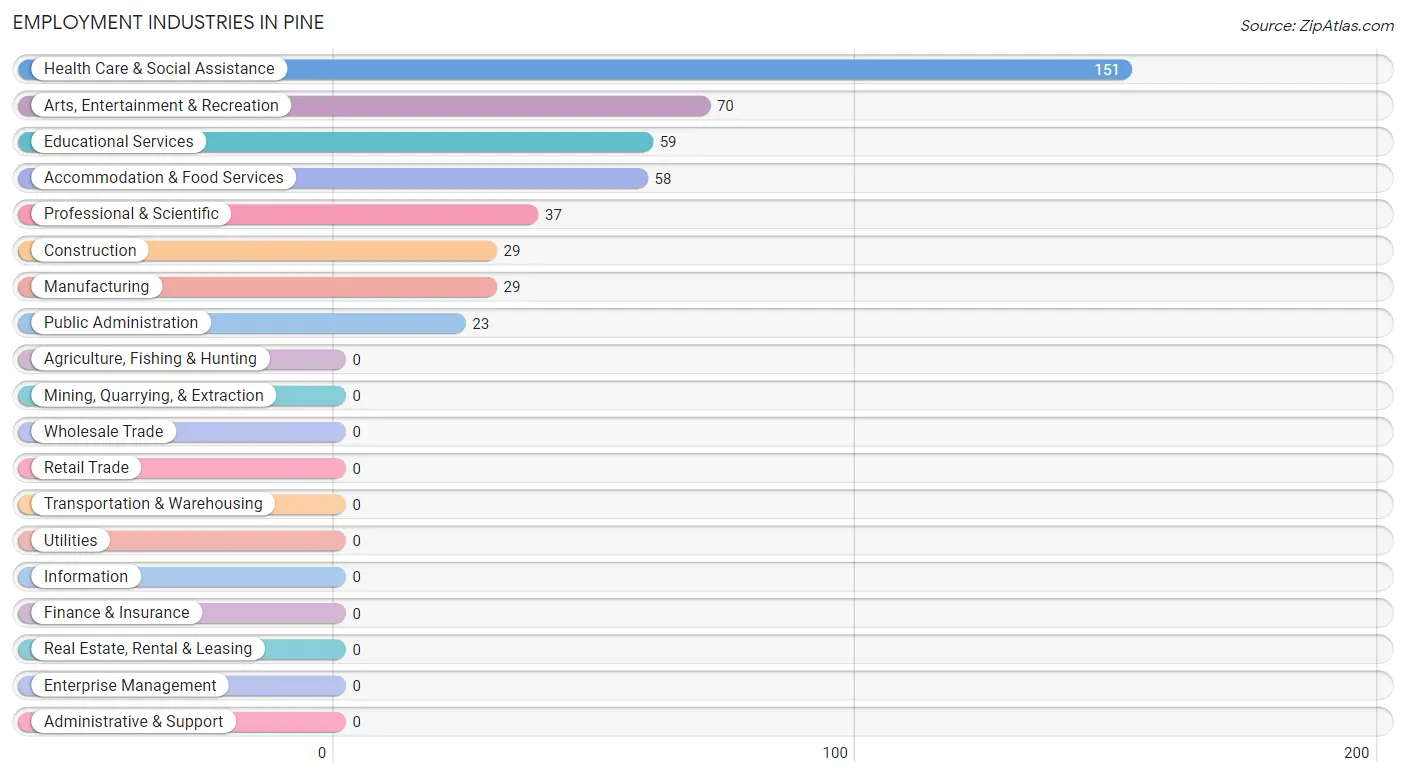
Employment Industries in Pine
The major employment industries in Pine include Health Care & Social Assistance (151 | 33.1%), Arts, Entertainment & Recreation (70 | 15.3%), Educational Services (59 | 12.9%), Accommodation & Food Services (58 | 12.7%), and Professional & Scientific (37 | 8.1%).
Employment Industries by Sex in Pine
The Pine industries that see more men than women are Construction (100.0%), Manufacturing (100.0%), and Professional & Scientific (100.0%), whereas the industries that tend to have a higher number of women are Health Care & Social Assistance (64.2%), Educational Services (54.2%), and Accommodation & Food Services (48.3%).
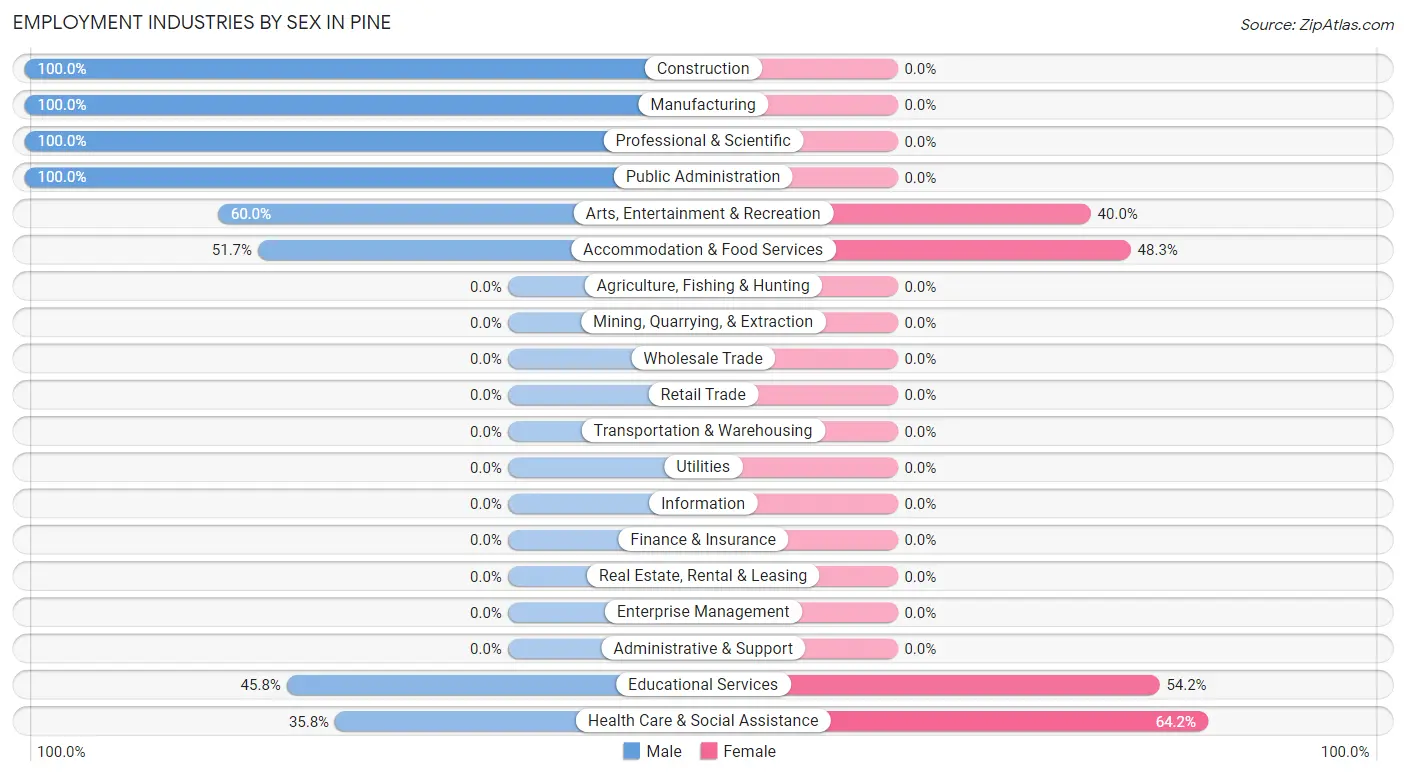
| Industry | Male | Female |
| Agriculture, Fishing & Hunting | 0 (0.0%) | 0 (0.0%) |
| Mining, Quarrying, & Extraction | 0 (0.0%) | 0 (0.0%) |
| Construction | 29 (100.0%) | 0 (0.0%) |
| Manufacturing | 29 (100.0%) | 0 (0.0%) |
| Wholesale Trade | 0 (0.0%) | 0 (0.0%) |
| Retail Trade | 0 (0.0%) | 0 (0.0%) |
| Transportation & Warehousing | 0 (0.0%) | 0 (0.0%) |
| Utilities | 0 (0.0%) | 0 (0.0%) |
| Information | 0 (0.0%) | 0 (0.0%) |
| Finance & Insurance | 0 (0.0%) | 0 (0.0%) |
| Real Estate, Rental & Leasing | 0 (0.0%) | 0 (0.0%) |
| Professional & Scientific | 37 (100.0%) | 0 (0.0%) |
| Enterprise Management | 0 (0.0%) | 0 (0.0%) |
| Administrative & Support | 0 (0.0%) | 0 (0.0%) |
| Educational Services | 27 (45.8%) | 32 (54.2%) |
| Health Care & Social Assistance | 54 (35.8%) | 97 (64.2%) |
| Arts, Entertainment & Recreation | 42 (60.0%) | 28 (40.0%) |
| Accommodation & Food Services | 30 (51.7%) | 28 (48.3%) |
| Public Administration | 23 (100.0%) | 0 (0.0%) |
| Total | 271 (59.4%) | 185 (40.6%) |
Education in Pine
School Enrollment in Pine
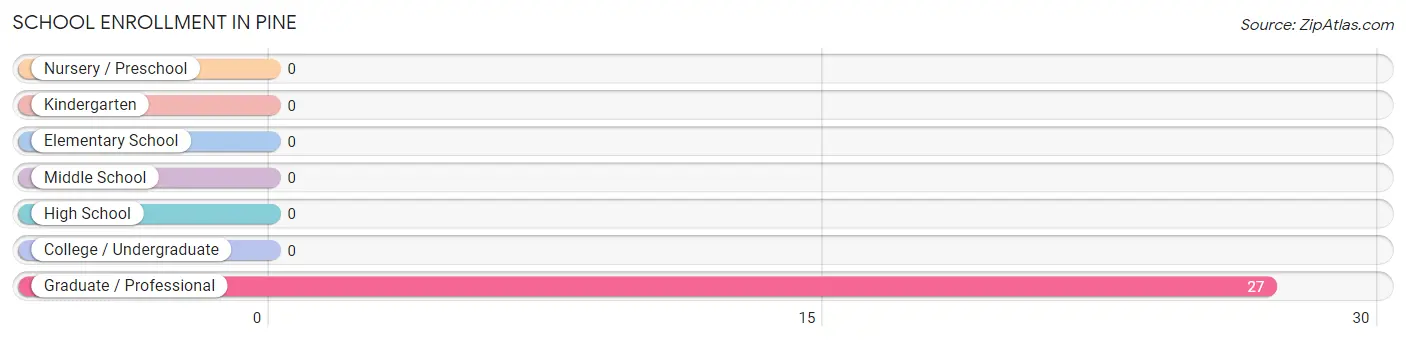
| School Level | # Students | % Students |
| Nursery / Preschool | 0 | 0.0% |
| Kindergarten | 0 | 0.0% |
| Elementary School | 0 | 0.0% |
| Middle School | 0 | 0.0% |
| High School | 0 | 0.0% |
| College / Undergraduate | 0 | 0.0% |
| Graduate / Professional | 27 | 100.0% |
| Total | 27 | 100.0% |
School Enrollment by Age by Funding Source in Pine
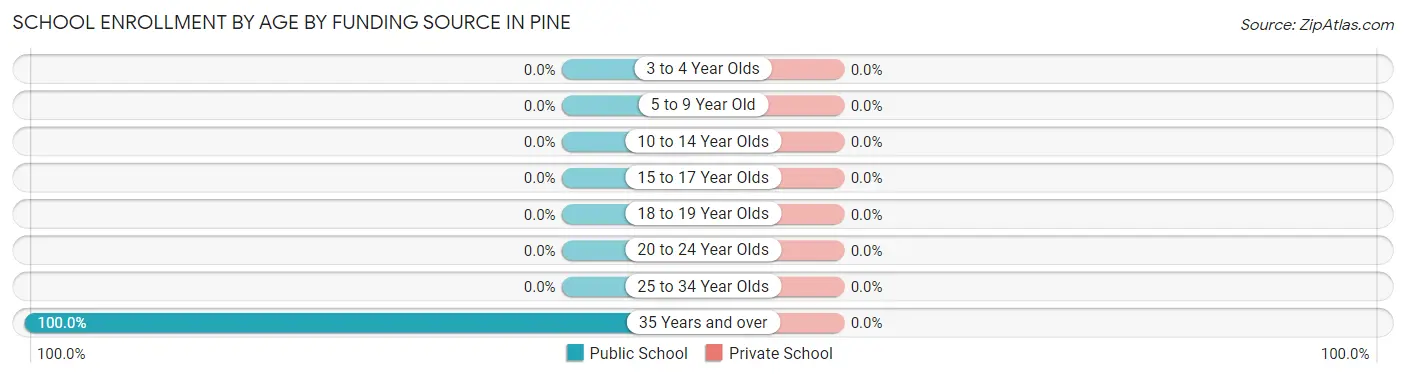
| Age Bracket | Public School | Private School |
| 3 to 4 Year Olds | 0 (0.0%) | 0 (0.0%) |
| 5 to 9 Year Old | 0 (0.0%) | 0 (0.0%) |
| 10 to 14 Year Olds | 0 (0.0%) | 0 (0.0%) |
| 15 to 17 Year Olds | 0 (0.0%) | 0 (0.0%) |
| 18 to 19 Year Olds | 0 (0.0%) | 0 (0.0%) |
| 20 to 24 Year Olds | 0 (0.0%) | 0 (0.0%) |
| 25 to 34 Year Olds | 0 (0.0%) | 0 (0.0%) |
| 35 Years and over | 27 (100.0%) | 0 (0.0%) |
| Total | 27 (100.0%) | 0 (0.0%) |
Educational Attainment by Field of Study in Pine
Education (131 | 30.2%), business (121 | 27.9%), liberal arts & history (65 | 15.0%), arts & humanities (32 | 7.4%), and social sciences (29 | 6.7%) are the most common fields of study among 433 individuals in Pine who have obtained a bachelor's degree or higher.
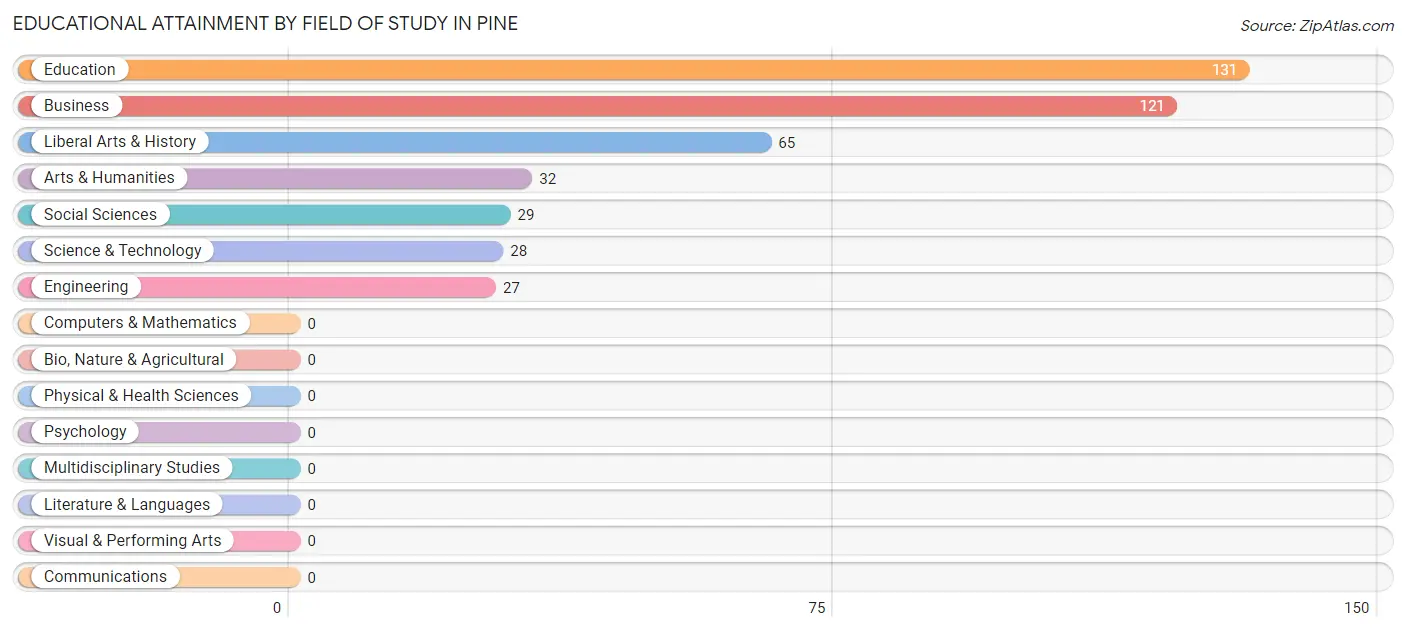
| Field of Study | # Graduates | % Graduates |
| Computers & Mathematics | 0 | 0.0% |
| Bio, Nature & Agricultural | 0 | 0.0% |
| Physical & Health Sciences | 0 | 0.0% |
| Psychology | 0 | 0.0% |
| Social Sciences | 29 | 6.7% |
| Engineering | 27 | 6.2% |
| Multidisciplinary Studies | 0 | 0.0% |
| Science & Technology | 28 | 6.5% |
| Business | 121 | 27.9% |
| Education | 131 | 30.2% |
| Literature & Languages | 0 | 0.0% |
| Liberal Arts & History | 65 | 15.0% |
| Visual & Performing Arts | 0 | 0.0% |
| Communications | 0 | 0.0% |
| Arts & Humanities | 32 | 7.4% |
| Total | 433 | 100.0% |
Transportation & Commute in Pine
Vehicle Availability by Sex in Pine
The most prevalent vehicle ownership categories in Pine are males with 2 vehicles (162, accounting for 60.0%) and females with 2 vehicles (125, making up 87.6%).
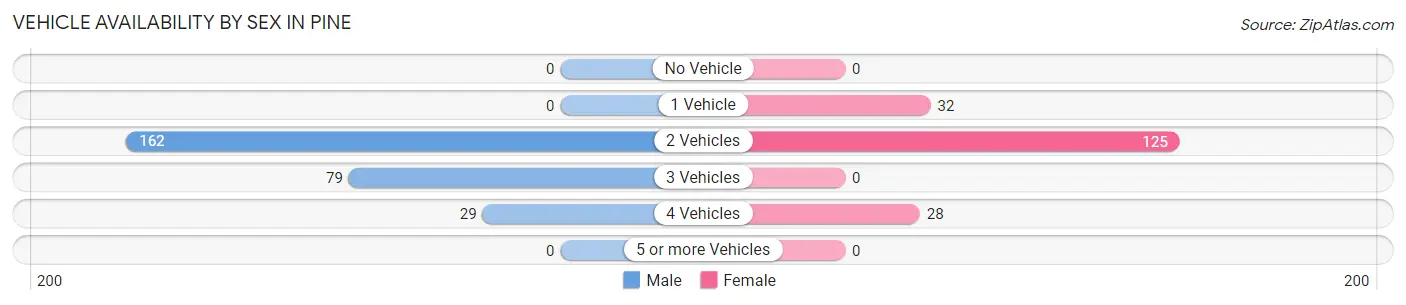
| Vehicles Available | Male | Female |
| No Vehicle | 0 (0.0%) | 0 (0.0%) |
| 1 Vehicle | 0 (0.0%) | 32 (17.3%) |
| 2 Vehicles | 162 (60.0%) | 125 (67.6%) |
| 3 Vehicles | 79 (29.3%) | 0 (0.0%) |
| 4 Vehicles | 29 (10.7%) | 28 (15.1%) |
| 5 or more Vehicles | 0 (0.0%) | 0 (0.0%) |
| Total | 270 (100.0%) | 185 (100.0%) |
Commute Time in Pine
The most frequently occuring commute durations in Pine are 30 to 34 minutes (138 commuters, 35.3%), 15 to 19 minutes (87 commuters, 22.3%), and 25 to 29 minutes (54 commuters, 13.8%).
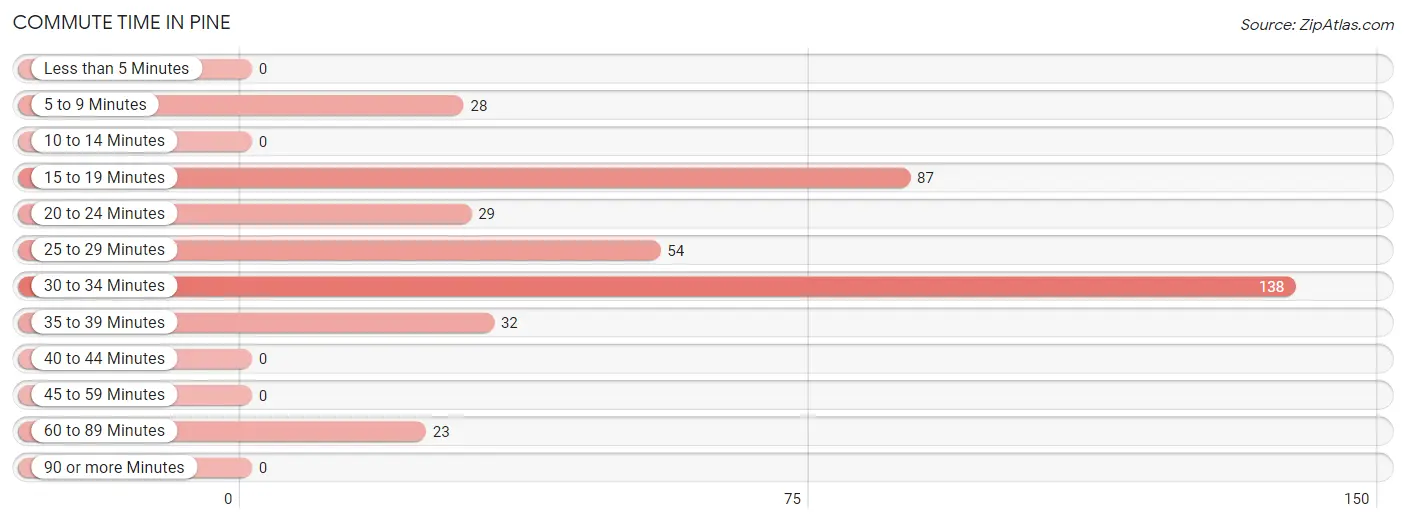
| Commute Time | # Commuters | % Commuters |
| Less than 5 Minutes | 0 | 0.0% |
| 5 to 9 Minutes | 28 | 7.2% |
| 10 to 14 Minutes | 0 | 0.0% |
| 15 to 19 Minutes | 87 | 22.3% |
| 20 to 24 Minutes | 29 | 7.4% |
| 25 to 29 Minutes | 54 | 13.8% |
| 30 to 34 Minutes | 138 | 35.3% |
| 35 to 39 Minutes | 32 | 8.2% |
| 40 to 44 Minutes | 0 | 0.0% |
| 45 to 59 Minutes | 0 | 0.0% |
| 60 to 89 Minutes | 23 | 5.9% |
| 90 or more Minutes | 0 | 0.0% |
Commute Time by Sex in Pine
The most common commute times in Pine are 30 to 34 minutes (71 commuters, 30.3%) for males and 30 to 34 minutes (67 commuters, 42.7%) for females.
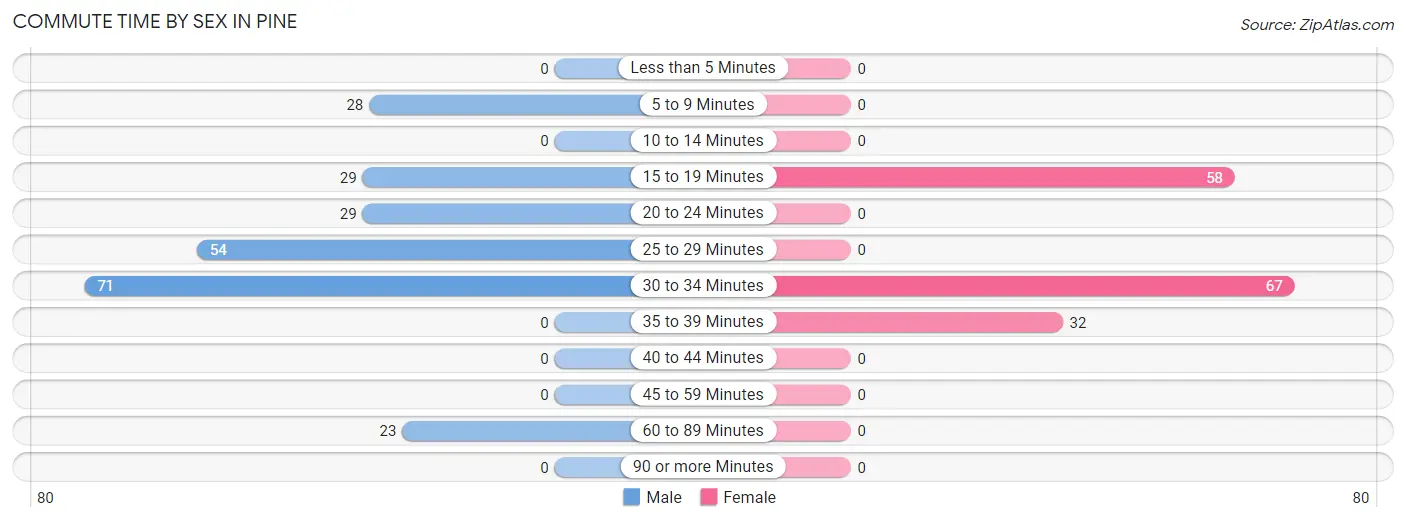
| Commute Time | Male | Female |
| Less than 5 Minutes | 0 (0.0%) | 0 (0.0%) |
| 5 to 9 Minutes | 28 (12.0%) | 0 (0.0%) |
| 10 to 14 Minutes | 0 (0.0%) | 0 (0.0%) |
| 15 to 19 Minutes | 29 (12.4%) | 58 (36.9%) |
| 20 to 24 Minutes | 29 (12.4%) | 0 (0.0%) |
| 25 to 29 Minutes | 54 (23.1%) | 0 (0.0%) |
| 30 to 34 Minutes | 71 (30.3%) | 67 (42.7%) |
| 35 to 39 Minutes | 0 (0.0%) | 32 (20.4%) |
| 40 to 44 Minutes | 0 (0.0%) | 0 (0.0%) |
| 45 to 59 Minutes | 0 (0.0%) | 0 (0.0%) |
| 60 to 89 Minutes | 23 (9.8%) | 0 (0.0%) |
| 90 or more Minutes | 0 (0.0%) | 0 (0.0%) |
Time of Departure to Work by Sex in Pine
The most frequent times of departure to work in Pine are 6:30 AM to 6:59 AM (83, 35.5%) for males and 7:30 AM to 7:59 AM (58, 36.9%) for females.
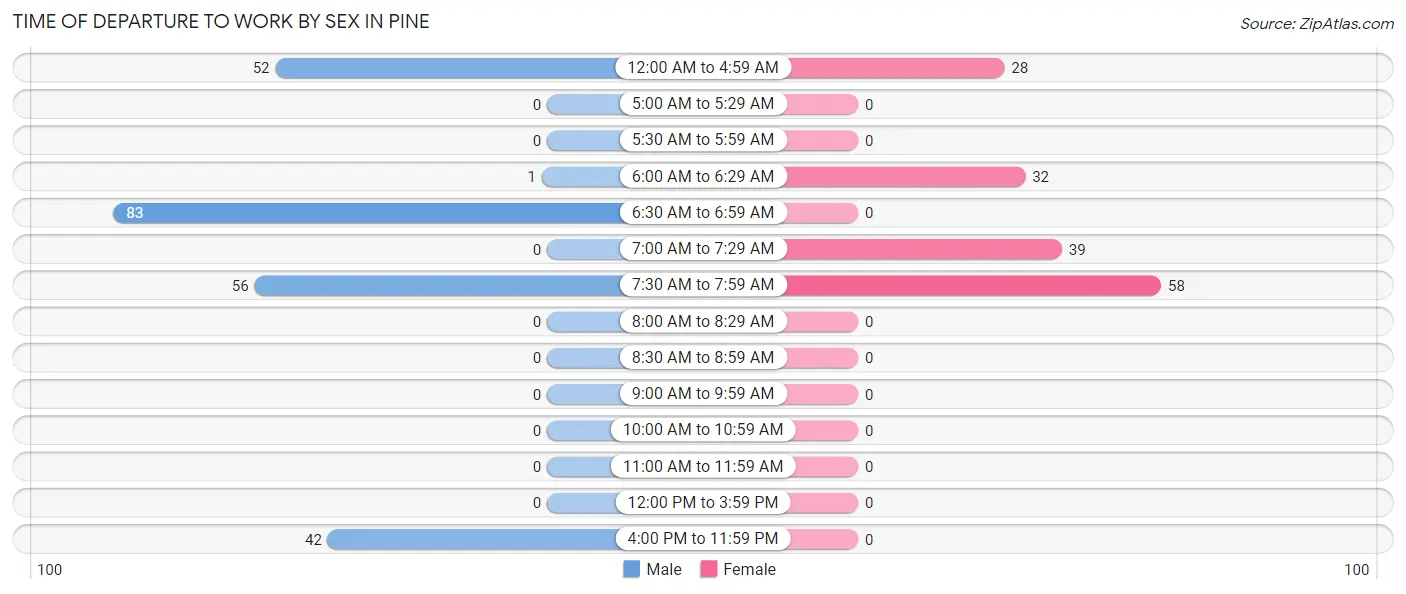
| Time of Departure | Male | Female |
| 12:00 AM to 4:59 AM | 52 (22.2%) | 28 (17.8%) |
| 5:00 AM to 5:29 AM | 0 (0.0%) | 0 (0.0%) |
| 5:30 AM to 5:59 AM | 0 (0.0%) | 0 (0.0%) |
| 6:00 AM to 6:29 AM | 1 (0.4%) | 32 (20.4%) |
| 6:30 AM to 6:59 AM | 83 (35.5%) | 0 (0.0%) |
| 7:00 AM to 7:29 AM | 0 (0.0%) | 39 (24.8%) |
| 7:30 AM to 7:59 AM | 56 (23.9%) | 58 (36.9%) |
| 8:00 AM to 8:29 AM | 0 (0.0%) | 0 (0.0%) |
| 8:30 AM to 8:59 AM | 0 (0.0%) | 0 (0.0%) |
| 9:00 AM to 9:59 AM | 0 (0.0%) | 0 (0.0%) |
| 10:00 AM to 10:59 AM | 0 (0.0%) | 0 (0.0%) |
| 11:00 AM to 11:59 AM | 0 (0.0%) | 0 (0.0%) |
| 12:00 PM to 3:59 PM | 0 (0.0%) | 0 (0.0%) |
| 4:00 PM to 11:59 PM | 42 (17.9%) | 0 (0.0%) |
| Total | 234 (100.0%) | 157 (100.0%) |
Housing Occupancy in Pine
Occupancy by Ownership in Pine
Of the total 829 dwellings in Pine, owner-occupied units account for 713 (86.0%), while renter-occupied units make up 116 (14.0%).
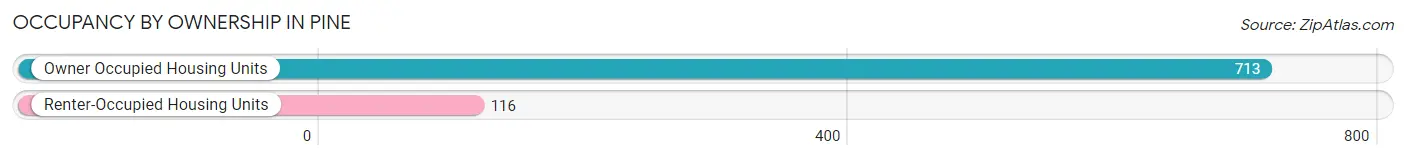
| Occupancy | # Housing Units | % Housing Units |
| Owner Occupied Housing Units | 713 | 86.0% |
| Renter-Occupied Housing Units | 116 | 14.0% |
| Total Occupied Housing Units | 829 | 100.0% |
Occupancy by Household Size in Pine
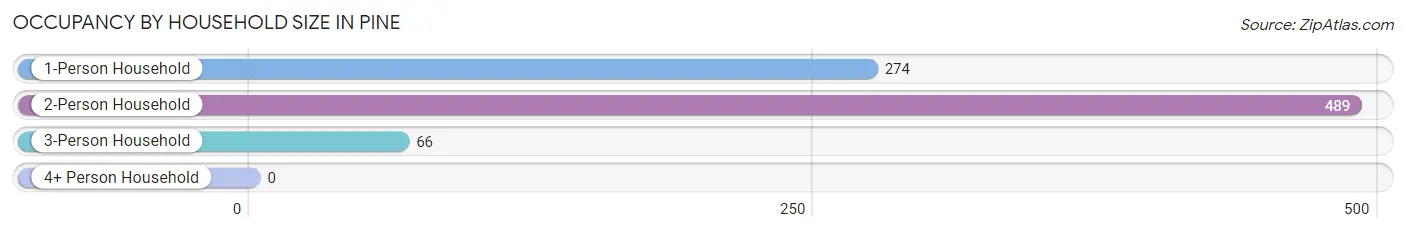
| Household Size | # Housing Units | % Housing Units |
| 1-Person Household | 274 | 33.1% |
| 2-Person Household | 489 | 59.0% |
| 3-Person Household | 66 | 8.0% |
| 4+ Person Household | 0 | 0.0% |
| Total Housing Units | 829 | 100.0% |
Occupancy by Ownership by Household Size in Pine
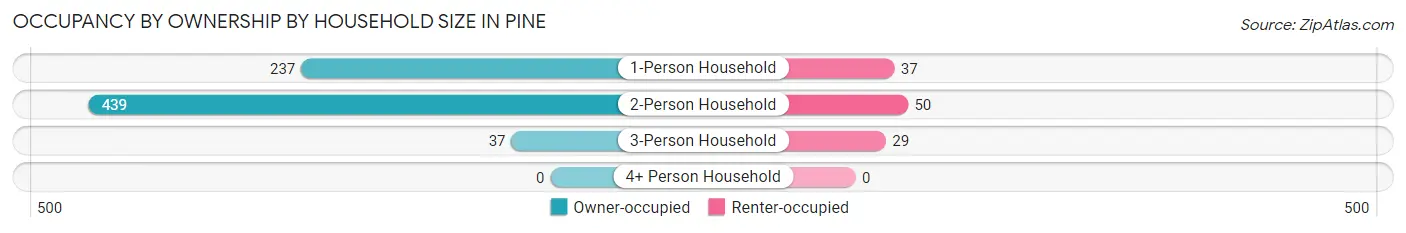
| Household Size | Owner-occupied | Renter-occupied |
| 1-Person Household | 237 (86.5%) | 37 (13.5%) |
| 2-Person Household | 439 (89.8%) | 50 (10.2%) |
| 3-Person Household | 37 (56.1%) | 29 (43.9%) |
| 4+ Person Household | 0 (0.0%) | 0 (0.0%) |
| Total Housing Units | 713 (86.0%) | 116 (14.0%) |
Occupancy by Educational Attainment in Pine
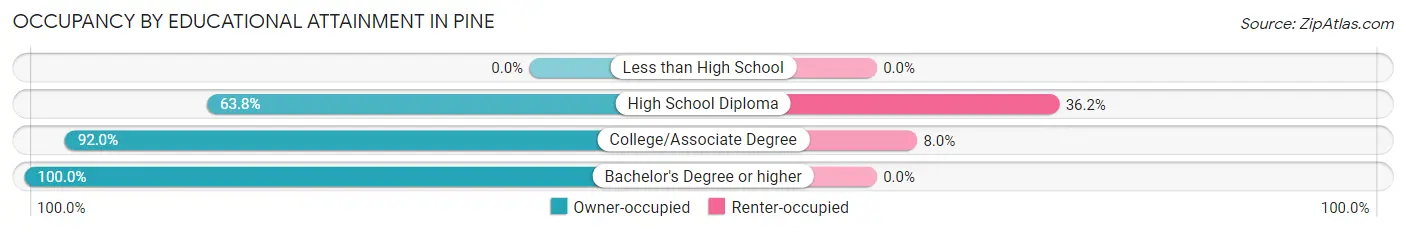
| Household Size | Owner-occupied | Renter-occupied |
| Less than High School | 0 (0.0%) | 0 (0.0%) |
| High School Diploma | 164 (63.8%) | 93 (36.2%) |
| College/Associate Degree | 265 (92.0%) | 23 (8.0%) |
| Bachelor's Degree or higher | 284 (100.0%) | 0 (0.0%) |
Occupancy by Age of Householder in Pine
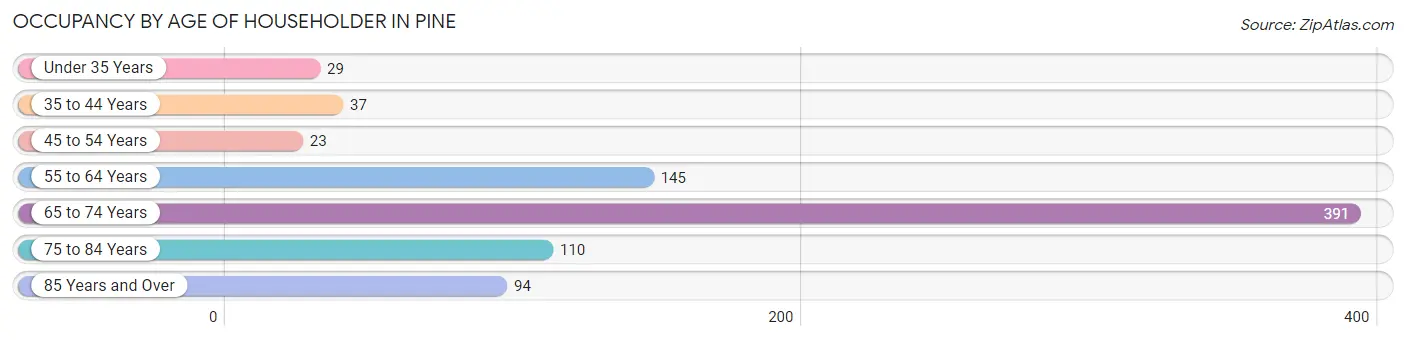
| Age Bracket | # Households | % Households |
| Under 35 Years | 29 | 3.5% |
| 35 to 44 Years | 37 | 4.5% |
| 45 to 54 Years | 23 | 2.8% |
| 55 to 64 Years | 145 | 17.5% |
| 65 to 74 Years | 391 | 47.2% |
| 75 to 84 Years | 110 | 13.3% |
| 85 Years and Over | 94 | 11.3% |
| Total | 829 | 100.0% |
Housing Finances in Pine
Median Income by Occupancy in Pine
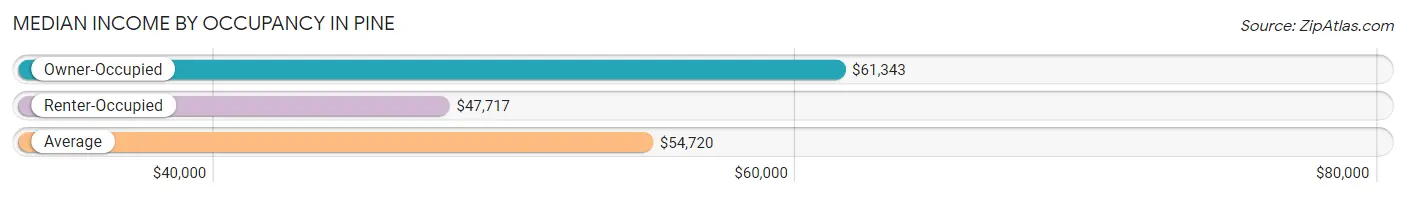
| Occupancy Type | # Households | Median Income |
| Owner-Occupied | 713 (86.0%) | $61,343 |
| Renter-Occupied | 116 (14.0%) | $47,717 |
| Average | 829 (100.0%) | $54,720 |
Occupancy by Householder Income Bracket in Pine
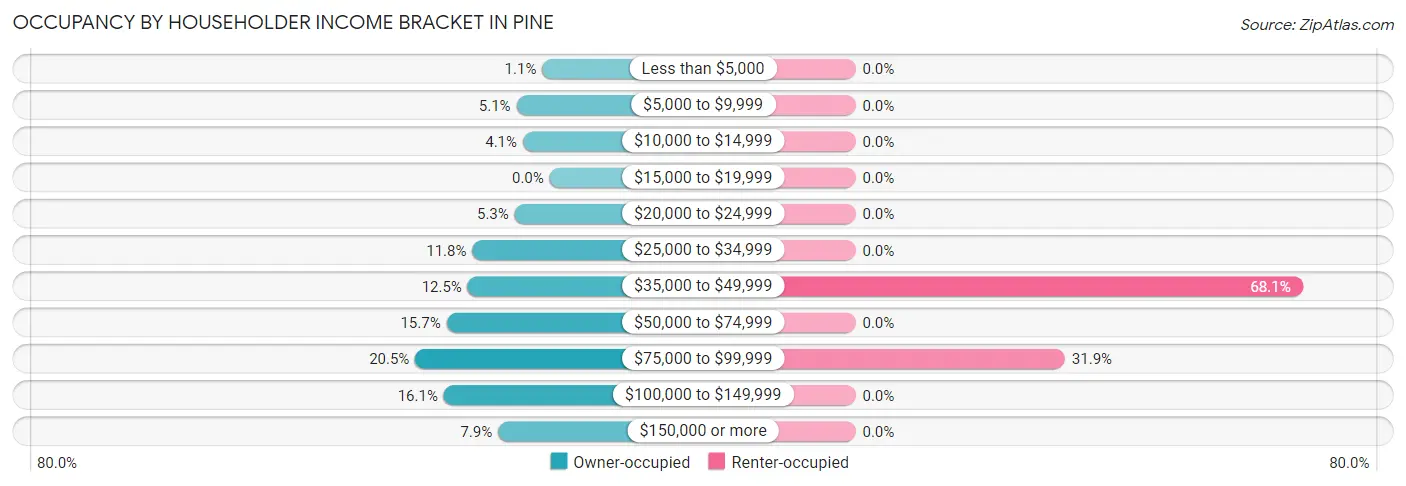
| Income Bracket | Owner-occupied | Renter-occupied |
| Less than $5,000 | 8 (1.1%) | 0 (0.0%) |
| $5,000 to $9,999 | 36 (5.1%) | 0 (0.0%) |
| $10,000 to $14,999 | 29 (4.1%) | 0 (0.0%) |
| $15,000 to $19,999 | 0 (0.0%) | 0 (0.0%) |
| $20,000 to $24,999 | 38 (5.3%) | 0 (0.0%) |
| $25,000 to $34,999 | 84 (11.8%) | 0 (0.0%) |
| $35,000 to $49,999 | 89 (12.5%) | 79 (68.1%) |
| $50,000 to $74,999 | 112 (15.7%) | 0 (0.0%) |
| $75,000 to $99,999 | 146 (20.5%) | 37 (31.9%) |
| $100,000 to $149,999 | 115 (16.1%) | 0 (0.0%) |
| $150,000 or more | 56 (7.9%) | 0 (0.0%) |
| Total | 713 (100.0%) | 116 (100.0%) |
Monthly Housing Cost Tiers in Pine
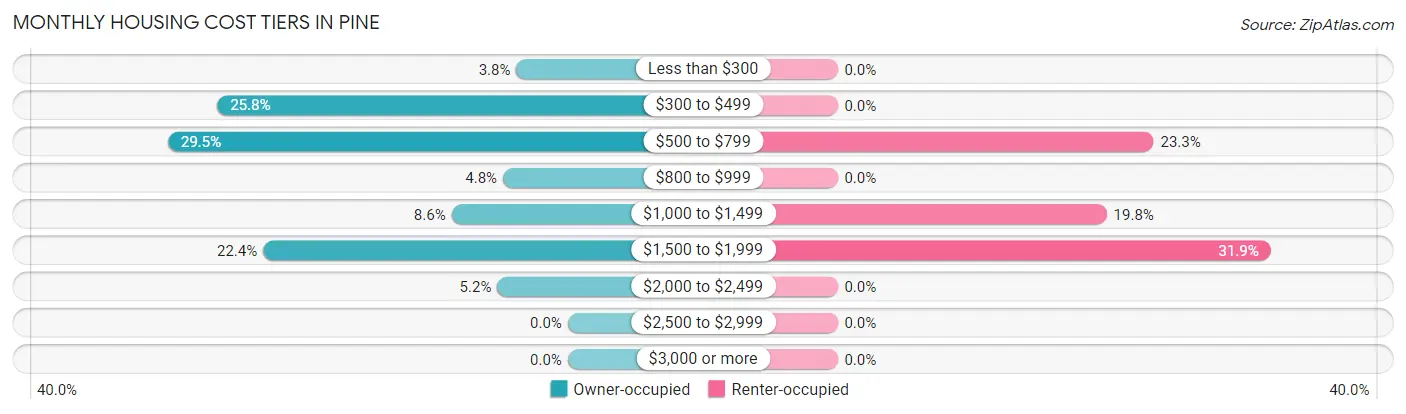
| Monthly Cost | Owner-occupied | Renter-occupied |
| Less than $300 | 27 (3.8%) | 0 (0.0%) |
| $300 to $499 | 184 (25.8%) | 0 (0.0%) |
| $500 to $799 | 210 (29.4%) | 27 (23.3%) |
| $800 to $999 | 34 (4.8%) | 0 (0.0%) |
| $1,000 to $1,499 | 61 (8.6%) | 23 (19.8%) |
| $1,500 to $1,999 | 160 (22.4%) | 37 (31.9%) |
| $2,000 to $2,499 | 37 (5.2%) | 0 (0.0%) |
| $2,500 to $2,999 | 0 (0.0%) | 0 (0.0%) |
| $3,000 or more | 0 (0.0%) | 0 (0.0%) |
| Total | 713 (100.0%) | 116 (100.0%) |
Physical Housing Characteristics in Pine
Housing Structures in Pine
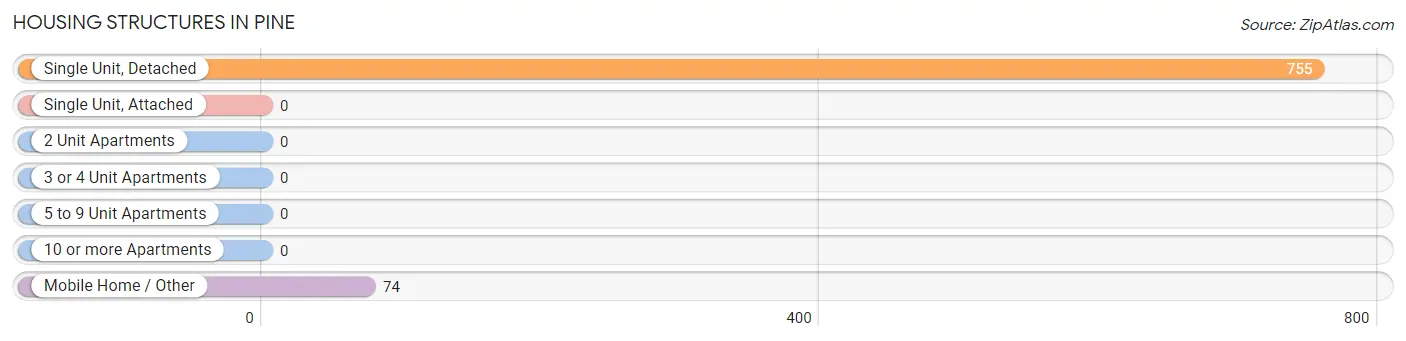
| Structure Type | # Housing Units | % Housing Units |
| Single Unit, Detached | 755 | 91.1% |
| Single Unit, Attached | 0 | 0.0% |
| 2 Unit Apartments | 0 | 0.0% |
| 3 or 4 Unit Apartments | 0 | 0.0% |
| 5 to 9 Unit Apartments | 0 | 0.0% |
| 10 or more Apartments | 0 | 0.0% |
| Mobile Home / Other | 74 | 8.9% |
| Total | 829 | 100.0% |
Housing Structures by Occupancy in Pine
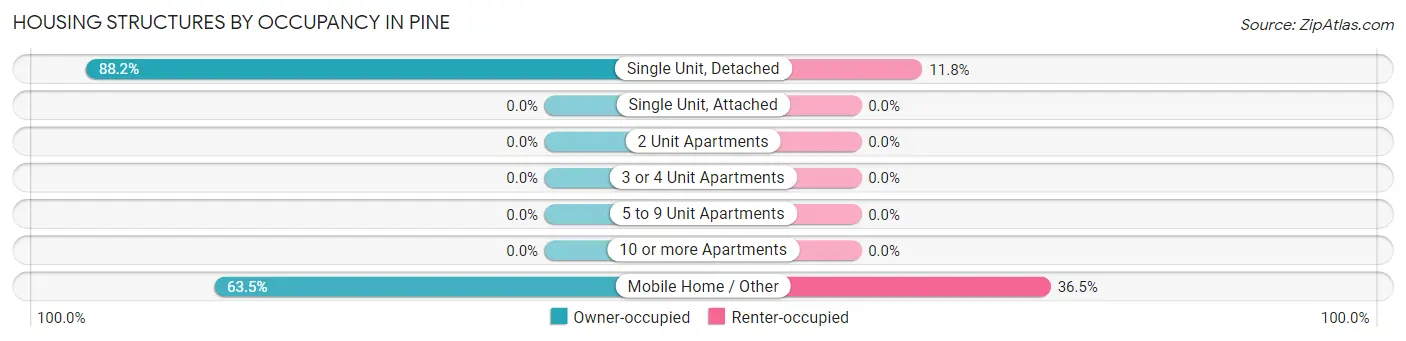
| Structure Type | Owner-occupied | Renter-occupied |
| Single Unit, Detached | 666 (88.2%) | 89 (11.8%) |
| Single Unit, Attached | 0 (0.0%) | 0 (0.0%) |
| 2 Unit Apartments | 0 (0.0%) | 0 (0.0%) |
| 3 or 4 Unit Apartments | 0 (0.0%) | 0 (0.0%) |
| 5 to 9 Unit Apartments | 0 (0.0%) | 0 (0.0%) |
| 10 or more Apartments | 0 (0.0%) | 0 (0.0%) |
| Mobile Home / Other | 47 (63.5%) | 27 (36.5%) |
| Total | 713 (86.0%) | 116 (14.0%) |
Housing Structures by Number of Rooms in Pine
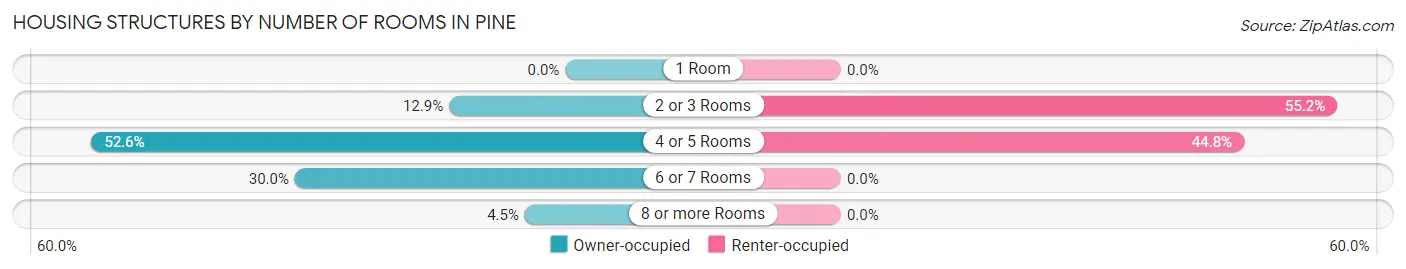
| Number of Rooms | Owner-occupied | Renter-occupied |
| 1 Room | 0 (0.0%) | 0 (0.0%) |
| 2 or 3 Rooms | 92 (12.9%) | 64 (55.2%) |
| 4 or 5 Rooms | 375 (52.6%) | 52 (44.8%) |
| 6 or 7 Rooms | 214 (30.0%) | 0 (0.0%) |
| 8 or more Rooms | 32 (4.5%) | 0 (0.0%) |
| Total | 713 (100.0%) | 116 (100.0%) |
Housing Structure by Heating Type in Pine
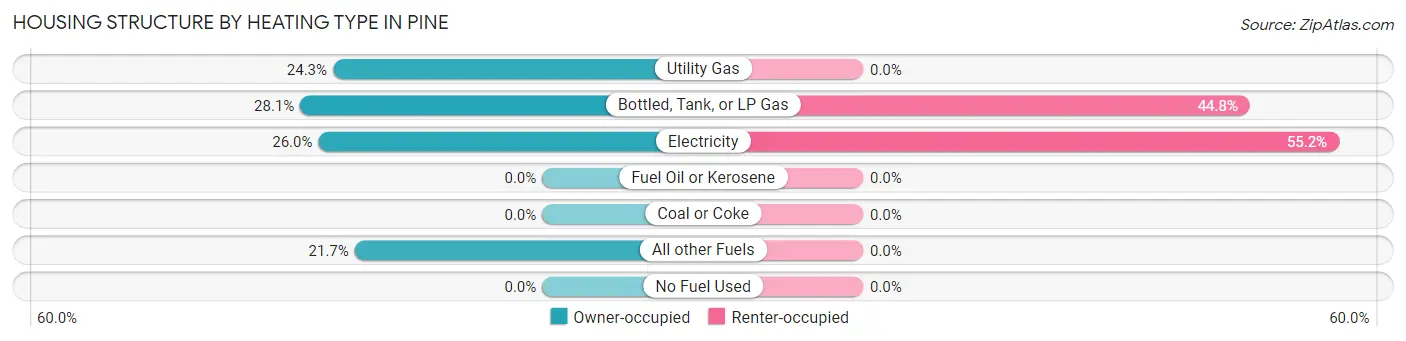
| Heating Type | Owner-occupied | Renter-occupied |
| Utility Gas | 173 (24.3%) | 0 (0.0%) |
| Bottled, Tank, or LP Gas | 200 (28.1%) | 52 (44.8%) |
| Electricity | 185 (26.0%) | 64 (55.2%) |
| Fuel Oil or Kerosene | 0 (0.0%) | 0 (0.0%) |
| Coal or Coke | 0 (0.0%) | 0 (0.0%) |
| All other Fuels | 155 (21.7%) | 0 (0.0%) |
| No Fuel Used | 0 (0.0%) | 0 (0.0%) |
| Total | 713 (100.0%) | 116 (100.0%) |
Household Vehicle Usage in Pine
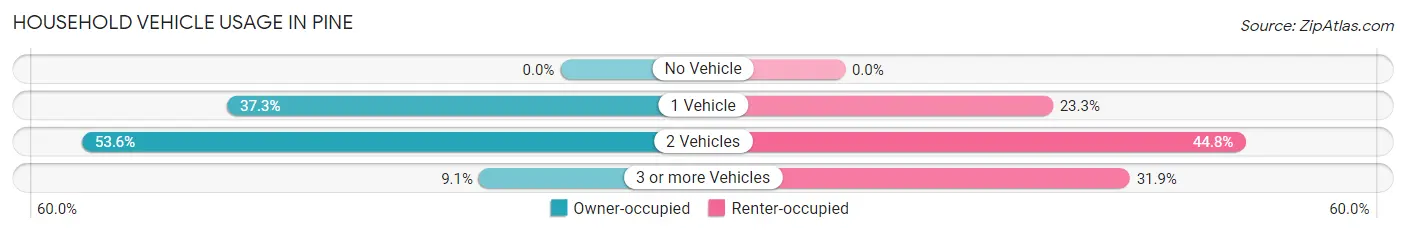
| Vehicles per Household | Owner-occupied | Renter-occupied |
| No Vehicle | 0 (0.0%) | 0 (0.0%) |
| 1 Vehicle | 266 (37.3%) | 27 (23.3%) |
| 2 Vehicles | 382 (53.6%) | 52 (44.8%) |
| 3 or more Vehicles | 65 (9.1%) | 37 (31.9%) |
| Total | 713 (100.0%) | 116 (100.0%) |
Real Estate & Mortgages in Pine
Real Estate and Mortgage Overview in Pine
| Characteristic | Without Mortgage | With Mortgage |
| Housing Units | 455 | 258 |
| Median Property Value | $371,000 | $342,800 |
| Median Household Income | $44,365 | $0 |
| Monthly Housing Costs | $514 | $0 |
| Real Estate Taxes | $3,071 | $32 |
Property Value by Mortgage Status in Pine
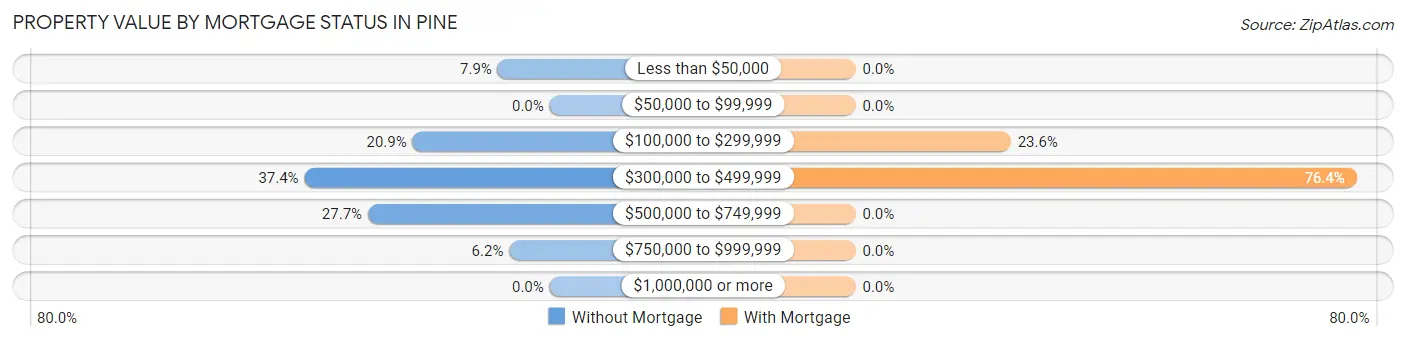
| Property Value | Without Mortgage | With Mortgage |
| Less than $50,000 | 36 (7.9%) | 0 (0.0%) |
| $50,000 to $99,999 | 0 (0.0%) | 0 (0.0%) |
| $100,000 to $299,999 | 95 (20.9%) | 61 (23.6%) |
| $300,000 to $499,999 | 170 (37.4%) | 197 (76.4%) |
| $500,000 to $749,999 | 126 (27.7%) | 0 (0.0%) |
| $750,000 to $999,999 | 28 (6.1%) | 0 (0.0%) |
| $1,000,000 or more | 0 (0.0%) | 0 (0.0%) |
| Total | 455 (100.0%) | 258 (100.0%) |
Household Income by Mortgage Status in Pine
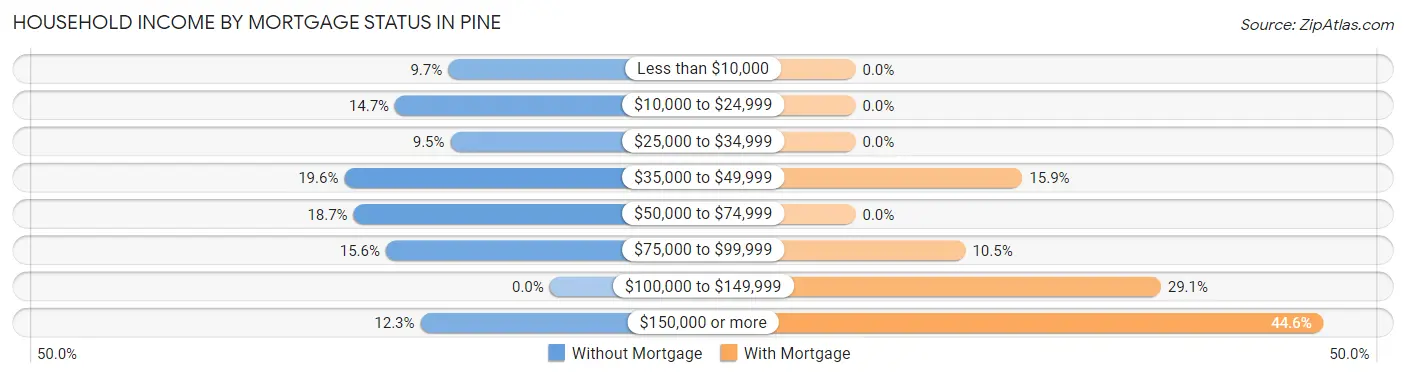
| Household Income | Without Mortgage | With Mortgage |
| Less than $10,000 | 44 (9.7%) | 0 (0.0%) |
| $10,000 to $24,999 | 67 (14.7%) | 0 (0.0%) |
| $25,000 to $34,999 | 43 (9.5%) | 0 (0.0%) |
| $35,000 to $49,999 | 89 (19.6%) | 41 (15.9%) |
| $50,000 to $74,999 | 85 (18.7%) | 0 (0.0%) |
| $75,000 to $99,999 | 71 (15.6%) | 27 (10.5%) |
| $100,000 to $149,999 | 0 (0.0%) | 75 (29.1%) |
| $150,000 or more | 56 (12.3%) | 115 (44.6%) |
| Total | 455 (100.0%) | 258 (100.0%) |
Property Value to Household Income Ratio in Pine
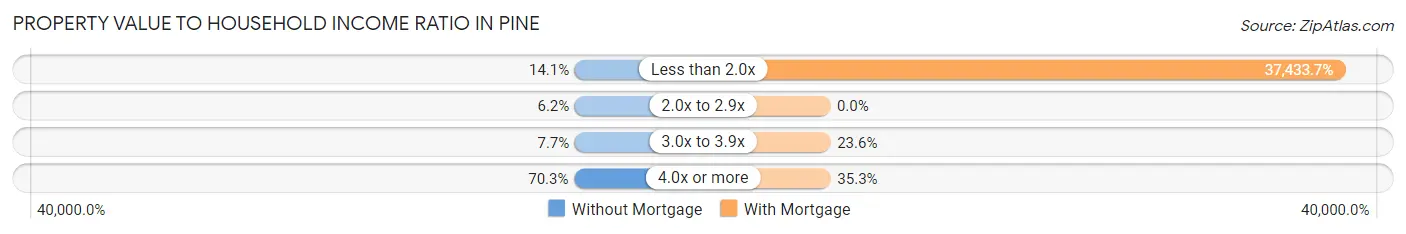
| Value-to-Income Ratio | Without Mortgage | With Mortgage |
| Less than 2.0x | 64 (14.1%) | 96,579 (37,433.7%) |
| 2.0x to 2.9x | 28 (6.1%) | 0 (0.0%) |
| 3.0x to 3.9x | 35 (7.7%) | 61 (23.6%) |
| 4.0x or more | 320 (70.3%) | 91 (35.3%) |
| Total | 455 (100.0%) | 258 (100.0%) |
Real Estate Taxes by Mortgage Status in Pine
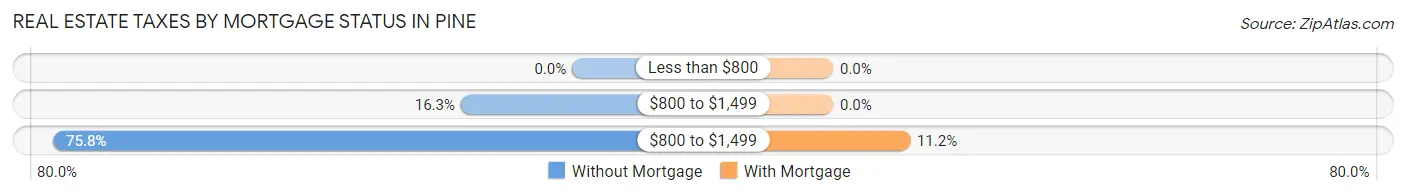
| Property Taxes | Without Mortgage | With Mortgage |
| Less than $800 | 0 (0.0%) | 0 (0.0%) |
| $800 to $1,499 | 74 (16.3%) | 0 (0.0%) |
| $800 to $1,499 | 345 (75.8%) | 29 (11.2%) |
| Total | 455 (100.0%) | 258 (100.0%) |
Health & Disability in Pine
Health Insurance Coverage by Age in Pine
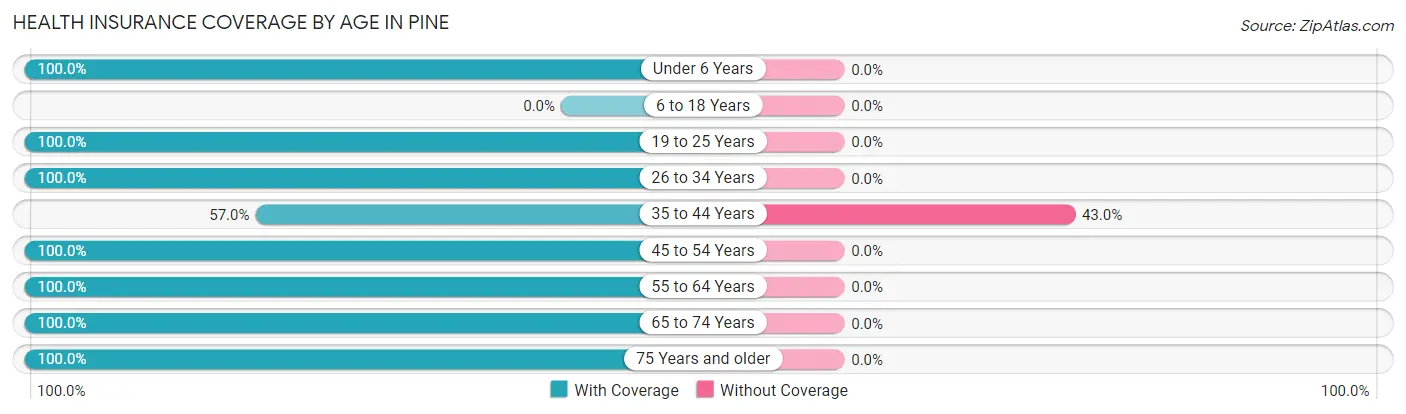
| Age Bracket | With Coverage | Without Coverage |
| Under 6 Years | 46 (100.0%) | 0 (0.0%) |
| 6 to 18 Years | 0 (0.0%) | 0 (0.0%) |
| 19 to 25 Years | 64 (100.0%) | 0 (0.0%) |
| 26 to 34 Years | 42 (100.0%) | 0 (0.0%) |
| 35 to 44 Years | 49 (57.0%) | 37 (43.0%) |
| 45 to 54 Years | 149 (100.0%) | 0 (0.0%) |
| 55 to 64 Years | 176 (100.0%) | 0 (0.0%) |
| 65 to 74 Years | 524 (100.0%) | 0 (0.0%) |
| 75 Years and older | 439 (100.0%) | 0 (0.0%) |
| Total | 1,489 (97.6%) | 37 (2.4%) |
Health Insurance Coverage by Citizenship Status in Pine
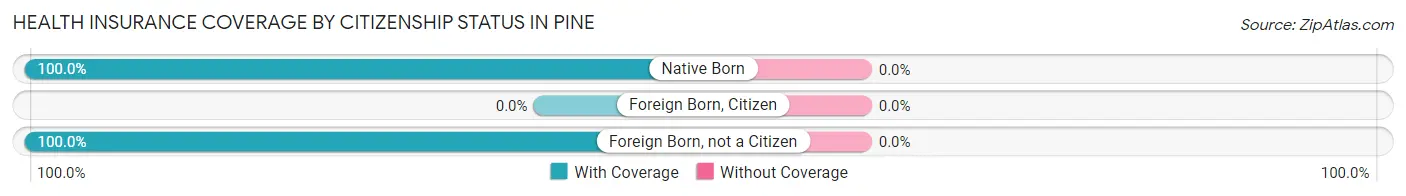
| Citizenship Status | With Coverage | Without Coverage |
| Native Born | 46 (100.0%) | 0 (0.0%) |
| Foreign Born, Citizen | 0 (0.0%) | 0 (0.0%) |
| Foreign Born, not a Citizen | 64 (100.0%) | 0 (0.0%) |
Health Insurance Coverage by Household Income in Pine
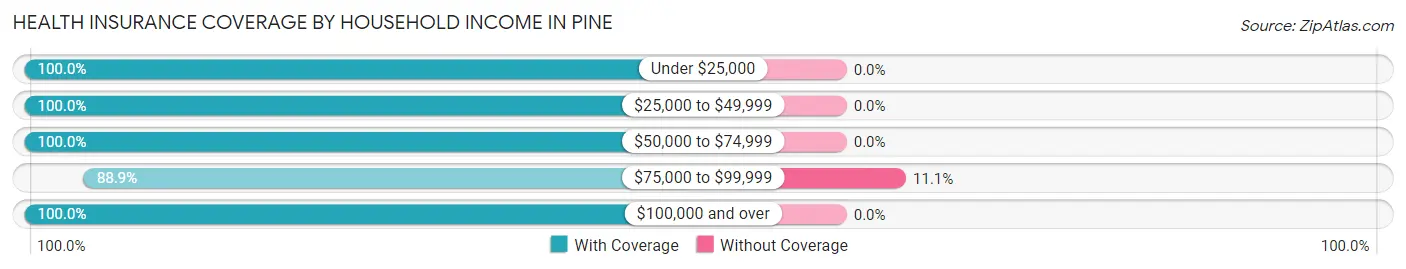
| Household Income | With Coverage | Without Coverage |
| Under $25,000 | 111 (100.0%) | 0 (0.0%) |
| $25,000 to $49,999 | 491 (100.0%) | 0 (0.0%) |
| $50,000 to $74,999 | 243 (100.0%) | 0 (0.0%) |
| $75,000 to $99,999 | 296 (88.9%) | 37 (11.1%) |
| $100,000 and over | 346 (100.0%) | 0 (0.0%) |
Public vs Private Health Insurance Coverage by Age in Pine
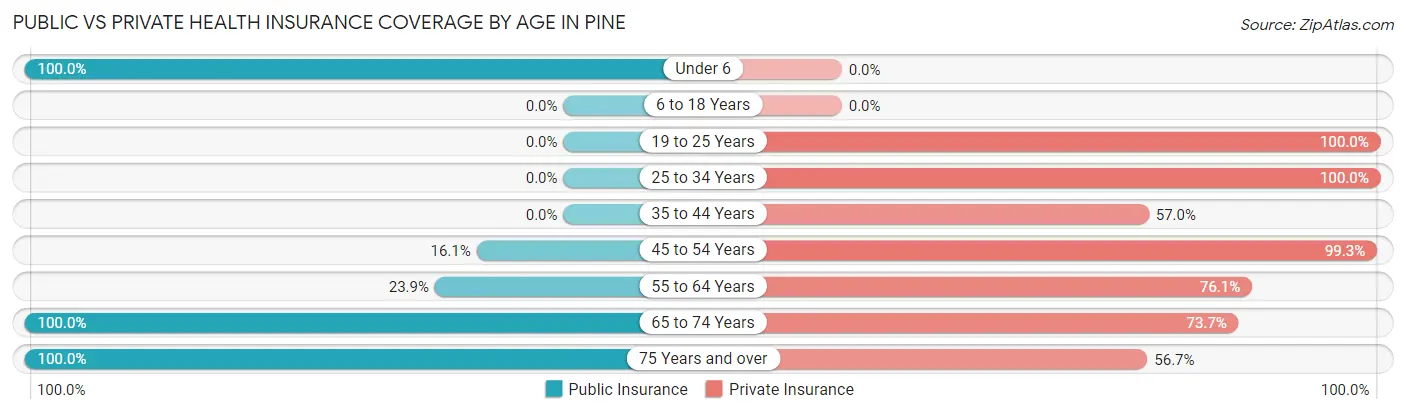
| Age Bracket | Public Insurance | Private Insurance |
| Under 6 | 46 (100.0%) | 0 (0.0%) |
| 6 to 18 Years | 0 (0.0%) | 0 (0.0%) |
| 19 to 25 Years | 0 (0.0%) | 64 (100.0%) |
| 25 to 34 Years | 0 (0.0%) | 42 (100.0%) |
| 35 to 44 Years | 0 (0.0%) | 49 (57.0%) |
| 45 to 54 Years | 24 (16.1%) | 148 (99.3%) |
| 55 to 64 Years | 42 (23.9%) | 134 (76.1%) |
| 65 to 74 Years | 524 (100.0%) | 386 (73.7%) |
| 75 Years and over | 439 (100.0%) | 249 (56.7%) |
| Total | 1,075 (70.5%) | 1,072 (70.3%) |
Disability Status by Sex by Age in Pine
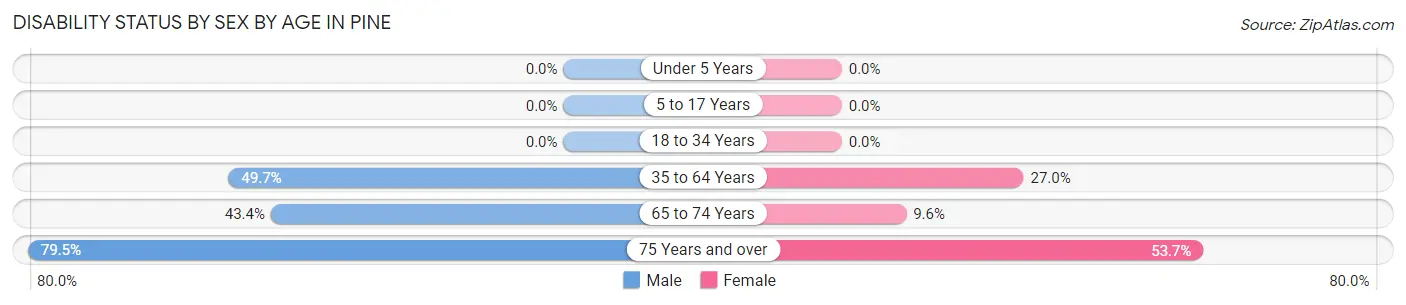
| Age Bracket | Male | Female |
| Under 5 Years | 0 (0.0%) | 0 (0.0%) |
| 5 to 17 Years | 0 (0.0%) | 0 (0.0%) |
| 18 to 34 Years | 0 (0.0%) | 0 (0.0%) |
| 35 to 64 Years | 92 (49.7%) | 61 (27.0%) |
| 65 to 74 Years | 96 (43.4%) | 29 (9.6%) |
| 75 Years and over | 198 (79.5%) | 102 (53.7%) |
Disability Class by Sex by Age in Pine
Disability Class: Hearing Difficulty
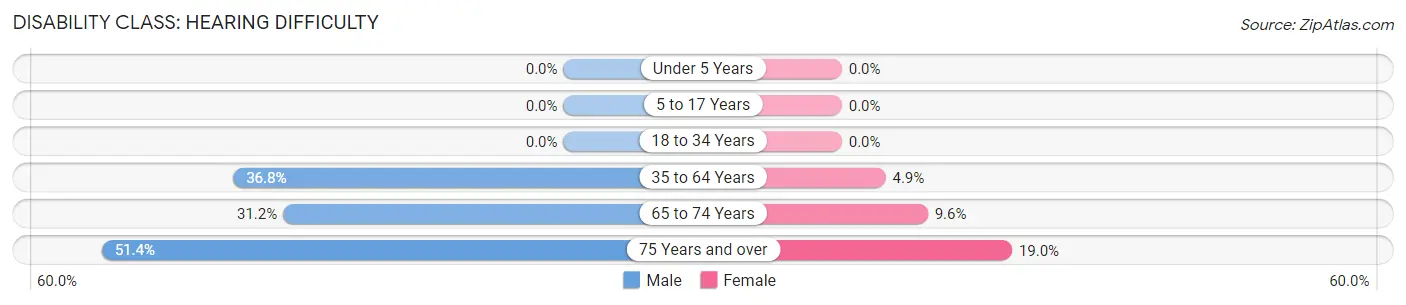
| Age Bracket | Male | Female |
| Under 5 Years | 0 (0.0%) | 0 (0.0%) |
| 5 to 17 Years | 0 (0.0%) | 0 (0.0%) |
| 18 to 34 Years | 0 (0.0%) | 0 (0.0%) |
| 35 to 64 Years | 68 (36.8%) | 11 (4.9%) |
| 65 to 74 Years | 69 (31.2%) | 29 (9.6%) |
| 75 Years and over | 128 (51.4%) | 36 (19.0%) |
Disability Class: Vision Difficulty
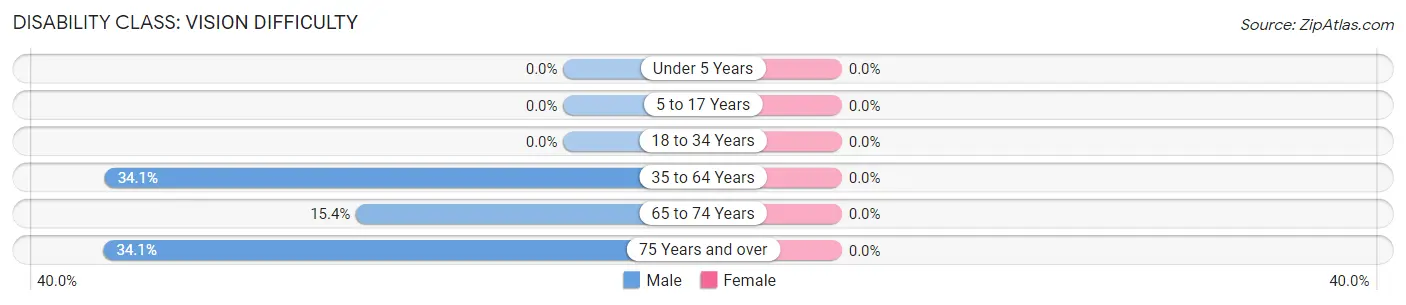
| Age Bracket | Male | Female |
| Under 5 Years | 0 (0.0%) | 0 (0.0%) |
| 5 to 17 Years | 0 (0.0%) | 0 (0.0%) |
| 18 to 34 Years | 0 (0.0%) | 0 (0.0%) |
| 35 to 64 Years | 63 (34.1%) | 0 (0.0%) |
| 65 to 74 Years | 34 (15.4%) | 0 (0.0%) |
| 75 Years and over | 85 (34.1%) | 0 (0.0%) |
Disability Class: Cognitive Difficulty
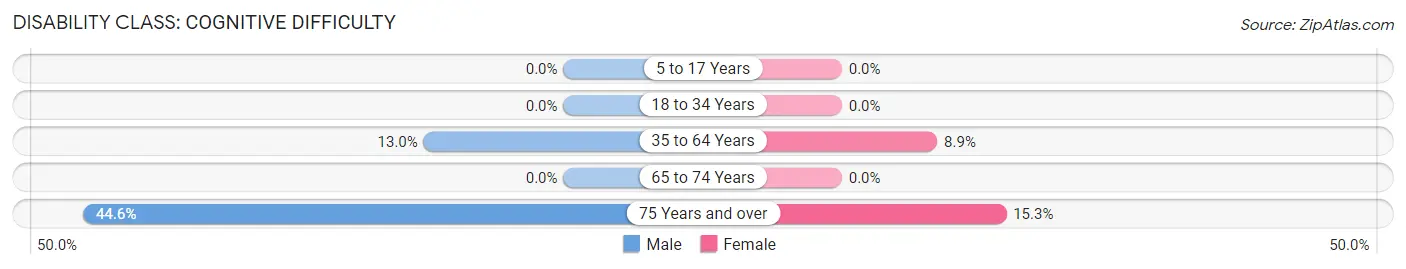
| Age Bracket | Male | Female |
| 5 to 17 Years | 0 (0.0%) | 0 (0.0%) |
| 18 to 34 Years | 0 (0.0%) | 0 (0.0%) |
| 35 to 64 Years | 24 (13.0%) | 20 (8.8%) |
| 65 to 74 Years | 0 (0.0%) | 0 (0.0%) |
| 75 Years and over | 111 (44.6%) | 29 (15.3%) |
Disability Class: Ambulatory Difficulty
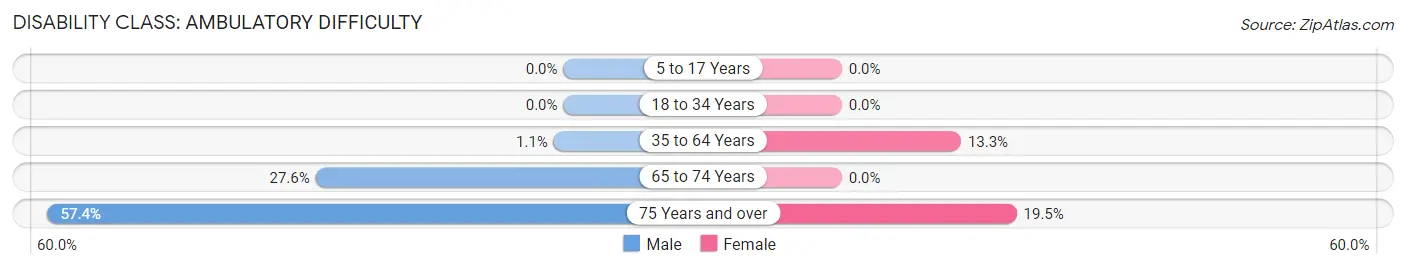
| Age Bracket | Male | Female |
| 5 to 17 Years | 0 (0.0%) | 0 (0.0%) |
| 18 to 34 Years | 0 (0.0%) | 0 (0.0%) |
| 35 to 64 Years | 2 (1.1%) | 30 (13.3%) |
| 65 to 74 Years | 61 (27.6%) | 0 (0.0%) |
| 75 Years and over | 143 (57.4%) | 37 (19.5%) |
Disability Class: Self-Care Difficulty
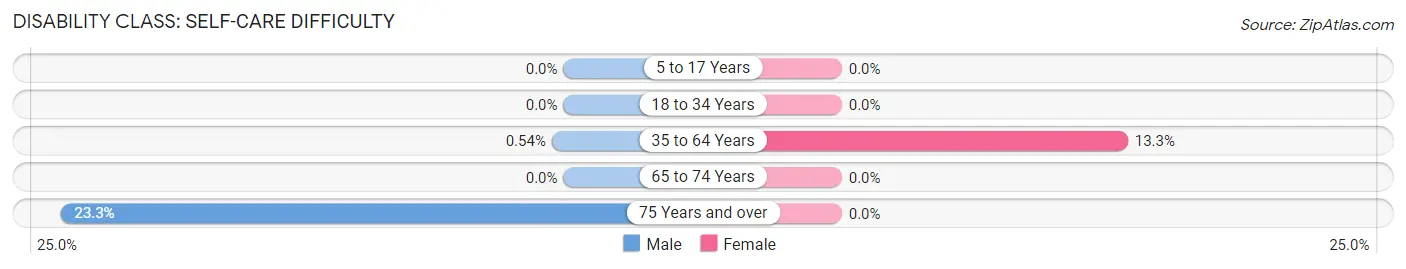
| Age Bracket | Male | Female |
| 5 to 17 Years | 0 (0.0%) | 0 (0.0%) |
| 18 to 34 Years | 0 (0.0%) | 0 (0.0%) |
| 35 to 64 Years | 1 (0.5%) | 30 (13.3%) |
| 65 to 74 Years | 0 (0.0%) | 0 (0.0%) |
| 75 Years and over | 58 (23.3%) | 0 (0.0%) |
Technology Access in Pine
Computing Device Access in Pine
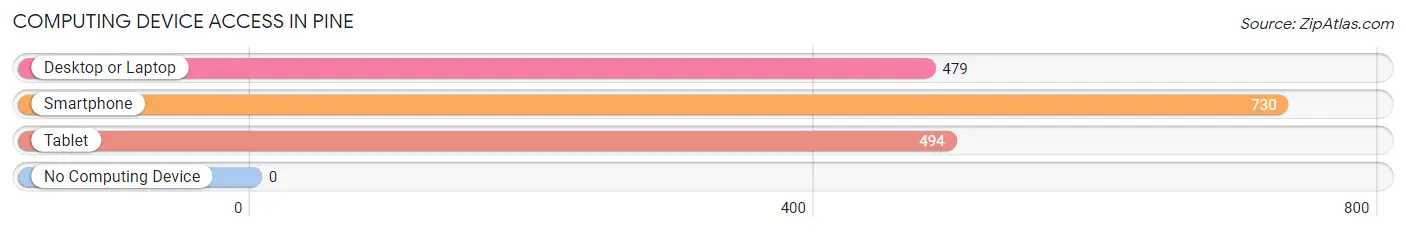
| Device Type | # Households | % Households |
| Desktop or Laptop | 479 | 57.8% |
| Smartphone | 730 | 88.1% |
| Tablet | 494 | 59.6% |
| No Computing Device | 0 | 0.0% |
| Total | 829 | 100.0% |
Internet Access in Pine
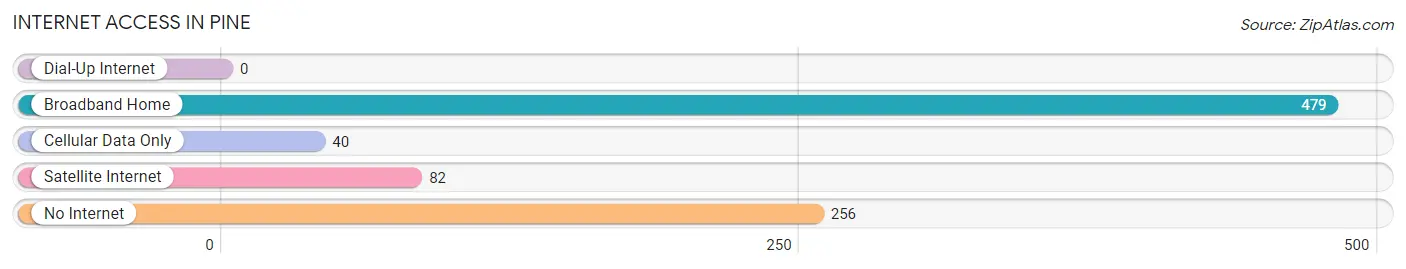
| Internet Type | # Households | % Households |
| Dial-Up Internet | 0 | 0.0% |
| Broadband Home | 479 | 57.8% |
| Cellular Data Only | 40 | 4.8% |
| Satellite Internet | 82 | 9.9% |
| No Internet | 256 | 30.9% |
| Total | 829 | 100.0% |
Pine Summary
Pine, Arizona is a small unincorporated community located in Gila County, Arizona. It is situated in the Mogollon Rim region of the state, approximately 80 miles northeast of Phoenix. The town is located in the Tonto National Forest and is surrounded by the Apache-Sitgreaves National Forest. The population of Pine was 1,963 as of the 2010 census.
Geography
Pine is located in the Mogollon Rim region of Arizona, at an elevation of 5,400 feet. The town is situated in the Tonto National Forest and is surrounded by the Apache-Sitgreaves National Forest. The town is located in the Mogollon Rim region of the state, approximately 80 miles northeast of Phoenix. The town is located in the Tonto National Forest and is surrounded by the Apache-Sitgreaves National Forest. The town is located in the Mogollon Rim region of the state, approximately 80 miles northeast of Phoenix. The town is located in the Tonto National Forest and is surrounded by the Apache-Sitgreaves National Forest. The town is located in the Mogollon Rim region of the state, approximately 80 miles northeast of Phoenix.
The town is located in the Mogollon Rim region of the state, approximately 80 miles northeast of Phoenix. The town is located in the Tonto National Forest and is surrounded by the Apache-Sitgreaves National Forest. The town is located in the Mogollon Rim region of the state, approximately 80 miles northeast of Phoenix. The town is located in the Tonto National Forest and is surrounded by the Apache-Sitgreaves National Forest. The town is located in the Mogollon Rim region of the state, approximately 80 miles northeast of Phoenix.
The town is located in the Mogollon Rim region of the state, approximately 80 miles northeast of Phoenix. The town is located in the Tonto National Forest and is surrounded by the Apache-Sitgreaves National Forest. The town is located in the Mogollon Rim region of the state, approximately 80 miles northeast of Phoenix. The town is located in the Tonto National Forest and is surrounded by the Apache-Sitgreaves National Forest. The town is located in the Mogollon Rim region of the state, approximately 80 miles northeast of Phoenix.
The town is located in the Mogollon Rim region of the state, approximately 80 miles northeast of Phoenix. The town is located in the Tonto National Forest and is surrounded by the Apache-Sitgreaves National Forest. The town is located in the Mogollon Rim region of the state, approximately 80 miles northeast of Phoenix. The town is located in the Tonto National Forest and is surrounded by the Apache-Sitgreaves National Forest.
History
Pine was founded in 1879 by a group of settlers from the Midwest. The town was originally called Pine Grove, but the name was changed to Pine in 1881. The town was originally a mining town, but it soon became a logging town as well. The town was also home to a number of sawmills and lumber companies.
The town was also home to a number of sawmills and lumber companies. The town was also home to a number of sawmills and lumber companies. The town was also home to a number of sawmills and lumber companies. The town was also home to a number of sawmills and lumber companies. The town was also home to a number of sawmills and lumber companies.
The town was also home to a number of sawmills and lumber companies. The town was also home to a number of sawmills and lumber companies. The town was also home to a number of sawmills and lumber companies. The town was also home to a number of sawmills and lumber companies. The town was also home to a number of sawmills and lumber companies.
The town was also home to a number of sawmills and lumber companies. The town was also home to a number of sawmills and lumber companies. The town was also home to a number of sawmills and lumber companies. The town was also home to a number of sawmills and lumber companies. The town was also home to a number of sawmills and lumber companies.
The town was also home to a number of sawmills and lumber companies. The town was also home to a number of sawmills and lumber companies. The town was also home to a number of sawmills and lumber companies. The town was also home to a number of sawmills and lumber companies. The town was also home to a number of sawmills and lumber companies.
The town was also home to a number of sawmills and lumber companies. The town was also home to a number of sawmills and lumber companies. The town was also home to a number of sawmills and lumber companies. The town was also home to a number of sawmills and lumber companies. The town was also home to a number of sawmills and lumber companies.
The town was also home to a number of sawmills and lumber companies. The town was also home to a number of sawmills and lumber companies. The town was also home to a number of sawmills and lumber companies. The town was also home to a number of sawmills and lumber companies. The town was also home to a number of sawmills and lumber companies.
The town was also home to a number of sawmills and lumber companies. The town was also home to a number of sawmills and lumber companies. The town was also home to a number of sawmills and lumber companies. The town was also home to a number of sawmills and lumber companies. The town was also home to a number of sawmills and lumber companies.
Economy
Pine’s economy is largely based on tourism and recreation. The town is home to a number of resorts, campgrounds, and other recreational activities. The town is also home to a number of restaurants, shops, and other businesses. The town is also home to a number of sawmills and lumber companies.
The town is also home to a number of sawmills and lumber companies. The town is also home to a number of sawmills and lumber companies. The town is also home to a number of sawmills and lumber companies. The town is also home to a number of sawmills and lumber companies. The town is also home to a number of sawmills and lumber companies.
The town is also home to a number of sawmills and lumber companies. The town is also home to a number of sawmills and lumber companies. The town is also home to a number of sawmills and lumber companies. The town is also home to a number of sawmills and lumber companies. The town is also home to a number of sawmills and lumber companies.
Demographics
As of the 2010 census, the population of Pine was 1,963. The racial makeup of the town was 95.3% White, 0.3% African American, 0.7% Native American, 0.2% Asian, 0.1% Pacific Islander, 1.2% from other races, and 2.4% from two or more races. Hispanic or Latino of any race were 4.3% of the population.
The median income for a household in Pine was $37,917, and the median income for a family was $41,250. Males had a median income of $30,000 versus $21,250 for females. The per capita income for the town was $17,845. About 10.3% of families and 13.2% of the population were below the poverty line, including 16.7% of those under age 18 and 8.3% of those age 65 or over.
Conclusion
Pine, Arizona is a small unincorporated community located in Gila County, Arizona. It is situated in the Mogollon Rim region of the state, approximately 80 miles northeast of Phoenix. The town is located in the Tonto National Forest and is surrounded by the Apache-Sitgreaves National Forest. The population of Pine was 1,963 as of the 2010 census. The town’s economy is largely based on tourism and recreation, and it is home to a number of resorts, campgrounds, restaurants, shops, and other businesses. The racial makeup of the town was 95.3% White, 0.3% African American, 0.7% Native American, 0.2% Asian, 0.1% Pacific Islander, 1.2% from other races, and 2.4% from two or more races. The median income for a household in Pine was $37,917, and the median income for a family was $41,250. About 10.3% of families and 13.2% of the population were below the poverty line.
Common Questions
What is Per Capita Income in Pine?
Per Capita income in Pine is $38,398.
What is the Median Family Income in Pine?
Median Family Income in Pine is $73,704.
What is the Median Household income in Pine?
Median Household Income in Pine is $54,720.
What is Income or Wage Gap in Pine?
Income or Wage Gap in Pine is 16.6%.
Women in Pine earn 83.4 cents for every dollar earned by a man.
What is Inequality or Gini Index in Pine?
Inequality or Gini Index in Pine is 0.35.
What is the Total Population of Pine?
Total Population of Pine is 1,526.
What is the Total Male Population of Pine?
Total Male Population of Pine is 772.
What is the Total Female Population of Pine?
Total Female Population of Pine is 754.
What is the Ratio of Males per 100 Females in Pine?
There are 102.39 Males per 100 Females in Pine.
What is the Ratio of Females per 100 Males in Pine?
There are 97.67 Females per 100 Males in Pine.
What is the Median Population Age in Pine?
Median Population Age in Pine is 68.7 Years.
What is the Average Family Size in Pine
Average Family Size in Pine is 2.2 People.
What is the Average Household Size in Pine
Average Household Size in Pine is 1.8 People.
How Large is the Labor Force in Pine?
There are 456 People in the Labor Forcein in Pine.
What is the Percentage of People in the Labor Force in Pine?
30.8% of People are in the Labor Force in Pine.