Heron Bay, GA Map & Demographics
Heron Bay Map
Heron Bay Overview
$45,167
PER CAPITA INCOME
$117,331
AVG FAMILY INCOME
$123,750
AVG HOUSEHOLD INCOME
32.1%
WAGE / INCOME GAP [ % ]
67.9¢/ $1
WAGE / INCOME GAP [ $ ]
0.30
INEQUALITY / GINI INDEX
3,899
TOTAL POPULATION
1,778
MALE POPULATION
2,121
FEMALE POPULATION
83.83
MALES / 100 FEMALES
119.29
FEMALES / 100 MALES
36.6
MEDIAN AGE
3.6
AVG FAMILY SIZE
3.3
AVG HOUSEHOLD SIZE
2,107
LABOR FORCE [ PEOPLE ]
69.2%
PERCENT IN LABOR FORCE
5.2%
UNEMPLOYMENT RATE
Income in Heron Bay
Income Overview in Heron Bay
Per Capita Income in Heron Bay is $45,167, while median incomes of families and households are $117,331 and $123,750 respectively.
| Characteristic | Number | Measure |
| Per Capita Income | 3,899 | $45,167 |
| Median Family Income | 1,005 | $117,331 |
| Mean Family Income | 1,005 | $143,175 |
| Median Household Income | 1,192 | $123,750 |
| Mean Household Income | 1,192 | $142,345 |
| Income Deficit | 1,005 | $0 |
| Wage / Income Gap (%) | 3,899 | 32.05% |
| Wage / Income Gap ($) | 3,899 | 67.95¢ per $1 |
| Gini / Inequality Index | 3,899 | 0.30 |
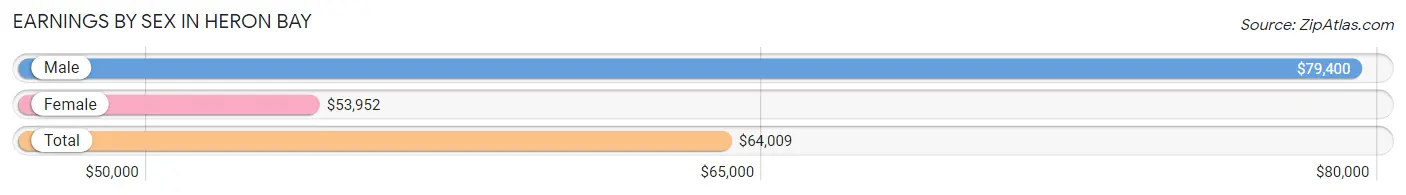
Earnings by Sex in Heron Bay
Average Earnings in Heron Bay are $64,009, $79,400 for men and $53,952 for women, a difference of 32.1%.
| Sex | Number | Average Earnings |
| Male | 1,052 (51.5%) | $79,400 |
| Female | 992 (48.5%) | $53,952 |
| Total | 2,044 (100.0%) | $64,009 |
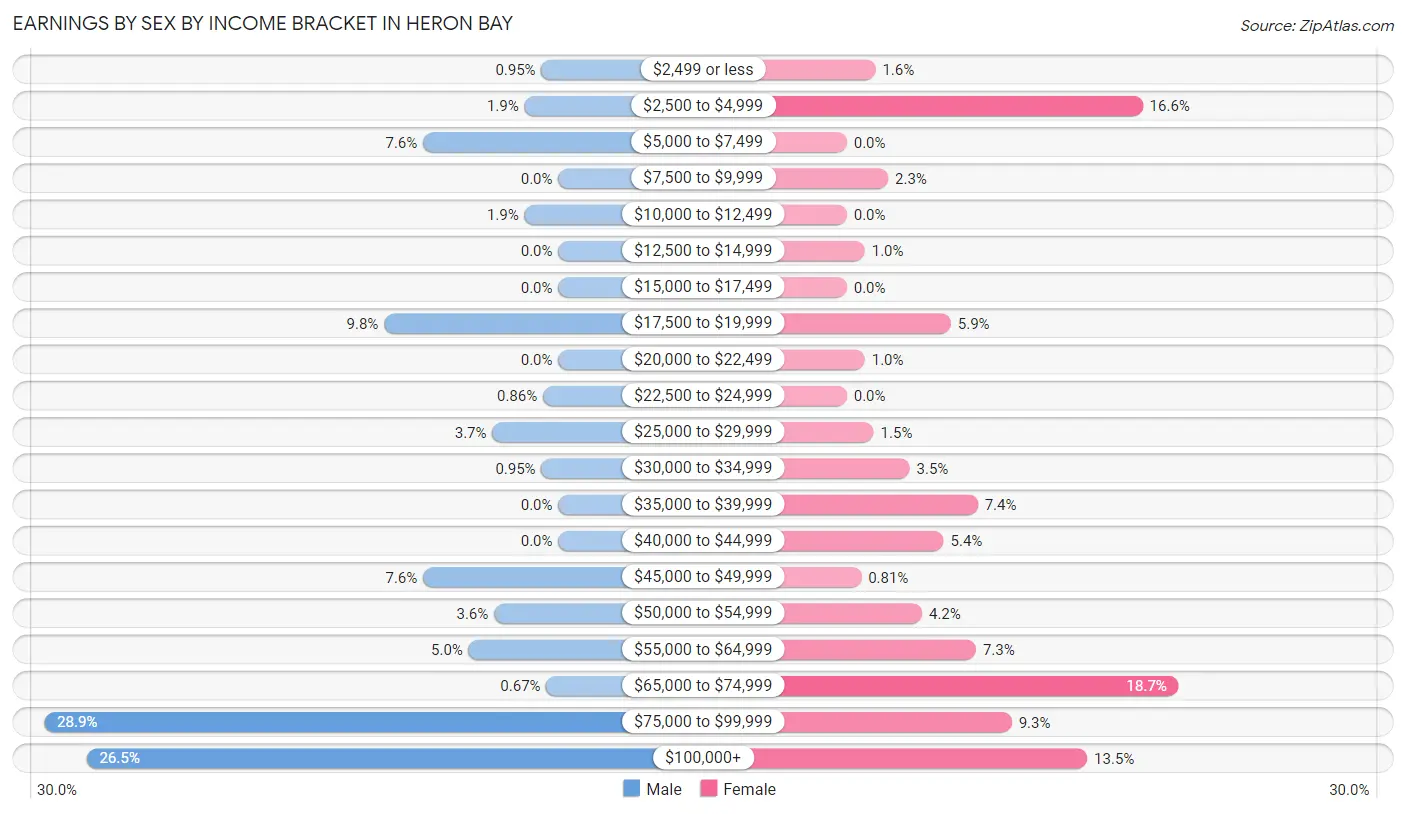
Earnings by Sex by Income Bracket in Heron Bay
The most common earnings brackets in Heron Bay are $75,000 to $99,999 for men (304 | 28.9%) and $65,000 to $74,999 for women (185 | 18.6%).
| Income | Male | Female |
| $2,499 or less | 10 (0.9%) | 16 (1.6%) |
| $2,500 to $4,999 | 20 (1.9%) | 165 (16.6%) |
| $5,000 to $7,499 | 80 (7.6%) | 0 (0.0%) |
| $7,500 to $9,999 | 0 (0.0%) | 23 (2.3%) |
| $10,000 to $12,499 | 20 (1.9%) | 0 (0.0%) |
| $12,500 to $14,999 | 0 (0.0%) | 10 (1.0%) |
| $15,000 to $17,499 | 0 (0.0%) | 0 (0.0%) |
| $17,500 to $19,999 | 103 (9.8%) | 58 (5.9%) |
| $20,000 to $22,499 | 0 (0.0%) | 10 (1.0%) |
| $22,500 to $24,999 | 9 (0.9%) | 0 (0.0%) |
| $25,000 to $29,999 | 39 (3.7%) | 15 (1.5%) |
| $30,000 to $34,999 | 10 (0.9%) | 35 (3.5%) |
| $35,000 to $39,999 | 0 (0.0%) | 73 (7.4%) |
| $40,000 to $44,999 | 0 (0.0%) | 54 (5.4%) |
| $45,000 to $49,999 | 80 (7.6%) | 8 (0.8%) |
| $50,000 to $54,999 | 38 (3.6%) | 42 (4.2%) |
| $55,000 to $64,999 | 53 (5.0%) | 72 (7.3%) |
| $65,000 to $74,999 | 7 (0.7%) | 185 (18.6%) |
| $75,000 to $99,999 | 304 (28.9%) | 92 (9.3%) |
| $100,000+ | 279 (26.5%) | 134 (13.5%) |
| Total | 1,052 (100.0%) | 992 (100.0%) |
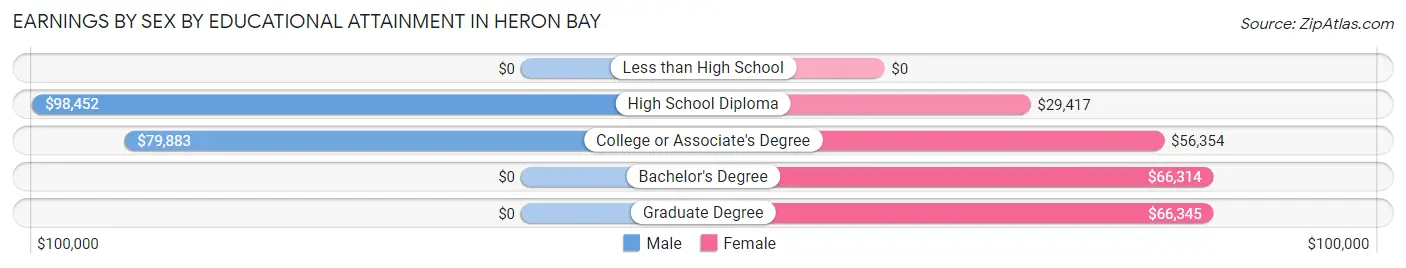
Earnings by Sex by Educational Attainment in Heron Bay
Average earnings in Heron Bay are $86,893 for men and $65,070 for women, a difference of 25.1%. Men with an educational attainment of high school diploma enjoy the highest average annual earnings of $98,452, while those with college or associate's degree education earn the least with $79,883. Women with an educational attainment of graduate degree earn the most with the average annual earnings of $66,345, while those with high school diploma education have the smallest earnings of $29,417.
| Educational Attainment | Male Income | Female Income |
| Less than High School | - | - |
| High School Diploma | $98,452 | $29,417 |
| College or Associate's Degree | $79,883 | $56,354 |
| Bachelor's Degree | - | - |
| Graduate Degree | - | - |
| Total | $86,893 | $65,070 |
Family Income in Heron Bay
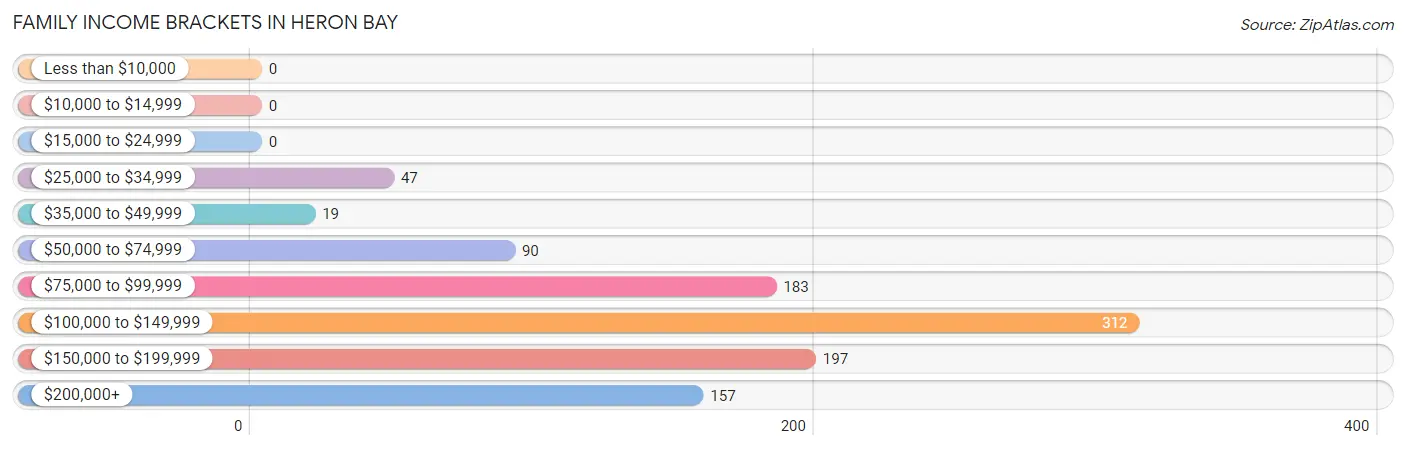
Family Income Brackets in Heron Bay
According to the Heron Bay family income data, there are 312 families falling into the $100,000 to $149,999 income range, which is the most common income bracket and makes up 31.0% of all families.
| Income Bracket | # Families | % Families |
| Less than $10,000 | 0 | 0.0% |
| $10,000 to $14,999 | 0 | 0.0% |
| $15,000 to $24,999 | 0 | 0.0% |
| $25,000 to $34,999 | 47 | 4.7% |
| $35,000 to $49,999 | 19 | 1.9% |
| $50,000 to $74,999 | 90 | 9.0% |
| $75,000 to $99,999 | 183 | 18.2% |
| $100,000 to $149,999 | 312 | 31.0% |
| $150,000 to $199,999 | 197 | 19.6% |
| $200,000+ | 157 | 15.6% |
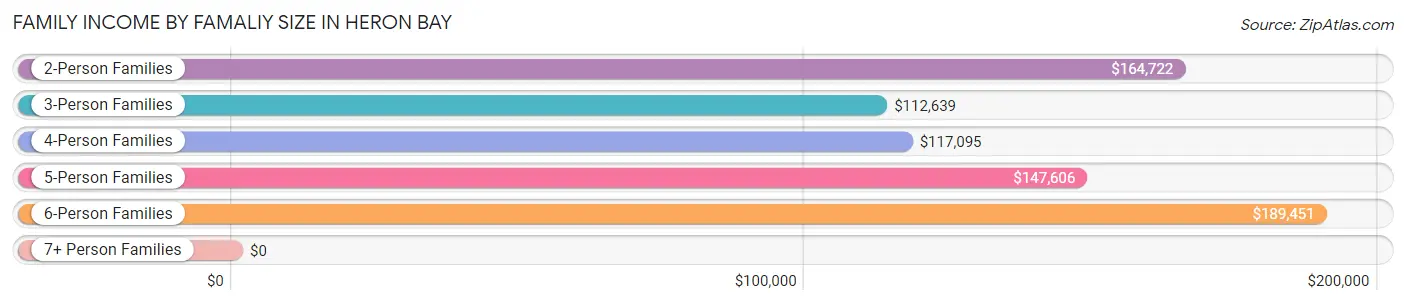
Family Income by Famaliy Size in Heron Bay
6-person families (64 | 6.4%) account for the highest median family income in Heron Bay with $189,451 per family, while 2-person families (294 | 29.2%) have the highest median income of $82,361 per family member.
| Income Bracket | # Families | Median Income |
| 2-Person Families | 294 (29.2%) | $164,722 |
| 3-Person Families | 270 (26.9%) | $112,639 |
| 4-Person Families | 160 (15.9%) | $117,095 |
| 5-Person Families | 217 (21.6%) | $147,606 |
| 6-Person Families | 64 (6.4%) | $189,451 |
| 7+ Person Families | 0 (0.0%) | $0 |
| Total | 1,005 (100.0%) | $117,331 |
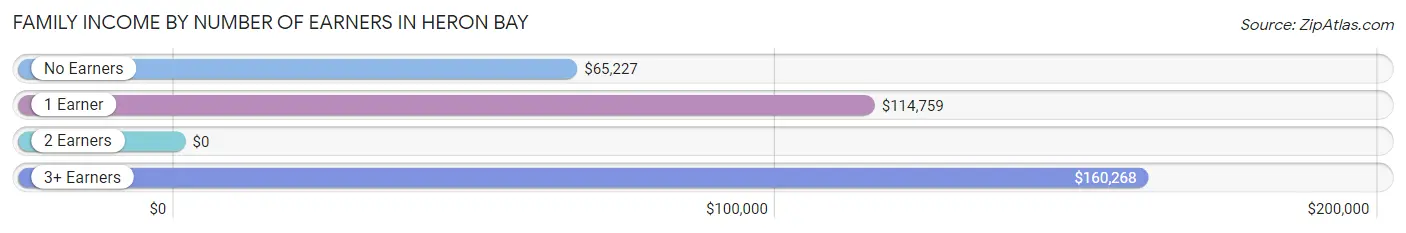
Family Income by Number of Earners in Heron Bay
| Number of Earners | # Families | Median Income |
| No Earners | 62 (6.2%) | $65,227 |
| 1 Earner | 461 (45.9%) | $114,759 |
| 2 Earners | 289 (28.8%) | $0 |
| 3+ Earners | 193 (19.2%) | $160,268 |
| Total | 1,005 (100.0%) | $117,331 |
Household Income in Heron Bay
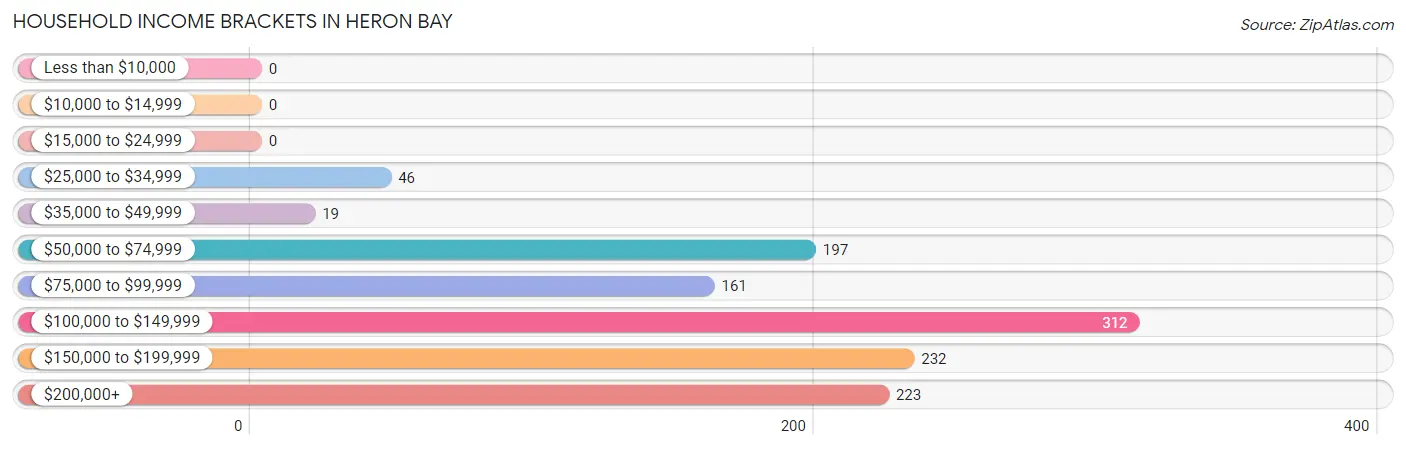
Household Income Brackets in Heron Bay
With 312 households falling in the category, the $100,000 to $149,999 income range is the most frequent in Heron Bay, accounting for 26.2% of all households.
| Income Bracket | # Households | % Households |
| Less than $10,000 | 0 | 0.0% |
| $10,000 to $14,999 | 0 | 0.0% |
| $15,000 to $24,999 | 0 | 0.0% |
| $25,000 to $34,999 | 46 | 3.9% |
| $35,000 to $49,999 | 19 | 1.6% |
| $50,000 to $74,999 | 197 | 16.5% |
| $75,000 to $99,999 | 161 | 13.5% |
| $100,000 to $149,999 | 312 | 26.2% |
| $150,000 to $199,999 | 232 | 19.5% |
| $200,000+ | 223 | 18.7% |
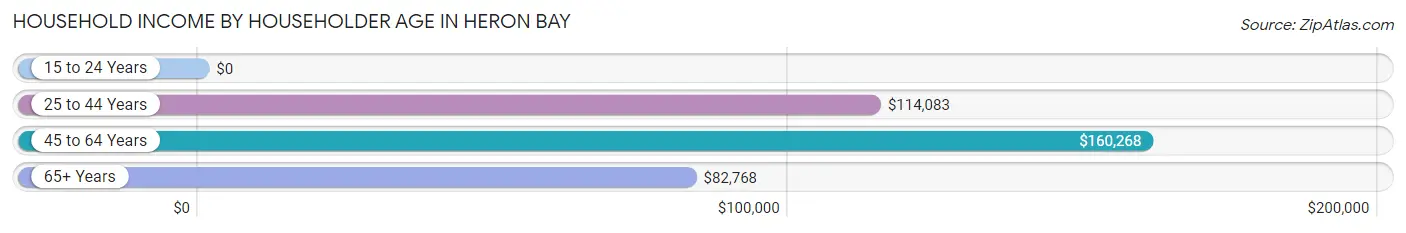
Household Income by Householder Age in Heron Bay
The median household income in Heron Bay is $123,750, with the highest median household income of $160,268 found in the 45 to 64 years age bracket for the primary householder. A total of 681 households (57.1%) fall into this category.
| Income Bracket | # Households | Median Income |
| 15 to 24 Years | 0 (0.0%) | $0 |
| 25 to 44 Years | 352 (29.5%) | $114,083 |
| 45 to 64 Years | 681 (57.1%) | $160,268 |
| 65+ Years | 159 (13.3%) | $82,768 |
| Total | 1,192 (100.0%) | $123,750 |
Poverty in Heron Bay
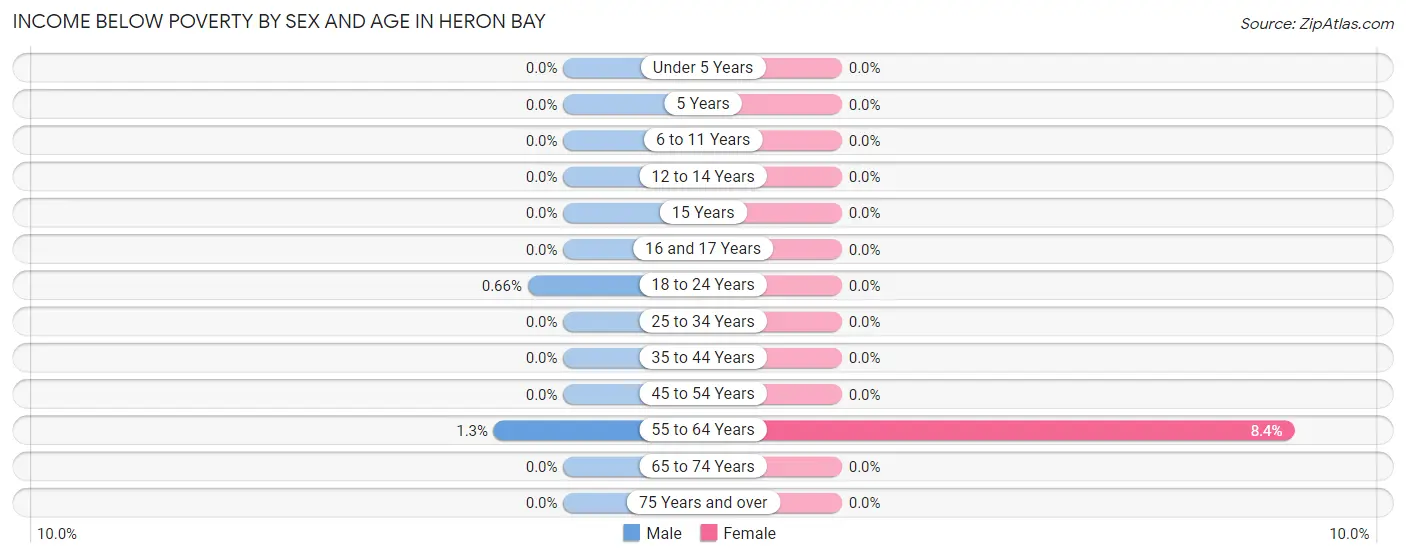
Income Below Poverty by Sex and Age in Heron Bay
With 0.3% poverty level for males and 0.9% for females among the residents of Heron Bay, 55 to 64 year old males and 55 to 64 year old females are the most vulnerable to poverty, with 3 males (1.3%) and 20 females (8.4%) in their respective age groups living below the poverty level.
| Age Bracket | Male | Female |
| Under 5 Years | 0 (0.0%) | 0 (0.0%) |
| 5 Years | 0 (0.0%) | 0 (0.0%) |
| 6 to 11 Years | 0 (0.0%) | 0 (0.0%) |
| 12 to 14 Years | 0 (0.0%) | 0 (0.0%) |
| 15 Years | 0 (0.0%) | 0 (0.0%) |
| 16 and 17 Years | 0 (0.0%) | 0 (0.0%) |
| 18 to 24 Years | 2 (0.7%) | 0 (0.0%) |
| 25 to 34 Years | 0 (0.0%) | 0 (0.0%) |
| 35 to 44 Years | 0 (0.0%) | 0 (0.0%) |
| 45 to 54 Years | 0 (0.0%) | 0 (0.0%) |
| 55 to 64 Years | 3 (1.3%) | 20 (8.4%) |
| 65 to 74 Years | 0 (0.0%) | 0 (0.0%) |
| 75 Years and over | 0 (0.0%) | 0 (0.0%) |
| Total | 5 (0.3%) | 20 (0.9%) |
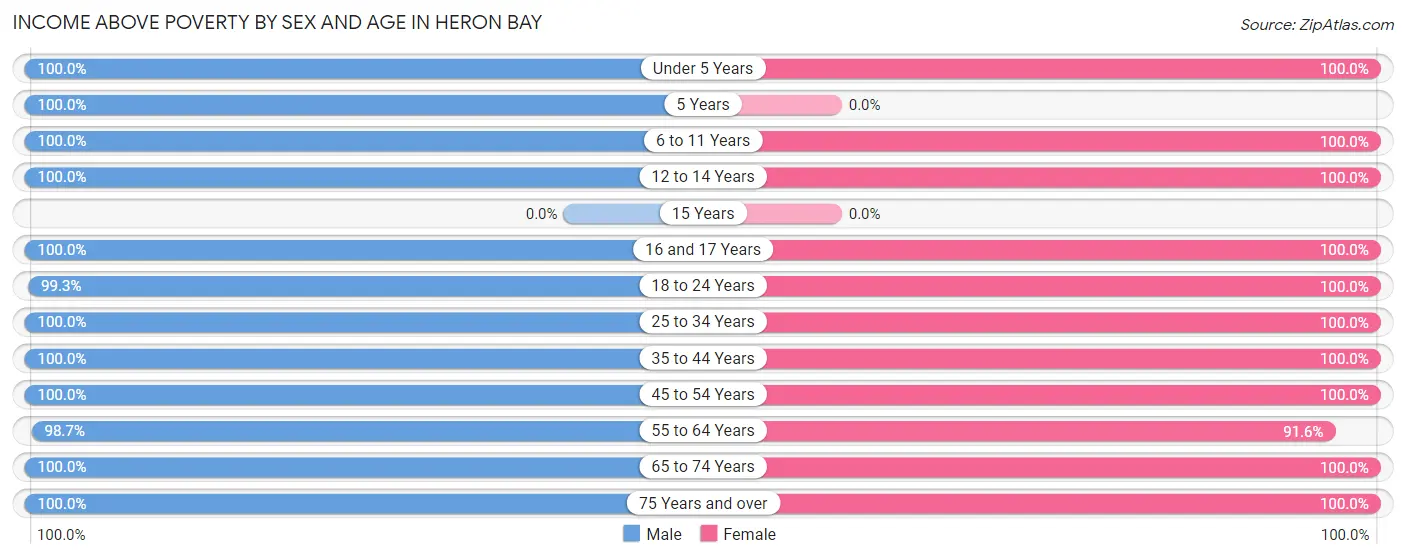
Income Above Poverty by Sex and Age in Heron Bay
According to the poverty statistics in Heron Bay, males aged under 5 years and females aged under 5 years are the age groups that are most secure financially, with 100.0% of males and 100.0% of females in these age groups living above the poverty line.
| Age Bracket | Male | Female |
| Under 5 Years | 97 (100.0%) | 251 (100.0%) |
| 5 Years | 130 (100.0%) | 0 (0.0%) |
| 6 to 11 Years | 118 (100.0%) | 68 (100.0%) |
| 12 to 14 Years | 29 (100.0%) | 160 (100.0%) |
| 15 Years | 0 (0.0%) | 0 (0.0%) |
| 16 and 17 Years | 10 (100.0%) | 77 (100.0%) |
| 18 to 24 Years | 301 (99.3%) | 235 (100.0%) |
| 25 to 34 Years | 199 (100.0%) | 145 (100.0%) |
| 35 to 44 Years | 255 (100.0%) | 291 (100.0%) |
| 45 to 54 Years | 272 (100.0%) | 448 (100.0%) |
| 55 to 64 Years | 230 (98.7%) | 218 (91.6%) |
| 65 to 74 Years | 78 (100.0%) | 83 (100.0%) |
| 75 Years and over | 54 (100.0%) | 124 (100.0%) |
| Total | 1,773 (99.7%) | 2,100 (99.1%) |
Income Below Poverty Among Married-Couple Families in Heron Bay
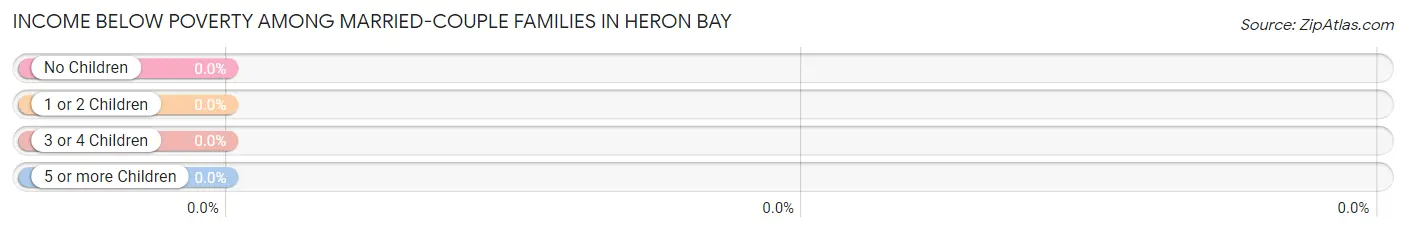
| Children | Above Poverty | Below Poverty |
| No Children | 334 (100.0%) | 0 (0.0%) |
| 1 or 2 Children | 349 (100.0%) | 0 (0.0%) |
| 3 or 4 Children | 135 (100.0%) | 0 (0.0%) |
| 5 or more Children | 0 (0.0%) | 0 (0.0%) |
| Total | 818 (100.0%) | 0 (0.0%) |
Income Below Poverty Among Single-Parent Households in Heron Bay
| Children | Single Father | Single Mother |
| No Children | 0 (0.0%) | 0 (0.0%) |
| 1 or 2 Children | 0 (0.0%) | 0 (0.0%) |
| 3 or 4 Children | 0 (0.0%) | 0 (0.0%) |
| 5 or more Children | 0 (0.0%) | 0 (0.0%) |
| Total | 0 (0.0%) | 0 (0.0%) |
Income Below Poverty Among Married-Couple vs Single-Parent Households in Heron Bay
| Children | Married-Couple Families | Single-Parent Households |
| No Children | 0 (0.0%) | 0 (0.0%) |
| 1 or 2 Children | 0 (0.0%) | 0 (0.0%) |
| 3 or 4 Children | 0 (0.0%) | 0 (0.0%) |
| 5 or more Children | 0 (0.0%) | 0 (0.0%) |
| Total | 0 (0.0%) | 0 (0.0%) |
Race in Heron Bay
The most populous races in Heron Bay are Black / African American (2,679 | 68.7%), White / Caucasian (934 | 23.9%), and Hispanic or Latino (301 | 7.7%).
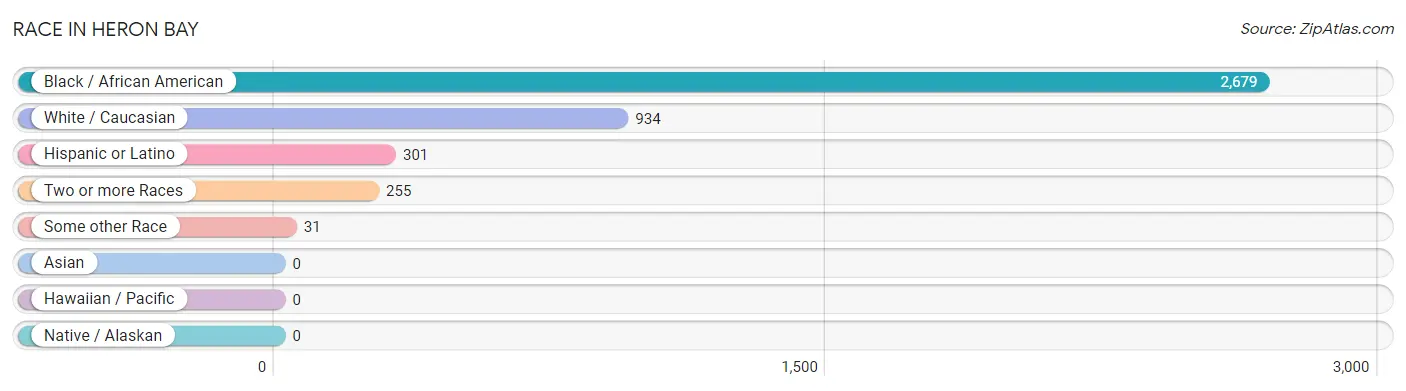
| Race | # Population | % Population |
| Asian | 0 | 0.0% |
| Black / African American | 2,679 | 68.7% |
| Hawaiian / Pacific | 0 | 0.0% |
| Hispanic or Latino | 301 | 7.7% |
| Native / Alaskan | 0 | 0.0% |
| White / Caucasian | 934 | 23.9% |
| Two or more Races | 255 | 6.5% |
| Some other Race | 31 | 0.8% |
| Total | 3,899 | 100.0% |
Ancestry in Heron Bay
The most populous ancestries reported in Heron Bay are Irish (403 | 10.3%), African (385 | 9.9%), Subsaharan African (385 | 9.9%), German (302 | 7.7%), and English (200 | 5.1%), together accounting for 43.0% of all Heron Bay residents.
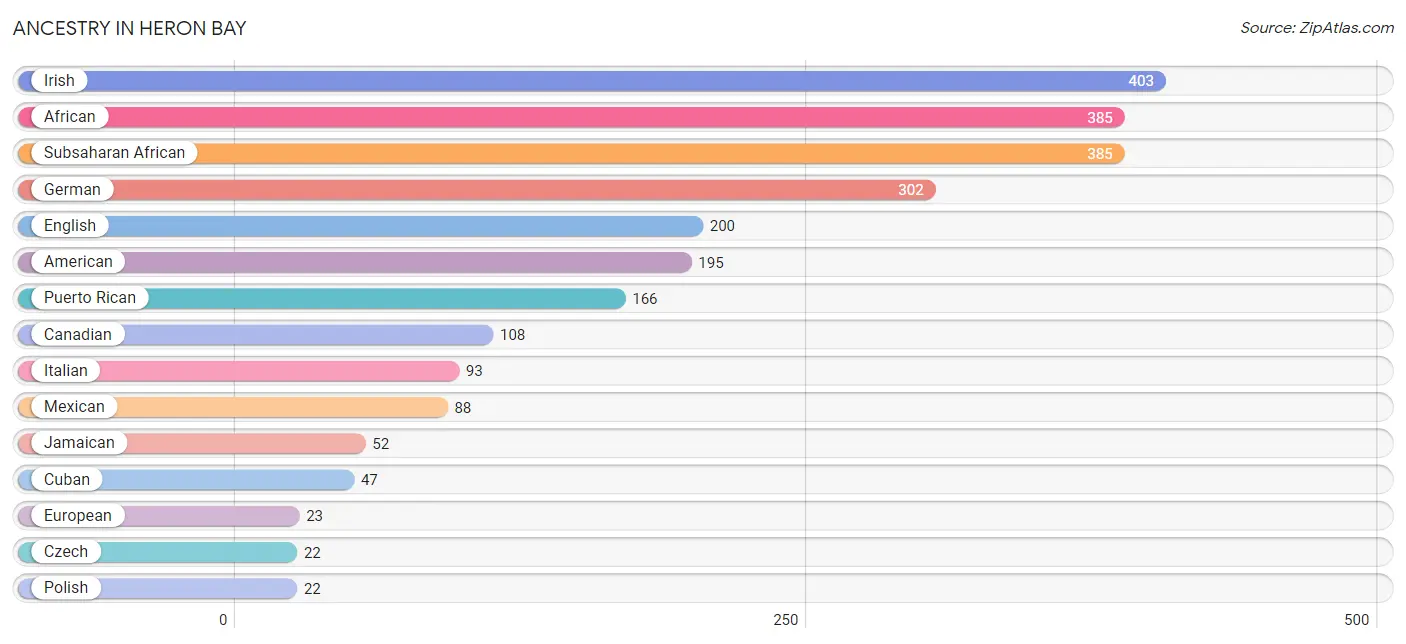
| Ancestry | # Population | % Population |
| African | 385 | 9.9% |
| American | 195 | 5.0% |
| Canadian | 108 | 2.8% |
| Cherokee | 14 | 0.4% |
| Cuban | 47 | 1.2% |
| Czech | 22 | 0.6% |
| English | 200 | 5.1% |
| European | 23 | 0.6% |
| German | 302 | 7.7% |
| Irish | 403 | 10.3% |
| Italian | 93 | 2.4% |
| Jamaican | 52 | 1.3% |
| Mexican | 88 | 2.3% |
| Polish | 22 | 0.6% |
| Puerto Rican | 166 | 4.3% |
| Scottish | 15 | 0.4% |
| Subsaharan African | 385 | 9.9% | View All 17 Rows |
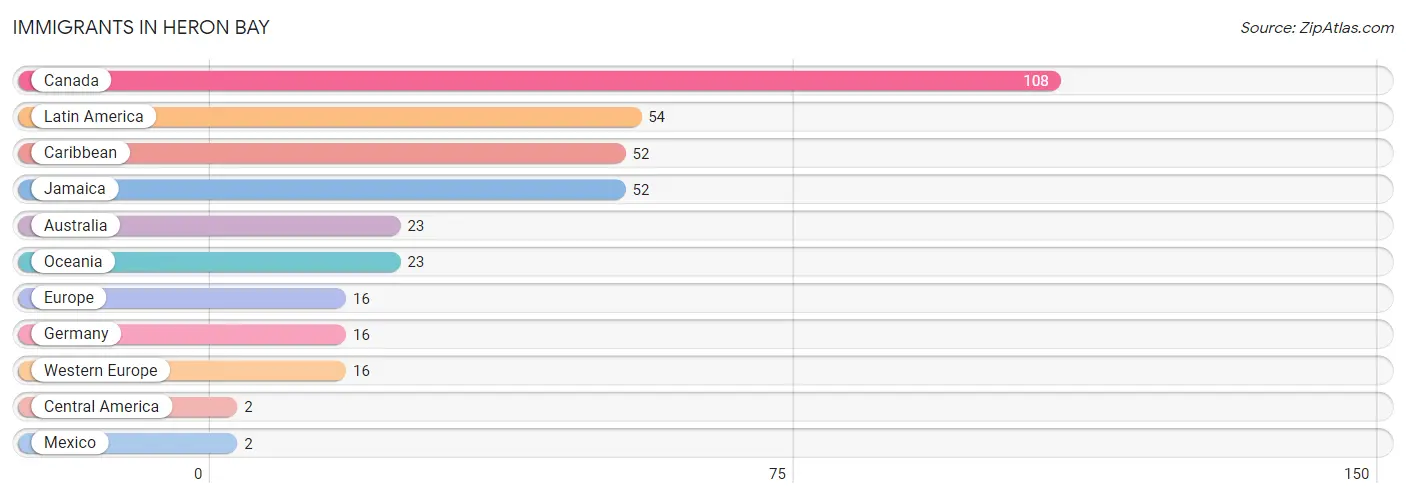
Immigrants in Heron Bay
The most numerous immigrant groups reported in Heron Bay came from Canada (108 | 2.8%), Latin America (54 | 1.4%), Caribbean (52 | 1.3%), Jamaica (52 | 1.3%), and Australia (23 | 0.6%), together accounting for 7.4% of all Heron Bay residents.
| Immigration Origin | # Population | % Population |
| Australia | 23 | 0.6% |
| Canada | 108 | 2.8% |
| Caribbean | 52 | 1.3% |
| Central America | 2 | 0.1% |
| Europe | 16 | 0.4% |
| Germany | 16 | 0.4% |
| Jamaica | 52 | 1.3% |
| Latin America | 54 | 1.4% |
| Mexico | 2 | 0.1% |
| Oceania | 23 | 0.6% |
| Western Europe | 16 | 0.4% | View All 11 Rows |
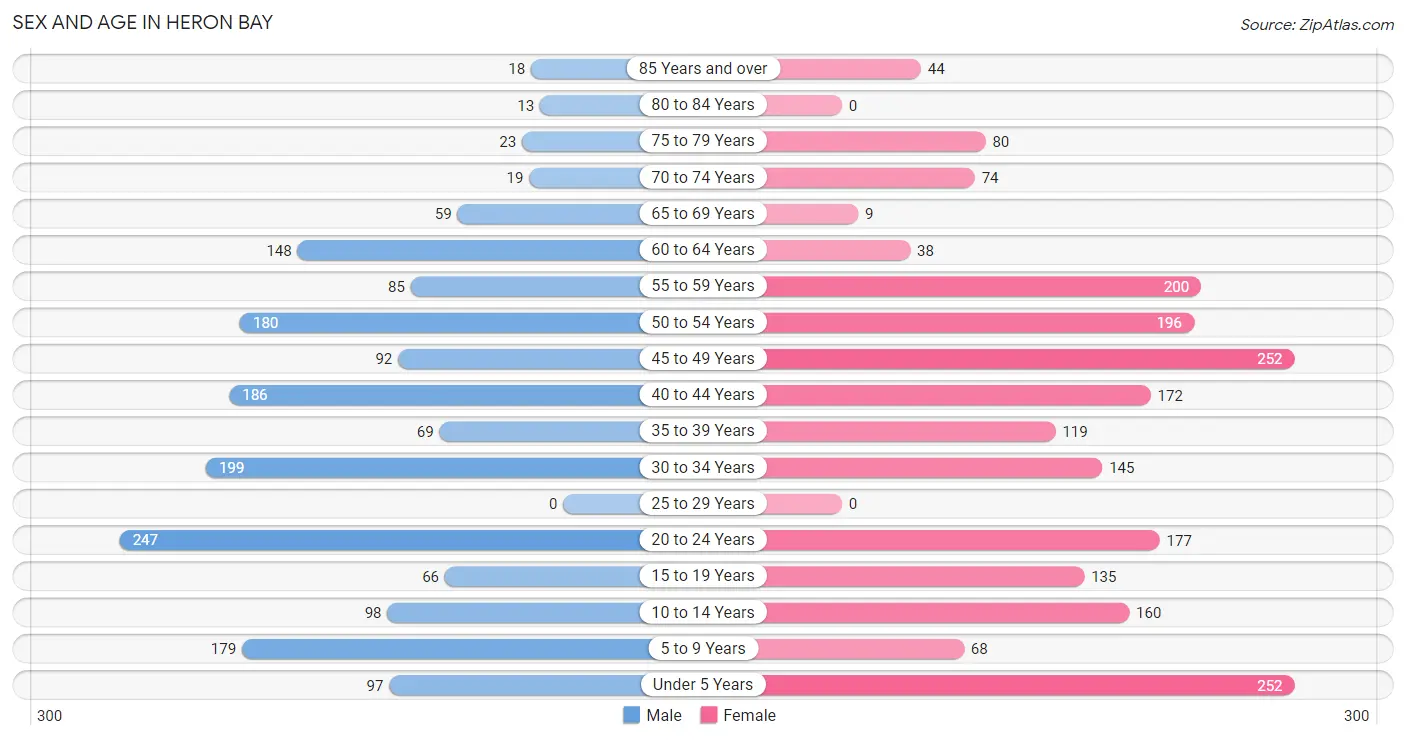
Sex and Age in Heron Bay
Sex and Age in Heron Bay
The most populous age groups in Heron Bay are 20 to 24 Years (247 | 13.9%) for men and Under 5 Years (252 | 11.9%) for women.
| Age Bracket | Male | Female |
| Under 5 Years | 97 (5.5%) | 252 (11.9%) |
| 5 to 9 Years | 179 (10.1%) | 68 (3.2%) |
| 10 to 14 Years | 98 (5.5%) | 160 (7.5%) |
| 15 to 19 Years | 66 (3.7%) | 135 (6.4%) |
| 20 to 24 Years | 247 (13.9%) | 177 (8.4%) |
| 25 to 29 Years | 0 (0.0%) | 0 (0.0%) |
| 30 to 34 Years | 199 (11.2%) | 145 (6.8%) |
| 35 to 39 Years | 69 (3.9%) | 119 (5.6%) |
| 40 to 44 Years | 186 (10.5%) | 172 (8.1%) |
| 45 to 49 Years | 92 (5.2%) | 252 (11.9%) |
| 50 to 54 Years | 180 (10.1%) | 196 (9.2%) |
| 55 to 59 Years | 85 (4.8%) | 200 (9.4%) |
| 60 to 64 Years | 148 (8.3%) | 38 (1.8%) |
| 65 to 69 Years | 59 (3.3%) | 9 (0.4%) |
| 70 to 74 Years | 19 (1.1%) | 74 (3.5%) |
| 75 to 79 Years | 23 (1.3%) | 80 (3.8%) |
| 80 to 84 Years | 13 (0.7%) | 0 (0.0%) |
| 85 Years and over | 18 (1.0%) | 44 (2.1%) |
| Total | 1,778 (100.0%) | 2,121 (100.0%) |
Families and Households in Heron Bay
Median Family Size in Heron Bay
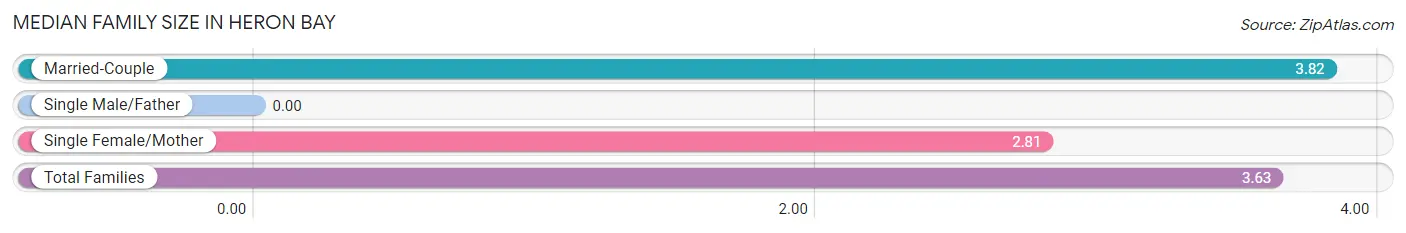
| Family Type | # Families | Family Size |
| Married-Couple | 818 (81.4%) | 3.82 |
| Single Male/Father | 0 (0.0%) | - |
| Single Female/Mother | 187 (18.6%) | 2.81 |
| Total Families | 1,005 (100.0%) | 3.63 |
Median Household Size in Heron Bay
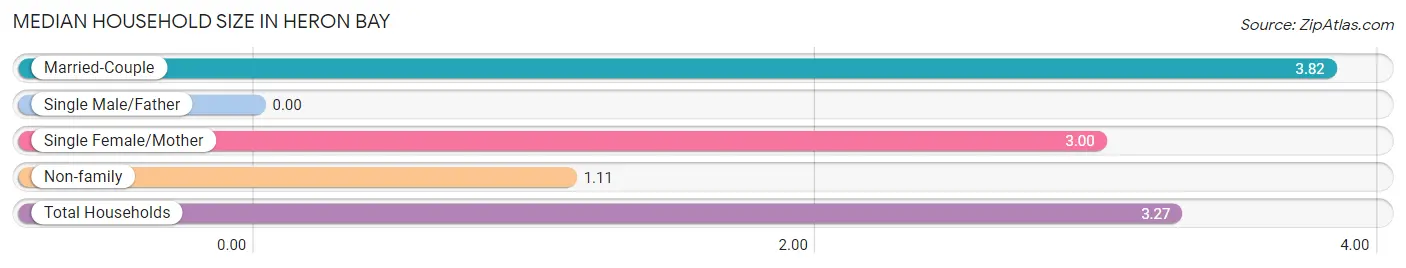
| Household Type | # Households | Household Size |
| Married-Couple | 818 (68.6%) | 3.82 |
| Single Male/Father | 0 (0.0%) | - |
| Single Female/Mother | 187 (15.7%) | 3.00 |
| Non-family | 187 (15.7%) | 1.11 |
| Total Households | 1,192 (100.0%) | 3.27 |
Household Size by Marriage Status in Heron Bay
Out of a total of 1,192 households in Heron Bay, 1,005 (84.3%) are family households, while 187 (15.7%) are nonfamily households. The most numerous type of family households are 2-person households, comprising 294, and the most common type of nonfamily households are 1-person households, comprising 159.
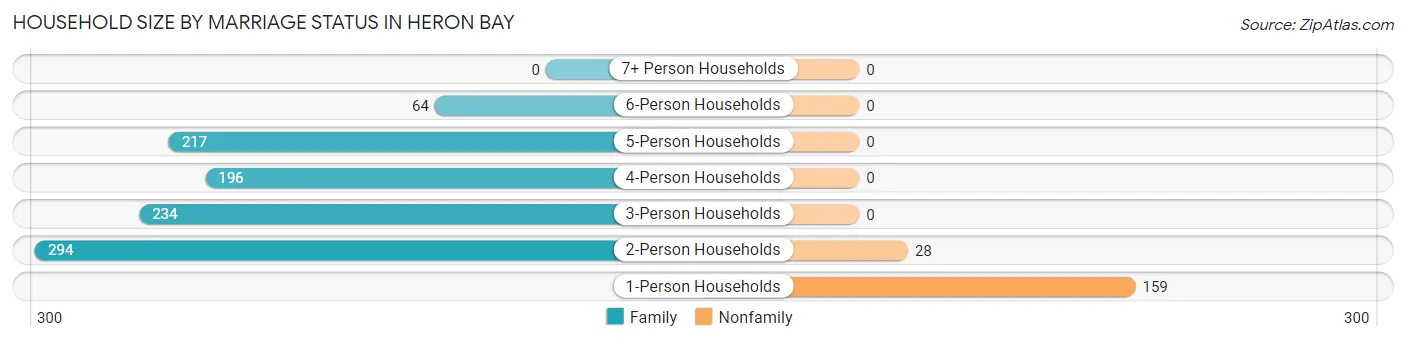
| Household Size | Family Households | Nonfamily Households |
| 1-Person Households | - | 159 (13.3%) |
| 2-Person Households | 294 (24.7%) | 28 (2.4%) |
| 3-Person Households | 234 (19.6%) | 0 (0.0%) |
| 4-Person Households | 196 (16.4%) | 0 (0.0%) |
| 5-Person Households | 217 (18.2%) | 0 (0.0%) |
| 6-Person Households | 64 (5.4%) | 0 (0.0%) |
| 7+ Person Households | 0 (0.0%) | 0 (0.0%) |
| Total | 1,005 (84.3%) | 187 (15.7%) |
Female Fertility in Heron Bay
Fertility by Age in Heron Bay
| Age Bracket | Women with Births | Births / 1,000 Women |
| 15 to 19 years | 0 (0.0%) | 0.0 |
| 20 to 34 years | 0 (0.0%) | 0.0 |
| 35 to 50 years | 0 (0.0%) | 0.0 |
| Total | 0 (0.0%) | 0.0 |
Fertility by Age by Marriage Status in Heron Bay
| Age Bracket | Married | Unmarried |
| 15 to 19 years | 0 (0.0%) | 0 (0.0%) |
| 20 to 34 years | 0 (0.0%) | 0 (0.0%) |
| 35 to 50 years | 0 (0.0%) | 0 (0.0%) |
| Total | 0 (0.0%) | 0 (0.0%) |
Fertility by Education in Heron Bay
| Educational Attainment | Women with Births | Births / 1,000 Women |
| Less than High School | 0 (0.0%) | 0.0 |
| High School Diploma | 0 (0.0%) | 0.0 |
| College or Associate's Degree | 0 (0.0%) | 0.0 |
| Bachelor's Degree | 0 (0.0%) | 0.0 |
| Graduate Degree | 0 (0.0%) | 0.0 |
| Total | 0 (0.0%) | 0.0 |
Fertility by Education by Marriage Status in Heron Bay
| Educational Attainment | Married | Unmarried |
| Less than High School | 0 (0.0%) | 0 (0.0%) |
| High School Diploma | 0 (0.0%) | 0 (0.0%) |
| College or Associate's Degree | 0 (0.0%) | 0 (0.0%) |
| Bachelor's Degree | 0 (0.0%) | 0 (0.0%) |
| Graduate Degree | 0 (0.0%) | 0 (0.0%) |
| Total | 0 (0.0%) | 0 (0.0%) |
Employment Characteristics in Heron Bay
Employment by Class of Employer in Heron Bay
Among the 1,920 employed individuals in Heron Bay, private company employees (1,217 | 63.4%), local government employees (259 | 13.5%), and not-for-profit organizations (149 | 7.8%) make up the most common classes of employment.
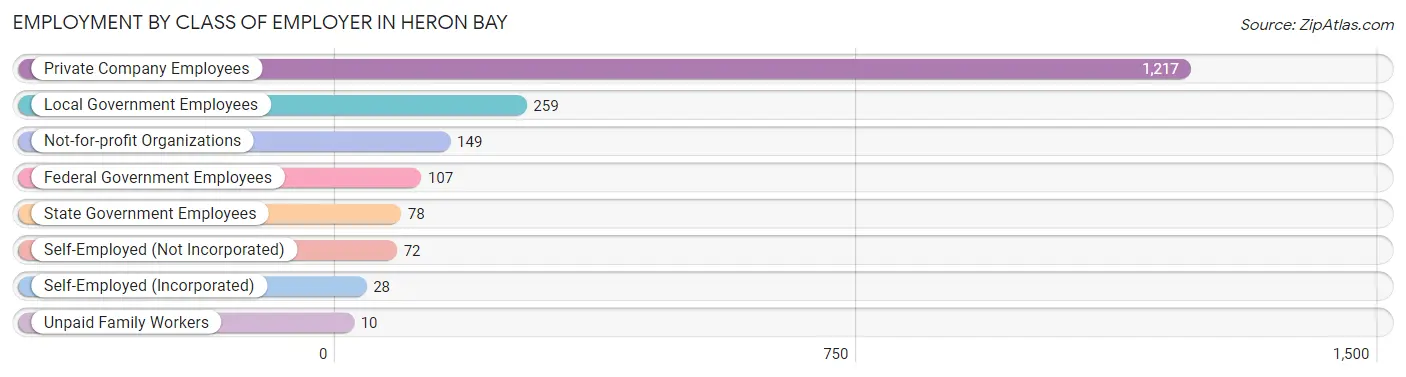
| Employer Class | # Employees | % Employees |
| Private Company Employees | 1,217 | 63.4% |
| Self-Employed (Incorporated) | 28 | 1.5% |
| Self-Employed (Not Incorporated) | 72 | 3.7% |
| Not-for-profit Organizations | 149 | 7.8% |
| Local Government Employees | 259 | 13.5% |
| State Government Employees | 78 | 4.1% |
| Federal Government Employees | 107 | 5.6% |
| Unpaid Family Workers | 10 | 0.5% |
| Total | 1,920 | 100.0% |
Employment Status by Age in Heron Bay
According to the labor force statistics for Heron Bay, out of the total population over 16 years of age (3,045), 69.2% or 2,107 individuals are in the labor force, with 5.2% or 110 of them unemployed. The age group with the highest labor force participation rate is 45 to 54 years, with 91.5% or 659 individuals in the labor force. Within the labor force, the 16 to 19 years age range has the highest percentage of unemployed individuals, with 100.0% or 46 of them being unemployed.
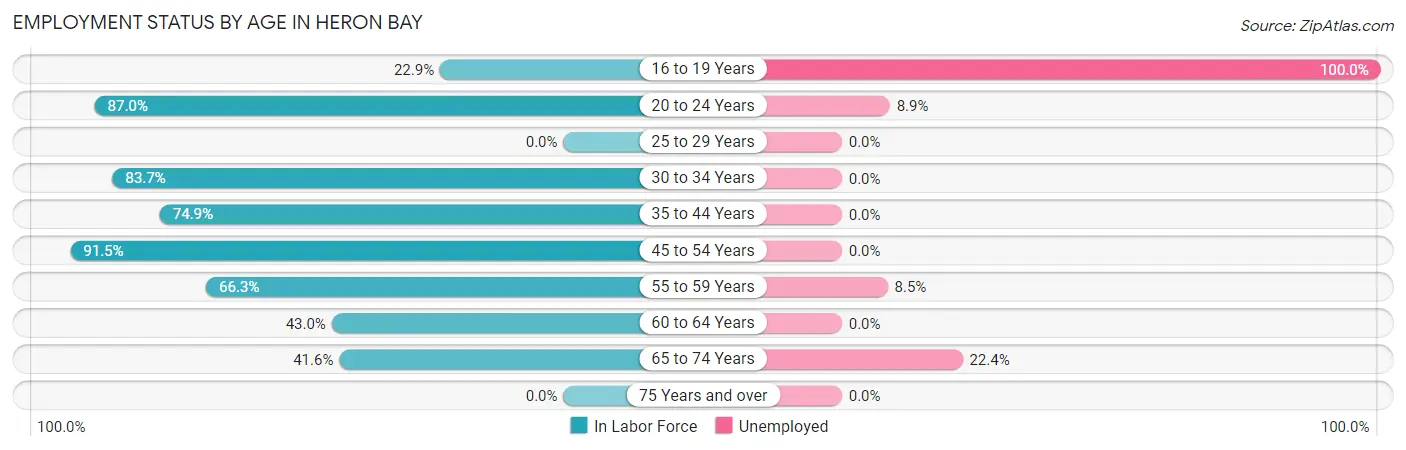
| Age Bracket | In Labor Force | Unemployed |
| 16 to 19 Years | 46 (22.9%) | 46 (100.0%) |
| 20 to 24 Years | 369 (87.0%) | 33 (8.9%) |
| 25 to 29 Years | 0 (0.0%) | 0 (0.0%) |
| 30 to 34 Years | 288 (83.7%) | 0 (0.0%) |
| 35 to 44 Years | 409 (74.9%) | 0 (0.0%) |
| 45 to 54 Years | 659 (91.5%) | 0 (0.0%) |
| 55 to 59 Years | 189 (66.3%) | 16 (8.5%) |
| 60 to 64 Years | 80 (43.0%) | 0 (0.0%) |
| 65 to 74 Years | 67 (41.6%) | 15 (22.4%) |
| 75 Years and over | 0 (0.0%) | 0 (0.0%) |
| Total | 2,107 (69.2%) | 110 (5.2%) |
Employment Status by Educational Attainment in Heron Bay
According to labor force statistics for Heron Bay, 78.1% of individuals (1,625) out of the total population between 25 and 64 years of age (2,081) are in the labor force, with 1.0% or 16 of them being unemployed. The group with the highest labor force participation rate are those with the educational attainment of high school diploma, with 93.7% or 311 individuals in the labor force. Within the labor force, individuals with bachelor's degree or higher education have the highest percentage of unemployment, with 2.3% or 16 of them being unemployed.
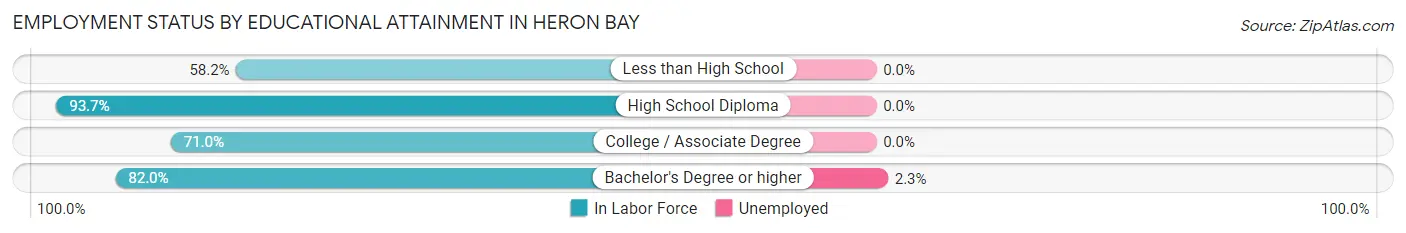
| Educational Attainment | In Labor Force | Unemployed |
| Less than High School | 103 (58.2%) | 0 (0.0%) |
| High School Diploma | 311 (93.7%) | 0 (0.0%) |
| College / Associate Degree | 504 (71.0%) | 0 (0.0%) |
| Bachelor's Degree or higher | 707 (82.0%) | 20 (2.3%) |
| Total | 1,625 (78.1%) | 21 (1.0%) |
Employment Occupations by Sex in Heron Bay
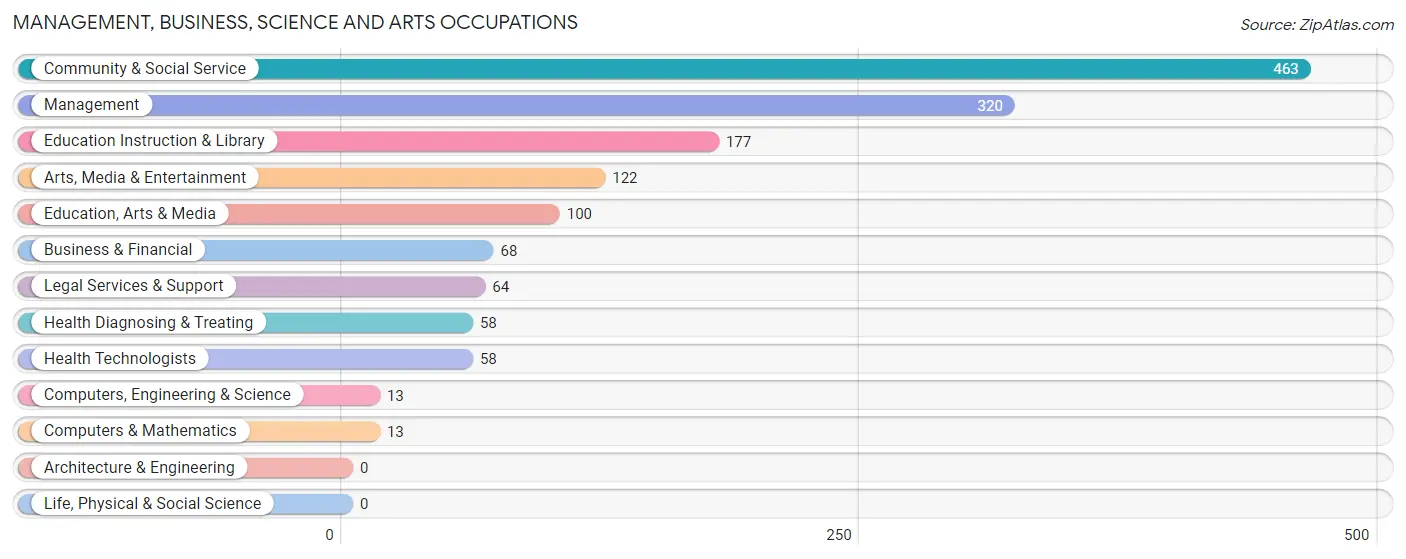
Management, Business, Science and Arts Occupations
The most common Management, Business, Science and Arts occupations in Heron Bay are Community & Social Service (463 | 23.2%), Management (320 | 16.0%), Education Instruction & Library (177 | 8.9%), Arts, Media & Entertainment (122 | 6.1%), and Education, Arts & Media (100 | 5.0%).
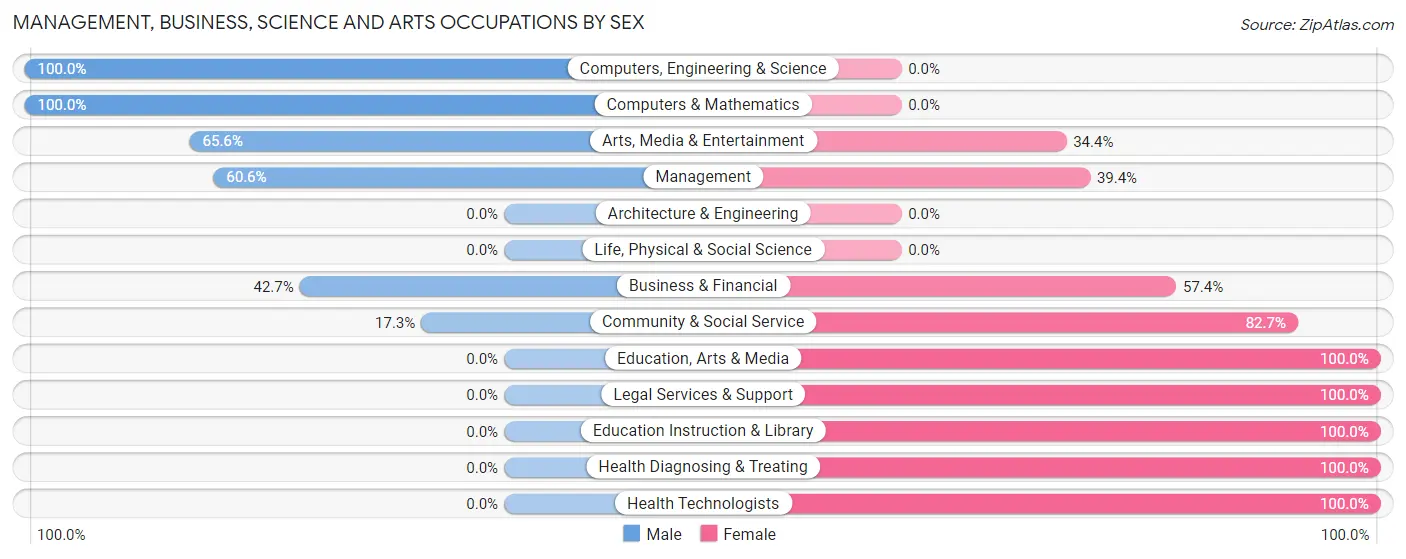
Management, Business, Science and Arts Occupations by Sex
Within the Management, Business, Science and Arts occupations in Heron Bay, the most male-oriented occupations are Computers, Engineering & Science (100.0%), Computers & Mathematics (100.0%), and Arts, Media & Entertainment (65.6%), while the most female-oriented occupations are Education, Arts & Media (100.0%), Legal Services & Support (100.0%), and Education Instruction & Library (100.0%).
| Occupation | Male | Female |
| Management | 194 (60.6%) | 126 (39.4%) |
| Business & Financial | 29 (42.6%) | 39 (57.4%) |
| Computers, Engineering & Science | 13 (100.0%) | 0 (0.0%) |
| Computers & Mathematics | 13 (100.0%) | 0 (0.0%) |
| Architecture & Engineering | 0 (0.0%) | 0 (0.0%) |
| Life, Physical & Social Science | 0 (0.0%) | 0 (0.0%) |
| Community & Social Service | 80 (17.3%) | 383 (82.7%) |
| Education, Arts & Media | 0 (0.0%) | 100 (100.0%) |
| Legal Services & Support | 0 (0.0%) | 64 (100.0%) |
| Education Instruction & Library | 0 (0.0%) | 177 (100.0%) |
| Arts, Media & Entertainment | 80 (65.6%) | 42 (34.4%) |
| Health Diagnosing & Treating | 0 (0.0%) | 58 (100.0%) |
| Health Technologists | 0 (0.0%) | 58 (100.0%) |
| Total (Category) | 316 (34.3%) | 606 (65.7%) |
| Total (Overall) | 1,042 (52.2%) | 955 (47.8%) |
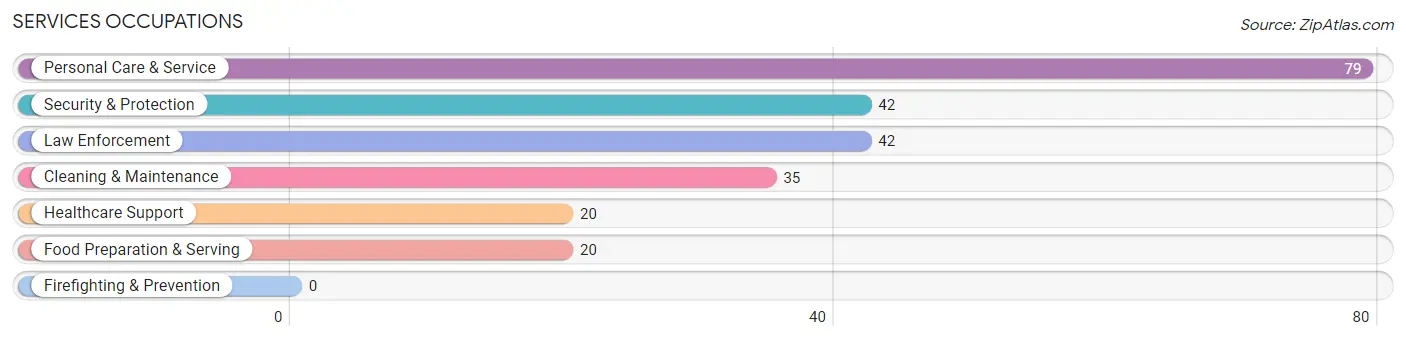
Services Occupations
The most common Services occupations in Heron Bay are Personal Care & Service (79 | 4.0%), Security & Protection (42 | 2.1%), Law Enforcement (42 | 2.1%), Cleaning & Maintenance (35 | 1.8%), and Healthcare Support (20 | 1.0%).
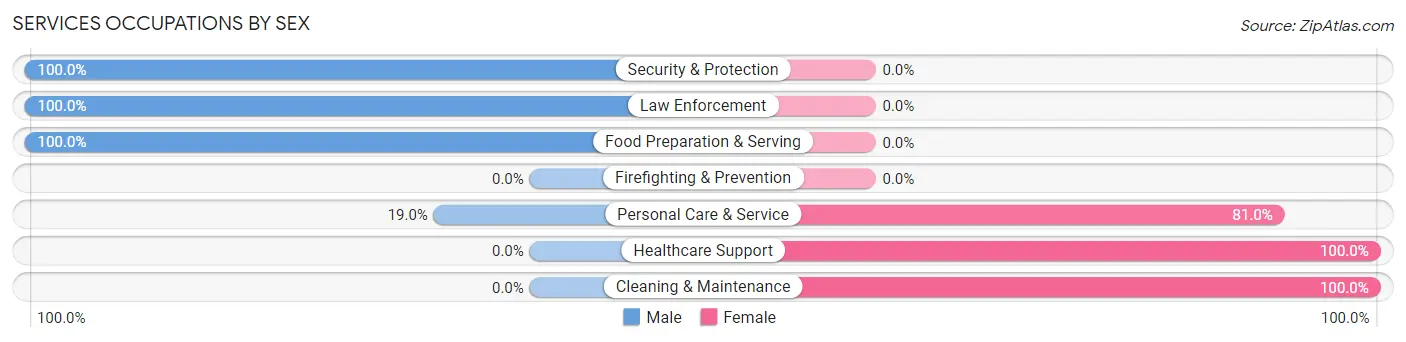
Services Occupations by Sex
Within the Services occupations in Heron Bay, the most male-oriented occupations are Security & Protection (100.0%), Law Enforcement (100.0%), and Food Preparation & Serving (100.0%), while the most female-oriented occupations are Healthcare Support (100.0%), Cleaning & Maintenance (100.0%), and Personal Care & Service (81.0%).
| Occupation | Male | Female |
| Healthcare Support | 0 (0.0%) | 20 (100.0%) |
| Security & Protection | 42 (100.0%) | 0 (0.0%) |
| Firefighting & Prevention | 0 (0.0%) | 0 (0.0%) |
| Law Enforcement | 42 (100.0%) | 0 (0.0%) |
| Food Preparation & Serving | 20 (100.0%) | 0 (0.0%) |
| Cleaning & Maintenance | 0 (0.0%) | 35 (100.0%) |
| Personal Care & Service | 15 (19.0%) | 64 (81.0%) |
| Total (Category) | 77 (39.3%) | 119 (60.7%) |
| Total (Overall) | 1,042 (52.2%) | 955 (47.8%) |
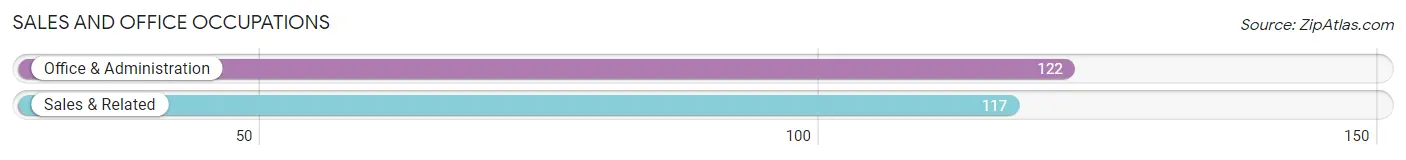
Sales and Office Occupations
The most common Sales and Office occupations in Heron Bay are Office & Administration (122 | 6.1%), and Sales & Related (117 | 5.9%).
Sales and Office Occupations by Sex
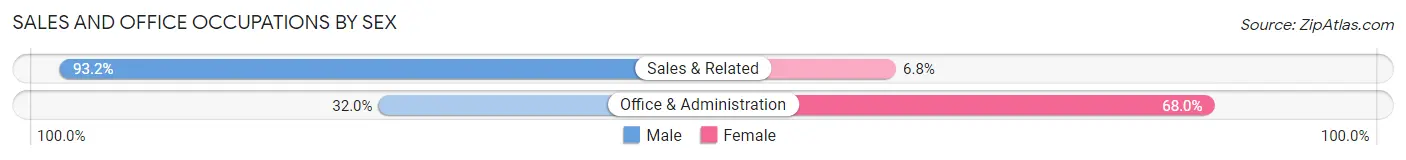
| Occupation | Male | Female |
| Sales & Related | 109 (93.2%) | 8 (6.8%) |
| Office & Administration | 39 (32.0%) | 83 (68.0%) |
| Total (Category) | 148 (61.9%) | 91 (38.1%) |
| Total (Overall) | 1,042 (52.2%) | 955 (47.8%) |
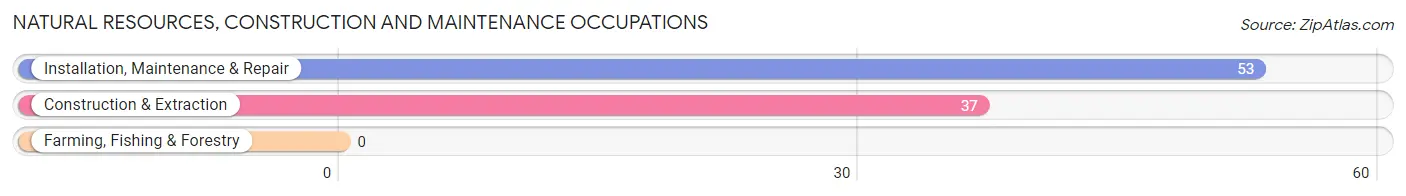
Natural Resources, Construction and Maintenance Occupations
The most common Natural Resources, Construction and Maintenance occupations in Heron Bay are Installation, Maintenance & Repair (53 | 2.6%), and Construction & Extraction (37 | 1.8%).
Natural Resources, Construction and Maintenance Occupations by Sex
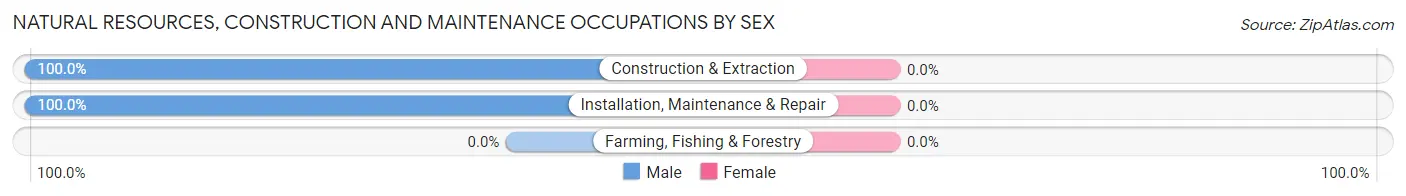
| Occupation | Male | Female |
| Farming, Fishing & Forestry | 0 (0.0%) | 0 (0.0%) |
| Construction & Extraction | 37 (100.0%) | 0 (0.0%) |
| Installation, Maintenance & Repair | 53 (100.0%) | 0 (0.0%) |
| Total (Category) | 90 (100.0%) | 0 (0.0%) |
| Total (Overall) | 1,042 (52.2%) | 955 (47.8%) |
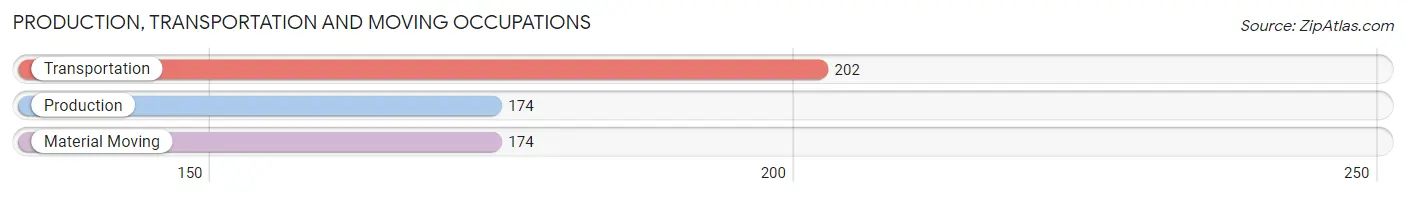
Production, Transportation and Moving Occupations
The most common Production, Transportation and Moving occupations in Heron Bay are Transportation (202 | 10.1%), Production (174 | 8.7%), and Material Moving (174 | 8.7%).
Production, Transportation and Moving Occupations by Sex
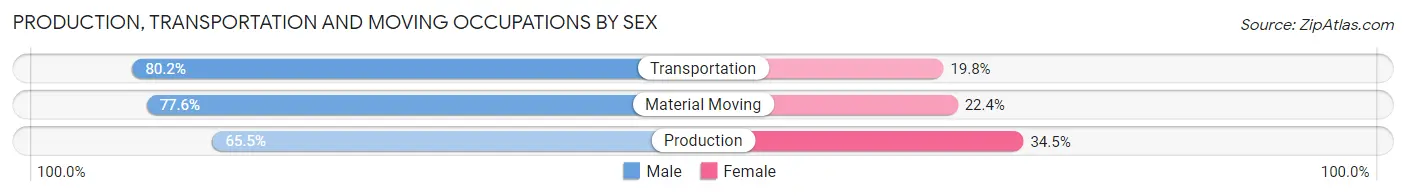
| Occupation | Male | Female |
| Production | 114 (65.5%) | 60 (34.5%) |
| Transportation | 162 (80.2%) | 40 (19.8%) |
| Material Moving | 135 (77.6%) | 39 (22.4%) |
| Total (Category) | 411 (74.7%) | 139 (25.3%) |
| Total (Overall) | 1,042 (52.2%) | 955 (47.8%) |
Employment Industries by Sex in Heron Bay
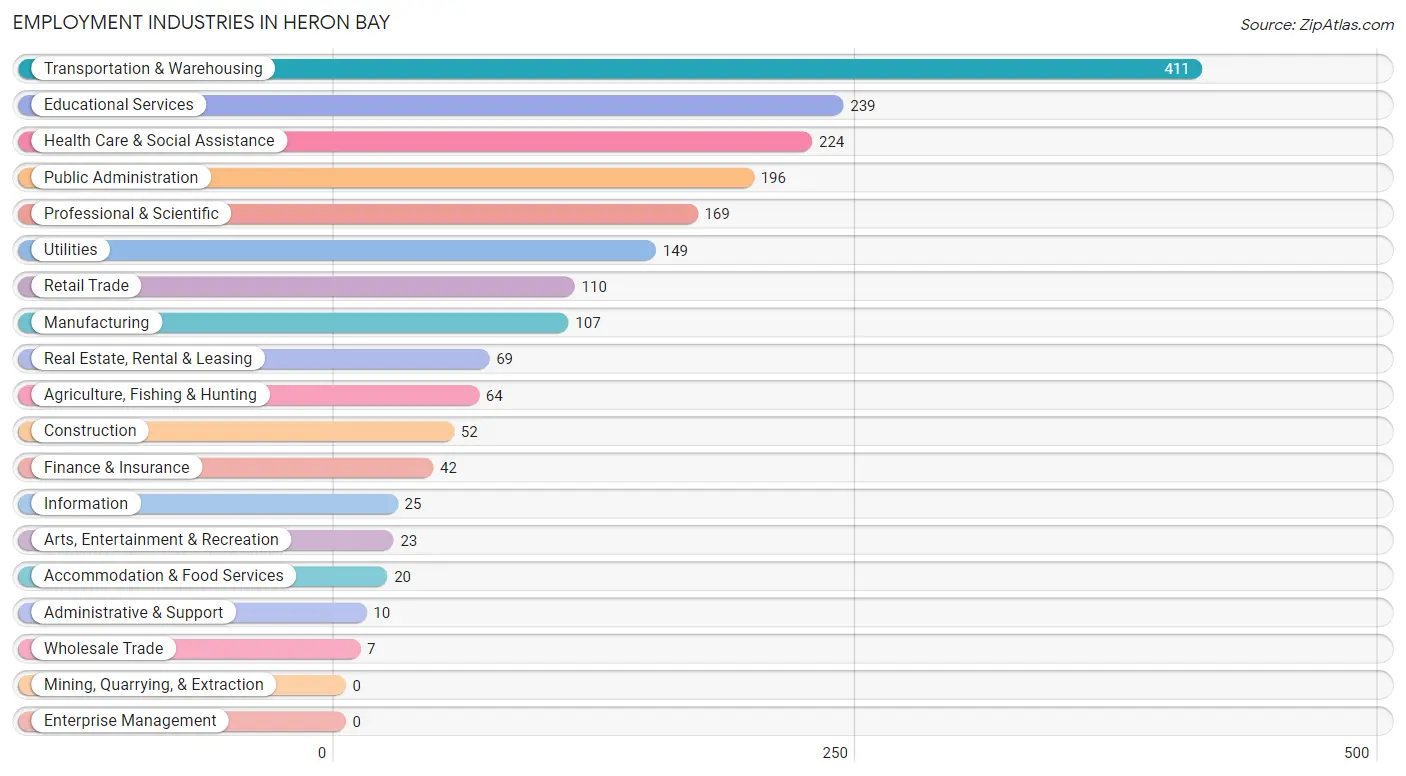
Employment Industries in Heron Bay
The major employment industries in Heron Bay include Transportation & Warehousing (411 | 20.6%), Educational Services (239 | 12.0%), Health Care & Social Assistance (224 | 11.2%), Public Administration (196 | 9.8%), and Professional & Scientific (169 | 8.5%).
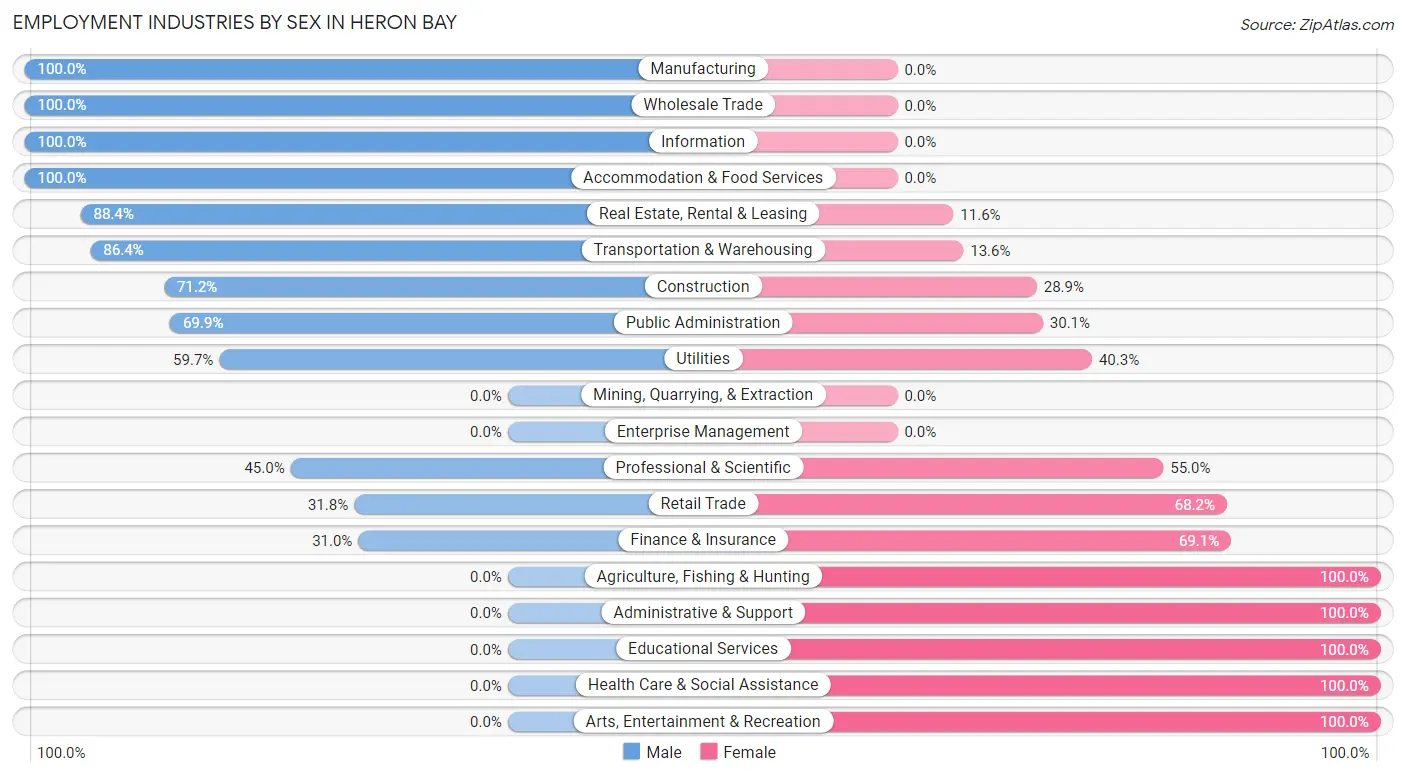
Employment Industries by Sex in Heron Bay
The Heron Bay industries that see more men than women are Manufacturing (100.0%), Wholesale Trade (100.0%), and Information (100.0%), whereas the industries that tend to have a higher number of women are Agriculture, Fishing & Hunting (100.0%), Administrative & Support (100.0%), and Educational Services (100.0%).
| Industry | Male | Female |
| Agriculture, Fishing & Hunting | 0 (0.0%) | 64 (100.0%) |
| Mining, Quarrying, & Extraction | 0 (0.0%) | 0 (0.0%) |
| Construction | 37 (71.2%) | 15 (28.8%) |
| Manufacturing | 107 (100.0%) | 0 (0.0%) |
| Wholesale Trade | 7 (100.0%) | 0 (0.0%) |
| Retail Trade | 35 (31.8%) | 75 (68.2%) |
| Transportation & Warehousing | 355 (86.4%) | 56 (13.6%) |
| Utilities | 89 (59.7%) | 60 (40.3%) |
| Information | 25 (100.0%) | 0 (0.0%) |
| Finance & Insurance | 13 (30.9%) | 29 (69.1%) |
| Real Estate, Rental & Leasing | 61 (88.4%) | 8 (11.6%) |
| Professional & Scientific | 76 (45.0%) | 93 (55.0%) |
| Enterprise Management | 0 (0.0%) | 0 (0.0%) |
| Administrative & Support | 0 (0.0%) | 10 (100.0%) |
| Educational Services | 0 (0.0%) | 239 (100.0%) |
| Health Care & Social Assistance | 0 (0.0%) | 224 (100.0%) |
| Arts, Entertainment & Recreation | 0 (0.0%) | 23 (100.0%) |
| Accommodation & Food Services | 20 (100.0%) | 0 (0.0%) |
| Public Administration | 137 (69.9%) | 59 (30.1%) |
| Total | 1,042 (52.2%) | 955 (47.8%) |
Education in Heron Bay
School Enrollment in Heron Bay
The most common levels of schooling among the 1,143 students in Heron Bay are graduate / professional (316 | 27.7%), middle school (258 | 22.6%), and college / undergraduate (179 | 15.7%).
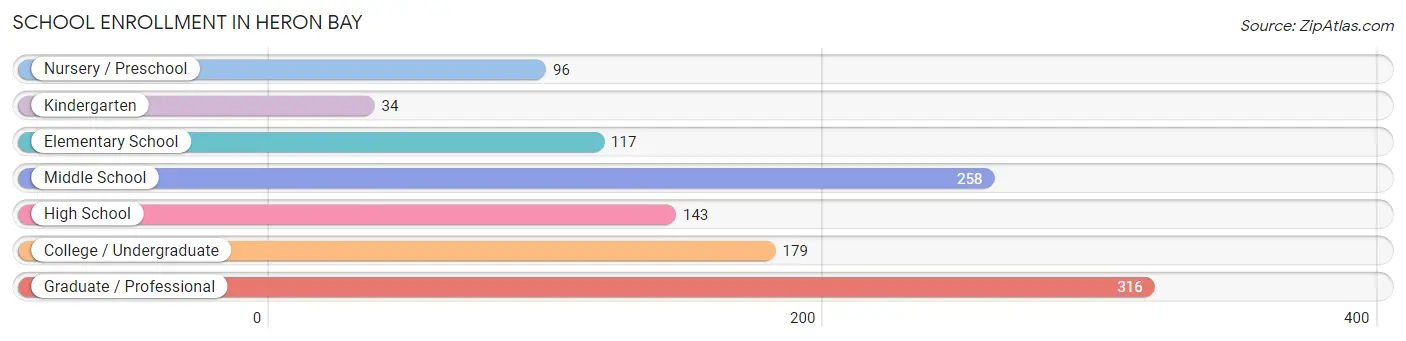
| School Level | # Students | % Students |
| Nursery / Preschool | 96 | 8.4% |
| Kindergarten | 34 | 3.0% |
| Elementary School | 117 | 10.2% |
| Middle School | 258 | 22.6% |
| High School | 143 | 12.5% |
| College / Undergraduate | 179 | 15.7% |
| Graduate / Professional | 316 | 27.7% |
| Total | 1,143 | 100.0% |
School Enrollment by Age by Funding Source in Heron Bay
Out of a total of 1,143 students who are enrolled in schools in Heron Bay, 354 (31.0%) attend a private institution, while the remaining 789 (69.0%) are enrolled in public schools. The age group of 35 years and over has the highest likelihood of being enrolled in private schools, with 216 (100.0% in the age bracket) enrolled. Conversely, the age group of 5 to 9 year old has the lowest likelihood of being enrolled in a private school, with 247 (100.0% in the age bracket) attending a public institution.
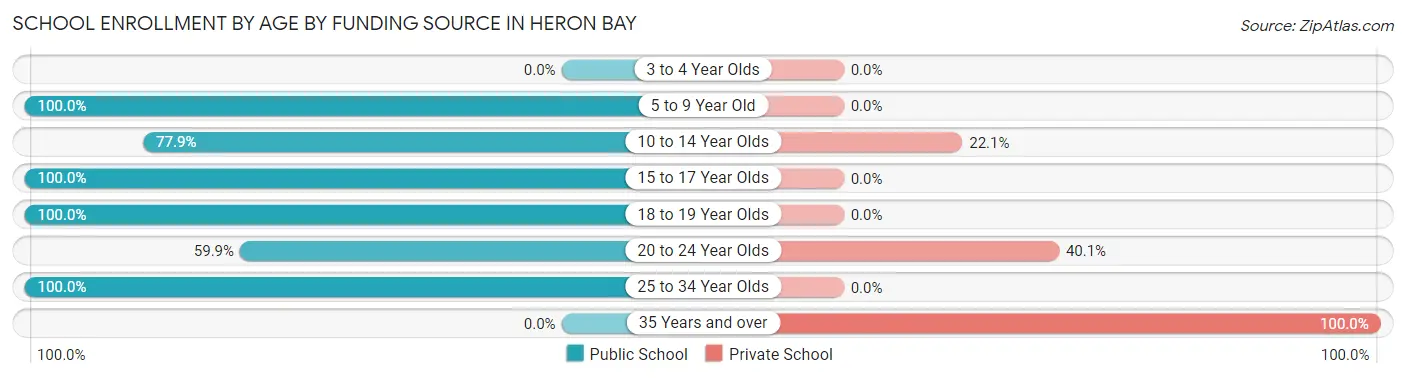
| Age Bracket | Public School | Private School |
| 3 to 4 Year Olds | 0 (0.0%) | 0 (0.0%) |
| 5 to 9 Year Old | 247 (100.0%) | 0 (0.0%) |
| 10 to 14 Year Olds | 201 (77.9%) | 57 (22.1%) |
| 15 to 17 Year Olds | 87 (100.0%) | 0 (0.0%) |
| 18 to 19 Year Olds | 114 (100.0%) | 0 (0.0%) |
| 20 to 24 Year Olds | 121 (59.9%) | 81 (40.1%) |
| 25 to 34 Year Olds | 19 (100.0%) | 0 (0.0%) |
| 35 Years and over | 0 (0.0%) | 216 (100.0%) |
| Total | 789 (69.0%) | 354 (31.0%) |
Educational Attainment by Field of Study in Heron Bay
Business (447 | 43.5%), engineering (118 | 11.5%), social sciences (79 | 7.7%), science & technology (77 | 7.5%), and psychology (76 | 7.4%) are the most common fields of study among 1,028 individuals in Heron Bay who have obtained a bachelor's degree or higher.
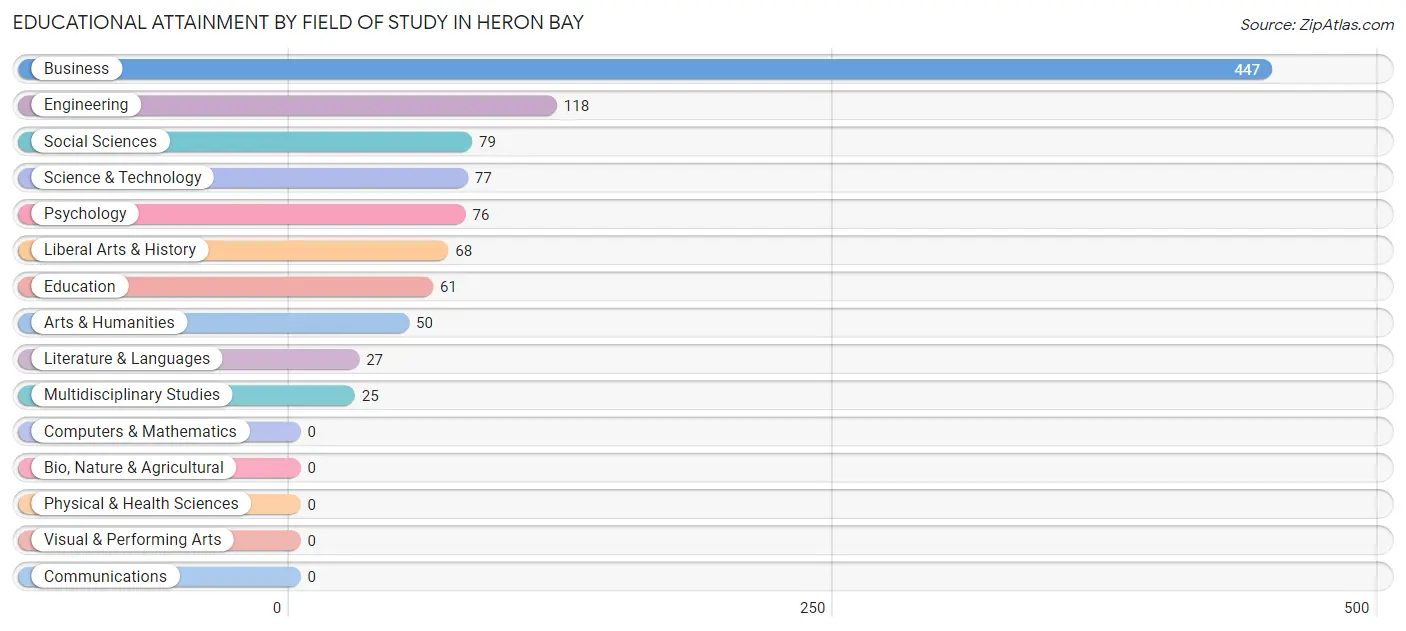
| Field of Study | # Graduates | % Graduates |
| Computers & Mathematics | 0 | 0.0% |
| Bio, Nature & Agricultural | 0 | 0.0% |
| Physical & Health Sciences | 0 | 0.0% |
| Psychology | 76 | 7.4% |
| Social Sciences | 79 | 7.7% |
| Engineering | 118 | 11.5% |
| Multidisciplinary Studies | 25 | 2.4% |
| Science & Technology | 77 | 7.5% |
| Business | 447 | 43.5% |
| Education | 61 | 5.9% |
| Literature & Languages | 27 | 2.6% |
| Liberal Arts & History | 68 | 6.6% |
| Visual & Performing Arts | 0 | 0.0% |
| Communications | 0 | 0.0% |
| Arts & Humanities | 50 | 4.9% |
| Total | 1,028 | 100.0% |
Transportation & Commute in Heron Bay
Vehicle Availability by Sex in Heron Bay
The most prevalent vehicle ownership categories in Heron Bay are males with 2 vehicles (452, accounting for 43.4%) and females with 2 vehicles (354, making up 51.5%).
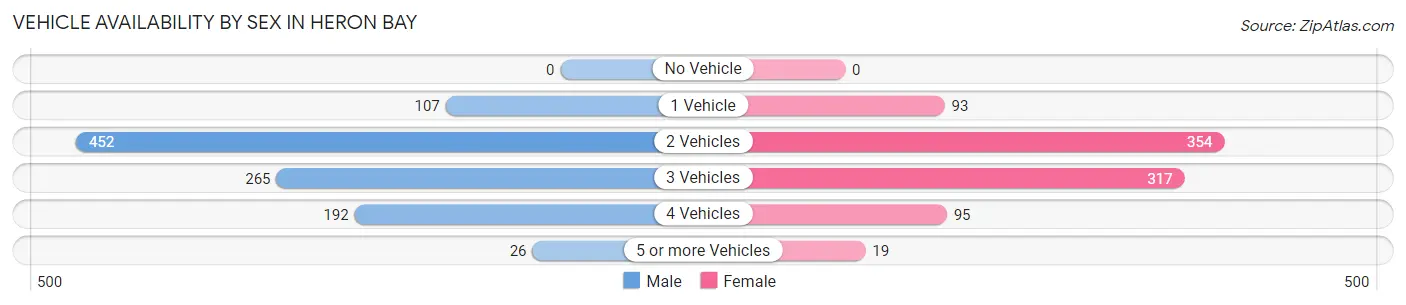
| Vehicles Available | Male | Female |
| No Vehicle | 0 (0.0%) | 0 (0.0%) |
| 1 Vehicle | 107 (10.3%) | 93 (10.6%) |
| 2 Vehicles | 452 (43.4%) | 354 (40.3%) |
| 3 Vehicles | 265 (25.4%) | 317 (36.1%) |
| 4 Vehicles | 192 (18.4%) | 95 (10.8%) |
| 5 or more Vehicles | 26 (2.5%) | 19 (2.2%) |
| Total | 1,042 (100.0%) | 878 (100.0%) |
Commute Time in Heron Bay
The most frequently occuring commute durations in Heron Bay are 45 to 59 minutes (448 commuters, 26.9%), 60 to 89 minutes (263 commuters, 15.8%), and 90 or more minutes (241 commuters, 14.5%).
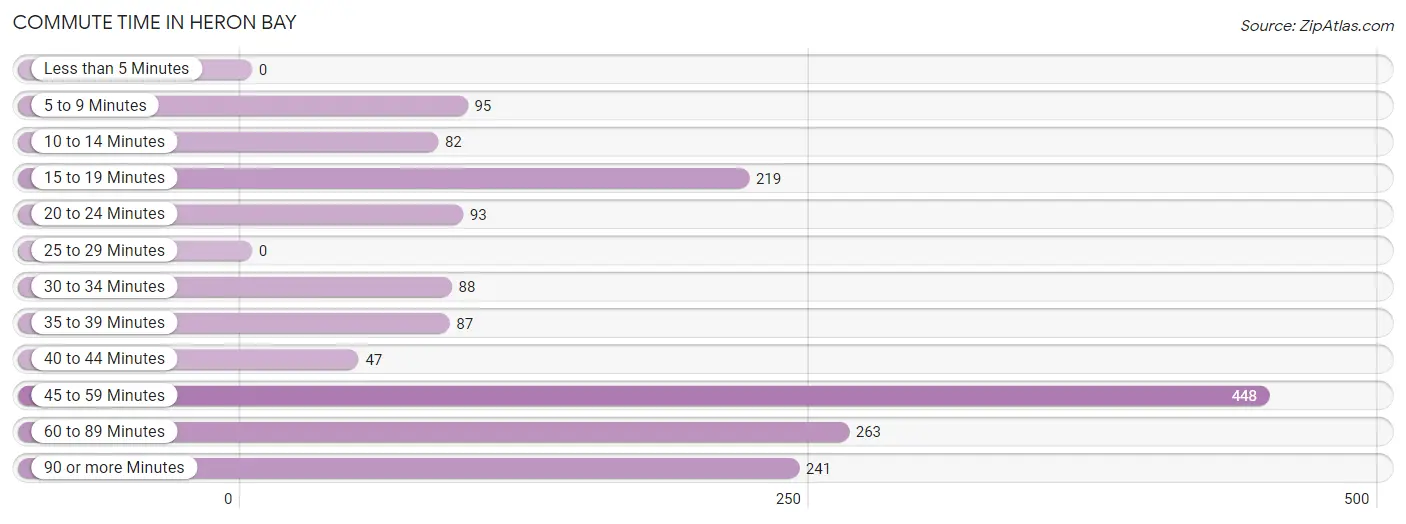
| Commute Time | # Commuters | % Commuters |
| Less than 5 Minutes | 0 | 0.0% |
| 5 to 9 Minutes | 95 | 5.7% |
| 10 to 14 Minutes | 82 | 4.9% |
| 15 to 19 Minutes | 219 | 13.2% |
| 20 to 24 Minutes | 93 | 5.6% |
| 25 to 29 Minutes | 0 | 0.0% |
| 30 to 34 Minutes | 88 | 5.3% |
| 35 to 39 Minutes | 87 | 5.2% |
| 40 to 44 Minutes | 47 | 2.8% |
| 45 to 59 Minutes | 448 | 26.9% |
| 60 to 89 Minutes | 263 | 15.8% |
| 90 or more Minutes | 241 | 14.5% |
Commute Time by Sex in Heron Bay
The most common commute times in Heron Bay are 60 to 89 minutes (199 commuters, 21.5%) for males and 45 to 59 minutes (254 commuters, 34.4%) for females.
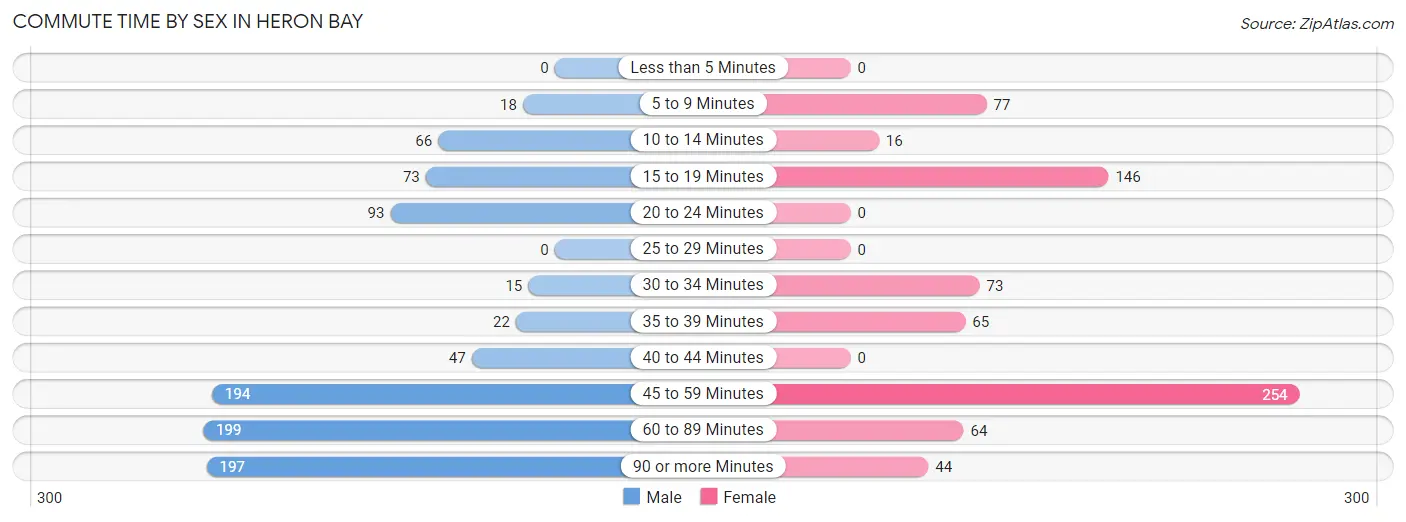
| Commute Time | Male | Female |
| Less than 5 Minutes | 0 (0.0%) | 0 (0.0%) |
| 5 to 9 Minutes | 18 (1.9%) | 77 (10.4%) |
| 10 to 14 Minutes | 66 (7.1%) | 16 (2.2%) |
| 15 to 19 Minutes | 73 (7.9%) | 146 (19.8%) |
| 20 to 24 Minutes | 93 (10.1%) | 0 (0.0%) |
| 25 to 29 Minutes | 0 (0.0%) | 0 (0.0%) |
| 30 to 34 Minutes | 15 (1.6%) | 73 (9.9%) |
| 35 to 39 Minutes | 22 (2.4%) | 65 (8.8%) |
| 40 to 44 Minutes | 47 (5.1%) | 0 (0.0%) |
| 45 to 59 Minutes | 194 (21.0%) | 254 (34.4%) |
| 60 to 89 Minutes | 199 (21.5%) | 64 (8.7%) |
| 90 or more Minutes | 197 (21.3%) | 44 (5.9%) |
Time of Departure to Work by Sex in Heron Bay
The most frequent times of departure to work in Heron Bay are 5:30 AM to 5:59 AM (158, 17.1%) for males and 6:00 AM to 6:29 AM (190, 25.7%) for females.
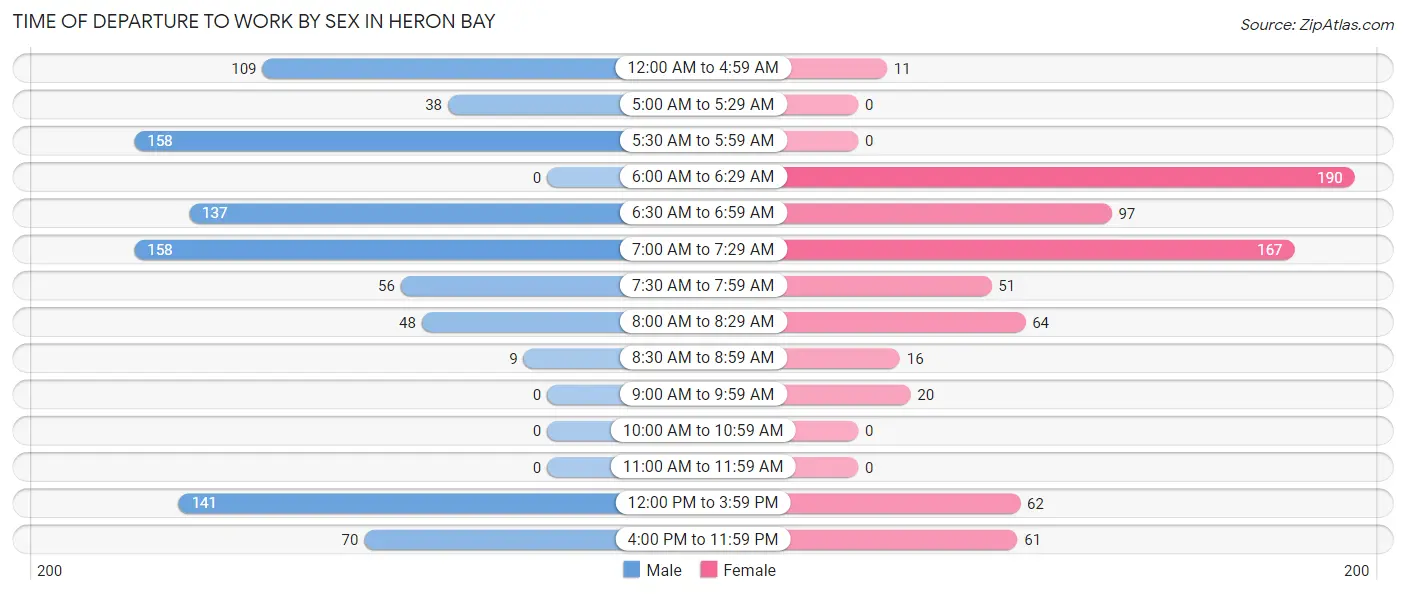
| Time of Departure | Male | Female |
| 12:00 AM to 4:59 AM | 109 (11.8%) | 11 (1.5%) |
| 5:00 AM to 5:29 AM | 38 (4.1%) | 0 (0.0%) |
| 5:30 AM to 5:59 AM | 158 (17.1%) | 0 (0.0%) |
| 6:00 AM to 6:29 AM | 0 (0.0%) | 190 (25.7%) |
| 6:30 AM to 6:59 AM | 137 (14.8%) | 97 (13.1%) |
| 7:00 AM to 7:29 AM | 158 (17.1%) | 167 (22.6%) |
| 7:30 AM to 7:59 AM | 56 (6.1%) | 51 (6.9%) |
| 8:00 AM to 8:29 AM | 48 (5.2%) | 64 (8.7%) |
| 8:30 AM to 8:59 AM | 9 (1.0%) | 16 (2.2%) |
| 9:00 AM to 9:59 AM | 0 (0.0%) | 20 (2.7%) |
| 10:00 AM to 10:59 AM | 0 (0.0%) | 0 (0.0%) |
| 11:00 AM to 11:59 AM | 0 (0.0%) | 0 (0.0%) |
| 12:00 PM to 3:59 PM | 141 (15.3%) | 62 (8.4%) |
| 4:00 PM to 11:59 PM | 70 (7.6%) | 61 (8.3%) |
| Total | 924 (100.0%) | 739 (100.0%) |
Housing Occupancy in Heron Bay
Occupancy by Ownership in Heron Bay
Of the total 1,192 dwellings in Heron Bay, owner-occupied units account for 1,116 (93.6%), while renter-occupied units make up 76 (6.4%).
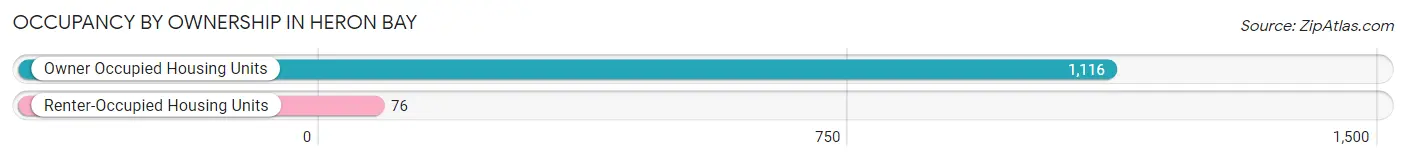
| Occupancy | # Housing Units | % Housing Units |
| Owner Occupied Housing Units | 1,116 | 93.6% |
| Renter-Occupied Housing Units | 76 | 6.4% |
| Total Occupied Housing Units | 1,192 | 100.0% |
Occupancy by Household Size in Heron Bay
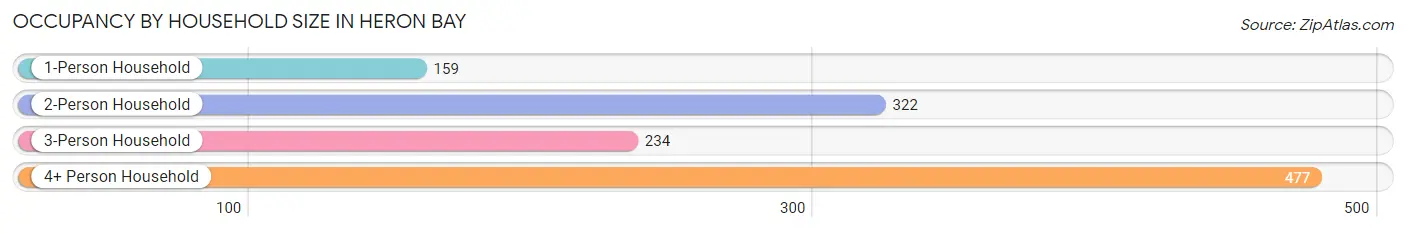
| Household Size | # Housing Units | % Housing Units |
| 1-Person Household | 159 | 13.3% |
| 2-Person Household | 322 | 27.0% |
| 3-Person Household | 234 | 19.6% |
| 4+ Person Household | 477 | 40.0% |
| Total Housing Units | 1,192 | 100.0% |
Occupancy by Ownership by Household Size in Heron Bay
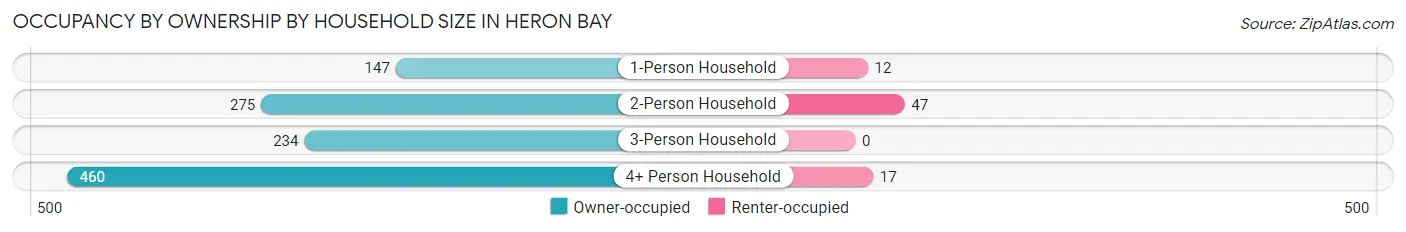
| Household Size | Owner-occupied | Renter-occupied |
| 1-Person Household | 147 (92.4%) | 12 (7.5%) |
| 2-Person Household | 275 (85.4%) | 47 (14.6%) |
| 3-Person Household | 234 (100.0%) | 0 (0.0%) |
| 4+ Person Household | 460 (96.4%) | 17 (3.6%) |
| Total Housing Units | 1,116 (93.6%) | 76 (6.4%) |
Occupancy by Educational Attainment in Heron Bay
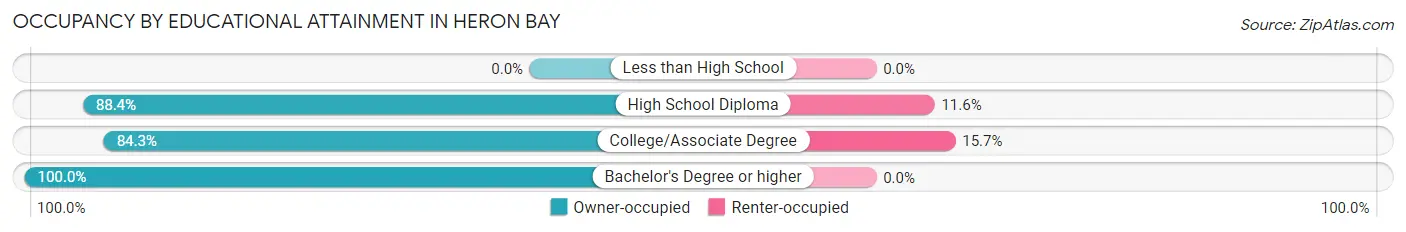
| Household Size | Owner-occupied | Renter-occupied |
| Less than High School | 0 (0.0%) | 0 (0.0%) |
| High School Diploma | 130 (88.4%) | 17 (11.6%) |
| College/Associate Degree | 317 (84.3%) | 59 (15.7%) |
| Bachelor's Degree or higher | 669 (100.0%) | 0 (0.0%) |
Occupancy by Age of Householder in Heron Bay
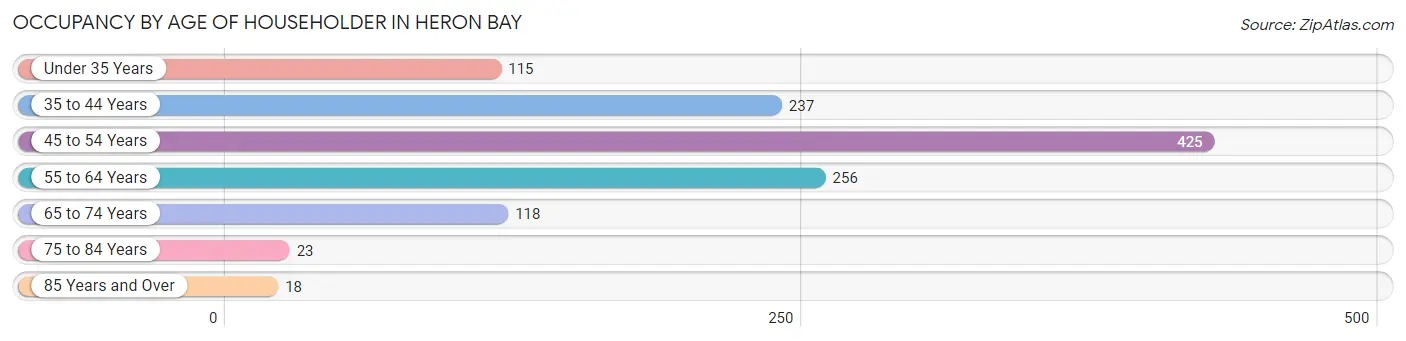
| Age Bracket | # Households | % Households |
| Under 35 Years | 115 | 9.7% |
| 35 to 44 Years | 237 | 19.9% |
| 45 to 54 Years | 425 | 35.6% |
| 55 to 64 Years | 256 | 21.5% |
| 65 to 74 Years | 118 | 9.9% |
| 75 to 84 Years | 23 | 1.9% |
| 85 Years and Over | 18 | 1.5% |
| Total | 1,192 | 100.0% |
Housing Finances in Heron Bay
Median Income by Occupancy in Heron Bay
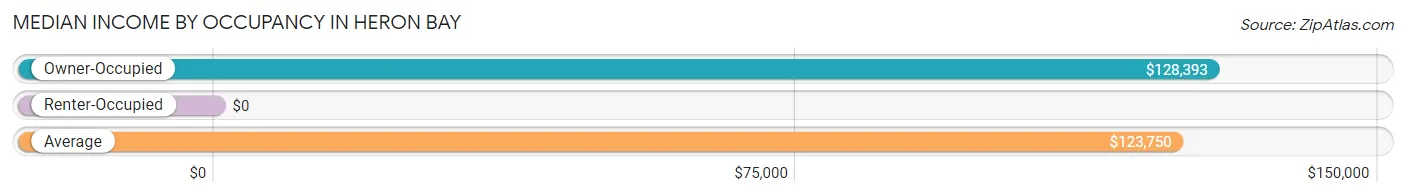
| Occupancy Type | # Households | Median Income |
| Owner-Occupied | 1,116 (93.6%) | $128,393 |
| Renter-Occupied | 76 (6.4%) | $0 |
| Average | 1,192 (100.0%) | $123,750 |
Occupancy by Householder Income Bracket in Heron Bay
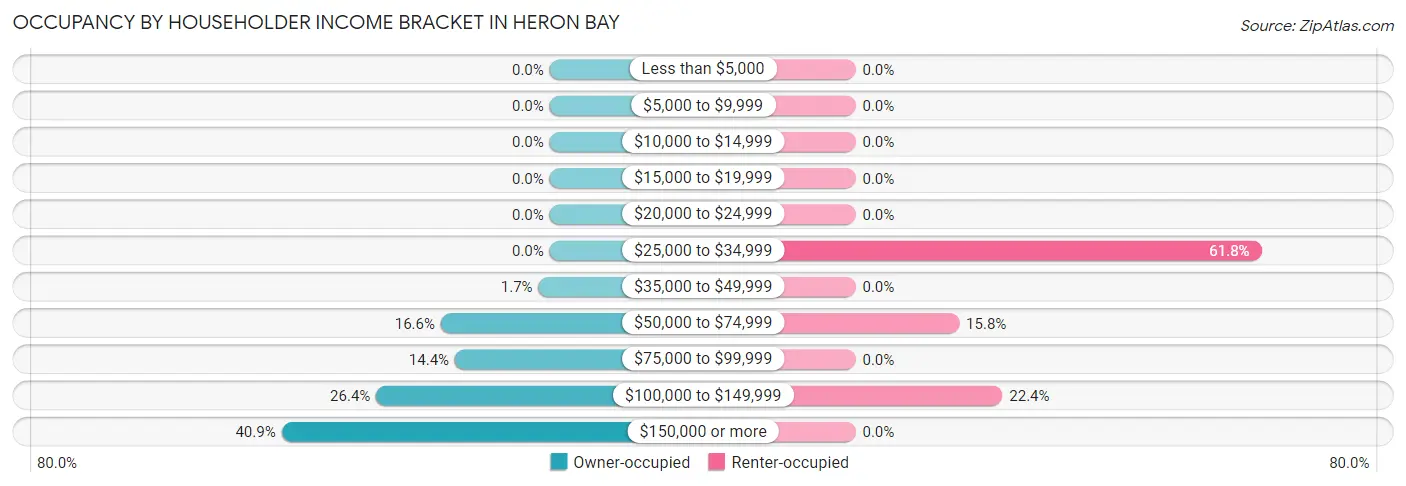
| Income Bracket | Owner-occupied | Renter-occupied |
| Less than $5,000 | 0 (0.0%) | 0 (0.0%) |
| $5,000 to $9,999 | 0 (0.0%) | 0 (0.0%) |
| $10,000 to $14,999 | 0 (0.0%) | 0 (0.0%) |
| $15,000 to $19,999 | 0 (0.0%) | 0 (0.0%) |
| $20,000 to $24,999 | 0 (0.0%) | 0 (0.0%) |
| $25,000 to $34,999 | 0 (0.0%) | 47 (61.8%) |
| $35,000 to $49,999 | 19 (1.7%) | 0 (0.0%) |
| $50,000 to $74,999 | 185 (16.6%) | 12 (15.8%) |
| $75,000 to $99,999 | 161 (14.4%) | 0 (0.0%) |
| $100,000 to $149,999 | 295 (26.4%) | 17 (22.4%) |
| $150,000 or more | 456 (40.9%) | 0 (0.0%) |
| Total | 1,116 (100.0%) | 76 (100.0%) |
Monthly Housing Cost Tiers in Heron Bay
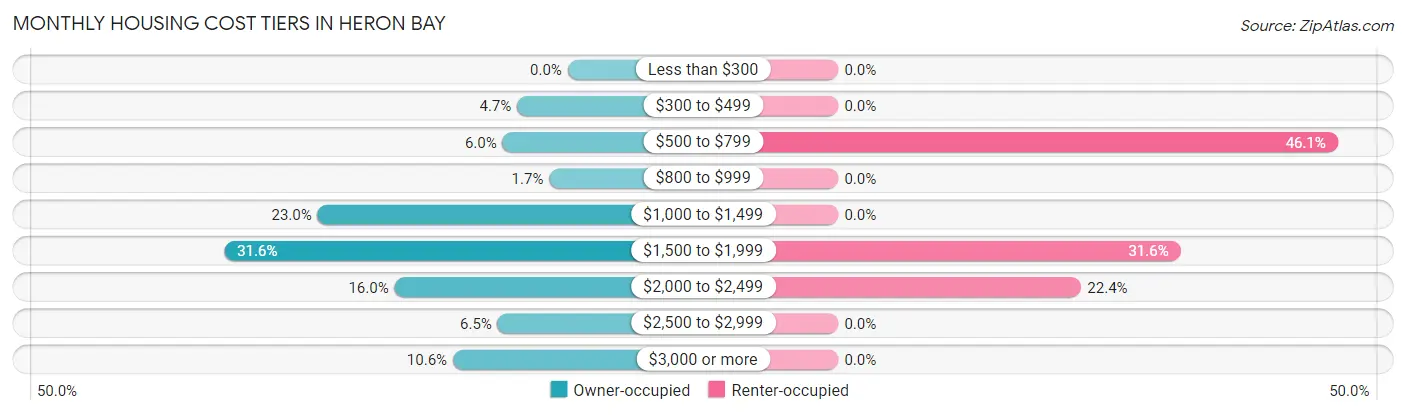
| Monthly Cost | Owner-occupied | Renter-occupied |
| Less than $300 | 0 (0.0%) | 0 (0.0%) |
| $300 to $499 | 52 (4.7%) | 0 (0.0%) |
| $500 to $799 | 67 (6.0%) | 35 (46.1%) |
| $800 to $999 | 19 (1.7%) | 0 (0.0%) |
| $1,000 to $1,499 | 257 (23.0%) | 0 (0.0%) |
| $1,500 to $1,999 | 353 (31.6%) | 24 (31.6%) |
| $2,000 to $2,499 | 178 (16.0%) | 17 (22.4%) |
| $2,500 to $2,999 | 72 (6.5%) | 0 (0.0%) |
| $3,000 or more | 118 (10.6%) | 0 (0.0%) |
| Total | 1,116 (100.0%) | 76 (100.0%) |
Physical Housing Characteristics in Heron Bay
Housing Structures in Heron Bay
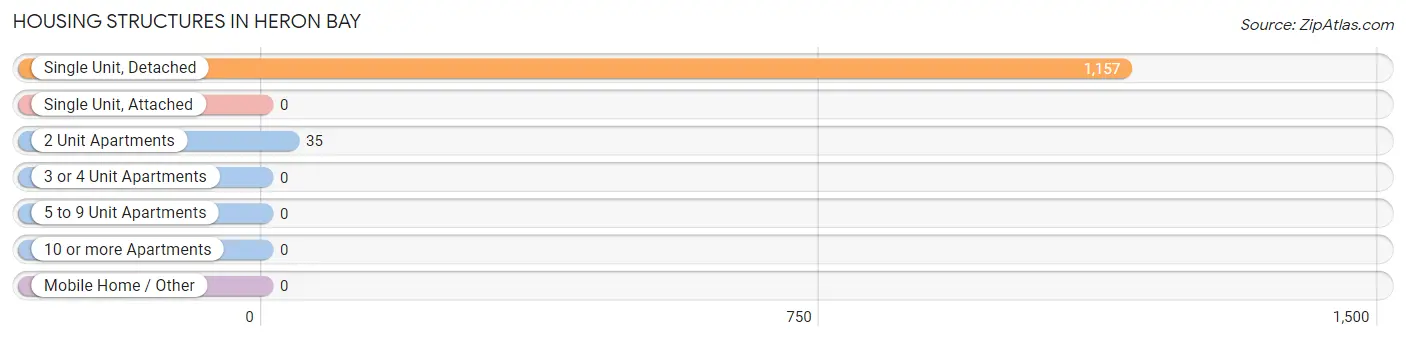
| Structure Type | # Housing Units | % Housing Units |
| Single Unit, Detached | 1,157 | 97.1% |
| Single Unit, Attached | 0 | 0.0% |
| 2 Unit Apartments | 35 | 2.9% |
| 3 or 4 Unit Apartments | 0 | 0.0% |
| 5 to 9 Unit Apartments | 0 | 0.0% |
| 10 or more Apartments | 0 | 0.0% |
| Mobile Home / Other | 0 | 0.0% |
| Total | 1,192 | 100.0% |
Housing Structures by Occupancy in Heron Bay
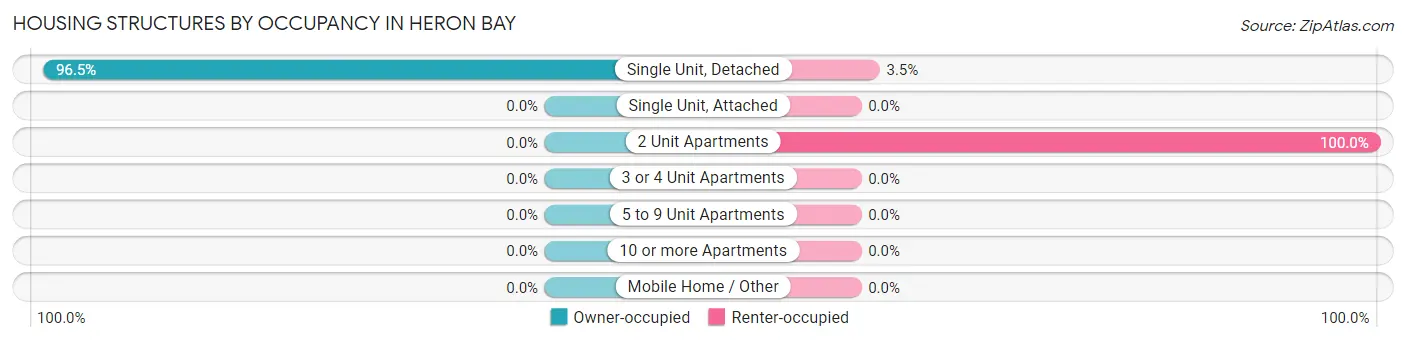
| Structure Type | Owner-occupied | Renter-occupied |
| Single Unit, Detached | 1,116 (96.5%) | 41 (3.5%) |
| Single Unit, Attached | 0 (0.0%) | 0 (0.0%) |
| 2 Unit Apartments | 0 (0.0%) | 35 (100.0%) |
| 3 or 4 Unit Apartments | 0 (0.0%) | 0 (0.0%) |
| 5 to 9 Unit Apartments | 0 (0.0%) | 0 (0.0%) |
| 10 or more Apartments | 0 (0.0%) | 0 (0.0%) |
| Mobile Home / Other | 0 (0.0%) | 0 (0.0%) |
| Total | 1,116 (93.6%) | 76 (6.4%) |
Housing Structures by Number of Rooms in Heron Bay
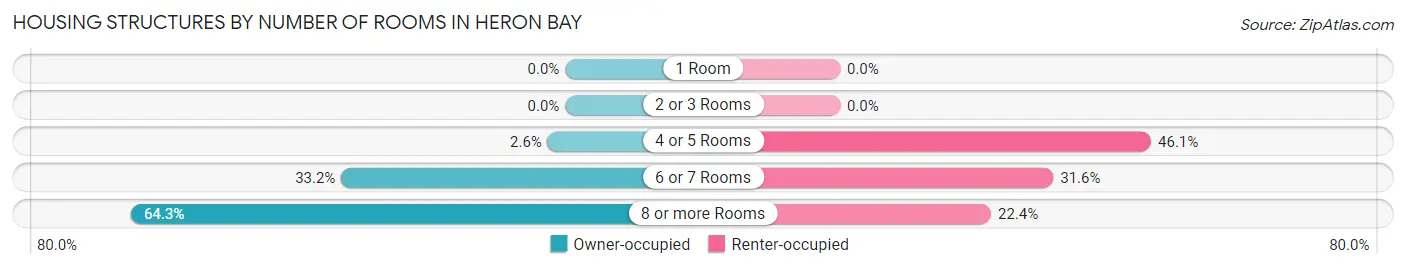
| Number of Rooms | Owner-occupied | Renter-occupied |
| 1 Room | 0 (0.0%) | 0 (0.0%) |
| 2 or 3 Rooms | 0 (0.0%) | 0 (0.0%) |
| 4 or 5 Rooms | 29 (2.6%) | 35 (46.1%) |
| 6 or 7 Rooms | 370 (33.2%) | 24 (31.6%) |
| 8 or more Rooms | 717 (64.2%) | 17 (22.4%) |
| Total | 1,116 (100.0%) | 76 (100.0%) |
Housing Structure by Heating Type in Heron Bay
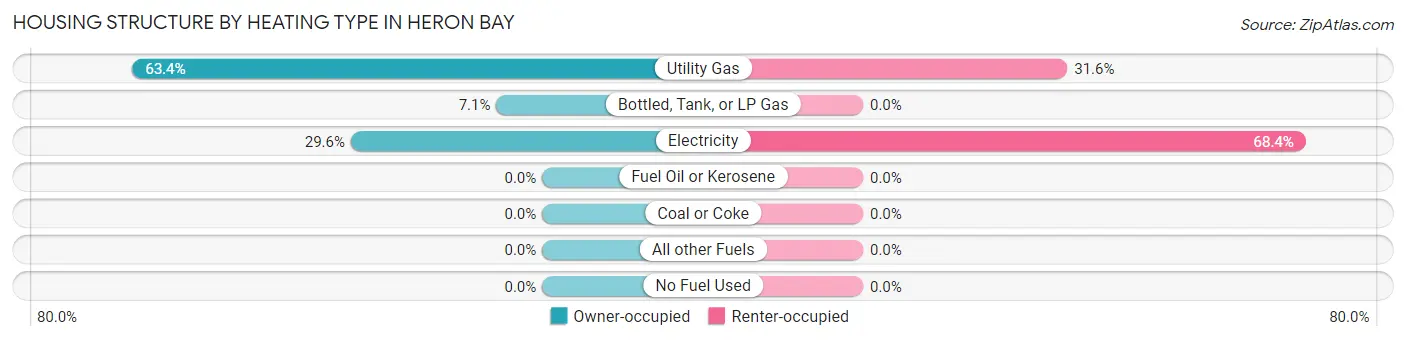
| Heating Type | Owner-occupied | Renter-occupied |
| Utility Gas | 707 (63.3%) | 24 (31.6%) |
| Bottled, Tank, or LP Gas | 79 (7.1%) | 0 (0.0%) |
| Electricity | 330 (29.6%) | 52 (68.4%) |
| Fuel Oil or Kerosene | 0 (0.0%) | 0 (0.0%) |
| Coal or Coke | 0 (0.0%) | 0 (0.0%) |
| All other Fuels | 0 (0.0%) | 0 (0.0%) |
| No Fuel Used | 0 (0.0%) | 0 (0.0%) |
| Total | 1,116 (100.0%) | 76 (100.0%) |
Household Vehicle Usage in Heron Bay
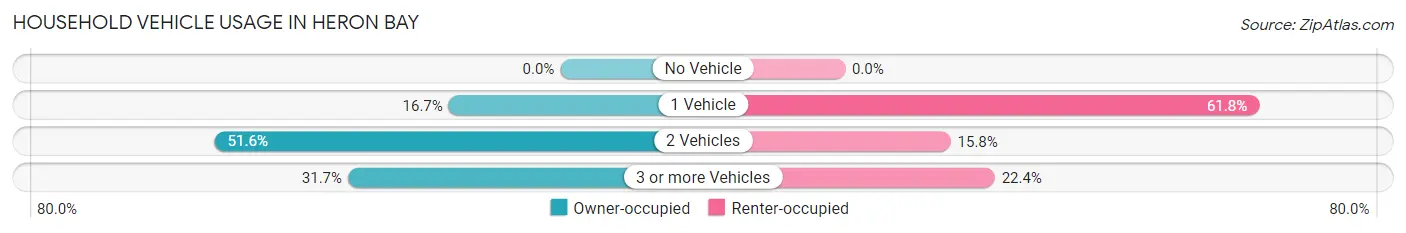
| Vehicles per Household | Owner-occupied | Renter-occupied |
| No Vehicle | 0 (0.0%) | 0 (0.0%) |
| 1 Vehicle | 186 (16.7%) | 47 (61.8%) |
| 2 Vehicles | 576 (51.6%) | 12 (15.8%) |
| 3 or more Vehicles | 354 (31.7%) | 17 (22.4%) |
| Total | 1,116 (100.0%) | 76 (100.0%) |
Real Estate & Mortgages in Heron Bay
Real Estate and Mortgage Overview in Heron Bay
| Characteristic | Without Mortgage | With Mortgage |
| Housing Units | 149 | 967 |
| Median Property Value | $281,300 | $335,200 |
| Median Household Income | $115,777 | $407 |
| Monthly Housing Costs | $712 | $118 |
| Real Estate Taxes | $3,629 | $31 |
Property Value by Mortgage Status in Heron Bay
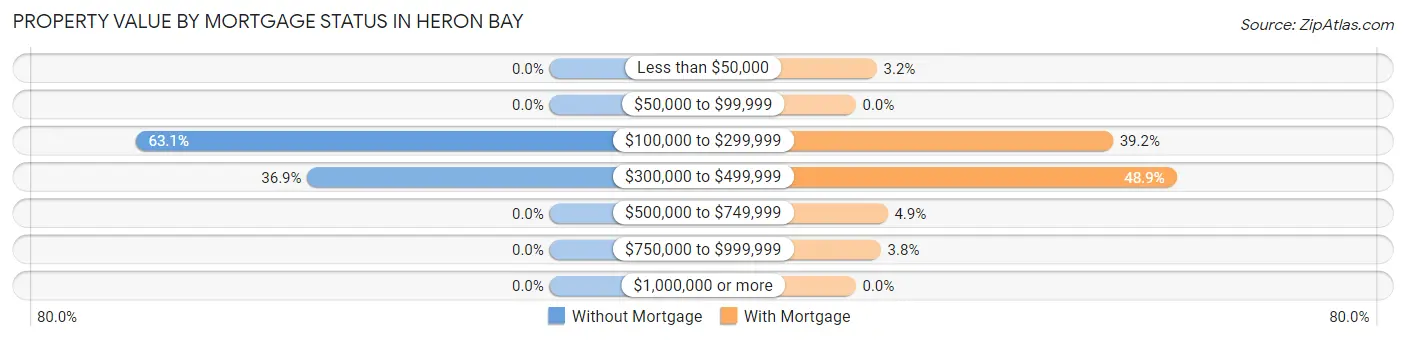
| Property Value | Without Mortgage | With Mortgage |
| Less than $50,000 | 0 (0.0%) | 31 (3.2%) |
| $50,000 to $99,999 | 0 (0.0%) | 0 (0.0%) |
| $100,000 to $299,999 | 94 (63.1%) | 379 (39.2%) |
| $300,000 to $499,999 | 55 (36.9%) | 473 (48.9%) |
| $500,000 to $749,999 | 0 (0.0%) | 47 (4.9%) |
| $750,000 to $999,999 | 0 (0.0%) | 37 (3.8%) |
| $1,000,000 or more | 0 (0.0%) | 0 (0.0%) |
| Total | 149 (100.0%) | 967 (100.0%) |
Household Income by Mortgage Status in Heron Bay
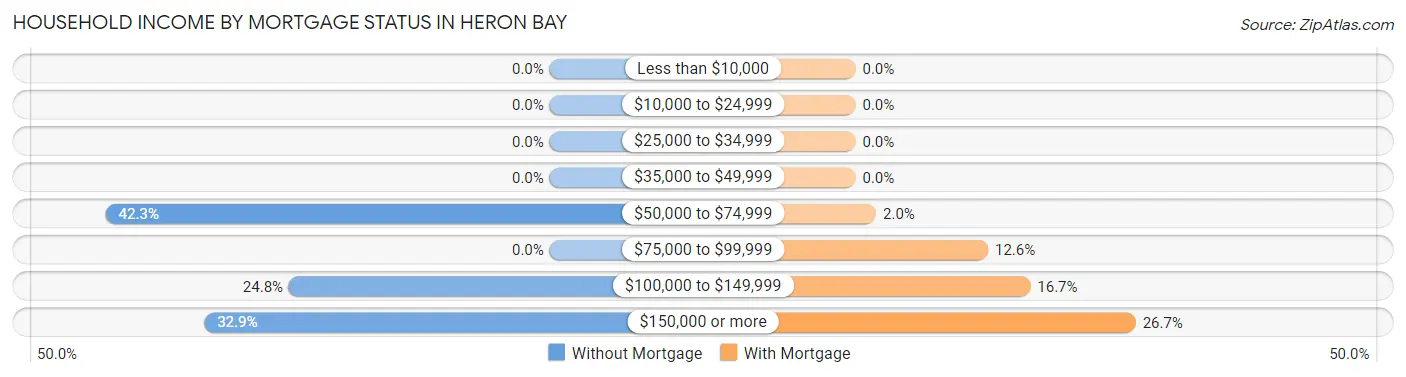
| Household Income | Without Mortgage | With Mortgage |
| Less than $10,000 | 0 (0.0%) | 0 (0.0%) |
| $10,000 to $24,999 | 0 (0.0%) | 0 (0.0%) |
| $25,000 to $34,999 | 0 (0.0%) | 0 (0.0%) |
| $35,000 to $49,999 | 0 (0.0%) | 0 (0.0%) |
| $50,000 to $74,999 | 63 (42.3%) | 19 (2.0%) |
| $75,000 to $99,999 | 0 (0.0%) | 122 (12.6%) |
| $100,000 to $149,999 | 37 (24.8%) | 161 (16.7%) |
| $150,000 or more | 49 (32.9%) | 258 (26.7%) |
| Total | 149 (100.0%) | 967 (100.0%) |
Property Value to Household Income Ratio in Heron Bay
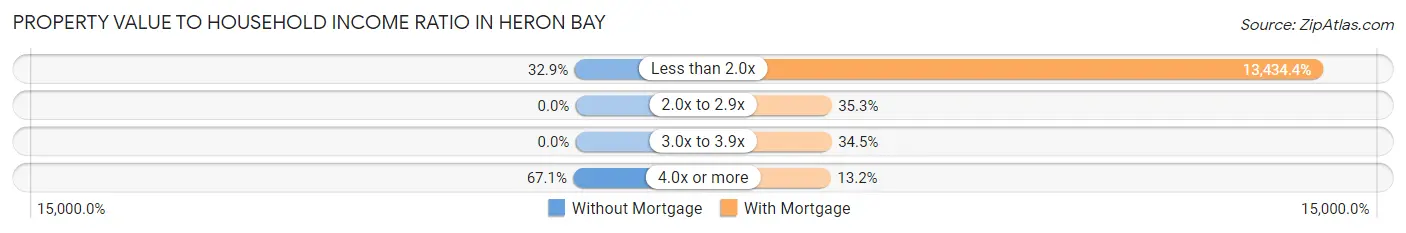
| Value-to-Income Ratio | Without Mortgage | With Mortgage |
| Less than 2.0x | 49 (32.9%) | 129,911 (13,434.4%) |
| 2.0x to 2.9x | 0 (0.0%) | 341 (35.3%) |
| 3.0x to 3.9x | 0 (0.0%) | 334 (34.5%) |
| 4.0x or more | 100 (67.1%) | 128 (13.2%) |
| Total | 149 (100.0%) | 967 (100.0%) |
Real Estate Taxes by Mortgage Status in Heron Bay
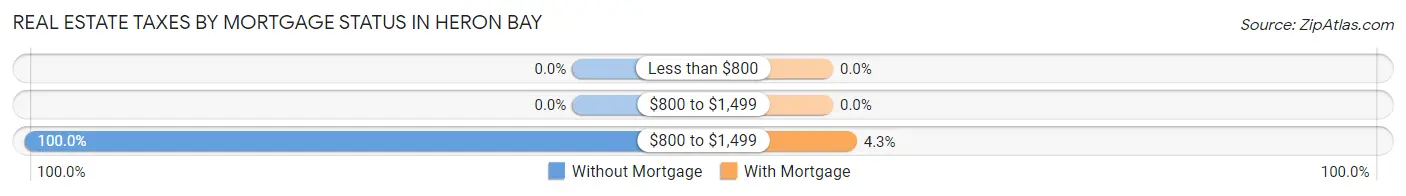
| Property Taxes | Without Mortgage | With Mortgage |
| Less than $800 | 0 (0.0%) | 0 (0.0%) |
| $800 to $1,499 | 0 (0.0%) | 0 (0.0%) |
| $800 to $1,499 | 149 (100.0%) | 42 (4.3%) |
| Total | 149 (100.0%) | 967 (100.0%) |
Health & Disability in Heron Bay
Health Insurance Coverage by Age in Heron Bay
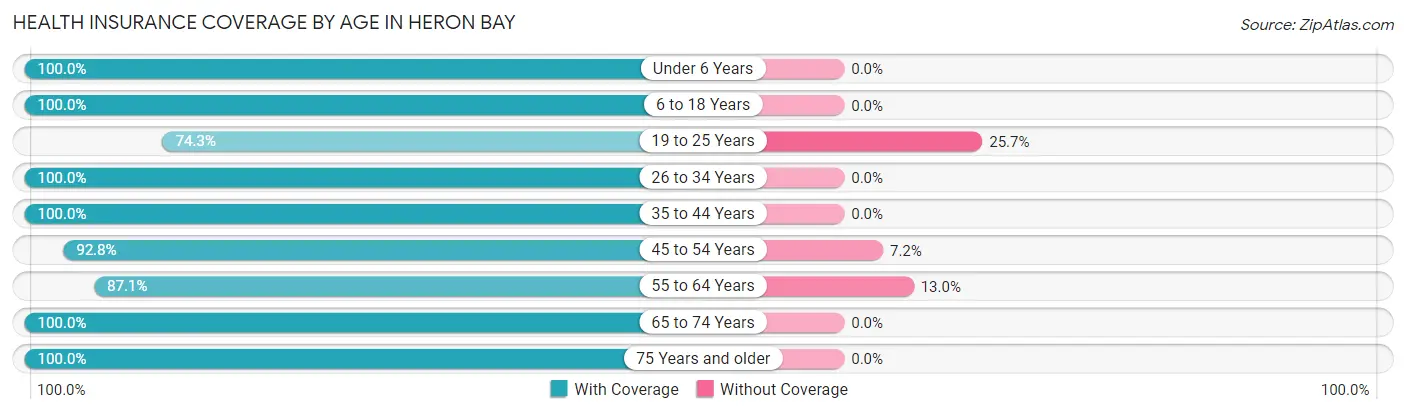
| Age Bracket | With Coverage | Without Coverage |
| Under 6 Years | 479 (100.0%) | 0 (0.0%) |
| 6 to 18 Years | 518 (100.0%) | 0 (0.0%) |
| 19 to 25 Years | 358 (74.3%) | 124 (25.7%) |
| 26 to 34 Years | 344 (100.0%) | 0 (0.0%) |
| 35 to 44 Years | 546 (100.0%) | 0 (0.0%) |
| 45 to 54 Years | 668 (92.8%) | 52 (7.2%) |
| 55 to 64 Years | 410 (87.1%) | 61 (13.0%) |
| 65 to 74 Years | 161 (100.0%) | 0 (0.0%) |
| 75 Years and older | 178 (100.0%) | 0 (0.0%) |
| Total | 3,662 (93.9%) | 237 (6.1%) |
Health Insurance Coverage by Citizenship Status in Heron Bay
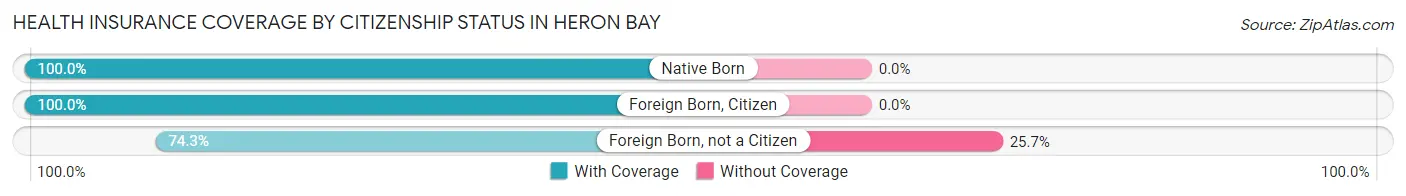
| Citizenship Status | With Coverage | Without Coverage |
| Native Born | 479 (100.0%) | 0 (0.0%) |
| Foreign Born, Citizen | 518 (100.0%) | 0 (0.0%) |
| Foreign Born, not a Citizen | 358 (74.3%) | 124 (25.7%) |
Health Insurance Coverage by Household Income in Heron Bay
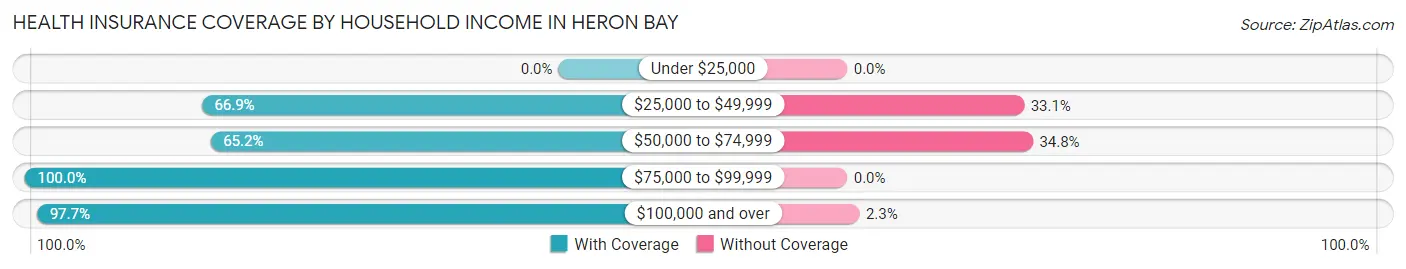
| Household Income | With Coverage | Without Coverage |
| Under $25,000 | 0 (0.0%) | 0 (0.0%) |
| $25,000 to $49,999 | 117 (66.9%) | 58 (33.1%) |
| $50,000 to $74,999 | 210 (65.2%) | 112 (34.8%) |
| $75,000 to $99,999 | 505 (100.0%) | 0 (0.0%) |
| $100,000 and over | 2,825 (97.7%) | 66 (2.3%) |
Public vs Private Health Insurance Coverage by Age in Heron Bay
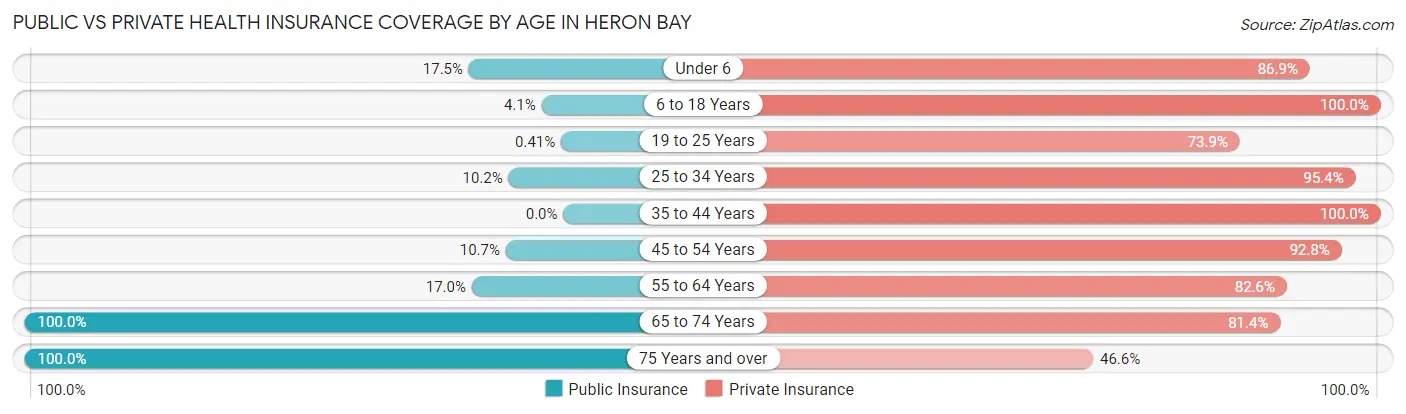
| Age Bracket | Public Insurance | Private Insurance |
| Under 6 | 84 (17.5%) | 416 (86.9%) |
| 6 to 18 Years | 21 (4.1%) | 518 (100.0%) |
| 19 to 25 Years | 2 (0.4%) | 356 (73.9%) |
| 25 to 34 Years | 35 (10.2%) | 328 (95.4%) |
| 35 to 44 Years | 0 (0.0%) | 546 (100.0%) |
| 45 to 54 Years | 77 (10.7%) | 668 (92.8%) |
| 55 to 64 Years | 80 (17.0%) | 389 (82.6%) |
| 65 to 74 Years | 161 (100.0%) | 131 (81.4%) |
| 75 Years and over | 178 (100.0%) | 83 (46.6%) |
| Total | 638 (16.4%) | 3,435 (88.1%) |
Disability Status by Sex by Age in Heron Bay
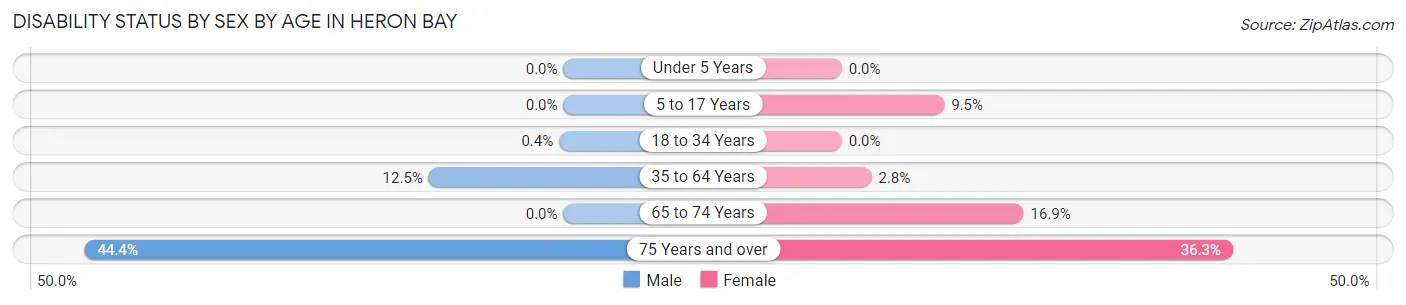
| Age Bracket | Male | Female |
| Under 5 Years | 0 (0.0%) | 0 (0.0%) |
| 5 to 17 Years | 0 (0.0%) | 29 (9.5%) |
| 18 to 34 Years | 2 (0.4%) | 0 (0.0%) |
| 35 to 64 Years | 95 (12.5%) | 27 (2.8%) |
| 65 to 74 Years | 0 (0.0%) | 14 (16.9%) |
| 75 Years and over | 24 (44.4%) | 45 (36.3%) |
Disability Class by Sex by Age in Heron Bay
Disability Class: Hearing Difficulty
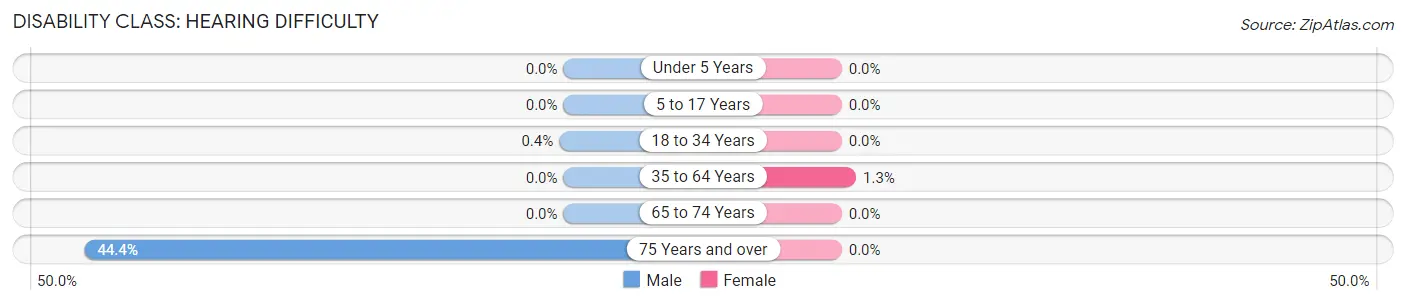
| Age Bracket | Male | Female |
| Under 5 Years | 0 (0.0%) | 0 (0.0%) |
| 5 to 17 Years | 0 (0.0%) | 0 (0.0%) |
| 18 to 34 Years | 2 (0.4%) | 0 (0.0%) |
| 35 to 64 Years | 0 (0.0%) | 13 (1.3%) |
| 65 to 74 Years | 0 (0.0%) | 0 (0.0%) |
| 75 Years and over | 24 (44.4%) | 0 (0.0%) |
Disability Class: Vision Difficulty
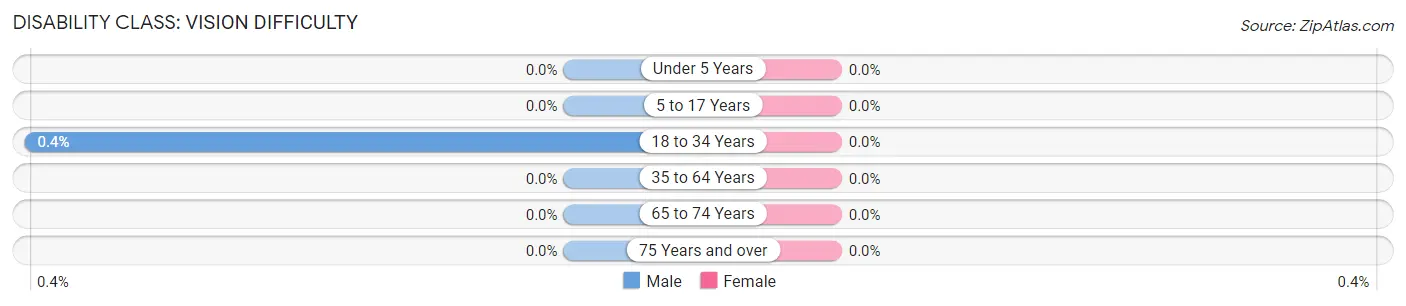
| Age Bracket | Male | Female |
| Under 5 Years | 0 (0.0%) | 0 (0.0%) |
| 5 to 17 Years | 0 (0.0%) | 0 (0.0%) |
| 18 to 34 Years | 2 (0.4%) | 0 (0.0%) |
| 35 to 64 Years | 0 (0.0%) | 0 (0.0%) |
| 65 to 74 Years | 0 (0.0%) | 0 (0.0%) |
| 75 Years and over | 0 (0.0%) | 0 (0.0%) |
Disability Class: Cognitive Difficulty
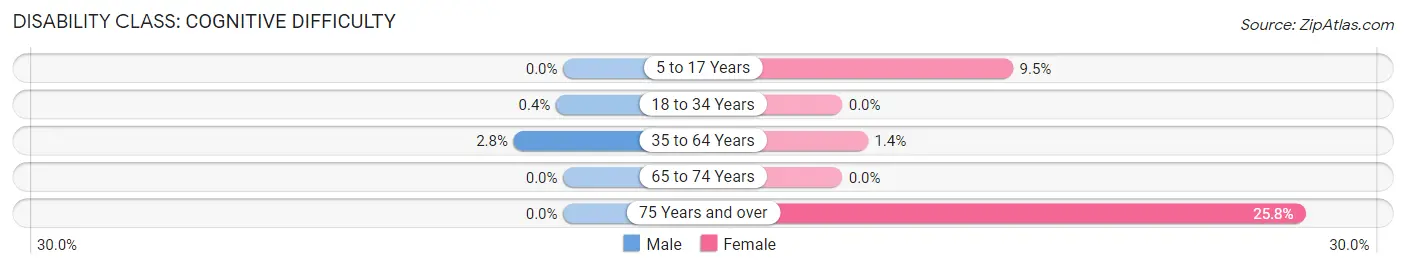
| Age Bracket | Male | Female |
| 5 to 17 Years | 0 (0.0%) | 29 (9.5%) |
| 18 to 34 Years | 2 (0.4%) | 0 (0.0%) |
| 35 to 64 Years | 21 (2.8%) | 14 (1.4%) |
| 65 to 74 Years | 0 (0.0%) | 0 (0.0%) |
| 75 Years and over | 0 (0.0%) | 32 (25.8%) |
Disability Class: Ambulatory Difficulty
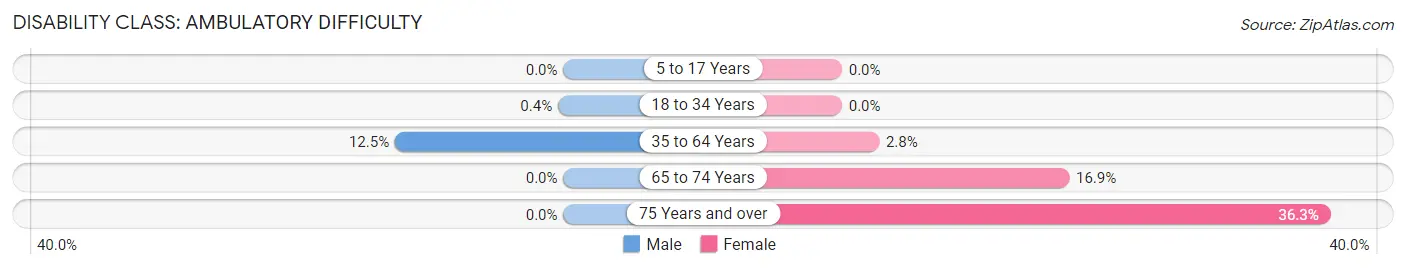
| Age Bracket | Male | Female |
| 5 to 17 Years | 0 (0.0%) | 0 (0.0%) |
| 18 to 34 Years | 2 (0.4%) | 0 (0.0%) |
| 35 to 64 Years | 95 (12.5%) | 27 (2.8%) |
| 65 to 74 Years | 0 (0.0%) | 14 (16.9%) |
| 75 Years and over | 0 (0.0%) | 45 (36.3%) |
Disability Class: Self-Care Difficulty
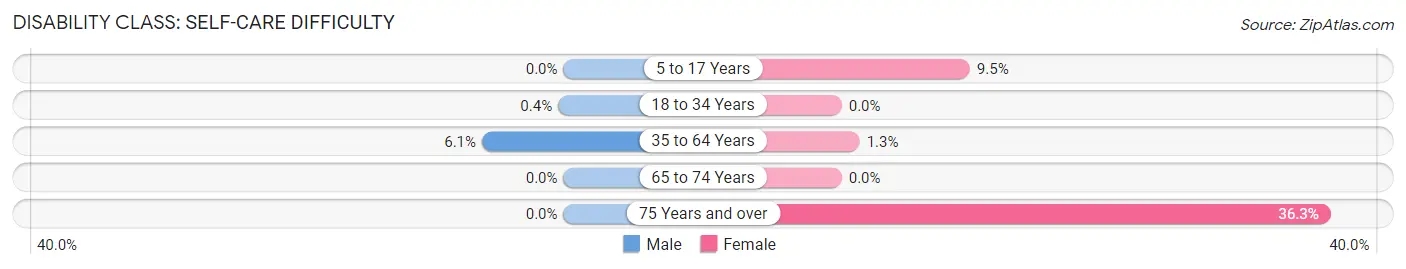
| Age Bracket | Male | Female |
| 5 to 17 Years | 0 (0.0%) | 29 (9.5%) |
| 18 to 34 Years | 2 (0.4%) | 0 (0.0%) |
| 35 to 64 Years | 46 (6.0%) | 13 (1.3%) |
| 65 to 74 Years | 0 (0.0%) | 0 (0.0%) |
| 75 Years and over | 0 (0.0%) | 45 (36.3%) |
Technology Access in Heron Bay
Computing Device Access in Heron Bay
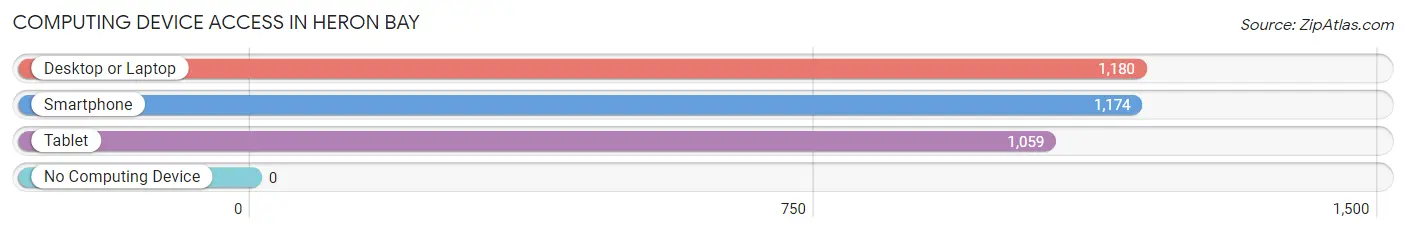
| Device Type | # Households | % Households |
| Desktop or Laptop | 1,180 | 99.0% |
| Smartphone | 1,174 | 98.5% |
| Tablet | 1,059 | 88.8% |
| No Computing Device | 0 | 0.0% |
| Total | 1,192 | 100.0% |
Internet Access in Heron Bay
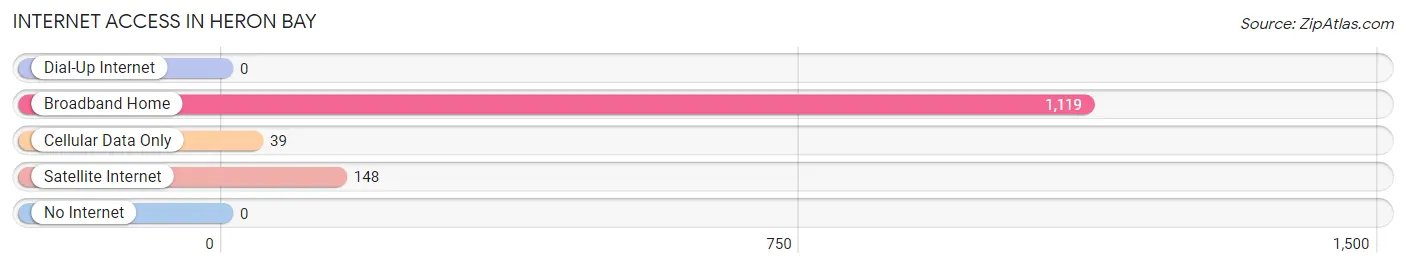
| Internet Type | # Households | % Households |
| Dial-Up Internet | 0 | 0.0% |
| Broadband Home | 1,119 | 93.9% |
| Cellular Data Only | 39 | 3.3% |
| Satellite Internet | 148 | 12.4% |
| No Internet | 0 | 0.0% |
| Total | 1,192 | 100.0% |
Heron Bay Summary
Heron Bay is a small town located in the state of Georgia, United States. It is situated in the southeastern corner of the state, near the border with Florida. The town is located in the coastal plain region of Georgia, and is part of the Brunswick metropolitan statistical area. The population of Heron Bay was estimated to be 1,845 in 2019.
History
Heron Bay was founded in 1820 by a group of settlers from the nearby town of St. Simons Island. The town was named after the herons that were found in the area. The settlers built a small fishing village and began to farm the land. The town grew slowly over the years, and by the late 19th century, it had become a popular tourist destination.
In the early 20th century, Heron Bay began to experience a period of growth and development. The town was incorporated in 1921, and the first mayor was elected in 1922. The town continued to grow, and by the 1950s, it had become a popular vacation spot for families.
Geography
Heron Bay is located in the southeastern corner of Georgia, near the border with Florida. The town is situated in the coastal plain region of the state, and is part of the Brunswick metropolitan statistical area. The town is located on the banks of the Altamaha River, and is surrounded by marshlands and swamps. The town is located approximately 30 miles south of Savannah, and is about 60 miles north of Jacksonville, Florida.
The climate in Heron Bay is humid subtropical, with hot, humid summers and mild winters. The average annual temperature is around 70 degrees Fahrenheit, and the average annual precipitation is around 50 inches.
Economy
The economy of Heron Bay is largely based on tourism and fishing. The town is a popular destination for tourists, and there are several hotels and resorts in the area. The town is also home to several marinas, which offer fishing charters and boat rentals.
The town is also home to several small businesses, including restaurants, shops, and other services. The town is also home to a small airport, which offers flights to nearby cities.
Demographics
As of 2019, the population of Heron Bay was estimated to be 1,845. The racial makeup of the town was 79.3% White, 15.2% African American, 0.7% Native American, 0.7% Asian, and 4.1% from other races. The median household income was $41,944, and the median home value was $179,400.
Conclusion
Heron Bay is a small town located in the southeastern corner of Georgia, near the border with Florida. The town is situated in the coastal plain region of the state, and is part of the Brunswick metropolitan statistical area. The town is a popular tourist destination, and the economy is largely based on tourism and fishing. The population of Heron Bay was estimated to be 1,845 in 2019.
Common Questions
What is Per Capita Income in Heron Bay?
Per Capita income in Heron Bay is $45,167.
What is the Median Family Income in Heron Bay?
Median Family Income in Heron Bay is $117,331.
What is the Median Household income in Heron Bay?
Median Household Income in Heron Bay is $123,750.
What is Income or Wage Gap in Heron Bay?
Income or Wage Gap in Heron Bay is 32.1%.
Women in Heron Bay earn 67.9 cents for every dollar earned by a man.
What is Inequality or Gini Index in Heron Bay?
Inequality or Gini Index in Heron Bay is 0.30.
What is the Total Population of Heron Bay?
Total Population of Heron Bay is 3,899.
What is the Total Male Population of Heron Bay?
Total Male Population of Heron Bay is 1,778.
What is the Total Female Population of Heron Bay?
Total Female Population of Heron Bay is 2,121.
What is the Ratio of Males per 100 Females in Heron Bay?
There are 83.83 Males per 100 Females in Heron Bay.
What is the Ratio of Females per 100 Males in Heron Bay?
There are 119.29 Females per 100 Males in Heron Bay.
What is the Median Population Age in Heron Bay?
Median Population Age in Heron Bay is 36.6 Years.
What is the Average Family Size in Heron Bay
Average Family Size in Heron Bay is 3.6 People.
What is the Average Household Size in Heron Bay
Average Household Size in Heron Bay is 3.3 People.
How Large is the Labor Force in Heron Bay?
There are 2,107 People in the Labor Forcein in Heron Bay.
What is the Percentage of People in the Labor Force in Heron Bay?
69.2% of People are in the Labor Force in Heron Bay.
What is the Unemployment Rate in Heron Bay?
Unemployment Rate in Heron Bay is 5.2%.