Sunfish Lake, MN Map & Demographics
Sunfish Lake Map
Sunfish Lake Overview
$120,771
PER CAPITA INCOME
$250,001
AVG FAMILY INCOME
$250,001
AVG HOUSEHOLD INCOME
65.7%
WAGE / INCOME GAP [ % ]
34.3¢/ $1
WAGE / INCOME GAP [ $ ]
0.44
INEQUALITY / GINI INDEX
553
TOTAL POPULATION
290
MALE POPULATION
263
FEMALE POPULATION
110.27
MALES / 100 FEMALES
90.69
FEMALES / 100 MALES
44.3
MEDIAN AGE
3.4
AVG FAMILY SIZE
3.2
AVG HOUSEHOLD SIZE
265
LABOR FORCE [ PEOPLE ]
61.3%
PERCENT IN LABOR FORCE
1.1%
UNEMPLOYMENT RATE
Sunfish Lake Area Codes
Income in Sunfish Lake
Income Overview in Sunfish Lake
Per Capita Income in Sunfish Lake is $120,771, while median incomes of families and households are $250,001 and $250,001 respectively.
| Characteristic | Number | Measure |
| Per Capita Income | 553 | $120,771 |
| Median Family Income | 157 | $250,001 |
| Mean Family Income | 157 | $371,648 |
| Median Household Income | 171 | $250,001 |
| Mean Household Income | 171 | $370,022 |
| Income Deficit | 157 | $0 |
| Wage / Income Gap (%) | 553 | 65.74% |
| Wage / Income Gap ($) | 553 | 34.26¢ per $1 |
| Gini / Inequality Index | 553 | 0.44 |
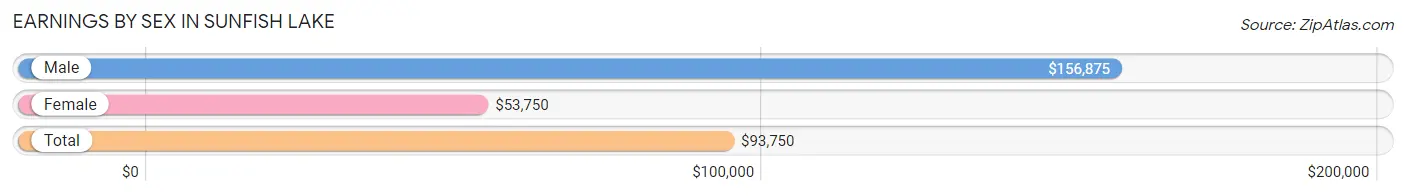
Earnings by Sex in Sunfish Lake
Average Earnings in Sunfish Lake are $93,750, $156,875 for men and $53,750 for women, a difference of 65.7%.
| Sex | Number | Average Earnings |
| Male | 167 (56.0%) | $156,875 |
| Female | 131 (44.0%) | $53,750 |
| Total | 298 (100.0%) | $93,750 |
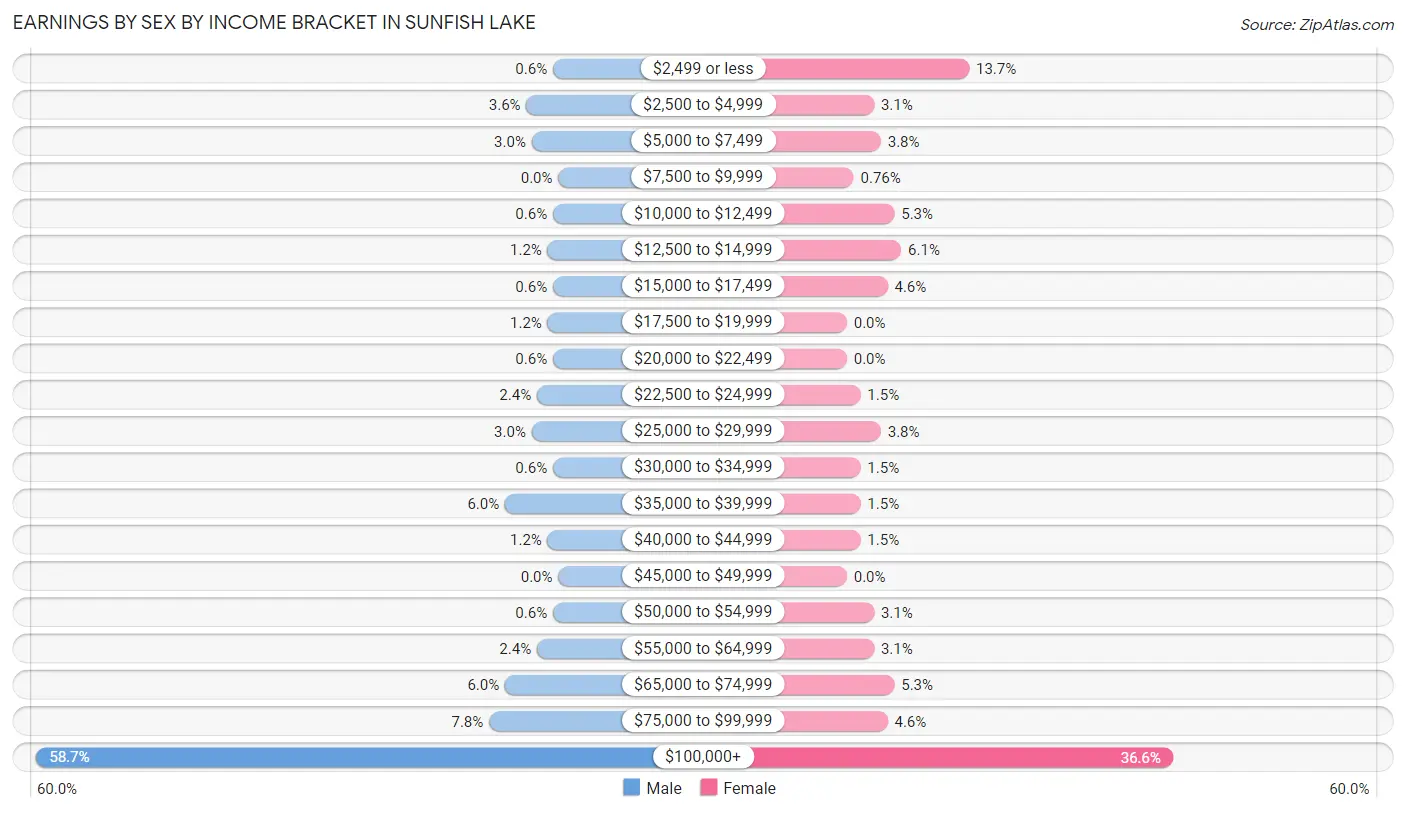
Earnings by Sex by Income Bracket in Sunfish Lake
The most common earnings brackets in Sunfish Lake are $100,000+ for men (98 | 58.7%) and $100,000+ for women (48 | 36.6%).
| Income | Male | Female |
| $2,499 or less | 1 (0.6%) | 18 (13.7%) |
| $2,500 to $4,999 | 6 (3.6%) | 4 (3.0%) |
| $5,000 to $7,499 | 5 (3.0%) | 5 (3.8%) |
| $7,500 to $9,999 | 0 (0.0%) | 1 (0.8%) |
| $10,000 to $12,499 | 1 (0.6%) | 7 (5.3%) |
| $12,500 to $14,999 | 2 (1.2%) | 8 (6.1%) |
| $15,000 to $17,499 | 1 (0.6%) | 6 (4.6%) |
| $17,500 to $19,999 | 2 (1.2%) | 0 (0.0%) |
| $20,000 to $22,499 | 1 (0.6%) | 0 (0.0%) |
| $22,500 to $24,999 | 4 (2.4%) | 2 (1.5%) |
| $25,000 to $29,999 | 5 (3.0%) | 5 (3.8%) |
| $30,000 to $34,999 | 1 (0.6%) | 2 (1.5%) |
| $35,000 to $39,999 | 10 (6.0%) | 2 (1.5%) |
| $40,000 to $44,999 | 2 (1.2%) | 2 (1.5%) |
| $45,000 to $49,999 | 0 (0.0%) | 0 (0.0%) |
| $50,000 to $54,999 | 1 (0.6%) | 4 (3.0%) |
| $55,000 to $64,999 | 4 (2.4%) | 4 (3.0%) |
| $65,000 to $74,999 | 10 (6.0%) | 7 (5.3%) |
| $75,000 to $99,999 | 13 (7.8%) | 6 (4.6%) |
| $100,000+ | 98 (58.7%) | 48 (36.6%) |
| Total | 167 (100.0%) | 131 (100.0%) |
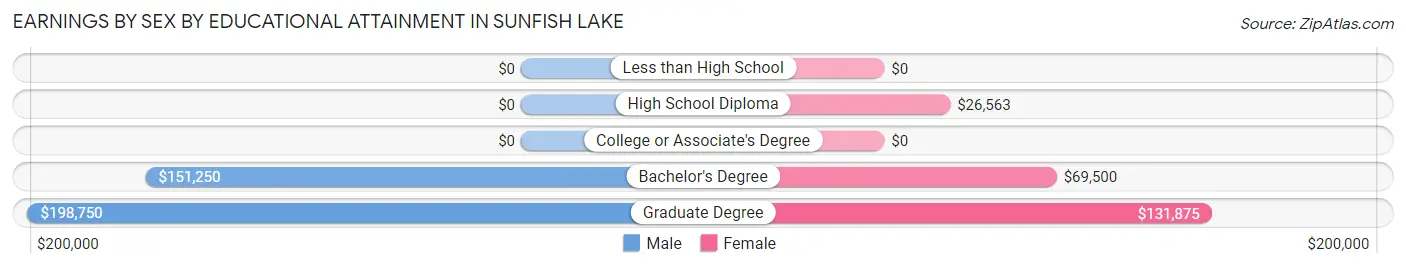
Earnings by Sex by Educational Attainment in Sunfish Lake
Average earnings in Sunfish Lake are $176,111 for men and $69,750 for women, a difference of 60.4%. Men with an educational attainment of graduate degree enjoy the highest average annual earnings of $198,750, while those with bachelor's degree education earn the least with $151,250. Women with an educational attainment of graduate degree earn the most with the average annual earnings of $131,875, while those with high school diploma education have the smallest earnings of $26,563.
| Educational Attainment | Male Income | Female Income |
| Less than High School | - | - |
| High School Diploma | - | - |
| College or Associate's Degree | - | - |
| Bachelor's Degree | $151,250 | $69,500 |
| Graduate Degree | $198,750 | $131,875 |
| Total | $176,111 | $69,750 |
Family Income in Sunfish Lake
Family Income Brackets in Sunfish Lake
According to the Sunfish Lake family income data, there are 102 families falling into the $200,000+ income range, which is the most common income bracket and makes up 65.0% of all families.
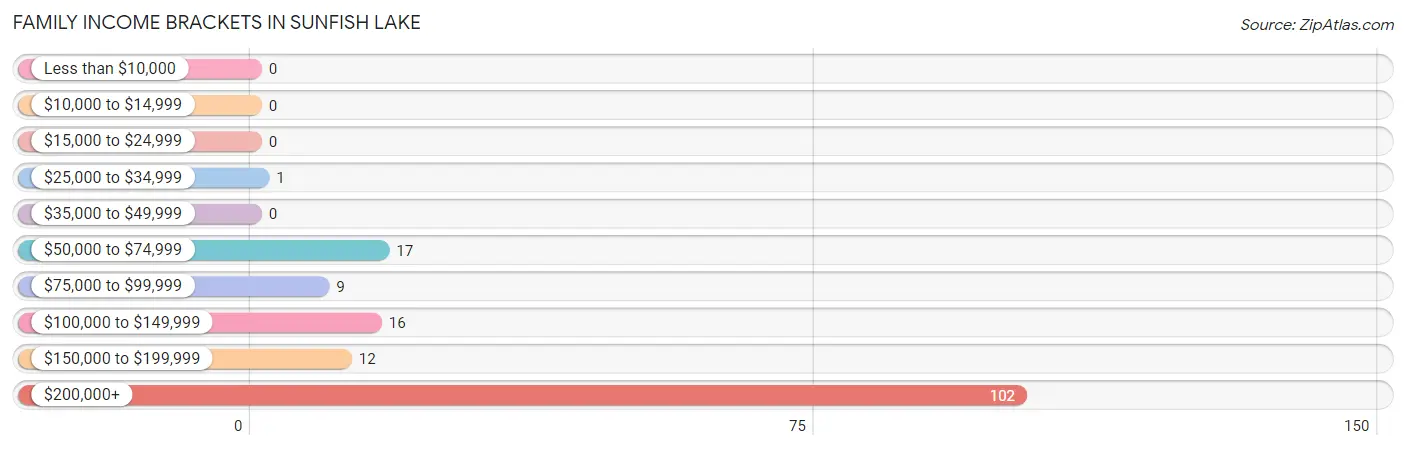
| Income Bracket | # Families | % Families |
| Less than $10,000 | 0 | 0.0% |
| $10,000 to $14,999 | 0 | 0.0% |
| $15,000 to $24,999 | 0 | 0.0% |
| $25,000 to $34,999 | 1 | 0.6% |
| $35,000 to $49,999 | 0 | 0.0% |
| $50,000 to $74,999 | 17 | 10.8% |
| $75,000 to $99,999 | 9 | 5.7% |
| $100,000 to $149,999 | 16 | 10.2% |
| $150,000 to $199,999 | 12 | 7.6% |
| $200,000+ | 102 | 65.0% |
Family Income by Famaliy Size in Sunfish Lake
3-person families (24 | 15.3%) account for the highest median family income in Sunfish Lake with $250,001 per family, while 2-person families (76 | 48.4%) have the highest median income of $123,125 per family member.
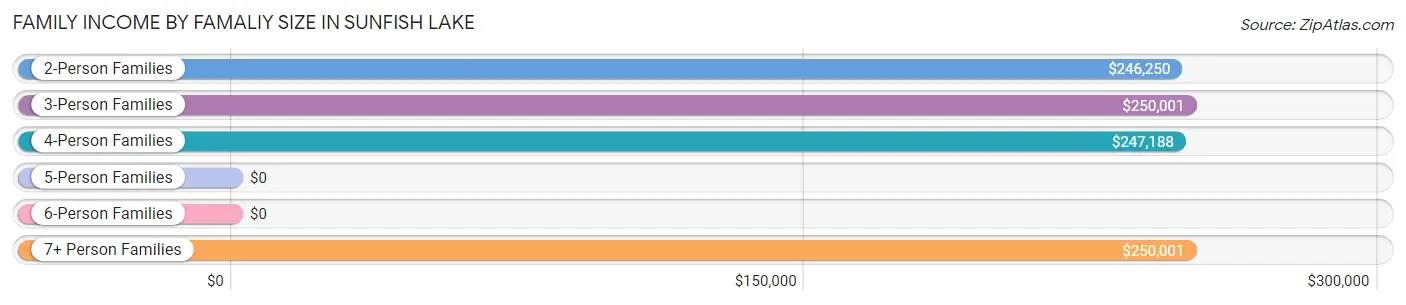
| Income Bracket | # Families | Median Income |
| 2-Person Families | 76 (48.4%) | $246,250 |
| 3-Person Families | 24 (15.3%) | $250,001 |
| 4-Person Families | 37 (23.6%) | $247,188 |
| 5-Person Families | 8 (5.1%) | $0 |
| 6-Person Families | 2 (1.3%) | $0 |
| 7+ Person Families | 10 (6.4%) | $250,001 |
| Total | 157 (100.0%) | $250,001 |
Family Income by Number of Earners in Sunfish Lake
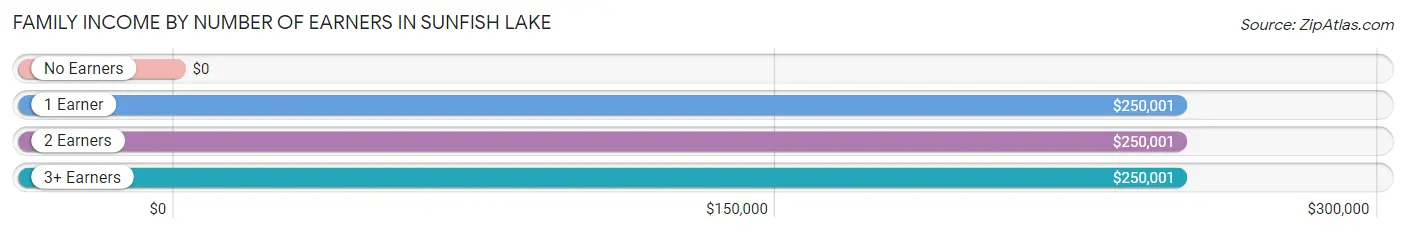
| Number of Earners | # Families | Median Income |
| No Earners | 20 (12.7%) | $0 |
| 1 Earner | 52 (33.1%) | $250,001 |
| 2 Earners | 61 (38.9%) | $250,001 |
| 3+ Earners | 24 (15.3%) | $250,001 |
| Total | 157 (100.0%) | $250,001 |
Household Income in Sunfish Lake
Household Income Brackets in Sunfish Lake
With 111 households falling in the category, the $200,000+ income range is the most frequent in Sunfish Lake, accounting for 64.9% of all households.
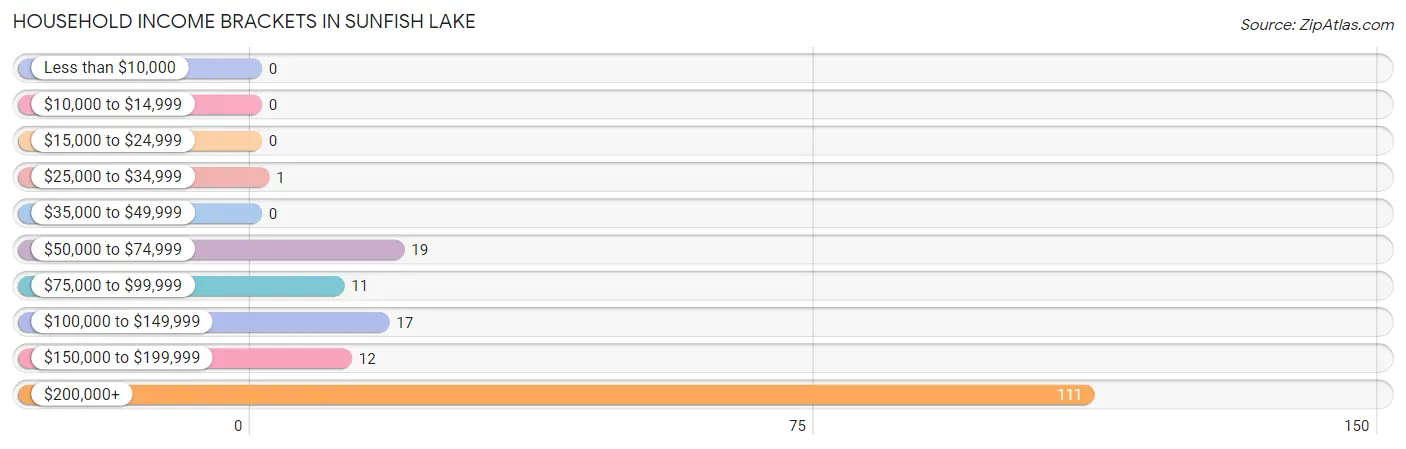
| Income Bracket | # Households | % Households |
| Less than $10,000 | 0 | 0.0% |
| $10,000 to $14,999 | 0 | 0.0% |
| $15,000 to $24,999 | 0 | 0.0% |
| $25,000 to $34,999 | 1 | 0.6% |
| $35,000 to $49,999 | 0 | 0.0% |
| $50,000 to $74,999 | 19 | 11.1% |
| $75,000 to $99,999 | 11 | 6.4% |
| $100,000 to $149,999 | 17 | 9.9% |
| $150,000 to $199,999 | 12 | 7.0% |
| $200,000+ | 111 | 64.9% |
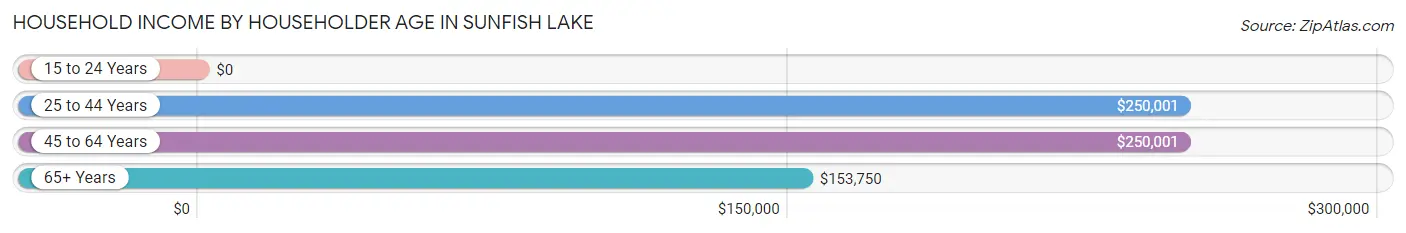
Household Income by Householder Age in Sunfish Lake
The median household income in Sunfish Lake is $250,001, with the highest median household income of $250,001 found in the 25 to 44 years age bracket for the primary householder. A total of 35 households (20.5%) fall into this category.
| Income Bracket | # Households | Median Income |
| 15 to 24 Years | 0 (0.0%) | $0 |
| 25 to 44 Years | 35 (20.5%) | $250,001 |
| 45 to 64 Years | 79 (46.2%) | $250,001 |
| 65+ Years | 57 (33.3%) | $153,750 |
| Total | 171 (100.0%) | $250,001 |
Poverty in Sunfish Lake
Income Below Poverty by Sex and Age in Sunfish Lake
With 0.3% poverty level for males and 0.8% for females among the residents of Sunfish Lake, 15 year old males and 16 and 17 year old females are the most vulnerable to poverty, with 1 males (12.5%) and 2 females (11.1%) in their respective age groups living below the poverty level.
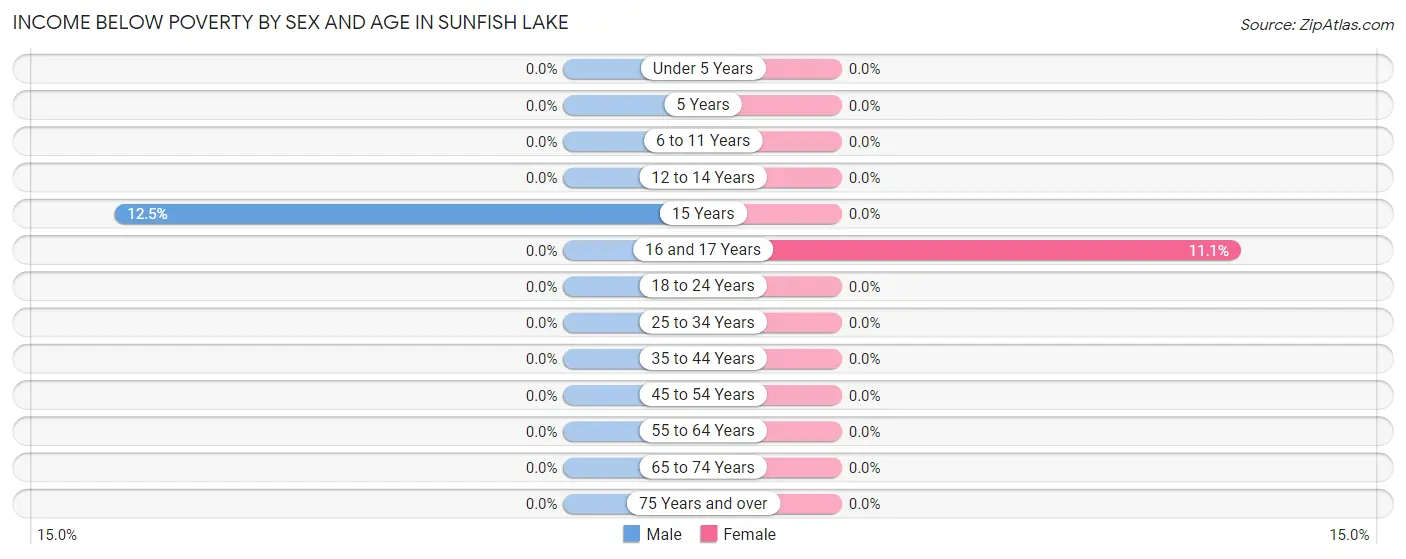
| Age Bracket | Male | Female |
| Under 5 Years | 0 (0.0%) | 0 (0.0%) |
| 5 Years | 0 (0.0%) | 0 (0.0%) |
| 6 to 11 Years | 0 (0.0%) | 0 (0.0%) |
| 12 to 14 Years | 0 (0.0%) | 0 (0.0%) |
| 15 Years | 1 (12.5%) | 0 (0.0%) |
| 16 and 17 Years | 0 (0.0%) | 2 (11.1%) |
| 18 to 24 Years | 0 (0.0%) | 0 (0.0%) |
| 25 to 34 Years | 0 (0.0%) | 0 (0.0%) |
| 35 to 44 Years | 0 (0.0%) | 0 (0.0%) |
| 45 to 54 Years | 0 (0.0%) | 0 (0.0%) |
| 55 to 64 Years | 0 (0.0%) | 0 (0.0%) |
| 65 to 74 Years | 0 (0.0%) | 0 (0.0%) |
| 75 Years and over | 0 (0.0%) | 0 (0.0%) |
| Total | 1 (0.3%) | 2 (0.8%) |
Income Above Poverty by Sex and Age in Sunfish Lake
According to the poverty statistics in Sunfish Lake, males aged under 5 years and females aged under 5 years are the age groups that are most secure financially, with 100.0% of males and 100.0% of females in these age groups living above the poverty line.
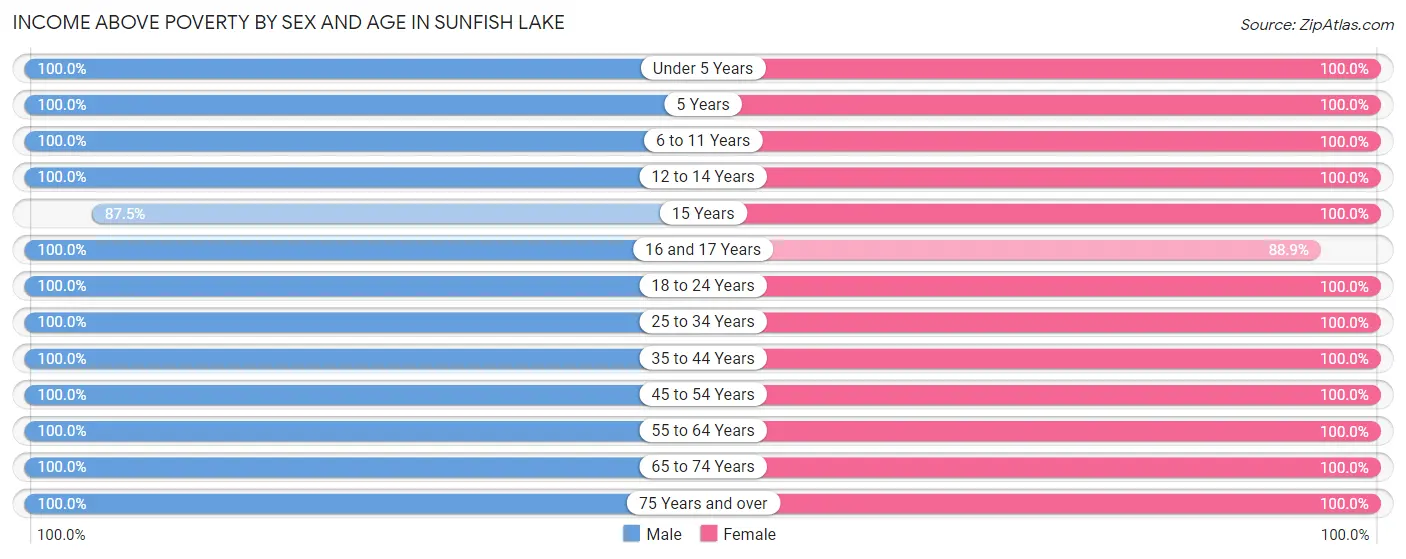
| Age Bracket | Male | Female |
| Under 5 Years | 12 (100.0%) | 10 (100.0%) |
| 5 Years | 3 (100.0%) | 2 (100.0%) |
| 6 to 11 Years | 40 (100.0%) | 20 (100.0%) |
| 12 to 14 Years | 8 (100.0%) | 15 (100.0%) |
| 15 Years | 7 (87.5%) | 3 (100.0%) |
| 16 and 17 Years | 11 (100.0%) | 16 (88.9%) |
| 18 to 24 Years | 21 (100.0%) | 19 (100.0%) |
| 25 to 34 Years | 10 (100.0%) | 4 (100.0%) |
| 35 to 44 Years | 37 (100.0%) | 37 (100.0%) |
| 45 to 54 Years | 26 (100.0%) | 42 (100.0%) |
| 55 to 64 Years | 47 (100.0%) | 43 (100.0%) |
| 65 to 74 Years | 55 (100.0%) | 30 (100.0%) |
| 75 Years and over | 12 (100.0%) | 20 (100.0%) |
| Total | 289 (99.7%) | 261 (99.2%) |
Income Below Poverty Among Married-Couple Families in Sunfish Lake
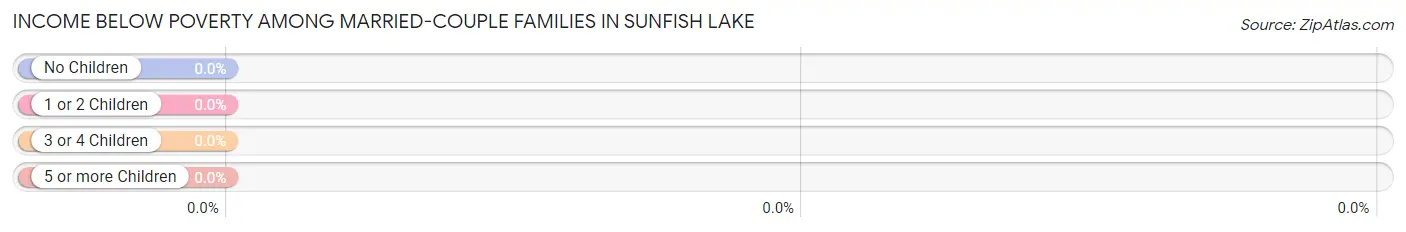
| Children | Above Poverty | Below Poverty |
| No Children | 93 (100.0%) | 0 (0.0%) |
| 1 or 2 Children | 43 (100.0%) | 0 (0.0%) |
| 3 or 4 Children | 6 (100.0%) | 0 (0.0%) |
| 5 or more Children | 9 (100.0%) | 0 (0.0%) |
| Total | 151 (100.0%) | 0 (0.0%) |
Income Below Poverty Among Single-Parent Households in Sunfish Lake
| Children | Single Father | Single Mother |
| No Children | 0 (0.0%) | 0 (0.0%) |
| 1 or 2 Children | 0 (0.0%) | 0 (0.0%) |
| 3 or 4 Children | 0 (0.0%) | 0 (0.0%) |
| 5 or more Children | 0 (0.0%) | 0 (0.0%) |
| Total | 0 (0.0%) | 0 (0.0%) |
Income Below Poverty Among Married-Couple vs Single-Parent Households in Sunfish Lake
| Children | Married-Couple Families | Single-Parent Households |
| No Children | 0 (0.0%) | 0 (0.0%) |
| 1 or 2 Children | 0 (0.0%) | 0 (0.0%) |
| 3 or 4 Children | 0 (0.0%) | 0 (0.0%) |
| 5 or more Children | 0 (0.0%) | 0 (0.0%) |
| Total | 0 (0.0%) | 0 (0.0%) |
Race in Sunfish Lake
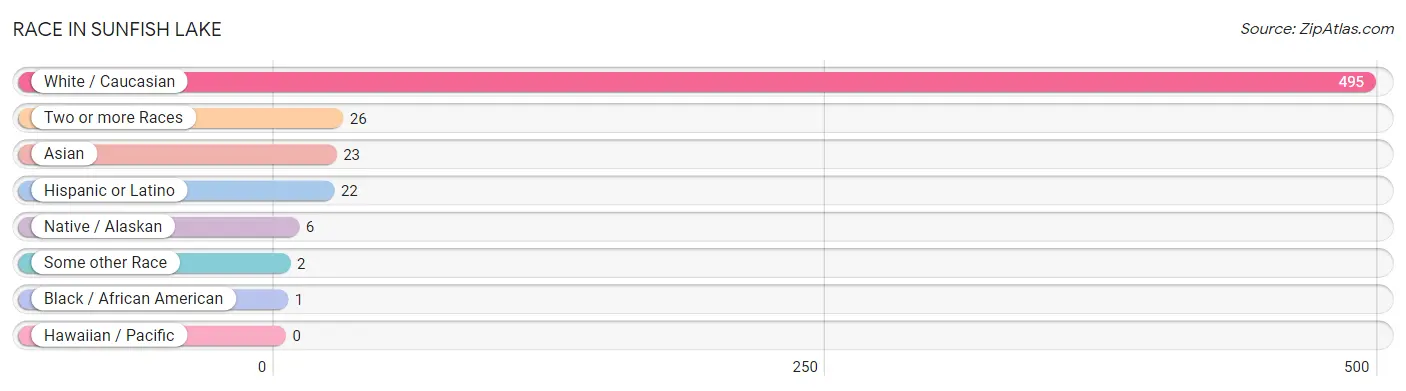
The most populous races in Sunfish Lake are White / Caucasian (495 | 89.5%), Two or more Races (26 | 4.7%), and Asian (23 | 4.2%).
| Race | # Population | % Population |
| Asian | 23 | 4.2% |
| Black / African American | 1 | 0.2% |
| Hawaiian / Pacific | 0 | 0.0% |
| Hispanic or Latino | 22 | 4.0% |
| Native / Alaskan | 6 | 1.1% |
| White / Caucasian | 495 | 89.5% |
| Two or more Races | 26 | 4.7% |
| Some other Race | 2 | 0.4% |
| Total | 553 | 100.0% |
Ancestry in Sunfish Lake
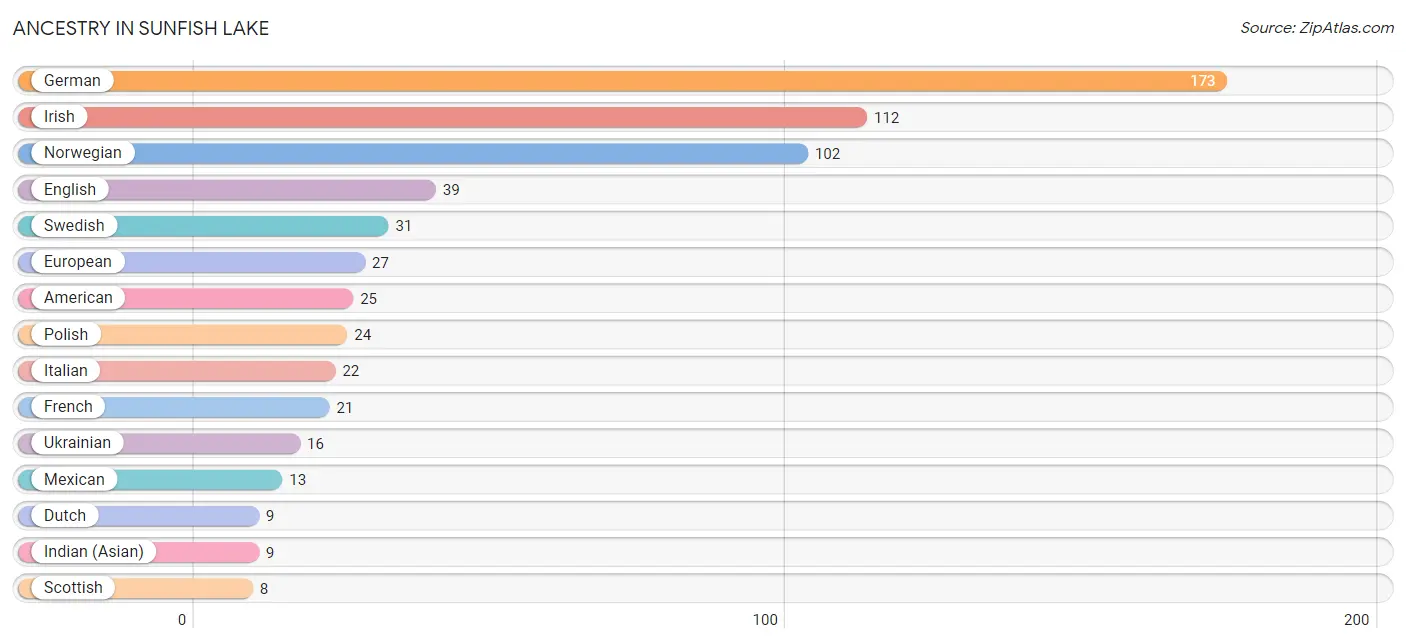
The most populous ancestries reported in Sunfish Lake are German (173 | 31.3%), Irish (112 | 20.3%), Norwegian (102 | 18.4%), English (39 | 7.0%), and Swedish (31 | 5.6%), together accounting for 82.6% of all Sunfish Lake residents.
| Ancestry | # Population | % Population |
| American | 25 | 4.5% |
| Arab | 4 | 0.7% |
| Austrian | 6 | 1.1% |
| Bhutanese | 3 | 0.5% |
| British | 2 | 0.4% |
| Burmese | 5 | 0.9% |
| Czech | 4 | 0.7% |
| Czechoslovakian | 1 | 0.2% |
| Danish | 5 | 0.9% |
| Dutch | 9 | 1.6% |
| Eastern European | 2 | 0.4% |
| English | 39 | 7.0% |
| European | 27 | 4.9% |
| Finnish | 7 | 1.3% |
| French | 21 | 3.8% |
| French Canadian | 2 | 0.4% |
| German | 173 | 31.3% |
| Greek | 1 | 0.2% |
| Indian (Asian) | 9 | 1.6% |
| Irish | 112 | 20.3% |
| Italian | 22 | 4.0% |
| Korean | 6 | 1.1% |
| Lebanese | 4 | 0.7% |
| Mexican | 13 | 2.4% |
| Mexican American Indian | 2 | 0.4% |
| Northern European | 2 | 0.4% |
| Norwegian | 102 | 18.4% |
| Peruvian | 5 | 0.9% |
| Polish | 24 | 4.3% |
| Russian | 5 | 0.9% |
| Scandinavian | 1 | 0.2% |
| Scotch-Irish | 3 | 0.5% |
| Scottish | 8 | 1.5% |
| Slovak | 2 | 0.4% |
| South American | 5 | 0.9% |
| Spaniard | 4 | 0.7% |
| Swedish | 31 | 5.6% |
| Swiss | 1 | 0.2% |
| Ukrainian | 16 | 2.9% |
| Welsh | 2 | 0.4% | View All 40 Rows |
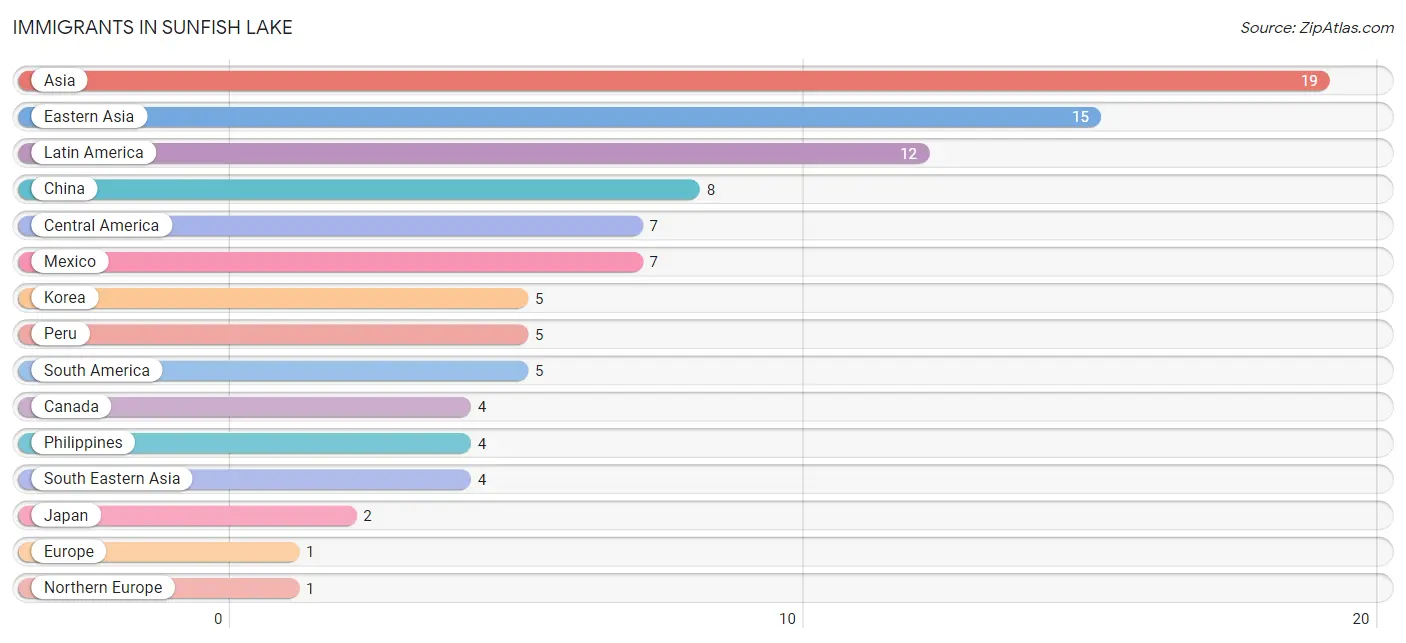
Immigrants in Sunfish Lake
The most numerous immigrant groups reported in Sunfish Lake came from Asia (19 | 3.4%), Eastern Asia (15 | 2.7%), Latin America (12 | 2.2%), China (8 | 1.5%), and Central America (7 | 1.3%), together accounting for 11.0% of all Sunfish Lake residents.
| Immigration Origin | # Population | % Population |
| Asia | 19 | 3.4% |
| Canada | 4 | 0.7% |
| Central America | 7 | 1.3% |
| China | 8 | 1.5% |
| Eastern Asia | 15 | 2.7% |
| Europe | 1 | 0.2% |
| Japan | 2 | 0.4% |
| Korea | 5 | 0.9% |
| Latin America | 12 | 2.2% |
| Mexico | 7 | 1.3% |
| Northern Europe | 1 | 0.2% |
| Norway | 1 | 0.2% |
| Peru | 5 | 0.9% |
| Philippines | 4 | 0.7% |
| South America | 5 | 0.9% |
| South Eastern Asia | 4 | 0.7% | View All 16 Rows |
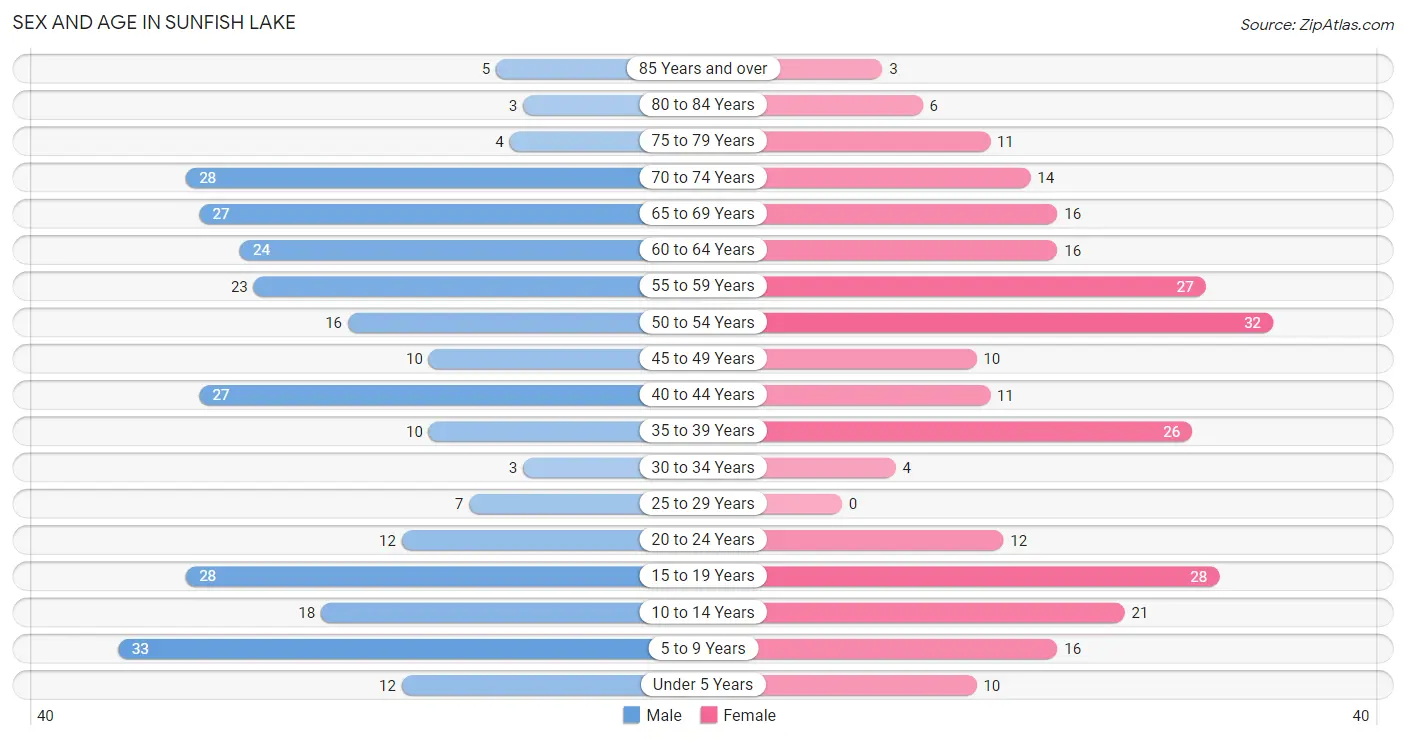
Sex and Age in Sunfish Lake
Sex and Age in Sunfish Lake
The most populous age groups in Sunfish Lake are 5 to 9 Years (33 | 11.4%) for men and 50 to 54 Years (32 | 12.2%) for women.
| Age Bracket | Male | Female |
| Under 5 Years | 12 (4.1%) | 10 (3.8%) |
| 5 to 9 Years | 33 (11.4%) | 16 (6.1%) |
| 10 to 14 Years | 18 (6.2%) | 21 (8.0%) |
| 15 to 19 Years | 28 (9.7%) | 28 (10.6%) |
| 20 to 24 Years | 12 (4.1%) | 12 (4.6%) |
| 25 to 29 Years | 7 (2.4%) | 0 (0.0%) |
| 30 to 34 Years | 3 (1.0%) | 4 (1.5%) |
| 35 to 39 Years | 10 (3.5%) | 26 (9.9%) |
| 40 to 44 Years | 27 (9.3%) | 11 (4.2%) |
| 45 to 49 Years | 10 (3.5%) | 10 (3.8%) |
| 50 to 54 Years | 16 (5.5%) | 32 (12.2%) |
| 55 to 59 Years | 23 (7.9%) | 27 (10.3%) |
| 60 to 64 Years | 24 (8.3%) | 16 (6.1%) |
| 65 to 69 Years | 27 (9.3%) | 16 (6.1%) |
| 70 to 74 Years | 28 (9.7%) | 14 (5.3%) |
| 75 to 79 Years | 4 (1.4%) | 11 (4.2%) |
| 80 to 84 Years | 3 (1.0%) | 6 (2.3%) |
| 85 Years and over | 5 (1.7%) | 3 (1.1%) |
| Total | 290 (100.0%) | 263 (100.0%) |
Families and Households in Sunfish Lake
Median Family Size in Sunfish Lake
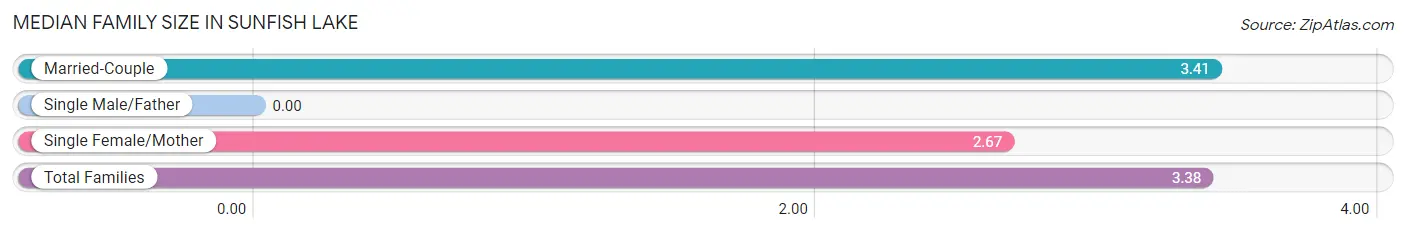
| Family Type | # Families | Family Size |
| Married-Couple | 151 (96.2%) | 3.41 |
| Single Male/Father | 0 (0.0%) | - |
| Single Female/Mother | 6 (3.8%) | 2.67 |
| Total Families | 157 (100.0%) | 3.38 |
Median Household Size in Sunfish Lake
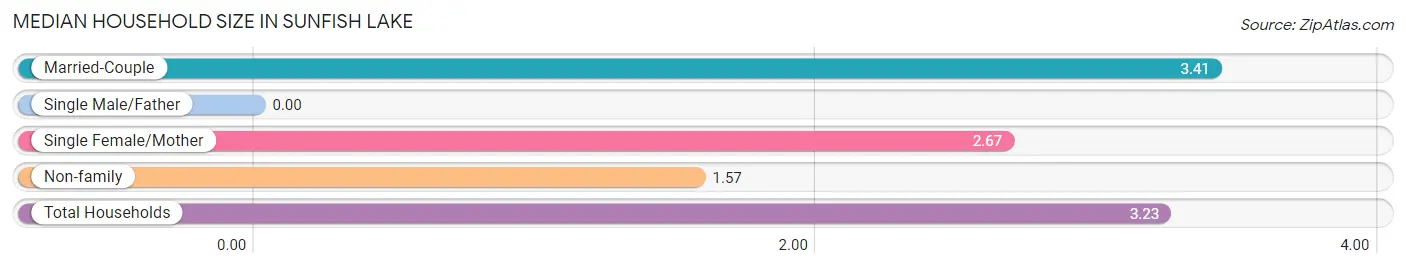
| Household Type | # Households | Household Size |
| Married-Couple | 151 (88.3%) | 3.41 |
| Single Male/Father | 0 (0.0%) | - |
| Single Female/Mother | 6 (3.5%) | 2.67 |
| Non-family | 14 (8.2%) | 1.57 |
| Total Households | 171 (100.0%) | 3.23 |
Household Size by Marriage Status in Sunfish Lake
Out of a total of 171 households in Sunfish Lake, 157 (91.8%) are family households, while 14 (8.2%) are nonfamily households. The most numerous type of family households are 2-person households, comprising 76, and the most common type of nonfamily households are 1-person households, comprising 10.
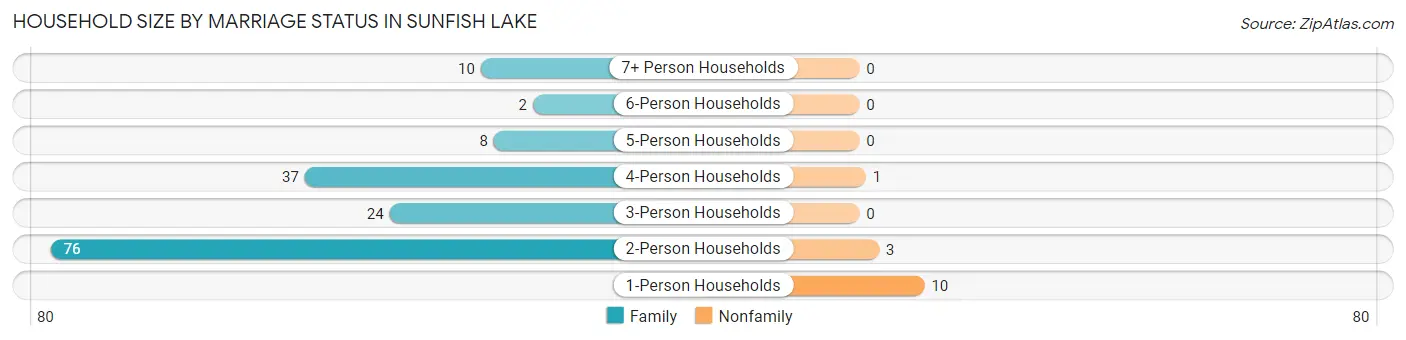
| Household Size | Family Households | Nonfamily Households |
| 1-Person Households | - | 10 (5.9%) |
| 2-Person Households | 76 (44.4%) | 3 (1.8%) |
| 3-Person Households | 24 (14.0%) | 0 (0.0%) |
| 4-Person Households | 37 (21.6%) | 1 (0.6%) |
| 5-Person Households | 8 (4.7%) | 0 (0.0%) |
| 6-Person Households | 2 (1.2%) | 0 (0.0%) |
| 7+ Person Households | 10 (5.9%) | 0 (0.0%) |
| Total | 157 (91.8%) | 14 (8.2%) |
Female Fertility in Sunfish Lake
Fertility by Age in Sunfish Lake
| Age Bracket | Women with Births | Births / 1,000 Women |
| 15 to 19 years | 0 (0.0%) | 0.0 |
| 20 to 34 years | 0 (0.0%) | 0.0 |
| 35 to 50 years | 0 (0.0%) | 0.0 |
| Total | 0 (0.0%) | 0.0 |
Fertility by Age by Marriage Status in Sunfish Lake
| Age Bracket | Married | Unmarried |
| 15 to 19 years | 0 (0.0%) | 0 (0.0%) |
| 20 to 34 years | 0 (0.0%) | 0 (0.0%) |
| 35 to 50 years | 0 (0.0%) | 0 (0.0%) |
| Total | 0 (0.0%) | 0 (0.0%) |
Fertility by Education in Sunfish Lake
| Educational Attainment | Women with Births | Births / 1,000 Women |
| Less than High School | 0 (0.0%) | 0.0 |
| High School Diploma | 0 (0.0%) | 0.0 |
| College or Associate's Degree | 0 (0.0%) | 0.0 |
| Bachelor's Degree | 0 (0.0%) | 0.0 |
| Graduate Degree | 0 (0.0%) | 0.0 |
| Total | 0 (0.0%) | 0.0 |
Fertility by Education by Marriage Status in Sunfish Lake
| Educational Attainment | Married | Unmarried |
| Less than High School | 0 (0.0%) | 0 (0.0%) |
| High School Diploma | 0 (0.0%) | 0 (0.0%) |
| College or Associate's Degree | 0 (0.0%) | 0 (0.0%) |
| Bachelor's Degree | 0 (0.0%) | 0 (0.0%) |
| Graduate Degree | 0 (0.0%) | 0 (0.0%) |
| Total | 0 (0.0%) | 0 (0.0%) |
Employment Characteristics in Sunfish Lake
Employment by Class of Employer in Sunfish Lake
Among the 258 employed individuals in Sunfish Lake, private company employees (166 | 64.3%), not-for-profit organizations (26 | 10.1%), and self-employed (incorporated) (25 | 9.7%) make up the most common classes of employment.
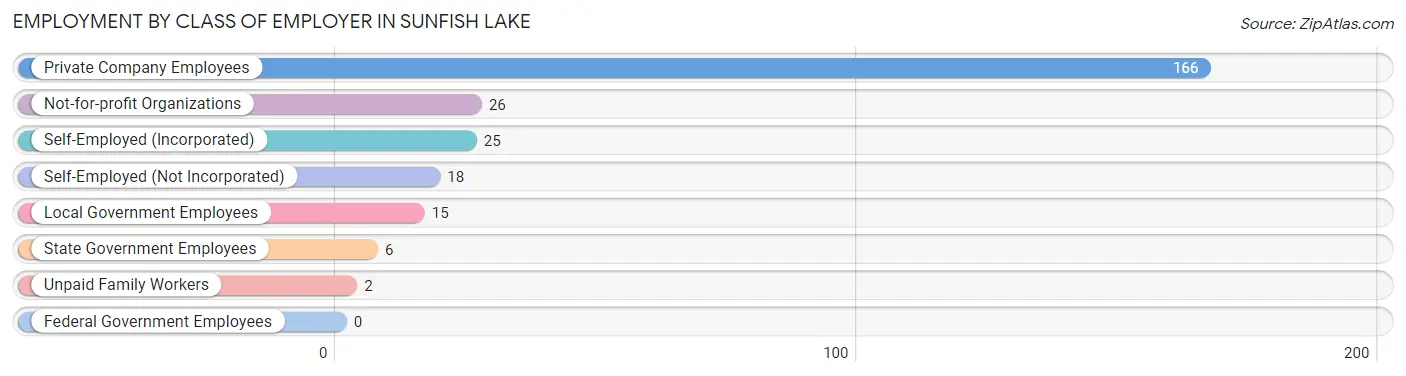
| Employer Class | # Employees | % Employees |
| Private Company Employees | 166 | 64.3% |
| Self-Employed (Incorporated) | 25 | 9.7% |
| Self-Employed (Not Incorporated) | 18 | 7.0% |
| Not-for-profit Organizations | 26 | 10.1% |
| Local Government Employees | 15 | 5.8% |
| State Government Employees | 6 | 2.3% |
| Federal Government Employees | 0 | 0.0% |
| Unpaid Family Workers | 2 | 0.8% |
| Total | 258 | 100.0% |
Employment Status by Age in Sunfish Lake
According to the labor force statistics for Sunfish Lake, out of the total population over 16 years of age (432), 61.3% or 265 individuals are in the labor force, with 1.1% or 3 of them unemployed. The age group with the highest labor force participation rate is 25 to 29 years, with 100.0% or 7 individuals in the labor force. Within the labor force, the 25 to 29 years age range has the highest percentage of unemployed individuals, with 28.6% or 2 of them being unemployed.
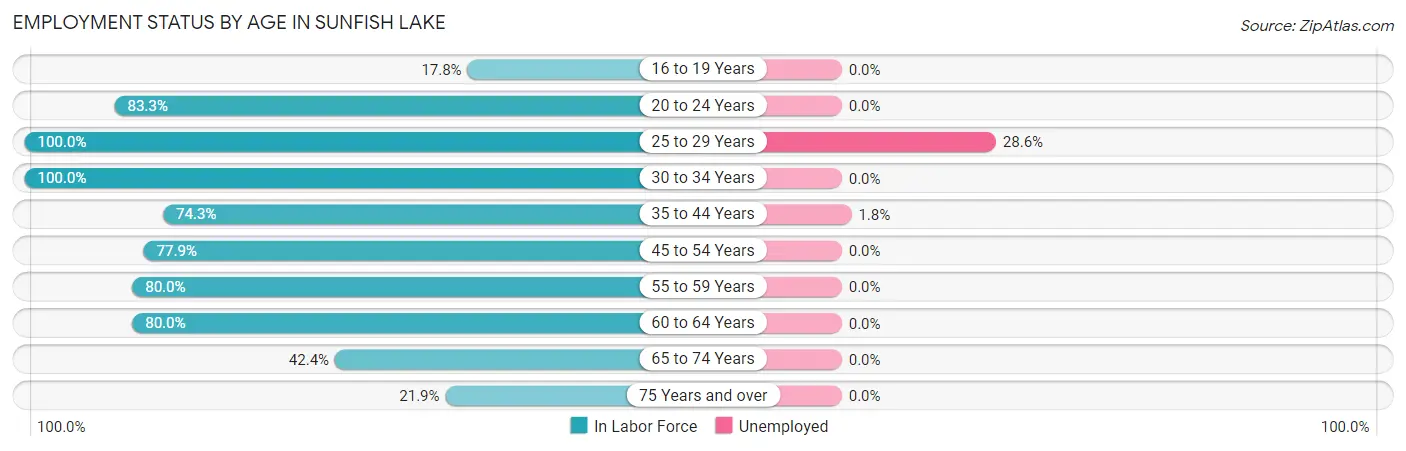
| Age Bracket | In Labor Force | Unemployed |
| 16 to 19 Years | 8 (17.8%) | 0 (0.0%) |
| 20 to 24 Years | 20 (83.3%) | 0 (0.0%) |
| 25 to 29 Years | 7 (100.0%) | 2 (28.6%) |
| 30 to 34 Years | 7 (100.0%) | 0 (0.0%) |
| 35 to 44 Years | 55 (74.3%) | 1 (1.8%) |
| 45 to 54 Years | 53 (77.9%) | 0 (0.0%) |
| 55 to 59 Years | 40 (80.0%) | 0 (0.0%) |
| 60 to 64 Years | 32 (80.0%) | 0 (0.0%) |
| 65 to 74 Years | 36 (42.4%) | 0 (0.0%) |
| 75 Years and over | 7 (21.9%) | 0 (0.0%) |
| Total | 265 (61.3%) | 3 (1.1%) |
Employment Status by Educational Attainment in Sunfish Lake
According to labor force statistics for Sunfish Lake, 78.9% of individuals (194) out of the total population between 25 and 64 years of age (246) are in the labor force, with 1.5% or 3 of them being unemployed. The group with the highest labor force participation rate are those with the educational attainment of less than high school, with 100.0% or 1 individuals in the labor force. Within the labor force, individuals with college / associate degree education have the highest percentage of unemployment, with 10.7% or 3 of them being unemployed.
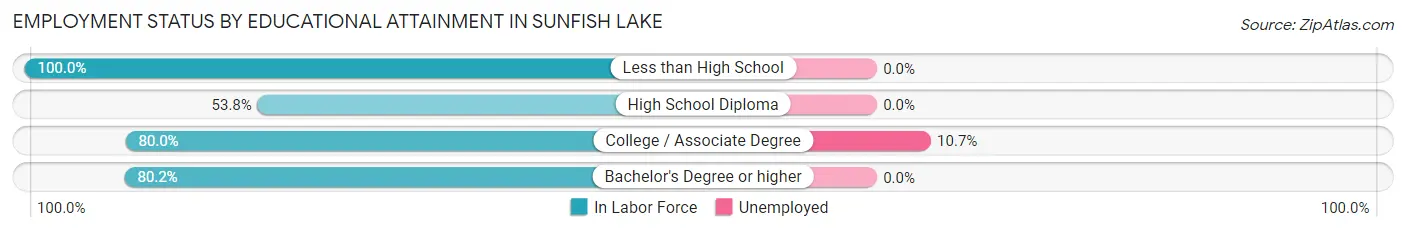
| Educational Attainment | In Labor Force | Unemployed |
| Less than High School | 1 (100.0%) | 0 (0.0%) |
| High School Diploma | 7 (53.8%) | 0 (0.0%) |
| College / Associate Degree | 28 (80.0%) | 4 (10.7%) |
| Bachelor's Degree or higher | 158 (80.2%) | 0 (0.0%) |
| Total | 194 (78.9%) | 4 (1.5%) |
Employment Occupations by Sex in Sunfish Lake
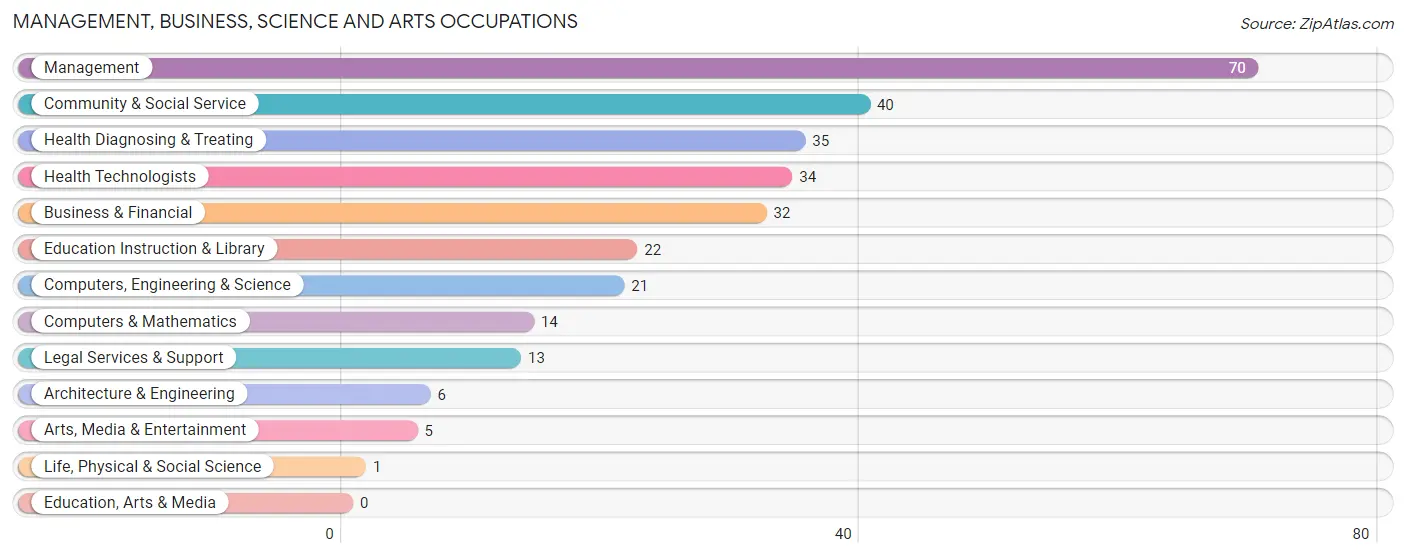
Management, Business, Science and Arts Occupations
The most common Management, Business, Science and Arts occupations in Sunfish Lake are Management (70 | 26.7%), Community & Social Service (40 | 15.3%), Health Diagnosing & Treating (35 | 13.4%), Health Technologists (34 | 13.0%), and Business & Financial (32 | 12.2%).
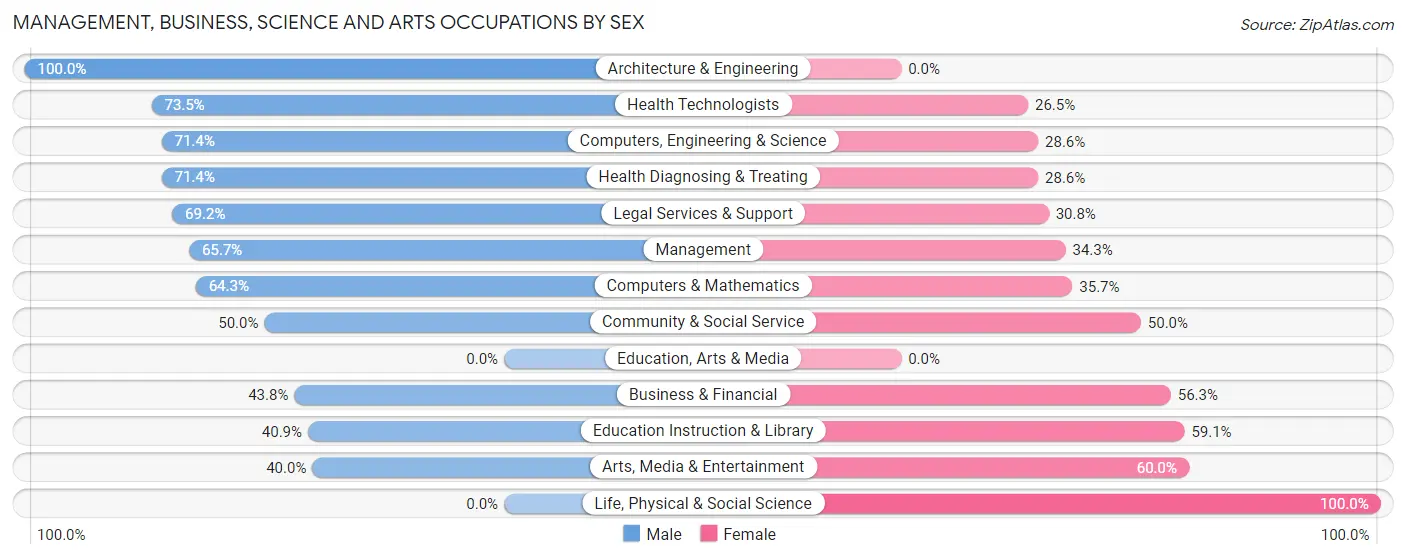
Management, Business, Science and Arts Occupations by Sex
Within the Management, Business, Science and Arts occupations in Sunfish Lake, the most male-oriented occupations are Architecture & Engineering (100.0%), Health Technologists (73.5%), and Computers, Engineering & Science (71.4%), while the most female-oriented occupations are Life, Physical & Social Science (100.0%), Arts, Media & Entertainment (60.0%), and Education Instruction & Library (59.1%).
| Occupation | Male | Female |
| Management | 46 (65.7%) | 24 (34.3%) |
| Business & Financial | 14 (43.8%) | 18 (56.2%) |
| Computers, Engineering & Science | 15 (71.4%) | 6 (28.6%) |
| Computers & Mathematics | 9 (64.3%) | 5 (35.7%) |
| Architecture & Engineering | 6 (100.0%) | 0 (0.0%) |
| Life, Physical & Social Science | 0 (0.0%) | 1 (100.0%) |
| Community & Social Service | 20 (50.0%) | 20 (50.0%) |
| Education, Arts & Media | 0 (0.0%) | 0 (0.0%) |
| Legal Services & Support | 9 (69.2%) | 4 (30.8%) |
| Education Instruction & Library | 9 (40.9%) | 13 (59.1%) |
| Arts, Media & Entertainment | 2 (40.0%) | 3 (60.0%) |
| Health Diagnosing & Treating | 25 (71.4%) | 10 (28.6%) |
| Health Technologists | 25 (73.5%) | 9 (26.5%) |
| Total (Category) | 120 (60.6%) | 78 (39.4%) |
| Total (Overall) | 158 (60.3%) | 104 (39.7%) |
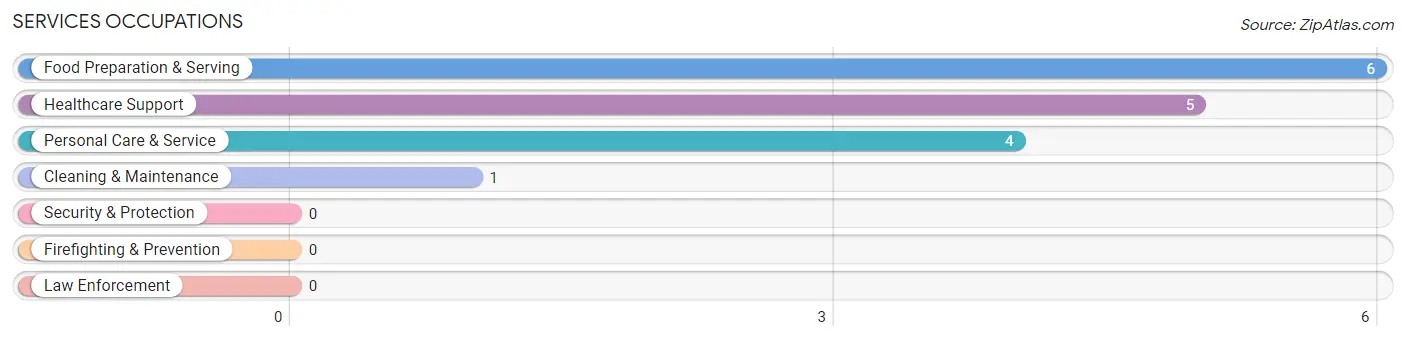
Services Occupations
The most common Services occupations in Sunfish Lake are Food Preparation & Serving (6 | 2.3%), Healthcare Support (5 | 1.9%), Personal Care & Service (4 | 1.5%), and Cleaning & Maintenance (1 | 0.4%).
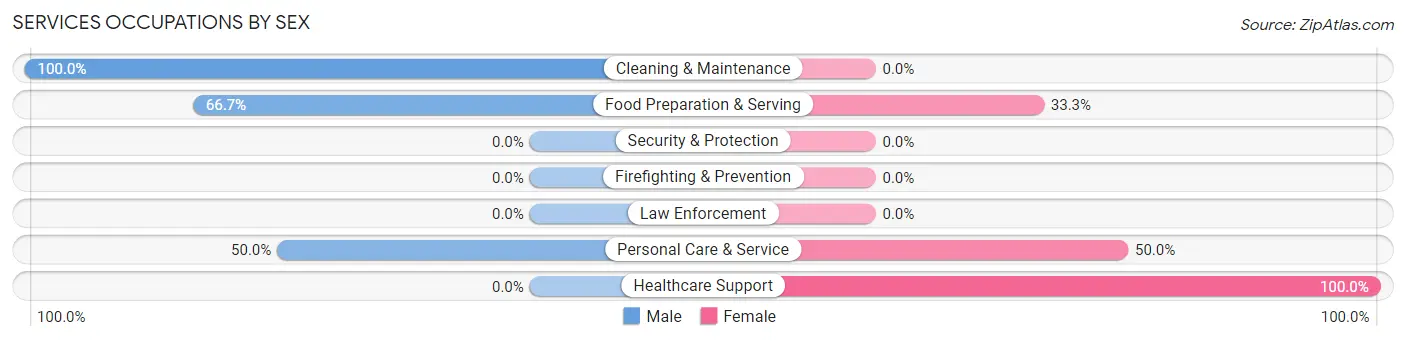
Services Occupations by Sex
Within the Services occupations in Sunfish Lake, the most male-oriented occupations are Cleaning & Maintenance (100.0%), Food Preparation & Serving (66.7%), and Personal Care & Service (50.0%), while the most female-oriented occupations are Healthcare Support (100.0%), Personal Care & Service (50.0%), and Food Preparation & Serving (33.3%).
| Occupation | Male | Female |
| Healthcare Support | 0 (0.0%) | 5 (100.0%) |
| Security & Protection | 0 (0.0%) | 0 (0.0%) |
| Firefighting & Prevention | 0 (0.0%) | 0 (0.0%) |
| Law Enforcement | 0 (0.0%) | 0 (0.0%) |
| Food Preparation & Serving | 4 (66.7%) | 2 (33.3%) |
| Cleaning & Maintenance | 1 (100.0%) | 0 (0.0%) |
| Personal Care & Service | 2 (50.0%) | 2 (50.0%) |
| Total (Category) | 7 (43.8%) | 9 (56.2%) |
| Total (Overall) | 158 (60.3%) | 104 (39.7%) |
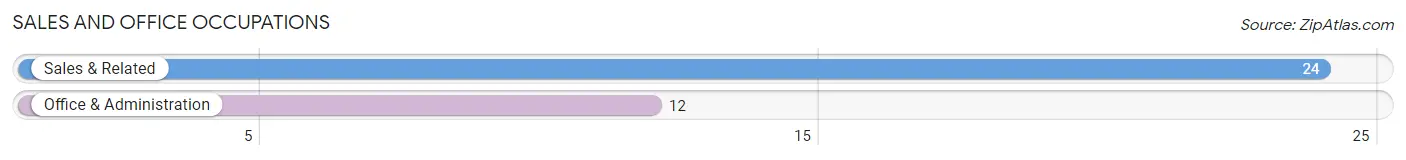
Sales and Office Occupations
The most common Sales and Office occupations in Sunfish Lake are Sales & Related (24 | 9.2%), and Office & Administration (12 | 4.6%).
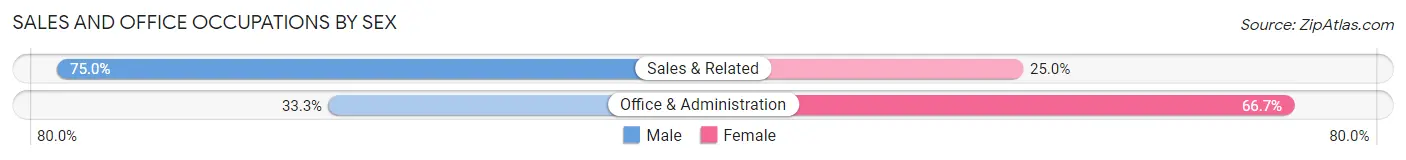
Sales and Office Occupations by Sex
| Occupation | Male | Female |
| Sales & Related | 18 (75.0%) | 6 (25.0%) |
| Office & Administration | 4 (33.3%) | 8 (66.7%) |
| Total (Category) | 22 (61.1%) | 14 (38.9%) |
| Total (Overall) | 158 (60.3%) | 104 (39.7%) |
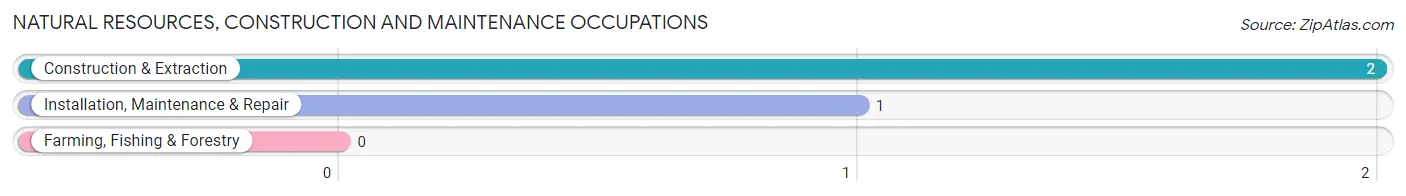
Natural Resources, Construction and Maintenance Occupations
The most common Natural Resources, Construction and Maintenance occupations in Sunfish Lake are Construction & Extraction (2 | 0.8%), and Installation, Maintenance & Repair (1 | 0.4%).
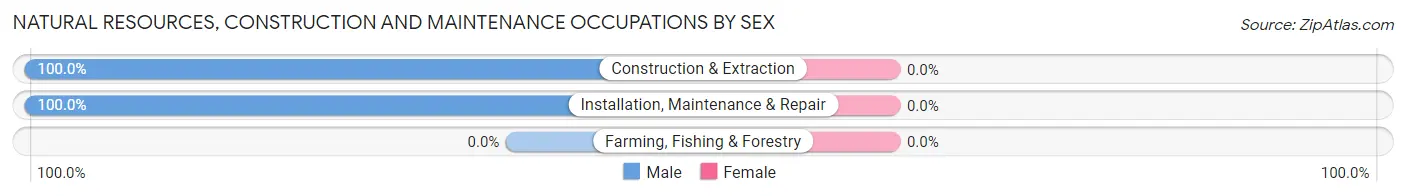
Natural Resources, Construction and Maintenance Occupations by Sex
| Occupation | Male | Female |
| Farming, Fishing & Forestry | 0 (0.0%) | 0 (0.0%) |
| Construction & Extraction | 2 (100.0%) | 0 (0.0%) |
| Installation, Maintenance & Repair | 1 (100.0%) | 0 (0.0%) |
| Total (Category) | 3 (100.0%) | 0 (0.0%) |
| Total (Overall) | 158 (60.3%) | 104 (39.7%) |
Production, Transportation and Moving Occupations
The most common Production, Transportation and Moving occupations in Sunfish Lake are Transportation (4 | 1.5%), Material Moving (4 | 1.5%), and Production (1 | 0.4%).
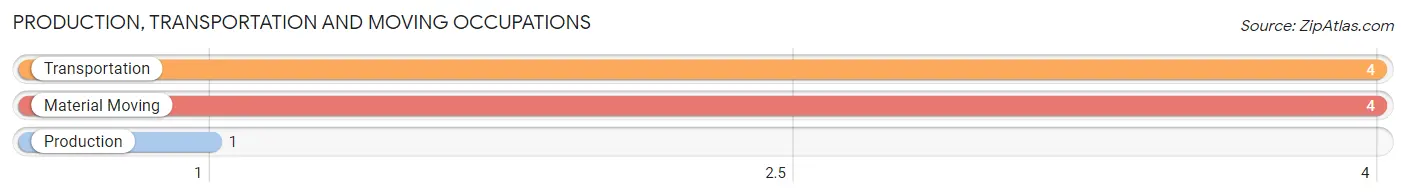
Production, Transportation and Moving Occupations by Sex
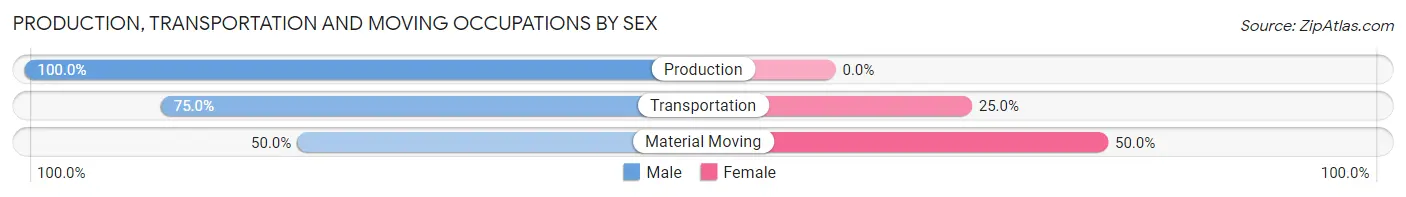
| Occupation | Male | Female |
| Production | 1 (100.0%) | 0 (0.0%) |
| Transportation | 3 (75.0%) | 1 (25.0%) |
| Material Moving | 2 (50.0%) | 2 (50.0%) |
| Total (Category) | 6 (66.7%) | 3 (33.3%) |
| Total (Overall) | 158 (60.3%) | 104 (39.7%) |
Employment Industries by Sex in Sunfish Lake
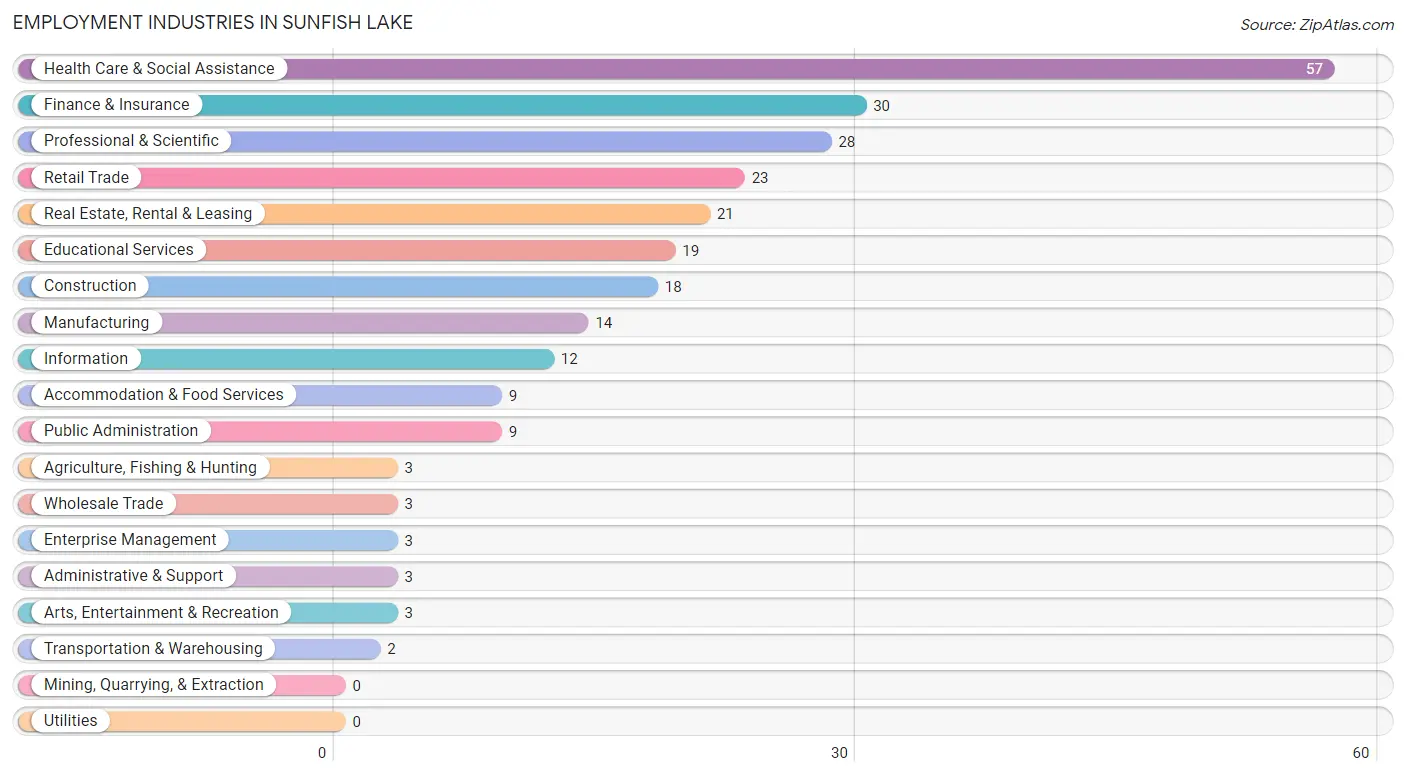
Employment Industries in Sunfish Lake
The major employment industries in Sunfish Lake include Health Care & Social Assistance (57 | 21.8%), Finance & Insurance (30 | 11.5%), Professional & Scientific (28 | 10.7%), Retail Trade (23 | 8.8%), and Real Estate, Rental & Leasing (21 | 8.0%).
Employment Industries by Sex in Sunfish Lake
The Sunfish Lake industries that see more men than women are Agriculture, Fishing & Hunting (100.0%), Enterprise Management (100.0%), and Retail Trade (82.6%), whereas the industries that tend to have a higher number of women are Information (66.7%), Transportation & Warehousing (50.0%), and Finance & Insurance (50.0%).
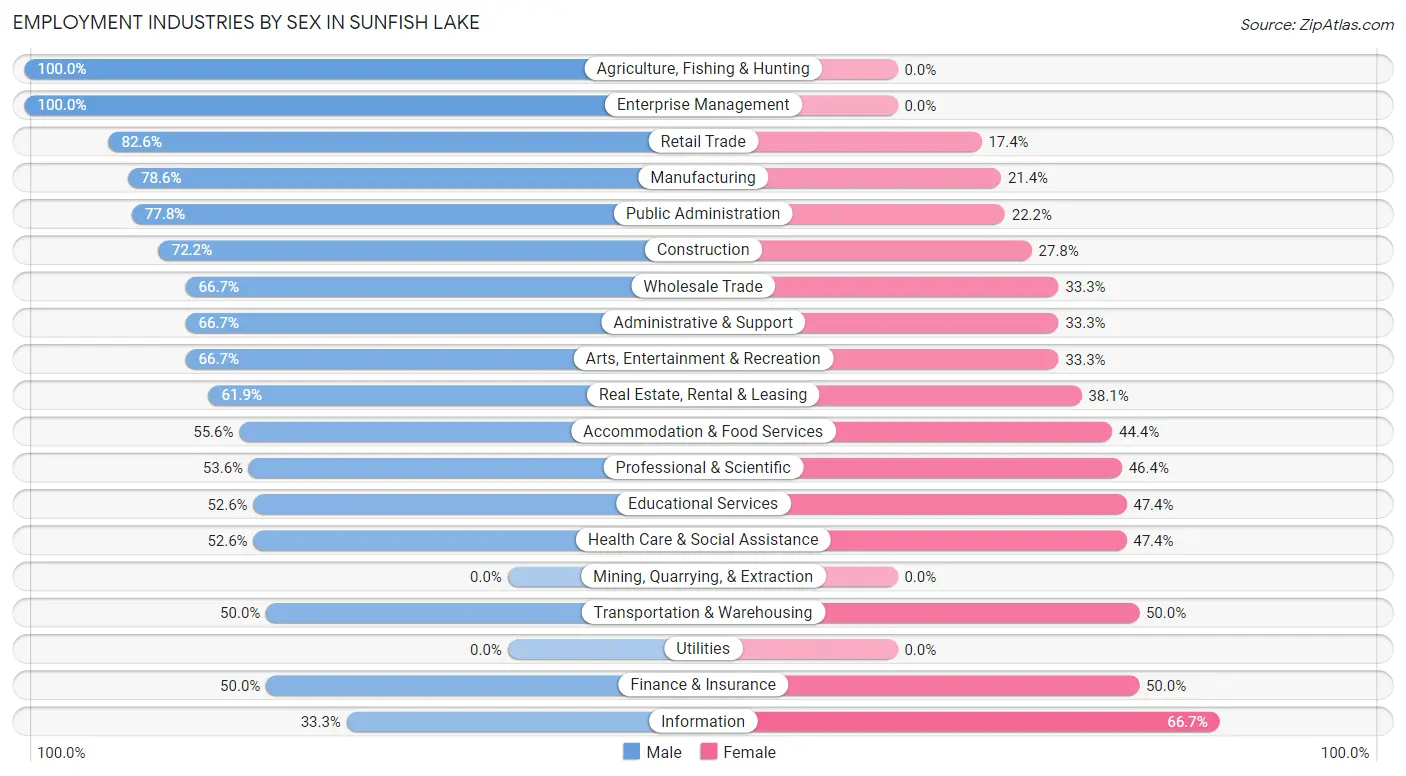
| Industry | Male | Female |
| Agriculture, Fishing & Hunting | 3 (100.0%) | 0 (0.0%) |
| Mining, Quarrying, & Extraction | 0 (0.0%) | 0 (0.0%) |
| Construction | 13 (72.2%) | 5 (27.8%) |
| Manufacturing | 11 (78.6%) | 3 (21.4%) |
| Wholesale Trade | 2 (66.7%) | 1 (33.3%) |
| Retail Trade | 19 (82.6%) | 4 (17.4%) |
| Transportation & Warehousing | 1 (50.0%) | 1 (50.0%) |
| Utilities | 0 (0.0%) | 0 (0.0%) |
| Information | 4 (33.3%) | 8 (66.7%) |
| Finance & Insurance | 15 (50.0%) | 15 (50.0%) |
| Real Estate, Rental & Leasing | 13 (61.9%) | 8 (38.1%) |
| Professional & Scientific | 15 (53.6%) | 13 (46.4%) |
| Enterprise Management | 3 (100.0%) | 0 (0.0%) |
| Administrative & Support | 2 (66.7%) | 1 (33.3%) |
| Educational Services | 10 (52.6%) | 9 (47.4%) |
| Health Care & Social Assistance | 30 (52.6%) | 27 (47.4%) |
| Arts, Entertainment & Recreation | 2 (66.7%) | 1 (33.3%) |
| Accommodation & Food Services | 5 (55.6%) | 4 (44.4%) |
| Public Administration | 7 (77.8%) | 2 (22.2%) |
| Total | 158 (60.3%) | 104 (39.7%) |
Education in Sunfish Lake
School Enrollment in Sunfish Lake
The most common levels of schooling among the 168 students in Sunfish Lake are high school (55 | 32.7%), elementary school (41 | 24.4%), and middle school (30 | 17.9%).
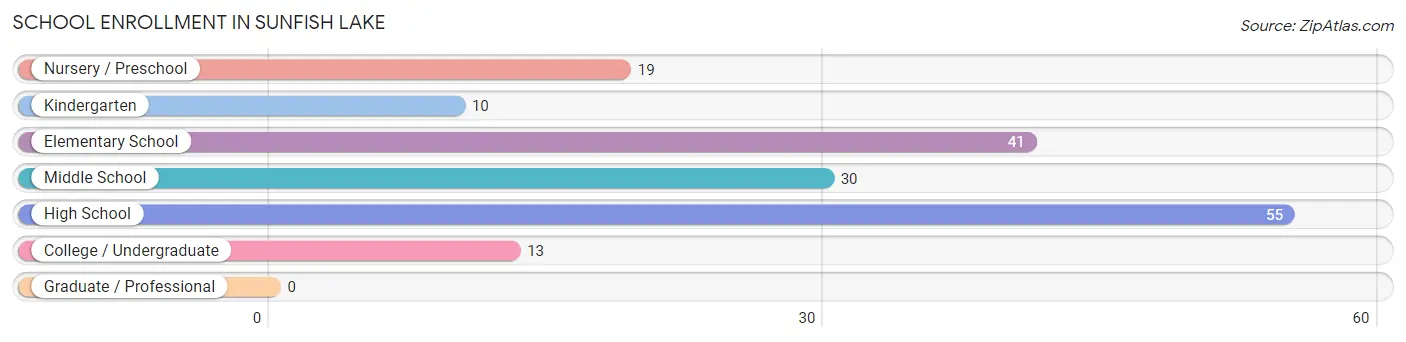
| School Level | # Students | % Students |
| Nursery / Preschool | 19 | 11.3% |
| Kindergarten | 10 | 5.9% |
| Elementary School | 41 | 24.4% |
| Middle School | 30 | 17.9% |
| High School | 55 | 32.7% |
| College / Undergraduate | 13 | 7.7% |
| Graduate / Professional | 0 | 0.0% |
| Total | 168 | 100.0% |
School Enrollment by Age by Funding Source in Sunfish Lake
Out of a total of 168 students who are enrolled in schools in Sunfish Lake, 128 (76.2%) attend a private institution, while the remaining 40 (23.8%) are enrolled in public schools. The age group of 3 to 4 year olds has the highest likelihood of being enrolled in private schools, with 17 (100.0% in the age bracket) enrolled. Conversely, the age group of 20 to 24 year olds has the lowest likelihood of being enrolled in a private school, with 4 (40.0% in the age bracket) attending a public institution.
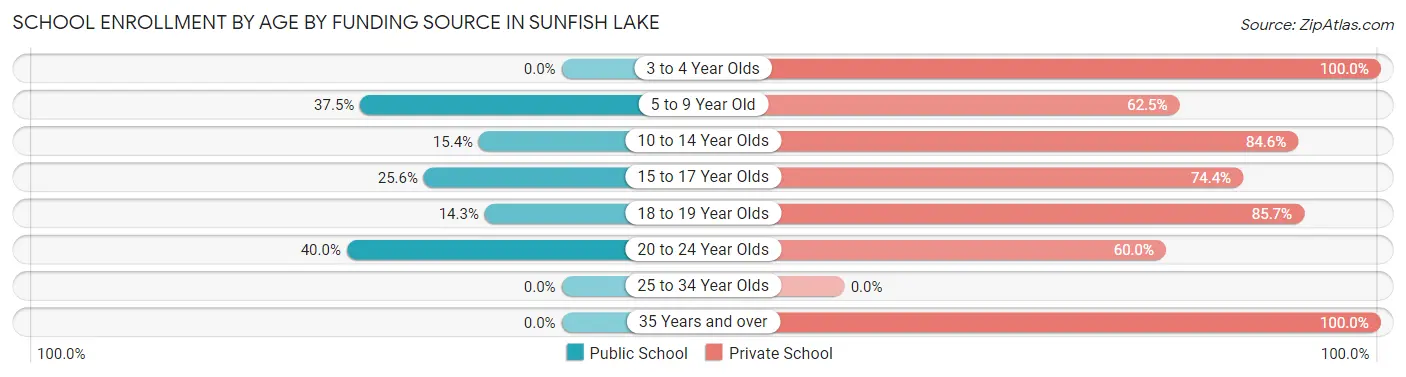
| Age Bracket | Public School | Private School |
| 3 to 4 Year Olds | 0 (0.0%) | 17 (100.0%) |
| 5 to 9 Year Old | 18 (37.5%) | 30 (62.5%) |
| 10 to 14 Year Olds | 6 (15.4%) | 33 (84.6%) |
| 15 to 17 Year Olds | 10 (25.6%) | 29 (74.4%) |
| 18 to 19 Year Olds | 2 (14.3%) | 12 (85.7%) |
| 20 to 24 Year Olds | 4 (40.0%) | 6 (60.0%) |
| 25 to 34 Year Olds | 0 (0.0%) | 0 (0.0%) |
| 35 Years and over | 0 (0.0%) | 1 (100.0%) |
| Total | 40 (23.8%) | 128 (76.2%) |
Educational Attainment by Field of Study in Sunfish Lake
Business (75 | 22.9%), literature & languages (32 | 9.8%), social sciences (31 | 9.5%), bio, nature & agricultural (29 | 8.8%), and psychology (25 | 7.6%) are the most common fields of study among 328 individuals in Sunfish Lake who have obtained a bachelor's degree or higher.
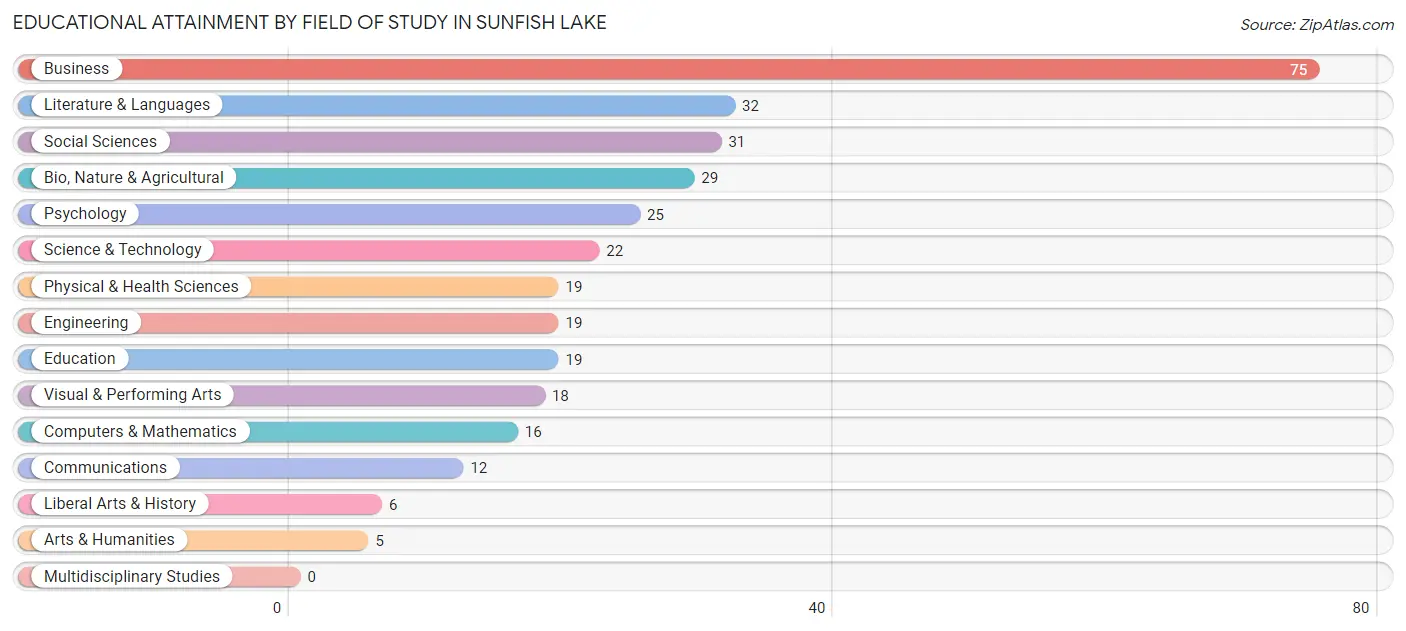
| Field of Study | # Graduates | % Graduates |
| Computers & Mathematics | 16 | 4.9% |
| Bio, Nature & Agricultural | 29 | 8.8% |
| Physical & Health Sciences | 19 | 5.8% |
| Psychology | 25 | 7.6% |
| Social Sciences | 31 | 9.5% |
| Engineering | 19 | 5.8% |
| Multidisciplinary Studies | 0 | 0.0% |
| Science & Technology | 22 | 6.7% |
| Business | 75 | 22.9% |
| Education | 19 | 5.8% |
| Literature & Languages | 32 | 9.8% |
| Liberal Arts & History | 6 | 1.8% |
| Visual & Performing Arts | 18 | 5.5% |
| Communications | 12 | 3.7% |
| Arts & Humanities | 5 | 1.5% |
| Total | 328 | 100.0% |
Transportation & Commute in Sunfish Lake
Vehicle Availability by Sex in Sunfish Lake
The most prevalent vehicle ownership categories in Sunfish Lake are males with 2 vehicles (60, accounting for 38.7%) and females with 2 vehicles (38, making up 58.3%).
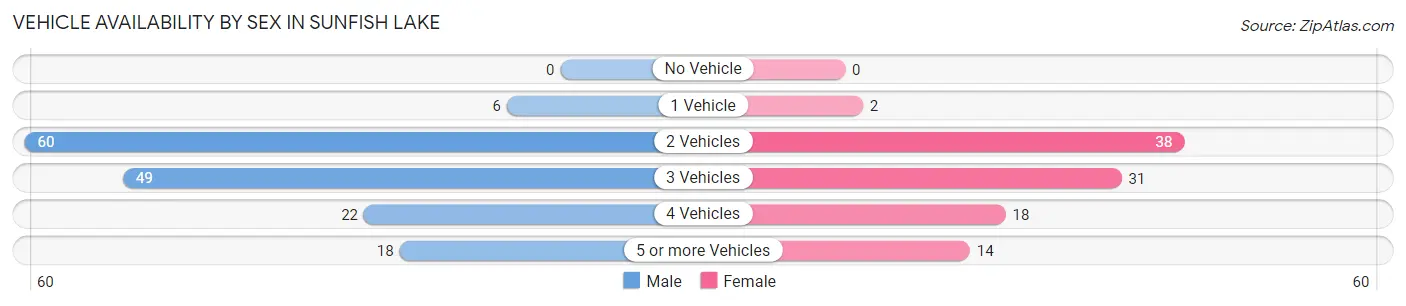
| Vehicles Available | Male | Female |
| No Vehicle | 0 (0.0%) | 0 (0.0%) |
| 1 Vehicle | 6 (3.9%) | 2 (1.9%) |
| 2 Vehicles | 60 (38.7%) | 38 (36.9%) |
| 3 Vehicles | 49 (31.6%) | 31 (30.1%) |
| 4 Vehicles | 22 (14.2%) | 18 (17.5%) |
| 5 or more Vehicles | 18 (11.6%) | 14 (13.6%) |
| Total | 155 (100.0%) | 103 (100.0%) |
Commute Time in Sunfish Lake
The most frequently occuring commute durations in Sunfish Lake are 20 to 24 minutes (47 commuters, 21.6%), 10 to 14 minutes (42 commuters, 19.3%), and 5 to 9 minutes (33 commuters, 15.1%).
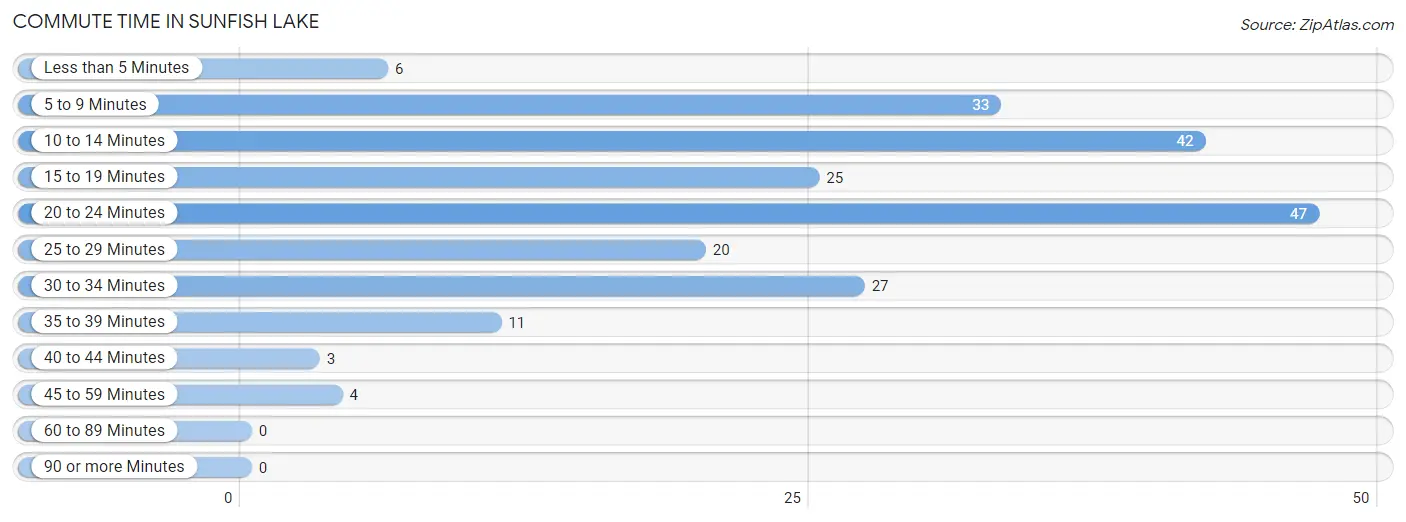
| Commute Time | # Commuters | % Commuters |
| Less than 5 Minutes | 6 | 2.8% |
| 5 to 9 Minutes | 33 | 15.1% |
| 10 to 14 Minutes | 42 | 19.3% |
| 15 to 19 Minutes | 25 | 11.5% |
| 20 to 24 Minutes | 47 | 21.6% |
| 25 to 29 Minutes | 20 | 9.2% |
| 30 to 34 Minutes | 27 | 12.4% |
| 35 to 39 Minutes | 11 | 5.1% |
| 40 to 44 Minutes | 3 | 1.4% |
| 45 to 59 Minutes | 4 | 1.8% |
| 60 to 89 Minutes | 0 | 0.0% |
| 90 or more Minutes | 0 | 0.0% |
Commute Time by Sex in Sunfish Lake
The most common commute times in Sunfish Lake are 10 to 14 minutes (26 commuters, 19.4%) for males and 20 to 24 minutes (21 commuters, 25.0%) for females.
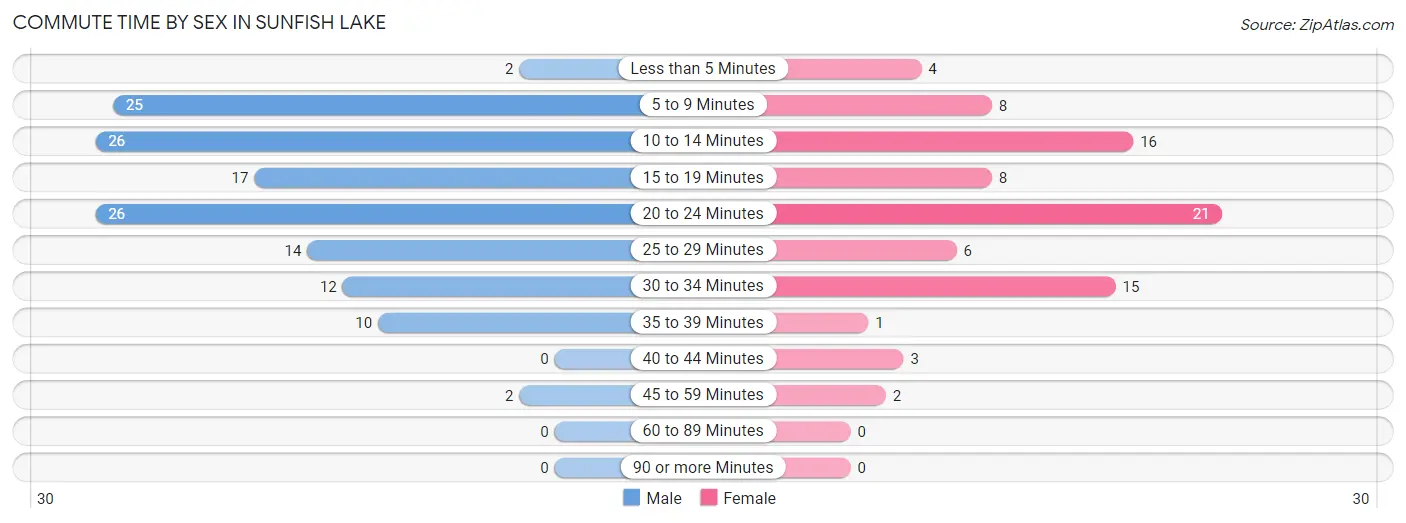
| Commute Time | Male | Female |
| Less than 5 Minutes | 2 (1.5%) | 4 (4.8%) |
| 5 to 9 Minutes | 25 (18.7%) | 8 (9.5%) |
| 10 to 14 Minutes | 26 (19.4%) | 16 (19.1%) |
| 15 to 19 Minutes | 17 (12.7%) | 8 (9.5%) |
| 20 to 24 Minutes | 26 (19.4%) | 21 (25.0%) |
| 25 to 29 Minutes | 14 (10.4%) | 6 (7.1%) |
| 30 to 34 Minutes | 12 (9.0%) | 15 (17.9%) |
| 35 to 39 Minutes | 10 (7.5%) | 1 (1.2%) |
| 40 to 44 Minutes | 0 (0.0%) | 3 (3.6%) |
| 45 to 59 Minutes | 2 (1.5%) | 2 (2.4%) |
| 60 to 89 Minutes | 0 (0.0%) | 0 (0.0%) |
| 90 or more Minutes | 0 (0.0%) | 0 (0.0%) |
Time of Departure to Work by Sex in Sunfish Lake
The most frequent times of departure to work in Sunfish Lake are 8:00 AM to 8:29 AM (44, 32.8%) for males and 8:00 AM to 8:29 AM (20, 23.8%) for females.
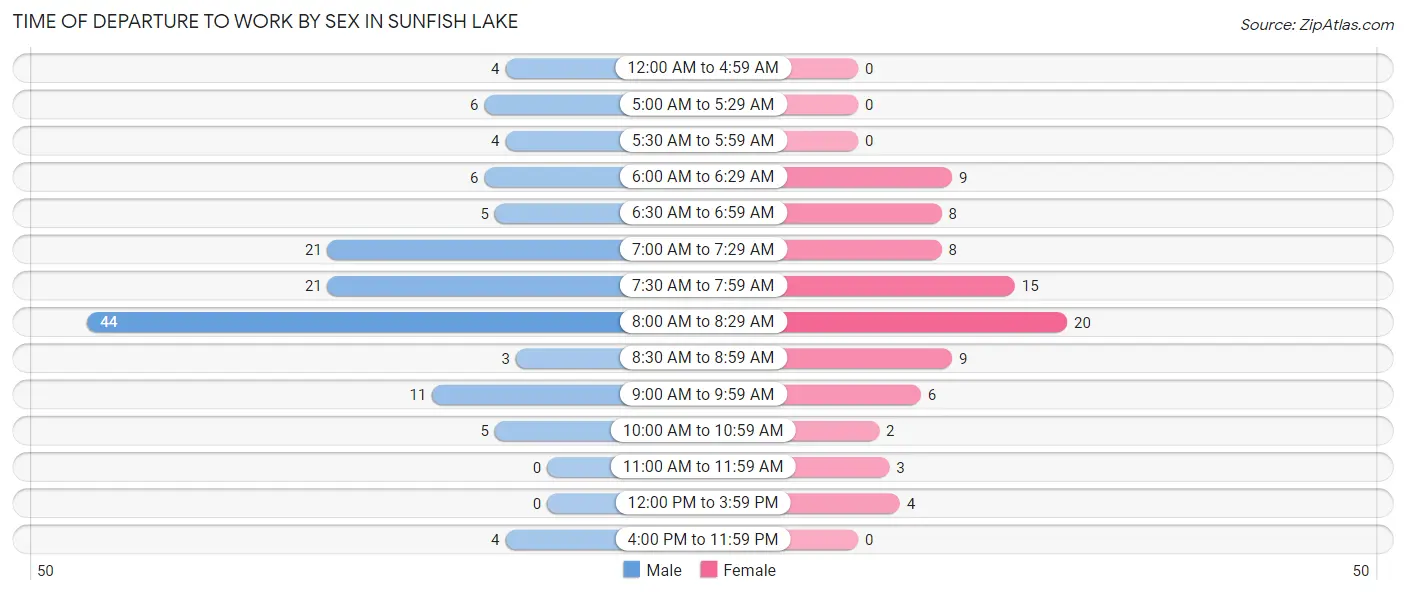
| Time of Departure | Male | Female |
| 12:00 AM to 4:59 AM | 4 (3.0%) | 0 (0.0%) |
| 5:00 AM to 5:29 AM | 6 (4.5%) | 0 (0.0%) |
| 5:30 AM to 5:59 AM | 4 (3.0%) | 0 (0.0%) |
| 6:00 AM to 6:29 AM | 6 (4.5%) | 9 (10.7%) |
| 6:30 AM to 6:59 AM | 5 (3.7%) | 8 (9.5%) |
| 7:00 AM to 7:29 AM | 21 (15.7%) | 8 (9.5%) |
| 7:30 AM to 7:59 AM | 21 (15.7%) | 15 (17.9%) |
| 8:00 AM to 8:29 AM | 44 (32.8%) | 20 (23.8%) |
| 8:30 AM to 8:59 AM | 3 (2.2%) | 9 (10.7%) |
| 9:00 AM to 9:59 AM | 11 (8.2%) | 6 (7.1%) |
| 10:00 AM to 10:59 AM | 5 (3.7%) | 2 (2.4%) |
| 11:00 AM to 11:59 AM | 0 (0.0%) | 3 (3.6%) |
| 12:00 PM to 3:59 PM | 0 (0.0%) | 4 (4.8%) |
| 4:00 PM to 11:59 PM | 4 (3.0%) | 0 (0.0%) |
| Total | 134 (100.0%) | 84 (100.0%) |
Housing Occupancy in Sunfish Lake
Occupancy by Ownership in Sunfish Lake
Of the total 171 dwellings in Sunfish Lake, owner-occupied units account for 167 (97.7%), while renter-occupied units make up 4 (2.3%).
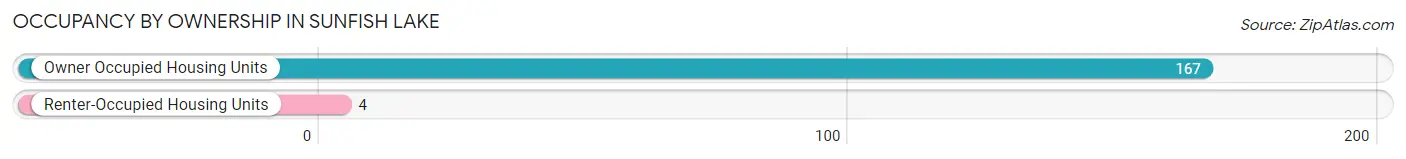
| Occupancy | # Housing Units | % Housing Units |
| Owner Occupied Housing Units | 167 | 97.7% |
| Renter-Occupied Housing Units | 4 | 2.3% |
| Total Occupied Housing Units | 171 | 100.0% |
Occupancy by Household Size in Sunfish Lake
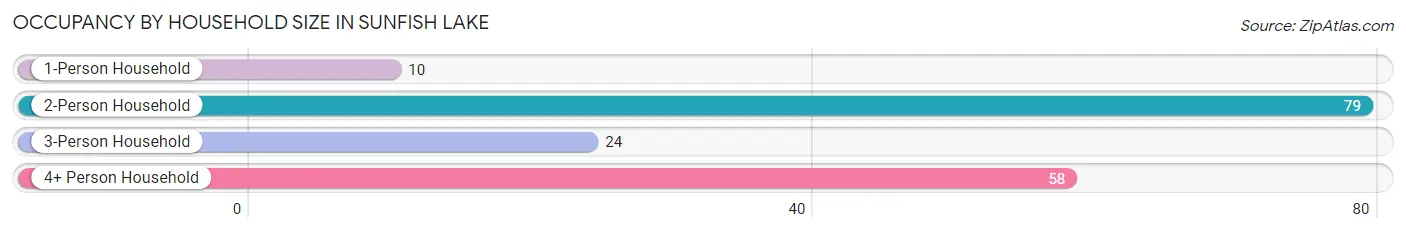
| Household Size | # Housing Units | % Housing Units |
| 1-Person Household | 10 | 5.9% |
| 2-Person Household | 79 | 46.2% |
| 3-Person Household | 24 | 14.0% |
| 4+ Person Household | 58 | 33.9% |
| Total Housing Units | 171 | 100.0% |
Occupancy by Ownership by Household Size in Sunfish Lake
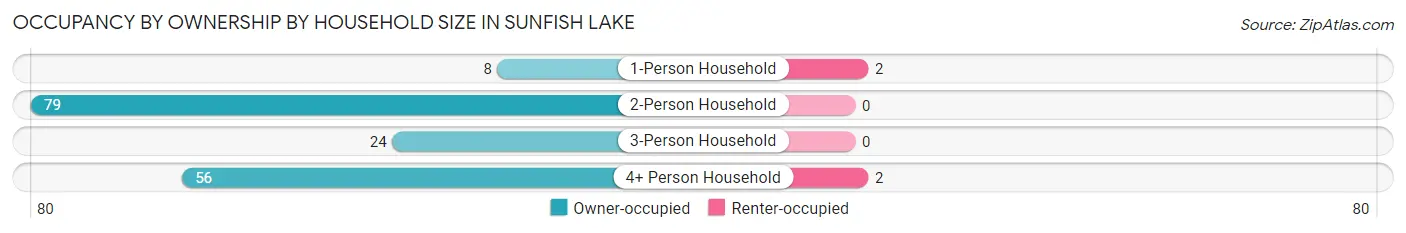
| Household Size | Owner-occupied | Renter-occupied |
| 1-Person Household | 8 (80.0%) | 2 (20.0%) |
| 2-Person Household | 79 (100.0%) | 0 (0.0%) |
| 3-Person Household | 24 (100.0%) | 0 (0.0%) |
| 4+ Person Household | 56 (96.6%) | 2 (3.5%) |
| Total Housing Units | 167 (97.7%) | 4 (2.3%) |
Occupancy by Educational Attainment in Sunfish Lake
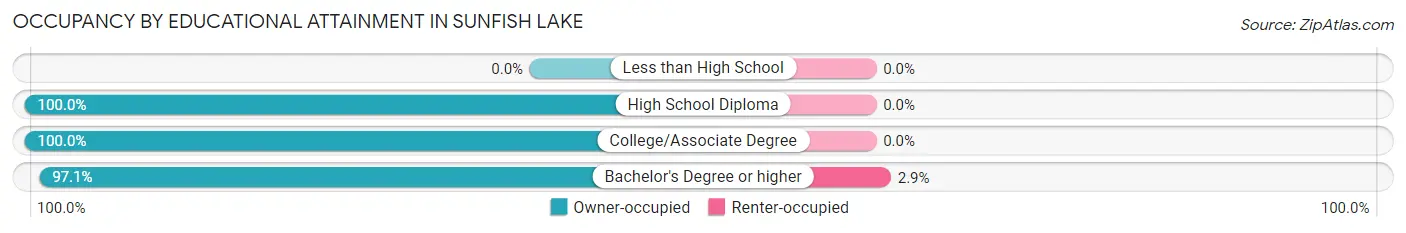
| Household Size | Owner-occupied | Renter-occupied |
| Less than High School | 0 (0.0%) | 0 (0.0%) |
| High School Diploma | 15 (100.0%) | 0 (0.0%) |
| College/Associate Degree | 18 (100.0%) | 0 (0.0%) |
| Bachelor's Degree or higher | 134 (97.1%) | 4 (2.9%) |
Occupancy by Age of Householder in Sunfish Lake
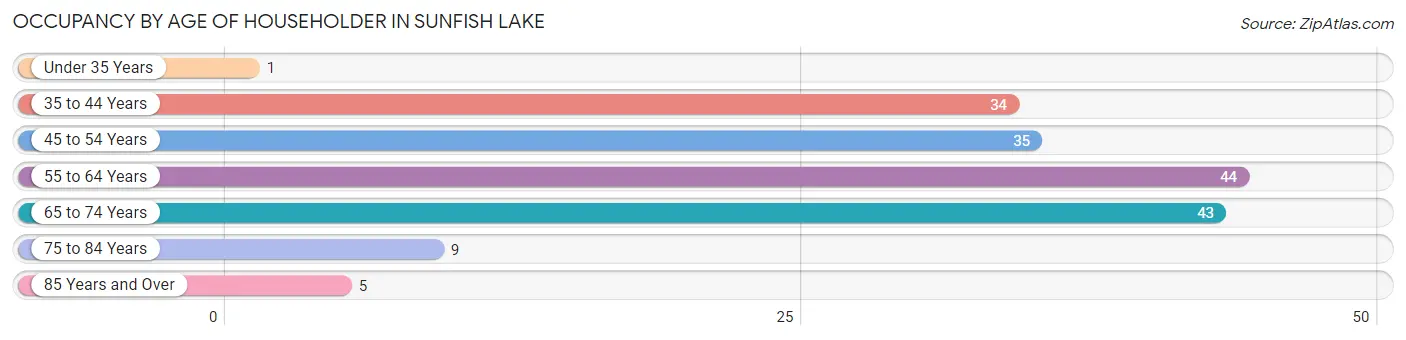
| Age Bracket | # Households | % Households |
| Under 35 Years | 1 | 0.6% |
| 35 to 44 Years | 34 | 19.9% |
| 45 to 54 Years | 35 | 20.5% |
| 55 to 64 Years | 44 | 25.7% |
| 65 to 74 Years | 43 | 25.2% |
| 75 to 84 Years | 9 | 5.3% |
| 85 Years and Over | 5 | 2.9% |
| Total | 171 | 100.0% |
Housing Finances in Sunfish Lake
Median Income by Occupancy in Sunfish Lake
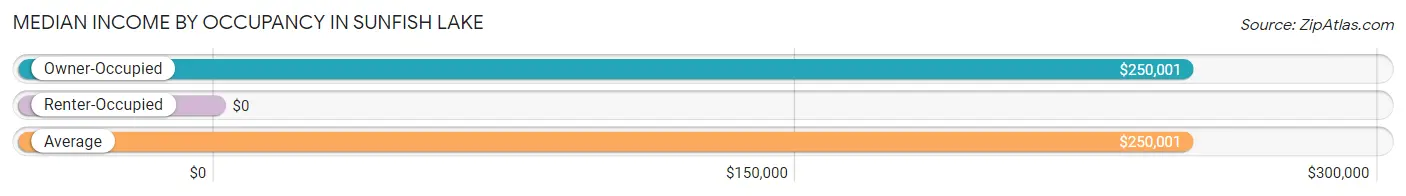
| Occupancy Type | # Households | Median Income |
| Owner-Occupied | 167 (97.7%) | $250,001 |
| Renter-Occupied | 4 (2.3%) | $0 |
| Average | 171 (100.0%) | $250,001 |
Occupancy by Householder Income Bracket in Sunfish Lake
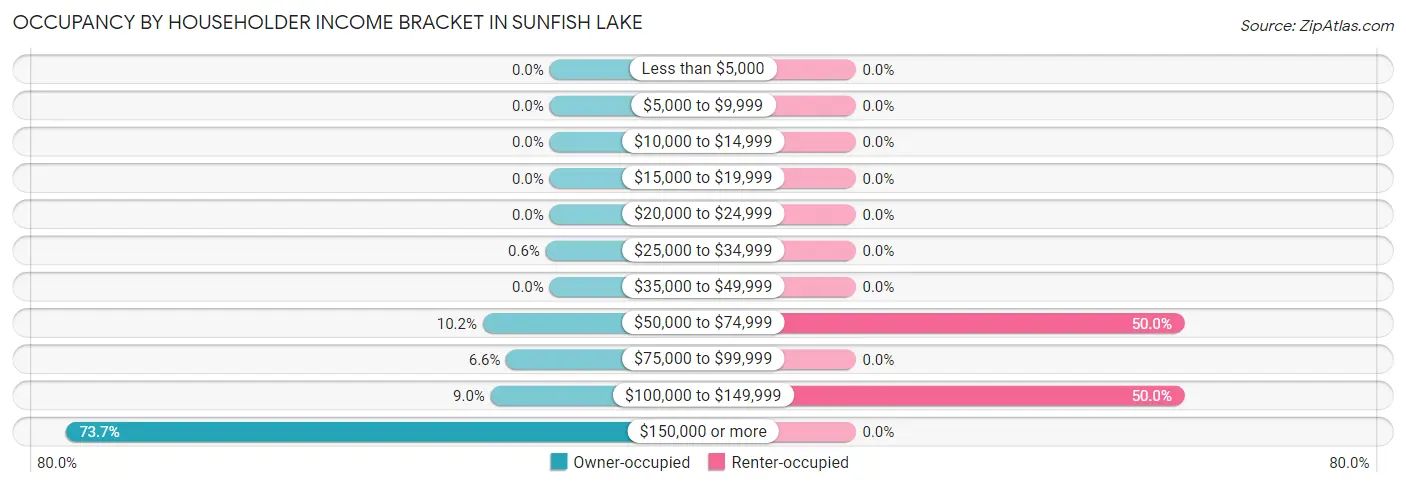
| Income Bracket | Owner-occupied | Renter-occupied |
| Less than $5,000 | 0 (0.0%) | 0 (0.0%) |
| $5,000 to $9,999 | 0 (0.0%) | 0 (0.0%) |
| $10,000 to $14,999 | 0 (0.0%) | 0 (0.0%) |
| $15,000 to $19,999 | 0 (0.0%) | 0 (0.0%) |
| $20,000 to $24,999 | 0 (0.0%) | 0 (0.0%) |
| $25,000 to $34,999 | 1 (0.6%) | 0 (0.0%) |
| $35,000 to $49,999 | 0 (0.0%) | 0 (0.0%) |
| $50,000 to $74,999 | 17 (10.2%) | 2 (50.0%) |
| $75,000 to $99,999 | 11 (6.6%) | 0 (0.0%) |
| $100,000 to $149,999 | 15 (9.0%) | 2 (50.0%) |
| $150,000 or more | 123 (73.7%) | 0 (0.0%) |
| Total | 167 (100.0%) | 4 (100.0%) |
Monthly Housing Cost Tiers in Sunfish Lake
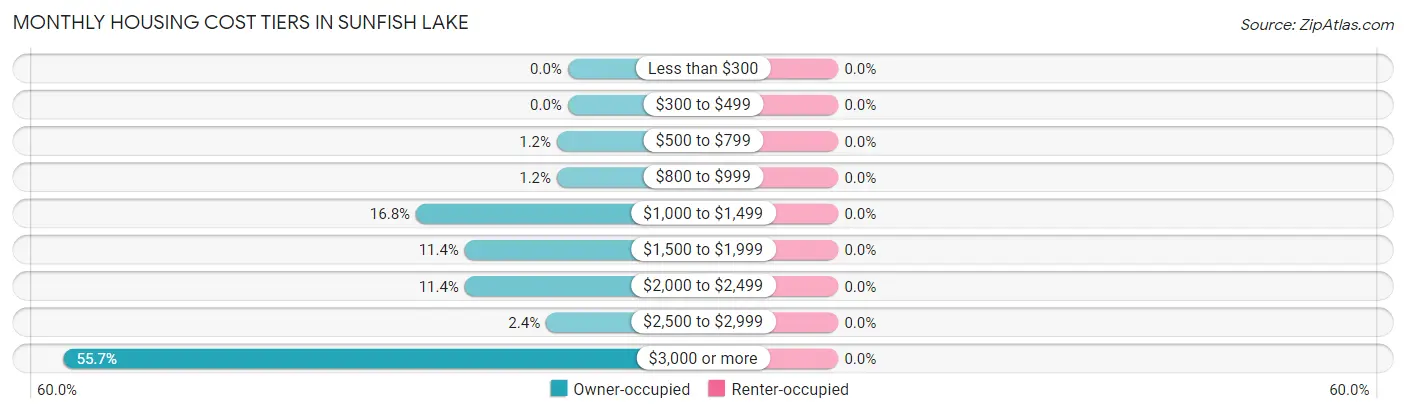
| Monthly Cost | Owner-occupied | Renter-occupied |
| Less than $300 | 0 (0.0%) | 0 (0.0%) |
| $300 to $499 | 0 (0.0%) | 0 (0.0%) |
| $500 to $799 | 2 (1.2%) | 0 (0.0%) |
| $800 to $999 | 2 (1.2%) | 0 (0.0%) |
| $1,000 to $1,499 | 28 (16.8%) | 0 (0.0%) |
| $1,500 to $1,999 | 19 (11.4%) | 0 (0.0%) |
| $2,000 to $2,499 | 19 (11.4%) | 0 (0.0%) |
| $2,500 to $2,999 | 4 (2.4%) | 0 (0.0%) |
| $3,000 or more | 93 (55.7%) | 0 (0.0%) |
| Total | 167 (100.0%) | 4 (100.0%) |
Physical Housing Characteristics in Sunfish Lake
Housing Structures in Sunfish Lake
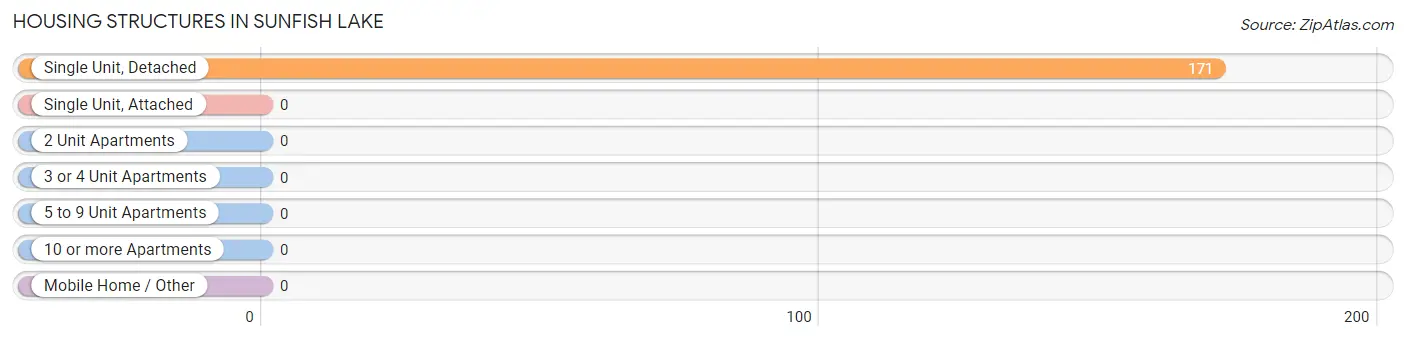
| Structure Type | # Housing Units | % Housing Units |
| Single Unit, Detached | 171 | 100.0% |
| Single Unit, Attached | 0 | 0.0% |
| 2 Unit Apartments | 0 | 0.0% |
| 3 or 4 Unit Apartments | 0 | 0.0% |
| 5 to 9 Unit Apartments | 0 | 0.0% |
| 10 or more Apartments | 0 | 0.0% |
| Mobile Home / Other | 0 | 0.0% |
| Total | 171 | 100.0% |
Housing Structures by Occupancy in Sunfish Lake
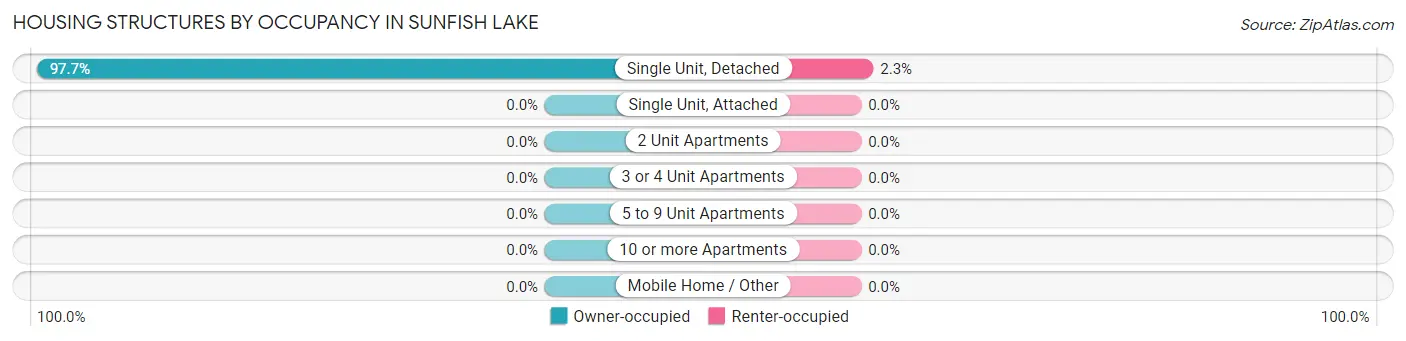
| Structure Type | Owner-occupied | Renter-occupied |
| Single Unit, Detached | 167 (97.7%) | 4 (2.3%) |
| Single Unit, Attached | 0 (0.0%) | 0 (0.0%) |
| 2 Unit Apartments | 0 (0.0%) | 0 (0.0%) |
| 3 or 4 Unit Apartments | 0 (0.0%) | 0 (0.0%) |
| 5 to 9 Unit Apartments | 0 (0.0%) | 0 (0.0%) |
| 10 or more Apartments | 0 (0.0%) | 0 (0.0%) |
| Mobile Home / Other | 0 (0.0%) | 0 (0.0%) |
| Total | 167 (97.7%) | 4 (2.3%) |
Housing Structures by Number of Rooms in Sunfish Lake
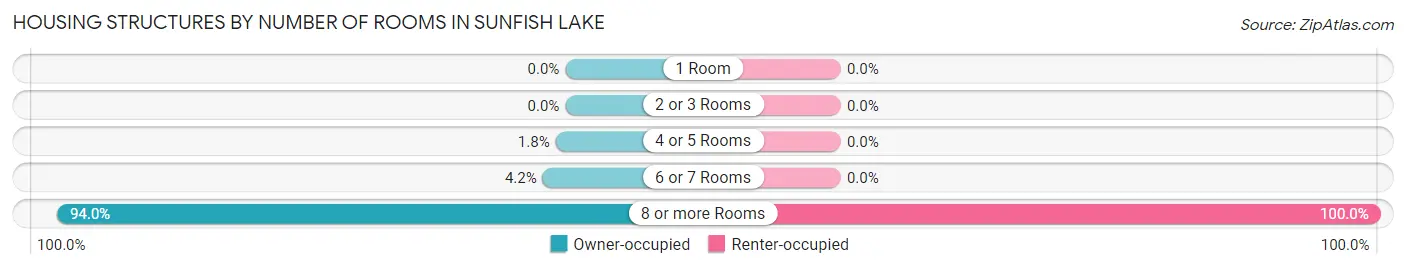
| Number of Rooms | Owner-occupied | Renter-occupied |
| 1 Room | 0 (0.0%) | 0 (0.0%) |
| 2 or 3 Rooms | 0 (0.0%) | 0 (0.0%) |
| 4 or 5 Rooms | 3 (1.8%) | 0 (0.0%) |
| 6 or 7 Rooms | 7 (4.2%) | 0 (0.0%) |
| 8 or more Rooms | 157 (94.0%) | 4 (100.0%) |
| Total | 167 (100.0%) | 4 (100.0%) |
Housing Structure by Heating Type in Sunfish Lake
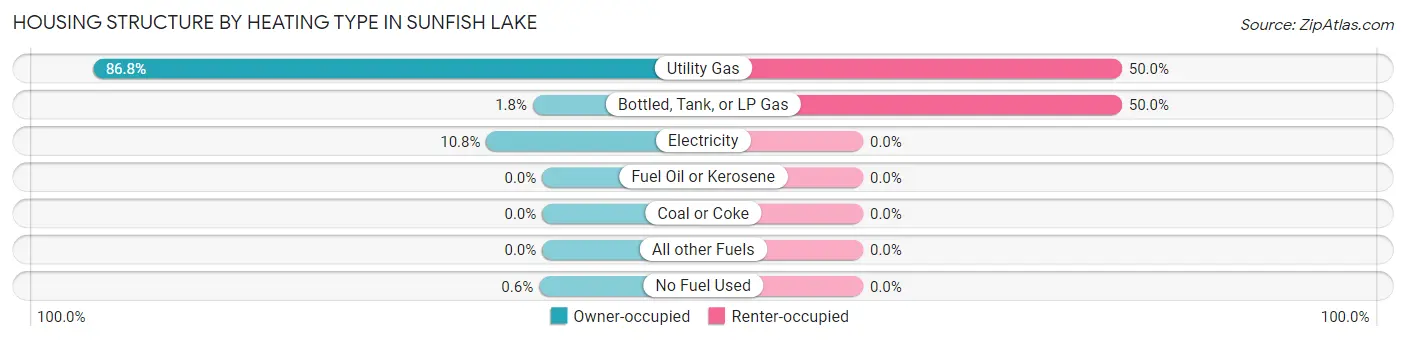
| Heating Type | Owner-occupied | Renter-occupied |
| Utility Gas | 145 (86.8%) | 2 (50.0%) |
| Bottled, Tank, or LP Gas | 3 (1.8%) | 2 (50.0%) |
| Electricity | 18 (10.8%) | 0 (0.0%) |
| Fuel Oil or Kerosene | 0 (0.0%) | 0 (0.0%) |
| Coal or Coke | 0 (0.0%) | 0 (0.0%) |
| All other Fuels | 0 (0.0%) | 0 (0.0%) |
| No Fuel Used | 1 (0.6%) | 0 (0.0%) |
| Total | 167 (100.0%) | 4 (100.0%) |
Household Vehicle Usage in Sunfish Lake
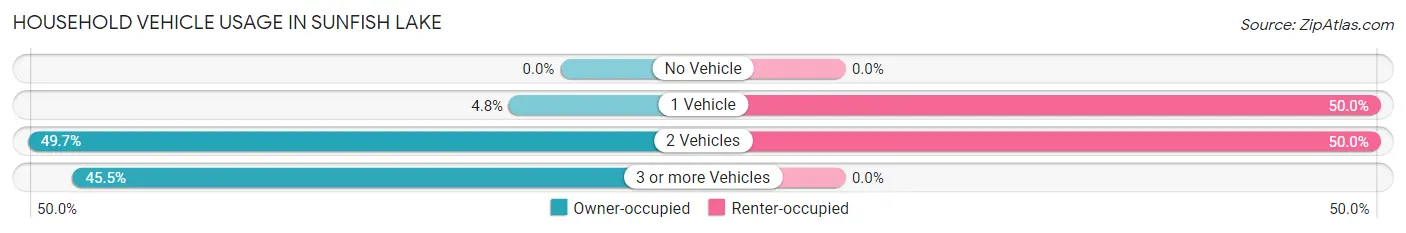
| Vehicles per Household | Owner-occupied | Renter-occupied |
| No Vehicle | 0 (0.0%) | 0 (0.0%) |
| 1 Vehicle | 8 (4.8%) | 2 (50.0%) |
| 2 Vehicles | 83 (49.7%) | 2 (50.0%) |
| 3 or more Vehicles | 76 (45.5%) | 0 (0.0%) |
| Total | 167 (100.0%) | 4 (100.0%) |
Real Estate & Mortgages in Sunfish Lake
Real Estate and Mortgage Overview in Sunfish Lake
| Characteristic | Without Mortgage | With Mortgage |
| Housing Units | 66 | 101 |
| Median Property Value | $1,307,700 | $1,115,700 |
| Median Household Income | $245,500 | $78 |
| Monthly Housing Costs | $1,501 | $88 |
| Real Estate Taxes | $10,001 | $2 |
Property Value by Mortgage Status in Sunfish Lake
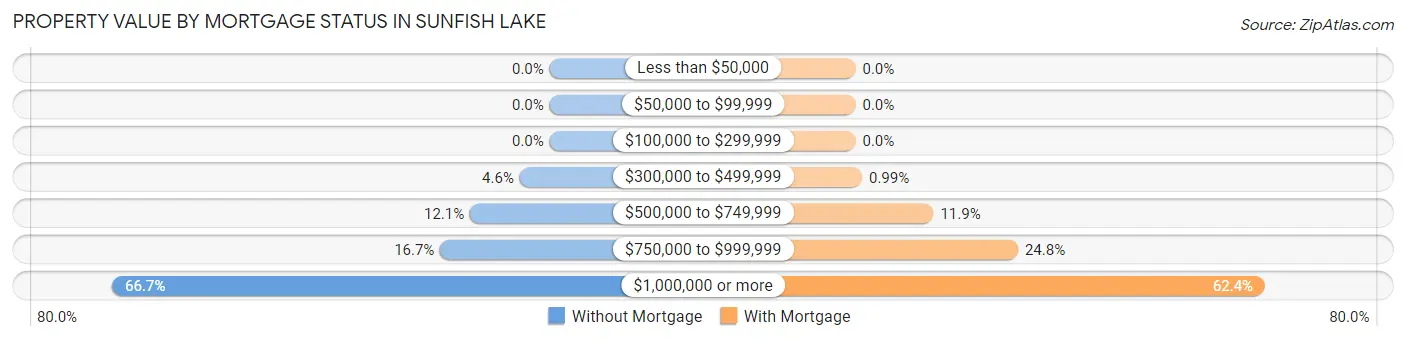
| Property Value | Without Mortgage | With Mortgage |
| Less than $50,000 | 0 (0.0%) | 0 (0.0%) |
| $50,000 to $99,999 | 0 (0.0%) | 0 (0.0%) |
| $100,000 to $299,999 | 0 (0.0%) | 0 (0.0%) |
| $300,000 to $499,999 | 3 (4.5%) | 1 (1.0%) |
| $500,000 to $749,999 | 8 (12.1%) | 12 (11.9%) |
| $750,000 to $999,999 | 11 (16.7%) | 25 (24.7%) |
| $1,000,000 or more | 44 (66.7%) | 63 (62.4%) |
| Total | 66 (100.0%) | 101 (100.0%) |
Household Income by Mortgage Status in Sunfish Lake
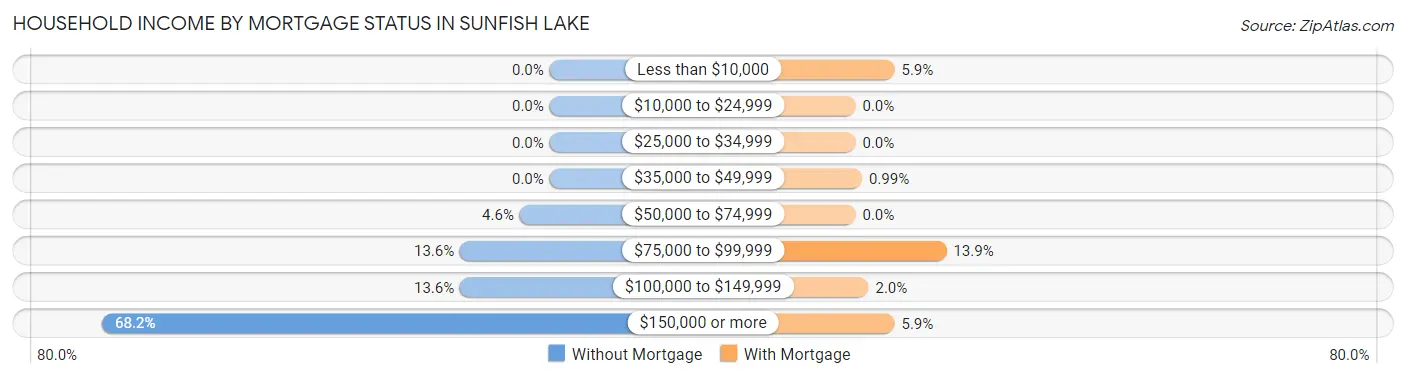
| Household Income | Without Mortgage | With Mortgage |
| Less than $10,000 | 0 (0.0%) | 6 (5.9%) |
| $10,000 to $24,999 | 0 (0.0%) | 0 (0.0%) |
| $25,000 to $34,999 | 0 (0.0%) | 0 (0.0%) |
| $35,000 to $49,999 | 0 (0.0%) | 1 (1.0%) |
| $50,000 to $74,999 | 3 (4.5%) | 0 (0.0%) |
| $75,000 to $99,999 | 9 (13.6%) | 14 (13.9%) |
| $100,000 to $149,999 | 9 (13.6%) | 2 (2.0%) |
| $150,000 or more | 45 (68.2%) | 6 (5.9%) |
| Total | 66 (100.0%) | 101 (100.0%) |
Property Value to Household Income Ratio in Sunfish Lake
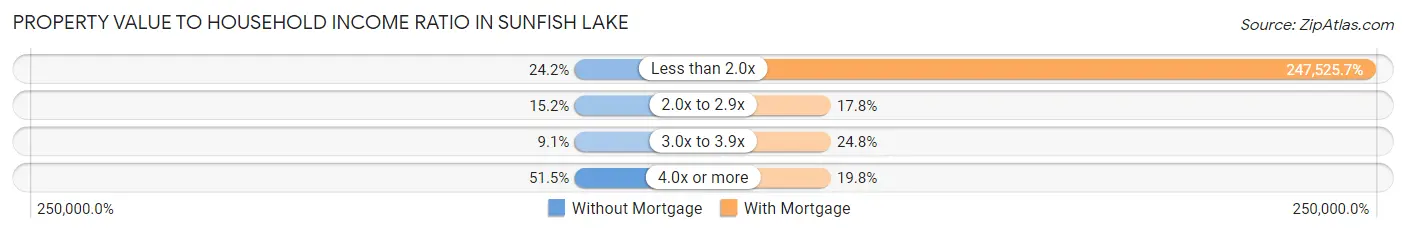
| Value-to-Income Ratio | Without Mortgage | With Mortgage |
| Less than 2.0x | 16 (24.2%) | 250,001 (247,525.7%) |
| 2.0x to 2.9x | 10 (15.1%) | 18 (17.8%) |
| 3.0x to 3.9x | 6 (9.1%) | 25 (24.7%) |
| 4.0x or more | 34 (51.5%) | 20 (19.8%) |
| Total | 66 (100.0%) | 101 (100.0%) |
Real Estate Taxes by Mortgage Status in Sunfish Lake
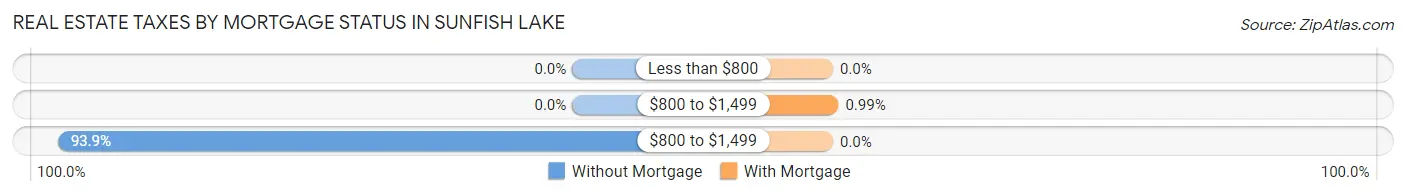
| Property Taxes | Without Mortgage | With Mortgage |
| Less than $800 | 0 (0.0%) | 0 (0.0%) |
| $800 to $1,499 | 0 (0.0%) | 1 (1.0%) |
| $800 to $1,499 | 62 (93.9%) | 0 (0.0%) |
| Total | 66 (100.0%) | 101 (100.0%) |
Health & Disability in Sunfish Lake
Health Insurance Coverage by Age in Sunfish Lake
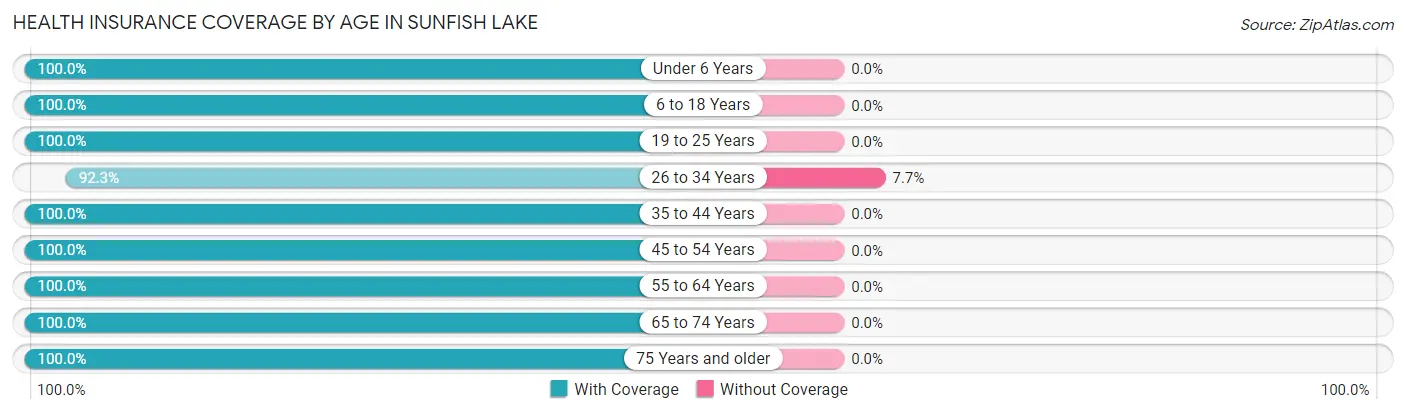
| Age Bracket | With Coverage | Without Coverage |
| Under 6 Years | 27 (100.0%) | 0 (0.0%) |
| 6 to 18 Years | 137 (100.0%) | 0 (0.0%) |
| 19 to 25 Years | 27 (100.0%) | 0 (0.0%) |
| 26 to 34 Years | 12 (92.3%) | 1 (7.7%) |
| 35 to 44 Years | 74 (100.0%) | 0 (0.0%) |
| 45 to 54 Years | 68 (100.0%) | 0 (0.0%) |
| 55 to 64 Years | 90 (100.0%) | 0 (0.0%) |
| 65 to 74 Years | 85 (100.0%) | 0 (0.0%) |
| 75 Years and older | 32 (100.0%) | 0 (0.0%) |
| Total | 552 (99.8%) | 1 (0.2%) |
Health Insurance Coverage by Citizenship Status in Sunfish Lake
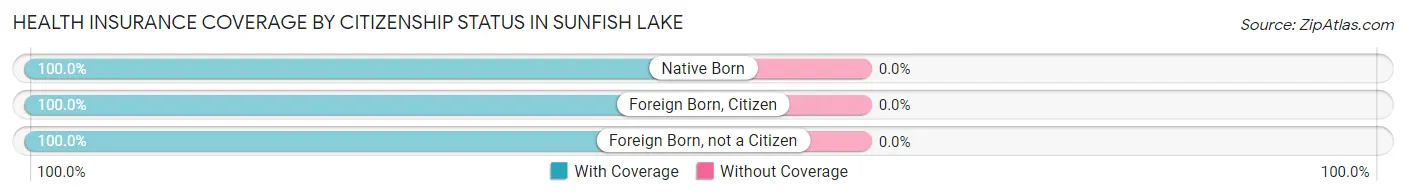
| Citizenship Status | With Coverage | Without Coverage |
| Native Born | 27 (100.0%) | 0 (0.0%) |
| Foreign Born, Citizen | 137 (100.0%) | 0 (0.0%) |
| Foreign Born, not a Citizen | 27 (100.0%) | 0 (0.0%) |
Health Insurance Coverage by Household Income in Sunfish Lake
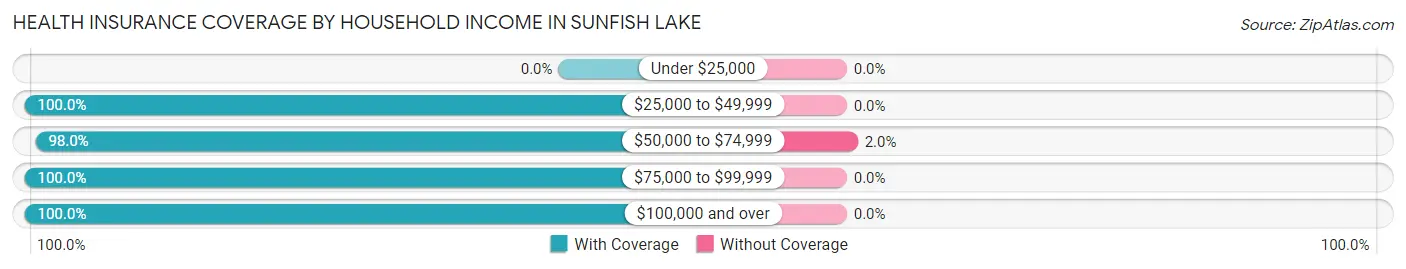
| Household Income | With Coverage | Without Coverage |
| Under $25,000 | 0 (0.0%) | 0 (0.0%) |
| $25,000 to $49,999 | 2 (100.0%) | 0 (0.0%) |
| $50,000 to $74,999 | 48 (98.0%) | 1 (2.0%) |
| $75,000 to $99,999 | 21 (100.0%) | 0 (0.0%) |
| $100,000 and over | 481 (100.0%) | 0 (0.0%) |
Public vs Private Health Insurance Coverage by Age in Sunfish Lake
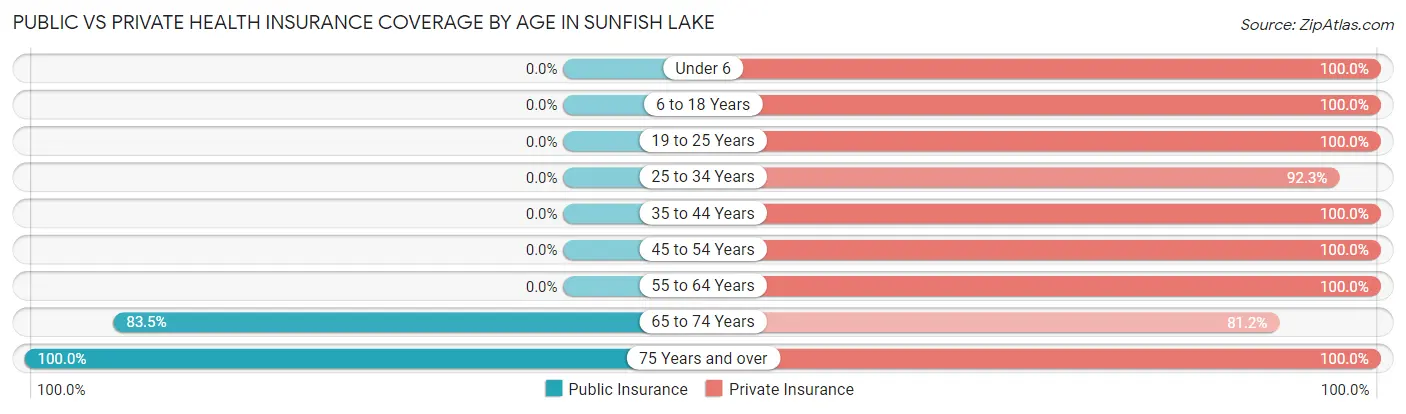
| Age Bracket | Public Insurance | Private Insurance |
| Under 6 | 0 (0.0%) | 27 (100.0%) |
| 6 to 18 Years | 0 (0.0%) | 137 (100.0%) |
| 19 to 25 Years | 0 (0.0%) | 27 (100.0%) |
| 25 to 34 Years | 0 (0.0%) | 12 (92.3%) |
| 35 to 44 Years | 0 (0.0%) | 74 (100.0%) |
| 45 to 54 Years | 0 (0.0%) | 68 (100.0%) |
| 55 to 64 Years | 0 (0.0%) | 90 (100.0%) |
| 65 to 74 Years | 71 (83.5%) | 69 (81.2%) |
| 75 Years and over | 32 (100.0%) | 32 (100.0%) |
| Total | 103 (18.6%) | 536 (96.9%) |
Disability Status by Sex by Age in Sunfish Lake
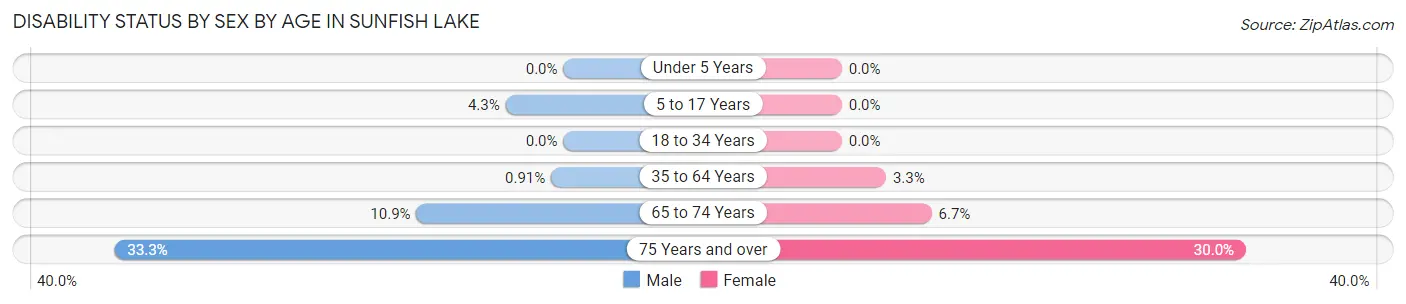
| Age Bracket | Male | Female |
| Under 5 Years | 0 (0.0%) | 0 (0.0%) |
| 5 to 17 Years | 3 (4.3%) | 0 (0.0%) |
| 18 to 34 Years | 0 (0.0%) | 0 (0.0%) |
| 35 to 64 Years | 1 (0.9%) | 4 (3.3%) |
| 65 to 74 Years | 6 (10.9%) | 2 (6.7%) |
| 75 Years and over | 4 (33.3%) | 6 (30.0%) |
Disability Class by Sex by Age in Sunfish Lake
Disability Class: Hearing Difficulty
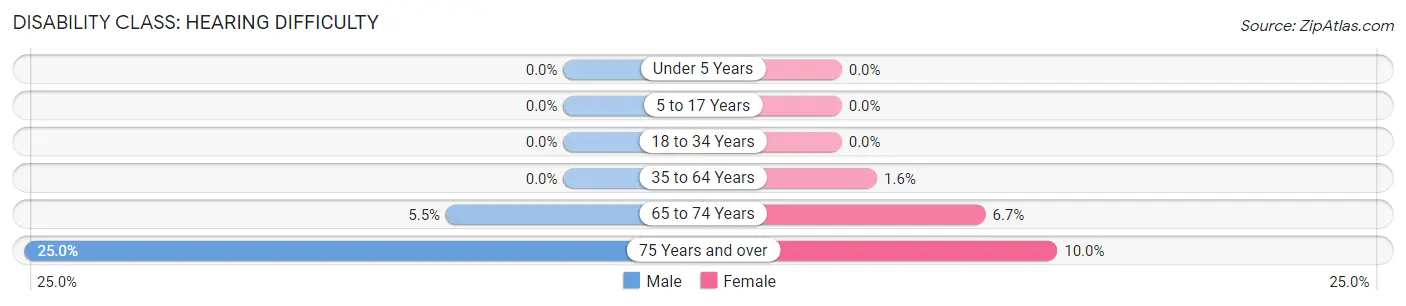
| Age Bracket | Male | Female |
| Under 5 Years | 0 (0.0%) | 0 (0.0%) |
| 5 to 17 Years | 0 (0.0%) | 0 (0.0%) |
| 18 to 34 Years | 0 (0.0%) | 0 (0.0%) |
| 35 to 64 Years | 0 (0.0%) | 2 (1.6%) |
| 65 to 74 Years | 3 (5.4%) | 2 (6.7%) |
| 75 Years and over | 3 (25.0%) | 2 (10.0%) |
Disability Class: Vision Difficulty
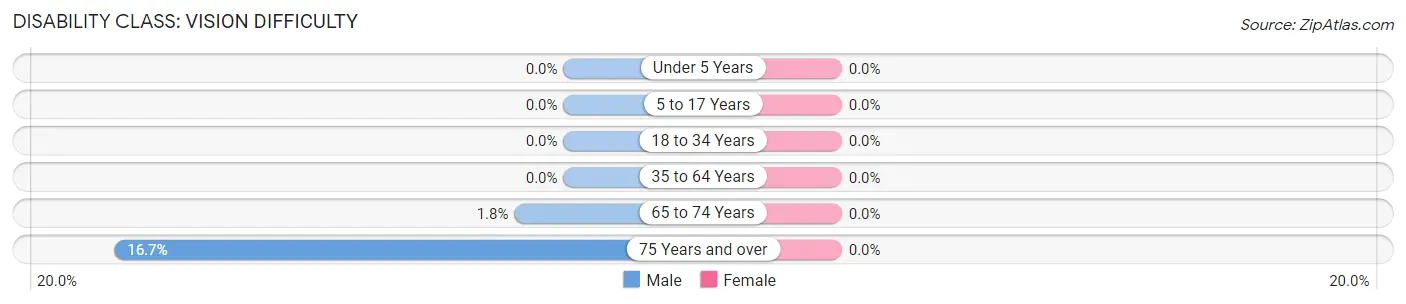
| Age Bracket | Male | Female |
| Under 5 Years | 0 (0.0%) | 0 (0.0%) |
| 5 to 17 Years | 0 (0.0%) | 0 (0.0%) |
| 18 to 34 Years | 0 (0.0%) | 0 (0.0%) |
| 35 to 64 Years | 0 (0.0%) | 0 (0.0%) |
| 65 to 74 Years | 1 (1.8%) | 0 (0.0%) |
| 75 Years and over | 2 (16.7%) | 0 (0.0%) |
Disability Class: Cognitive Difficulty
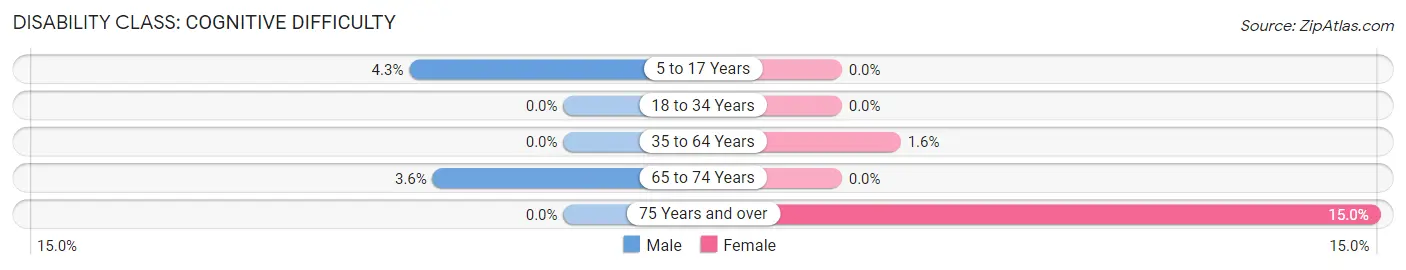
| Age Bracket | Male | Female |
| 5 to 17 Years | 3 (4.3%) | 0 (0.0%) |
| 18 to 34 Years | 0 (0.0%) | 0 (0.0%) |
| 35 to 64 Years | 0 (0.0%) | 2 (1.6%) |
| 65 to 74 Years | 2 (3.6%) | 0 (0.0%) |
| 75 Years and over | 0 (0.0%) | 3 (15.0%) |
Disability Class: Ambulatory Difficulty
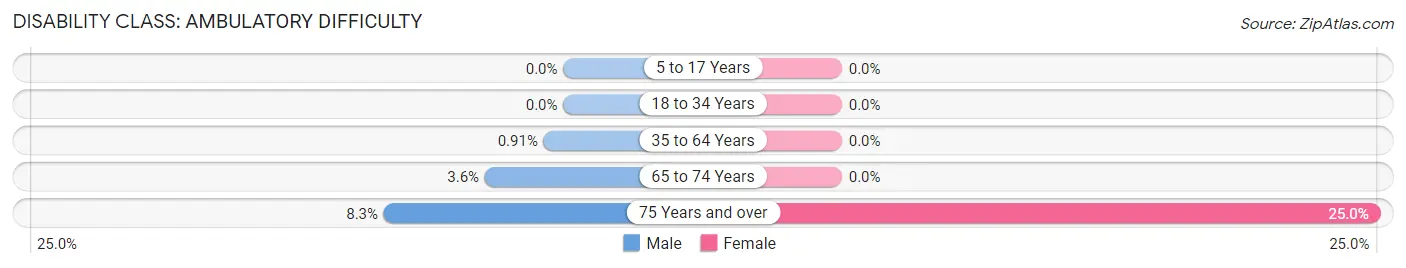
| Age Bracket | Male | Female |
| 5 to 17 Years | 0 (0.0%) | 0 (0.0%) |
| 18 to 34 Years | 0 (0.0%) | 0 (0.0%) |
| 35 to 64 Years | 1 (0.9%) | 0 (0.0%) |
| 65 to 74 Years | 2 (3.6%) | 0 (0.0%) |
| 75 Years and over | 1 (8.3%) | 5 (25.0%) |
Disability Class: Self-Care Difficulty
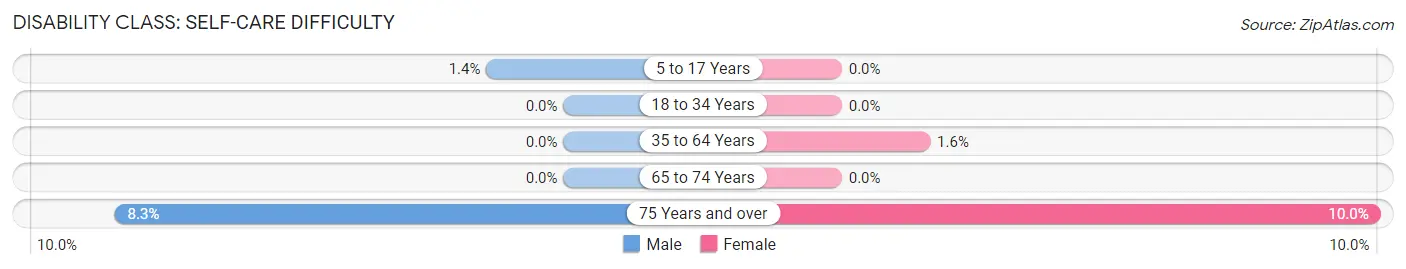
| Age Bracket | Male | Female |
| 5 to 17 Years | 1 (1.4%) | 0 (0.0%) |
| 18 to 34 Years | 0 (0.0%) | 0 (0.0%) |
| 35 to 64 Years | 0 (0.0%) | 2 (1.6%) |
| 65 to 74 Years | 0 (0.0%) | 0 (0.0%) |
| 75 Years and over | 1 (8.3%) | 2 (10.0%) |
Technology Access in Sunfish Lake
Computing Device Access in Sunfish Lake
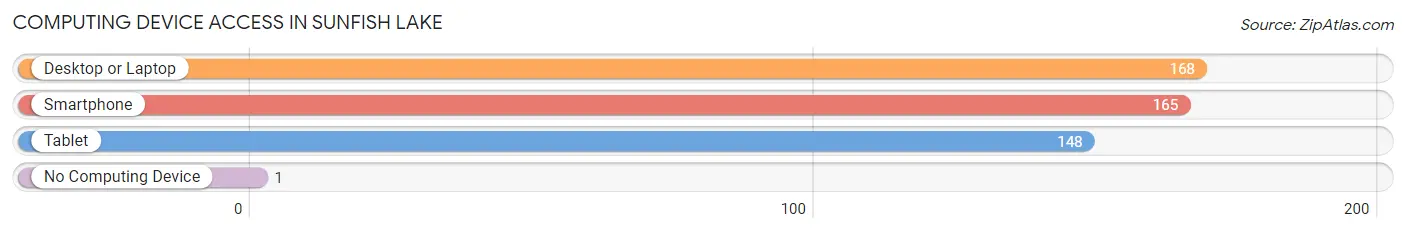
| Device Type | # Households | % Households |
| Desktop or Laptop | 168 | 98.3% |
| Smartphone | 165 | 96.5% |
| Tablet | 148 | 86.6% |
| No Computing Device | 1 | 0.6% |
| Total | 171 | 100.0% |
Internet Access in Sunfish Lake
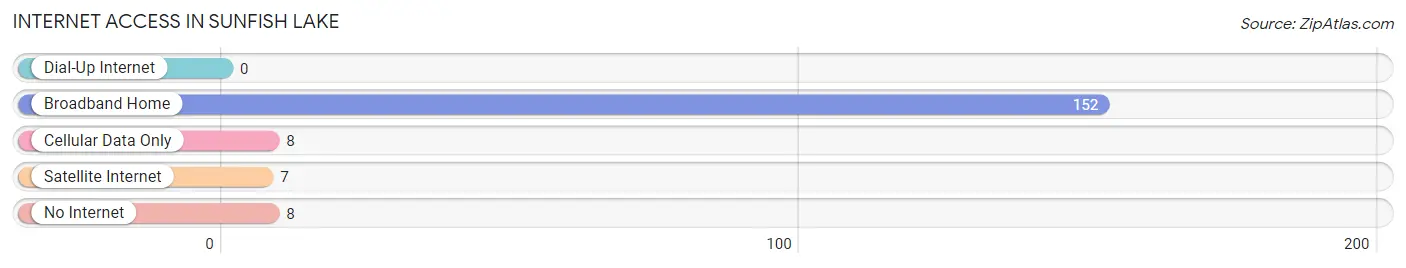
| Internet Type | # Households | % Households |
| Dial-Up Internet | 0 | 0.0% |
| Broadband Home | 152 | 88.9% |
| Cellular Data Only | 8 | 4.7% |
| Satellite Internet | 7 | 4.1% |
| No Internet | 8 | 4.7% |
| Total | 171 | 100.0% |
Sunfish Lake Summary
Sunfish Lake, Minnesota is a small city located in the northern part of the state, just south of the Twin Cities metropolitan area. It is a small, rural community with a population of just over 1,000 people. The city is located in Dakota County and is part of the Minneapolis-St. Paul-Bloomington Metropolitan Statistical Area.
Geography
Sunfish Lake is located in the northern part of Dakota County, Minnesota. It is situated on the western shore of Sunfish Lake, a small lake that is part of the Mississippi River watershed. The city is bordered by the cities of Mendota Heights and Eagan to the north, and the cities of Rosemount and Apple Valley to the south. The city is located approximately 20 miles south of the Twin Cities metropolitan area.
The city is located in a region of rolling hills and wooded areas. The terrain is mostly flat, with some areas of higher elevation. The city is located in a temperate climate, with hot summers and cold winters.
History
Sunfish Lake was first settled in the late 1800s by a group of settlers from Sweden. The settlers were attracted to the area due to its proximity to the Twin Cities and its abundance of natural resources. The city was officially incorporated in 1887.
The city was named after the nearby Sunfish Lake, which was named by the Native Americans who lived in the area. The lake was a popular fishing spot for the Native Americans, and the settlers adopted the name for the city.
The city grew slowly over the years, and by the early 1900s, it had become a popular summer destination for city dwellers from the Twin Cities. The city was known for its natural beauty and its abundance of outdoor activities.
Economy
Sunfish Lake has a small, but diverse economy. The city is home to a variety of businesses, including retail stores, restaurants, and professional services. The city is also home to a number of small manufacturing companies.
The city is also home to a number of small farms, which produce a variety of crops, including corn, soybeans, and hay. The city is also home to a number of wineries, which produce a variety of wines.
Demographics
As of the 2010 census, the population of Sunfish Lake was 1,072. The population is predominantly white, with a small percentage of African Americans, Asians, and Hispanics. The median household income is $76,250, and the median home value is $310,000.
The city is served by the Sunfish Lake School District, which includes two elementary schools, one middle school, and one high school. The city is also home to a number of churches, including the Sunfish Lake Lutheran Church.
Conclusion
Sunfish Lake, Minnesota is a small, rural city located in the northern part of the state. The city is home to a diverse economy and a population of just over 1,000 people. The city is known for its natural beauty and its abundance of outdoor activities. The city is served by the Sunfish Lake School District and is home to a number of churches.
Common Questions
What is Per Capita Income in Sunfish Lake?
Per Capita income in Sunfish Lake is $120,771.
What is the Median Family Income in Sunfish Lake?
Median Family Income in Sunfish Lake is $250,001.
What is the Median Household income in Sunfish Lake?
Median Household Income in Sunfish Lake is $250,001.
What is Income or Wage Gap in Sunfish Lake?
Income or Wage Gap in Sunfish Lake is 65.7%.
Women in Sunfish Lake earn 34.3 cents for every dollar earned by a man.
What is Inequality or Gini Index in Sunfish Lake?
Inequality or Gini Index in Sunfish Lake is 0.44.
What is the Total Population of Sunfish Lake?
Total Population of Sunfish Lake is 553.
What is the Total Male Population of Sunfish Lake?
Total Male Population of Sunfish Lake is 290.
What is the Total Female Population of Sunfish Lake?
Total Female Population of Sunfish Lake is 263.
What is the Ratio of Males per 100 Females in Sunfish Lake?
There are 110.27 Males per 100 Females in Sunfish Lake.
What is the Ratio of Females per 100 Males in Sunfish Lake?
There are 90.69 Females per 100 Males in Sunfish Lake.
What is the Median Population Age in Sunfish Lake?
Median Population Age in Sunfish Lake is 44.3 Years.
What is the Average Family Size in Sunfish Lake
Average Family Size in Sunfish Lake is 3.4 People.
What is the Average Household Size in Sunfish Lake
Average Household Size in Sunfish Lake is 3.2 People.
How Large is the Labor Force in Sunfish Lake?
There are 265 People in the Labor Forcein in Sunfish Lake.
What is the Percentage of People in the Labor Force in Sunfish Lake?
61.3% of People are in the Labor Force in Sunfish Lake.
What is the Unemployment Rate in Sunfish Lake?
Unemployment Rate in Sunfish Lake is 1.1%.