Pinch, WV Map & Demographics
Pinch Map
Pinch Overview
$34,114
PER CAPITA INCOME
$92,885
AVG FAMILY INCOME
$73,973
AVG HOUSEHOLD INCOME
12.2%
WAGE / INCOME GAP [ % ]
87.8¢/ $1
WAGE / INCOME GAP [ $ ]
0.42
INEQUALITY / GINI INDEX
4,015
TOTAL POPULATION
1,720
MALE POPULATION
2,295
FEMALE POPULATION
74.95
MALES / 100 FEMALES
133.43
FEMALES / 100 MALES
50.2
MEDIAN AGE
3.4
AVG FAMILY SIZE
2.9
AVG HOUSEHOLD SIZE
1,497
LABOR FORCE [ PEOPLE ]
50.0%
PERCENT IN LABOR FORCE
1.8%
UNEMPLOYMENT RATE
Pinch Zip Codes
Pinch Area Codes
Income in Pinch
Income Overview in Pinch
Per Capita Income in Pinch is $34,114, while median incomes of families and households are $92,885 and $73,973 respectively.
| Characteristic | Number | Measure |
| Per Capita Income | 4,015 | $34,114 |
| Median Family Income | 1,074 | $92,885 |
| Mean Family Income | 1,074 | $115,889 |
| Median Household Income | 1,386 | $73,973 |
| Mean Household Income | 1,386 | $98,017 |
| Income Deficit | 1,074 | $0 |
| Wage / Income Gap (%) | 4,015 | 12.18% |
| Wage / Income Gap ($) | 4,015 | 87.82¢ per $1 |
| Gini / Inequality Index | 4,015 | 0.42 |
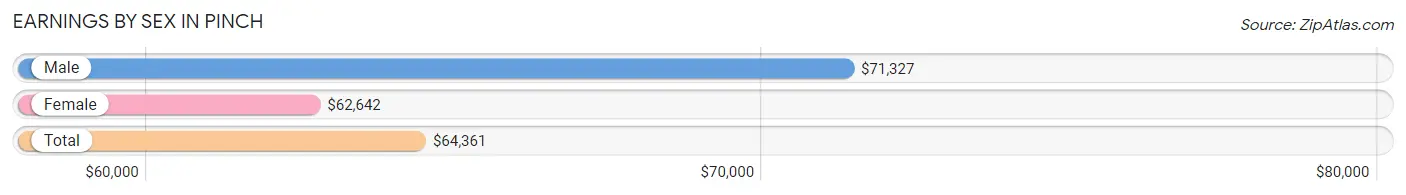
Earnings by Sex in Pinch
Average Earnings in Pinch are $64,361, $71,327 for men and $62,642 for women, a difference of 12.2%.
| Sex | Number | Average Earnings |
| Male | 897 (56.5%) | $71,327 |
| Female | 692 (43.5%) | $62,642 |
| Total | 1,589 (100.0%) | $64,361 |
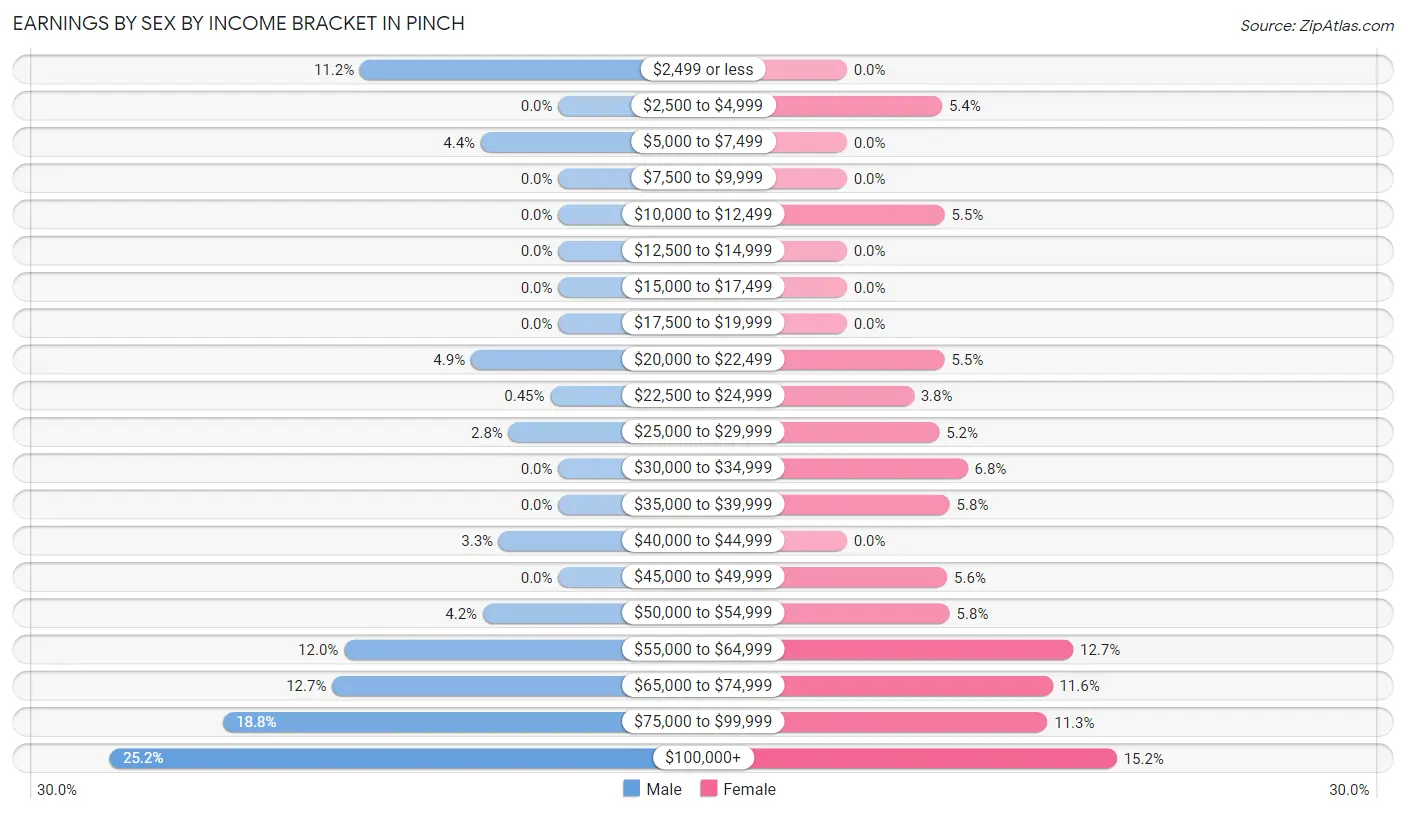
Earnings by Sex by Income Bracket in Pinch
The most common earnings brackets in Pinch are $100,000+ for men (226 | 25.2%) and $100,000+ for women (105 | 15.2%).
| Income | Male | Female |
| $2,499 or less | 100 (11.2%) | 0 (0.0%) |
| $2,500 to $4,999 | 0 (0.0%) | 37 (5.3%) |
| $5,000 to $7,499 | 39 (4.3%) | 0 (0.0%) |
| $7,500 to $9,999 | 0 (0.0%) | 0 (0.0%) |
| $10,000 to $12,499 | 0 (0.0%) | 38 (5.5%) |
| $12,500 to $14,999 | 0 (0.0%) | 0 (0.0%) |
| $15,000 to $17,499 | 0 (0.0%) | 0 (0.0%) |
| $17,500 to $19,999 | 0 (0.0%) | 0 (0.0%) |
| $20,000 to $22,499 | 44 (4.9%) | 38 (5.5%) |
| $22,500 to $24,999 | 4 (0.4%) | 26 (3.8%) |
| $25,000 to $29,999 | 25 (2.8%) | 36 (5.2%) |
| $30,000 to $34,999 | 0 (0.0%) | 47 (6.8%) |
| $35,000 to $39,999 | 0 (0.0%) | 40 (5.8%) |
| $40,000 to $44,999 | 30 (3.3%) | 0 (0.0%) |
| $45,000 to $49,999 | 0 (0.0%) | 39 (5.6%) |
| $50,000 to $54,999 | 38 (4.2%) | 40 (5.8%) |
| $55,000 to $64,999 | 108 (12.0%) | 88 (12.7%) |
| $65,000 to $74,999 | 114 (12.7%) | 80 (11.6%) |
| $75,000 to $99,999 | 169 (18.8%) | 78 (11.3%) |
| $100,000+ | 226 (25.2%) | 105 (15.2%) |
| Total | 897 (100.0%) | 692 (100.0%) |
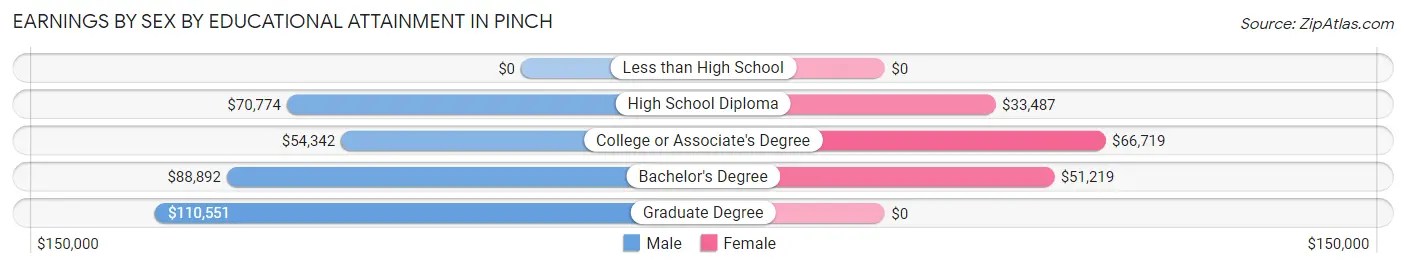
Earnings by Sex by Educational Attainment in Pinch
Average earnings in Pinch are $72,478 for men and $62,642 for women, a difference of 13.6%. Men with an educational attainment of graduate degree enjoy the highest average annual earnings of $110,551, while those with college or associate's degree education earn the least with $54,342. Women with an educational attainment of college or associate's degree earn the most with the average annual earnings of $66,719, while those with high school diploma education have the smallest earnings of $33,487.
| Educational Attainment | Male Income | Female Income |
| Less than High School | - | - |
| High School Diploma | $70,774 | $33,487 |
| College or Associate's Degree | $54,342 | $66,719 |
| Bachelor's Degree | $88,892 | $51,219 |
| Graduate Degree | $110,551 | $0 |
| Total | $72,478 | $62,642 |
Family Income in Pinch
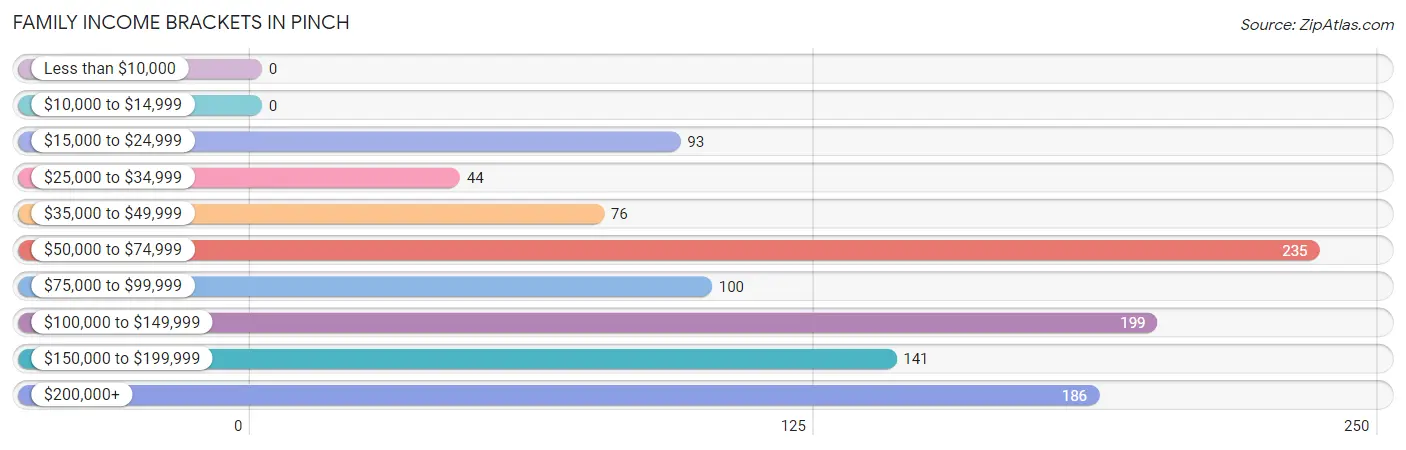
Family Income Brackets in Pinch
According to the Pinch family income data, there are 235 families falling into the $50,000 to $74,999 income range, which is the most common income bracket and makes up 21.9% of all families.
| Income Bracket | # Families | % Families |
| Less than $10,000 | 0 | 0.0% |
| $10,000 to $14,999 | 0 | 0.0% |
| $15,000 to $24,999 | 93 | 8.7% |
| $25,000 to $34,999 | 44 | 4.1% |
| $35,000 to $49,999 | 76 | 7.1% |
| $50,000 to $74,999 | 235 | 21.9% |
| $75,000 to $99,999 | 100 | 9.3% |
| $100,000 to $149,999 | 199 | 18.5% |
| $150,000 to $199,999 | 141 | 13.1% |
| $200,000+ | 186 | 17.3% |
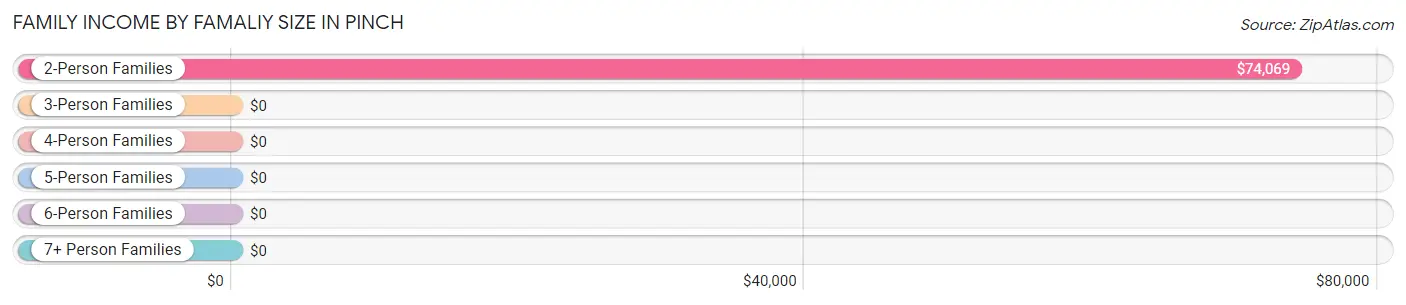
Family Income by Famaliy Size in Pinch
2-person families (507 | 47.2%) account for the highest median family income in Pinch with $74,069 per family, while 2-person families (507 | 47.2%) have the highest median income of $37,034 per family member.
| Income Bracket | # Families | Median Income |
| 2-Person Families | 507 (47.2%) | $74,069 |
| 3-Person Families | 328 (30.5%) | $0 |
| 4-Person Families | 135 (12.6%) | $0 |
| 5-Person Families | 40 (3.7%) | $0 |
| 6-Person Families | 0 (0.0%) | $0 |
| 7+ Person Families | 64 (6.0%) | $0 |
| Total | 1,074 (100.0%) | $92,885 |
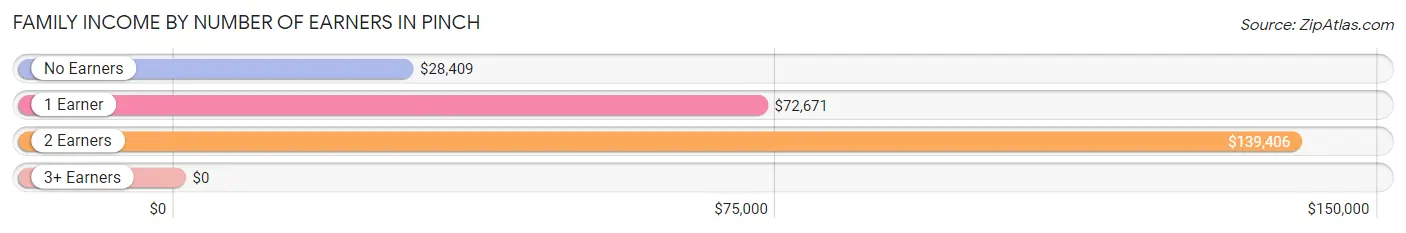
Family Income by Number of Earners in Pinch
| Number of Earners | # Families | Median Income |
| No Earners | 218 (20.3%) | $28,409 |
| 1 Earner | 394 (36.7%) | $72,671 |
| 2 Earners | 357 (33.2%) | $139,406 |
| 3+ Earners | 105 (9.8%) | $0 |
| Total | 1,074 (100.0%) | $92,885 |
Household Income in Pinch
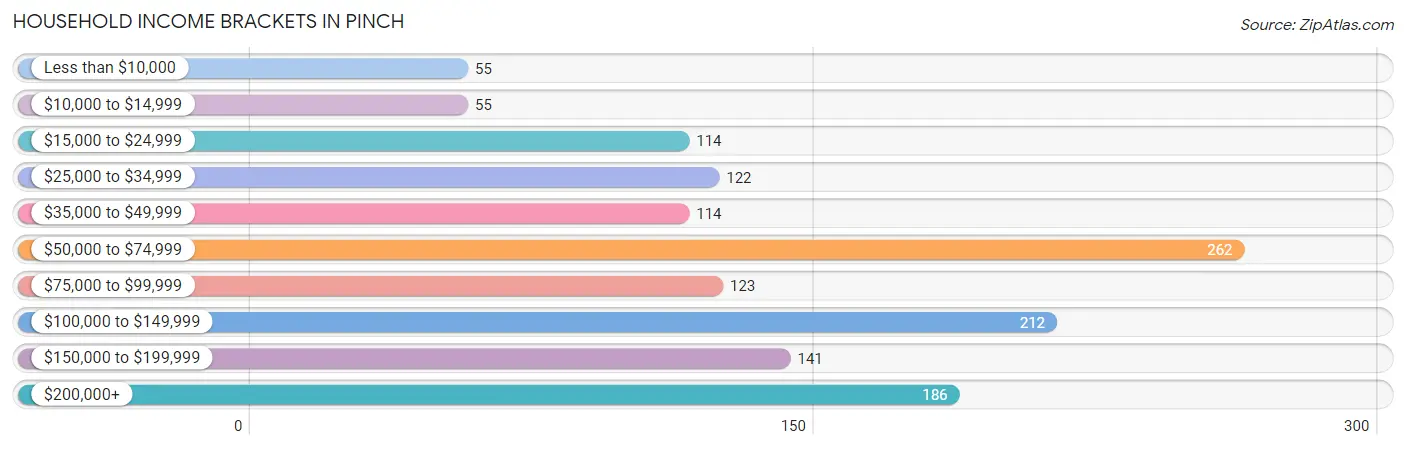
Household Income Brackets in Pinch
With 262 households falling in the category, the $50,000 to $74,999 income range is the most frequent in Pinch, accounting for 18.9% of all households. In contrast, only 55 households (4.0%) fall into the less than $10,000 income bracket, making it the least populous group.
| Income Bracket | # Households | % Households |
| Less than $10,000 | 55 | 4.0% |
| $10,000 to $14,999 | 55 | 4.0% |
| $15,000 to $24,999 | 114 | 8.2% |
| $25,000 to $34,999 | 122 | 8.8% |
| $35,000 to $49,999 | 114 | 8.2% |
| $50,000 to $74,999 | 262 | 18.9% |
| $75,000 to $99,999 | 123 | 8.9% |
| $100,000 to $149,999 | 212 | 15.3% |
| $150,000 to $199,999 | 141 | 10.2% |
| $200,000+ | 186 | 13.4% |
Household Income by Householder Age in Pinch
The median household income in Pinch is $73,973, with the highest median household income of $124,031 found in the 25 to 44 years age bracket for the primary householder. A total of 309 households (22.3%) fall into this category.
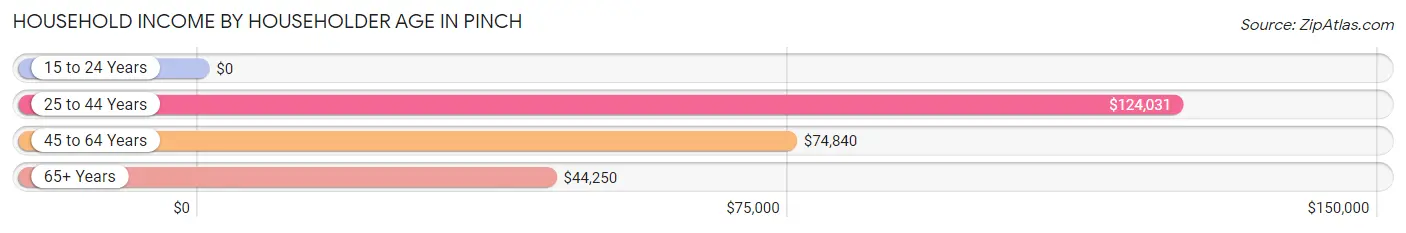
| Income Bracket | # Households | Median Income |
| 15 to 24 Years | 0 (0.0%) | $0 |
| 25 to 44 Years | 309 (22.3%) | $124,031 |
| 45 to 64 Years | 436 (31.5%) | $74,840 |
| 65+ Years | 641 (46.3%) | $44,250 |
| Total | 1,386 (100.0%) | $73,973 |
Poverty in Pinch
Income Below Poverty by Sex and Age in Pinch
With 0.3% poverty level for males and 4.7% for females among the residents of Pinch, 55 to 64 year old males and 65 to 74 year old females are the most vulnerable to poverty, with 5 males (2.2%) and 55 females (14.0%) in their respective age groups living below the poverty level.
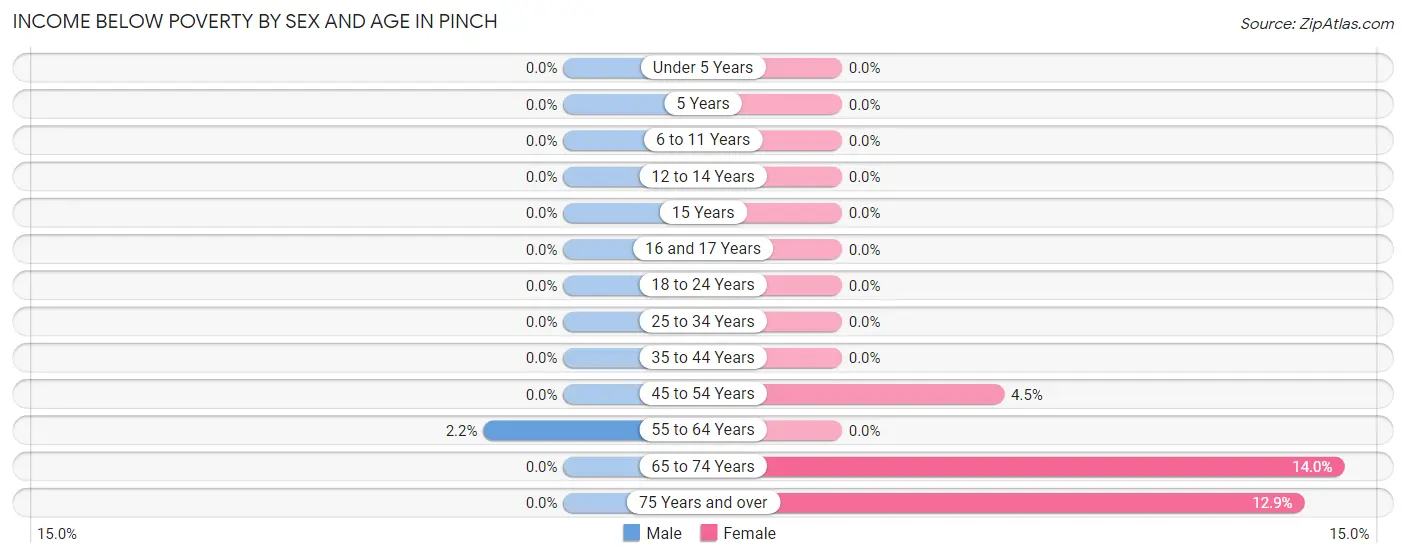
| Age Bracket | Male | Female |
| Under 5 Years | 0 (0.0%) | 0 (0.0%) |
| 5 Years | 0 (0.0%) | 0 (0.0%) |
| 6 to 11 Years | 0 (0.0%) | 0 (0.0%) |
| 12 to 14 Years | 0 (0.0%) | 0 (0.0%) |
| 15 Years | 0 (0.0%) | 0 (0.0%) |
| 16 and 17 Years | 0 (0.0%) | 0 (0.0%) |
| 18 to 24 Years | 0 (0.0%) | 0 (0.0%) |
| 25 to 34 Years | 0 (0.0%) | 0 (0.0%) |
| 35 to 44 Years | 0 (0.0%) | 0 (0.0%) |
| 45 to 54 Years | 0 (0.0%) | 14 (4.5%) |
| 55 to 64 Years | 5 (2.2%) | 0 (0.0%) |
| 65 to 74 Years | 0 (0.0%) | 55 (14.0%) |
| 75 Years and over | 0 (0.0%) | 38 (12.9%) |
| Total | 5 (0.3%) | 107 (4.7%) |
Income Above Poverty by Sex and Age in Pinch
According to the poverty statistics in Pinch, males aged 6 to 11 years and females aged under 5 years are the age groups that are most secure financially, with 100.0% of males and 100.0% of females in these age groups living above the poverty line.
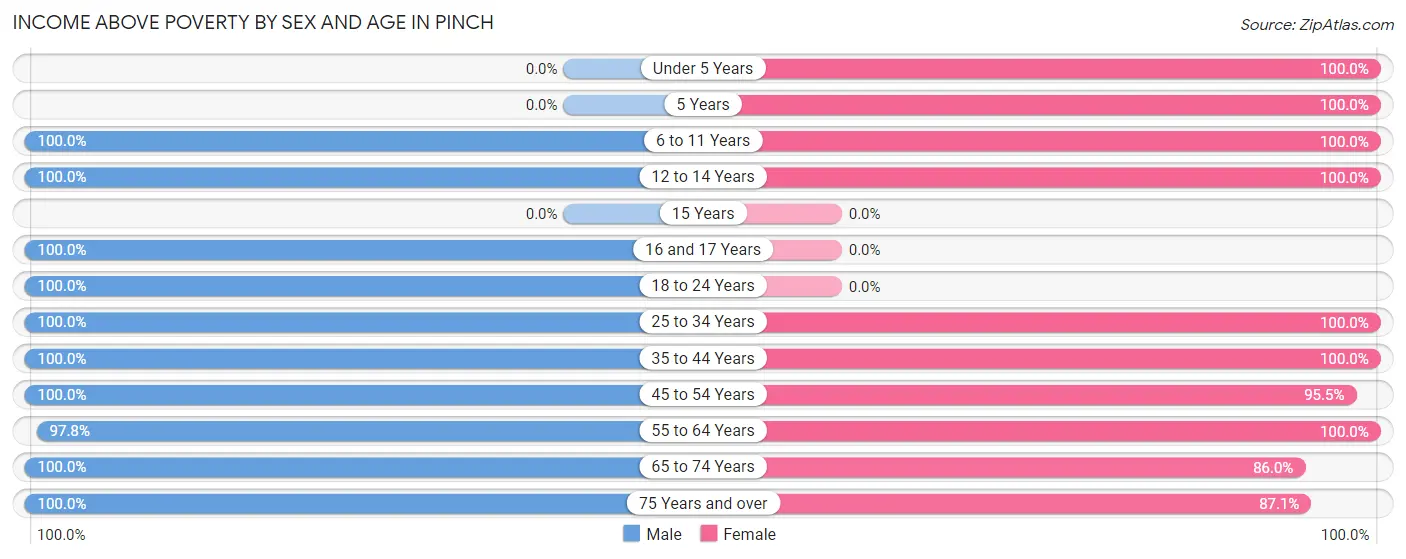
| Age Bracket | Male | Female |
| Under 5 Years | 0 (0.0%) | 367 (100.0%) |
| 5 Years | 0 (0.0%) | 34 (100.0%) |
| 6 to 11 Years | 295 (100.0%) | 221 (100.0%) |
| 12 to 14 Years | 48 (100.0%) | 56 (100.0%) |
| 15 Years | 0 (0.0%) | 0 (0.0%) |
| 16 and 17 Years | 116 (100.0%) | 0 (0.0%) |
| 18 to 24 Years | 39 (100.0%) | 0 (0.0%) |
| 25 to 34 Years | 129 (100.0%) | 160 (100.0%) |
| 35 to 44 Years | 182 (100.0%) | 153 (100.0%) |
| 45 to 54 Years | 230 (100.0%) | 296 (95.5%) |
| 55 to 64 Years | 219 (97.8%) | 306 (100.0%) |
| 65 to 74 Years | 279 (100.0%) | 338 (86.0%) |
| 75 Years and over | 178 (100.0%) | 257 (87.1%) |
| Total | 1,715 (99.7%) | 2,188 (95.3%) |
Income Below Poverty Among Married-Couple Families in Pinch
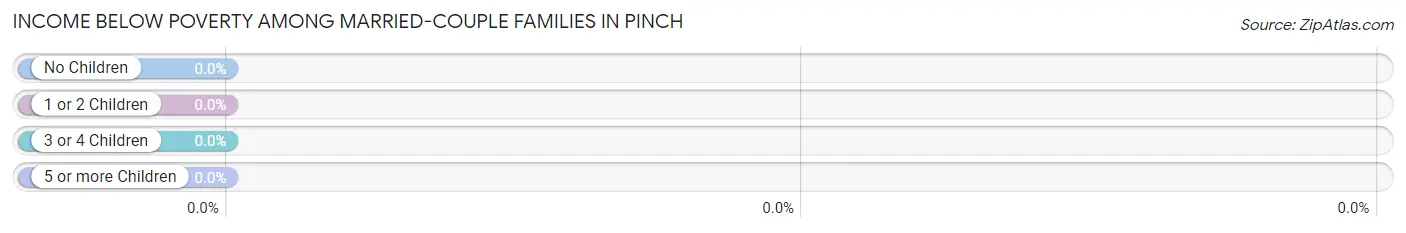
| Children | Above Poverty | Below Poverty |
| No Children | 500 (100.0%) | 0 (0.0%) |
| 1 or 2 Children | 221 (100.0%) | 0 (0.0%) |
| 3 or 4 Children | 104 (100.0%) | 0 (0.0%) |
| 5 or more Children | 0 (0.0%) | 0 (0.0%) |
| Total | 825 (100.0%) | 0 (0.0%) |
Income Below Poverty Among Single-Parent Households in Pinch
| Children | Single Father | Single Mother |
| No Children | 0 (0.0%) | 0 (0.0%) |
| 1 or 2 Children | 0 (0.0%) | 0 (0.0%) |
| 3 or 4 Children | 0 (0.0%) | 0 (0.0%) |
| 5 or more Children | 0 (0.0%) | 0 (0.0%) |
| Total | 0 (0.0%) | 0 (0.0%) |
Income Below Poverty Among Married-Couple vs Single-Parent Households in Pinch
| Children | Married-Couple Families | Single-Parent Households |
| No Children | 0 (0.0%) | 0 (0.0%) |
| 1 or 2 Children | 0 (0.0%) | 0 (0.0%) |
| 3 or 4 Children | 0 (0.0%) | 0 (0.0%) |
| 5 or more Children | 0 (0.0%) | 0 (0.0%) |
| Total | 0 (0.0%) | 0 (0.0%) |
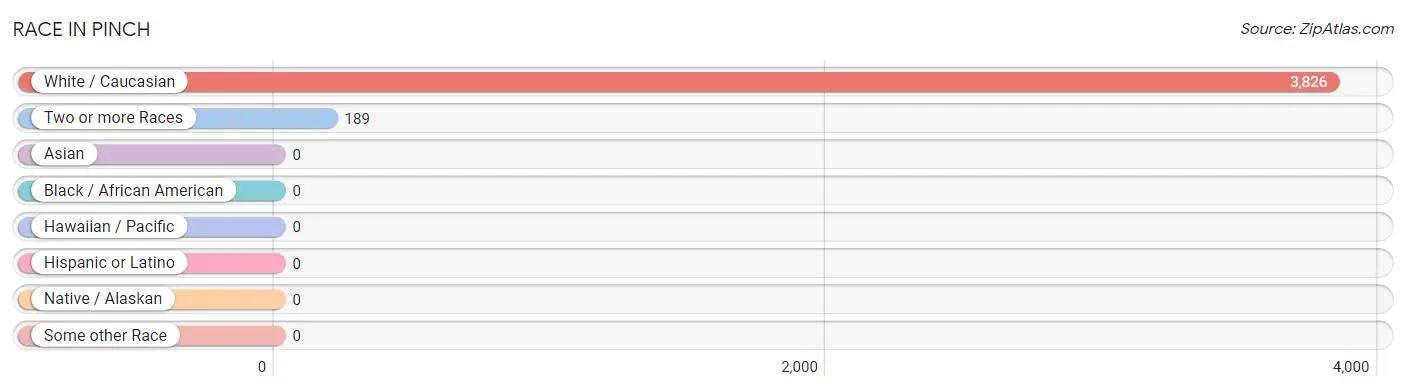
Race in Pinch
The most populous races in Pinch are White / Caucasian (3,826 | 95.3%), and Two or more Races (189 | 4.7%).
| Race | # Population | % Population |
| Asian | 0 | 0.0% |
| Black / African American | 0 | 0.0% |
| Hawaiian / Pacific | 0 | 0.0% |
| Hispanic or Latino | 0 | 0.0% |
| Native / Alaskan | 0 | 0.0% |
| White / Caucasian | 3,826 | 95.3% |
| Two or more Races | 189 | 4.7% |
| Some other Race | 0 | 0.0% |
| Total | 4,015 | 100.0% |
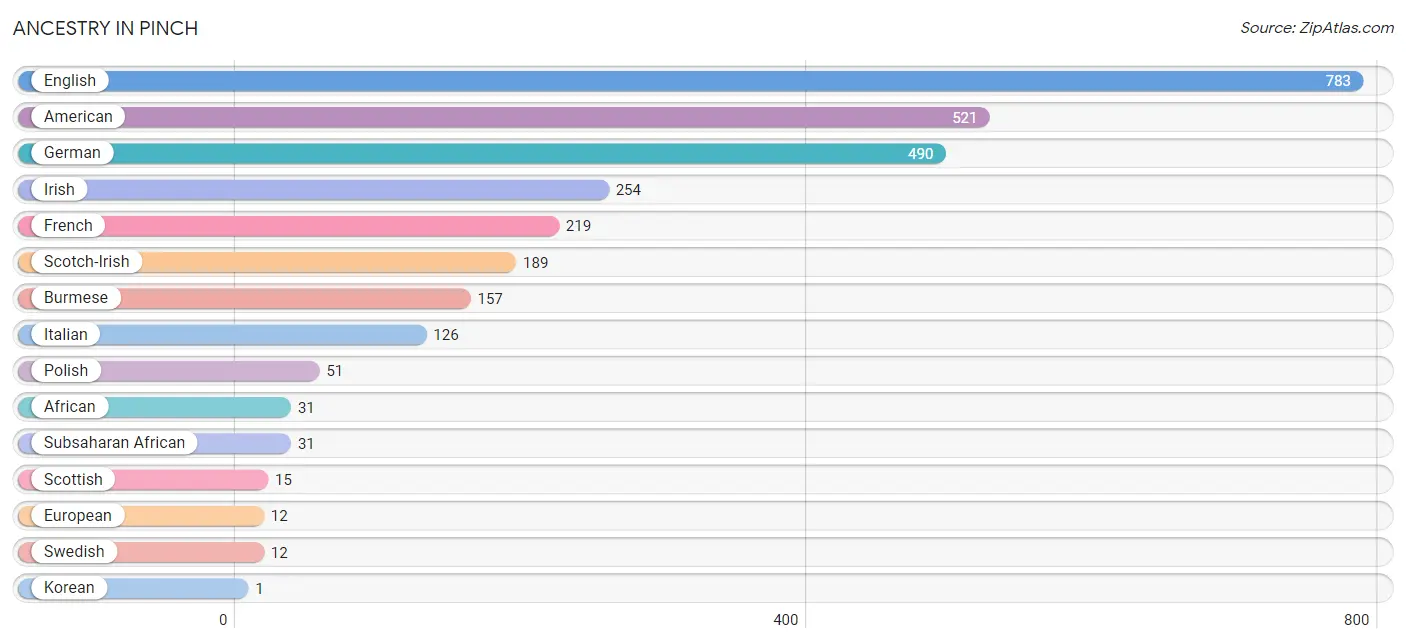
Ancestry in Pinch
The most populous ancestries reported in Pinch are English (783 | 19.5%), American (521 | 13.0%), German (490 | 12.2%), Irish (254 | 6.3%), and French (219 | 5.4%), together accounting for 56.5% of all Pinch residents.
| Ancestry | # Population | % Population |
| African | 31 | 0.8% |
| American | 521 | 13.0% |
| Burmese | 157 | 3.9% |
| English | 783 | 19.5% |
| European | 12 | 0.3% |
| French | 219 | 5.4% |
| German | 490 | 12.2% |
| Irish | 254 | 6.3% |
| Italian | 126 | 3.1% |
| Korean | 1 | 0.0% |
| Polish | 51 | 1.3% |
| Scotch-Irish | 189 | 4.7% |
| Scottish | 15 | 0.4% |
| Subsaharan African | 31 | 0.8% |
| Swedish | 12 | 0.3% | View All 15 Rows |
Immigrants in Pinch
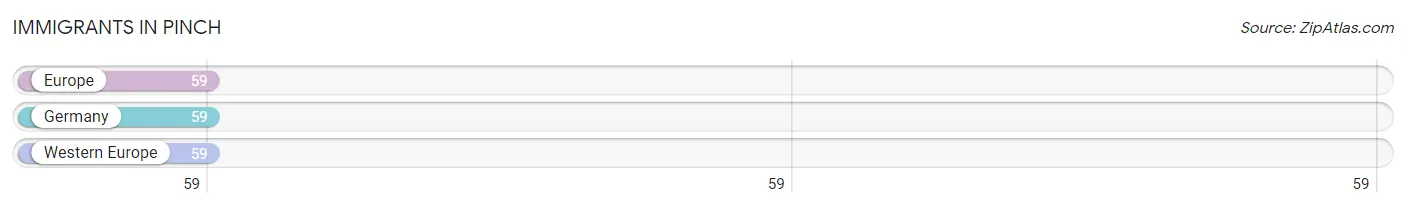
The most numerous immigrant groups reported in Pinch came from Europe (59 | 1.5%), Germany (59 | 1.5%), and Western Europe (59 | 1.5%), together accounting for 4.4% of all Pinch residents.
| Immigration Origin | # Population | % Population |
| Europe | 59 | 1.5% |
| Germany | 59 | 1.5% |
| Western Europe | 59 | 1.5% | View All 3 Rows |
Sex and Age in Pinch
Sex and Age in Pinch
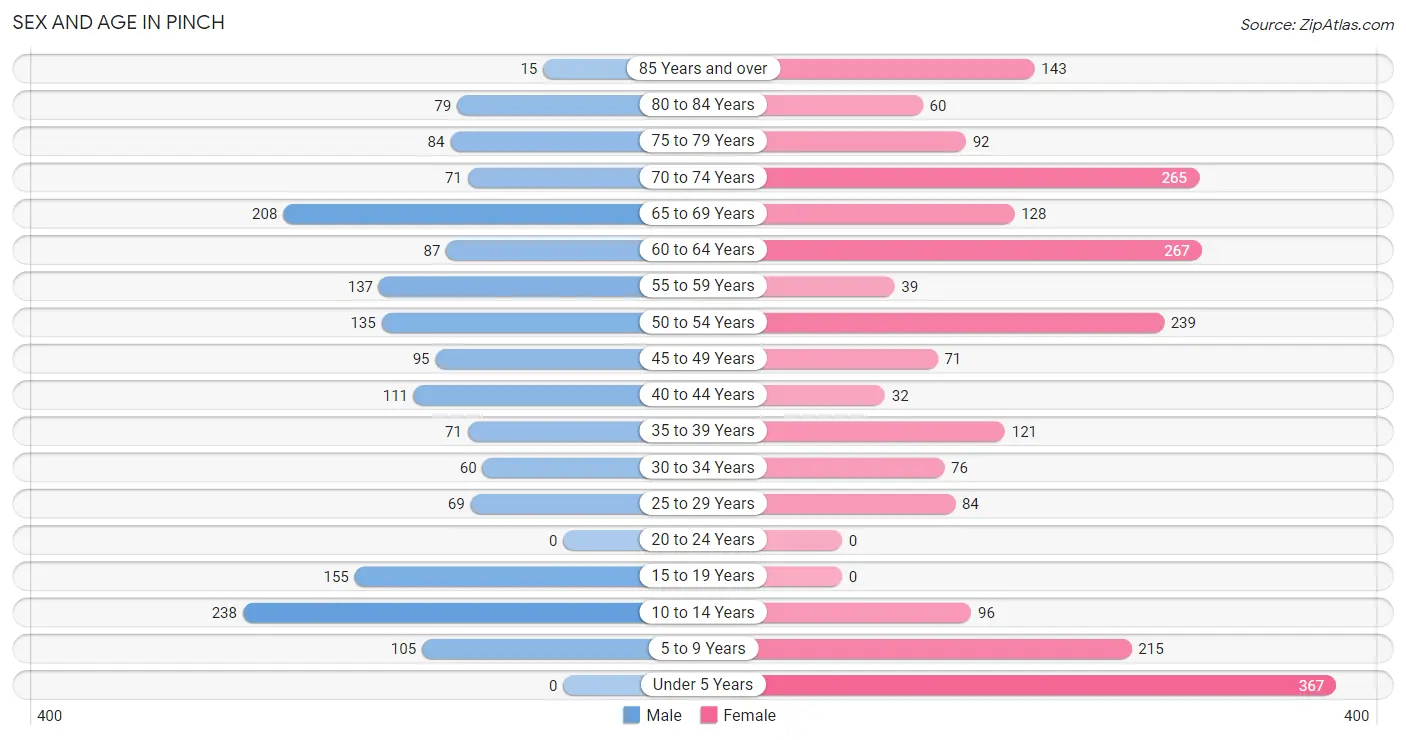
The most populous age groups in Pinch are 10 to 14 Years (238 | 13.8%) for men and Under 5 Years (367 | 16.0%) for women.
| Age Bracket | Male | Female |
| Under 5 Years | 0 (0.0%) | 367 (16.0%) |
| 5 to 9 Years | 105 (6.1%) | 215 (9.4%) |
| 10 to 14 Years | 238 (13.8%) | 96 (4.2%) |
| 15 to 19 Years | 155 (9.0%) | 0 (0.0%) |
| 20 to 24 Years | 0 (0.0%) | 0 (0.0%) |
| 25 to 29 Years | 69 (4.0%) | 84 (3.7%) |
| 30 to 34 Years | 60 (3.5%) | 76 (3.3%) |
| 35 to 39 Years | 71 (4.1%) | 121 (5.3%) |
| 40 to 44 Years | 111 (6.5%) | 32 (1.4%) |
| 45 to 49 Years | 95 (5.5%) | 71 (3.1%) |
| 50 to 54 Years | 135 (7.9%) | 239 (10.4%) |
| 55 to 59 Years | 137 (8.0%) | 39 (1.7%) |
| 60 to 64 Years | 87 (5.1%) | 267 (11.6%) |
| 65 to 69 Years | 208 (12.1%) | 128 (5.6%) |
| 70 to 74 Years | 71 (4.1%) | 265 (11.6%) |
| 75 to 79 Years | 84 (4.9%) | 92 (4.0%) |
| 80 to 84 Years | 79 (4.6%) | 60 (2.6%) |
| 85 Years and over | 15 (0.9%) | 143 (6.2%) |
| Total | 1,720 (100.0%) | 2,295 (100.0%) |
Families and Households in Pinch
Median Family Size in Pinch
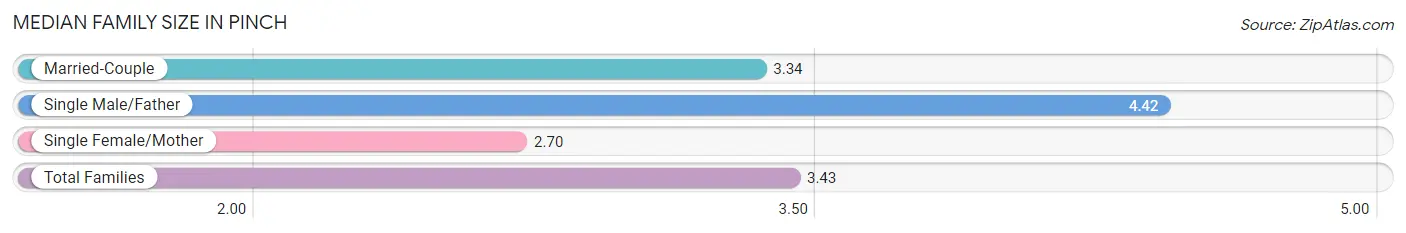
The median family size in Pinch is 3.43 persons per family, with single male/father families (146 | 13.6%) accounting for the largest median family size of 4.42 persons per family. On the other hand, single female/mother families (103 | 9.6%) represent the smallest median family size with 2.70 persons per family.
| Family Type | # Families | Family Size |
| Married-Couple | 825 (76.8%) | 3.34 |
| Single Male/Father | 146 (13.6%) | 4.42 |
| Single Female/Mother | 103 (9.6%) | 2.70 |
| Total Families | 1,074 (100.0%) | 3.43 |
Median Household Size in Pinch
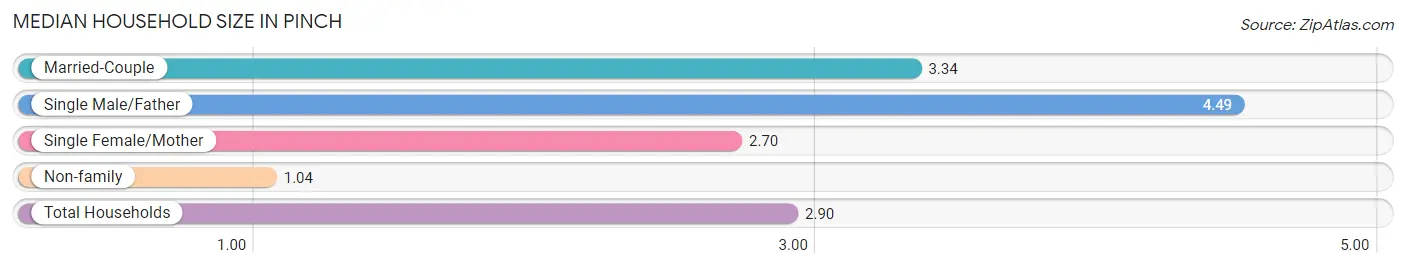
The median household size in Pinch is 2.90 persons per household, with single male/father households (146 | 10.5%) accounting for the largest median household size of 4.49 persons per household. non-family households (312 | 22.5%) represent the smallest median household size with 1.04 persons per household.
| Household Type | # Households | Household Size |
| Married-Couple | 825 (59.5%) | 3.34 |
| Single Male/Father | 146 (10.5%) | 4.49 |
| Single Female/Mother | 103 (7.4%) | 2.70 |
| Non-family | 312 (22.5%) | 1.04 |
| Total Households | 1,386 (100.0%) | 2.90 |
Household Size by Marriage Status in Pinch
Out of a total of 1,386 households in Pinch, 1,074 (77.5%) are family households, while 312 (22.5%) are nonfamily households. The most numerous type of family households are 2-person households, comprising 507, and the most common type of nonfamily households are 1-person households, comprising 297.
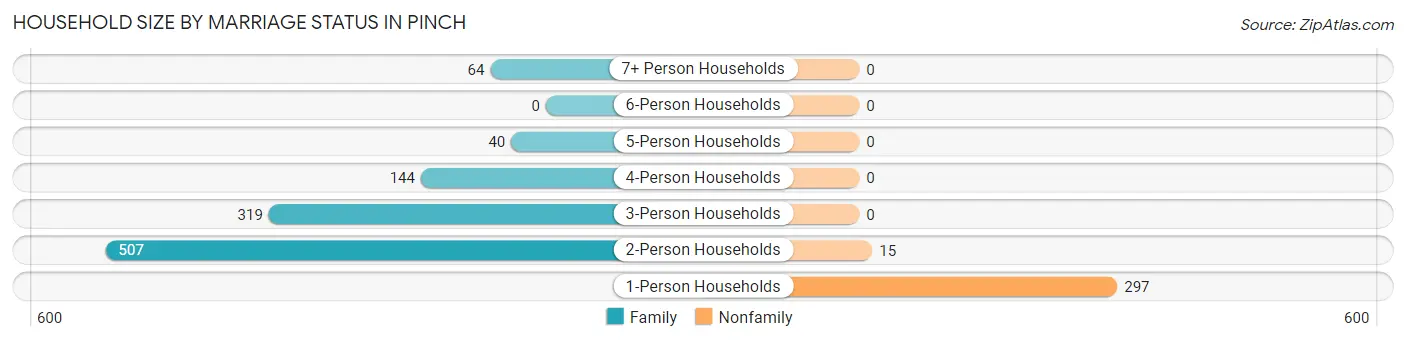
| Household Size | Family Households | Nonfamily Households |
| 1-Person Households | - | 297 (21.4%) |
| 2-Person Households | 507 (36.6%) | 15 (1.1%) |
| 3-Person Households | 319 (23.0%) | 0 (0.0%) |
| 4-Person Households | 144 (10.4%) | 0 (0.0%) |
| 5-Person Households | 40 (2.9%) | 0 (0.0%) |
| 6-Person Households | 0 (0.0%) | 0 (0.0%) |
| 7+ Person Households | 64 (4.6%) | 0 (0.0%) |
| Total | 1,074 (77.5%) | 312 (22.5%) |
Female Fertility in Pinch
Fertility by Age in Pinch
Average fertility rate in Pinch is 80.0 births per 1,000 women. Women in the age bracket of 20 to 34 years have the highest fertility rate with 250.0 births per 1,000 women. Women in the age bracket of 20 to 34 years acount for 100.0% of all women with births.
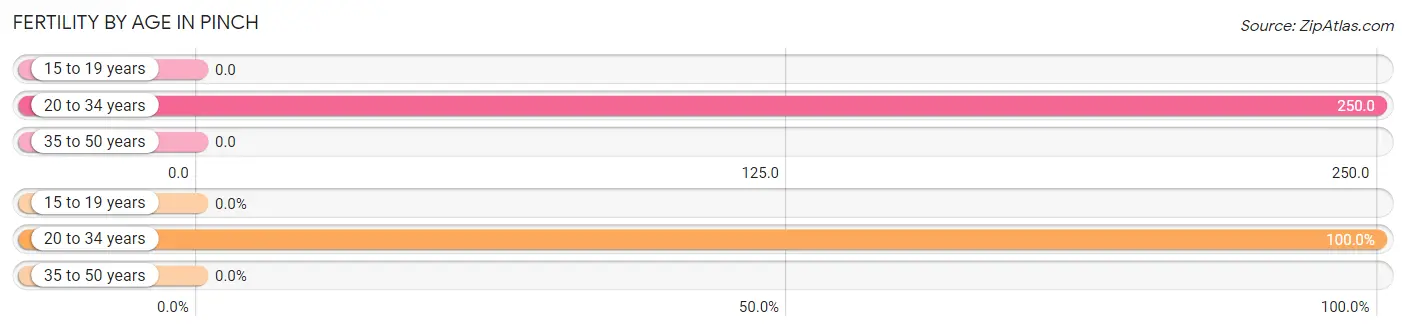
| Age Bracket | Women with Births | Births / 1,000 Women |
| 15 to 19 years | 0 (0.0%) | 0.0 |
| 20 to 34 years | 40 (100.0%) | 250.0 |
| 35 to 50 years | 0 (0.0%) | 0.0 |
| Total | 40 (100.0%) | 80.0 |
Fertility by Age by Marriage Status in Pinch
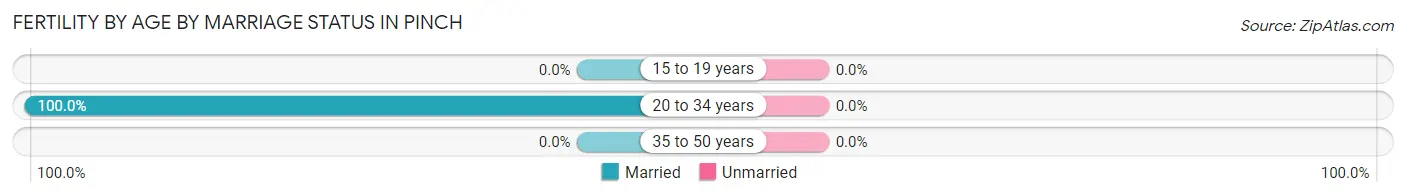
| Age Bracket | Married | Unmarried |
| 15 to 19 years | 0 (0.0%) | 0 (0.0%) |
| 20 to 34 years | 40 (100.0%) | 0 (0.0%) |
| 35 to 50 years | 0 (0.0%) | 0 (0.0%) |
| Total | 40 (100.0%) | 0 (0.0%) |
Fertility by Education in Pinch
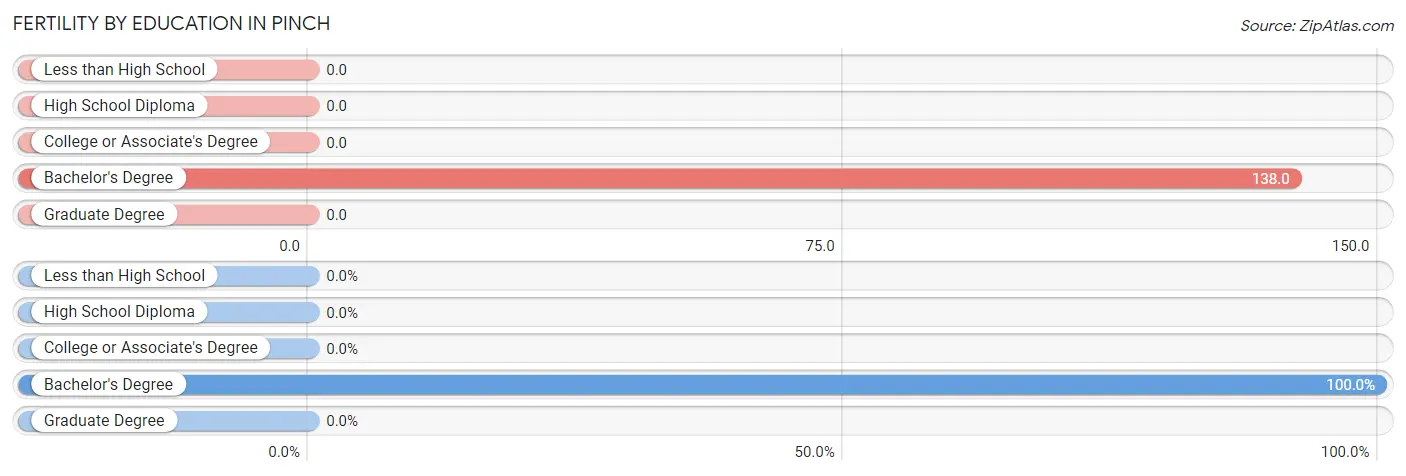
| Educational Attainment | Women with Births | Births / 1,000 Women |
| Less than High School | 0 (0.0%) | 0.0 |
| High School Diploma | 0 (0.0%) | 0.0 |
| College or Associate's Degree | 0 (0.0%) | 0.0 |
| Bachelor's Degree | 40 (100.0%) | 138.0 |
| Graduate Degree | 0 (0.0%) | 0.0 |
| Total | 40 (100.0%) | 80.0 |
Fertility by Education by Marriage Status in Pinch
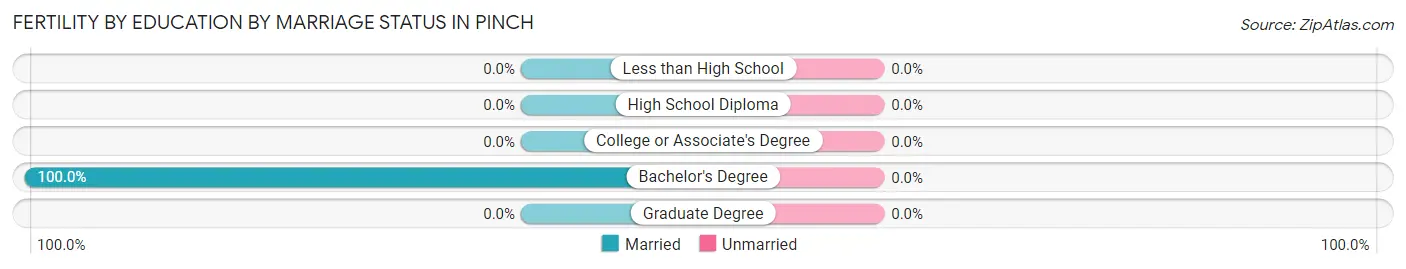
| Educational Attainment | Married | Unmarried |
| Less than High School | 0 (0.0%) | 0 (0.0%) |
| High School Diploma | 0 (0.0%) | 0 (0.0%) |
| College or Associate's Degree | 0 (0.0%) | 0 (0.0%) |
| Bachelor's Degree | 40 (100.0%) | 0 (0.0%) |
| Graduate Degree | 0 (0.0%) | 0 (0.0%) |
| Total | 40 (100.0%) | 0 (0.0%) |
Employment Characteristics in Pinch
Employment by Class of Employer in Pinch
Among the 1,469 employed individuals in Pinch, private company employees (849 | 57.8%), local government employees (191 | 13.0%), and not-for-profit organizations (181 | 12.3%) make up the most common classes of employment.
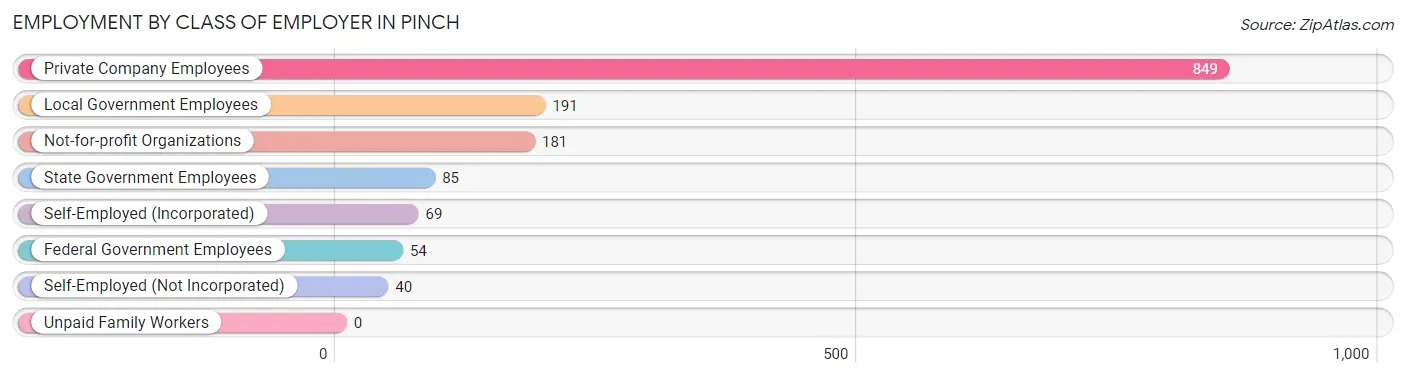
| Employer Class | # Employees | % Employees |
| Private Company Employees | 849 | 57.8% |
| Self-Employed (Incorporated) | 69 | 4.7% |
| Self-Employed (Not Incorporated) | 40 | 2.7% |
| Not-for-profit Organizations | 181 | 12.3% |
| Local Government Employees | 191 | 13.0% |
| State Government Employees | 85 | 5.8% |
| Federal Government Employees | 54 | 3.7% |
| Unpaid Family Workers | 0 | 0.0% |
| Total | 1,469 | 100.0% |
Employment Status by Age in Pinch
According to the labor force statistics for Pinch, out of the total population over 16 years of age (2,994), 50.0% or 1,497 individuals are in the labor force, with 1.8% or 27 of them unemployed. The age group with the highest labor force participation rate is 30 to 34 years, with 100.0% or 136 individuals in the labor force. Within the labor force, the 25 to 29 years age range has the highest percentage of unemployed individuals, with 20.0% or 27 of them being unemployed.
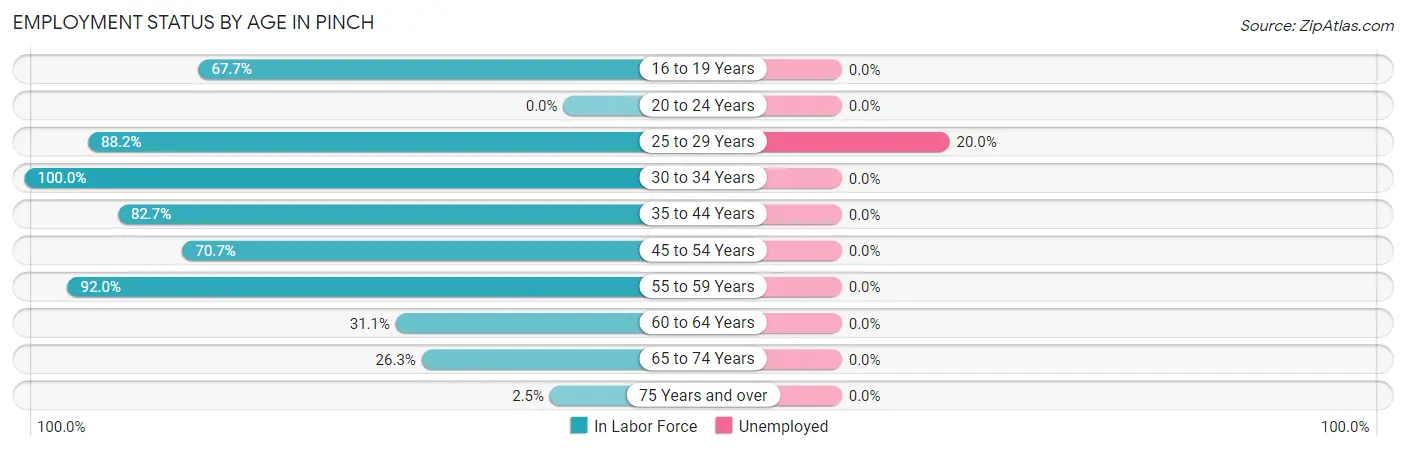
| Age Bracket | In Labor Force | Unemployed |
| 16 to 19 Years | 105 (67.7%) | 0 (0.0%) |
| 20 to 24 Years | 0 (0.0%) | 0 (0.0%) |
| 25 to 29 Years | 135 (88.2%) | 27 (20.0%) |
| 30 to 34 Years | 136 (100.0%) | 0 (0.0%) |
| 35 to 44 Years | 277 (82.7%) | 0 (0.0%) |
| 45 to 54 Years | 382 (70.7%) | 0 (0.0%) |
| 55 to 59 Years | 162 (92.0%) | 0 (0.0%) |
| 60 to 64 Years | 110 (31.1%) | 0 (0.0%) |
| 65 to 74 Years | 177 (26.3%) | 0 (0.0%) |
| 75 Years and over | 12 (2.5%) | 0 (0.0%) |
| Total | 1,497 (50.0%) | 27 (1.8%) |
Employment Status by Educational Attainment in Pinch
According to labor force statistics for Pinch, 71.0% of individuals (1,203) out of the total population between 25 and 64 years of age (1,694) are in the labor force, with 2.2% or 26 of them being unemployed. The group with the highest labor force participation rate are those with the educational attainment of college / associate degree, with 78.5% or 318 individuals in the labor force. Within the labor force, individuals with bachelor's degree or higher education have the highest percentage of unemployment, with 3.8% or 27 of them being unemployed.
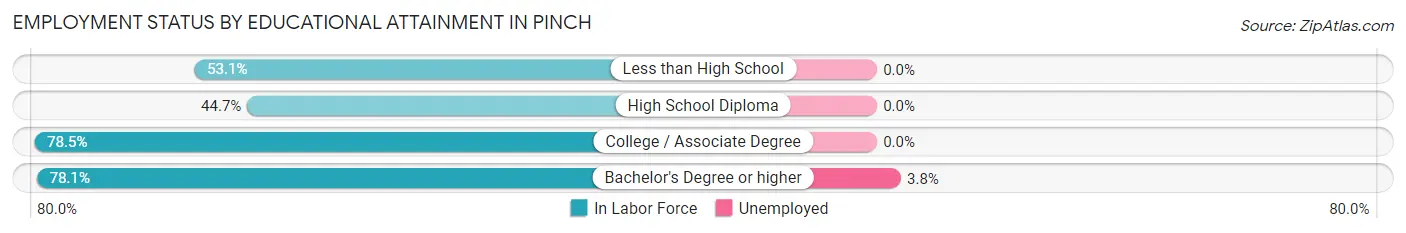
| Educational Attainment | In Labor Force | Unemployed |
| Less than High School | 26 (53.1%) | 0 (0.0%) |
| High School Diploma | 148 (44.7%) | 0 (0.0%) |
| College / Associate Degree | 318 (78.5%) | 0 (0.0%) |
| Bachelor's Degree or higher | 710 (78.1%) | 35 (3.8%) |
| Total | 1,203 (71.0%) | 37 (2.2%) |
Employment Occupations by Sex in Pinch
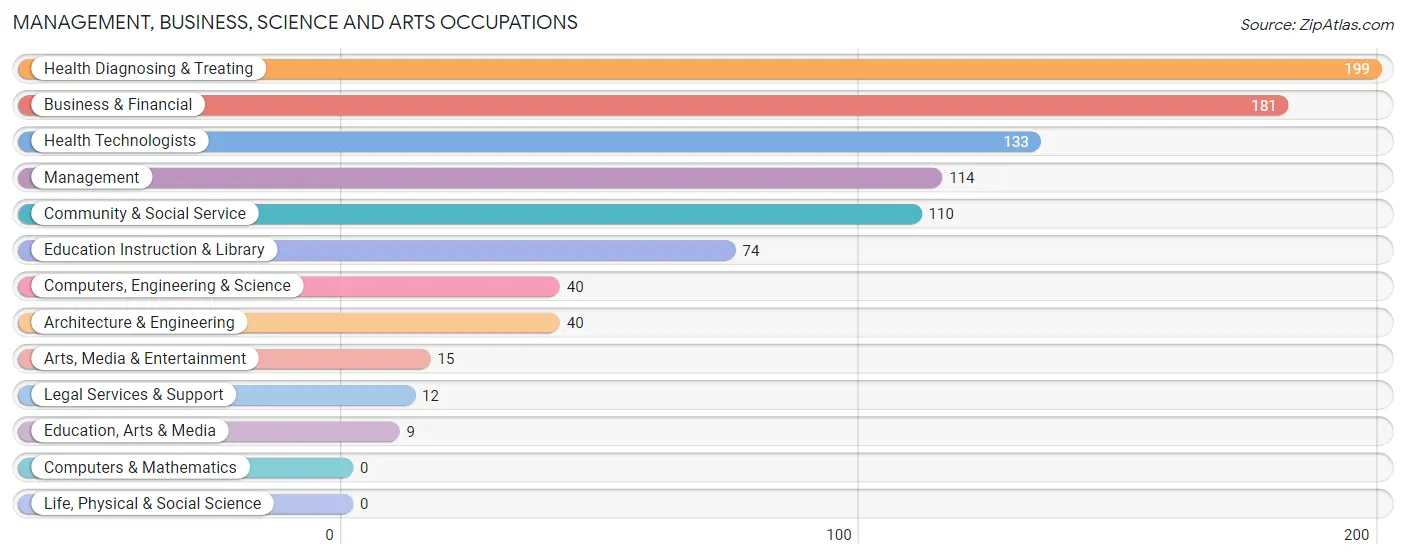
Management, Business, Science and Arts Occupations
The most common Management, Business, Science and Arts occupations in Pinch are Health Diagnosing & Treating (199 | 13.6%), Business & Financial (181 | 12.3%), Health Technologists (133 | 9.0%), Management (114 | 7.8%), and Community & Social Service (110 | 7.5%).
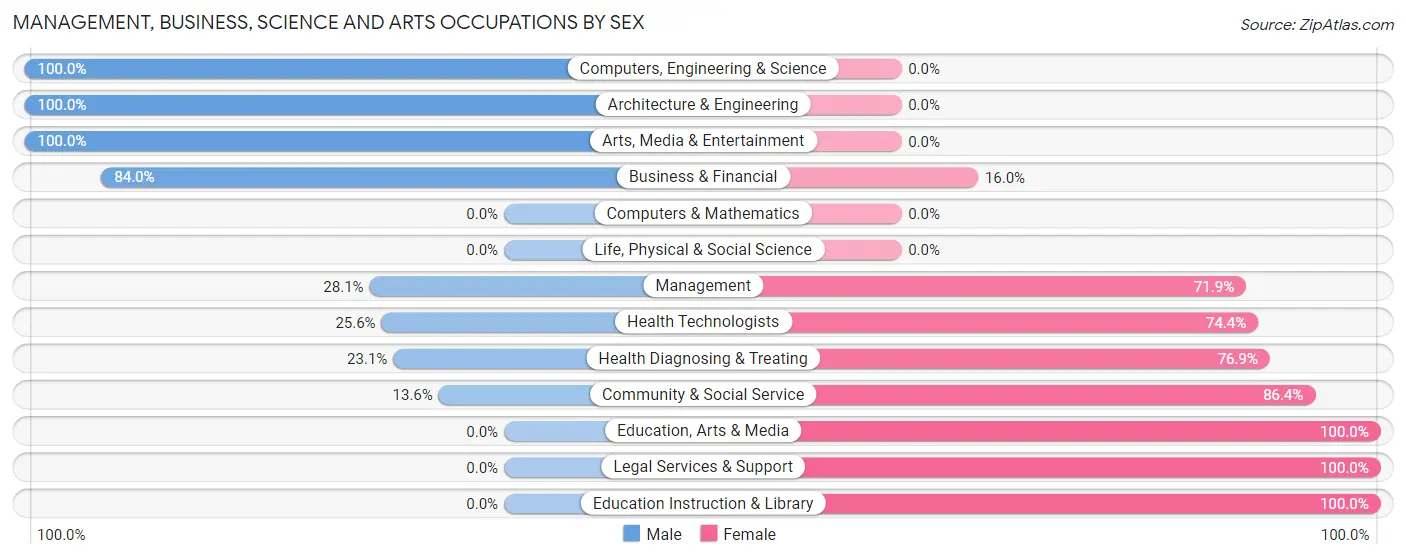
Management, Business, Science and Arts Occupations by Sex
Within the Management, Business, Science and Arts occupations in Pinch, the most male-oriented occupations are Computers, Engineering & Science (100.0%), Architecture & Engineering (100.0%), and Arts, Media & Entertainment (100.0%), while the most female-oriented occupations are Education, Arts & Media (100.0%), Legal Services & Support (100.0%), and Education Instruction & Library (100.0%).
| Occupation | Male | Female |
| Management | 32 (28.1%) | 82 (71.9%) |
| Business & Financial | 152 (84.0%) | 29 (16.0%) |
| Computers, Engineering & Science | 40 (100.0%) | 0 (0.0%) |
| Computers & Mathematics | 0 (0.0%) | 0 (0.0%) |
| Architecture & Engineering | 40 (100.0%) | 0 (0.0%) |
| Life, Physical & Social Science | 0 (0.0%) | 0 (0.0%) |
| Community & Social Service | 15 (13.6%) | 95 (86.4%) |
| Education, Arts & Media | 0 (0.0%) | 9 (100.0%) |
| Legal Services & Support | 0 (0.0%) | 12 (100.0%) |
| Education Instruction & Library | 0 (0.0%) | 74 (100.0%) |
| Arts, Media & Entertainment | 15 (100.0%) | 0 (0.0%) |
| Health Diagnosing & Treating | 46 (23.1%) | 153 (76.9%) |
| Health Technologists | 34 (25.6%) | 99 (74.4%) |
| Total (Category) | 285 (44.3%) | 359 (55.7%) |
| Total (Overall) | 863 (58.8%) | 606 (41.2%) |
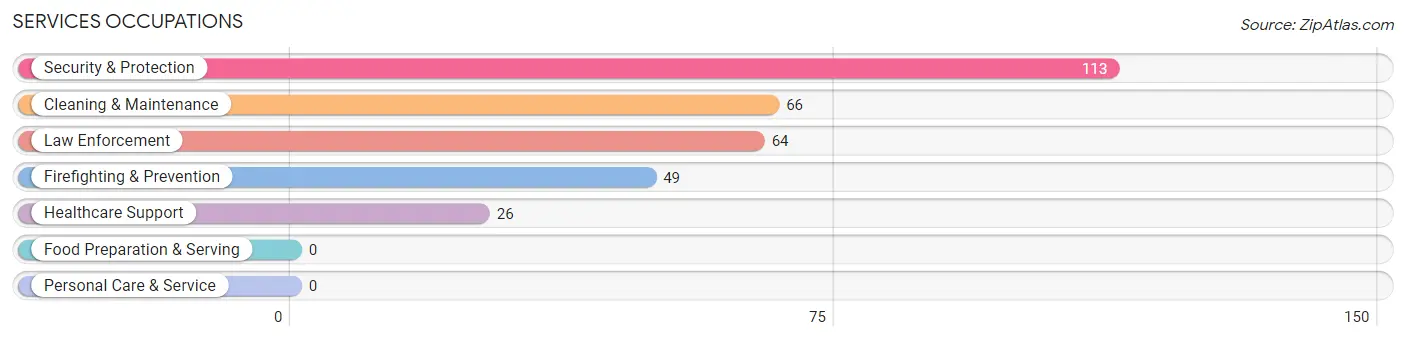
Services Occupations
The most common Services occupations in Pinch are Security & Protection (113 | 7.7%), Cleaning & Maintenance (66 | 4.5%), Law Enforcement (64 | 4.4%), Firefighting & Prevention (49 | 3.3%), and Healthcare Support (26 | 1.8%).
Services Occupations by Sex
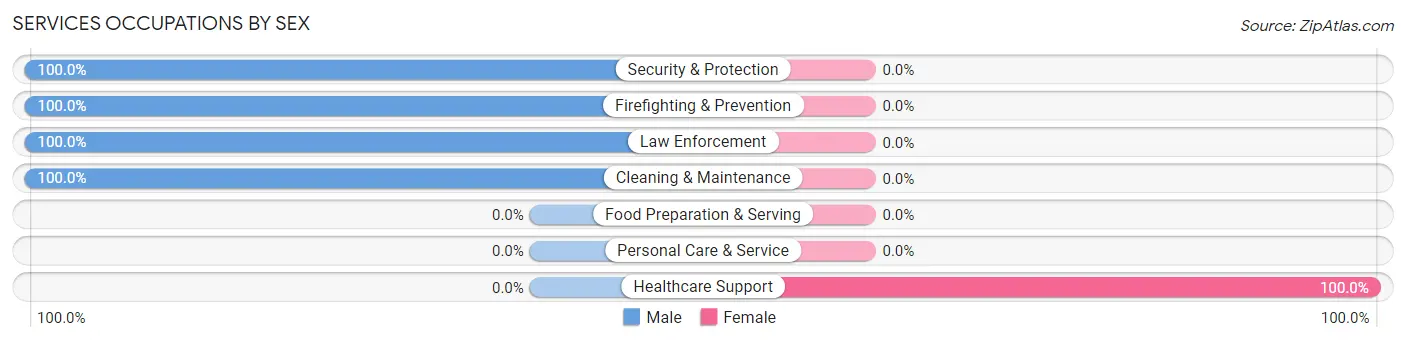
| Occupation | Male | Female |
| Healthcare Support | 0 (0.0%) | 26 (100.0%) |
| Security & Protection | 113 (100.0%) | 0 (0.0%) |
| Firefighting & Prevention | 49 (100.0%) | 0 (0.0%) |
| Law Enforcement | 64 (100.0%) | 0 (0.0%) |
| Food Preparation & Serving | 0 (0.0%) | 0 (0.0%) |
| Cleaning & Maintenance | 66 (100.0%) | 0 (0.0%) |
| Personal Care & Service | 0 (0.0%) | 0 (0.0%) |
| Total (Category) | 179 (87.3%) | 26 (12.7%) |
| Total (Overall) | 863 (58.8%) | 606 (41.2%) |
Sales and Office Occupations
The most common Sales and Office occupations in Pinch are Sales & Related (215 | 14.6%), and Office & Administration (114 | 7.8%).
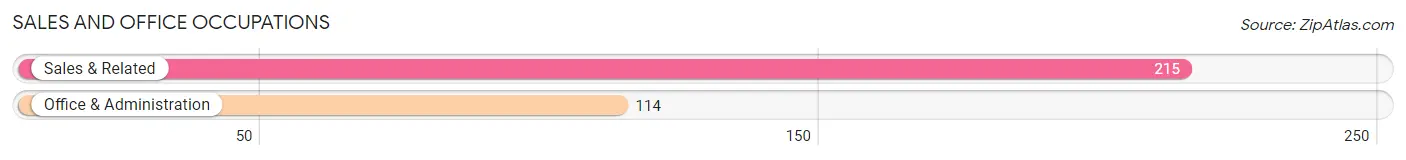
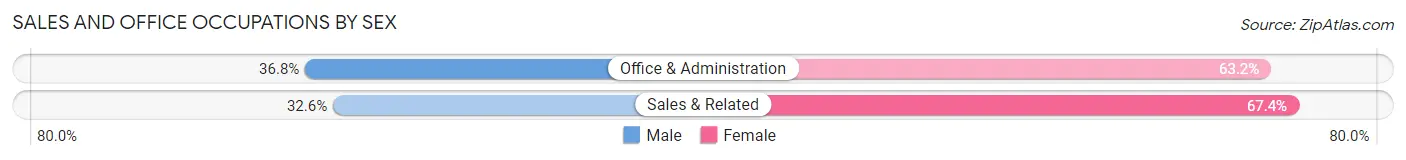
Sales and Office Occupations by Sex
| Occupation | Male | Female |
| Sales & Related | 70 (32.6%) | 145 (67.4%) |
| Office & Administration | 42 (36.8%) | 72 (63.2%) |
| Total (Category) | 112 (34.0%) | 217 (66.0%) |
| Total (Overall) | 863 (58.8%) | 606 (41.2%) |
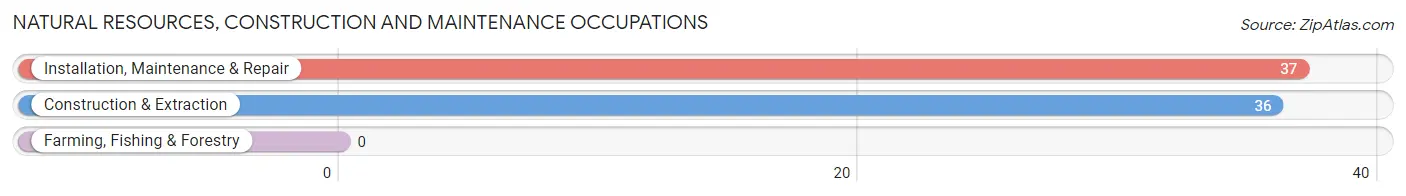
Natural Resources, Construction and Maintenance Occupations
The most common Natural Resources, Construction and Maintenance occupations in Pinch are Installation, Maintenance & Repair (37 | 2.5%), and Construction & Extraction (36 | 2.5%).
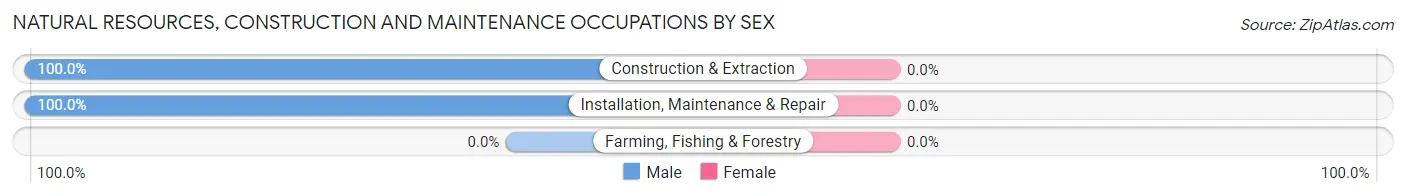
Natural Resources, Construction and Maintenance Occupations by Sex
| Occupation | Male | Female |
| Farming, Fishing & Forestry | 0 (0.0%) | 0 (0.0%) |
| Construction & Extraction | 36 (100.0%) | 0 (0.0%) |
| Installation, Maintenance & Repair | 37 (100.0%) | 0 (0.0%) |
| Total (Category) | 73 (100.0%) | 0 (0.0%) |
| Total (Overall) | 863 (58.8%) | 606 (41.2%) |
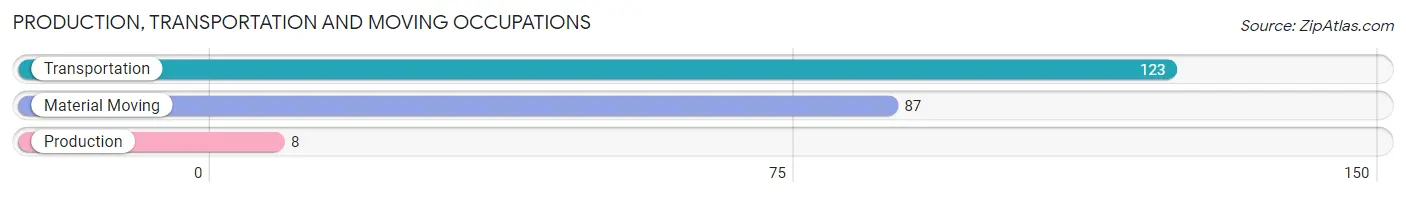
Production, Transportation and Moving Occupations
The most common Production, Transportation and Moving occupations in Pinch are Transportation (123 | 8.4%), Material Moving (87 | 5.9%), and Production (8 | 0.5%).
Production, Transportation and Moving Occupations by Sex
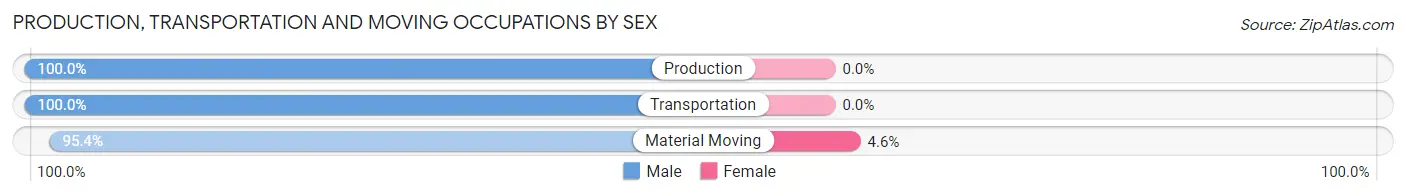
| Occupation | Male | Female |
| Production | 8 (100.0%) | 0 (0.0%) |
| Transportation | 123 (100.0%) | 0 (0.0%) |
| Material Moving | 83 (95.4%) | 4 (4.6%) |
| Total (Category) | 214 (98.2%) | 4 (1.8%) |
| Total (Overall) | 863 (58.8%) | 606 (41.2%) |
Employment Industries by Sex in Pinch
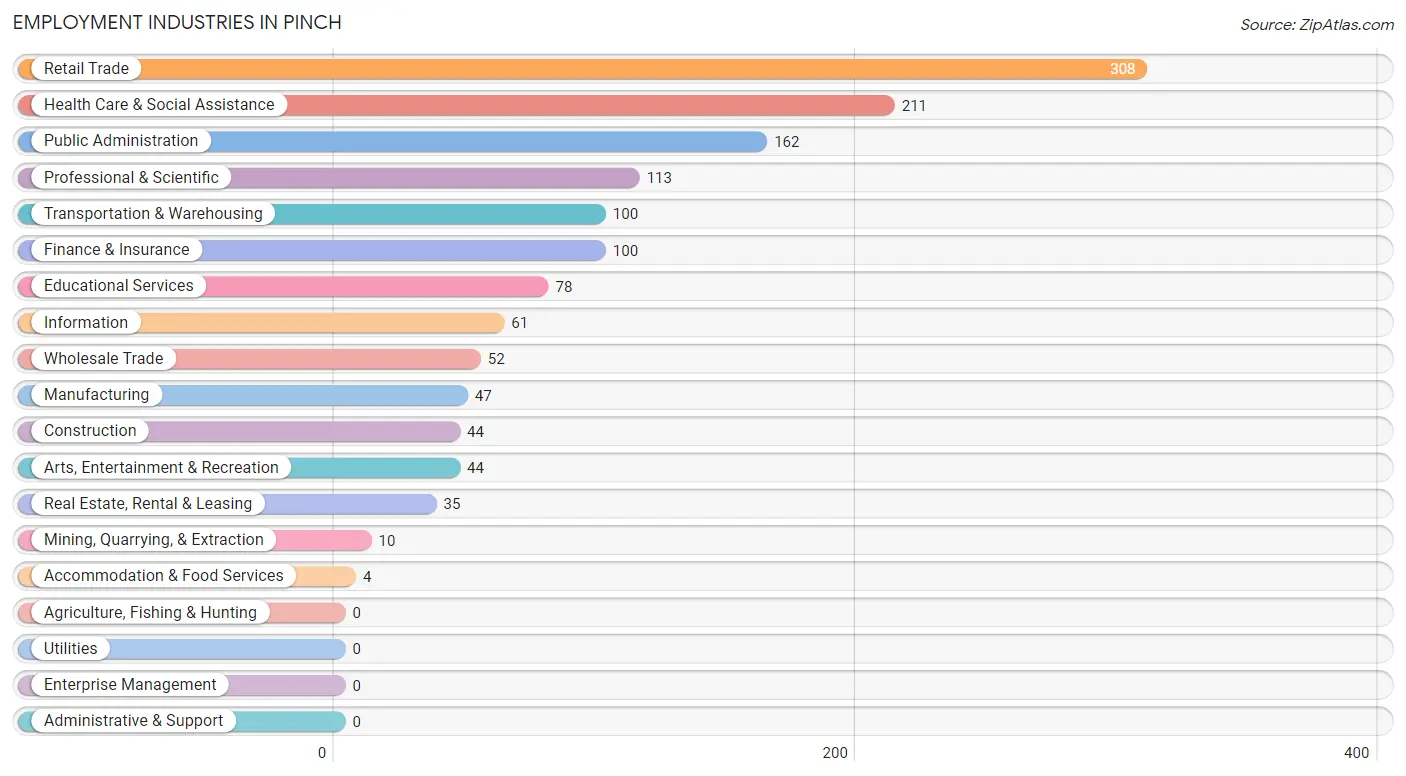
Employment Industries in Pinch
The major employment industries in Pinch include Retail Trade (308 | 21.0%), Health Care & Social Assistance (211 | 14.4%), Public Administration (162 | 11.0%), Professional & Scientific (113 | 7.7%), and Transportation & Warehousing (100 | 6.8%).
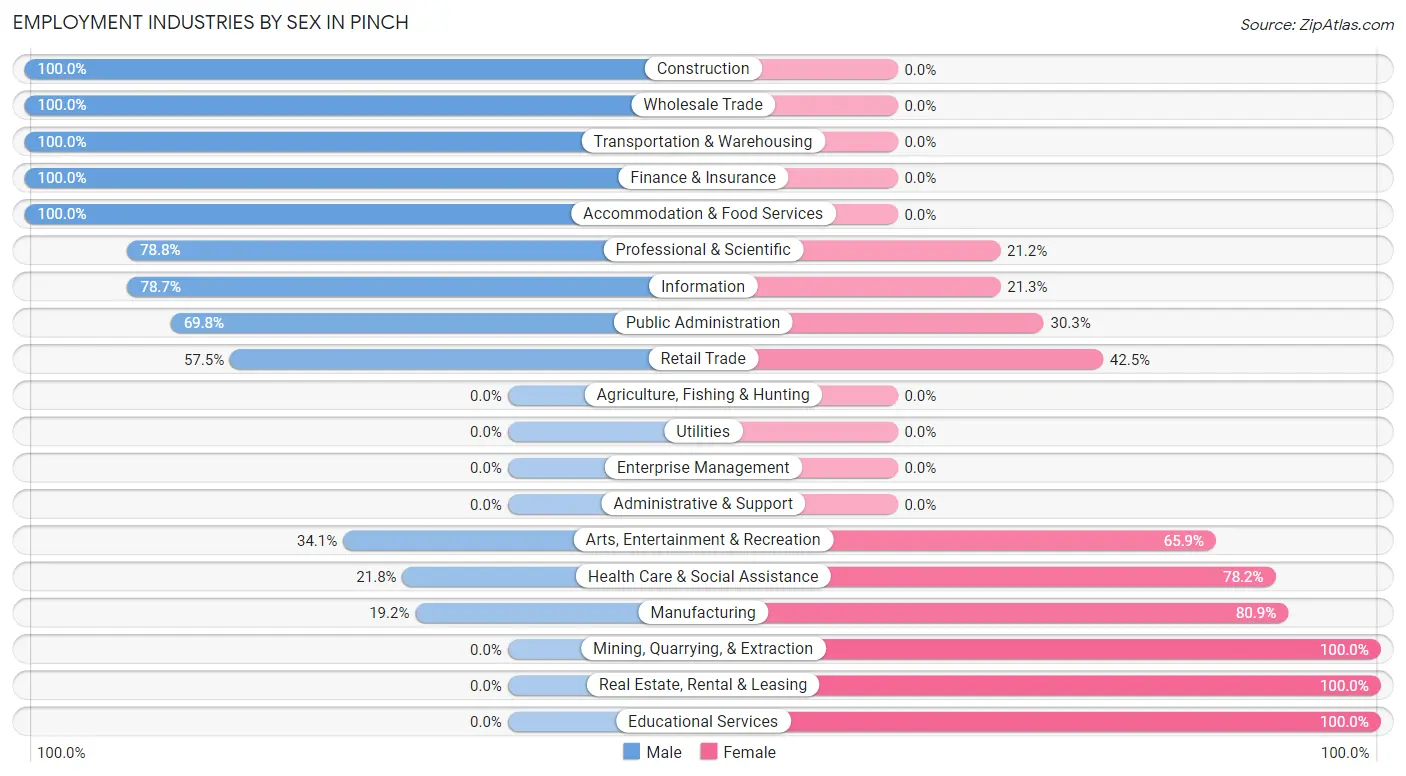
Employment Industries by Sex in Pinch
The Pinch industries that see more men than women are Construction (100.0%), Wholesale Trade (100.0%), and Transportation & Warehousing (100.0%), whereas the industries that tend to have a higher number of women are Mining, Quarrying, & Extraction (100.0%), Real Estate, Rental & Leasing (100.0%), and Educational Services (100.0%).
| Industry | Male | Female |
| Agriculture, Fishing & Hunting | 0 (0.0%) | 0 (0.0%) |
| Mining, Quarrying, & Extraction | 0 (0.0%) | 10 (100.0%) |
| Construction | 44 (100.0%) | 0 (0.0%) |
| Manufacturing | 9 (19.2%) | 38 (80.8%) |
| Wholesale Trade | 52 (100.0%) | 0 (0.0%) |
| Retail Trade | 177 (57.5%) | 131 (42.5%) |
| Transportation & Warehousing | 100 (100.0%) | 0 (0.0%) |
| Utilities | 0 (0.0%) | 0 (0.0%) |
| Information | 48 (78.7%) | 13 (21.3%) |
| Finance & Insurance | 100 (100.0%) | 0 (0.0%) |
| Real Estate, Rental & Leasing | 0 (0.0%) | 35 (100.0%) |
| Professional & Scientific | 89 (78.8%) | 24 (21.2%) |
| Enterprise Management | 0 (0.0%) | 0 (0.0%) |
| Administrative & Support | 0 (0.0%) | 0 (0.0%) |
| Educational Services | 0 (0.0%) | 78 (100.0%) |
| Health Care & Social Assistance | 46 (21.8%) | 165 (78.2%) |
| Arts, Entertainment & Recreation | 15 (34.1%) | 29 (65.9%) |
| Accommodation & Food Services | 4 (100.0%) | 0 (0.0%) |
| Public Administration | 113 (69.8%) | 49 (30.2%) |
| Total | 863 (58.8%) | 606 (41.2%) |
Education in Pinch
School Enrollment in Pinch
The most common levels of schooling among the 679 students in Pinch are middle school (310 | 45.7%), elementary school (185 | 27.3%), and high school (140 | 20.6%).
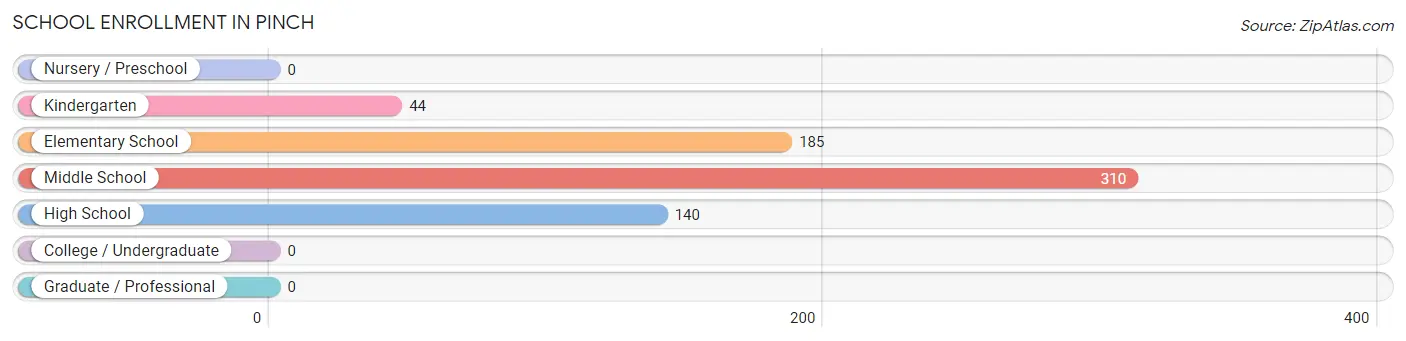
| School Level | # Students | % Students |
| Nursery / Preschool | 0 | 0.0% |
| Kindergarten | 44 | 6.5% |
| Elementary School | 185 | 27.3% |
| Middle School | 310 | 45.7% |
| High School | 140 | 20.6% |
| College / Undergraduate | 0 | 0.0% |
| Graduate / Professional | 0 | 0.0% |
| Total | 679 | 100.0% |
School Enrollment by Age by Funding Source in Pinch
Out of a total of 679 students who are enrolled in schools in Pinch, 139 (20.5%) attend a private institution, while the remaining 540 (79.5%) are enrolled in public schools. The age group of 5 to 9 year old has the highest likelihood of being enrolled in private schools, with 107 (46.7% in the age bracket) enrolled. Conversely, the age group of 15 to 17 year olds has the lowest likelihood of being enrolled in a private school, with 116 (100.0% in the age bracket) attending a public institution.
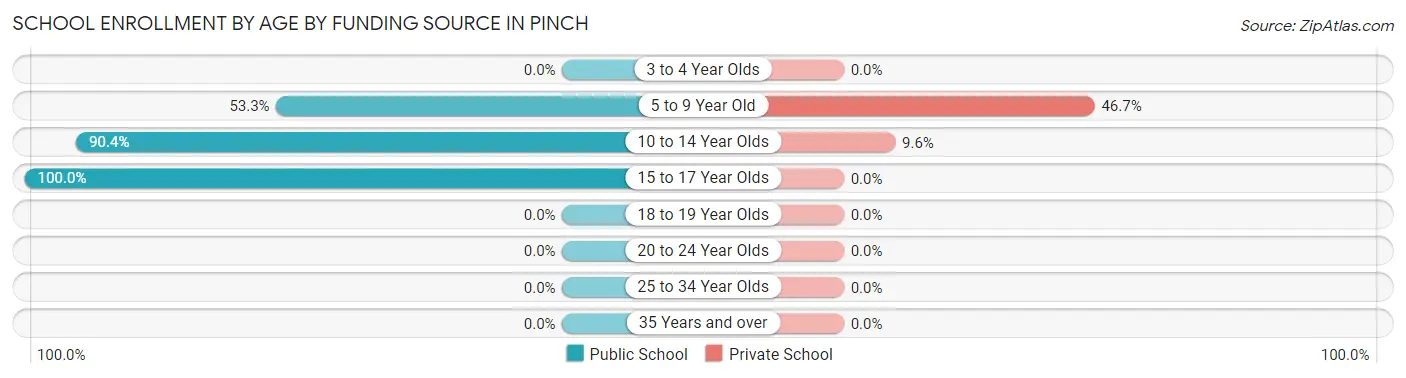
| Age Bracket | Public School | Private School |
| 3 to 4 Year Olds | 0 (0.0%) | 0 (0.0%) |
| 5 to 9 Year Old | 122 (53.3%) | 107 (46.7%) |
| 10 to 14 Year Olds | 302 (90.4%) | 32 (9.6%) |
| 15 to 17 Year Olds | 116 (100.0%) | 0 (0.0%) |
| 18 to 19 Year Olds | 0 (0.0%) | 0 (0.0%) |
| 20 to 24 Year Olds | 0 (0.0%) | 0 (0.0%) |
| 25 to 34 Year Olds | 0 (0.0%) | 0 (0.0%) |
| 35 Years and over | 0 (0.0%) | 0 (0.0%) |
| Total | 540 (79.5%) | 139 (20.5%) |
Educational Attainment by Field of Study in Pinch
Business (317 | 24.0%), physical & health sciences (264 | 20.0%), science & technology (174 | 13.2%), arts & humanities (160 | 12.1%), and education (122 | 9.2%) are the most common fields of study among 1,319 individuals in Pinch who have obtained a bachelor's degree or higher.
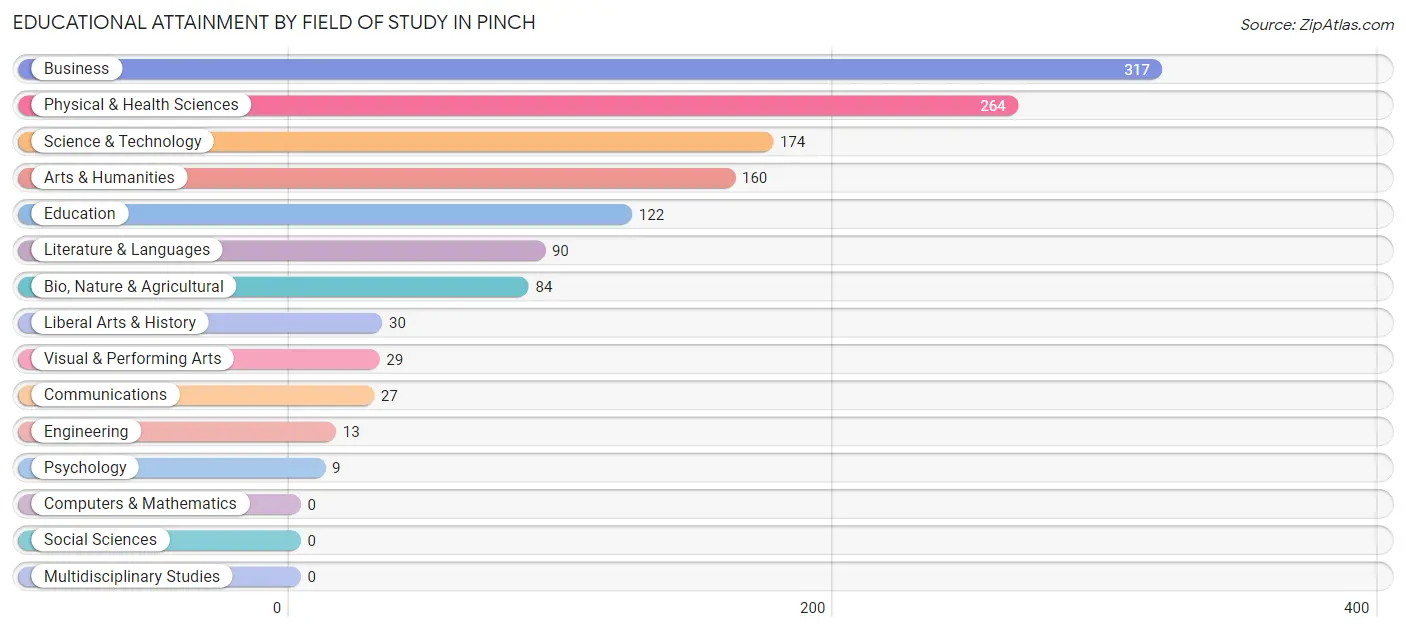
| Field of Study | # Graduates | % Graduates |
| Computers & Mathematics | 0 | 0.0% |
| Bio, Nature & Agricultural | 84 | 6.4% |
| Physical & Health Sciences | 264 | 20.0% |
| Psychology | 9 | 0.7% |
| Social Sciences | 0 | 0.0% |
| Engineering | 13 | 1.0% |
| Multidisciplinary Studies | 0 | 0.0% |
| Science & Technology | 174 | 13.2% |
| Business | 317 | 24.0% |
| Education | 122 | 9.2% |
| Literature & Languages | 90 | 6.8% |
| Liberal Arts & History | 30 | 2.3% |
| Visual & Performing Arts | 29 | 2.2% |
| Communications | 27 | 2.1% |
| Arts & Humanities | 160 | 12.1% |
| Total | 1,319 | 100.0% |
Transportation & Commute in Pinch
Vehicle Availability by Sex in Pinch
The most prevalent vehicle ownership categories in Pinch are males with 2 vehicles (288, accounting for 33.4%) and females with 2 vehicles (290, making up 47.5%).
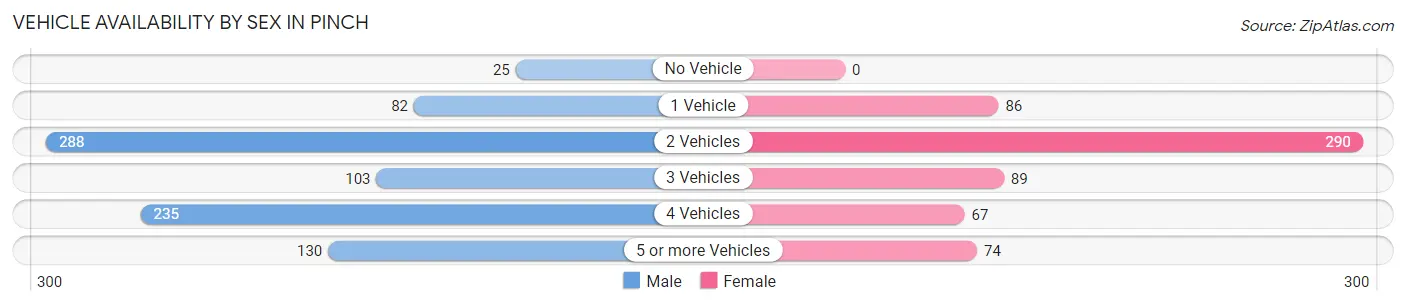
| Vehicles Available | Male | Female |
| No Vehicle | 25 (2.9%) | 0 (0.0%) |
| 1 Vehicle | 82 (9.5%) | 86 (14.2%) |
| 2 Vehicles | 288 (33.4%) | 290 (47.8%) |
| 3 Vehicles | 103 (11.9%) | 89 (14.7%) |
| 4 Vehicles | 235 (27.2%) | 67 (11.1%) |
| 5 or more Vehicles | 130 (15.1%) | 74 (12.2%) |
| Total | 863 (100.0%) | 606 (100.0%) |
Commute Time in Pinch
The most frequently occuring commute durations in Pinch are 20 to 24 minutes (359 commuters, 30.3%), 15 to 19 minutes (222 commuters, 18.8%), and 40 to 44 minutes (136 commuters, 11.5%).
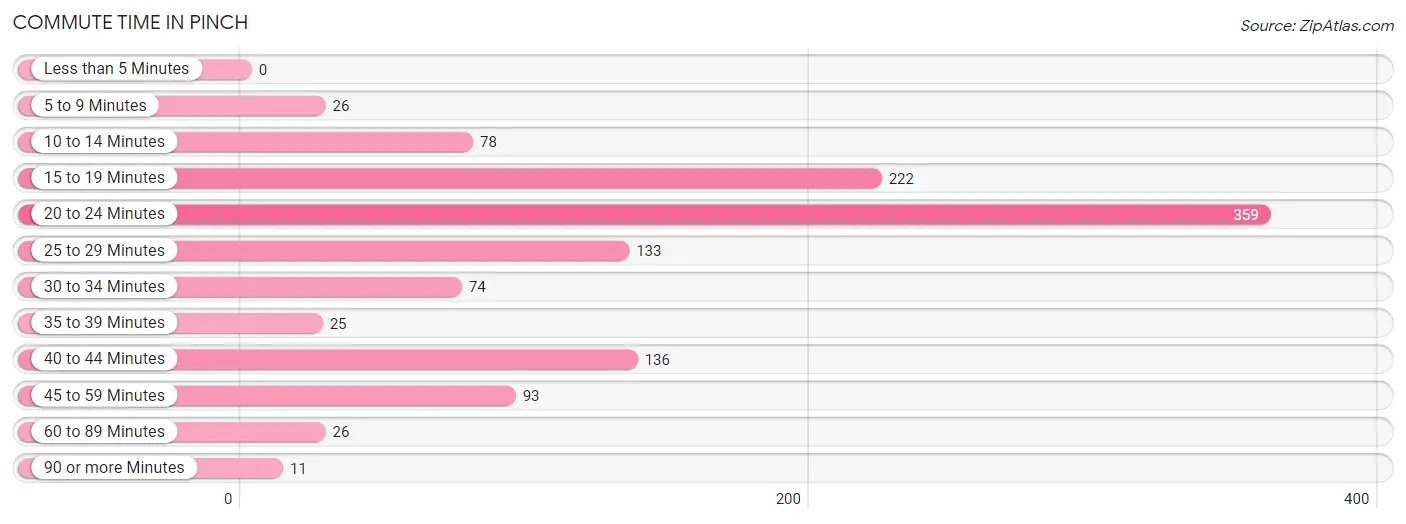
| Commute Time | # Commuters | % Commuters |
| Less than 5 Minutes | 0 | 0.0% |
| 5 to 9 Minutes | 26 | 2.2% |
| 10 to 14 Minutes | 78 | 6.6% |
| 15 to 19 Minutes | 222 | 18.8% |
| 20 to 24 Minutes | 359 | 30.3% |
| 25 to 29 Minutes | 133 | 11.2% |
| 30 to 34 Minutes | 74 | 6.3% |
| 35 to 39 Minutes | 25 | 2.1% |
| 40 to 44 Minutes | 136 | 11.5% |
| 45 to 59 Minutes | 93 | 7.9% |
| 60 to 89 Minutes | 26 | 2.2% |
| 90 or more Minutes | 11 | 0.9% |
Commute Time by Sex in Pinch
The most common commute times in Pinch are 20 to 24 minutes (287 commuters, 40.9%) for males and 15 to 19 minutes (141 commuters, 29.2%) for females.
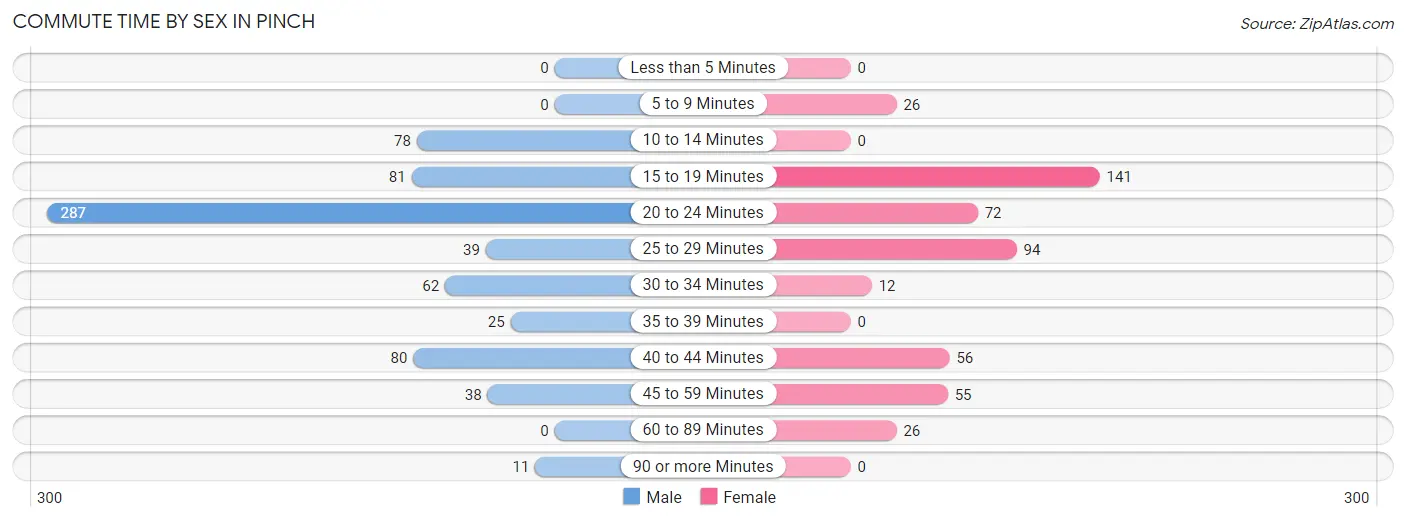
| Commute Time | Male | Female |
| Less than 5 Minutes | 0 (0.0%) | 0 (0.0%) |
| 5 to 9 Minutes | 0 (0.0%) | 26 (5.4%) |
| 10 to 14 Minutes | 78 (11.1%) | 0 (0.0%) |
| 15 to 19 Minutes | 81 (11.6%) | 141 (29.2%) |
| 20 to 24 Minutes | 287 (40.9%) | 72 (14.9%) |
| 25 to 29 Minutes | 39 (5.6%) | 94 (19.5%) |
| 30 to 34 Minutes | 62 (8.8%) | 12 (2.5%) |
| 35 to 39 Minutes | 25 (3.6%) | 0 (0.0%) |
| 40 to 44 Minutes | 80 (11.4%) | 56 (11.6%) |
| 45 to 59 Minutes | 38 (5.4%) | 55 (11.4%) |
| 60 to 89 Minutes | 0 (0.0%) | 26 (5.4%) |
| 90 or more Minutes | 11 (1.6%) | 0 (0.0%) |
Time of Departure to Work by Sex in Pinch
The most frequent times of departure to work in Pinch are 12:00 AM to 4:59 AM (173, 24.7%) for males and 7:30 AM to 7:59 AM (178, 36.9%) for females.
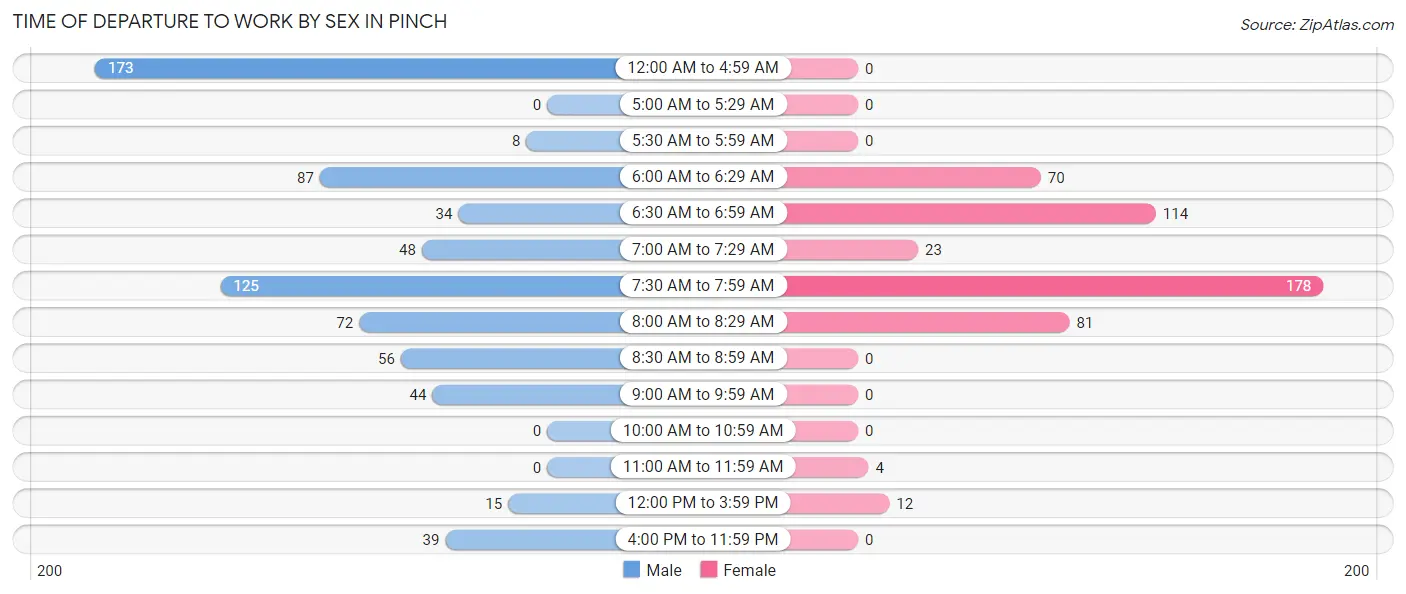
| Time of Departure | Male | Female |
| 12:00 AM to 4:59 AM | 173 (24.7%) | 0 (0.0%) |
| 5:00 AM to 5:29 AM | 0 (0.0%) | 0 (0.0%) |
| 5:30 AM to 5:59 AM | 8 (1.1%) | 0 (0.0%) |
| 6:00 AM to 6:29 AM | 87 (12.4%) | 70 (14.5%) |
| 6:30 AM to 6:59 AM | 34 (4.9%) | 114 (23.6%) |
| 7:00 AM to 7:29 AM | 48 (6.9%) | 23 (4.8%) |
| 7:30 AM to 7:59 AM | 125 (17.8%) | 178 (36.9%) |
| 8:00 AM to 8:29 AM | 72 (10.3%) | 81 (16.8%) |
| 8:30 AM to 8:59 AM | 56 (8.0%) | 0 (0.0%) |
| 9:00 AM to 9:59 AM | 44 (6.3%) | 0 (0.0%) |
| 10:00 AM to 10:59 AM | 0 (0.0%) | 0 (0.0%) |
| 11:00 AM to 11:59 AM | 0 (0.0%) | 4 (0.8%) |
| 12:00 PM to 3:59 PM | 15 (2.1%) | 12 (2.5%) |
| 4:00 PM to 11:59 PM | 39 (5.6%) | 0 (0.0%) |
| Total | 701 (100.0%) | 482 (100.0%) |
Housing Occupancy in Pinch
Occupancy by Ownership in Pinch
Of the total 1,386 dwellings in Pinch, owner-occupied units account for 966 (69.7%), while renter-occupied units make up 420 (30.3%).
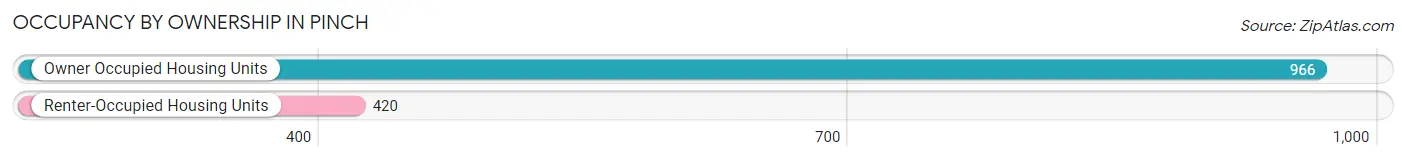
| Occupancy | # Housing Units | % Housing Units |
| Owner Occupied Housing Units | 966 | 69.7% |
| Renter-Occupied Housing Units | 420 | 30.3% |
| Total Occupied Housing Units | 1,386 | 100.0% |
Occupancy by Household Size in Pinch
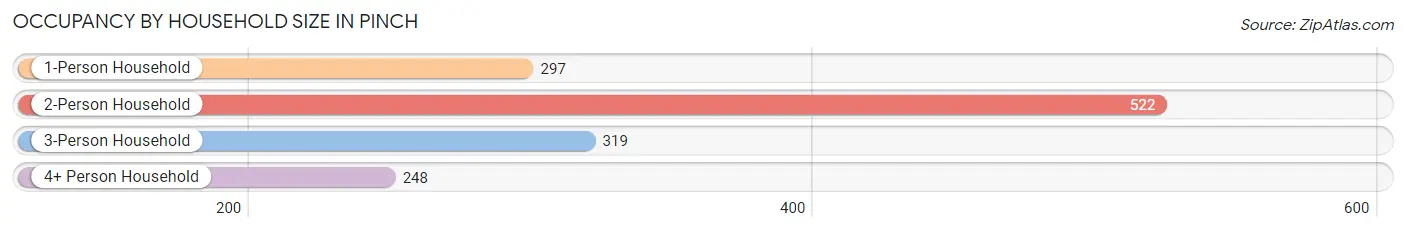
| Household Size | # Housing Units | % Housing Units |
| 1-Person Household | 297 | 21.4% |
| 2-Person Household | 522 | 37.7% |
| 3-Person Household | 319 | 23.0% |
| 4+ Person Household | 248 | 17.9% |
| Total Housing Units | 1,386 | 100.0% |
Occupancy by Ownership by Household Size in Pinch
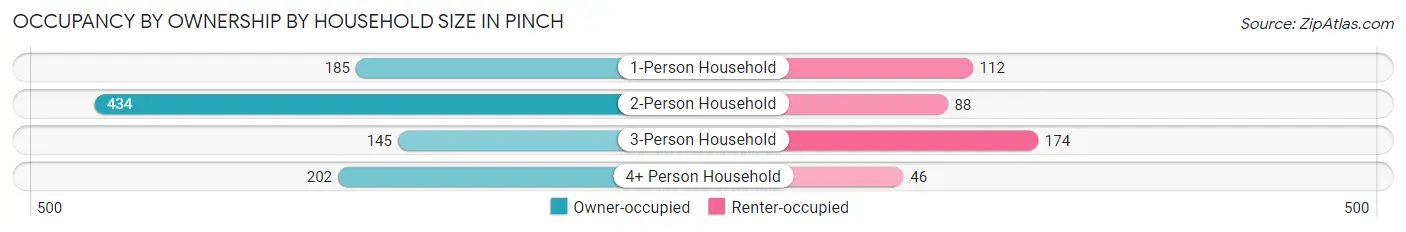
| Household Size | Owner-occupied | Renter-occupied |
| 1-Person Household | 185 (62.3%) | 112 (37.7%) |
| 2-Person Household | 434 (83.1%) | 88 (16.9%) |
| 3-Person Household | 145 (45.5%) | 174 (54.5%) |
| 4+ Person Household | 202 (81.5%) | 46 (18.5%) |
| Total Housing Units | 966 (69.7%) | 420 (30.3%) |
Occupancy by Educational Attainment in Pinch
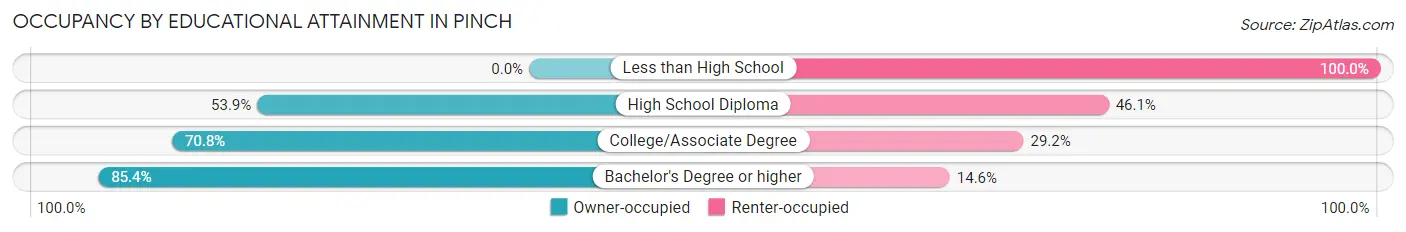
| Household Size | Owner-occupied | Renter-occupied |
| Less than High School | 0 (0.0%) | 26 (100.0%) |
| High School Diploma | 235 (53.9%) | 201 (46.1%) |
| College/Associate Degree | 281 (70.8%) | 116 (29.2%) |
| Bachelor's Degree or higher | 450 (85.4%) | 77 (14.6%) |
Occupancy by Age of Householder in Pinch
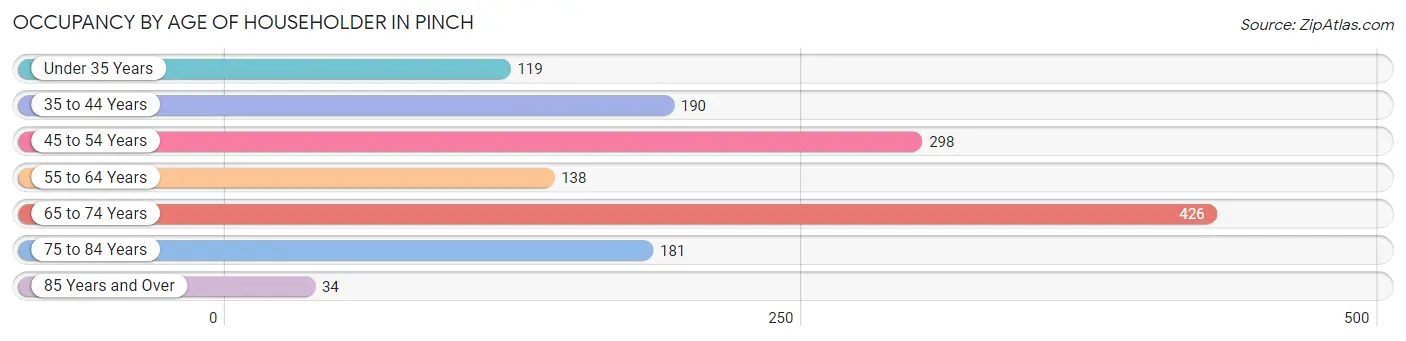
| Age Bracket | # Households | % Households |
| Under 35 Years | 119 | 8.6% |
| 35 to 44 Years | 190 | 13.7% |
| 45 to 54 Years | 298 | 21.5% |
| 55 to 64 Years | 138 | 10.0% |
| 65 to 74 Years | 426 | 30.7% |
| 75 to 84 Years | 181 | 13.1% |
| 85 Years and Over | 34 | 2.5% |
| Total | 1,386 | 100.0% |
Housing Finances in Pinch
Median Income by Occupancy in Pinch
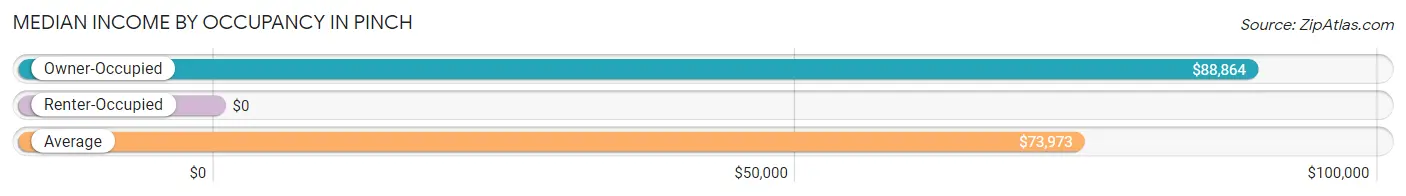
| Occupancy Type | # Households | Median Income |
| Owner-Occupied | 966 (69.7%) | $88,864 |
| Renter-Occupied | 420 (30.3%) | $0 |
| Average | 1,386 (100.0%) | $73,973 |
Occupancy by Householder Income Bracket in Pinch
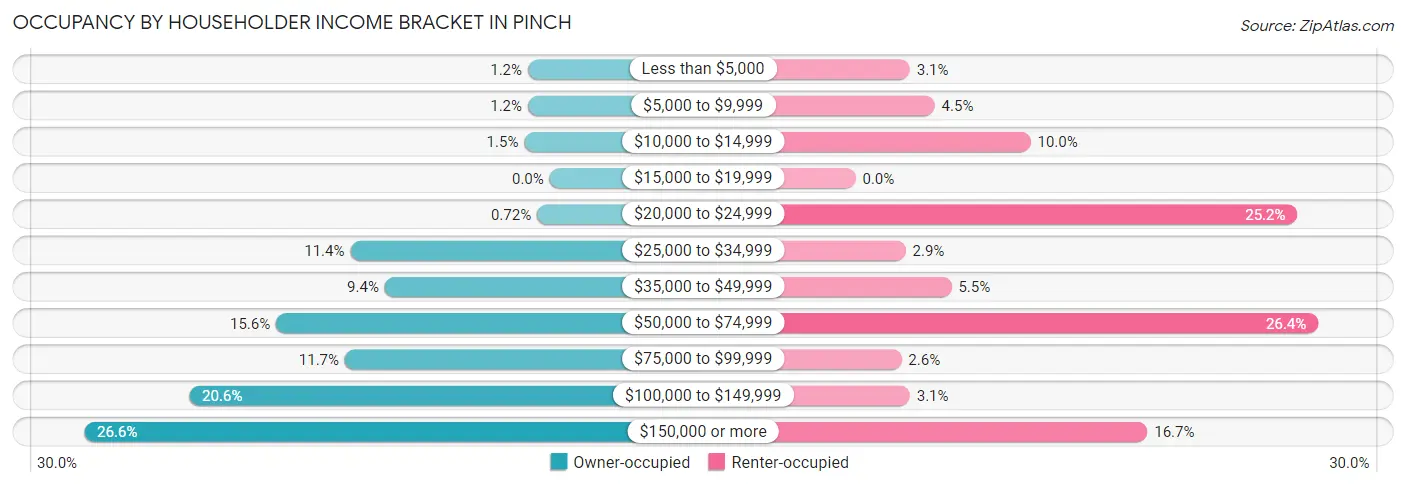
| Income Bracket | Owner-occupied | Renter-occupied |
| Less than $5,000 | 12 (1.2%) | 13 (3.1%) |
| $5,000 to $9,999 | 12 (1.2%) | 19 (4.5%) |
| $10,000 to $14,999 | 14 (1.5%) | 42 (10.0%) |
| $15,000 to $19,999 | 0 (0.0%) | 0 (0.0%) |
| $20,000 to $24,999 | 7 (0.7%) | 106 (25.2%) |
| $25,000 to $34,999 | 110 (11.4%) | 12 (2.9%) |
| $35,000 to $49,999 | 91 (9.4%) | 23 (5.5%) |
| $50,000 to $74,999 | 151 (15.6%) | 111 (26.4%) |
| $75,000 to $99,999 | 113 (11.7%) | 11 (2.6%) |
| $100,000 to $149,999 | 199 (20.6%) | 13 (3.1%) |
| $150,000 or more | 257 (26.6%) | 70 (16.7%) |
| Total | 966 (100.0%) | 420 (100.0%) |
Monthly Housing Cost Tiers in Pinch
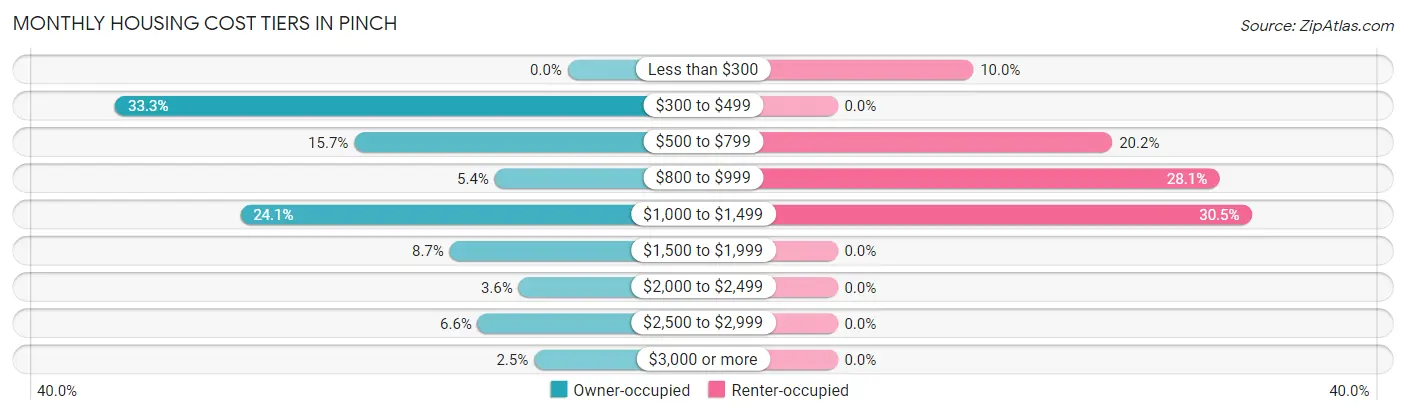
| Monthly Cost | Owner-occupied | Renter-occupied |
| Less than $300 | 0 (0.0%) | 42 (10.0%) |
| $300 to $499 | 322 (33.3%) | 0 (0.0%) |
| $500 to $799 | 152 (15.7%) | 85 (20.2%) |
| $800 to $999 | 52 (5.4%) | 118 (28.1%) |
| $1,000 to $1,499 | 233 (24.1%) | 128 (30.5%) |
| $1,500 to $1,999 | 84 (8.7%) | 0 (0.0%) |
| $2,000 to $2,499 | 35 (3.6%) | 0 (0.0%) |
| $2,500 to $2,999 | 64 (6.6%) | 0 (0.0%) |
| $3,000 or more | 24 (2.5%) | 0 (0.0%) |
| Total | 966 (100.0%) | 420 (100.0%) |
Physical Housing Characteristics in Pinch
Housing Structures in Pinch
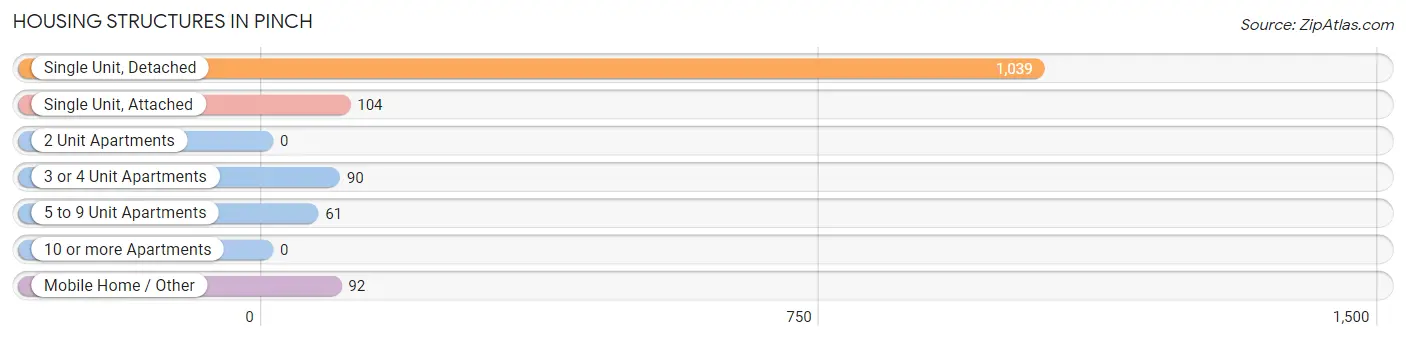
| Structure Type | # Housing Units | % Housing Units |
| Single Unit, Detached | 1,039 | 75.0% |
| Single Unit, Attached | 104 | 7.5% |
| 2 Unit Apartments | 0 | 0.0% |
| 3 or 4 Unit Apartments | 90 | 6.5% |
| 5 to 9 Unit Apartments | 61 | 4.4% |
| 10 or more Apartments | 0 | 0.0% |
| Mobile Home / Other | 92 | 6.6% |
| Total | 1,386 | 100.0% |
Housing Structures by Occupancy in Pinch
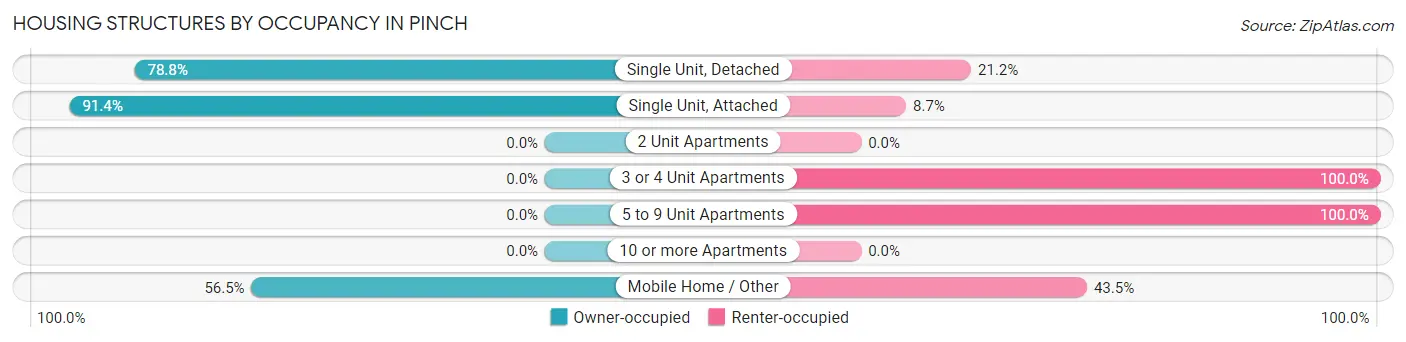
| Structure Type | Owner-occupied | Renter-occupied |
| Single Unit, Detached | 819 (78.8%) | 220 (21.2%) |
| Single Unit, Attached | 95 (91.3%) | 9 (8.6%) |
| 2 Unit Apartments | 0 (0.0%) | 0 (0.0%) |
| 3 or 4 Unit Apartments | 0 (0.0%) | 90 (100.0%) |
| 5 to 9 Unit Apartments | 0 (0.0%) | 61 (100.0%) |
| 10 or more Apartments | 0 (0.0%) | 0 (0.0%) |
| Mobile Home / Other | 52 (56.5%) | 40 (43.5%) |
| Total | 966 (69.7%) | 420 (30.3%) |
Housing Structures by Number of Rooms in Pinch
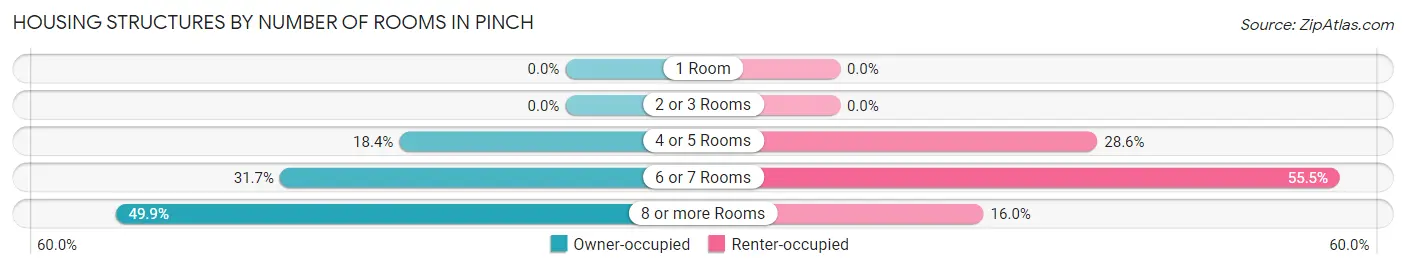
| Number of Rooms | Owner-occupied | Renter-occupied |
| 1 Room | 0 (0.0%) | 0 (0.0%) |
| 2 or 3 Rooms | 0 (0.0%) | 0 (0.0%) |
| 4 or 5 Rooms | 178 (18.4%) | 120 (28.6%) |
| 6 or 7 Rooms | 306 (31.7%) | 233 (55.5%) |
| 8 or more Rooms | 482 (49.9%) | 67 (16.0%) |
| Total | 966 (100.0%) | 420 (100.0%) |
Housing Structure by Heating Type in Pinch
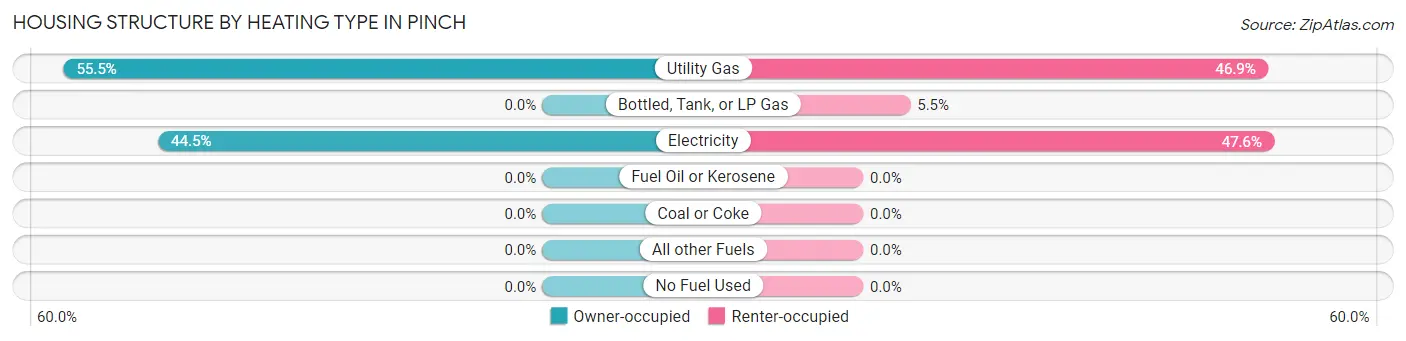
| Heating Type | Owner-occupied | Renter-occupied |
| Utility Gas | 536 (55.5%) | 197 (46.9%) |
| Bottled, Tank, or LP Gas | 0 (0.0%) | 23 (5.5%) |
| Electricity | 430 (44.5%) | 200 (47.6%) |
| Fuel Oil or Kerosene | 0 (0.0%) | 0 (0.0%) |
| Coal or Coke | 0 (0.0%) | 0 (0.0%) |
| All other Fuels | 0 (0.0%) | 0 (0.0%) |
| No Fuel Used | 0 (0.0%) | 0 (0.0%) |
| Total | 966 (100.0%) | 420 (100.0%) |
Household Vehicle Usage in Pinch
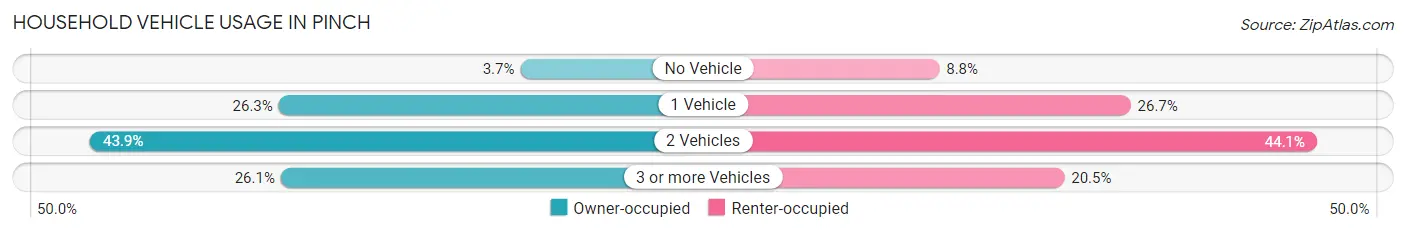
| Vehicles per Household | Owner-occupied | Renter-occupied |
| No Vehicle | 36 (3.7%) | 37 (8.8%) |
| 1 Vehicle | 254 (26.3%) | 112 (26.7%) |
| 2 Vehicles | 424 (43.9%) | 185 (44.1%) |
| 3 or more Vehicles | 252 (26.1%) | 86 (20.5%) |
| Total | 966 (100.0%) | 420 (100.0%) |
Real Estate & Mortgages in Pinch
Real Estate and Mortgage Overview in Pinch
| Characteristic | Without Mortgage | With Mortgage |
| Housing Units | 473 | 493 |
| Median Property Value | $179,700 | $224,000 |
| Median Household Income | $73,910 | $201 |
| Monthly Housing Costs | $449 | $24 |
| Real Estate Taxes | $1,115 | $0 |
Property Value by Mortgage Status in Pinch
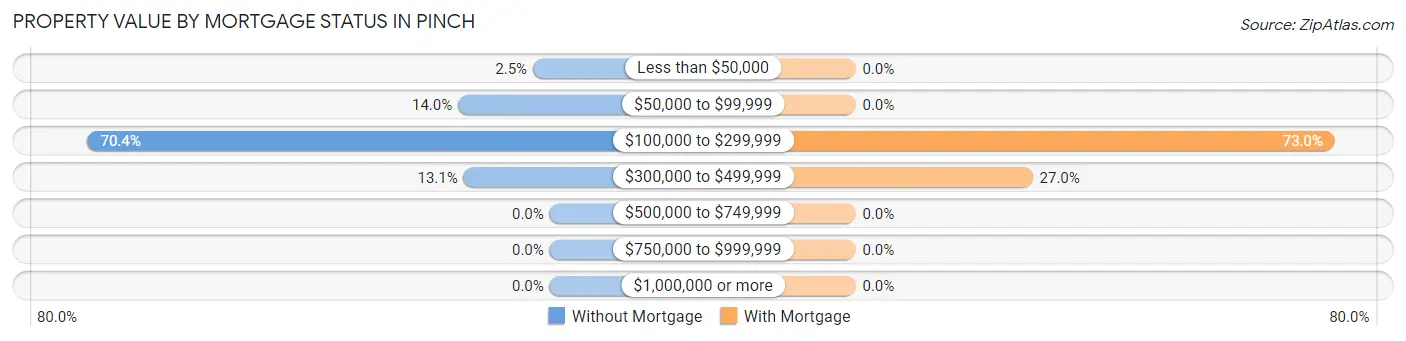
| Property Value | Without Mortgage | With Mortgage |
| Less than $50,000 | 12 (2.5%) | 0 (0.0%) |
| $50,000 to $99,999 | 66 (14.0%) | 0 (0.0%) |
| $100,000 to $299,999 | 333 (70.4%) | 360 (73.0%) |
| $300,000 to $499,999 | 62 (13.1%) | 133 (27.0%) |
| $500,000 to $749,999 | 0 (0.0%) | 0 (0.0%) |
| $750,000 to $999,999 | 0 (0.0%) | 0 (0.0%) |
| $1,000,000 or more | 0 (0.0%) | 0 (0.0%) |
| Total | 473 (100.0%) | 493 (100.0%) |
Household Income by Mortgage Status in Pinch
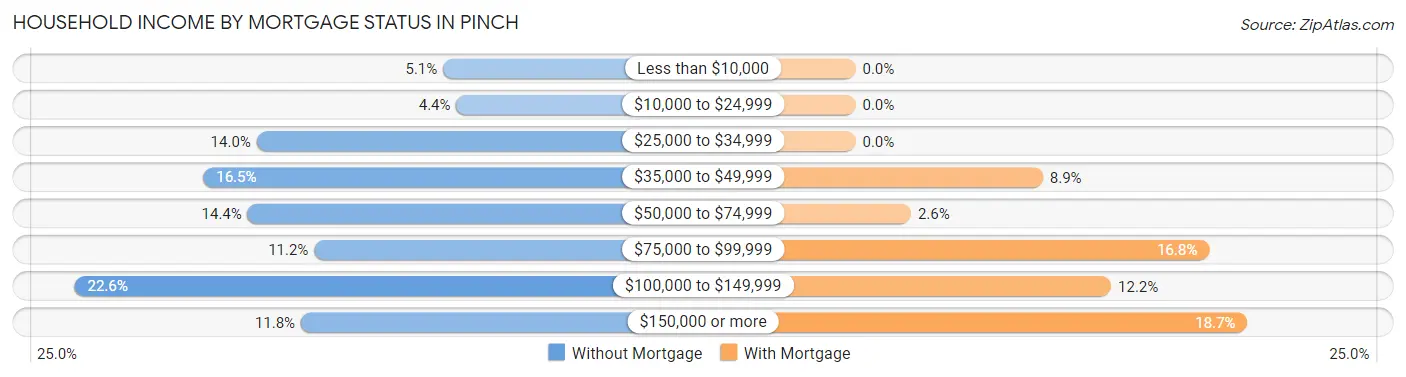
| Household Income | Without Mortgage | With Mortgage |
| Less than $10,000 | 24 (5.1%) | 0 (0.0%) |
| $10,000 to $24,999 | 21 (4.4%) | 0 (0.0%) |
| $25,000 to $34,999 | 66 (14.0%) | 0 (0.0%) |
| $35,000 to $49,999 | 78 (16.5%) | 44 (8.9%) |
| $50,000 to $74,999 | 68 (14.4%) | 13 (2.6%) |
| $75,000 to $99,999 | 53 (11.2%) | 83 (16.8%) |
| $100,000 to $149,999 | 107 (22.6%) | 60 (12.2%) |
| $150,000 or more | 56 (11.8%) | 92 (18.7%) |
| Total | 473 (100.0%) | 493 (100.0%) |
Property Value to Household Income Ratio in Pinch
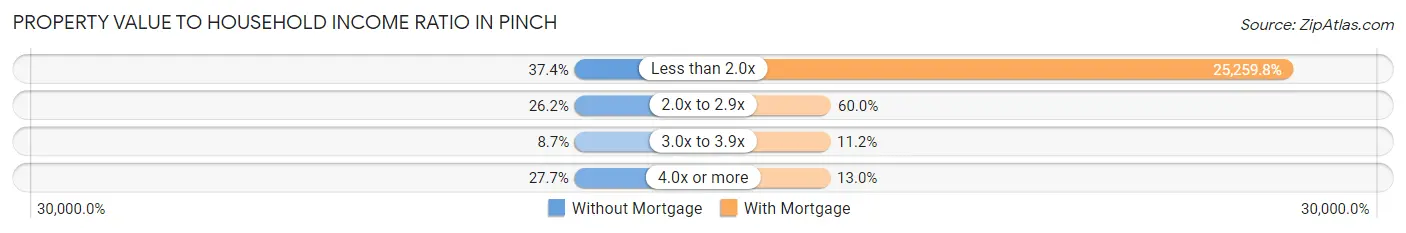
| Value-to-Income Ratio | Without Mortgage | With Mortgage |
| Less than 2.0x | 177 (37.4%) | 124,531 (25,259.8%) |
| 2.0x to 2.9x | 124 (26.2%) | 296 (60.0%) |
| 3.0x to 3.9x | 41 (8.7%) | 55 (11.2%) |
| 4.0x or more | 131 (27.7%) | 64 (13.0%) |
| Total | 473 (100.0%) | 493 (100.0%) |
Real Estate Taxes by Mortgage Status in Pinch
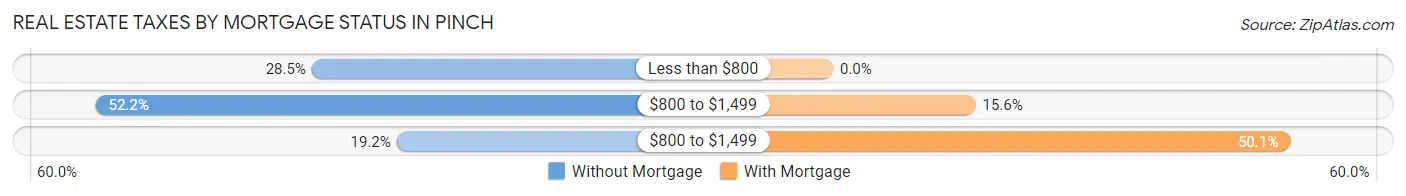
| Property Taxes | Without Mortgage | With Mortgage |
| Less than $800 | 135 (28.5%) | 0 (0.0%) |
| $800 to $1,499 | 247 (52.2%) | 77 (15.6%) |
| $800 to $1,499 | 91 (19.2%) | 247 (50.1%) |
| Total | 473 (100.0%) | 493 (100.0%) |
Health & Disability in Pinch
Health Insurance Coverage by Age in Pinch
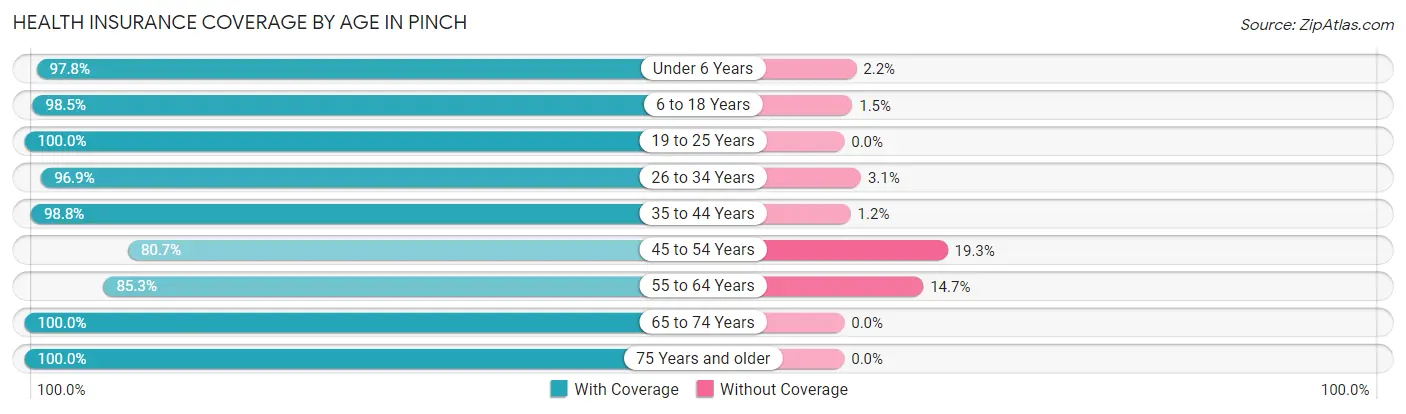
| Age Bracket | With Coverage | Without Coverage |
| Under 6 Years | 392 (97.8%) | 9 (2.2%) |
| 6 to 18 Years | 725 (98.5%) | 11 (1.5%) |
| 19 to 25 Years | 39 (100.0%) | 0 (0.0%) |
| 26 to 34 Years | 280 (96.9%) | 9 (3.1%) |
| 35 to 44 Years | 331 (98.8%) | 4 (1.2%) |
| 45 to 54 Years | 436 (80.7%) | 104 (19.3%) |
| 55 to 64 Years | 452 (85.3%) | 78 (14.7%) |
| 65 to 74 Years | 672 (100.0%) | 0 (0.0%) |
| 75 Years and older | 473 (100.0%) | 0 (0.0%) |
| Total | 3,800 (94.7%) | 215 (5.3%) |
Health Insurance Coverage by Citizenship Status in Pinch
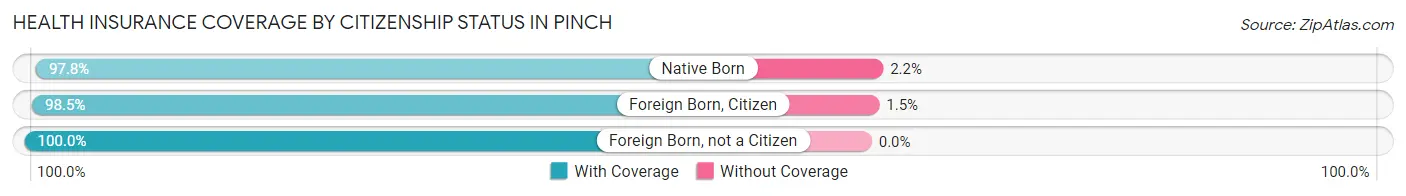
| Citizenship Status | With Coverage | Without Coverage |
| Native Born | 392 (97.8%) | 9 (2.2%) |
| Foreign Born, Citizen | 725 (98.5%) | 11 (1.5%) |
| Foreign Born, not a Citizen | 39 (100.0%) | 0 (0.0%) |
Health Insurance Coverage by Household Income in Pinch
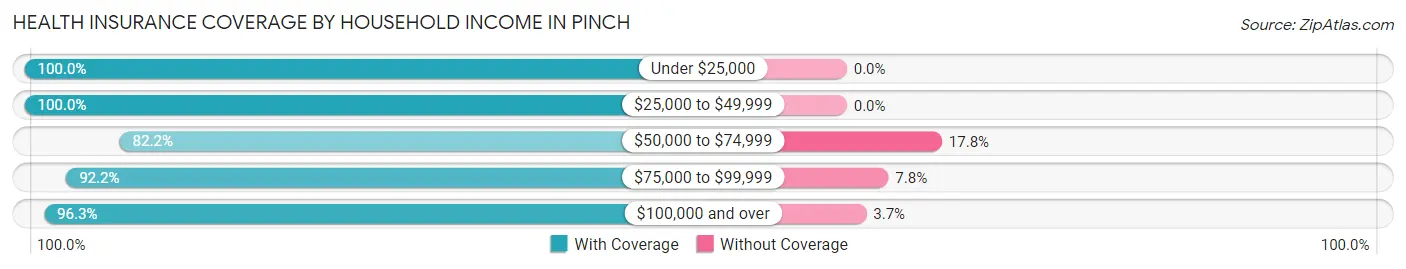
| Household Income | With Coverage | Without Coverage |
| Under $25,000 | 548 (100.0%) | 0 (0.0%) |
| $25,000 to $49,999 | 364 (100.0%) | 0 (0.0%) |
| $50,000 to $74,999 | 498 (82.2%) | 108 (17.8%) |
| $75,000 to $99,999 | 343 (92.2%) | 29 (7.8%) |
| $100,000 and over | 2,047 (96.3%) | 78 (3.7%) |
Public vs Private Health Insurance Coverage by Age in Pinch
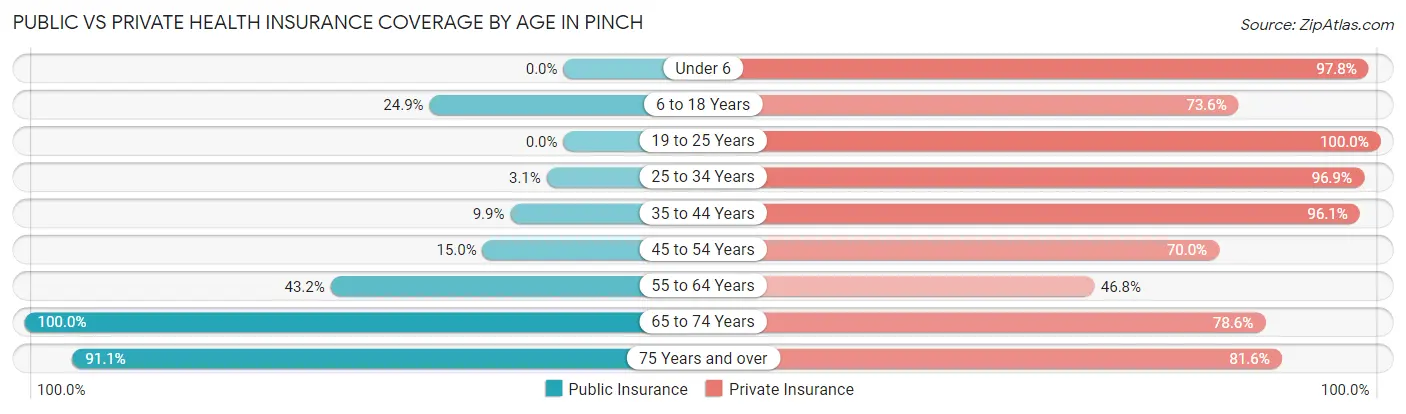
| Age Bracket | Public Insurance | Private Insurance |
| Under 6 | 0 (0.0%) | 392 (97.8%) |
| 6 to 18 Years | 183 (24.9%) | 542 (73.6%) |
| 19 to 25 Years | 0 (0.0%) | 39 (100.0%) |
| 25 to 34 Years | 9 (3.1%) | 280 (96.9%) |
| 35 to 44 Years | 33 (9.9%) | 322 (96.1%) |
| 45 to 54 Years | 81 (15.0%) | 378 (70.0%) |
| 55 to 64 Years | 229 (43.2%) | 248 (46.8%) |
| 65 to 74 Years | 672 (100.0%) | 528 (78.6%) |
| 75 Years and over | 431 (91.1%) | 386 (81.6%) |
| Total | 1,638 (40.8%) | 3,115 (77.6%) |
Disability Status by Sex by Age in Pinch
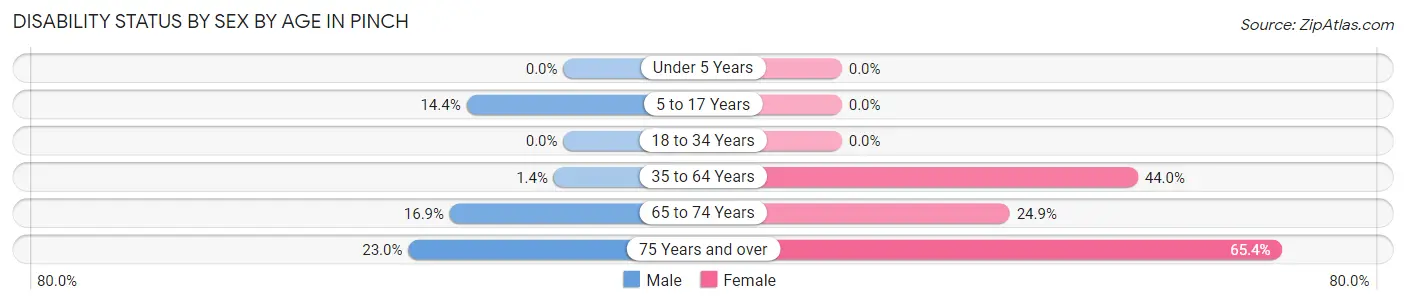
| Age Bracket | Male | Female |
| Under 5 Years | 0 (0.0%) | 0 (0.0%) |
| 5 to 17 Years | 66 (14.4%) | 0 (0.0%) |
| 18 to 34 Years | 0 (0.0%) | 0 (0.0%) |
| 35 to 64 Years | 9 (1.4%) | 338 (44.0%) |
| 65 to 74 Years | 47 (16.9%) | 98 (24.9%) |
| 75 Years and over | 41 (23.0%) | 193 (65.4%) |
Disability Class by Sex by Age in Pinch
Disability Class: Hearing Difficulty
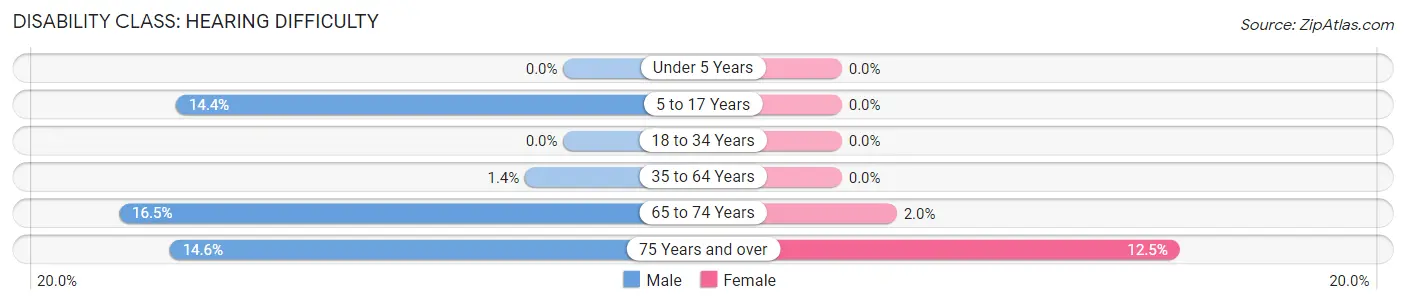
| Age Bracket | Male | Female |
| Under 5 Years | 0 (0.0%) | 0 (0.0%) |
| 5 to 17 Years | 66 (14.4%) | 0 (0.0%) |
| 18 to 34 Years | 0 (0.0%) | 0 (0.0%) |
| 35 to 64 Years | 9 (1.4%) | 0 (0.0%) |
| 65 to 74 Years | 46 (16.5%) | 8 (2.0%) |
| 75 Years and over | 26 (14.6%) | 37 (12.5%) |
Disability Class: Vision Difficulty
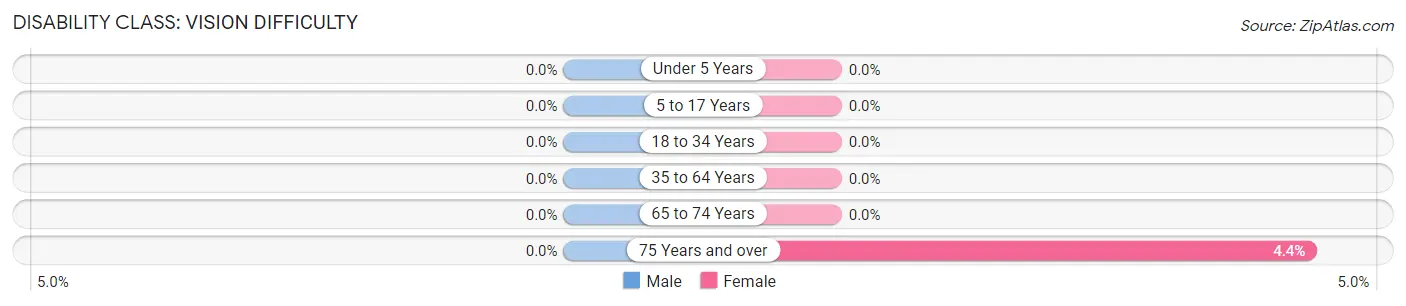
| Age Bracket | Male | Female |
| Under 5 Years | 0 (0.0%) | 0 (0.0%) |
| 5 to 17 Years | 0 (0.0%) | 0 (0.0%) |
| 18 to 34 Years | 0 (0.0%) | 0 (0.0%) |
| 35 to 64 Years | 0 (0.0%) | 0 (0.0%) |
| 65 to 74 Years | 0 (0.0%) | 0 (0.0%) |
| 75 Years and over | 0 (0.0%) | 13 (4.4%) |
Disability Class: Cognitive Difficulty
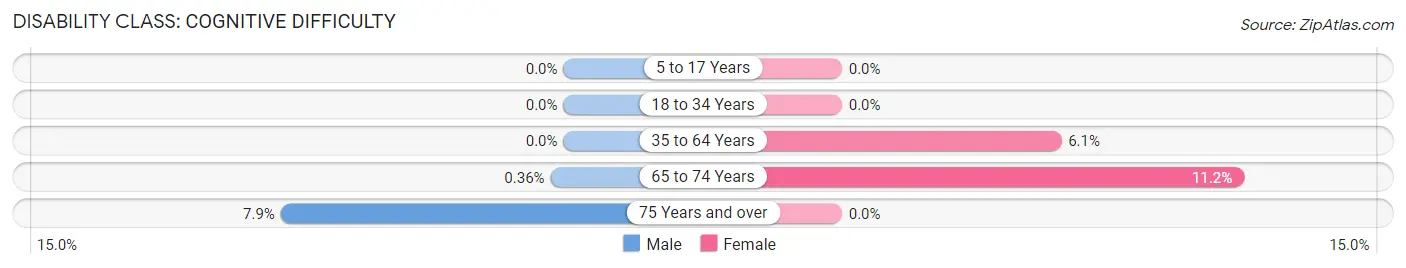
| Age Bracket | Male | Female |
| 5 to 17 Years | 0 (0.0%) | 0 (0.0%) |
| 18 to 34 Years | 0 (0.0%) | 0 (0.0%) |
| 35 to 64 Years | 0 (0.0%) | 47 (6.1%) |
| 65 to 74 Years | 1 (0.4%) | 44 (11.2%) |
| 75 Years and over | 14 (7.9%) | 0 (0.0%) |
Disability Class: Ambulatory Difficulty
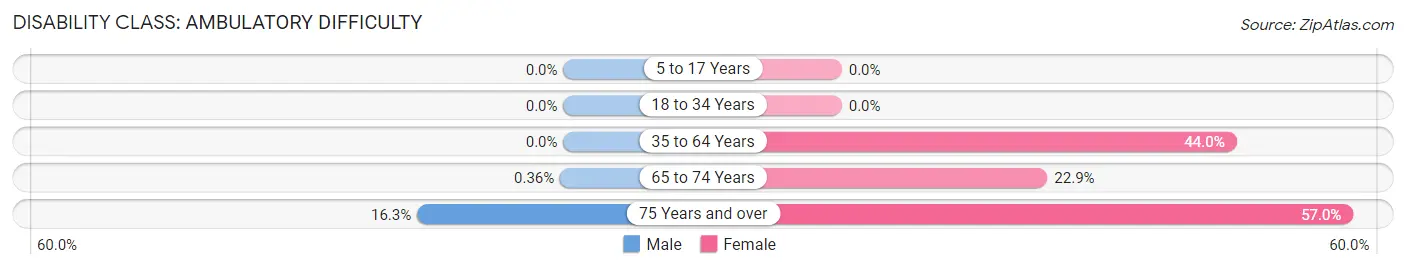
| Age Bracket | Male | Female |
| 5 to 17 Years | 0 (0.0%) | 0 (0.0%) |
| 18 to 34 Years | 0 (0.0%) | 0 (0.0%) |
| 35 to 64 Years | 0 (0.0%) | 338 (44.0%) |
| 65 to 74 Years | 1 (0.4%) | 90 (22.9%) |
| 75 Years and over | 29 (16.3%) | 168 (57.0%) |
Disability Class: Self-Care Difficulty
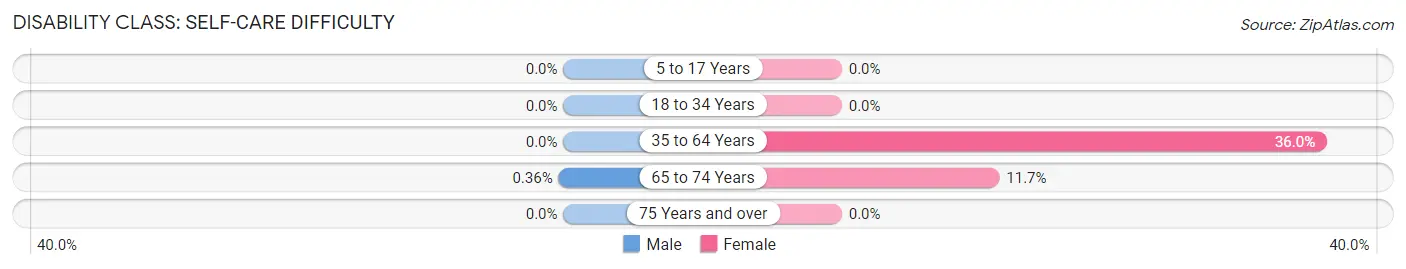
| Age Bracket | Male | Female |
| 5 to 17 Years | 0 (0.0%) | 0 (0.0%) |
| 18 to 34 Years | 0 (0.0%) | 0 (0.0%) |
| 35 to 64 Years | 0 (0.0%) | 277 (36.0%) |
| 65 to 74 Years | 1 (0.4%) | 46 (11.7%) |
| 75 Years and over | 0 (0.0%) | 0 (0.0%) |
Technology Access in Pinch
Computing Device Access in Pinch
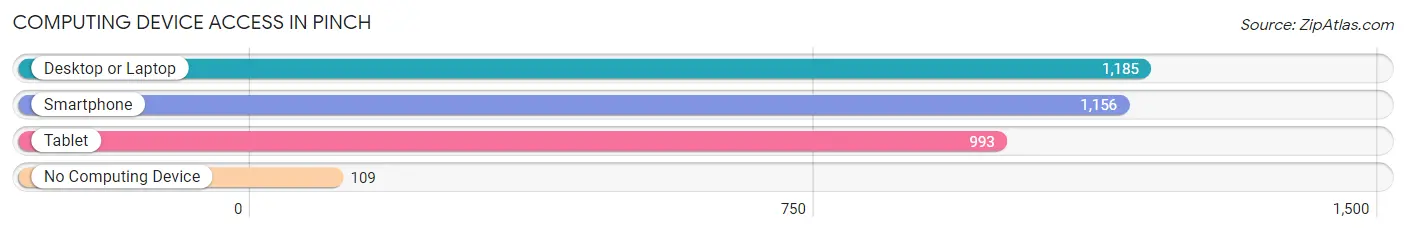
| Device Type | # Households | % Households |
| Desktop or Laptop | 1,185 | 85.5% |
| Smartphone | 1,156 | 83.4% |
| Tablet | 993 | 71.7% |
| No Computing Device | 109 | 7.9% |
| Total | 1,386 | 100.0% |
Internet Access in Pinch
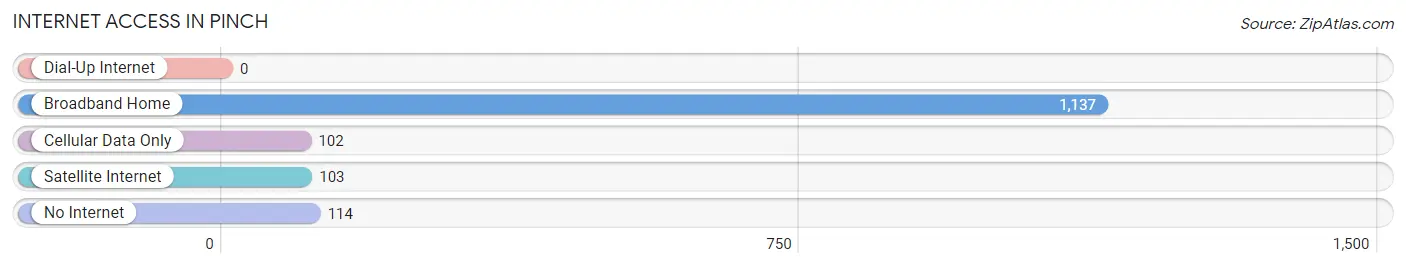
| Internet Type | # Households | % Households |
| Dial-Up Internet | 0 | 0.0% |
| Broadband Home | 1,137 | 82.0% |
| Cellular Data Only | 102 | 7.4% |
| Satellite Internet | 103 | 7.4% |
| No Internet | 114 | 8.2% |
| Total | 1,386 | 100.0% |
Pinch Summary
History
Pinch is an unincorporated community located in Kanawha County, West Virginia. It is situated along the Kanawha River, approximately 10 miles north of Charleston. The community was first settled in the late 1700s by a group of German immigrants. The town was originally known as “Pinchtown” and was named after the Pinch Creek, which runs through the area.
The town was officially incorporated in 1891 and was home to a variety of businesses, including a sawmill, a gristmill, a blacksmith shop, and a general store. The town also had a post office, a school, and a church.
In the early 1900s, the town began to decline as the coal industry in the area began to decline. The town’s population decreased and many of the businesses closed. In the 1950s, the town was almost completely abandoned.
In the late 1970s, the town began to experience a resurgence as people began to move back to the area. The town was revitalized and new businesses began to open. Today, Pinch is a small, rural community with a population of approximately 500 people.
Geography
Pinch is located in Kanawha County, West Virginia. It is situated along the Kanawha River, approximately 10 miles north of Charleston. The town is located in a rural area and is surrounded by rolling hills and farmland. The town is located at an elevation of 845 feet above sea level.
The climate in Pinch is humid and subtropical. Summers are hot and humid, with temperatures reaching into the 90s. Winters are cold and wet, with temperatures dropping into the 20s.
Economy
The economy of Pinch is largely based on agriculture. The town is home to several farms, which produce a variety of crops, including corn, soybeans, and hay. The town also has a few small businesses, including a general store, a gas station, and a restaurant.
The town is also home to a few manufacturing companies, which produce a variety of products, including furniture, clothing, and automotive parts.
Demographics
As of the 2010 census, the population of Pinch was 498. The racial makeup of the town was 97.2% White, 0.6% African American, 0.2% Native American, 0.2% Asian, 0.2% from other races, and 1.8% from two or more races. Hispanic or Latino of any race were 0.8% of the population.
The median household income in Pinch was $30,000, and the median family income was $35,000. The per capita income was $14,000. About 17.2% of the population was below the poverty line.
Common Questions
What is Per Capita Income in Pinch?
Per Capita income in Pinch is $34,114.
What is the Median Family Income in Pinch?
Median Family Income in Pinch is $92,885.
What is the Median Household income in Pinch?
Median Household Income in Pinch is $73,973.
What is Income or Wage Gap in Pinch?
Income or Wage Gap in Pinch is 12.2%.
Women in Pinch earn 87.8 cents for every dollar earned by a man.
What is Inequality or Gini Index in Pinch?
Inequality or Gini Index in Pinch is 0.42.
What is the Total Population of Pinch?
Total Population of Pinch is 4,015.
What is the Total Male Population of Pinch?
Total Male Population of Pinch is 1,720.
What is the Total Female Population of Pinch?
Total Female Population of Pinch is 2,295.
What is the Ratio of Males per 100 Females in Pinch?
There are 74.95 Males per 100 Females in Pinch.
What is the Ratio of Females per 100 Males in Pinch?
There are 133.43 Females per 100 Males in Pinch.
What is the Median Population Age in Pinch?
Median Population Age in Pinch is 50.2 Years.
What is the Average Family Size in Pinch
Average Family Size in Pinch is 3.4 People.
What is the Average Household Size in Pinch
Average Household Size in Pinch is 2.9 People.
How Large is the Labor Force in Pinch?
There are 1,497 People in the Labor Forcein in Pinch.
What is the Percentage of People in the Labor Force in Pinch?
50.0% of People are in the Labor Force in Pinch.
What is the Unemployment Rate in Pinch?
Unemployment Rate in Pinch is 1.8%.