Justin, TX Map & Demographics
Justin Map
Justin Overview
$43,379
PER CAPITA INCOME
$121,629
AVG FAMILY INCOME
$89,932
AVG HOUSEHOLD INCOME
41.4%
WAGE / INCOME GAP [ % ]
58.6¢/ $1
WAGE / INCOME GAP [ $ ]
0.40
INEQUALITY / GINI INDEX
4,731
TOTAL POPULATION
2,530
MALE POPULATION
2,201
FEMALE POPULATION
114.95
MALES / 100 FEMALES
87.00
FEMALES / 100 MALES
39.8
MEDIAN AGE
3.1
AVG FAMILY SIZE
2.6
AVG HOUSEHOLD SIZE
2,549
LABOR FORCE [ PEOPLE ]
69.5%
PERCENT IN LABOR FORCE
6.5%
UNEMPLOYMENT RATE
Justin Zip Codes
Justin Area Codes
Income in Justin
Income Overview in Justin
Per Capita Income in Justin is $43,379, while median incomes of families and households are $121,629 and $89,932 respectively.
| Characteristic | Number | Measure |
| Per Capita Income | 4,731 | $43,379 |
| Median Family Income | 1,311 | $121,629 |
| Mean Family Income | 1,311 | $134,593 |
| Median Household Income | 1,764 | $89,932 |
| Mean Household Income | 1,764 | $111,934 |
| Income Deficit | 1,311 | $0 |
| Wage / Income Gap (%) | 4,731 | 41.36% |
| Wage / Income Gap ($) | 4,731 | 58.64¢ per $1 |
| Gini / Inequality Index | 4,731 | 0.40 |
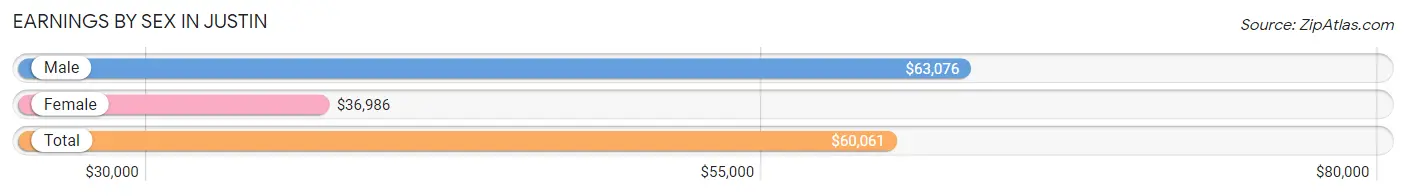
Earnings by Sex in Justin
Average Earnings in Justin are $60,061, $63,076 for men and $36,986 for women, a difference of 41.4%.
| Sex | Number | Average Earnings |
| Male | 1,481 (56.4%) | $63,076 |
| Female | 1,146 (43.6%) | $36,986 |
| Total | 2,627 (100.0%) | $60,061 |
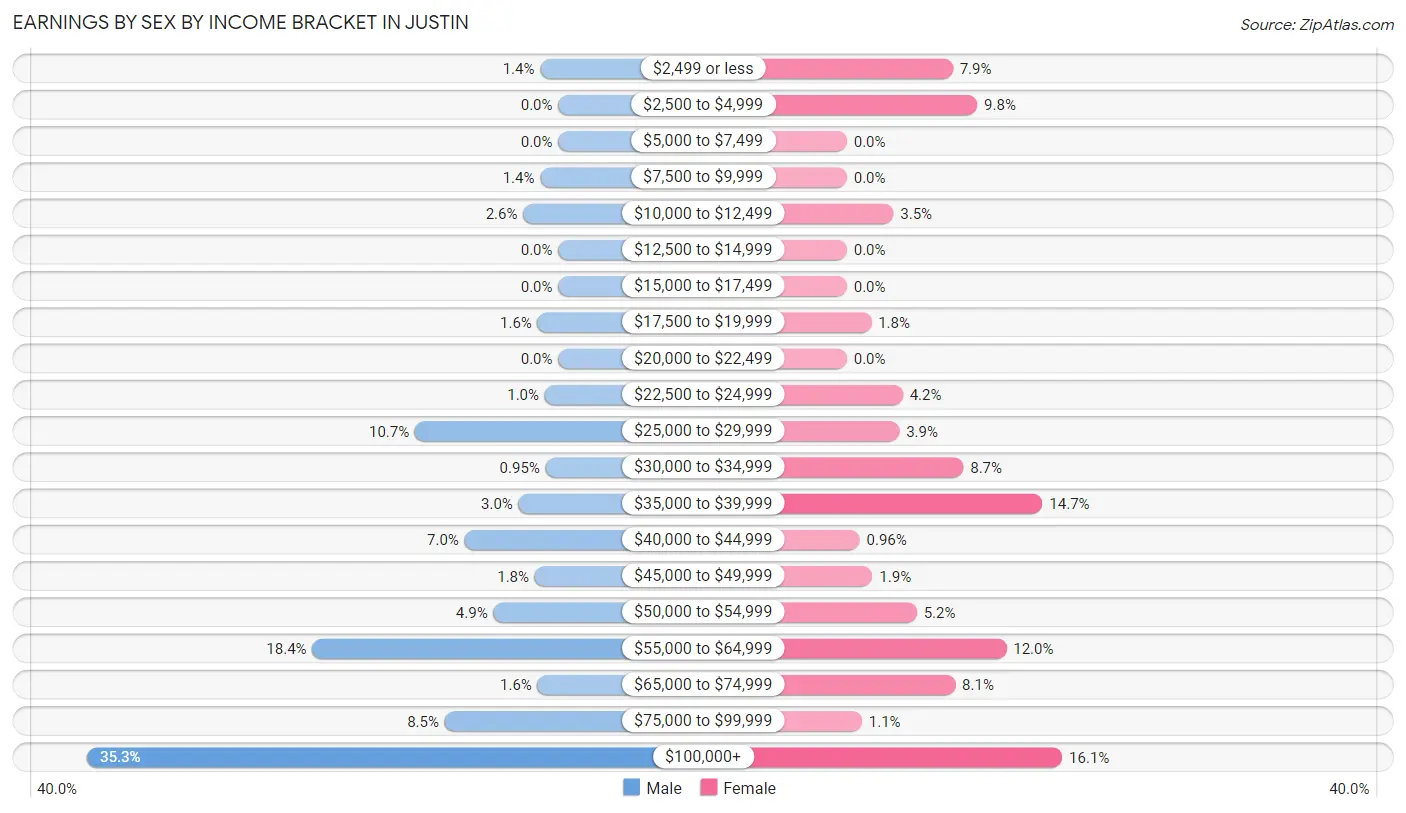
Earnings by Sex by Income Bracket in Justin
The most common earnings brackets in Justin are $100,000+ for men (523 | 35.3%) and $100,000+ for women (185 | 16.1%).
| Income | Male | Female |
| $2,499 or less | 20 (1.3%) | 91 (7.9%) |
| $2,500 to $4,999 | 0 (0.0%) | 112 (9.8%) |
| $5,000 to $7,499 | 0 (0.0%) | 0 (0.0%) |
| $7,500 to $9,999 | 20 (1.3%) | 0 (0.0%) |
| $10,000 to $12,499 | 39 (2.6%) | 40 (3.5%) |
| $12,500 to $14,999 | 0 (0.0%) | 0 (0.0%) |
| $15,000 to $17,499 | 0 (0.0%) | 0 (0.0%) |
| $17,500 to $19,999 | 23 (1.5%) | 21 (1.8%) |
| $20,000 to $22,499 | 0 (0.0%) | 0 (0.0%) |
| $22,500 to $24,999 | 15 (1.0%) | 48 (4.2%) |
| $25,000 to $29,999 | 159 (10.7%) | 45 (3.9%) |
| $30,000 to $34,999 | 14 (0.9%) | 100 (8.7%) |
| $35,000 to $39,999 | 44 (3.0%) | 168 (14.7%) |
| $40,000 to $44,999 | 104 (7.0%) | 11 (1.0%) |
| $45,000 to $49,999 | 26 (1.8%) | 22 (1.9%) |
| $50,000 to $54,999 | 72 (4.9%) | 60 (5.2%) |
| $55,000 to $64,999 | 273 (18.4%) | 137 (11.9%) |
| $65,000 to $74,999 | 23 (1.5%) | 93 (8.1%) |
| $75,000 to $99,999 | 126 (8.5%) | 13 (1.1%) |
| $100,000+ | 523 (35.3%) | 185 (16.1%) |
| Total | 1,481 (100.0%) | 1,146 (100.0%) |
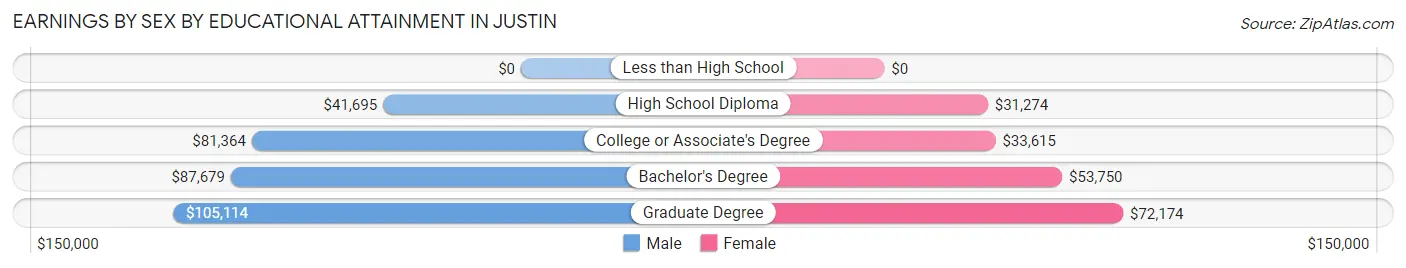
Earnings by Sex by Educational Attainment in Justin
Average earnings in Justin are $64,705 for men and $36,985 for women, a difference of 42.8%. Men with an educational attainment of graduate degree enjoy the highest average annual earnings of $105,114, while those with high school diploma education earn the least with $41,695. Women with an educational attainment of graduate degree earn the most with the average annual earnings of $72,174, while those with high school diploma education have the smallest earnings of $31,274.
| Educational Attainment | Male Income | Female Income |
| Less than High School | - | - |
| High School Diploma | $41,695 | $31,274 |
| College or Associate's Degree | $81,364 | $33,615 |
| Bachelor's Degree | $87,679 | $53,750 |
| Graduate Degree | $105,114 | $72,174 |
| Total | $64,705 | $36,985 |
Family Income in Justin
Family Income Brackets in Justin
According to the Justin family income data, there are 328 families falling into the $100,000 to $149,999 income range, which is the most common income bracket and makes up 25.0% of all families.
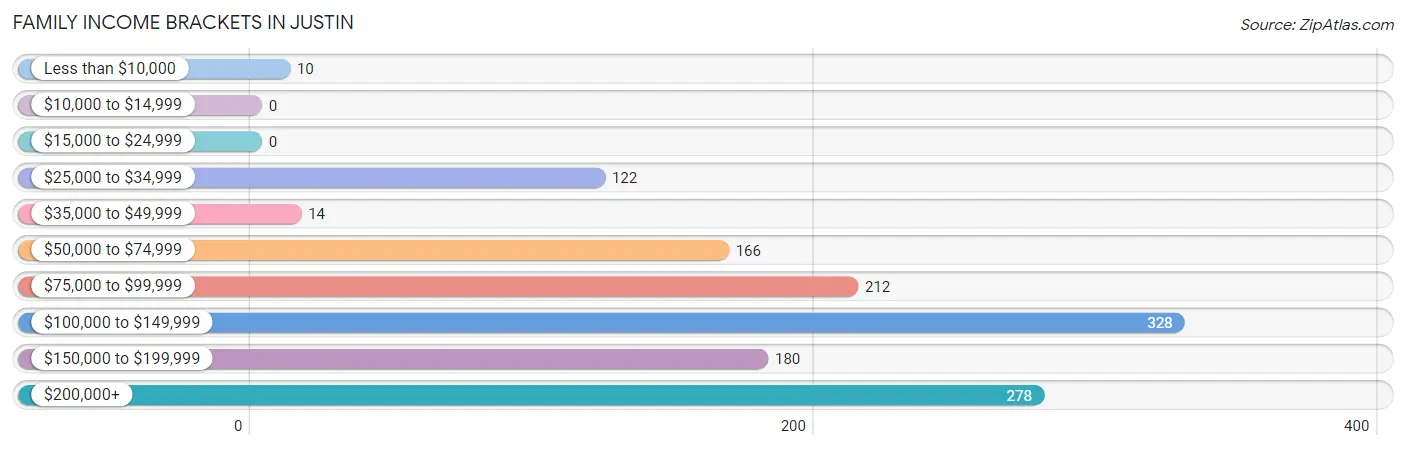
| Income Bracket | # Families | % Families |
| Less than $10,000 | 10 | 0.8% |
| $10,000 to $14,999 | 0 | 0.0% |
| $15,000 to $24,999 | 0 | 0.0% |
| $25,000 to $34,999 | 122 | 9.3% |
| $35,000 to $49,999 | 14 | 1.1% |
| $50,000 to $74,999 | 166 | 12.7% |
| $75,000 to $99,999 | 212 | 16.2% |
| $100,000 to $149,999 | 328 | 25.0% |
| $150,000 to $199,999 | 180 | 13.7% |
| $200,000+ | 278 | 21.2% |
Family Income by Famaliy Size in Justin
2-person families (544 | 41.5%) account for the highest median family income in Justin with $159,659 per family, while 2-person families (544 | 41.5%) have the highest median income of $79,830 per family member.
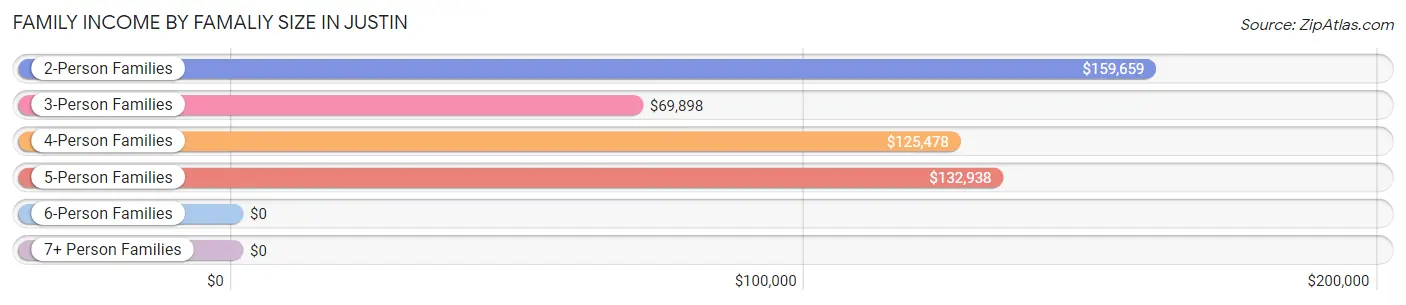
| Income Bracket | # Families | Median Income |
| 2-Person Families | 544 (41.5%) | $159,659 |
| 3-Person Families | 316 (24.1%) | $69,898 |
| 4-Person Families | 224 (17.1%) | $125,478 |
| 5-Person Families | 227 (17.3%) | $132,938 |
| 6-Person Families | 0 (0.0%) | $0 |
| 7+ Person Families | 0 (0.0%) | $0 |
| Total | 1,311 (100.0%) | $121,629 |
Family Income by Number of Earners in Justin
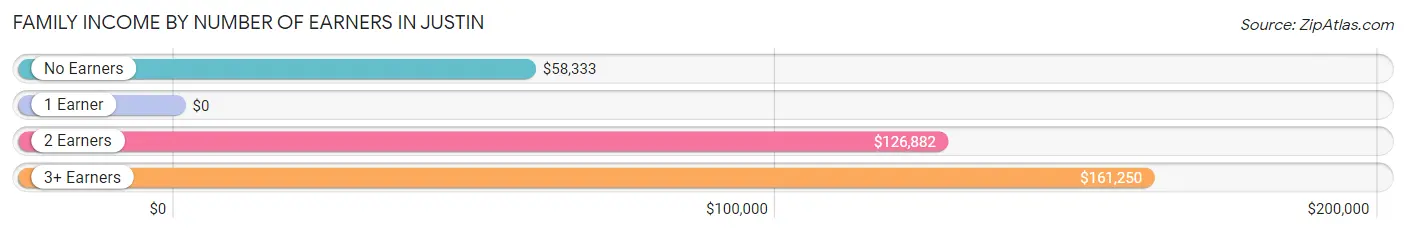
| Number of Earners | # Families | Median Income |
| No Earners | 86 (6.6%) | $58,333 |
| 1 Earner | 259 (19.8%) | $0 |
| 2 Earners | 824 (62.8%) | $126,882 |
| 3+ Earners | 142 (10.8%) | $161,250 |
| Total | 1,311 (100.0%) | $121,629 |
Household Income in Justin
Household Income Brackets in Justin
With 423 households falling in the category, the $100,000 to $149,999 income range is the most frequent in Justin, accounting for 24.0% of all households. In contrast, only 16 households (0.9%) fall into the $35,000 to $49,999 income bracket, making it the least populous group.
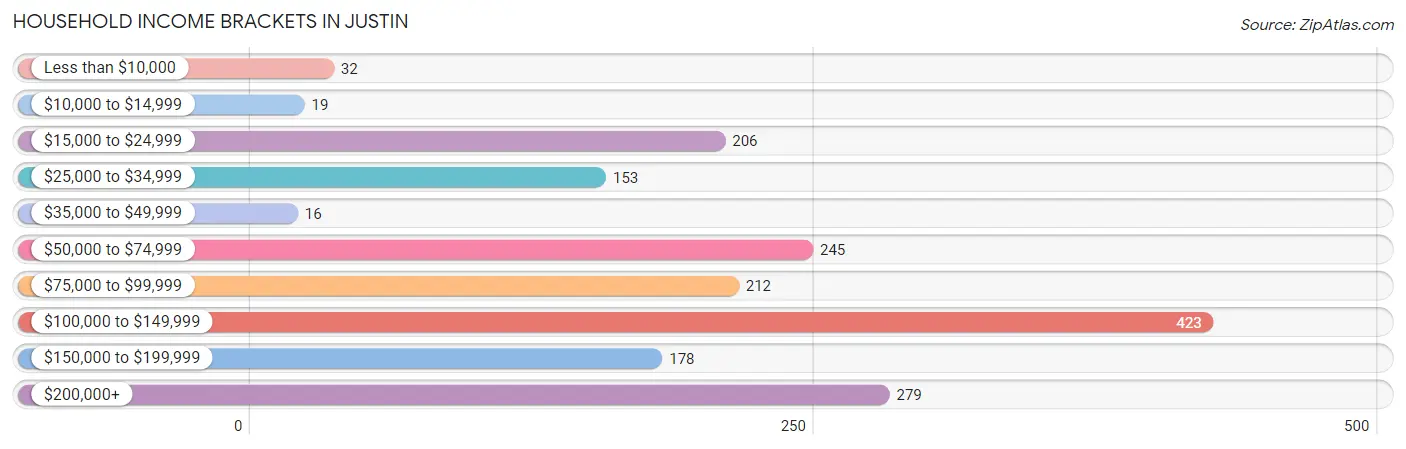
| Income Bracket | # Households | % Households |
| Less than $10,000 | 32 | 1.8% |
| $10,000 to $14,999 | 19 | 1.1% |
| $15,000 to $24,999 | 206 | 11.7% |
| $25,000 to $34,999 | 153 | 8.7% |
| $35,000 to $49,999 | 16 | 0.9% |
| $50,000 to $74,999 | 245 | 13.9% |
| $75,000 to $99,999 | 212 | 12.0% |
| $100,000 to $149,999 | 423 | 24.0% |
| $150,000 to $199,999 | 178 | 10.1% |
| $200,000+ | 279 | 15.8% |
Household Income by Householder Age in Justin
The median household income in Justin is $89,932, with the highest median household income of $133,690 found in the 45 to 64 years age bracket for the primary householder. A total of 832 households (47.2%) fall into this category.
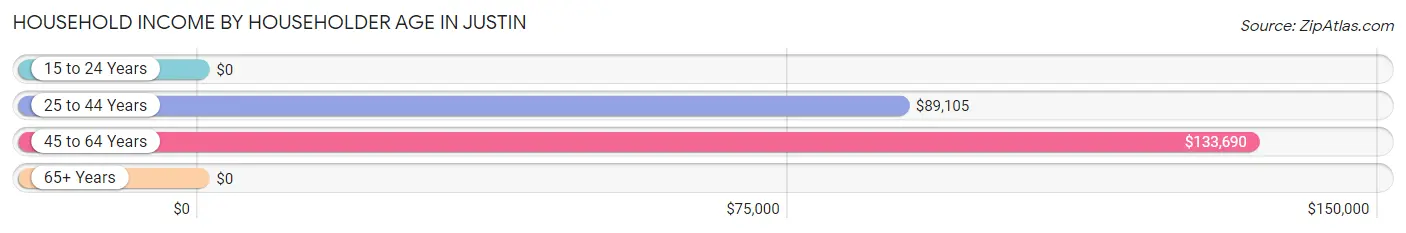
| Income Bracket | # Households | Median Income |
| 15 to 24 Years | 0 (0.0%) | $0 |
| 25 to 44 Years | 529 (30.0%) | $89,105 |
| 45 to 64 Years | 832 (47.2%) | $133,690 |
| 65+ Years | 403 (22.9%) | $0 |
| Total | 1,764 (100.0%) | $89,932 |
Poverty in Justin
Income Below Poverty by Sex and Age in Justin
With 0.4% poverty level for males and 3.7% for females among the residents of Justin, 35 to 44 year old males and 12 to 14 year old females are the most vulnerable to poverty, with 10 males (2.8%) and 9 females (21.4%) in their respective age groups living below the poverty level.
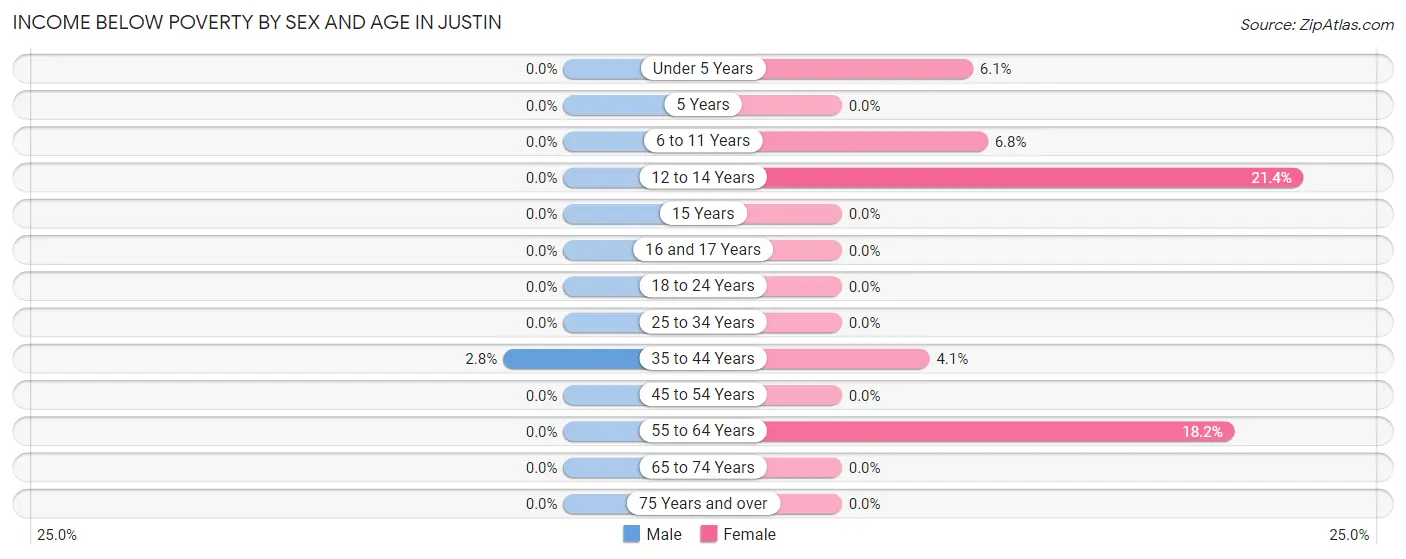
| Age Bracket | Male | Female |
| Under 5 Years | 0 (0.0%) | 9 (6.1%) |
| 5 Years | 0 (0.0%) | 0 (0.0%) |
| 6 to 11 Years | 0 (0.0%) | 9 (6.8%) |
| 12 to 14 Years | 0 (0.0%) | 9 (21.4%) |
| 15 Years | 0 (0.0%) | 0 (0.0%) |
| 16 and 17 Years | 0 (0.0%) | 0 (0.0%) |
| 18 to 24 Years | 0 (0.0%) | 0 (0.0%) |
| 25 to 34 Years | 0 (0.0%) | 0 (0.0%) |
| 35 to 44 Years | 10 (2.8%) | 10 (4.1%) |
| 45 to 54 Years | 0 (0.0%) | 0 (0.0%) |
| 55 to 64 Years | 0 (0.0%) | 41 (18.2%) |
| 65 to 74 Years | 0 (0.0%) | 0 (0.0%) |
| 75 Years and over | 0 (0.0%) | 0 (0.0%) |
| Total | 10 (0.4%) | 78 (3.7%) |
Income Above Poverty by Sex and Age in Justin
According to the poverty statistics in Justin, males aged under 5 years and females aged 15 years are the age groups that are most secure financially, with 100.0% of males and 100.0% of females in these age groups living above the poverty line.
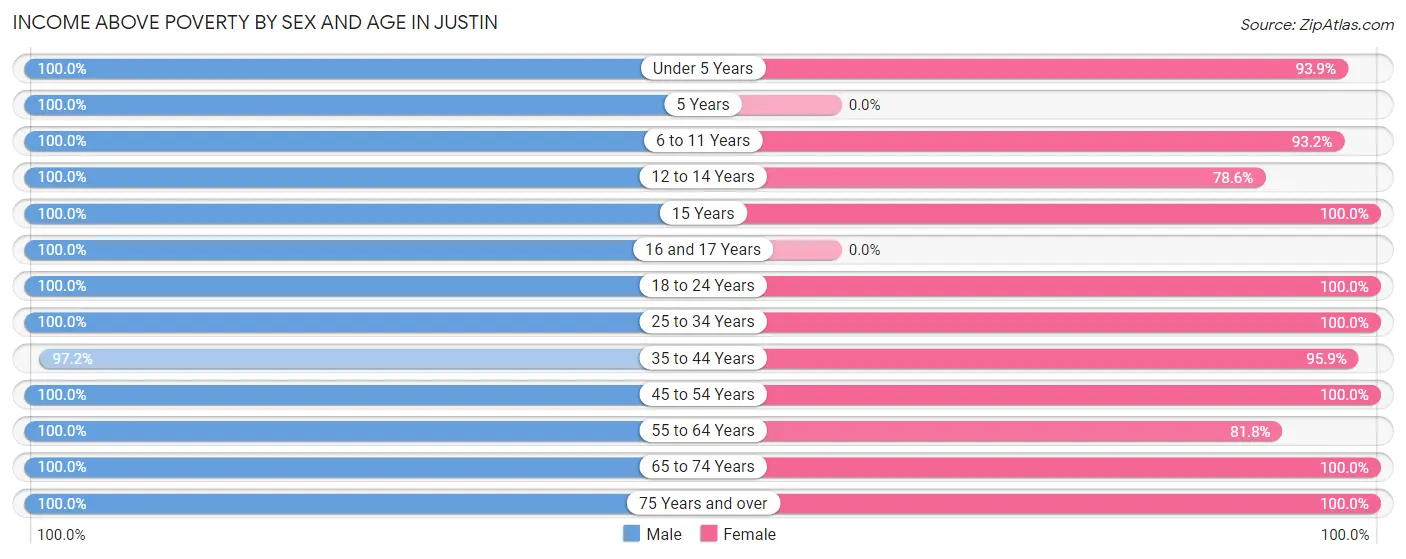
| Age Bracket | Male | Female |
| Under 5 Years | 267 (100.0%) | 139 (93.9%) |
| 5 Years | 25 (100.0%) | 0 (0.0%) |
| 6 to 11 Years | 258 (100.0%) | 124 (93.2%) |
| 12 to 14 Years | 148 (100.0%) | 33 (78.6%) |
| 15 Years | 25 (100.0%) | 18 (100.0%) |
| 16 and 17 Years | 185 (100.0%) | 0 (0.0%) |
| 18 to 24 Years | 96 (100.0%) | 155 (100.0%) |
| 25 to 34 Years | 261 (100.0%) | 325 (100.0%) |
| 35 to 44 Years | 347 (97.2%) | 236 (95.9%) |
| 45 to 54 Years | 524 (100.0%) | 444 (100.0%) |
| 55 to 64 Years | 190 (100.0%) | 184 (81.8%) |
| 65 to 74 Years | 82 (100.0%) | 175 (100.0%) |
| 75 Years and over | 64 (100.0%) | 211 (100.0%) |
| Total | 2,472 (99.6%) | 2,044 (96.3%) |
Income Below Poverty Among Married-Couple Families in Justin
The poverty statistics for married-couple families in Justin show that 0.9% or 10 of the total 1,158 families live below the poverty line. Families with 3 or 4 children have the highest poverty rate of 4.9%, comprising of 10 families. On the other hand, families with no children have the lowest poverty rate of 0.0%, which includes 0 families.
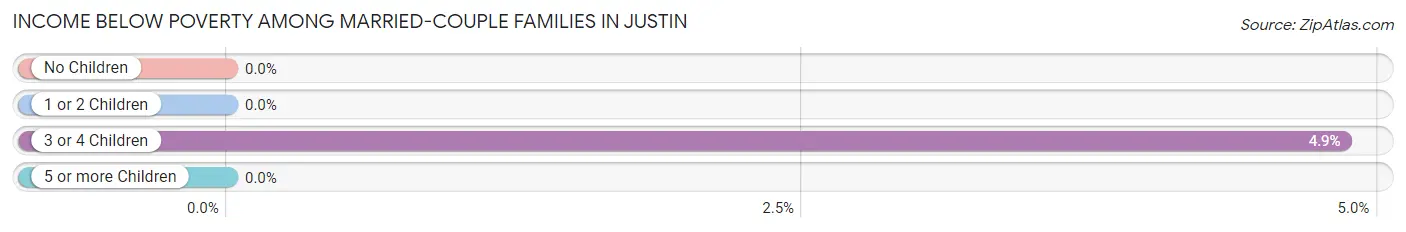
| Children | Above Poverty | Below Poverty |
| No Children | 591 (100.0%) | 0 (0.0%) |
| 1 or 2 Children | 361 (100.0%) | 0 (0.0%) |
| 3 or 4 Children | 196 (95.2%) | 10 (4.9%) |
| 5 or more Children | 0 (0.0%) | 0 (0.0%) |
| Total | 1,148 (99.1%) | 10 (0.9%) |
Income Below Poverty Among Single-Parent Households in Justin
| Children | Single Father | Single Mother |
| No Children | 0 (0.0%) | 0 (0.0%) |
| 1 or 2 Children | 0 (0.0%) | 0 (0.0%) |
| 3 or 4 Children | 0 (0.0%) | 0 (0.0%) |
| 5 or more Children | 0 (0.0%) | 0 (0.0%) |
| Total | 0 (0.0%) | 0 (0.0%) |
Income Below Poverty Among Married-Couple vs Single-Parent Households in Justin
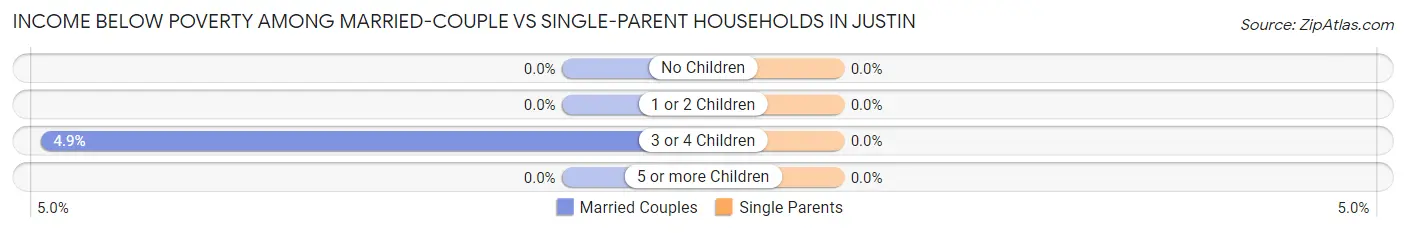
| Children | Married-Couple Families | Single-Parent Households |
| No Children | 0 (0.0%) | 0 (0.0%) |
| 1 or 2 Children | 0 (0.0%) | 0 (0.0%) |
| 3 or 4 Children | 10 (4.9%) | 0 (0.0%) |
| 5 or more Children | 0 (0.0%) | 0 (0.0%) |
| Total | 10 (0.9%) | 0 (0.0%) |
Race in Justin
The most populous races in Justin are White / Caucasian (3,408 | 72.0%), Two or more Races (826 | 17.5%), and Hispanic or Latino (795 | 16.8%).
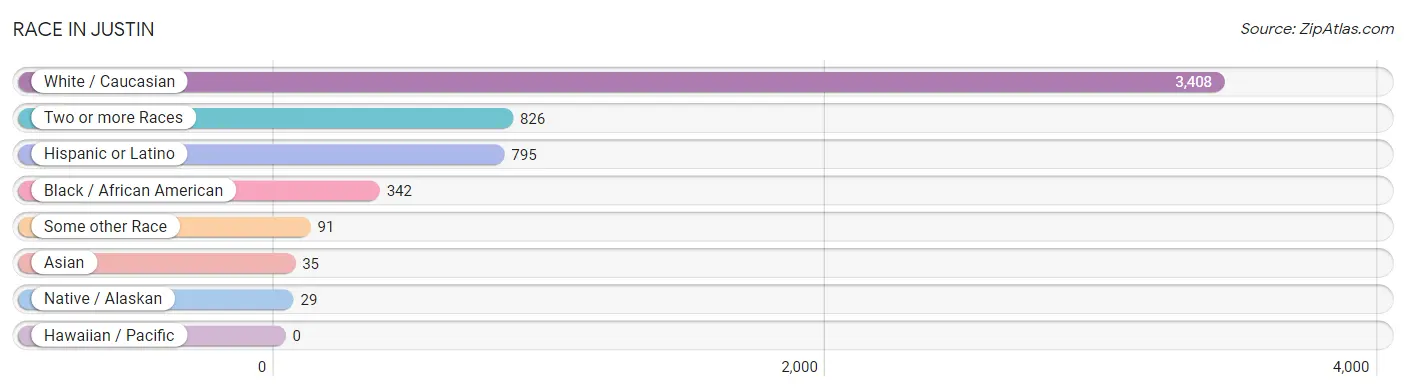
| Race | # Population | % Population |
| Asian | 35 | 0.7% |
| Black / African American | 342 | 7.2% |
| Hawaiian / Pacific | 0 | 0.0% |
| Hispanic or Latino | 795 | 16.8% |
| Native / Alaskan | 29 | 0.6% |
| White / Caucasian | 3,408 | 72.0% |
| Two or more Races | 826 | 17.5% |
| Some other Race | 91 | 1.9% |
| Total | 4,731 | 100.0% |
Ancestry in Justin
The most populous ancestries reported in Justin are German (1,074 | 22.7%), English (665 | 14.1%), Mexican (640 | 13.5%), Irish (428 | 9.0%), and American (345 | 7.3%), together accounting for 66.6% of all Justin residents.
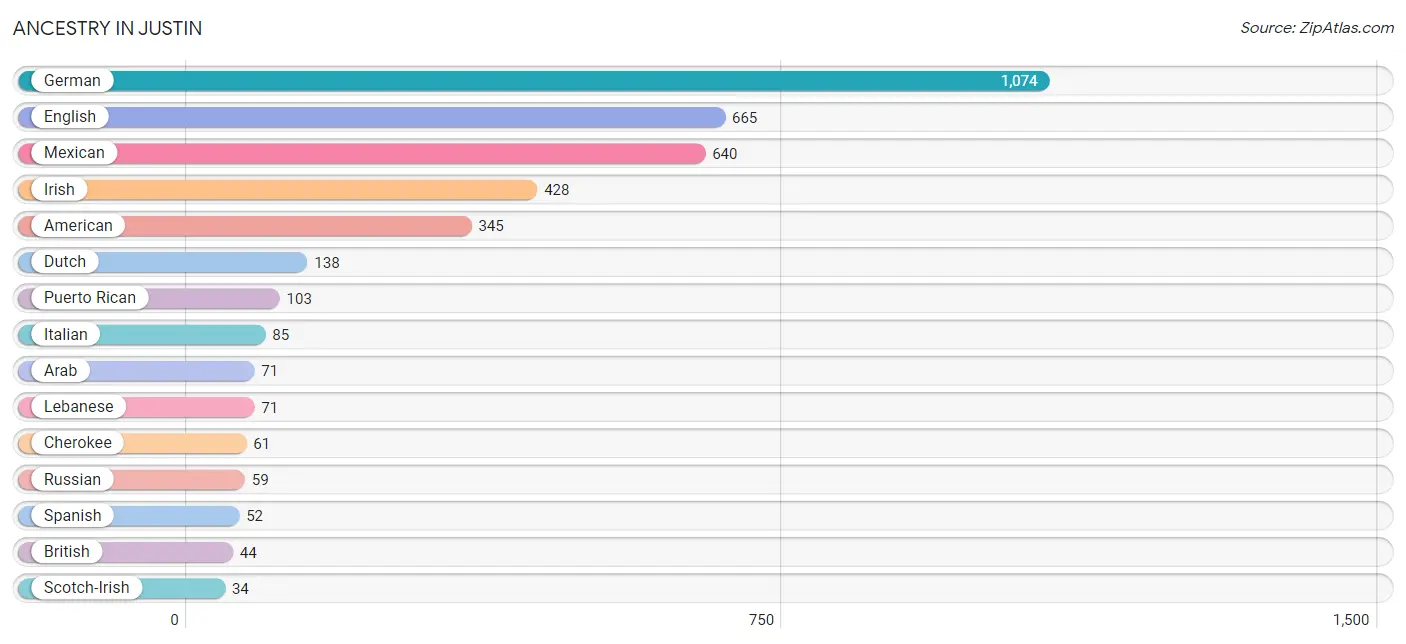
| Ancestry | # Population | % Population |
| American | 345 | 7.3% |
| Arab | 71 | 1.5% |
| British | 44 | 0.9% |
| Burmese | 28 | 0.6% |
| Cherokee | 61 | 1.3% |
| Choctaw | 6 | 0.1% |
| Danish | 11 | 0.2% |
| Dutch | 138 | 2.9% |
| English | 665 | 14.1% |
| European | 22 | 0.5% |
| German | 1,074 | 22.7% |
| Greek | 31 | 0.7% |
| Irish | 428 | 9.0% |
| Italian | 85 | 1.8% |
| Korean | 22 | 0.5% |
| Lebanese | 71 | 1.5% |
| Mexican | 640 | 13.5% |
| Norwegian | 20 | 0.4% |
| Puerto Rican | 103 | 2.2% |
| Russian | 59 | 1.3% |
| Scotch-Irish | 34 | 0.7% |
| Scottish | 23 | 0.5% |
| Spanish | 52 | 1.1% |
| Swedish | 17 | 0.4% |
| Thai | 7 | 0.2% |
| Ukrainian | 18 | 0.4% |
| Welsh | 32 | 0.7% | View All 27 Rows |
Immigrants in Justin
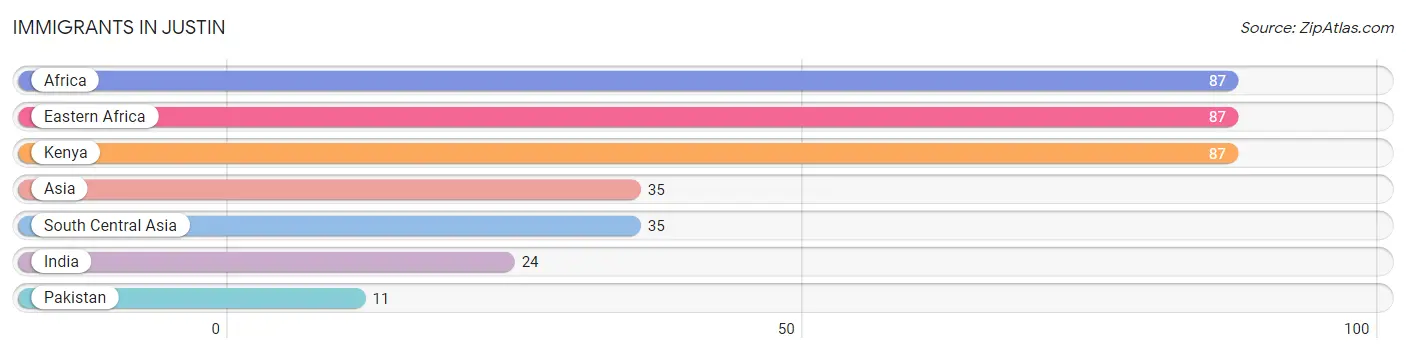
The most numerous immigrant groups reported in Justin came from Africa (87 | 1.8%), Eastern Africa (87 | 1.8%), Kenya (87 | 1.8%), Asia (35 | 0.7%), and South Central Asia (35 | 0.7%), together accounting for 7.0% of all Justin residents.
| Immigration Origin | # Population | % Population |
| Africa | 87 | 1.8% |
| Asia | 35 | 0.7% |
| Eastern Africa | 87 | 1.8% |
| India | 24 | 0.5% |
| Kenya | 87 | 1.8% |
| Pakistan | 11 | 0.2% |
| South Central Asia | 35 | 0.7% | View All 7 Rows |
Sex and Age in Justin
Sex and Age in Justin
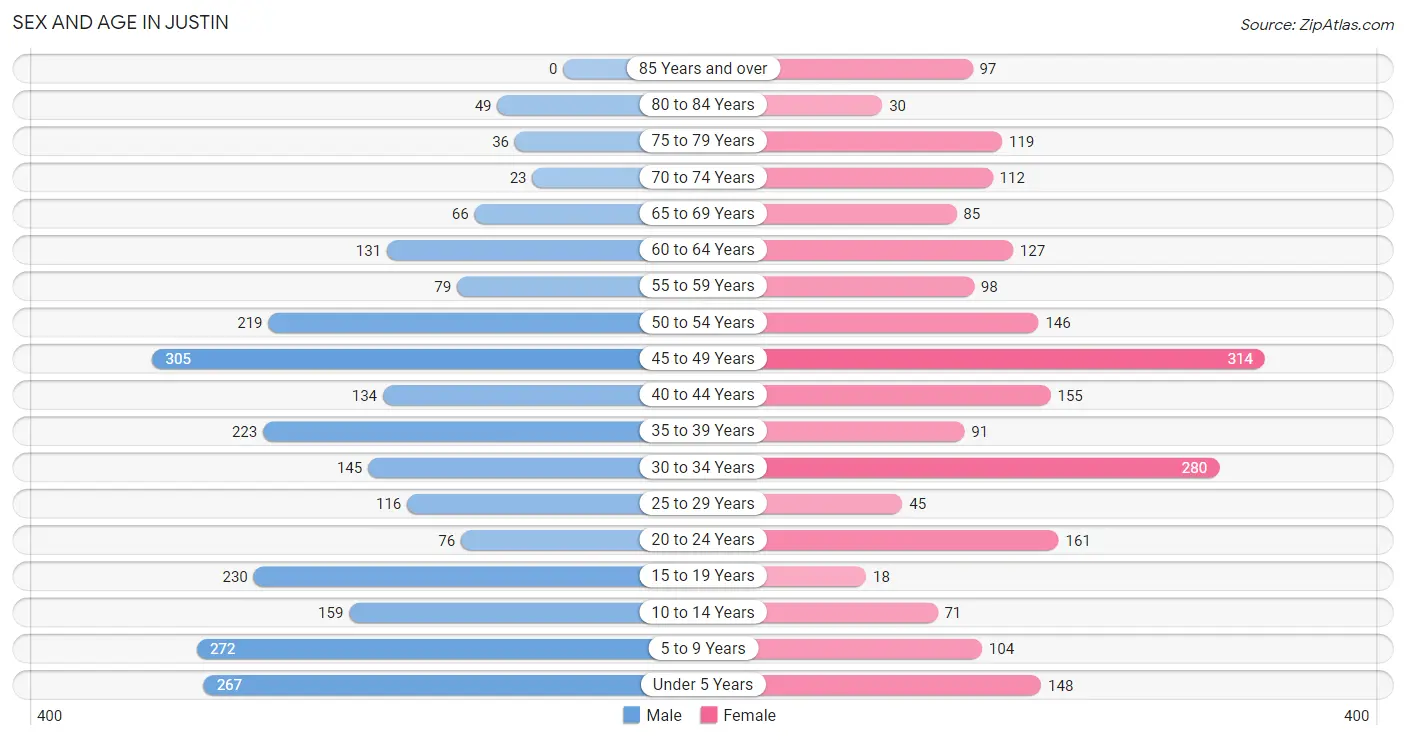
The most populous age groups in Justin are 45 to 49 Years (305 | 12.1%) for men and 45 to 49 Years (314 | 14.3%) for women.
| Age Bracket | Male | Female |
| Under 5 Years | 267 (10.5%) | 148 (6.7%) |
| 5 to 9 Years | 272 (10.7%) | 104 (4.7%) |
| 10 to 14 Years | 159 (6.3%) | 71 (3.2%) |
| 15 to 19 Years | 230 (9.1%) | 18 (0.8%) |
| 20 to 24 Years | 76 (3.0%) | 161 (7.3%) |
| 25 to 29 Years | 116 (4.6%) | 45 (2.0%) |
| 30 to 34 Years | 145 (5.7%) | 280 (12.7%) |
| 35 to 39 Years | 223 (8.8%) | 91 (4.1%) |
| 40 to 44 Years | 134 (5.3%) | 155 (7.0%) |
| 45 to 49 Years | 305 (12.1%) | 314 (14.3%) |
| 50 to 54 Years | 219 (8.7%) | 146 (6.6%) |
| 55 to 59 Years | 79 (3.1%) | 98 (4.4%) |
| 60 to 64 Years | 131 (5.2%) | 127 (5.8%) |
| 65 to 69 Years | 66 (2.6%) | 85 (3.9%) |
| 70 to 74 Years | 23 (0.9%) | 112 (5.1%) |
| 75 to 79 Years | 36 (1.4%) | 119 (5.4%) |
| 80 to 84 Years | 49 (1.9%) | 30 (1.4%) |
| 85 Years and over | 0 (0.0%) | 97 (4.4%) |
| Total | 2,530 (100.0%) | 2,201 (100.0%) |
Families and Households in Justin
Median Family Size in Justin
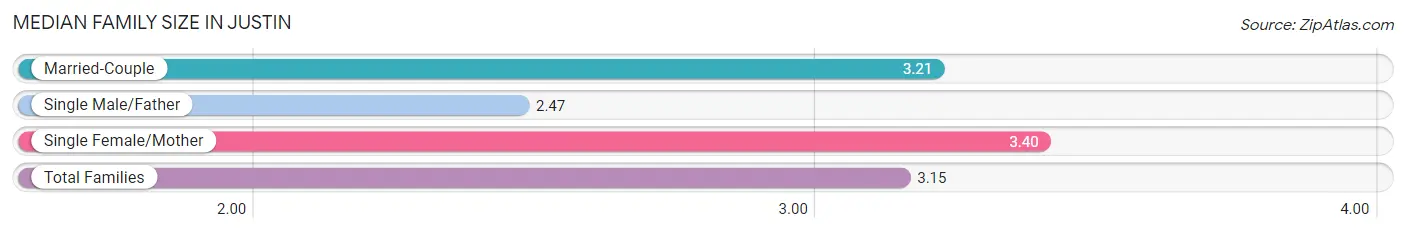
The median family size in Justin is 3.15 persons per family, with single female/mother families (45 | 3.4%) accounting for the largest median family size of 3.4 persons per family. On the other hand, single male/father families (108 | 8.2%) represent the smallest median family size with 2.47 persons per family.
| Family Type | # Families | Family Size |
| Married-Couple | 1,158 (88.3%) | 3.21 |
| Single Male/Father | 108 (8.2%) | 2.47 |
| Single Female/Mother | 45 (3.4%) | 3.40 |
| Total Families | 1,311 (100.0%) | 3.15 |
Median Household Size in Justin
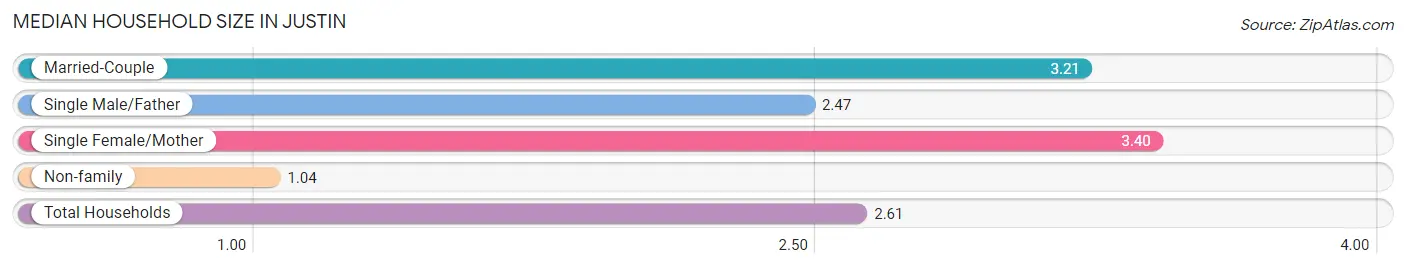
The median household size in Justin is 2.61 persons per household, with single female/mother households (45 | 2.5%) accounting for the largest median household size of 3.4 persons per household. non-family households (453 | 25.7%) represent the smallest median household size with 1.04 persons per household.
| Household Type | # Households | Household Size |
| Married-Couple | 1,158 (65.6%) | 3.21 |
| Single Male/Father | 108 (6.1%) | 2.47 |
| Single Female/Mother | 45 (2.5%) | 3.40 |
| Non-family | 453 (25.7%) | 1.04 |
| Total Households | 1,764 (100.0%) | 2.61 |
Household Size by Marriage Status in Justin
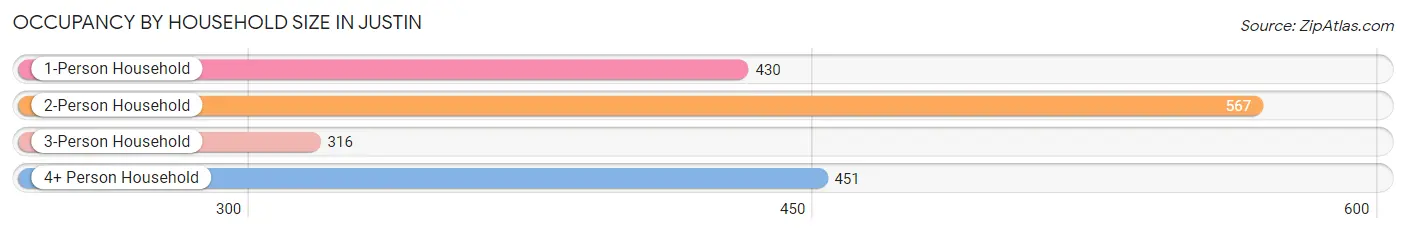
Out of a total of 1,764 households in Justin, 1,311 (74.3%) are family households, while 453 (25.7%) are nonfamily households. The most numerous type of family households are 2-person households, comprising 544, and the most common type of nonfamily households are 1-person households, comprising 430.
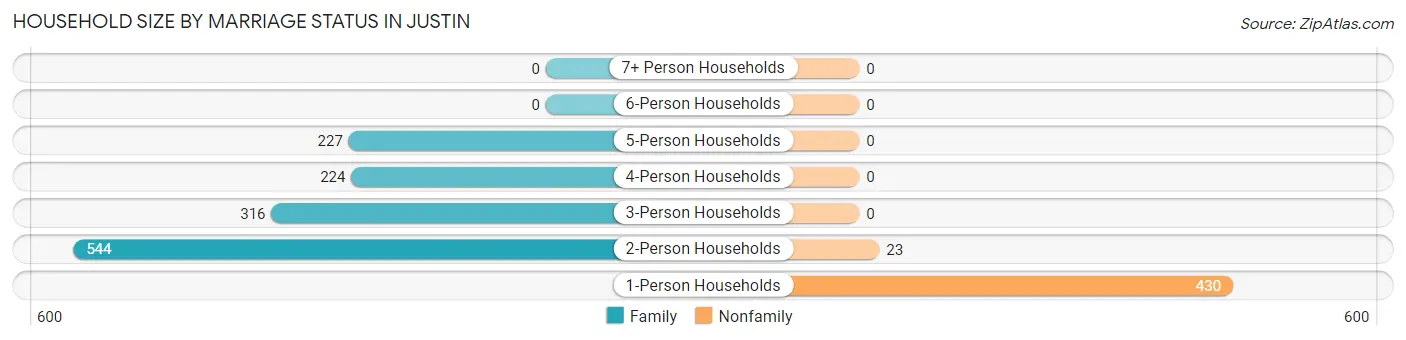
| Household Size | Family Households | Nonfamily Households |
| 1-Person Households | - | 430 (24.4%) |
| 2-Person Households | 544 (30.8%) | 23 (1.3%) |
| 3-Person Households | 316 (17.9%) | 0 (0.0%) |
| 4-Person Households | 224 (12.7%) | 0 (0.0%) |
| 5-Person Households | 227 (12.9%) | 0 (0.0%) |
| 6-Person Households | 0 (0.0%) | 0 (0.0%) |
| 7+ Person Households | 0 (0.0%) | 0 (0.0%) |
| Total | 1,311 (74.3%) | 453 (25.7%) |
Female Fertility in Justin
Fertility by Age in Justin
Average fertility rate in Justin is 73.0 births per 1,000 women. Women in the age bracket of 20 to 34 years have the highest fertility rate with 169.0 births per 1,000 women. Women in the age bracket of 20 to 34 years acount for 100.0% of all women with births.
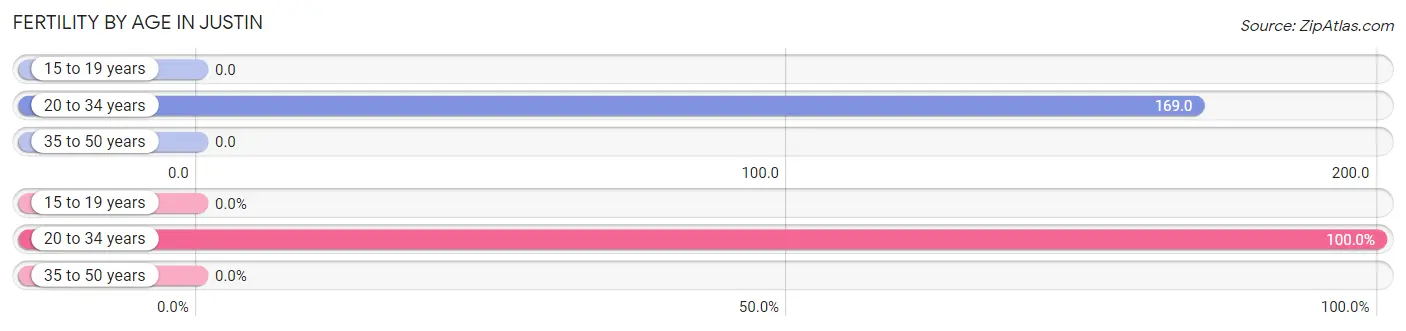
| Age Bracket | Women with Births | Births / 1,000 Women |
| 15 to 19 years | 0 (0.0%) | 0.0 |
| 20 to 34 years | 82 (100.0%) | 169.0 |
| 35 to 50 years | 0 (0.0%) | 0.0 |
| Total | 82 (100.0%) | 73.0 |
Fertility by Age by Marriage Status in Justin
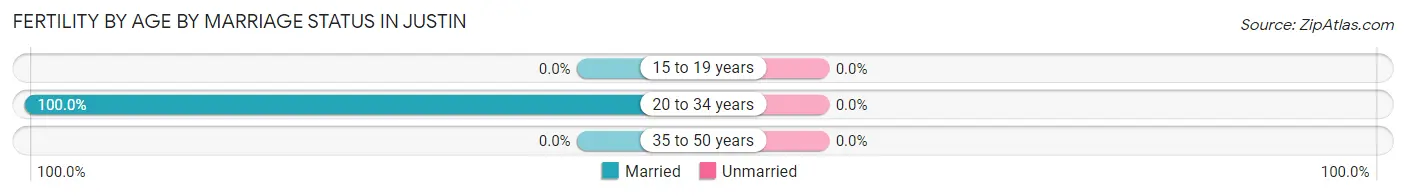
| Age Bracket | Married | Unmarried |
| 15 to 19 years | 0 (0.0%) | 0 (0.0%) |
| 20 to 34 years | 82 (100.0%) | 0 (0.0%) |
| 35 to 50 years | 0 (0.0%) | 0 (0.0%) |
| Total | 82 (100.0%) | 0 (0.0%) |
Fertility by Education in Justin
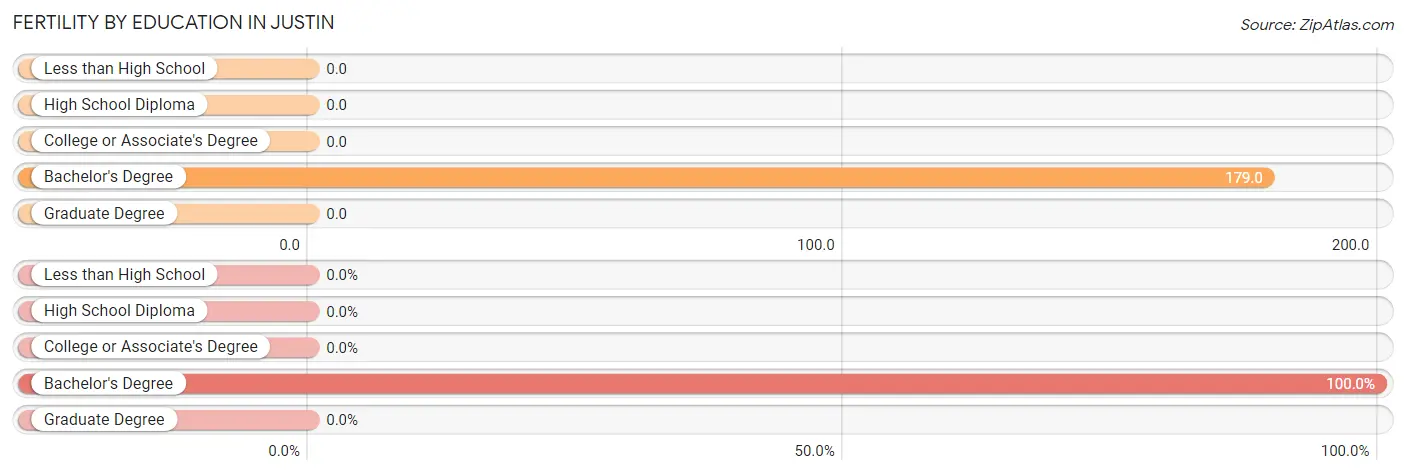
| Educational Attainment | Women with Births | Births / 1,000 Women |
| Less than High School | 0 (0.0%) | 0.0 |
| High School Diploma | 0 (0.0%) | 0.0 |
| College or Associate's Degree | 0 (0.0%) | 0.0 |
| Bachelor's Degree | 82 (100.0%) | 179.0 |
| Graduate Degree | 0 (0.0%) | 0.0 |
| Total | 82 (100.0%) | 73.0 |
Fertility by Education by Marriage Status in Justin
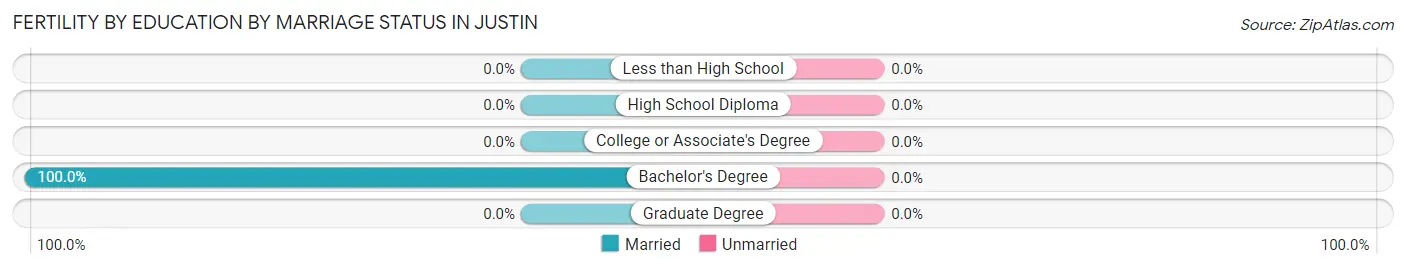
| Educational Attainment | Married | Unmarried |
| Less than High School | 0 (0.0%) | 0 (0.0%) |
| High School Diploma | 0 (0.0%) | 0 (0.0%) |
| College or Associate's Degree | 0 (0.0%) | 0 (0.0%) |
| Bachelor's Degree | 82 (100.0%) | 0 (0.0%) |
| Graduate Degree | 0 (0.0%) | 0 (0.0%) |
| Total | 82 (100.0%) | 0 (0.0%) |
Employment Characteristics in Justin
Employment by Class of Employer in Justin
Among the 2,313 employed individuals in Justin, private company employees (1,355 | 58.6%), local government employees (358 | 15.5%), and self-employed (incorporated) (322 | 13.9%) make up the most common classes of employment.
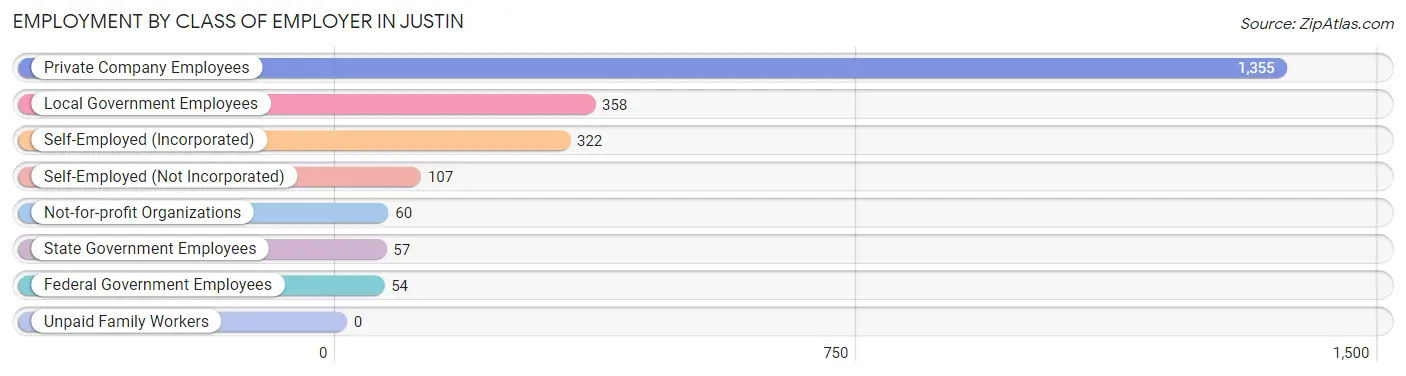
| Employer Class | # Employees | % Employees |
| Private Company Employees | 1,355 | 58.6% |
| Self-Employed (Incorporated) | 322 | 13.9% |
| Self-Employed (Not Incorporated) | 107 | 4.6% |
| Not-for-profit Organizations | 60 | 2.6% |
| Local Government Employees | 358 | 15.5% |
| State Government Employees | 57 | 2.5% |
| Federal Government Employees | 54 | 2.3% |
| Unpaid Family Workers | 0 | 0.0% |
| Total | 2,313 | 100.0% |
Employment Status by Age in Justin
According to the labor force statistics for Justin, out of the total population over 16 years of age (3,667), 69.5% or 2,549 individuals are in the labor force, with 6.5% or 166 of them unemployed. The age group with the highest labor force participation rate is 30 to 34 years, with 97.4% or 414 individuals in the labor force. Within the labor force, the 35 to 44 years age range has the highest percentage of unemployed individuals, with 13.5% or 74 of them being unemployed.
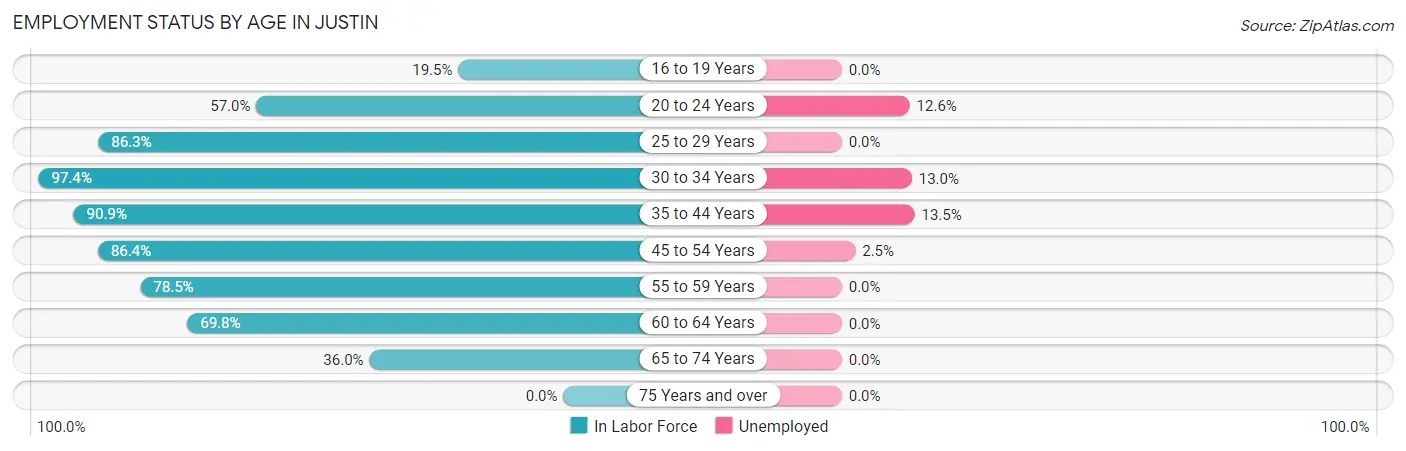
| Age Bracket | In Labor Force | Unemployed |
| 16 to 19 Years | 40 (19.5%) | 0 (0.0%) |
| 20 to 24 Years | 135 (57.0%) | 17 (12.6%) |
| 25 to 29 Years | 139 (86.3%) | 0 (0.0%) |
| 30 to 34 Years | 414 (97.4%) | 54 (13.0%) |
| 35 to 44 Years | 548 (90.9%) | 74 (13.5%) |
| 45 to 54 Years | 850 (86.4%) | 21 (2.5%) |
| 55 to 59 Years | 139 (78.5%) | 0 (0.0%) |
| 60 to 64 Years | 180 (69.8%) | 0 (0.0%) |
| 65 to 74 Years | 103 (36.0%) | 0 (0.0%) |
| 75 Years and over | 0 (0.0%) | 0 (0.0%) |
| Total | 2,549 (69.5%) | 166 (6.5%) |
Employment Status by Educational Attainment in Justin
According to labor force statistics for Justin, 87.0% of individuals (2,269) out of the total population between 25 and 64 years of age (2,608) are in the labor force, with 6.6% or 150 of them being unemployed. The group with the highest labor force participation rate are those with the educational attainment of college / associate degree, with 91.6% or 1,098 individuals in the labor force. Within the labor force, individuals with college / associate degree education have the highest percentage of unemployment, with 10.3% or 113 of them being unemployed.
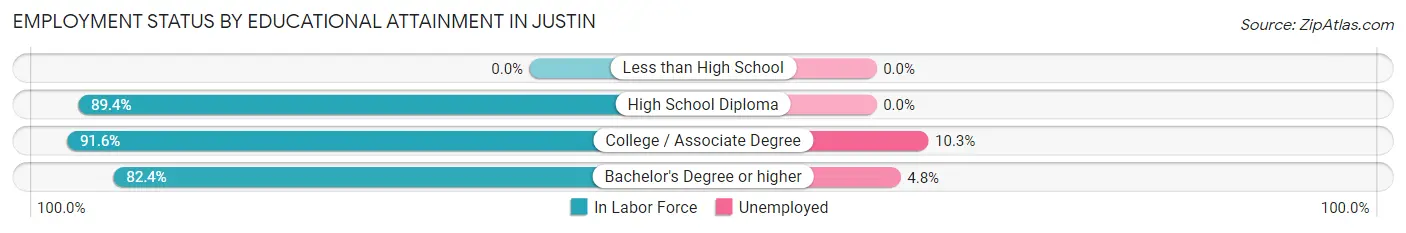
| Educational Attainment | In Labor Force | Unemployed |
| Less than High School | 0 (0.0%) | 0 (0.0%) |
| High School Diploma | 420 (89.4%) | 0 (0.0%) |
| College / Associate Degree | 1,098 (91.6%) | 123 (10.3%) |
| Bachelor's Degree or higher | 752 (82.4%) | 44 (4.8%) |
| Total | 2,269 (87.0%) | 172 (6.6%) |
Employment Occupations by Sex in Justin
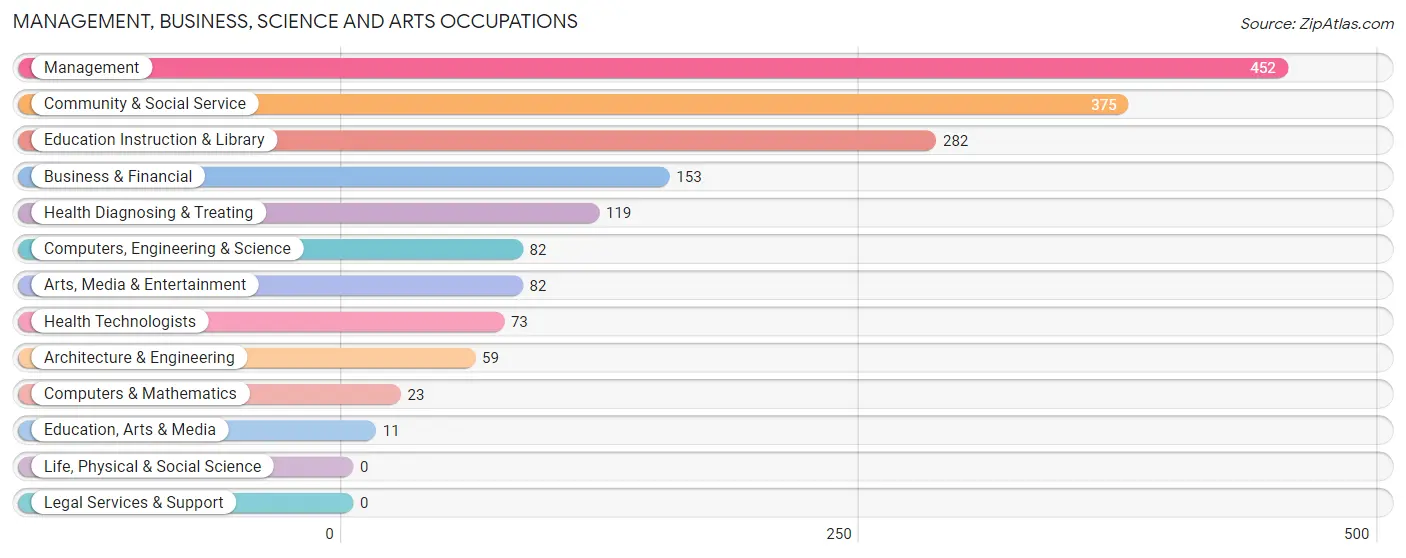
Management, Business, Science and Arts Occupations
The most common Management, Business, Science and Arts occupations in Justin are Management (452 | 19.0%), Community & Social Service (375 | 15.7%), Education Instruction & Library (282 | 11.8%), Business & Financial (153 | 6.4%), and Health Diagnosing & Treating (119 | 5.0%).
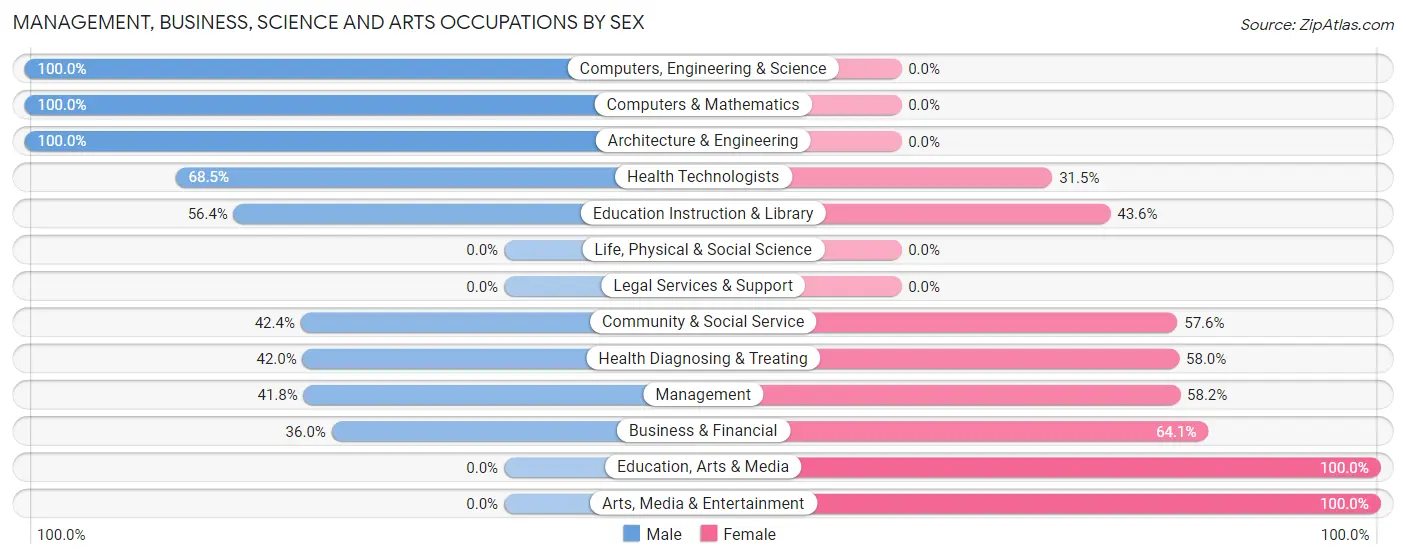
Management, Business, Science and Arts Occupations by Sex
Within the Management, Business, Science and Arts occupations in Justin, the most male-oriented occupations are Computers, Engineering & Science (100.0%), Computers & Mathematics (100.0%), and Architecture & Engineering (100.0%), while the most female-oriented occupations are Education, Arts & Media (100.0%), Arts, Media & Entertainment (100.0%), and Business & Financial (64.0%).
| Occupation | Male | Female |
| Management | 189 (41.8%) | 263 (58.2%) |
| Business & Financial | 55 (35.9%) | 98 (64.0%) |
| Computers, Engineering & Science | 82 (100.0%) | 0 (0.0%) |
| Computers & Mathematics | 23 (100.0%) | 0 (0.0%) |
| Architecture & Engineering | 59 (100.0%) | 0 (0.0%) |
| Life, Physical & Social Science | 0 (0.0%) | 0 (0.0%) |
| Community & Social Service | 159 (42.4%) | 216 (57.6%) |
| Education, Arts & Media | 0 (0.0%) | 11 (100.0%) |
| Legal Services & Support | 0 (0.0%) | 0 (0.0%) |
| Education Instruction & Library | 159 (56.4%) | 123 (43.6%) |
| Arts, Media & Entertainment | 0 (0.0%) | 82 (100.0%) |
| Health Diagnosing & Treating | 50 (42.0%) | 69 (58.0%) |
| Health Technologists | 50 (68.5%) | 23 (31.5%) |
| Total (Category) | 535 (45.3%) | 646 (54.7%) |
| Total (Overall) | 1,428 (60.0%) | 954 (40.1%) |
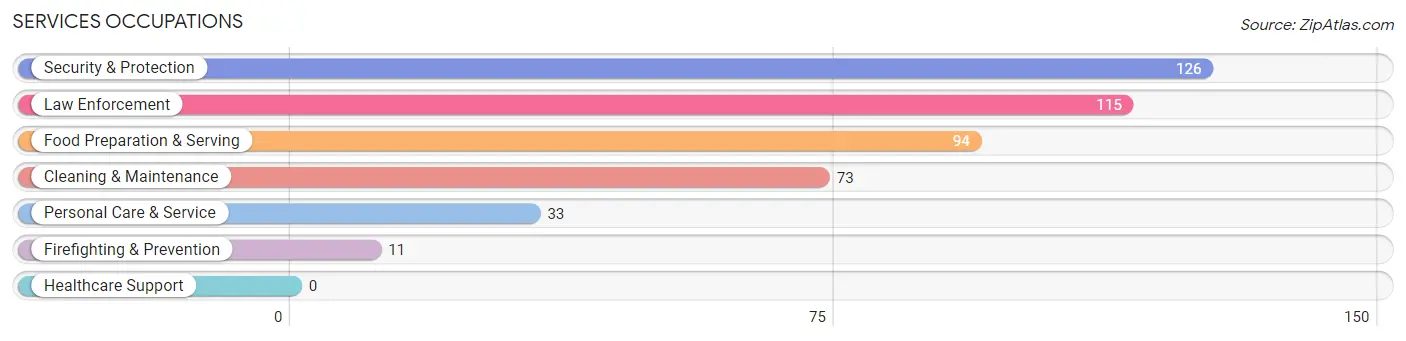
Services Occupations
The most common Services occupations in Justin are Security & Protection (126 | 5.3%), Law Enforcement (115 | 4.8%), Food Preparation & Serving (94 | 4.0%), Cleaning & Maintenance (73 | 3.1%), and Personal Care & Service (33 | 1.4%).
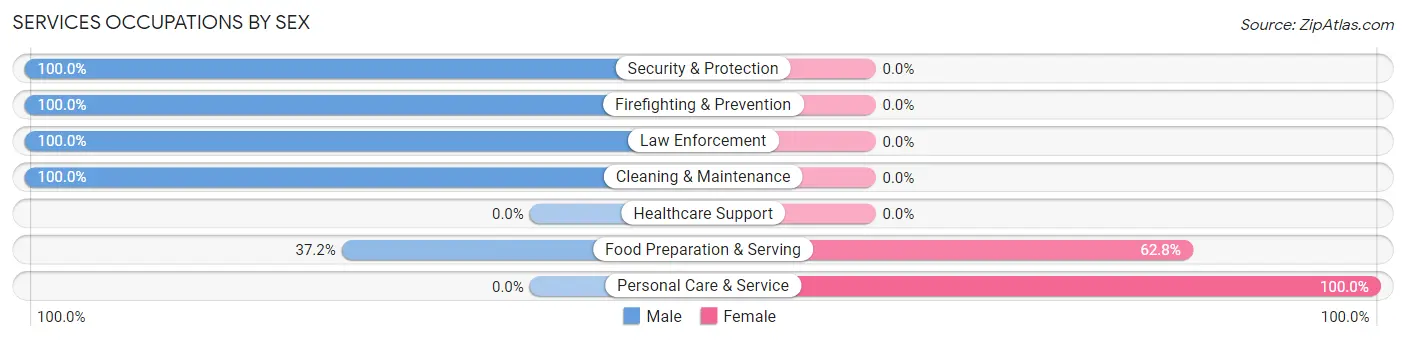
Services Occupations by Sex
Within the Services occupations in Justin, the most male-oriented occupations are Security & Protection (100.0%), Firefighting & Prevention (100.0%), and Law Enforcement (100.0%), while the most female-oriented occupations are Personal Care & Service (100.0%), and Food Preparation & Serving (62.8%).
| Occupation | Male | Female |
| Healthcare Support | 0 (0.0%) | 0 (0.0%) |
| Security & Protection | 126 (100.0%) | 0 (0.0%) |
| Firefighting & Prevention | 11 (100.0%) | 0 (0.0%) |
| Law Enforcement | 115 (100.0%) | 0 (0.0%) |
| Food Preparation & Serving | 35 (37.2%) | 59 (62.8%) |
| Cleaning & Maintenance | 73 (100.0%) | 0 (0.0%) |
| Personal Care & Service | 0 (0.0%) | 33 (100.0%) |
| Total (Category) | 234 (71.8%) | 92 (28.2%) |
| Total (Overall) | 1,428 (60.0%) | 954 (40.1%) |
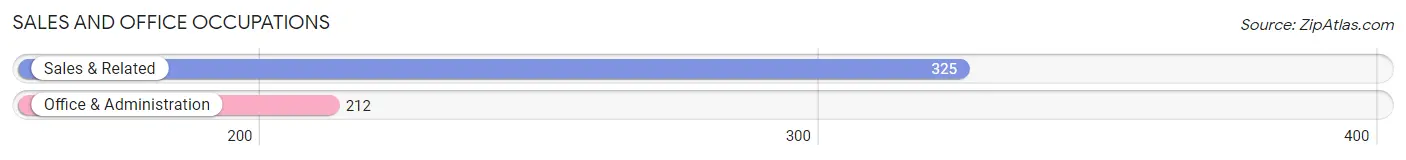
Sales and Office Occupations
The most common Sales and Office occupations in Justin are Sales & Related (325 | 13.6%), and Office & Administration (212 | 8.9%).
Sales and Office Occupations by Sex
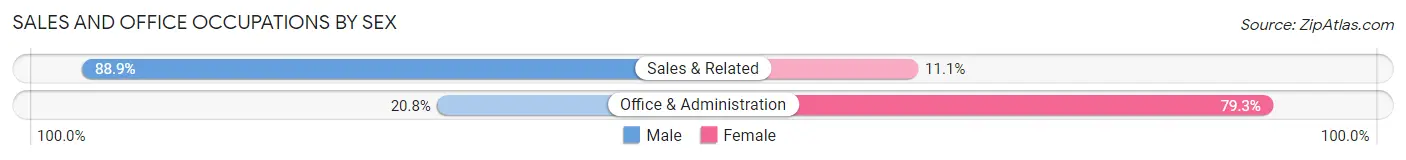
| Occupation | Male | Female |
| Sales & Related | 289 (88.9%) | 36 (11.1%) |
| Office & Administration | 44 (20.7%) | 168 (79.2%) |
| Total (Category) | 333 (62.0%) | 204 (38.0%) |
| Total (Overall) | 1,428 (60.0%) | 954 (40.1%) |
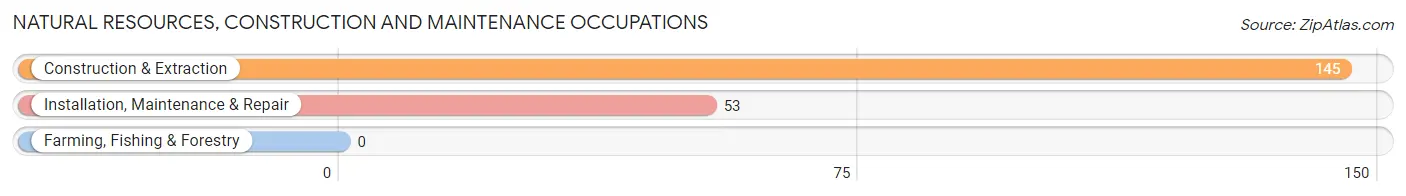
Natural Resources, Construction and Maintenance Occupations
The most common Natural Resources, Construction and Maintenance occupations in Justin are Construction & Extraction (145 | 6.1%), and Installation, Maintenance & Repair (53 | 2.2%).
Natural Resources, Construction and Maintenance Occupations by Sex
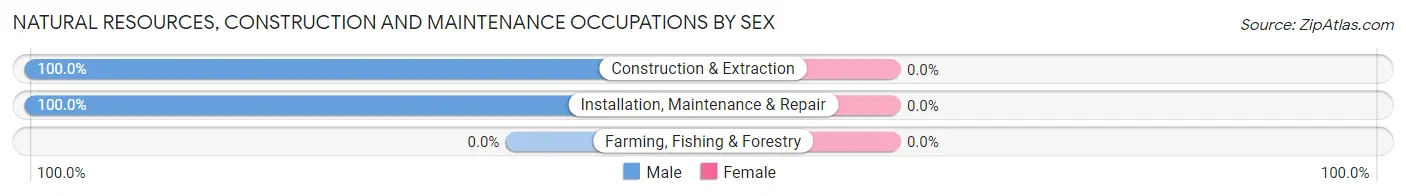
| Occupation | Male | Female |
| Farming, Fishing & Forestry | 0 (0.0%) | 0 (0.0%) |
| Construction & Extraction | 145 (100.0%) | 0 (0.0%) |
| Installation, Maintenance & Repair | 53 (100.0%) | 0 (0.0%) |
| Total (Category) | 198 (100.0%) | 0 (0.0%) |
| Total (Overall) | 1,428 (60.0%) | 954 (40.1%) |
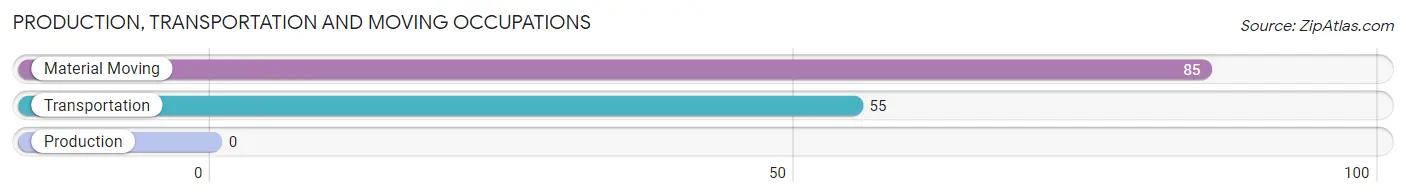
Production, Transportation and Moving Occupations
The most common Production, Transportation and Moving occupations in Justin are Material Moving (85 | 3.6%), and Transportation (55 | 2.3%).
Production, Transportation and Moving Occupations by Sex
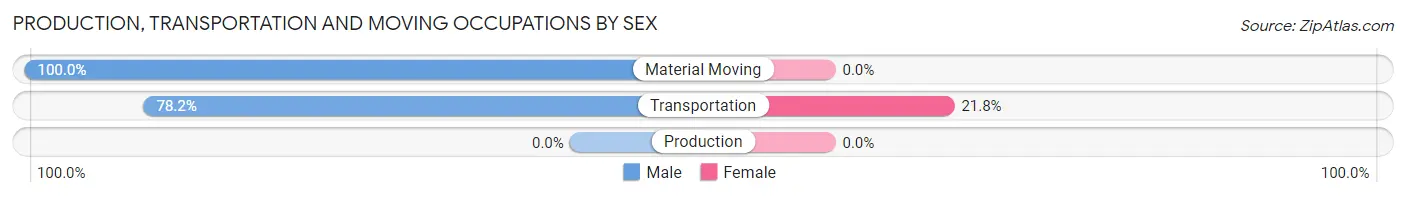
| Occupation | Male | Female |
| Production | 0 (0.0%) | 0 (0.0%) |
| Transportation | 43 (78.2%) | 12 (21.8%) |
| Material Moving | 85 (100.0%) | 0 (0.0%) |
| Total (Category) | 128 (91.4%) | 12 (8.6%) |
| Total (Overall) | 1,428 (60.0%) | 954 (40.1%) |
Employment Industries by Sex in Justin
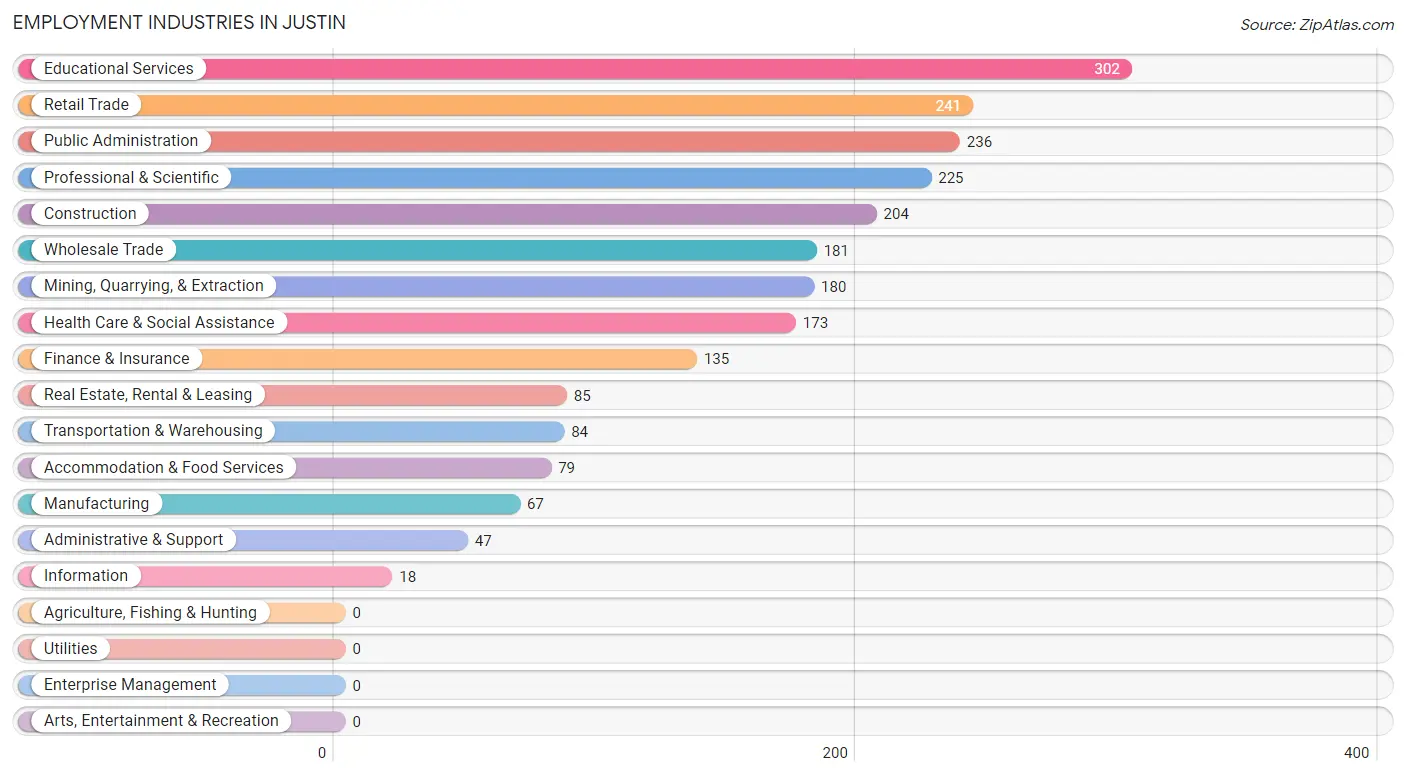
Employment Industries in Justin
The major employment industries in Justin include Educational Services (302 | 12.7%), Retail Trade (241 | 10.1%), Public Administration (236 | 9.9%), Professional & Scientific (225 | 9.5%), and Construction (204 | 8.6%).
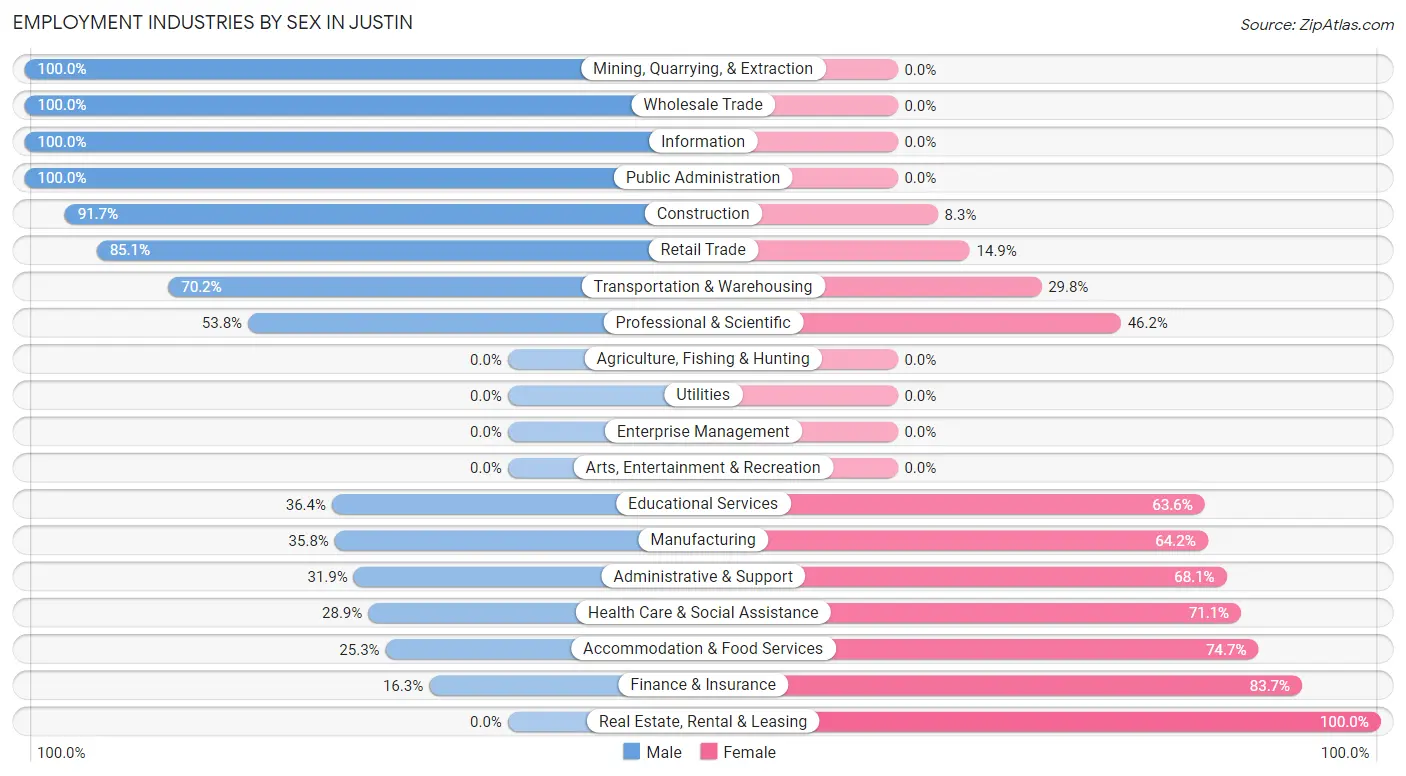
Employment Industries by Sex in Justin
The Justin industries that see more men than women are Mining, Quarrying, & Extraction (100.0%), Wholesale Trade (100.0%), and Information (100.0%), whereas the industries that tend to have a higher number of women are Real Estate, Rental & Leasing (100.0%), Finance & Insurance (83.7%), and Accommodation & Food Services (74.7%).
| Industry | Male | Female |
| Agriculture, Fishing & Hunting | 0 (0.0%) | 0 (0.0%) |
| Mining, Quarrying, & Extraction | 180 (100.0%) | 0 (0.0%) |
| Construction | 187 (91.7%) | 17 (8.3%) |
| Manufacturing | 24 (35.8%) | 43 (64.2%) |
| Wholesale Trade | 181 (100.0%) | 0 (0.0%) |
| Retail Trade | 205 (85.1%) | 36 (14.9%) |
| Transportation & Warehousing | 59 (70.2%) | 25 (29.8%) |
| Utilities | 0 (0.0%) | 0 (0.0%) |
| Information | 18 (100.0%) | 0 (0.0%) |
| Finance & Insurance | 22 (16.3%) | 113 (83.7%) |
| Real Estate, Rental & Leasing | 0 (0.0%) | 85 (100.0%) |
| Professional & Scientific | 121 (53.8%) | 104 (46.2%) |
| Enterprise Management | 0 (0.0%) | 0 (0.0%) |
| Administrative & Support | 15 (31.9%) | 32 (68.1%) |
| Educational Services | 110 (36.4%) | 192 (63.6%) |
| Health Care & Social Assistance | 50 (28.9%) | 123 (71.1%) |
| Arts, Entertainment & Recreation | 0 (0.0%) | 0 (0.0%) |
| Accommodation & Food Services | 20 (25.3%) | 59 (74.7%) |
| Public Administration | 236 (100.0%) | 0 (0.0%) |
| Total | 1,428 (60.0%) | 954 (40.1%) |
Education in Justin
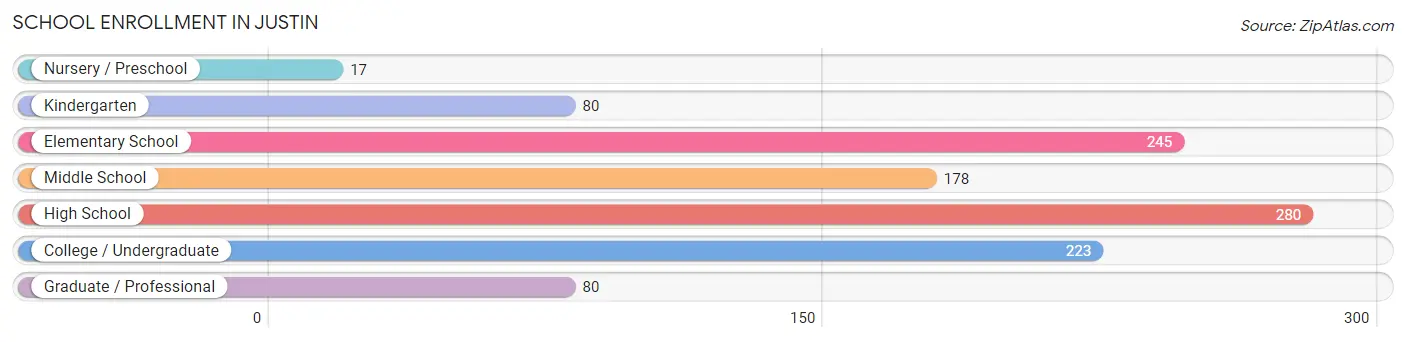
School Enrollment in Justin
The most common levels of schooling among the 1,103 students in Justin are high school (280 | 25.4%), elementary school (245 | 22.2%), and college / undergraduate (223 | 20.2%).
| School Level | # Students | % Students |
| Nursery / Preschool | 17 | 1.5% |
| Kindergarten | 80 | 7.2% |
| Elementary School | 245 | 22.2% |
| Middle School | 178 | 16.1% |
| High School | 280 | 25.4% |
| College / Undergraduate | 223 | 20.2% |
| Graduate / Professional | 80 | 7.2% |
| Total | 1,103 | 100.0% |
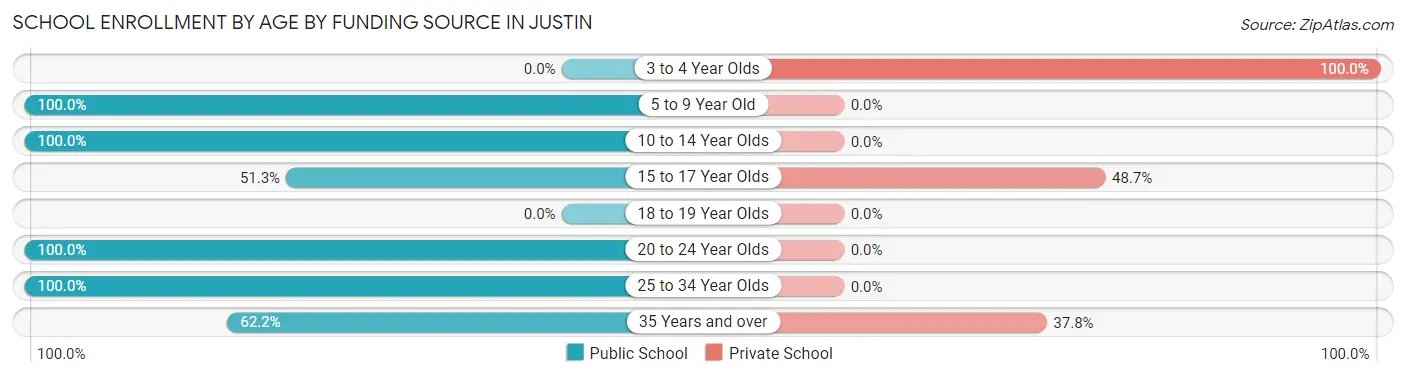
School Enrollment by Age by Funding Source in Justin
Out of a total of 1,103 students who are enrolled in schools in Justin, 182 (16.5%) attend a private institution, while the remaining 921 (83.5%) are enrolled in public schools. The age group of 3 to 4 year olds has the highest likelihood of being enrolled in private schools, with 17 (100.0% in the age bracket) enrolled. Conversely, the age group of 5 to 9 year old has the lowest likelihood of being enrolled in a private school, with 325 (100.0% in the age bracket) attending a public institution.
| Age Bracket | Public School | Private School |
| 3 to 4 Year Olds | 0 (0.0%) | 17 (100.0%) |
| 5 to 9 Year Old | 325 (100.0%) | 0 (0.0%) |
| 10 to 14 Year Olds | 230 (100.0%) | 0 (0.0%) |
| 15 to 17 Year Olds | 117 (51.3%) | 111 (48.7%) |
| 18 to 19 Year Olds | 0 (0.0%) | 0 (0.0%) |
| 20 to 24 Year Olds | 106 (100.0%) | 0 (0.0%) |
| 25 to 34 Year Olds | 54 (100.0%) | 0 (0.0%) |
| 35 Years and over | 89 (62.2%) | 54 (37.8%) |
| Total | 921 (83.5%) | 182 (16.5%) |
Educational Attainment by Field of Study in Justin
Business (281 | 26.2%), psychology (121 | 11.3%), arts & humanities (104 | 9.7%), engineering (86 | 8.0%), and communications (85 | 7.9%) are the most common fields of study among 1,074 individuals in Justin who have obtained a bachelor's degree or higher.
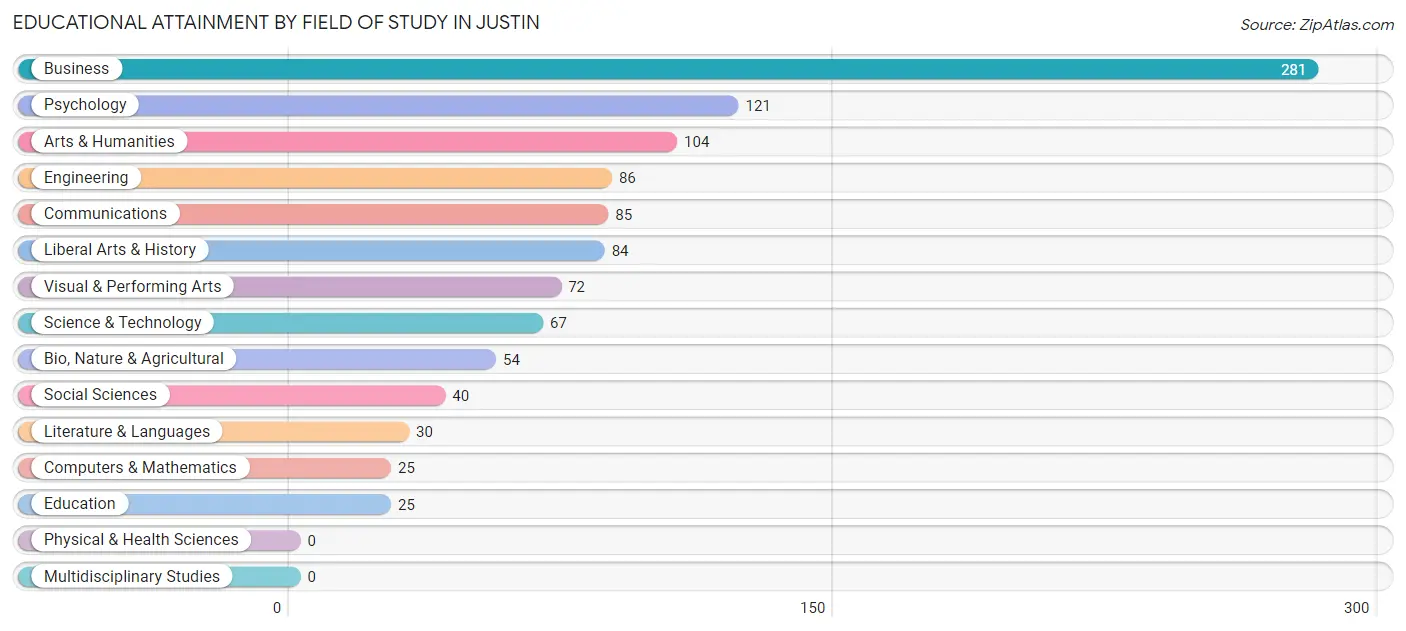
| Field of Study | # Graduates | % Graduates |
| Computers & Mathematics | 25 | 2.3% |
| Bio, Nature & Agricultural | 54 | 5.0% |
| Physical & Health Sciences | 0 | 0.0% |
| Psychology | 121 | 11.3% |
| Social Sciences | 40 | 3.7% |
| Engineering | 86 | 8.0% |
| Multidisciplinary Studies | 0 | 0.0% |
| Science & Technology | 67 | 6.2% |
| Business | 281 | 26.2% |
| Education | 25 | 2.3% |
| Literature & Languages | 30 | 2.8% |
| Liberal Arts & History | 84 | 7.8% |
| Visual & Performing Arts | 72 | 6.7% |
| Communications | 85 | 7.9% |
| Arts & Humanities | 104 | 9.7% |
| Total | 1,074 | 100.0% |
Transportation & Commute in Justin
Vehicle Availability by Sex in Justin
The most prevalent vehicle ownership categories in Justin are males with 2 vehicles (802, accounting for 57.0%) and females with 2 vehicles (522, making up 88.6%).
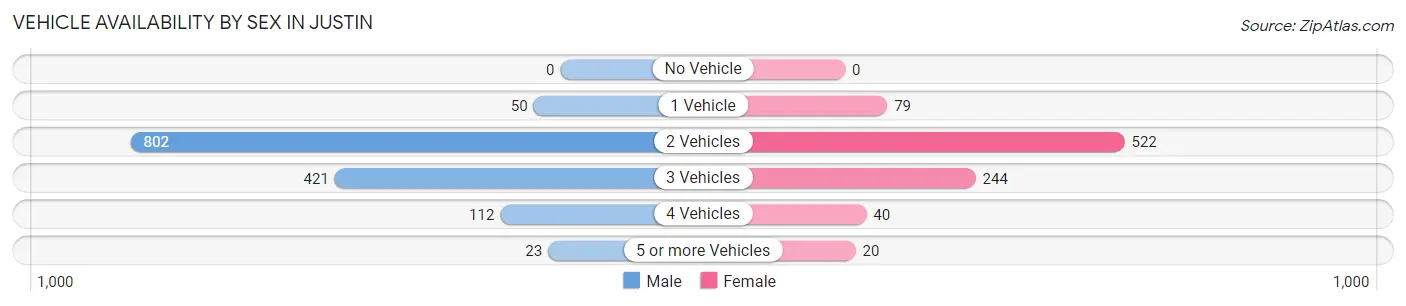
| Vehicles Available | Male | Female |
| No Vehicle | 0 (0.0%) | 0 (0.0%) |
| 1 Vehicle | 50 (3.5%) | 79 (8.7%) |
| 2 Vehicles | 802 (57.0%) | 522 (57.7%) |
| 3 Vehicles | 421 (29.9%) | 244 (27.0%) |
| 4 Vehicles | 112 (8.0%) | 40 (4.4%) |
| 5 or more Vehicles | 23 (1.6%) | 20 (2.2%) |
| Total | 1,408 (100.0%) | 905 (100.0%) |
Commute Time in Justin
The most frequently occuring commute durations in Justin are 45 to 59 minutes (375 commuters, 19.9%), 25 to 29 minutes (299 commuters, 15.9%), and 60 to 89 minutes (298 commuters, 15.8%).
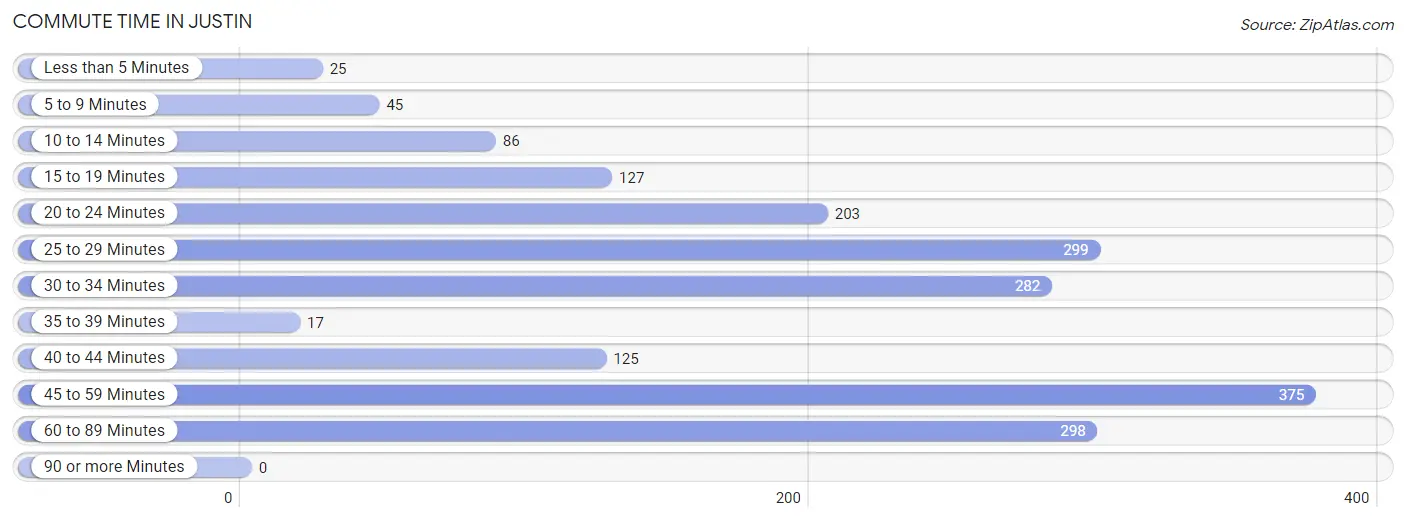
| Commute Time | # Commuters | % Commuters |
| Less than 5 Minutes | 25 | 1.3% |
| 5 to 9 Minutes | 45 | 2.4% |
| 10 to 14 Minutes | 86 | 4.6% |
| 15 to 19 Minutes | 127 | 6.8% |
| 20 to 24 Minutes | 203 | 10.8% |
| 25 to 29 Minutes | 299 | 15.9% |
| 30 to 34 Minutes | 282 | 15.0% |
| 35 to 39 Minutes | 17 | 0.9% |
| 40 to 44 Minutes | 125 | 6.6% |
| 45 to 59 Minutes | 375 | 19.9% |
| 60 to 89 Minutes | 298 | 15.8% |
| 90 or more Minutes | 0 | 0.0% |
Commute Time by Sex in Justin
The most common commute times in Justin are 45 to 59 minutes (325 commuters, 28.4%) for males and 30 to 34 minutes (229 commuters, 31.0%) for females.
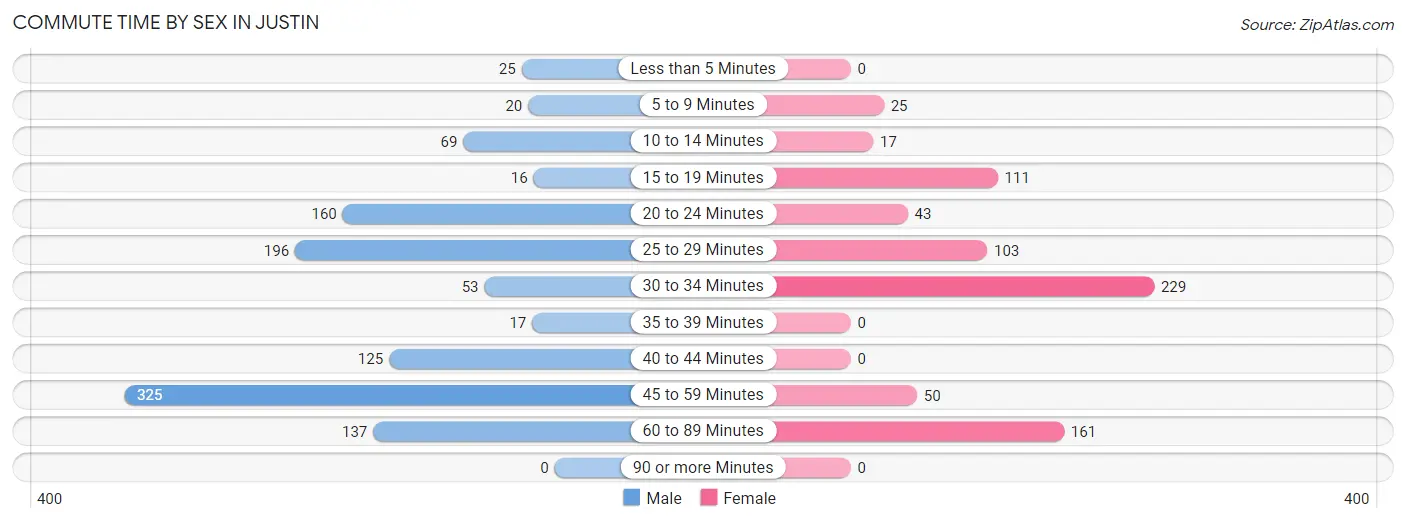
| Commute Time | Male | Female |
| Less than 5 Minutes | 25 (2.2%) | 0 (0.0%) |
| 5 to 9 Minutes | 20 (1.8%) | 25 (3.4%) |
| 10 to 14 Minutes | 69 (6.0%) | 17 (2.3%) |
| 15 to 19 Minutes | 16 (1.4%) | 111 (15.0%) |
| 20 to 24 Minutes | 160 (14.0%) | 43 (5.8%) |
| 25 to 29 Minutes | 196 (17.2%) | 103 (13.9%) |
| 30 to 34 Minutes | 53 (4.6%) | 229 (31.0%) |
| 35 to 39 Minutes | 17 (1.5%) | 0 (0.0%) |
| 40 to 44 Minutes | 125 (10.9%) | 0 (0.0%) |
| 45 to 59 Minutes | 325 (28.4%) | 50 (6.8%) |
| 60 to 89 Minutes | 137 (12.0%) | 161 (21.8%) |
| 90 or more Minutes | 0 (0.0%) | 0 (0.0%) |
Time of Departure to Work by Sex in Justin
The most frequent times of departure to work in Justin are 5:00 AM to 5:29 AM (245, 21.4%) for males and 7:00 AM to 7:29 AM (398, 53.9%) for females.
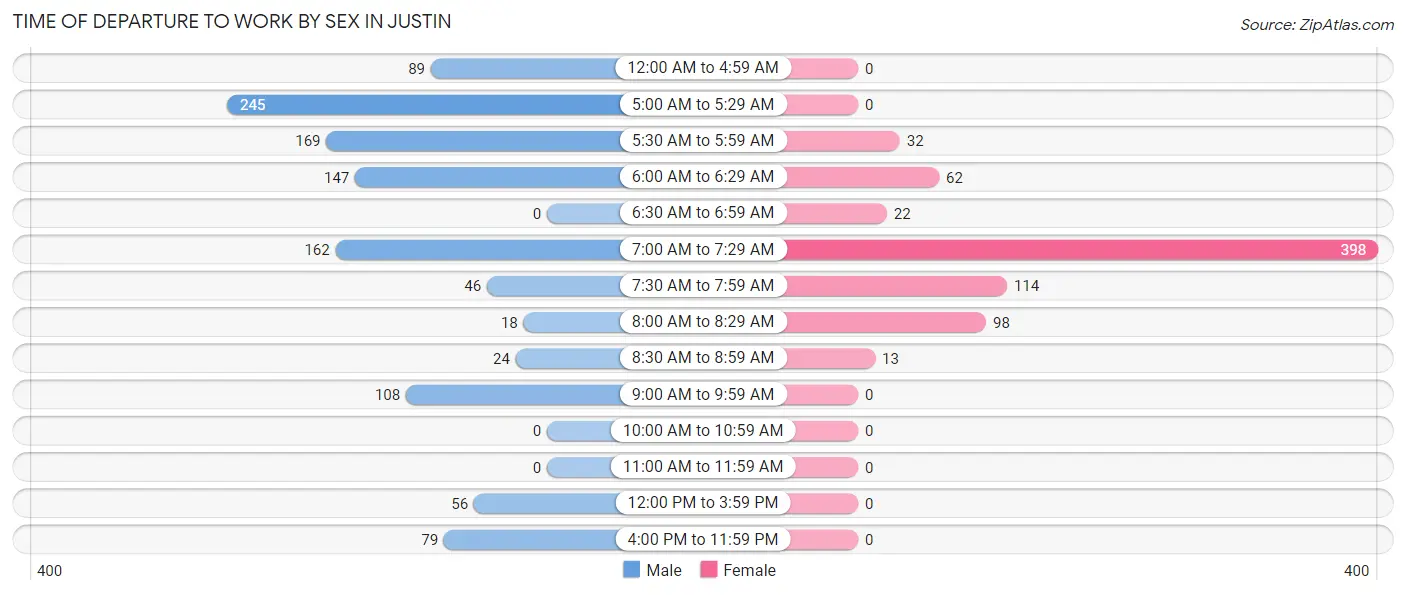
| Time of Departure | Male | Female |
| 12:00 AM to 4:59 AM | 89 (7.8%) | 0 (0.0%) |
| 5:00 AM to 5:29 AM | 245 (21.4%) | 0 (0.0%) |
| 5:30 AM to 5:59 AM | 169 (14.8%) | 32 (4.3%) |
| 6:00 AM to 6:29 AM | 147 (12.9%) | 62 (8.4%) |
| 6:30 AM to 6:59 AM | 0 (0.0%) | 22 (3.0%) |
| 7:00 AM to 7:29 AM | 162 (14.2%) | 398 (53.9%) |
| 7:30 AM to 7:59 AM | 46 (4.0%) | 114 (15.4%) |
| 8:00 AM to 8:29 AM | 18 (1.6%) | 98 (13.3%) |
| 8:30 AM to 8:59 AM | 24 (2.1%) | 13 (1.8%) |
| 9:00 AM to 9:59 AM | 108 (9.5%) | 0 (0.0%) |
| 10:00 AM to 10:59 AM | 0 (0.0%) | 0 (0.0%) |
| 11:00 AM to 11:59 AM | 0 (0.0%) | 0 (0.0%) |
| 12:00 PM to 3:59 PM | 56 (4.9%) | 0 (0.0%) |
| 4:00 PM to 11:59 PM | 79 (6.9%) | 0 (0.0%) |
| Total | 1,143 (100.0%) | 739 (100.0%) |
Housing Occupancy in Justin
Occupancy by Ownership in Justin
Of the total 1,764 dwellings in Justin, owner-occupied units account for 1,514 (85.8%), while renter-occupied units make up 250 (14.2%).
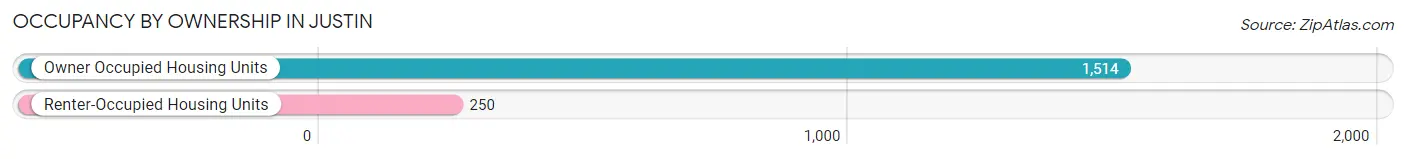
| Occupancy | # Housing Units | % Housing Units |
| Owner Occupied Housing Units | 1,514 | 85.8% |
| Renter-Occupied Housing Units | 250 | 14.2% |
| Total Occupied Housing Units | 1,764 | 100.0% |
Occupancy by Household Size in Justin
| Household Size | # Housing Units | % Housing Units |
| 1-Person Household | 430 | 24.4% |
| 2-Person Household | 567 | 32.1% |
| 3-Person Household | 316 | 17.9% |
| 4+ Person Household | 451 | 25.6% |
| Total Housing Units | 1,764 | 100.0% |
Occupancy by Ownership by Household Size in Justin
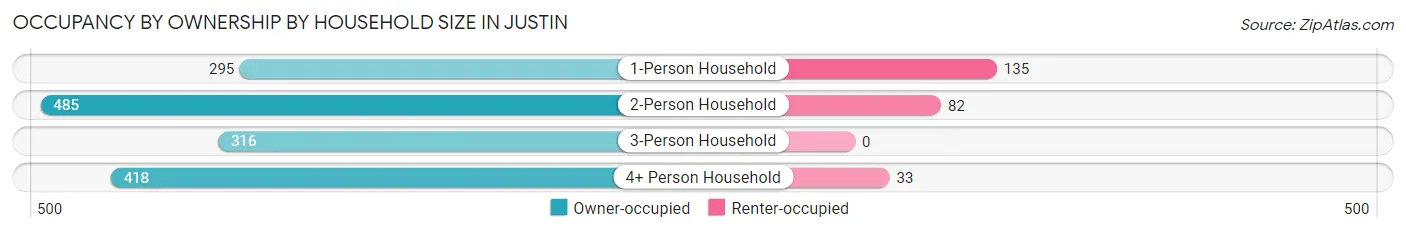
| Household Size | Owner-occupied | Renter-occupied |
| 1-Person Household | 295 (68.6%) | 135 (31.4%) |
| 2-Person Household | 485 (85.5%) | 82 (14.5%) |
| 3-Person Household | 316 (100.0%) | 0 (0.0%) |
| 4+ Person Household | 418 (92.7%) | 33 (7.3%) |
| Total Housing Units | 1,514 (85.8%) | 250 (14.2%) |
Occupancy by Educational Attainment in Justin
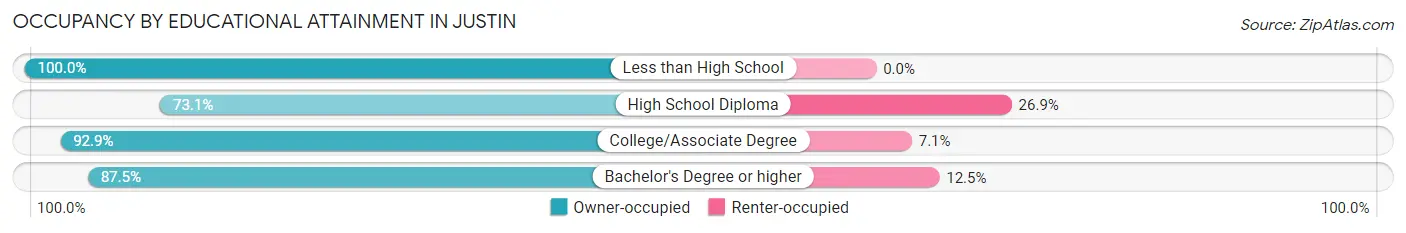
| Household Size | Owner-occupied | Renter-occupied |
| Less than High School | 19 (100.0%) | 0 (0.0%) |
| High School Diploma | 354 (73.1%) | 130 (26.9%) |
| College/Associate Degree | 645 (92.9%) | 49 (7.1%) |
| Bachelor's Degree or higher | 496 (87.5%) | 71 (12.5%) |
Occupancy by Age of Householder in Justin
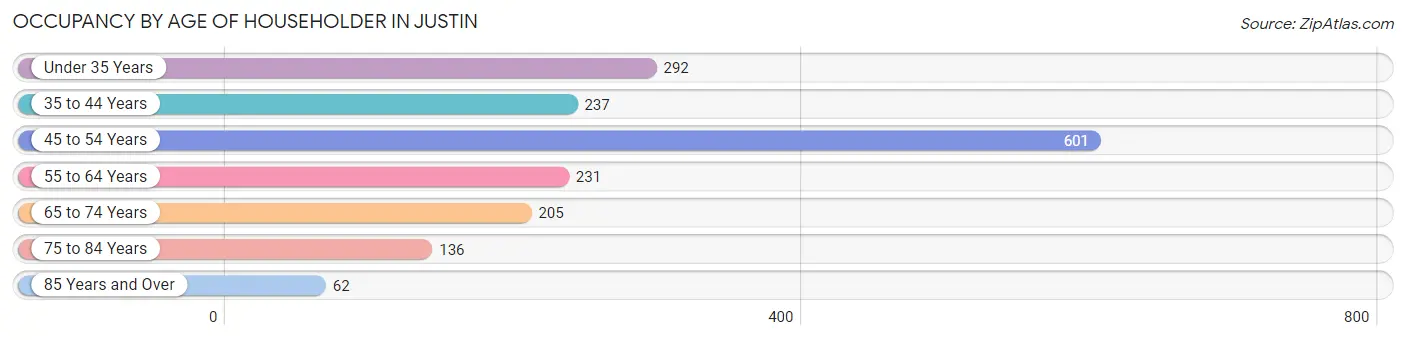
| Age Bracket | # Households | % Households |
| Under 35 Years | 292 | 16.6% |
| 35 to 44 Years | 237 | 13.4% |
| 45 to 54 Years | 601 | 34.1% |
| 55 to 64 Years | 231 | 13.1% |
| 65 to 74 Years | 205 | 11.6% |
| 75 to 84 Years | 136 | 7.7% |
| 85 Years and Over | 62 | 3.5% |
| Total | 1,764 | 100.0% |
Housing Finances in Justin
Median Income by Occupancy in Justin
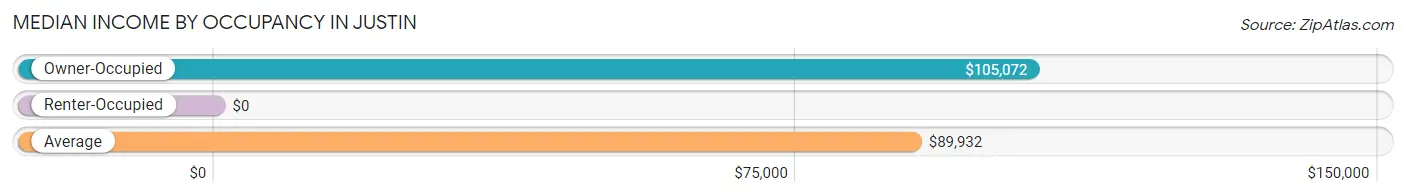
| Occupancy Type | # Households | Median Income |
| Owner-Occupied | 1,514 (85.8%) | $105,072 |
| Renter-Occupied | 250 (14.2%) | $0 |
| Average | 1,764 (100.0%) | $89,932 |
Occupancy by Householder Income Bracket in Justin
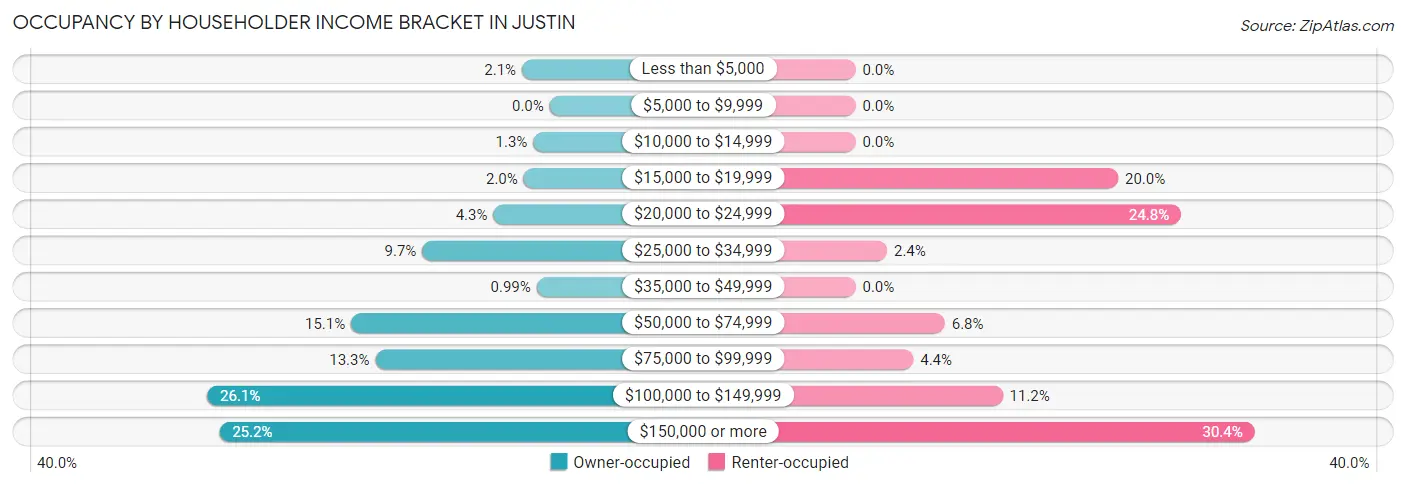
| Income Bracket | Owner-occupied | Renter-occupied |
| Less than $5,000 | 32 (2.1%) | 0 (0.0%) |
| $5,000 to $9,999 | 0 (0.0%) | 0 (0.0%) |
| $10,000 to $14,999 | 19 (1.3%) | 0 (0.0%) |
| $15,000 to $19,999 | 30 (2.0%) | 50 (20.0%) |
| $20,000 to $24,999 | 65 (4.3%) | 62 (24.8%) |
| $25,000 to $34,999 | 147 (9.7%) | 6 (2.4%) |
| $35,000 to $49,999 | 15 (1.0%) | 0 (0.0%) |
| $50,000 to $74,999 | 229 (15.1%) | 17 (6.8%) |
| $75,000 to $99,999 | 201 (13.3%) | 11 (4.4%) |
| $100,000 to $149,999 | 395 (26.1%) | 28 (11.2%) |
| $150,000 or more | 381 (25.2%) | 76 (30.4%) |
| Total | 1,514 (100.0%) | 250 (100.0%) |
Monthly Housing Cost Tiers in Justin
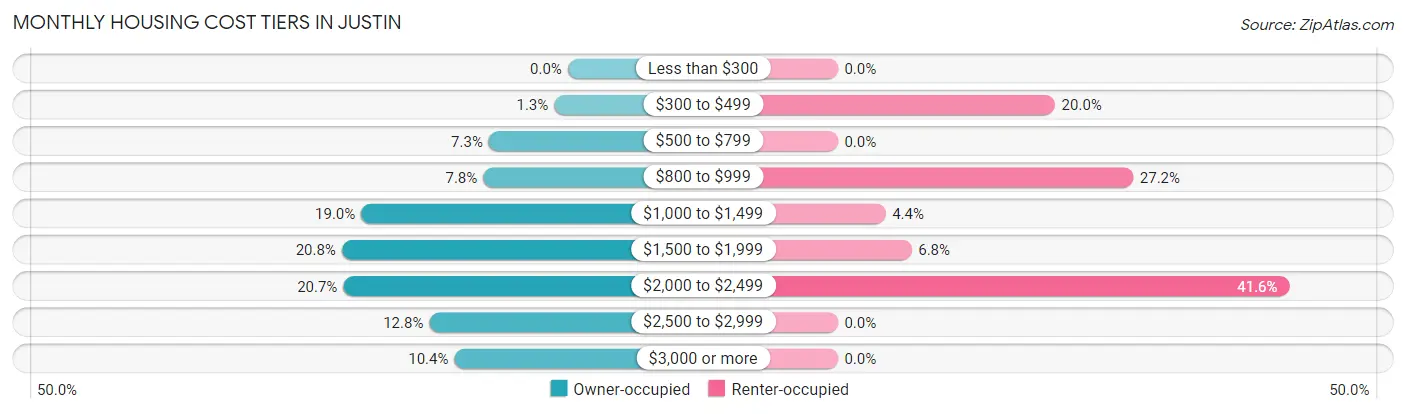
| Monthly Cost | Owner-occupied | Renter-occupied |
| Less than $300 | 0 (0.0%) | 0 (0.0%) |
| $300 to $499 | 19 (1.3%) | 50 (20.0%) |
| $500 to $799 | 110 (7.3%) | 0 (0.0%) |
| $800 to $999 | 118 (7.8%) | 68 (27.2%) |
| $1,000 to $1,499 | 288 (19.0%) | 11 (4.4%) |
| $1,500 to $1,999 | 315 (20.8%) | 17 (6.8%) |
| $2,000 to $2,499 | 313 (20.7%) | 104 (41.6%) |
| $2,500 to $2,999 | 193 (12.8%) | 0 (0.0%) |
| $3,000 or more | 158 (10.4%) | 0 (0.0%) |
| Total | 1,514 (100.0%) | 250 (100.0%) |
Physical Housing Characteristics in Justin
Housing Structures in Justin
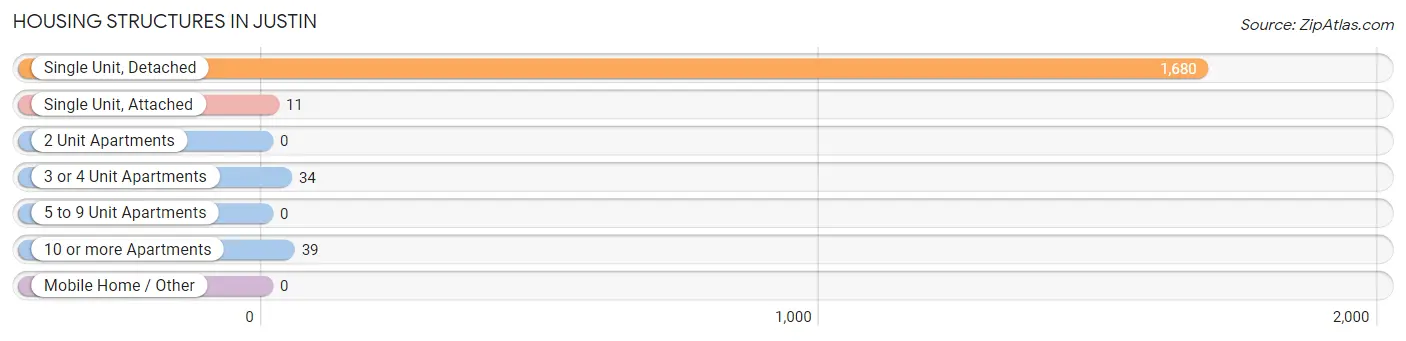
| Structure Type | # Housing Units | % Housing Units |
| Single Unit, Detached | 1,680 | 95.2% |
| Single Unit, Attached | 11 | 0.6% |
| 2 Unit Apartments | 0 | 0.0% |
| 3 or 4 Unit Apartments | 34 | 1.9% |
| 5 to 9 Unit Apartments | 0 | 0.0% |
| 10 or more Apartments | 39 | 2.2% |
| Mobile Home / Other | 0 | 0.0% |
| Total | 1,764 | 100.0% |
Housing Structures by Occupancy in Justin
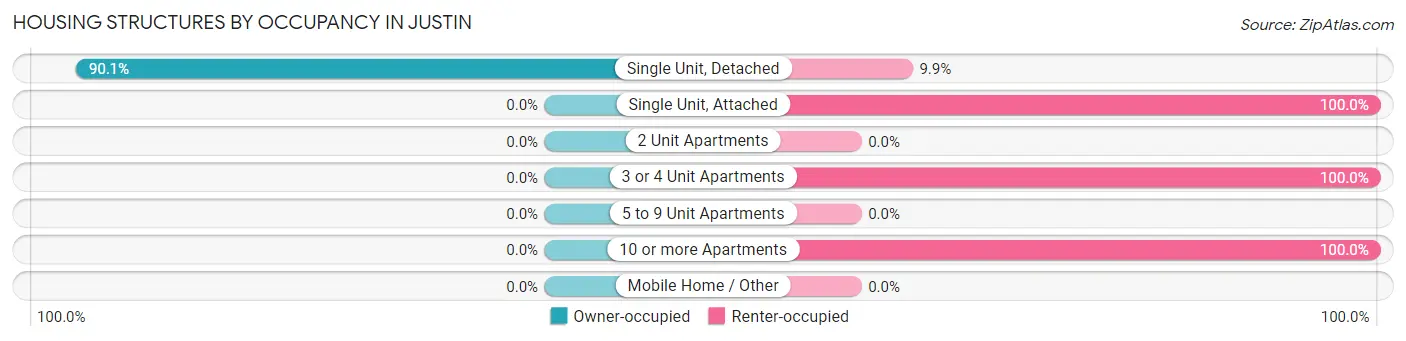
| Structure Type | Owner-occupied | Renter-occupied |
| Single Unit, Detached | 1,514 (90.1%) | 166 (9.9%) |
| Single Unit, Attached | 0 (0.0%) | 11 (100.0%) |
| 2 Unit Apartments | 0 (0.0%) | 0 (0.0%) |
| 3 or 4 Unit Apartments | 0 (0.0%) | 34 (100.0%) |
| 5 to 9 Unit Apartments | 0 (0.0%) | 0 (0.0%) |
| 10 or more Apartments | 0 (0.0%) | 39 (100.0%) |
| Mobile Home / Other | 0 (0.0%) | 0 (0.0%) |
| Total | 1,514 (85.8%) | 250 (14.2%) |
Housing Structures by Number of Rooms in Justin
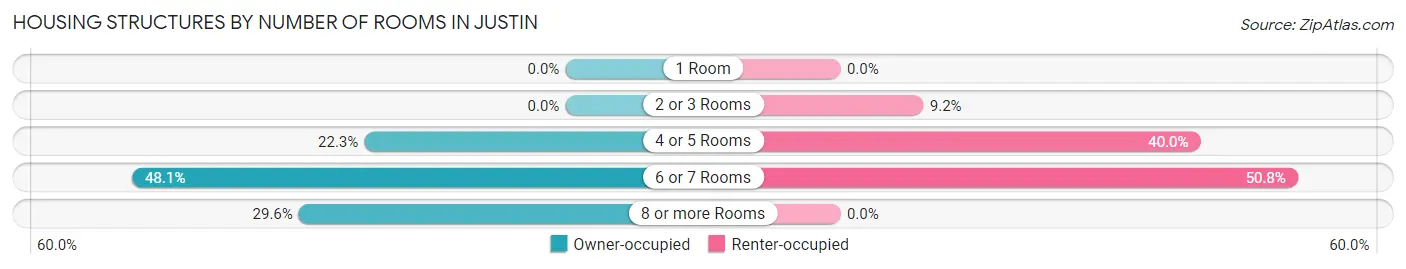
| Number of Rooms | Owner-occupied | Renter-occupied |
| 1 Room | 0 (0.0%) | 0 (0.0%) |
| 2 or 3 Rooms | 0 (0.0%) | 23 (9.2%) |
| 4 or 5 Rooms | 338 (22.3%) | 100 (40.0%) |
| 6 or 7 Rooms | 728 (48.1%) | 127 (50.8%) |
| 8 or more Rooms | 448 (29.6%) | 0 (0.0%) |
| Total | 1,514 (100.0%) | 250 (100.0%) |
Housing Structure by Heating Type in Justin
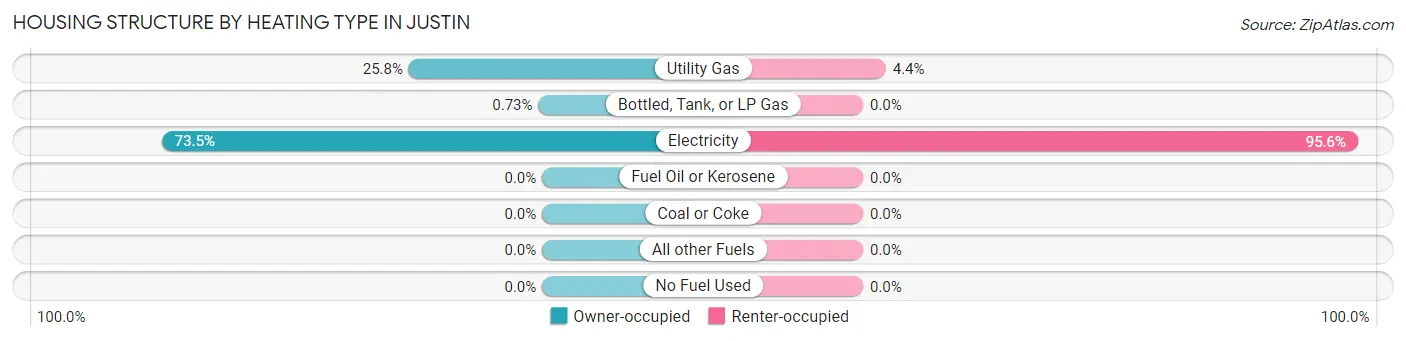
| Heating Type | Owner-occupied | Renter-occupied |
| Utility Gas | 390 (25.8%) | 11 (4.4%) |
| Bottled, Tank, or LP Gas | 11 (0.7%) | 0 (0.0%) |
| Electricity | 1,113 (73.5%) | 239 (95.6%) |
| Fuel Oil or Kerosene | 0 (0.0%) | 0 (0.0%) |
| Coal or Coke | 0 (0.0%) | 0 (0.0%) |
| All other Fuels | 0 (0.0%) | 0 (0.0%) |
| No Fuel Used | 0 (0.0%) | 0 (0.0%) |
| Total | 1,514 (100.0%) | 250 (100.0%) |
Household Vehicle Usage in Justin
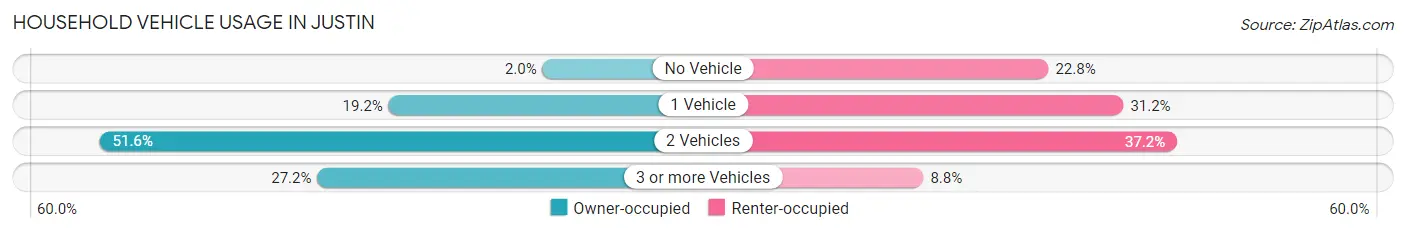
| Vehicles per Household | Owner-occupied | Renter-occupied |
| No Vehicle | 30 (2.0%) | 57 (22.8%) |
| 1 Vehicle | 291 (19.2%) | 78 (31.2%) |
| 2 Vehicles | 781 (51.6%) | 93 (37.2%) |
| 3 or more Vehicles | 412 (27.2%) | 22 (8.8%) |
| Total | 1,514 (100.0%) | 250 (100.0%) |
Real Estate & Mortgages in Justin
Real Estate and Mortgage Overview in Justin
| Characteristic | Without Mortgage | With Mortgage |
| Housing Units | 513 | 1,001 |
| Median Property Value | $346,700 | $310,700 |
| Median Household Income | $106,925 | $248 |
| Monthly Housing Costs | $1,024 | $158 |
| Real Estate Taxes | $5,452 | $15 |
Property Value by Mortgage Status in Justin
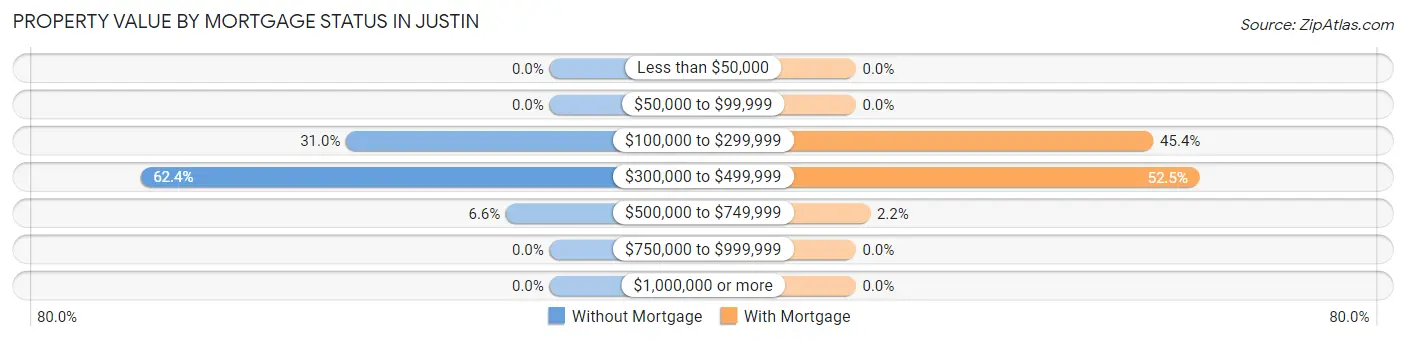
| Property Value | Without Mortgage | With Mortgage |
| Less than $50,000 | 0 (0.0%) | 0 (0.0%) |
| $50,000 to $99,999 | 0 (0.0%) | 0 (0.0%) |
| $100,000 to $299,999 | 159 (31.0%) | 454 (45.4%) |
| $300,000 to $499,999 | 320 (62.4%) | 525 (52.4%) |
| $500,000 to $749,999 | 34 (6.6%) | 22 (2.2%) |
| $750,000 to $999,999 | 0 (0.0%) | 0 (0.0%) |
| $1,000,000 or more | 0 (0.0%) | 0 (0.0%) |
| Total | 513 (100.0%) | 1,001 (100.0%) |
Household Income by Mortgage Status in Justin
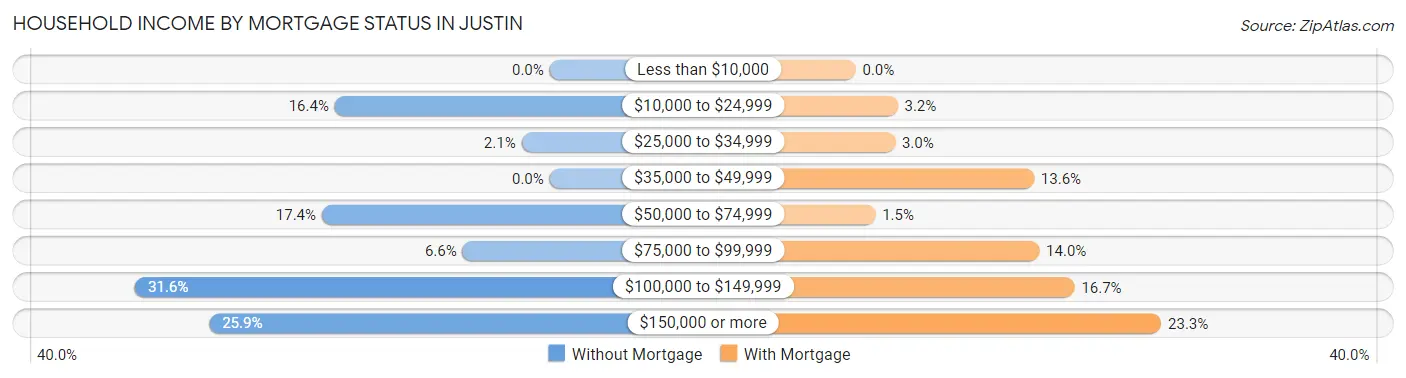
| Household Income | Without Mortgage | With Mortgage |
| Less than $10,000 | 0 (0.0%) | 0 (0.0%) |
| $10,000 to $24,999 | 84 (16.4%) | 32 (3.2%) |
| $25,000 to $34,999 | 11 (2.1%) | 30 (3.0%) |
| $35,000 to $49,999 | 0 (0.0%) | 136 (13.6%) |
| $50,000 to $74,999 | 89 (17.3%) | 15 (1.5%) |
| $75,000 to $99,999 | 34 (6.6%) | 140 (14.0%) |
| $100,000 to $149,999 | 162 (31.6%) | 167 (16.7%) |
| $150,000 or more | 133 (25.9%) | 233 (23.3%) |
| Total | 513 (100.0%) | 1,001 (100.0%) |
Property Value to Household Income Ratio in Justin
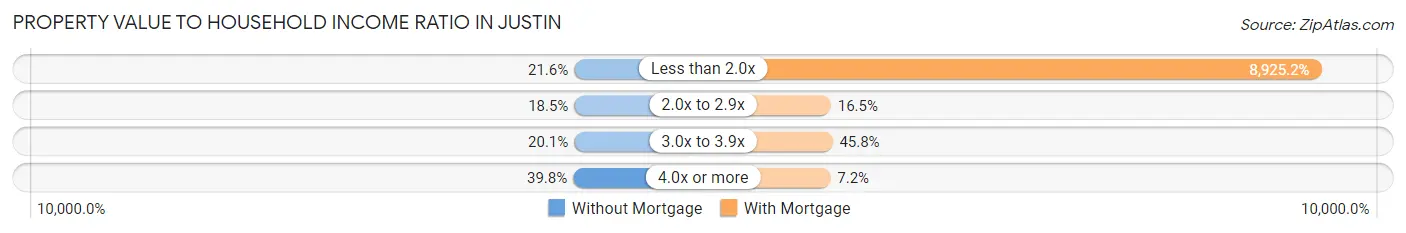
| Value-to-Income Ratio | Without Mortgage | With Mortgage |
| Less than 2.0x | 111 (21.6%) | 89,341 (8,925.2%) |
| 2.0x to 2.9x | 95 (18.5%) | 165 (16.5%) |
| 3.0x to 3.9x | 103 (20.1%) | 458 (45.8%) |
| 4.0x or more | 204 (39.8%) | 72 (7.2%) |
| Total | 513 (100.0%) | 1,001 (100.0%) |
Real Estate Taxes by Mortgage Status in Justin
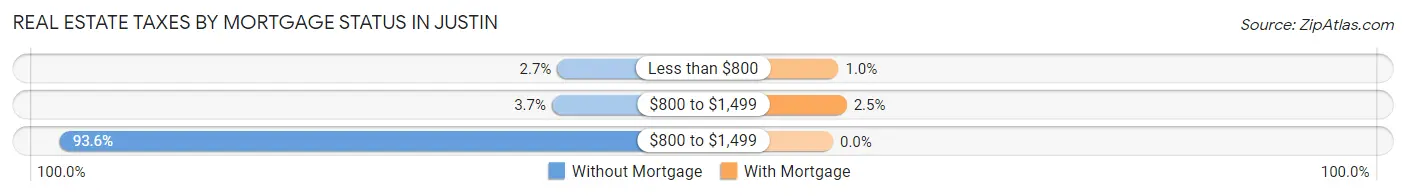
| Property Taxes | Without Mortgage | With Mortgage |
| Less than $800 | 14 (2.7%) | 10 (1.0%) |
| $800 to $1,499 | 19 (3.7%) | 25 (2.5%) |
| $800 to $1,499 | 480 (93.6%) | 0 (0.0%) |
| Total | 513 (100.0%) | 1,001 (100.0%) |
Health & Disability in Justin
Health Insurance Coverage by Age in Justin
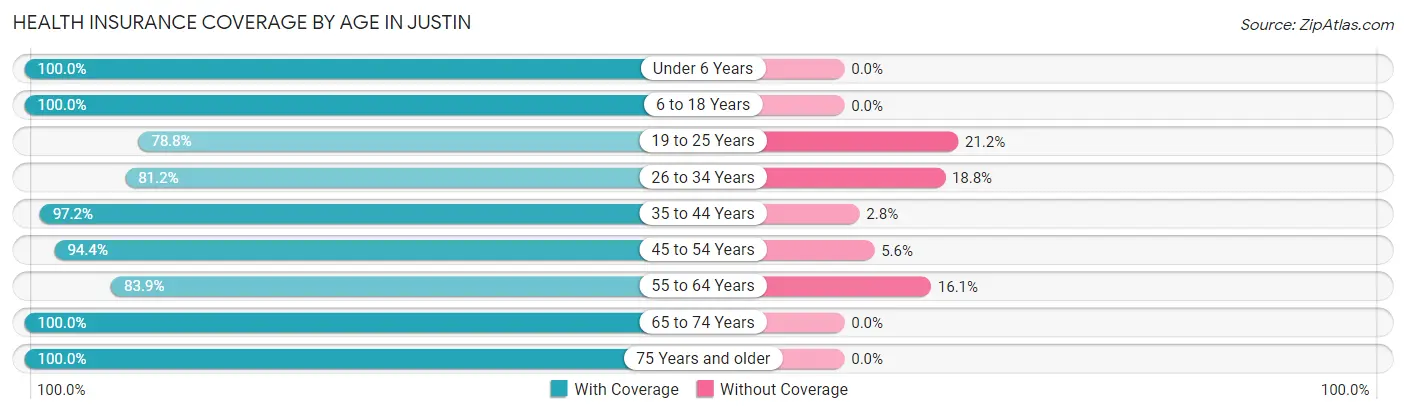
| Age Bracket | With Coverage | Without Coverage |
| Under 6 Years | 440 (100.0%) | 0 (0.0%) |
| 6 to 18 Years | 829 (100.0%) | 0 (0.0%) |
| 19 to 25 Years | 182 (78.8%) | 49 (21.2%) |
| 26 to 34 Years | 476 (81.2%) | 110 (18.8%) |
| 35 to 44 Years | 586 (97.2%) | 17 (2.8%) |
| 45 to 54 Years | 914 (94.4%) | 54 (5.6%) |
| 55 to 64 Years | 348 (83.9%) | 67 (16.1%) |
| 65 to 74 Years | 257 (100.0%) | 0 (0.0%) |
| 75 Years and older | 275 (100.0%) | 0 (0.0%) |
| Total | 4,307 (93.5%) | 297 (6.5%) |
Health Insurance Coverage by Citizenship Status in Justin
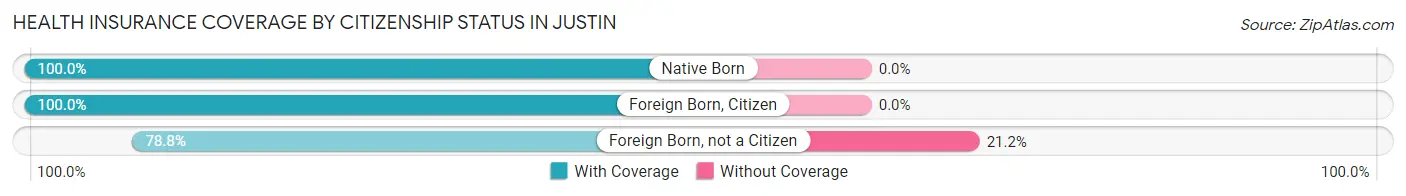
| Citizenship Status | With Coverage | Without Coverage |
| Native Born | 440 (100.0%) | 0 (0.0%) |
| Foreign Born, Citizen | 829 (100.0%) | 0 (0.0%) |
| Foreign Born, not a Citizen | 182 (78.8%) | 49 (21.2%) |
Health Insurance Coverage by Household Income in Justin
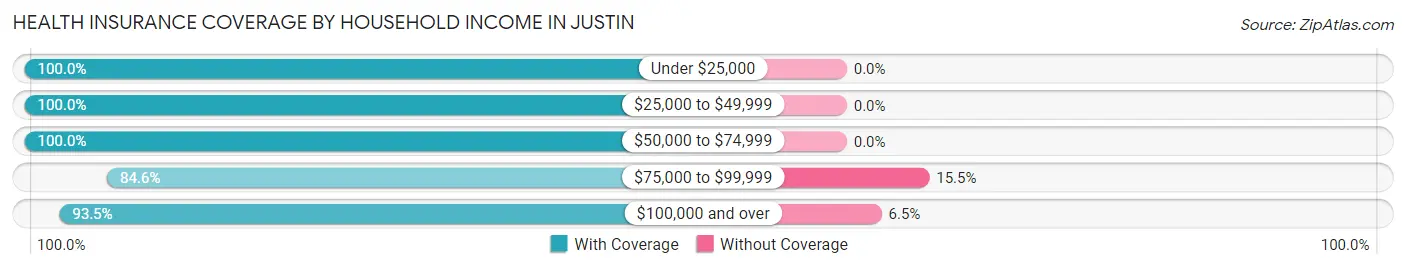
| Household Income | With Coverage | Without Coverage |
| Under $25,000 | 295 (100.0%) | 0 (0.0%) |
| $25,000 to $49,999 | 417 (100.0%) | 0 (0.0%) |
| $50,000 to $74,999 | 560 (100.0%) | 0 (0.0%) |
| $75,000 to $99,999 | 755 (84.6%) | 138 (15.4%) |
| $100,000 and over | 2,280 (93.5%) | 159 (6.5%) |
Public vs Private Health Insurance Coverage by Age in Justin
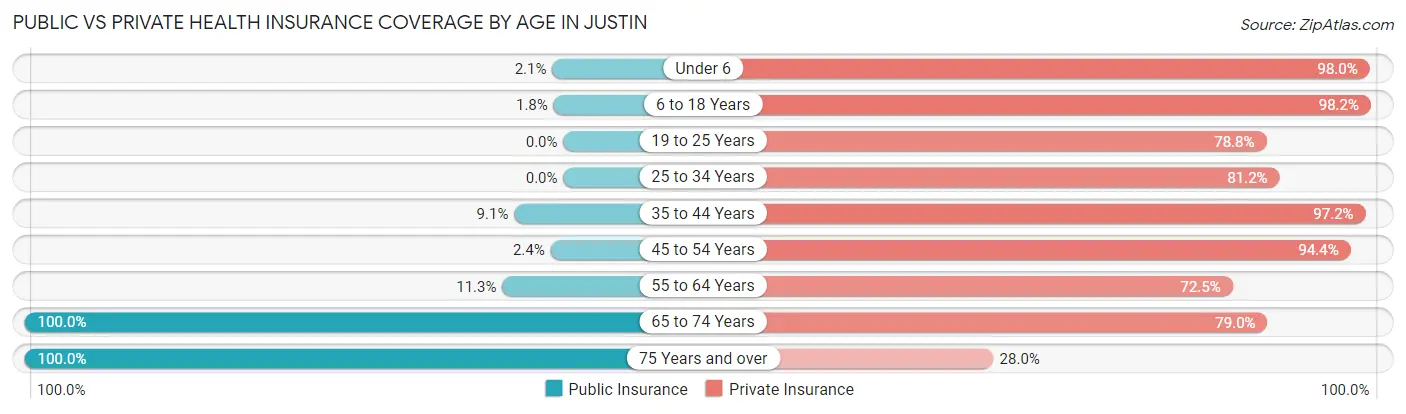
| Age Bracket | Public Insurance | Private Insurance |
| Under 6 | 9 (2.1%) | 431 (98.0%) |
| 6 to 18 Years | 15 (1.8%) | 814 (98.2%) |
| 19 to 25 Years | 0 (0.0%) | 182 (78.8%) |
| 25 to 34 Years | 0 (0.0%) | 476 (81.2%) |
| 35 to 44 Years | 55 (9.1%) | 586 (97.2%) |
| 45 to 54 Years | 23 (2.4%) | 914 (94.4%) |
| 55 to 64 Years | 47 (11.3%) | 301 (72.5%) |
| 65 to 74 Years | 257 (100.0%) | 203 (79.0%) |
| 75 Years and over | 275 (100.0%) | 77 (28.0%) |
| Total | 681 (14.8%) | 3,984 (86.5%) |
Disability Status by Sex by Age in Justin
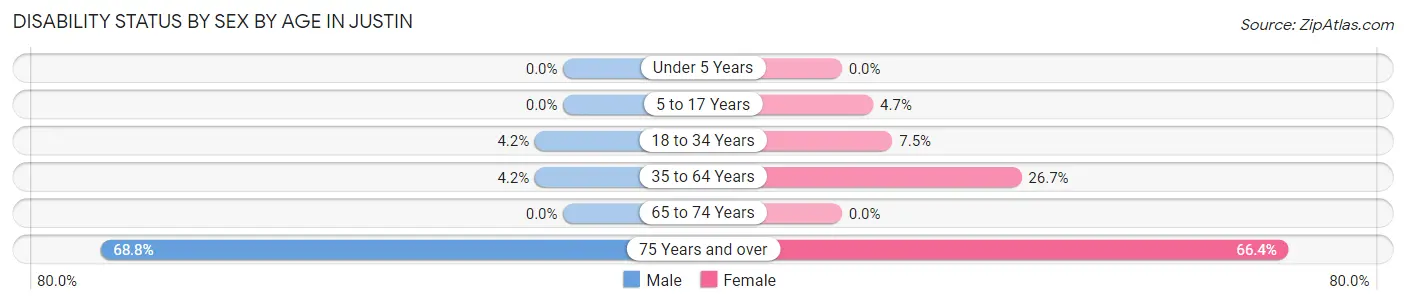
| Age Bracket | Male | Female |
| Under 5 Years | 0 (0.0%) | 0 (0.0%) |
| 5 to 17 Years | 0 (0.0%) | 9 (4.7%) |
| 18 to 34 Years | 15 (4.2%) | 36 (7.5%) |
| 35 to 64 Years | 45 (4.2%) | 244 (26.7%) |
| 65 to 74 Years | 0 (0.0%) | 0 (0.0%) |
| 75 Years and over | 44 (68.8%) | 140 (66.3%) |
Disability Class by Sex by Age in Justin
Disability Class: Hearing Difficulty
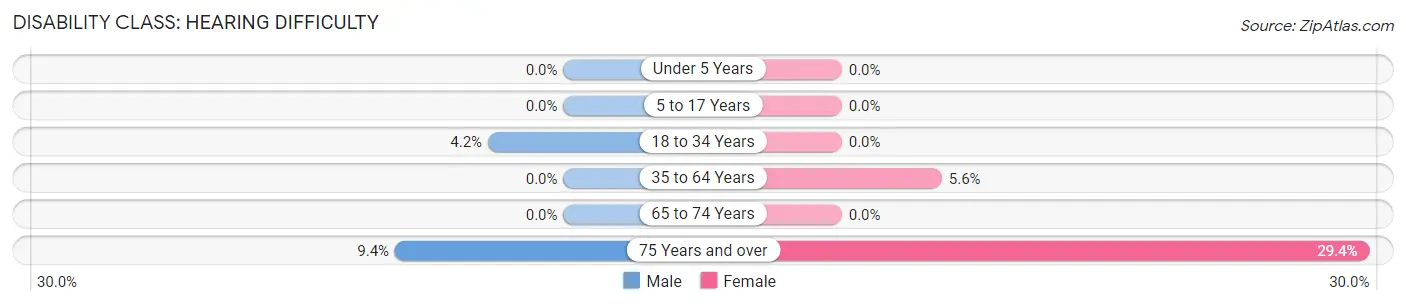
| Age Bracket | Male | Female |
| Under 5 Years | 0 (0.0%) | 0 (0.0%) |
| 5 to 17 Years | 0 (0.0%) | 0 (0.0%) |
| 18 to 34 Years | 15 (4.2%) | 0 (0.0%) |
| 35 to 64 Years | 0 (0.0%) | 51 (5.6%) |
| 65 to 74 Years | 0 (0.0%) | 0 (0.0%) |
| 75 Years and over | 6 (9.4%) | 62 (29.4%) |
Disability Class: Vision Difficulty
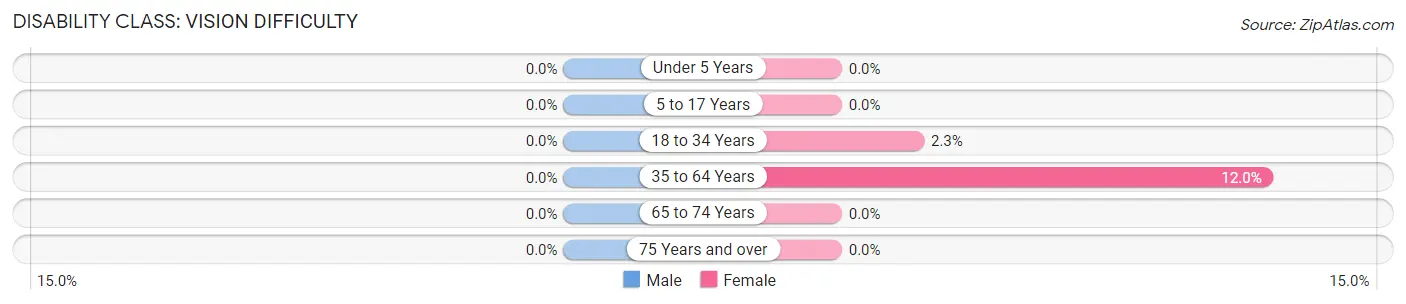
| Age Bracket | Male | Female |
| Under 5 Years | 0 (0.0%) | 0 (0.0%) |
| 5 to 17 Years | 0 (0.0%) | 0 (0.0%) |
| 18 to 34 Years | 0 (0.0%) | 11 (2.3%) |
| 35 to 64 Years | 0 (0.0%) | 110 (12.0%) |
| 65 to 74 Years | 0 (0.0%) | 0 (0.0%) |
| 75 Years and over | 0 (0.0%) | 0 (0.0%) |
Disability Class: Cognitive Difficulty
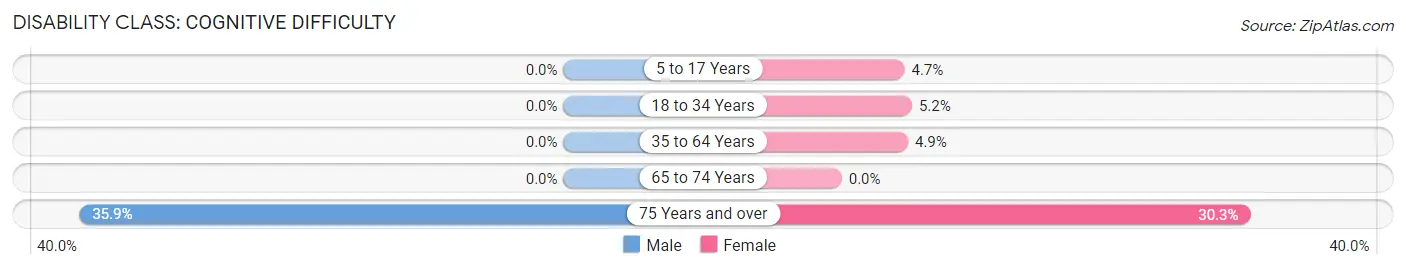
| Age Bracket | Male | Female |
| 5 to 17 Years | 0 (0.0%) | 9 (4.7%) |
| 18 to 34 Years | 0 (0.0%) | 25 (5.2%) |
| 35 to 64 Years | 0 (0.0%) | 45 (4.9%) |
| 65 to 74 Years | 0 (0.0%) | 0 (0.0%) |
| 75 Years and over | 23 (35.9%) | 64 (30.3%) |
Disability Class: Ambulatory Difficulty
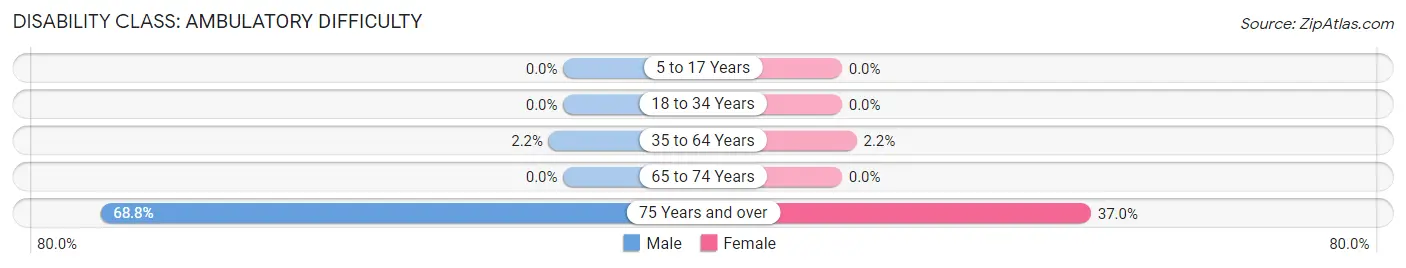
| Age Bracket | Male | Female |
| 5 to 17 Years | 0 (0.0%) | 0 (0.0%) |
| 18 to 34 Years | 0 (0.0%) | 0 (0.0%) |
| 35 to 64 Years | 23 (2.1%) | 20 (2.2%) |
| 65 to 74 Years | 0 (0.0%) | 0 (0.0%) |
| 75 Years and over | 44 (68.8%) | 78 (37.0%) |
Disability Class: Self-Care Difficulty
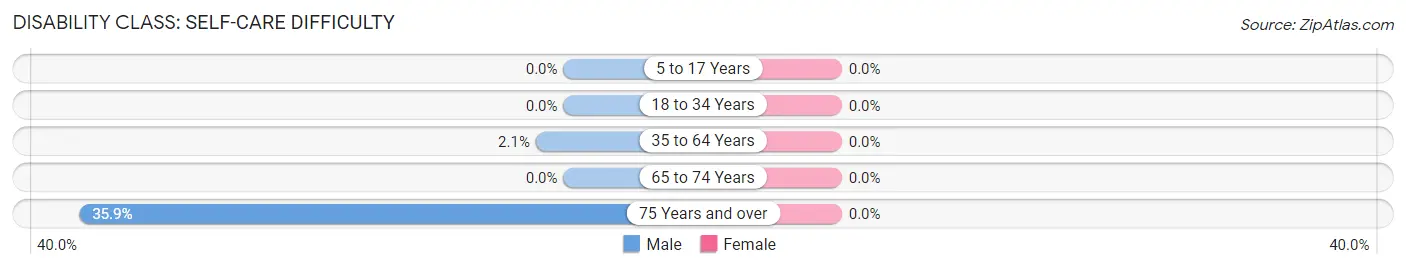
| Age Bracket | Male | Female |
| 5 to 17 Years | 0 (0.0%) | 0 (0.0%) |
| 18 to 34 Years | 0 (0.0%) | 0 (0.0%) |
| 35 to 64 Years | 22 (2.1%) | 0 (0.0%) |
| 65 to 74 Years | 0 (0.0%) | 0 (0.0%) |
| 75 Years and over | 23 (35.9%) | 0 (0.0%) |
Technology Access in Justin
Computing Device Access in Justin
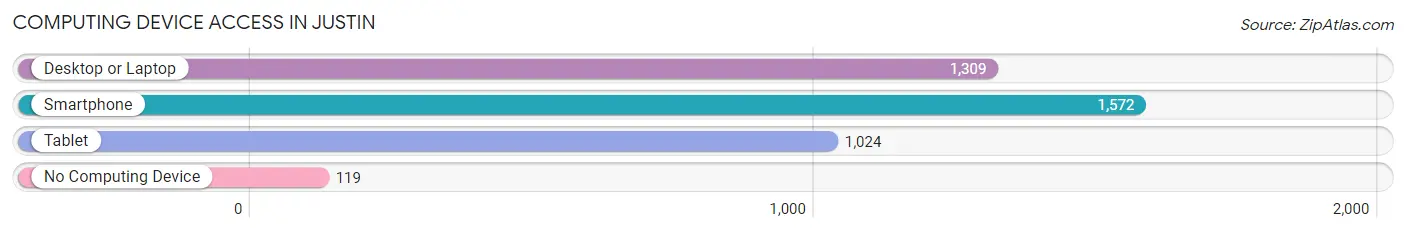
| Device Type | # Households | % Households |
| Desktop or Laptop | 1,309 | 74.2% |
| Smartphone | 1,572 | 89.1% |
| Tablet | 1,024 | 58.1% |
| No Computing Device | 119 | 6.8% |
| Total | 1,764 | 100.0% |
Internet Access in Justin
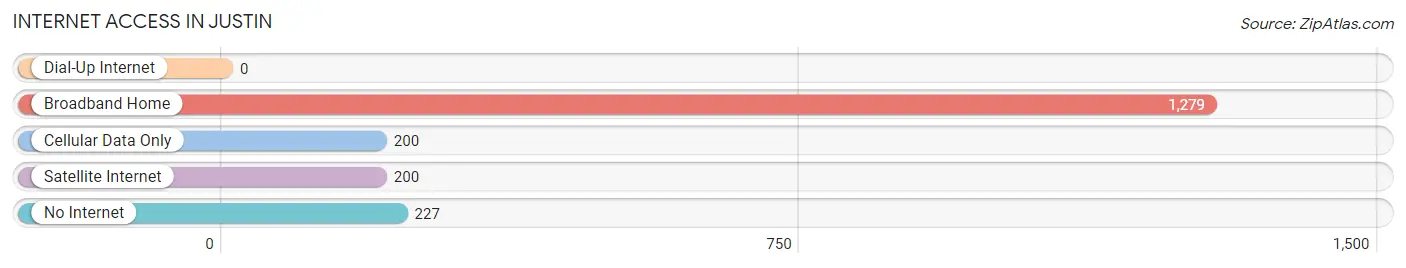
| Internet Type | # Households | % Households |
| Dial-Up Internet | 0 | 0.0% |
| Broadband Home | 1,279 | 72.5% |
| Cellular Data Only | 200 | 11.3% |
| Satellite Internet | 200 | 11.3% |
| No Internet | 227 | 12.9% |
| Total | 1,764 | 100.0% |
Justin Summary
Justin, Texas is a small town located in Denton County, Texas. It is situated about 25 miles northwest of Dallas and is part of the Dallas-Fort Worth-Arlington metropolitan area. The town was founded in 1876 and was named after Justin C. Smith, a local rancher. As of the 2010 census, the population of Justin was 2,246.
History
The area that is now Justin was first settled in the late 1840s by a group of settlers from Kentucky. The town was originally known as Double Springs, but was renamed Justin in 1876 after Justin C. Smith, a local rancher. The town was incorporated in 1891 and was home to a number of businesses, including a cotton gin, a blacksmith shop, a general store, and a hotel.
In the early 1900s, Justin experienced a period of growth and development. The town was home to a number of churches, schools, and businesses. The town also had a post office, a bank, and a newspaper.
Geography
Justin is located in Denton County, Texas, about 25 miles northwest of Dallas. The town is situated at the intersection of U.S. Highway 380 and Farm to Market Road 156. The town is located in the Blackland Prairie region of Texas, which is characterized by flat terrain and fertile soil. The town is located in the Central Time Zone.
The climate in Justin is characterized by hot, humid summers and mild winters. The average temperature in the summer is around 90 degrees Fahrenheit, while the average temperature in the winter is around 50 degrees Fahrenheit. The average annual precipitation is around 36 inches.
Economy
The economy of Justin is largely based on agriculture. The town is home to a number of farms and ranches, which produce a variety of crops, including cotton, corn, wheat, and hay. The town is also home to a number of businesses, including a feed store, a hardware store, and a lumber yard.
Demographics
As of the 2010 census, the population of Justin was 2,246. The population is largely white (90.2%), with a small percentage of African Americans (4.2%), Hispanics (3.3%), and Asians (1.2%). The median household income in Justin is $50,945, and the median home value is $133,400. The town has a low unemployment rate of 3.7%.
Conclusion
Justin, Texas is a small town located in Denton County, Texas. It is situated about 25 miles northwest of Dallas and is part of the Dallas-Fort Worth-Arlington metropolitan area. The town was founded in 1876 and was named after Justin C. Smith, a local rancher. The economy of Justin is largely based on agriculture, and the town is home to a number of businesses. As of the 2010 census, the population of Justin was 2,246. The population is largely white, with a small percentage of African Americans, Hispanics, and Asians. The median household income in Justin is $50,945, and the median home value is $133,400.
Common Questions
What is Per Capita Income in Justin?
Per Capita income in Justin is $43,379.
What is the Median Family Income in Justin?
Median Family Income in Justin is $121,629.
What is the Median Household income in Justin?
Median Household Income in Justin is $89,932.
What is Income or Wage Gap in Justin?
Income or Wage Gap in Justin is 41.4%.
Women in Justin earn 58.6 cents for every dollar earned by a man.
What is Inequality or Gini Index in Justin?
Inequality or Gini Index in Justin is 0.40.
What is the Total Population of Justin?
Total Population of Justin is 4,731.
What is the Total Male Population of Justin?
Total Male Population of Justin is 2,530.
What is the Total Female Population of Justin?
Total Female Population of Justin is 2,201.
What is the Ratio of Males per 100 Females in Justin?
There are 114.95 Males per 100 Females in Justin.
What is the Ratio of Females per 100 Males in Justin?
There are 87.00 Females per 100 Males in Justin.
What is the Median Population Age in Justin?
Median Population Age in Justin is 39.8 Years.
What is the Average Family Size in Justin
Average Family Size in Justin is 3.1 People.
What is the Average Household Size in Justin
Average Household Size in Justin is 2.6 People.
How Large is the Labor Force in Justin?
There are 2,549 People in the Labor Forcein in Justin.
What is the Percentage of People in the Labor Force in Justin?
69.5% of People are in the Labor Force in Justin.
What is the Unemployment Rate in Justin?
Unemployment Rate in Justin is 6.5%.