Albertville, MN Map & Demographics
Albertville Map
Albertville Overview
$45,019
PER CAPITA INCOME
$111,441
AVG FAMILY INCOME
$107,316
AVG HOUSEHOLD INCOME
26.9%
WAGE / INCOME GAP [ % ]
73.1¢/ $1
WAGE / INCOME GAP [ $ ]
0.31
INEQUALITY / GINI INDEX
7,883
TOTAL POPULATION
3,994
MALE POPULATION
3,889
FEMALE POPULATION
102.70
MALES / 100 FEMALES
97.37
FEMALES / 100 MALES
36.9
MEDIAN AGE
3.0
AVG FAMILY SIZE
2.7
AVG HOUSEHOLD SIZE
5,099
LABOR FORCE [ PEOPLE ]
84.6%
PERCENT IN LABOR FORCE
Albertville Zip Codes
Income in Albertville
Income Overview in Albertville
Per Capita Income in Albertville is $45,019, while median incomes of families and households are $111,441 and $107,316 respectively.
| Characteristic | Number | Measure |
| Per Capita Income | 7,883 | $45,019 |
| Median Family Income | 2,232 | $111,441 |
| Mean Family Income | 2,232 | $125,973 |
| Median Household Income | 2,885 | $107,316 |
| Mean Household Income | 2,885 | $119,540 |
| Income Deficit | 2,232 | $0 |
| Wage / Income Gap (%) | 7,883 | 26.88% |
| Wage / Income Gap ($) | 7,883 | 73.12¢ per $1 |
| Gini / Inequality Index | 7,883 | 0.31 |
Earnings by Sex in Albertville
Average Earnings in Albertville are $56,495, $64,343 for men and $47,045 for women, a difference of 26.9%.
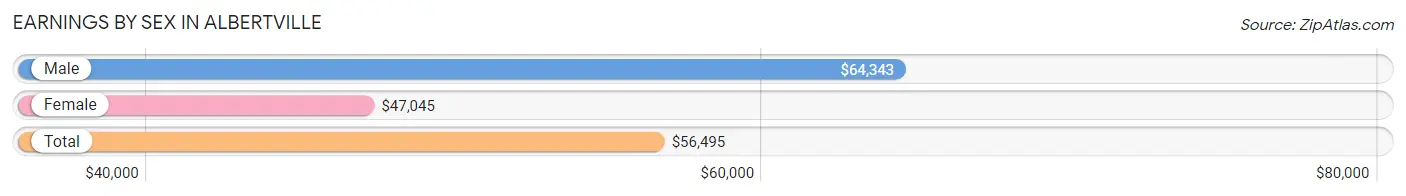
| Sex | Number | Average Earnings |
| Male | 2,830 (54.2%) | $64,343 |
| Female | 2,392 (45.8%) | $47,045 |
| Total | 5,222 (100.0%) | $56,495 |
Earnings by Sex by Income Bracket in Albertville
The most common earnings brackets in Albertville are $65,000 to $74,999 for men (492 | 17.4%) and $75,000 to $99,999 for women (367 | 15.3%).
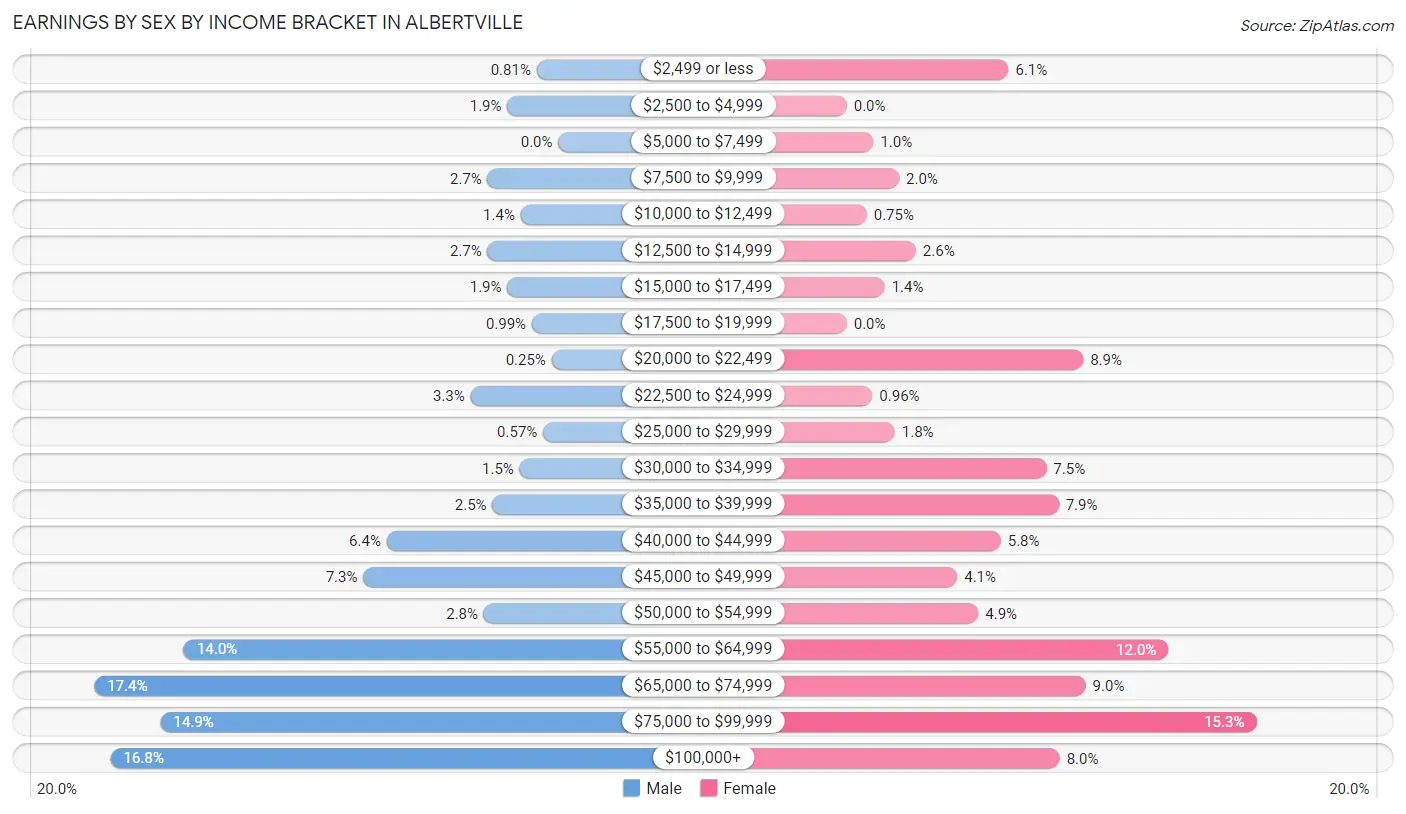
| Income | Male | Female |
| $2,499 or less | 23 (0.8%) | 145 (6.1%) |
| $2,500 to $4,999 | 54 (1.9%) | 0 (0.0%) |
| $5,000 to $7,499 | 0 (0.0%) | 24 (1.0%) |
| $7,500 to $9,999 | 75 (2.6%) | 47 (2.0%) |
| $10,000 to $12,499 | 40 (1.4%) | 18 (0.7%) |
| $12,500 to $14,999 | 75 (2.6%) | 62 (2.6%) |
| $15,000 to $17,499 | 54 (1.9%) | 34 (1.4%) |
| $17,500 to $19,999 | 28 (1.0%) | 0 (0.0%) |
| $20,000 to $22,499 | 7 (0.3%) | 212 (8.9%) |
| $22,500 to $24,999 | 93 (3.3%) | 23 (1.0%) |
| $25,000 to $29,999 | 16 (0.6%) | 43 (1.8%) |
| $30,000 to $34,999 | 41 (1.5%) | 179 (7.5%) |
| $35,000 to $39,999 | 70 (2.5%) | 190 (7.9%) |
| $40,000 to $44,999 | 182 (6.4%) | 138 (5.8%) |
| $45,000 to $49,999 | 207 (7.3%) | 99 (4.1%) |
| $50,000 to $54,999 | 79 (2.8%) | 118 (4.9%) |
| $55,000 to $64,999 | 397 (14.0%) | 288 (12.0%) |
| $65,000 to $74,999 | 492 (17.4%) | 214 (8.9%) |
| $75,000 to $99,999 | 422 (14.9%) | 367 (15.3%) |
| $100,000+ | 475 (16.8%) | 191 (8.0%) |
| Total | 2,830 (100.0%) | 2,392 (100.0%) |
Earnings by Sex by Educational Attainment in Albertville
Average earnings in Albertville are $67,541 for men and $56,614 for women, a difference of 16.2%. Men with an educational attainment of bachelor's degree enjoy the highest average annual earnings of $96,576, while those with high school diploma education earn the least with $49,583. Women with an educational attainment of bachelor's degree earn the most with the average annual earnings of $86,875, while those with college or associate's degree education have the smallest earnings of $22,218.
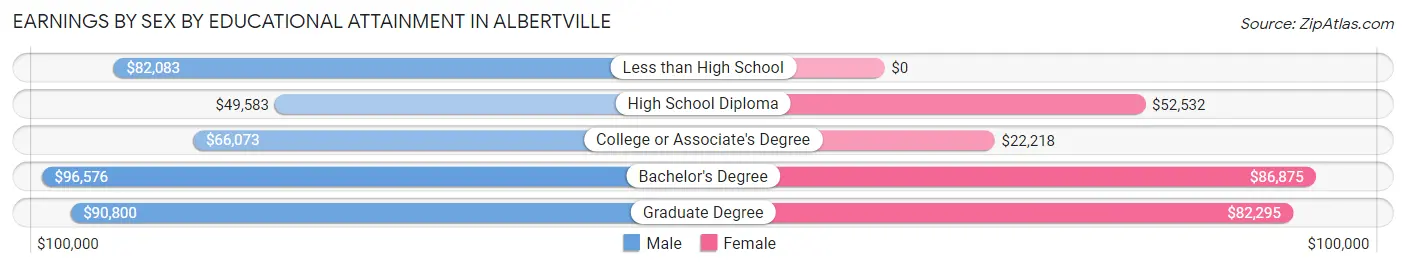
| Educational Attainment | Male Income | Female Income |
| Less than High School | $82,083 | $0 |
| High School Diploma | $49,583 | $52,532 |
| College or Associate's Degree | $66,073 | $22,218 |
| Bachelor's Degree | $96,576 | $86,875 |
| Graduate Degree | $90,800 | $82,295 |
| Total | $67,541 | $56,614 |
Family Income in Albertville
Family Income Brackets in Albertville
According to the Albertville family income data, there are 594 families falling into the $100,000 to $149,999 income range, which is the most common income bracket and makes up 26.6% of all families.
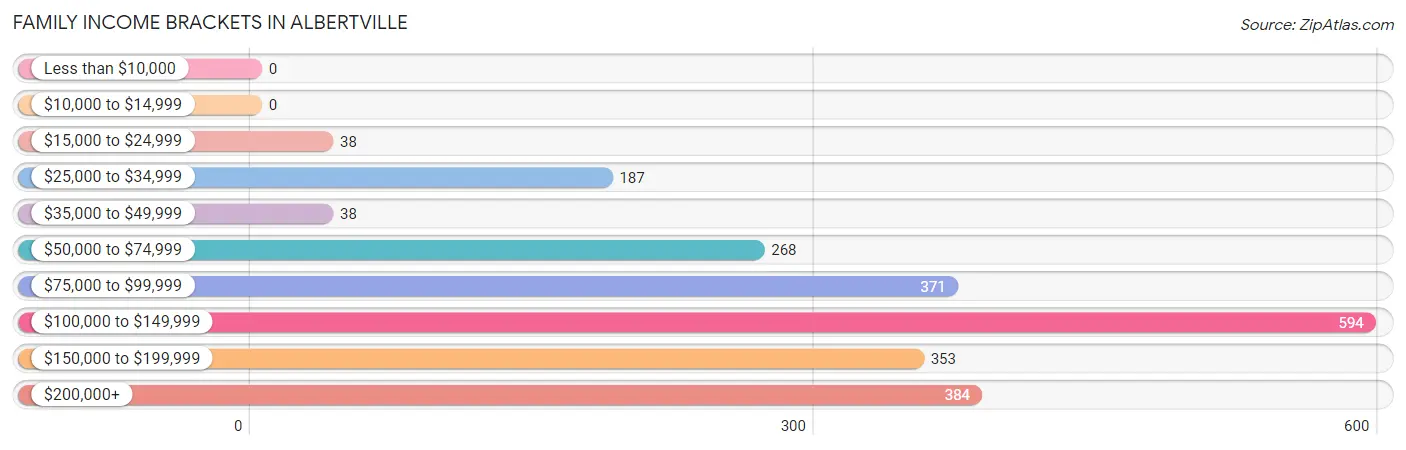
| Income Bracket | # Families | % Families |
| Less than $10,000 | 0 | 0.0% |
| $10,000 to $14,999 | 0 | 0.0% |
| $15,000 to $24,999 | 38 | 1.7% |
| $25,000 to $34,999 | 187 | 8.4% |
| $35,000 to $49,999 | 38 | 1.7% |
| $50,000 to $74,999 | 268 | 12.0% |
| $75,000 to $99,999 | 371 | 16.6% |
| $100,000 to $149,999 | 594 | 26.6% |
| $150,000 to $199,999 | 353 | 15.8% |
| $200,000+ | 384 | 17.2% |
Family Income by Famaliy Size in Albertville
5-person families (185 | 8.3%) account for the highest median family income in Albertville with $154,511 per family, while 3-person families (455 | 20.4%) have the highest median income of $40,744 per family member.
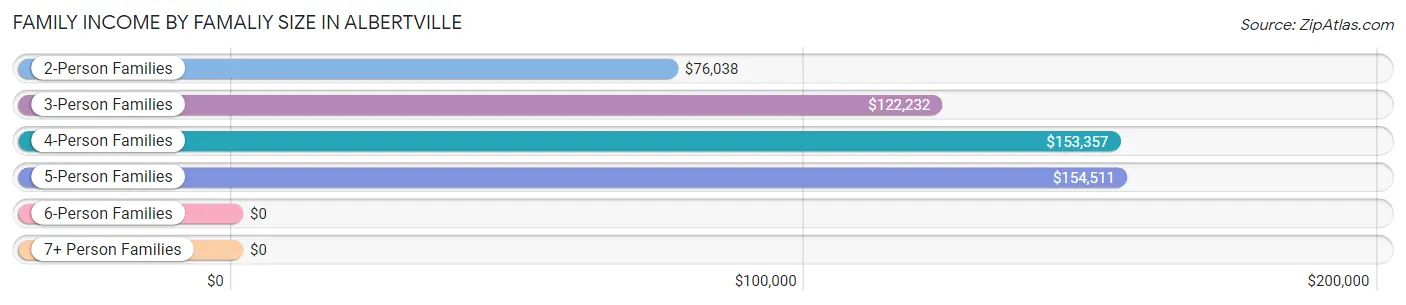
| Income Bracket | # Families | Median Income |
| 2-Person Families | 1,088 (48.7%) | $76,038 |
| 3-Person Families | 455 (20.4%) | $122,232 |
| 4-Person Families | 454 (20.3%) | $153,357 |
| 5-Person Families | 185 (8.3%) | $154,511 |
| 6-Person Families | 21 (0.9%) | $0 |
| 7+ Person Families | 29 (1.3%) | $0 |
| Total | 2,232 (100.0%) | $111,441 |
Family Income by Number of Earners in Albertville
The median family income in Albertville is $111,441, with families comprising 3+ earners (313) having the highest median family income of $153,814, while families with 1 earner (563) have the lowest median family income of $52,660, accounting for 14.0% and 25.2% of families, respectively.
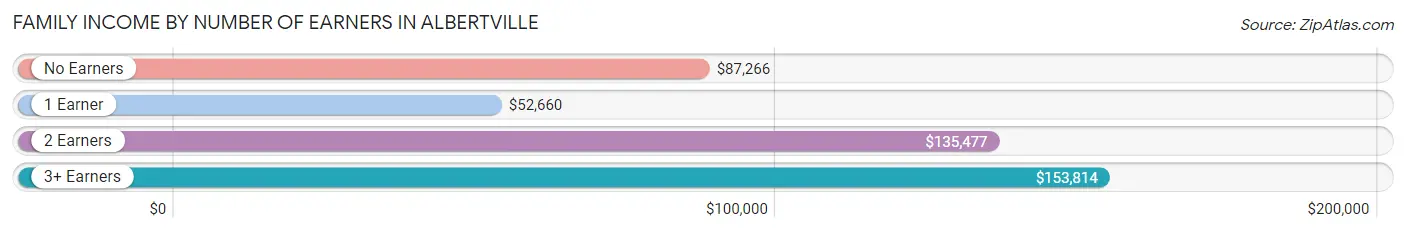
| Number of Earners | # Families | Median Income |
| No Earners | 141 (6.3%) | $87,266 |
| 1 Earner | 563 (25.2%) | $52,660 |
| 2 Earners | 1,215 (54.4%) | $135,477 |
| 3+ Earners | 313 (14.0%) | $153,814 |
| Total | 2,232 (100.0%) | $111,441 |
Household Income in Albertville
Household Income Brackets in Albertville
With 623 households falling in the category, the $100,000 to $149,999 income range is the most frequent in Albertville, accounting for 21.6% of all households. In contrast, only 20 households (0.7%) fall into the $10,000 to $14,999 income bracket, making it the least populous group.
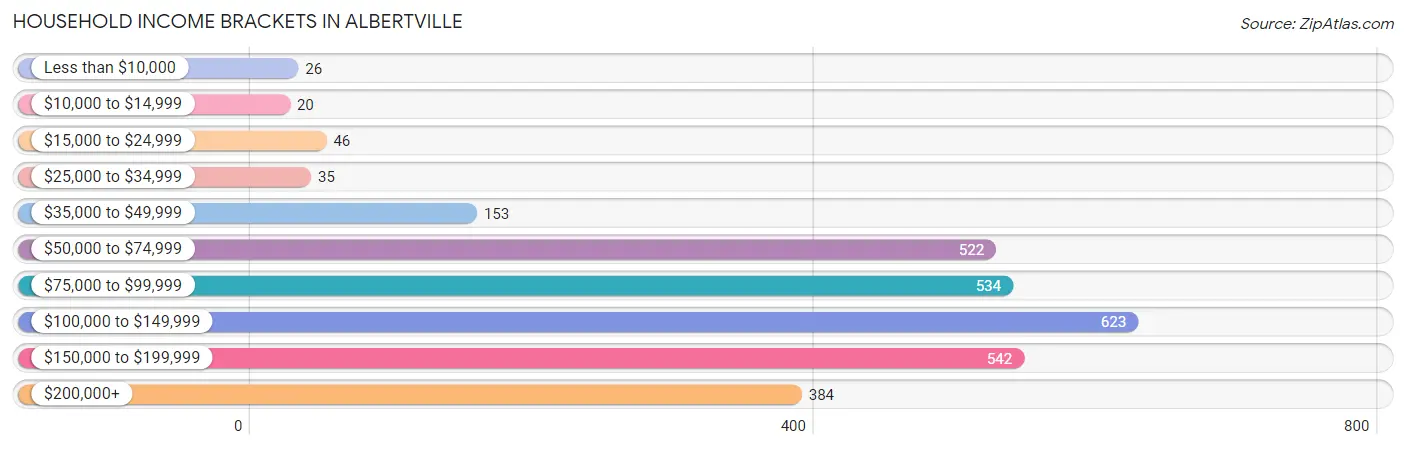
| Income Bracket | # Households | % Households |
| Less than $10,000 | 26 | 0.9% |
| $10,000 to $14,999 | 20 | 0.7% |
| $15,000 to $24,999 | 46 | 1.6% |
| $25,000 to $34,999 | 35 | 1.2% |
| $35,000 to $49,999 | 153 | 5.3% |
| $50,000 to $74,999 | 522 | 18.1% |
| $75,000 to $99,999 | 534 | 18.5% |
| $100,000 to $149,999 | 623 | 21.6% |
| $150,000 to $199,999 | 542 | 18.8% |
| $200,000+ | 384 | 13.3% |
Household Income by Householder Age in Albertville
The median household income in Albertville is $107,316, with the highest median household income of $126,306 found in the 25 to 44 years age bracket for the primary householder. A total of 740 households (25.7%) fall into this category. Meanwhile, the 65+ years age bracket for the primary householder has the lowest median household income of $50,949, with 367 households (12.7%) in this group.
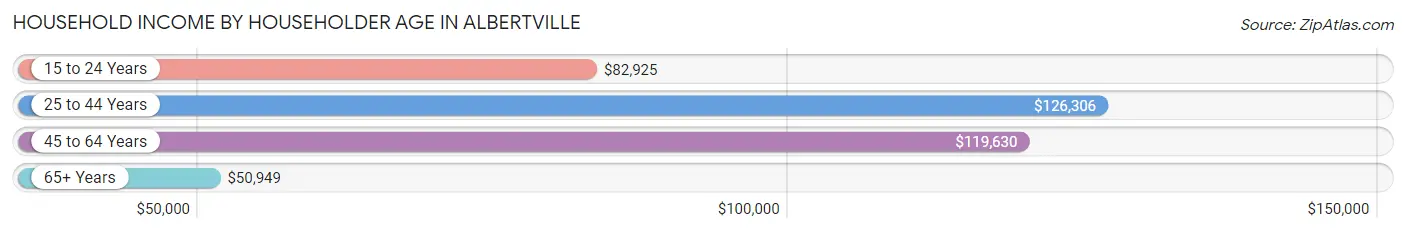
| Income Bracket | # Households | Median Income |
| 15 to 24 Years | 254 (8.8%) | $82,925 |
| 25 to 44 Years | 740 (25.7%) | $126,306 |
| 45 to 64 Years | 1,524 (52.8%) | $119,630 |
| 65+ Years | 367 (12.7%) | $50,949 |
| Total | 2,885 (100.0%) | $107,316 |
Poverty in Albertville
Income Below Poverty by Sex and Age in Albertville
With 0.1% poverty level for males and 1.2% for females among the residents of Albertville, 65 to 74 year old males and 65 to 74 year old females are the most vulnerable to poverty, with 1 males (0.9%) and 21 females (15.1%) in their respective age groups living below the poverty level.
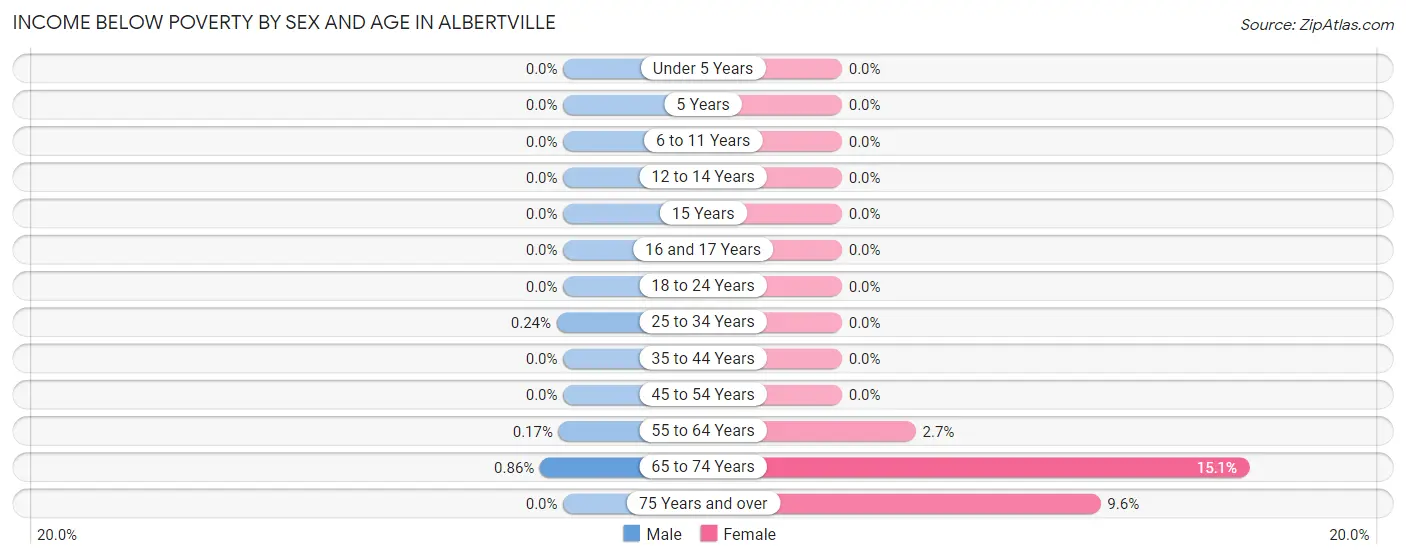
| Age Bracket | Male | Female |
| Under 5 Years | 0 (0.0%) | 0 (0.0%) |
| 5 Years | 0 (0.0%) | 0 (0.0%) |
| 6 to 11 Years | 0 (0.0%) | 0 (0.0%) |
| 12 to 14 Years | 0 (0.0%) | 0 (0.0%) |
| 15 Years | 0 (0.0%) | 0 (0.0%) |
| 16 and 17 Years | 0 (0.0%) | 0 (0.0%) |
| 18 to 24 Years | 0 (0.0%) | 0 (0.0%) |
| 25 to 34 Years | 1 (0.2%) | 0 (0.0%) |
| 35 to 44 Years | 0 (0.0%) | 0 (0.0%) |
| 45 to 54 Years | 0 (0.0%) | 0 (0.0%) |
| 55 to 64 Years | 1 (0.2%) | 9 (2.7%) |
| 65 to 74 Years | 1 (0.9%) | 21 (15.1%) |
| 75 Years and over | 0 (0.0%) | 17 (9.6%) |
| Total | 3 (0.1%) | 47 (1.2%) |
Income Above Poverty by Sex and Age in Albertville
According to the poverty statistics in Albertville, males aged under 5 years and females aged under 5 years are the age groups that are most secure financially, with 100.0% of males and 100.0% of females in these age groups living above the poverty line.
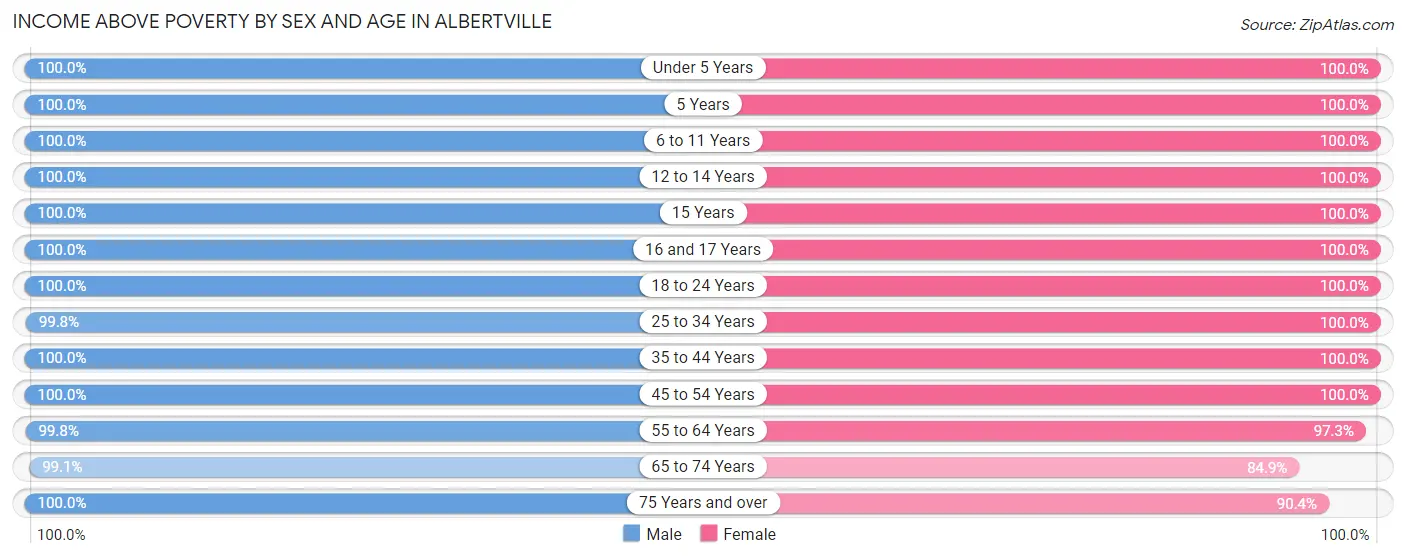
| Age Bracket | Male | Female |
| Under 5 Years | 200 (100.0%) | 110 (100.0%) |
| 5 Years | 37 (100.0%) | 115 (100.0%) |
| 6 to 11 Years | 430 (100.0%) | 443 (100.0%) |
| 12 to 14 Years | 224 (100.0%) | 131 (100.0%) |
| 15 Years | 119 (100.0%) | 47 (100.0%) |
| 16 and 17 Years | 41 (100.0%) | 94 (100.0%) |
| 18 to 24 Years | 342 (100.0%) | 476 (100.0%) |
| 25 to 34 Years | 409 (99.8%) | 558 (100.0%) |
| 35 to 44 Years | 457 (100.0%) | 590 (100.0%) |
| 45 to 54 Years | 880 (100.0%) | 681 (100.0%) |
| 55 to 64 Years | 585 (99.8%) | 319 (97.3%) |
| 65 to 74 Years | 115 (99.1%) | 118 (84.9%) |
| 75 Years and over | 152 (100.0%) | 160 (90.4%) |
| Total | 3,991 (99.9%) | 3,842 (98.8%) |
Income Below Poverty Among Married-Couple Families in Albertville
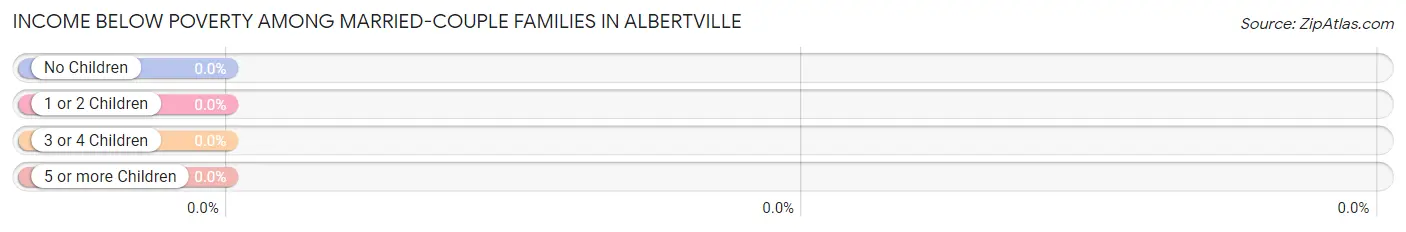
| Children | Above Poverty | Below Poverty |
| No Children | 798 (100.0%) | 0 (0.0%) |
| 1 or 2 Children | 711 (100.0%) | 0 (0.0%) |
| 3 or 4 Children | 151 (100.0%) | 0 (0.0%) |
| 5 or more Children | 29 (100.0%) | 0 (0.0%) |
| Total | 1,689 (100.0%) | 0 (0.0%) |
Income Below Poverty Among Single-Parent Households in Albertville
| Children | Single Father | Single Mother |
| No Children | 0 (0.0%) | 0 (0.0%) |
| 1 or 2 Children | 0 (0.0%) | 0 (0.0%) |
| 3 or 4 Children | 0 (0.0%) | 0 (0.0%) |
| 5 or more Children | 0 (0.0%) | 0 (0.0%) |
| Total | 0 (0.0%) | 0 (0.0%) |
Income Below Poverty Among Married-Couple vs Single-Parent Households in Albertville
| Children | Married-Couple Families | Single-Parent Households |
| No Children | 0 (0.0%) | 0 (0.0%) |
| 1 or 2 Children | 0 (0.0%) | 0 (0.0%) |
| 3 or 4 Children | 0 (0.0%) | 0 (0.0%) |
| 5 or more Children | 0 (0.0%) | 0 (0.0%) |
| Total | 0 (0.0%) | 0 (0.0%) |
Race in Albertville
The most populous races in Albertville are White / Caucasian (6,916 | 87.7%), Two or more Races (621 | 7.9%), and Some other Race (180 | 2.3%).
| Race | # Population | % Population |
| Asian | 66 | 0.8% |
| Black / African American | 100 | 1.3% |
| Hawaiian / Pacific | 0 | 0.0% |
| Hispanic or Latino | 57 | 0.7% |
| Native / Alaskan | 0 | 0.0% |
| White / Caucasian | 6,916 | 87.7% |
| Two or more Races | 621 | 7.9% |
| Some other Race | 180 | 2.3% |
| Total | 7,883 | 100.0% |
Ancestry in Albertville
The most populous ancestries reported in Albertville are German (2,853 | 36.2%), Irish (1,127 | 14.3%), Norwegian (940 | 11.9%), Finnish (702 | 8.9%), and English (586 | 7.4%), together accounting for 78.7% of all Albertville residents.
| Ancestry | # Population | % Population |
| American | 414 | 5.2% |
| Belgian | 14 | 0.2% |
| British | 65 | 0.8% |
| Czech | 111 | 1.4% |
| Danish | 21 | 0.3% |
| English | 586 | 7.4% |
| European | 261 | 3.3% |
| Finnish | 702 | 8.9% |
| French | 258 | 3.3% |
| French Canadian | 222 | 2.8% |
| German | 2,853 | 36.2% |
| Indian (Asian) | 29 | 0.4% |
| Irish | 1,127 | 14.3% |
| Italian | 264 | 3.4% |
| Luxembourger | 9 | 0.1% |
| Malaysian | 36 | 0.5% |
| Nigerian | 53 | 0.7% |
| Norwegian | 940 | 11.9% |
| Polish | 530 | 6.7% |
| Puerto Rican | 46 | 0.6% |
| Russian | 39 | 0.5% |
| Scandinavian | 148 | 1.9% |
| Scottish | 23 | 0.3% |
| Spanish | 11 | 0.1% |
| Sri Lankan | 41 | 0.5% |
| Subsaharan African | 53 | 0.7% |
| Swedish | 438 | 5.6% |
| Swiss | 27 | 0.3% |
| Ukrainian | 105 | 1.3% |
| Welsh | 19 | 0.2% | View All 30 Rows |
Immigrants in Albertville
The most numerous immigrant groups reported in Albertville came from Asia (66 | 0.8%), Canada (38 | 0.5%), South Central Asia (37 | 0.5%), Sri Lanka (37 | 0.5%), and China (29 | 0.4%), together accounting for 2.6% of all Albertville residents.
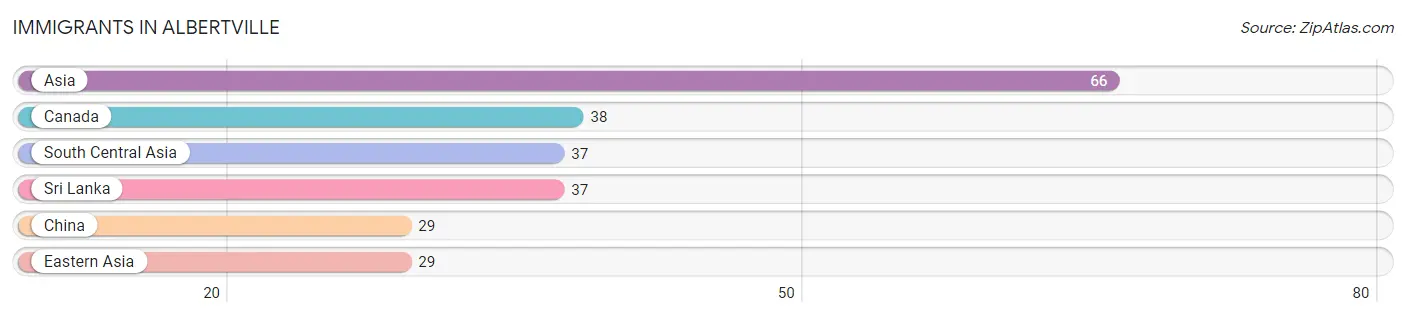
| Immigration Origin | # Population | % Population |
| Asia | 66 | 0.8% |
| Canada | 38 | 0.5% |
| China | 29 | 0.4% |
| Eastern Asia | 29 | 0.4% |
| South Central Asia | 37 | 0.5% |
| Sri Lanka | 37 | 0.5% | View All 6 Rows |
Sex and Age in Albertville
Sex and Age in Albertville
The most populous age groups in Albertville are 50 to 54 Years (442 | 11.1%) for men and 45 to 49 Years (443 | 11.4%) for women.
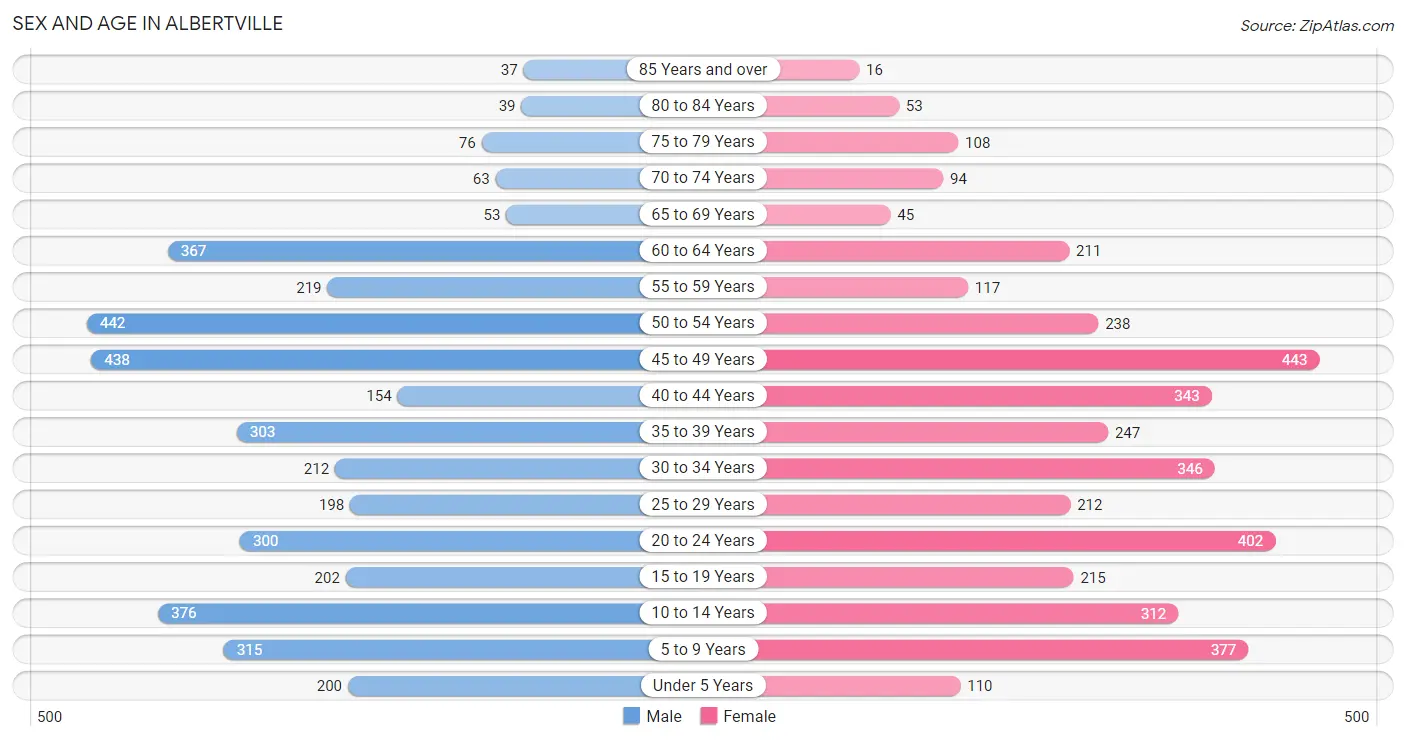
| Age Bracket | Male | Female |
| Under 5 Years | 200 (5.0%) | 110 (2.8%) |
| 5 to 9 Years | 315 (7.9%) | 377 (9.7%) |
| 10 to 14 Years | 376 (9.4%) | 312 (8.0%) |
| 15 to 19 Years | 202 (5.1%) | 215 (5.5%) |
| 20 to 24 Years | 300 (7.5%) | 402 (10.3%) |
| 25 to 29 Years | 198 (5.0%) | 212 (5.4%) |
| 30 to 34 Years | 212 (5.3%) | 346 (8.9%) |
| 35 to 39 Years | 303 (7.6%) | 247 (6.4%) |
| 40 to 44 Years | 154 (3.9%) | 343 (8.8%) |
| 45 to 49 Years | 438 (11.0%) | 443 (11.4%) |
| 50 to 54 Years | 442 (11.1%) | 238 (6.1%) |
| 55 to 59 Years | 219 (5.5%) | 117 (3.0%) |
| 60 to 64 Years | 367 (9.2%) | 211 (5.4%) |
| 65 to 69 Years | 53 (1.3%) | 45 (1.2%) |
| 70 to 74 Years | 63 (1.6%) | 94 (2.4%) |
| 75 to 79 Years | 76 (1.9%) | 108 (2.8%) |
| 80 to 84 Years | 39 (1.0%) | 53 (1.4%) |
| 85 Years and over | 37 (0.9%) | 16 (0.4%) |
| Total | 3,994 (100.0%) | 3,889 (100.0%) |
Families and Households in Albertville
Median Family Size in Albertville
The median family size in Albertville is 3.05 persons per family, with married-couple families (1,689 | 75.7%) accounting for the largest median family size of 3.34 persons per family. On the other hand, single female/mother families (369 | 16.5%) represent the smallest median family size with 2.07 persons per family.
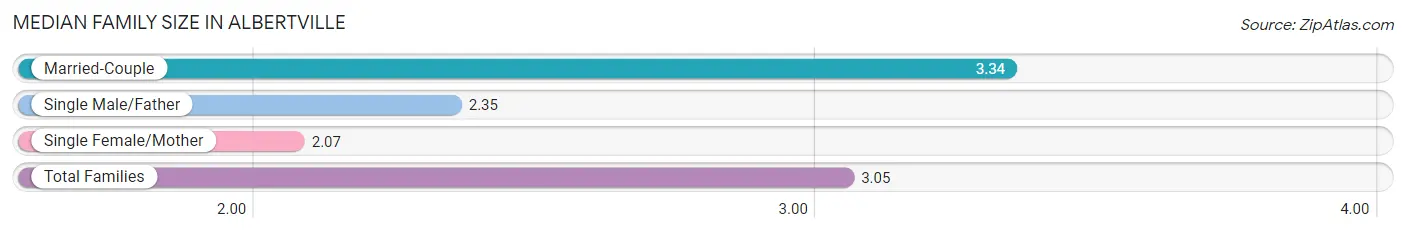
| Family Type | # Families | Family Size |
| Married-Couple | 1,689 (75.7%) | 3.34 |
| Single Male/Father | 174 (7.8%) | 2.35 |
| Single Female/Mother | 369 (16.5%) | 2.07 |
| Total Families | 2,232 (100.0%) | 3.05 |
Median Household Size in Albertville
The median household size in Albertville is 2.73 persons per household, with married-couple households (1,689 | 58.5%) accounting for the largest median household size of 3.36 persons per household. non-family households (653 | 22.6%) represent the smallest median household size with 1.22 persons per household.
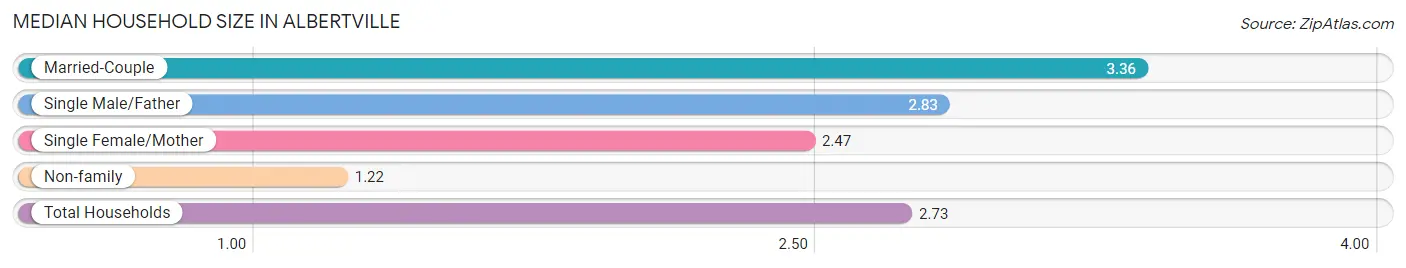
| Household Type | # Households | Household Size |
| Married-Couple | 1,689 (58.5%) | 3.36 |
| Single Male/Father | 174 (6.0%) | 2.83 |
| Single Female/Mother | 369 (12.8%) | 2.47 |
| Non-family | 653 (22.6%) | 1.22 |
| Total Households | 2,885 (100.0%) | 2.73 |
Household Size by Marriage Status in Albertville
Out of a total of 2,885 households in Albertville, 2,232 (77.4%) are family households, while 653 (22.6%) are nonfamily households. The most numerous type of family households are 2-person households, comprising 847, and the most common type of nonfamily households are 1-person households, comprising 503.
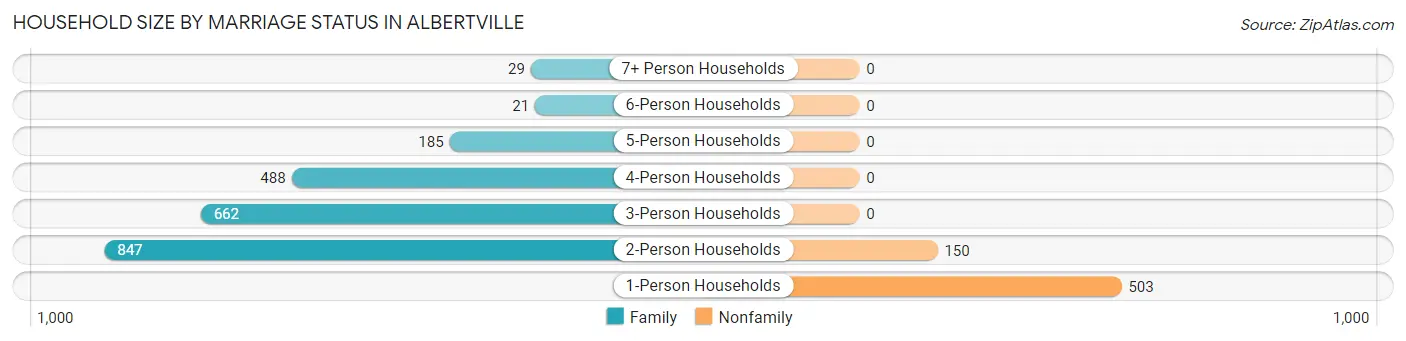
| Household Size | Family Households | Nonfamily Households |
| 1-Person Households | - | 503 (17.4%) |
| 2-Person Households | 847 (29.4%) | 150 (5.2%) |
| 3-Person Households | 662 (23.0%) | 0 (0.0%) |
| 4-Person Households | 488 (16.9%) | 0 (0.0%) |
| 5-Person Households | 185 (6.4%) | 0 (0.0%) |
| 6-Person Households | 21 (0.7%) | 0 (0.0%) |
| 7+ Person Households | 29 (1.0%) | 0 (0.0%) |
| Total | 2,232 (77.4%) | 653 (22.6%) |
Female Fertility in Albertville
Fertility by Age in Albertville
Average fertility rate in Albertville is 1.0 births per 1,000 women. Women in the age bracket of 20 to 34 years have the highest fertility rate with 3.0 births per 1,000 women. Women in the age bracket of 20 to 34 years acount for 100.0% of all women with births.
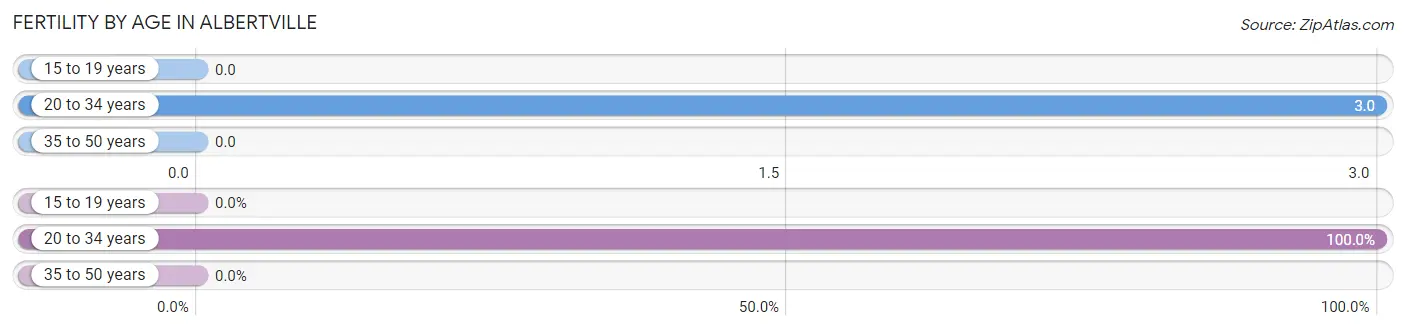
| Age Bracket | Women with Births | Births / 1,000 Women |
| 15 to 19 years | 0 (0.0%) | 0.0 |
| 20 to 34 years | 3 (100.0%) | 3.0 |
| 35 to 50 years | 0 (0.0%) | 0.0 |
| Total | 3 (100.0%) | 1.0 |
Fertility by Age by Marriage Status in Albertville
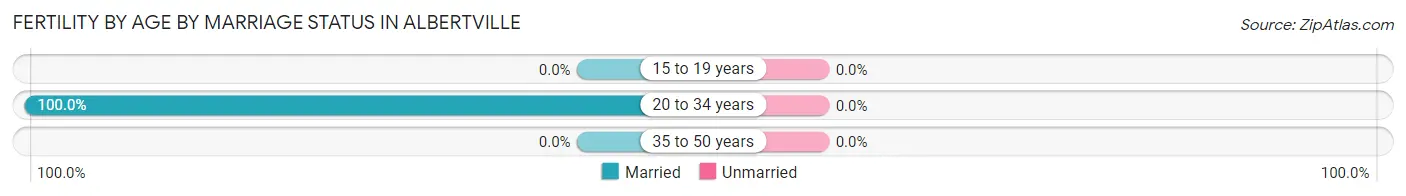
| Age Bracket | Married | Unmarried |
| 15 to 19 years | 0 (0.0%) | 0 (0.0%) |
| 20 to 34 years | 3 (100.0%) | 0 (0.0%) |
| 35 to 50 years | 0 (0.0%) | 0 (0.0%) |
| Total | 3 (100.0%) | 0 (0.0%) |
Fertility by Education in Albertville
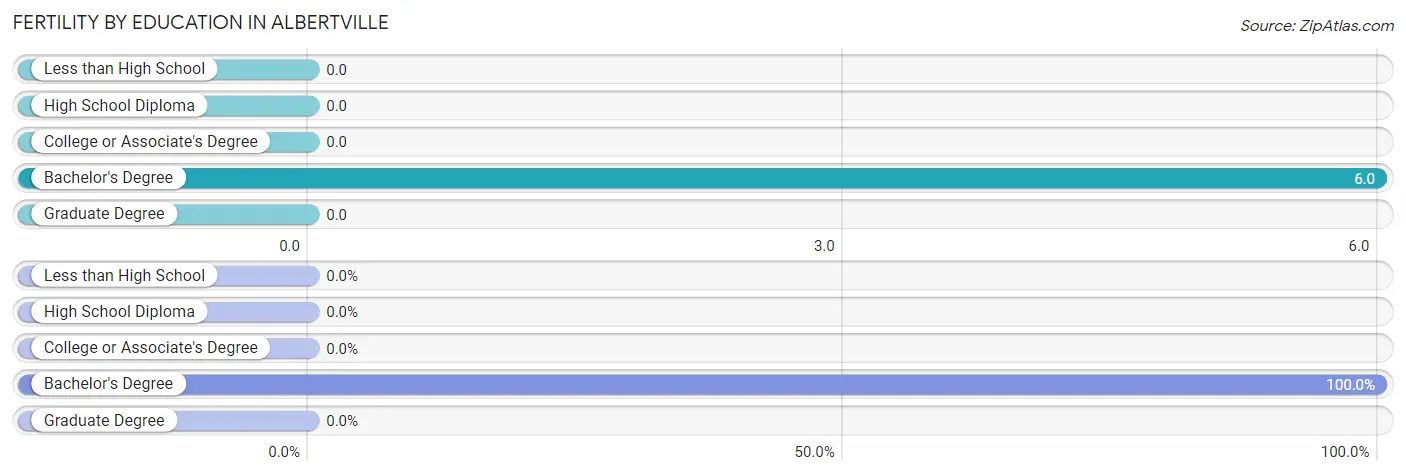
| Educational Attainment | Women with Births | Births / 1,000 Women |
| Less than High School | 0 (0.0%) | 0.0 |
| High School Diploma | 0 (0.0%) | 0.0 |
| College or Associate's Degree | 0 (0.0%) | 0.0 |
| Bachelor's Degree | 3 (100.0%) | 6.0 |
| Graduate Degree | 0 (0.0%) | 0.0 |
| Total | 3 (100.0%) | 1.0 |
Fertility by Education by Marriage Status in Albertville
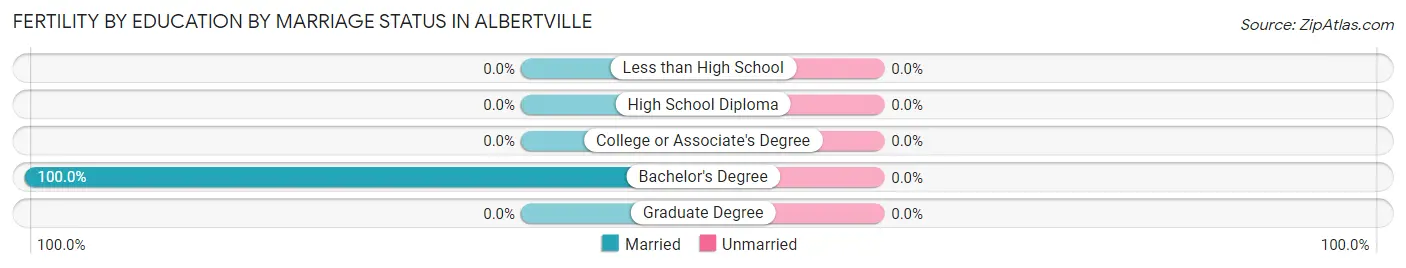
| Educational Attainment | Married | Unmarried |
| Less than High School | 0 (0.0%) | 0 (0.0%) |
| High School Diploma | 0 (0.0%) | 0 (0.0%) |
| College or Associate's Degree | 0 (0.0%) | 0 (0.0%) |
| Bachelor's Degree | 3 (100.0%) | 0 (0.0%) |
| Graduate Degree | 0 (0.0%) | 0 (0.0%) |
| Total | 3 (100.0%) | 0 (0.0%) |
Employment Characteristics in Albertville
Employment by Class of Employer in Albertville
Among the 4,998 employed individuals in Albertville, private company employees (3,870 | 77.4%), not-for-profit organizations (353 | 7.1%), and local government employees (283 | 5.7%) make up the most common classes of employment.
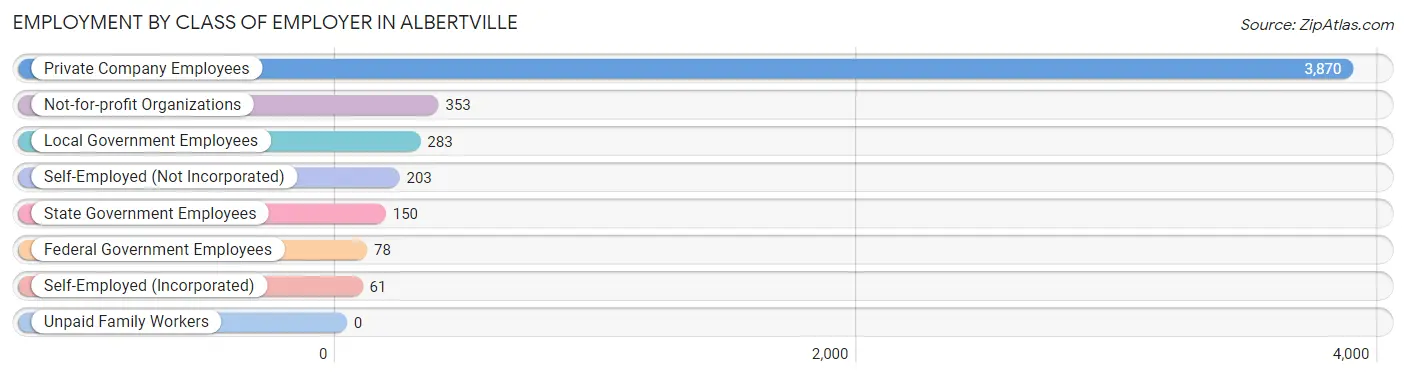
| Employer Class | # Employees | % Employees |
| Private Company Employees | 3,870 | 77.4% |
| Self-Employed (Incorporated) | 61 | 1.2% |
| Self-Employed (Not Incorporated) | 203 | 4.1% |
| Not-for-profit Organizations | 353 | 7.1% |
| Local Government Employees | 283 | 5.7% |
| State Government Employees | 150 | 3.0% |
| Federal Government Employees | 78 | 1.6% |
| Unpaid Family Workers | 0 | 0.0% |
| Total | 4,998 | 100.0% |
Employment Status by Age in Albertville
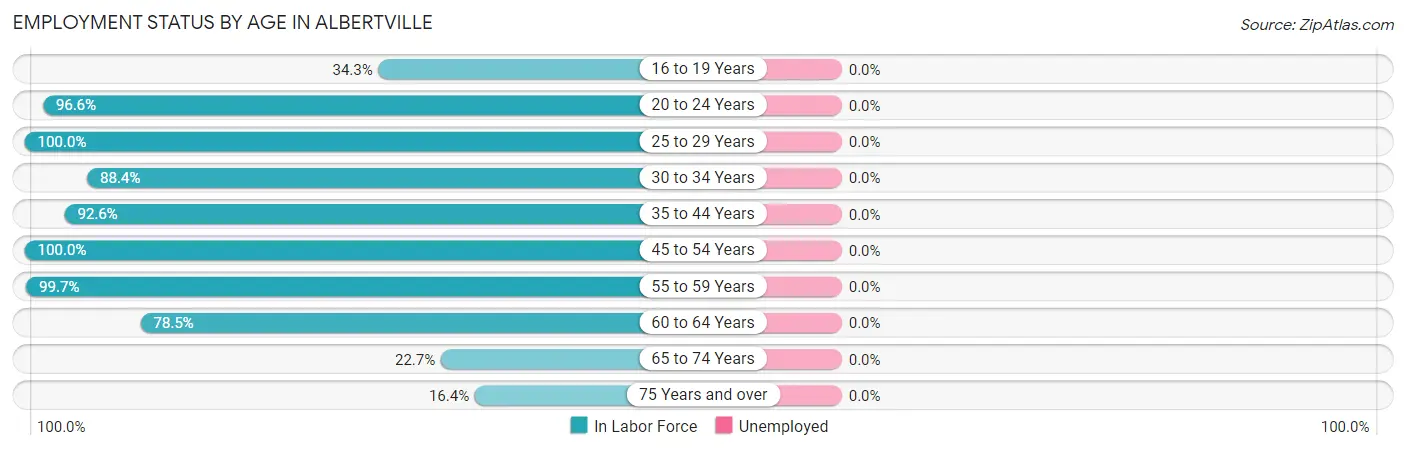
| Age Bracket | In Labor Force | Unemployed |
| 16 to 19 Years | 86 (34.3%) | 0 (0.0%) |
| 20 to 24 Years | 678 (96.6%) | 0 (0.0%) |
| 25 to 29 Years | 410 (100.0%) | 0 (0.0%) |
| 30 to 34 Years | 493 (88.4%) | 0 (0.0%) |
| 35 to 44 Years | 970 (92.6%) | 0 (0.0%) |
| 45 to 54 Years | 1,561 (100.0%) | 0 (0.0%) |
| 55 to 59 Years | 335 (99.7%) | 0 (0.0%) |
| 60 to 64 Years | 454 (78.5%) | 0 (0.0%) |
| 65 to 74 Years | 58 (22.7%) | 0 (0.0%) |
| 75 Years and over | 54 (16.4%) | 0 (0.0%) |
| Total | 5,099 (84.6%) | 0 (0.0%) |
Employment Status by Educational Attainment in Albertville
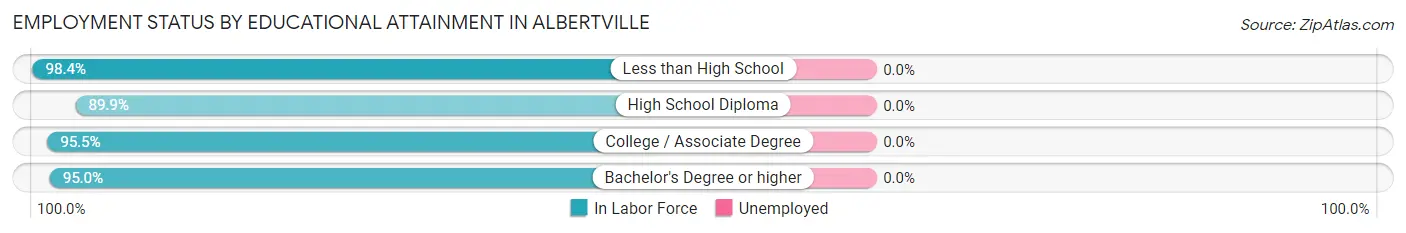
| Educational Attainment | In Labor Force | Unemployed |
| Less than High School | 62 (98.4%) | 0 (0.0%) |
| High School Diploma | 966 (89.9%) | 0 (0.0%) |
| College / Associate Degree | 1,645 (95.5%) | 0 (0.0%) |
| Bachelor's Degree or higher | 1,548 (95.0%) | 0 (0.0%) |
| Total | 4,221 (94.0%) | 0 (0.0%) |
Employment Occupations by Sex in Albertville
Management, Business, Science and Arts Occupations
The most common Management, Business, Science and Arts occupations in Albertville are Business & Financial (719 | 14.1%), Management (459 | 9.0%), Community & Social Service (380 | 7.4%), Education Instruction & Library (342 | 6.7%), and Computers, Engineering & Science (264 | 5.2%).
Management, Business, Science and Arts Occupations by Sex
Within the Management, Business, Science and Arts occupations in Albertville, the most male-oriented occupations are Architecture & Engineering (100.0%), Arts, Media & Entertainment (100.0%), and Computers, Engineering & Science (80.3%), while the most female-oriented occupations are Health Diagnosing & Treating (87.2%), Education Instruction & Library (72.5%), and Health Technologists (71.9%).
| Occupation | Male | Female |
| Management | 199 (43.4%) | 260 (56.6%) |
| Business & Financial | 216 (30.0%) | 503 (70.0%) |
| Computers, Engineering & Science | 212 (80.3%) | 52 (19.7%) |
| Computers & Mathematics | 145 (73.6%) | 52 (26.4%) |
| Architecture & Engineering | 67 (100.0%) | 0 (0.0%) |
| Life, Physical & Social Science | 0 (0.0%) | 0 (0.0%) |
| Community & Social Service | 132 (34.7%) | 248 (65.3%) |
| Education, Arts & Media | 0 (0.0%) | 0 (0.0%) |
| Legal Services & Support | 0 (0.0%) | 0 (0.0%) |
| Education Instruction & Library | 94 (27.5%) | 248 (72.5%) |
| Arts, Media & Entertainment | 38 (100.0%) | 0 (0.0%) |
| Health Diagnosing & Treating | 25 (12.8%) | 170 (87.2%) |
| Health Technologists | 25 (28.1%) | 64 (71.9%) |
| Total (Category) | 784 (38.9%) | 1,233 (61.1%) |
| Total (Overall) | 2,770 (54.3%) | 2,328 (45.7%) |
Services Occupations
The most common Services occupations in Albertville are Food Preparation & Serving (232 | 4.5%), Personal Care & Service (99 | 1.9%), Cleaning & Maintenance (24 | 0.5%), Security & Protection (7 | 0.1%), and Firefighting & Prevention (7 | 0.1%).
Services Occupations by Sex
Within the Services occupations in Albertville, the most male-oriented occupations are Security & Protection (100.0%), Firefighting & Prevention (100.0%), and Cleaning & Maintenance (100.0%), while the most female-oriented occupations are Personal Care & Service (100.0%), and Food Preparation & Serving (34.5%).
| Occupation | Male | Female |
| Healthcare Support | 0 (0.0%) | 0 (0.0%) |
| Security & Protection | 7 (100.0%) | 0 (0.0%) |
| Firefighting & Prevention | 7 (100.0%) | 0 (0.0%) |
| Law Enforcement | 0 (0.0%) | 0 (0.0%) |
| Food Preparation & Serving | 152 (65.5%) | 80 (34.5%) |
| Cleaning & Maintenance | 24 (100.0%) | 0 (0.0%) |
| Personal Care & Service | 0 (0.0%) | 99 (100.0%) |
| Total (Category) | 183 (50.5%) | 179 (49.4%) |
| Total (Overall) | 2,770 (54.3%) | 2,328 (45.7%) |
Sales and Office Occupations
The most common Sales and Office occupations in Albertville are Sales & Related (659 | 12.9%), and Office & Administration (596 | 11.7%).
Sales and Office Occupations by Sex
| Occupation | Male | Female |
| Sales & Related | 444 (67.4%) | 215 (32.6%) |
| Office & Administration | 117 (19.6%) | 479 (80.4%) |
| Total (Category) | 561 (44.7%) | 694 (55.3%) |
| Total (Overall) | 2,770 (54.3%) | 2,328 (45.7%) |
Natural Resources, Construction and Maintenance Occupations
The most common Natural Resources, Construction and Maintenance occupations in Albertville are Construction & Extraction (567 | 11.1%), and Installation, Maintenance & Repair (210 | 4.1%).
Natural Resources, Construction and Maintenance Occupations by Sex
| Occupation | Male | Female |
| Farming, Fishing & Forestry | 0 (0.0%) | 0 (0.0%) |
| Construction & Extraction | 567 (100.0%) | 0 (0.0%) |
| Installation, Maintenance & Repair | 171 (81.4%) | 39 (18.6%) |
| Total (Category) | 738 (95.0%) | 39 (5.0%) |
| Total (Overall) | 2,770 (54.3%) | 2,328 (45.7%) |
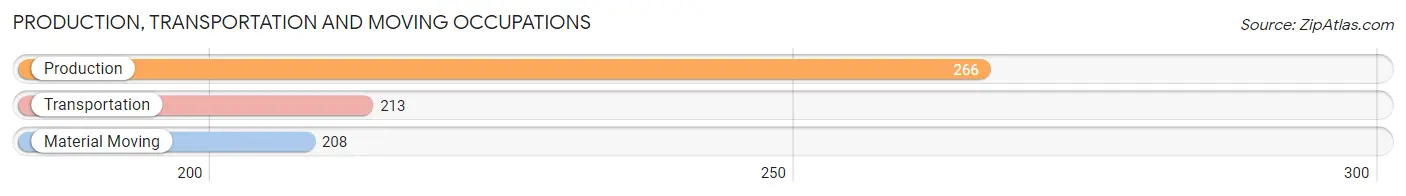
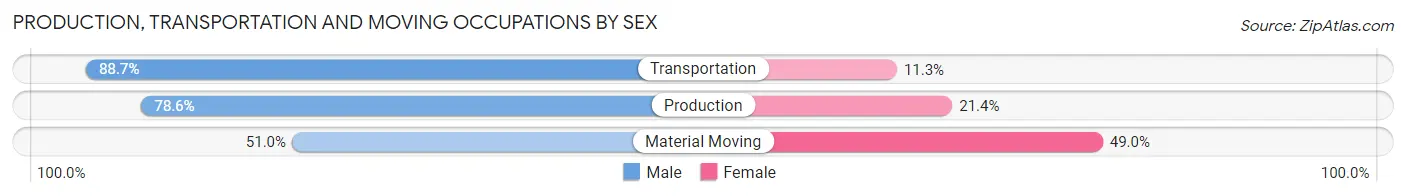
Production, Transportation and Moving Occupations
The most common Production, Transportation and Moving occupations in Albertville are Production (266 | 5.2%), Transportation (213 | 4.2%), and Material Moving (208 | 4.1%).
Production, Transportation and Moving Occupations by Sex
| Occupation | Male | Female |
| Production | 209 (78.6%) | 57 (21.4%) |
| Transportation | 189 (88.7%) | 24 (11.3%) |
| Material Moving | 106 (51.0%) | 102 (49.0%) |
| Total (Category) | 504 (73.4%) | 183 (26.6%) |
| Total (Overall) | 2,770 (54.3%) | 2,328 (45.7%) |
Employment Industries by Sex in Albertville
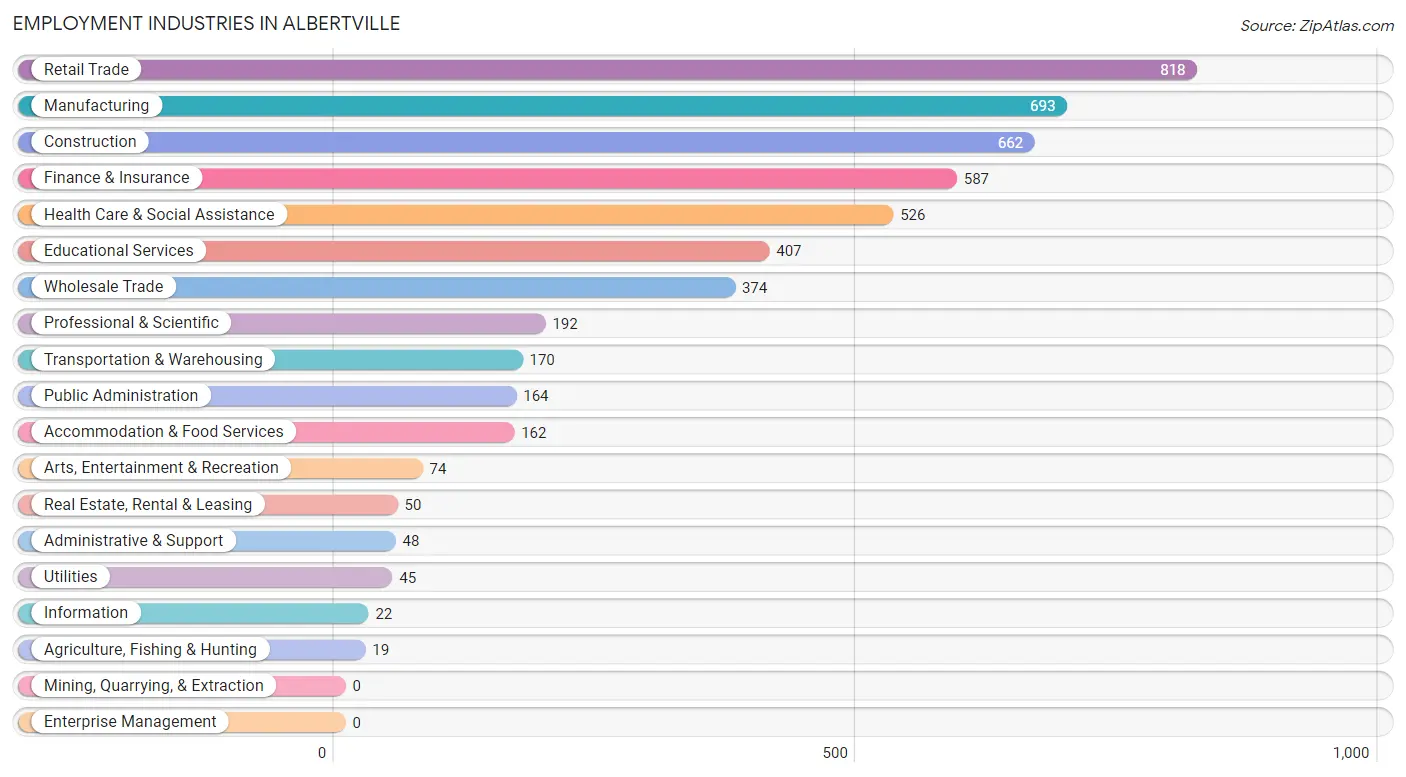
Employment Industries in Albertville
The major employment industries in Albertville include Retail Trade (818 | 16.1%), Manufacturing (693 | 13.6%), Construction (662 | 13.0%), Finance & Insurance (587 | 11.5%), and Health Care & Social Assistance (526 | 10.3%).
Employment Industries by Sex in Albertville
The Albertville industries that see more men than women are Agriculture, Fishing & Hunting (100.0%), Utilities (100.0%), and Information (100.0%), whereas the industries that tend to have a higher number of women are Public Administration (79.9%), Health Care & Social Assistance (77.2%), and Educational Services (76.9%).
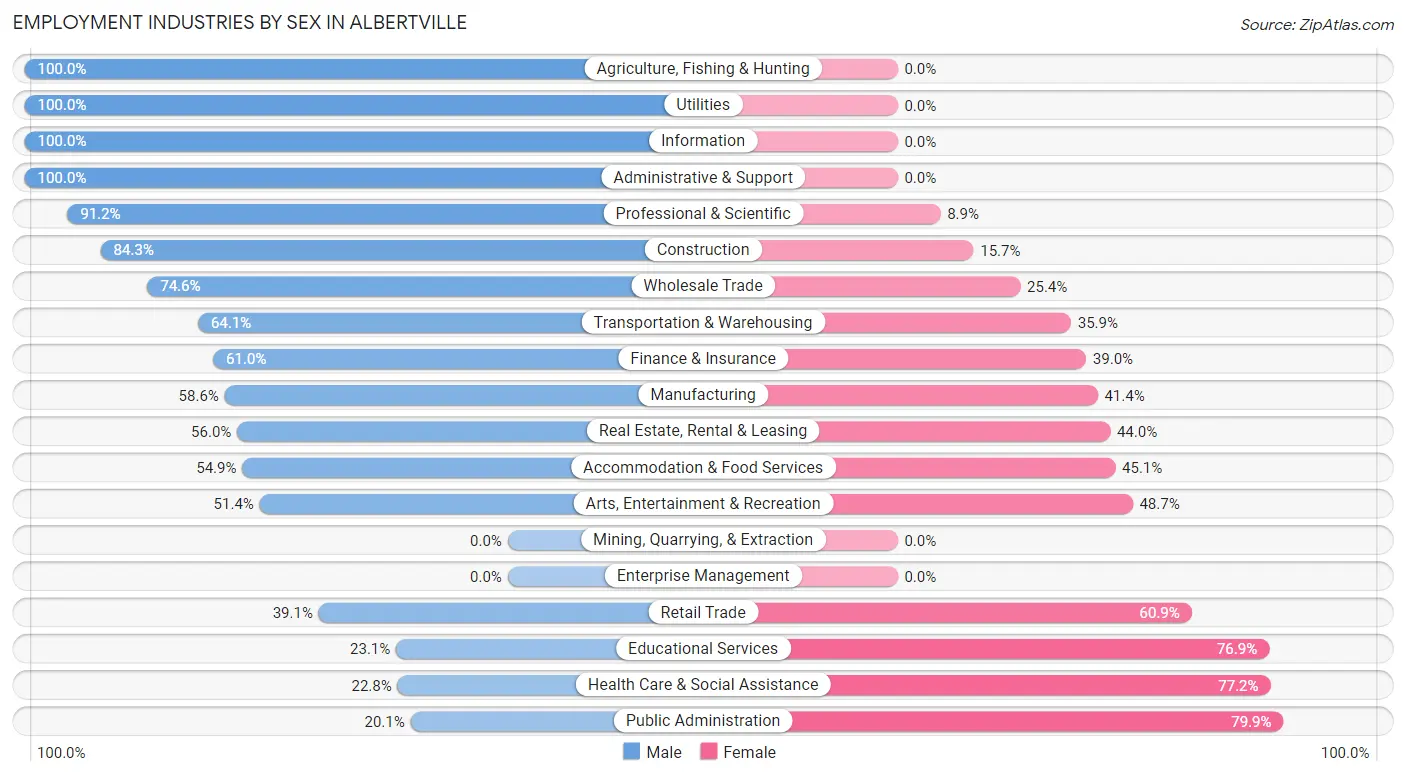
| Industry | Male | Female |
| Agriculture, Fishing & Hunting | 19 (100.0%) | 0 (0.0%) |
| Mining, Quarrying, & Extraction | 0 (0.0%) | 0 (0.0%) |
| Construction | 558 (84.3%) | 104 (15.7%) |
| Manufacturing | 406 (58.6%) | 287 (41.4%) |
| Wholesale Trade | 279 (74.6%) | 95 (25.4%) |
| Retail Trade | 320 (39.1%) | 498 (60.9%) |
| Transportation & Warehousing | 109 (64.1%) | 61 (35.9%) |
| Utilities | 45 (100.0%) | 0 (0.0%) |
| Information | 22 (100.0%) | 0 (0.0%) |
| Finance & Insurance | 358 (61.0%) | 229 (39.0%) |
| Real Estate, Rental & Leasing | 28 (56.0%) | 22 (44.0%) |
| Professional & Scientific | 175 (91.1%) | 17 (8.8%) |
| Enterprise Management | 0 (0.0%) | 0 (0.0%) |
| Administrative & Support | 48 (100.0%) | 0 (0.0%) |
| Educational Services | 94 (23.1%) | 313 (76.9%) |
| Health Care & Social Assistance | 120 (22.8%) | 406 (77.2%) |
| Arts, Entertainment & Recreation | 38 (51.3%) | 36 (48.6%) |
| Accommodation & Food Services | 89 (54.9%) | 73 (45.1%) |
| Public Administration | 33 (20.1%) | 131 (79.9%) |
| Total | 2,770 (54.3%) | 2,328 (45.7%) |
Education in Albertville
School Enrollment in Albertville
The most common levels of schooling among the 2,093 students in Albertville are middle school (571 | 27.3%), elementary school (534 | 25.5%), and high school (459 | 21.9%).
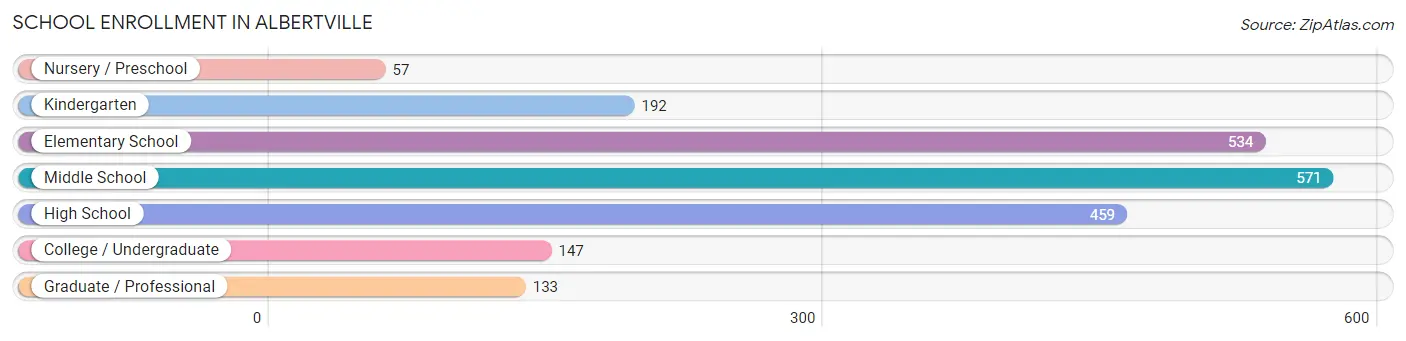
| School Level | # Students | % Students |
| Nursery / Preschool | 57 | 2.7% |
| Kindergarten | 192 | 9.2% |
| Elementary School | 534 | 25.5% |
| Middle School | 571 | 27.3% |
| High School | 459 | 21.9% |
| College / Undergraduate | 147 | 7.0% |
| Graduate / Professional | 133 | 6.4% |
| Total | 2,093 | 100.0% |
School Enrollment by Age by Funding Source in Albertville
Out of a total of 2,093 students who are enrolled in schools in Albertville, 299 (14.3%) attend a private institution, while the remaining 1,794 (85.7%) are enrolled in public schools. The age group of 3 to 4 year olds has the highest likelihood of being enrolled in private schools, with 57 (100.0% in the age bracket) enrolled. Conversely, the age group of 15 to 17 year olds has the lowest likelihood of being enrolled in a private school, with 301 (100.0% in the age bracket) attending a public institution.
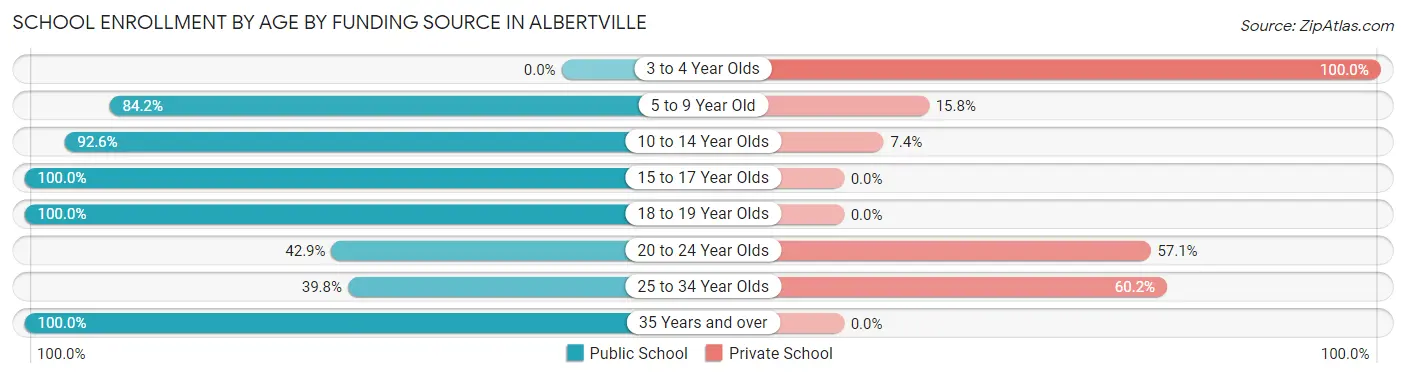
| Age Bracket | Public School | Private School |
| 3 to 4 Year Olds | 0 (0.0%) | 57 (100.0%) |
| 5 to 9 Year Old | 574 (84.2%) | 108 (15.8%) |
| 10 to 14 Year Olds | 637 (92.6%) | 51 (7.4%) |
| 15 to 17 Year Olds | 301 (100.0%) | 0 (0.0%) |
| 18 to 19 Year Olds | 116 (100.0%) | 0 (0.0%) |
| 20 to 24 Year Olds | 18 (42.9%) | 24 (57.1%) |
| 25 to 34 Year Olds | 39 (39.8%) | 59 (60.2%) |
| 35 Years and over | 109 (100.0%) | 0 (0.0%) |
| Total | 1,794 (85.7%) | 299 (14.3%) |
Educational Attainment by Field of Study in Albertville
Business (807 | 40.0%), education (402 | 19.9%), arts & humanities (196 | 9.7%), communications (127 | 6.3%), and computers & mathematics (121 | 6.0%) are the most common fields of study among 2,020 individuals in Albertville who have obtained a bachelor's degree or higher.
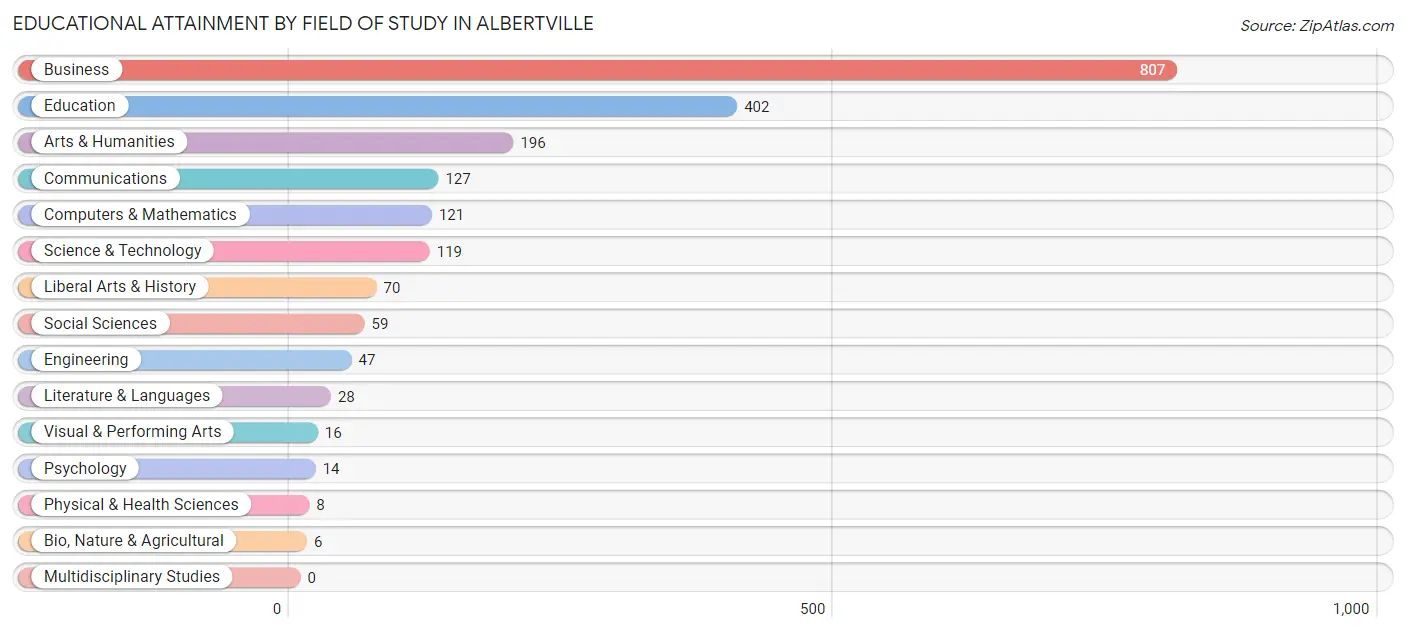
| Field of Study | # Graduates | % Graduates |
| Computers & Mathematics | 121 | 6.0% |
| Bio, Nature & Agricultural | 6 | 0.3% |
| Physical & Health Sciences | 8 | 0.4% |
| Psychology | 14 | 0.7% |
| Social Sciences | 59 | 2.9% |
| Engineering | 47 | 2.3% |
| Multidisciplinary Studies | 0 | 0.0% |
| Science & Technology | 119 | 5.9% |
| Business | 807 | 40.0% |
| Education | 402 | 19.9% |
| Literature & Languages | 28 | 1.4% |
| Liberal Arts & History | 70 | 3.5% |
| Visual & Performing Arts | 16 | 0.8% |
| Communications | 127 | 6.3% |
| Arts & Humanities | 196 | 9.7% |
| Total | 2,020 | 100.0% |
Transportation & Commute in Albertville
Vehicle Availability by Sex in Albertville
The most prevalent vehicle ownership categories in Albertville are males with 2 vehicles (875, accounting for 32.9%) and females with 2 vehicles (921, making up 37.6%).
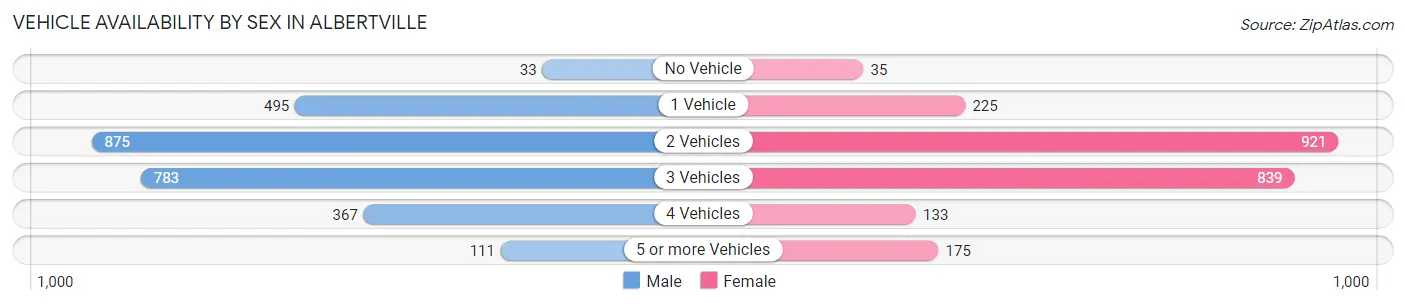
| Vehicles Available | Male | Female |
| No Vehicle | 33 (1.2%) | 35 (1.5%) |
| 1 Vehicle | 495 (18.6%) | 225 (9.7%) |
| 2 Vehicles | 875 (32.9%) | 921 (39.6%) |
| 3 Vehicles | 783 (29.4%) | 839 (36.0%) |
| 4 Vehicles | 367 (13.8%) | 133 (5.7%) |
| 5 or more Vehicles | 111 (4.2%) | 175 (7.5%) |
| Total | 2,664 (100.0%) | 2,328 (100.0%) |
Commute Time in Albertville
The most frequently occuring commute durations in Albertville are 30 to 34 minutes (965 commuters, 22.6%), 20 to 24 minutes (613 commuters, 14.3%), and 10 to 14 minutes (583 commuters, 13.6%).
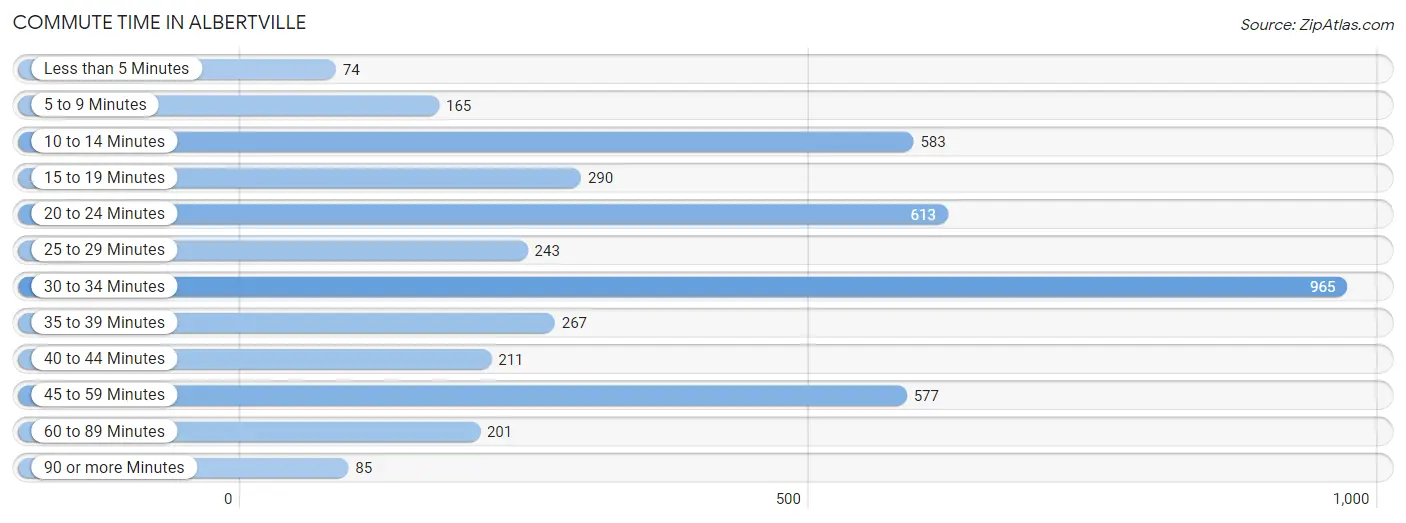
| Commute Time | # Commuters | % Commuters |
| Less than 5 Minutes | 74 | 1.7% |
| 5 to 9 Minutes | 165 | 3.9% |
| 10 to 14 Minutes | 583 | 13.6% |
| 15 to 19 Minutes | 290 | 6.8% |
| 20 to 24 Minutes | 613 | 14.3% |
| 25 to 29 Minutes | 243 | 5.7% |
| 30 to 34 Minutes | 965 | 22.6% |
| 35 to 39 Minutes | 267 | 6.2% |
| 40 to 44 Minutes | 211 | 4.9% |
| 45 to 59 Minutes | 577 | 13.5% |
| 60 to 89 Minutes | 201 | 4.7% |
| 90 or more Minutes | 85 | 2.0% |
Commute Time by Sex in Albertville
The most common commute times in Albertville are 30 to 34 minutes (592 commuters, 24.8%) for males and 20 to 24 minutes (471 commuters, 25.0%) for females.
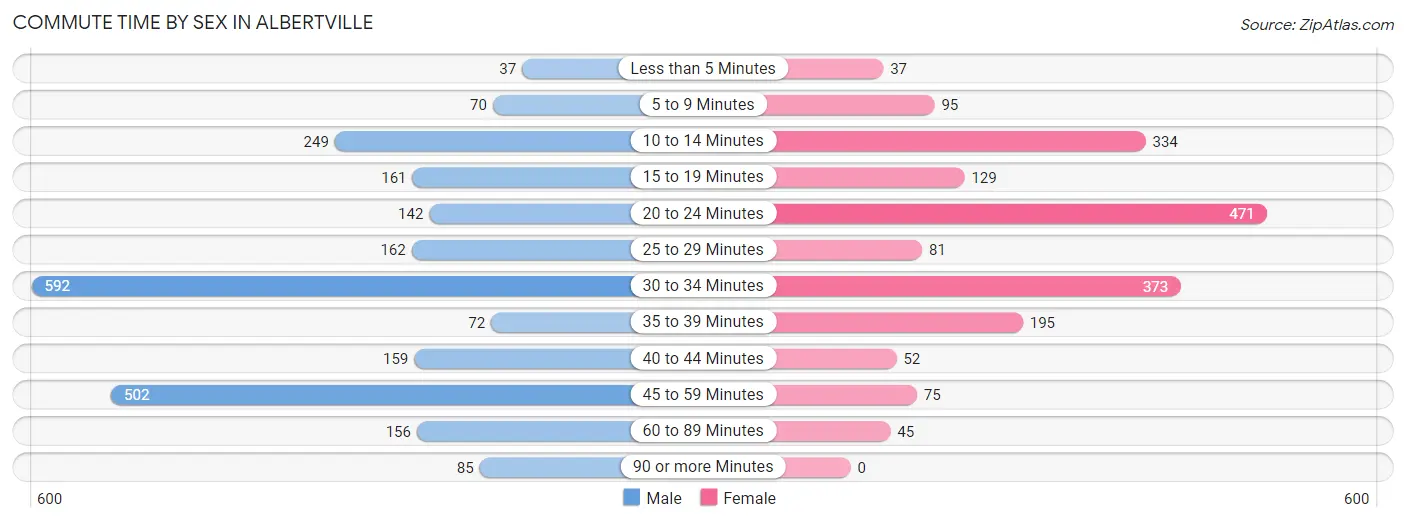
| Commute Time | Male | Female |
| Less than 5 Minutes | 37 (1.5%) | 37 (2.0%) |
| 5 to 9 Minutes | 70 (2.9%) | 95 (5.0%) |
| 10 to 14 Minutes | 249 (10.4%) | 334 (17.7%) |
| 15 to 19 Minutes | 161 (6.7%) | 129 (6.8%) |
| 20 to 24 Minutes | 142 (5.9%) | 471 (25.0%) |
| 25 to 29 Minutes | 162 (6.8%) | 81 (4.3%) |
| 30 to 34 Minutes | 592 (24.8%) | 373 (19.8%) |
| 35 to 39 Minutes | 72 (3.0%) | 195 (10.3%) |
| 40 to 44 Minutes | 159 (6.7%) | 52 (2.8%) |
| 45 to 59 Minutes | 502 (21.0%) | 75 (4.0%) |
| 60 to 89 Minutes | 156 (6.5%) | 45 (2.4%) |
| 90 or more Minutes | 85 (3.6%) | 0 (0.0%) |
Time of Departure to Work by Sex in Albertville
The most frequent times of departure to work in Albertville are 7:00 AM to 7:29 AM (334, 14.0%) for males and 7:30 AM to 7:59 AM (341, 18.1%) for females.
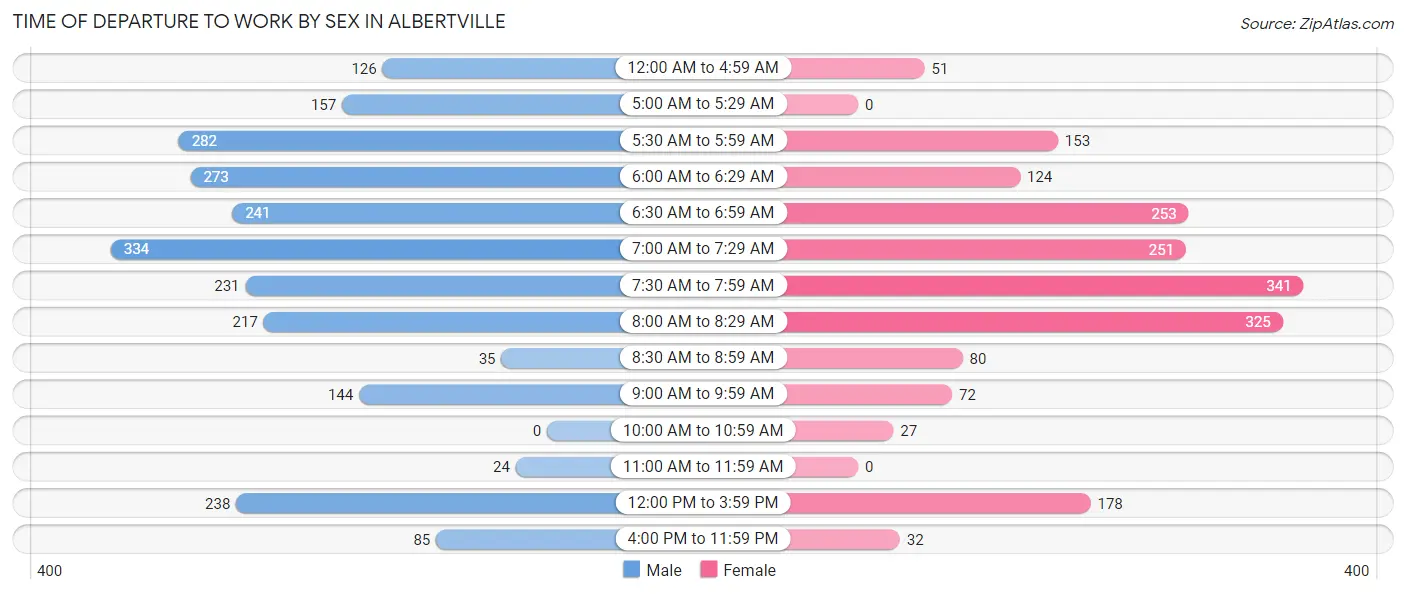
| Time of Departure | Male | Female |
| 12:00 AM to 4:59 AM | 126 (5.3%) | 51 (2.7%) |
| 5:00 AM to 5:29 AM | 157 (6.6%) | 0 (0.0%) |
| 5:30 AM to 5:59 AM | 282 (11.8%) | 153 (8.1%) |
| 6:00 AM to 6:29 AM | 273 (11.4%) | 124 (6.6%) |
| 6:30 AM to 6:59 AM | 241 (10.1%) | 253 (13.4%) |
| 7:00 AM to 7:29 AM | 334 (14.0%) | 251 (13.3%) |
| 7:30 AM to 7:59 AM | 231 (9.7%) | 341 (18.1%) |
| 8:00 AM to 8:29 AM | 217 (9.1%) | 325 (17.2%) |
| 8:30 AM to 8:59 AM | 35 (1.5%) | 80 (4.2%) |
| 9:00 AM to 9:59 AM | 144 (6.0%) | 72 (3.8%) |
| 10:00 AM to 10:59 AM | 0 (0.0%) | 27 (1.4%) |
| 11:00 AM to 11:59 AM | 24 (1.0%) | 0 (0.0%) |
| 12:00 PM to 3:59 PM | 238 (10.0%) | 178 (9.4%) |
| 4:00 PM to 11:59 PM | 85 (3.6%) | 32 (1.7%) |
| Total | 2,387 (100.0%) | 1,887 (100.0%) |
Housing Occupancy in Albertville
Occupancy by Ownership in Albertville
Of the total 2,885 dwellings in Albertville, owner-occupied units account for 2,365 (82.0%), while renter-occupied units make up 520 (18.0%).
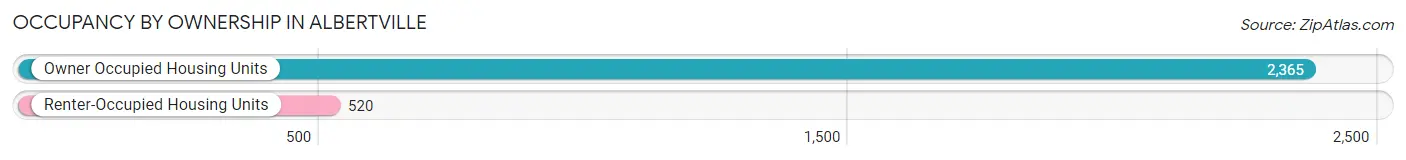
| Occupancy | # Housing Units | % Housing Units |
| Owner Occupied Housing Units | 2,365 | 82.0% |
| Renter-Occupied Housing Units | 520 | 18.0% |
| Total Occupied Housing Units | 2,885 | 100.0% |
Occupancy by Household Size in Albertville
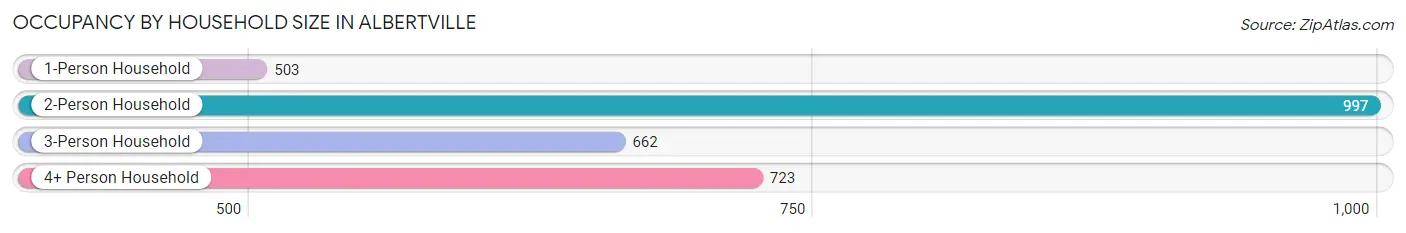
| Household Size | # Housing Units | % Housing Units |
| 1-Person Household | 503 | 17.4% |
| 2-Person Household | 997 | 34.6% |
| 3-Person Household | 662 | 23.0% |
| 4+ Person Household | 723 | 25.1% |
| Total Housing Units | 2,885 | 100.0% |
Occupancy by Ownership by Household Size in Albertville
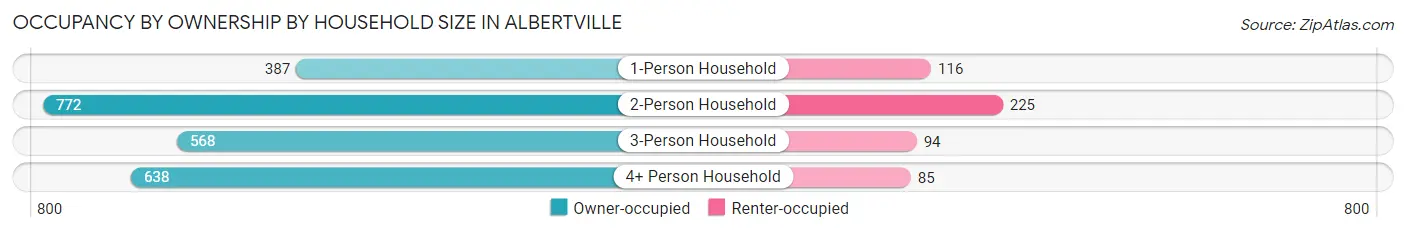
| Household Size | Owner-occupied | Renter-occupied |
| 1-Person Household | 387 (76.9%) | 116 (23.1%) |
| 2-Person Household | 772 (77.4%) | 225 (22.6%) |
| 3-Person Household | 568 (85.8%) | 94 (14.2%) |
| 4+ Person Household | 638 (88.2%) | 85 (11.8%) |
| Total Housing Units | 2,365 (82.0%) | 520 (18.0%) |
Occupancy by Educational Attainment in Albertville
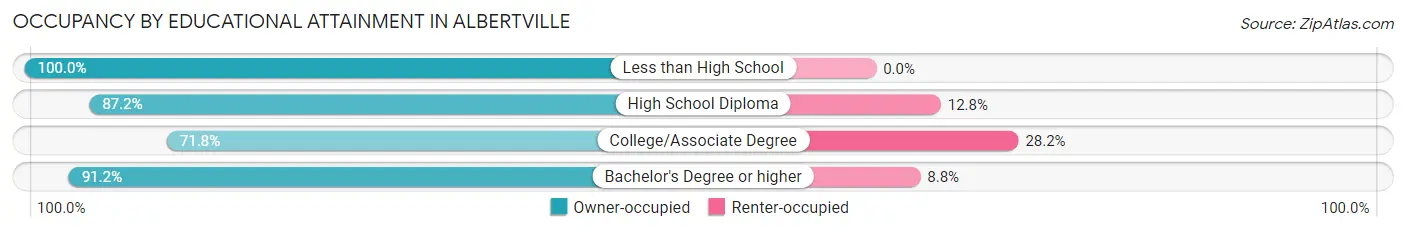
| Household Size | Owner-occupied | Renter-occupied |
| Less than High School | 21 (100.0%) | 0 (0.0%) |
| High School Diploma | 612 (87.2%) | 90 (12.8%) |
| College/Associate Degree | 888 (71.8%) | 349 (28.2%) |
| Bachelor's Degree or higher | 844 (91.2%) | 81 (8.8%) |
Occupancy by Age of Householder in Albertville
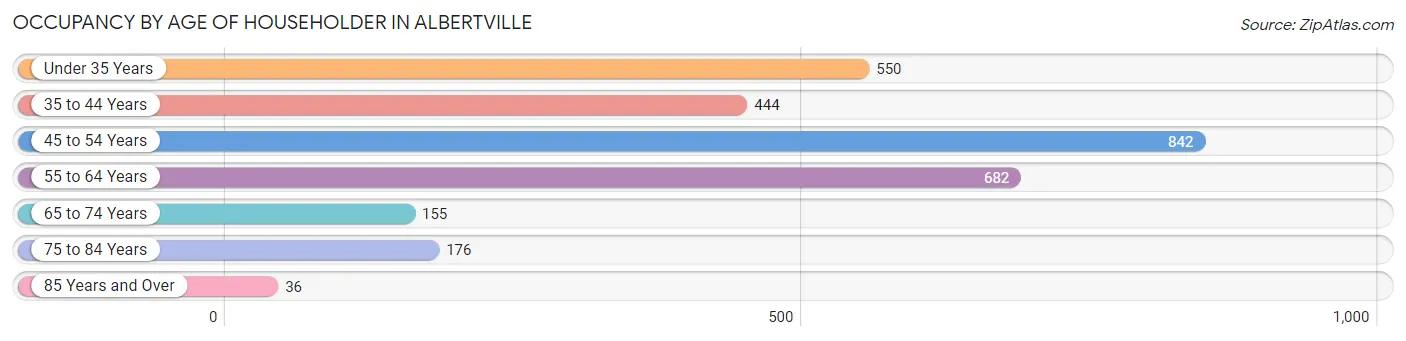
| Age Bracket | # Households | % Households |
| Under 35 Years | 550 | 19.1% |
| 35 to 44 Years | 444 | 15.4% |
| 45 to 54 Years | 842 | 29.2% |
| 55 to 64 Years | 682 | 23.6% |
| 65 to 74 Years | 155 | 5.4% |
| 75 to 84 Years | 176 | 6.1% |
| 85 Years and Over | 36 | 1.3% |
| Total | 2,885 | 100.0% |
Housing Finances in Albertville
Median Income by Occupancy in Albertville
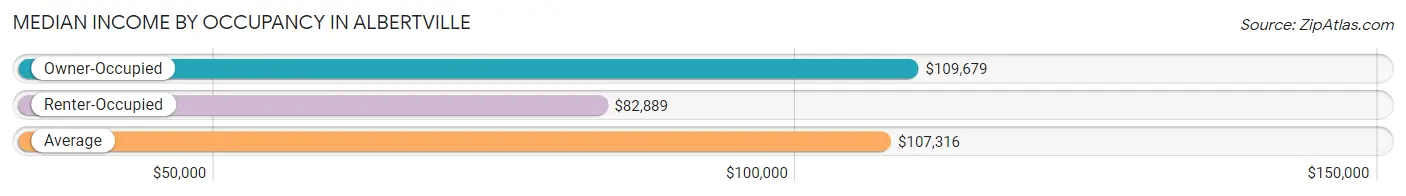
| Occupancy Type | # Households | Median Income |
| Owner-Occupied | 2,365 (82.0%) | $109,679 |
| Renter-Occupied | 520 (18.0%) | $82,889 |
| Average | 2,885 (100.0%) | $107,316 |
Occupancy by Householder Income Bracket in Albertville
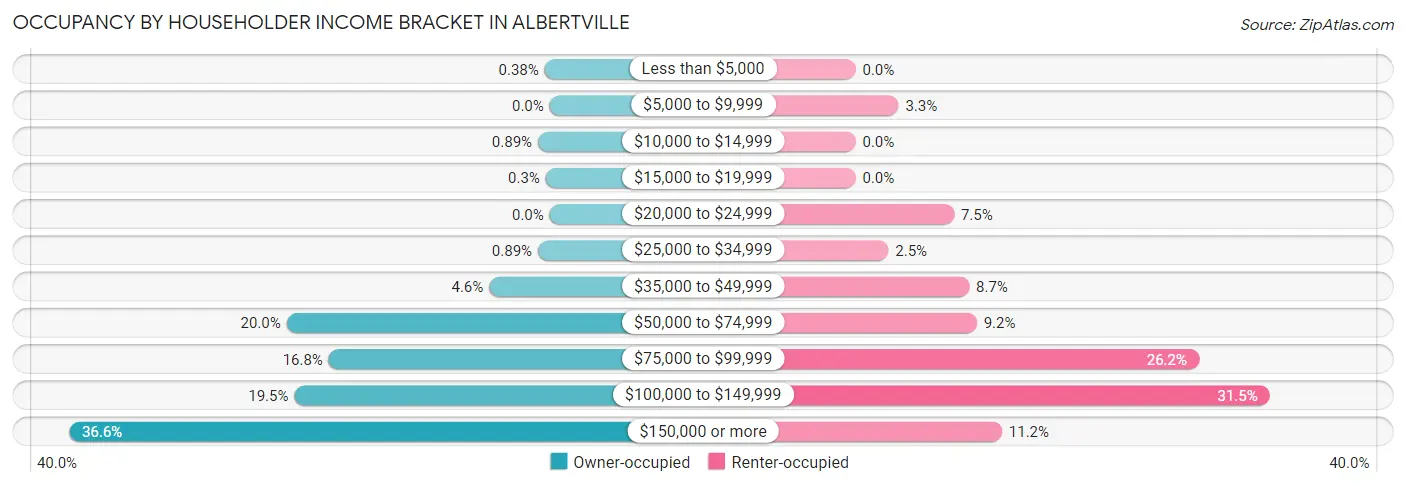
| Income Bracket | Owner-occupied | Renter-occupied |
| Less than $5,000 | 9 (0.4%) | 0 (0.0%) |
| $5,000 to $9,999 | 0 (0.0%) | 17 (3.3%) |
| $10,000 to $14,999 | 21 (0.9%) | 0 (0.0%) |
| $15,000 to $19,999 | 7 (0.3%) | 0 (0.0%) |
| $20,000 to $24,999 | 0 (0.0%) | 39 (7.5%) |
| $25,000 to $34,999 | 21 (0.9%) | 13 (2.5%) |
| $35,000 to $49,999 | 109 (4.6%) | 45 (8.6%) |
| $50,000 to $74,999 | 474 (20.0%) | 48 (9.2%) |
| $75,000 to $99,999 | 398 (16.8%) | 136 (26.2%) |
| $100,000 to $149,999 | 460 (19.5%) | 164 (31.5%) |
| $150,000 or more | 866 (36.6%) | 58 (11.2%) |
| Total | 2,365 (100.0%) | 520 (100.0%) |
Monthly Housing Cost Tiers in Albertville
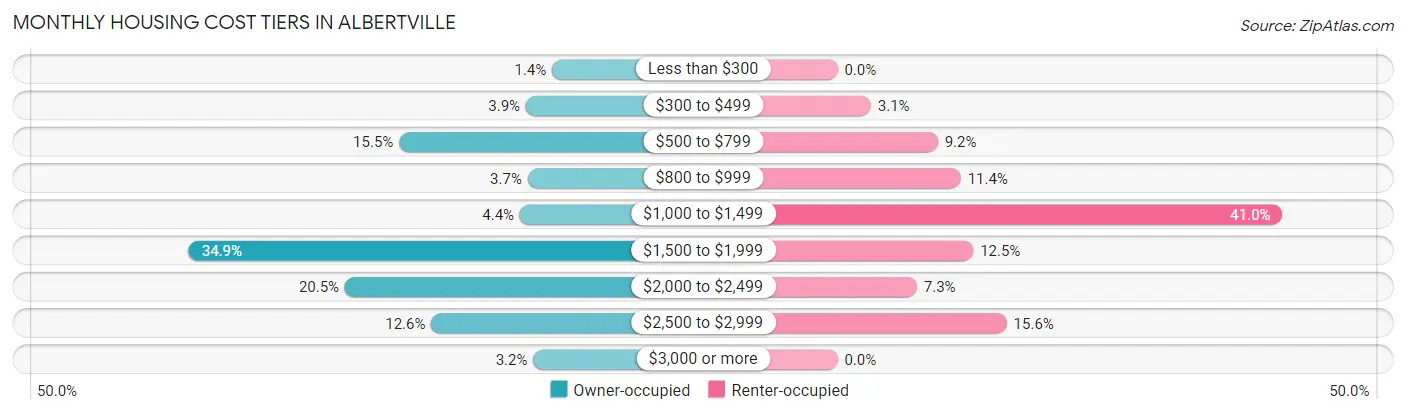
| Monthly Cost | Owner-occupied | Renter-occupied |
| Less than $300 | 34 (1.4%) | 0 (0.0%) |
| $300 to $499 | 91 (3.8%) | 16 (3.1%) |
| $500 to $799 | 367 (15.5%) | 48 (9.2%) |
| $800 to $999 | 87 (3.7%) | 59 (11.4%) |
| $1,000 to $1,499 | 104 (4.4%) | 213 (41.0%) |
| $1,500 to $1,999 | 825 (34.9%) | 65 (12.5%) |
| $2,000 to $2,499 | 485 (20.5%) | 38 (7.3%) |
| $2,500 to $2,999 | 297 (12.6%) | 81 (15.6%) |
| $3,000 or more | 75 (3.2%) | 0 (0.0%) |
| Total | 2,365 (100.0%) | 520 (100.0%) |
Physical Housing Characteristics in Albertville
Housing Structures in Albertville
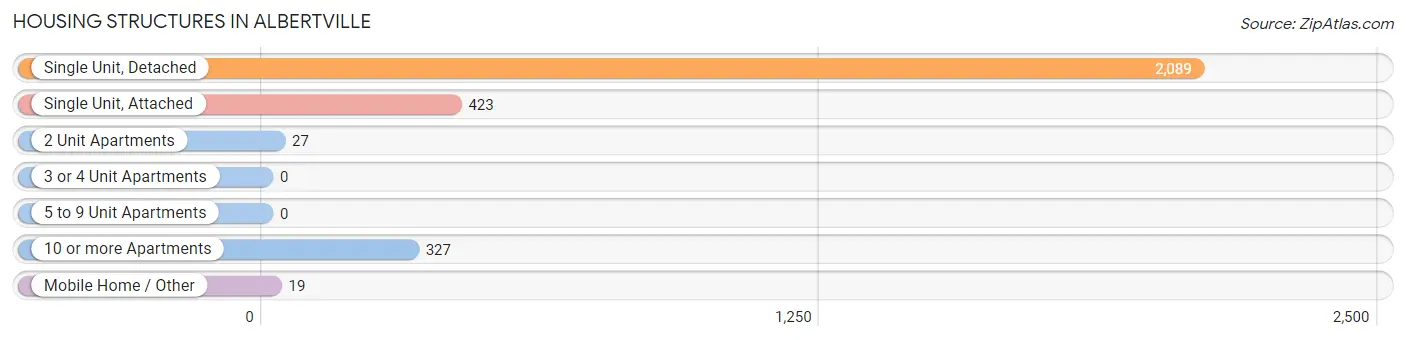
| Structure Type | # Housing Units | % Housing Units |
| Single Unit, Detached | 2,089 | 72.4% |
| Single Unit, Attached | 423 | 14.7% |
| 2 Unit Apartments | 27 | 0.9% |
| 3 or 4 Unit Apartments | 0 | 0.0% |
| 5 to 9 Unit Apartments | 0 | 0.0% |
| 10 or more Apartments | 327 | 11.3% |
| Mobile Home / Other | 19 | 0.7% |
| Total | 2,885 | 100.0% |
Housing Structures by Occupancy in Albertville
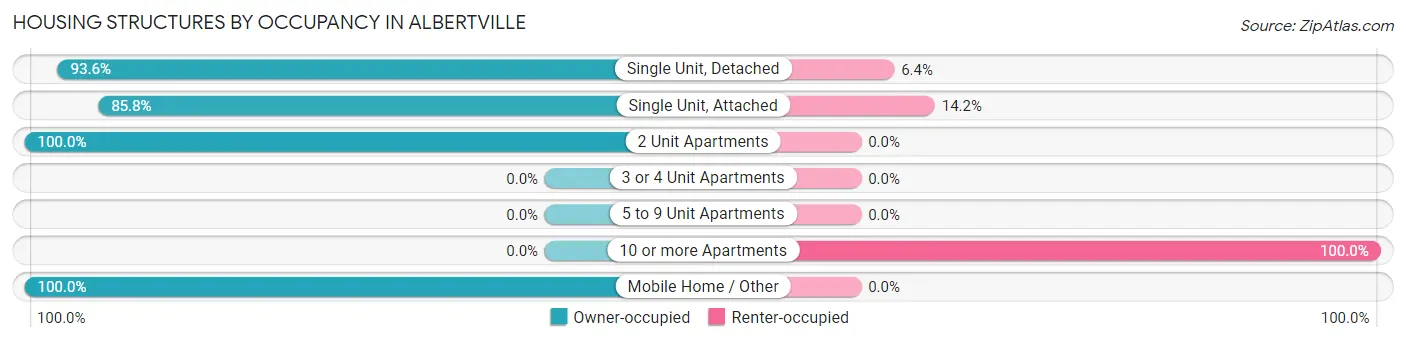
| Structure Type | Owner-occupied | Renter-occupied |
| Single Unit, Detached | 1,956 (93.6%) | 133 (6.4%) |
| Single Unit, Attached | 363 (85.8%) | 60 (14.2%) |
| 2 Unit Apartments | 27 (100.0%) | 0 (0.0%) |
| 3 or 4 Unit Apartments | 0 (0.0%) | 0 (0.0%) |
| 5 to 9 Unit Apartments | 0 (0.0%) | 0 (0.0%) |
| 10 or more Apartments | 0 (0.0%) | 327 (100.0%) |
| Mobile Home / Other | 19 (100.0%) | 0 (0.0%) |
| Total | 2,365 (82.0%) | 520 (18.0%) |
Housing Structures by Number of Rooms in Albertville
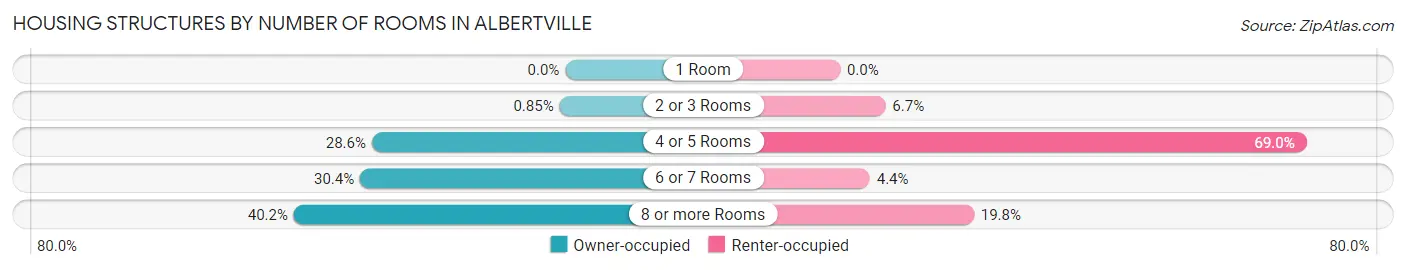
| Number of Rooms | Owner-occupied | Renter-occupied |
| 1 Room | 0 (0.0%) | 0 (0.0%) |
| 2 or 3 Rooms | 20 (0.9%) | 35 (6.7%) |
| 4 or 5 Rooms | 677 (28.6%) | 359 (69.0%) |
| 6 or 7 Rooms | 718 (30.4%) | 23 (4.4%) |
| 8 or more Rooms | 950 (40.2%) | 103 (19.8%) |
| Total | 2,365 (100.0%) | 520 (100.0%) |
Housing Structure by Heating Type in Albertville
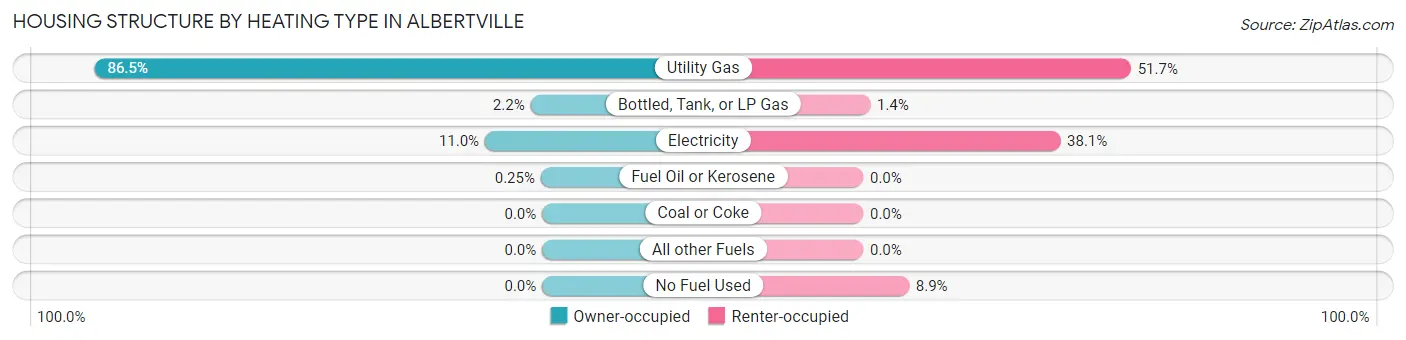
| Heating Type | Owner-occupied | Renter-occupied |
| Utility Gas | 2,045 (86.5%) | 269 (51.7%) |
| Bottled, Tank, or LP Gas | 53 (2.2%) | 7 (1.3%) |
| Electricity | 261 (11.0%) | 198 (38.1%) |
| Fuel Oil or Kerosene | 6 (0.3%) | 0 (0.0%) |
| Coal or Coke | 0 (0.0%) | 0 (0.0%) |
| All other Fuels | 0 (0.0%) | 0 (0.0%) |
| No Fuel Used | 0 (0.0%) | 46 (8.8%) |
| Total | 2,365 (100.0%) | 520 (100.0%) |
Household Vehicle Usage in Albertville
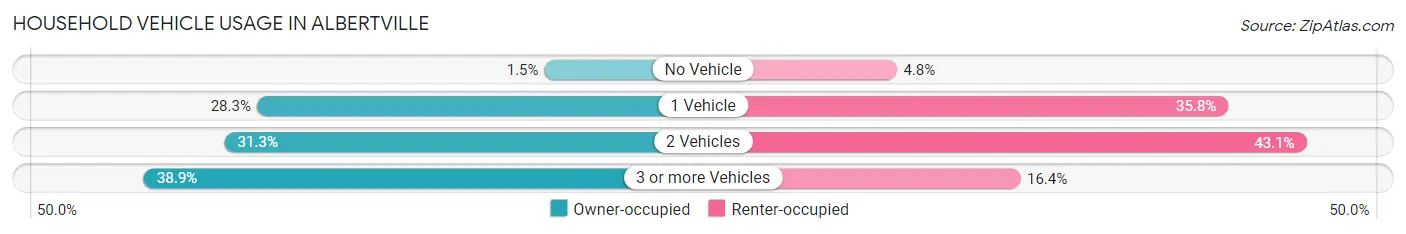
| Vehicles per Household | Owner-occupied | Renter-occupied |
| No Vehicle | 35 (1.5%) | 25 (4.8%) |
| 1 Vehicle | 670 (28.3%) | 186 (35.8%) |
| 2 Vehicles | 741 (31.3%) | 224 (43.1%) |
| 3 or more Vehicles | 919 (38.9%) | 85 (16.4%) |
| Total | 2,365 (100.0%) | 520 (100.0%) |
Real Estate & Mortgages in Albertville
Real Estate and Mortgage Overview in Albertville
| Characteristic | Without Mortgage | With Mortgage |
| Housing Units | 513 | 1,852 |
| Median Property Value | $251,500 | $300,800 |
| Median Household Income | $85,391 | $740 |
| Monthly Housing Costs | $579 | $75 |
| Real Estate Taxes | $2,969 | $27 |
Property Value by Mortgage Status in Albertville
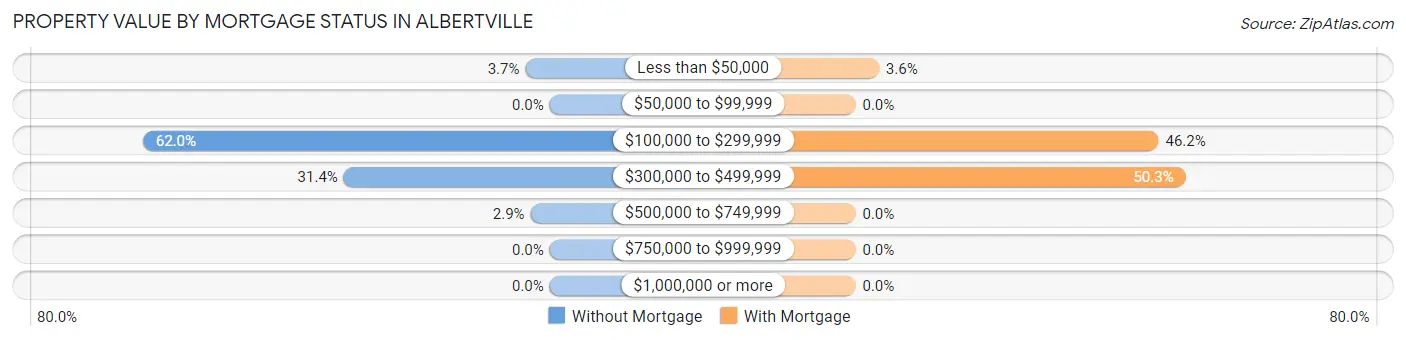
| Property Value | Without Mortgage | With Mortgage |
| Less than $50,000 | 19 (3.7%) | 66 (3.6%) |
| $50,000 to $99,999 | 0 (0.0%) | 0 (0.0%) |
| $100,000 to $299,999 | 318 (62.0%) | 855 (46.2%) |
| $300,000 to $499,999 | 161 (31.4%) | 931 (50.3%) |
| $500,000 to $749,999 | 15 (2.9%) | 0 (0.0%) |
| $750,000 to $999,999 | 0 (0.0%) | 0 (0.0%) |
| $1,000,000 or more | 0 (0.0%) | 0 (0.0%) |
| Total | 513 (100.0%) | 1,852 (100.0%) |
Household Income by Mortgage Status in Albertville
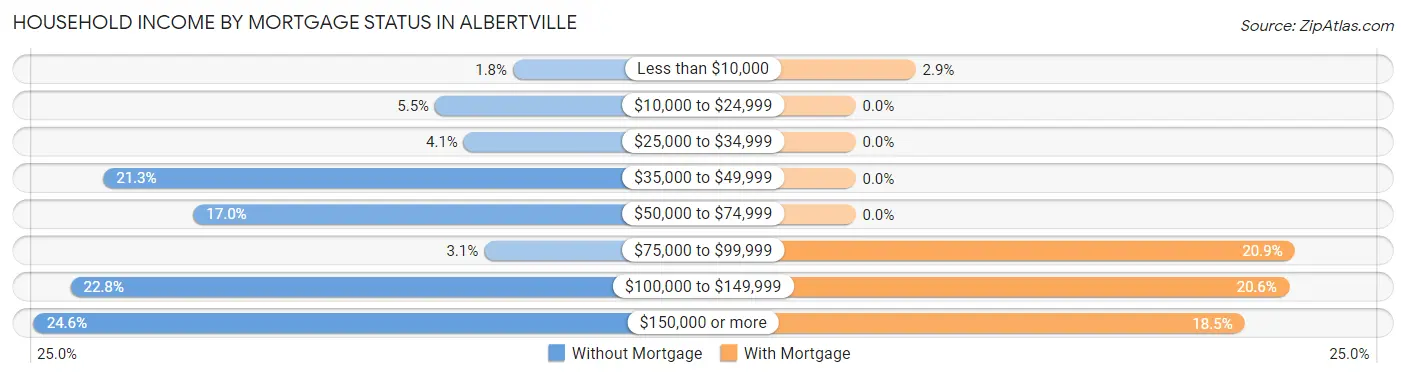
| Household Income | Without Mortgage | With Mortgage |
| Less than $10,000 | 9 (1.8%) | 53 (2.9%) |
| $10,000 to $24,999 | 28 (5.5%) | 0 (0.0%) |
| $25,000 to $34,999 | 21 (4.1%) | 0 (0.0%) |
| $35,000 to $49,999 | 109 (21.2%) | 0 (0.0%) |
| $50,000 to $74,999 | 87 (17.0%) | 0 (0.0%) |
| $75,000 to $99,999 | 16 (3.1%) | 387 (20.9%) |
| $100,000 to $149,999 | 117 (22.8%) | 382 (20.6%) |
| $150,000 or more | 126 (24.6%) | 343 (18.5%) |
| Total | 513 (100.0%) | 1,852 (100.0%) |
Property Value to Household Income Ratio in Albertville
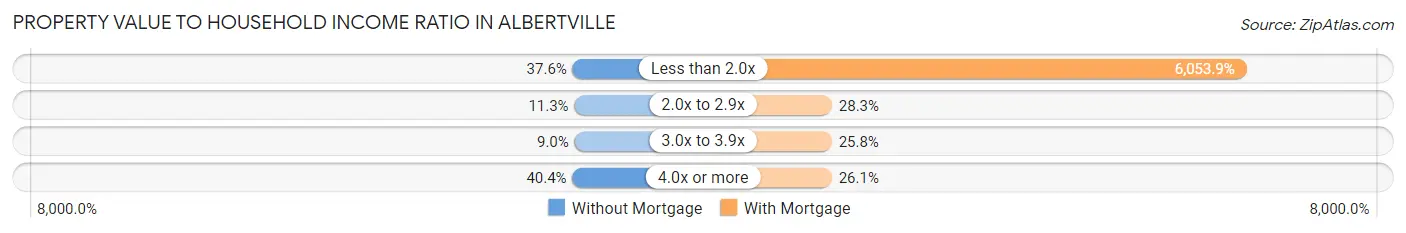
| Value-to-Income Ratio | Without Mortgage | With Mortgage |
| Less than 2.0x | 193 (37.6%) | 112,119 (6,053.9%) |
| 2.0x to 2.9x | 58 (11.3%) | 524 (28.3%) |
| 3.0x to 3.9x | 46 (9.0%) | 478 (25.8%) |
| 4.0x or more | 207 (40.4%) | 484 (26.1%) |
| Total | 513 (100.0%) | 1,852 (100.0%) |
Real Estate Taxes by Mortgage Status in Albertville

| Property Taxes | Without Mortgage | With Mortgage |
| Less than $800 | 19 (3.7%) | 0 (0.0%) |
| $800 to $1,499 | 16 (3.1%) | 0 (0.0%) |
| $800 to $1,499 | 463 (90.2%) | 30 (1.6%) |
| Total | 513 (100.0%) | 1,852 (100.0%) |
Health & Disability in Albertville
Health Insurance Coverage by Age in Albertville
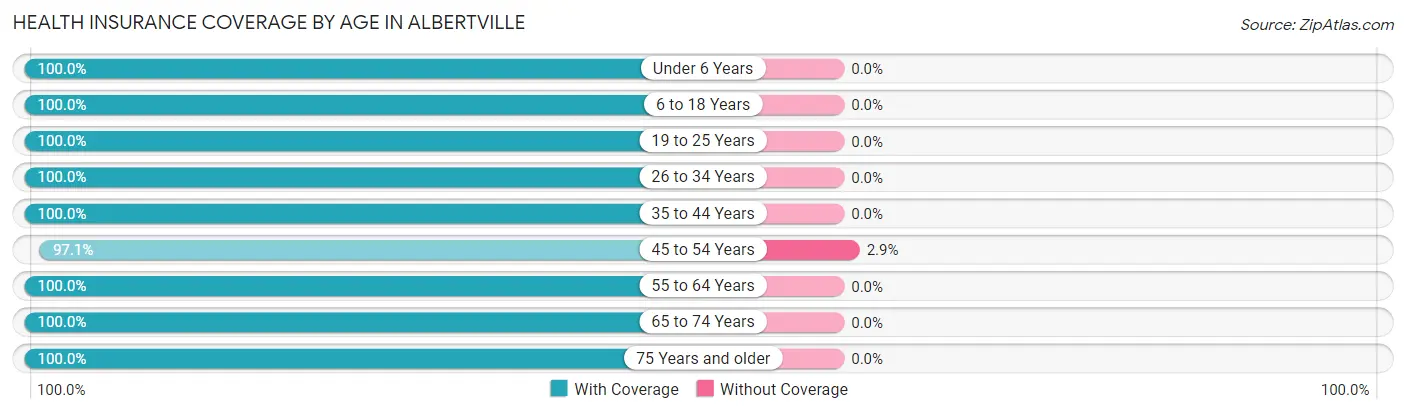
| Age Bracket | With Coverage | Without Coverage |
| Under 6 Years | 462 (100.0%) | 0 (0.0%) |
| 6 to 18 Years | 1,645 (100.0%) | 0 (0.0%) |
| 19 to 25 Years | 746 (100.0%) | 0 (0.0%) |
| 26 to 34 Years | 924 (100.0%) | 0 (0.0%) |
| 35 to 44 Years | 1,047 (100.0%) | 0 (0.0%) |
| 45 to 54 Years | 1,516 (97.1%) | 45 (2.9%) |
| 55 to 64 Years | 914 (100.0%) | 0 (0.0%) |
| 65 to 74 Years | 255 (100.0%) | 0 (0.0%) |
| 75 Years and older | 329 (100.0%) | 0 (0.0%) |
| Total | 7,838 (99.4%) | 45 (0.6%) |
Health Insurance Coverage by Citizenship Status in Albertville
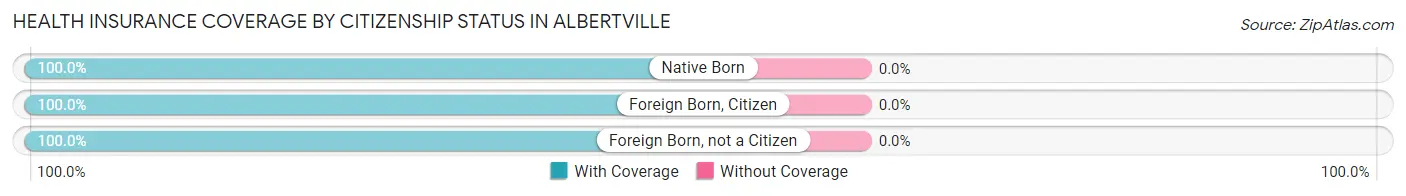
| Citizenship Status | With Coverage | Without Coverage |
| Native Born | 462 (100.0%) | 0 (0.0%) |
| Foreign Born, Citizen | 1,645 (100.0%) | 0 (0.0%) |
| Foreign Born, not a Citizen | 746 (100.0%) | 0 (0.0%) |
Health Insurance Coverage by Household Income in Albertville
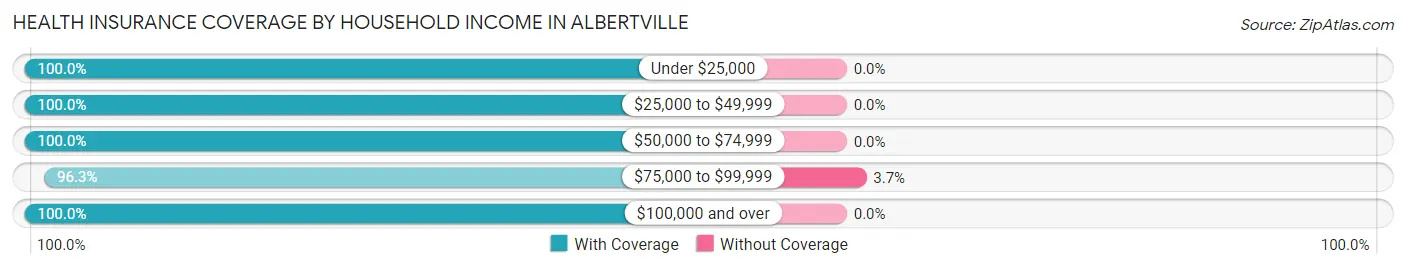
| Household Income | With Coverage | Without Coverage |
| Under $25,000 | 126 (100.0%) | 0 (0.0%) |
| $25,000 to $49,999 | 288 (100.0%) | 0 (0.0%) |
| $50,000 to $74,999 | 837 (100.0%) | 0 (0.0%) |
| $75,000 to $99,999 | 1,186 (96.3%) | 45 (3.7%) |
| $100,000 and over | 5,393 (100.0%) | 0 (0.0%) |
Public vs Private Health Insurance Coverage by Age in Albertville
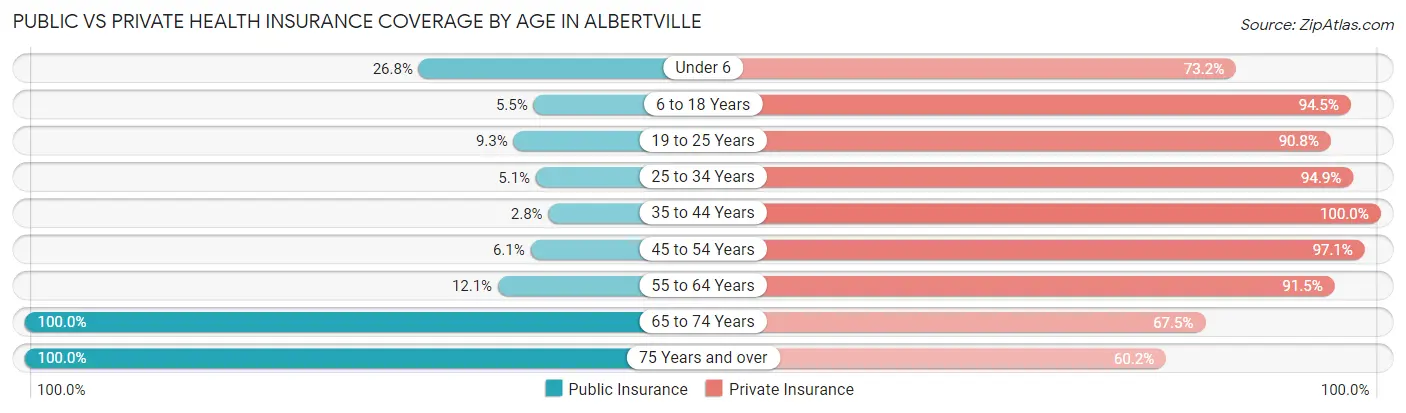
| Age Bracket | Public Insurance | Private Insurance |
| Under 6 | 124 (26.8%) | 338 (73.2%) |
| 6 to 18 Years | 91 (5.5%) | 1,554 (94.5%) |
| 19 to 25 Years | 69 (9.2%) | 677 (90.7%) |
| 25 to 34 Years | 47 (5.1%) | 877 (94.9%) |
| 35 to 44 Years | 29 (2.8%) | 1,047 (100.0%) |
| 45 to 54 Years | 95 (6.1%) | 1,515 (97.1%) |
| 55 to 64 Years | 111 (12.1%) | 836 (91.5%) |
| 65 to 74 Years | 255 (100.0%) | 172 (67.4%) |
| 75 Years and over | 329 (100.0%) | 198 (60.2%) |
| Total | 1,150 (14.6%) | 7,214 (91.5%) |
Disability Status by Sex by Age in Albertville
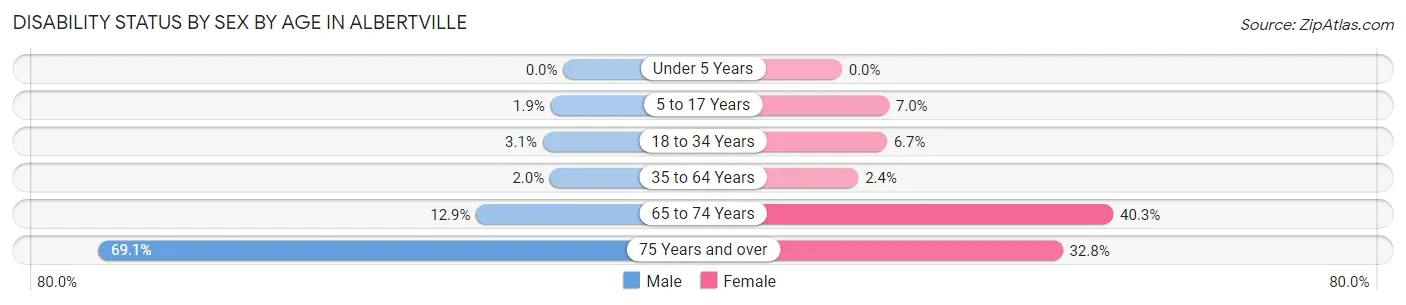
| Age Bracket | Male | Female |
| Under 5 Years | 0 (0.0%) | 0 (0.0%) |
| 5 to 17 Years | 16 (1.9%) | 58 (7.0%) |
| 18 to 34 Years | 23 (3.1%) | 69 (6.7%) |
| 35 to 64 Years | 38 (2.0%) | 39 (2.4%) |
| 65 to 74 Years | 15 (12.9%) | 56 (40.3%) |
| 75 Years and over | 105 (69.1%) | 58 (32.8%) |
Disability Class by Sex by Age in Albertville
Disability Class: Hearing Difficulty
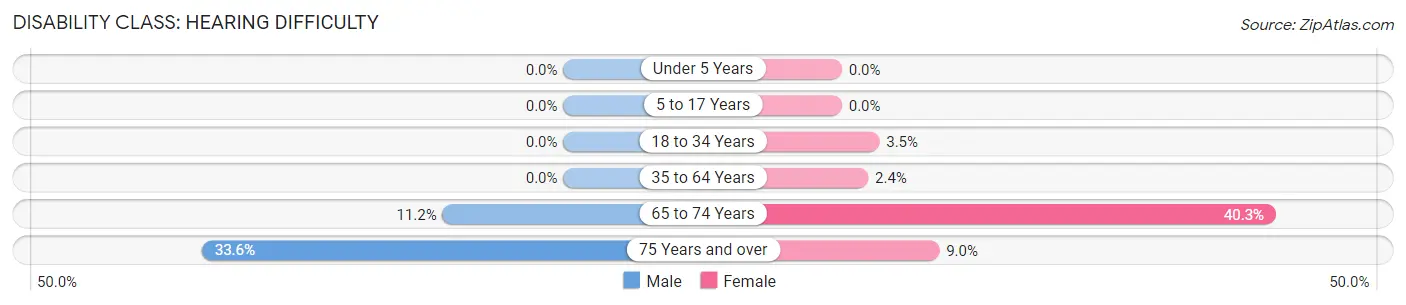
| Age Bracket | Male | Female |
| Under 5 Years | 0 (0.0%) | 0 (0.0%) |
| 5 to 17 Years | 0 (0.0%) | 0 (0.0%) |
| 18 to 34 Years | 0 (0.0%) | 36 (3.5%) |
| 35 to 64 Years | 0 (0.0%) | 39 (2.4%) |
| 65 to 74 Years | 13 (11.2%) | 56 (40.3%) |
| 75 Years and over | 51 (33.6%) | 16 (9.0%) |
Disability Class: Vision Difficulty
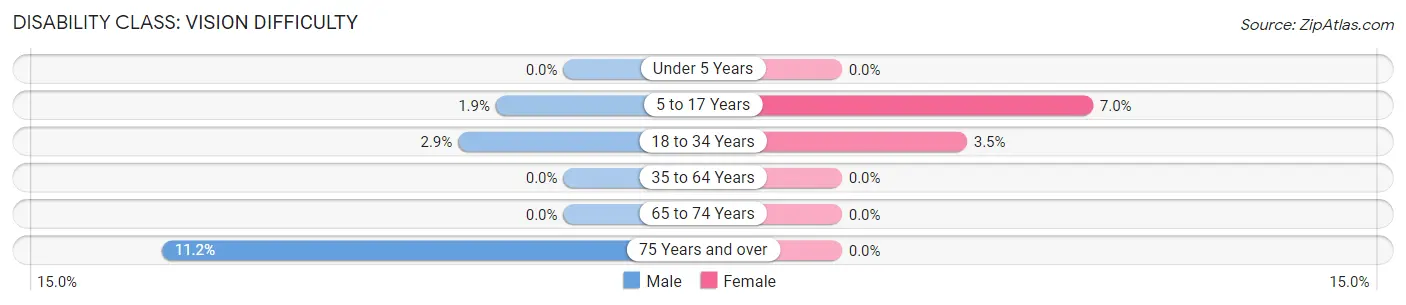
| Age Bracket | Male | Female |
| Under 5 Years | 0 (0.0%) | 0 (0.0%) |
| 5 to 17 Years | 16 (1.9%) | 58 (7.0%) |
| 18 to 34 Years | 22 (2.9%) | 36 (3.5%) |
| 35 to 64 Years | 0 (0.0%) | 0 (0.0%) |
| 65 to 74 Years | 0 (0.0%) | 0 (0.0%) |
| 75 Years and over | 17 (11.2%) | 0 (0.0%) |
Disability Class: Cognitive Difficulty
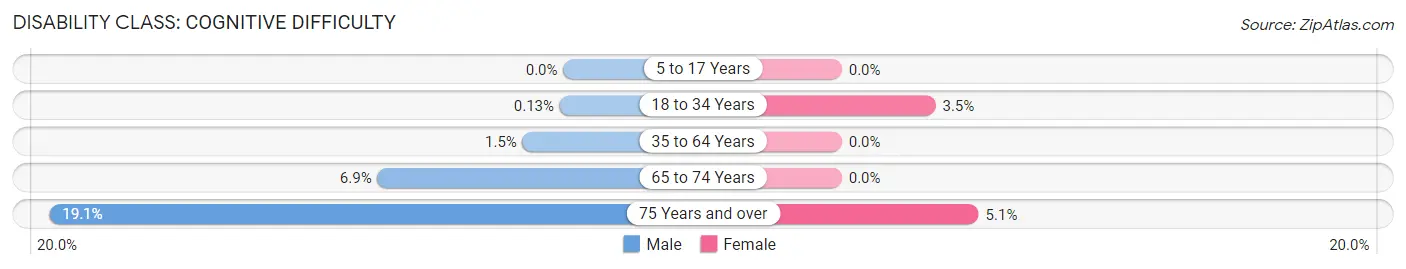
| Age Bracket | Male | Female |
| 5 to 17 Years | 0 (0.0%) | 0 (0.0%) |
| 18 to 34 Years | 1 (0.1%) | 36 (3.5%) |
| 35 to 64 Years | 29 (1.5%) | 0 (0.0%) |
| 65 to 74 Years | 8 (6.9%) | 0 (0.0%) |
| 75 Years and over | 29 (19.1%) | 9 (5.1%) |
Disability Class: Ambulatory Difficulty
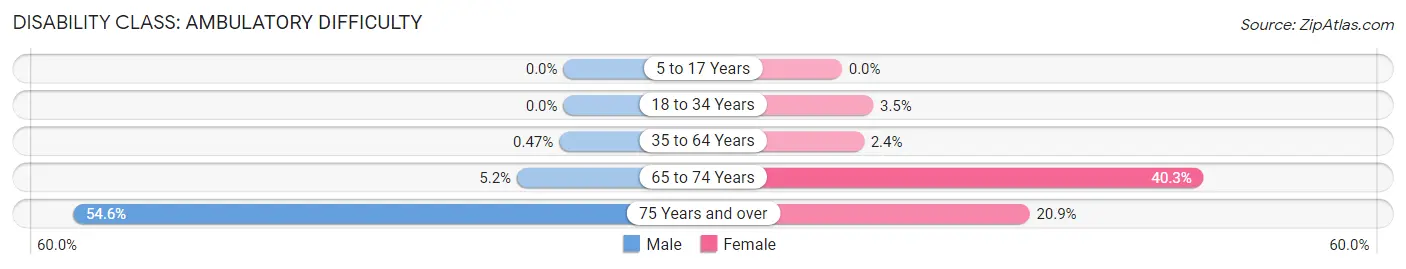
| Age Bracket | Male | Female |
| 5 to 17 Years | 0 (0.0%) | 0 (0.0%) |
| 18 to 34 Years | 0 (0.0%) | 36 (3.5%) |
| 35 to 64 Years | 9 (0.5%) | 39 (2.4%) |
| 65 to 74 Years | 6 (5.2%) | 56 (40.3%) |
| 75 Years and over | 83 (54.6%) | 37 (20.9%) |
Disability Class: Self-Care Difficulty
| Age Bracket | Male | Female |
| 5 to 17 Years | 0 (0.0%) | 0 (0.0%) |
| 18 to 34 Years | 0 (0.0%) | 36 (3.5%) |
| 35 to 64 Years | 9 (0.5%) | 0 (0.0%) |
| 65 to 74 Years | 7 (6.0%) | 0 (0.0%) |
| 75 Years and over | 12 (7.9%) | 9 (5.1%) |
Technology Access in Albertville
Computing Device Access in Albertville
| Device Type | # Households | % Households |
| Desktop or Laptop | 2,647 | 91.7% |
| Smartphone | 2,564 | 88.9% |
| Tablet | 1,987 | 68.9% |
| No Computing Device | 127 | 4.4% |
| Total | 2,885 | 100.0% |
Internet Access in Albertville
| Internet Type | # Households | % Households |
| Dial-Up Internet | 27 | 0.9% |
| Broadband Home | 2,224 | 77.1% |
| Cellular Data Only | 441 | 15.3% |
| Satellite Internet | 83 | 2.9% |
| No Internet | 127 | 4.4% |
| Total | 2,885 | 100.0% |
Albertville Summary
Albertville, Minnesota is a city located in the northwest corner of Wright County, Minnesota. It is part of the Twin Cities metropolitan area and is located about 40 miles northwest of Minneapolis. The city was founded in 1856 and incorporated in 1887. As of the 2010 census, the population of Albertville was 7,044.
Geography
Albertville is located at 45°14'N 93°37'W (45.23, -93.62). According to the United States Census Bureau, the city has a total area of 4.2 square miles (10.8 km2), all of it land.
The city is located on the north side of the Crow River, which flows through the city. The city is also located near the Albertville Outlet Mall, which is one of the largest shopping centers in the Twin Cities area.
History
Albertville was founded in 1856 by Albert and Mary Ann Miller. The Millers were among the first settlers in the area and named the town after themselves. The town was originally a farming community, but in the late 19th century, it began to grow as a trading center for the surrounding area.
In 1887, Albertville was incorporated as a village. The village grew rapidly and in 1902, it was incorporated as a city.
In the early 20th century, Albertville was a thriving community with a variety of businesses, including a bank, a newspaper, a hotel, a creamery, a lumberyard, and a flour mill. The city also had a number of churches, including a Catholic church, a Methodist church, and a Lutheran church.
In the 1950s, Albertville began to experience a population boom as people moved to the city from the surrounding rural areas. This growth continued into the 1960s and 1970s, and by the 1980s, Albertville had become a bedroom community for the Twin Cities.
Economy
Albertville is a bedroom community for the Twin Cities, and the majority of its residents commute to the cities for work. The city is home to a number of businesses, including a number of retail stores, restaurants, and service businesses.
The city is also home to the Albertville Outlet Mall, which is one of the largest shopping centers in the Twin Cities area. The mall is home to a variety of stores, including clothing stores, electronics stores, and home goods stores.
Demographics
As of the 2010 census, there were 7,044 people, 2,541 households, and 1,945 families residing in Albertville. The population density was 1,683.3 people per square mile (650.2/km2). There were 2,717 housing units at an average density of 645.3 per square mile (249.3/km2). The racial makeup of the city was 94.2% White, 0.7% African American, 0.3% Native American, 1.7% Asian, 0.1% Pacific Islander, 1.7% from other races, and 1.2% from two or more races. Hispanic or Latino of any race were 4.2% of the population.
There were 2,541 households, out of which 39.2% had children under the age of 18 living with them, 61.2% were married couples living together, 8.7% had a female householder with no husband present, and 25.7% were non-families. 21.2% of all households were made up of individuals, and 8.2% had someone living alone who was 65 years of age or older. The average household size was 2.76 and the average family size was 3.22.
In the city, the population was spread out, with 29.2% under the age of 18, 7.2% from 18 to 24, 33.2% from 25 to 44, 19.7% from 45 to 64, and 10.7% who were 65 years of age or older. The median age was 34 years. For every 100 females, there were 97.2 males. For every 100 females age 18 and over, there were 94.2 males.
The median income for a household in the city was $50,902, and the median income for a family was $58,958. Males had a median income of $41,919 versus $30,917 for females. The per capita income for the city was $21,945. About 3.2% of families and 4.7% of the population were below the poverty line, including 5.2% of those under age 18 and 5.3% of those age 65 or over.
Common Questions
What is Per Capita Income in Albertville?
Per Capita income in Albertville is $45,019.
What is the Median Family Income in Albertville?
Median Family Income in Albertville is $111,441.
What is the Median Household income in Albertville?
Median Household Income in Albertville is $107,316.
What is Income or Wage Gap in Albertville?
Income or Wage Gap in Albertville is 26.9%.
Women in Albertville earn 73.1 cents for every dollar earned by a man.
What is Inequality or Gini Index in Albertville?
Inequality or Gini Index in Albertville is 0.31.
What is the Total Population of Albertville?
Total Population of Albertville is 7,883.
What is the Total Male Population of Albertville?
Total Male Population of Albertville is 3,994.
What is the Total Female Population of Albertville?
Total Female Population of Albertville is 3,889.
What is the Ratio of Males per 100 Females in Albertville?
There are 102.70 Males per 100 Females in Albertville.
What is the Ratio of Females per 100 Males in Albertville?
There are 97.37 Females per 100 Males in Albertville.
What is the Median Population Age in Albertville?
Median Population Age in Albertville is 36.9 Years.
What is the Average Family Size in Albertville
Average Family Size in Albertville is 3.0 People.
What is the Average Household Size in Albertville
Average Household Size in Albertville is 2.7 People.
How Large is the Labor Force in Albertville?
There are 5,099 People in the Labor Forcein in Albertville.
What is the Percentage of People in the Labor Force in Albertville?
84.6% of People are in the Labor Force in Albertville.