Murfreesboro, TN Map & Demographics
Murfreesboro Map
Murfreesboro Overview
$36,126
PER CAPITA INCOME
$90,863
AVG FAMILY INCOME
$70,451
AVG HOUSEHOLD INCOME
19.4%
WAGE / INCOME GAP [ % ]
80.6¢/ $1
WAGE / INCOME GAP [ $ ]
$9,201
FAMILY INCOME DEFICIT
0.42
INEQUALITY / GINI INDEX
153,487
TOTAL POPULATION
75,747
MALE POPULATION
77,740
FEMALE POPULATION
97.44
MALES / 100 FEMALES
102.63
FEMALES / 100 MALES
31.5
MEDIAN AGE
3.2
AVG FAMILY SIZE
2.6
AVG HOUSEHOLD SIZE
88,595
LABOR FORCE [ PEOPLE ]
72.1%
PERCENT IN LABOR FORCE
4.3%
UNEMPLOYMENT RATE
Murfreesboro Area Codes
Income in Murfreesboro
Income Overview in Murfreesboro
Per Capita Income in Murfreesboro is $36,126, while median incomes of families and households are $90,863 and $70,451 respectively.
| Characteristic | Number | Measure |
| Per Capita Income | 153,487 | $36,126 |
| Median Family Income | 35,413 | $90,863 |
| Mean Family Income | 35,413 | $112,272 |
| Median Household Income | 57,399 | $70,451 |
| Mean Household Income | 57,399 | $93,961 |
| Income Deficit | 35,413 | $9,201 |
| Wage / Income Gap (%) | 153,487 | 19.40% |
| Wage / Income Gap ($) | 153,487 | 80.60¢ per $1 |
| Gini / Inequality Index | 153,487 | 0.42 |
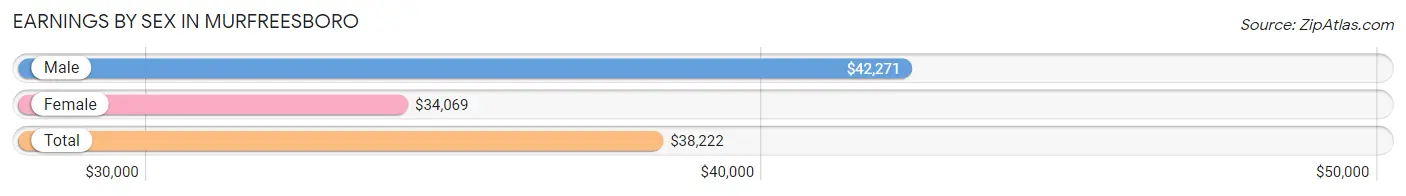
Earnings by Sex in Murfreesboro
Average Earnings in Murfreesboro are $38,222, $42,271 for men and $34,069 for women, a difference of 19.4%.
| Sex | Number | Average Earnings |
| Male | 48,387 (52.1%) | $42,271 |
| Female | 44,551 (47.9%) | $34,069 |
| Total | 92,938 (100.0%) | $38,222 |
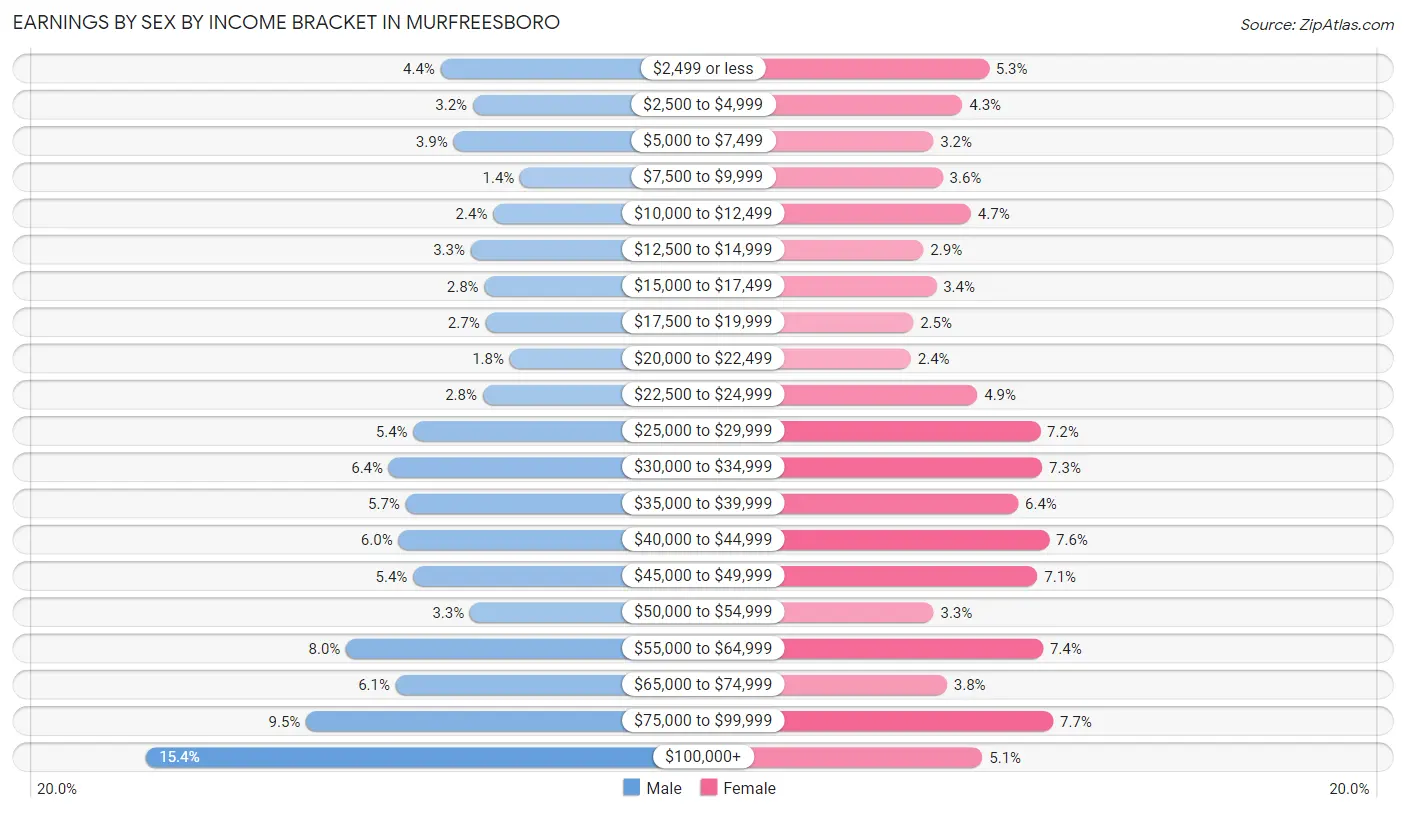
Earnings by Sex by Income Bracket in Murfreesboro
The most common earnings brackets in Murfreesboro are $100,000+ for men (7,471 | 15.4%) and $75,000 to $99,999 for women (3,446 | 7.7%).
| Income | Male | Female |
| $2,499 or less | 2,133 (4.4%) | 2,369 (5.3%) |
| $2,500 to $4,999 | 1,546 (3.2%) | 1,929 (4.3%) |
| $5,000 to $7,499 | 1,901 (3.9%) | 1,443 (3.2%) |
| $7,500 to $9,999 | 693 (1.4%) | 1,598 (3.6%) |
| $10,000 to $12,499 | 1,180 (2.4%) | 2,070 (4.6%) |
| $12,500 to $14,999 | 1,588 (3.3%) | 1,277 (2.9%) |
| $15,000 to $17,499 | 1,338 (2.8%) | 1,494 (3.4%) |
| $17,500 to $19,999 | 1,320 (2.7%) | 1,111 (2.5%) |
| $20,000 to $22,499 | 883 (1.8%) | 1,068 (2.4%) |
| $22,500 to $24,999 | 1,370 (2.8%) | 2,180 (4.9%) |
| $25,000 to $29,999 | 2,625 (5.4%) | 3,224 (7.2%) |
| $30,000 to $34,999 | 3,072 (6.4%) | 3,260 (7.3%) |
| $35,000 to $39,999 | 2,766 (5.7%) | 2,862 (6.4%) |
| $40,000 to $44,999 | 2,898 (6.0%) | 3,379 (7.6%) |
| $45,000 to $49,999 | 2,632 (5.4%) | 3,180 (7.1%) |
| $50,000 to $54,999 | 1,604 (3.3%) | 1,450 (3.3%) |
| $55,000 to $64,999 | 3,846 (8.0%) | 3,276 (7.3%) |
| $65,000 to $74,999 | 2,948 (6.1%) | 1,671 (3.7%) |
| $75,000 to $99,999 | 4,573 (9.5%) | 3,446 (7.7%) |
| $100,000+ | 7,471 (15.4%) | 2,264 (5.1%) |
| Total | 48,387 (100.0%) | 44,551 (100.0%) |
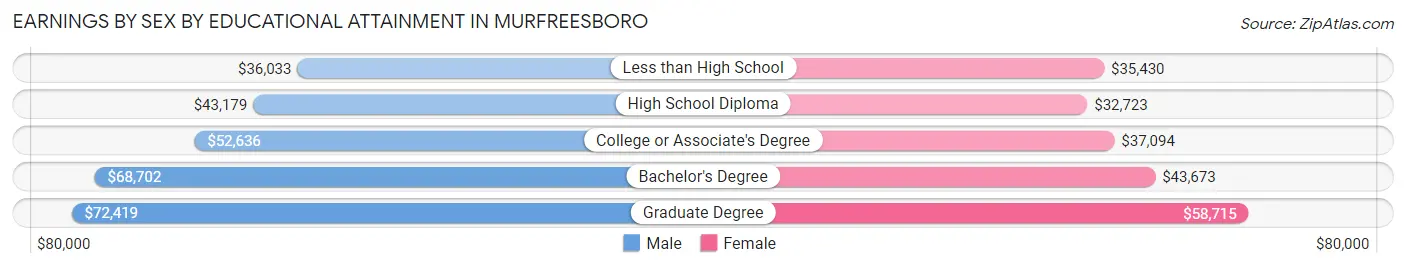
Earnings by Sex by Educational Attainment in Murfreesboro
Average earnings in Murfreesboro are $55,095 for men and $41,427 for women, a difference of 24.8%. Men with an educational attainment of graduate degree enjoy the highest average annual earnings of $72,419, while those with less than high school education earn the least with $36,033. Women with an educational attainment of graduate degree earn the most with the average annual earnings of $58,715, while those with high school diploma education have the smallest earnings of $32,723.
| Educational Attainment | Male Income | Female Income |
| Less than High School | $36,033 | $35,430 |
| High School Diploma | $43,179 | $32,723 |
| College or Associate's Degree | $52,636 | $37,094 |
| Bachelor's Degree | $68,702 | $43,673 |
| Graduate Degree | $72,419 | $58,715 |
| Total | $55,095 | $41,427 |
Family Income in Murfreesboro
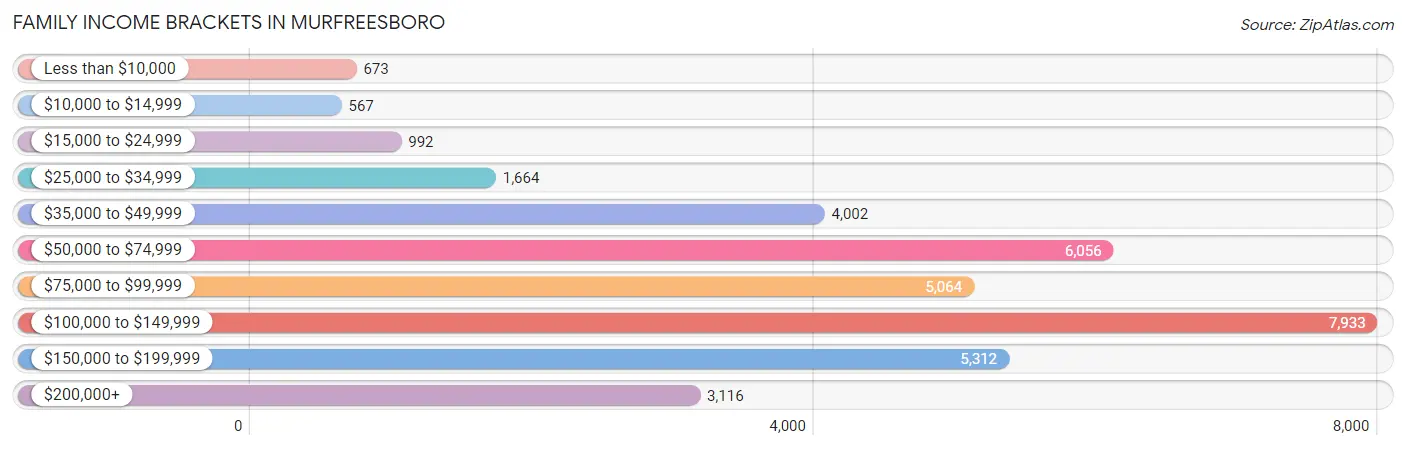
Family Income Brackets in Murfreesboro
According to the Murfreesboro family income data, there are 7,933 families falling into the $100,000 to $149,999 income range, which is the most common income bracket and makes up 22.4% of all families. Conversely, the $10,000 to $14,999 income bracket is the least frequent group with only 567 families (1.6%) belonging to this category.
| Income Bracket | # Families | % Families |
| Less than $10,000 | 673 | 1.9% |
| $10,000 to $14,999 | 567 | 1.6% |
| $15,000 to $24,999 | 992 | 2.8% |
| $25,000 to $34,999 | 1,664 | 4.7% |
| $35,000 to $49,999 | 4,002 | 11.3% |
| $50,000 to $74,999 | 6,056 | 17.1% |
| $75,000 to $99,999 | 5,064 | 14.3% |
| $100,000 to $149,999 | 7,933 | 22.4% |
| $150,000 to $199,999 | 5,312 | 15.0% |
| $200,000+ | 3,116 | 8.8% |
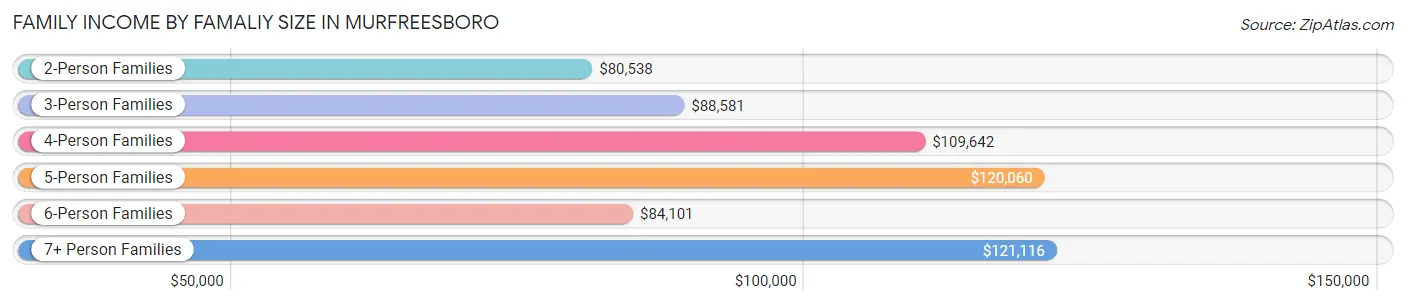
Family Income by Famaliy Size in Murfreesboro
7+ person families (349 | 1.0%) account for the highest median family income in Murfreesboro with $121,116 per family, while 2-person families (15,931 | 45.0%) have the highest median income of $40,269 per family member.
| Income Bracket | # Families | Median Income |
| 2-Person Families | 15,931 (45.0%) | $80,538 |
| 3-Person Families | 8,470 (23.9%) | $88,581 |
| 4-Person Families | 6,927 (19.6%) | $109,642 |
| 5-Person Families | 2,879 (8.1%) | $120,060 |
| 6-Person Families | 857 (2.4%) | $84,101 |
| 7+ Person Families | 349 (1.0%) | $121,116 |
| Total | 35,413 (100.0%) | $90,863 |
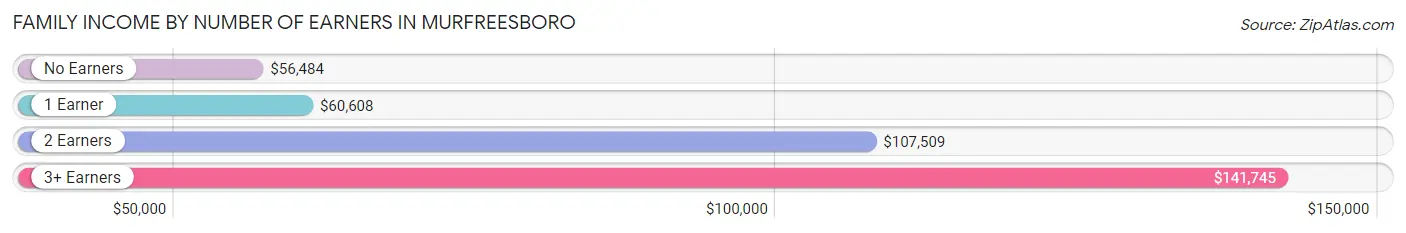
Family Income by Number of Earners in Murfreesboro
The median family income in Murfreesboro is $90,863, with families comprising 3+ earners (4,140) having the highest median family income of $141,745, while families with no earners (3,332) have the lowest median family income of $56,484, accounting for 11.7% and 9.4% of families, respectively.
| Number of Earners | # Families | Median Income |
| No Earners | 3,332 (9.4%) | $56,484 |
| 1 Earner | 10,877 (30.7%) | $60,608 |
| 2 Earners | 17,064 (48.2%) | $107,509 |
| 3+ Earners | 4,140 (11.7%) | $141,745 |
| Total | 35,413 (100.0%) | $90,863 |
Household Income in Murfreesboro
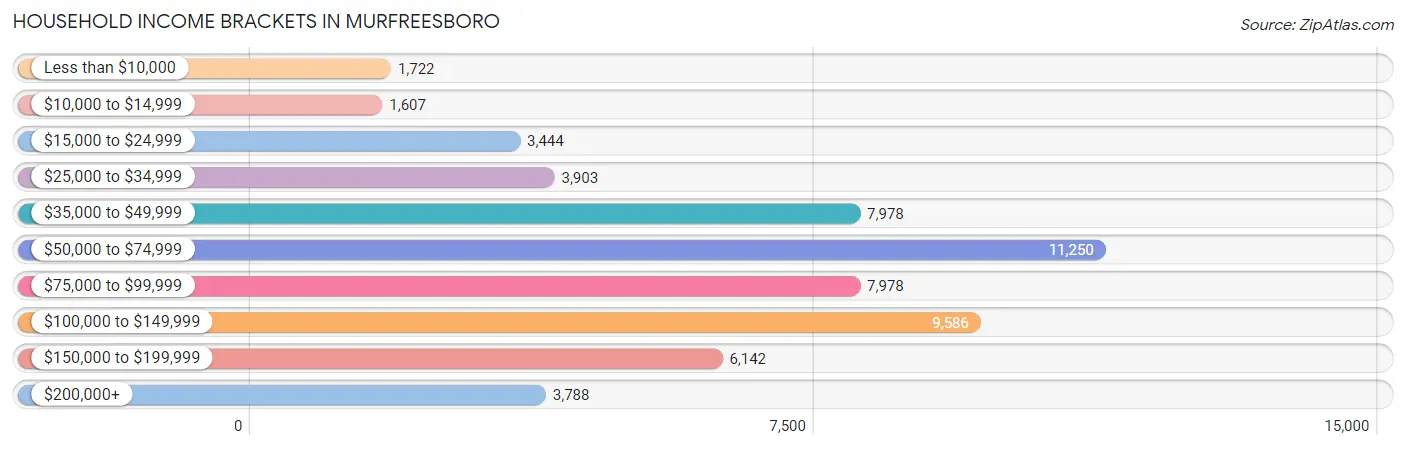
Household Income Brackets in Murfreesboro
With 11,250 households falling in the category, the $50,000 to $74,999 income range is the most frequent in Murfreesboro, accounting for 19.6% of all households. In contrast, only 1,607 households (2.8%) fall into the $10,000 to $14,999 income bracket, making it the least populous group.
| Income Bracket | # Households | % Households |
| Less than $10,000 | 1,722 | 3.0% |
| $10,000 to $14,999 | 1,607 | 2.8% |
| $15,000 to $24,999 | 3,444 | 6.0% |
| $25,000 to $34,999 | 3,903 | 6.8% |
| $35,000 to $49,999 | 7,978 | 13.9% |
| $50,000 to $74,999 | 11,250 | 19.6% |
| $75,000 to $99,999 | 7,978 | 13.9% |
| $100,000 to $149,999 | 9,586 | 16.7% |
| $150,000 to $199,999 | 6,142 | 10.7% |
| $200,000+ | 3,788 | 6.6% |
Household Income by Householder Age in Murfreesboro
The median household income in Murfreesboro is $70,451, with the highest median household income of $90,925 found in the 45 to 64 years age bracket for the primary householder. A total of 18,200 households (31.7%) fall into this category. Meanwhile, the 15 to 24 years age bracket for the primary householder has the lowest median household income of $45,565, with 5,929 households (10.3%) in this group.
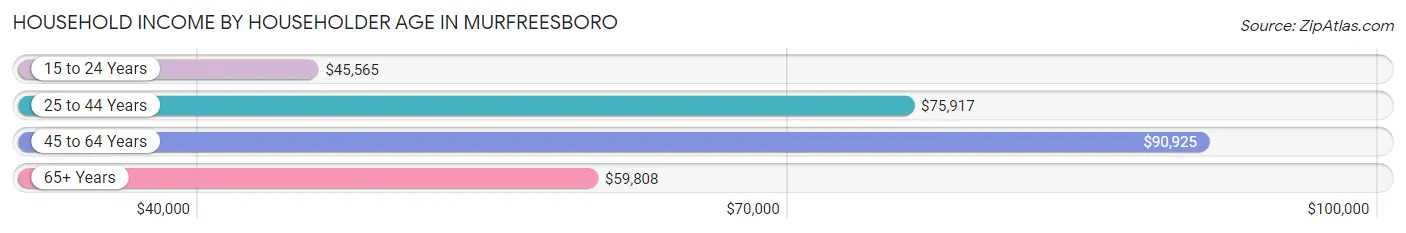
| Income Bracket | # Households | Median Income |
| 15 to 24 Years | 5,929 (10.3%) | $45,565 |
| 25 to 44 Years | 23,170 (40.4%) | $75,917 |
| 45 to 64 Years | 18,200 (31.7%) | $90,925 |
| 65+ Years | 10,100 (17.6%) | $59,808 |
| Total | 57,399 (100.0%) | $70,451 |
Poverty in Murfreesboro
Income Below Poverty by Sex and Age in Murfreesboro
With 10.9% poverty level for males and 12.1% for females among the residents of Murfreesboro, 18 to 24 year old males and 15 year old females are the most vulnerable to poverty, with 3,083 males (27.9%) and 257 females (27.2%) in their respective age groups living below the poverty level.
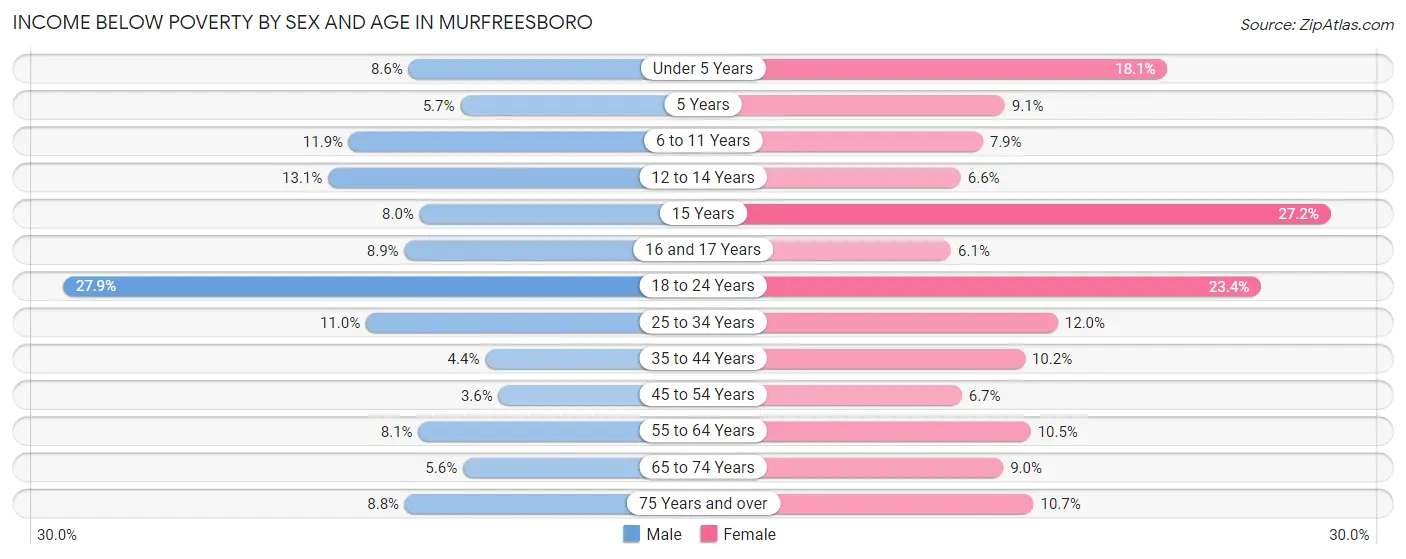
| Age Bracket | Male | Female |
| Under 5 Years | 441 (8.6%) | 717 (18.1%) |
| 5 Years | 51 (5.7%) | 73 (9.1%) |
| 6 to 11 Years | 606 (11.9%) | 461 (7.9%) |
| 12 to 14 Years | 457 (13.1%) | 187 (6.6%) |
| 15 Years | 73 (8.0%) | 257 (27.2%) |
| 16 and 17 Years | 232 (8.8%) | 93 (6.1%) |
| 18 to 24 Years | 3,083 (27.9%) | 2,535 (23.4%) |
| 25 to 34 Years | 1,343 (11.0%) | 1,517 (12.0%) |
| 35 to 44 Years | 442 (4.3%) | 1,077 (10.2%) |
| 45 to 54 Years | 310 (3.6%) | 621 (6.7%) |
| 55 to 64 Years | 526 (8.1%) | 769 (10.5%) |
| 65 to 74 Years | 236 (5.6%) | 476 (9.0%) |
| 75 Years and over | 200 (8.8%) | 419 (10.7%) |
| Total | 8,000 (10.9%) | 9,202 (12.1%) |
Income Above Poverty by Sex and Age in Murfreesboro
According to the poverty statistics in Murfreesboro, males aged 45 to 54 years and females aged 16 and 17 years are the age groups that are most secure financially, with 96.4% of males and 93.9% of females in these age groups living above the poverty line.
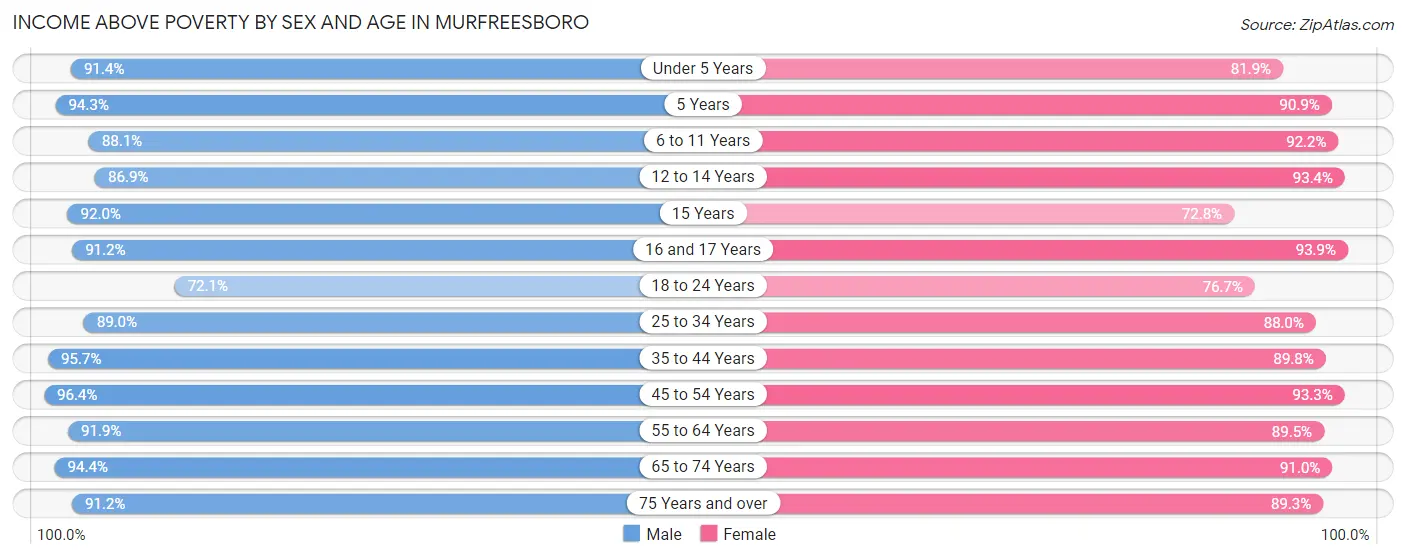
| Age Bracket | Male | Female |
| Under 5 Years | 4,675 (91.4%) | 3,238 (81.9%) |
| 5 Years | 837 (94.3%) | 731 (90.9%) |
| 6 to 11 Years | 4,469 (88.1%) | 5,409 (92.1%) |
| 12 to 14 Years | 3,032 (86.9%) | 2,634 (93.4%) |
| 15 Years | 839 (92.0%) | 687 (72.8%) |
| 16 and 17 Years | 2,389 (91.1%) | 1,434 (93.9%) |
| 18 to 24 Years | 7,981 (72.1%) | 8,323 (76.6%) |
| 25 to 34 Years | 10,873 (89.0%) | 11,094 (88.0%) |
| 35 to 44 Years | 9,709 (95.7%) | 9,479 (89.8%) |
| 45 to 54 Years | 8,270 (96.4%) | 8,681 (93.3%) |
| 55 to 64 Years | 5,994 (91.9%) | 6,543 (89.5%) |
| 65 to 74 Years | 3,989 (94.4%) | 4,816 (91.0%) |
| 75 Years and over | 2,068 (91.2%) | 3,506 (89.3%) |
| Total | 65,125 (89.1%) | 66,575 (87.9%) |
Income Below Poverty Among Married-Couple Families in Murfreesboro
The poverty statistics for married-couple families in Murfreesboro show that 3.3% or 842 of the total 25,700 families live below the poverty line. Families with 5 or more children have the highest poverty rate of 29.4%, comprising of 55 families. On the other hand, families with no children have the lowest poverty rate of 1.8%, which includes 243 families.
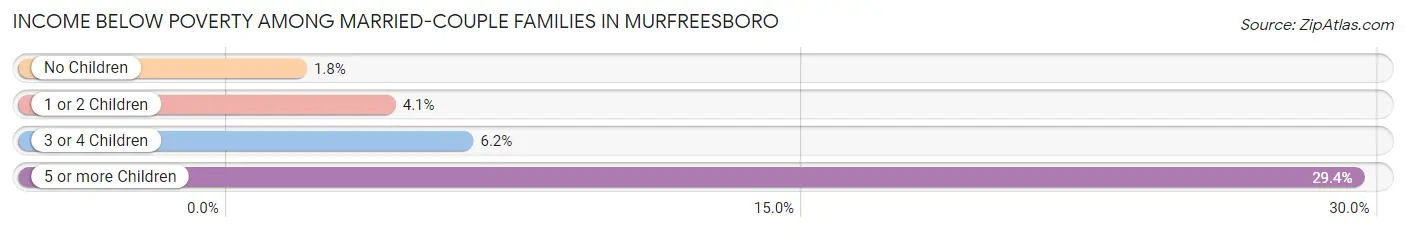
| Children | Above Poverty | Below Poverty |
| No Children | 13,259 (98.2%) | 243 (1.8%) |
| 1 or 2 Children | 9,195 (95.9%) | 395 (4.1%) |
| 3 or 4 Children | 2,272 (93.9%) | 149 (6.1%) |
| 5 or more Children | 132 (70.6%) | 55 (29.4%) |
| Total | 24,858 (96.7%) | 842 (3.3%) |
Income Below Poverty Among Single-Parent Households in Murfreesboro
According to the poverty data in Murfreesboro, 6.2% or 161 single-father households and 18.5% or 1,317 single-mother households are living below the poverty line. Among single-father households, those with 1 or 2 children have the highest poverty rate, with 161 households (14.4%) experiencing poverty. Likewise, among single-mother households, those with 3 or 4 children have the highest poverty rate, with 182 households (40.1%) falling below the poverty line.
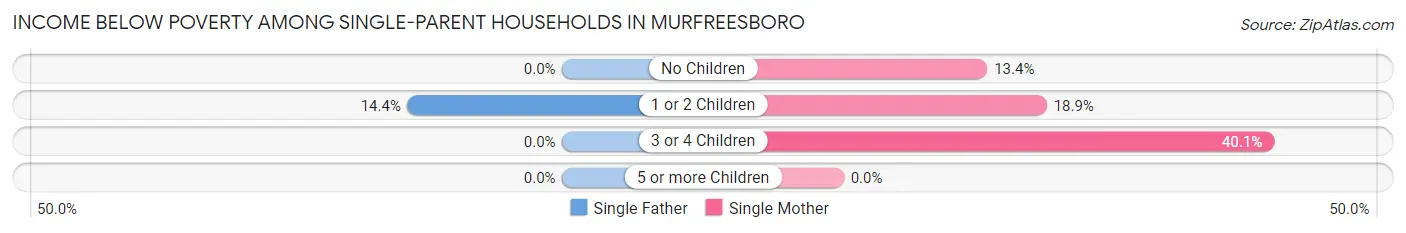
| Children | Single Father | Single Mother |
| No Children | 0 (0.0%) | 305 (13.4%) |
| 1 or 2 Children | 161 (14.4%) | 830 (18.9%) |
| 3 or 4 Children | 0 (0.0%) | 182 (40.1%) |
| 5 or more Children | 0 (0.0%) | 0 (0.0%) |
| Total | 161 (6.2%) | 1,317 (18.5%) |
Income Below Poverty Among Married-Couple vs Single-Parent Households in Murfreesboro
The poverty data for Murfreesboro shows that 842 of the married-couple family households (3.3%) and 1,478 of the single-parent households (15.2%) are living below the poverty level. Within the married-couple family households, those with 5 or more children have the highest poverty rate, with 55 households (29.4%) falling below the poverty line. Among the single-parent households, those with 3 or 4 children have the highest poverty rate, with 182 household (23.0%) living below poverty.
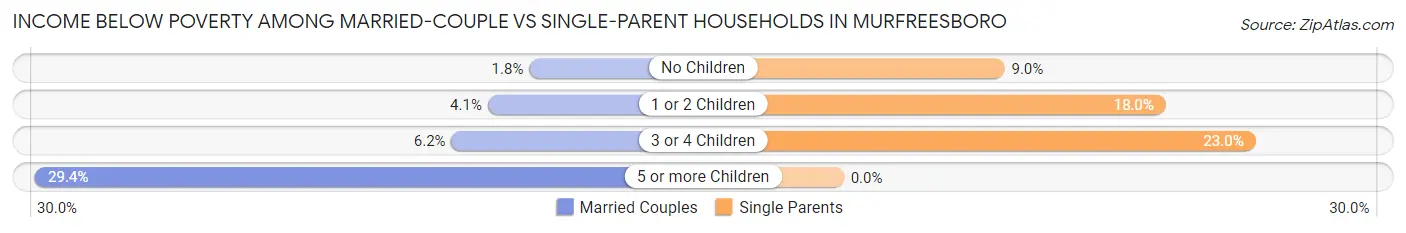
| Children | Married-Couple Families | Single-Parent Households |
| No Children | 243 (1.8%) | 305 (9.0%) |
| 1 or 2 Children | 395 (4.1%) | 991 (18.0%) |
| 3 or 4 Children | 149 (6.1%) | 182 (23.0%) |
| 5 or more Children | 55 (29.4%) | 0 (0.0%) |
| Total | 842 (3.3%) | 1,478 (15.2%) |
Race in Murfreesboro
The most populous races in Murfreesboro are White / Caucasian (105,671 | 68.9%), Black / African American (27,340 | 17.8%), and Hispanic or Latino (11,379 | 7.4%).
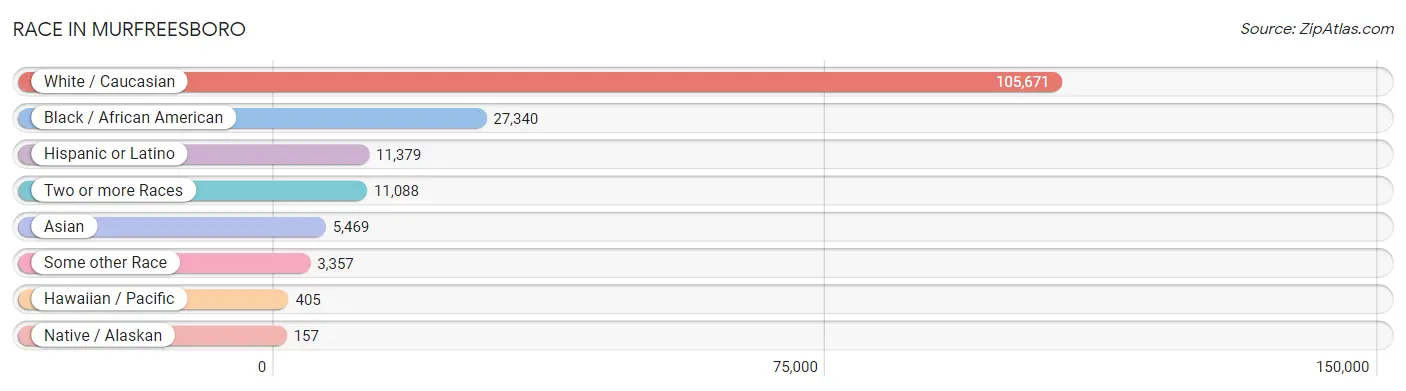
| Race | # Population | % Population |
| Asian | 5,469 | 3.6% |
| Black / African American | 27,340 | 17.8% |
| Hawaiian / Pacific | 405 | 0.3% |
| Hispanic or Latino | 11,379 | 7.4% |
| Native / Alaskan | 157 | 0.1% |
| White / Caucasian | 105,671 | 68.9% |
| Two or more Races | 11,088 | 7.2% |
| Some other Race | 3,357 | 2.2% |
| Total | 153,487 | 100.0% |
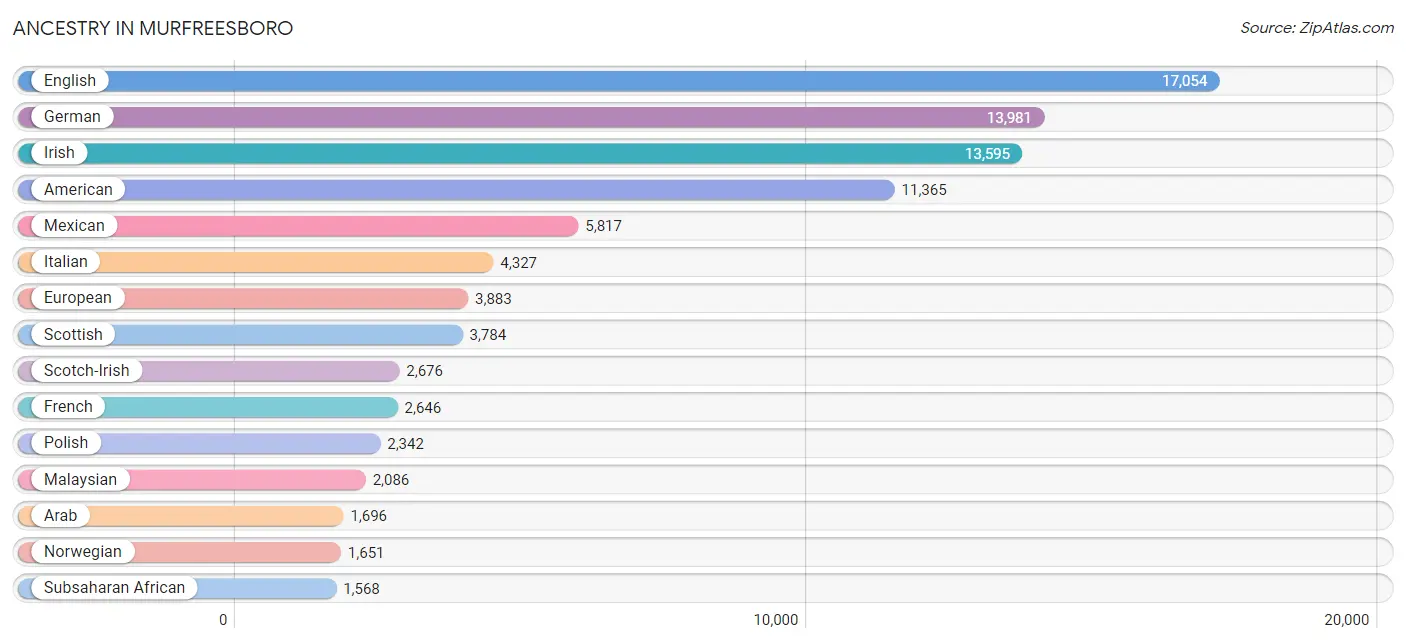
Ancestry in Murfreesboro
The most populous ancestries reported in Murfreesboro are English (17,054 | 11.1%), German (13,981 | 9.1%), Irish (13,595 | 8.9%), American (11,365 | 7.4%), and Mexican (5,817 | 3.8%), together accounting for 40.3% of all Murfreesboro residents.
| Ancestry | # Population | % Population |
| African | 664 | 0.4% |
| American | 11,365 | 7.4% |
| Arab | 1,696 | 1.1% |
| Argentinean | 299 | 0.2% |
| Armenian | 130 | 0.1% |
| Assyrian / Chaldean / Syriac | 9 | 0.0% |
| Australian | 16 | 0.0% |
| Austrian | 130 | 0.1% |
| Bahamian | 25 | 0.0% |
| Belgian | 21 | 0.0% |
| Belizean | 47 | 0.0% |
| Bermudan | 8 | 0.0% |
| Bhutanese | 867 | 0.6% |
| Blackfeet | 136 | 0.1% |
| Brazilian | 13 | 0.0% |
| British | 860 | 0.6% |
| British West Indian | 47 | 0.0% |
| Bulgarian | 80 | 0.1% |
| Burmese | 657 | 0.4% |
| Canadian | 71 | 0.1% |
| Celtic | 98 | 0.1% |
| Central American | 1,061 | 0.7% |
| Central American Indian | 22 | 0.0% |
| Cherokee | 353 | 0.2% |
| Chickasaw | 3 | 0.0% |
| Choctaw | 3 | 0.0% |
| Colombian | 318 | 0.2% |
| Comanche | 6 | 0.0% |
| Costa Rican | 8 | 0.0% |
| Croatian | 85 | 0.1% |
| Cuban | 344 | 0.2% |
| Czech | 211 | 0.1% |
| Czechoslovakian | 81 | 0.1% |
| Danish | 154 | 0.1% |
| Dominican | 439 | 0.3% |
| Dutch | 802 | 0.5% |
| Eastern European | 133 | 0.1% |
| Ecuadorian | 19 | 0.0% |
| Egyptian | 556 | 0.4% |
| English | 17,054 | 11.1% |
| Ethiopian | 462 | 0.3% |
| European | 3,883 | 2.5% |
| Filipino | 88 | 0.1% |
| Finnish | 713 | 0.5% |
| French | 2,646 | 1.7% |
| French Canadian | 526 | 0.3% |
| German | 13,981 | 9.1% |
| Greek | 388 | 0.3% |
| Guatemalan | 439 | 0.3% |
| Haitian | 154 | 0.1% |
| Honduran | 160 | 0.1% |
| Hungarian | 326 | 0.2% |
| Icelander | 44 | 0.0% |
| Indian (Asian) | 1,001 | 0.6% |
| Indonesian | 451 | 0.3% |
| Iranian | 35 | 0.0% |
| Iraqi | 195 | 0.1% |
| Irish | 13,595 | 8.9% |
| Iroquois | 70 | 0.1% |
| Israeli | 16 | 0.0% |
| Italian | 4,327 | 2.8% |
| Jamaican | 174 | 0.1% |
| Japanese | 245 | 0.2% |
| Jordanian | 73 | 0.1% |
| Kenyan | 85 | 0.1% |
| Korean | 766 | 0.5% |
| Laotian | 53 | 0.0% |
| Latvian | 96 | 0.1% |
| Lebanese | 76 | 0.1% |
| Liberian | 19 | 0.0% |
| Lithuanian | 207 | 0.1% |
| Malaysian | 2,086 | 1.4% |
| Mexican | 5,817 | 3.8% |
| Mexican American Indian | 39 | 0.0% |
| Native Hawaiian | 226 | 0.2% |
| Navajo | 46 | 0.0% |
| Nigerian | 276 | 0.2% |
| Northern European | 128 | 0.1% |
| Norwegian | 1,651 | 1.1% |
| Pakistani | 79 | 0.1% |
| Palestinian | 204 | 0.1% |
| Panamanian | 119 | 0.1% |
| Peruvian | 383 | 0.3% |
| Polish | 2,342 | 1.5% |
| Portuguese | 205 | 0.1% |
| Puerto Rican | 1,399 | 0.9% |
| Romanian | 153 | 0.1% |
| Russian | 552 | 0.4% |
| Salvadoran | 335 | 0.2% |
| Samoan | 222 | 0.1% |
| Scandinavian | 367 | 0.2% |
| Scotch-Irish | 2,676 | 1.7% |
| Scottish | 3,784 | 2.5% |
| Seminole | 28 | 0.0% |
| Slavic | 20 | 0.0% |
| Slovak | 156 | 0.1% |
| Slovene | 76 | 0.1% |
| Somali | 3 | 0.0% |
| South American | 1,431 | 0.9% |
| South American Indian | 11 | 0.0% |
| Spaniard | 223 | 0.2% |
| Spanish | 298 | 0.2% |
| Sri Lankan | 295 | 0.2% |
| Subsaharan African | 1,568 | 1.0% |
| Sudanese | 41 | 0.0% |
| Swedish | 653 | 0.4% |
| Swiss | 138 | 0.1% |
| Syrian | 33 | 0.0% |
| Thai | 1,064 | 0.7% |
| Trinidadian and Tobagonian | 24 | 0.0% |
| U.S. Virgin Islander | 15 | 0.0% |
| Ukrainian | 229 | 0.2% |
| Venezuelan | 238 | 0.2% |
| Welsh | 771 | 0.5% |
| West Indian | 100 | 0.1% |
| Yugoslavian | 18 | 0.0% | View All 116 Rows |
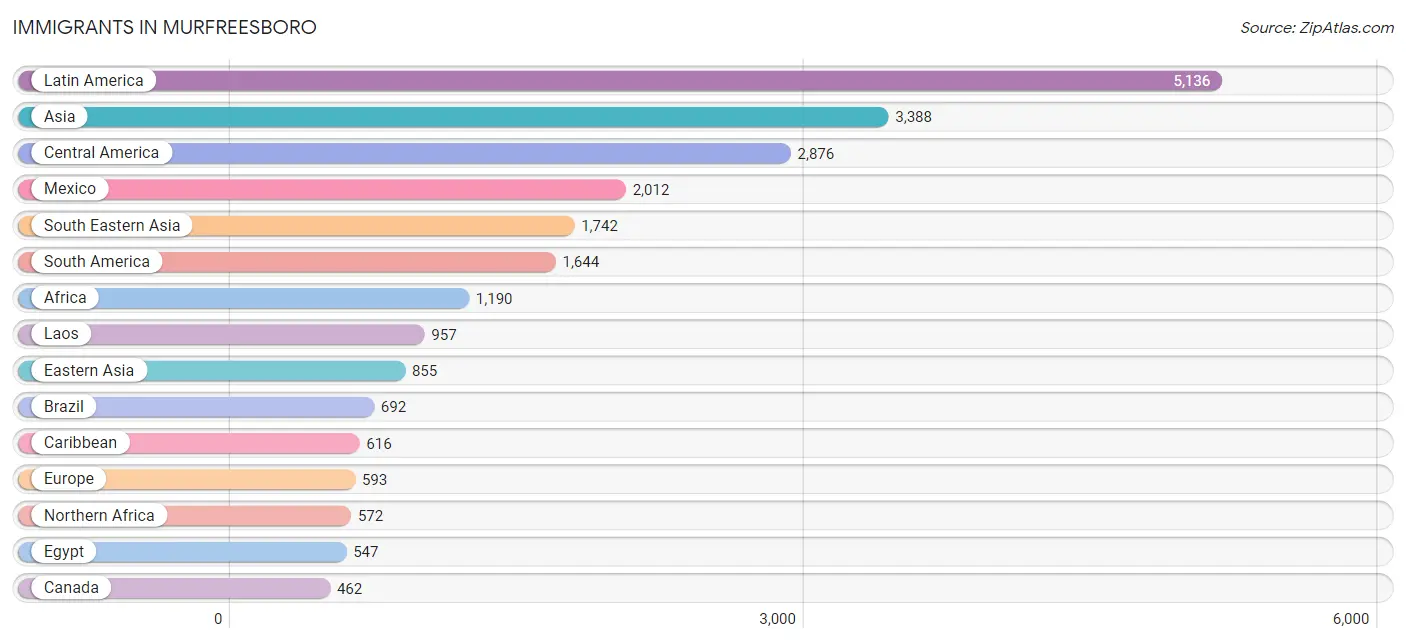
Immigrants in Murfreesboro
The most numerous immigrant groups reported in Murfreesboro came from Latin America (5,136 | 3.4%), Asia (3,388 | 2.2%), Central America (2,876 | 1.9%), Mexico (2,012 | 1.3%), and South Eastern Asia (1,742 | 1.1%), together accounting for 9.9% of all Murfreesboro residents.
| Immigration Origin | # Population | % Population |
| Africa | 1,190 | 0.8% |
| Argentina | 131 | 0.1% |
| Asia | 3,388 | 2.2% |
| Australia | 32 | 0.0% |
| Bahamas | 25 | 0.0% |
| Bolivia | 36 | 0.0% |
| Brazil | 692 | 0.4% |
| Cambodia | 18 | 0.0% |
| Canada | 462 | 0.3% |
| Caribbean | 616 | 0.4% |
| Central America | 2,876 | 1.9% |
| China | 381 | 0.3% |
| Colombia | 194 | 0.1% |
| Cuba | 143 | 0.1% |
| Dominican Republic | 245 | 0.2% |
| Eastern Africa | 248 | 0.2% |
| Eastern Asia | 855 | 0.6% |
| Eastern Europe | 301 | 0.2% |
| Egypt | 547 | 0.4% |
| El Salvador | 276 | 0.2% |
| England | 28 | 0.0% |
| Ethiopia | 166 | 0.1% |
| Europe | 593 | 0.4% |
| France | 69 | 0.0% |
| Germany | 37 | 0.0% |
| Ghana | 28 | 0.0% |
| Greece | 26 | 0.0% |
| Guatemala | 316 | 0.2% |
| Haiti | 75 | 0.1% |
| Honduras | 173 | 0.1% |
| Hungary | 34 | 0.0% |
| India | 287 | 0.2% |
| Indonesia | 53 | 0.0% |
| Iran | 16 | 0.0% |
| Iraq | 125 | 0.1% |
| Italy | 34 | 0.0% |
| Jamaica | 128 | 0.1% |
| Japan | 279 | 0.2% |
| Jordan | 60 | 0.0% |
| Kenya | 63 | 0.0% |
| Korea | 195 | 0.1% |
| Kuwait | 93 | 0.1% |
| Laos | 957 | 0.6% |
| Latin America | 5,136 | 3.4% |
| Lebanon | 25 | 0.0% |
| Malaysia | 82 | 0.1% |
| Mexico | 2,012 | 1.3% |
| Middle Africa | 10 | 0.0% |
| Nigeria | 272 | 0.2% |
| Northern Africa | 572 | 0.4% |
| Northern Europe | 40 | 0.0% |
| Oceania | 32 | 0.0% |
| Panama | 99 | 0.1% |
| Peru | 247 | 0.2% |
| Philippines | 259 | 0.2% |
| Poland | 92 | 0.1% |
| Portugal | 17 | 0.0% |
| Romania | 85 | 0.1% |
| Russia | 73 | 0.1% |
| Saudi Arabia | 32 | 0.0% |
| South America | 1,644 | 1.1% |
| South Central Asia | 303 | 0.2% |
| South Eastern Asia | 1,742 | 1.1% |
| Southern Europe | 146 | 0.1% |
| Spain | 69 | 0.0% |
| Sudan | 25 | 0.0% |
| Syria | 75 | 0.1% |
| Thailand | 96 | 0.1% |
| Turkey | 1 | 0.0% |
| Ukraine | 17 | 0.0% |
| Venezuela | 344 | 0.2% |
| Vietnam | 18 | 0.0% |
| Western Africa | 300 | 0.2% |
| Western Asia | 411 | 0.3% |
| Western Europe | 106 | 0.1% |
| Zaire | 10 | 0.0% | View All 76 Rows |
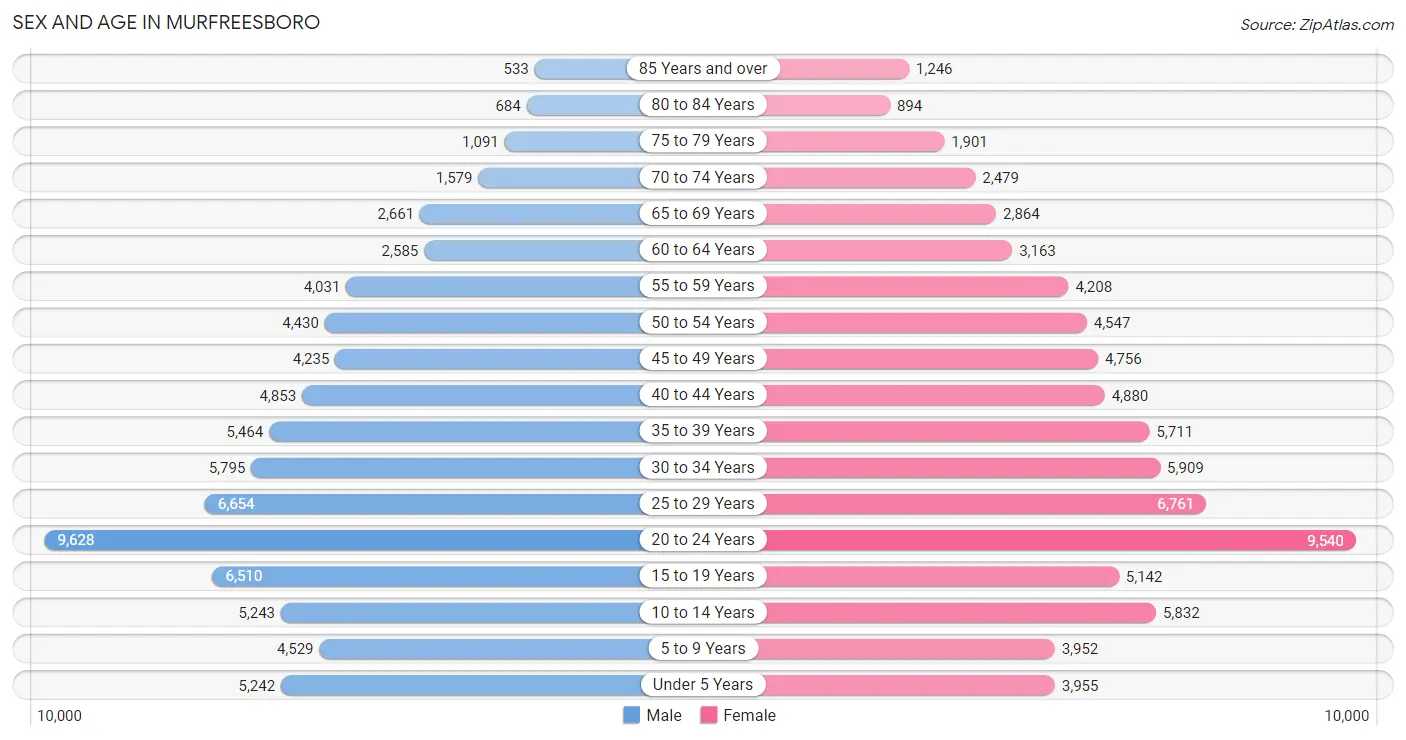
Sex and Age in Murfreesboro
Sex and Age in Murfreesboro
The most populous age groups in Murfreesboro are 20 to 24 Years (9,628 | 12.7%) for men and 20 to 24 Years (9,540 | 12.3%) for women.
| Age Bracket | Male | Female |
| Under 5 Years | 5,242 (6.9%) | 3,955 (5.1%) |
| 5 to 9 Years | 4,529 (6.0%) | 3,952 (5.1%) |
| 10 to 14 Years | 5,243 (6.9%) | 5,832 (7.5%) |
| 15 to 19 Years | 6,510 (8.6%) | 5,142 (6.6%) |
| 20 to 24 Years | 9,628 (12.7%) | 9,540 (12.3%) |
| 25 to 29 Years | 6,654 (8.8%) | 6,761 (8.7%) |
| 30 to 34 Years | 5,795 (7.6%) | 5,909 (7.6%) |
| 35 to 39 Years | 5,464 (7.2%) | 5,711 (7.3%) |
| 40 to 44 Years | 4,853 (6.4%) | 4,880 (6.3%) |
| 45 to 49 Years | 4,235 (5.6%) | 4,756 (6.1%) |
| 50 to 54 Years | 4,430 (5.9%) | 4,547 (5.9%) |
| 55 to 59 Years | 4,031 (5.3%) | 4,208 (5.4%) |
| 60 to 64 Years | 2,585 (3.4%) | 3,163 (4.1%) |
| 65 to 69 Years | 2,661 (3.5%) | 2,864 (3.7%) |
| 70 to 74 Years | 1,579 (2.1%) | 2,479 (3.2%) |
| 75 to 79 Years | 1,091 (1.4%) | 1,901 (2.5%) |
| 80 to 84 Years | 684 (0.9%) | 894 (1.1%) |
| 85 Years and over | 533 (0.7%) | 1,246 (1.6%) |
| Total | 75,747 (100.0%) | 77,740 (100.0%) |
Families and Households in Murfreesboro
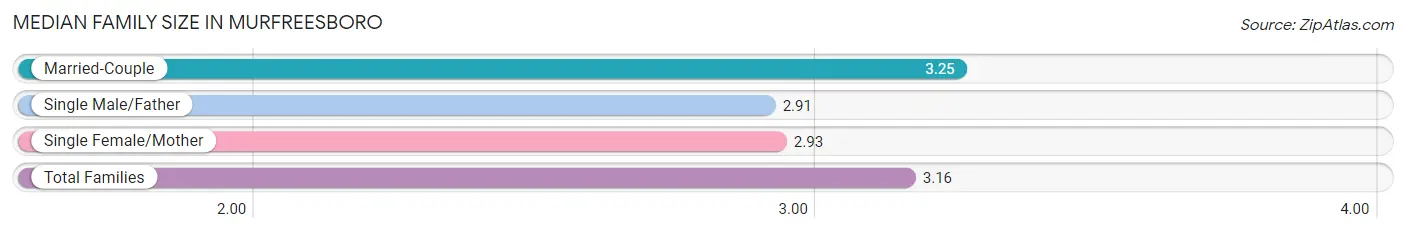
Median Family Size in Murfreesboro
The median family size in Murfreesboro is 3.16 persons per family, with married-couple families (25,700 | 72.6%) accounting for the largest median family size of 3.25 persons per family. On the other hand, single male/father families (2,587 | 7.3%) represent the smallest median family size with 2.91 persons per family.
| Family Type | # Families | Family Size |
| Married-Couple | 25,700 (72.6%) | 3.25 |
| Single Male/Father | 2,587 (7.3%) | 2.91 |
| Single Female/Mother | 7,126 (20.1%) | 2.93 |
| Total Families | 35,413 (100.0%) | 3.16 |
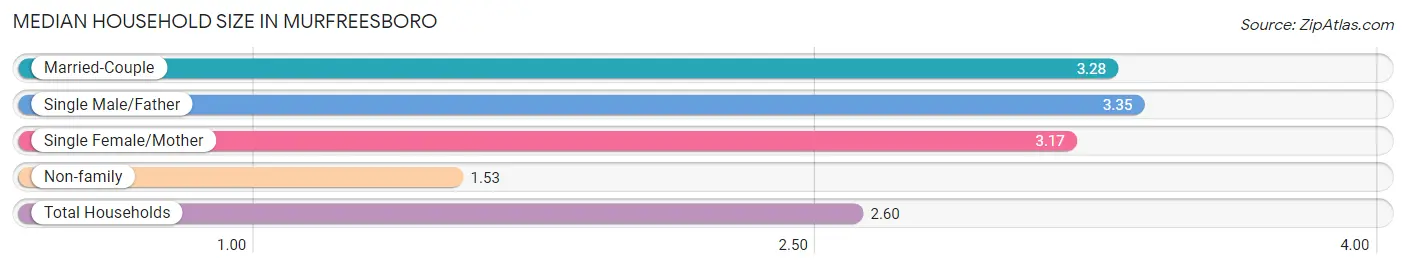
Median Household Size in Murfreesboro
The median household size in Murfreesboro is 2.60 persons per household, with single male/father households (2,587 | 4.5%) accounting for the largest median household size of 3.35 persons per household. non-family households (21,986 | 38.3%) represent the smallest median household size with 1.53 persons per household.
| Household Type | # Households | Household Size |
| Married-Couple | 25,700 (44.8%) | 3.28 |
| Single Male/Father | 2,587 (4.5%) | 3.35 |
| Single Female/Mother | 7,126 (12.4%) | 3.17 |
| Non-family | 21,986 (38.3%) | 1.53 |
| Total Households | 57,399 (100.0%) | 2.60 |
Household Size by Marriage Status in Murfreesboro
Out of a total of 57,399 households in Murfreesboro, 35,413 (61.7%) are family households, while 21,986 (38.3%) are nonfamily households. The most numerous type of family households are 2-person households, comprising 14,678, and the most common type of nonfamily households are 1-person households, comprising 15,482.
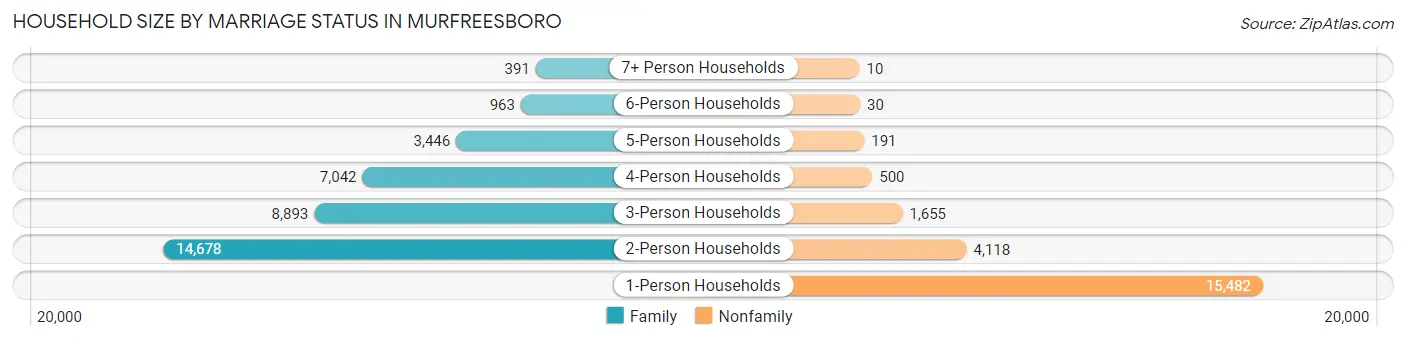
| Household Size | Family Households | Nonfamily Households |
| 1-Person Households | - | 15,482 (27.0%) |
| 2-Person Households | 14,678 (25.6%) | 4,118 (7.2%) |
| 3-Person Households | 8,893 (15.5%) | 1,655 (2.9%) |
| 4-Person Households | 7,042 (12.3%) | 500 (0.9%) |
| 5-Person Households | 3,446 (6.0%) | 191 (0.3%) |
| 6-Person Households | 963 (1.7%) | 30 (0.1%) |
| 7+ Person Households | 391 (0.7%) | 10 (0.0%) |
| Total | 35,413 (61.7%) | 21,986 (38.3%) |
Female Fertility in Murfreesboro
Fertility by Age in Murfreesboro
Average fertility rate in Murfreesboro is 56.0 births per 1,000 women. Women in the age bracket of 20 to 34 years have the highest fertility rate with 81.0 births per 1,000 women. Women in the age bracket of 20 to 34 years acount for 73.2% of all women with births.
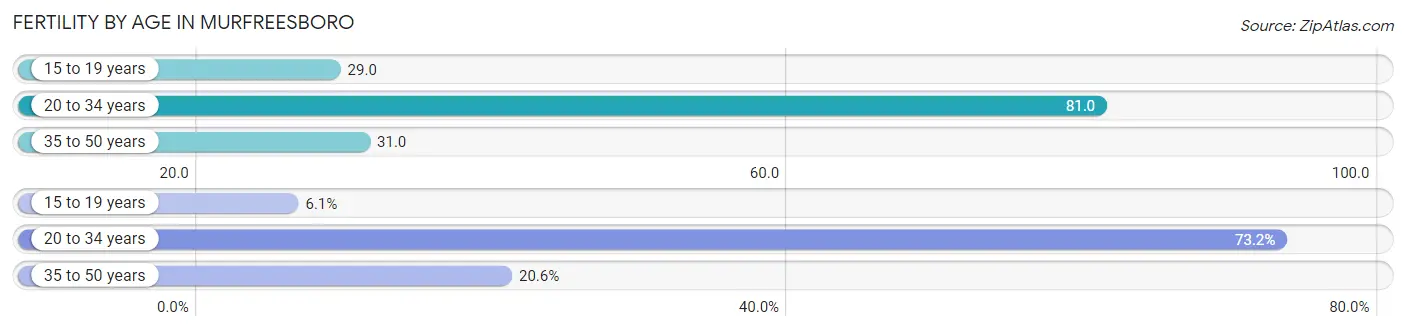
| Age Bracket | Women with Births | Births / 1,000 Women |
| 15 to 19 years | 151 (6.1%) | 29.0 |
| 20 to 34 years | 1,800 (73.2%) | 81.0 |
| 35 to 50 years | 507 (20.6%) | 31.0 |
| Total | 2,458 (100.0%) | 56.0 |
Fertility by Age by Marriage Status in Murfreesboro
68.3% of women with births (2,458) in Murfreesboro are married. The highest percentage of unmarried women with births falls into 15 to 19 years age bracket with 100.0% of them unmarried at the time of birth, while the lowest percentage of unmarried women with births belong to 35 to 50 years age bracket with 14.6% of them unmarried.
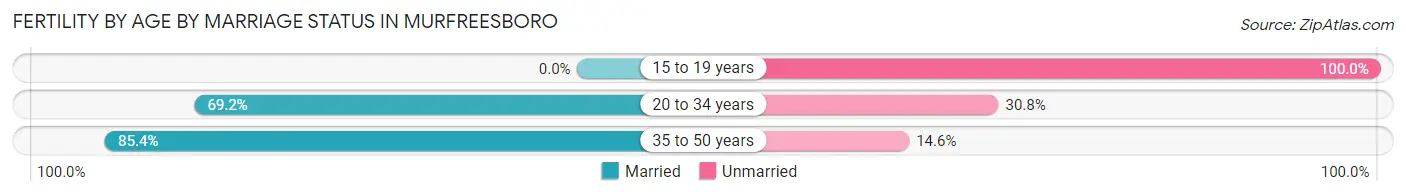
| Age Bracket | Married | Unmarried |
| 15 to 19 years | 0 (0.0%) | 151 (100.0%) |
| 20 to 34 years | 1,246 (69.2%) | 554 (30.8%) |
| 35 to 50 years | 433 (85.4%) | 74 (14.6%) |
| Total | 1,679 (68.3%) | 779 (31.7%) |
Fertility by Education in Murfreesboro
Average fertility rate in Murfreesboro is 56.0 births per 1,000 women. Women with the education attainment of high school diploma have the highest fertility rate of 95.0 births per 1,000 women, while women with the education attainment of less than high school have the lowest fertility at 11.0 births per 1,000 women. Women with the education attainment of high school diploma represent 34.3% of all women with births.
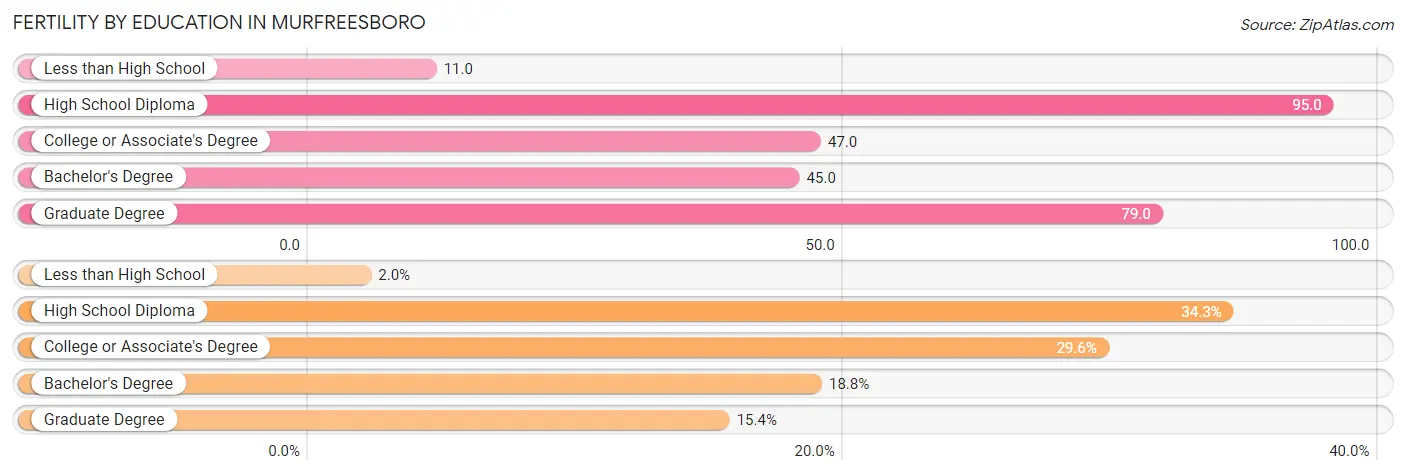
| Educational Attainment | Women with Births | Births / 1,000 Women |
| Less than High School | 48 (1.9%) | 11.0 |
| High School Diploma | 842 (34.3%) | 95.0 |
| College or Associate's Degree | 727 (29.6%) | 47.0 |
| Bachelor's Degree | 463 (18.8%) | 45.0 |
| Graduate Degree | 378 (15.4%) | 79.0 |
| Total | 2,458 (100.0%) | 56.0 |
Fertility by Education by Marriage Status in Murfreesboro
31.7% of women with births in Murfreesboro are unmarried. Women with the educational attainment of bachelor's degree are most likely to be married with 100.0% of them married at childbirth, while women with the educational attainment of less than high school are least likely to be married with 70.8% of them unmarried at childbirth.
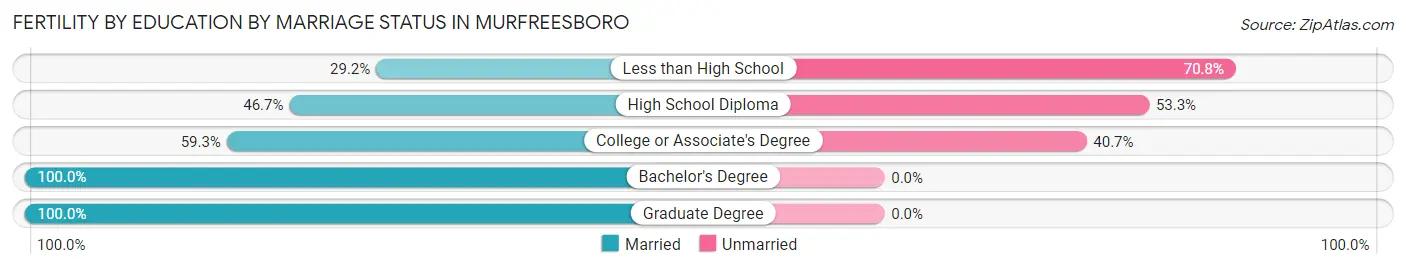
| Educational Attainment | Married | Unmarried |
| Less than High School | 14 (29.2%) | 34 (70.8%) |
| High School Diploma | 393 (46.7%) | 449 (53.3%) |
| College or Associate's Degree | 431 (59.3%) | 296 (40.7%) |
| Bachelor's Degree | 463 (100.0%) | 0 (0.0%) |
| Graduate Degree | 378 (100.0%) | 0 (0.0%) |
| Total | 1,679 (68.3%) | 779 (31.7%) |
Employment Characteristics in Murfreesboro
Employment by Class of Employer in Murfreesboro
Among the 83,117 employed individuals in Murfreesboro, private company employees (60,289 | 72.5%), not-for-profit organizations (5,745 | 6.9%), and local government employees (4,795 | 5.8%) make up the most common classes of employment.
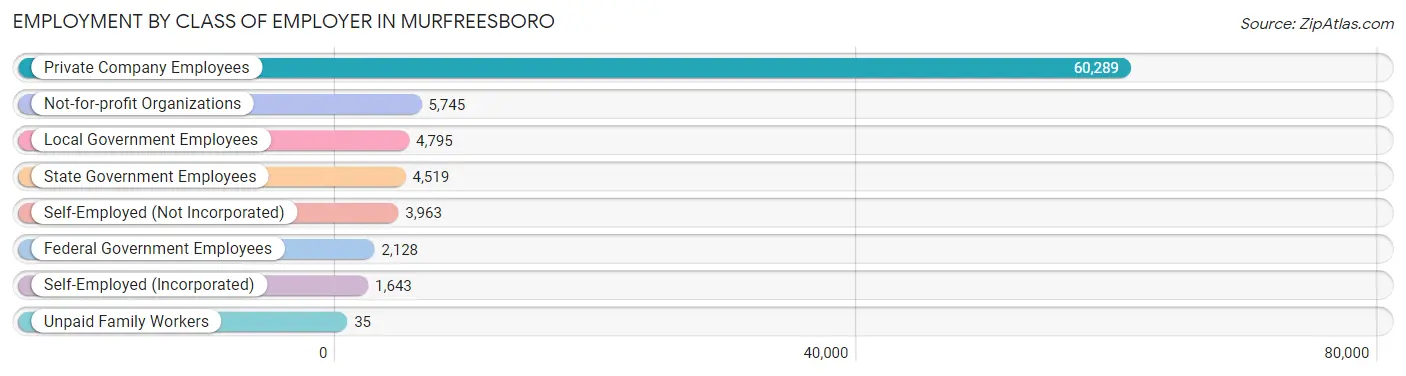
| Employer Class | # Employees | % Employees |
| Private Company Employees | 60,289 | 72.5% |
| Self-Employed (Incorporated) | 1,643 | 2.0% |
| Self-Employed (Not Incorporated) | 3,963 | 4.8% |
| Not-for-profit Organizations | 5,745 | 6.9% |
| Local Government Employees | 4,795 | 5.8% |
| State Government Employees | 4,519 | 5.4% |
| Federal Government Employees | 2,128 | 2.6% |
| Unpaid Family Workers | 35 | 0.0% |
| Total | 83,117 | 100.0% |
Employment Status by Age in Murfreesboro
According to the labor force statistics for Murfreesboro, out of the total population over 16 years of age (122,878), 72.1% or 88,595 individuals are in the labor force, with 4.3% or 3,810 of them unemployed. The age group with the highest labor force participation rate is 25 to 29 years, with 88.0% or 11,805 individuals in the labor force. Within the labor force, the 16 to 19 years age range has the highest percentage of unemployed individuals, with 14.3% or 614 of them being unemployed.
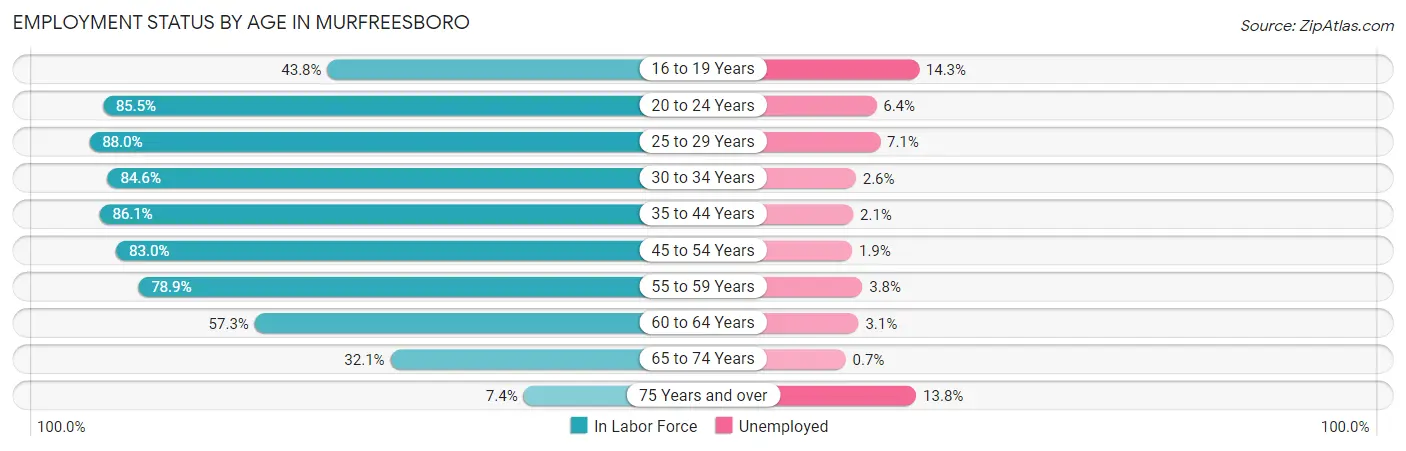
| Age Bracket | In Labor Force | Unemployed |
| 16 to 19 Years | 4,291 (43.8%) | 614 (14.3%) |
| 20 to 24 Years | 16,389 (85.5%) | 1,049 (6.4%) |
| 25 to 29 Years | 11,805 (88.0%) | 838 (7.1%) |
| 30 to 34 Years | 9,902 (84.6%) | 257 (2.6%) |
| 35 to 44 Years | 18,002 (86.1%) | 378 (2.1%) |
| 45 to 54 Years | 14,913 (83.0%) | 283 (1.9%) |
| 55 to 59 Years | 6,501 (78.9%) | 247 (3.8%) |
| 60 to 64 Years | 3,294 (57.3%) | 102 (3.1%) |
| 65 to 74 Years | 3,076 (32.1%) | 22 (0.7%) |
| 75 Years and over | 470 (7.4%) | 65 (13.8%) |
| Total | 88,595 (72.1%) | 3,810 (4.3%) |
Employment Status by Educational Attainment in Murfreesboro
According to labor force statistics for Murfreesboro, 82.6% of individuals (64,413) out of the total population between 25 and 64 years of age (77,982) are in the labor force, with 3.3% or 2,126 of them being unemployed. The group with the highest labor force participation rate are those with the educational attainment of bachelor's degree or higher, with 87.4% or 28,398 individuals in the labor force. Within the labor force, individuals with less than high school education have the highest percentage of unemployment, with 10.3% or 264 of them being unemployed.
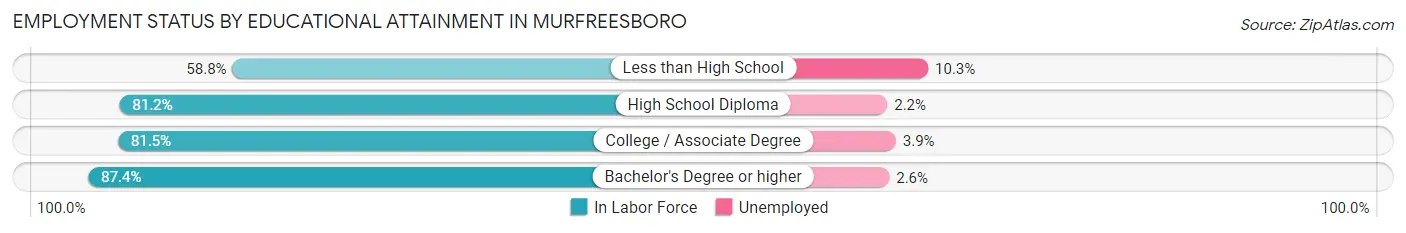
| Educational Attainment | In Labor Force | Unemployed |
| Less than High School | 2,566 (58.8%) | 449 (10.3%) |
| High School Diploma | 13,186 (81.2%) | 357 (2.2%) |
| College / Associate Degree | 20,283 (81.5%) | 971 (3.9%) |
| Bachelor's Degree or higher | 28,398 (87.4%) | 845 (2.6%) |
| Total | 64,413 (82.6%) | 2,573 (3.3%) |
Employment Occupations by Sex in Murfreesboro
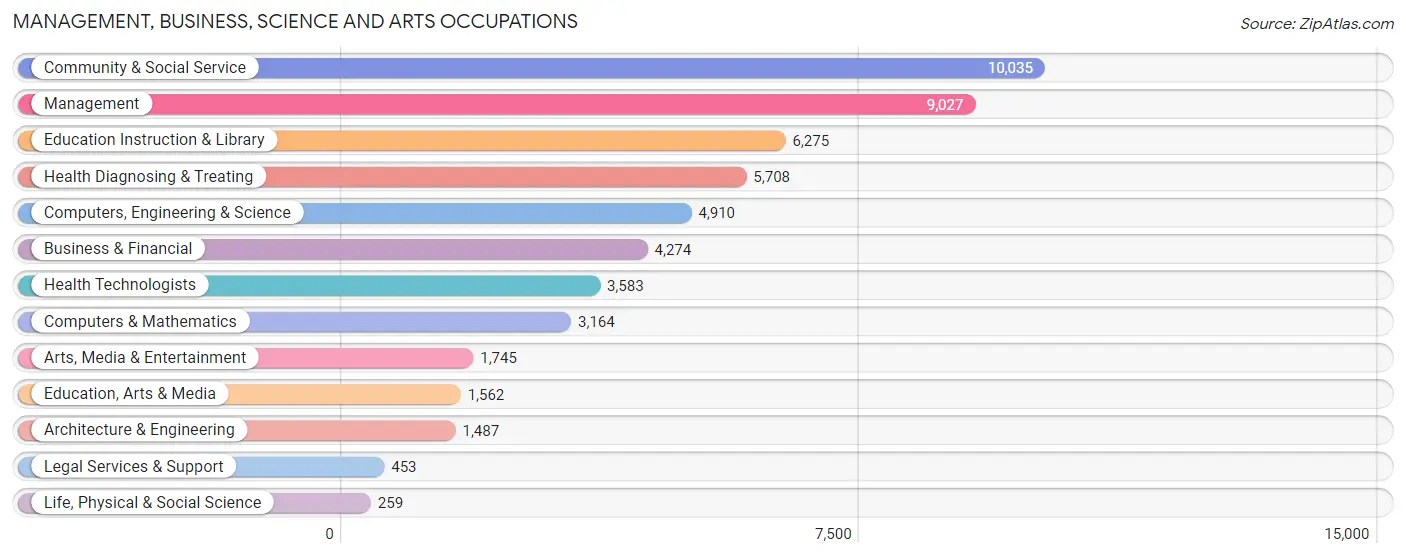
Management, Business, Science and Arts Occupations
The most common Management, Business, Science and Arts occupations in Murfreesboro are Community & Social Service (10,035 | 11.9%), Management (9,027 | 10.7%), Education Instruction & Library (6,275 | 7.4%), Health Diagnosing & Treating (5,708 | 6.8%), and Computers, Engineering & Science (4,910 | 5.8%).
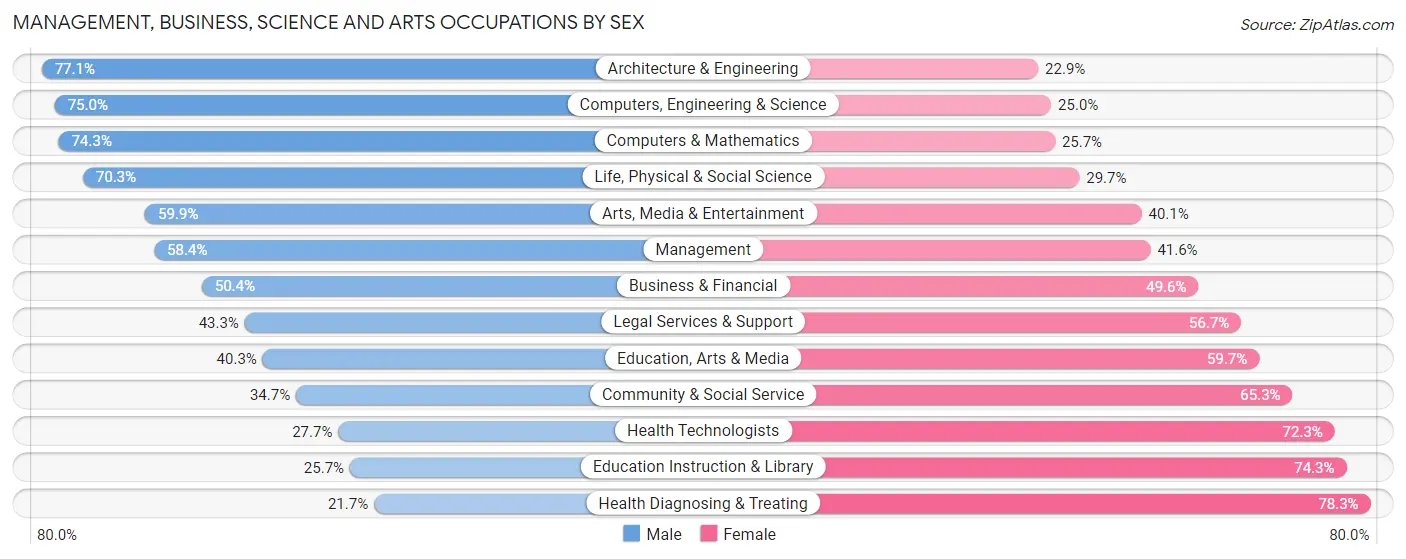
Management, Business, Science and Arts Occupations by Sex
Within the Management, Business, Science and Arts occupations in Murfreesboro, the most male-oriented occupations are Architecture & Engineering (77.1%), Computers, Engineering & Science (75.0%), and Computers & Mathematics (74.3%), while the most female-oriented occupations are Health Diagnosing & Treating (78.3%), Education Instruction & Library (74.3%), and Health Technologists (72.3%).
| Occupation | Male | Female |
| Management | 5,272 (58.4%) | 3,755 (41.6%) |
| Business & Financial | 2,155 (50.4%) | 2,119 (49.6%) |
| Computers, Engineering & Science | 3,681 (75.0%) | 1,229 (25.0%) |
| Computers & Mathematics | 2,352 (74.3%) | 812 (25.7%) |
| Architecture & Engineering | 1,147 (77.1%) | 340 (22.9%) |
| Life, Physical & Social Science | 182 (70.3%) | 77 (29.7%) |
| Community & Social Service | 3,483 (34.7%) | 6,552 (65.3%) |
| Education, Arts & Media | 629 (40.3%) | 933 (59.7%) |
| Legal Services & Support | 196 (43.3%) | 257 (56.7%) |
| Education Instruction & Library | 1,613 (25.7%) | 4,662 (74.3%) |
| Arts, Media & Entertainment | 1,045 (59.9%) | 700 (40.1%) |
| Health Diagnosing & Treating | 1,238 (21.7%) | 4,470 (78.3%) |
| Health Technologists | 991 (27.7%) | 2,592 (72.3%) |
| Total (Category) | 15,829 (46.6%) | 18,125 (53.4%) |
| Total (Overall) | 43,780 (51.8%) | 40,724 (48.2%) |
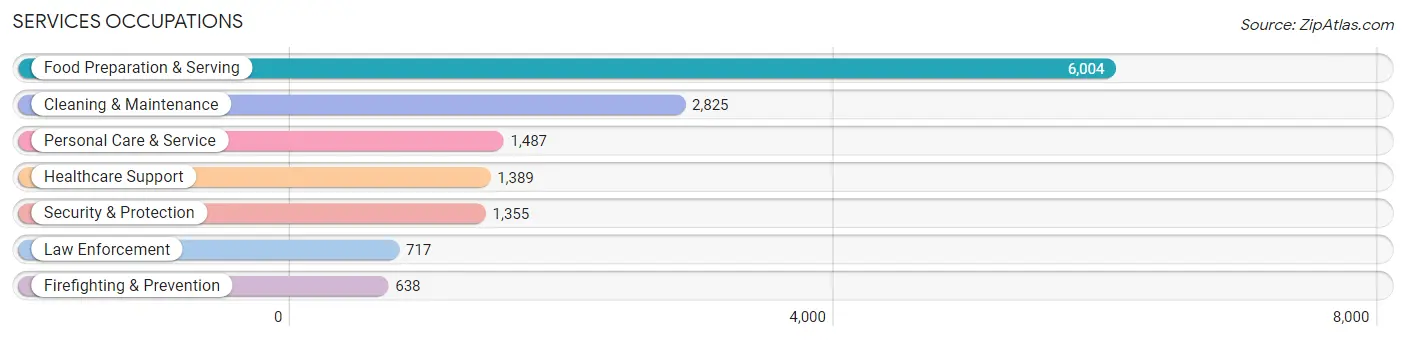
Services Occupations
The most common Services occupations in Murfreesboro are Food Preparation & Serving (6,004 | 7.1%), Cleaning & Maintenance (2,825 | 3.3%), Personal Care & Service (1,487 | 1.8%), Healthcare Support (1,389 | 1.6%), and Security & Protection (1,355 | 1.6%).
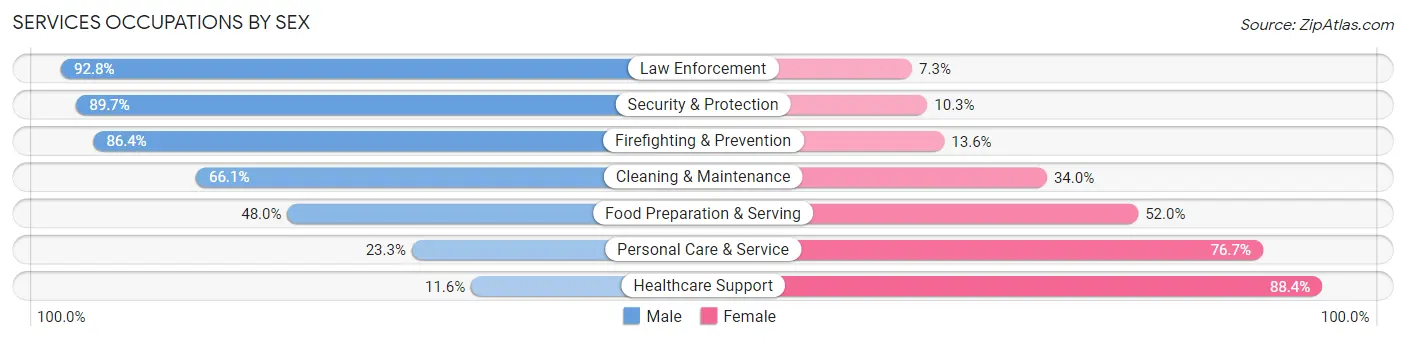
Services Occupations by Sex
Within the Services occupations in Murfreesboro, the most male-oriented occupations are Law Enforcement (92.7%), Security & Protection (89.7%), and Firefighting & Prevention (86.4%), while the most female-oriented occupations are Healthcare Support (88.4%), Personal Care & Service (76.7%), and Food Preparation & Serving (52.0%).
| Occupation | Male | Female |
| Healthcare Support | 161 (11.6%) | 1,228 (88.4%) |
| Security & Protection | 1,216 (89.7%) | 139 (10.3%) |
| Firefighting & Prevention | 551 (86.4%) | 87 (13.6%) |
| Law Enforcement | 665 (92.7%) | 52 (7.2%) |
| Food Preparation & Serving | 2,881 (48.0%) | 3,123 (52.0%) |
| Cleaning & Maintenance | 1,866 (66.0%) | 959 (34.0%) |
| Personal Care & Service | 347 (23.3%) | 1,140 (76.7%) |
| Total (Category) | 6,471 (49.5%) | 6,589 (50.4%) |
| Total (Overall) | 43,780 (51.8%) | 40,724 (48.2%) |
Sales and Office Occupations
The most common Sales and Office occupations in Murfreesboro are Office & Administration (10,809 | 12.8%), and Sales & Related (8,238 | 9.8%).

Sales and Office Occupations by Sex
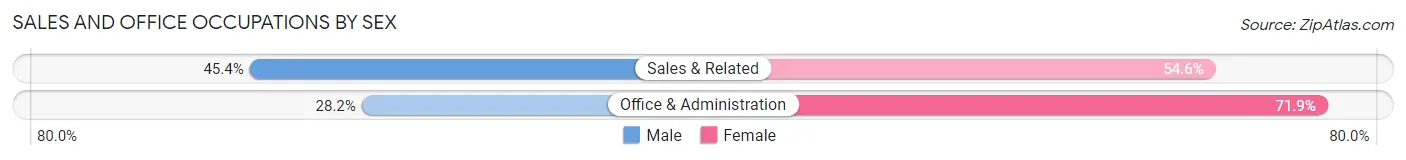
| Occupation | Male | Female |
| Sales & Related | 3,740 (45.4%) | 4,498 (54.6%) |
| Office & Administration | 3,043 (28.1%) | 7,766 (71.9%) |
| Total (Category) | 6,783 (35.6%) | 12,264 (64.4%) |
| Total (Overall) | 43,780 (51.8%) | 40,724 (48.2%) |
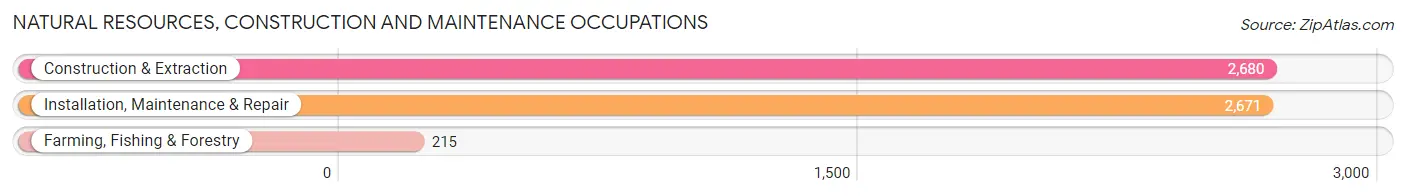
Natural Resources, Construction and Maintenance Occupations
The most common Natural Resources, Construction and Maintenance occupations in Murfreesboro are Construction & Extraction (2,680 | 3.2%), Installation, Maintenance & Repair (2,671 | 3.2%), and Farming, Fishing & Forestry (215 | 0.3%).
Natural Resources, Construction and Maintenance Occupations by Sex
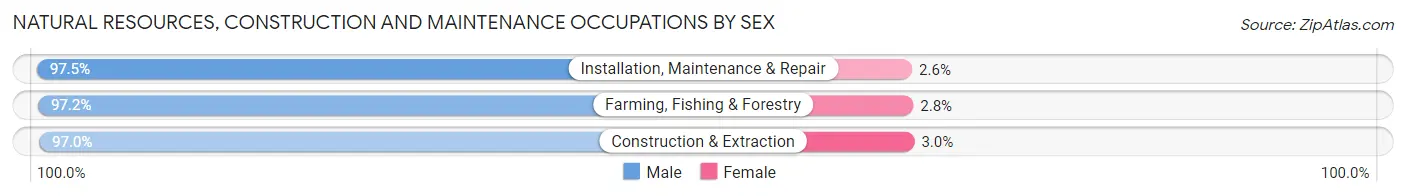
| Occupation | Male | Female |
| Farming, Fishing & Forestry | 209 (97.2%) | 6 (2.8%) |
| Construction & Extraction | 2,599 (97.0%) | 81 (3.0%) |
| Installation, Maintenance & Repair | 2,603 (97.5%) | 68 (2.5%) |
| Total (Category) | 5,411 (97.2%) | 155 (2.8%) |
| Total (Overall) | 43,780 (51.8%) | 40,724 (48.2%) |
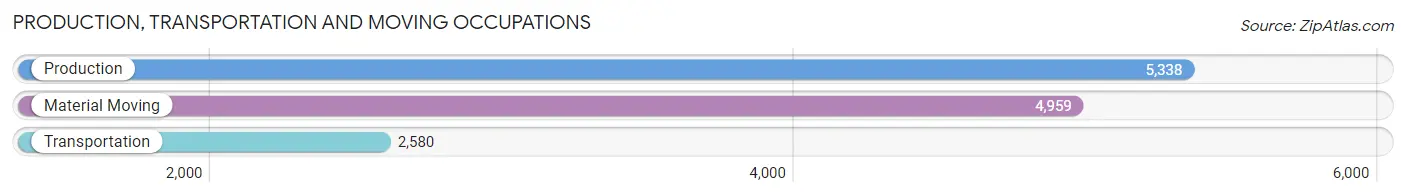
Production, Transportation and Moving Occupations
The most common Production, Transportation and Moving occupations in Murfreesboro are Production (5,338 | 6.3%), Material Moving (4,959 | 5.9%), and Transportation (2,580 | 3.0%).
Production, Transportation and Moving Occupations by Sex
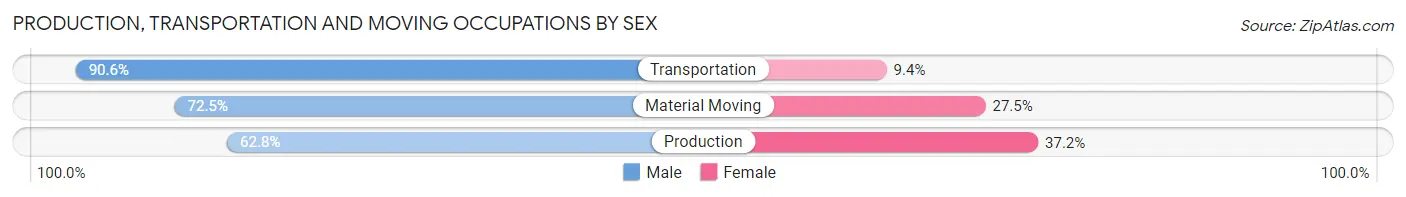
| Occupation | Male | Female |
| Production | 3,354 (62.8%) | 1,984 (37.2%) |
| Transportation | 2,338 (90.6%) | 242 (9.4%) |
| Material Moving | 3,594 (72.5%) | 1,365 (27.5%) |
| Total (Category) | 9,286 (72.1%) | 3,591 (27.9%) |
| Total (Overall) | 43,780 (51.8%) | 40,724 (48.2%) |
Employment Industries by Sex in Murfreesboro
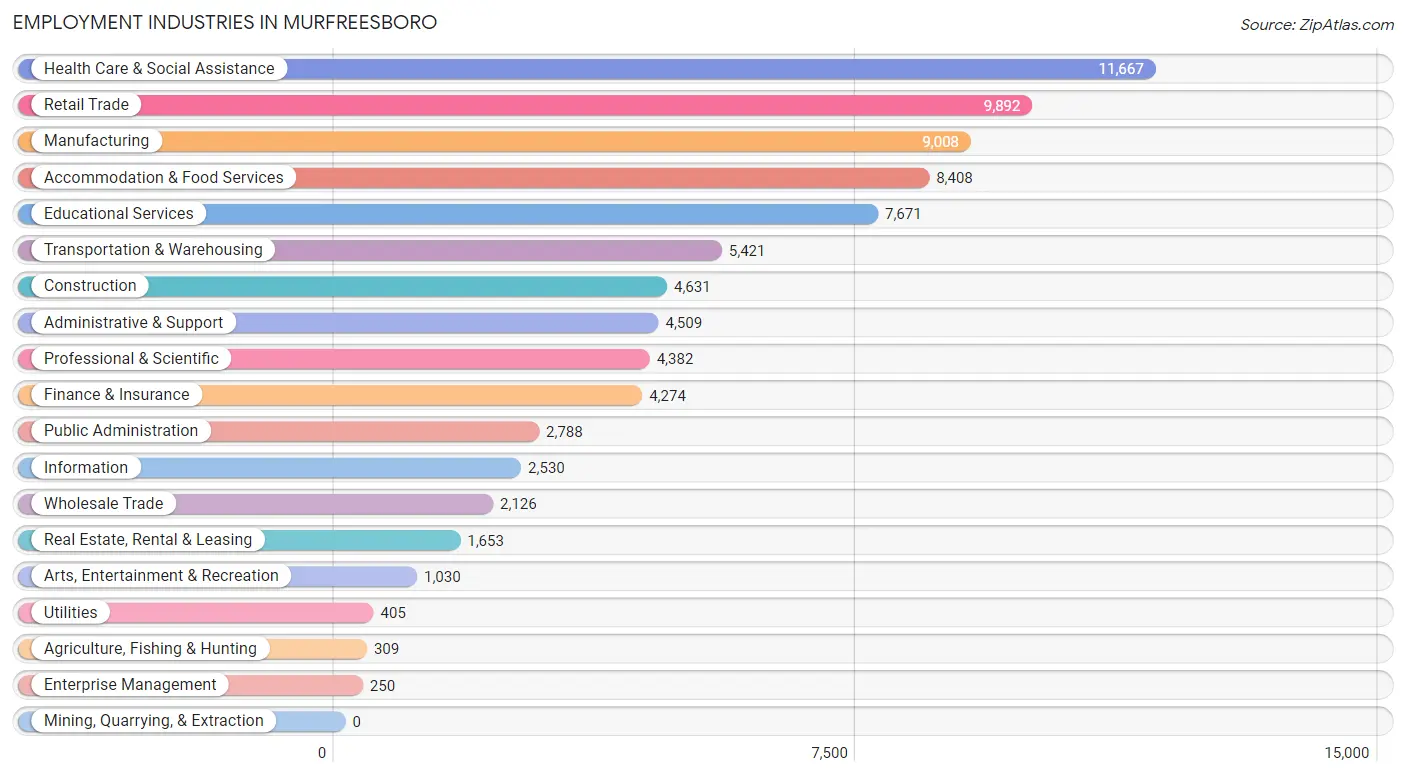
Employment Industries in Murfreesboro
The major employment industries in Murfreesboro include Health Care & Social Assistance (11,667 | 13.8%), Retail Trade (9,892 | 11.7%), Manufacturing (9,008 | 10.7%), Accommodation & Food Services (8,408 | 10.0%), and Educational Services (7,671 | 9.1%).
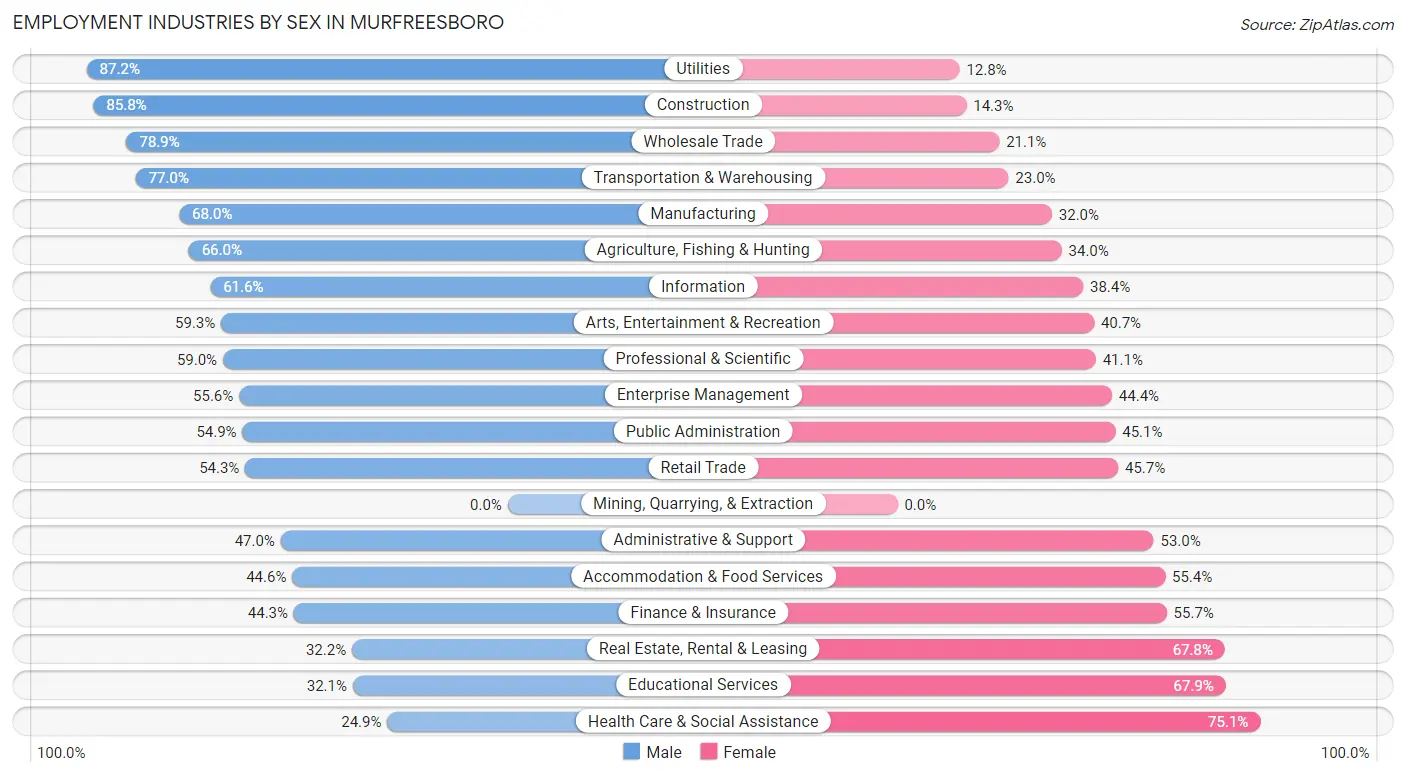
Employment Industries by Sex in Murfreesboro
The Murfreesboro industries that see more men than women are Utilities (87.2%), Construction (85.8%), and Wholesale Trade (78.9%), whereas the industries that tend to have a higher number of women are Health Care & Social Assistance (75.1%), Educational Services (67.9%), and Real Estate, Rental & Leasing (67.8%).
| Industry | Male | Female |
| Agriculture, Fishing & Hunting | 204 (66.0%) | 105 (34.0%) |
| Mining, Quarrying, & Extraction | 0 (0.0%) | 0 (0.0%) |
| Construction | 3,971 (85.8%) | 660 (14.2%) |
| Manufacturing | 6,128 (68.0%) | 2,880 (32.0%) |
| Wholesale Trade | 1,678 (78.9%) | 448 (21.1%) |
| Retail Trade | 5,375 (54.3%) | 4,517 (45.7%) |
| Transportation & Warehousing | 4,176 (77.0%) | 1,245 (23.0%) |
| Utilities | 353 (87.2%) | 52 (12.8%) |
| Information | 1,558 (61.6%) | 972 (38.4%) |
| Finance & Insurance | 1,892 (44.3%) | 2,382 (55.7%) |
| Real Estate, Rental & Leasing | 533 (32.2%) | 1,120 (67.8%) |
| Professional & Scientific | 2,583 (59.0%) | 1,799 (41.0%) |
| Enterprise Management | 139 (55.6%) | 111 (44.4%) |
| Administrative & Support | 2,119 (47.0%) | 2,390 (53.0%) |
| Educational Services | 2,460 (32.1%) | 5,211 (67.9%) |
| Health Care & Social Assistance | 2,908 (24.9%) | 8,759 (75.1%) |
| Arts, Entertainment & Recreation | 611 (59.3%) | 419 (40.7%) |
| Accommodation & Food Services | 3,750 (44.6%) | 4,658 (55.4%) |
| Public Administration | 1,531 (54.9%) | 1,257 (45.1%) |
| Total | 43,780 (51.8%) | 40,724 (48.2%) |
Education in Murfreesboro
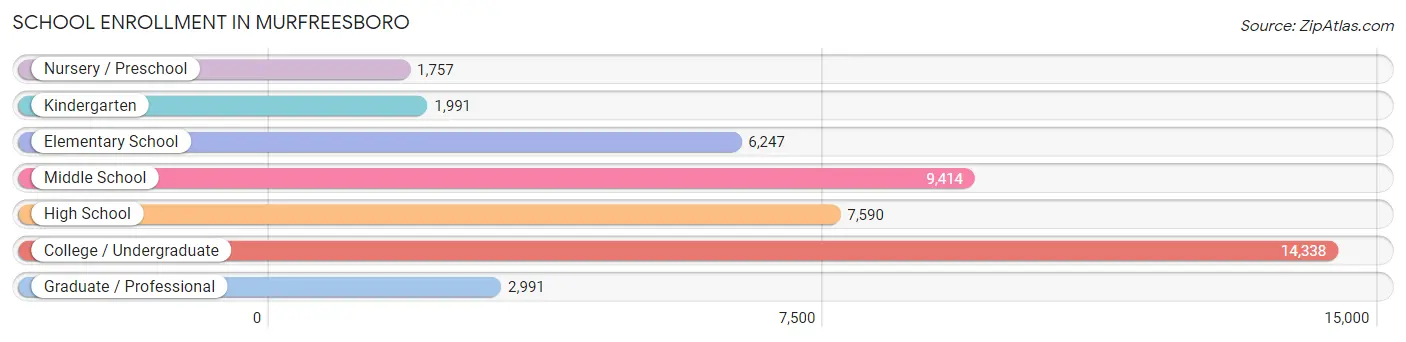
School Enrollment in Murfreesboro
The most common levels of schooling among the 44,328 students in Murfreesboro are college / undergraduate (14,338 | 32.4%), middle school (9,414 | 21.2%), and high school (7,590 | 17.1%).
| School Level | # Students | % Students |
| Nursery / Preschool | 1,757 | 4.0% |
| Kindergarten | 1,991 | 4.5% |
| Elementary School | 6,247 | 14.1% |
| Middle School | 9,414 | 21.2% |
| High School | 7,590 | 17.1% |
| College / Undergraduate | 14,338 | 32.4% |
| Graduate / Professional | 2,991 | 6.8% |
| Total | 44,328 | 100.0% |
School Enrollment by Age by Funding Source in Murfreesboro
Out of a total of 44,328 students who are enrolled in schools in Murfreesboro, 5,940 (13.4%) attend a private institution, while the remaining 38,388 (86.6%) are enrolled in public schools. The age group of 3 to 4 year olds has the highest likelihood of being enrolled in private schools, with 499 (35.2% in the age bracket) enrolled. Conversely, the age group of 18 to 19 year olds has the lowest likelihood of being enrolled in a private school, with 3,865 (92.2% in the age bracket) attending a public institution.
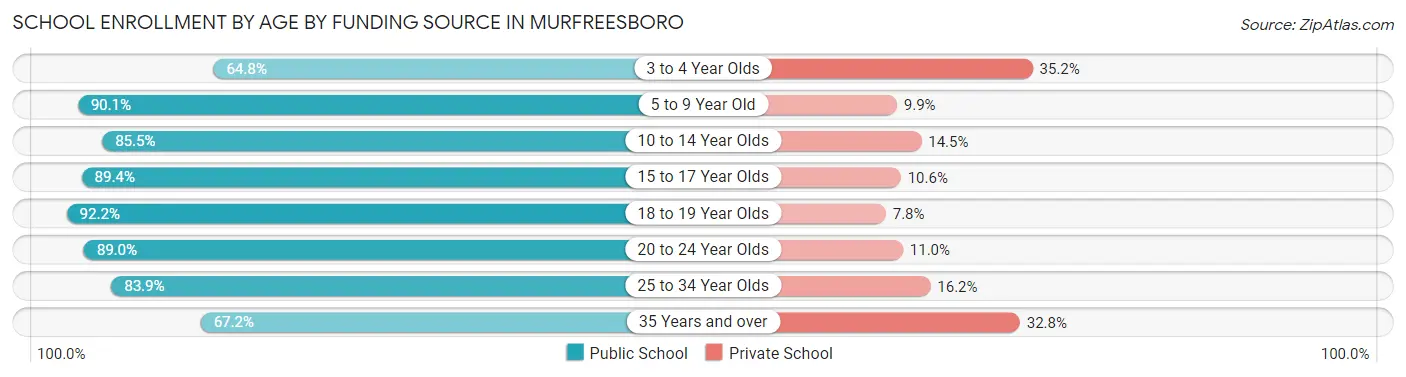
| Age Bracket | Public School | Private School |
| 3 to 4 Year Olds | 919 (64.8%) | 499 (35.2%) |
| 5 to 9 Year Old | 7,160 (90.1%) | 787 (9.9%) |
| 10 to 14 Year Olds | 9,331 (85.5%) | 1,577 (14.5%) |
| 15 to 17 Year Olds | 5,097 (89.4%) | 606 (10.6%) |
| 18 to 19 Year Olds | 3,865 (92.2%) | 329 (7.8%) |
| 20 to 24 Year Olds | 7,960 (89.0%) | 987 (11.0%) |
| 25 to 34 Year Olds | 2,706 (83.9%) | 521 (16.2%) |
| 35 Years and over | 1,333 (67.2%) | 651 (32.8%) |
| Total | 38,388 (86.6%) | 5,940 (13.4%) |
Educational Attainment by Field of Study in Murfreesboro
Business (8,834 | 21.6%), education (4,821 | 11.8%), science & technology (4,498 | 11.0%), arts & humanities (3,509 | 8.6%), and communications (2,607 | 6.4%) are the most common fields of study among 40,887 individuals in Murfreesboro who have obtained a bachelor's degree or higher.
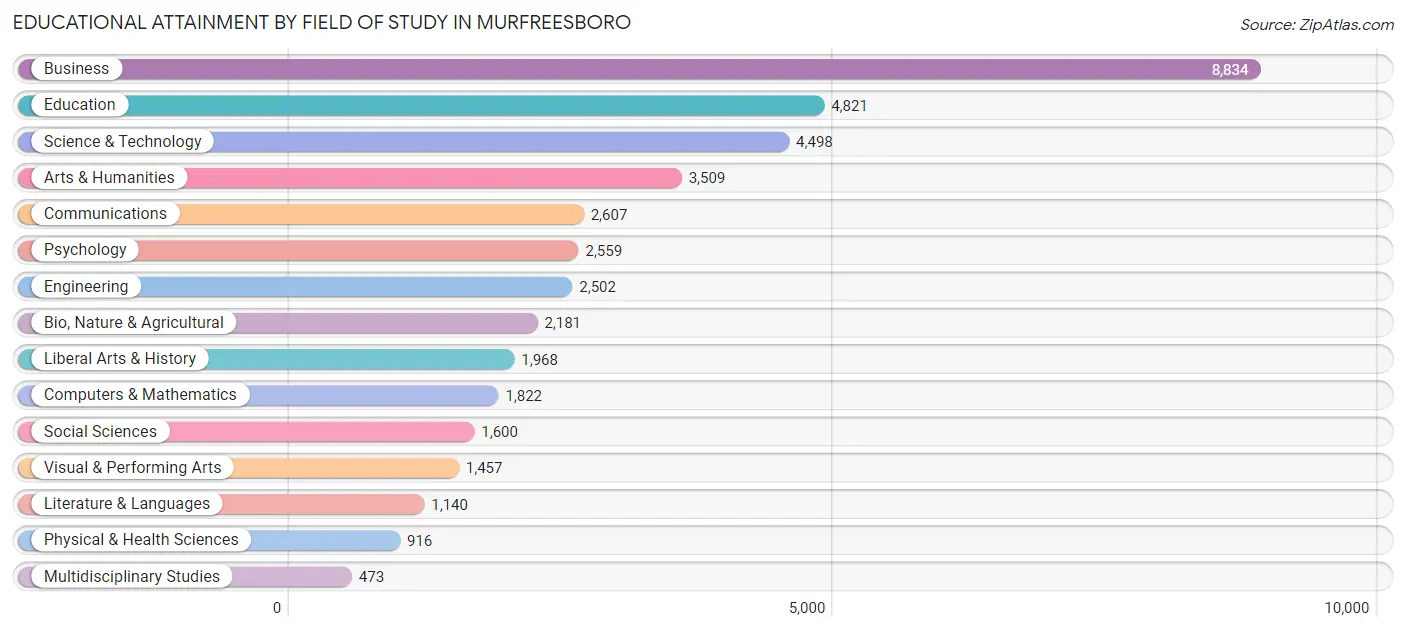
| Field of Study | # Graduates | % Graduates |
| Computers & Mathematics | 1,822 | 4.5% |
| Bio, Nature & Agricultural | 2,181 | 5.3% |
| Physical & Health Sciences | 916 | 2.2% |
| Psychology | 2,559 | 6.3% |
| Social Sciences | 1,600 | 3.9% |
| Engineering | 2,502 | 6.1% |
| Multidisciplinary Studies | 473 | 1.2% |
| Science & Technology | 4,498 | 11.0% |
| Business | 8,834 | 21.6% |
| Education | 4,821 | 11.8% |
| Literature & Languages | 1,140 | 2.8% |
| Liberal Arts & History | 1,968 | 4.8% |
| Visual & Performing Arts | 1,457 | 3.6% |
| Communications | 2,607 | 6.4% |
| Arts & Humanities | 3,509 | 8.6% |
| Total | 40,887 | 100.0% |
Transportation & Commute in Murfreesboro
Vehicle Availability by Sex in Murfreesboro
The most prevalent vehicle ownership categories in Murfreesboro are males with 2 vehicles (19,102, accounting for 44.2%) and females with 2 vehicles (17,147, making up 49.0%).
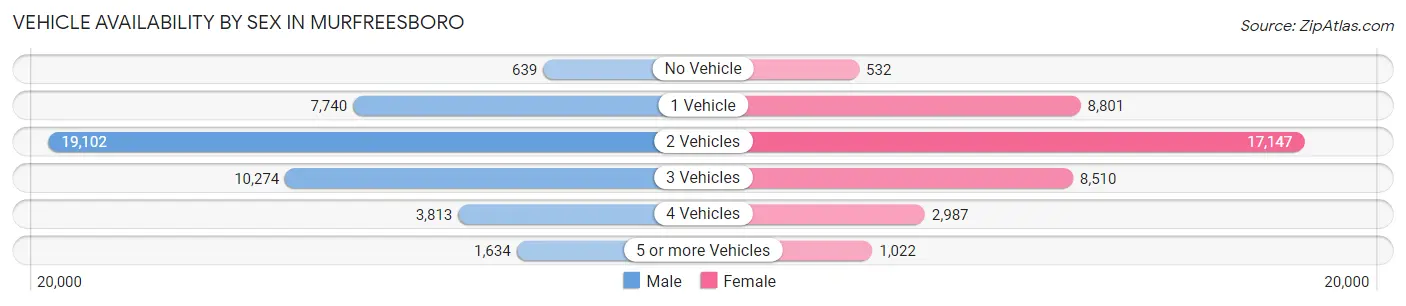
| Vehicles Available | Male | Female |
| No Vehicle | 639 (1.5%) | 532 (1.4%) |
| 1 Vehicle | 7,740 (17.9%) | 8,801 (22.6%) |
| 2 Vehicles | 19,102 (44.2%) | 17,147 (44.0%) |
| 3 Vehicles | 10,274 (23.8%) | 8,510 (21.8%) |
| 4 Vehicles | 3,813 (8.8%) | 2,987 (7.7%) |
| 5 or more Vehicles | 1,634 (3.8%) | 1,022 (2.6%) |
| Total | 43,202 (100.0%) | 38,999 (100.0%) |
Commute Time in Murfreesboro
The most frequently occuring commute durations in Murfreesboro are 15 to 19 minutes (12,156 commuters, 16.8%), 10 to 14 minutes (10,100 commuters, 14.0%), and 20 to 24 minutes (9,365 commuters, 13.0%).
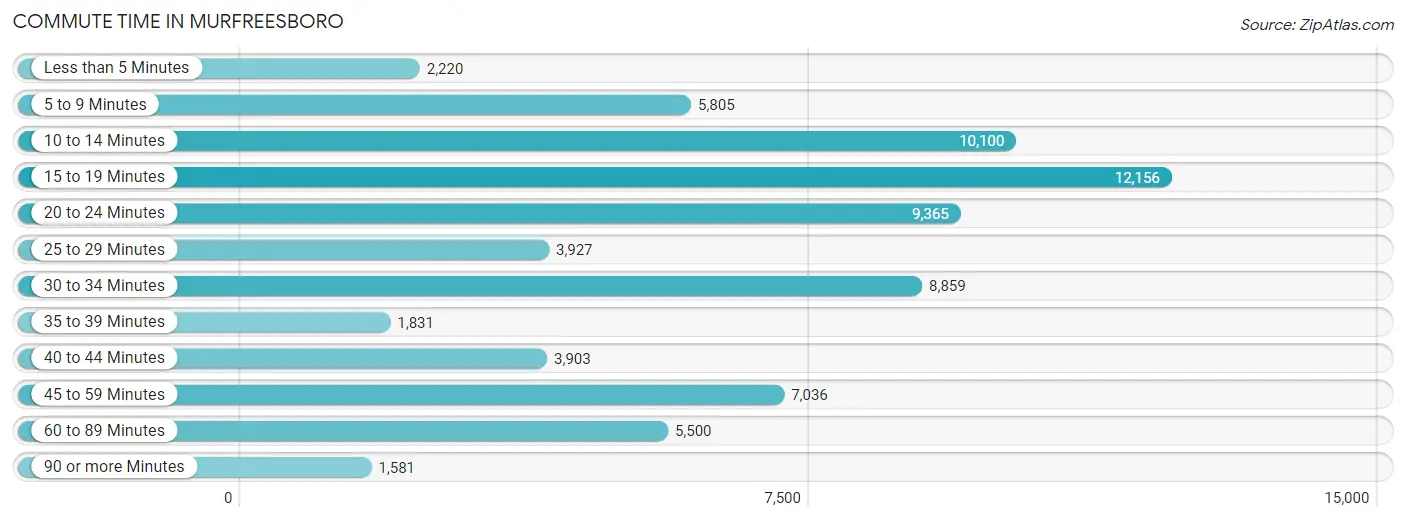
| Commute Time | # Commuters | % Commuters |
| Less than 5 Minutes | 2,220 | 3.1% |
| 5 to 9 Minutes | 5,805 | 8.0% |
| 10 to 14 Minutes | 10,100 | 14.0% |
| 15 to 19 Minutes | 12,156 | 16.8% |
| 20 to 24 Minutes | 9,365 | 13.0% |
| 25 to 29 Minutes | 3,927 | 5.4% |
| 30 to 34 Minutes | 8,859 | 12.3% |
| 35 to 39 Minutes | 1,831 | 2.5% |
| 40 to 44 Minutes | 3,903 | 5.4% |
| 45 to 59 Minutes | 7,036 | 9.7% |
| 60 to 89 Minutes | 5,500 | 7.6% |
| 90 or more Minutes | 1,581 | 2.2% |
Commute Time by Sex in Murfreesboro
The most common commute times in Murfreesboro are 15 to 19 minutes (6,703 commuters, 17.3%) for males and 15 to 19 minutes (5,453 commuters, 16.2%) for females.
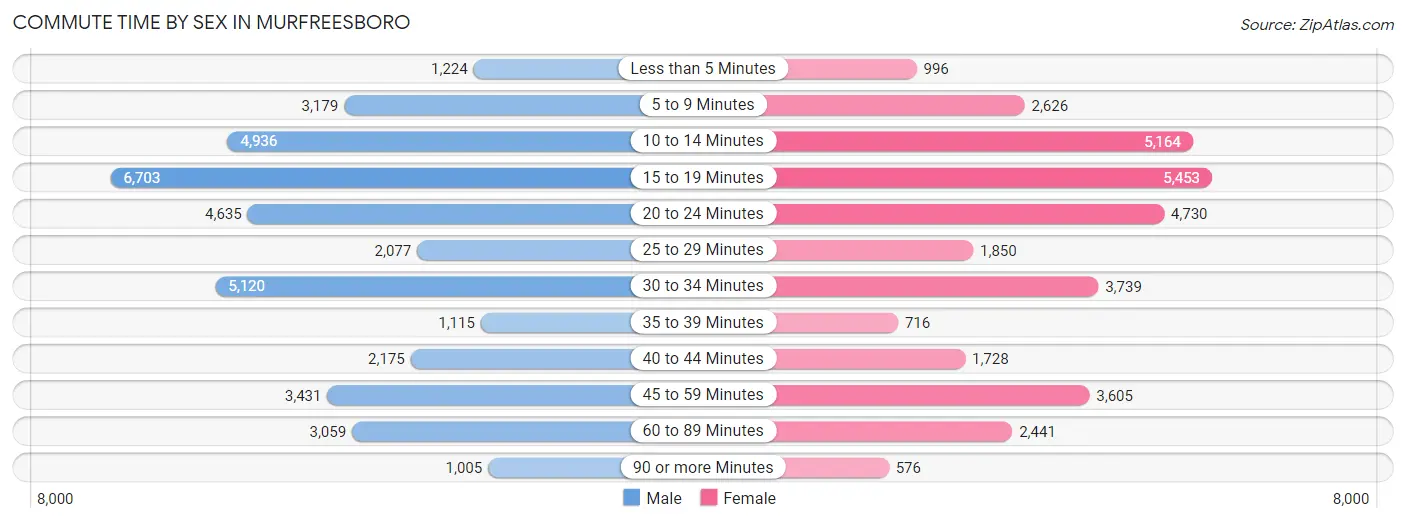
| Commute Time | Male | Female |
| Less than 5 Minutes | 1,224 (3.2%) | 996 (3.0%) |
| 5 to 9 Minutes | 3,179 (8.2%) | 2,626 (7.8%) |
| 10 to 14 Minutes | 4,936 (12.8%) | 5,164 (15.4%) |
| 15 to 19 Minutes | 6,703 (17.3%) | 5,453 (16.2%) |
| 20 to 24 Minutes | 4,635 (12.0%) | 4,730 (14.1%) |
| 25 to 29 Minutes | 2,077 (5.4%) | 1,850 (5.5%) |
| 30 to 34 Minutes | 5,120 (13.2%) | 3,739 (11.1%) |
| 35 to 39 Minutes | 1,115 (2.9%) | 716 (2.1%) |
| 40 to 44 Minutes | 2,175 (5.6%) | 1,728 (5.1%) |
| 45 to 59 Minutes | 3,431 (8.9%) | 3,605 (10.7%) |
| 60 to 89 Minutes | 3,059 (7.9%) | 2,441 (7.3%) |
| 90 or more Minutes | 1,005 (2.6%) | 576 (1.7%) |
Time of Departure to Work by Sex in Murfreesboro
The most frequent times of departure to work in Murfreesboro are 7:00 AM to 7:29 AM (4,566, 11.8%) for males and 7:00 AM to 7:29 AM (5,639, 16.8%) for females.
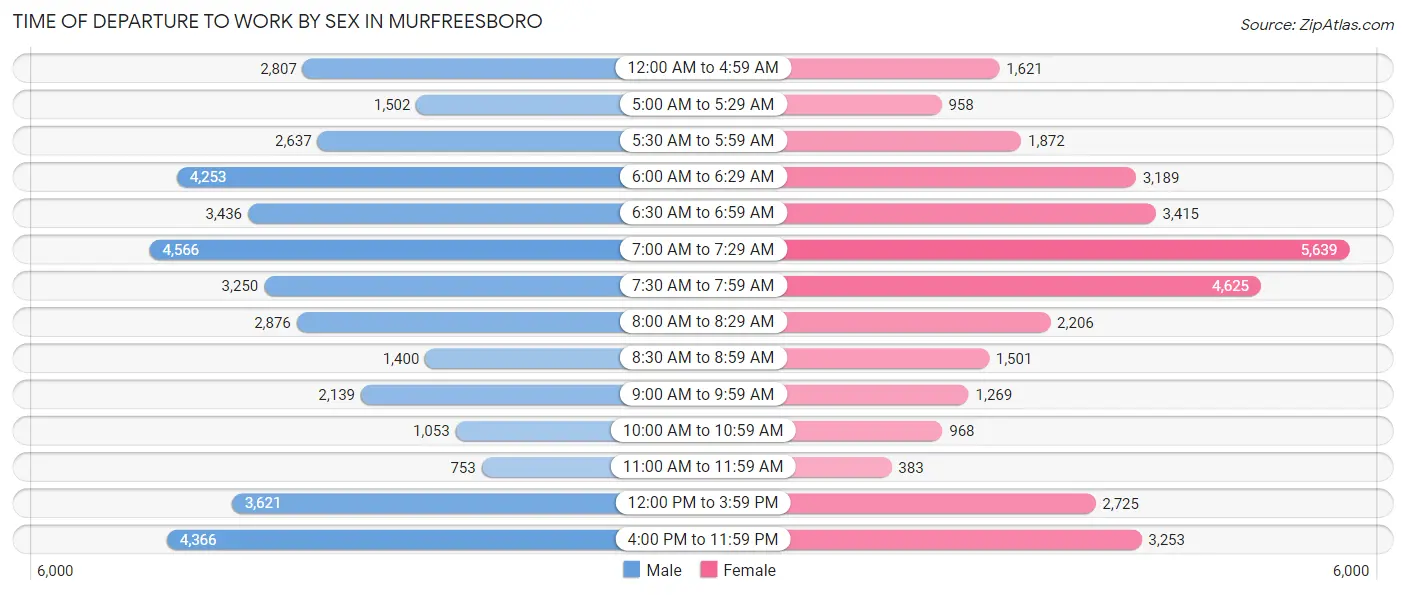
| Time of Departure | Male | Female |
| 12:00 AM to 4:59 AM | 2,807 (7.3%) | 1,621 (4.8%) |
| 5:00 AM to 5:29 AM | 1,502 (3.9%) | 958 (2.9%) |
| 5:30 AM to 5:59 AM | 2,637 (6.8%) | 1,872 (5.6%) |
| 6:00 AM to 6:29 AM | 4,253 (11.0%) | 3,189 (9.5%) |
| 6:30 AM to 6:59 AM | 3,436 (8.9%) | 3,415 (10.2%) |
| 7:00 AM to 7:29 AM | 4,566 (11.8%) | 5,639 (16.8%) |
| 7:30 AM to 7:59 AM | 3,250 (8.4%) | 4,625 (13.8%) |
| 8:00 AM to 8:29 AM | 2,876 (7.4%) | 2,206 (6.6%) |
| 8:30 AM to 8:59 AM | 1,400 (3.6%) | 1,501 (4.5%) |
| 9:00 AM to 9:59 AM | 2,139 (5.5%) | 1,269 (3.8%) |
| 10:00 AM to 10:59 AM | 1,053 (2.7%) | 968 (2.9%) |
| 11:00 AM to 11:59 AM | 753 (1.9%) | 383 (1.1%) |
| 12:00 PM to 3:59 PM | 3,621 (9.4%) | 2,725 (8.1%) |
| 4:00 PM to 11:59 PM | 4,366 (11.3%) | 3,253 (9.7%) |
| Total | 38,659 (100.0%) | 33,624 (100.0%) |
Housing Occupancy in Murfreesboro
Occupancy by Ownership in Murfreesboro
Of the total 57,399 dwellings in Murfreesboro, owner-occupied units account for 30,501 (53.1%), while renter-occupied units make up 26,898 (46.9%).
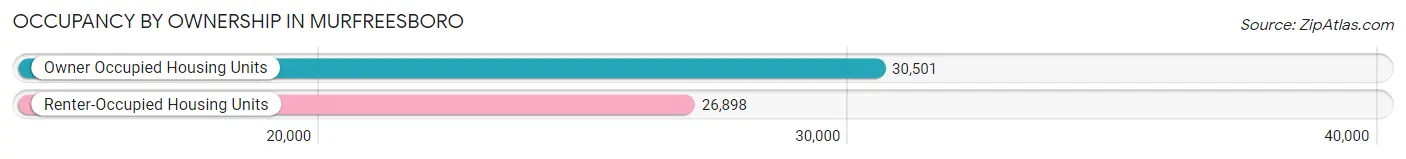
| Occupancy | # Housing Units | % Housing Units |
| Owner Occupied Housing Units | 30,501 | 53.1% |
| Renter-Occupied Housing Units | 26,898 | 46.9% |
| Total Occupied Housing Units | 57,399 | 100.0% |
Occupancy by Household Size in Murfreesboro
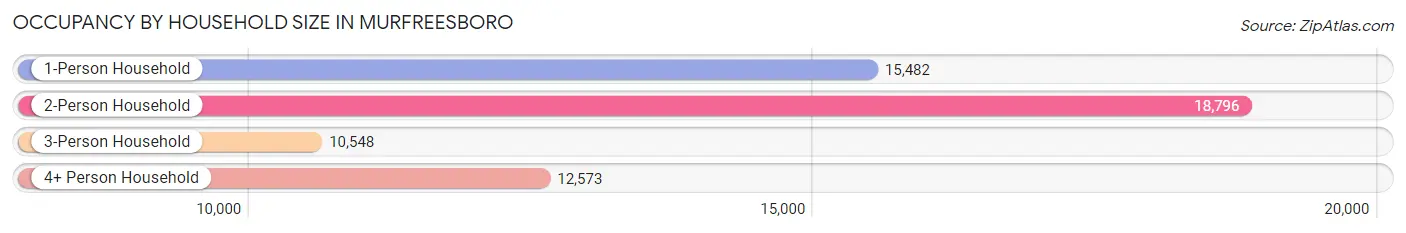
| Household Size | # Housing Units | % Housing Units |
| 1-Person Household | 15,482 | 27.0% |
| 2-Person Household | 18,796 | 32.8% |
| 3-Person Household | 10,548 | 18.4% |
| 4+ Person Household | 12,573 | 21.9% |
| Total Housing Units | 57,399 | 100.0% |
Occupancy by Ownership by Household Size in Murfreesboro
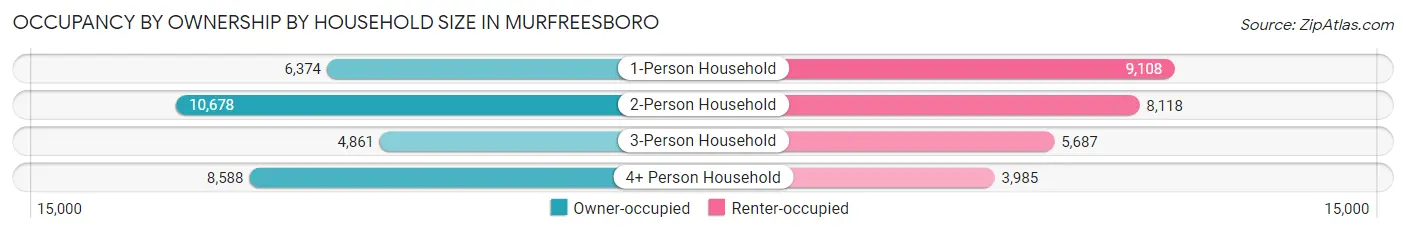
| Household Size | Owner-occupied | Renter-occupied |
| 1-Person Household | 6,374 (41.2%) | 9,108 (58.8%) |
| 2-Person Household | 10,678 (56.8%) | 8,118 (43.2%) |
| 3-Person Household | 4,861 (46.1%) | 5,687 (53.9%) |
| 4+ Person Household | 8,588 (68.3%) | 3,985 (31.7%) |
| Total Housing Units | 30,501 (53.1%) | 26,898 (46.9%) |
Occupancy by Educational Attainment in Murfreesboro
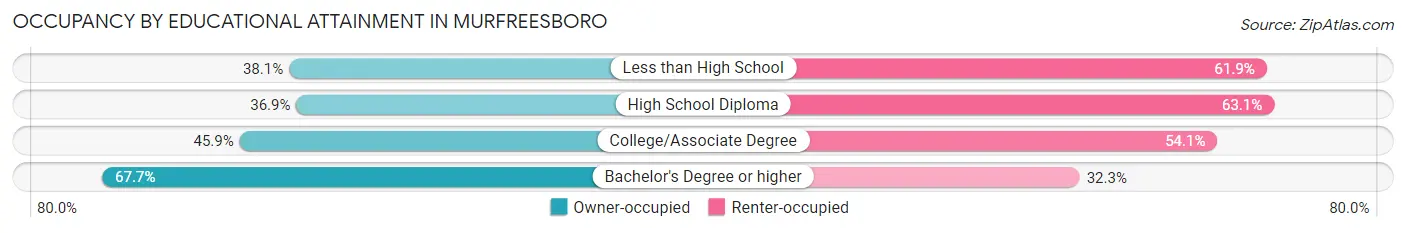
| Household Size | Owner-occupied | Renter-occupied |
| Less than High School | 967 (38.1%) | 1,573 (61.9%) |
| High School Diploma | 3,962 (36.9%) | 6,776 (63.1%) |
| College/Associate Degree | 9,060 (45.9%) | 10,676 (54.1%) |
| Bachelor's Degree or higher | 16,512 (67.7%) | 7,873 (32.3%) |
Occupancy by Age of Householder in Murfreesboro
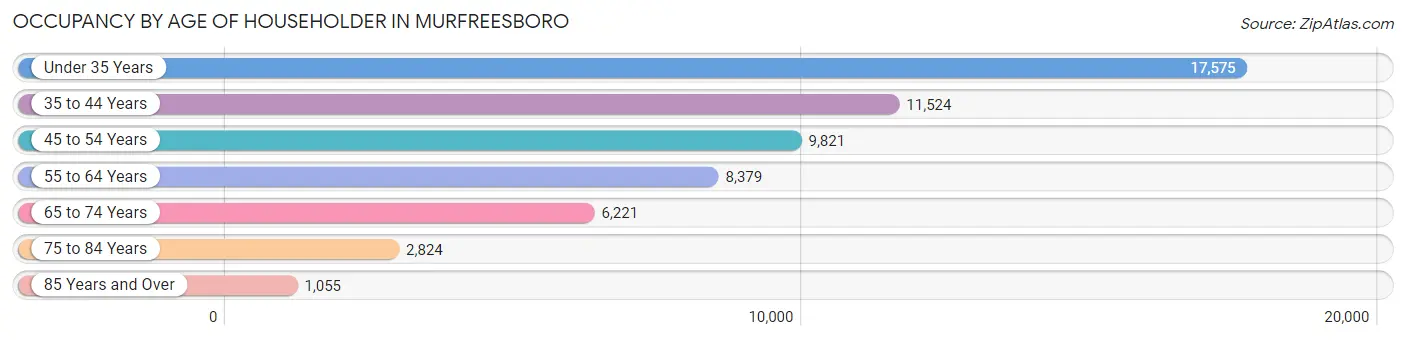
| Age Bracket | # Households | % Households |
| Under 35 Years | 17,575 | 30.6% |
| 35 to 44 Years | 11,524 | 20.1% |
| 45 to 54 Years | 9,821 | 17.1% |
| 55 to 64 Years | 8,379 | 14.6% |
| 65 to 74 Years | 6,221 | 10.8% |
| 75 to 84 Years | 2,824 | 4.9% |
| 85 Years and Over | 1,055 | 1.8% |
| Total | 57,399 | 100.0% |
Housing Finances in Murfreesboro
Median Income by Occupancy in Murfreesboro
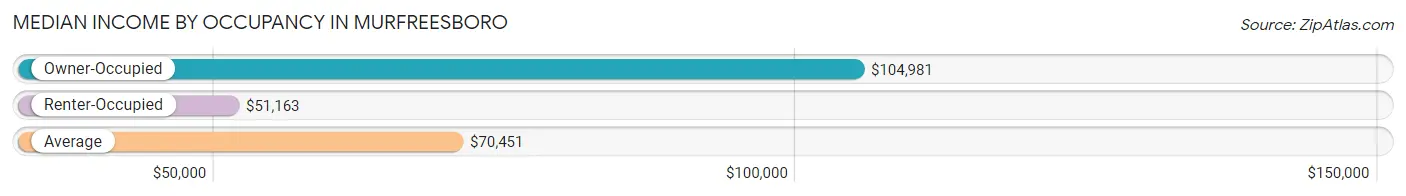
| Occupancy Type | # Households | Median Income |
| Owner-Occupied | 30,501 (53.1%) | $104,981 |
| Renter-Occupied | 26,898 (46.9%) | $51,163 |
| Average | 57,399 (100.0%) | $70,451 |
Occupancy by Householder Income Bracket in Murfreesboro
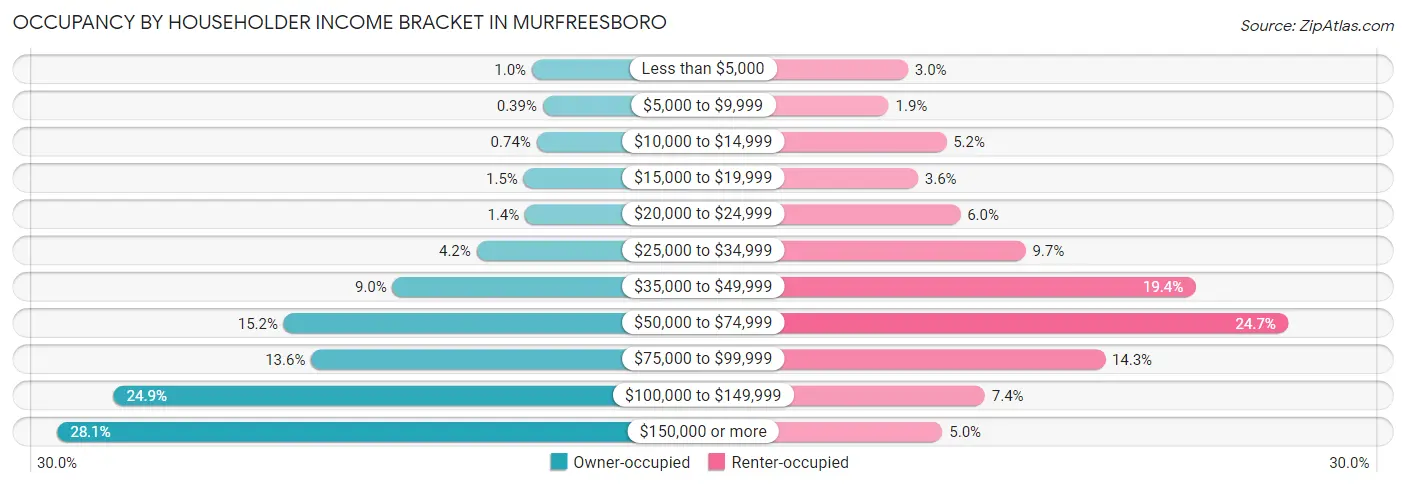
| Income Bracket | Owner-occupied | Renter-occupied |
| Less than $5,000 | 307 (1.0%) | 803 (3.0%) |
| $5,000 to $9,999 | 119 (0.4%) | 509 (1.9%) |
| $10,000 to $14,999 | 226 (0.7%) | 1,394 (5.2%) |
| $15,000 to $19,999 | 451 (1.5%) | 957 (3.6%) |
| $20,000 to $24,999 | 428 (1.4%) | 1,609 (6.0%) |
| $25,000 to $34,999 | 1,271 (4.2%) | 2,611 (9.7%) |
| $35,000 to $49,999 | 2,735 (9.0%) | 5,218 (19.4%) |
| $50,000 to $74,999 | 4,634 (15.2%) | 6,642 (24.7%) |
| $75,000 to $99,999 | 4,154 (13.6%) | 3,834 (14.2%) |
| $100,000 to $149,999 | 7,597 (24.9%) | 1,988 (7.4%) |
| $150,000 or more | 8,579 (28.1%) | 1,333 (5.0%) |
| Total | 30,501 (100.0%) | 26,898 (100.0%) |
Monthly Housing Cost Tiers in Murfreesboro
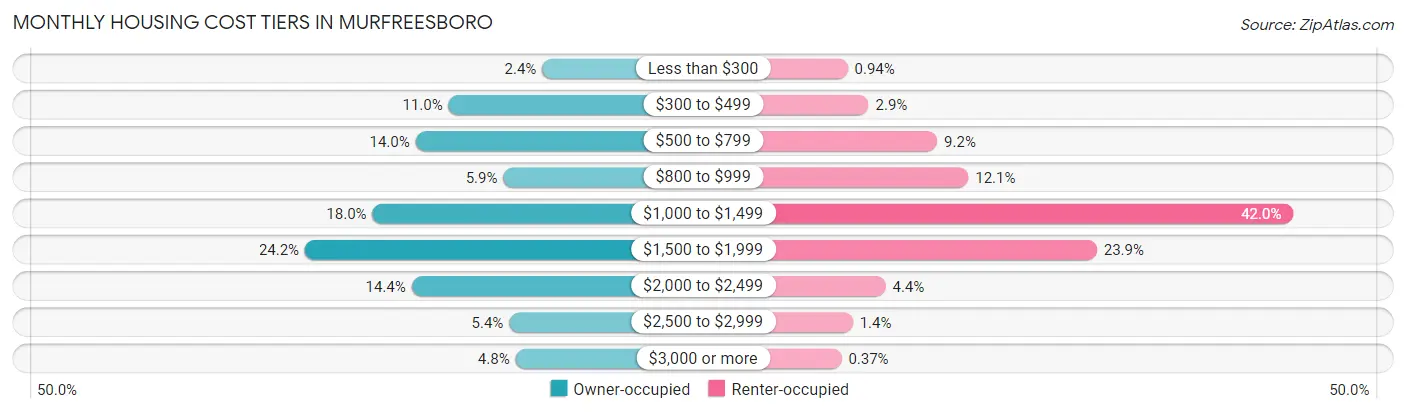
| Monthly Cost | Owner-occupied | Renter-occupied |
| Less than $300 | 717 (2.4%) | 254 (0.9%) |
| $300 to $499 | 3,345 (11.0%) | 772 (2.9%) |
| $500 to $799 | 4,272 (14.0%) | 2,469 (9.2%) |
| $800 to $999 | 1,808 (5.9%) | 3,242 (12.0%) |
| $1,000 to $1,499 | 5,485 (18.0%) | 11,287 (42.0%) |
| $1,500 to $1,999 | 7,379 (24.2%) | 6,422 (23.9%) |
| $2,000 to $2,499 | 4,385 (14.4%) | 1,191 (4.4%) |
| $2,500 to $2,999 | 1,643 (5.4%) | 379 (1.4%) |
| $3,000 or more | 1,467 (4.8%) | 99 (0.4%) |
| Total | 30,501 (100.0%) | 26,898 (100.0%) |
Physical Housing Characteristics in Murfreesboro
Housing Structures in Murfreesboro
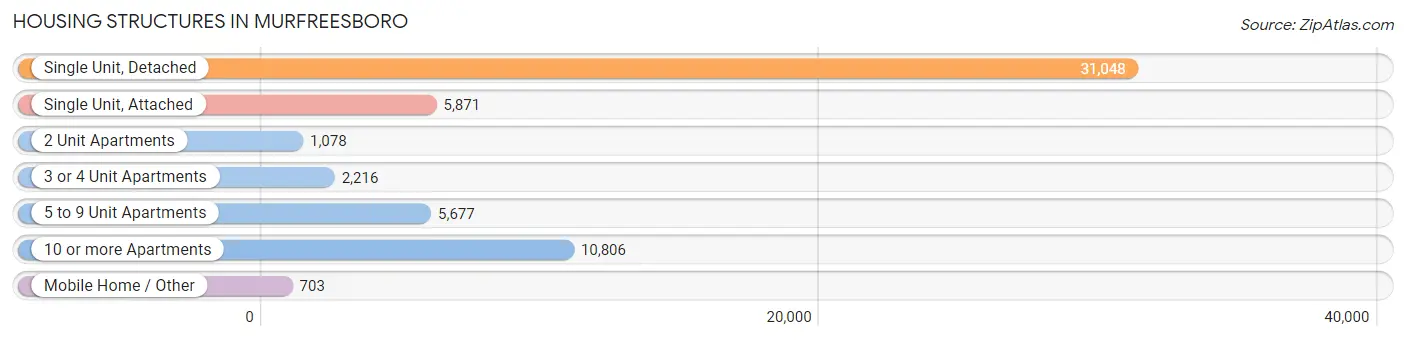
| Structure Type | # Housing Units | % Housing Units |
| Single Unit, Detached | 31,048 | 54.1% |
| Single Unit, Attached | 5,871 | 10.2% |
| 2 Unit Apartments | 1,078 | 1.9% |
| 3 or 4 Unit Apartments | 2,216 | 3.9% |
| 5 to 9 Unit Apartments | 5,677 | 9.9% |
| 10 or more Apartments | 10,806 | 18.8% |
| Mobile Home / Other | 703 | 1.2% |
| Total | 57,399 | 100.0% |
Housing Structures by Occupancy in Murfreesboro
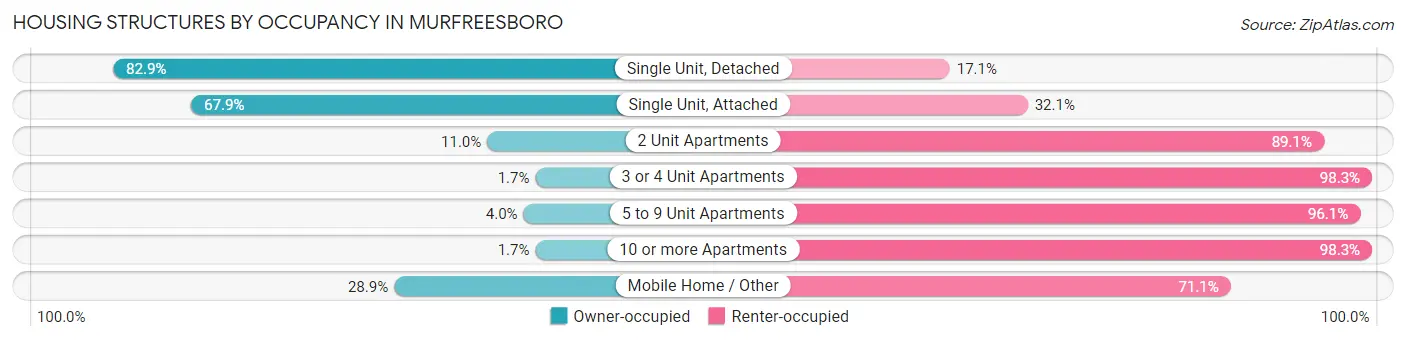
| Structure Type | Owner-occupied | Renter-occupied |
| Single Unit, Detached | 25,751 (82.9%) | 5,297 (17.1%) |
| Single Unit, Attached | 3,988 (67.9%) | 1,883 (32.1%) |
| 2 Unit Apartments | 118 (11.0%) | 960 (89.0%) |
| 3 or 4 Unit Apartments | 37 (1.7%) | 2,179 (98.3%) |
| 5 to 9 Unit Apartments | 224 (4.0%) | 5,453 (96.1%) |
| 10 or more Apartments | 180 (1.7%) | 10,626 (98.3%) |
| Mobile Home / Other | 203 (28.9%) | 500 (71.1%) |
| Total | 30,501 (53.1%) | 26,898 (46.9%) |
Housing Structures by Number of Rooms in Murfreesboro
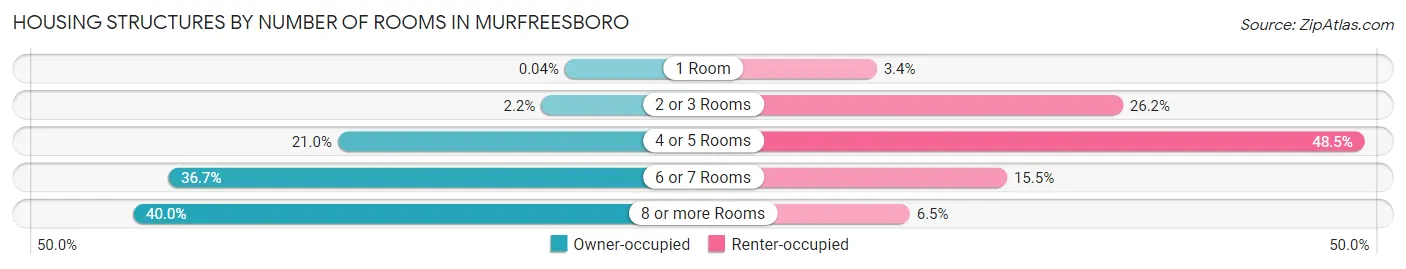
| Number of Rooms | Owner-occupied | Renter-occupied |
| 1 Room | 12 (0.0%) | 915 (3.4%) |
| 2 or 3 Rooms | 680 (2.2%) | 7,039 (26.2%) |
| 4 or 5 Rooms | 6,416 (21.0%) | 13,050 (48.5%) |
| 6 or 7 Rooms | 11,203 (36.7%) | 4,157 (15.4%) |
| 8 or more Rooms | 12,190 (40.0%) | 1,737 (6.5%) |
| Total | 30,501 (100.0%) | 26,898 (100.0%) |
Housing Structure by Heating Type in Murfreesboro
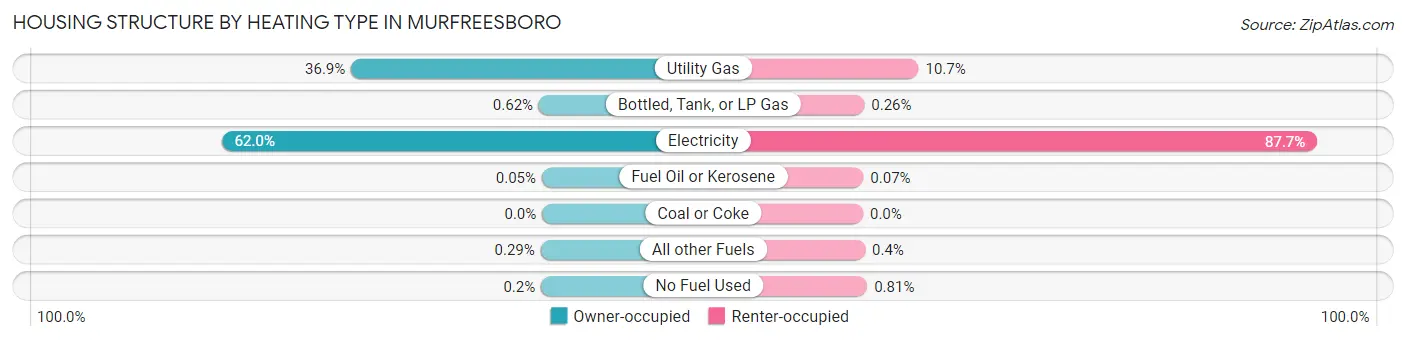
| Heating Type | Owner-occupied | Renter-occupied |
| Utility Gas | 11,254 (36.9%) | 2,886 (10.7%) |
| Bottled, Tank, or LP Gas | 189 (0.6%) | 70 (0.3%) |
| Electricity | 18,894 (62.0%) | 23,599 (87.7%) |
| Fuel Oil or Kerosene | 14 (0.1%) | 18 (0.1%) |
| Coal or Coke | 0 (0.0%) | 0 (0.0%) |
| All other Fuels | 88 (0.3%) | 107 (0.4%) |
| No Fuel Used | 62 (0.2%) | 218 (0.8%) |
| Total | 30,501 (100.0%) | 26,898 (100.0%) |
Household Vehicle Usage in Murfreesboro
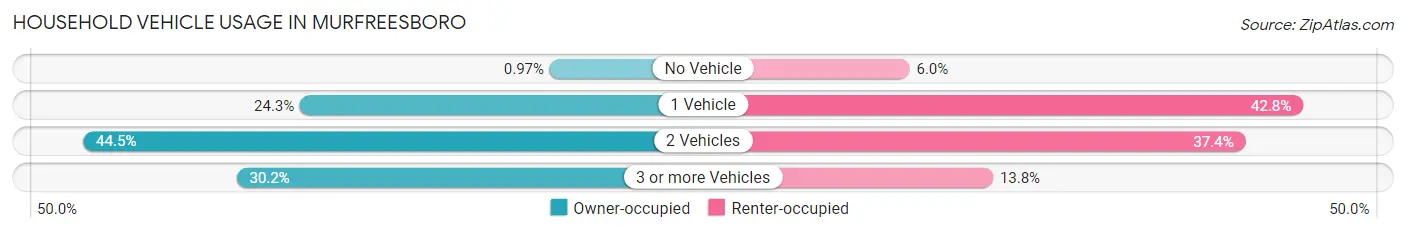
| Vehicles per Household | Owner-occupied | Renter-occupied |
| No Vehicle | 297 (1.0%) | 1,621 (6.0%) |
| 1 Vehicle | 7,405 (24.3%) | 11,504 (42.8%) |
| 2 Vehicles | 13,583 (44.5%) | 10,057 (37.4%) |
| 3 or more Vehicles | 9,216 (30.2%) | 3,716 (13.8%) |
| Total | 30,501 (100.0%) | 26,898 (100.0%) |
Real Estate & Mortgages in Murfreesboro
Real Estate and Mortgage Overview in Murfreesboro
| Characteristic | Without Mortgage | With Mortgage |
| Housing Units | 8,638 | 21,863 |
| Median Property Value | $306,100 | $333,900 |
| Median Household Income | $67,593 | $6,930 |
| Monthly Housing Costs | $519 | $1,458 |
| Real Estate Taxes | $2,121 | $727 |
Property Value by Mortgage Status in Murfreesboro
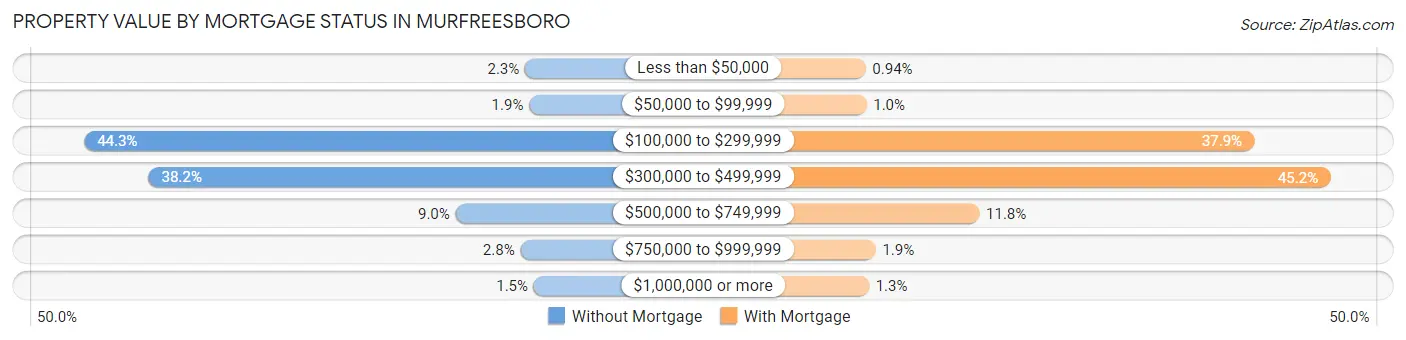
| Property Value | Without Mortgage | With Mortgage |
| Less than $50,000 | 201 (2.3%) | 205 (0.9%) |
| $50,000 to $99,999 | 168 (1.9%) | 222 (1.0%) |
| $100,000 to $299,999 | 3,828 (44.3%) | 8,294 (37.9%) |
| $300,000 to $499,999 | 3,299 (38.2%) | 9,878 (45.2%) |
| $500,000 to $749,999 | 773 (8.9%) | 2,574 (11.8%) |
| $750,000 to $999,999 | 239 (2.8%) | 416 (1.9%) |
| $1,000,000 or more | 130 (1.5%) | 274 (1.3%) |
| Total | 8,638 (100.0%) | 21,863 (100.0%) |
Household Income by Mortgage Status in Murfreesboro
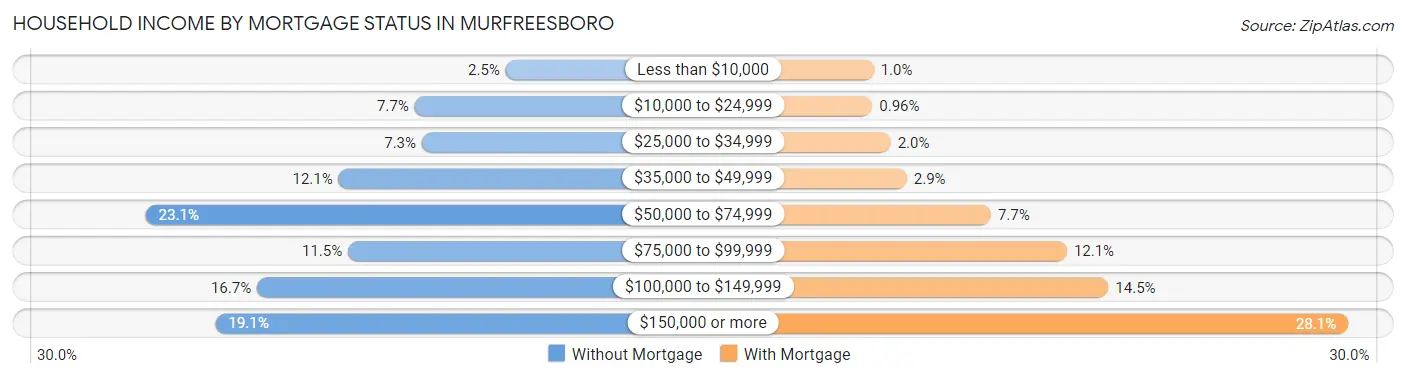
| Household Income | Without Mortgage | With Mortgage |
| Less than $10,000 | 217 (2.5%) | 227 (1.0%) |
| $10,000 to $24,999 | 666 (7.7%) | 209 (1.0%) |
| $25,000 to $34,999 | 631 (7.3%) | 439 (2.0%) |
| $35,000 to $49,999 | 1,042 (12.1%) | 640 (2.9%) |
| $50,000 to $74,999 | 1,994 (23.1%) | 1,693 (7.7%) |
| $75,000 to $99,999 | 995 (11.5%) | 2,640 (12.1%) |
| $100,000 to $149,999 | 1,444 (16.7%) | 3,159 (14.4%) |
| $150,000 or more | 1,649 (19.1%) | 6,153 (28.1%) |
| Total | 8,638 (100.0%) | 21,863 (100.0%) |
Property Value to Household Income Ratio in Murfreesboro
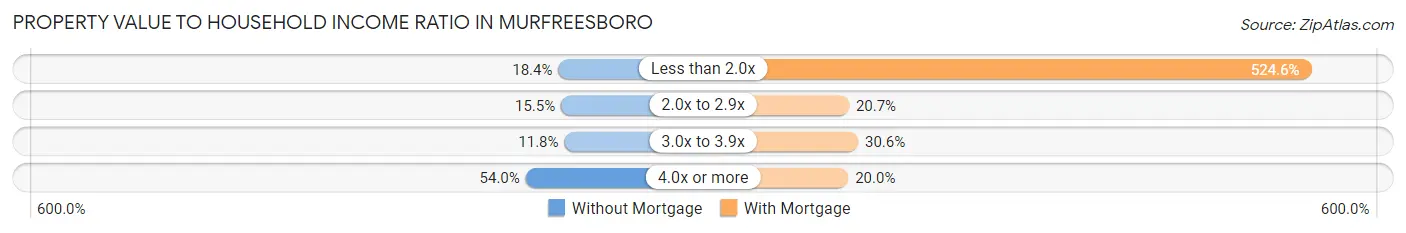
| Value-to-Income Ratio | Without Mortgage | With Mortgage |
| Less than 2.0x | 1,591 (18.4%) | 114,696 (524.6%) |
| 2.0x to 2.9x | 1,337 (15.5%) | 4,535 (20.7%) |
| 3.0x to 3.9x | 1,021 (11.8%) | 6,696 (30.6%) |
| 4.0x or more | 4,668 (54.0%) | 4,364 (20.0%) |
| Total | 8,638 (100.0%) | 21,863 (100.0%) |
Real Estate Taxes by Mortgage Status in Murfreesboro
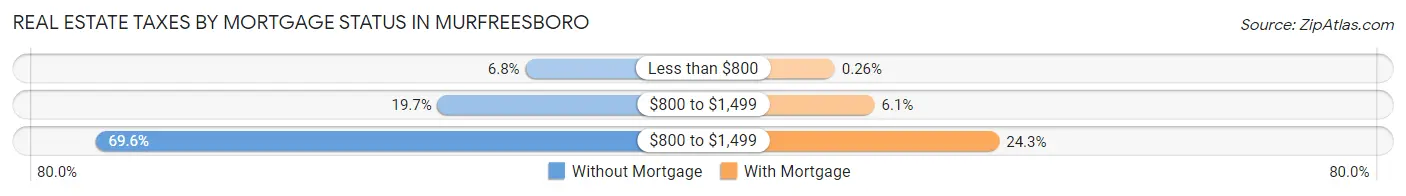
| Property Taxes | Without Mortgage | With Mortgage |
| Less than $800 | 589 (6.8%) | 57 (0.3%) |
| $800 to $1,499 | 1,698 (19.7%) | 1,326 (6.1%) |
| $800 to $1,499 | 6,013 (69.6%) | 5,311 (24.3%) |
| Total | 8,638 (100.0%) | 21,863 (100.0%) |
Health & Disability in Murfreesboro
Health Insurance Coverage by Age in Murfreesboro
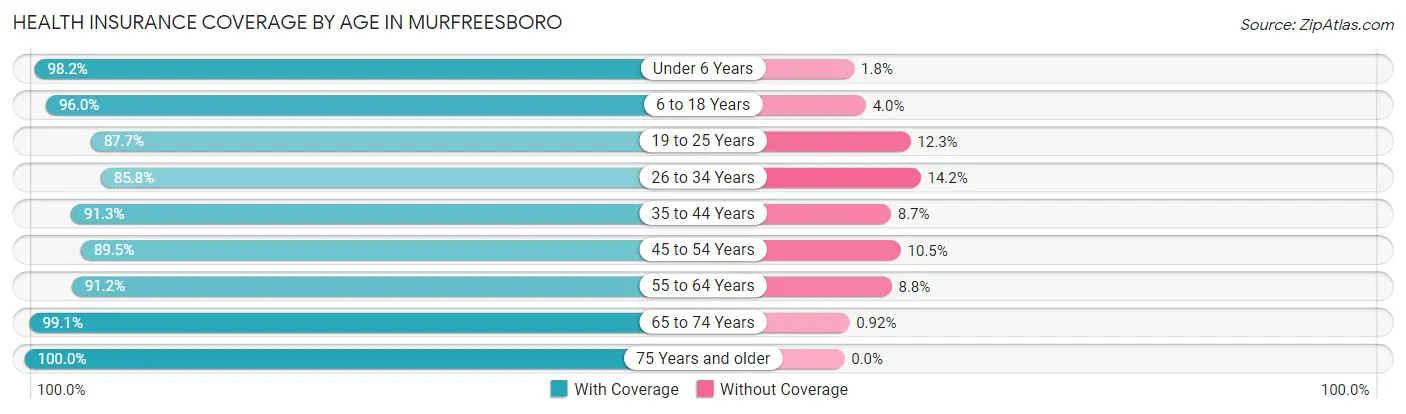
| Age Bracket | With Coverage | Without Coverage |
| Under 6 Years | 10,755 (98.2%) | 202 (1.8%) |
| 6 to 18 Years | 25,186 (96.0%) | 1,048 (4.0%) |
| 19 to 25 Years | 21,447 (87.7%) | 3,015 (12.3%) |
| 26 to 34 Years | 19,258 (85.8%) | 3,192 (14.2%) |
| 35 to 44 Years | 18,818 (91.3%) | 1,786 (8.7%) |
| 45 to 54 Years | 15,935 (89.5%) | 1,870 (10.5%) |
| 55 to 64 Years | 12,613 (91.2%) | 1,219 (8.8%) |
| 65 to 74 Years | 9,429 (99.1%) | 88 (0.9%) |
| 75 Years and older | 6,193 (100.0%) | 0 (0.0%) |
| Total | 139,634 (91.8%) | 12,420 (8.2%) |
Health Insurance Coverage by Citizenship Status in Murfreesboro
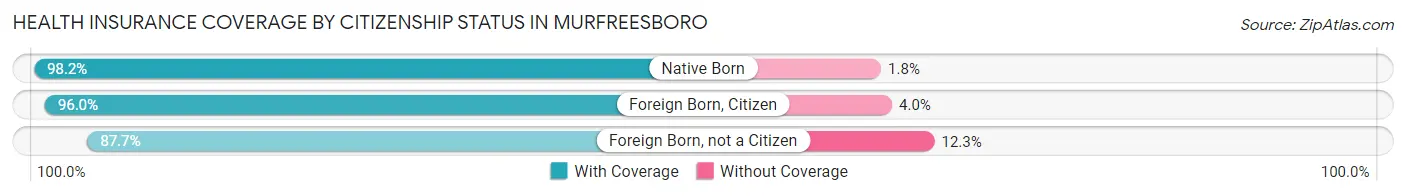
| Citizenship Status | With Coverage | Without Coverage |
| Native Born | 10,755 (98.2%) | 202 (1.8%) |
| Foreign Born, Citizen | 25,186 (96.0%) | 1,048 (4.0%) |
| Foreign Born, not a Citizen | 21,447 (87.7%) | 3,015 (12.3%) |
Health Insurance Coverage by Household Income in Murfreesboro
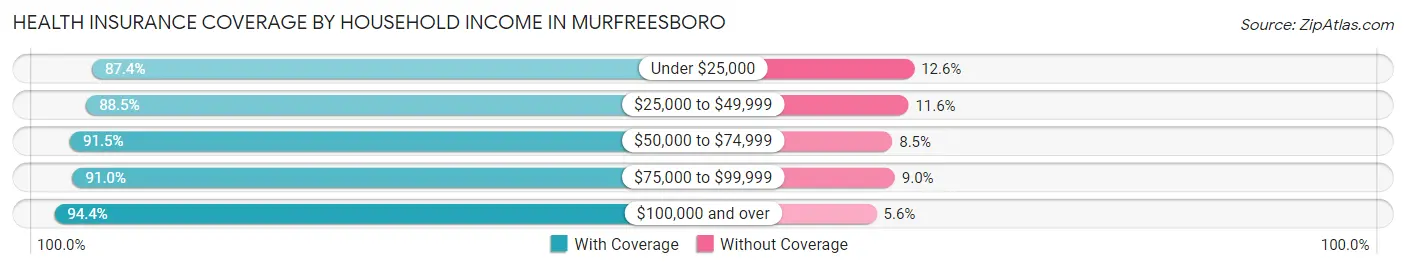
| Household Income | With Coverage | Without Coverage |
| Under $25,000 | 10,985 (87.4%) | 1,588 (12.6%) |
| $25,000 to $49,999 | 22,594 (88.4%) | 2,950 (11.6%) |
| $50,000 to $74,999 | 23,212 (91.5%) | 2,163 (8.5%) |
| $75,000 to $99,999 | 20,191 (91.0%) | 1,996 (9.0%) |
| $100,000 and over | 59,663 (94.4%) | 3,533 (5.6%) |
Public vs Private Health Insurance Coverage by Age in Murfreesboro
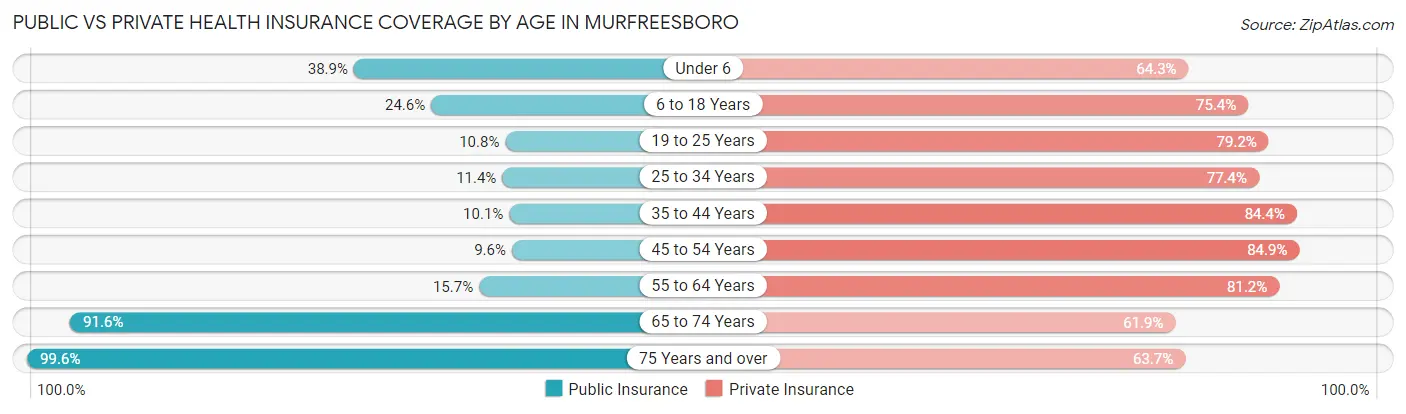
| Age Bracket | Public Insurance | Private Insurance |
| Under 6 | 4,261 (38.9%) | 7,050 (64.3%) |
| 6 to 18 Years | 6,443 (24.6%) | 19,784 (75.4%) |
| 19 to 25 Years | 2,640 (10.8%) | 19,382 (79.2%) |
| 25 to 34 Years | 2,547 (11.4%) | 17,375 (77.4%) |
| 35 to 44 Years | 2,072 (10.1%) | 17,398 (84.4%) |
| 45 to 54 Years | 1,703 (9.6%) | 15,116 (84.9%) |
| 55 to 64 Years | 2,166 (15.7%) | 11,228 (81.2%) |
| 65 to 74 Years | 8,713 (91.5%) | 5,890 (61.9%) |
| 75 Years and over | 6,165 (99.6%) | 3,945 (63.7%) |
| Total | 36,710 (24.1%) | 117,168 (77.1%) |
Disability Status by Sex by Age in Murfreesboro
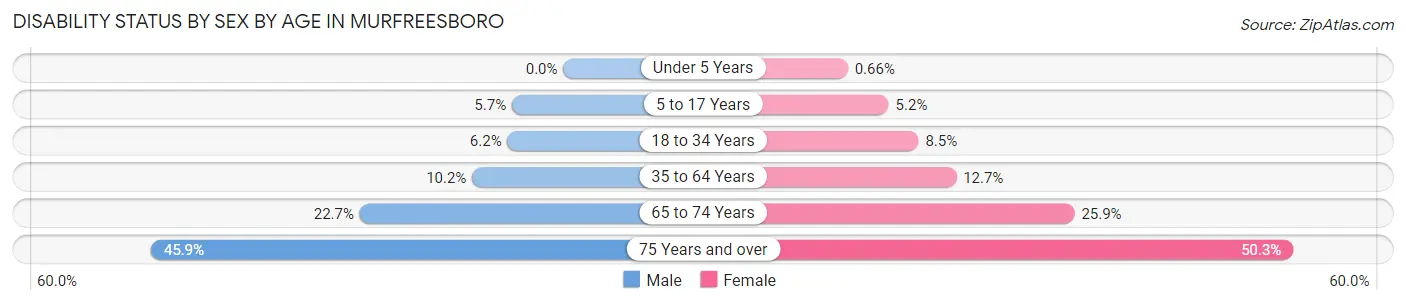
| Age Bracket | Male | Female |
| Under 5 Years | 0 (0.0%) | 26 (0.7%) |
| 5 to 17 Years | 759 (5.7%) | 641 (5.2%) |
| 18 to 34 Years | 1,529 (6.2%) | 2,116 (8.5%) |
| 35 to 64 Years | 2,544 (10.2%) | 3,462 (12.7%) |
| 65 to 74 Years | 958 (22.7%) | 1,371 (25.9%) |
| 75 Years and over | 1,042 (45.9%) | 1,973 (50.3%) |
Disability Class by Sex by Age in Murfreesboro
Disability Class: Hearing Difficulty
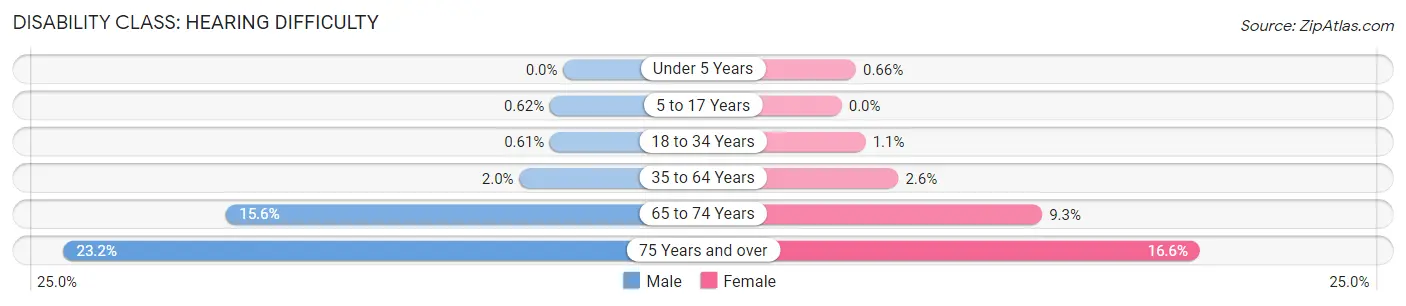
| Age Bracket | Male | Female |
| Under 5 Years | 0 (0.0%) | 26 (0.7%) |
| 5 to 17 Years | 83 (0.6%) | 0 (0.0%) |
| 18 to 34 Years | 150 (0.6%) | 275 (1.1%) |
| 35 to 64 Years | 511 (2.0%) | 714 (2.6%) |
| 65 to 74 Years | 661 (15.6%) | 492 (9.3%) |
| 75 Years and over | 526 (23.2%) | 652 (16.6%) |
Disability Class: Vision Difficulty
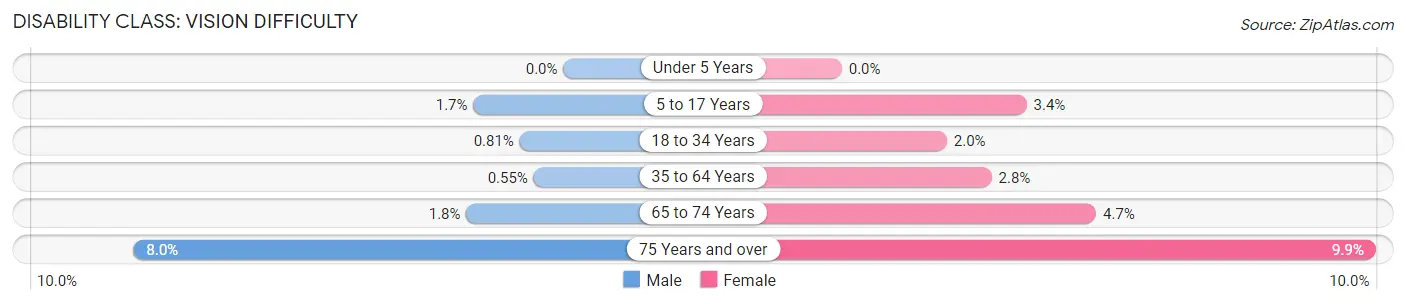
| Age Bracket | Male | Female |
| Under 5 Years | 0 (0.0%) | 0 (0.0%) |
| 5 to 17 Years | 222 (1.7%) | 421 (3.4%) |
| 18 to 34 Years | 198 (0.8%) | 483 (1.9%) |
| 35 to 64 Years | 138 (0.5%) | 754 (2.8%) |
| 65 to 74 Years | 76 (1.8%) | 250 (4.7%) |
| 75 Years and over | 181 (8.0%) | 389 (9.9%) |
Disability Class: Cognitive Difficulty
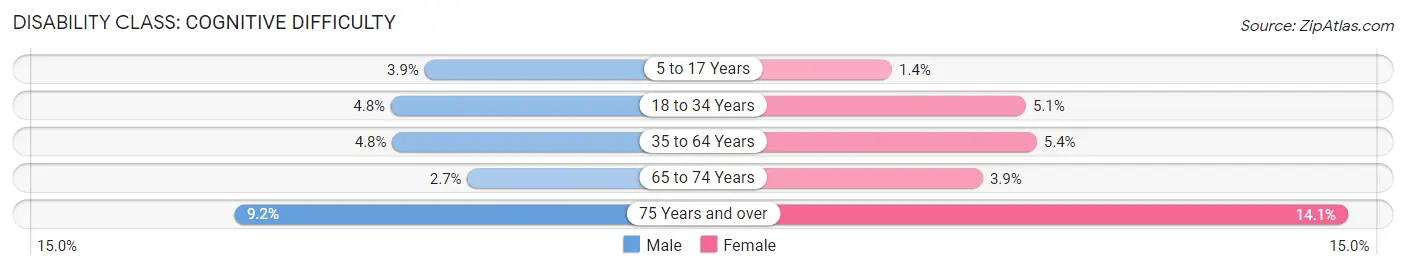
| Age Bracket | Male | Female |
| 5 to 17 Years | 512 (3.9%) | 172 (1.4%) |
| 18 to 34 Years | 1,179 (4.8%) | 1,270 (5.1%) |
| 35 to 64 Years | 1,193 (4.8%) | 1,476 (5.4%) |
| 65 to 74 Years | 113 (2.7%) | 208 (3.9%) |
| 75 Years and over | 208 (9.2%) | 553 (14.1%) |
Disability Class: Ambulatory Difficulty
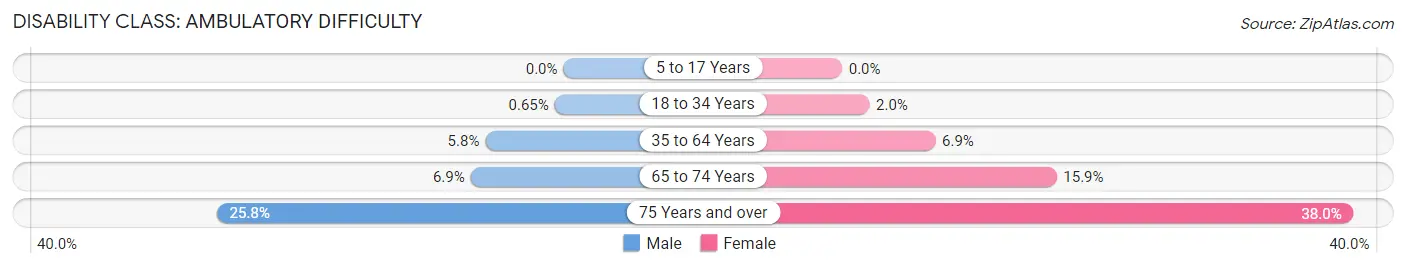
| Age Bracket | Male | Female |
| 5 to 17 Years | 0 (0.0%) | 0 (0.0%) |
| 18 to 34 Years | 160 (0.6%) | 503 (2.0%) |
| 35 to 64 Years | 1,455 (5.8%) | 1,884 (6.9%) |
| 65 to 74 Years | 291 (6.9%) | 843 (15.9%) |
| 75 Years and over | 584 (25.8%) | 1,491 (38.0%) |
Disability Class: Self-Care Difficulty
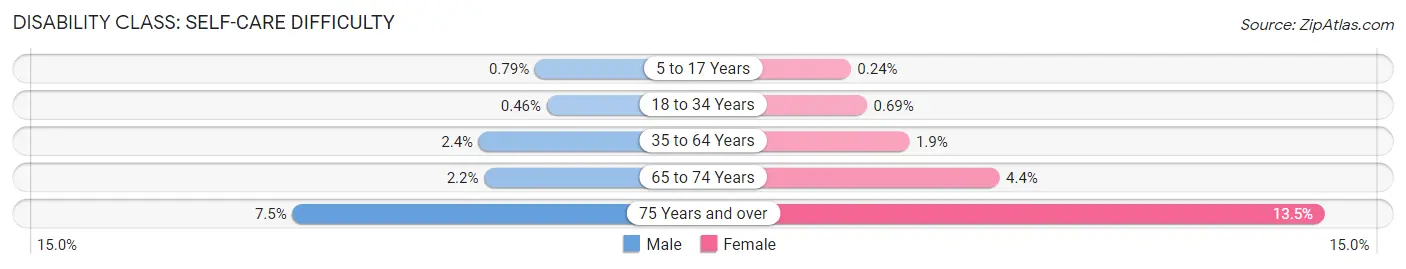
| Age Bracket | Male | Female |
| 5 to 17 Years | 105 (0.8%) | 30 (0.2%) |
| 18 to 34 Years | 112 (0.5%) | 171 (0.7%) |
| 35 to 64 Years | 589 (2.4%) | 509 (1.9%) |
| 65 to 74 Years | 93 (2.2%) | 232 (4.4%) |
| 75 Years and over | 171 (7.5%) | 528 (13.5%) |
Technology Access in Murfreesboro
Computing Device Access in Murfreesboro
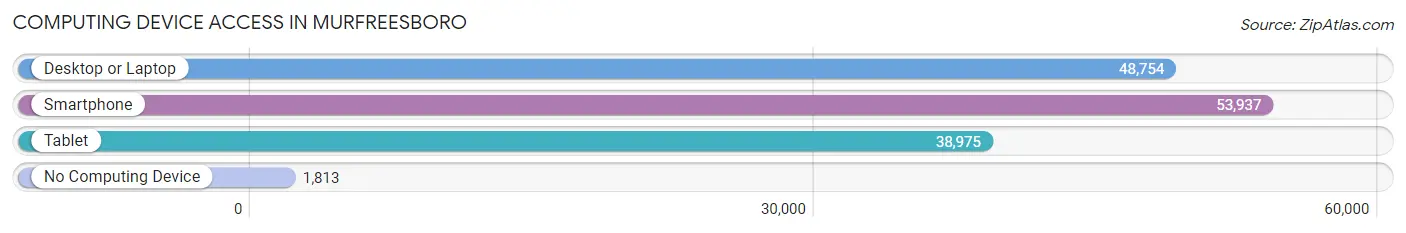
| Device Type | # Households | % Households |
| Desktop or Laptop | 48,754 | 84.9% |
| Smartphone | 53,937 | 94.0% |
| Tablet | 38,975 | 67.9% |
| No Computing Device | 1,813 | 3.2% |
| Total | 57,399 | 100.0% |
Internet Access in Murfreesboro
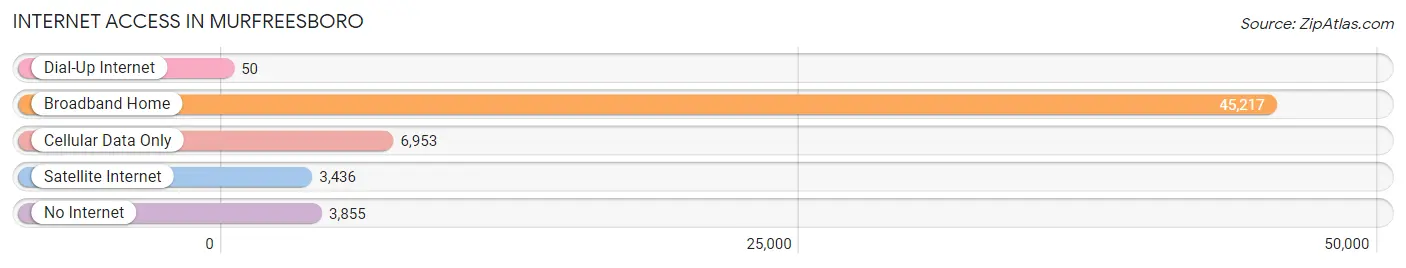
| Internet Type | # Households | % Households |
| Dial-Up Internet | 50 | 0.1% |
| Broadband Home | 45,217 | 78.8% |
| Cellular Data Only | 6,953 | 12.1% |
| Satellite Internet | 3,436 | 6.0% |
| No Internet | 3,855 | 6.7% |
| Total | 57,399 | 100.0% |
Murfreesboro Summary
Murfreesboro, Tennessee is a city located in the center of Rutherford County, approximately 34 miles southeast of Nashville. It is the county seat and the largest city in the county. The city is home to Middle Tennessee State University, the largest undergraduate university in the state. Murfreesboro is a vibrant and growing city with a population of 126,118 as of 2019.
History
The area that is now Murfreesboro was first settled in the late 1700s by William Lytle, who established a trading post near the Stones River. The city was officially founded in 1811 and named after Colonel Hardy Murfree, a Revolutionary War hero. Murfreesboro was an important center of commerce and transportation during the Civil War, and was the site of the Battle of Stones River in 1862. The city was also the site of the Battle of Murfreesboro in 1863.
Geography
Murfreesboro is located in the center of Rutherford County, approximately 34 miles southeast of Nashville. The city is situated on the Stones River, which flows through the city and is a major tributary of the Cumberland River. The city has a total area of 44.3 square miles, of which 43.9 square miles is land and 0.4 square miles is water. The city is located in the Central Basin of Tennessee, which is characterized by rolling hills and fertile soil.
Economy
Murfreesboro is a major economic center in the region, with a diverse economy that includes healthcare, education, manufacturing, retail, and tourism. The city is home to Middle Tennessee State University, the largest undergraduate university in the state, which has an annual economic impact of over $1 billion. The city is also home to several major healthcare providers, including Saint Thomas Rutherford Hospital and Vanderbilt University Medical Center. The city is also home to several major manufacturing companies, including Bridgestone, Nissan, and Amazon.
Demographics
As of 2019, the population of Murfreesboro was 126,118, making it the largest city in Rutherford County. The city has a diverse population, with a median age of 33.7 years. The racial makeup of the city is 73.2% White, 15.3% African American, 5.2% Hispanic or Latino, 3.2% Asian, and 3.1% other. The median household income in the city is $50,945, and the median home value is $213,400.
Murfreesboro is a vibrant and growing city with a diverse population and a strong economy. The city is home to Middle Tennessee State University, several major healthcare providers, and several major manufacturing companies. The city has a rich history and is a great place to live, work, and play.
Common Questions
What is Per Capita Income in Murfreesboro?
Per Capita income in Murfreesboro is $36,126.
What is the Median Family Income in Murfreesboro?
Median Family Income in Murfreesboro is $90,863.
What is the Median Household income in Murfreesboro?
Median Household Income in Murfreesboro is $70,451.
What is Income or Wage Gap in Murfreesboro?
Income or Wage Gap in Murfreesboro is 19.4%.
Women in Murfreesboro earn 80.6 cents for every dollar earned by a man.
What is Family Income Deficit in Murfreesboro?
Family Income Deficit in Murfreesboro is $9,201.
Families that are below poverty line in Murfreesboro earn $9,201 less on average than the poverty threshold level.
What is Inequality or Gini Index in Murfreesboro?
Inequality or Gini Index in Murfreesboro is 0.42.
What is the Total Population of Murfreesboro?
Total Population of Murfreesboro is 153,487.
What is the Total Male Population of Murfreesboro?
Total Male Population of Murfreesboro is 75,747.
What is the Total Female Population of Murfreesboro?
Total Female Population of Murfreesboro is 77,740.
What is the Ratio of Males per 100 Females in Murfreesboro?
There are 97.44 Males per 100 Females in Murfreesboro.
What is the Ratio of Females per 100 Males in Murfreesboro?
There are 102.63 Females per 100 Males in Murfreesboro.
What is the Median Population Age in Murfreesboro?
Median Population Age in Murfreesboro is 31.5 Years.
What is the Average Family Size in Murfreesboro
Average Family Size in Murfreesboro is 3.2 People.
What is the Average Household Size in Murfreesboro
Average Household Size in Murfreesboro is 2.6 People.
How Large is the Labor Force in Murfreesboro?
There are 88,595 People in the Labor Forcein in Murfreesboro.
What is the Percentage of People in the Labor Force in Murfreesboro?
72.1% of People are in the Labor Force in Murfreesboro.
What is the Unemployment Rate in Murfreesboro?
Unemployment Rate in Murfreesboro is 4.3%.