St Paul, MN Map & Demographics
St Paul Map
St Paul Overview
$39,726
PER CAPITA INCOME
$91,077
AVG FAMILY INCOME
$69,919
AVG HOUSEHOLD INCOME
16.2%
WAGE / INCOME GAP [ % ]
83.8¢/ $1
WAGE / INCOME GAP [ $ ]
$11,950
FAMILY INCOME DEFICIT
0.48
INEQUALITY / GINI INDEX
308,806
TOTAL POPULATION
152,822
MALE POPULATION
155,984
FEMALE POPULATION
97.97
MALES / 100 FEMALES
102.07
FEMALES / 100 MALES
33.1
MEDIAN AGE
3.4
AVG FAMILY SIZE
2.5
AVG HOUSEHOLD SIZE
170,628
LABOR FORCE [ PEOPLE ]
70.3%
PERCENT IN LABOR FORCE
5.0%
UNEMPLOYMENT RATE
Income in St Paul
Income Overview in St Paul
Per Capita Income in St Paul is $39,726, while median incomes of families and households are $91,077 and $69,919 respectively.
| Characteristic | Number | Measure |
| Per Capita Income | 308,806 | $39,726 |
| Median Family Income | 63,637 | $91,077 |
| Mean Family Income | 63,637 | $121,191 |
| Median Household Income | 121,212 | $69,919 |
| Mean Household Income | 121,212 | $98,687 |
| Income Deficit | 63,637 | $11,950 |
| Wage / Income Gap (%) | 308,806 | 16.20% |
| Wage / Income Gap ($) | 308,806 | 83.80¢ per $1 |
| Gini / Inequality Index | 308,806 | 0.48 |
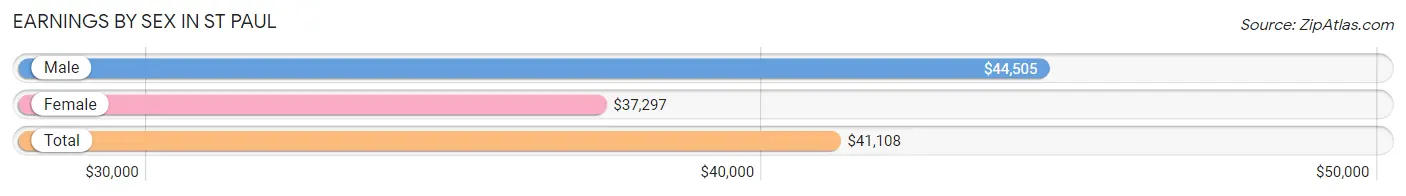
Earnings by Sex in St Paul
Average Earnings in St Paul are $41,108, $44,505 for men and $37,297 for women, a difference of 16.2%.
| Sex | Number | Average Earnings |
| Male | 91,712 (51.0%) | $44,505 |
| Female | 88,016 (49.0%) | $37,297 |
| Total | 179,728 (100.0%) | $41,108 |
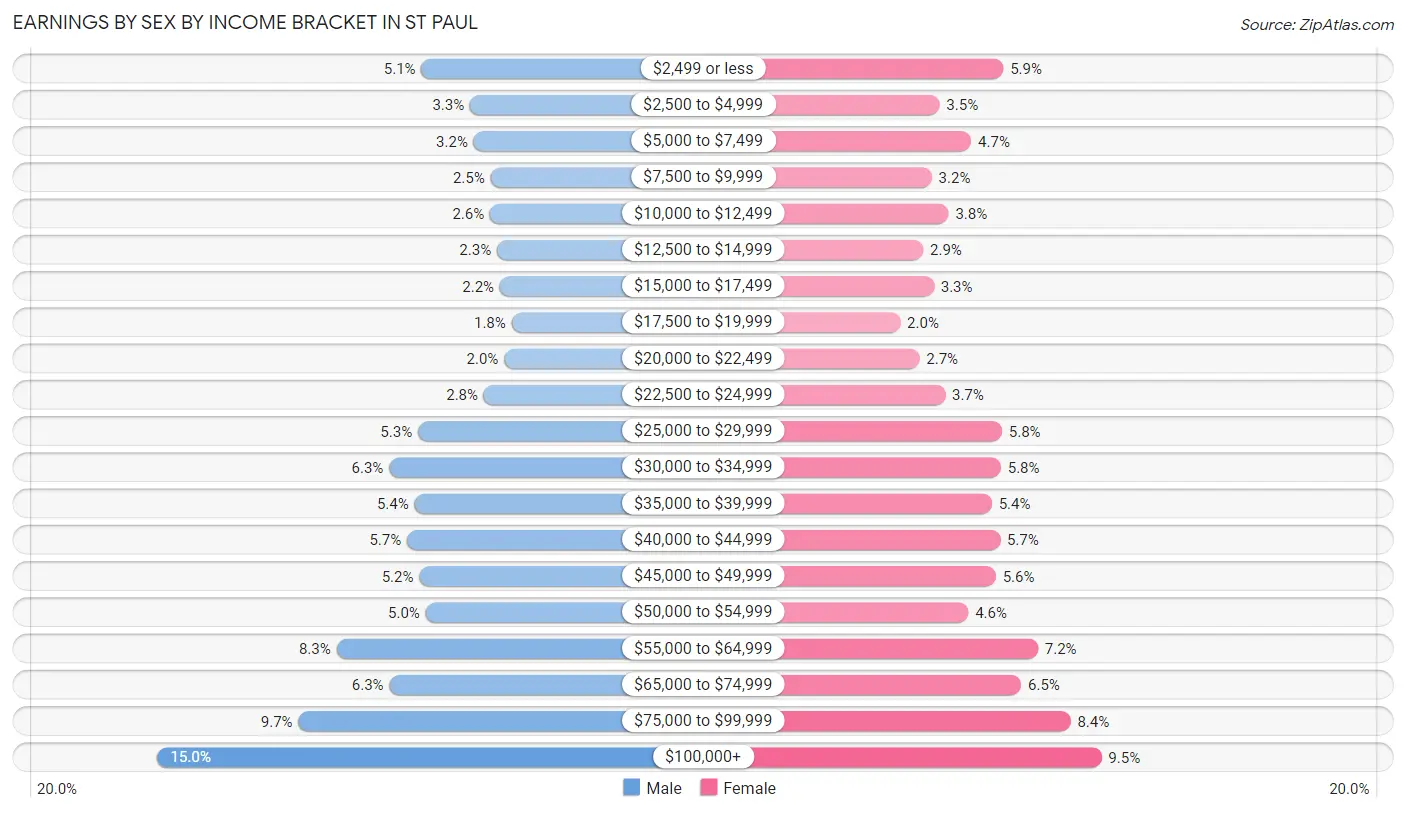
Earnings by Sex by Income Bracket in St Paul
The most common earnings brackets in St Paul are $100,000+ for men (13,776 | 15.0%) and $100,000+ for women (8,401 | 9.5%).
| Income | Male | Female |
| $2,499 or less | 4,705 (5.1%) | 5,160 (5.9%) |
| $2,500 to $4,999 | 3,032 (3.3%) | 3,056 (3.5%) |
| $5,000 to $7,499 | 2,903 (3.2%) | 4,100 (4.7%) |
| $7,500 to $9,999 | 2,326 (2.5%) | 2,802 (3.2%) |
| $10,000 to $12,499 | 2,352 (2.6%) | 3,352 (3.8%) |
| $12,500 to $14,999 | 2,113 (2.3%) | 2,521 (2.9%) |
| $15,000 to $17,499 | 2,013 (2.2%) | 2,867 (3.3%) |
| $17,500 to $19,999 | 1,602 (1.8%) | 1,759 (2.0%) |
| $20,000 to $22,499 | 1,862 (2.0%) | 2,396 (2.7%) |
| $22,500 to $24,999 | 2,556 (2.8%) | 3,240 (3.7%) |
| $25,000 to $29,999 | 4,824 (5.3%) | 5,117 (5.8%) |
| $30,000 to $34,999 | 5,813 (6.3%) | 5,080 (5.8%) |
| $35,000 to $39,999 | 4,943 (5.4%) | 4,777 (5.4%) |
| $40,000 to $44,999 | 5,200 (5.7%) | 5,048 (5.7%) |
| $45,000 to $49,999 | 4,774 (5.2%) | 4,907 (5.6%) |
| $50,000 to $54,999 | 4,555 (5.0%) | 4,006 (4.5%) |
| $55,000 to $64,999 | 7,620 (8.3%) | 6,300 (7.2%) |
| $65,000 to $74,999 | 5,806 (6.3%) | 5,747 (6.5%) |
| $75,000 to $99,999 | 8,937 (9.7%) | 7,380 (8.4%) |
| $100,000+ | 13,776 (15.0%) | 8,401 (9.5%) |
| Total | 91,712 (100.0%) | 88,016 (100.0%) |
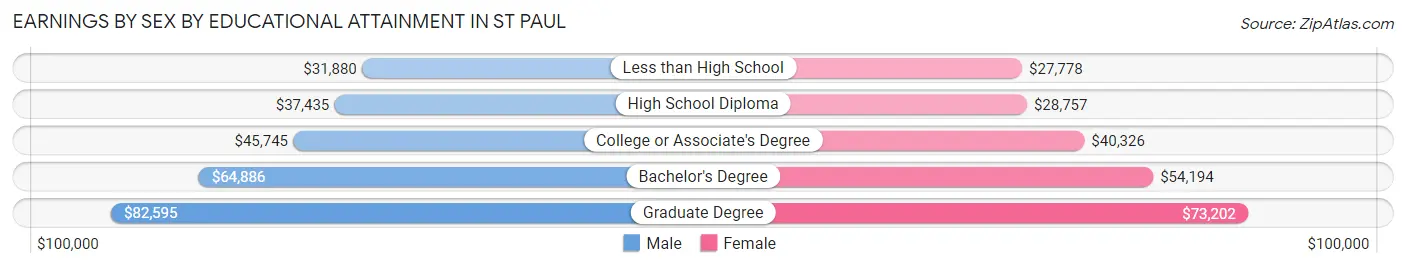
Earnings by Sex by Educational Attainment in St Paul
Average earnings in St Paul are $51,315 for men and $45,097 for women, a difference of 12.1%. Men with an educational attainment of graduate degree enjoy the highest average annual earnings of $82,595, while those with less than high school education earn the least with $31,880. Women with an educational attainment of graduate degree earn the most with the average annual earnings of $73,202, while those with less than high school education have the smallest earnings of $27,778.
| Educational Attainment | Male Income | Female Income |
| Less than High School | $31,880 | $27,778 |
| High School Diploma | $37,435 | $28,757 |
| College or Associate's Degree | $45,745 | $40,326 |
| Bachelor's Degree | $64,886 | $54,194 |
| Graduate Degree | $82,595 | $73,202 |
| Total | $51,315 | $45,097 |
Family Income in St Paul
Family Income Brackets in St Paul
According to the St Paul family income data, there are 12,664 families falling into the $100,000 to $149,999 income range, which is the most common income bracket and makes up 19.9% of all families. Conversely, the $10,000 to $14,999 income bracket is the least frequent group with only 1,209 families (1.9%) belonging to this category.
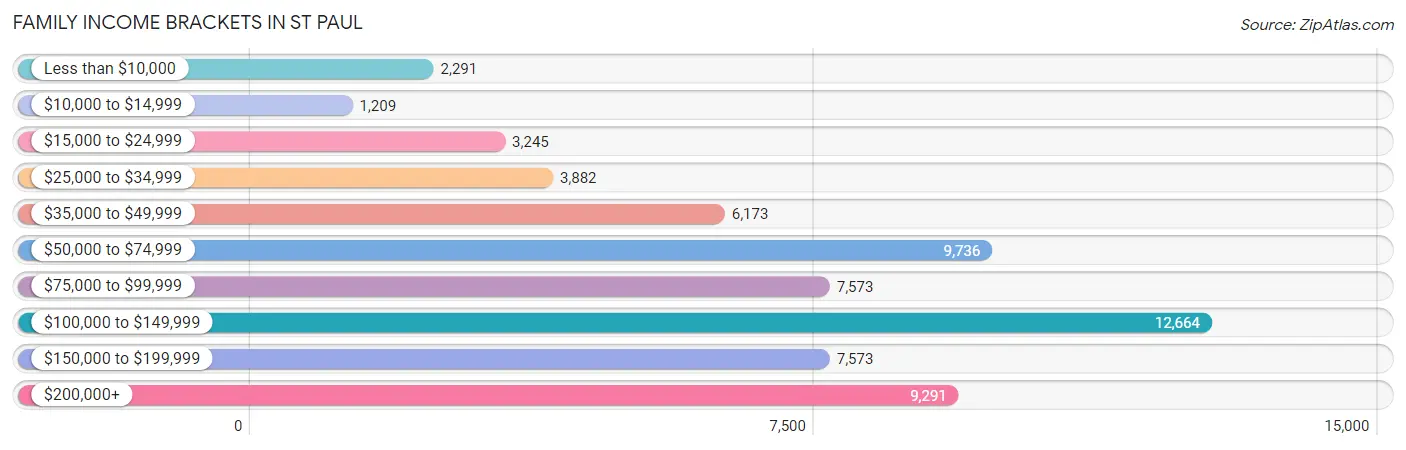
| Income Bracket | # Families | % Families |
| Less than $10,000 | 2,291 | 3.6% |
| $10,000 to $14,999 | 1,209 | 1.9% |
| $15,000 to $24,999 | 3,245 | 5.1% |
| $25,000 to $34,999 | 3,882 | 6.1% |
| $35,000 to $49,999 | 6,173 | 9.7% |
| $50,000 to $74,999 | 9,736 | 15.3% |
| $75,000 to $99,999 | 7,573 | 11.9% |
| $100,000 to $149,999 | 12,664 | 19.9% |
| $150,000 to $199,999 | 7,573 | 11.9% |
| $200,000+ | 9,291 | 14.6% |
Family Income by Famaliy Size in St Paul
4-person families (10,295 | 16.2%) account for the highest median family income in St Paul with $122,623 per family, while 2-person families (27,678 | 43.5%) have the highest median income of $42,778 per family member.
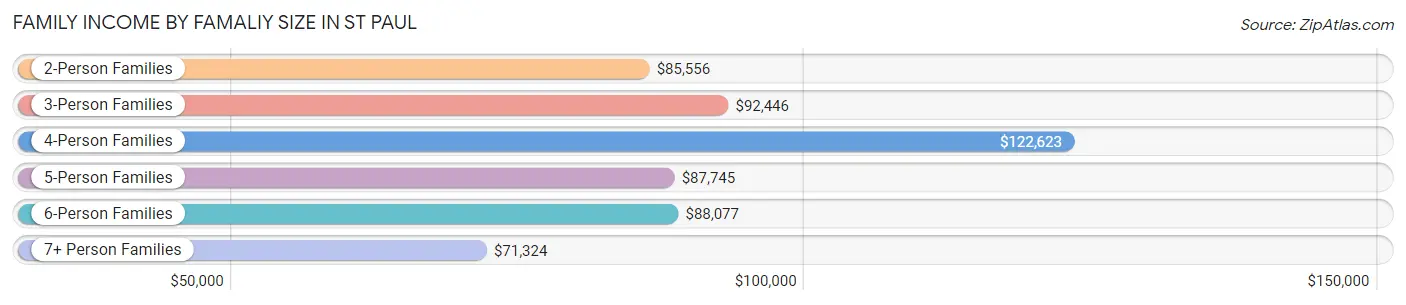
| Income Bracket | # Families | Median Income |
| 2-Person Families | 27,678 (43.5%) | $85,556 |
| 3-Person Families | 13,741 (21.6%) | $92,446 |
| 4-Person Families | 10,295 (16.2%) | $122,623 |
| 5-Person Families | 5,531 (8.7%) | $87,745 |
| 6-Person Families | 3,070 (4.8%) | $88,077 |
| 7+ Person Families | 3,322 (5.2%) | $71,324 |
| Total | 63,637 (100.0%) | $91,077 |
Family Income by Number of Earners in St Paul
The median family income in St Paul is $91,077, with families comprising 3+ earners (9,017) having the highest median family income of $139,442, while families with no earners (6,006) have the lowest median family income of $46,417, accounting for 14.2% and 9.4% of families, respectively.
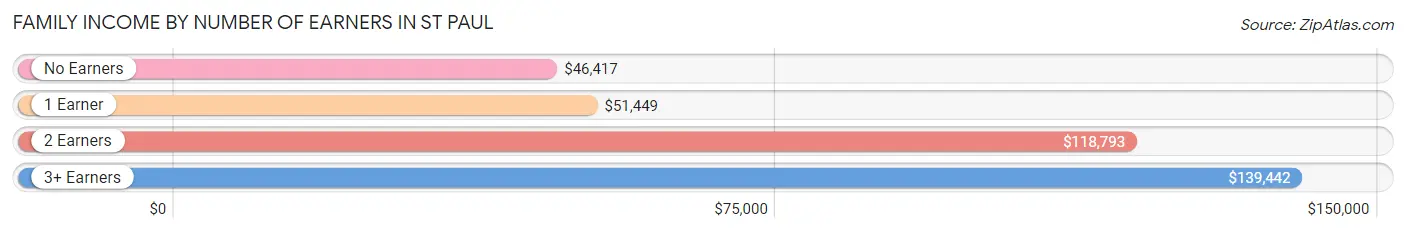
| Number of Earners | # Families | Median Income |
| No Earners | 6,006 (9.4%) | $46,417 |
| 1 Earner | 20,249 (31.8%) | $51,449 |
| 2 Earners | 28,365 (44.6%) | $118,793 |
| 3+ Earners | 9,017 (14.2%) | $139,442 |
| Total | 63,637 (100.0%) | $91,077 |
Household Income in St Paul
Household Income Brackets in St Paul
With 21,576 households falling in the category, the $50,000 to $74,999 income range is the most frequent in St Paul, accounting for 17.8% of all households. In contrast, only 5,212 households (4.3%) fall into the $10,000 to $14,999 income bracket, making it the least populous group.
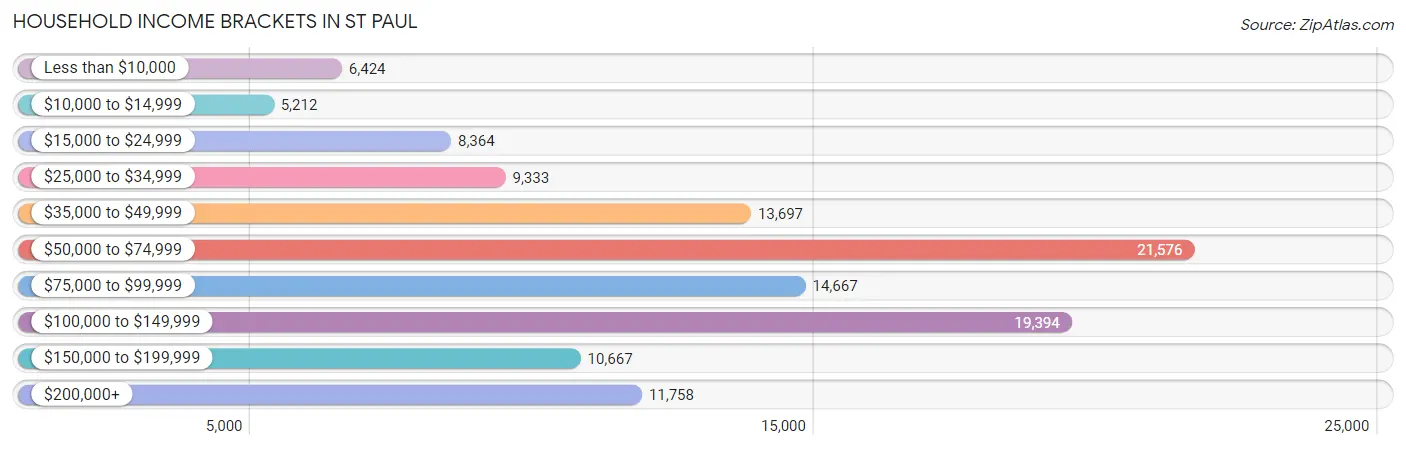
| Income Bracket | # Households | % Households |
| Less than $10,000 | 6,424 | 5.3% |
| $10,000 to $14,999 | 5,212 | 4.3% |
| $15,000 to $24,999 | 8,364 | 6.9% |
| $25,000 to $34,999 | 9,333 | 7.7% |
| $35,000 to $49,999 | 13,697 | 11.3% |
| $50,000 to $74,999 | 21,576 | 17.8% |
| $75,000 to $99,999 | 14,667 | 12.1% |
| $100,000 to $149,999 | 19,394 | 16.0% |
| $150,000 to $199,999 | 10,667 | 8.8% |
| $200,000+ | 11,758 | 9.7% |
Household Income by Householder Age in St Paul
The median household income in St Paul is $69,919, with the highest median household income of $82,200 found in the 45 to 64 years age bracket for the primary householder. A total of 40,094 households (33.1%) fall into this category. Meanwhile, the 15 to 24 years age bracket for the primary householder has the lowest median household income of $40,118, with 6,642 households (5.5%) in this group.
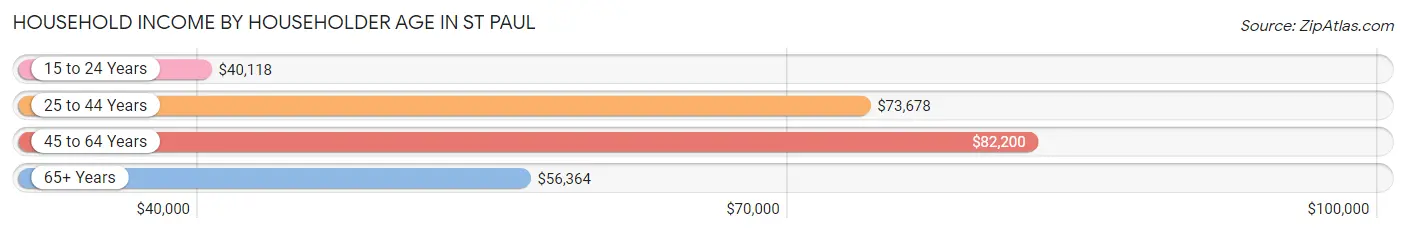
| Income Bracket | # Households | Median Income |
| 15 to 24 Years | 6,642 (5.5%) | $40,118 |
| 25 to 44 Years | 51,179 (42.2%) | $73,678 |
| 45 to 64 Years | 40,094 (33.1%) | $82,200 |
| 65+ Years | 23,297 (19.2%) | $56,364 |
| Total | 121,212 (100.0%) | $69,919 |
Poverty in St Paul
Income Below Poverty by Sex and Age in St Paul
With 15.5% poverty level for males and 17.9% for females among the residents of St Paul, under 5 year old males and 18 to 24 year old females are the most vulnerable to poverty, with 2,549 males (24.9%) and 4,362 females (29.7%) in their respective age groups living below the poverty level.
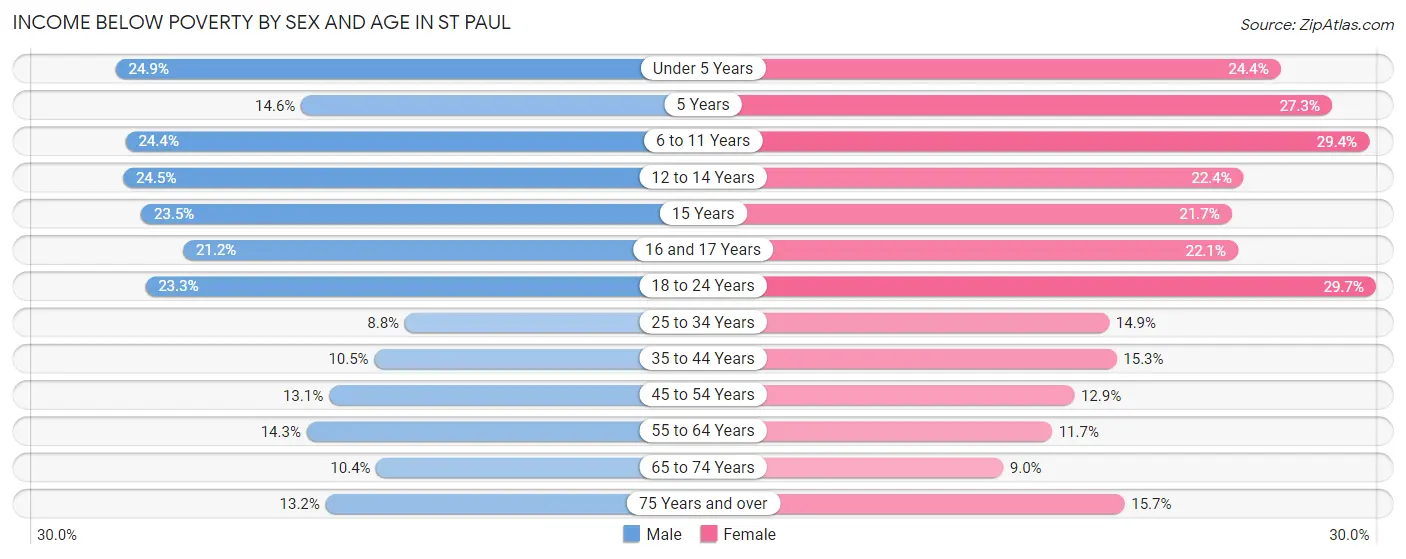
| Age Bracket | Male | Female |
| Under 5 Years | 2,549 (24.9%) | 2,445 (24.4%) |
| 5 Years | 285 (14.6%) | 663 (27.3%) |
| 6 to 11 Years | 3,063 (24.4%) | 3,282 (29.3%) |
| 12 to 14 Years | 1,483 (24.5%) | 1,480 (22.4%) |
| 15 Years | 518 (23.5%) | 381 (21.7%) |
| 16 and 17 Years | 824 (21.2%) | 877 (22.1%) |
| 18 to 24 Years | 3,366 (23.3%) | 4,362 (29.7%) |
| 25 to 34 Years | 2,466 (8.8%) | 4,137 (14.9%) |
| 35 to 44 Years | 2,217 (10.5%) | 3,231 (15.3%) |
| 45 to 54 Years | 2,236 (13.1%) | 2,103 (12.9%) |
| 55 to 64 Years | 2,335 (14.3%) | 1,923 (11.7%) |
| 65 to 74 Years | 1,111 (10.4%) | 1,109 (9.0%) |
| 75 Years and over | 603 (13.2%) | 1,121 (15.7%) |
| Total | 23,056 (15.5%) | 27,114 (17.9%) |
Income Above Poverty by Sex and Age in St Paul
According to the poverty statistics in St Paul, males aged 25 to 34 years and females aged 65 to 74 years are the age groups that are most secure financially, with 91.2% of males and 91.0% of females in these age groups living above the poverty line.
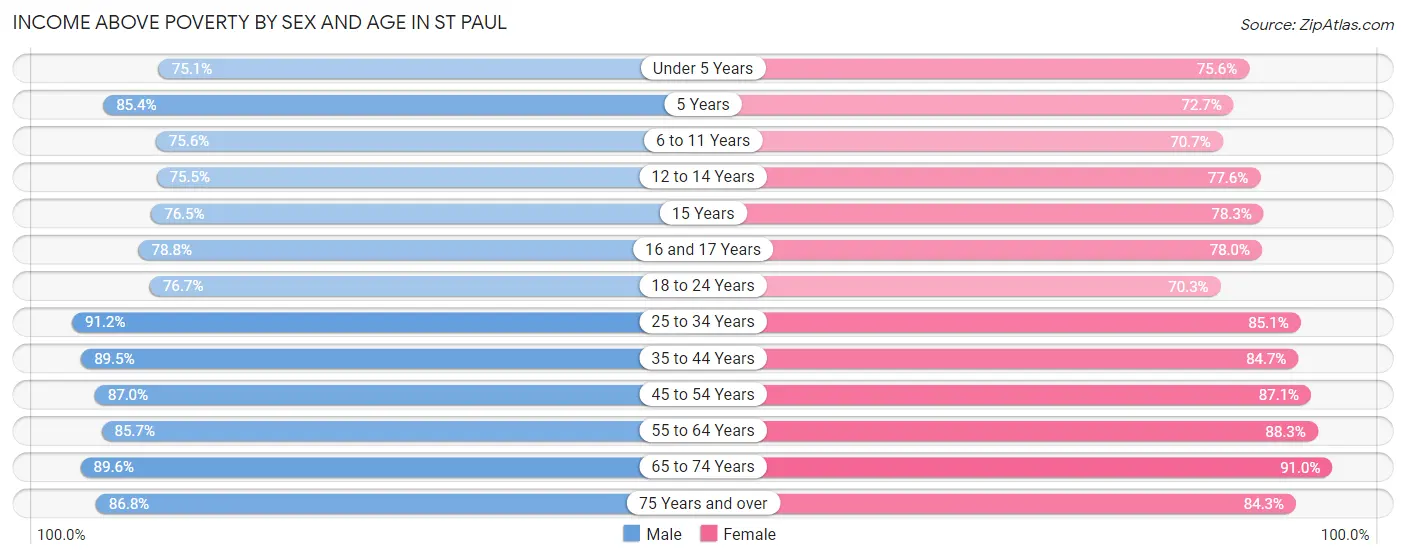
| Age Bracket | Male | Female |
| Under 5 Years | 7,674 (75.1%) | 7,564 (75.6%) |
| 5 Years | 1,667 (85.4%) | 1,767 (72.7%) |
| 6 to 11 Years | 9,503 (75.6%) | 7,902 (70.7%) |
| 12 to 14 Years | 4,565 (75.5%) | 5,137 (77.6%) |
| 15 Years | 1,684 (76.5%) | 1,375 (78.3%) |
| 16 and 17 Years | 3,067 (78.8%) | 3,101 (77.9%) |
| 18 to 24 Years | 11,095 (76.7%) | 10,310 (70.3%) |
| 25 to 34 Years | 25,484 (91.2%) | 23,683 (85.1%) |
| 35 to 44 Years | 18,855 (89.5%) | 17,902 (84.7%) |
| 45 to 54 Years | 14,902 (87.0%) | 14,159 (87.1%) |
| 55 to 64 Years | 14,008 (85.7%) | 14,524 (88.3%) |
| 65 to 74 Years | 9,559 (89.6%) | 11,256 (91.0%) |
| 75 Years and over | 3,953 (86.8%) | 6,006 (84.3%) |
| Total | 126,016 (84.5%) | 124,686 (82.1%) |
Income Below Poverty Among Married-Couple Families in St Paul
The poverty statistics for married-couple families in St Paul show that 5.3% or 2,219 of the total 41,789 families live below the poverty line. Families with 5 or more children have the highest poverty rate of 36.6%, comprising of 517 families. On the other hand, families with no children have the lowest poverty rate of 2.0%, which includes 439 families.
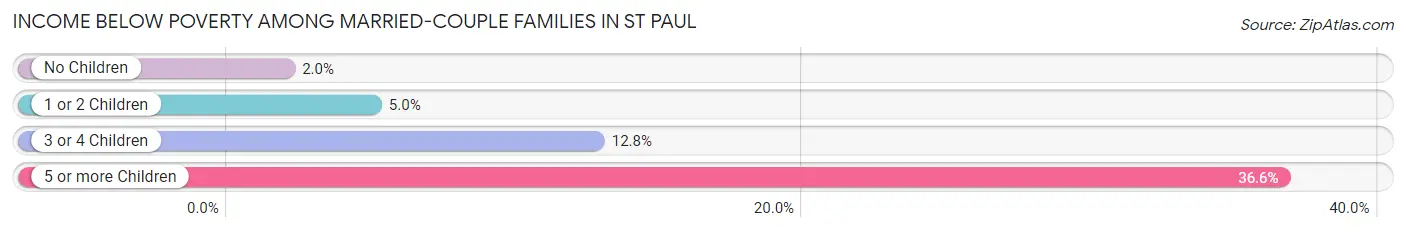
| Children | Above Poverty | Below Poverty |
| No Children | 21,574 (98.0%) | 439 (2.0%) |
| 1 or 2 Children | 13,248 (95.0%) | 699 (5.0%) |
| 3 or 4 Children | 3,854 (87.2%) | 564 (12.8%) |
| 5 or more Children | 894 (63.4%) | 517 (36.6%) |
| Total | 39,570 (94.7%) | 2,219 (5.3%) |
Income Below Poverty Among Single-Parent Households in St Paul
According to the poverty data in St Paul, 17.4% or 1,087 single-father households and 27.1% or 4,224 single-mother households are living below the poverty line. Among single-father households, those with 5 or more children have the highest poverty rate, with 33 households (75.0%) experiencing poverty. Likewise, among single-mother households, those with 5 or more children have the highest poverty rate, with 363 households (62.6%) falling below the poverty line.
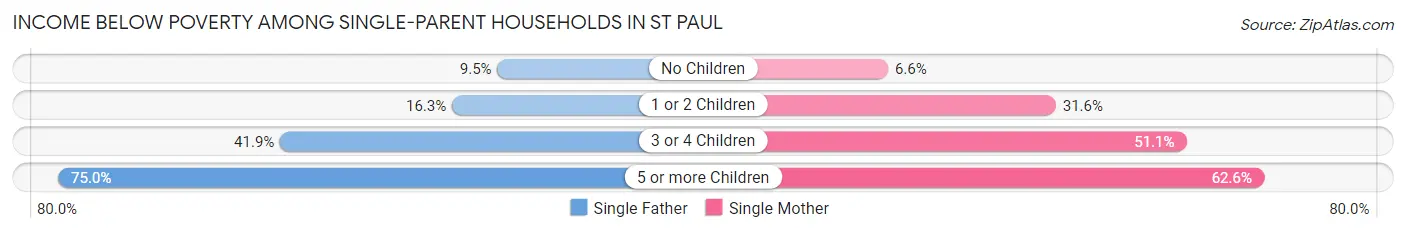
| Children | Single Father | Single Mother |
| No Children | 259 (9.5%) | 327 (6.6%) |
| 1 or 2 Children | 429 (16.3%) | 2,597 (31.6%) |
| 3 or 4 Children | 366 (41.9%) | 937 (51.1%) |
| 5 or more Children | 33 (75.0%) | 363 (62.6%) |
| Total | 1,087 (17.4%) | 4,224 (27.1%) |
Income Below Poverty Among Married-Couple vs Single-Parent Households in St Paul
The poverty data for St Paul shows that 2,219 of the married-couple family households (5.3%) and 5,311 of the single-parent households (24.3%) are living below the poverty level. Within the married-couple family households, those with 5 or more children have the highest poverty rate, with 517 households (36.6%) falling below the poverty line. Among the single-parent households, those with 5 or more children have the highest poverty rate, with 396 household (63.5%) living below poverty.
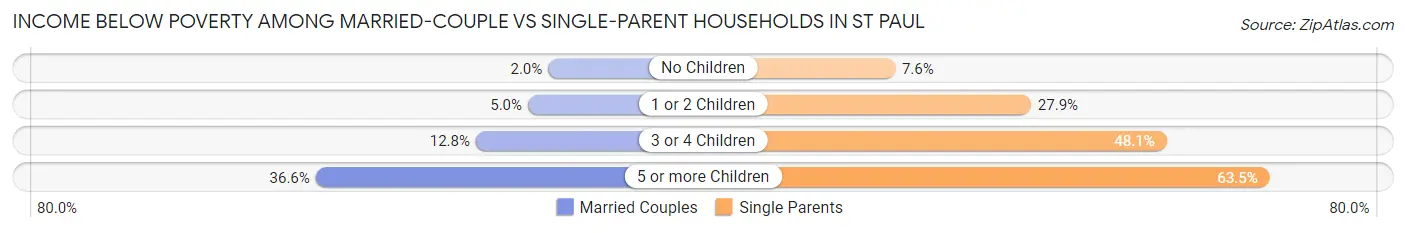
| Children | Married-Couple Families | Single-Parent Households |
| No Children | 439 (2.0%) | 586 (7.6%) |
| 1 or 2 Children | 699 (5.0%) | 3,026 (27.9%) |
| 3 or 4 Children | 564 (12.8%) | 1,303 (48.1%) |
| 5 or more Children | 517 (36.6%) | 396 (63.5%) |
| Total | 2,219 (5.3%) | 5,311 (24.3%) |
Race in St Paul
The most populous races in St Paul are White / Caucasian (167,729 | 54.3%), Asian (56,755 | 18.4%), and Black / African American (48,323 | 15.7%).
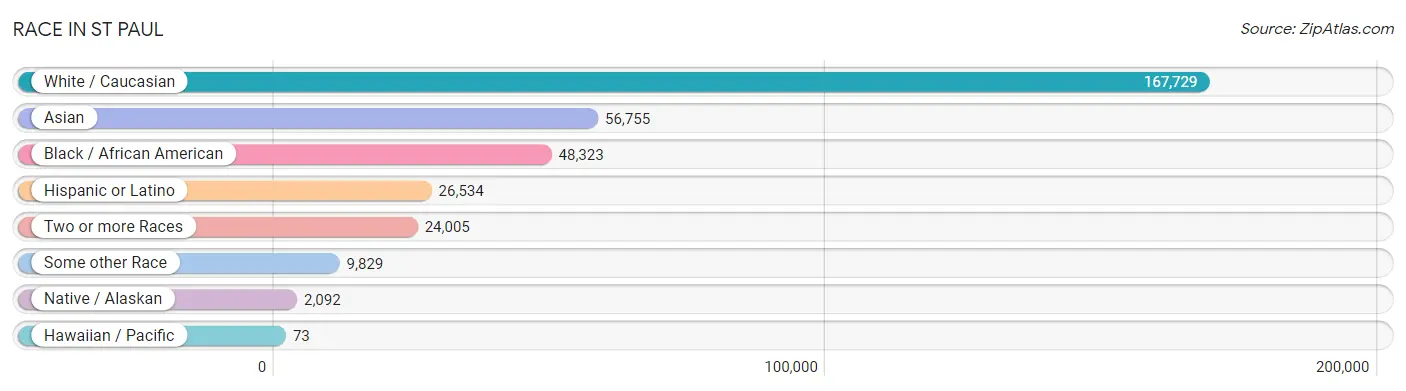
| Race | # Population | % Population |
| Asian | 56,755 | 18.4% |
| Black / African American | 48,323 | 15.7% |
| Hawaiian / Pacific | 73 | 0.0% |
| Hispanic or Latino | 26,534 | 8.6% |
| Native / Alaskan | 2,092 | 0.7% |
| White / Caucasian | 167,729 | 54.3% |
| Two or more Races | 24,005 | 7.8% |
| Some other Race | 9,829 | 3.2% |
| Total | 308,806 | 100.0% |
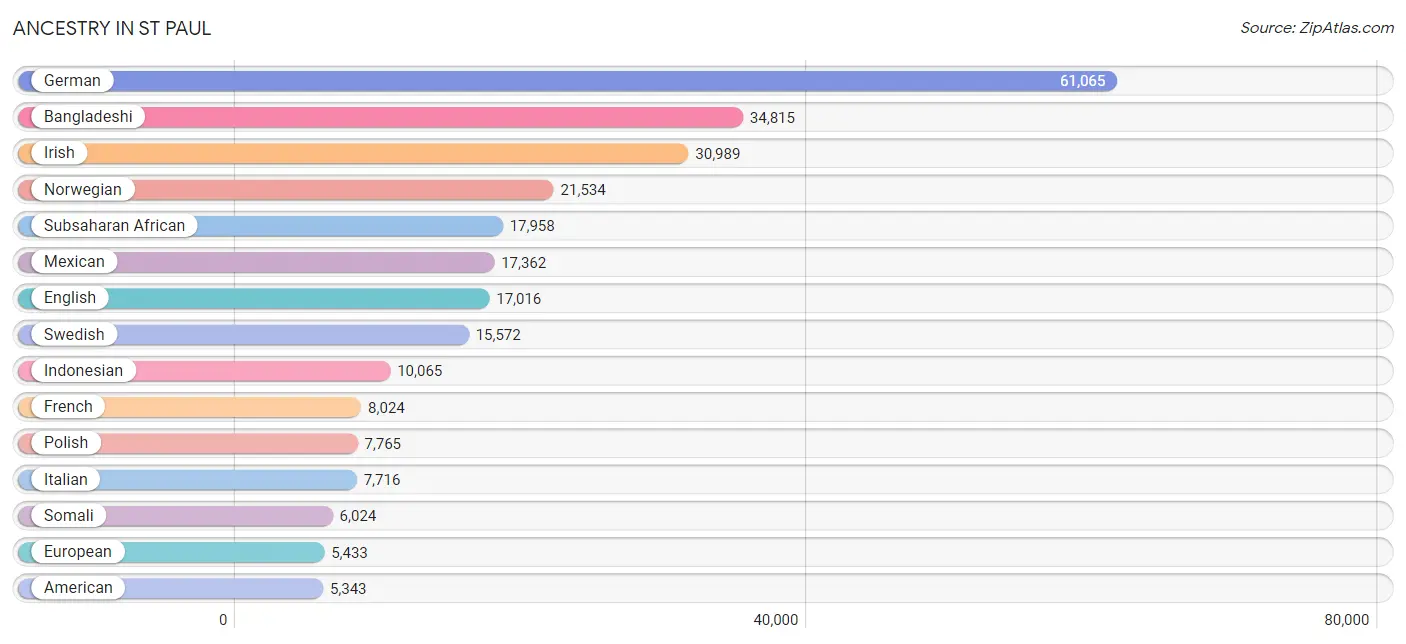
Ancestry in St Paul
The most populous ancestries reported in St Paul are German (61,065 | 19.8%), Bangladeshi (34,815 | 11.3%), Irish (30,989 | 10.0%), Norwegian (21,534 | 7.0%), and Subsaharan African (17,958 | 5.8%), together accounting for 53.9% of all St Paul residents.
| Ancestry | # Population | % Population |
| Afghan | 84 | 0.0% |
| African | 3,873 | 1.3% |
| Albanian | 69 | 0.0% |
| American | 5,343 | 1.7% |
| Apache | 93 | 0.0% |
| Arab | 940 | 0.3% |
| Argentinean | 142 | 0.1% |
| Armenian | 65 | 0.0% |
| Assyrian / Chaldean / Syriac | 17 | 0.0% |
| Australian | 19 | 0.0% |
| Austrian | 941 | 0.3% |
| Bangladeshi | 34,815 | 11.3% |
| Barbadian | 30 | 0.0% |
| Basque | 18 | 0.0% |
| Belgian | 508 | 0.2% |
| Belizean | 7 | 0.0% |
| Bermudan | 13 | 0.0% |
| Bhutanese | 1,130 | 0.4% |
| Blackfeet | 758 | 0.3% |
| Brazilian | 107 | 0.0% |
| British | 1,601 | 0.5% |
| British West Indian | 3 | 0.0% |
| Bulgarian | 91 | 0.0% |
| Burmese | 1,574 | 0.5% |
| Cajun | 17 | 0.0% |
| Canadian | 170 | 0.1% |
| Carpatho Rusyn | 3 | 0.0% |
| Celtic | 64 | 0.0% |
| Central American | 4,168 | 1.3% |
| Central American Indian | 176 | 0.1% |
| Cherokee | 466 | 0.2% |
| Chilean | 17 | 0.0% |
| Chippewa | 2,101 | 0.7% |
| Choctaw | 115 | 0.0% |
| Colombian | 385 | 0.1% |
| Costa Rican | 135 | 0.0% |
| Cree | 3 | 0.0% |
| Croatian | 189 | 0.1% |
| Cuban | 741 | 0.2% |
| Czech | 2,413 | 0.8% |
| Czechoslovakian | 387 | 0.1% |
| Danish | 2,075 | 0.7% |
| Dominican | 213 | 0.1% |
| Dutch | 3,275 | 1.1% |
| Eastern European | 780 | 0.3% |
| Ecuadorian | 105 | 0.0% |
| Egyptian | 133 | 0.0% |
| English | 17,016 | 5.5% |
| Estonian | 55 | 0.0% |
| Ethiopian | 4,626 | 1.5% |
| European | 5,433 | 1.8% |
| Filipino | 52 | 0.0% |
| Finnish | 2,461 | 0.8% |
| French | 8,024 | 2.6% |
| French American Indian | 739 | 0.2% |
| French Canadian | 2,061 | 0.7% |
| German | 61,065 | 19.8% |
| German Russian | 50 | 0.0% |
| Ghanaian | 602 | 0.2% |
| Greek | 733 | 0.2% |
| Guamanian / Chamorro | 69 | 0.0% |
| Guatemalan | 318 | 0.1% |
| Guyanese | 102 | 0.0% |
| Haitian | 93 | 0.0% |
| Honduran | 330 | 0.1% |
| Hungarian | 1,212 | 0.4% |
| Icelander | 36 | 0.0% |
| Indian (Asian) | 2,571 | 0.8% |
| Indonesian | 10,065 | 3.3% |
| Inupiat | 611 | 0.2% |
| Iranian | 162 | 0.1% |
| Iraqi | 6 | 0.0% |
| Irish | 30,989 | 10.0% |
| Iroquois | 58 | 0.0% |
| Israeli | 51 | 0.0% |
| Italian | 7,716 | 2.5% |
| Jamaican | 846 | 0.3% |
| Japanese | 722 | 0.2% |
| Jordanian | 20 | 0.0% |
| Kenyan | 726 | 0.2% |
| Kiowa | 18 | 0.0% |
| Korean | 2,034 | 0.7% |
| Laotian | 85 | 0.0% |
| Latvian | 185 | 0.1% |
| Lebanese | 299 | 0.1% |
| Liberian | 434 | 0.1% |
| Lithuanian | 779 | 0.3% |
| Luxembourger | 515 | 0.2% |
| Macedonian | 11 | 0.0% |
| Malaysian | 597 | 0.2% |
| Maltese | 24 | 0.0% |
| Menominee | 53 | 0.0% |
| Mexican | 17,362 | 5.6% |
| Mexican American Indian | 368 | 0.1% |
| Mongolian | 56 | 0.0% |
| Moroccan | 111 | 0.0% |
| Native Hawaiian | 149 | 0.1% |
| Navajo | 17 | 0.0% |
| New Zealander | 11 | 0.0% |
| Nicaraguan | 231 | 0.1% |
| Nigerian | 1,067 | 0.4% |
| Northern European | 842 | 0.3% |
| Norwegian | 21,534 | 7.0% |
| Osage | 16 | 0.0% |
| Pakistani | 1,017 | 0.3% |
| Palestinian | 62 | 0.0% |
| Panamanian | 130 | 0.0% |
| Paraguayan | 38 | 0.0% |
| Pennsylvania German | 29 | 0.0% |
| Peruvian | 162 | 0.1% |
| Polish | 7,765 | 2.5% |
| Portuguese | 136 | 0.0% |
| Potawatomi | 7 | 0.0% |
| Puerto Rican | 1,253 | 0.4% |
| Puget Sound Salish | 10 | 0.0% |
| Romanian | 242 | 0.1% |
| Russian | 2,141 | 0.7% |
| Salvadoran | 3,016 | 1.0% |
| Samoan | 147 | 0.1% |
| Scandinavian | 3,436 | 1.1% |
| Scotch-Irish | 1,940 | 0.6% |
| Scottish | 3,699 | 1.2% |
| Seminole | 67 | 0.0% |
| Senegalese | 6 | 0.0% |
| Serbian | 336 | 0.1% |
| Sioux | 774 | 0.3% |
| Slavic | 159 | 0.1% |
| Slovak | 563 | 0.2% |
| Slovene | 397 | 0.1% |
| Somali | 6,024 | 1.9% |
| South African | 59 | 0.0% |
| South American | 1,173 | 0.4% |
| South American Indian | 36 | 0.0% |
| Spaniard | 450 | 0.2% |
| Spanish | 502 | 0.2% |
| Sri Lankan | 2,236 | 0.7% |
| Subsaharan African | 17,958 | 5.8% |
| Sudanese | 26 | 0.0% |
| Swedish | 15,572 | 5.0% |
| Swiss | 1,190 | 0.4% |
| Syrian | 92 | 0.0% |
| Thai | 1,972 | 0.6% |
| Tlingit-Haida | 11 | 0.0% |
| Tohono O'Odham | 37 | 0.0% |
| Trinidadian and Tobagonian | 530 | 0.2% |
| Turkish | 167 | 0.1% |
| U.S. Virgin Islander | 34 | 0.0% |
| Ugandan | 3 | 0.0% |
| Ukrainian | 719 | 0.2% |
| Uruguayan | 116 | 0.0% |
| Venezuelan | 174 | 0.1% |
| Vietnamese | 35 | 0.0% |
| Welsh | 1,161 | 0.4% |
| West Indian | 336 | 0.1% |
| Yaqui | 9 | 0.0% |
| Yugoslavian | 84 | 0.0% |
| Yup'ik | 12 | 0.0% |
| Zimbabwean | 45 | 0.0% | View All 158 Rows |
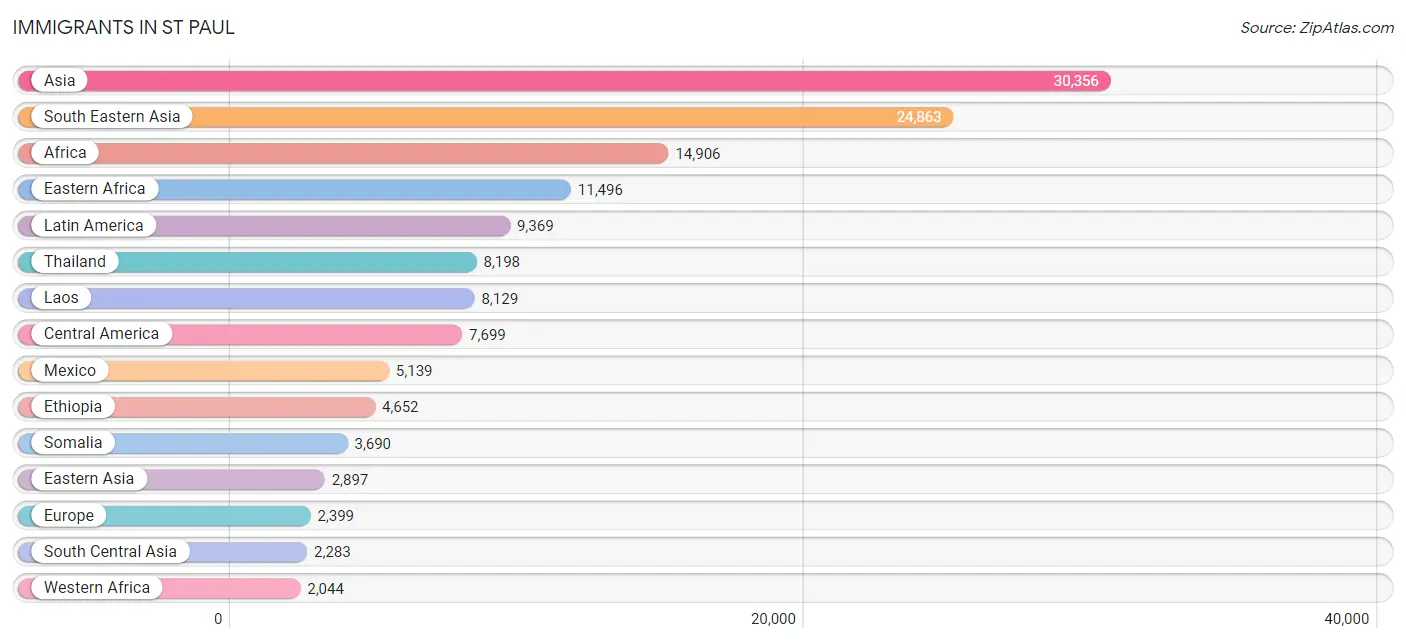
Immigrants in St Paul
The most numerous immigrant groups reported in St Paul came from Asia (30,356 | 9.8%), South Eastern Asia (24,863 | 8.1%), Africa (14,906 | 4.8%), Eastern Africa (11,496 | 3.7%), and Latin America (9,369 | 3.0%), together accounting for 29.5% of all St Paul residents.
| Immigration Origin | # Population | % Population |
| Afghanistan | 135 | 0.0% |
| Africa | 14,906 | 4.8% |
| Albania | 26 | 0.0% |
| Argentina | 82 | 0.0% |
| Armenia | 4 | 0.0% |
| Asia | 30,356 | 9.8% |
| Australia | 203 | 0.1% |
| Austria | 44 | 0.0% |
| Bahamas | 28 | 0.0% |
| Bangladesh | 37 | 0.0% |
| Barbados | 31 | 0.0% |
| Belarus | 29 | 0.0% |
| Belgium | 23 | 0.0% |
| Belize | 49 | 0.0% |
| Bolivia | 14 | 0.0% |
| Brazil | 46 | 0.0% |
| Bulgaria | 38 | 0.0% |
| Cambodia | 385 | 0.1% |
| Cameroon | 399 | 0.1% |
| Canada | 882 | 0.3% |
| Caribbean | 433 | 0.1% |
| Central America | 7,699 | 2.5% |
| Chile | 17 | 0.0% |
| China | 1,786 | 0.6% |
| Colombia | 362 | 0.1% |
| Congo | 120 | 0.0% |
| Costa Rica | 83 | 0.0% |
| Croatia | 8 | 0.0% |
| Cuba | 31 | 0.0% |
| Czechoslovakia | 50 | 0.0% |
| Dominican Republic | 125 | 0.0% |
| Eastern Africa | 11,496 | 3.7% |
| Eastern Asia | 2,897 | 0.9% |
| Eastern Europe | 960 | 0.3% |
| Ecuador | 144 | 0.1% |
| Egypt | 84 | 0.0% |
| El Salvador | 1,853 | 0.6% |
| England | 245 | 0.1% |
| Eritrea | 1,116 | 0.4% |
| Ethiopia | 4,652 | 1.5% |
| Europe | 2,399 | 0.8% |
| Fiji | 10 | 0.0% |
| France | 140 | 0.1% |
| Germany | 381 | 0.1% |
| Ghana | 360 | 0.1% |
| Greece | 9 | 0.0% |
| Guatemala | 203 | 0.1% |
| Guyana | 161 | 0.1% |
| Haiti | 44 | 0.0% |
| Honduras | 191 | 0.1% |
| Hong Kong | 33 | 0.0% |
| Hungary | 57 | 0.0% |
| India | 897 | 0.3% |
| Indonesia | 23 | 0.0% |
| Iran | 113 | 0.0% |
| Iraq | 19 | 0.0% |
| Ireland | 74 | 0.0% |
| Israel | 55 | 0.0% |
| Italy | 8 | 0.0% |
| Jamaica | 156 | 0.1% |
| Japan | 172 | 0.1% |
| Jordan | 20 | 0.0% |
| Kazakhstan | 18 | 0.0% |
| Kenya | 1,416 | 0.5% |
| Korea | 939 | 0.3% |
| Laos | 8,129 | 2.6% |
| Latin America | 9,369 | 3.0% |
| Lebanon | 70 | 0.0% |
| Liberia | 491 | 0.2% |
| Malaysia | 72 | 0.0% |
| Mexico | 5,139 | 1.7% |
| Middle Africa | 690 | 0.2% |
| Moldova | 37 | 0.0% |
| Morocco | 76 | 0.0% |
| Nepal | 544 | 0.2% |
| Netherlands | 36 | 0.0% |
| Nicaragua | 181 | 0.1% |
| Nigeria | 800 | 0.3% |
| North Macedonia | 11 | 0.0% |
| Northern Africa | 301 | 0.1% |
| Northern Europe | 601 | 0.2% |
| Oceania | 221 | 0.1% |
| Pakistan | 65 | 0.0% |
| Peru | 185 | 0.1% |
| Philippines | 649 | 0.2% |
| Poland | 96 | 0.0% |
| Portugal | 15 | 0.0% |
| Romania | 46 | 0.0% |
| Russia | 237 | 0.1% |
| Saudi Arabia | 20 | 0.0% |
| Senegal | 6 | 0.0% |
| Sierra Leone | 71 | 0.0% |
| Singapore | 7 | 0.0% |
| Somalia | 3,690 | 1.2% |
| South Africa | 50 | 0.0% |
| South America | 1,237 | 0.4% |
| South Central Asia | 2,283 | 0.7% |
| South Eastern Asia | 24,863 | 8.1% |
| Southern Europe | 171 | 0.1% |
| Spain | 121 | 0.0% |
| Sri Lanka | 33 | 0.0% |
| Sudan | 125 | 0.0% |
| Sweden | 80 | 0.0% |
| Switzerland | 22 | 0.0% |
| Taiwan | 64 | 0.0% |
| Thailand | 8,198 | 2.6% |
| Trinidad and Tobago | 18 | 0.0% |
| Turkey | 44 | 0.0% |
| Uganda | 141 | 0.1% |
| Ukraine | 309 | 0.1% |
| Uruguay | 60 | 0.0% |
| Venezuela | 143 | 0.1% |
| Vietnam | 1,665 | 0.5% |
| Western Africa | 2,044 | 0.7% |
| Western Asia | 303 | 0.1% |
| Western Europe | 646 | 0.2% |
| Yemen | 36 | 0.0% |
| Zaire | 171 | 0.1% |
| Zimbabwe | 39 | 0.0% | View All 119 Rows |
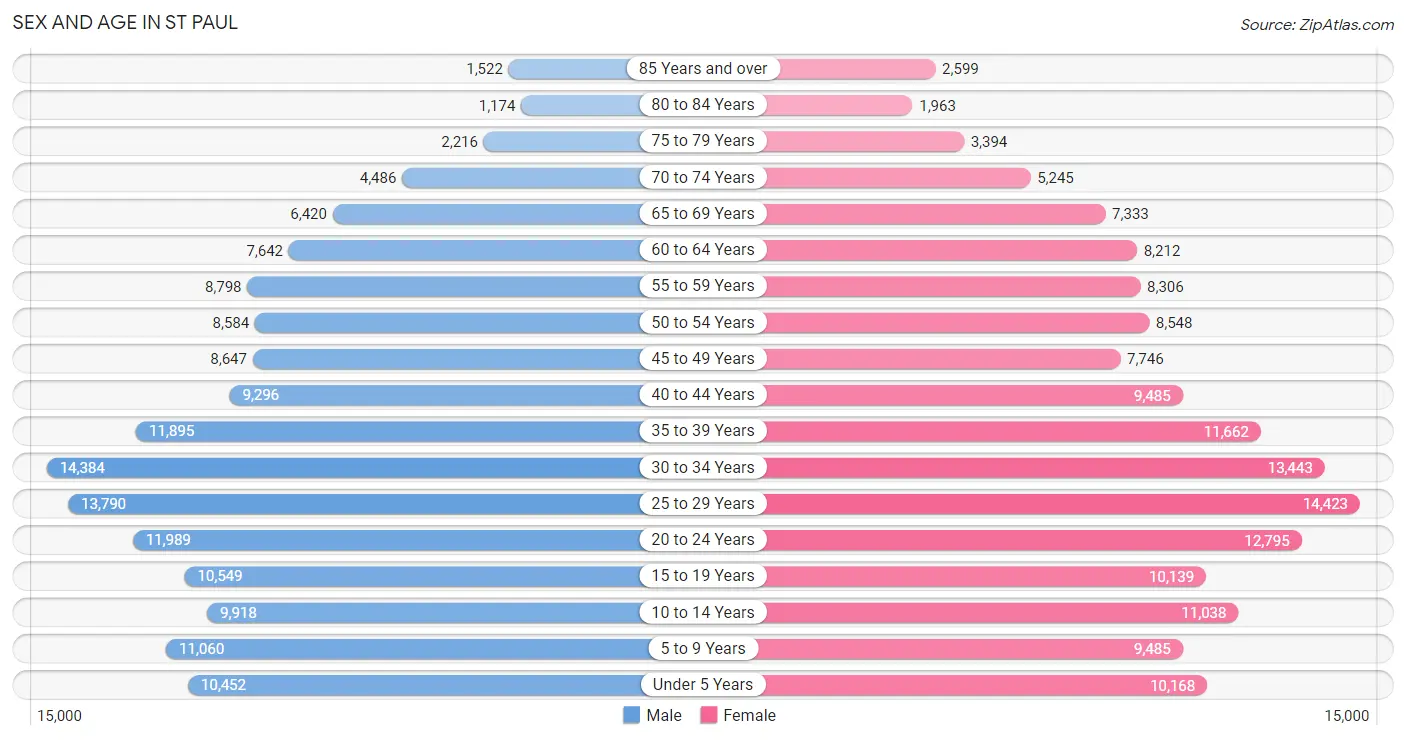
Sex and Age in St Paul
Sex and Age in St Paul
The most populous age groups in St Paul are 30 to 34 Years (14,384 | 9.4%) for men and 25 to 29 Years (14,423 | 9.2%) for women.
| Age Bracket | Male | Female |
| Under 5 Years | 10,452 (6.8%) | 10,168 (6.5%) |
| 5 to 9 Years | 11,060 (7.2%) | 9,485 (6.1%) |
| 10 to 14 Years | 9,918 (6.5%) | 11,038 (7.1%) |
| 15 to 19 Years | 10,549 (6.9%) | 10,139 (6.5%) |
| 20 to 24 Years | 11,989 (7.9%) | 12,795 (8.2%) |
| 25 to 29 Years | 13,790 (9.0%) | 14,423 (9.2%) |
| 30 to 34 Years | 14,384 (9.4%) | 13,443 (8.6%) |
| 35 to 39 Years | 11,895 (7.8%) | 11,662 (7.5%) |
| 40 to 44 Years | 9,296 (6.1%) | 9,485 (6.1%) |
| 45 to 49 Years | 8,647 (5.7%) | 7,746 (5.0%) |
| 50 to 54 Years | 8,584 (5.6%) | 8,548 (5.5%) |
| 55 to 59 Years | 8,798 (5.8%) | 8,306 (5.3%) |
| 60 to 64 Years | 7,642 (5.0%) | 8,212 (5.3%) |
| 65 to 69 Years | 6,420 (4.2%) | 7,333 (4.7%) |
| 70 to 74 Years | 4,486 (2.9%) | 5,245 (3.4%) |
| 75 to 79 Years | 2,216 (1.5%) | 3,394 (2.2%) |
| 80 to 84 Years | 1,174 (0.8%) | 1,963 (1.3%) |
| 85 Years and over | 1,522 (1.0%) | 2,599 (1.7%) |
| Total | 152,822 (100.0%) | 155,984 (100.0%) |
Families and Households in St Paul
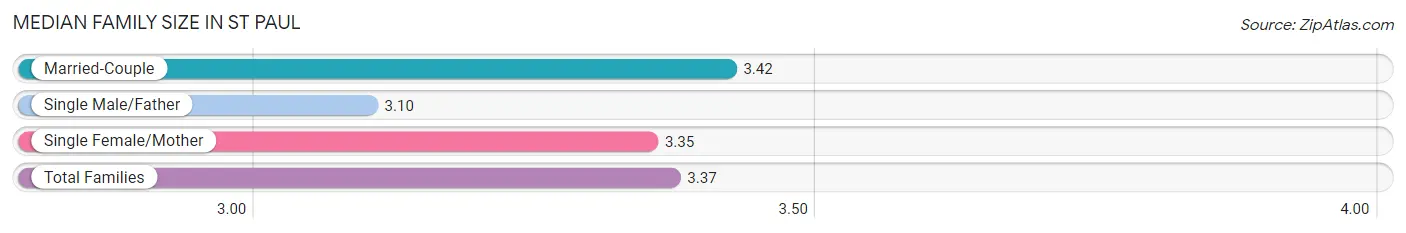
Median Family Size in St Paul
The median family size in St Paul is 3.37 persons per family, with married-couple families (41,789 | 65.7%) accounting for the largest median family size of 3.42 persons per family. On the other hand, single male/father families (6,263 | 9.8%) represent the smallest median family size with 3.10 persons per family.
| Family Type | # Families | Family Size |
| Married-Couple | 41,789 (65.7%) | 3.42 |
| Single Male/Father | 6,263 (9.8%) | 3.10 |
| Single Female/Mother | 15,585 (24.5%) | 3.35 |
| Total Families | 63,637 (100.0%) | 3.37 |
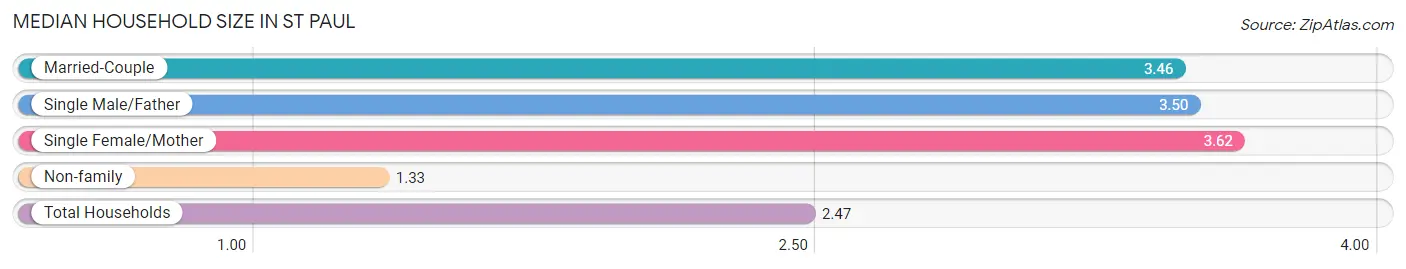
Median Household Size in St Paul
The median household size in St Paul is 2.47 persons per household, with single female/mother households (15,585 | 12.9%) accounting for the largest median household size of 3.62 persons per household. non-family households (57,575 | 47.5%) represent the smallest median household size with 1.33 persons per household.
| Household Type | # Households | Household Size |
| Married-Couple | 41,789 (34.5%) | 3.46 |
| Single Male/Father | 6,263 (5.2%) | 3.50 |
| Single Female/Mother | 15,585 (12.9%) | 3.62 |
| Non-family | 57,575 (47.5%) | 1.33 |
| Total Households | 121,212 (100.0%) | 2.47 |
Household Size by Marriage Status in St Paul
Out of a total of 121,212 households in St Paul, 63,637 (52.5%) are family households, while 57,575 (47.5%) are nonfamily households. The most numerous type of family households are 2-person households, comprising 25,181, and the most common type of nonfamily households are 1-person households, comprising 44,672.
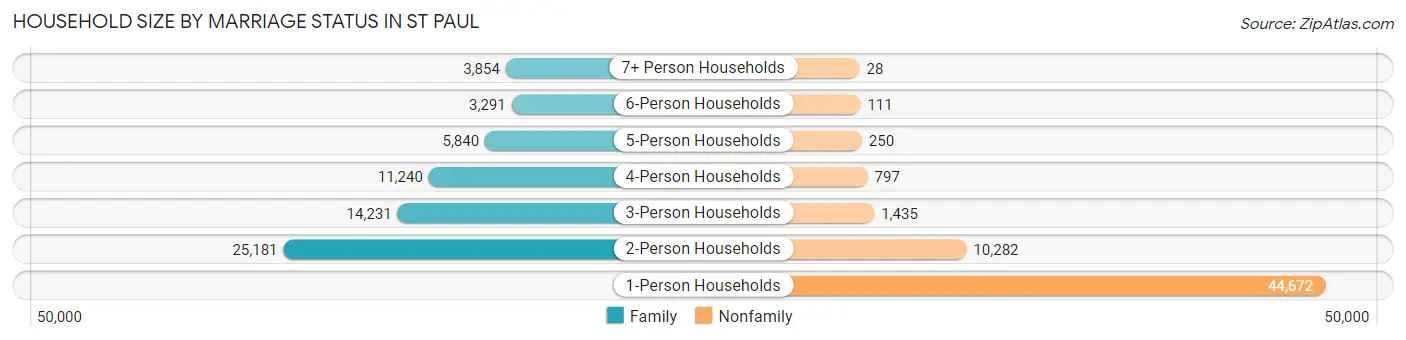
| Household Size | Family Households | Nonfamily Households |
| 1-Person Households | - | 44,672 (36.8%) |
| 2-Person Households | 25,181 (20.8%) | 10,282 (8.5%) |
| 3-Person Households | 14,231 (11.7%) | 1,435 (1.2%) |
| 4-Person Households | 11,240 (9.3%) | 797 (0.7%) |
| 5-Person Households | 5,840 (4.8%) | 250 (0.2%) |
| 6-Person Households | 3,291 (2.7%) | 111 (0.1%) |
| 7+ Person Households | 3,854 (3.2%) | 28 (0.0%) |
| Total | 63,637 (52.5%) | 57,575 (47.5%) |
Female Fertility in St Paul
Fertility by Age in St Paul
Average fertility rate in St Paul is 58.0 births per 1,000 women. Women in the age bracket of 20 to 34 years have the highest fertility rate with 86.0 births per 1,000 women. Women in the age bracket of 20 to 34 years acount for 73.3% of all women with births.
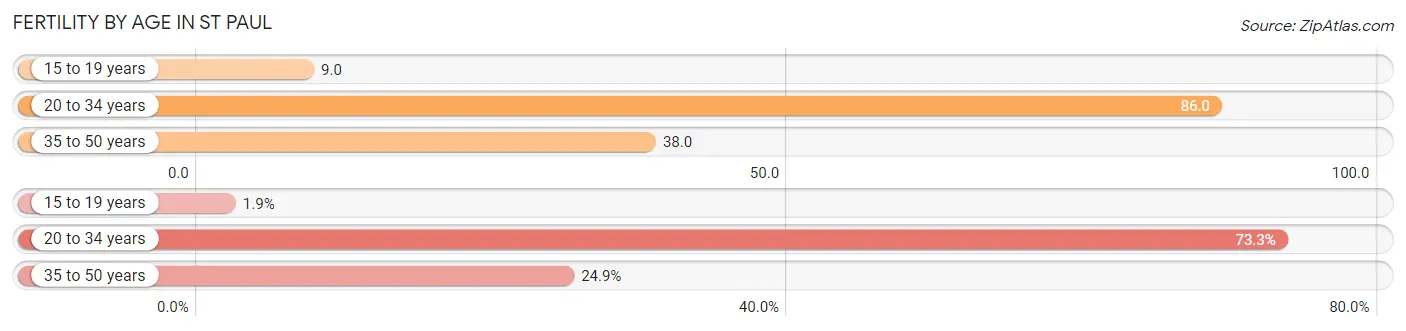
| Age Bracket | Women with Births | Births / 1,000 Women |
| 15 to 19 years | 90 (1.9%) | 9.0 |
| 20 to 34 years | 3,487 (73.3%) | 86.0 |
| 35 to 50 years | 1,183 (24.8%) | 38.0 |
| Total | 4,760 (100.0%) | 58.0 |
Fertility by Age by Marriage Status in St Paul
70.3% of women with births (4,760) in St Paul are married. The highest percentage of unmarried women with births falls into 15 to 19 years age bracket with 100.0% of them unmarried at the time of birth, while the lowest percentage of unmarried women with births belong to 35 to 50 years age bracket with 18.0% of them unmarried.
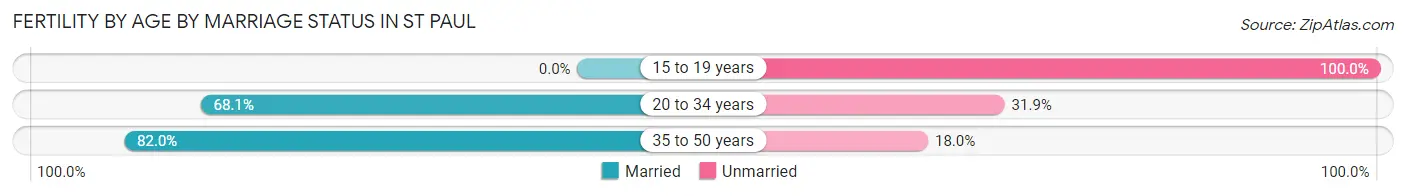
| Age Bracket | Married | Unmarried |
| 15 to 19 years | 0 (0.0%) | 90 (100.0%) |
| 20 to 34 years | 2,375 (68.1%) | 1,112 (31.9%) |
| 35 to 50 years | 970 (82.0%) | 213 (18.0%) |
| Total | 3,346 (70.3%) | 1,414 (29.7%) |
Fertility by Education in St Paul
Average fertility rate in St Paul is 58.0 births per 1,000 women. Women with the education attainment of high school diploma have the highest fertility rate of 103.0 births per 1,000 women, while women with the education attainment of bachelor's degree have the lowest fertility at 44.0 births per 1,000 women. Women with the education attainment of high school diploma represent 27.2% of all women with births.
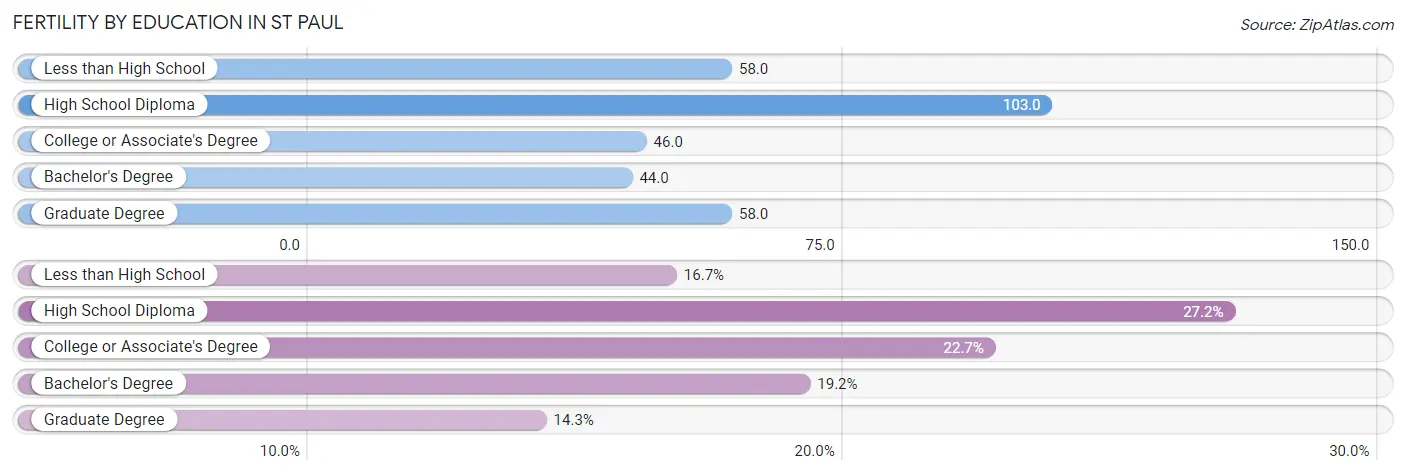
| Educational Attainment | Women with Births | Births / 1,000 Women |
| Less than High School | 795 (16.7%) | 58.0 |
| High School Diploma | 1,293 (27.2%) | 103.0 |
| College or Associate's Degree | 1,079 (22.7%) | 46.0 |
| Bachelor's Degree | 914 (19.2%) | 44.0 |
| Graduate Degree | 679 (14.3%) | 58.0 |
| Total | 4,760 (100.0%) | 58.0 |
Fertility by Education by Marriage Status in St Paul
29.7% of women with births in St Paul are unmarried. Women with the educational attainment of graduate degree are most likely to be married with 97.5% of them married at childbirth, while women with the educational attainment of college or associate's degree are least likely to be married with 47.7% of them unmarried at childbirth.
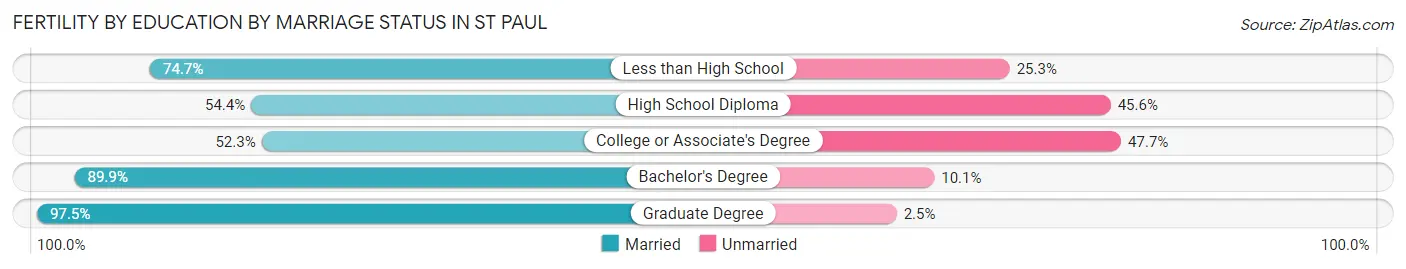
| Educational Attainment | Married | Unmarried |
| Less than High School | 594 (74.7%) | 201 (25.3%) |
| High School Diploma | 703 (54.4%) | 590 (45.6%) |
| College or Associate's Degree | 564 (52.3%) | 515 (47.7%) |
| Bachelor's Degree | 822 (89.9%) | 92 (10.1%) |
| Graduate Degree | 662 (97.5%) | 17 (2.5%) |
| Total | 3,346 (70.3%) | 1,414 (29.7%) |
Employment Characteristics in St Paul
Employment by Class of Employer in St Paul
Among the 158,824 employed individuals in St Paul, private company employees (100,246 | 63.1%), not-for-profit organizations (25,156 | 15.8%), and local government employees (10,132 | 6.4%) make up the most common classes of employment.
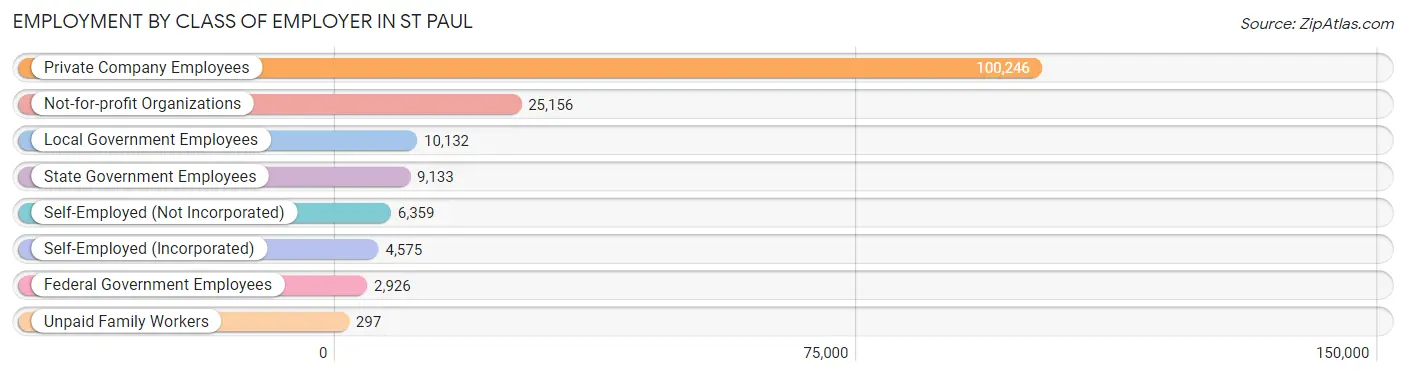
| Employer Class | # Employees | % Employees |
| Private Company Employees | 100,246 | 63.1% |
| Self-Employed (Incorporated) | 4,575 | 2.9% |
| Self-Employed (Not Incorporated) | 6,359 | 4.0% |
| Not-for-profit Organizations | 25,156 | 15.8% |
| Local Government Employees | 10,132 | 6.4% |
| State Government Employees | 9,133 | 5.8% |
| Federal Government Employees | 2,926 | 1.8% |
| Unpaid Family Workers | 297 | 0.2% |
| Total | 158,824 | 100.0% |
Employment Status by Age in St Paul
According to the labor force statistics for St Paul, out of the total population over 16 years of age (242,714), 70.3% or 170,628 individuals are in the labor force, with 5.0% or 8,531 of them unemployed. The age group with the highest labor force participation rate is 25 to 29 years, with 88.3% or 24,912 individuals in the labor force. Within the labor force, the 16 to 19 years age range has the highest percentage of unemployed individuals, with 15.0% or 1,226 of them being unemployed.
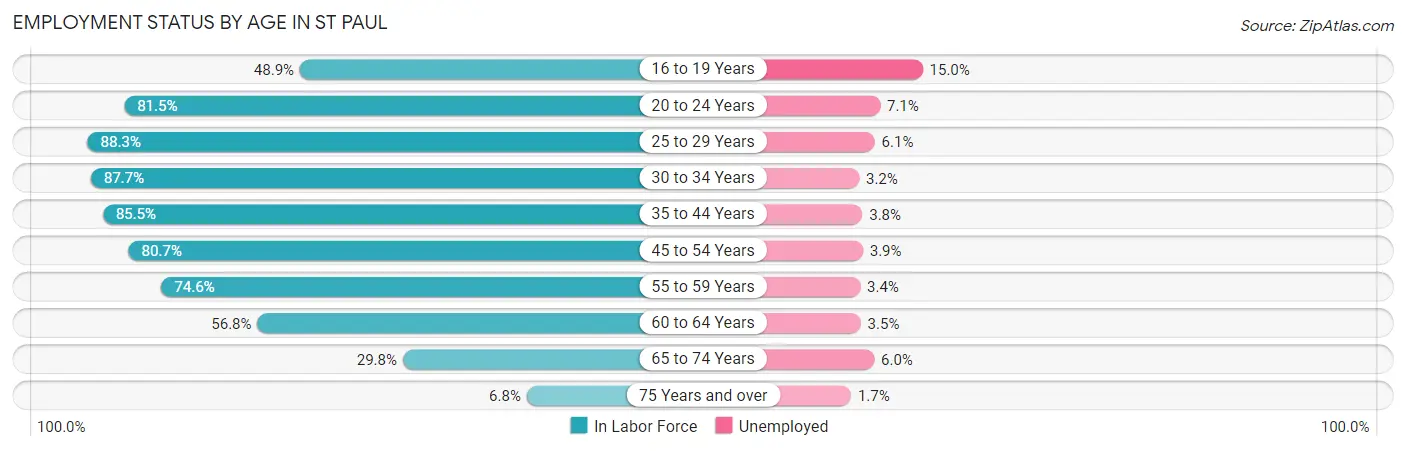
| Age Bracket | In Labor Force | Unemployed |
| 16 to 19 Years | 8,175 (48.9%) | 1,226 (15.0%) |
| 20 to 24 Years | 20,199 (81.5%) | 1,434 (7.1%) |
| 25 to 29 Years | 24,912 (88.3%) | 1,520 (6.1%) |
| 30 to 34 Years | 24,404 (87.7%) | 781 (3.2%) |
| 35 to 44 Years | 36,199 (85.5%) | 1,376 (3.8%) |
| 45 to 54 Years | 27,055 (80.7%) | 1,055 (3.9%) |
| 55 to 59 Years | 12,760 (74.6%) | 434 (3.4%) |
| 60 to 64 Years | 9,005 (56.8%) | 315 (3.5%) |
| 65 to 74 Years | 6,998 (29.8%) | 420 (6.0%) |
| 75 Years and over | 875 (6.8%) | 15 (1.7%) |
| Total | 170,628 (70.3%) | 8,531 (5.0%) |
Employment Status by Educational Attainment in St Paul
According to labor force statistics for St Paul, 81.5% of individuals (134,362) out of the total population between 25 and 64 years of age (164,861) are in the labor force, with 4.1% or 5,509 of them being unemployed. The group with the highest labor force participation rate are those with the educational attainment of bachelor's degree or higher, with 90.7% or 65,271 individuals in the labor force. Within the labor force, individuals with high school diploma education have the highest percentage of unemployment, with 5.7% or 1,341 of them being unemployed.
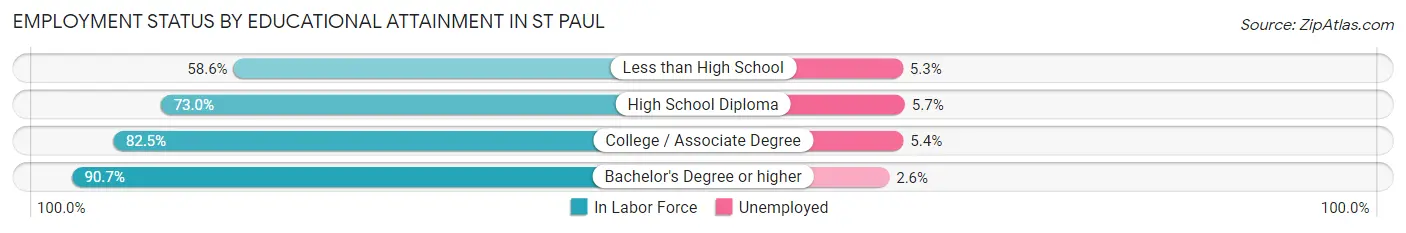
| Educational Attainment | In Labor Force | Unemployed |
| Less than High School | 11,073 (58.6%) | 1,001 (5.3%) |
| High School Diploma | 23,521 (73.0%) | 1,837 (5.7%) |
| College / Associate Degree | 34,468 (82.5%) | 2,256 (5.4%) |
| Bachelor's Degree or higher | 65,271 (90.7%) | 1,871 (2.6%) |
| Total | 134,362 (81.5%) | 6,759 (4.1%) |
Employment Occupations by Sex in St Paul
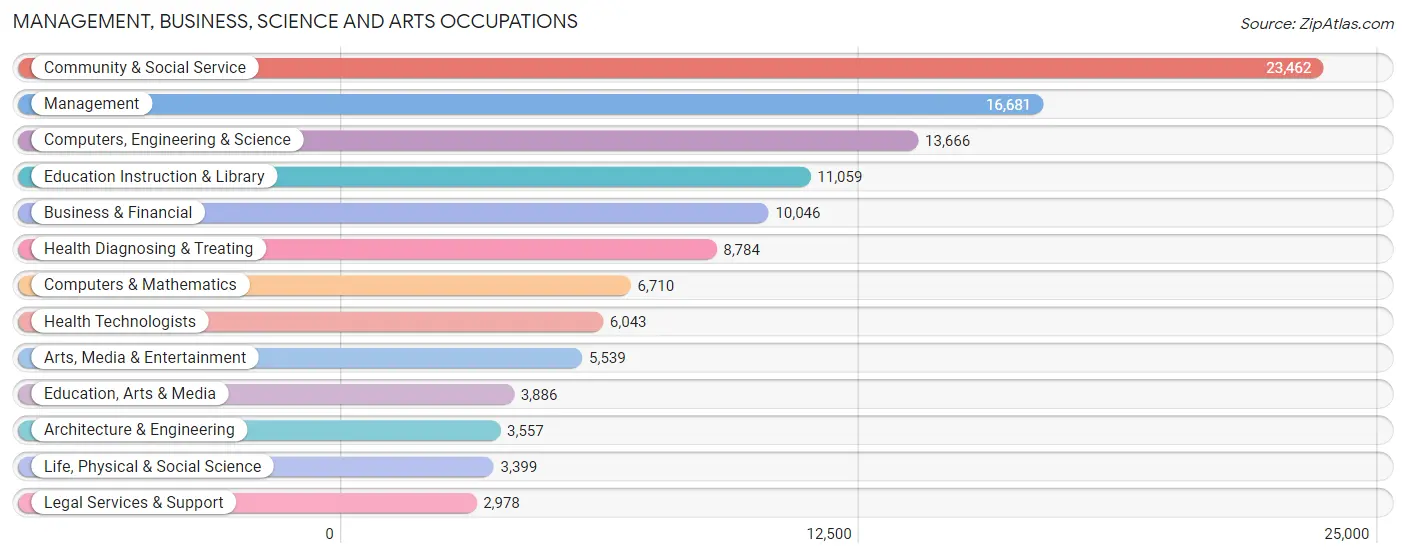
Management, Business, Science and Arts Occupations
The most common Management, Business, Science and Arts occupations in St Paul are Community & Social Service (23,462 | 14.5%), Management (16,681 | 10.3%), Computers, Engineering & Science (13,666 | 8.4%), Education Instruction & Library (11,059 | 6.8%), and Business & Financial (10,046 | 6.2%).
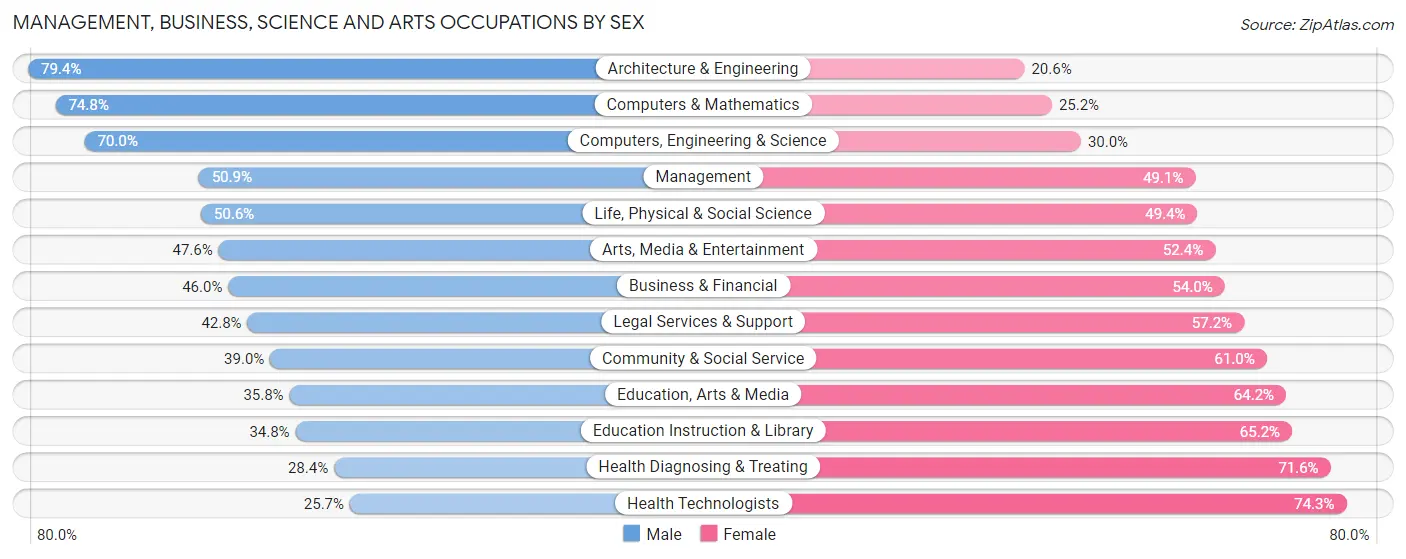
Management, Business, Science and Arts Occupations by Sex
Within the Management, Business, Science and Arts occupations in St Paul, the most male-oriented occupations are Architecture & Engineering (79.4%), Computers & Mathematics (74.8%), and Computers, Engineering & Science (70.0%), while the most female-oriented occupations are Health Technologists (74.3%), Health Diagnosing & Treating (71.6%), and Education Instruction & Library (65.2%).
| Occupation | Male | Female |
| Management | 8,495 (50.9%) | 8,186 (49.1%) |
| Business & Financial | 4,623 (46.0%) | 5,423 (54.0%) |
| Computers, Engineering & Science | 9,566 (70.0%) | 4,100 (30.0%) |
| Computers & Mathematics | 5,022 (74.8%) | 1,688 (25.2%) |
| Architecture & Engineering | 2,825 (79.4%) | 732 (20.6%) |
| Life, Physical & Social Science | 1,719 (50.6%) | 1,680 (49.4%) |
| Community & Social Service | 9,154 (39.0%) | 14,308 (61.0%) |
| Education, Arts & Media | 1,391 (35.8%) | 2,495 (64.2%) |
| Legal Services & Support | 1,275 (42.8%) | 1,703 (57.2%) |
| Education Instruction & Library | 3,849 (34.8%) | 7,210 (65.2%) |
| Arts, Media & Entertainment | 2,639 (47.6%) | 2,900 (52.4%) |
| Health Diagnosing & Treating | 2,492 (28.4%) | 6,292 (71.6%) |
| Health Technologists | 1,554 (25.7%) | 4,489 (74.3%) |
| Total (Category) | 34,330 (47.3%) | 38,309 (52.7%) |
| Total (Overall) | 82,339 (50.8%) | 79,589 (49.1%) |
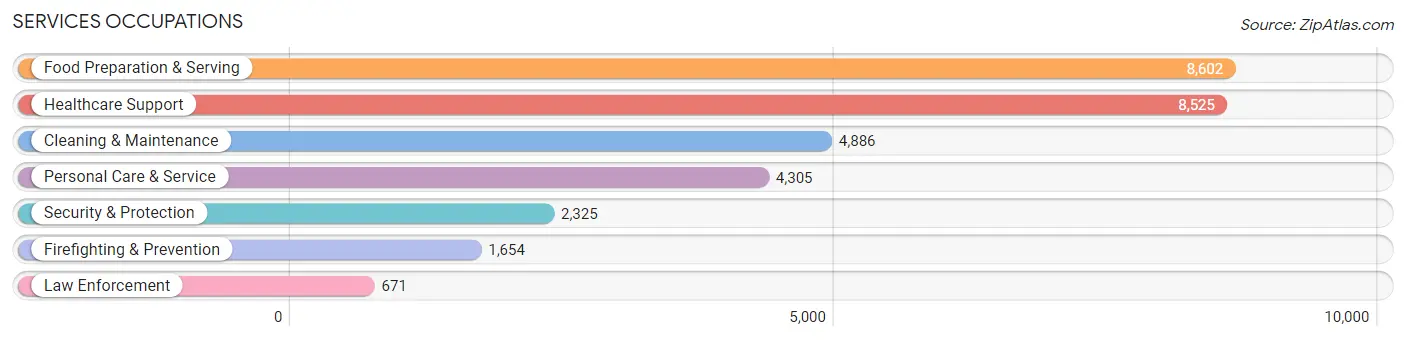
Services Occupations
The most common Services occupations in St Paul are Food Preparation & Serving (8,602 | 5.3%), Healthcare Support (8,525 | 5.3%), Cleaning & Maintenance (4,886 | 3.0%), Personal Care & Service (4,305 | 2.7%), and Security & Protection (2,325 | 1.4%).
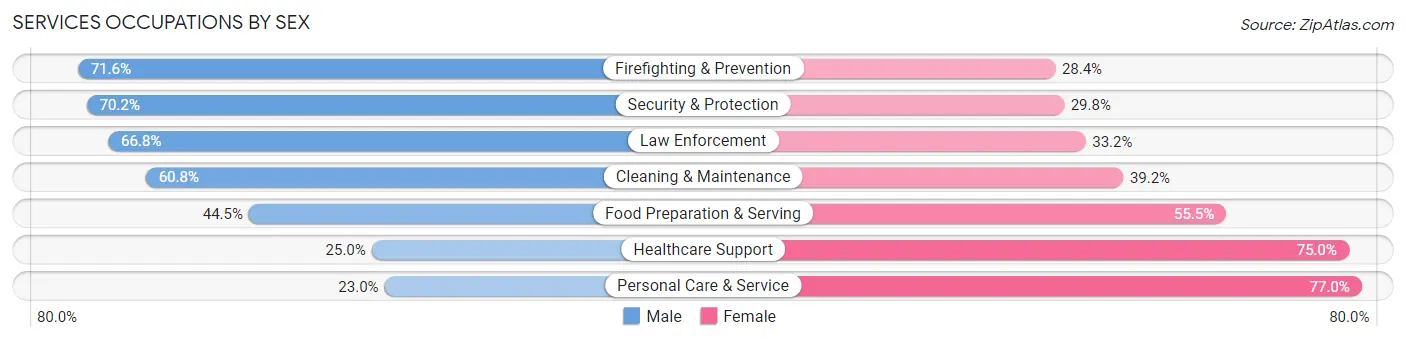
Services Occupations by Sex
Within the Services occupations in St Paul, the most male-oriented occupations are Firefighting & Prevention (71.6%), Security & Protection (70.2%), and Law Enforcement (66.8%), while the most female-oriented occupations are Personal Care & Service (77.0%), Healthcare Support (75.0%), and Food Preparation & Serving (55.5%).
| Occupation | Male | Female |
| Healthcare Support | 2,134 (25.0%) | 6,391 (75.0%) |
| Security & Protection | 1,632 (70.2%) | 693 (29.8%) |
| Firefighting & Prevention | 1,184 (71.6%) | 470 (28.4%) |
| Law Enforcement | 448 (66.8%) | 223 (33.2%) |
| Food Preparation & Serving | 3,826 (44.5%) | 4,776 (55.5%) |
| Cleaning & Maintenance | 2,971 (60.8%) | 1,915 (39.2%) |
| Personal Care & Service | 990 (23.0%) | 3,315 (77.0%) |
| Total (Category) | 11,553 (40.3%) | 17,090 (59.7%) |
| Total (Overall) | 82,339 (50.8%) | 79,589 (49.1%) |
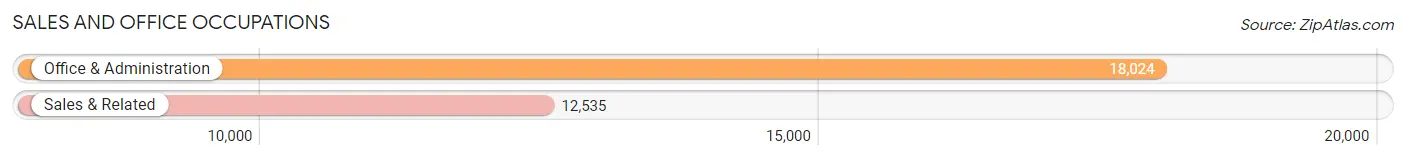
Sales and Office Occupations
The most common Sales and Office occupations in St Paul are Office & Administration (18,024 | 11.1%), and Sales & Related (12,535 | 7.7%).
Sales and Office Occupations by Sex
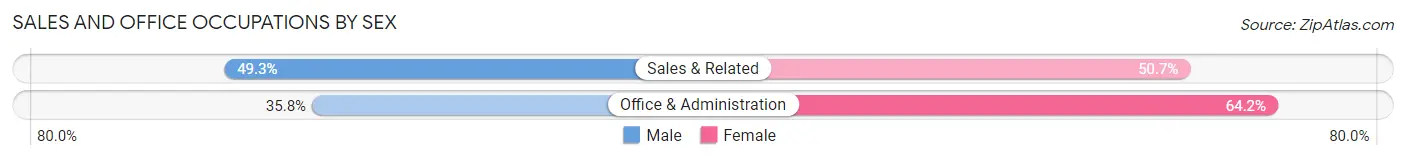
| Occupation | Male | Female |
| Sales & Related | 6,178 (49.3%) | 6,357 (50.7%) |
| Office & Administration | 6,452 (35.8%) | 11,572 (64.2%) |
| Total (Category) | 12,630 (41.3%) | 17,929 (58.7%) |
| Total (Overall) | 82,339 (50.8%) | 79,589 (49.1%) |
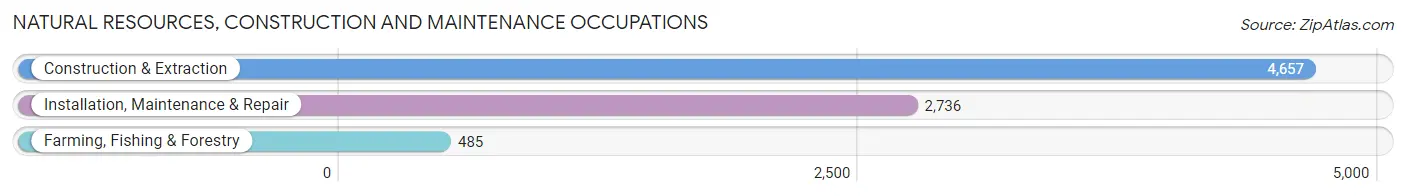
Natural Resources, Construction and Maintenance Occupations
The most common Natural Resources, Construction and Maintenance occupations in St Paul are Construction & Extraction (4,657 | 2.9%), Installation, Maintenance & Repair (2,736 | 1.7%), and Farming, Fishing & Forestry (485 | 0.3%).
Natural Resources, Construction and Maintenance Occupations by Sex
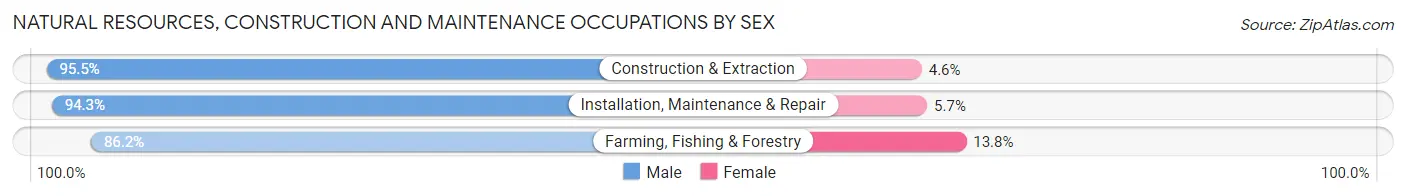
| Occupation | Male | Female |
| Farming, Fishing & Forestry | 418 (86.2%) | 67 (13.8%) |
| Construction & Extraction | 4,445 (95.5%) | 212 (4.5%) |
| Installation, Maintenance & Repair | 2,581 (94.3%) | 155 (5.7%) |
| Total (Category) | 7,444 (94.5%) | 434 (5.5%) |
| Total (Overall) | 82,339 (50.8%) | 79,589 (49.1%) |
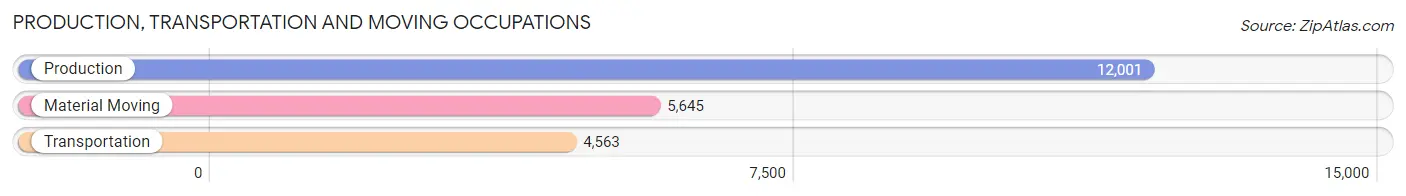
Production, Transportation and Moving Occupations
The most common Production, Transportation and Moving occupations in St Paul are Production (12,001 | 7.4%), Material Moving (5,645 | 3.5%), and Transportation (4,563 | 2.8%).
Production, Transportation and Moving Occupations by Sex
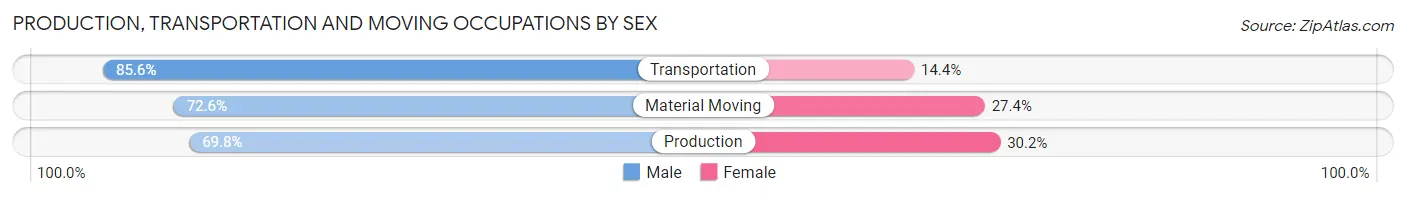
| Occupation | Male | Female |
| Production | 8,376 (69.8%) | 3,625 (30.2%) |
| Transportation | 3,906 (85.6%) | 657 (14.4%) |
| Material Moving | 4,100 (72.6%) | 1,545 (27.4%) |
| Total (Category) | 16,382 (73.8%) | 5,827 (26.2%) |
| Total (Overall) | 82,339 (50.8%) | 79,589 (49.1%) |
Employment Industries by Sex in St Paul
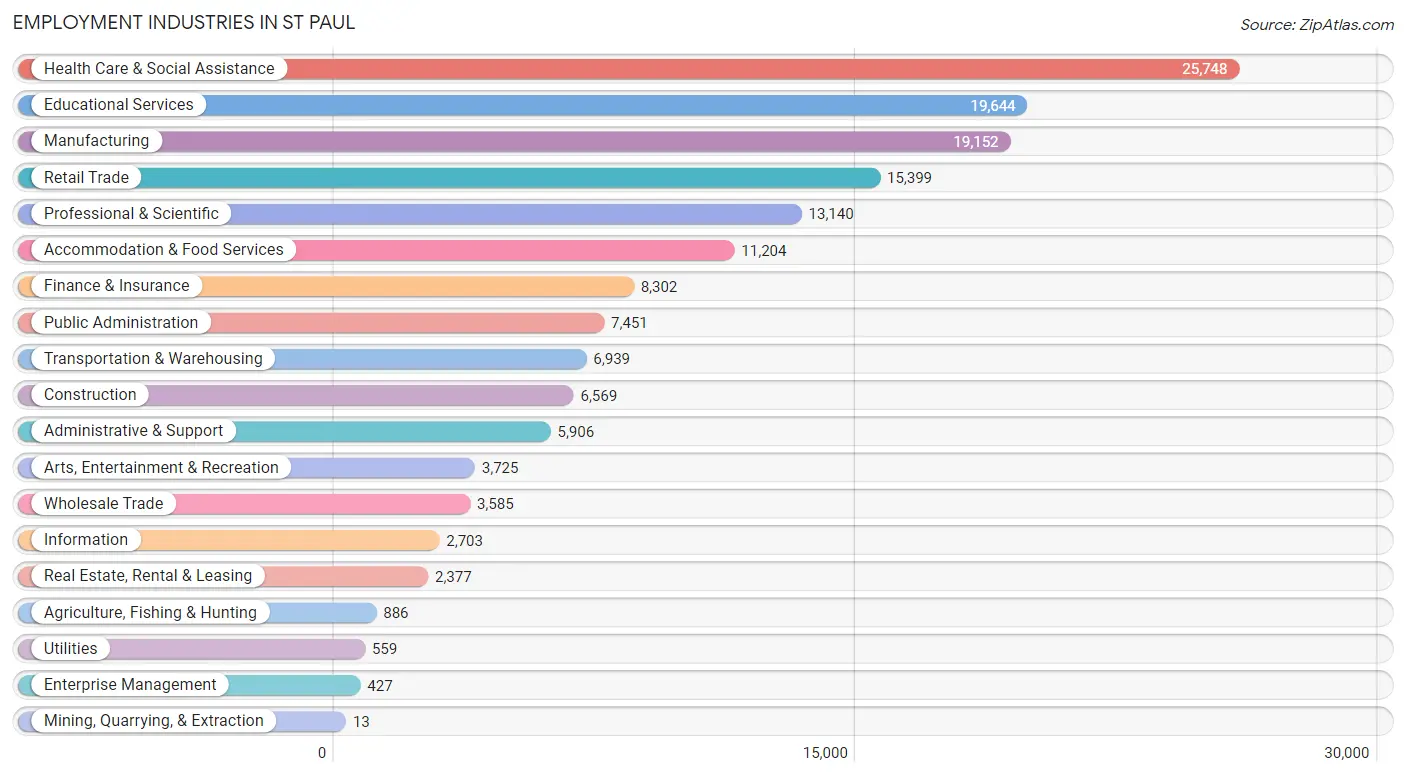
Employment Industries in St Paul
The major employment industries in St Paul include Health Care & Social Assistance (25,748 | 15.9%), Educational Services (19,644 | 12.1%), Manufacturing (19,152 | 11.8%), Retail Trade (15,399 | 9.5%), and Professional & Scientific (13,140 | 8.1%).
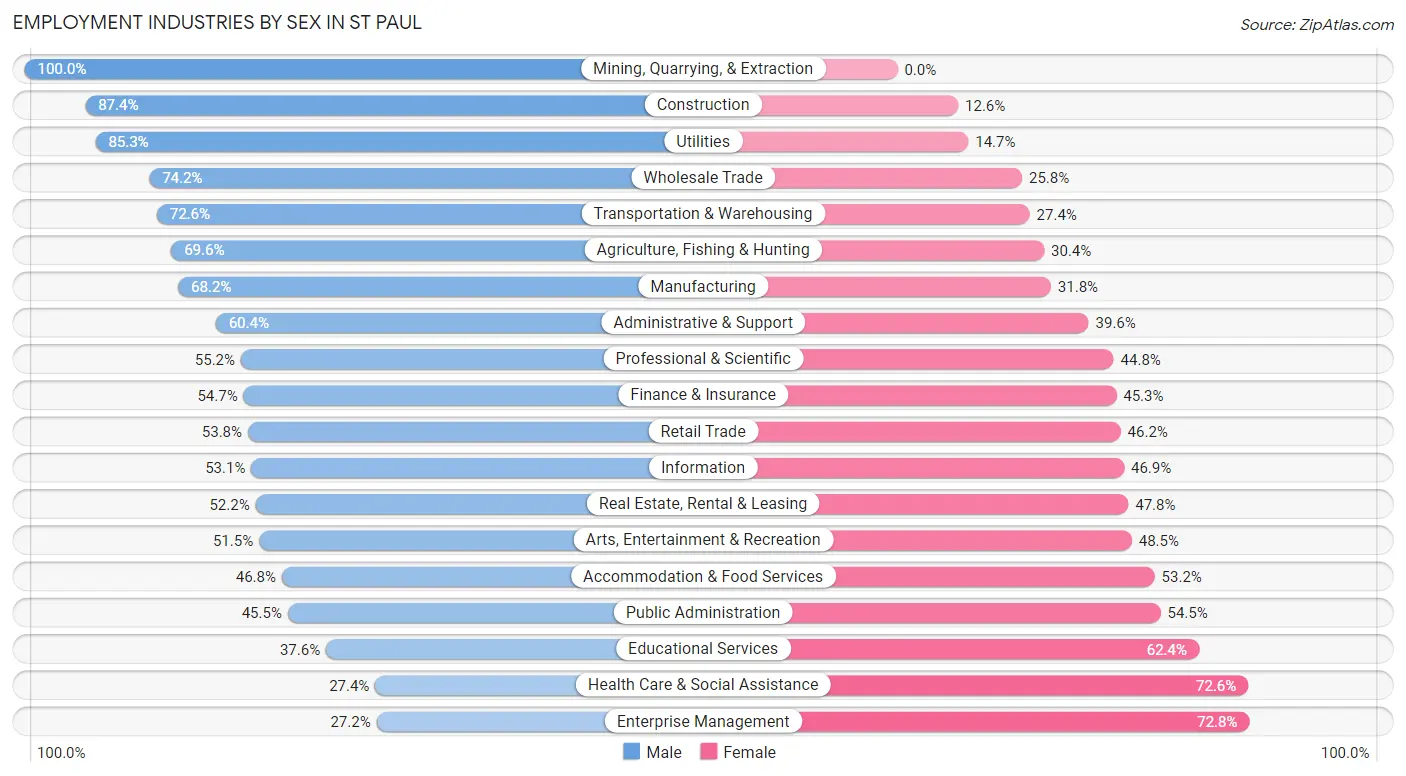
Employment Industries by Sex in St Paul
The St Paul industries that see more men than women are Mining, Quarrying, & Extraction (100.0%), Construction (87.4%), and Utilities (85.3%), whereas the industries that tend to have a higher number of women are Enterprise Management (72.8%), Health Care & Social Assistance (72.6%), and Educational Services (62.4%).
| Industry | Male | Female |
| Agriculture, Fishing & Hunting | 617 (69.6%) | 269 (30.4%) |
| Mining, Quarrying, & Extraction | 13 (100.0%) | 0 (0.0%) |
| Construction | 5,744 (87.4%) | 825 (12.6%) |
| Manufacturing | 13,067 (68.2%) | 6,085 (31.8%) |
| Wholesale Trade | 2,660 (74.2%) | 925 (25.8%) |
| Retail Trade | 8,283 (53.8%) | 7,116 (46.2%) |
| Transportation & Warehousing | 5,040 (72.6%) | 1,899 (27.4%) |
| Utilities | 477 (85.3%) | 82 (14.7%) |
| Information | 1,435 (53.1%) | 1,268 (46.9%) |
| Finance & Insurance | 4,540 (54.7%) | 3,762 (45.3%) |
| Real Estate, Rental & Leasing | 1,241 (52.2%) | 1,136 (47.8%) |
| Professional & Scientific | 7,258 (55.2%) | 5,882 (44.8%) |
| Enterprise Management | 116 (27.2%) | 311 (72.8%) |
| Administrative & Support | 3,569 (60.4%) | 2,337 (39.6%) |
| Educational Services | 7,390 (37.6%) | 12,254 (62.4%) |
| Health Care & Social Assistance | 7,062 (27.4%) | 18,686 (72.6%) |
| Arts, Entertainment & Recreation | 1,918 (51.5%) | 1,807 (48.5%) |
| Accommodation & Food Services | 5,239 (46.8%) | 5,965 (53.2%) |
| Public Administration | 3,393 (45.5%) | 4,058 (54.5%) |
| Total | 82,339 (50.8%) | 79,589 (49.1%) |
Education in St Paul
School Enrollment in St Paul
The most common levels of schooling among the 84,362 students in St Paul are college / undergraduate (19,691 | 23.3%), middle school (16,490 | 19.6%), and high school (16,240 | 19.3%).
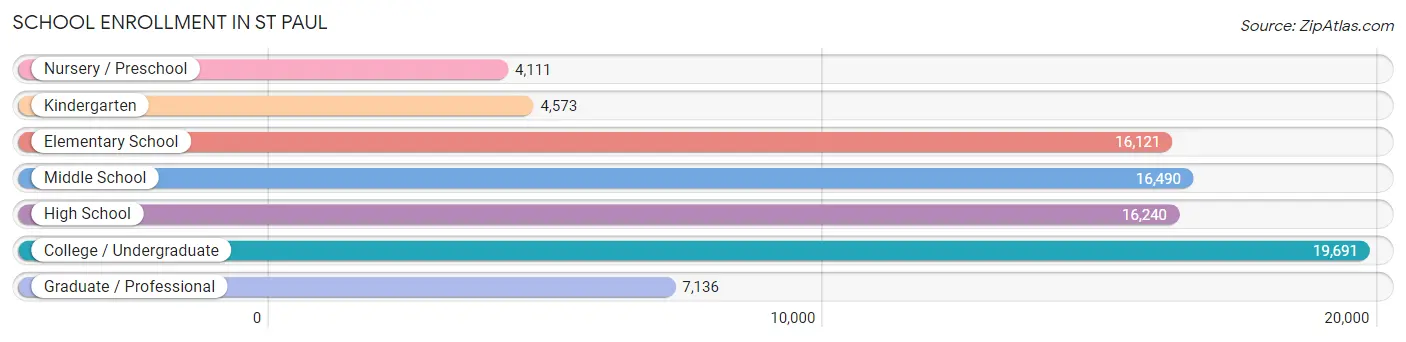
| School Level | # Students | % Students |
| Nursery / Preschool | 4,111 | 4.9% |
| Kindergarten | 4,573 | 5.4% |
| Elementary School | 16,121 | 19.1% |
| Middle School | 16,490 | 19.6% |
| High School | 16,240 | 19.3% |
| College / Undergraduate | 19,691 | 23.3% |
| Graduate / Professional | 7,136 | 8.5% |
| Total | 84,362 | 100.0% |
School Enrollment by Age by Funding Source in St Paul
Out of a total of 84,362 students who are enrolled in schools in St Paul, 19,656 (23.3%) attend a private institution, while the remaining 64,706 (76.7%) are enrolled in public schools. The age group of 20 to 24 year olds has the highest likelihood of being enrolled in private schools, with 5,312 (50.8% in the age bracket) enrolled. Conversely, the age group of 5 to 9 year old has the lowest likelihood of being enrolled in a private school, with 16,872 (87.4% in the age bracket) attending a public institution.
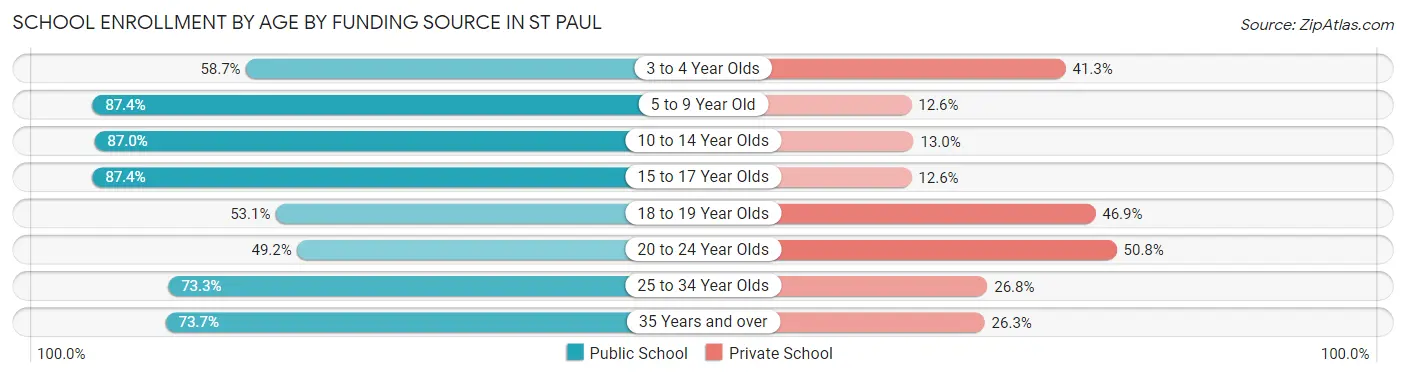
| Age Bracket | Public School | Private School |
| 3 to 4 Year Olds | 1,755 (58.7%) | 1,236 (41.3%) |
| 5 to 9 Year Old | 16,872 (87.4%) | 2,434 (12.6%) |
| 10 to 14 Year Olds | 17,936 (87.0%) | 2,683 (13.0%) |
| 15 to 17 Year Olds | 10,120 (87.4%) | 1,461 (12.6%) |
| 18 to 19 Year Olds | 3,577 (53.1%) | 3,155 (46.9%) |
| 20 to 24 Year Olds | 5,136 (49.2%) | 5,312 (50.8%) |
| 25 to 34 Year Olds | 6,266 (73.3%) | 2,288 (26.8%) |
| 35 Years and over | 3,046 (73.7%) | 1,085 (26.3%) |
| Total | 64,706 (76.7%) | 19,656 (23.3%) |
Educational Attainment by Field of Study in St Paul
Business (12,061 | 12.3%), social sciences (11,316 | 11.6%), literature & languages (8,467 | 8.6%), bio, nature & agricultural (7,844 | 8.0%), and education (7,406 | 7.6%) are the most common fields of study among 97,846 individuals in St Paul who have obtained a bachelor's degree or higher.
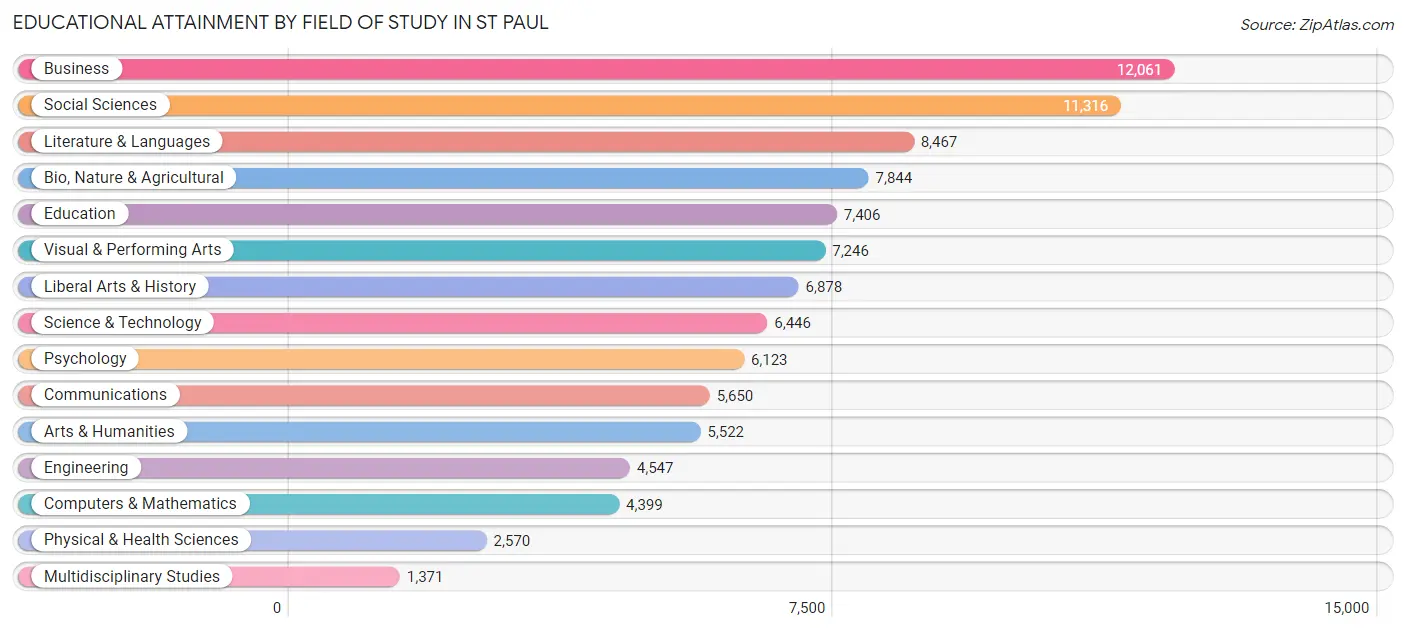
| Field of Study | # Graduates | % Graduates |
| Computers & Mathematics | 4,399 | 4.5% |
| Bio, Nature & Agricultural | 7,844 | 8.0% |
| Physical & Health Sciences | 2,570 | 2.6% |
| Psychology | 6,123 | 6.3% |
| Social Sciences | 11,316 | 11.6% |
| Engineering | 4,547 | 4.6% |
| Multidisciplinary Studies | 1,371 | 1.4% |
| Science & Technology | 6,446 | 6.6% |
| Business | 12,061 | 12.3% |
| Education | 7,406 | 7.6% |
| Literature & Languages | 8,467 | 8.6% |
| Liberal Arts & History | 6,878 | 7.0% |
| Visual & Performing Arts | 7,246 | 7.4% |
| Communications | 5,650 | 5.8% |
| Arts & Humanities | 5,522 | 5.6% |
| Total | 97,846 | 100.0% |
Transportation & Commute in St Paul
Vehicle Availability by Sex in St Paul
The most prevalent vehicle ownership categories in St Paul are males with 2 vehicles (32,737, accounting for 41.2%) and females with 2 vehicles (30,330, making up 42.9%).
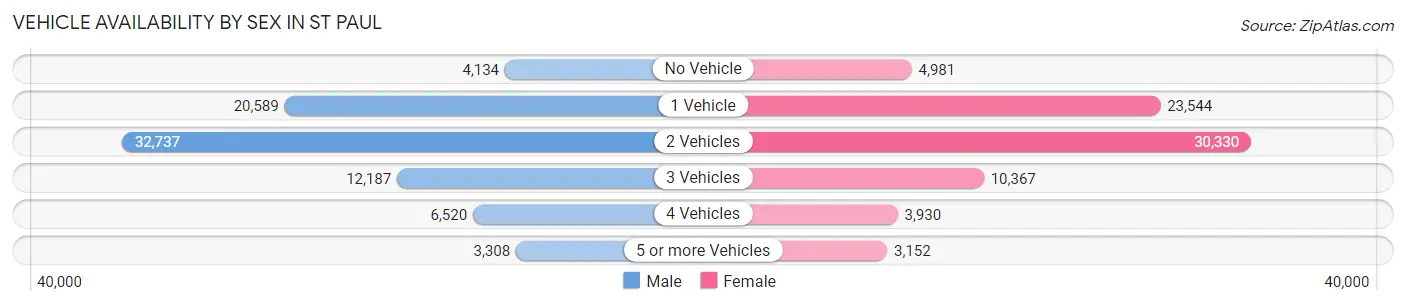
| Vehicles Available | Male | Female |
| No Vehicle | 4,134 (5.2%) | 4,981 (6.5%) |
| 1 Vehicle | 20,589 (25.9%) | 23,544 (30.9%) |
| 2 Vehicles | 32,737 (41.2%) | 30,330 (39.8%) |
| 3 Vehicles | 12,187 (15.3%) | 10,367 (13.6%) |
| 4 Vehicles | 6,520 (8.2%) | 3,930 (5.1%) |
| 5 or more Vehicles | 3,308 (4.2%) | 3,152 (4.1%) |
| Total | 79,475 (100.0%) | 76,304 (100.0%) |
Commute Time in St Paul
The most frequently occuring commute durations in St Paul are 20 to 24 minutes (25,635 commuters, 19.1%), 15 to 19 minutes (25,094 commuters, 18.7%), and 10 to 14 minutes (19,885 commuters, 14.8%).
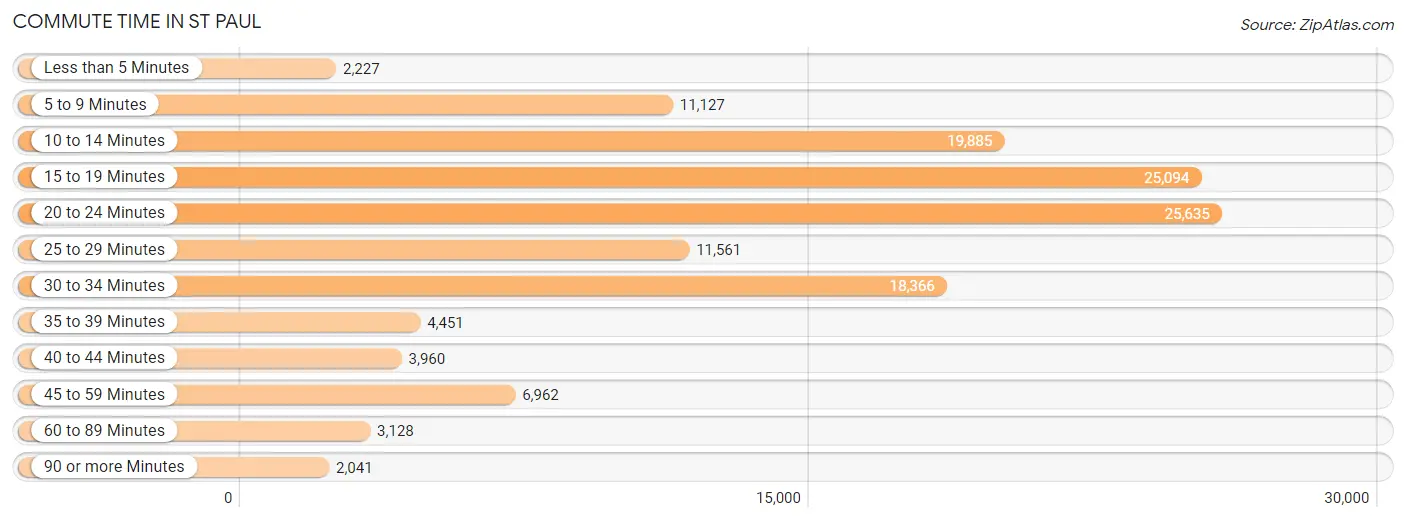
| Commute Time | # Commuters | % Commuters |
| Less than 5 Minutes | 2,227 | 1.7% |
| 5 to 9 Minutes | 11,127 | 8.3% |
| 10 to 14 Minutes | 19,885 | 14.8% |
| 15 to 19 Minutes | 25,094 | 18.7% |
| 20 to 24 Minutes | 25,635 | 19.1% |
| 25 to 29 Minutes | 11,561 | 8.6% |
| 30 to 34 Minutes | 18,366 | 13.7% |
| 35 to 39 Minutes | 4,451 | 3.3% |
| 40 to 44 Minutes | 3,960 | 2.9% |
| 45 to 59 Minutes | 6,962 | 5.2% |
| 60 to 89 Minutes | 3,128 | 2.3% |
| 90 or more Minutes | 2,041 | 1.5% |
Commute Time by Sex in St Paul
The most common commute times in St Paul are 20 to 24 minutes (13,789 commuters, 19.9%) for males and 15 to 19 minutes (12,900 commuters, 19.9%) for females.
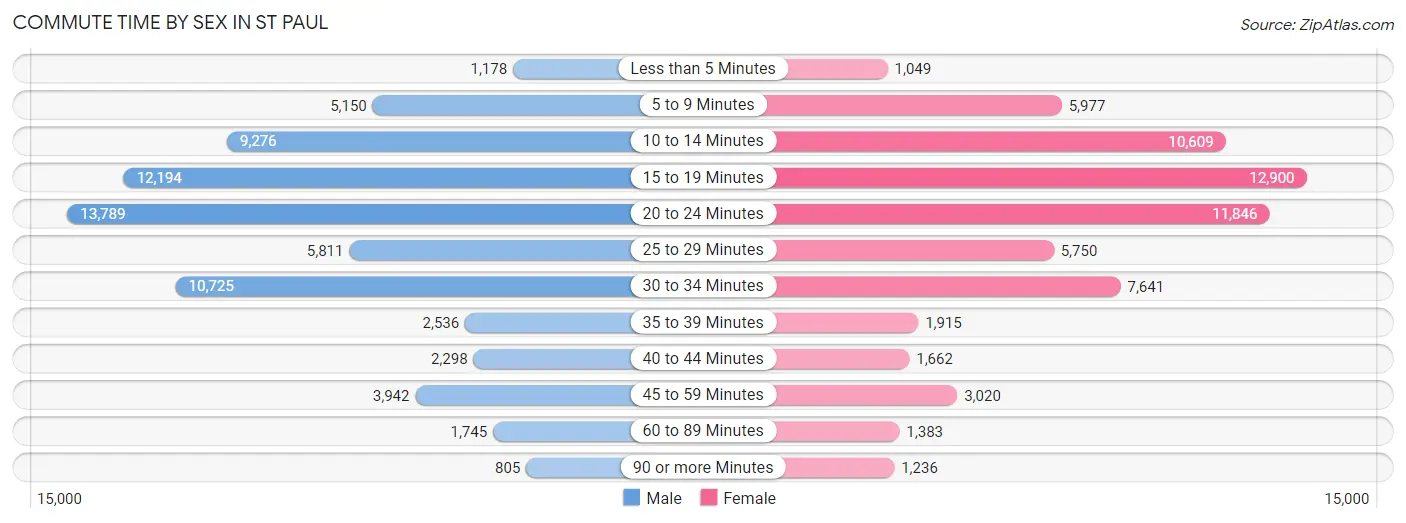
| Commute Time | Male | Female |
| Less than 5 Minutes | 1,178 (1.7%) | 1,049 (1.6%) |
| 5 to 9 Minutes | 5,150 (7.4%) | 5,977 (9.2%) |
| 10 to 14 Minutes | 9,276 (13.4%) | 10,609 (16.3%) |
| 15 to 19 Minutes | 12,194 (17.6%) | 12,900 (19.9%) |
| 20 to 24 Minutes | 13,789 (19.9%) | 11,846 (18.2%) |
| 25 to 29 Minutes | 5,811 (8.4%) | 5,750 (8.8%) |
| 30 to 34 Minutes | 10,725 (15.4%) | 7,641 (11.8%) |
| 35 to 39 Minutes | 2,536 (3.6%) | 1,915 (2.9%) |
| 40 to 44 Minutes | 2,298 (3.3%) | 1,662 (2.6%) |
| 45 to 59 Minutes | 3,942 (5.7%) | 3,020 (4.6%) |
| 60 to 89 Minutes | 1,745 (2.5%) | 1,383 (2.1%) |
| 90 or more Minutes | 805 (1.2%) | 1,236 (1.9%) |
Time of Departure to Work by Sex in St Paul
The most frequent times of departure to work in St Paul are 12:00 PM to 3:59 PM (8,376, 12.1%) for males and 8:00 AM to 8:29 AM (9,082, 14.0%) for females.
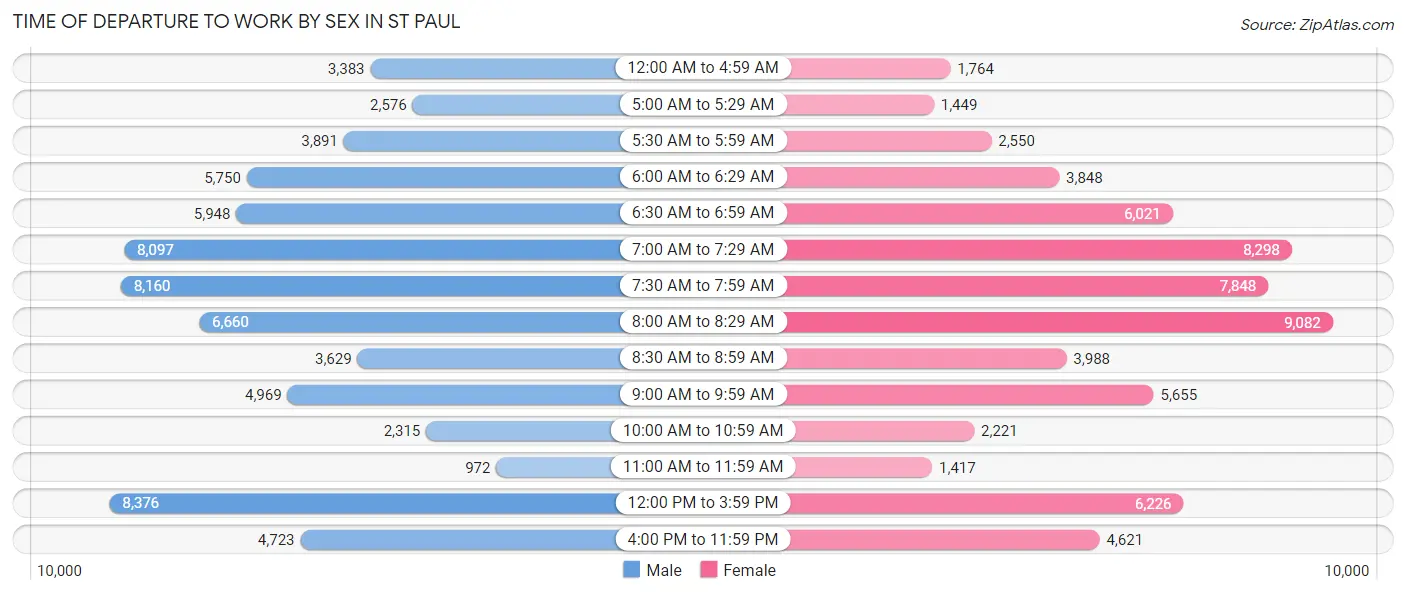
| Time of Departure | Male | Female |
| 12:00 AM to 4:59 AM | 3,383 (4.9%) | 1,764 (2.7%) |
| 5:00 AM to 5:29 AM | 2,576 (3.7%) | 1,449 (2.2%) |
| 5:30 AM to 5:59 AM | 3,891 (5.6%) | 2,550 (3.9%) |
| 6:00 AM to 6:29 AM | 5,750 (8.3%) | 3,848 (5.9%) |
| 6:30 AM to 6:59 AM | 5,948 (8.6%) | 6,021 (9.3%) |
| 7:00 AM to 7:29 AM | 8,097 (11.7%) | 8,298 (12.8%) |
| 7:30 AM to 7:59 AM | 8,160 (11.7%) | 7,848 (12.1%) |
| 8:00 AM to 8:29 AM | 6,660 (9.6%) | 9,082 (14.0%) |
| 8:30 AM to 8:59 AM | 3,629 (5.2%) | 3,988 (6.1%) |
| 9:00 AM to 9:59 AM | 4,969 (7.1%) | 5,655 (8.7%) |
| 10:00 AM to 10:59 AM | 2,315 (3.3%) | 2,221 (3.4%) |
| 11:00 AM to 11:59 AM | 972 (1.4%) | 1,417 (2.2%) |
| 12:00 PM to 3:59 PM | 8,376 (12.1%) | 6,226 (9.6%) |
| 4:00 PM to 11:59 PM | 4,723 (6.8%) | 4,621 (7.1%) |
| Total | 69,449 (100.0%) | 64,988 (100.0%) |
Housing Occupancy in St Paul
Occupancy by Ownership in St Paul
Of the total 121,212 dwellings in St Paul, owner-occupied units account for 64,263 (53.0%), while renter-occupied units make up 56,949 (47.0%).
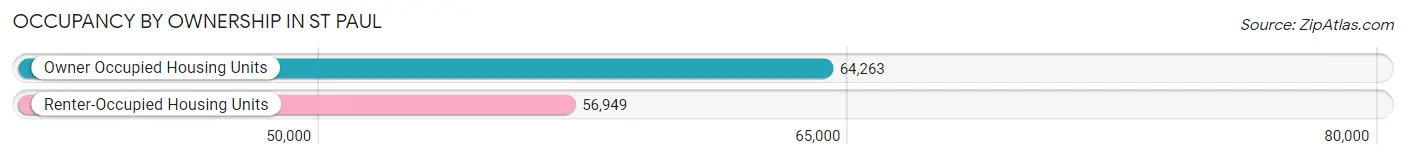
| Occupancy | # Housing Units | % Housing Units |
| Owner Occupied Housing Units | 64,263 | 53.0% |
| Renter-Occupied Housing Units | 56,949 | 47.0% |
| Total Occupied Housing Units | 121,212 | 100.0% |
Occupancy by Household Size in St Paul
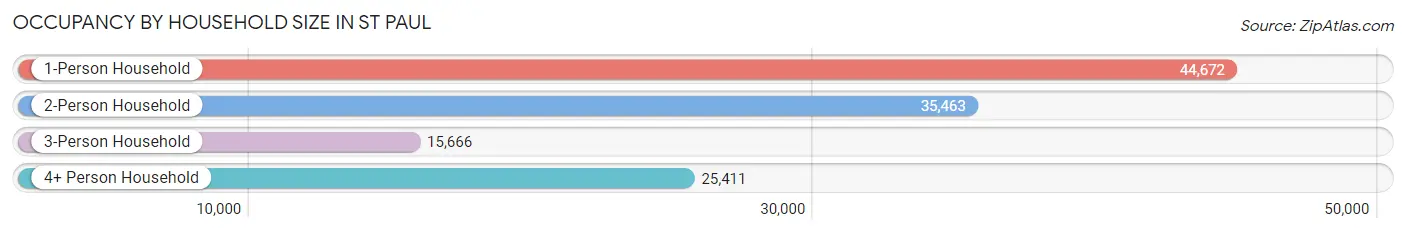
| Household Size | # Housing Units | % Housing Units |
| 1-Person Household | 44,672 | 36.8% |
| 2-Person Household | 35,463 | 29.3% |
| 3-Person Household | 15,666 | 12.9% |
| 4+ Person Household | 25,411 | 21.0% |
| Total Housing Units | 121,212 | 100.0% |
Occupancy by Ownership by Household Size in St Paul
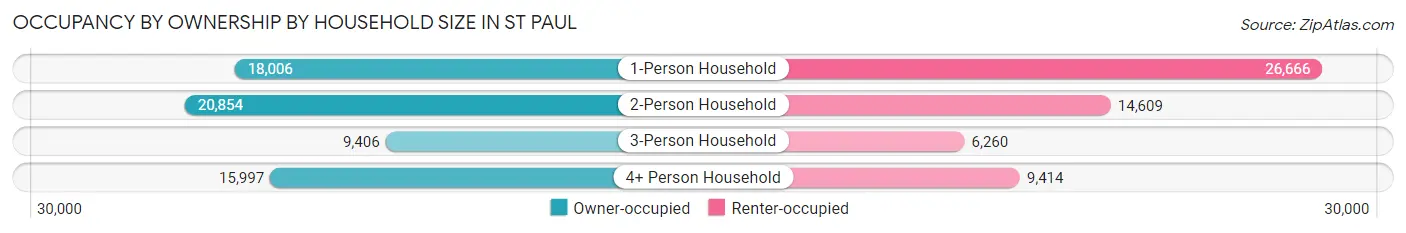
| Household Size | Owner-occupied | Renter-occupied |
| 1-Person Household | 18,006 (40.3%) | 26,666 (59.7%) |
| 2-Person Household | 20,854 (58.8%) | 14,609 (41.2%) |
| 3-Person Household | 9,406 (60.0%) | 6,260 (40.0%) |
| 4+ Person Household | 15,997 (62.9%) | 9,414 (37.0%) |
| Total Housing Units | 64,263 (53.0%) | 56,949 (47.0%) |
Occupancy by Educational Attainment in St Paul
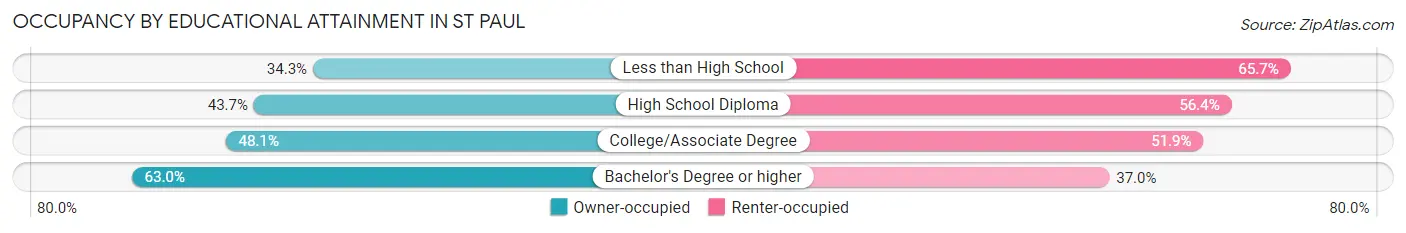
| Household Size | Owner-occupied | Renter-occupied |
| Less than High School | 3,646 (34.3%) | 6,992 (65.7%) |
| High School Diploma | 9,745 (43.6%) | 12,578 (56.4%) |
| College/Associate Degree | 15,317 (48.1%) | 16,516 (51.9%) |
| Bachelor's Degree or higher | 35,555 (63.0%) | 20,863 (37.0%) |
Occupancy by Age of Householder in St Paul
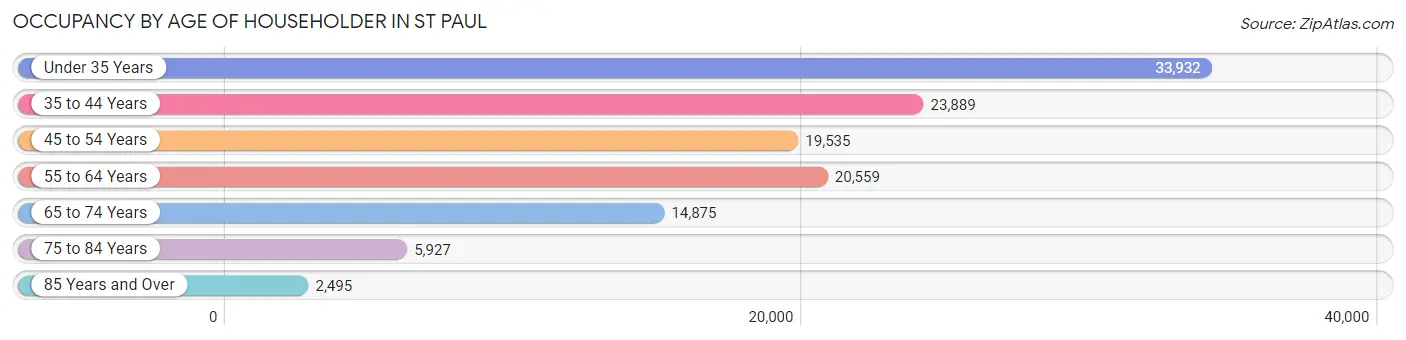
| Age Bracket | # Households | % Households |
| Under 35 Years | 33,932 | 28.0% |
| 35 to 44 Years | 23,889 | 19.7% |
| 45 to 54 Years | 19,535 | 16.1% |
| 55 to 64 Years | 20,559 | 17.0% |
| 65 to 74 Years | 14,875 | 12.3% |
| 75 to 84 Years | 5,927 | 4.9% |
| 85 Years and Over | 2,495 | 2.1% |
| Total | 121,212 | 100.0% |
Housing Finances in St Paul
Median Income by Occupancy in St Paul
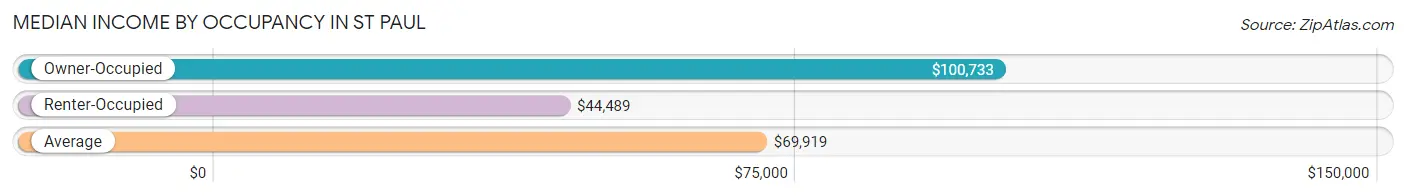
| Occupancy Type | # Households | Median Income |
| Owner-Occupied | 64,263 (53.0%) | $100,733 |
| Renter-Occupied | 56,949 (47.0%) | $44,489 |
| Average | 121,212 (100.0%) | $69,919 |
Occupancy by Householder Income Bracket in St Paul
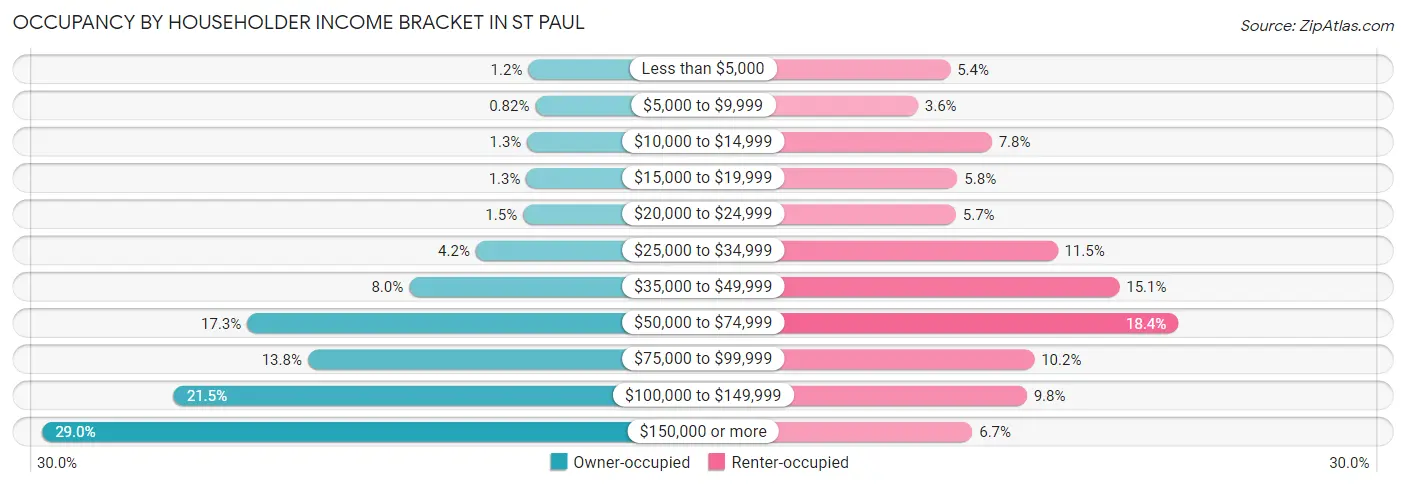
| Income Bracket | Owner-occupied | Renter-occupied |
| Less than $5,000 | 785 (1.2%) | 3,080 (5.4%) |
| $5,000 to $9,999 | 526 (0.8%) | 2,029 (3.6%) |
| $10,000 to $14,999 | 823 (1.3%) | 4,428 (7.8%) |
| $15,000 to $19,999 | 856 (1.3%) | 3,315 (5.8%) |
| $20,000 to $24,999 | 979 (1.5%) | 3,266 (5.7%) |
| $25,000 to $34,999 | 2,714 (4.2%) | 6,570 (11.5%) |
| $35,000 to $49,999 | 5,160 (8.0%) | 8,585 (15.1%) |
| $50,000 to $74,999 | 11,108 (17.3%) | 10,498 (18.4%) |
| $75,000 to $99,999 | 8,884 (13.8%) | 5,812 (10.2%) |
| $100,000 to $149,999 | 13,797 (21.5%) | 5,567 (9.8%) |
| $150,000 or more | 18,631 (29.0%) | 3,799 (6.7%) |
| Total | 64,263 (100.0%) | 56,949 (100.0%) |
Monthly Housing Cost Tiers in St Paul
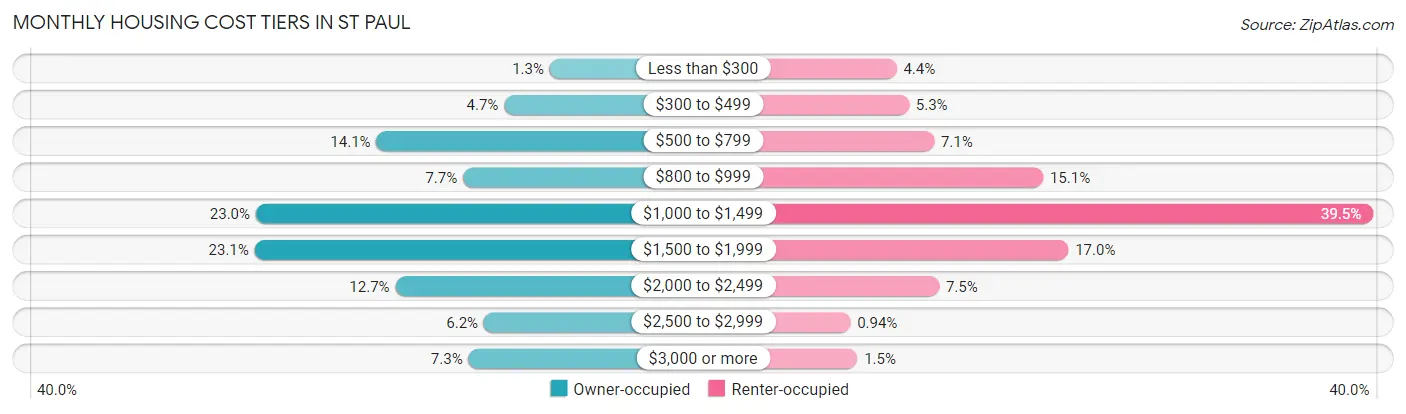
| Monthly Cost | Owner-occupied | Renter-occupied |
| Less than $300 | 851 (1.3%) | 2,480 (4.3%) |
| $300 to $499 | 3,005 (4.7%) | 2,993 (5.3%) |
| $500 to $799 | 9,055 (14.1%) | 4,049 (7.1%) |
| $800 to $999 | 4,955 (7.7%) | 8,624 (15.1%) |
| $1,000 to $1,499 | 14,762 (23.0%) | 22,469 (39.5%) |
| $1,500 to $1,999 | 14,820 (23.1%) | 9,683 (17.0%) |
| $2,000 to $2,499 | 8,152 (12.7%) | 4,259 (7.5%) |
| $2,500 to $2,999 | 3,964 (6.2%) | 535 (0.9%) |
| $3,000 or more | 4,699 (7.3%) | 833 (1.5%) |
| Total | 64,263 (100.0%) | 56,949 (100.0%) |
Physical Housing Characteristics in St Paul
Housing Structures in St Paul
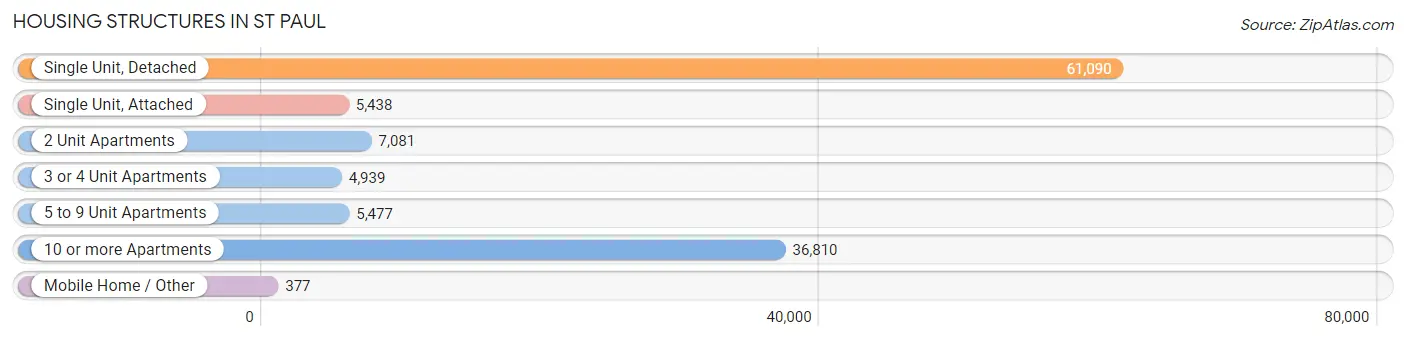
| Structure Type | # Housing Units | % Housing Units |
| Single Unit, Detached | 61,090 | 50.4% |
| Single Unit, Attached | 5,438 | 4.5% |
| 2 Unit Apartments | 7,081 | 5.8% |
| 3 or 4 Unit Apartments | 4,939 | 4.1% |
| 5 to 9 Unit Apartments | 5,477 | 4.5% |
| 10 or more Apartments | 36,810 | 30.4% |
| Mobile Home / Other | 377 | 0.3% |
| Total | 121,212 | 100.0% |
Housing Structures by Occupancy in St Paul
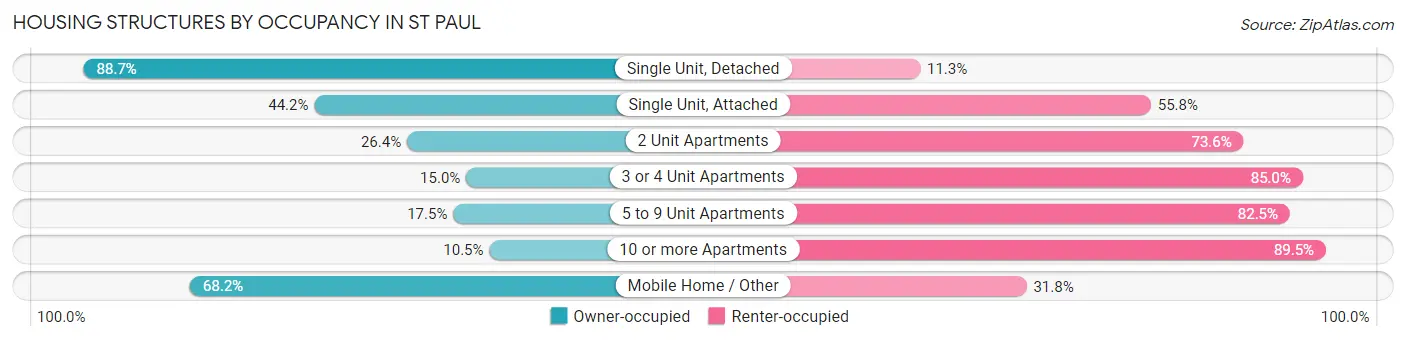
| Structure Type | Owner-occupied | Renter-occupied |
| Single Unit, Detached | 54,164 (88.7%) | 6,926 (11.3%) |
| Single Unit, Attached | 2,405 (44.2%) | 3,033 (55.8%) |
| 2 Unit Apartments | 1,868 (26.4%) | 5,213 (73.6%) |
| 3 or 4 Unit Apartments | 740 (15.0%) | 4,199 (85.0%) |
| 5 to 9 Unit Apartments | 957 (17.5%) | 4,520 (82.5%) |
| 10 or more Apartments | 3,872 (10.5%) | 32,938 (89.5%) |
| Mobile Home / Other | 257 (68.2%) | 120 (31.8%) |
| Total | 64,263 (53.0%) | 56,949 (47.0%) |
Housing Structures by Number of Rooms in St Paul
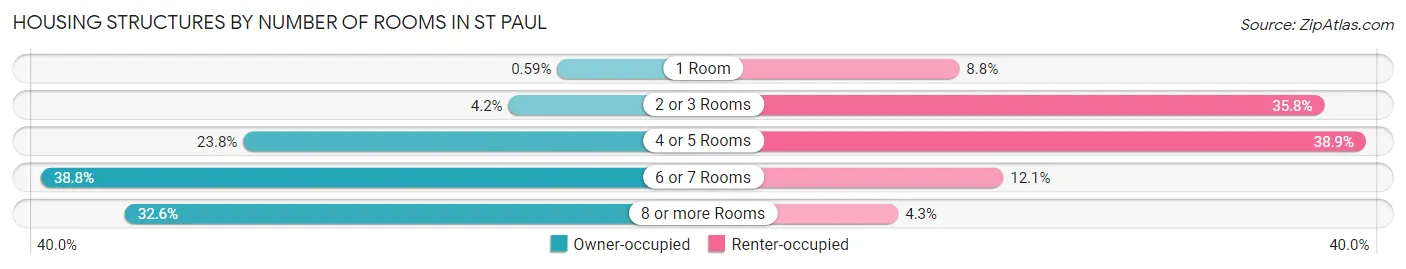
| Number of Rooms | Owner-occupied | Renter-occupied |
| 1 Room | 377 (0.6%) | 5,034 (8.8%) |
| 2 or 3 Rooms | 2,696 (4.2%) | 20,412 (35.8%) |
| 4 or 5 Rooms | 15,316 (23.8%) | 22,158 (38.9%) |
| 6 or 7 Rooms | 24,934 (38.8%) | 6,886 (12.1%) |
| 8 or more Rooms | 20,940 (32.6%) | 2,459 (4.3%) |
| Total | 64,263 (100.0%) | 56,949 (100.0%) |
Housing Structure by Heating Type in St Paul
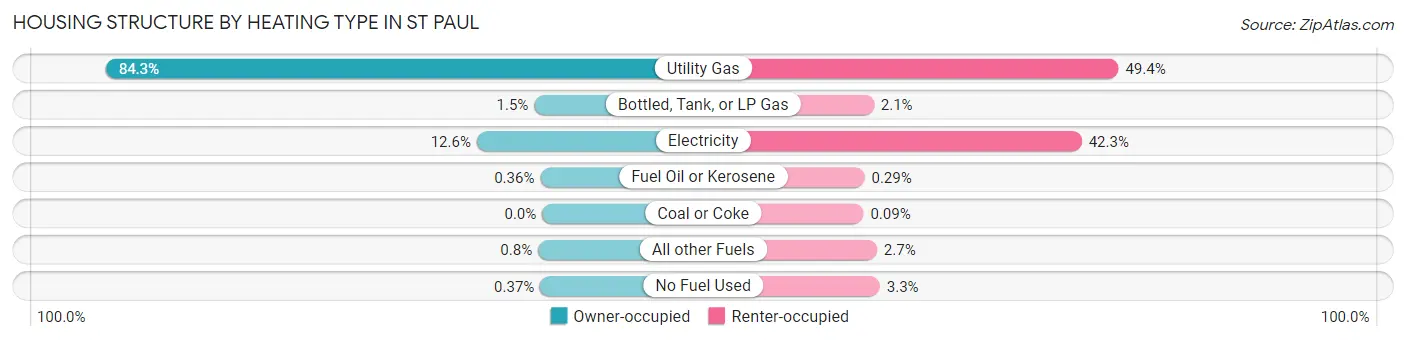
| Heating Type | Owner-occupied | Renter-occupied |
| Utility Gas | 54,174 (84.3%) | 28,108 (49.4%) |
| Bottled, Tank, or LP Gas | 984 (1.5%) | 1,186 (2.1%) |
| Electricity | 8,117 (12.6%) | 24,064 (42.3%) |
| Fuel Oil or Kerosene | 231 (0.4%) | 163 (0.3%) |
| Coal or Coke | 0 (0.0%) | 50 (0.1%) |
| All other Fuels | 517 (0.8%) | 1,526 (2.7%) |
| No Fuel Used | 240 (0.4%) | 1,852 (3.3%) |
| Total | 64,263 (100.0%) | 56,949 (100.0%) |
Household Vehicle Usage in St Paul
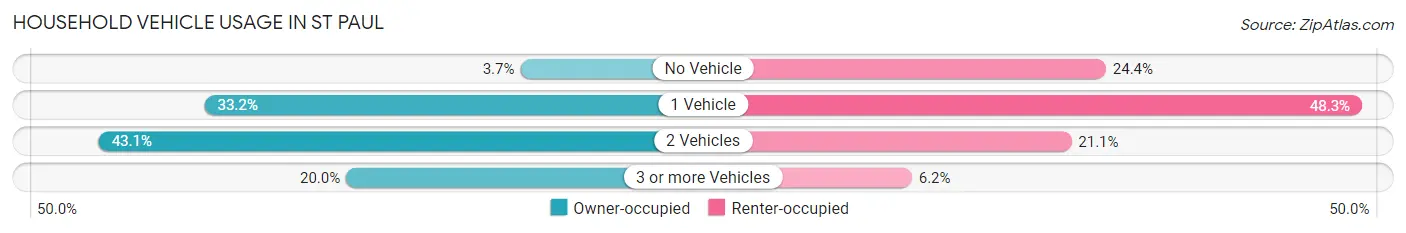
| Vehicles per Household | Owner-occupied | Renter-occupied |
| No Vehicle | 2,394 (3.7%) | 13,872 (24.4%) |
| 1 Vehicle | 21,338 (33.2%) | 27,485 (48.3%) |
| 2 Vehicles | 27,685 (43.1%) | 12,041 (21.1%) |
| 3 or more Vehicles | 12,846 (20.0%) | 3,551 (6.2%) |
| Total | 64,263 (100.0%) | 56,949 (100.0%) |
Real Estate & Mortgages in St Paul
Real Estate and Mortgage Overview in St Paul
| Characteristic | Without Mortgage | With Mortgage |
| Housing Units | 19,278 | 44,985 |
| Median Property Value | $257,000 | $267,300 |
| Median Household Income | $76,559 | $14,436 |
| Monthly Housing Costs | $711 | $4,600 |
| Real Estate Taxes | $3,382 | $1,011 |
Property Value by Mortgage Status in St Paul
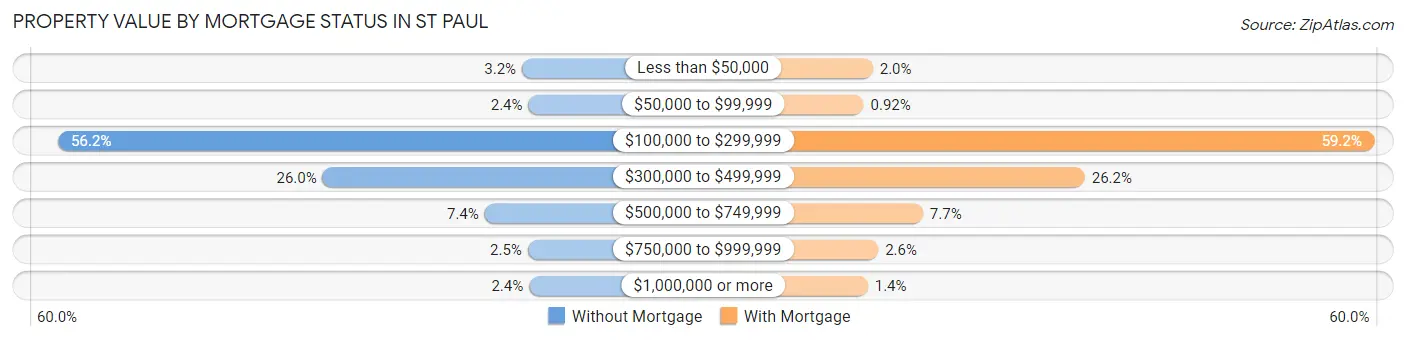
| Property Value | Without Mortgage | With Mortgage |
| Less than $50,000 | 609 (3.2%) | 888 (2.0%) |
| $50,000 to $99,999 | 469 (2.4%) | 416 (0.9%) |
| $100,000 to $299,999 | 10,831 (56.2%) | 26,640 (59.2%) |
| $300,000 to $499,999 | 5,002 (26.0%) | 11,785 (26.2%) |
| $500,000 to $749,999 | 1,432 (7.4%) | 3,463 (7.7%) |
| $750,000 to $999,999 | 482 (2.5%) | 1,165 (2.6%) |
| $1,000,000 or more | 453 (2.4%) | 628 (1.4%) |
| Total | 19,278 (100.0%) | 44,985 (100.0%) |
Household Income by Mortgage Status in St Paul
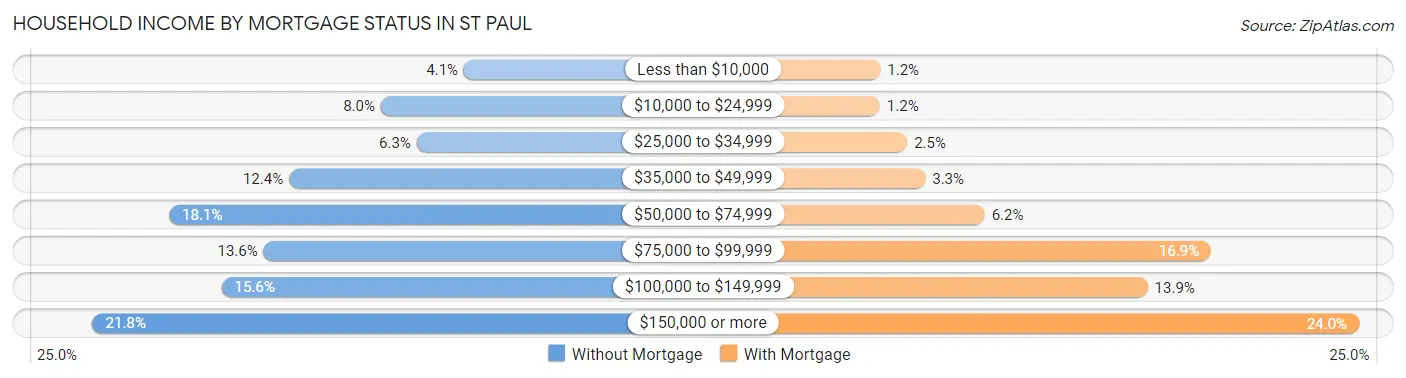
| Household Income | Without Mortgage | With Mortgage |
| Less than $10,000 | 787 (4.1%) | 533 (1.2%) |
| $10,000 to $24,999 | 1,550 (8.0%) | 524 (1.2%) |
| $25,000 to $34,999 | 1,221 (6.3%) | 1,108 (2.5%) |
| $35,000 to $49,999 | 2,393 (12.4%) | 1,493 (3.3%) |
| $50,000 to $74,999 | 3,494 (18.1%) | 2,767 (6.1%) |
| $75,000 to $99,999 | 2,626 (13.6%) | 7,614 (16.9%) |
| $100,000 to $149,999 | 3,012 (15.6%) | 6,258 (13.9%) |
| $150,000 or more | 4,195 (21.8%) | 10,785 (24.0%) |
| Total | 19,278 (100.0%) | 44,985 (100.0%) |
Property Value to Household Income Ratio in St Paul
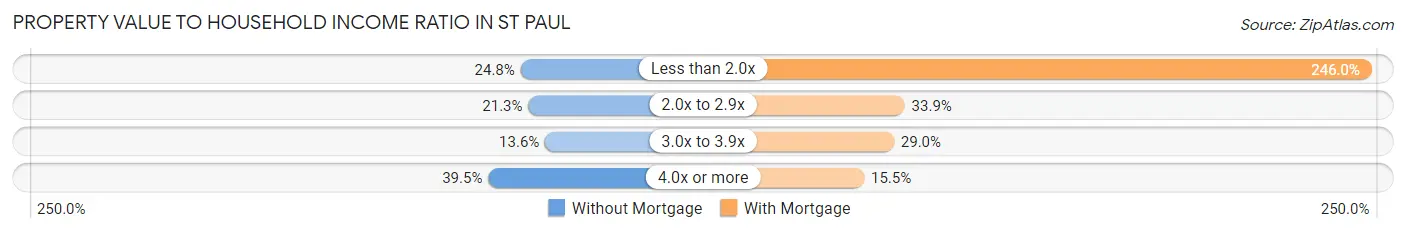
| Value-to-Income Ratio | Without Mortgage | With Mortgage |
| Less than 2.0x | 4,779 (24.8%) | 110,668 (246.0%) |
| 2.0x to 2.9x | 4,100 (21.3%) | 15,266 (33.9%) |
| 3.0x to 3.9x | 2,630 (13.6%) | 13,064 (29.0%) |
| 4.0x or more | 7,613 (39.5%) | 6,968 (15.5%) |
| Total | 19,278 (100.0%) | 44,985 (100.0%) |
Real Estate Taxes by Mortgage Status in St Paul
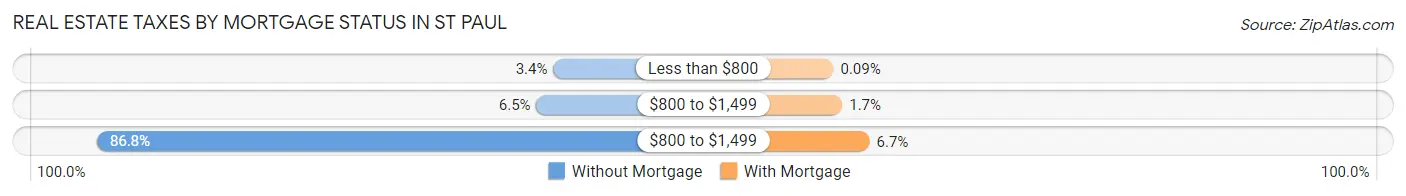
| Property Taxes | Without Mortgage | With Mortgage |
| Less than $800 | 664 (3.4%) | 39 (0.1%) |
| $800 to $1,499 | 1,257 (6.5%) | 758 (1.7%) |
| $800 to $1,499 | 16,733 (86.8%) | 3,003 (6.7%) |
| Total | 19,278 (100.0%) | 44,985 (100.0%) |
Health & Disability in St Paul
Health Insurance Coverage by Age in St Paul
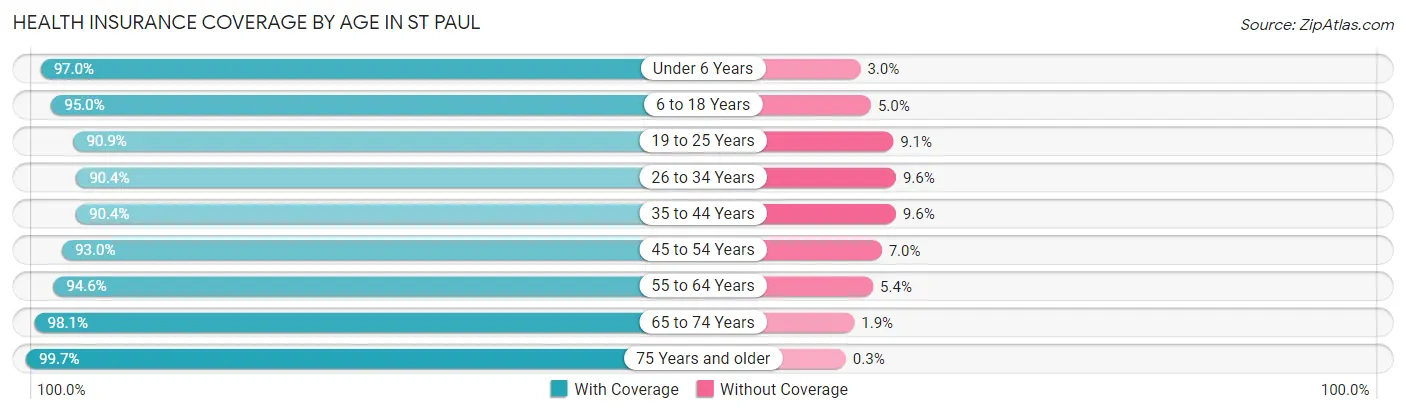
| Age Bracket | With Coverage | Without Coverage |
| Under 6 Years | 24,312 (97.0%) | 754 (3.0%) |
| 6 to 18 Years | 50,420 (95.0%) | 2,643 (5.0%) |
| 19 to 25 Years | 30,975 (90.9%) | 3,110 (9.1%) |
| 26 to 34 Years | 46,166 (90.4%) | 4,928 (9.6%) |
| 35 to 44 Years | 38,150 (90.4%) | 4,059 (9.6%) |
| 45 to 54 Years | 31,079 (93.0%) | 2,332 (7.0%) |
| 55 to 64 Years | 31,026 (94.6%) | 1,764 (5.4%) |
| 65 to 74 Years | 22,603 (98.1%) | 432 (1.9%) |
| 75 Years and older | 11,648 (99.7%) | 35 (0.3%) |
| Total | 286,379 (93.4%) | 20,057 (6.6%) |
Health Insurance Coverage by Citizenship Status in St Paul
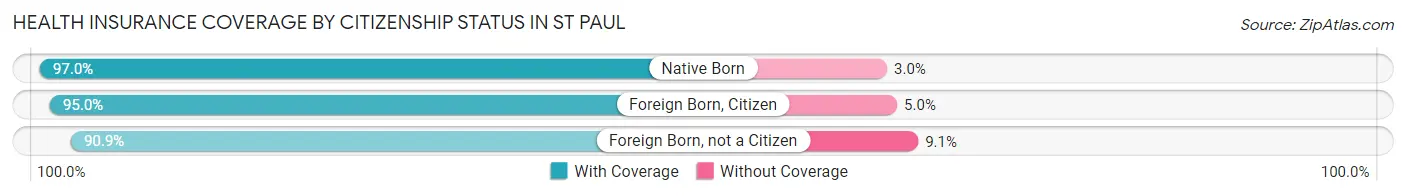
| Citizenship Status | With Coverage | Without Coverage |
| Native Born | 24,312 (97.0%) | 754 (3.0%) |
| Foreign Born, Citizen | 50,420 (95.0%) | 2,643 (5.0%) |
| Foreign Born, not a Citizen | 30,975 (90.9%) | 3,110 (9.1%) |
Health Insurance Coverage by Household Income in St Paul
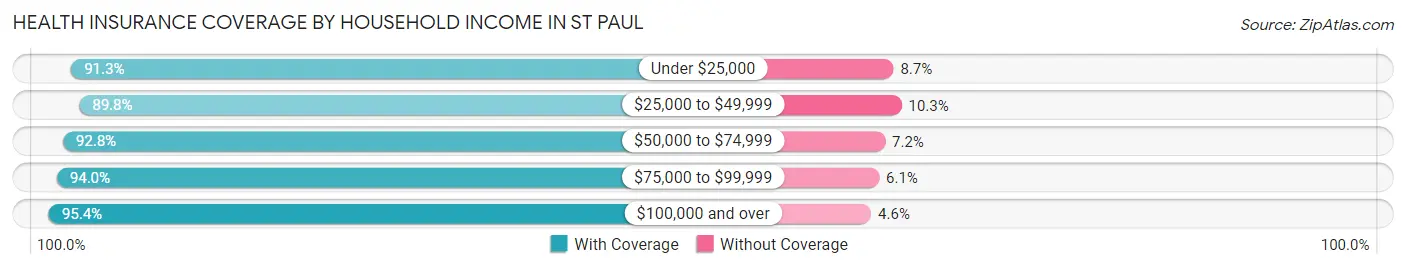
| Household Income | With Coverage | Without Coverage |
| Under $25,000 | 31,254 (91.3%) | 2,995 (8.7%) |
| $25,000 to $49,999 | 45,755 (89.7%) | 5,226 (10.2%) |
| $50,000 to $74,999 | 44,822 (92.8%) | 3,465 (7.2%) |
| $75,000 to $99,999 | 34,306 (94.0%) | 2,210 (6.0%) |
| $100,000 and over | 123,441 (95.4%) | 5,899 (4.6%) |
Public vs Private Health Insurance Coverage by Age in St Paul
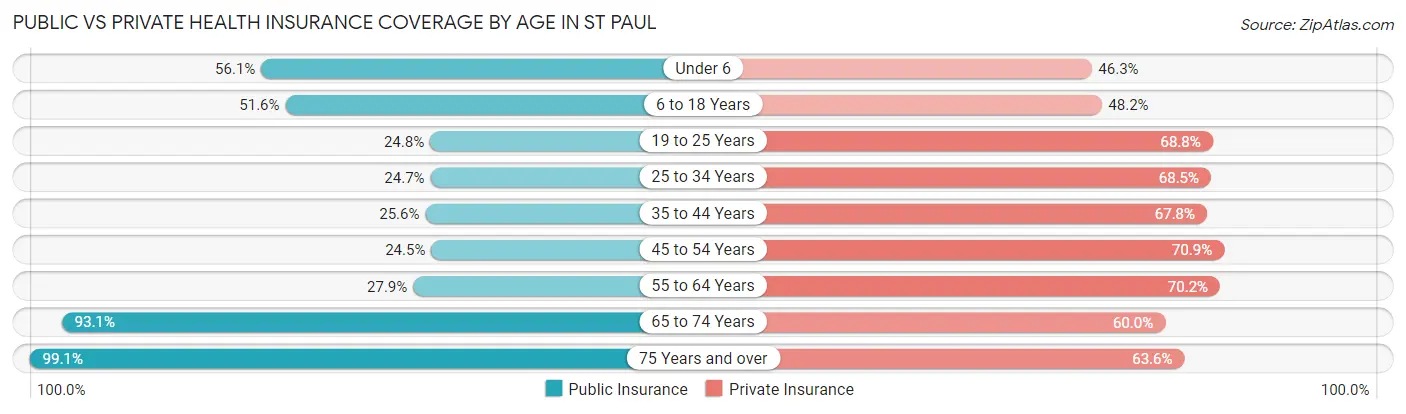
| Age Bracket | Public Insurance | Private Insurance |
| Under 6 | 14,059 (56.1%) | 11,613 (46.3%) |
| 6 to 18 Years | 27,378 (51.6%) | 25,570 (48.2%) |
| 19 to 25 Years | 8,436 (24.7%) | 23,457 (68.8%) |
| 25 to 34 Years | 12,610 (24.7%) | 34,997 (68.5%) |
| 35 to 44 Years | 10,815 (25.6%) | 28,600 (67.8%) |
| 45 to 54 Years | 8,194 (24.5%) | 23,702 (70.9%) |
| 55 to 64 Years | 9,145 (27.9%) | 23,012 (70.2%) |
| 65 to 74 Years | 21,452 (93.1%) | 13,820 (60.0%) |
| 75 Years and over | 11,573 (99.1%) | 7,426 (63.6%) |
| Total | 123,662 (40.4%) | 192,197 (62.7%) |
Disability Status by Sex by Age in St Paul
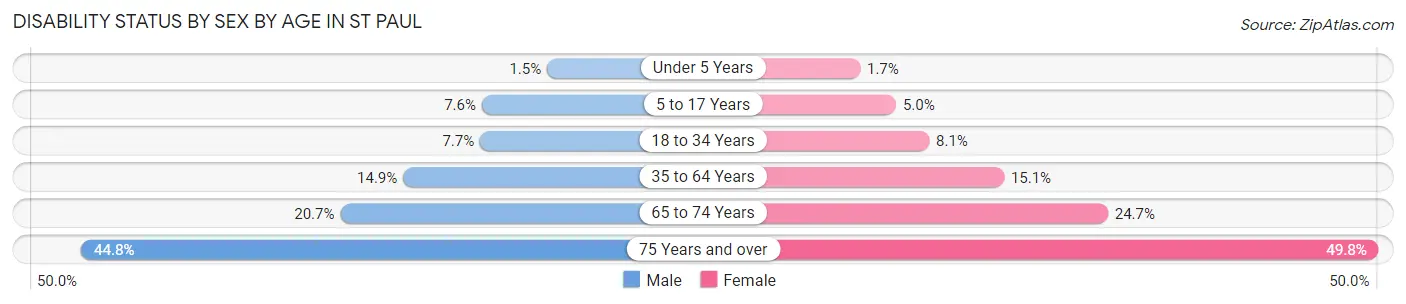
| Age Bracket | Male | Female |
| Under 5 Years | 158 (1.5%) | 172 (1.7%) |
| 5 to 17 Years | 2,049 (7.6%) | 1,322 (5.0%) |
| 18 to 34 Years | 3,430 (7.7%) | 3,643 (8.1%) |
| 35 to 64 Years | 8,114 (14.9%) | 8,102 (15.0%) |
| 65 to 74 Years | 2,209 (20.7%) | 3,053 (24.7%) |
| 75 Years and over | 2,039 (44.8%) | 3,551 (49.8%) |
Disability Class by Sex by Age in St Paul
Disability Class: Hearing Difficulty
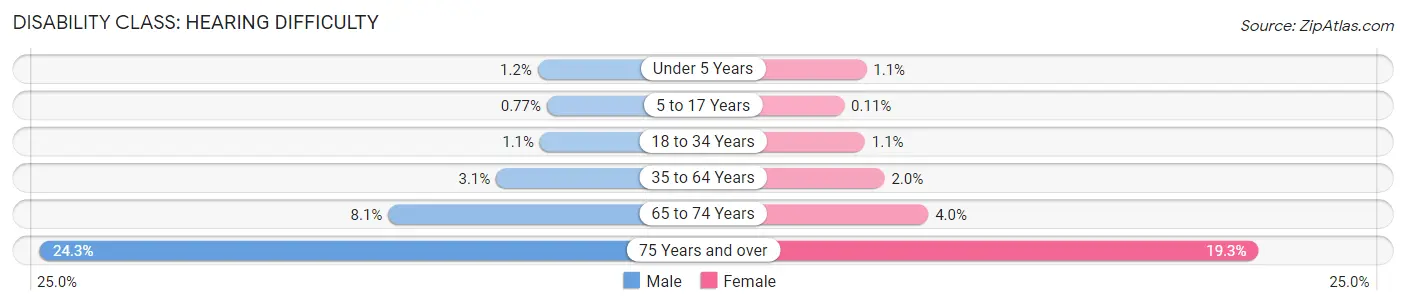
| Age Bracket | Male | Female |
| Under 5 Years | 124 (1.2%) | 116 (1.1%) |
| 5 to 17 Years | 209 (0.8%) | 29 (0.1%) |
| 18 to 34 Years | 485 (1.1%) | 483 (1.1%) |
| 35 to 64 Years | 1,700 (3.1%) | 1,068 (2.0%) |
| 65 to 74 Years | 867 (8.1%) | 496 (4.0%) |
| 75 Years and over | 1,106 (24.3%) | 1,378 (19.3%) |
Disability Class: Vision Difficulty
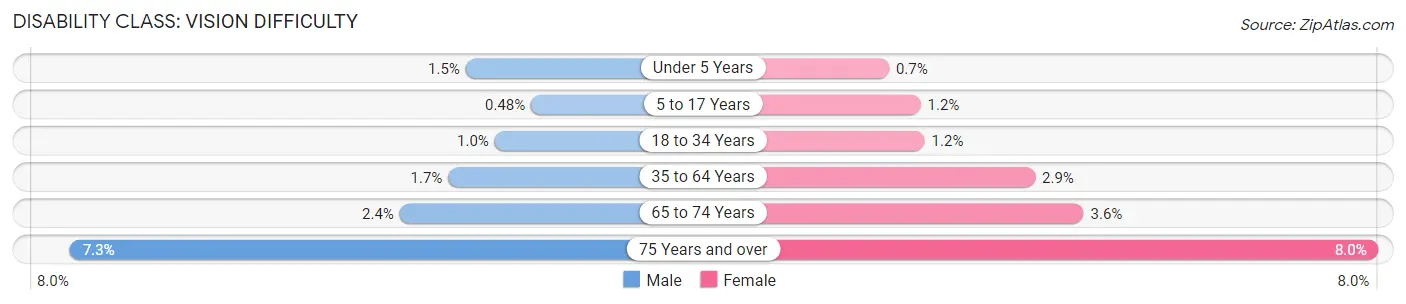
| Age Bracket | Male | Female |
| Under 5 Years | 152 (1.5%) | 71 (0.7%) |
| 5 to 17 Years | 129 (0.5%) | 308 (1.2%) |
| 18 to 34 Years | 452 (1.0%) | 554 (1.2%) |
| 35 to 64 Years | 933 (1.7%) | 1,545 (2.9%) |
| 65 to 74 Years | 259 (2.4%) | 444 (3.6%) |
| 75 Years and over | 334 (7.3%) | 568 (8.0%) |
Disability Class: Cognitive Difficulty
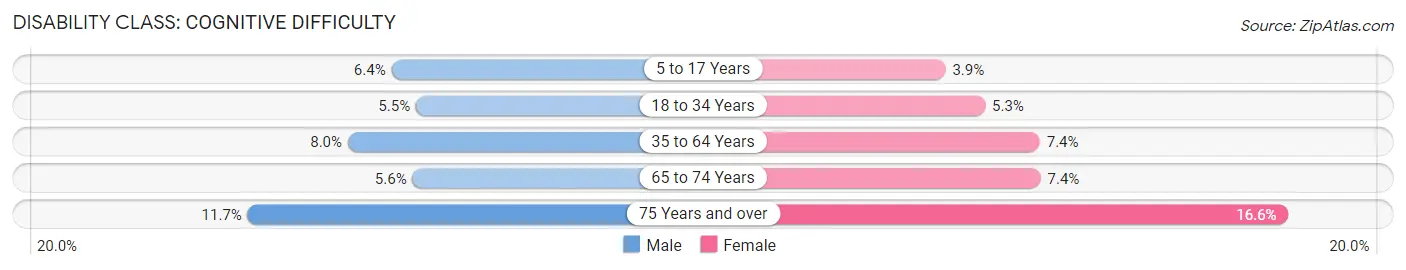
| Age Bracket | Male | Female |
| 5 to 17 Years | 1,727 (6.4%) | 1,011 (3.8%) |
| 18 to 34 Years | 2,430 (5.5%) | 2,392 (5.3%) |
| 35 to 64 Years | 4,365 (8.0%) | 3,958 (7.3%) |
| 65 to 74 Years | 597 (5.6%) | 912 (7.4%) |
| 75 Years and over | 534 (11.7%) | 1,182 (16.6%) |
Disability Class: Ambulatory Difficulty
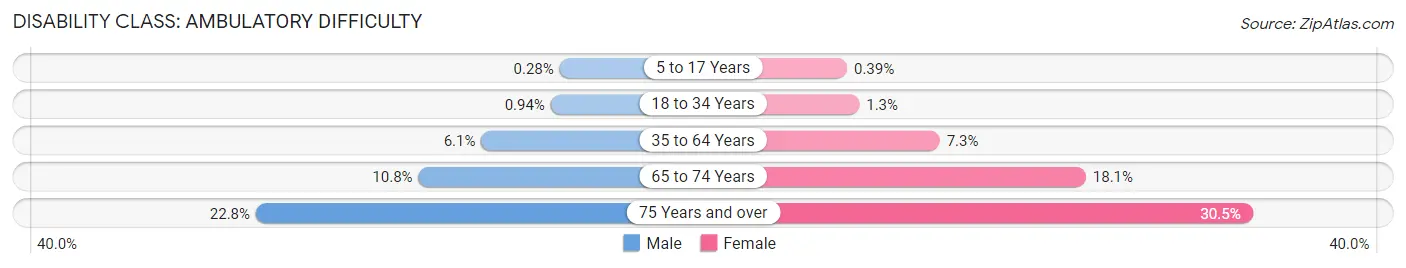
| Age Bracket | Male | Female |
| 5 to 17 Years | 76 (0.3%) | 102 (0.4%) |
| 18 to 34 Years | 417 (0.9%) | 587 (1.3%) |
| 35 to 64 Years | 3,321 (6.1%) | 3,913 (7.3%) |
| 65 to 74 Years | 1,148 (10.8%) | 2,240 (18.1%) |
| 75 Years and over | 1,040 (22.8%) | 2,173 (30.5%) |
Disability Class: Self-Care Difficulty
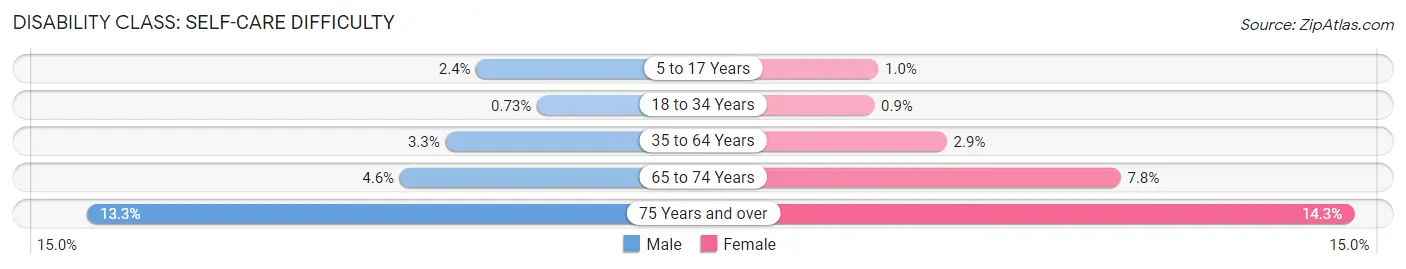
| Age Bracket | Male | Female |
| 5 to 17 Years | 655 (2.4%) | 264 (1.0%) |
| 18 to 34 Years | 325 (0.7%) | 403 (0.9%) |
| 35 to 64 Years | 1,790 (3.3%) | 1,572 (2.9%) |
| 65 to 74 Years | 485 (4.5%) | 960 (7.8%) |
| 75 Years and over | 604 (13.3%) | 1,016 (14.3%) |
Technology Access in St Paul
Computing Device Access in St Paul
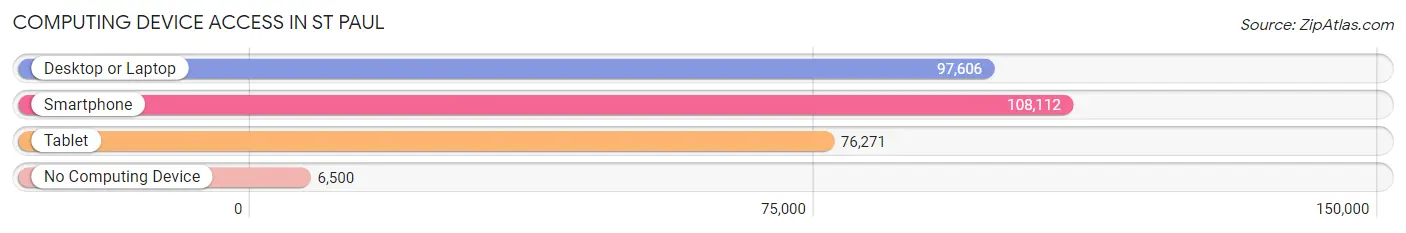
| Device Type | # Households | % Households |
| Desktop or Laptop | 97,606 | 80.5% |
| Smartphone | 108,112 | 89.2% |
| Tablet | 76,271 | 62.9% |
| No Computing Device | 6,500 | 5.4% |
| Total | 121,212 | 100.0% |
Internet Access in St Paul
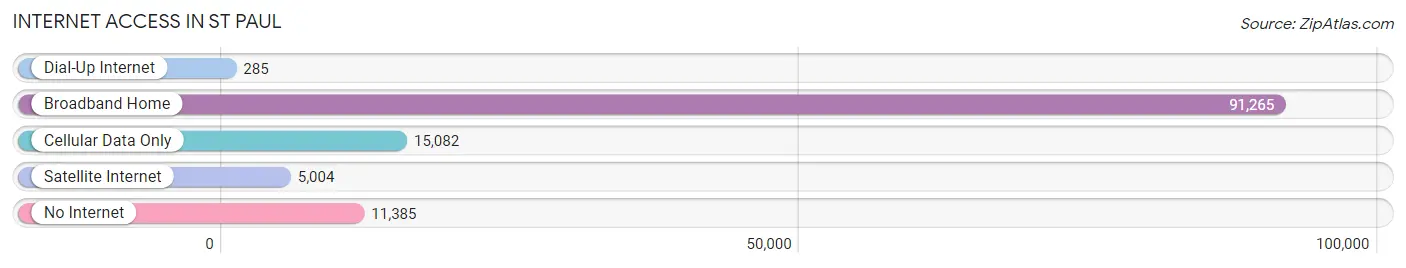
| Internet Type | # Households | % Households |
| Dial-Up Internet | 285 | 0.2% |
| Broadband Home | 91,265 | 75.3% |
| Cellular Data Only | 15,082 | 12.4% |
| Satellite Internet | 5,004 | 4.1% |
| No Internet | 11,385 | 9.4% |
| Total | 121,212 | 100.0% |
St Paul Summary
St. Paul, Minnesota is the capital of the state and the second largest city in the state. It is located in the east-central part of the state, along the Mississippi River. The city is known for its vibrant culture, diverse population, and strong economy.
History
St. Paul was founded in 1838 by Pierre Parrant, a French-Canadian fur trader. The city was named after the Apostle Paul, and was originally part of the Minnesota Territory. In 1849, St. Paul was incorporated as a city.
In the late 19th century, St. Paul was a major hub for the lumber industry. The city was also home to a number of breweries, including the Hamm’s Brewery, which was founded in 1865.
In the early 20th century, St. Paul was a major center for the railroad industry. The city was also home to a number of manufacturing companies, including the 3M Company, which was founded in 1902.
Geography
St. Paul is located in east-central Minnesota, along the Mississippi River. The city is situated on the east bank of the river, and is bordered by Minneapolis to the north, Falcon Heights to the east, and Maplewood to the south.
The city has a total area of 56.2 square miles, of which 54.2 square miles is land and 2.0 square miles is water. The city is located at an elevation of 710 feet above sea level.
Economy
St. Paul has a strong and diverse economy. The city is home to a number of major corporations, including 3M, Ecolab, and Xcel Energy. The city is also home to a number of government agencies, including the Minnesota Department of Transportation and the Minnesota Department of Natural Resources.
St. Paul is also home to a number of educational institutions, including the University of St. Thomas, Hamline University, and the College of St. Catherine.
Demographics
As of the 2010 census, St. Paul had a population of 285,068. The city has a population density of 5,093 people per square mile. The racial makeup of the city is 73.2% White, 15.2% African American, 0.7% Native American, 5.3% Asian, 0.1% Pacific Islander, and 5.5% from other races.
The median household income in St. Paul is $50,895, and the median family income is $63,945. The city has a poverty rate of 22.3%.
St. Paul is a diverse city, with a variety of cultures and backgrounds. The city is home to a large number of immigrants, including those from Somalia, Ethiopia, and Vietnam. The city also has a large population of Native Americans, with the largest concentration being the Dakota people.
Common Questions
What is Per Capita Income in St Paul?
Per Capita income in St Paul is $39,726.
What is the Median Family Income in St Paul?
Median Family Income in St Paul is $91,077.
What is the Median Household income in St Paul?
Median Household Income in St Paul is $69,919.
What is Income or Wage Gap in St Paul?
Income or Wage Gap in St Paul is 16.2%.
Women in St Paul earn 83.8 cents for every dollar earned by a man.
What is Family Income Deficit in St Paul?
Family Income Deficit in St Paul is $11,950.
Families that are below poverty line in St Paul earn $11,950 less on average than the poverty threshold level.
What is Inequality or Gini Index in St Paul?
Inequality or Gini Index in St Paul is 0.48.
What is the Total Population of St Paul?
Total Population of St Paul is 308,806.
What is the Total Male Population of St Paul?
Total Male Population of St Paul is 152,822.
What is the Total Female Population of St Paul?
Total Female Population of St Paul is 155,984.
What is the Ratio of Males per 100 Females in St Paul?
There are 97.97 Males per 100 Females in St Paul.
What is the Ratio of Females per 100 Males in St Paul?
There are 102.07 Females per 100 Males in St Paul.
What is the Median Population Age in St Paul?
Median Population Age in St Paul is 33.1 Years.
What is the Average Family Size in St Paul
Average Family Size in St Paul is 3.4 People.
What is the Average Household Size in St Paul
Average Household Size in St Paul is 2.5 People.
How Large is the Labor Force in St Paul?
There are 170,628 People in the Labor Forcein in St Paul.
What is the Percentage of People in the Labor Force in St Paul?
70.3% of People are in the Labor Force in St Paul.
What is the Unemployment Rate in St Paul?
Unemployment Rate in St Paul is 5.0%.