Lewisville, TX Map & Demographics
Lewisville Map
Lewisville Overview
$42,275
PER CAPITA INCOME
$98,501
AVG FAMILY INCOME
$82,006
AVG HOUSEHOLD INCOME
23.9%
WAGE / INCOME GAP [ % ]
76.1¢/ $1
WAGE / INCOME GAP [ $ ]
$10,139
FAMILY INCOME DEFICIT
0.41
INEQUALITY / GINI INDEX
125,028
TOTAL POPULATION
60,323
MALE POPULATION
64,705
FEMALE POPULATION
93.23
MALES / 100 FEMALES
107.26
FEMALES / 100 MALES
34.2
MEDIAN AGE
3.3
AVG FAMILY SIZE
2.6
AVG HOUSEHOLD SIZE
74,886
LABOR FORCE [ PEOPLE ]
75.9%
PERCENT IN LABOR FORCE
3.8%
UNEMPLOYMENT RATE
Income in Lewisville
Income Overview in Lewisville
Per Capita Income in Lewisville is $42,275, while median incomes of families and households are $98,501 and $82,006 respectively.
| Characteristic | Number | Measure |
| Per Capita Income | 125,028 | $42,275 |
| Median Family Income | 30,341 | $98,501 |
| Mean Family Income | 30,341 | $124,592 |
| Median Household Income | 48,725 | $82,006 |
| Mean Household Income | 48,725 | $105,565 |
| Income Deficit | 30,341 | $10,139 |
| Wage / Income Gap (%) | 125,028 | 23.86% |
| Wage / Income Gap ($) | 125,028 | 76.14¢ per $1 |
| Gini / Inequality Index | 125,028 | 0.41 |
Earnings by Sex in Lewisville
Average Earnings in Lewisville are $46,254, $53,713 for men and $40,897 for women, a difference of 23.9%.

| Sex | Number | Average Earnings |
| Male | 39,790 (51.6%) | $53,713 |
| Female | 37,302 (48.4%) | $40,897 |
| Total | 77,092 (100.0%) | $46,254 |
Earnings by Sex by Income Bracket in Lewisville
The most common earnings brackets in Lewisville are $100,000+ for men (8,273 | 20.8%) and $100,000+ for women (4,265 | 11.4%).
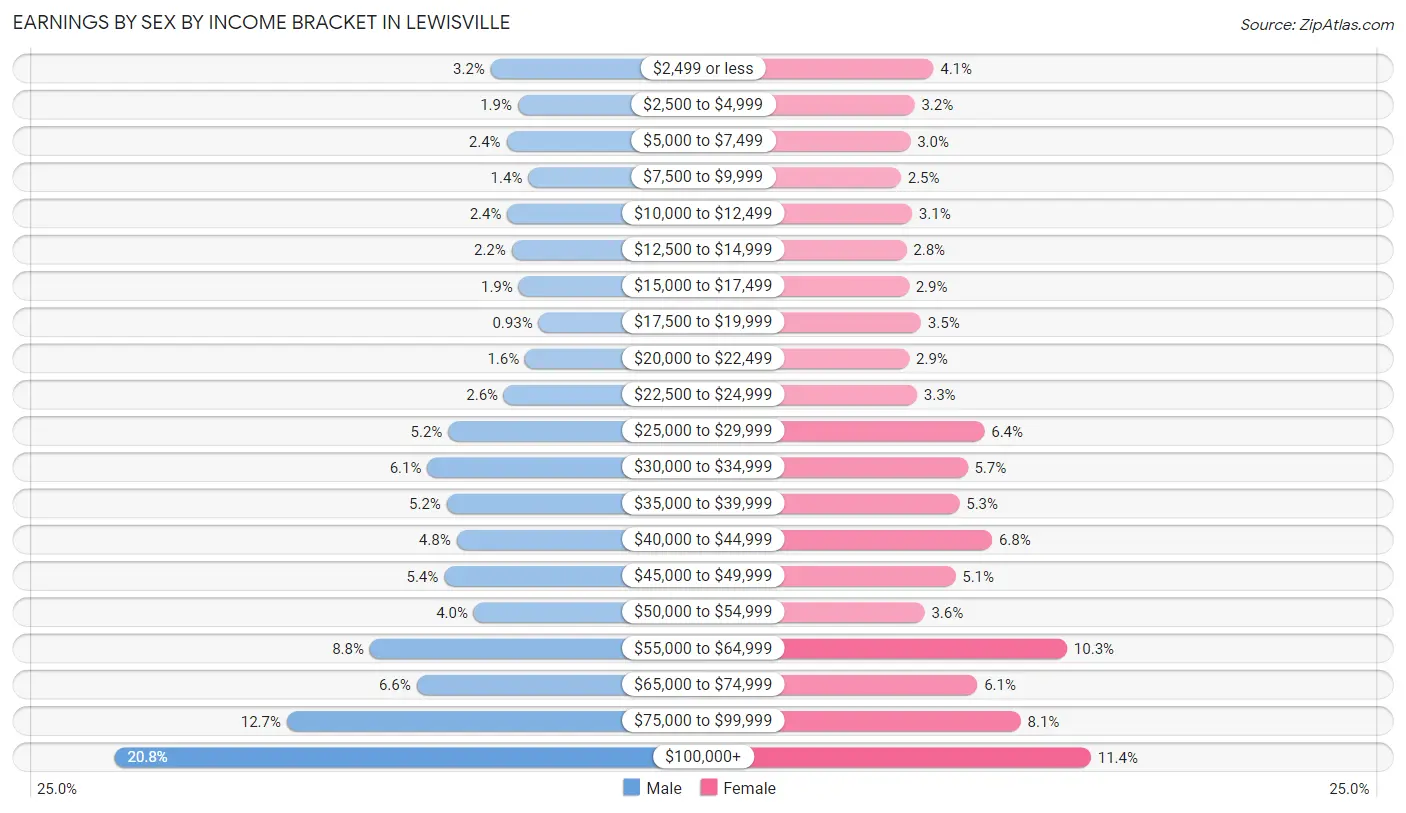
| Income | Male | Female |
| $2,499 or less | 1,262 (3.2%) | 1,511 (4.1%) |
| $2,500 to $4,999 | 756 (1.9%) | 1,181 (3.2%) |
| $5,000 to $7,499 | 966 (2.4%) | 1,108 (3.0%) |
| $7,500 to $9,999 | 562 (1.4%) | 943 (2.5%) |
| $10,000 to $12,499 | 951 (2.4%) | 1,139 (3.0%) |
| $12,500 to $14,999 | 870 (2.2%) | 1,039 (2.8%) |
| $15,000 to $17,499 | 742 (1.9%) | 1,081 (2.9%) |
| $17,500 to $19,999 | 371 (0.9%) | 1,294 (3.5%) |
| $20,000 to $22,499 | 622 (1.6%) | 1,090 (2.9%) |
| $22,500 to $24,999 | 1,013 (2.5%) | 1,224 (3.3%) |
| $25,000 to $29,999 | 2,055 (5.2%) | 2,403 (6.4%) |
| $30,000 to $34,999 | 2,445 (6.1%) | 2,109 (5.7%) |
| $35,000 to $39,999 | 2,081 (5.2%) | 1,964 (5.3%) |
| $40,000 to $44,999 | 1,896 (4.8%) | 2,536 (6.8%) |
| $45,000 to $49,999 | 2,130 (5.3%) | 1,895 (5.1%) |
| $50,000 to $54,999 | 1,574 (4.0%) | 1,358 (3.6%) |
| $55,000 to $64,999 | 3,515 (8.8%) | 3,847 (10.3%) |
| $65,000 to $74,999 | 2,643 (6.6%) | 2,278 (6.1%) |
| $75,000 to $99,999 | 5,063 (12.7%) | 3,037 (8.1%) |
| $100,000+ | 8,273 (20.8%) | 4,265 (11.4%) |
| Total | 39,790 (100.0%) | 37,302 (100.0%) |
Earnings by Sex by Educational Attainment in Lewisville
Average earnings in Lewisville are $59,587 for men and $45,242 for women, a difference of 24.1%. Men with an educational attainment of graduate degree enjoy the highest average annual earnings of $97,216, while those with less than high school education earn the least with $36,370. Women with an educational attainment of graduate degree earn the most with the average annual earnings of $64,964, while those with less than high school education have the smallest earnings of $23,108.
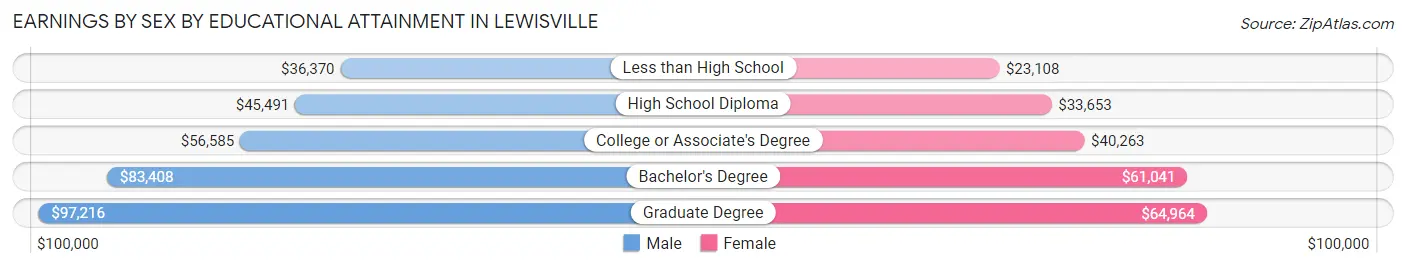
| Educational Attainment | Male Income | Female Income |
| Less than High School | $36,370 | $23,108 |
| High School Diploma | $45,491 | $33,653 |
| College or Associate's Degree | $56,585 | $40,263 |
| Bachelor's Degree | $83,408 | $61,041 |
| Graduate Degree | $97,216 | $64,964 |
| Total | $59,587 | $45,242 |
Family Income in Lewisville
Family Income Brackets in Lewisville
According to the Lewisville family income data, there are 6,250 families falling into the $100,000 to $149,999 income range, which is the most common income bracket and makes up 20.6% of all families. Conversely, the $10,000 to $14,999 income bracket is the least frequent group with only 303 families (1.0%) belonging to this category.
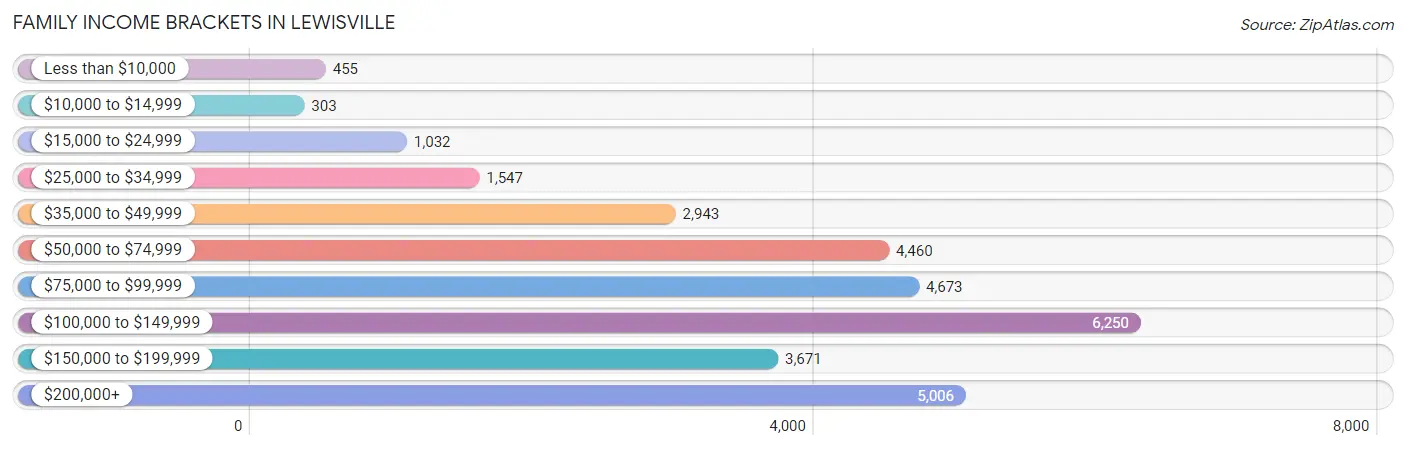
| Income Bracket | # Families | % Families |
| Less than $10,000 | 455 | 1.5% |
| $10,000 to $14,999 | 303 | 1.0% |
| $15,000 to $24,999 | 1,032 | 3.4% |
| $25,000 to $34,999 | 1,547 | 5.1% |
| $35,000 to $49,999 | 2,943 | 9.7% |
| $50,000 to $74,999 | 4,460 | 14.7% |
| $75,000 to $99,999 | 4,673 | 15.4% |
| $100,000 to $149,999 | 6,250 | 20.6% |
| $150,000 to $199,999 | 3,671 | 12.1% |
| $200,000+ | 5,006 | 16.5% |
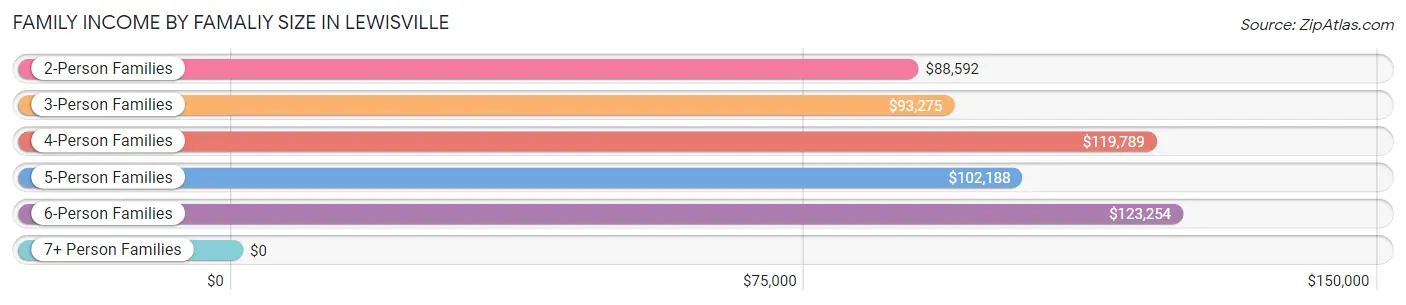
Family Income by Famaliy Size in Lewisville
6-person families (1,215 | 4.0%) account for the highest median family income in Lewisville with $123,254 per family, while 2-person families (12,371 | 40.8%) have the highest median income of $44,296 per family member.
| Income Bracket | # Families | Median Income |
| 2-Person Families | 12,371 (40.8%) | $88,592 |
| 3-Person Families | 7,049 (23.2%) | $93,275 |
| 4-Person Families | 6,434 (21.2%) | $119,789 |
| 5-Person Families | 2,784 (9.2%) | $102,188 |
| 6-Person Families | 1,215 (4.0%) | $123,254 |
| 7+ Person Families | 488 (1.6%) | $0 |
| Total | 30,341 (100.0%) | $98,501 |
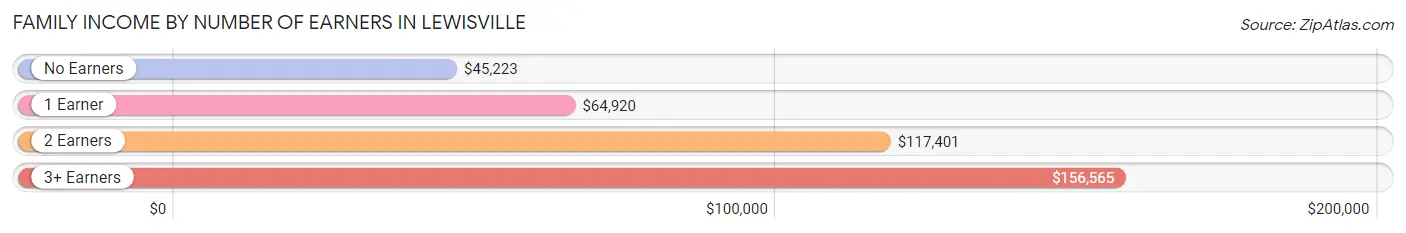
Family Income by Number of Earners in Lewisville
The median family income in Lewisville is $98,501, with families comprising 3+ earners (4,476) having the highest median family income of $156,565, while families with no earners (1,817) have the lowest median family income of $45,223, accounting for 14.7% and 6.0% of families, respectively.
| Number of Earners | # Families | Median Income |
| No Earners | 1,817 (6.0%) | $45,223 |
| 1 Earner | 9,012 (29.7%) | $64,920 |
| 2 Earners | 15,036 (49.6%) | $117,401 |
| 3+ Earners | 4,476 (14.7%) | $156,565 |
| Total | 30,341 (100.0%) | $98,501 |
Household Income in Lewisville
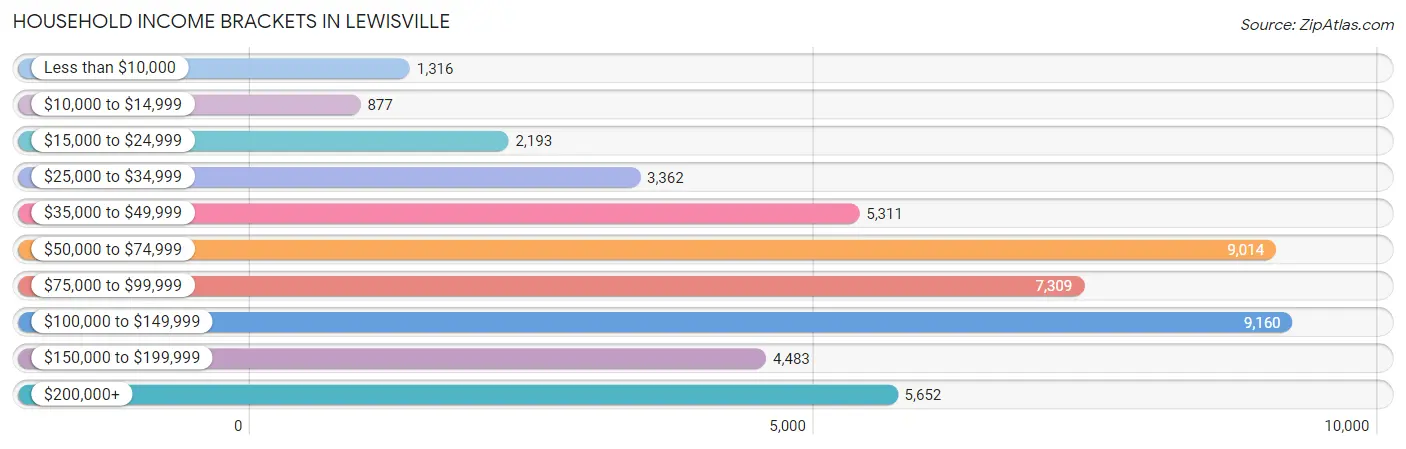
Household Income Brackets in Lewisville
With 9,160 households falling in the category, the $100,000 to $149,999 income range is the most frequent in Lewisville, accounting for 18.8% of all households. In contrast, only 877 households (1.8%) fall into the $10,000 to $14,999 income bracket, making it the least populous group.
| Income Bracket | # Households | % Households |
| Less than $10,000 | 1,316 | 2.7% |
| $10,000 to $14,999 | 877 | 1.8% |
| $15,000 to $24,999 | 2,193 | 4.5% |
| $25,000 to $34,999 | 3,362 | 6.9% |
| $35,000 to $49,999 | 5,311 | 10.9% |
| $50,000 to $74,999 | 9,014 | 18.5% |
| $75,000 to $99,999 | 7,309 | 15.0% |
| $100,000 to $149,999 | 9,160 | 18.8% |
| $150,000 to $199,999 | 4,483 | 9.2% |
| $200,000+ | 5,652 | 11.6% |
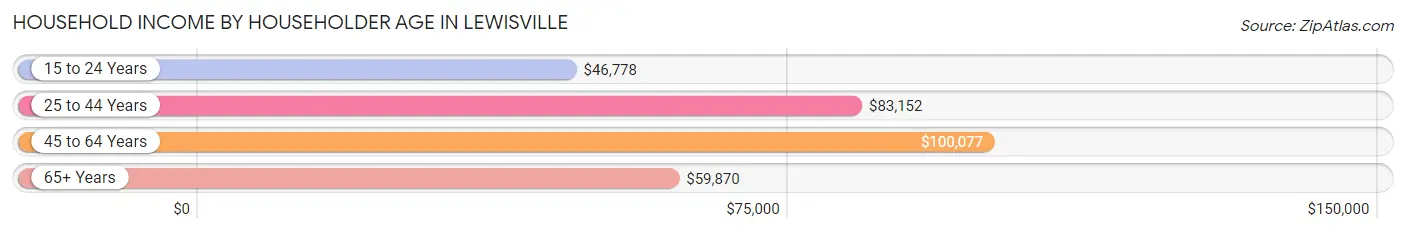
Household Income by Householder Age in Lewisville
The median household income in Lewisville is $82,006, with the highest median household income of $100,077 found in the 45 to 64 years age bracket for the primary householder. A total of 17,357 households (35.6%) fall into this category. Meanwhile, the 15 to 24 years age bracket for the primary householder has the lowest median household income of $46,778, with 2,579 households (5.3%) in this group.
| Income Bracket | # Households | Median Income |
| 15 to 24 Years | 2,579 (5.3%) | $46,778 |
| 25 to 44 Years | 22,397 (46.0%) | $83,152 |
| 45 to 64 Years | 17,357 (35.6%) | $100,077 |
| 65+ Years | 6,392 (13.1%) | $59,870 |
| Total | 48,725 (100.0%) | $82,006 |
Poverty in Lewisville
Income Below Poverty by Sex and Age in Lewisville
With 8.1% poverty level for males and 9.6% for females among the residents of Lewisville, 5 year old males and 6 to 11 year old females are the most vulnerable to poverty, with 181 males (22.5%) and 844 females (15.8%) in their respective age groups living below the poverty level.
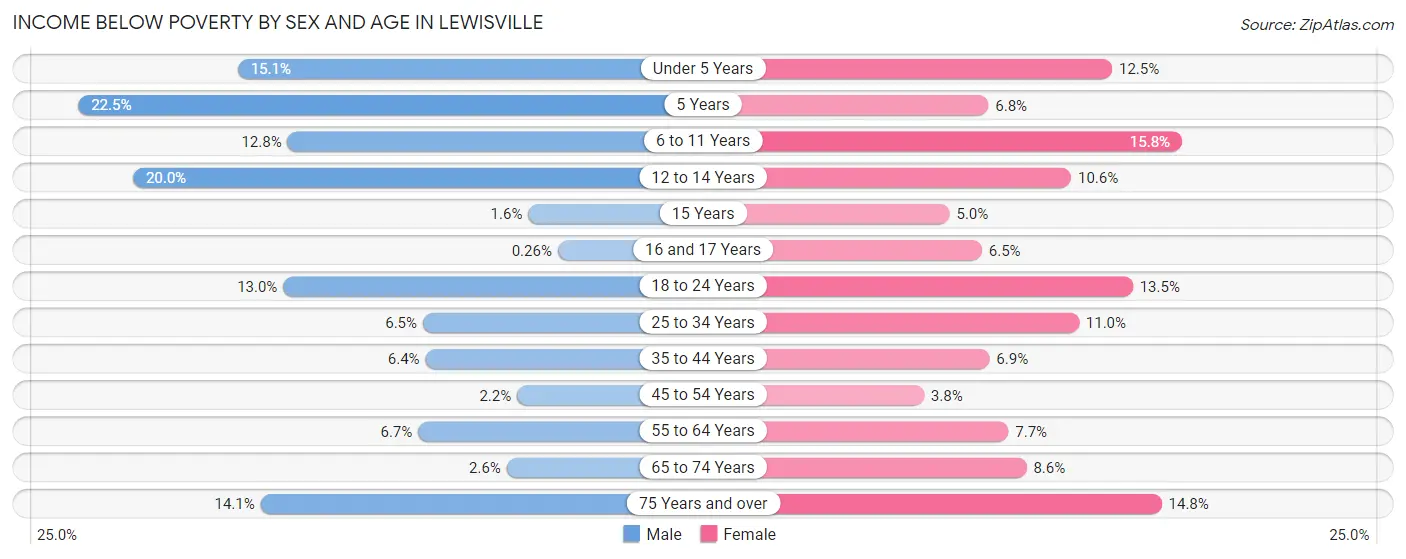
| Age Bracket | Male | Female |
| Under 5 Years | 633 (15.1%) | 545 (12.5%) |
| 5 Years | 181 (22.5%) | 34 (6.8%) |
| 6 to 11 Years | 550 (12.8%) | 844 (15.8%) |
| 12 to 14 Years | 466 (20.0%) | 272 (10.6%) |
| 15 Years | 8 (1.6%) | 55 (5.0%) |
| 16 and 17 Years | 5 (0.3%) | 102 (6.5%) |
| 18 to 24 Years | 683 (13.0%) | 762 (13.5%) |
| 25 to 34 Years | 778 (6.5%) | 1,287 (11.0%) |
| 35 to 44 Years | 609 (6.4%) | 683 (6.9%) |
| 45 to 54 Years | 179 (2.1%) | 319 (3.8%) |
| 55 to 64 Years | 430 (6.7%) | 518 (7.7%) |
| 65 to 74 Years | 73 (2.6%) | 320 (8.6%) |
| 75 Years and over | 230 (14.1%) | 416 (14.8%) |
| Total | 4,825 (8.1%) | 6,157 (9.6%) |
Income Above Poverty by Sex and Age in Lewisville
According to the poverty statistics in Lewisville, males aged 16 and 17 years and females aged 45 to 54 years are the age groups that are most secure financially, with 99.7% of males and 96.2% of females in these age groups living above the poverty line.
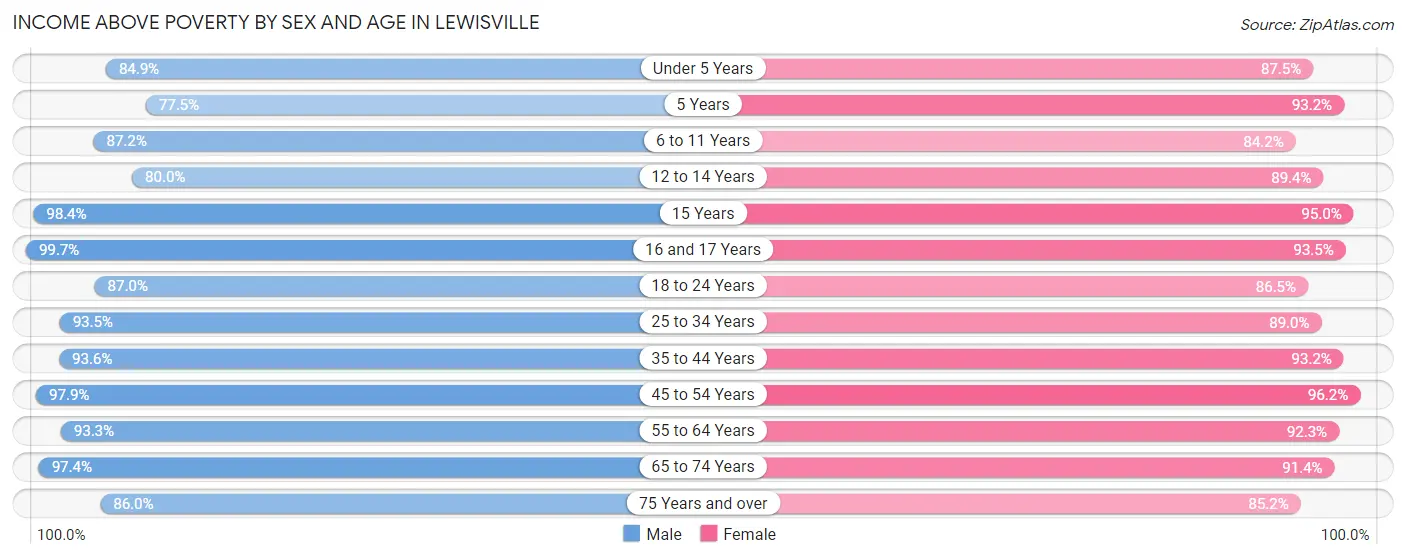
| Age Bracket | Male | Female |
| Under 5 Years | 3,557 (84.9%) | 3,800 (87.5%) |
| 5 Years | 623 (77.5%) | 466 (93.2%) |
| 6 to 11 Years | 3,746 (87.2%) | 4,506 (84.2%) |
| 12 to 14 Years | 1,868 (80.0%) | 2,285 (89.4%) |
| 15 Years | 484 (98.4%) | 1,045 (95.0%) |
| 16 and 17 Years | 1,925 (99.7%) | 1,467 (93.5%) |
| 18 to 24 Years | 4,571 (87.0%) | 4,881 (86.5%) |
| 25 to 34 Years | 11,151 (93.5%) | 10,418 (89.0%) |
| 35 to 44 Years | 8,911 (93.6%) | 9,281 (93.1%) |
| 45 to 54 Years | 8,141 (97.9%) | 8,049 (96.2%) |
| 55 to 64 Years | 5,951 (93.3%) | 6,184 (92.3%) |
| 65 to 74 Years | 2,707 (97.4%) | 3,415 (91.4%) |
| 75 Years and over | 1,407 (86.0%) | 2,387 (85.2%) |
| Total | 55,042 (91.9%) | 58,184 (90.4%) |
Income Below Poverty Among Married-Couple Families in Lewisville
The poverty statistics for married-couple families in Lewisville show that 3.8% or 834 of the total 22,004 families live below the poverty line. Families with 5 or more children have the highest poverty rate of 84.0%, comprising of 42 families. On the other hand, families with 1 or 2 children have the lowest poverty rate of 1.1%, which includes 95 families.
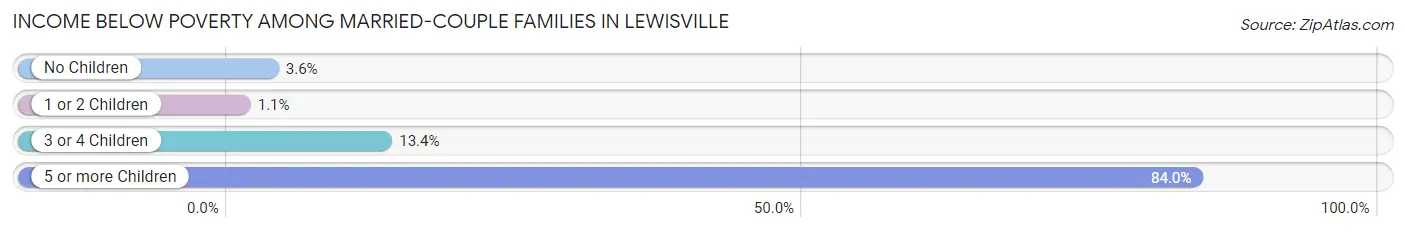
| Children | Above Poverty | Below Poverty |
| No Children | 10,718 (96.5%) | 394 (3.5%) |
| 1 or 2 Children | 8,491 (98.9%) | 95 (1.1%) |
| 3 or 4 Children | 1,953 (86.6%) | 303 (13.4%) |
| 5 or more Children | 8 (16.0%) | 42 (84.0%) |
| Total | 21,170 (96.2%) | 834 (3.8%) |
Income Below Poverty Among Single-Parent Households in Lewisville
According to the poverty data in Lewisville, 4.6% or 113 single-father households and 16.3% or 958 single-mother households are living below the poverty line. Among single-father households, those with 1 or 2 children have the highest poverty rate, with 102 households (8.7%) experiencing poverty. Likewise, among single-mother households, those with 5 or more children have the highest poverty rate, with 96 households (84.2%) falling below the poverty line.
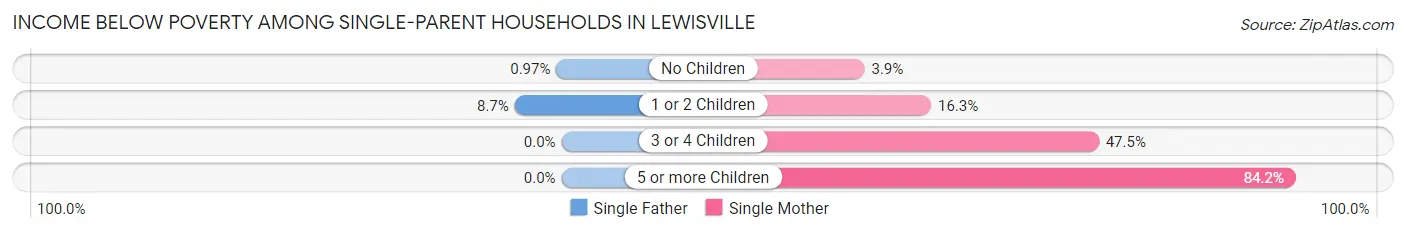
| Children | Single Father | Single Mother |
| No Children | 11 (1.0%) | 66 (3.9%) |
| 1 or 2 Children | 102 (8.7%) | 596 (16.3%) |
| 3 or 4 Children | 0 (0.0%) | 200 (47.5%) |
| 5 or more Children | 0 (0.0%) | 96 (84.2%) |
| Total | 113 (4.6%) | 958 (16.3%) |
Income Below Poverty Among Married-Couple vs Single-Parent Households in Lewisville
The poverty data for Lewisville shows that 834 of the married-couple family households (3.8%) and 1,071 of the single-parent households (12.9%) are living below the poverty level. Within the married-couple family households, those with 5 or more children have the highest poverty rate, with 42 households (84.0%) falling below the poverty line. Among the single-parent households, those with 5 or more children have the highest poverty rate, with 96 household (84.2%) living below poverty.
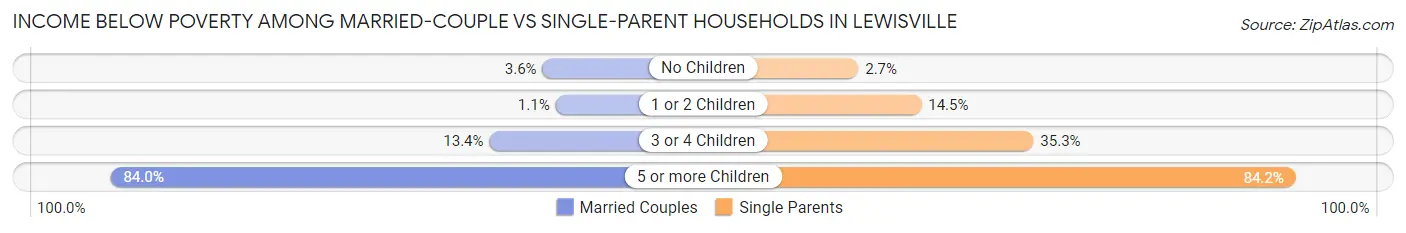
| Children | Married-Couple Families | Single-Parent Households |
| No Children | 394 (3.5%) | 77 (2.7%) |
| 1 or 2 Children | 95 (1.1%) | 698 (14.4%) |
| 3 or 4 Children | 303 (13.4%) | 200 (35.3%) |
| 5 or more Children | 42 (84.0%) | 96 (84.2%) |
| Total | 834 (3.8%) | 1,071 (12.9%) |
Race in Lewisville
The most populous races in Lewisville are White / Caucasian (67,626 | 54.1%), Hispanic or Latino (35,636 | 28.5%), and Asian (17,409 | 13.9%).
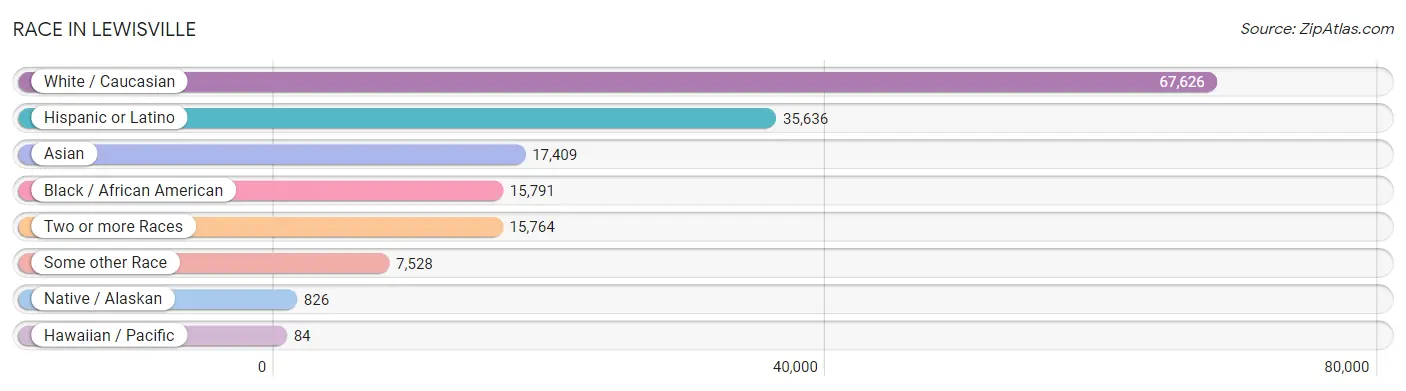
| Race | # Population | % Population |
| Asian | 17,409 | 13.9% |
| Black / African American | 15,791 | 12.6% |
| Hawaiian / Pacific | 84 | 0.1% |
| Hispanic or Latino | 35,636 | 28.5% |
| Native / Alaskan | 826 | 0.7% |
| White / Caucasian | 67,626 | 54.1% |
| Two or more Races | 15,764 | 12.6% |
| Some other Race | 7,528 | 6.0% |
| Total | 125,028 | 100.0% |
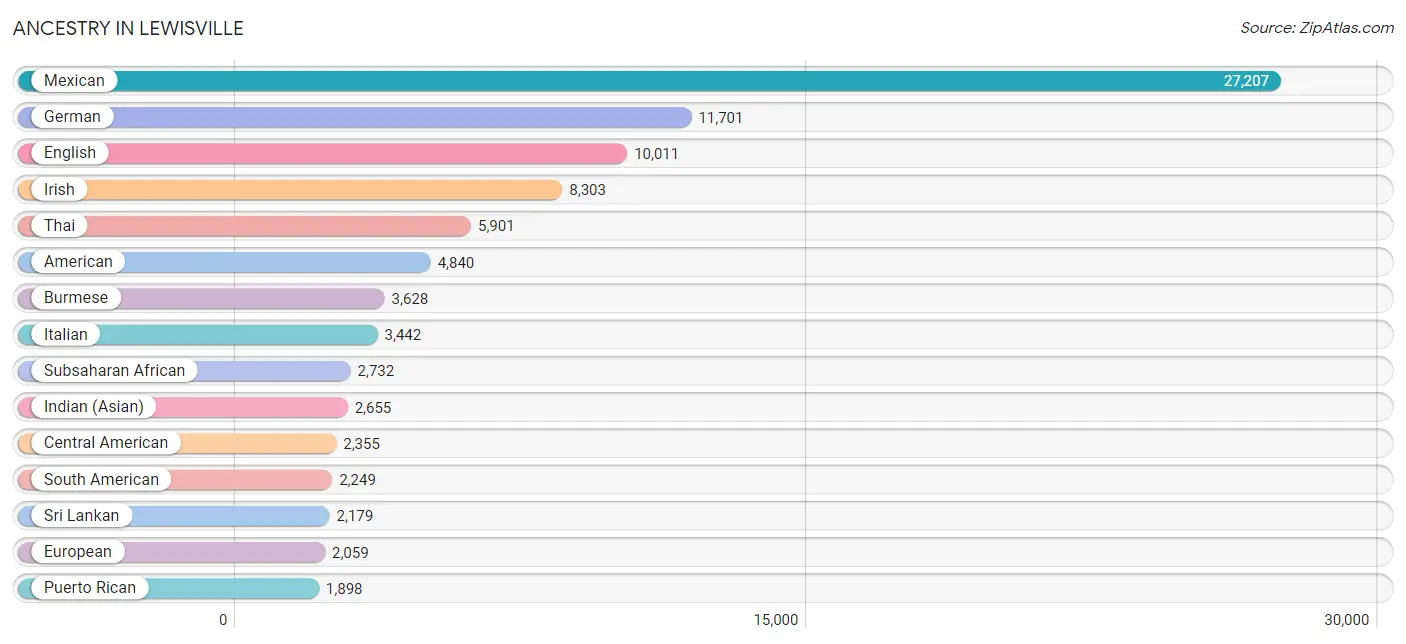
Ancestry in Lewisville
The most populous ancestries reported in Lewisville are Mexican (27,207 | 21.8%), German (11,701 | 9.4%), English (10,011 | 8.0%), Irish (8,303 | 6.6%), and Thai (5,901 | 4.7%), together accounting for 50.5% of all Lewisville residents.
| Ancestry | # Population | % Population |
| African | 1,065 | 0.9% |
| Albanian | 17 | 0.0% |
| American | 4,840 | 3.9% |
| Apache | 11 | 0.0% |
| Arab | 286 | 0.2% |
| Argentinean | 16 | 0.0% |
| Armenian | 54 | 0.0% |
| Australian | 13 | 0.0% |
| Austrian | 61 | 0.1% |
| Bangladeshi | 41 | 0.0% |
| Barbadian | 59 | 0.1% |
| Belgian | 81 | 0.1% |
| Belizean | 10 | 0.0% |
| Bhutanese | 253 | 0.2% |
| Blackfeet | 11 | 0.0% |
| Brazilian | 169 | 0.1% |
| British | 811 | 0.6% |
| British West Indian | 84 | 0.1% |
| Burmese | 3,628 | 2.9% |
| Cajun | 12 | 0.0% |
| Cambodian | 23 | 0.0% |
| Canadian | 119 | 0.1% |
| Celtic | 7 | 0.0% |
| Central American | 2,355 | 1.9% |
| Central American Indian | 49 | 0.0% |
| Cherokee | 336 | 0.3% |
| Chickasaw | 34 | 0.0% |
| Chilean | 74 | 0.1% |
| Choctaw | 178 | 0.1% |
| Colombian | 632 | 0.5% |
| Costa Rican | 4 | 0.0% |
| Creek | 60 | 0.1% |
| Croatian | 72 | 0.1% |
| Cuban | 383 | 0.3% |
| Czech | 559 | 0.4% |
| Czechoslovakian | 120 | 0.1% |
| Danish | 348 | 0.3% |
| Dominican | 234 | 0.2% |
| Dutch | 848 | 0.7% |
| Dutch West Indian | 52 | 0.0% |
| Eastern European | 191 | 0.2% |
| Ecuadorian | 74 | 0.1% |
| Egyptian | 29 | 0.0% |
| English | 10,011 | 8.0% |
| Ethiopian | 10 | 0.0% |
| European | 2,059 | 1.7% |
| Fijian | 16 | 0.0% |
| Filipino | 110 | 0.1% |
| Finnish | 34 | 0.0% |
| French | 1,766 | 1.4% |
| French Canadian | 250 | 0.2% |
| German | 11,701 | 9.4% |
| Ghanaian | 46 | 0.0% |
| Greek | 339 | 0.3% |
| Guamanian / Chamorro | 24 | 0.0% |
| Guatemalan | 271 | 0.2% |
| Haitian | 16 | 0.0% |
| Honduran | 372 | 0.3% |
| Hungarian | 471 | 0.4% |
| Indian (Asian) | 2,655 | 2.1% |
| Indonesian | 1,805 | 1.4% |
| Iranian | 168 | 0.1% |
| Iraqi | 18 | 0.0% |
| Irish | 8,303 | 6.6% |
| Italian | 3,442 | 2.8% |
| Jamaican | 252 | 0.2% |
| Japanese | 116 | 0.1% |
| Jordanian | 17 | 0.0% |
| Kenyan | 154 | 0.1% |
| Korean | 852 | 0.7% |
| Laotian | 92 | 0.1% |
| Latvian | 8 | 0.0% |
| Lebanese | 73 | 0.1% |
| Lithuanian | 45 | 0.0% |
| Malaysian | 11 | 0.0% |
| Mexican | 27,207 | 21.8% |
| Mexican American Indian | 787 | 0.6% |
| Mongolian | 6 | 0.0% |
| Native Hawaiian | 151 | 0.1% |
| Navajo | 18 | 0.0% |
| Nicaraguan | 128 | 0.1% |
| Nigerian | 1,069 | 0.9% |
| Northern European | 223 | 0.2% |
| Norwegian | 343 | 0.3% |
| Osage | 3 | 0.0% |
| Pakistani | 578 | 0.5% |
| Panamanian | 63 | 0.1% |
| Paraguayan | 66 | 0.1% |
| Pennsylvania German | 75 | 0.1% |
| Peruvian | 761 | 0.6% |
| Polish | 1,655 | 1.3% |
| Portuguese | 251 | 0.2% |
| Puerto Rican | 1,898 | 1.5% |
| Romanian | 15 | 0.0% |
| Russian | 203 | 0.2% |
| Salvadoran | 1,478 | 1.2% |
| Samoan | 50 | 0.0% |
| Scandinavian | 282 | 0.2% |
| Scotch-Irish | 851 | 0.7% |
| Scottish | 1,799 | 1.4% |
| Seminole | 13 | 0.0% |
| Sioux | 5 | 0.0% |
| Slavic | 9 | 0.0% |
| Slovak | 50 | 0.0% |
| South African | 56 | 0.0% |
| South American | 2,249 | 1.8% |
| South American Indian | 49 | 0.0% |
| Spaniard | 373 | 0.3% |
| Spanish | 157 | 0.1% |
| Sri Lankan | 2,179 | 1.7% |
| Subsaharan African | 2,732 | 2.2% |
| Sudanese | 65 | 0.1% |
| Swedish | 501 | 0.4% |
| Swiss | 71 | 0.1% |
| Syrian | 9 | 0.0% |
| Thai | 5,901 | 4.7% |
| Trinidadian and Tobagonian | 24 | 0.0% |
| Turkish | 183 | 0.2% |
| Ukrainian | 154 | 0.1% |
| Venezuelan | 611 | 0.5% |
| Vietnamese | 14 | 0.0% |
| Welsh | 540 | 0.4% |
| West Indian | 63 | 0.1% |
| Yugoslavian | 30 | 0.0% |
| Zimbabwean | 26 | 0.0% | View All 125 Rows |
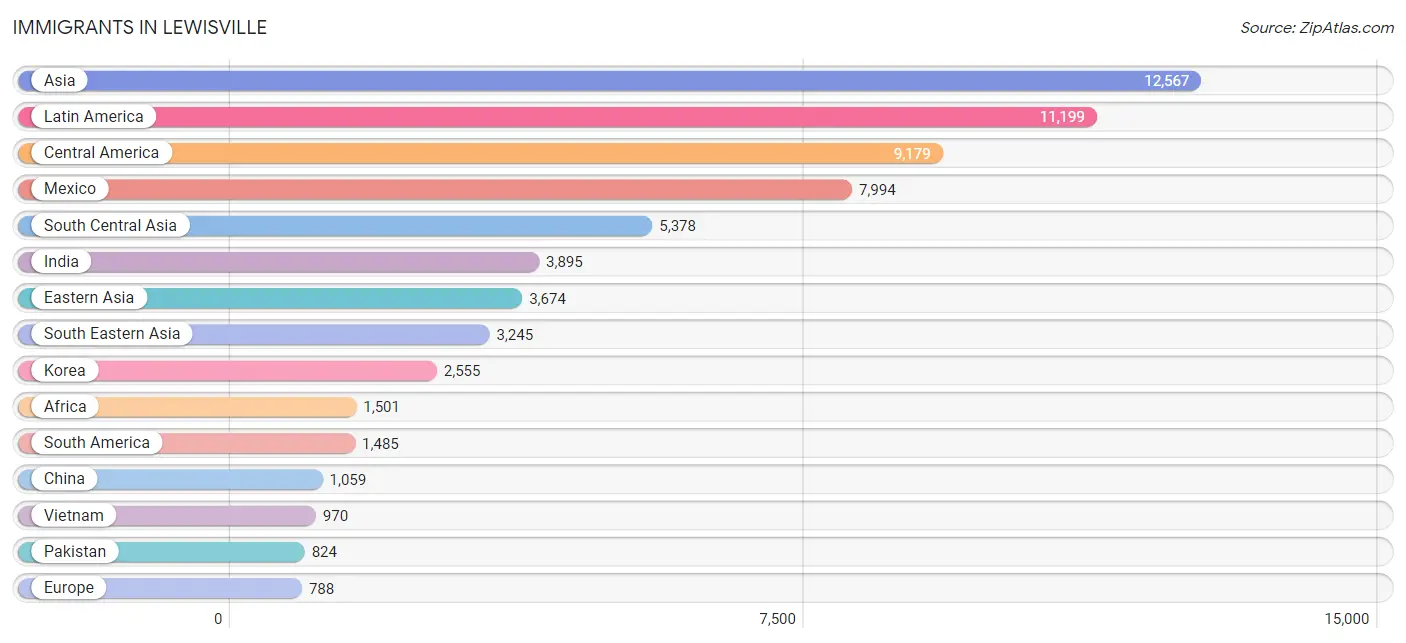
Immigrants in Lewisville
The most numerous immigrant groups reported in Lewisville came from Asia (12,567 | 10.1%), Latin America (11,199 | 9.0%), Central America (9,179 | 7.3%), Mexico (7,994 | 6.4%), and South Central Asia (5,378 | 4.3%), together accounting for 37.0% of all Lewisville residents.
| Immigration Origin | # Population | % Population |
| Africa | 1,501 | 1.2% |
| Argentina | 14 | 0.0% |
| Asia | 12,567 | 10.1% |
| Bangladesh | 37 | 0.0% |
| Barbados | 7 | 0.0% |
| Bosnia and Herzegovina | 18 | 0.0% |
| Brazil | 211 | 0.2% |
| Cambodia | 28 | 0.0% |
| Cameroon | 101 | 0.1% |
| Canada | 164 | 0.1% |
| Caribbean | 535 | 0.4% |
| Central America | 9,179 | 7.3% |
| China | 1,059 | 0.9% |
| Colombia | 210 | 0.2% |
| Congo | 26 | 0.0% |
| Costa Rica | 4 | 0.0% |
| Cuba | 37 | 0.0% |
| Denmark | 20 | 0.0% |
| Dominican Republic | 147 | 0.1% |
| Eastern Africa | 361 | 0.3% |
| Eastern Asia | 3,674 | 2.9% |
| Eastern Europe | 113 | 0.1% |
| Ecuador | 9 | 0.0% |
| Egypt | 5 | 0.0% |
| El Salvador | 626 | 0.5% |
| England | 126 | 0.1% |
| Europe | 788 | 0.6% |
| France | 66 | 0.1% |
| Germany | 172 | 0.1% |
| Ghana | 16 | 0.0% |
| Greece | 36 | 0.0% |
| Grenada | 12 | 0.0% |
| Guatemala | 118 | 0.1% |
| Guyana | 46 | 0.0% |
| Haiti | 16 | 0.0% |
| Honduras | 270 | 0.2% |
| Hong Kong | 60 | 0.1% |
| Hungary | 14 | 0.0% |
| India | 3,895 | 3.1% |
| Indonesia | 91 | 0.1% |
| Iran | 110 | 0.1% |
| Iraq | 23 | 0.0% |
| Italy | 124 | 0.1% |
| Jamaica | 160 | 0.1% |
| Japan | 60 | 0.1% |
| Kenya | 239 | 0.2% |
| Korea | 2,555 | 2.0% |
| Kuwait | 36 | 0.0% |
| Latin America | 11,199 | 9.0% |
| Lebanon | 35 | 0.0% |
| Malaysia | 159 | 0.1% |
| Mexico | 7,994 | 6.4% |
| Middle Africa | 296 | 0.2% |
| Moldova | 19 | 0.0% |
| Nepal | 470 | 0.4% |
| Nicaragua | 128 | 0.1% |
| Nigeria | 606 | 0.5% |
| Northern Africa | 88 | 0.1% |
| Northern Europe | 243 | 0.2% |
| Oceania | 41 | 0.0% |
| Pakistan | 824 | 0.7% |
| Panama | 39 | 0.0% |
| Peru | 408 | 0.3% |
| Philippines | 466 | 0.4% |
| Poland | 8 | 0.0% |
| Portugal | 4 | 0.0% |
| Russia | 7 | 0.0% |
| Scotland | 20 | 0.0% |
| Singapore | 67 | 0.1% |
| South Africa | 67 | 0.1% |
| South America | 1,485 | 1.2% |
| South Central Asia | 5,378 | 4.3% |
| South Eastern Asia | 3,245 | 2.6% |
| Southern Europe | 186 | 0.2% |
| Spain | 22 | 0.0% |
| Sri Lanka | 42 | 0.0% |
| Sudan | 65 | 0.1% |
| Taiwan | 155 | 0.1% |
| Thailand | 64 | 0.1% |
| Trinidad and Tobago | 92 | 0.1% |
| Turkey | 108 | 0.1% |
| Ukraine | 43 | 0.0% |
| Venezuela | 549 | 0.4% |
| Vietnam | 970 | 0.8% |
| West Indies | 29 | 0.0% |
| Western Africa | 680 | 0.5% |
| Western Asia | 270 | 0.2% |
| Western Europe | 238 | 0.2% |
| Zaire | 169 | 0.1% |
| Zimbabwe | 56 | 0.0% | View All 90 Rows |
Sex and Age in Lewisville
Sex and Age in Lewisville
The most populous age groups in Lewisville are 25 to 29 Years (6,270 | 10.4%) for men and 25 to 29 Years (5,936 | 9.2%) for women.
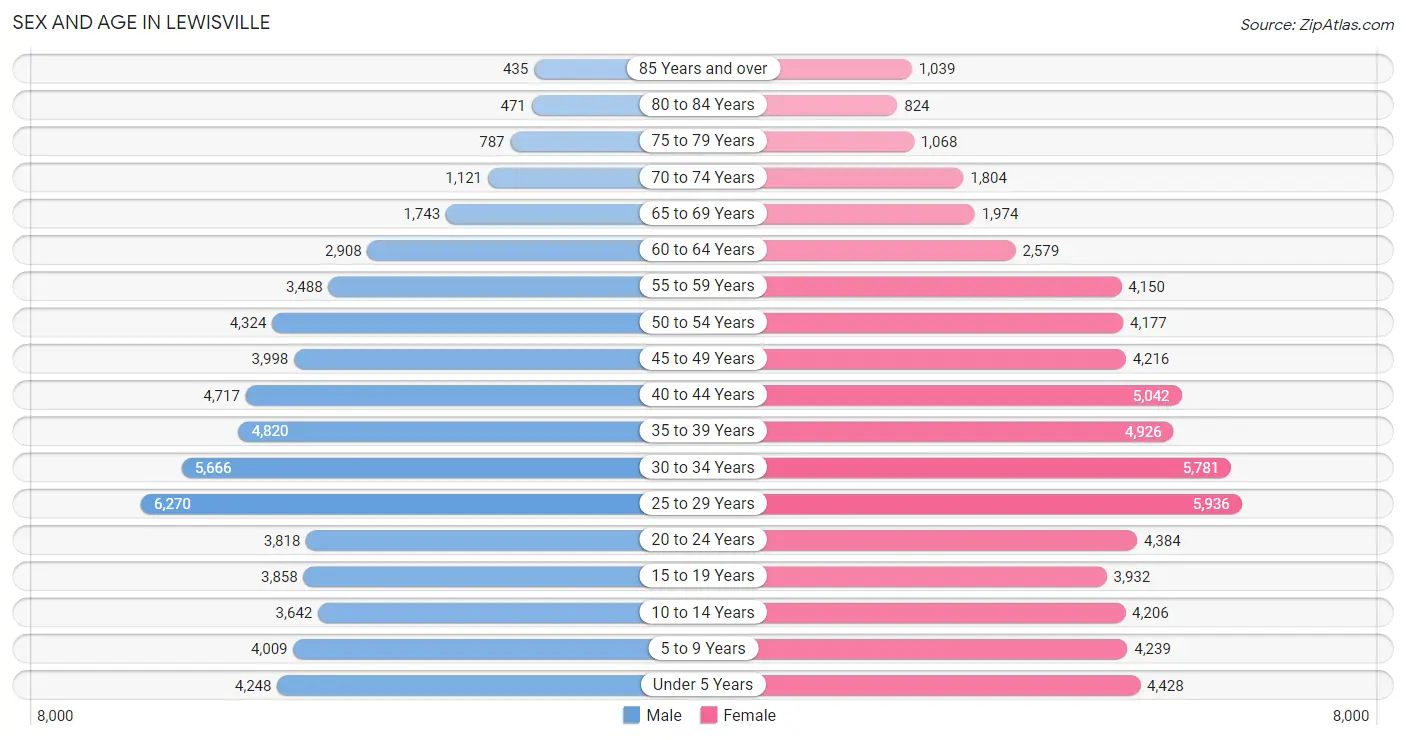
| Age Bracket | Male | Female |
| Under 5 Years | 4,248 (7.0%) | 4,428 (6.8%) |
| 5 to 9 Years | 4,009 (6.7%) | 4,239 (6.6%) |
| 10 to 14 Years | 3,642 (6.0%) | 4,206 (6.5%) |
| 15 to 19 Years | 3,858 (6.4%) | 3,932 (6.1%) |
| 20 to 24 Years | 3,818 (6.3%) | 4,384 (6.8%) |
| 25 to 29 Years | 6,270 (10.4%) | 5,936 (9.2%) |
| 30 to 34 Years | 5,666 (9.4%) | 5,781 (8.9%) |
| 35 to 39 Years | 4,820 (8.0%) | 4,926 (7.6%) |
| 40 to 44 Years | 4,717 (7.8%) | 5,042 (7.8%) |
| 45 to 49 Years | 3,998 (6.6%) | 4,216 (6.5%) |
| 50 to 54 Years | 4,324 (7.2%) | 4,177 (6.5%) |
| 55 to 59 Years | 3,488 (5.8%) | 4,150 (6.4%) |
| 60 to 64 Years | 2,908 (4.8%) | 2,579 (4.0%) |
| 65 to 69 Years | 1,743 (2.9%) | 1,974 (3.0%) |
| 70 to 74 Years | 1,121 (1.9%) | 1,804 (2.8%) |
| 75 to 79 Years | 787 (1.3%) | 1,068 (1.7%) |
| 80 to 84 Years | 471 (0.8%) | 824 (1.3%) |
| 85 Years and over | 435 (0.7%) | 1,039 (1.6%) |
| Total | 60,323 (100.0%) | 64,705 (100.0%) |
Families and Households in Lewisville
Median Family Size in Lewisville
The median family size in Lewisville is 3.26 persons per family, with married-couple families (22,004 | 72.5%) accounting for the largest median family size of 3.32 persons per family. On the other hand, single male/father families (2,444 | 8.1%) represent the smallest median family size with 2.86 persons per family.
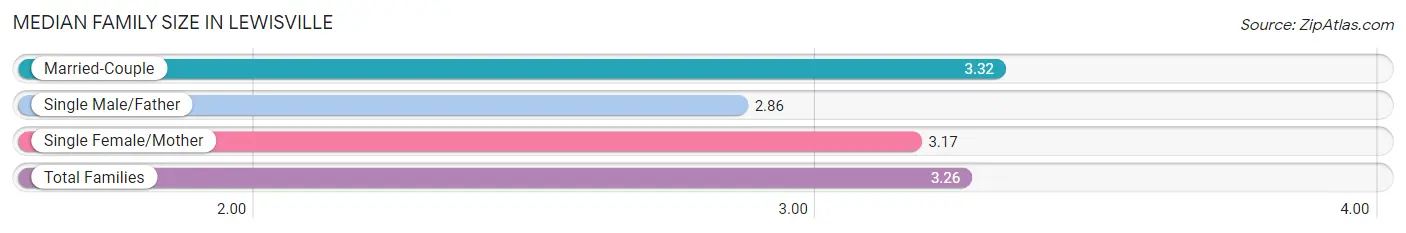
| Family Type | # Families | Family Size |
| Married-Couple | 22,004 (72.5%) | 3.32 |
| Single Male/Father | 2,444 (8.1%) | 2.86 |
| Single Female/Mother | 5,893 (19.4%) | 3.17 |
| Total Families | 30,341 (100.0%) | 3.26 |
Median Household Size in Lewisville
The median household size in Lewisville is 2.56 persons per household, with single female/mother households (5,893 | 12.1%) accounting for the largest median household size of 3.39 persons per household. non-family households (18,384 | 37.7%) represent the smallest median household size with 1.26 persons per household.
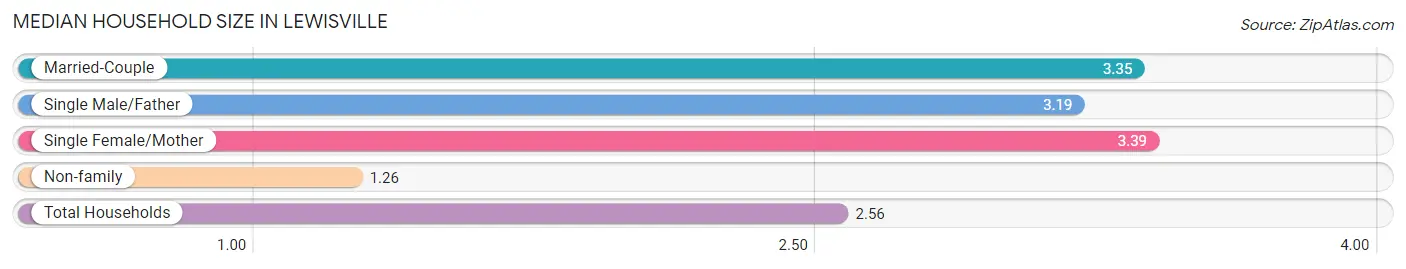
| Household Type | # Households | Household Size |
| Married-Couple | 22,004 (45.2%) | 3.35 |
| Single Male/Father | 2,444 (5.0%) | 3.19 |
| Single Female/Mother | 5,893 (12.1%) | 3.39 |
| Non-family | 18,384 (37.7%) | 1.26 |
| Total Households | 48,725 (100.0%) | 2.56 |
Household Size by Marriage Status in Lewisville
Out of a total of 48,725 households in Lewisville, 30,341 (62.3%) are family households, while 18,384 (37.7%) are nonfamily households. The most numerous type of family households are 2-person households, comprising 11,195, and the most common type of nonfamily households are 1-person households, comprising 14,767.
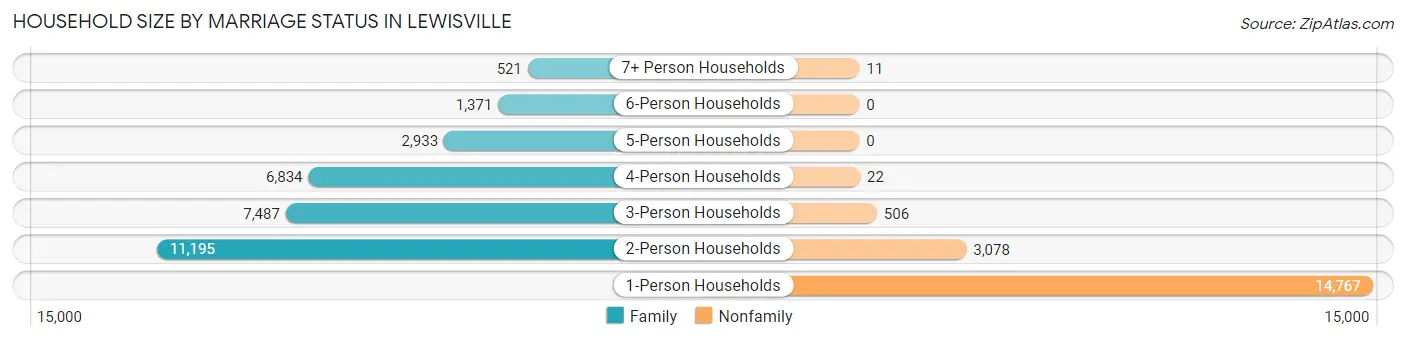
| Household Size | Family Households | Nonfamily Households |
| 1-Person Households | - | 14,767 (30.3%) |
| 2-Person Households | 11,195 (23.0%) | 3,078 (6.3%) |
| 3-Person Households | 7,487 (15.4%) | 506 (1.0%) |
| 4-Person Households | 6,834 (14.0%) | 22 (0.1%) |
| 5-Person Households | 2,933 (6.0%) | 0 (0.0%) |
| 6-Person Households | 1,371 (2.8%) | 0 (0.0%) |
| 7+ Person Households | 521 (1.1%) | 11 (0.0%) |
| Total | 30,341 (62.3%) | 18,384 (37.7%) |
Female Fertility in Lewisville
Fertility by Age in Lewisville
Average fertility rate in Lewisville is 59.0 births per 1,000 women. Women in the age bracket of 20 to 34 years have the highest fertility rate with 82.0 births per 1,000 women. Women in the age bracket of 20 to 34 years acount for 64.3% of all women with births.
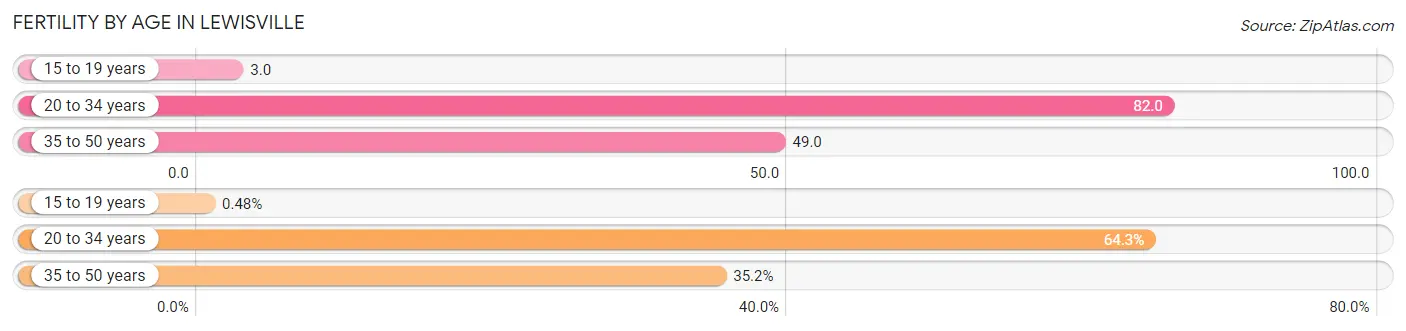
| Age Bracket | Women with Births | Births / 1,000 Women |
| 15 to 19 years | 10 (0.5%) | 3.0 |
| 20 to 34 years | 1,328 (64.3%) | 82.0 |
| 35 to 50 years | 726 (35.2%) | 49.0 |
| Total | 2,064 (100.0%) | 59.0 |
Fertility by Age by Marriage Status in Lewisville
69.2% of women with births (2,064) in Lewisville are married. The highest percentage of unmarried women with births falls into 15 to 19 years age bracket with 100.0% of them unmarried at the time of birth, while the lowest percentage of unmarried women with births belong to 35 to 50 years age bracket with 19.7% of them unmarried.
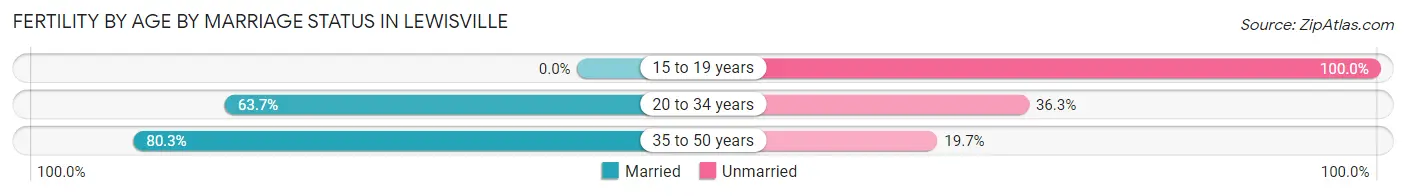
| Age Bracket | Married | Unmarried |
| 15 to 19 years | 0 (0.0%) | 10 (100.0%) |
| 20 to 34 years | 846 (63.7%) | 482 (36.3%) |
| 35 to 50 years | 583 (80.3%) | 143 (19.7%) |
| Total | 1,428 (69.2%) | 636 (30.8%) |
Fertility by Education in Lewisville
Average fertility rate in Lewisville is 59.0 births per 1,000 women. Women with the education attainment of high school diploma have the highest fertility rate of 95.0 births per 1,000 women, while women with the education attainment of less than high school have the lowest fertility at 17.0 births per 1,000 women. Women with the education attainment of college or associate's degree represent 33.1% of all women with births.
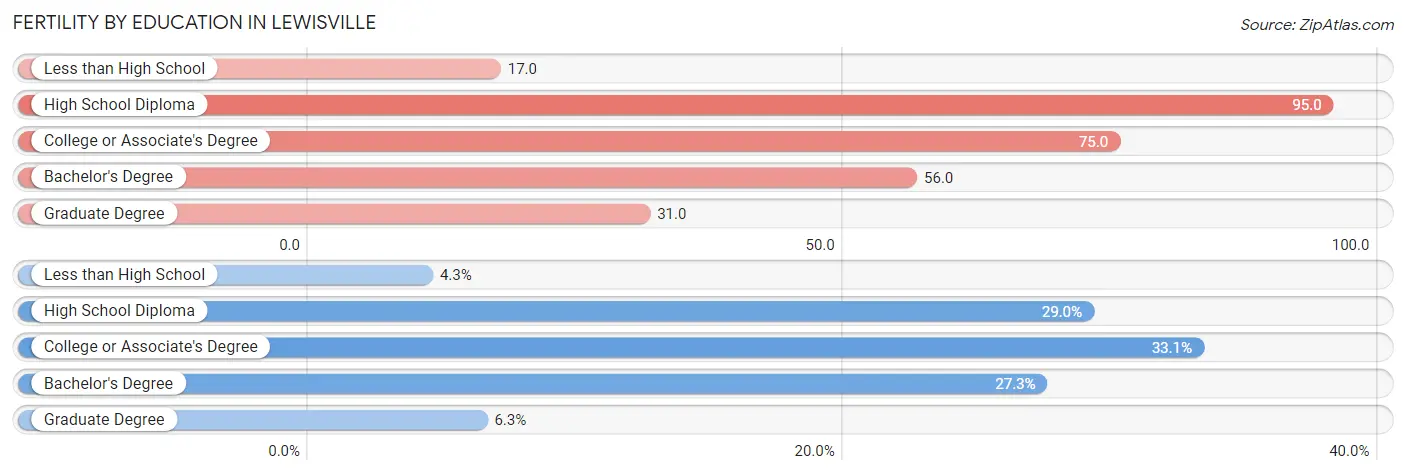
| Educational Attainment | Women with Births | Births / 1,000 Women |
| Less than High School | 88 (4.3%) | 17.0 |
| High School Diploma | 599 (29.0%) | 95.0 |
| College or Associate's Degree | 684 (33.1%) | 75.0 |
| Bachelor's Degree | 563 (27.3%) | 56.0 |
| Graduate Degree | 130 (6.3%) | 31.0 |
| Total | 2,064 (100.0%) | 59.0 |
Fertility by Education by Marriage Status in Lewisville
30.8% of women with births in Lewisville are unmarried. Women with the educational attainment of bachelor's degree are most likely to be married with 86.0% of them married at childbirth, while women with the educational attainment of graduate degree are least likely to be married with 56.1% of them unmarried at childbirth.
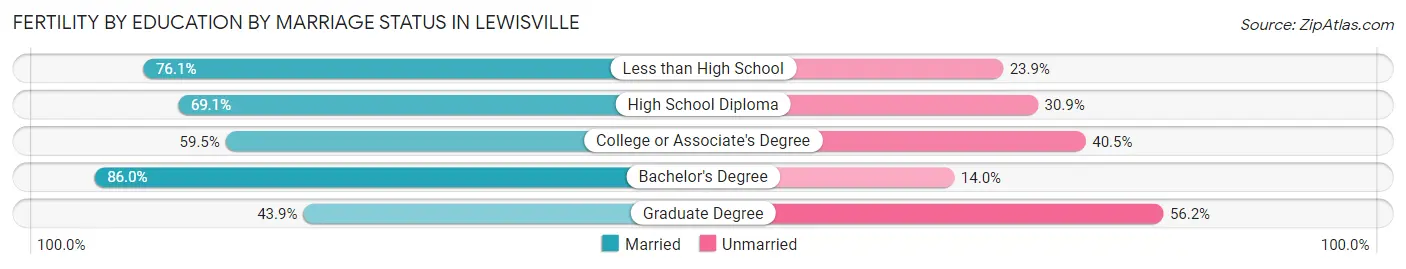
| Educational Attainment | Married | Unmarried |
| Less than High School | 67 (76.1%) | 21 (23.9%) |
| High School Diploma | 414 (69.1%) | 185 (30.9%) |
| College or Associate's Degree | 407 (59.5%) | 277 (40.5%) |
| Bachelor's Degree | 484 (86.0%) | 79 (14.0%) |
| Graduate Degree | 57 (43.9%) | 73 (56.1%) |
| Total | 1,428 (69.2%) | 636 (30.8%) |
Employment Characteristics in Lewisville
Employment by Class of Employer in Lewisville
Among the 70,175 employed individuals in Lewisville, private company employees (54,194 | 77.2%), local government employees (4,428 | 6.3%), and self-employed (not incorporated) (3,571 | 5.1%) make up the most common classes of employment.
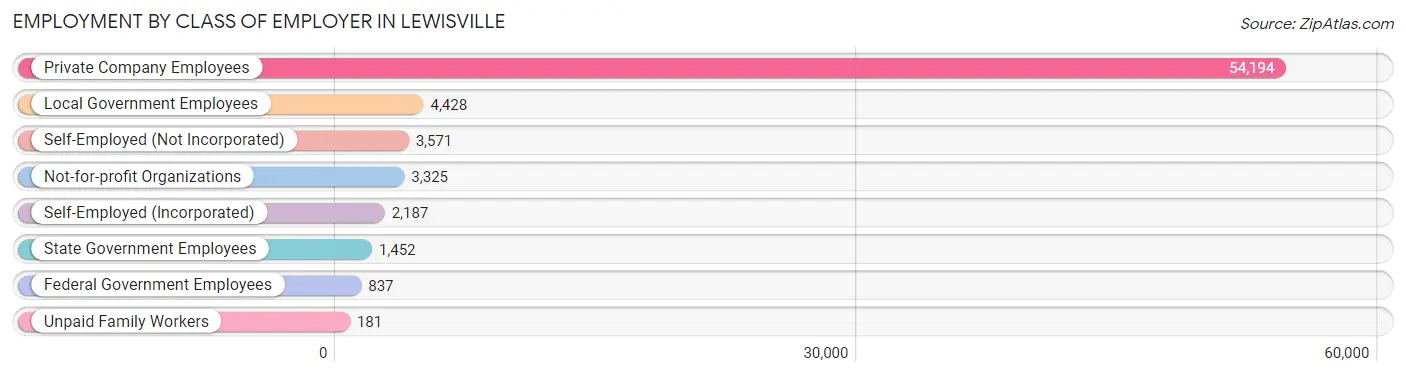
| Employer Class | # Employees | % Employees |
| Private Company Employees | 54,194 | 77.2% |
| Self-Employed (Incorporated) | 2,187 | 3.1% |
| Self-Employed (Not Incorporated) | 3,571 | 5.1% |
| Not-for-profit Organizations | 3,325 | 4.7% |
| Local Government Employees | 4,428 | 6.3% |
| State Government Employees | 1,452 | 2.1% |
| Federal Government Employees | 837 | 1.2% |
| Unpaid Family Workers | 181 | 0.3% |
| Total | 70,175 | 100.0% |
Employment Status by Age in Lewisville
According to the labor force statistics for Lewisville, out of the total population over 16 years of age (98,664), 75.9% or 74,886 individuals are in the labor force, with 3.8% or 2,846 of them unemployed. The age group with the highest labor force participation rate is 25 to 29 years, with 93.0% or 11,352 individuals in the labor force. Within the labor force, the 16 to 19 years age range has the highest percentage of unemployed individuals, with 13.3% or 312 of them being unemployed.
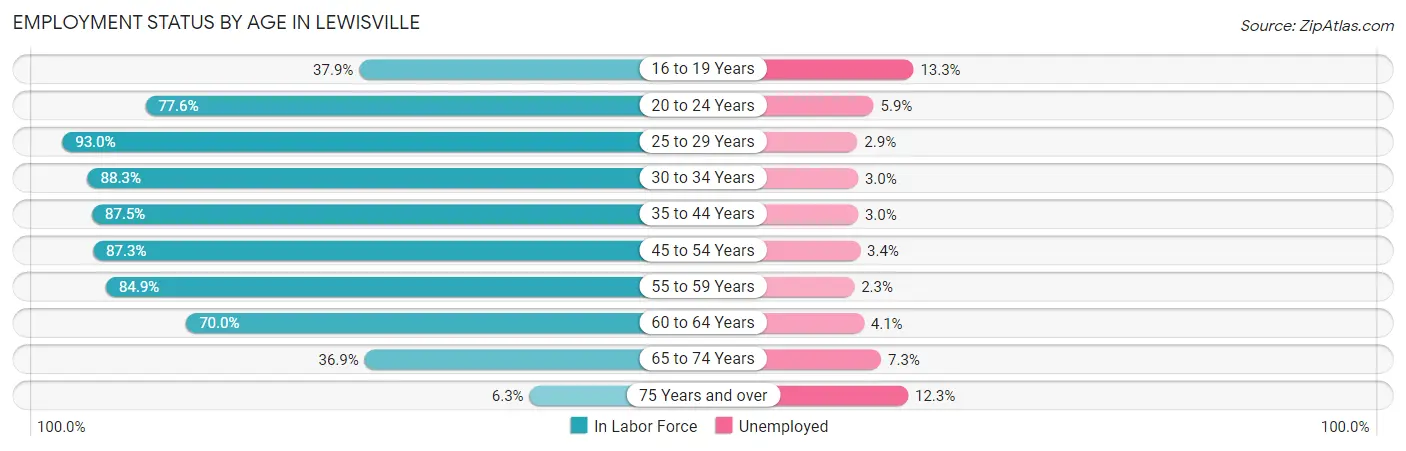
| Age Bracket | In Labor Force | Unemployed |
| 16 to 19 Years | 2,349 (37.9%) | 312 (13.3%) |
| 20 to 24 Years | 6,365 (77.6%) | 376 (5.9%) |
| 25 to 29 Years | 11,352 (93.0%) | 329 (2.9%) |
| 30 to 34 Years | 10,108 (88.3%) | 303 (3.0%) |
| 35 to 44 Years | 17,067 (87.5%) | 512 (3.0%) |
| 45 to 54 Years | 14,592 (87.3%) | 496 (3.4%) |
| 55 to 59 Years | 6,485 (84.9%) | 149 (2.3%) |
| 60 to 64 Years | 3,841 (70.0%) | 157 (4.1%) |
| 65 to 74 Years | 2,451 (36.9%) | 179 (7.3%) |
| 75 Years and over | 291 (6.3%) | 36 (12.3%) |
| Total | 74,886 (75.9%) | 2,846 (3.8%) |
Employment Status by Educational Attainment in Lewisville
According to labor force statistics for Lewisville, 86.9% of individuals (63,435) out of the total population between 25 and 64 years of age (72,998) are in the labor force, with 3.1% or 1,966 of them being unemployed. The group with the highest labor force participation rate are those with the educational attainment of bachelor's degree or higher, with 91.1% or 27,619 individuals in the labor force. Within the labor force, individuals with high school diploma education have the highest percentage of unemployment, with 4.5% or 503 of them being unemployed.
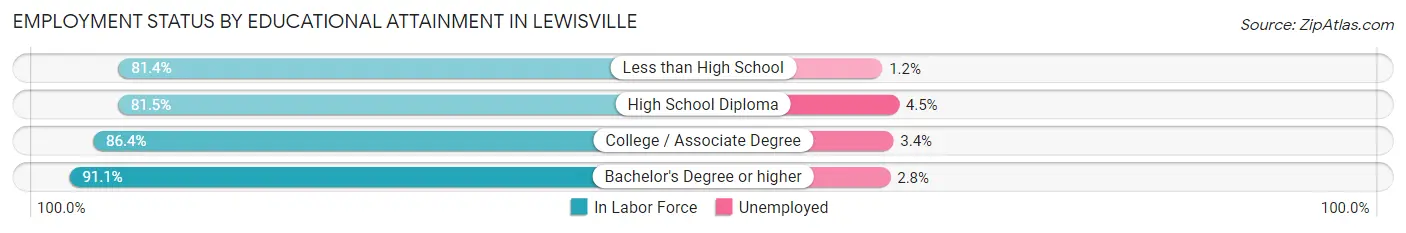
| Educational Attainment | In Labor Force | Unemployed |
| Less than High School | 6,294 (81.4%) | 93 (1.2%) |
| High School Diploma | 11,179 (81.5%) | 617 (4.5%) |
| College / Associate Degree | 18,344 (86.4%) | 722 (3.4%) |
| Bachelor's Degree or higher | 27,619 (91.1%) | 849 (2.8%) |
| Total | 63,435 (86.9%) | 2,263 (3.1%) |
Employment Occupations by Sex in Lewisville
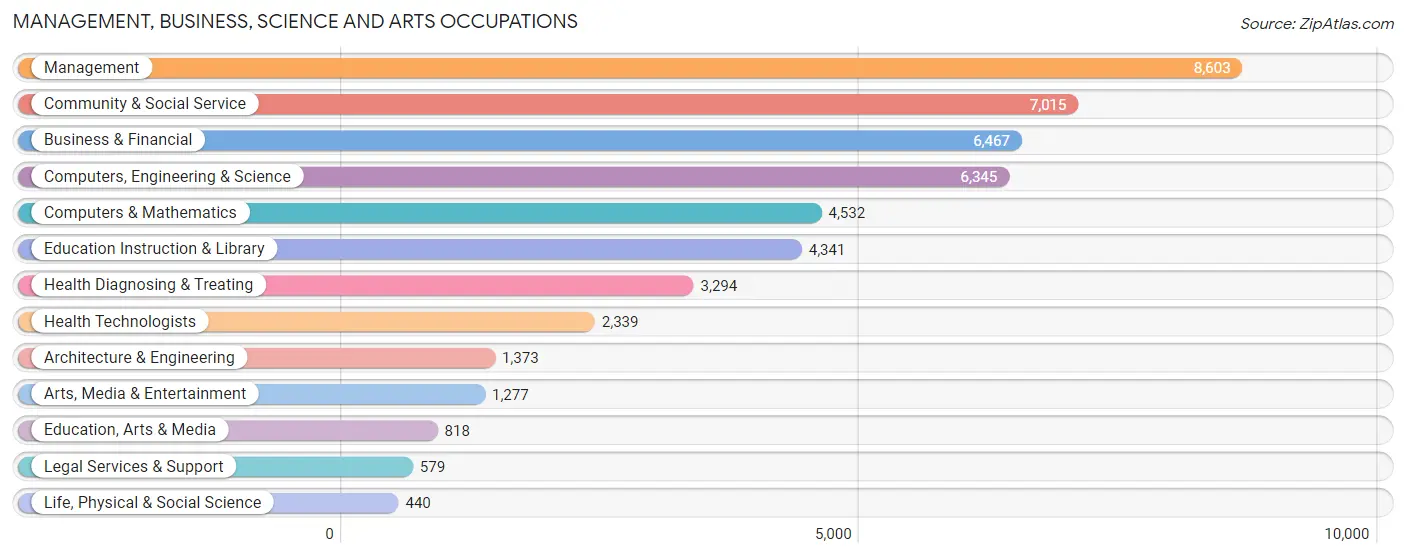
Management, Business, Science and Arts Occupations
The most common Management, Business, Science and Arts occupations in Lewisville are Management (8,603 | 12.0%), Community & Social Service (7,015 | 9.8%), Business & Financial (6,467 | 9.0%), Computers, Engineering & Science (6,345 | 8.8%), and Computers & Mathematics (4,532 | 6.3%).
Management, Business, Science and Arts Occupations by Sex
Within the Management, Business, Science and Arts occupations in Lewisville, the most male-oriented occupations are Architecture & Engineering (76.3%), Computers & Mathematics (70.3%), and Computers, Engineering & Science (70.2%), while the most female-oriented occupations are Health Diagnosing & Treating (79.2%), Health Technologists (78.2%), and Education Instruction & Library (75.0%).
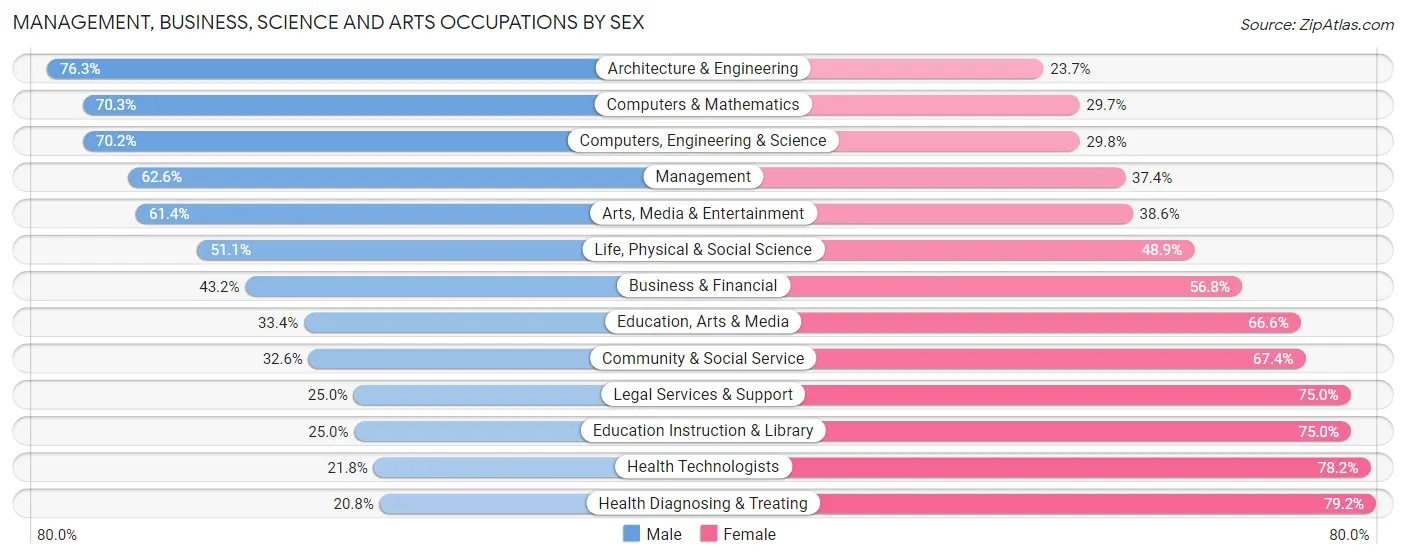
| Occupation | Male | Female |
| Management | 5,389 (62.6%) | 3,214 (37.4%) |
| Business & Financial | 2,792 (43.2%) | 3,675 (56.8%) |
| Computers, Engineering & Science | 4,457 (70.2%) | 1,888 (29.8%) |
| Computers & Mathematics | 3,185 (70.3%) | 1,347 (29.7%) |
| Architecture & Engineering | 1,047 (76.3%) | 326 (23.7%) |
| Life, Physical & Social Science | 225 (51.1%) | 215 (48.9%) |
| Community & Social Service | 2,286 (32.6%) | 4,729 (67.4%) |
| Education, Arts & Media | 273 (33.4%) | 545 (66.6%) |
| Legal Services & Support | 145 (25.0%) | 434 (75.0%) |
| Education Instruction & Library | 1,084 (25.0%) | 3,257 (75.0%) |
| Arts, Media & Entertainment | 784 (61.4%) | 493 (38.6%) |
| Health Diagnosing & Treating | 684 (20.8%) | 2,610 (79.2%) |
| Health Technologists | 509 (21.8%) | 1,830 (78.2%) |
| Total (Category) | 15,608 (49.2%) | 16,116 (50.8%) |
| Total (Overall) | 37,561 (52.2%) | 34,362 (47.8%) |
Services Occupations
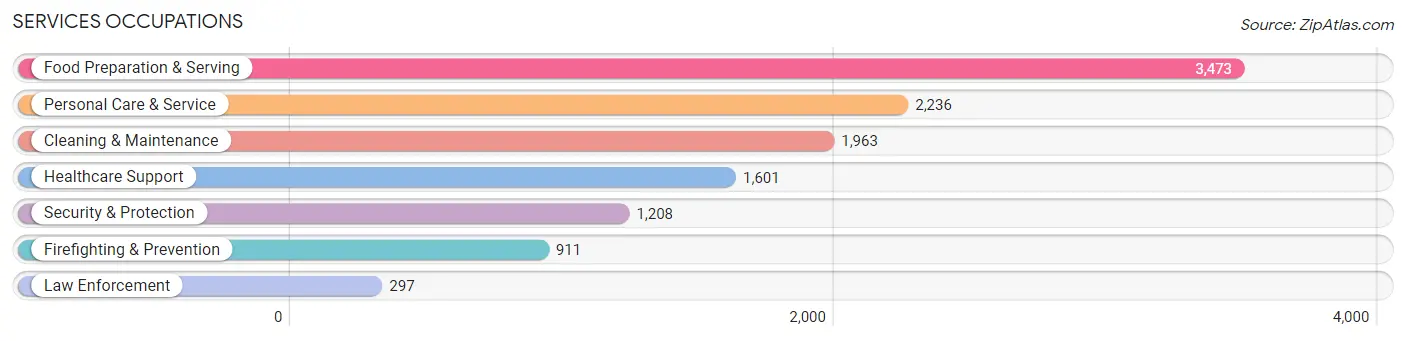
The most common Services occupations in Lewisville are Food Preparation & Serving (3,473 | 4.8%), Personal Care & Service (2,236 | 3.1%), Cleaning & Maintenance (1,963 | 2.7%), Healthcare Support (1,601 | 2.2%), and Security & Protection (1,208 | 1.7%).
Services Occupations by Sex
Within the Services occupations in Lewisville, the most male-oriented occupations are Law Enforcement (79.8%), Security & Protection (56.7%), and Cleaning & Maintenance (50.7%), while the most female-oriented occupations are Healthcare Support (79.8%), Personal Care & Service (58.7%), and Food Preparation & Serving (55.6%).
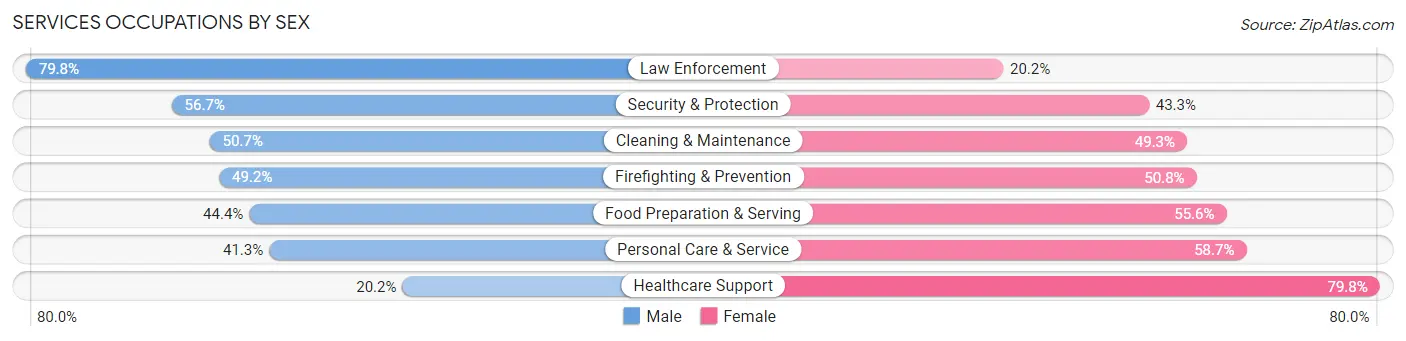
| Occupation | Male | Female |
| Healthcare Support | 323 (20.2%) | 1,278 (79.8%) |
| Security & Protection | 685 (56.7%) | 523 (43.3%) |
| Firefighting & Prevention | 448 (49.2%) | 463 (50.8%) |
| Law Enforcement | 237 (79.8%) | 60 (20.2%) |
| Food Preparation & Serving | 1,543 (44.4%) | 1,930 (55.6%) |
| Cleaning & Maintenance | 995 (50.7%) | 968 (49.3%) |
| Personal Care & Service | 923 (41.3%) | 1,313 (58.7%) |
| Total (Category) | 4,469 (42.6%) | 6,012 (57.4%) |
| Total (Overall) | 37,561 (52.2%) | 34,362 (47.8%) |
Sales and Office Occupations
The most common Sales and Office occupations in Lewisville are Office & Administration (8,811 | 12.2%), and Sales & Related (7,462 | 10.4%).

Sales and Office Occupations by Sex
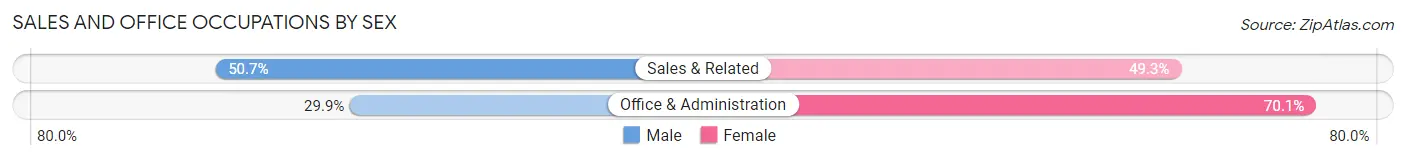
| Occupation | Male | Female |
| Sales & Related | 3,781 (50.7%) | 3,681 (49.3%) |
| Office & Administration | 2,635 (29.9%) | 6,176 (70.1%) |
| Total (Category) | 6,416 (39.4%) | 9,857 (60.6%) |
| Total (Overall) | 37,561 (52.2%) | 34,362 (47.8%) |
Natural Resources, Construction and Maintenance Occupations
The most common Natural Resources, Construction and Maintenance occupations in Lewisville are Construction & Extraction (3,229 | 4.5%), Installation, Maintenance & Repair (1,933 | 2.7%), and Farming, Fishing & Forestry (141 | 0.2%).

Natural Resources, Construction and Maintenance Occupations by Sex
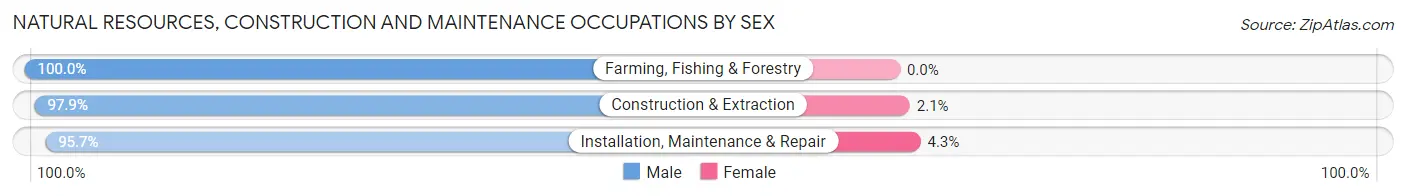
| Occupation | Male | Female |
| Farming, Fishing & Forestry | 141 (100.0%) | 0 (0.0%) |
| Construction & Extraction | 3,162 (97.9%) | 67 (2.1%) |
| Installation, Maintenance & Repair | 1,850 (95.7%) | 83 (4.3%) |
| Total (Category) | 5,153 (97.2%) | 150 (2.8%) |
| Total (Overall) | 37,561 (52.2%) | 34,362 (47.8%) |
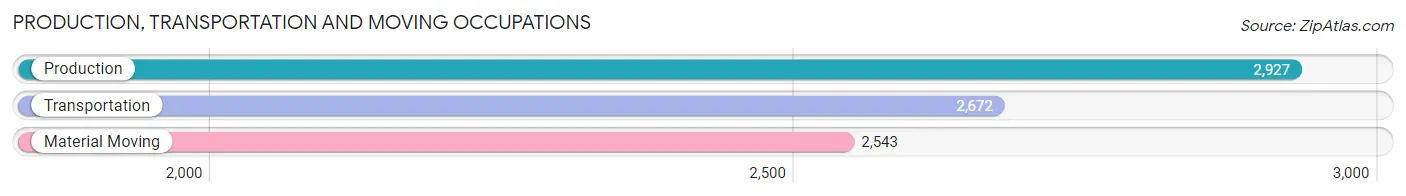
Production, Transportation and Moving Occupations
The most common Production, Transportation and Moving occupations in Lewisville are Production (2,927 | 4.1%), Transportation (2,672 | 3.7%), and Material Moving (2,543 | 3.5%).
Production, Transportation and Moving Occupations by Sex
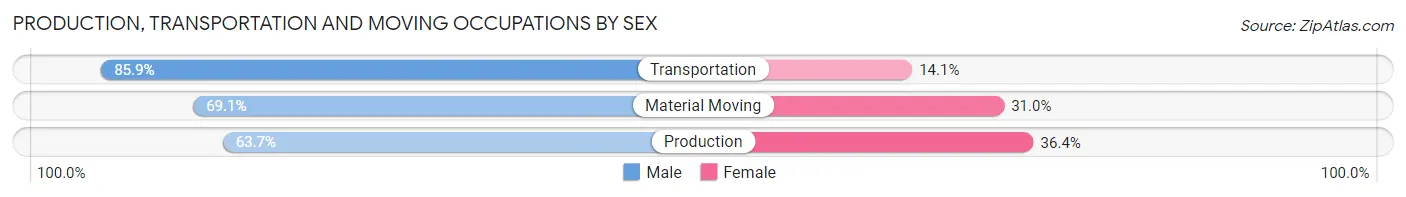
| Occupation | Male | Female |
| Production | 1,863 (63.6%) | 1,064 (36.3%) |
| Transportation | 2,296 (85.9%) | 376 (14.1%) |
| Material Moving | 1,756 (69.1%) | 787 (30.9%) |
| Total (Category) | 5,915 (72.7%) | 2,227 (27.4%) |
| Total (Overall) | 37,561 (52.2%) | 34,362 (47.8%) |
Employment Industries by Sex in Lewisville
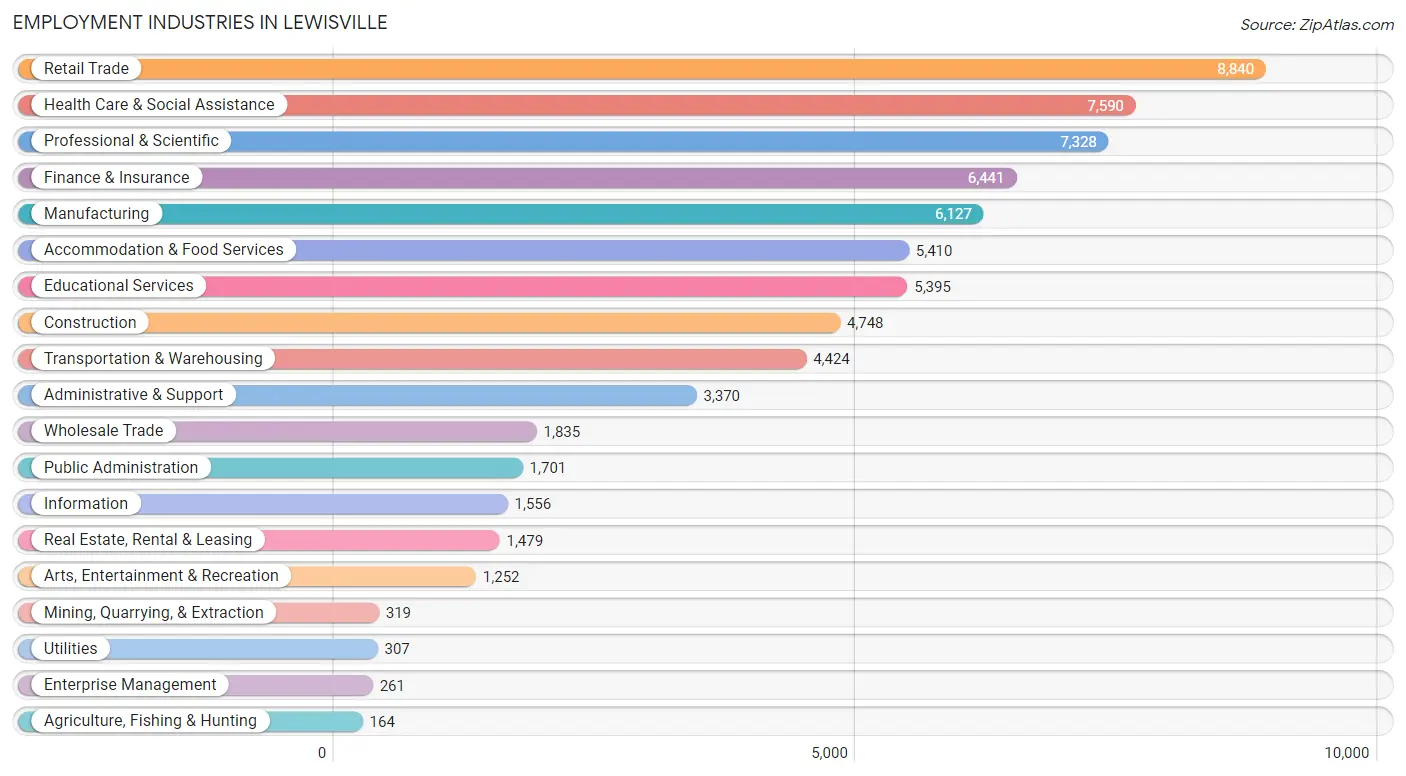
Employment Industries in Lewisville
The major employment industries in Lewisville include Retail Trade (8,840 | 12.3%), Health Care & Social Assistance (7,590 | 10.5%), Professional & Scientific (7,328 | 10.2%), Finance & Insurance (6,441 | 9.0%), and Manufacturing (6,127 | 8.5%).
Employment Industries by Sex in Lewisville
The Lewisville industries that see more men than women are Agriculture, Fishing & Hunting (100.0%), Construction (90.1%), and Arts, Entertainment & Recreation (74.0%), whereas the industries that tend to have a higher number of women are Health Care & Social Assistance (78.0%), Educational Services (71.8%), and Enterprise Management (67.4%).
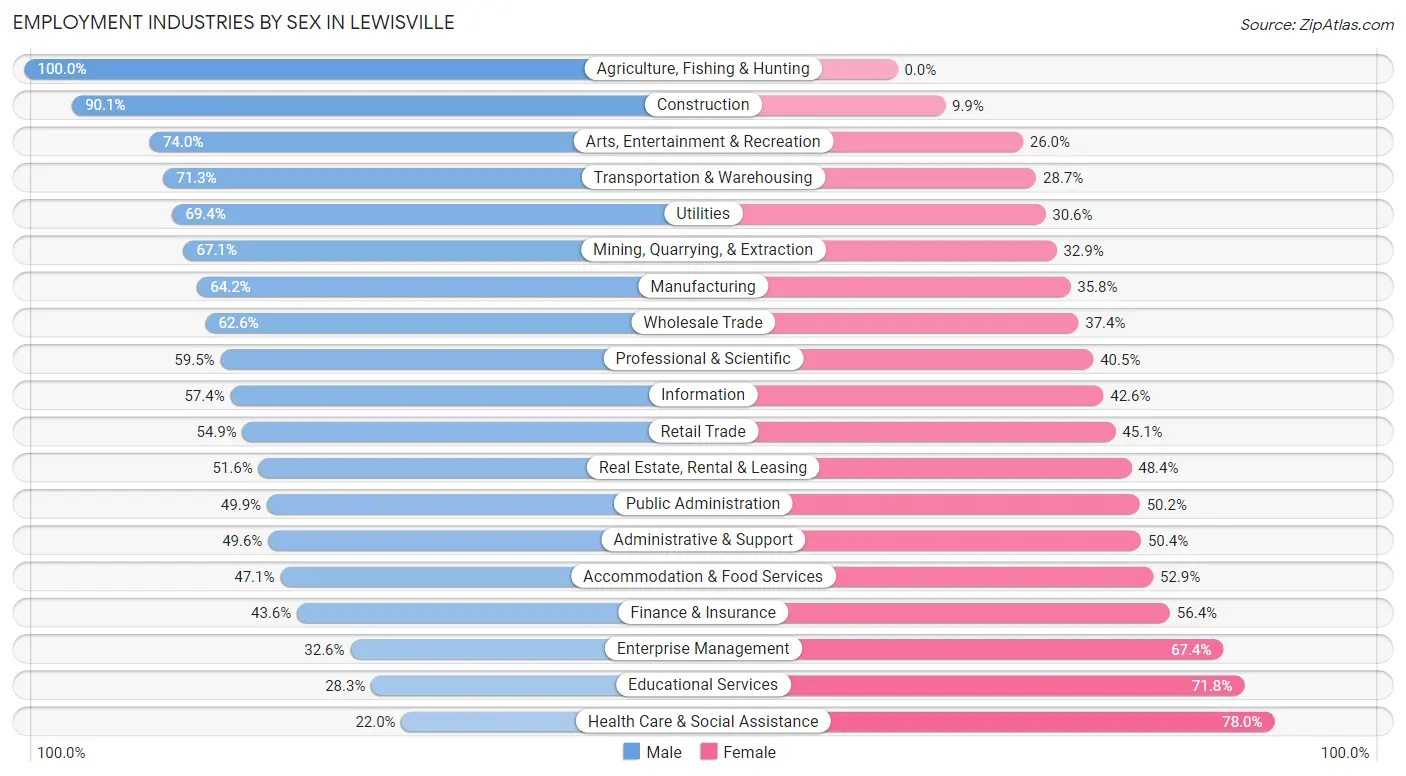
| Industry | Male | Female |
| Agriculture, Fishing & Hunting | 164 (100.0%) | 0 (0.0%) |
| Mining, Quarrying, & Extraction | 214 (67.1%) | 105 (32.9%) |
| Construction | 4,280 (90.1%) | 468 (9.9%) |
| Manufacturing | 3,935 (64.2%) | 2,192 (35.8%) |
| Wholesale Trade | 1,148 (62.6%) | 687 (37.4%) |
| Retail Trade | 4,851 (54.9%) | 3,989 (45.1%) |
| Transportation & Warehousing | 3,154 (71.3%) | 1,270 (28.7%) |
| Utilities | 213 (69.4%) | 94 (30.6%) |
| Information | 893 (57.4%) | 663 (42.6%) |
| Finance & Insurance | 2,808 (43.6%) | 3,633 (56.4%) |
| Real Estate, Rental & Leasing | 763 (51.6%) | 716 (48.4%) |
| Professional & Scientific | 4,358 (59.5%) | 2,970 (40.5%) |
| Enterprise Management | 85 (32.6%) | 176 (67.4%) |
| Administrative & Support | 1,671 (49.6%) | 1,699 (50.4%) |
| Educational Services | 1,524 (28.2%) | 3,871 (71.8%) |
| Health Care & Social Assistance | 1,670 (22.0%) | 5,920 (78.0%) |
| Arts, Entertainment & Recreation | 927 (74.0%) | 325 (26.0%) |
| Accommodation & Food Services | 2,547 (47.1%) | 2,863 (52.9%) |
| Public Administration | 848 (49.8%) | 853 (50.1%) |
| Total | 37,561 (52.2%) | 34,362 (47.8%) |
Education in Lewisville
School Enrollment in Lewisville
The most common levels of schooling among the 30,676 students in Lewisville are elementary school (6,586 | 21.5%), high school (6,501 | 21.2%), and college / undergraduate (6,219 | 20.3%).
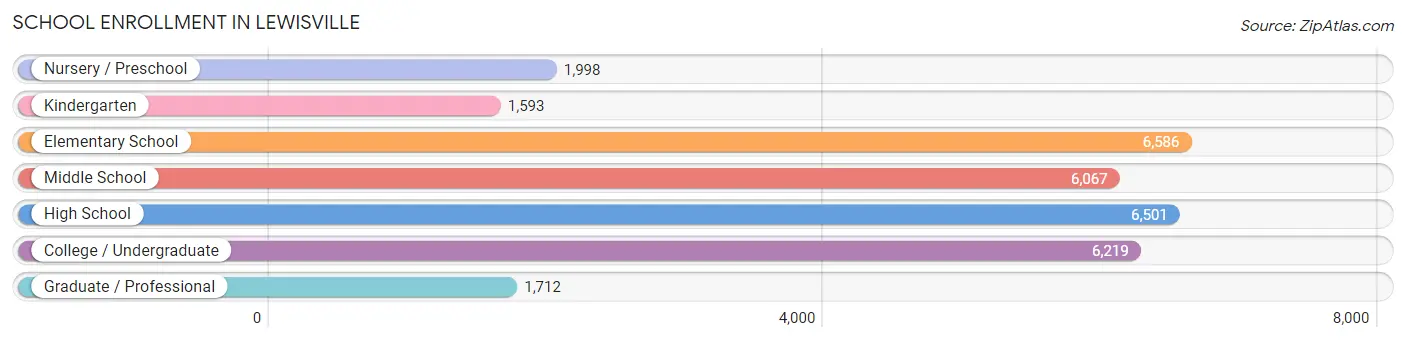
| School Level | # Students | % Students |
| Nursery / Preschool | 1,998 | 6.5% |
| Kindergarten | 1,593 | 5.2% |
| Elementary School | 6,586 | 21.5% |
| Middle School | 6,067 | 19.8% |
| High School | 6,501 | 21.2% |
| College / Undergraduate | 6,219 | 20.3% |
| Graduate / Professional | 1,712 | 5.6% |
| Total | 30,676 | 100.0% |
School Enrollment by Age by Funding Source in Lewisville
Out of a total of 30,676 students who are enrolled in schools in Lewisville, 4,049 (13.2%) attend a private institution, while the remaining 26,627 (86.8%) are enrolled in public schools. The age group of 3 to 4 year olds has the highest likelihood of being enrolled in private schools, with 785 (51.2% in the age bracket) enrolled. Conversely, the age group of 10 to 14 year olds has the lowest likelihood of being enrolled in a private school, with 7,204 (93.8% in the age bracket) attending a public institution.
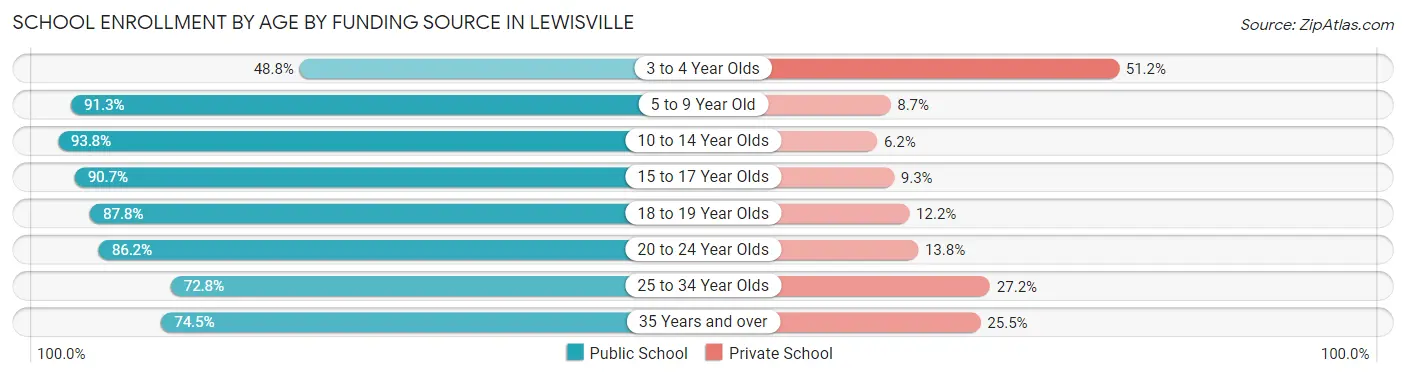
| Age Bracket | Public School | Private School |
| 3 to 4 Year Olds | 747 (48.8%) | 785 (51.2%) |
| 5 to 9 Year Old | 7,042 (91.3%) | 669 (8.7%) |
| 10 to 14 Year Olds | 7,204 (93.8%) | 476 (6.2%) |
| 15 to 17 Year Olds | 4,534 (90.7%) | 467 (9.3%) |
| 18 to 19 Year Olds | 1,971 (87.8%) | 274 (12.2%) |
| 20 to 24 Year Olds | 2,379 (86.2%) | 382 (13.8%) |
| 25 to 34 Year Olds | 1,306 (72.8%) | 489 (27.2%) |
| 35 Years and over | 1,454 (74.5%) | 497 (25.5%) |
| Total | 26,627 (86.8%) | 4,049 (13.2%) |
Educational Attainment by Field of Study in Lewisville
Business (9,859 | 27.4%), science & technology (3,490 | 9.7%), engineering (3,434 | 9.6%), education (2,768 | 7.7%), and social sciences (2,521 | 7.0%) are the most common fields of study among 35,949 individuals in Lewisville who have obtained a bachelor's degree or higher.
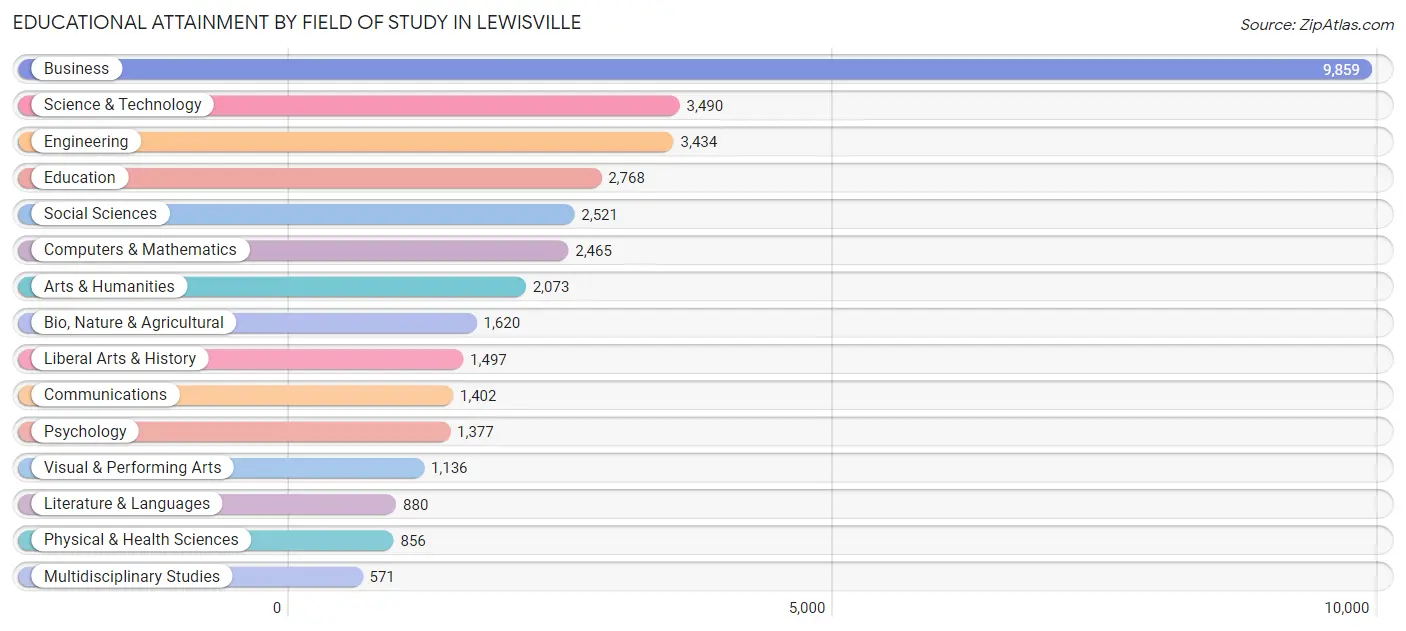
| Field of Study | # Graduates | % Graduates |
| Computers & Mathematics | 2,465 | 6.9% |
| Bio, Nature & Agricultural | 1,620 | 4.5% |
| Physical & Health Sciences | 856 | 2.4% |
| Psychology | 1,377 | 3.8% |
| Social Sciences | 2,521 | 7.0% |
| Engineering | 3,434 | 9.6% |
| Multidisciplinary Studies | 571 | 1.6% |
| Science & Technology | 3,490 | 9.7% |
| Business | 9,859 | 27.4% |
| Education | 2,768 | 7.7% |
| Literature & Languages | 880 | 2.5% |
| Liberal Arts & History | 1,497 | 4.2% |
| Visual & Performing Arts | 1,136 | 3.2% |
| Communications | 1,402 | 3.9% |
| Arts & Humanities | 2,073 | 5.8% |
| Total | 35,949 | 100.0% |
Transportation & Commute in Lewisville
Vehicle Availability by Sex in Lewisville
The most prevalent vehicle ownership categories in Lewisville are males with 2 vehicles (16,600, accounting for 45.3%) and females with 2 vehicles (14,001, making up 49.6%).
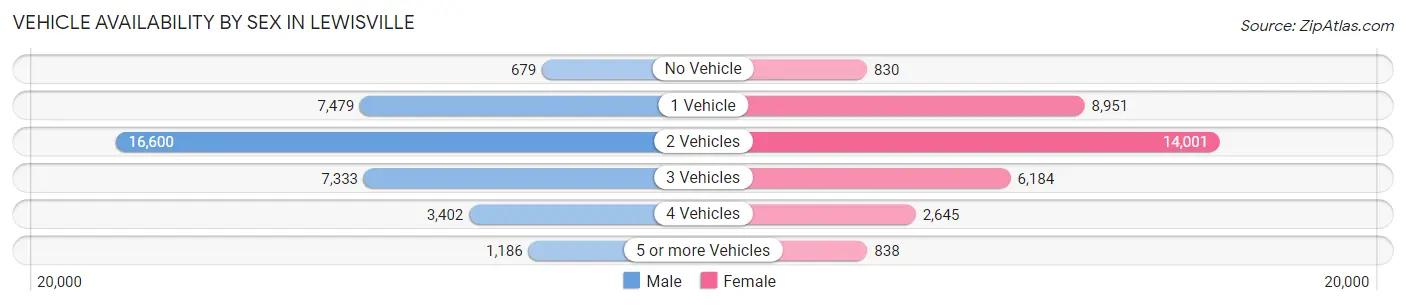
| Vehicles Available | Male | Female |
| No Vehicle | 679 (1.8%) | 830 (2.5%) |
| 1 Vehicle | 7,479 (20.4%) | 8,951 (26.8%) |
| 2 Vehicles | 16,600 (45.3%) | 14,001 (41.9%) |
| 3 Vehicles | 7,333 (20.0%) | 6,184 (18.5%) |
| 4 Vehicles | 3,402 (9.3%) | 2,645 (7.9%) |
| 5 or more Vehicles | 1,186 (3.2%) | 838 (2.5%) |
| Total | 36,679 (100.0%) | 33,449 (100.0%) |
Commute Time in Lewisville
The most frequently occuring commute durations in Lewisville are 30 to 34 minutes (10,368 commuters, 17.2%), 15 to 19 minutes (9,830 commuters, 16.3%), and 20 to 24 minutes (9,696 commuters, 16.0%).
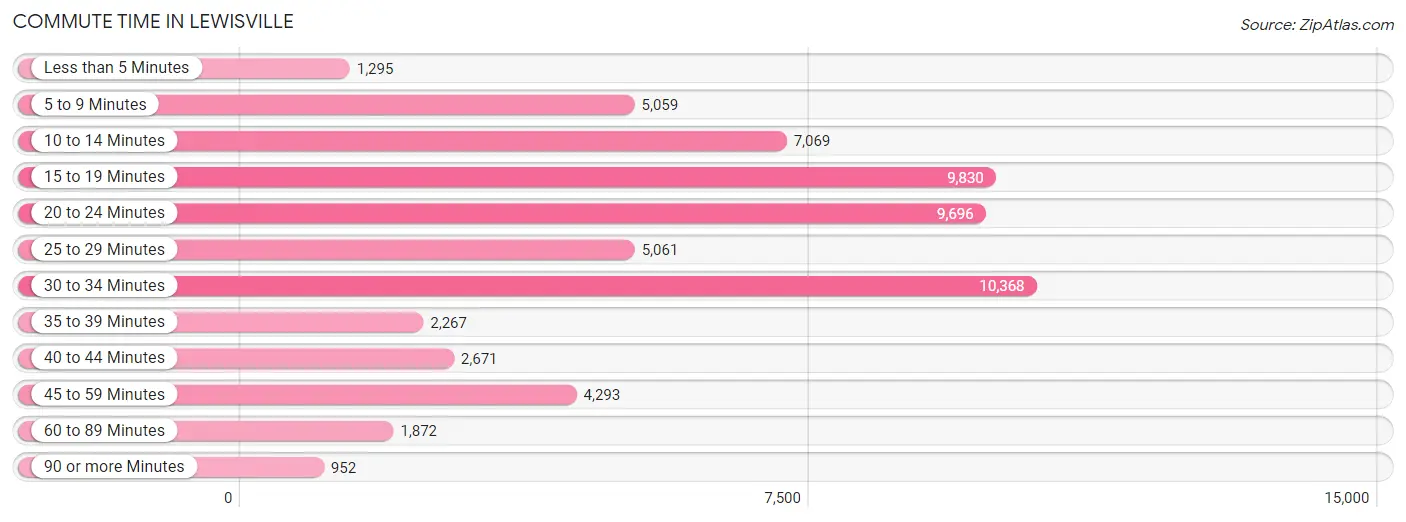
| Commute Time | # Commuters | % Commuters |
| Less than 5 Minutes | 1,295 | 2.1% |
| 5 to 9 Minutes | 5,059 | 8.4% |
| 10 to 14 Minutes | 7,069 | 11.7% |
| 15 to 19 Minutes | 9,830 | 16.3% |
| 20 to 24 Minutes | 9,696 | 16.0% |
| 25 to 29 Minutes | 5,061 | 8.4% |
| 30 to 34 Minutes | 10,368 | 17.2% |
| 35 to 39 Minutes | 2,267 | 3.7% |
| 40 to 44 Minutes | 2,671 | 4.4% |
| 45 to 59 Minutes | 4,293 | 7.1% |
| 60 to 89 Minutes | 1,872 | 3.1% |
| 90 or more Minutes | 952 | 1.6% |
Commute Time by Sex in Lewisville
The most common commute times in Lewisville are 30 to 34 minutes (5,904 commuters, 18.8%) for males and 15 to 19 minutes (5,472 commuters, 18.9%) for females.
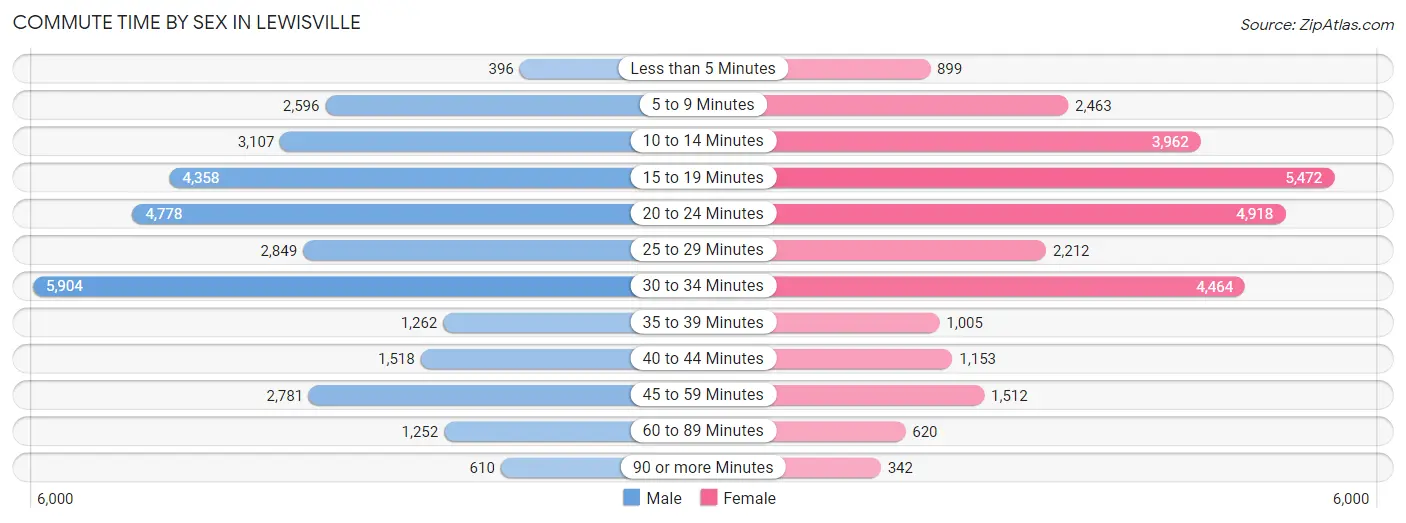
| Commute Time | Male | Female |
| Less than 5 Minutes | 396 (1.3%) | 899 (3.1%) |
| 5 to 9 Minutes | 2,596 (8.3%) | 2,463 (8.5%) |
| 10 to 14 Minutes | 3,107 (9.9%) | 3,962 (13.7%) |
| 15 to 19 Minutes | 4,358 (13.9%) | 5,472 (18.9%) |
| 20 to 24 Minutes | 4,778 (15.2%) | 4,918 (17.0%) |
| 25 to 29 Minutes | 2,849 (9.1%) | 2,212 (7.6%) |
| 30 to 34 Minutes | 5,904 (18.8%) | 4,464 (15.4%) |
| 35 to 39 Minutes | 1,262 (4.0%) | 1,005 (3.5%) |
| 40 to 44 Minutes | 1,518 (4.8%) | 1,153 (4.0%) |
| 45 to 59 Minutes | 2,781 (8.8%) | 1,512 (5.2%) |
| 60 to 89 Minutes | 1,252 (4.0%) | 620 (2.1%) |
| 90 or more Minutes | 610 (1.9%) | 342 (1.2%) |
Time of Departure to Work by Sex in Lewisville
The most frequent times of departure to work in Lewisville are 7:00 AM to 7:29 AM (4,369, 13.9%) for males and 7:00 AM to 7:29 AM (4,329, 14.9%) for females.
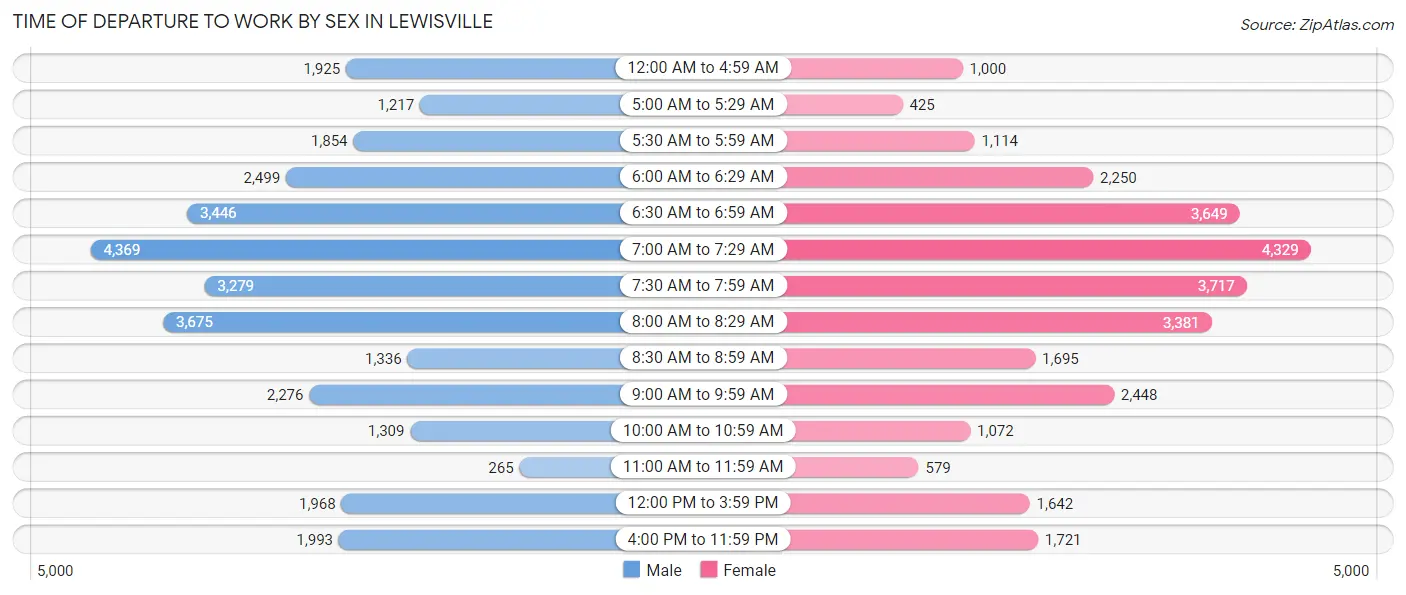
| Time of Departure | Male | Female |
| 12:00 AM to 4:59 AM | 1,925 (6.1%) | 1,000 (3.5%) |
| 5:00 AM to 5:29 AM | 1,217 (3.9%) | 425 (1.5%) |
| 5:30 AM to 5:59 AM | 1,854 (5.9%) | 1,114 (3.8%) |
| 6:00 AM to 6:29 AM | 2,499 (8.0%) | 2,250 (7.7%) |
| 6:30 AM to 6:59 AM | 3,446 (11.0%) | 3,649 (12.6%) |
| 7:00 AM to 7:29 AM | 4,369 (13.9%) | 4,329 (14.9%) |
| 7:30 AM to 7:59 AM | 3,279 (10.4%) | 3,717 (12.8%) |
| 8:00 AM to 8:29 AM | 3,675 (11.7%) | 3,381 (11.7%) |
| 8:30 AM to 8:59 AM | 1,336 (4.3%) | 1,695 (5.8%) |
| 9:00 AM to 9:59 AM | 2,276 (7.2%) | 2,448 (8.4%) |
| 10:00 AM to 10:59 AM | 1,309 (4.2%) | 1,072 (3.7%) |
| 11:00 AM to 11:59 AM | 265 (0.8%) | 579 (2.0%) |
| 12:00 PM to 3:59 PM | 1,968 (6.3%) | 1,642 (5.7%) |
| 4:00 PM to 11:59 PM | 1,993 (6.3%) | 1,721 (5.9%) |
| Total | 31,411 (100.0%) | 29,022 (100.0%) |
Housing Occupancy in Lewisville
Occupancy by Ownership in Lewisville
Of the total 48,725 dwellings in Lewisville, owner-occupied units account for 22,040 (45.2%), while renter-occupied units make up 26,685 (54.8%).
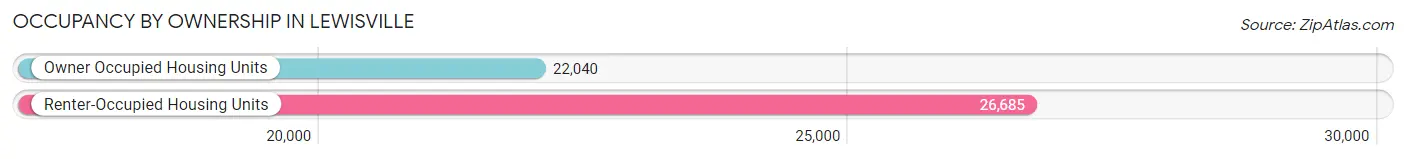
| Occupancy | # Housing Units | % Housing Units |
| Owner Occupied Housing Units | 22,040 | 45.2% |
| Renter-Occupied Housing Units | 26,685 | 54.8% |
| Total Occupied Housing Units | 48,725 | 100.0% |
Occupancy by Household Size in Lewisville
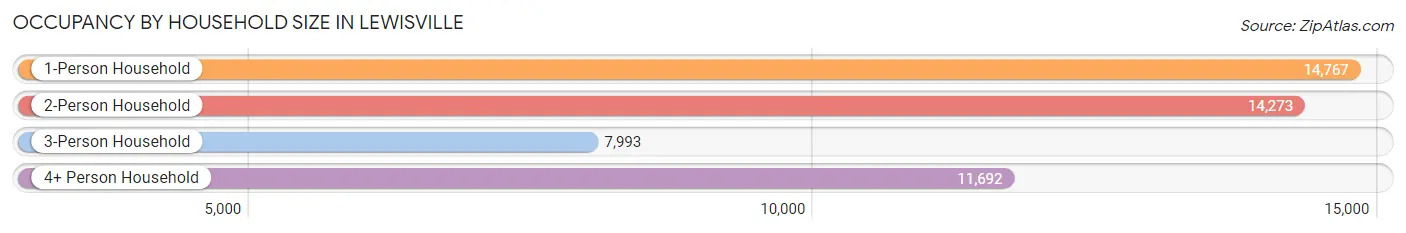
| Household Size | # Housing Units | % Housing Units |
| 1-Person Household | 14,767 | 30.3% |
| 2-Person Household | 14,273 | 29.3% |
| 3-Person Household | 7,993 | 16.4% |
| 4+ Person Household | 11,692 | 24.0% |
| Total Housing Units | 48,725 | 100.0% |
Occupancy by Ownership by Household Size in Lewisville
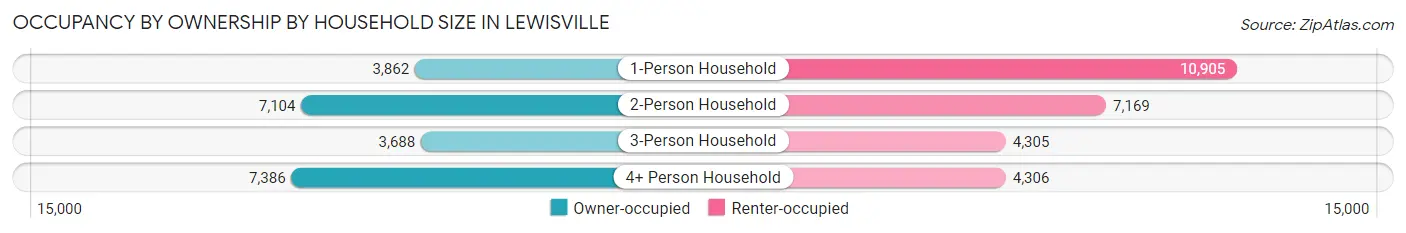
| Household Size | Owner-occupied | Renter-occupied |
| 1-Person Household | 3,862 (26.2%) | 10,905 (73.9%) |
| 2-Person Household | 7,104 (49.8%) | 7,169 (50.2%) |
| 3-Person Household | 3,688 (46.1%) | 4,305 (53.9%) |
| 4+ Person Household | 7,386 (63.2%) | 4,306 (36.8%) |
| Total Housing Units | 22,040 (45.2%) | 26,685 (54.8%) |
Occupancy by Educational Attainment in Lewisville
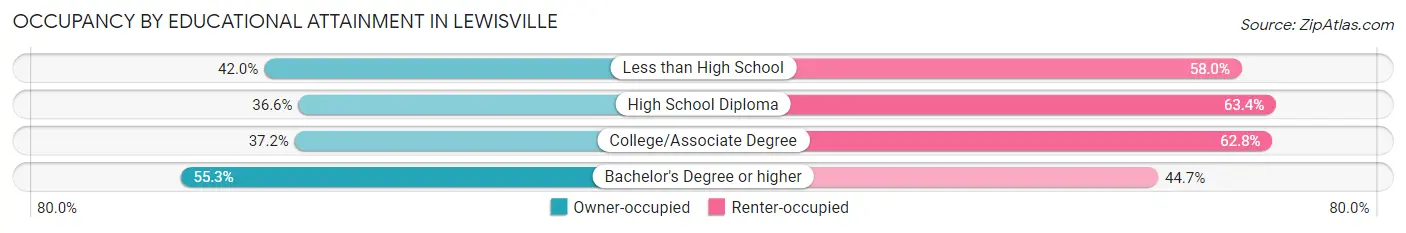
| Household Size | Owner-occupied | Renter-occupied |
| Less than High School | 1,702 (42.0%) | 2,349 (58.0%) |
| High School Diploma | 3,199 (36.6%) | 5,547 (63.4%) |
| College/Associate Degree | 5,585 (37.2%) | 9,446 (62.8%) |
| Bachelor's Degree or higher | 11,554 (55.3%) | 9,343 (44.7%) |
Occupancy by Age of Householder in Lewisville
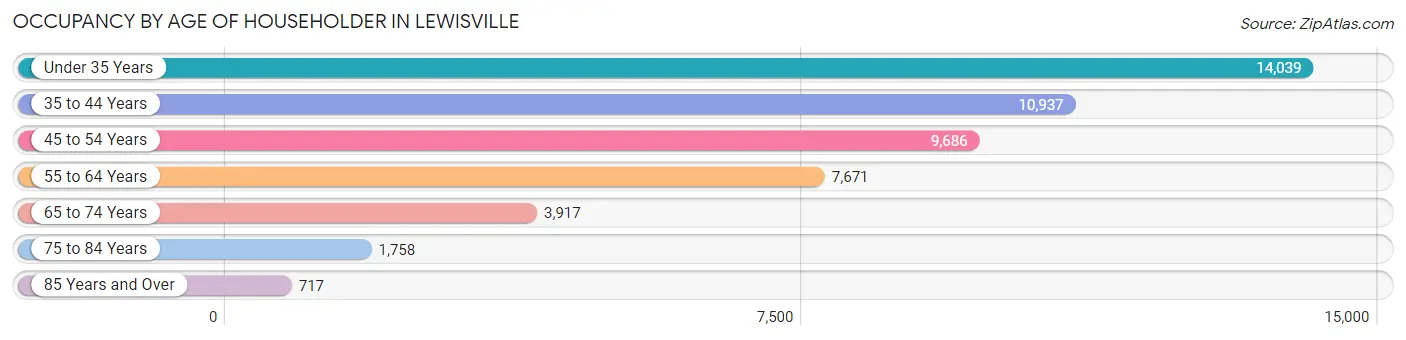
| Age Bracket | # Households | % Households |
| Under 35 Years | 14,039 | 28.8% |
| 35 to 44 Years | 10,937 | 22.5% |
| 45 to 54 Years | 9,686 | 19.9% |
| 55 to 64 Years | 7,671 | 15.7% |
| 65 to 74 Years | 3,917 | 8.0% |
| 75 to 84 Years | 1,758 | 3.6% |
| 85 Years and Over | 717 | 1.5% |
| Total | 48,725 | 100.0% |
Housing Finances in Lewisville
Median Income by Occupancy in Lewisville
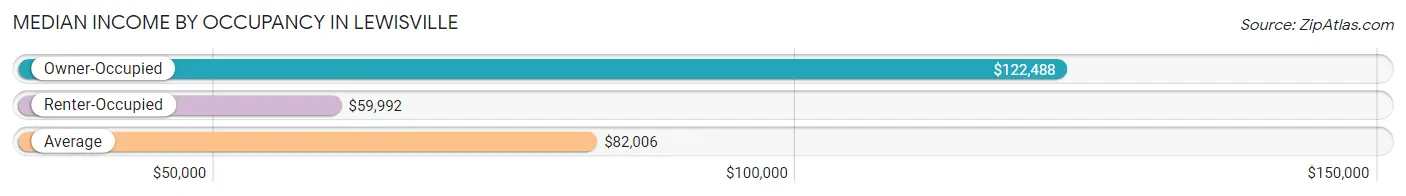
| Occupancy Type | # Households | Median Income |
| Owner-Occupied | 22,040 (45.2%) | $122,488 |
| Renter-Occupied | 26,685 (54.8%) | $59,992 |
| Average | 48,725 (100.0%) | $82,006 |
Occupancy by Householder Income Bracket in Lewisville
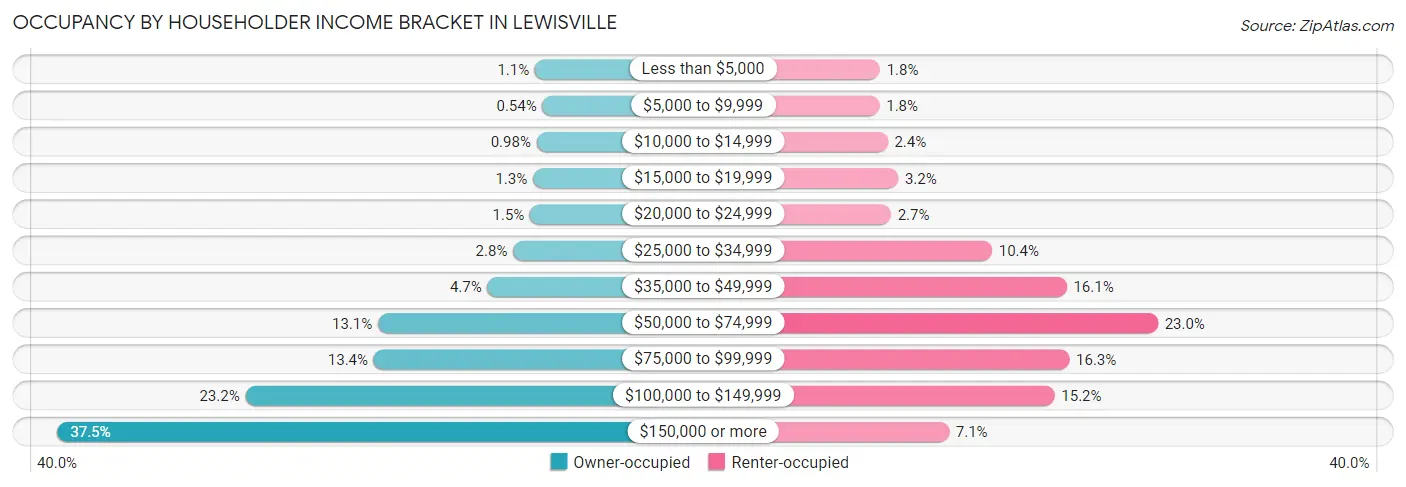
| Income Bracket | Owner-occupied | Renter-occupied |
| Less than $5,000 | 244 (1.1%) | 490 (1.8%) |
| $5,000 to $9,999 | 120 (0.5%) | 484 (1.8%) |
| $10,000 to $14,999 | 216 (1.0%) | 648 (2.4%) |
| $15,000 to $19,999 | 277 (1.3%) | 863 (3.2%) |
| $20,000 to $24,999 | 327 (1.5%) | 716 (2.7%) |
| $25,000 to $34,999 | 610 (2.8%) | 2,770 (10.4%) |
| $35,000 to $49,999 | 1,043 (4.7%) | 4,288 (16.1%) |
| $50,000 to $74,999 | 2,880 (13.1%) | 6,144 (23.0%) |
| $75,000 to $99,999 | 2,951 (13.4%) | 4,342 (16.3%) |
| $100,000 to $149,999 | 5,107 (23.2%) | 4,042 (15.1%) |
| $150,000 or more | 8,265 (37.5%) | 1,898 (7.1%) |
| Total | 22,040 (100.0%) | 26,685 (100.0%) |
Monthly Housing Cost Tiers in Lewisville
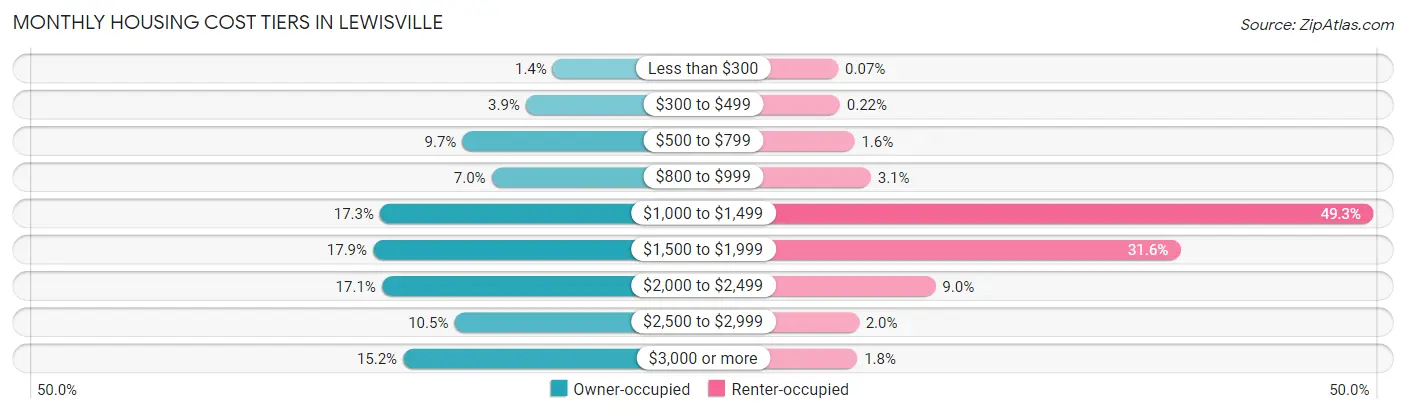
| Monthly Cost | Owner-occupied | Renter-occupied |
| Less than $300 | 306 (1.4%) | 19 (0.1%) |
| $300 to $499 | 854 (3.9%) | 59 (0.2%) |
| $500 to $799 | 2,143 (9.7%) | 419 (1.6%) |
| $800 to $999 | 1,548 (7.0%) | 820 (3.1%) |
| $1,000 to $1,499 | 3,813 (17.3%) | 13,150 (49.3%) |
| $1,500 to $1,999 | 3,953 (17.9%) | 8,419 (31.6%) |
| $2,000 to $2,499 | 3,775 (17.1%) | 2,406 (9.0%) |
| $2,500 to $2,999 | 2,304 (10.4%) | 523 (2.0%) |
| $3,000 or more | 3,344 (15.2%) | 486 (1.8%) |
| Total | 22,040 (100.0%) | 26,685 (100.0%) |
Physical Housing Characteristics in Lewisville
Housing Structures in Lewisville
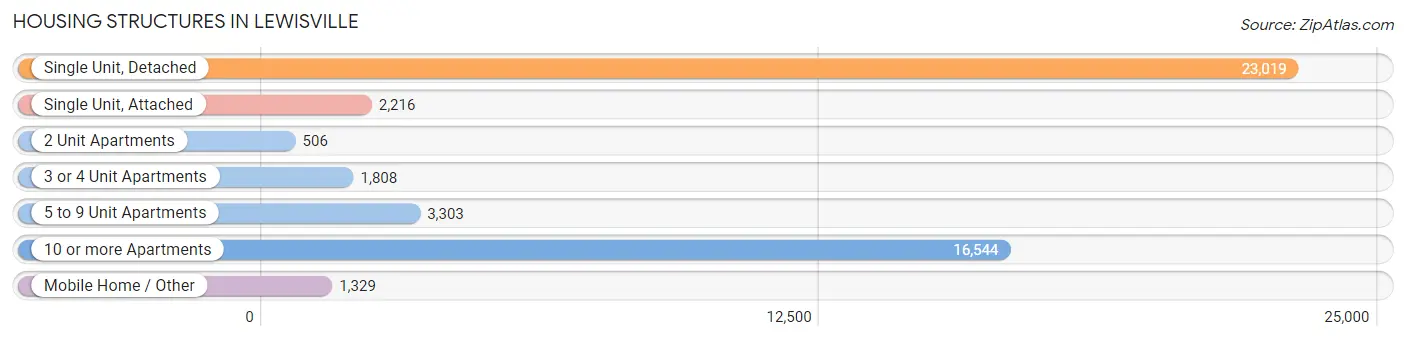
| Structure Type | # Housing Units | % Housing Units |
| Single Unit, Detached | 23,019 | 47.2% |
| Single Unit, Attached | 2,216 | 4.5% |
| 2 Unit Apartments | 506 | 1.0% |
| 3 or 4 Unit Apartments | 1,808 | 3.7% |
| 5 to 9 Unit Apartments | 3,303 | 6.8% |
| 10 or more Apartments | 16,544 | 34.0% |
| Mobile Home / Other | 1,329 | 2.7% |
| Total | 48,725 | 100.0% |
Housing Structures by Occupancy in Lewisville
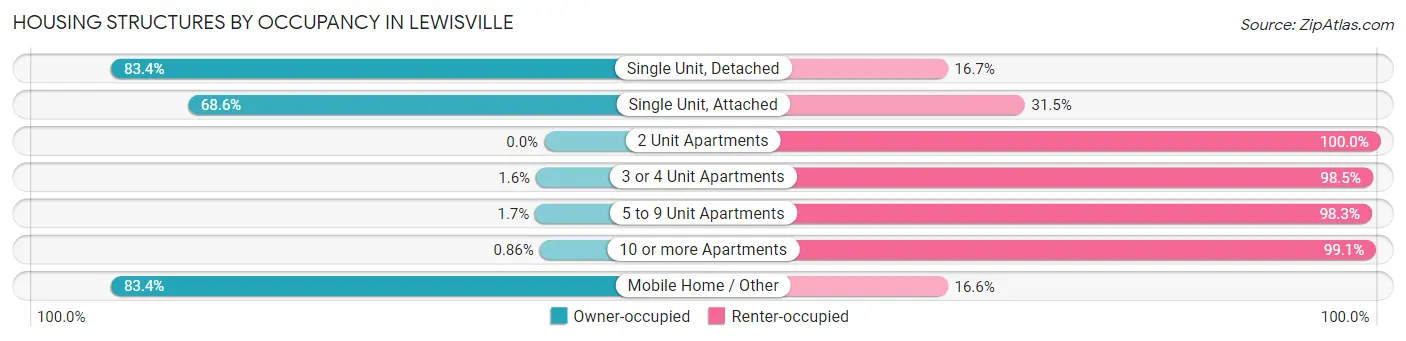
| Structure Type | Owner-occupied | Renter-occupied |
| Single Unit, Detached | 19,187 (83.4%) | 3,832 (16.7%) |
| Single Unit, Attached | 1,519 (68.5%) | 697 (31.5%) |
| 2 Unit Apartments | 0 (0.0%) | 506 (100.0%) |
| 3 or 4 Unit Apartments | 28 (1.5%) | 1,780 (98.5%) |
| 5 to 9 Unit Apartments | 56 (1.7%) | 3,247 (98.3%) |
| 10 or more Apartments | 142 (0.9%) | 16,402 (99.1%) |
| Mobile Home / Other | 1,108 (83.4%) | 221 (16.6%) |
| Total | 22,040 (45.2%) | 26,685 (54.8%) |
Housing Structures by Number of Rooms in Lewisville
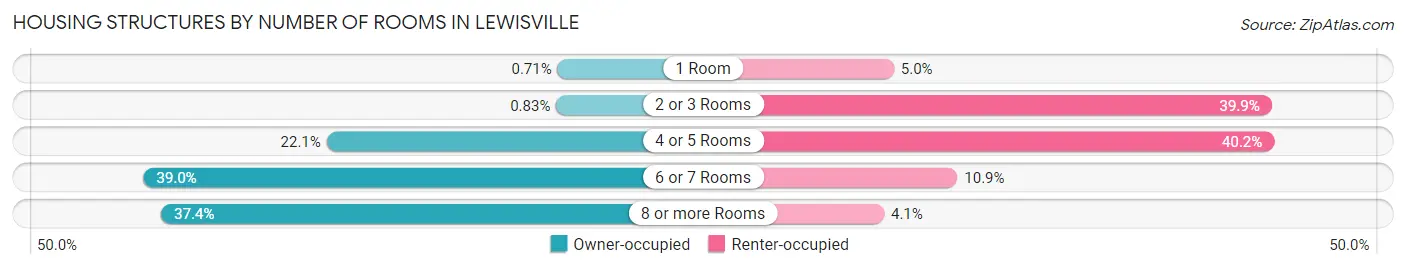
| Number of Rooms | Owner-occupied | Renter-occupied |
| 1 Room | 157 (0.7%) | 1,331 (5.0%) |
| 2 or 3 Rooms | 184 (0.8%) | 10,652 (39.9%) |
| 4 or 5 Rooms | 4,864 (22.1%) | 10,714 (40.2%) |
| 6 or 7 Rooms | 8,598 (39.0%) | 2,899 (10.9%) |
| 8 or more Rooms | 8,237 (37.4%) | 1,089 (4.1%) |
| Total | 22,040 (100.0%) | 26,685 (100.0%) |
Housing Structure by Heating Type in Lewisville
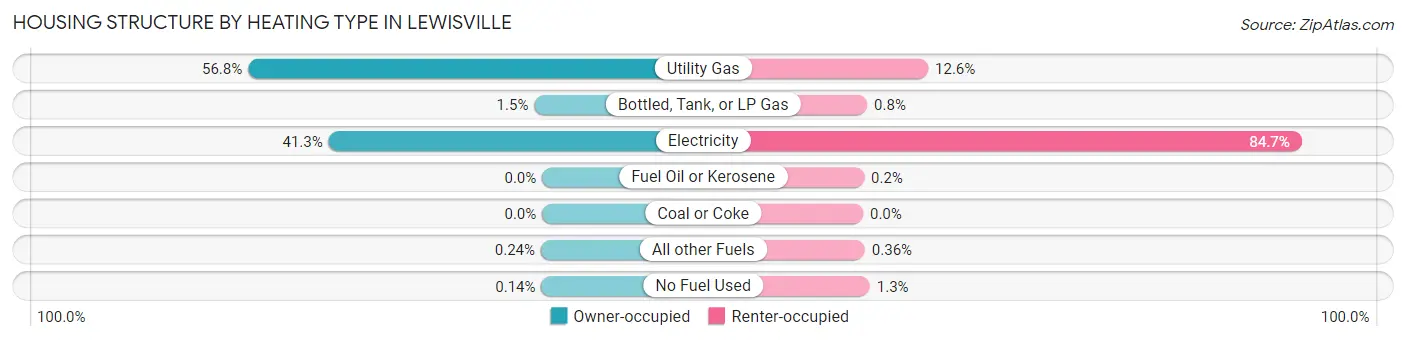
| Heating Type | Owner-occupied | Renter-occupied |
| Utility Gas | 12,524 (56.8%) | 3,354 (12.6%) |
| Bottled, Tank, or LP Gas | 336 (1.5%) | 214 (0.8%) |
| Electricity | 9,097 (41.3%) | 22,613 (84.7%) |
| Fuel Oil or Kerosene | 0 (0.0%) | 54 (0.2%) |
| Coal or Coke | 0 (0.0%) | 0 (0.0%) |
| All other Fuels | 53 (0.2%) | 97 (0.4%) |
| No Fuel Used | 30 (0.1%) | 353 (1.3%) |
| Total | 22,040 (100.0%) | 26,685 (100.0%) |
Household Vehicle Usage in Lewisville
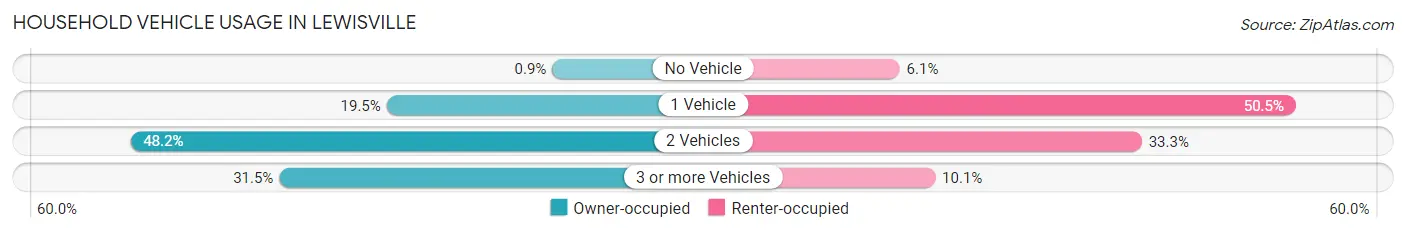
| Vehicles per Household | Owner-occupied | Renter-occupied |
| No Vehicle | 199 (0.9%) | 1,636 (6.1%) |
| 1 Vehicle | 4,286 (19.5%) | 13,476 (50.5%) |
| 2 Vehicles | 10,616 (48.2%) | 8,874 (33.3%) |
| 3 or more Vehicles | 6,939 (31.5%) | 2,699 (10.1%) |
| Total | 22,040 (100.0%) | 26,685 (100.0%) |
Real Estate & Mortgages in Lewisville
Real Estate and Mortgage Overview in Lewisville
| Characteristic | Without Mortgage | With Mortgage |
| Housing Units | 6,818 | 15,222 |
| Median Property Value | $302,300 | $340,900 |
| Median Household Income | $94,785 | $6,367 |
| Monthly Housing Costs | $847 | $3,310 |
| Real Estate Taxes | $4,163 | $261 |
Property Value by Mortgage Status in Lewisville
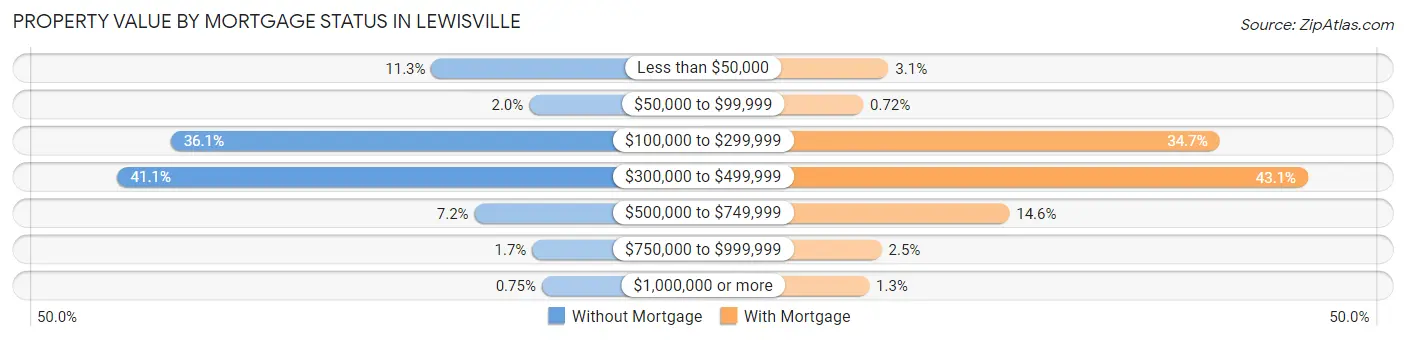
| Property Value | Without Mortgage | With Mortgage |
| Less than $50,000 | 768 (11.3%) | 476 (3.1%) |
| $50,000 to $99,999 | 133 (1.9%) | 110 (0.7%) |
| $100,000 to $299,999 | 2,460 (36.1%) | 5,276 (34.7%) |
| $300,000 to $499,999 | 2,805 (41.1%) | 6,557 (43.1%) |
| $500,000 to $749,999 | 488 (7.2%) | 2,229 (14.6%) |
| $750,000 to $999,999 | 113 (1.7%) | 377 (2.5%) |
| $1,000,000 or more | 51 (0.7%) | 197 (1.3%) |
| Total | 6,818 (100.0%) | 15,222 (100.0%) |
Household Income by Mortgage Status in Lewisville
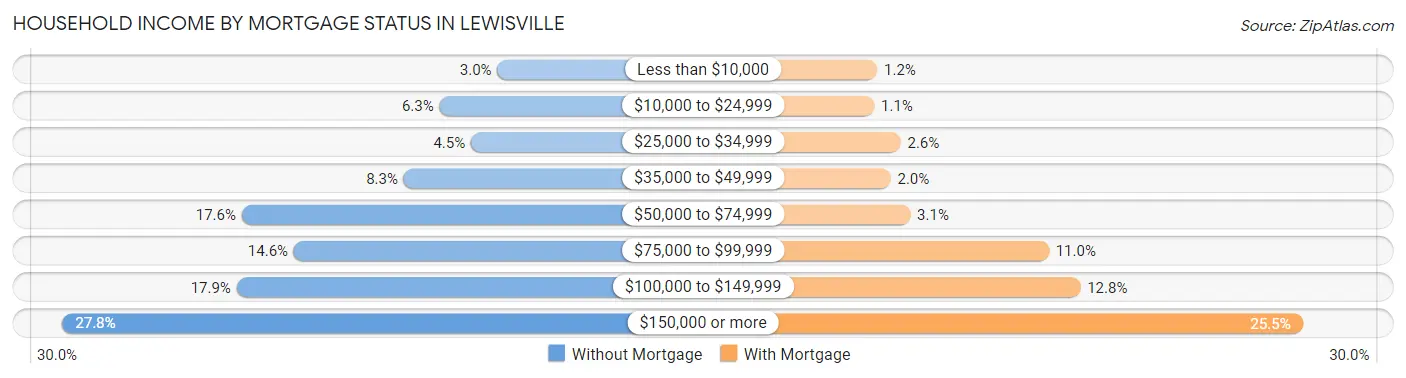
| Household Income | Without Mortgage | With Mortgage |
| Less than $10,000 | 203 (3.0%) | 187 (1.2%) |
| $10,000 to $24,999 | 429 (6.3%) | 161 (1.1%) |
| $25,000 to $34,999 | 306 (4.5%) | 391 (2.6%) |
| $35,000 to $49,999 | 568 (8.3%) | 304 (2.0%) |
| $50,000 to $74,999 | 1,199 (17.6%) | 475 (3.1%) |
| $75,000 to $99,999 | 996 (14.6%) | 1,681 (11.0%) |
| $100,000 to $149,999 | 1,219 (17.9%) | 1,955 (12.8%) |
| $150,000 or more | 1,898 (27.8%) | 3,888 (25.5%) |
| Total | 6,818 (100.0%) | 15,222 (100.0%) |
Property Value to Household Income Ratio in Lewisville
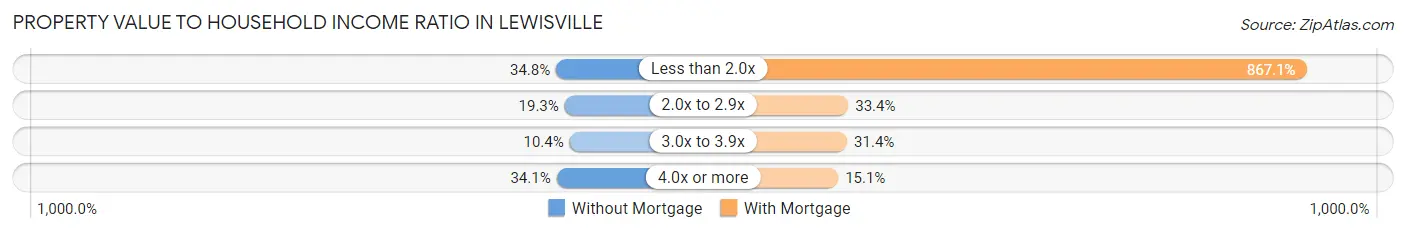
| Value-to-Income Ratio | Without Mortgage | With Mortgage |
| Less than 2.0x | 2,372 (34.8%) | 131,995 (867.1%) |
| 2.0x to 2.9x | 1,317 (19.3%) | 5,079 (33.4%) |
| 3.0x to 3.9x | 708 (10.4%) | 4,772 (31.4%) |
| 4.0x or more | 2,322 (34.1%) | 2,291 (15.0%) |
| Total | 6,818 (100.0%) | 15,222 (100.0%) |
Real Estate Taxes by Mortgage Status in Lewisville
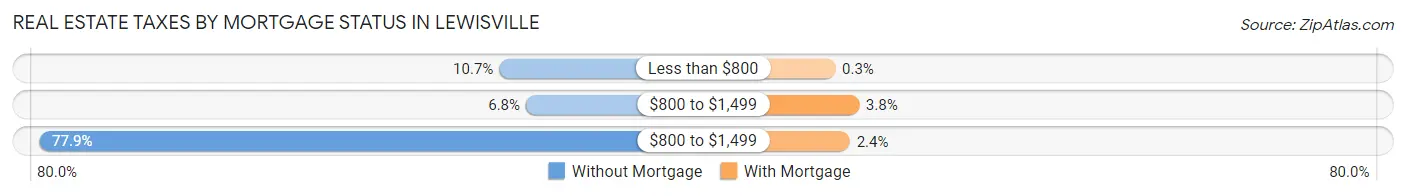
| Property Taxes | Without Mortgage | With Mortgage |
| Less than $800 | 727 (10.7%) | 46 (0.3%) |
| $800 to $1,499 | 461 (6.8%) | 576 (3.8%) |
| $800 to $1,499 | 5,309 (77.9%) | 372 (2.4%) |
| Total | 6,818 (100.0%) | 15,222 (100.0%) |
Health & Disability in Lewisville
Health Insurance Coverage by Age in Lewisville
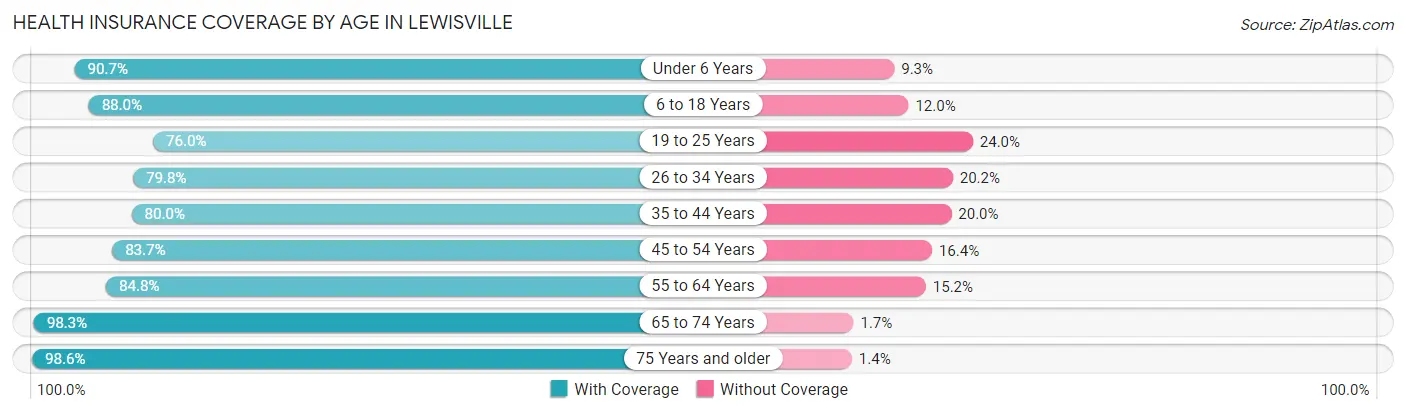
| Age Bracket | With Coverage | Without Coverage |
| Under 6 Years | 9,085 (90.7%) | 934 (9.3%) |
| 6 to 18 Years | 18,800 (88.0%) | 2,557 (12.0%) |
| 19 to 25 Years | 9,256 (76.0%) | 2,920 (24.0%) |
| 26 to 34 Years | 16,563 (79.8%) | 4,201 (20.2%) |
| 35 to 44 Years | 15,582 (80.0%) | 3,886 (20.0%) |
| 45 to 54 Years | 13,946 (83.7%) | 2,726 (16.4%) |
| 55 to 64 Years | 11,093 (84.8%) | 1,990 (15.2%) |
| 65 to 74 Years | 6,403 (98.3%) | 112 (1.7%) |
| 75 Years and older | 4,377 (98.6%) | 63 (1.4%) |
| Total | 105,105 (84.4%) | 19,389 (15.6%) |
Health Insurance Coverage by Citizenship Status in Lewisville
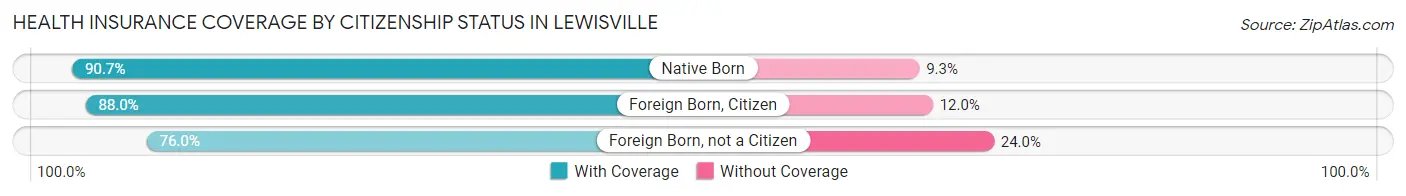
| Citizenship Status | With Coverage | Without Coverage |
| Native Born | 9,085 (90.7%) | 934 (9.3%) |
| Foreign Born, Citizen | 18,800 (88.0%) | 2,557 (12.0%) |
| Foreign Born, not a Citizen | 9,256 (76.0%) | 2,920 (24.0%) |
Health Insurance Coverage by Household Income in Lewisville
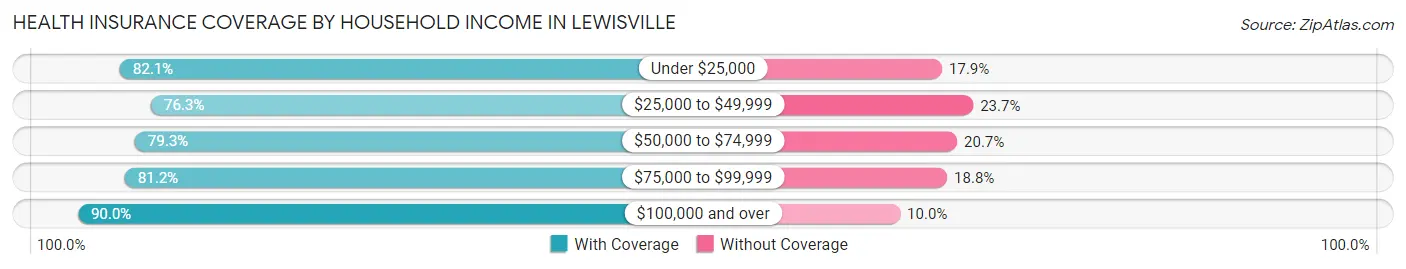
| Household Income | With Coverage | Without Coverage |
| Under $25,000 | 6,863 (82.1%) | 1,492 (17.9%) |
| $25,000 to $49,999 | 14,080 (76.3%) | 4,372 (23.7%) |
| $50,000 to $74,999 | 15,460 (79.3%) | 4,029 (20.7%) |
| $75,000 to $99,999 | 15,454 (81.2%) | 3,577 (18.8%) |
| $100,000 and over | 53,165 (90.0%) | 5,906 (10.0%) |
Public vs Private Health Insurance Coverage by Age in Lewisville
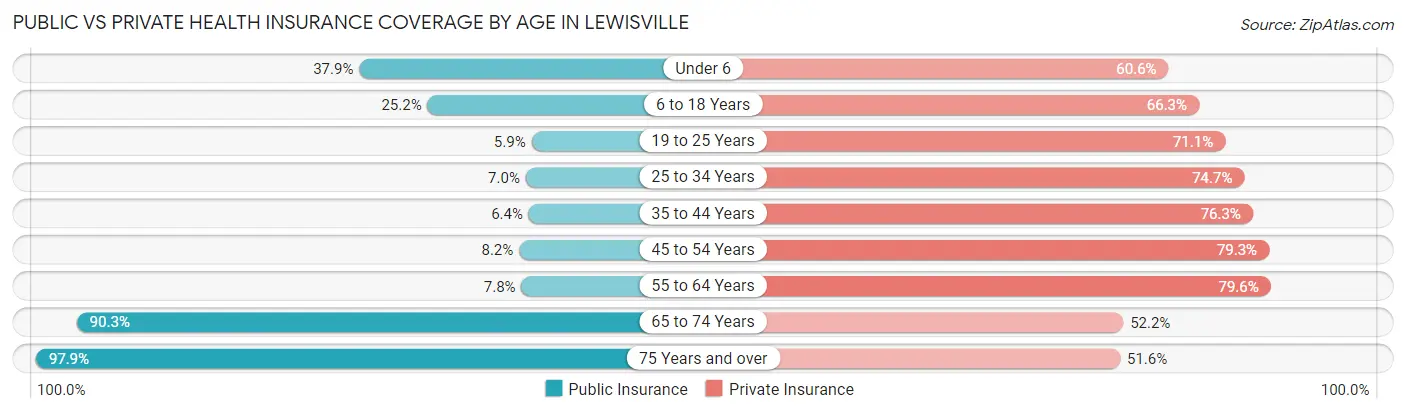
| Age Bracket | Public Insurance | Private Insurance |
| Under 6 | 3,796 (37.9%) | 6,074 (60.6%) |
| 6 to 18 Years | 5,387 (25.2%) | 14,154 (66.3%) |
| 19 to 25 Years | 720 (5.9%) | 8,659 (71.1%) |
| 25 to 34 Years | 1,449 (7.0%) | 15,508 (74.7%) |
| 35 to 44 Years | 1,248 (6.4%) | 14,847 (76.3%) |
| 45 to 54 Years | 1,368 (8.2%) | 13,217 (79.3%) |
| 55 to 64 Years | 1,018 (7.8%) | 10,411 (79.6%) |
| 65 to 74 Years | 5,885 (90.3%) | 3,403 (52.2%) |
| 75 Years and over | 4,347 (97.9%) | 2,293 (51.6%) |
| Total | 25,218 (20.3%) | 88,566 (71.1%) |
Disability Status by Sex by Age in Lewisville
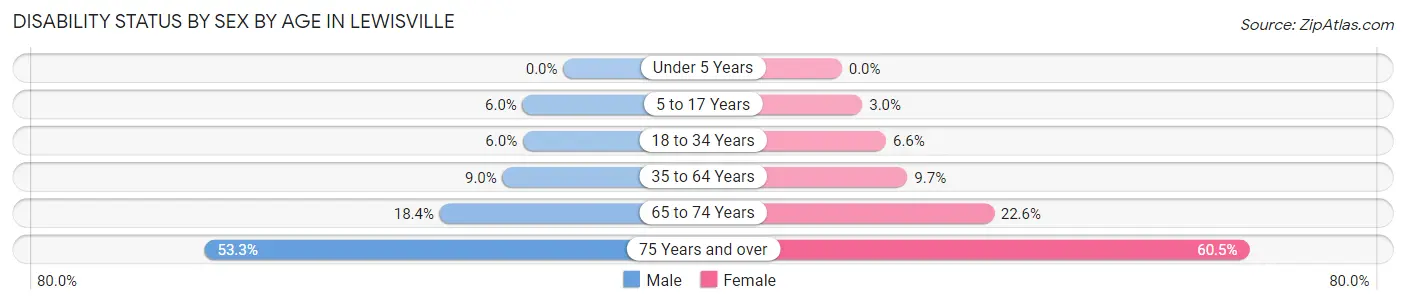
| Age Bracket | Male | Female |
| Under 5 Years | 0 (0.0%) | 0 (0.0%) |
| 5 to 17 Years | 608 (6.0%) | 338 (3.0%) |
| 18 to 34 Years | 1,024 (6.0%) | 1,140 (6.6%) |
| 35 to 64 Years | 2,182 (9.0%) | 2,438 (9.7%) |
| 65 to 74 Years | 510 (18.3%) | 843 (22.6%) |
| 75 Years and over | 872 (53.3%) | 1,696 (60.5%) |
Disability Class by Sex by Age in Lewisville
Disability Class: Hearing Difficulty
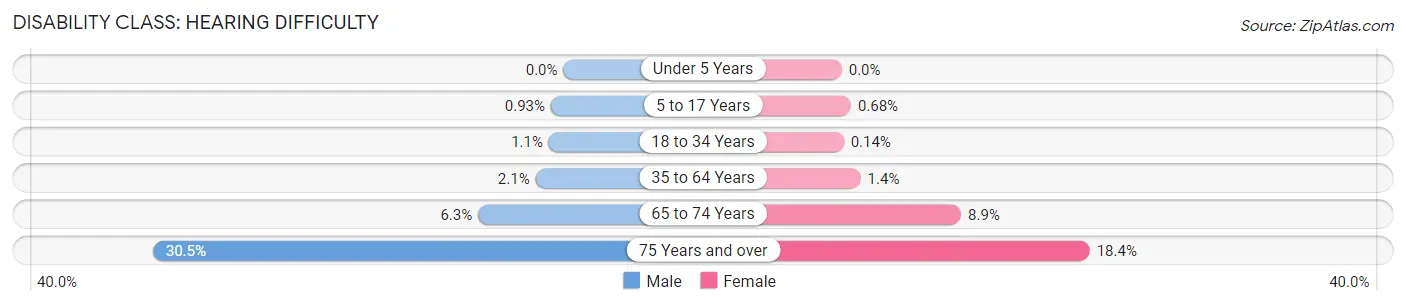
| Age Bracket | Male | Female |
| Under 5 Years | 0 (0.0%) | 0 (0.0%) |
| 5 to 17 Years | 94 (0.9%) | 76 (0.7%) |
| 18 to 34 Years | 184 (1.1%) | 24 (0.1%) |
| 35 to 64 Years | 500 (2.1%) | 351 (1.4%) |
| 65 to 74 Years | 176 (6.3%) | 331 (8.9%) |
| 75 Years and over | 499 (30.5%) | 516 (18.4%) |
Disability Class: Vision Difficulty
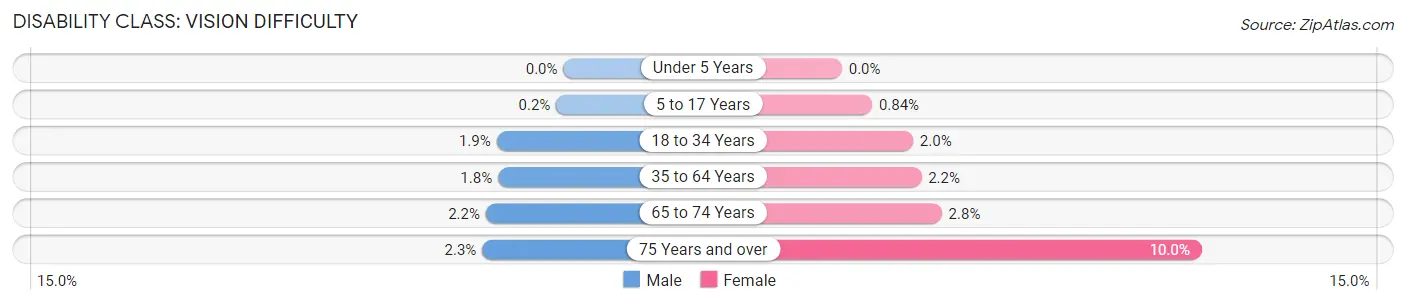
| Age Bracket | Male | Female |
| Under 5 Years | 0 (0.0%) | 0 (0.0%) |
| 5 to 17 Years | 20 (0.2%) | 93 (0.8%) |
| 18 to 34 Years | 319 (1.9%) | 343 (2.0%) |
| 35 to 64 Years | 440 (1.8%) | 553 (2.2%) |
| 65 to 74 Years | 60 (2.2%) | 104 (2.8%) |
| 75 Years and over | 37 (2.3%) | 281 (10.0%) |
Disability Class: Cognitive Difficulty
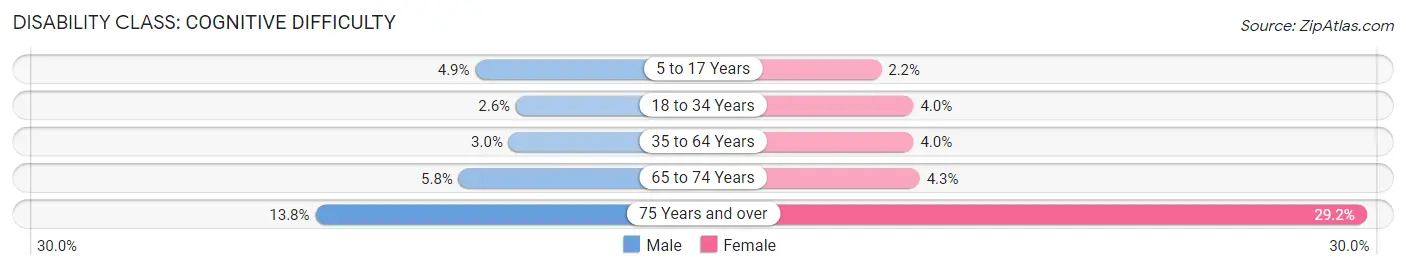
| Age Bracket | Male | Female |
| 5 to 17 Years | 494 (4.9%) | 245 (2.2%) |
| 18 to 34 Years | 451 (2.6%) | 693 (4.0%) |
| 35 to 64 Years | 735 (3.0%) | 998 (4.0%) |
| 65 to 74 Years | 162 (5.8%) | 162 (4.3%) |
| 75 Years and over | 226 (13.8%) | 819 (29.2%) |
Disability Class: Ambulatory Difficulty
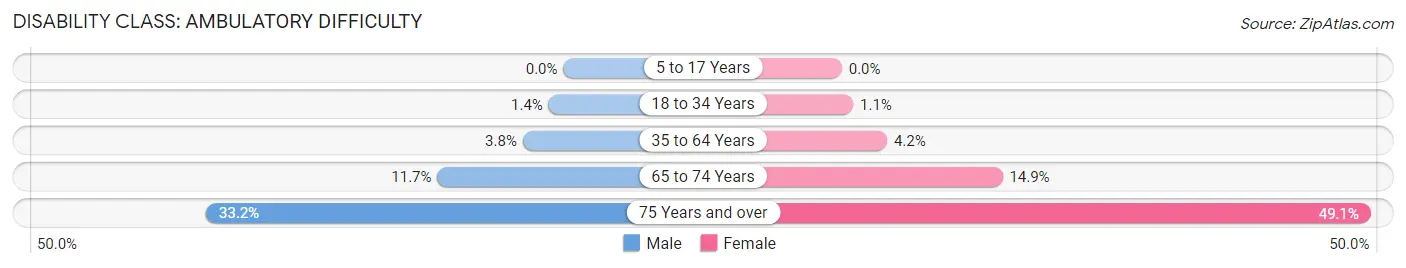
| Age Bracket | Male | Female |
| 5 to 17 Years | 0 (0.0%) | 0 (0.0%) |
| 18 to 34 Years | 232 (1.4%) | 182 (1.1%) |
| 35 to 64 Years | 912 (3.8%) | 1,048 (4.2%) |
| 65 to 74 Years | 325 (11.7%) | 557 (14.9%) |
| 75 Years and over | 543 (33.2%) | 1,376 (49.1%) |
Disability Class: Self-Care Difficulty
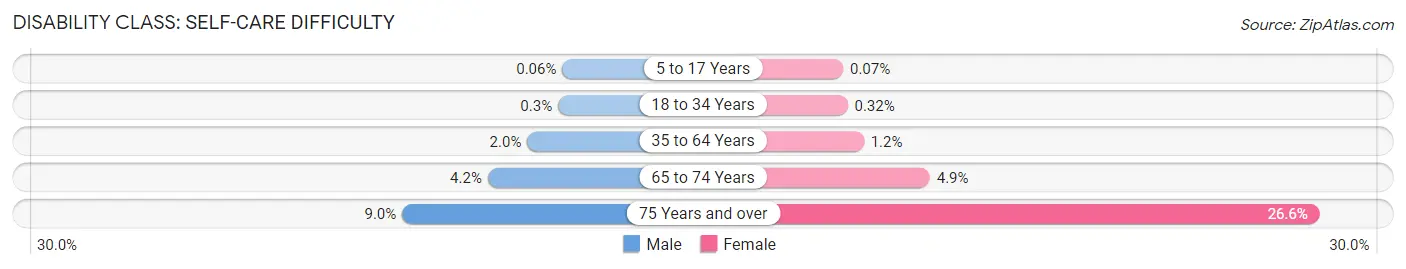
| Age Bracket | Male | Female |
| 5 to 17 Years | 6 (0.1%) | 8 (0.1%) |
| 18 to 34 Years | 52 (0.3%) | 55 (0.3%) |
| 35 to 64 Years | 487 (2.0%) | 305 (1.2%) |
| 65 to 74 Years | 117 (4.2%) | 183 (4.9%) |
| 75 Years and over | 147 (9.0%) | 746 (26.6%) |
Technology Access in Lewisville
Computing Device Access in Lewisville
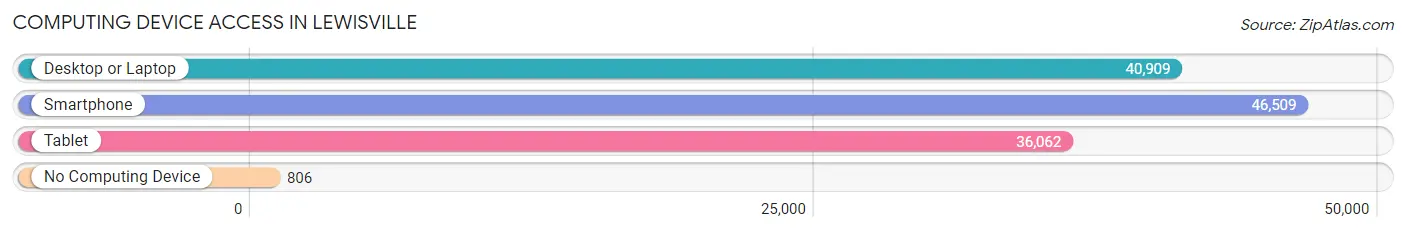
| Device Type | # Households | % Households |
| Desktop or Laptop | 40,909 | 84.0% |
| Smartphone | 46,509 | 95.5% |
| Tablet | 36,062 | 74.0% |
| No Computing Device | 806 | 1.7% |
| Total | 48,725 | 100.0% |
Internet Access in Lewisville
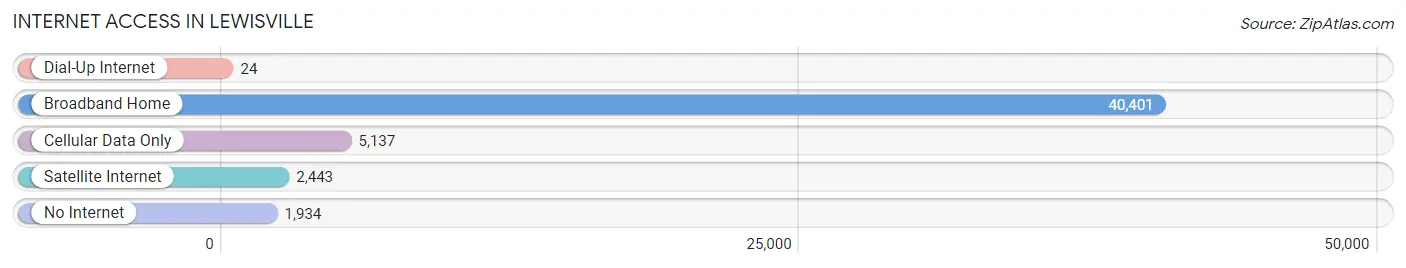
| Internet Type | # Households | % Households |
| Dial-Up Internet | 24 | 0.1% |
| Broadband Home | 40,401 | 82.9% |
| Cellular Data Only | 5,137 | 10.5% |
| Satellite Internet | 2,443 | 5.0% |
| No Internet | 1,934 | 4.0% |
| Total | 48,725 | 100.0% |
Lewisville Summary
Lewisville, Texas is a city located in Denton County, Texas, United States. It is a suburb of Dallas and Fort Worth and is part of the Dallas-Fort Worth-Arlington metropolitan area. The city had an estimated population of 103,072 in 2019, making it the twenty-fourth most populous city in Texas.
History
The area that is now Lewisville was first settled in the 1840s by settlers from Kentucky and Tennessee. The town was originally called Holford's Prairie, after one of the first settlers, William Lewis Holford. The town was renamed Lewisville in 1881 after Holford's son, Lewis. The town was incorporated in 1925 and has grown steadily since then.
Geography
Lewisville is located in Denton County, Texas, about 25 miles northwest of Dallas and 25 miles northeast of Fort Worth. The city covers an area of approximately 37 square miles and is situated on the shores of Lake Lewisville, a large reservoir on the Elm Fork of the Trinity River. The city is bordered by the cities of Flower Mound to the north, Highland Village to the east, Coppell to the south, and Carrollton to the west.
Economy
Lewisville is a major economic center in the Dallas-Fort Worth area. The city is home to several large companies, including the headquarters of the Dr Pepper Snapple Group, Frito-Lay, and JCPenney. The city is also home to several large shopping centers, including Vista Ridge Mall, Music City Mall, and Vista Ridge Marketplace.
Demographics
As of the 2019 census, the population of Lewisville was 103,072. The racial makeup of the city was 73.2% White, 11.3% African American, 0.7% Native American, 5.2% Asian, 0.1% Pacific Islander, 6.2% from other races, and 3.3% from two or more races. Hispanic or Latino of any race were 18.2% of the population.
The median household income in Lewisville was $63,945 in 2019, and the median family income was $71,945. The per capita income was $30,945. The poverty rate was 8.3%.
Lewisville is a diverse city with a variety of cultures and backgrounds. The city is home to a large number of immigrants from Mexico, India, and other countries. The city is also home to a large number of military veterans.
Common Questions
What is Per Capita Income in Lewisville?
Per Capita income in Lewisville is $42,275.
What is the Median Family Income in Lewisville?
Median Family Income in Lewisville is $98,501.
What is the Median Household income in Lewisville?
Median Household Income in Lewisville is $82,006.
What is Income or Wage Gap in Lewisville?
Income or Wage Gap in Lewisville is 23.9%.
Women in Lewisville earn 76.1 cents for every dollar earned by a man.
What is Family Income Deficit in Lewisville?
Family Income Deficit in Lewisville is $10,139.
Families that are below poverty line in Lewisville earn $10,139 less on average than the poverty threshold level.
What is Inequality or Gini Index in Lewisville?
Inequality or Gini Index in Lewisville is 0.41.
What is the Total Population of Lewisville?
Total Population of Lewisville is 125,028.
What is the Total Male Population of Lewisville?
Total Male Population of Lewisville is 60,323.
What is the Total Female Population of Lewisville?
Total Female Population of Lewisville is 64,705.
What is the Ratio of Males per 100 Females in Lewisville?
There are 93.23 Males per 100 Females in Lewisville.
What is the Ratio of Females per 100 Males in Lewisville?
There are 107.26 Females per 100 Males in Lewisville.
What is the Median Population Age in Lewisville?
Median Population Age in Lewisville is 34.2 Years.
What is the Average Family Size in Lewisville
Average Family Size in Lewisville is 3.3 People.
What is the Average Household Size in Lewisville
Average Household Size in Lewisville is 2.6 People.
How Large is the Labor Force in Lewisville?
There are 74,886 People in the Labor Forcein in Lewisville.
What is the Percentage of People in the Labor Force in Lewisville?
75.9% of People are in the Labor Force in Lewisville.
What is the Unemployment Rate in Lewisville?
Unemployment Rate in Lewisville is 3.8%.