Huron, SD Map & Demographics
Huron Map
Huron Overview
$29,576
PER CAPITA INCOME
$67,979
AVG FAMILY INCOME
$57,702
AVG HOUSEHOLD INCOME
41.9%
WAGE / INCOME GAP [ % ]
58.1¢/ $1
WAGE / INCOME GAP [ $ ]
0.44
INEQUALITY / GINI INDEX
14,179
TOTAL POPULATION
6,850
MALE POPULATION
7,329
FEMALE POPULATION
93.46
MALES / 100 FEMALES
106.99
FEMALES / 100 MALES
34.8
MEDIAN AGE
3.2
AVG FAMILY SIZE
2.5
AVG HOUSEHOLD SIZE
7,021
LABOR FORCE [ PEOPLE ]
67.1%
PERCENT IN LABOR FORCE
2.7%
UNEMPLOYMENT RATE
Huron Zip Codes
Huron Area Codes
Income in Huron
Income Overview in Huron
Per Capita Income in Huron is $29,576, while median incomes of families and households are $67,979 and $57,702 respectively.
| Characteristic | Number | Measure |
| Per Capita Income | 14,179 | $29,576 |
| Median Family Income | 3,477 | $67,979 |
| Mean Family Income | 3,477 | $90,763 |
| Median Household Income | 5,489 | $57,702 |
| Mean Household Income | 5,489 | $75,030 |
| Income Deficit | 3,477 | $0 |
| Wage / Income Gap (%) | 14,179 | 41.89% |
| Wage / Income Gap ($) | 14,179 | 58.11¢ per $1 |
| Gini / Inequality Index | 14,179 | 0.44 |
Earnings by Sex in Huron
Average Earnings in Huron are $34,375, $45,515 for men and $26,451 for women, a difference of 41.9%.
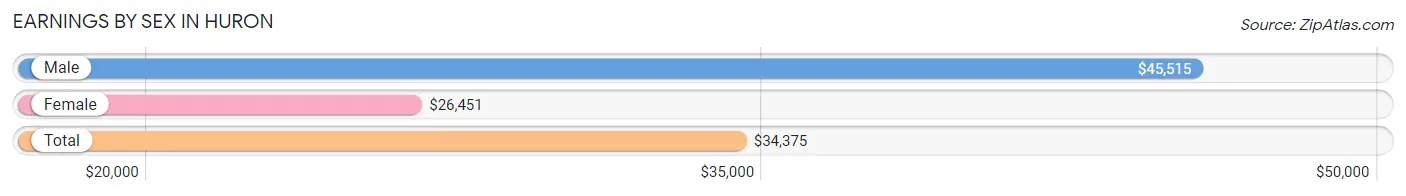
| Sex | Number | Average Earnings |
| Male | 4,042 (55.0%) | $45,515 |
| Female | 3,300 (45.0%) | $26,451 |
| Total | 7,342 (100.0%) | $34,375 |
Earnings by Sex by Income Bracket in Huron
The most common earnings brackets in Huron are $100,000+ for men (577 | 14.3%) and $30,000 to $34,999 for women (352 | 10.7%).
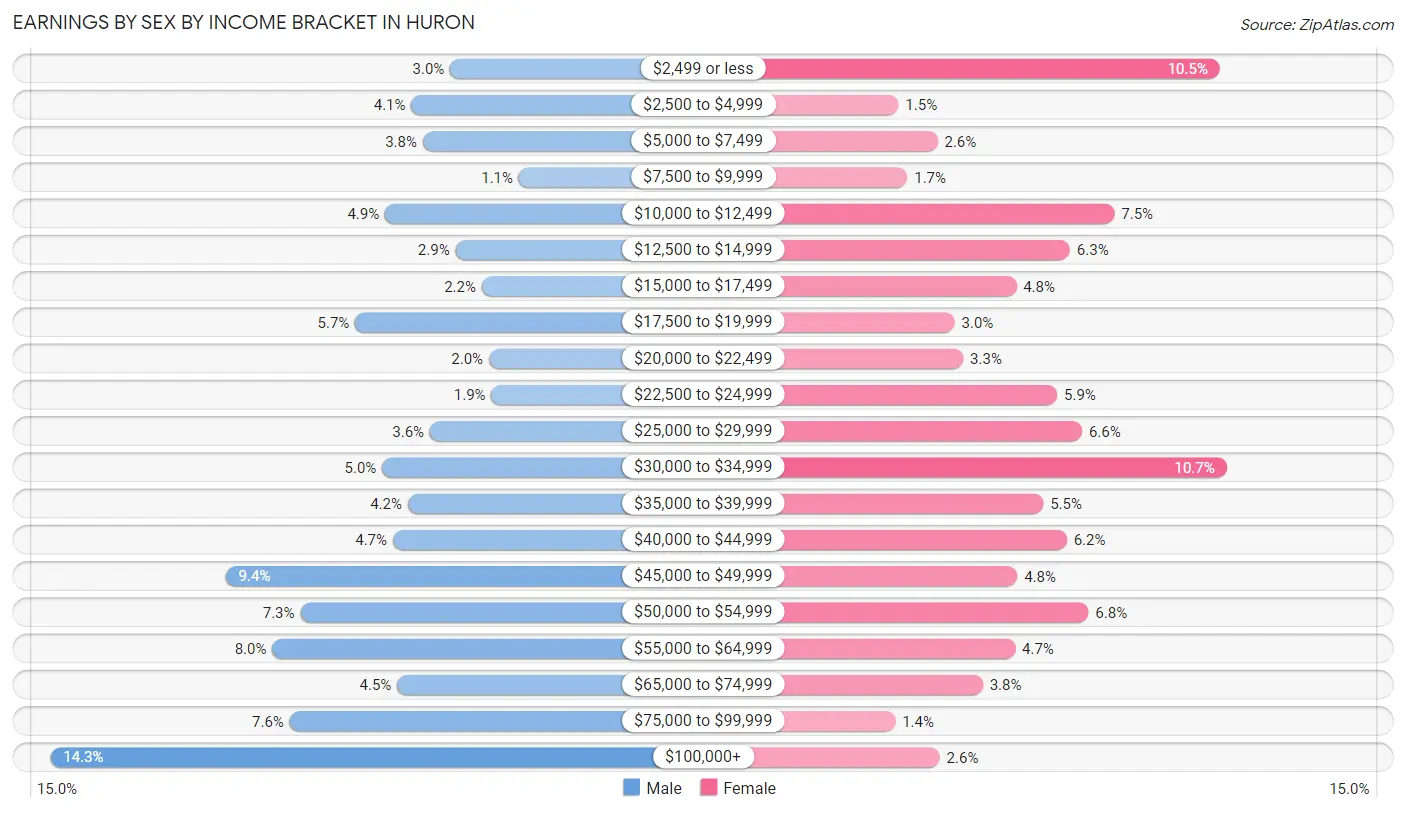
| Income | Male | Female |
| $2,499 or less | 123 (3.0%) | 346 (10.5%) |
| $2,500 to $4,999 | 167 (4.1%) | 48 (1.5%) |
| $5,000 to $7,499 | 154 (3.8%) | 84 (2.5%) |
| $7,500 to $9,999 | 45 (1.1%) | 56 (1.7%) |
| $10,000 to $12,499 | 197 (4.9%) | 248 (7.5%) |
| $12,500 to $14,999 | 117 (2.9%) | 207 (6.3%) |
| $15,000 to $17,499 | 87 (2.1%) | 157 (4.8%) |
| $17,500 to $19,999 | 231 (5.7%) | 100 (3.0%) |
| $20,000 to $22,499 | 79 (1.9%) | 108 (3.3%) |
| $22,500 to $24,999 | 76 (1.9%) | 195 (5.9%) |
| $25,000 to $29,999 | 146 (3.6%) | 218 (6.6%) |
| $30,000 to $34,999 | 200 (5.0%) | 352 (10.7%) |
| $35,000 to $39,999 | 171 (4.2%) | 182 (5.5%) |
| $40,000 to $44,999 | 188 (4.6%) | 204 (6.2%) |
| $45,000 to $49,999 | 378 (9.3%) | 158 (4.8%) |
| $50,000 to $54,999 | 293 (7.2%) | 224 (6.8%) |
| $55,000 to $64,999 | 325 (8.0%) | 156 (4.7%) |
| $65,000 to $74,999 | 183 (4.5%) | 126 (3.8%) |
| $75,000 to $99,999 | 305 (7.5%) | 45 (1.4%) |
| $100,000+ | 577 (14.3%) | 86 (2.6%) |
| Total | 4,042 (100.0%) | 3,300 (100.0%) |
Earnings by Sex by Educational Attainment in Huron
Average earnings in Huron are $48,477 for men and $30,074 for women, a difference of 38.0%. Men with an educational attainment of graduate degree enjoy the highest average annual earnings of $80,586, while those with less than high school education earn the least with $19,563. Women with an educational attainment of graduate degree earn the most with the average annual earnings of $48,073, while those with high school diploma education have the smallest earnings of $17,179.
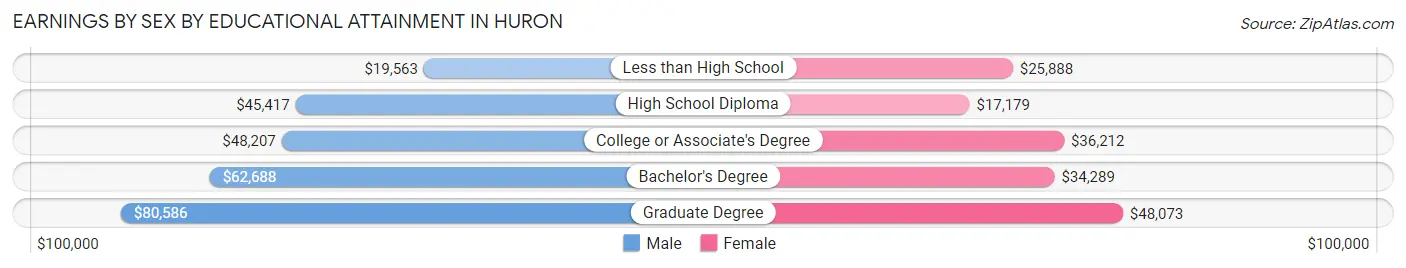
| Educational Attainment | Male Income | Female Income |
| Less than High School | $19,563 | $25,888 |
| High School Diploma | $45,417 | $17,179 |
| College or Associate's Degree | $48,207 | $36,212 |
| Bachelor's Degree | $62,688 | $34,289 |
| Graduate Degree | $80,586 | $48,073 |
| Total | $48,477 | $30,074 |
Family Income in Huron
Family Income Brackets in Huron
According to the Huron family income data, there are 758 families falling into the $50,000 to $74,999 income range, which is the most common income bracket and makes up 21.8% of all families. Conversely, the $10,000 to $14,999 income bracket is the least frequent group with only 10 families (0.3%) belonging to this category.
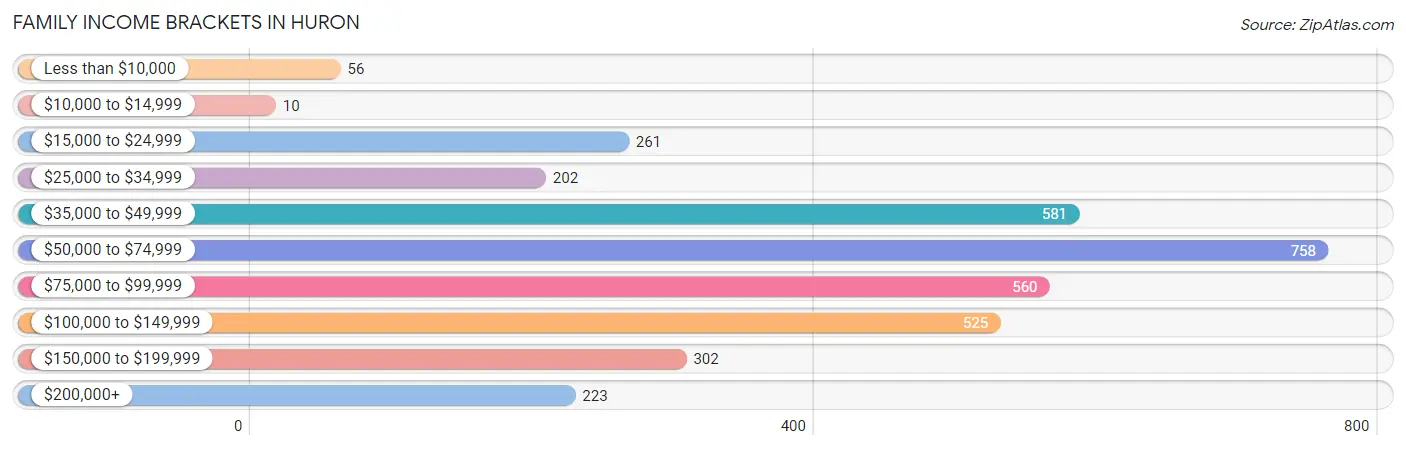
| Income Bracket | # Families | % Families |
| Less than $10,000 | 56 | 1.6% |
| $10,000 to $14,999 | 10 | 0.3% |
| $15,000 to $24,999 | 261 | 7.5% |
| $25,000 to $34,999 | 202 | 5.8% |
| $35,000 to $49,999 | 581 | 16.7% |
| $50,000 to $74,999 | 758 | 21.8% |
| $75,000 to $99,999 | 560 | 16.1% |
| $100,000 to $149,999 | 525 | 15.1% |
| $150,000 to $199,999 | 302 | 8.7% |
| $200,000+ | 223 | 6.4% |
Family Income by Famaliy Size in Huron
5-person families (279 | 8.0%) account for the highest median family income in Huron with $168,576 per family, while 5-person families (279 | 8.0%) have the highest median income of $33,715 per family member.
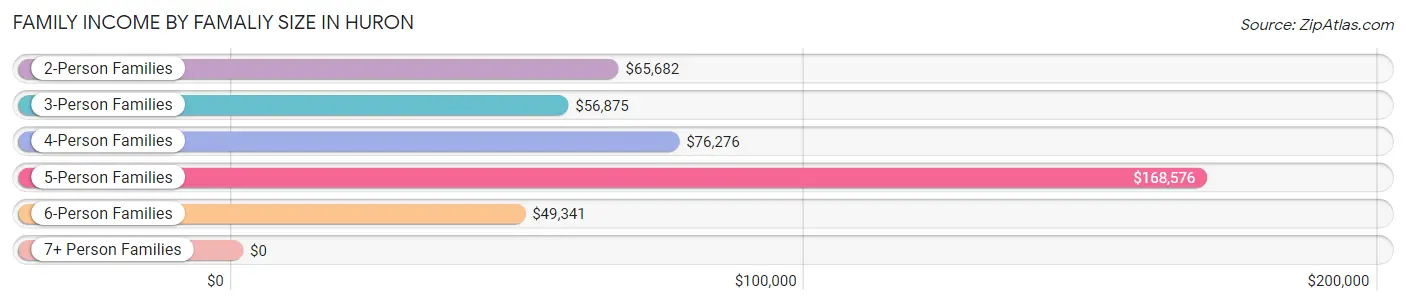
| Income Bracket | # Families | Median Income |
| 2-Person Families | 1,784 (51.3%) | $65,682 |
| 3-Person Families | 558 (16.1%) | $56,875 |
| 4-Person Families | 559 (16.1%) | $76,276 |
| 5-Person Families | 279 (8.0%) | $168,576 |
| 6-Person Families | 188 (5.4%) | $49,341 |
| 7+ Person Families | 109 (3.1%) | $0 |
| Total | 3,477 (100.0%) | $67,979 |
Family Income by Number of Earners in Huron
The median family income in Huron is $67,979, with families comprising 3+ earners (371) having the highest median family income of $141,964, while families with no earners (459) have the lowest median family income of $39,617, accounting for 10.7% and 13.2% of families, respectively.
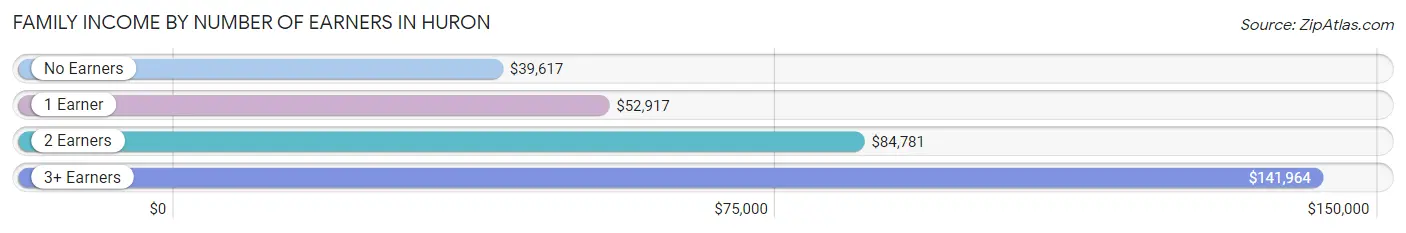
| Number of Earners | # Families | Median Income |
| No Earners | 459 (13.2%) | $39,617 |
| 1 Earner | 1,147 (33.0%) | $52,917 |
| 2 Earners | 1,500 (43.1%) | $84,781 |
| 3+ Earners | 371 (10.7%) | $141,964 |
| Total | 3,477 (100.0%) | $67,979 |
Household Income in Huron
Household Income Brackets in Huron
With 895 households falling in the category, the $35,000 to $49,999 income range is the most frequent in Huron, accounting for 16.3% of all households. In contrast, only 236 households (4.3%) fall into the $200,000+ income bracket, making it the least populous group.
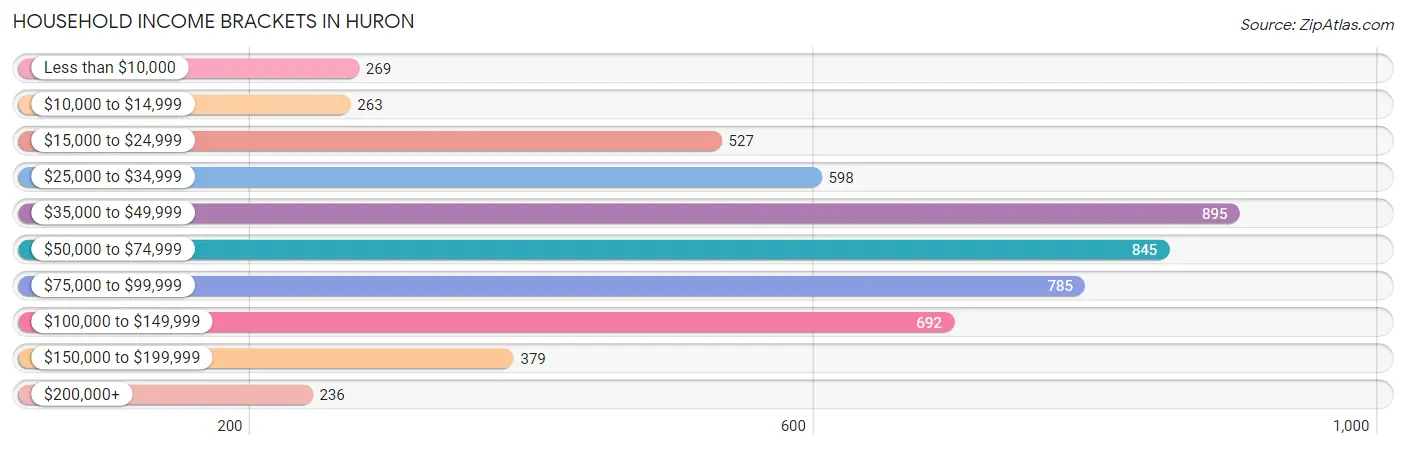
| Income Bracket | # Households | % Households |
| Less than $10,000 | 269 | 4.9% |
| $10,000 to $14,999 | 263 | 4.8% |
| $15,000 to $24,999 | 527 | 9.6% |
| $25,000 to $34,999 | 598 | 10.9% |
| $35,000 to $49,999 | 895 | 16.3% |
| $50,000 to $74,999 | 845 | 15.4% |
| $75,000 to $99,999 | 785 | 14.3% |
| $100,000 to $149,999 | 692 | 12.6% |
| $150,000 to $199,999 | 379 | 6.9% |
| $200,000+ | 236 | 4.3% |
Household Income by Householder Age in Huron
The median household income in Huron is $57,702, with the highest median household income of $77,300 found in the 25 to 44 years age bracket for the primary householder. A total of 1,918 households (34.9%) fall into this category. Meanwhile, the 15 to 24 years age bracket for the primary householder has the lowest median household income of $38,854, with 336 households (6.1%) in this group.
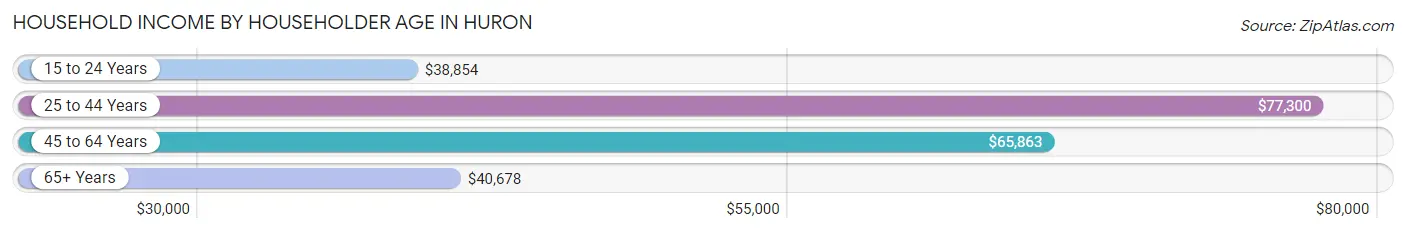
| Income Bracket | # Households | Median Income |
| 15 to 24 Years | 336 (6.1%) | $38,854 |
| 25 to 44 Years | 1,918 (34.9%) | $77,300 |
| 45 to 64 Years | 1,749 (31.9%) | $65,863 |
| 65+ Years | 1,486 (27.1%) | $40,678 |
| Total | 5,489 (100.0%) | $57,702 |
Poverty in Huron
Income Below Poverty by Sex and Age in Huron
With 10.0% poverty level for males and 12.1% for females among the residents of Huron, under 5 year old males and 18 to 24 year old females are the most vulnerable to poverty, with 154 males (28.7%) and 211 females (35.8%) in their respective age groups living below the poverty level.
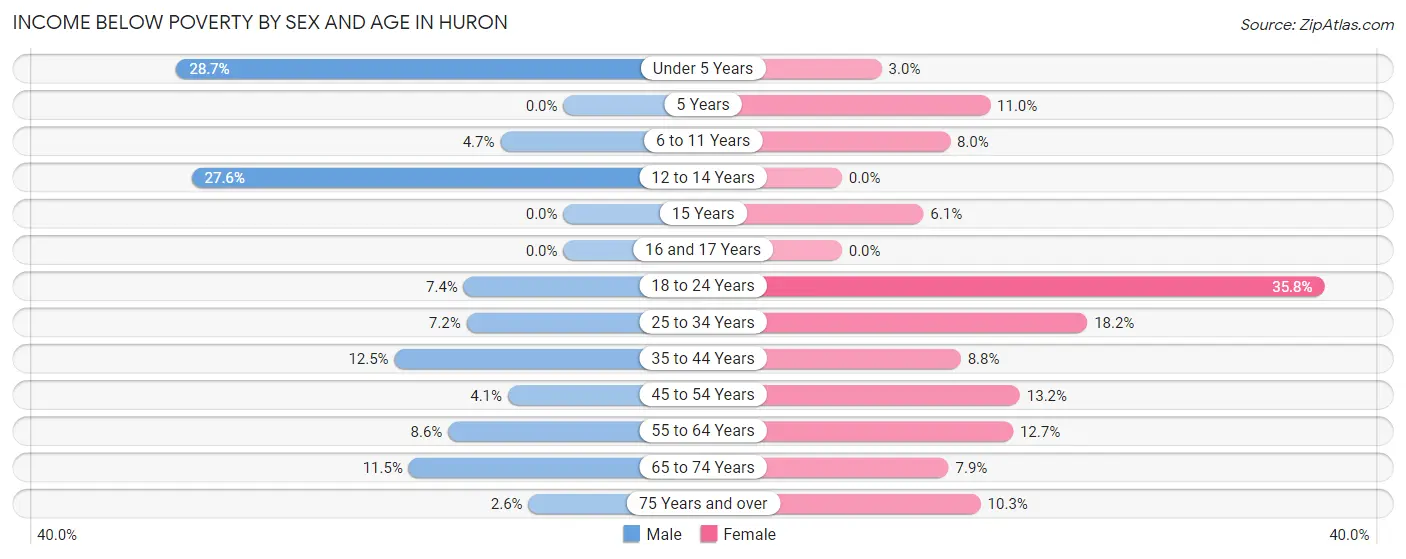
| Age Bracket | Male | Female |
| Under 5 Years | 154 (28.7%) | 24 (3.0%) |
| 5 Years | 0 (0.0%) | 12 (11.0%) |
| 6 to 11 Years | 34 (4.7%) | 65 (8.0%) |
| 12 to 14 Years | 85 (27.6%) | 0 (0.0%) |
| 15 Years | 0 (0.0%) | 2 (6.1%) |
| 16 and 17 Years | 0 (0.0%) | 0 (0.0%) |
| 18 to 24 Years | 33 (7.4%) | 211 (35.8%) |
| 25 to 34 Years | 69 (7.2%) | 198 (18.2%) |
| 35 to 44 Years | 112 (12.5%) | 59 (8.8%) |
| 45 to 54 Years | 26 (4.1%) | 71 (13.2%) |
| 55 to 64 Years | 69 (8.6%) | 97 (12.7%) |
| 65 to 74 Years | 79 (11.5%) | 49 (7.9%) |
| 75 Years and over | 11 (2.6%) | 77 (10.3%) |
| Total | 672 (10.0%) | 865 (12.1%) |
Income Above Poverty by Sex and Age in Huron
According to the poverty statistics in Huron, males aged 5 years and females aged 12 to 14 years are the age groups that are most secure financially, with 100.0% of males and 100.0% of females in these age groups living above the poverty line.
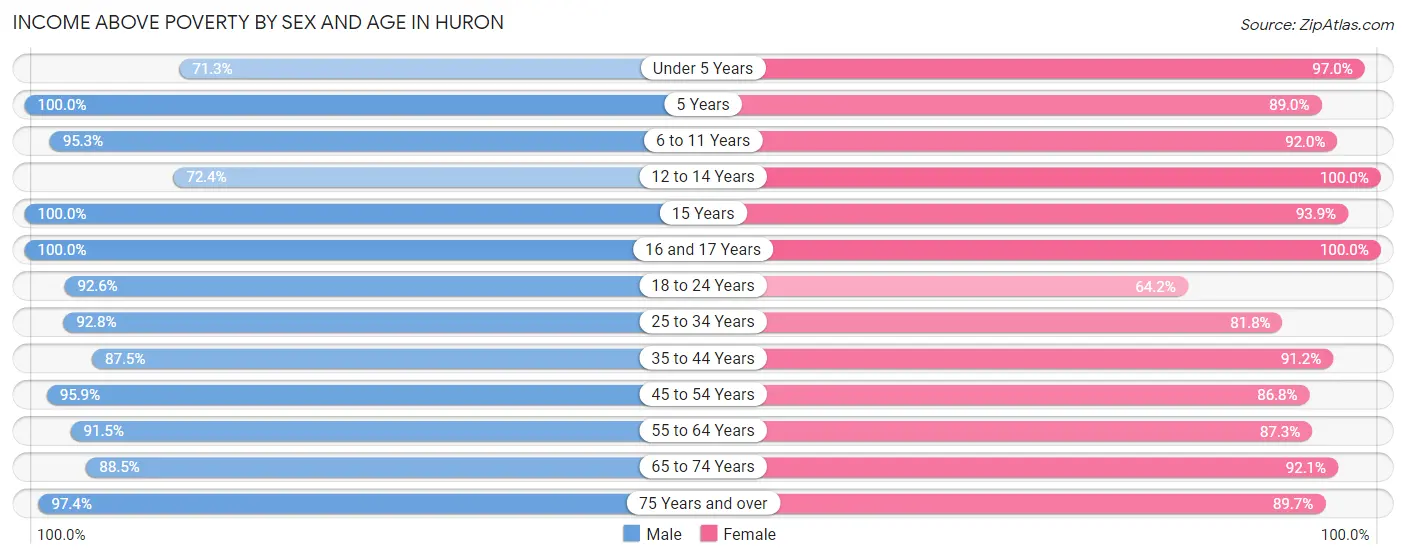
| Age Bracket | Male | Female |
| Under 5 Years | 382 (71.3%) | 787 (97.0%) |
| 5 Years | 122 (100.0%) | 97 (89.0%) |
| 6 to 11 Years | 692 (95.3%) | 744 (92.0%) |
| 12 to 14 Years | 223 (72.4%) | 212 (100.0%) |
| 15 Years | 26 (100.0%) | 31 (93.9%) |
| 16 and 17 Years | 151 (100.0%) | 166 (100.0%) |
| 18 to 24 Years | 413 (92.6%) | 378 (64.2%) |
| 25 to 34 Years | 890 (92.8%) | 889 (81.8%) |
| 35 to 44 Years | 781 (87.5%) | 609 (91.2%) |
| 45 to 54 Years | 605 (95.9%) | 466 (86.8%) |
| 55 to 64 Years | 738 (91.4%) | 666 (87.3%) |
| 65 to 74 Years | 609 (88.5%) | 569 (92.1%) |
| 75 Years and over | 414 (97.4%) | 670 (89.7%) |
| Total | 6,046 (90.0%) | 6,284 (87.9%) |
Income Below Poverty Among Married-Couple Families in Huron
The poverty statistics for married-couple families in Huron show that 3.6% or 97 of the total 2,669 families live below the poverty line. Families with 1 or 2 children have the highest poverty rate of 5.6%, comprising of 51 families. On the other hand, families with 5 or more children have the lowest poverty rate of 0.0%, which includes 0 families.
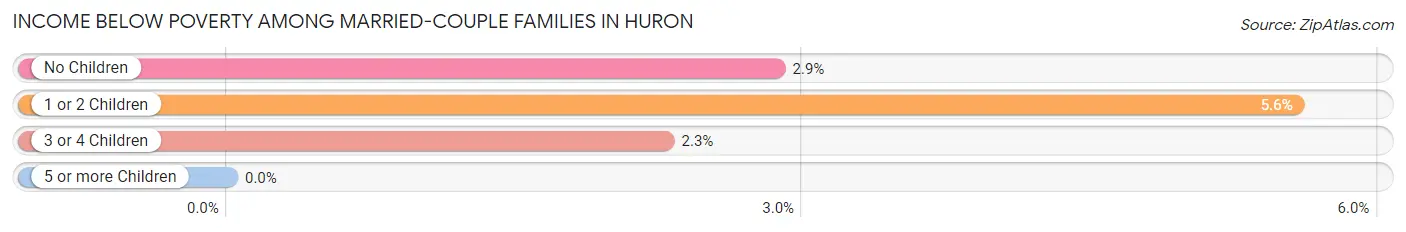
| Children | Above Poverty | Below Poverty |
| No Children | 1,360 (97.1%) | 40 (2.9%) |
| 1 or 2 Children | 864 (94.4%) | 51 (5.6%) |
| 3 or 4 Children | 257 (97.7%) | 6 (2.3%) |
| 5 or more Children | 91 (100.0%) | 0 (0.0%) |
| Total | 2,572 (96.4%) | 97 (3.6%) |
Income Below Poverty Among Single-Parent Households in Huron
According to the poverty data in Huron, 6.1% or 26 single-father households and 8.7% or 33 single-mother households are living below the poverty line. Among single-father households, those with 3 or 4 children have the highest poverty rate, with 5 households (7.2%) experiencing poverty. Likewise, among single-mother households, those with no children have the highest poverty rate, with 13 households (22.0%) falling below the poverty line.
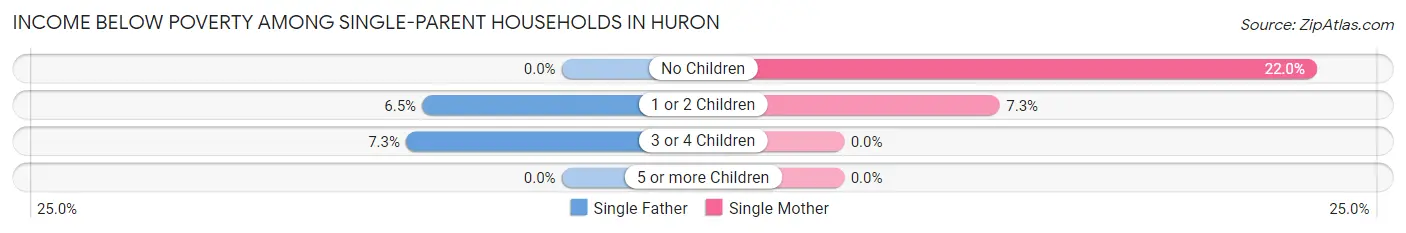
| Children | Single Father | Single Mother |
| No Children | 0 (0.0%) | 13 (22.0%) |
| 1 or 2 Children | 21 (6.5%) | 20 (7.2%) |
| 3 or 4 Children | 5 (7.2%) | 0 (0.0%) |
| 5 or more Children | 0 (0.0%) | 0 (0.0%) |
| Total | 26 (6.1%) | 33 (8.7%) |
Income Below Poverty Among Married-Couple vs Single-Parent Households in Huron
The poverty data for Huron shows that 97 of the married-couple family households (3.6%) and 59 of the single-parent households (7.3%) are living below the poverty level. Within the married-couple family households, those with 1 or 2 children have the highest poverty rate, with 51 households (5.6%) falling below the poverty line. Among the single-parent households, those with no children have the highest poverty rate, with 13 household (13.5%) living below poverty.
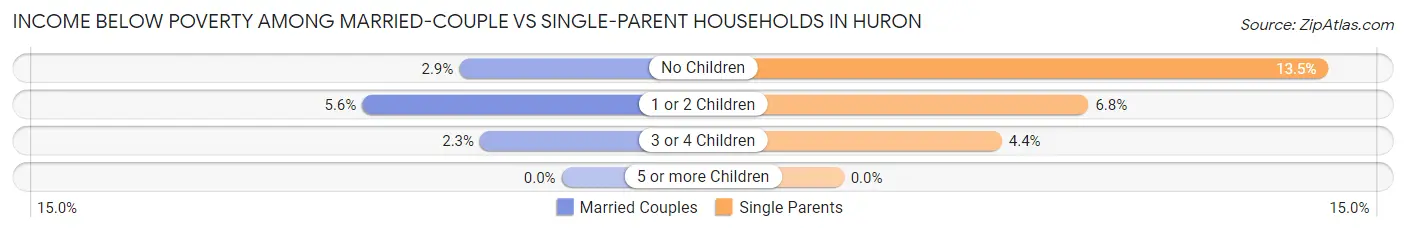
| Children | Married-Couple Families | Single-Parent Households |
| No Children | 40 (2.9%) | 13 (13.5%) |
| 1 or 2 Children | 51 (5.6%) | 41 (6.8%) |
| 3 or 4 Children | 6 (2.3%) | 5 (4.4%) |
| 5 or more Children | 0 (0.0%) | 0 (0.0%) |
| Total | 97 (3.6%) | 59 (7.3%) |
Race in Huron
The most populous races in Huron are White / Caucasian (9,474 | 66.8%), Hispanic or Latino (2,089 | 14.7%), and Asian (1,708 | 12.0%).
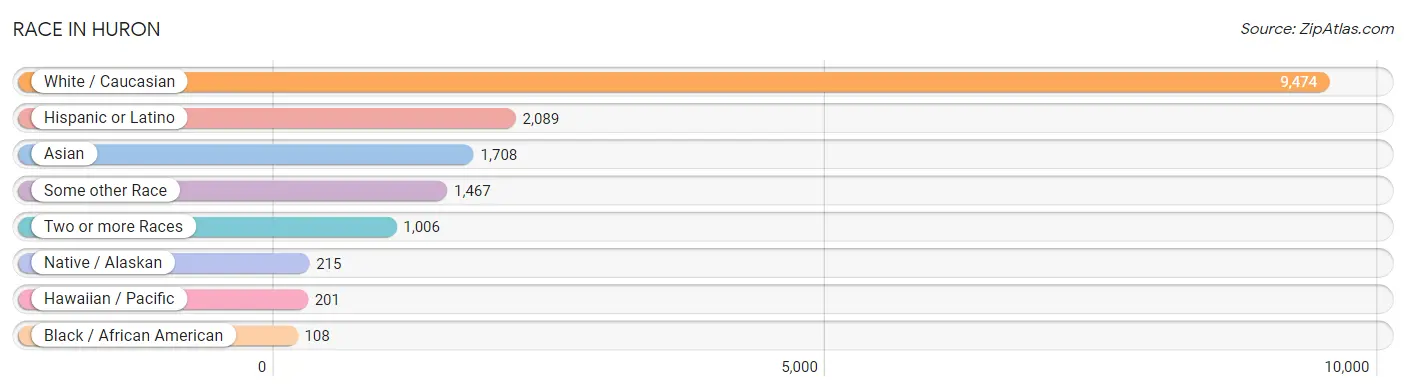
| Race | # Population | % Population |
| Asian | 1,708 | 12.0% |
| Black / African American | 108 | 0.8% |
| Hawaiian / Pacific | 201 | 1.4% |
| Hispanic or Latino | 2,089 | 14.7% |
| Native / Alaskan | 215 | 1.5% |
| White / Caucasian | 9,474 | 66.8% |
| Two or more Races | 1,006 | 7.1% |
| Some other Race | 1,467 | 10.3% |
| Total | 14,179 | 100.0% |
Ancestry in Huron
The most populous ancestries reported in Huron are German (4,555 | 32.1%), Norwegian (1,127 | 8.0%), English (1,093 | 7.7%), Indonesian (1,033 | 7.3%), and Mexican (992 | 7.0%), together accounting for 62.1% of all Huron residents.
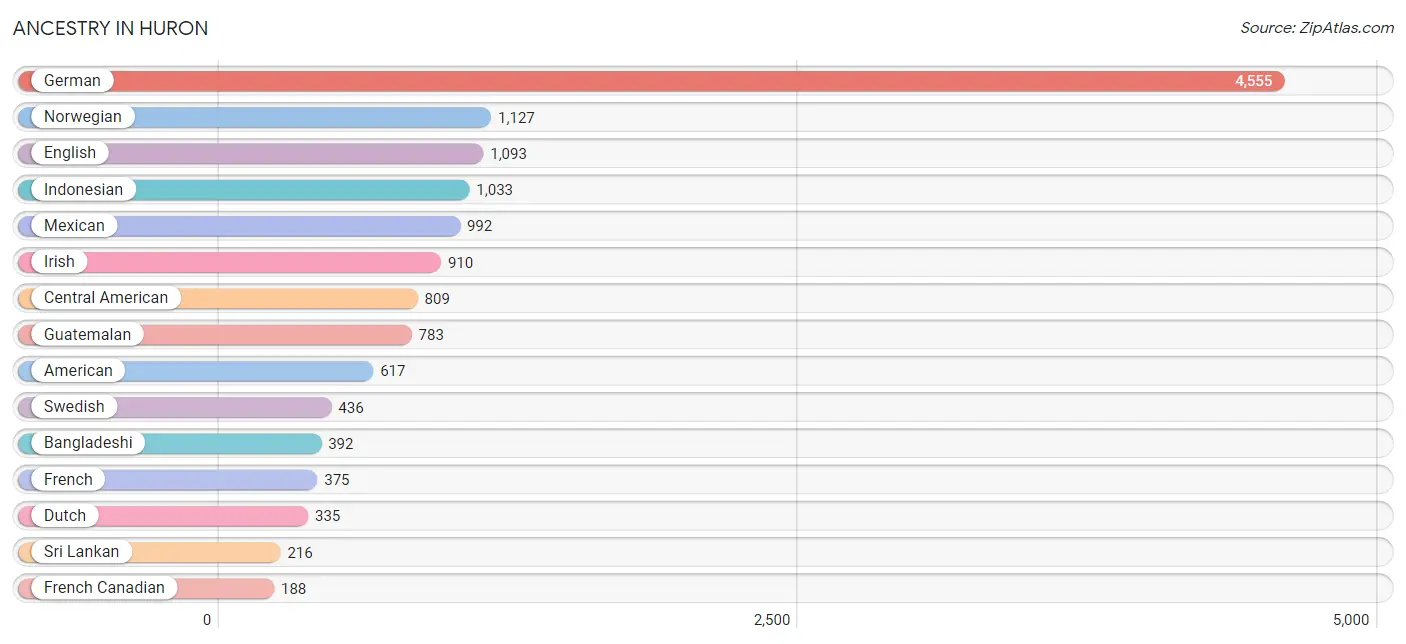
| Ancestry | # Population | % Population |
| American | 617 | 4.3% |
| Armenian | 9 | 0.1% |
| Austrian | 15 | 0.1% |
| Bangladeshi | 392 | 2.8% |
| Belgian | 20 | 0.1% |
| Bhutanese | 16 | 0.1% |
| British | 39 | 0.3% |
| Cambodian | 16 | 0.1% |
| Central American | 809 | 5.7% |
| Cherokee | 21 | 0.2% |
| Chippewa | 114 | 0.8% |
| Crow | 36 | 0.3% |
| Czech | 89 | 0.6% |
| Czechoslovakian | 13 | 0.1% |
| Danish | 99 | 0.7% |
| Dominican | 100 | 0.7% |
| Dutch | 335 | 2.4% |
| Eastern European | 3 | 0.0% |
| English | 1,093 | 7.7% |
| European | 20 | 0.1% |
| Finnish | 31 | 0.2% |
| French | 375 | 2.6% |
| French Canadian | 188 | 1.3% |
| German | 4,555 | 32.1% |
| German Russian | 91 | 0.6% |
| Greek | 40 | 0.3% |
| Guatemalan | 783 | 5.5% |
| Honduran | 26 | 0.2% |
| Indonesian | 1,033 | 7.3% |
| Iranian | 13 | 0.1% |
| Irish | 910 | 6.4% |
| Italian | 115 | 0.8% |
| Korean | 141 | 1.0% |
| Menominee | 8 | 0.1% |
| Mexican | 992 | 7.0% |
| Mexican American Indian | 9 | 0.1% |
| Norwegian | 1,127 | 8.0% |
| Pakistani | 136 | 1.0% |
| Peruvian | 73 | 0.5% |
| Polish | 53 | 0.4% |
| Portuguese | 79 | 0.6% |
| Puerto Rican | 94 | 0.7% |
| Russian | 82 | 0.6% |
| Scandinavian | 85 | 0.6% |
| Scotch-Irish | 46 | 0.3% |
| Scottish | 38 | 0.3% |
| Sioux | 130 | 0.9% |
| South American | 73 | 0.5% |
| Sri Lankan | 216 | 1.5% |
| Swedish | 436 | 3.1% |
| Swiss | 27 | 0.2% |
| Welsh | 137 | 1.0% | View All 52 Rows |
Immigrants in Huron
The most numerous immigrant groups reported in Huron came from Asia (1,159 | 8.2%), South Eastern Asia (1,140 | 8.0%), Latin America (851 | 6.0%), Central America (636 | 4.5%), and Guatemala (597 | 4.2%), together accounting for 30.9% of all Huron residents.
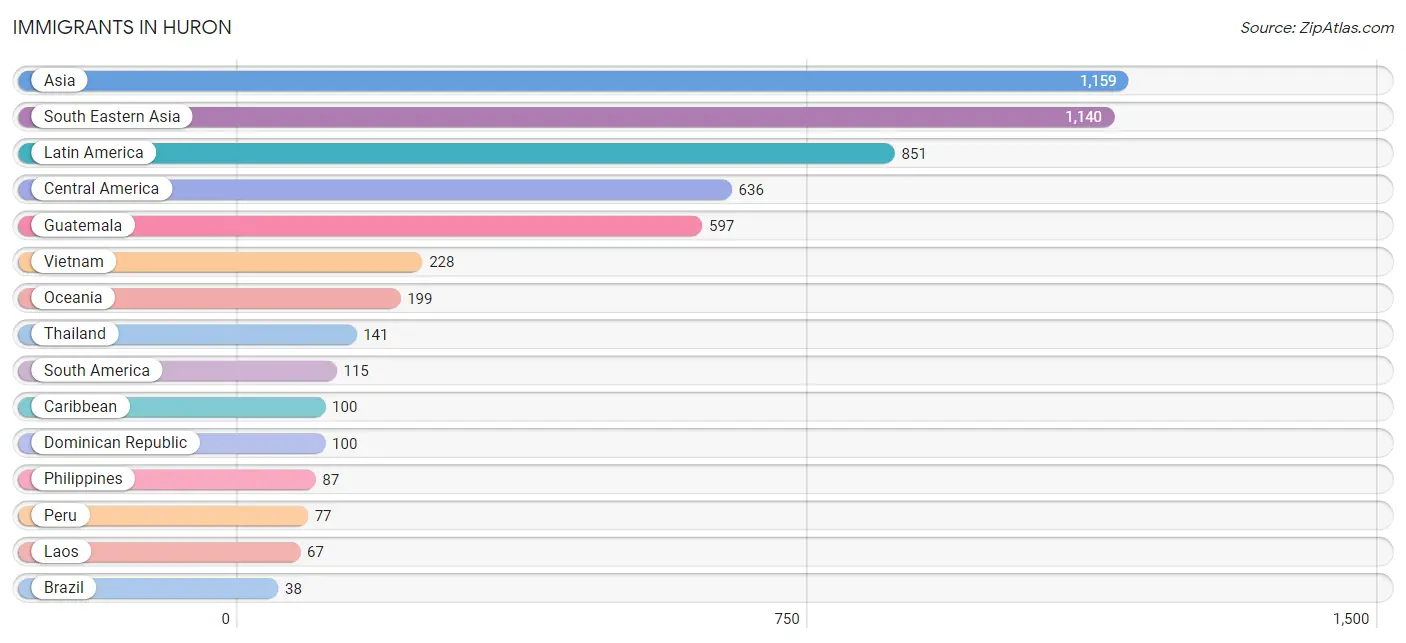
| Immigration Origin | # Population | % Population |
| Africa | 17 | 0.1% |
| Asia | 1,159 | 8.2% |
| Brazil | 38 | 0.3% |
| Caribbean | 100 | 0.7% |
| Central America | 636 | 4.5% |
| Dominican Republic | 100 | 0.7% |
| Europe | 14 | 0.1% |
| Guatemala | 597 | 4.2% |
| Honduras | 10 | 0.1% |
| Iran | 13 | 0.1% |
| Laos | 67 | 0.5% |
| Latin America | 851 | 6.0% |
| Mexico | 29 | 0.2% |
| Northern Europe | 14 | 0.1% |
| Oceania | 199 | 1.4% |
| Peru | 77 | 0.5% |
| Philippines | 87 | 0.6% |
| South Africa | 17 | 0.1% |
| South America | 115 | 0.8% |
| South Central Asia | 13 | 0.1% |
| South Eastern Asia | 1,140 | 8.0% |
| Thailand | 141 | 1.0% |
| Vietnam | 228 | 1.6% | View All 23 Rows |
Sex and Age in Huron
Sex and Age in Huron
The most populous age groups in Huron are 10 to 14 Years (679 | 9.9%) for men and 5 to 9 Years (821 | 11.2%) for women.
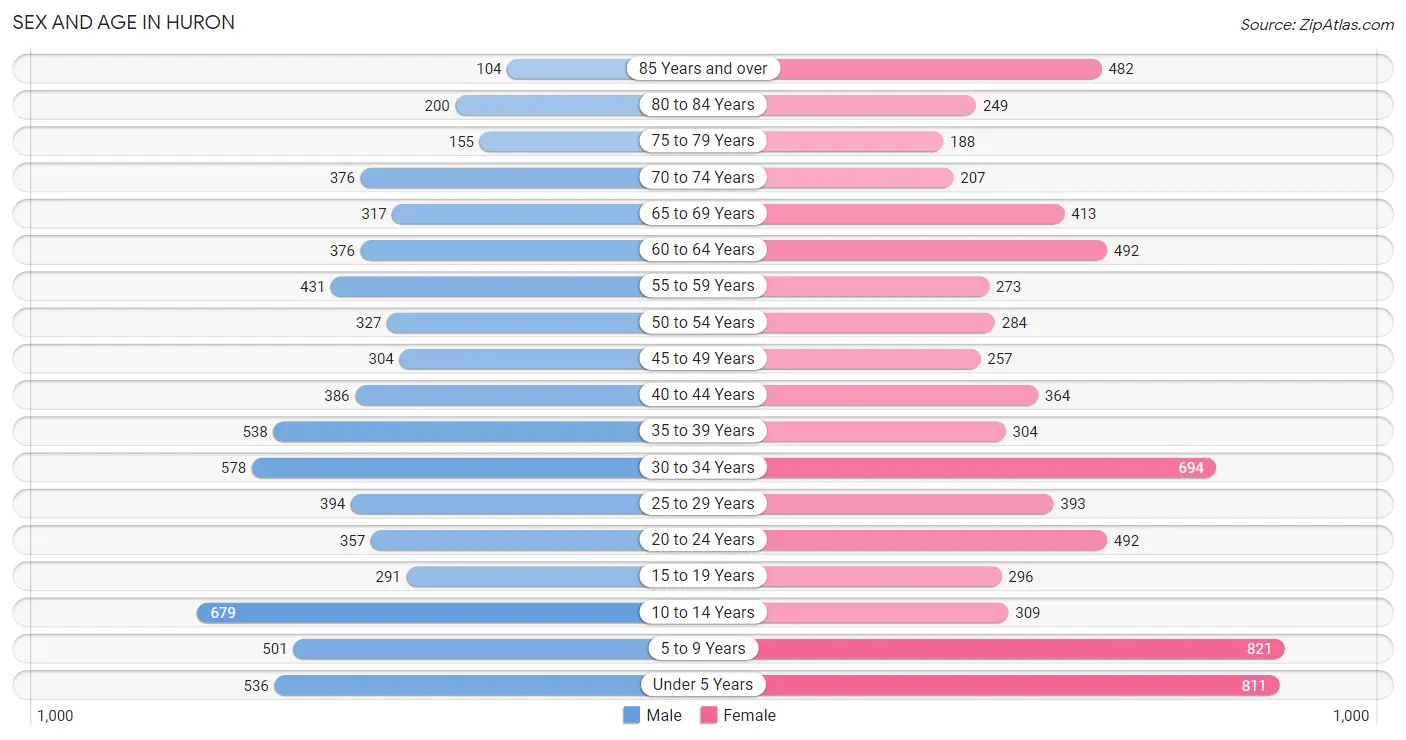
| Age Bracket | Male | Female |
| Under 5 Years | 536 (7.8%) | 811 (11.1%) |
| 5 to 9 Years | 501 (7.3%) | 821 (11.2%) |
| 10 to 14 Years | 679 (9.9%) | 309 (4.2%) |
| 15 to 19 Years | 291 (4.3%) | 296 (4.0%) |
| 20 to 24 Years | 357 (5.2%) | 492 (6.7%) |
| 25 to 29 Years | 394 (5.8%) | 393 (5.4%) |
| 30 to 34 Years | 578 (8.4%) | 694 (9.5%) |
| 35 to 39 Years | 538 (7.9%) | 304 (4.2%) |
| 40 to 44 Years | 386 (5.6%) | 364 (5.0%) |
| 45 to 49 Years | 304 (4.4%) | 257 (3.5%) |
| 50 to 54 Years | 327 (4.8%) | 284 (3.9%) |
| 55 to 59 Years | 431 (6.3%) | 273 (3.7%) |
| 60 to 64 Years | 376 (5.5%) | 492 (6.7%) |
| 65 to 69 Years | 317 (4.6%) | 413 (5.6%) |
| 70 to 74 Years | 376 (5.5%) | 207 (2.8%) |
| 75 to 79 Years | 155 (2.3%) | 188 (2.6%) |
| 80 to 84 Years | 200 (2.9%) | 249 (3.4%) |
| 85 Years and over | 104 (1.5%) | 482 (6.6%) |
| Total | 6,850 (100.0%) | 7,329 (100.0%) |
Families and Households in Huron
Median Family Size in Huron
The median family size in Huron is 3.18 persons per family, with married-couple families (2,669 | 76.8%) accounting for the largest median family size of 3.27 persons per family. On the other hand, single female/mother families (379 | 10.9%) represent the smallest median family size with 2.76 persons per family.
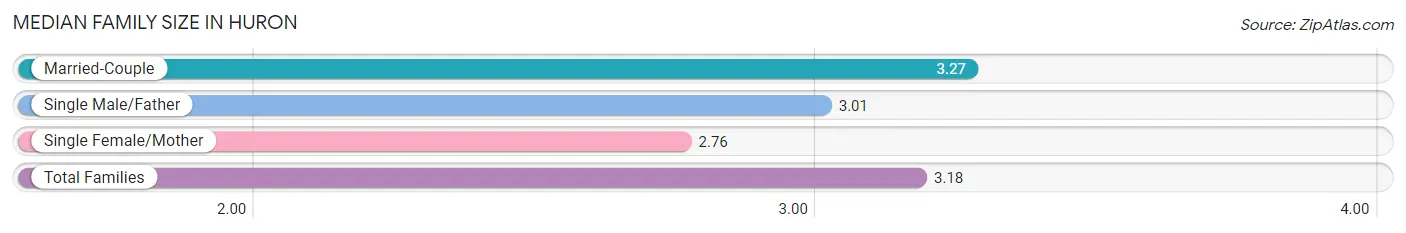
| Family Type | # Families | Family Size |
| Married-Couple | 2,669 (76.8%) | 3.27 |
| Single Male/Father | 429 (12.3%) | 3.01 |
| Single Female/Mother | 379 (10.9%) | 2.76 |
| Total Families | 3,477 (100.0%) | 3.18 |
Median Household Size in Huron
The median household size in Huron is 2.49 persons per household, with single male/father households (429 | 7.8%) accounting for the largest median household size of 3.62 persons per household. non-family households (2,012 | 36.7%) represent the smallest median household size with 1.10 persons per household.
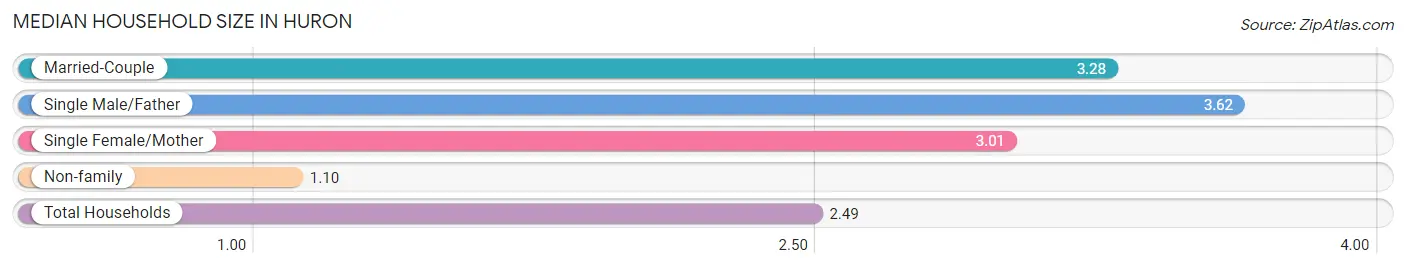
| Household Type | # Households | Household Size |
| Married-Couple | 2,669 (48.6%) | 3.28 |
| Single Male/Father | 429 (7.8%) | 3.62 |
| Single Female/Mother | 379 (6.9%) | 3.01 |
| Non-family | 2,012 (36.7%) | 1.10 |
| Total Households | 5,489 (100.0%) | 2.49 |
Household Size by Marriage Status in Huron
Out of a total of 5,489 households in Huron, 3,477 (63.3%) are family households, while 2,012 (36.7%) are nonfamily households. The most numerous type of family households are 2-person households, comprising 1,652, and the most common type of nonfamily households are 1-person households, comprising 1,826.
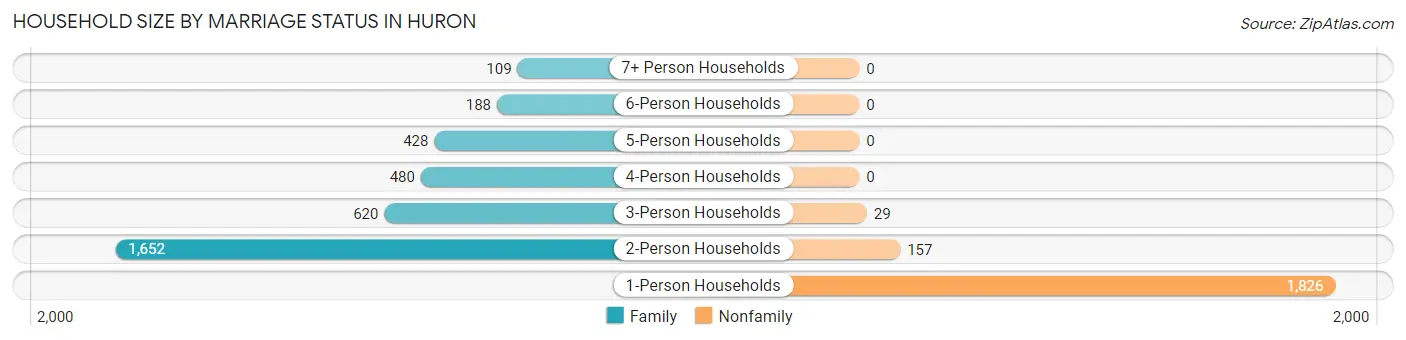
| Household Size | Family Households | Nonfamily Households |
| 1-Person Households | - | 1,826 (33.3%) |
| 2-Person Households | 1,652 (30.1%) | 157 (2.9%) |
| 3-Person Households | 620 (11.3%) | 29 (0.5%) |
| 4-Person Households | 480 (8.7%) | 0 (0.0%) |
| 5-Person Households | 428 (7.8%) | 0 (0.0%) |
| 6-Person Households | 188 (3.4%) | 0 (0.0%) |
| 7+ Person Households | 109 (2.0%) | 0 (0.0%) |
| Total | 3,477 (63.3%) | 2,012 (36.7%) |
Female Fertility in Huron
Fertility by Age in Huron
Average fertility rate in Huron is 118.0 births per 1,000 women. Women in the age bracket of 20 to 34 years have the highest fertility rate with 213.0 births per 1,000 women. Women in the age bracket of 20 to 34 years acount for 99.7% of all women with births.
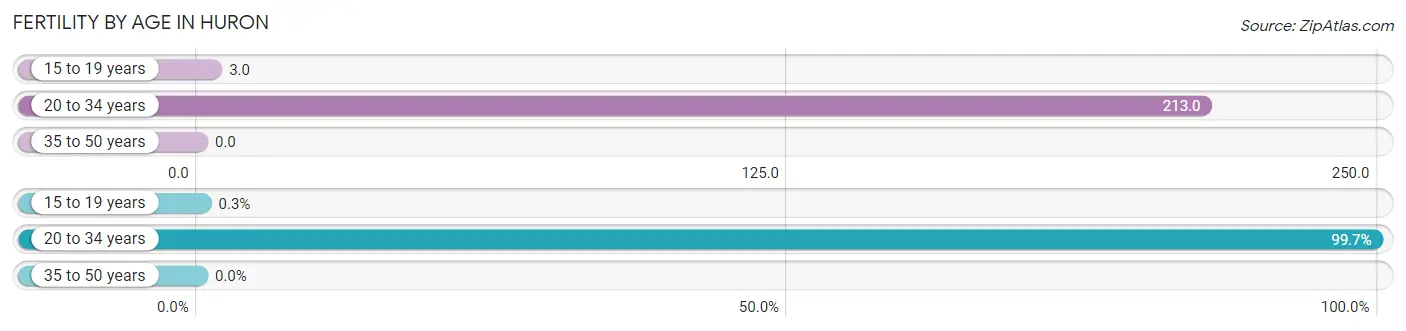
| Age Bracket | Women with Births | Births / 1,000 Women |
| 15 to 19 years | 1 (0.3%) | 3.0 |
| 20 to 34 years | 337 (99.7%) | 213.0 |
| 35 to 50 years | 0 (0.0%) | 0.0 |
| Total | 338 (100.0%) | 118.0 |
Fertility by Age by Marriage Status in Huron
62.7% of women with births (338) in Huron are married. The highest percentage of unmarried women with births falls into 15 to 19 years age bracket with 100.0% of them unmarried at the time of birth, while the lowest percentage of unmarried women with births belong to 20 to 34 years age bracket with 37.1% of them unmarried.
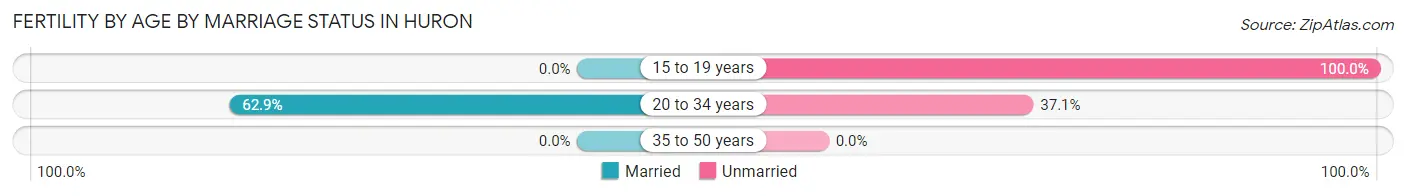
| Age Bracket | Married | Unmarried |
| 15 to 19 years | 0 (0.0%) | 1 (100.0%) |
| 20 to 34 years | 212 (62.9%) | 125 (37.1%) |
| 35 to 50 years | 0 (0.0%) | 0 (0.0%) |
| Total | 212 (62.7%) | 126 (37.3%) |
Fertility by Education in Huron
Average fertility rate in Huron is 118.0 births per 1,000 women. Women with the education attainment of graduate degree have the highest fertility rate of 299.0 births per 1,000 women, while women with the education attainment of college or associate's degree have the lowest fertility at 47.0 births per 1,000 women. Women with the education attainment of less than high school represent 35.5% of all women with births.
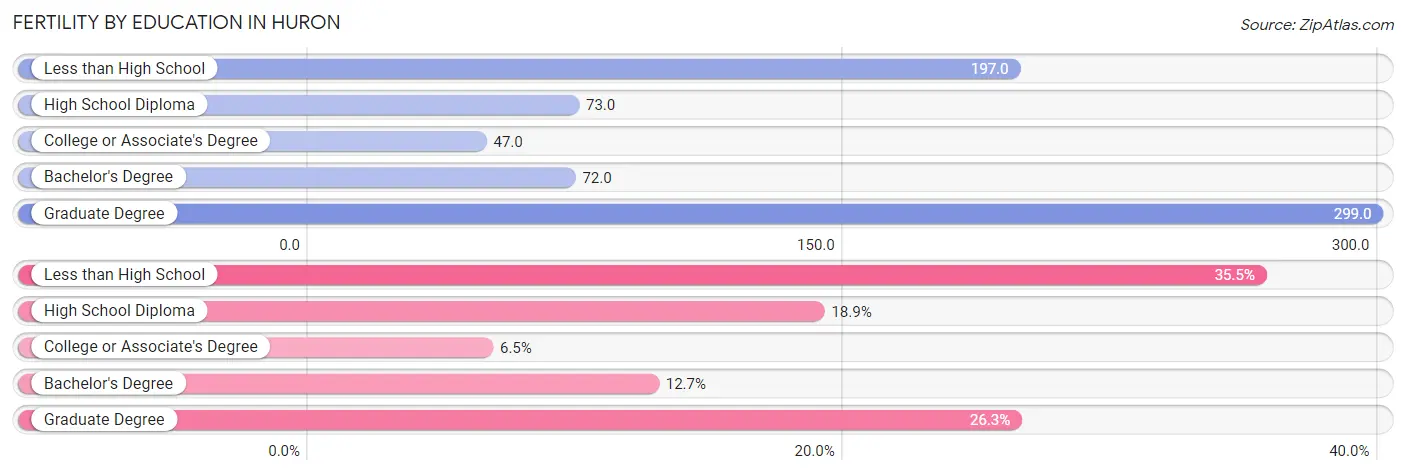
| Educational Attainment | Women with Births | Births / 1,000 Women |
| Less than High School | 120 (35.5%) | 197.0 |
| High School Diploma | 64 (18.9%) | 73.0 |
| College or Associate's Degree | 22 (6.5%) | 47.0 |
| Bachelor's Degree | 43 (12.7%) | 72.0 |
| Graduate Degree | 89 (26.3%) | 299.0 |
| Total | 338 (100.0%) | 118.0 |
Fertility by Education by Marriage Status in Huron
37.3% of women with births in Huron are unmarried. Women with the educational attainment of bachelor's degree are most likely to be married with 100.0% of them married at childbirth, while women with the educational attainment of college or associate's degree are least likely to be married with 100.0% of them unmarried at childbirth.
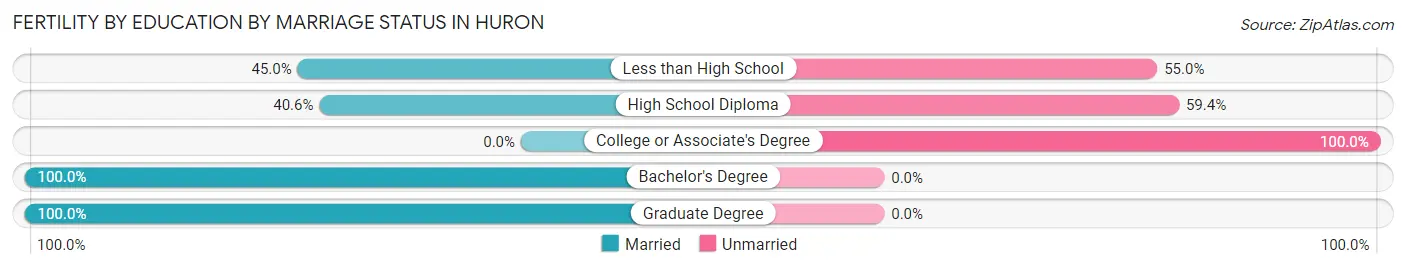
| Educational Attainment | Married | Unmarried |
| Less than High School | 54 (45.0%) | 66 (55.0%) |
| High School Diploma | 26 (40.6%) | 38 (59.4%) |
| College or Associate's Degree | 0 (0.0%) | 22 (100.0%) |
| Bachelor's Degree | 43 (100.0%) | 0 (0.0%) |
| Graduate Degree | 89 (100.0%) | 0 (0.0%) |
| Total | 212 (62.7%) | 126 (37.3%) |
Employment Characteristics in Huron
Employment by Class of Employer in Huron
Among the 6,689 employed individuals in Huron, private company employees (4,292 | 64.2%), not-for-profit organizations (987 | 14.8%), and self-employed (not incorporated) (391 | 5.9%) make up the most common classes of employment.
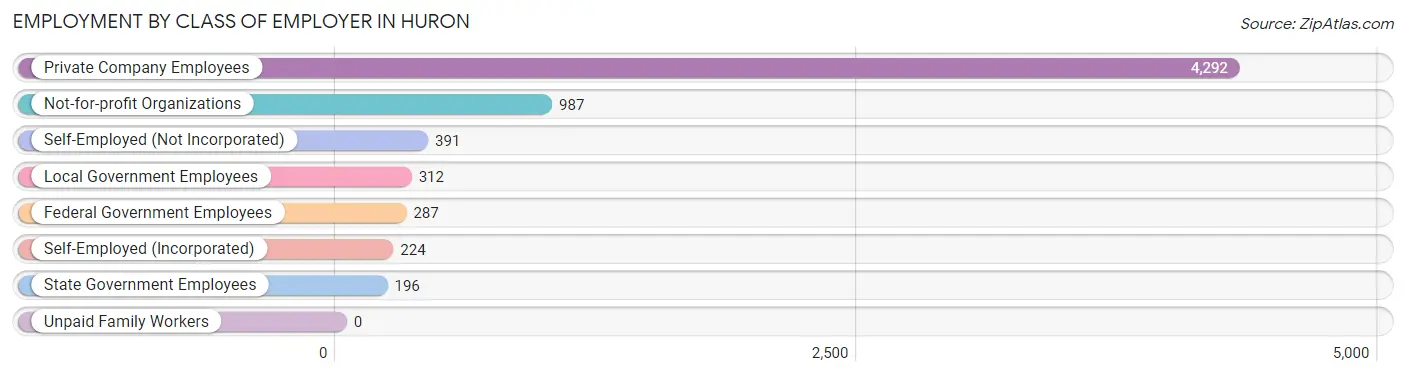
| Employer Class | # Employees | % Employees |
| Private Company Employees | 4,292 | 64.2% |
| Self-Employed (Incorporated) | 224 | 3.4% |
| Self-Employed (Not Incorporated) | 391 | 5.9% |
| Not-for-profit Organizations | 987 | 14.8% |
| Local Government Employees | 312 | 4.7% |
| State Government Employees | 196 | 2.9% |
| Federal Government Employees | 287 | 4.3% |
| Unpaid Family Workers | 0 | 0.0% |
| Total | 6,689 | 100.0% |
Employment Status by Age in Huron
According to the labor force statistics for Huron, out of the total population over 16 years of age (10,463), 67.1% or 7,021 individuals are in the labor force, with 2.7% or 190 of them unemployed. The age group with the highest labor force participation rate is 45 to 54 years, with 92.1% or 1,079 individuals in the labor force. Within the labor force, the 60 to 64 years age range has the highest percentage of unemployed individuals, with 11.8% or 74 of them being unemployed.
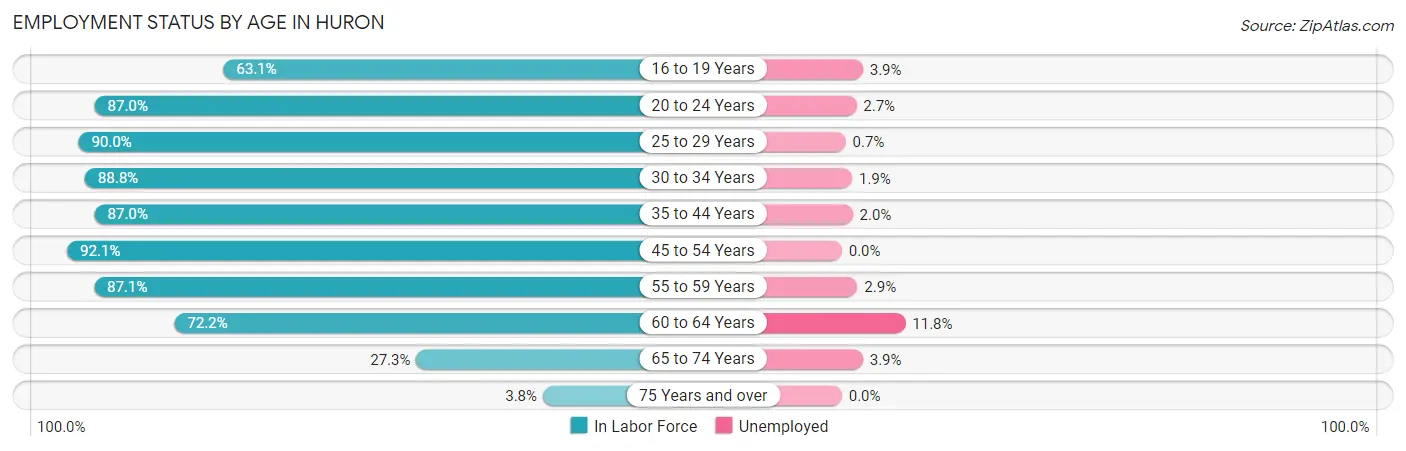
| Age Bracket | In Labor Force | Unemployed |
| 16 to 19 Years | 333 (63.1%) | 13 (3.9%) |
| 20 to 24 Years | 739 (87.0%) | 20 (2.7%) |
| 25 to 29 Years | 708 (90.0%) | 5 (0.7%) |
| 30 to 34 Years | 1,130 (88.8%) | 21 (1.9%) |
| 35 to 44 Years | 1,385 (87.0%) | 28 (2.0%) |
| 45 to 54 Years | 1,079 (92.1%) | 0 (0.0%) |
| 55 to 59 Years | 613 (87.1%) | 18 (2.9%) |
| 60 to 64 Years | 627 (72.2%) | 74 (11.8%) |
| 65 to 74 Years | 358 (27.3%) | 14 (3.9%) |
| 75 Years and over | 52 (3.8%) | 0 (0.0%) |
| Total | 7,021 (67.1%) | 190 (2.7%) |
Employment Status by Educational Attainment in Huron
According to labor force statistics for Huron, 86.7% of individuals (5,544) out of the total population between 25 and 64 years of age (6,395) are in the labor force, with 2.6% or 144 of them being unemployed. The group with the highest labor force participation rate are those with the educational attainment of college / associate degree, with 90.9% or 1,275 individuals in the labor force. Within the labor force, individuals with high school diploma education have the highest percentage of unemployment, with 5.2% or 79 of them being unemployed.
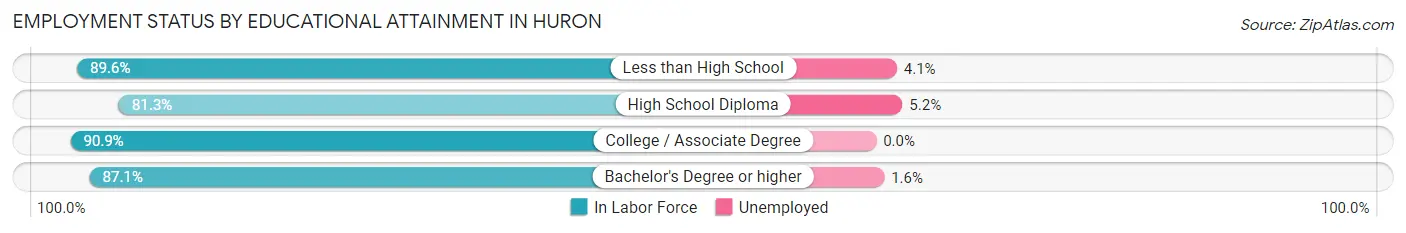
| Educational Attainment | In Labor Force | Unemployed |
| Less than High School | 960 (89.6%) | 44 (4.1%) |
| High School Diploma | 1,528 (81.3%) | 98 (5.2%) |
| College / Associate Degree | 1,275 (90.9%) | 0 (0.0%) |
| Bachelor's Degree or higher | 1,779 (87.1%) | 33 (1.6%) |
| Total | 5,544 (86.7%) | 166 (2.6%) |
Employment Occupations by Sex in Huron
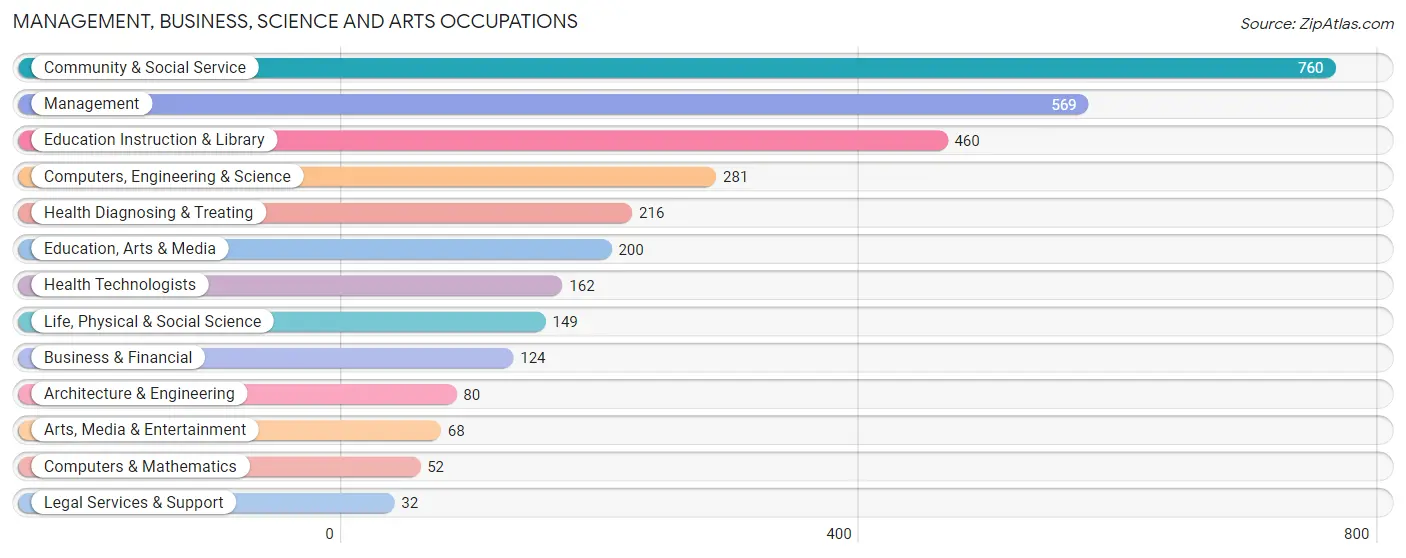
Management, Business, Science and Arts Occupations
The most common Management, Business, Science and Arts occupations in Huron are Community & Social Service (760 | 11.1%), Management (569 | 8.3%), Education Instruction & Library (460 | 6.7%), Computers, Engineering & Science (281 | 4.1%), and Health Diagnosing & Treating (216 | 3.2%).
Management, Business, Science and Arts Occupations by Sex
Within the Management, Business, Science and Arts occupations in Huron, the most male-oriented occupations are Computers & Mathematics (88.5%), Life, Physical & Social Science (81.9%), and Computers, Engineering & Science (81.9%), while the most female-oriented occupations are Education Instruction & Library (88.5%), Business & Financial (84.7%), and Community & Social Service (69.9%).
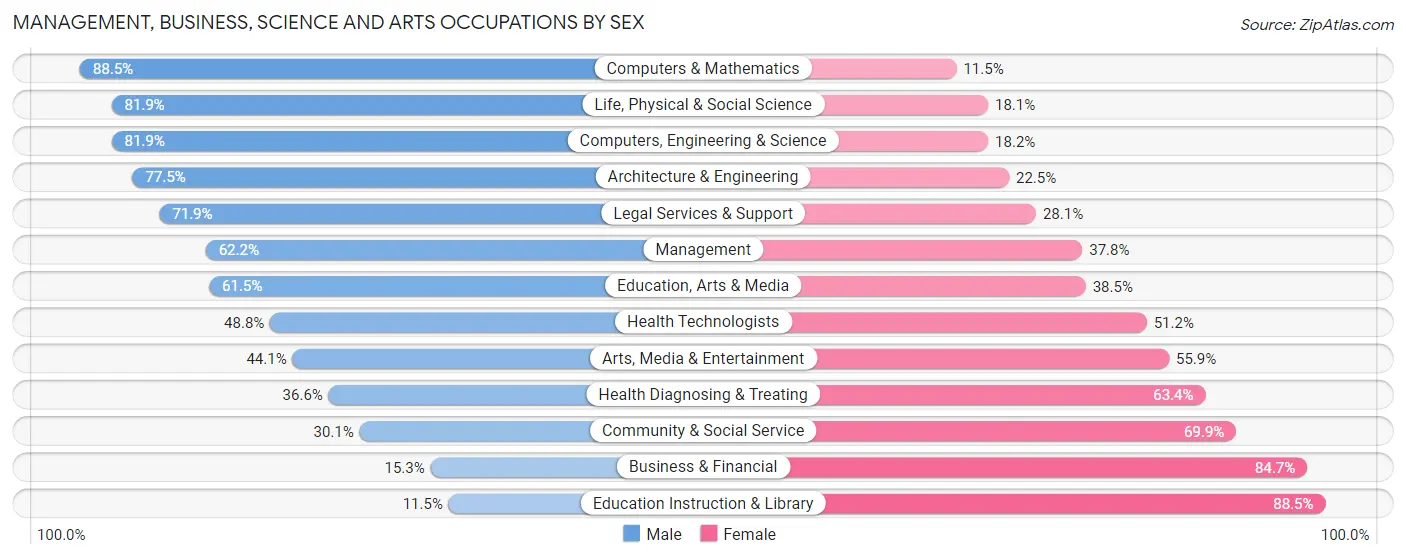
| Occupation | Male | Female |
| Management | 354 (62.2%) | 215 (37.8%) |
| Business & Financial | 19 (15.3%) | 105 (84.7%) |
| Computers, Engineering & Science | 230 (81.9%) | 51 (18.1%) |
| Computers & Mathematics | 46 (88.5%) | 6 (11.5%) |
| Architecture & Engineering | 62 (77.5%) | 18 (22.5%) |
| Life, Physical & Social Science | 122 (81.9%) | 27 (18.1%) |
| Community & Social Service | 229 (30.1%) | 531 (69.9%) |
| Education, Arts & Media | 123 (61.5%) | 77 (38.5%) |
| Legal Services & Support | 23 (71.9%) | 9 (28.1%) |
| Education Instruction & Library | 53 (11.5%) | 407 (88.5%) |
| Arts, Media & Entertainment | 30 (44.1%) | 38 (55.9%) |
| Health Diagnosing & Treating | 79 (36.6%) | 137 (63.4%) |
| Health Technologists | 79 (48.8%) | 83 (51.2%) |
| Total (Category) | 911 (46.7%) | 1,039 (53.3%) |
| Total (Overall) | 3,747 (54.8%) | 3,084 (45.2%) |
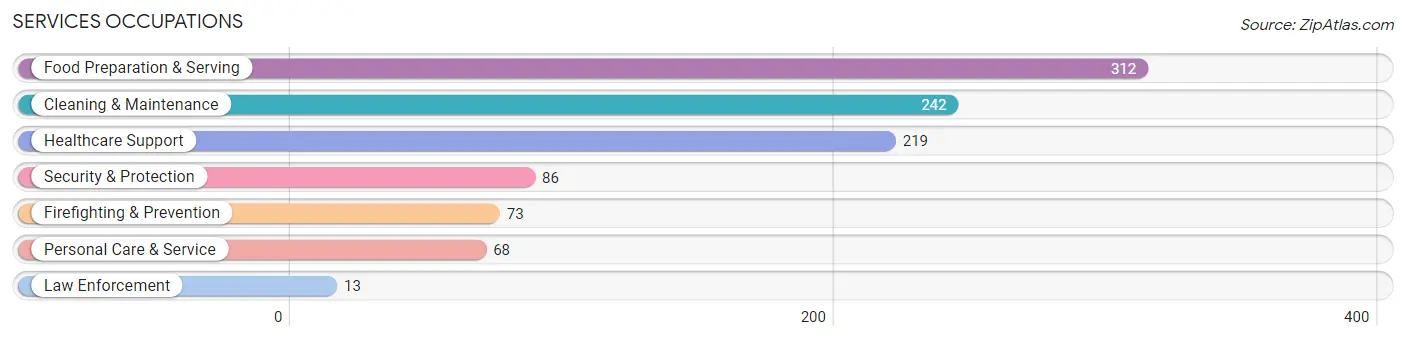
Services Occupations
The most common Services occupations in Huron are Food Preparation & Serving (312 | 4.6%), Cleaning & Maintenance (242 | 3.5%), Healthcare Support (219 | 3.2%), Security & Protection (86 | 1.3%), and Firefighting & Prevention (73 | 1.1%).
Services Occupations by Sex
Within the Services occupations in Huron, the most male-oriented occupations are Law Enforcement (100.0%), Security & Protection (66.3%), and Firefighting & Prevention (60.3%), while the most female-oriented occupations are Personal Care & Service (91.2%), Healthcare Support (72.6%), and Food Preparation & Serving (71.5%).
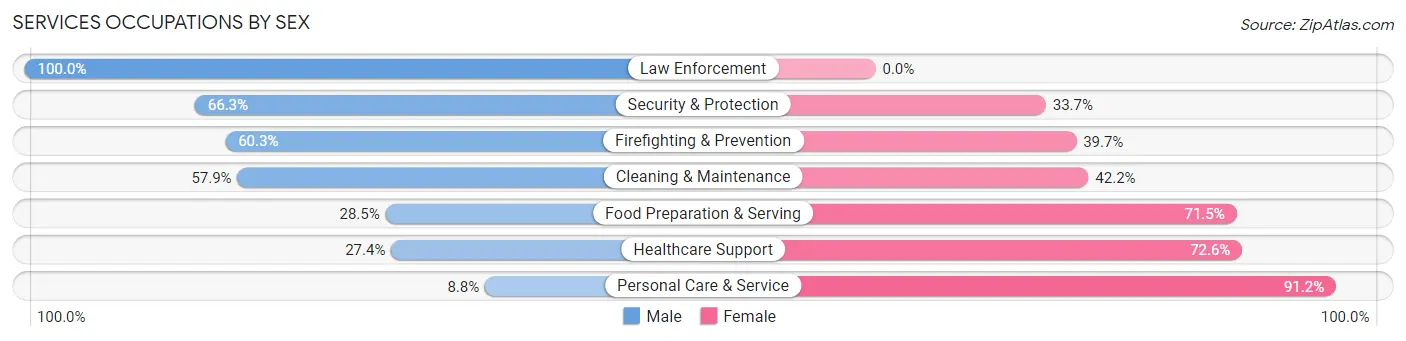
| Occupation | Male | Female |
| Healthcare Support | 60 (27.4%) | 159 (72.6%) |
| Security & Protection | 57 (66.3%) | 29 (33.7%) |
| Firefighting & Prevention | 44 (60.3%) | 29 (39.7%) |
| Law Enforcement | 13 (100.0%) | 0 (0.0%) |
| Food Preparation & Serving | 89 (28.5%) | 223 (71.5%) |
| Cleaning & Maintenance | 140 (57.9%) | 102 (42.1%) |
| Personal Care & Service | 6 (8.8%) | 62 (91.2%) |
| Total (Category) | 352 (38.0%) | 575 (62.0%) |
| Total (Overall) | 3,747 (54.8%) | 3,084 (45.2%) |
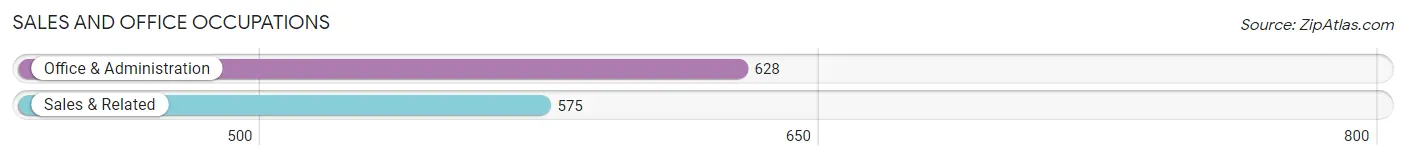
Sales and Office Occupations
The most common Sales and Office occupations in Huron are Office & Administration (628 | 9.2%), and Sales & Related (575 | 8.4%).
Sales and Office Occupations by Sex
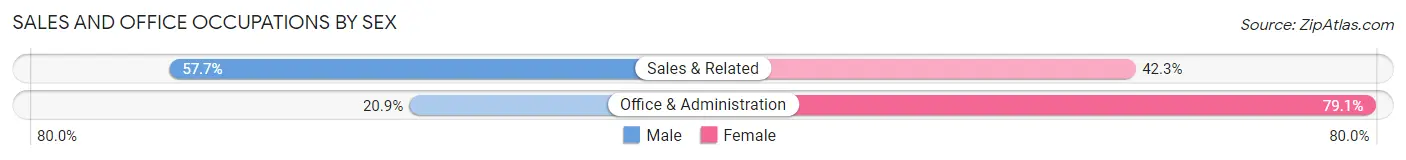
| Occupation | Male | Female |
| Sales & Related | 332 (57.7%) | 243 (42.3%) |
| Office & Administration | 131 (20.9%) | 497 (79.1%) |
| Total (Category) | 463 (38.5%) | 740 (61.5%) |
| Total (Overall) | 3,747 (54.8%) | 3,084 (45.2%) |
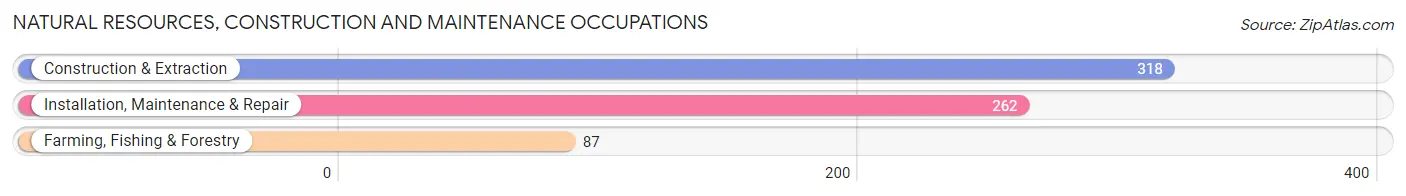
Natural Resources, Construction and Maintenance Occupations
The most common Natural Resources, Construction and Maintenance occupations in Huron are Construction & Extraction (318 | 4.7%), Installation, Maintenance & Repair (262 | 3.8%), and Farming, Fishing & Forestry (87 | 1.3%).
Natural Resources, Construction and Maintenance Occupations by Sex
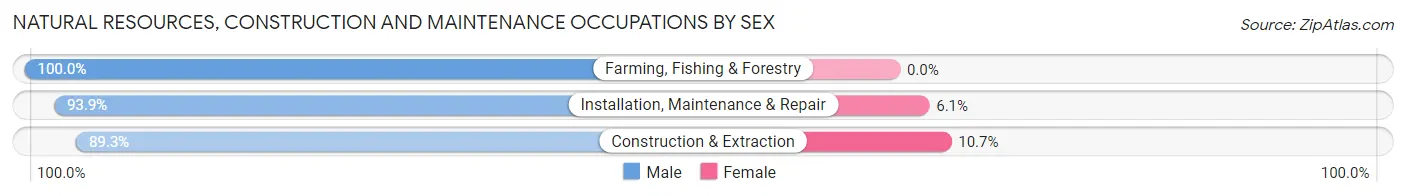
| Occupation | Male | Female |
| Farming, Fishing & Forestry | 87 (100.0%) | 0 (0.0%) |
| Construction & Extraction | 284 (89.3%) | 34 (10.7%) |
| Installation, Maintenance & Repair | 246 (93.9%) | 16 (6.1%) |
| Total (Category) | 617 (92.5%) | 50 (7.5%) |
| Total (Overall) | 3,747 (54.8%) | 3,084 (45.2%) |
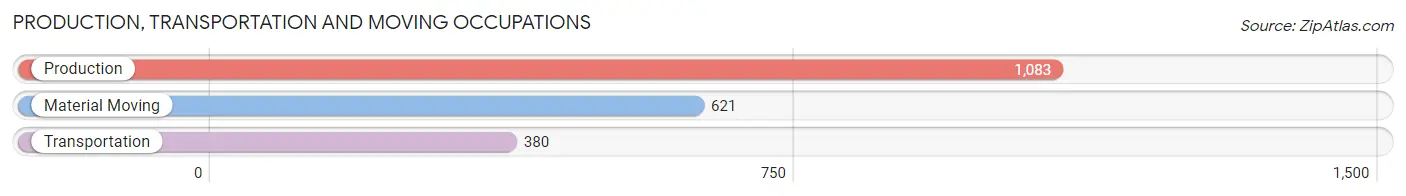
Production, Transportation and Moving Occupations
The most common Production, Transportation and Moving occupations in Huron are Production (1,083 | 15.9%), Material Moving (621 | 9.1%), and Transportation (380 | 5.6%).
Production, Transportation and Moving Occupations by Sex
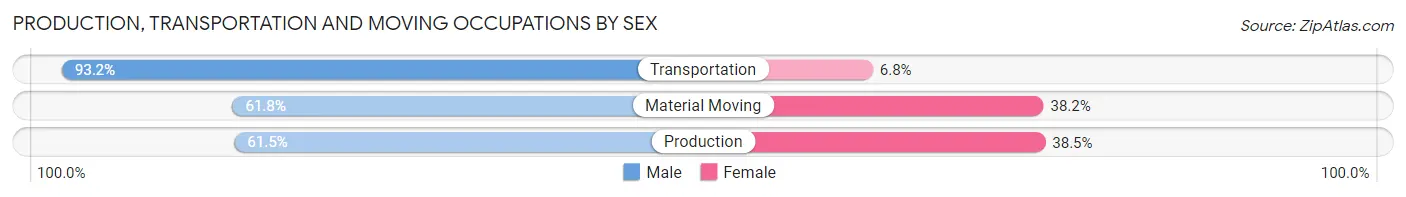
| Occupation | Male | Female |
| Production | 666 (61.5%) | 417 (38.5%) |
| Transportation | 354 (93.2%) | 26 (6.8%) |
| Material Moving | 384 (61.8%) | 237 (38.2%) |
| Total (Category) | 1,404 (67.4%) | 680 (32.6%) |
| Total (Overall) | 3,747 (54.8%) | 3,084 (45.2%) |
Employment Industries by Sex in Huron
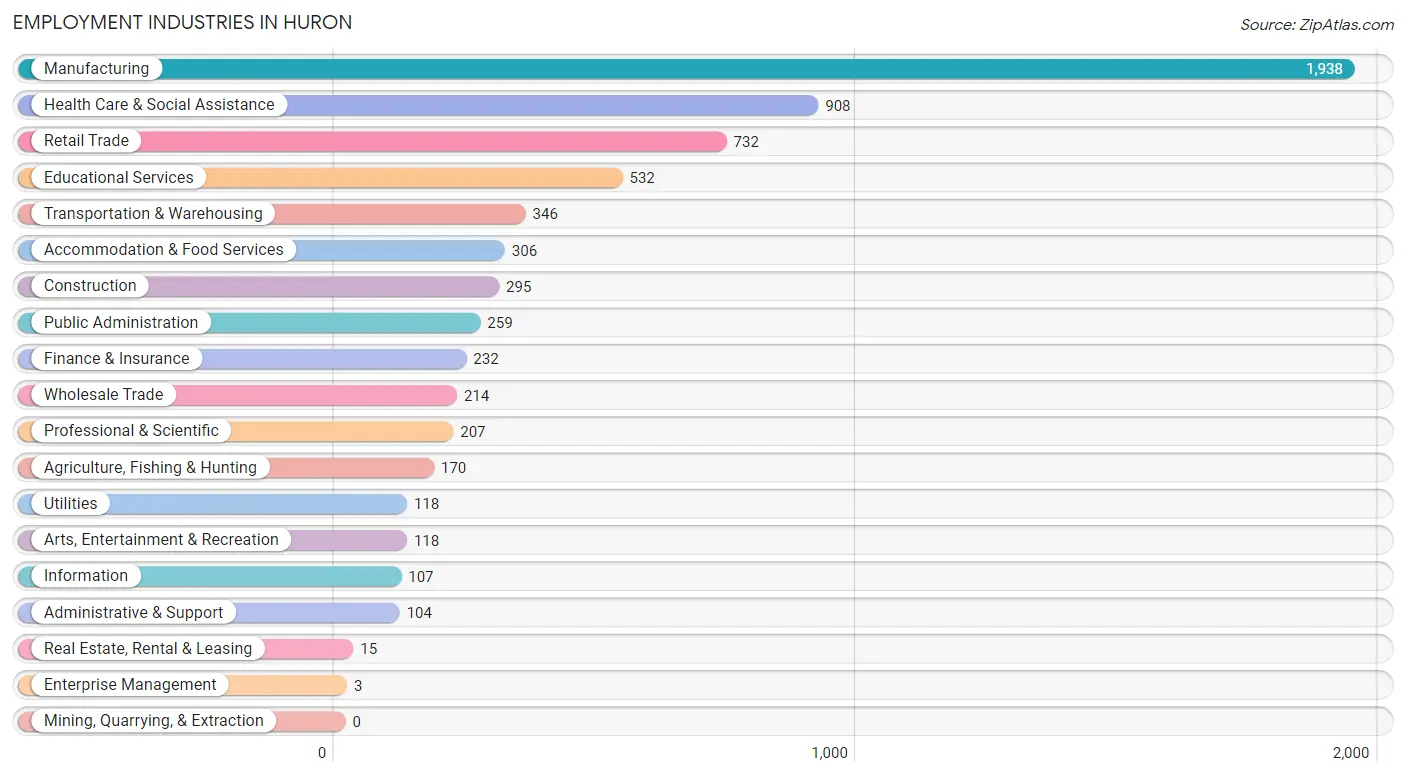
Employment Industries in Huron
The major employment industries in Huron include Manufacturing (1,938 | 28.4%), Health Care & Social Assistance (908 | 13.3%), Retail Trade (732 | 10.7%), Educational Services (532 | 7.8%), and Transportation & Warehousing (346 | 5.1%).
Employment Industries by Sex in Huron
The Huron industries that see more men than women are Real Estate, Rental & Leasing (100.0%), Agriculture, Fishing & Hunting (95.9%), and Construction (88.5%), whereas the industries that tend to have a higher number of women are Enterprise Management (100.0%), Educational Services (78.9%), and Accommodation & Food Services (73.9%).
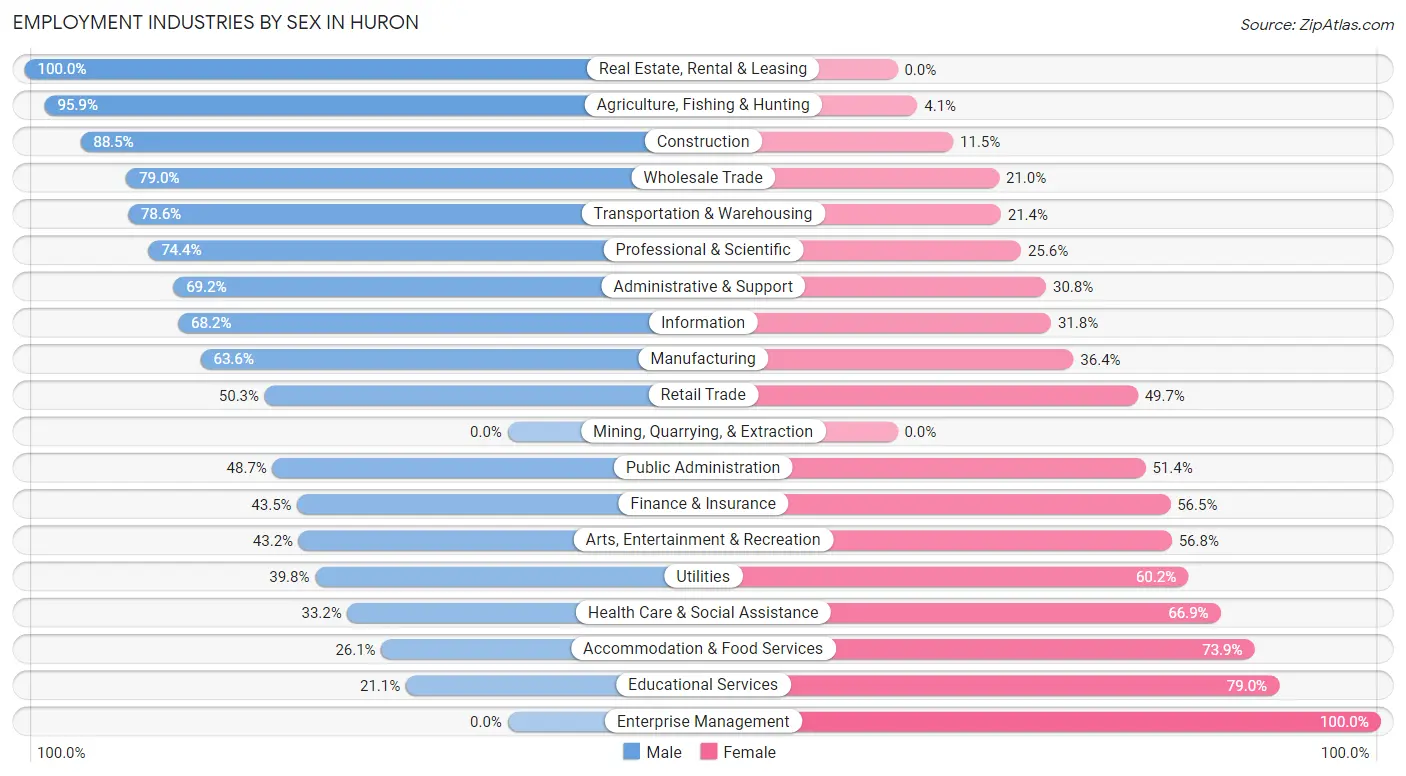
| Industry | Male | Female |
| Agriculture, Fishing & Hunting | 163 (95.9%) | 7 (4.1%) |
| Mining, Quarrying, & Extraction | 0 (0.0%) | 0 (0.0%) |
| Construction | 261 (88.5%) | 34 (11.5%) |
| Manufacturing | 1,232 (63.6%) | 706 (36.4%) |
| Wholesale Trade | 169 (79.0%) | 45 (21.0%) |
| Retail Trade | 368 (50.3%) | 364 (49.7%) |
| Transportation & Warehousing | 272 (78.6%) | 74 (21.4%) |
| Utilities | 47 (39.8%) | 71 (60.2%) |
| Information | 73 (68.2%) | 34 (31.8%) |
| Finance & Insurance | 101 (43.5%) | 131 (56.5%) |
| Real Estate, Rental & Leasing | 15 (100.0%) | 0 (0.0%) |
| Professional & Scientific | 154 (74.4%) | 53 (25.6%) |
| Enterprise Management | 0 (0.0%) | 3 (100.0%) |
| Administrative & Support | 72 (69.2%) | 32 (30.8%) |
| Educational Services | 112 (21.0%) | 420 (78.9%) |
| Health Care & Social Assistance | 301 (33.2%) | 607 (66.8%) |
| Arts, Entertainment & Recreation | 51 (43.2%) | 67 (56.8%) |
| Accommodation & Food Services | 80 (26.1%) | 226 (73.9%) |
| Public Administration | 126 (48.6%) | 133 (51.3%) |
| Total | 3,747 (54.8%) | 3,084 (45.2%) |
Education in Huron
School Enrollment in Huron
The most common levels of schooling among the 3,135 students in Huron are elementary school (1,113 | 35.5%), middle school (727 | 23.2%), and high school (515 | 16.4%).
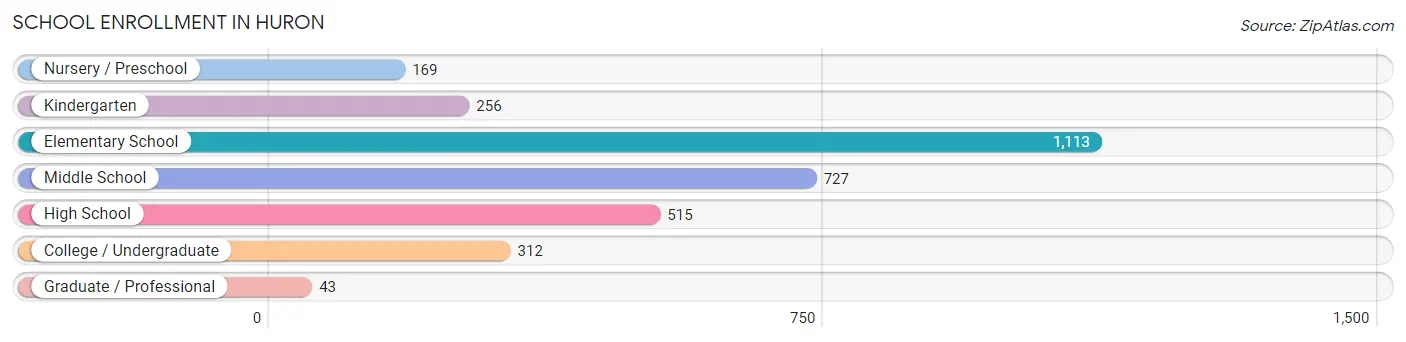
| School Level | # Students | % Students |
| Nursery / Preschool | 169 | 5.4% |
| Kindergarten | 256 | 8.2% |
| Elementary School | 1,113 | 35.5% |
| Middle School | 727 | 23.2% |
| High School | 515 | 16.4% |
| College / Undergraduate | 312 | 10.0% |
| Graduate / Professional | 43 | 1.4% |
| Total | 3,135 | 100.0% |
School Enrollment by Age by Funding Source in Huron
Out of a total of 3,135 students who are enrolled in schools in Huron, 498 (15.9%) attend a private institution, while the remaining 2,637 (84.1%) are enrolled in public schools. The age group of 5 to 9 year old has the highest likelihood of being enrolled in private schools, with 278 (22.5% in the age bracket) enrolled. Conversely, the age group of 20 to 24 year olds has the lowest likelihood of being enrolled in a private school, with 84 (100.0% in the age bracket) attending a public institution.
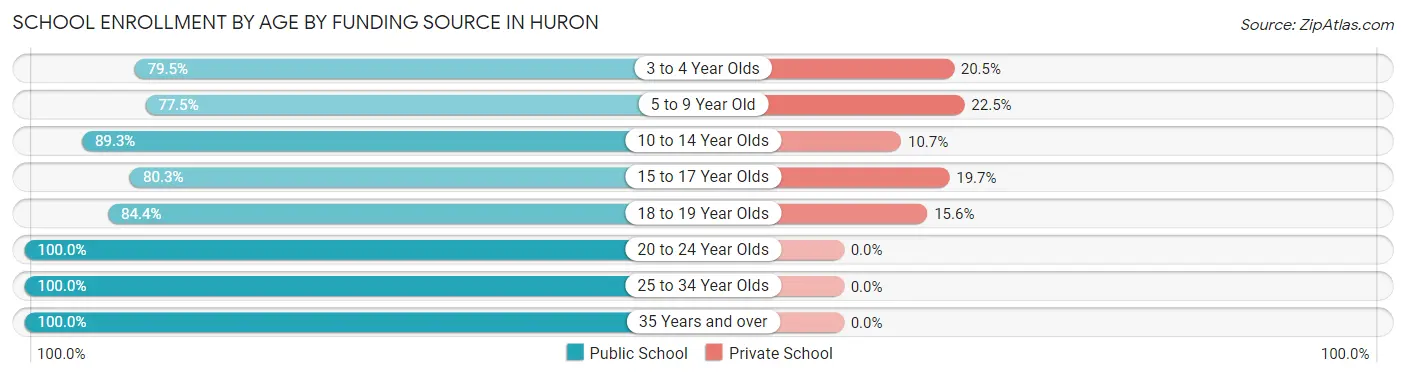
| Age Bracket | Public School | Private School |
| 3 to 4 Year Olds | 93 (79.5%) | 24 (20.5%) |
| 5 to 9 Year Old | 958 (77.5%) | 278 (22.5%) |
| 10 to 14 Year Olds | 877 (89.3%) | 105 (10.7%) |
| 15 to 17 Year Olds | 290 (80.3%) | 71 (19.7%) |
| 18 to 19 Year Olds | 103 (84.4%) | 19 (15.6%) |
| 20 to 24 Year Olds | 84 (100.0%) | 0 (0.0%) |
| 25 to 34 Year Olds | 17 (100.0%) | 0 (0.0%) |
| 35 Years and over | 216 (100.0%) | 0 (0.0%) |
| Total | 2,637 (84.1%) | 498 (15.9%) |
Educational Attainment by Field of Study in Huron
Education (639 | 24.6%), business (532 | 20.5%), science & technology (330 | 12.7%), liberal arts & history (168 | 6.5%), and literature & languages (160 | 6.1%) are the most common fields of study among 2,600 individuals in Huron who have obtained a bachelor's degree or higher.
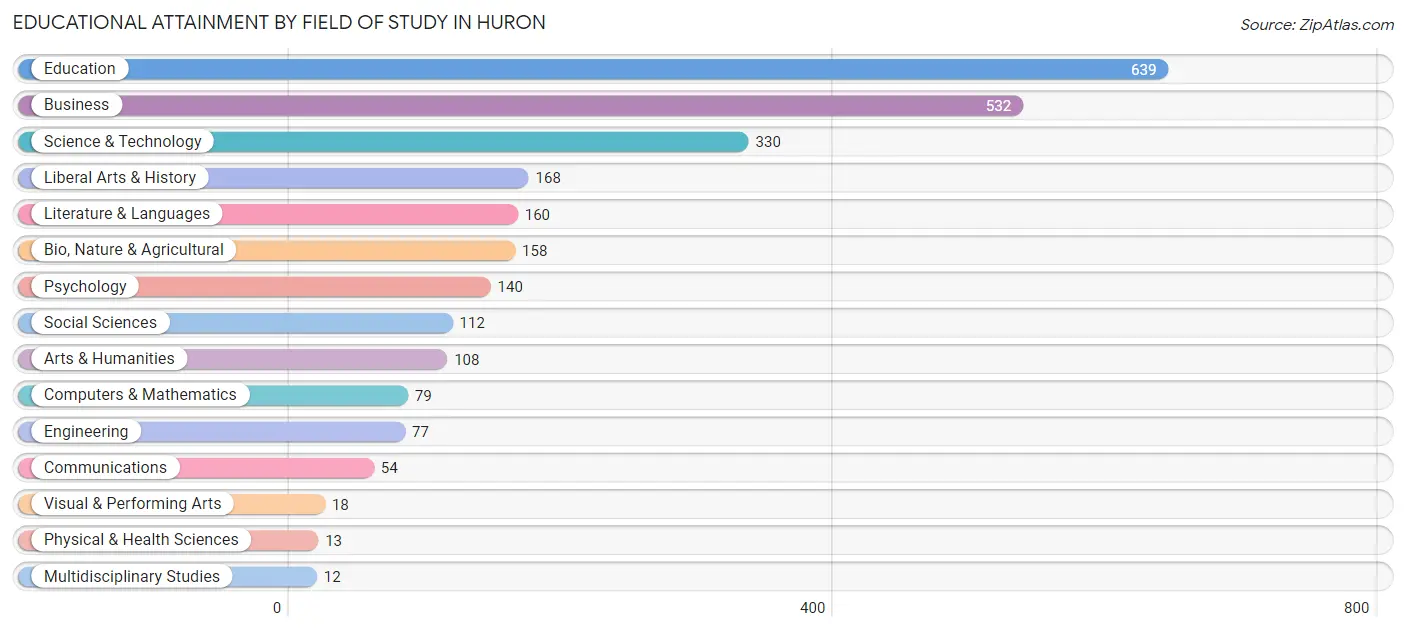
| Field of Study | # Graduates | % Graduates |
| Computers & Mathematics | 79 | 3.0% |
| Bio, Nature & Agricultural | 158 | 6.1% |
| Physical & Health Sciences | 13 | 0.5% |
| Psychology | 140 | 5.4% |
| Social Sciences | 112 | 4.3% |
| Engineering | 77 | 3.0% |
| Multidisciplinary Studies | 12 | 0.5% |
| Science & Technology | 330 | 12.7% |
| Business | 532 | 20.5% |
| Education | 639 | 24.6% |
| Literature & Languages | 160 | 6.1% |
| Liberal Arts & History | 168 | 6.5% |
| Visual & Performing Arts | 18 | 0.7% |
| Communications | 54 | 2.1% |
| Arts & Humanities | 108 | 4.2% |
| Total | 2,600 | 100.0% |
Transportation & Commute in Huron
Vehicle Availability by Sex in Huron
The most prevalent vehicle ownership categories in Huron are males with 2 vehicles (1,378, accounting for 38.3%) and females with 2 vehicles (1,073, making up 46.5%).
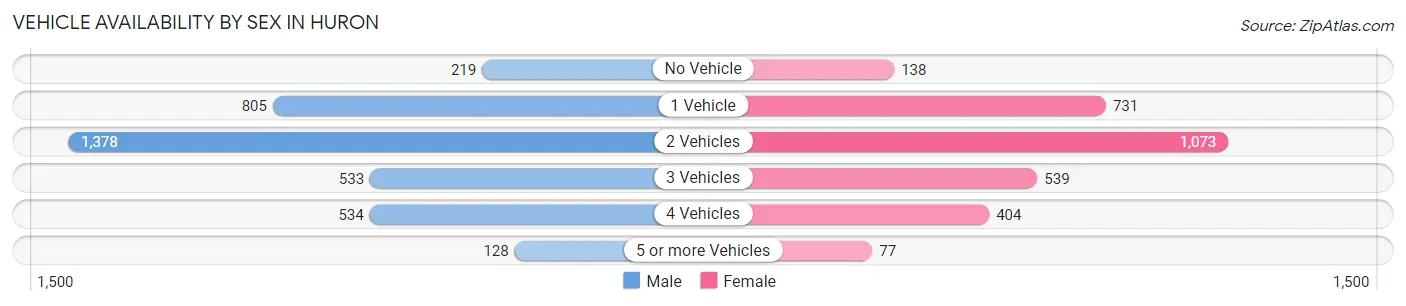
| Vehicles Available | Male | Female |
| No Vehicle | 219 (6.1%) | 138 (4.7%) |
| 1 Vehicle | 805 (22.4%) | 731 (24.7%) |
| 2 Vehicles | 1,378 (38.3%) | 1,073 (36.2%) |
| 3 Vehicles | 533 (14.8%) | 539 (18.2%) |
| 4 Vehicles | 534 (14.8%) | 404 (13.6%) |
| 5 or more Vehicles | 128 (3.6%) | 77 (2.6%) |
| Total | 3,597 (100.0%) | 2,962 (100.0%) |
Commute Time in Huron
The most frequently occuring commute durations in Huron are 5 to 9 minutes (2,210 commuters, 34.2%), 10 to 14 minutes (2,165 commuters, 33.5%), and 15 to 19 minutes (596 commuters, 9.2%).
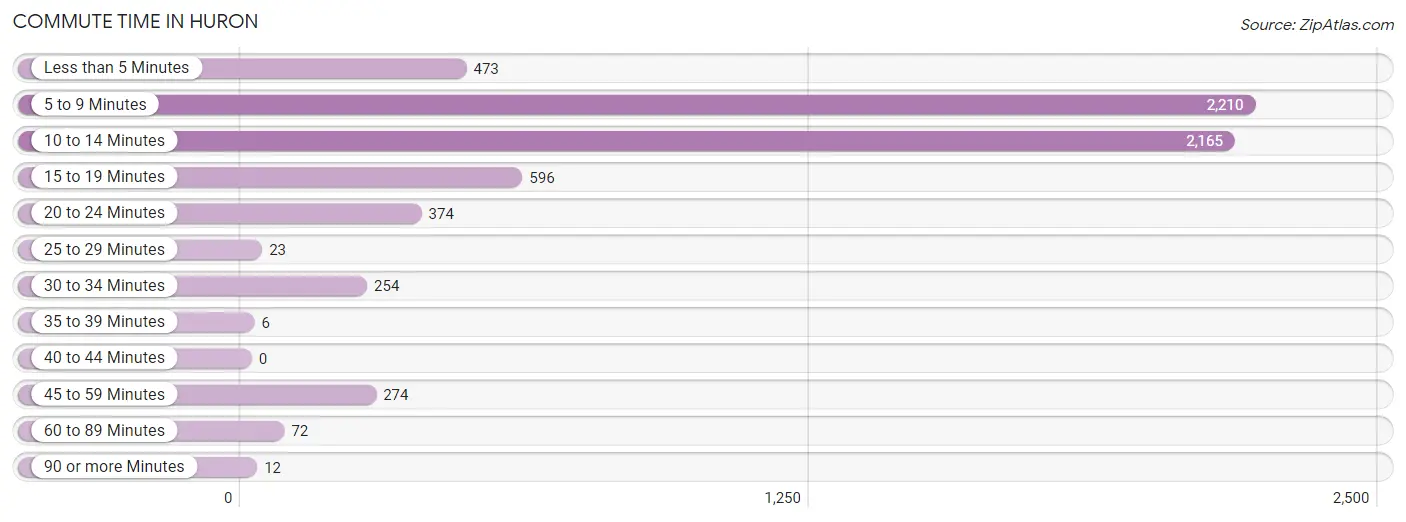
| Commute Time | # Commuters | % Commuters |
| Less than 5 Minutes | 473 | 7.3% |
| 5 to 9 Minutes | 2,210 | 34.2% |
| 10 to 14 Minutes | 2,165 | 33.5% |
| 15 to 19 Minutes | 596 | 9.2% |
| 20 to 24 Minutes | 374 | 5.8% |
| 25 to 29 Minutes | 23 | 0.4% |
| 30 to 34 Minutes | 254 | 3.9% |
| 35 to 39 Minutes | 6 | 0.1% |
| 40 to 44 Minutes | 0 | 0.0% |
| 45 to 59 Minutes | 274 | 4.2% |
| 60 to 89 Minutes | 72 | 1.1% |
| 90 or more Minutes | 12 | 0.2% |
Commute Time by Sex in Huron
The most common commute times in Huron are 10 to 14 minutes (1,372 commuters, 38.2%) for males and 5 to 9 minutes (1,184 commuters, 41.4%) for females.
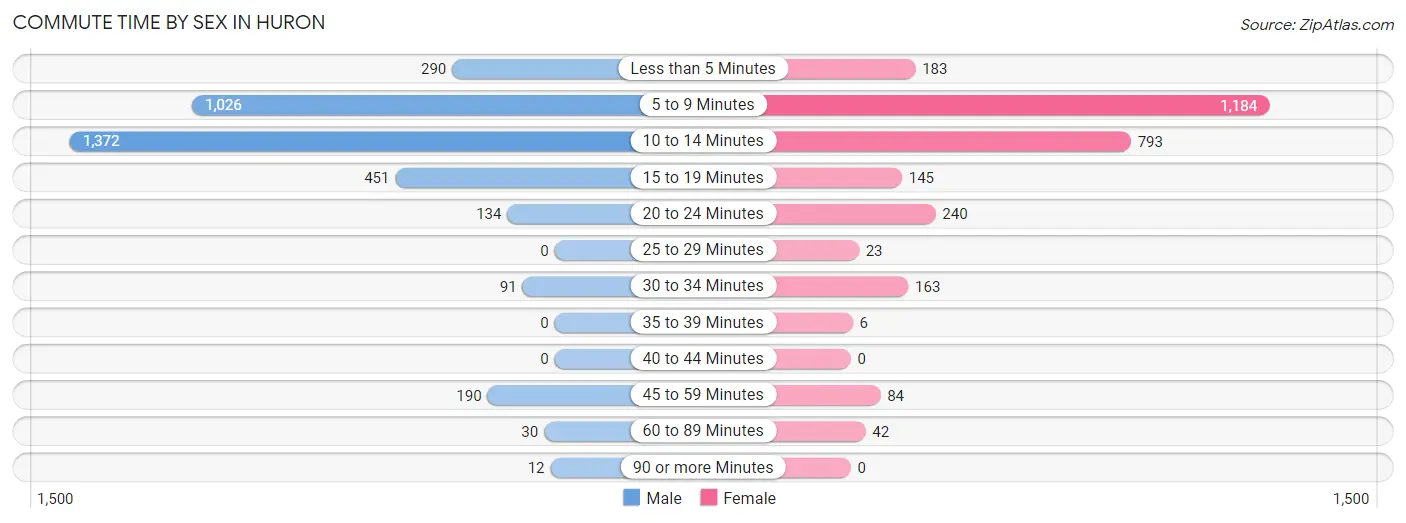
| Commute Time | Male | Female |
| Less than 5 Minutes | 290 (8.1%) | 183 (6.4%) |
| 5 to 9 Minutes | 1,026 (28.5%) | 1,184 (41.4%) |
| 10 to 14 Minutes | 1,372 (38.2%) | 793 (27.7%) |
| 15 to 19 Minutes | 451 (12.5%) | 145 (5.1%) |
| 20 to 24 Minutes | 134 (3.7%) | 240 (8.4%) |
| 25 to 29 Minutes | 0 (0.0%) | 23 (0.8%) |
| 30 to 34 Minutes | 91 (2.5%) | 163 (5.7%) |
| 35 to 39 Minutes | 0 (0.0%) | 6 (0.2%) |
| 40 to 44 Minutes | 0 (0.0%) | 0 (0.0%) |
| 45 to 59 Minutes | 190 (5.3%) | 84 (2.9%) |
| 60 to 89 Minutes | 30 (0.8%) | 42 (1.5%) |
| 90 or more Minutes | 12 (0.3%) | 0 (0.0%) |
Time of Departure to Work by Sex in Huron
The most frequent times of departure to work in Huron are 7:30 AM to 7:59 AM (644, 17.9%) for males and 7:30 AM to 7:59 AM (542, 18.9%) for females.
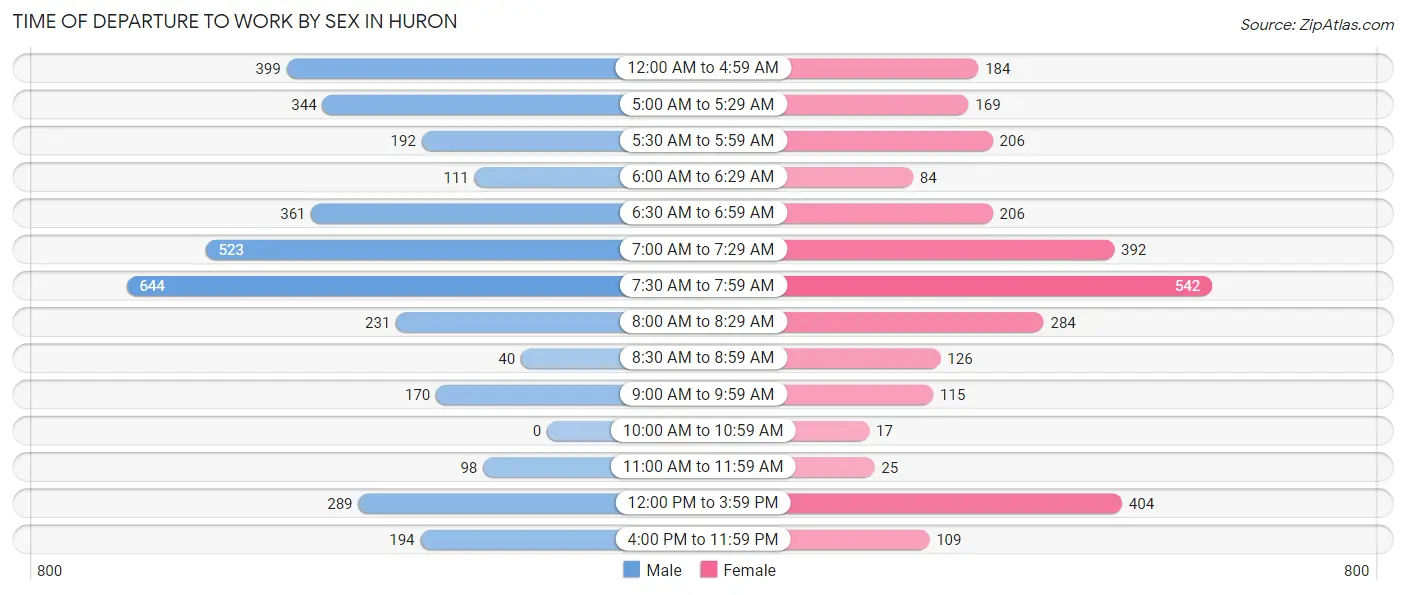
| Time of Departure | Male | Female |
| 12:00 AM to 4:59 AM | 399 (11.1%) | 184 (6.4%) |
| 5:00 AM to 5:29 AM | 344 (9.6%) | 169 (5.9%) |
| 5:30 AM to 5:59 AM | 192 (5.3%) | 206 (7.2%) |
| 6:00 AM to 6:29 AM | 111 (3.1%) | 84 (2.9%) |
| 6:30 AM to 6:59 AM | 361 (10.0%) | 206 (7.2%) |
| 7:00 AM to 7:29 AM | 523 (14.5%) | 392 (13.7%) |
| 7:30 AM to 7:59 AM | 644 (17.9%) | 542 (18.9%) |
| 8:00 AM to 8:29 AM | 231 (6.4%) | 284 (9.9%) |
| 8:30 AM to 8:59 AM | 40 (1.1%) | 126 (4.4%) |
| 9:00 AM to 9:59 AM | 170 (4.7%) | 115 (4.0%) |
| 10:00 AM to 10:59 AM | 0 (0.0%) | 17 (0.6%) |
| 11:00 AM to 11:59 AM | 98 (2.7%) | 25 (0.9%) |
| 12:00 PM to 3:59 PM | 289 (8.0%) | 404 (14.1%) |
| 4:00 PM to 11:59 PM | 194 (5.4%) | 109 (3.8%) |
| Total | 3,596 (100.0%) | 2,863 (100.0%) |
Housing Occupancy in Huron
Occupancy by Ownership in Huron
Of the total 5,489 dwellings in Huron, owner-occupied units account for 3,562 (64.9%), while renter-occupied units make up 1,927 (35.1%).
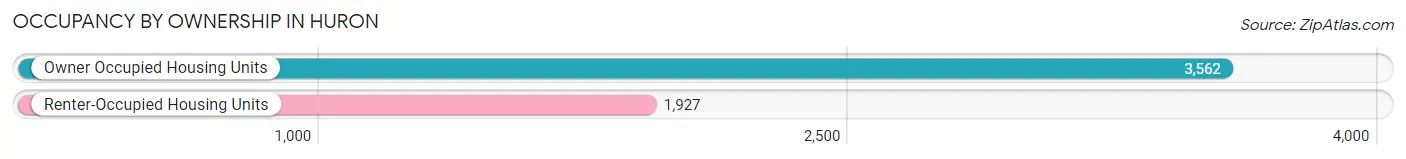
| Occupancy | # Housing Units | % Housing Units |
| Owner Occupied Housing Units | 3,562 | 64.9% |
| Renter-Occupied Housing Units | 1,927 | 35.1% |
| Total Occupied Housing Units | 5,489 | 100.0% |
Occupancy by Household Size in Huron
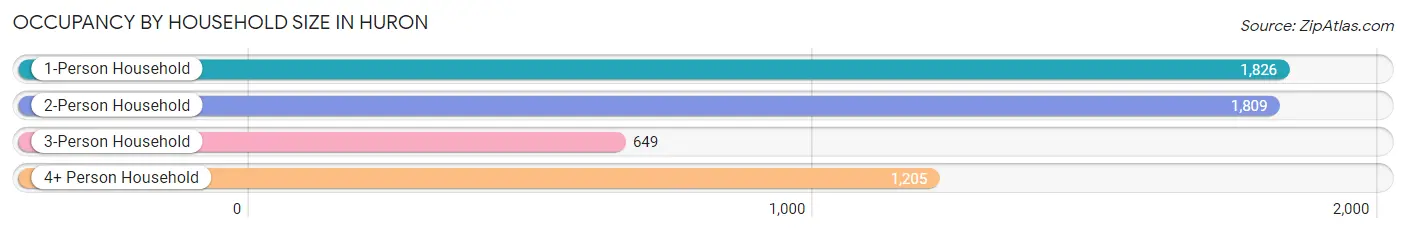
| Household Size | # Housing Units | % Housing Units |
| 1-Person Household | 1,826 | 33.3% |
| 2-Person Household | 1,809 | 33.0% |
| 3-Person Household | 649 | 11.8% |
| 4+ Person Household | 1,205 | 22.0% |
| Total Housing Units | 5,489 | 100.0% |
Occupancy by Ownership by Household Size in Huron
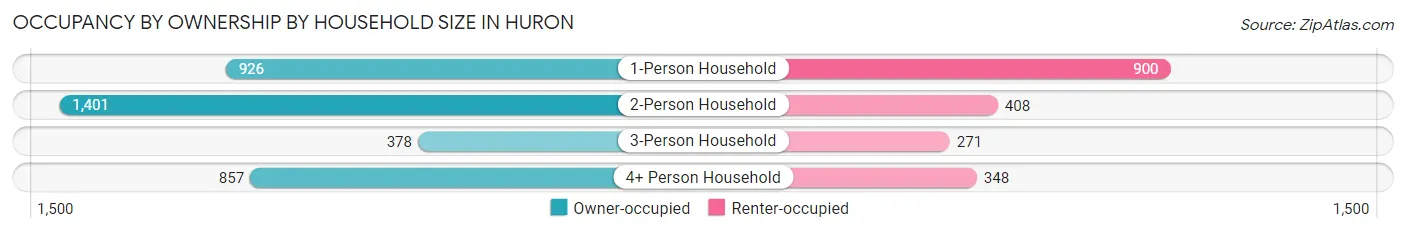
| Household Size | Owner-occupied | Renter-occupied |
| 1-Person Household | 926 (50.7%) | 900 (49.3%) |
| 2-Person Household | 1,401 (77.4%) | 408 (22.6%) |
| 3-Person Household | 378 (58.2%) | 271 (41.8%) |
| 4+ Person Household | 857 (71.1%) | 348 (28.9%) |
| Total Housing Units | 3,562 (64.9%) | 1,927 (35.1%) |
Occupancy by Educational Attainment in Huron
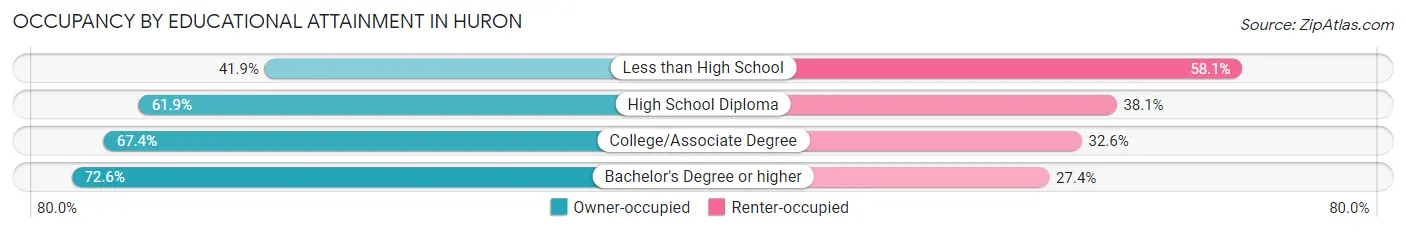
| Household Size | Owner-occupied | Renter-occupied |
| Less than High School | 184 (41.9%) | 255 (58.1%) |
| High School Diploma | 1,208 (61.9%) | 744 (38.1%) |
| College/Associate Degree | 1,025 (67.4%) | 495 (32.6%) |
| Bachelor's Degree or higher | 1,145 (72.6%) | 433 (27.4%) |
Occupancy by Age of Householder in Huron
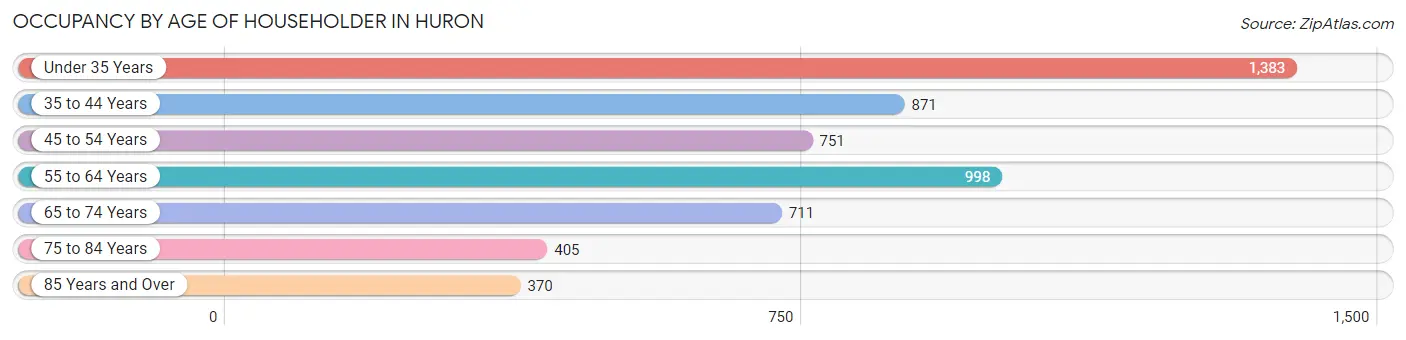
| Age Bracket | # Households | % Households |
| Under 35 Years | 1,383 | 25.2% |
| 35 to 44 Years | 871 | 15.9% |
| 45 to 54 Years | 751 | 13.7% |
| 55 to 64 Years | 998 | 18.2% |
| 65 to 74 Years | 711 | 13.0% |
| 75 to 84 Years | 405 | 7.4% |
| 85 Years and Over | 370 | 6.7% |
| Total | 5,489 | 100.0% |
Housing Finances in Huron
Median Income by Occupancy in Huron
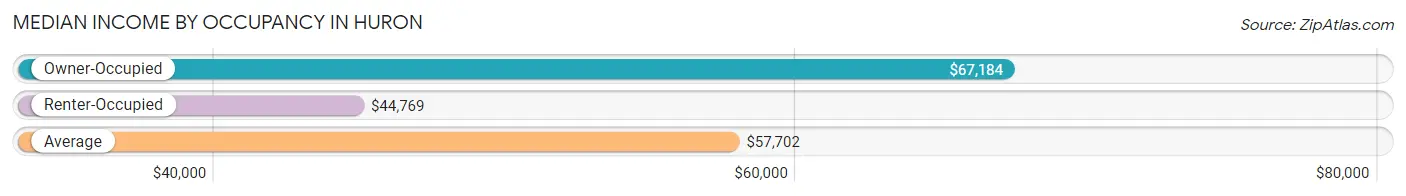
| Occupancy Type | # Households | Median Income |
| Owner-Occupied | 3,562 (64.9%) | $67,184 |
| Renter-Occupied | 1,927 (35.1%) | $44,769 |
| Average | 5,489 (100.0%) | $57,702 |
Occupancy by Householder Income Bracket in Huron
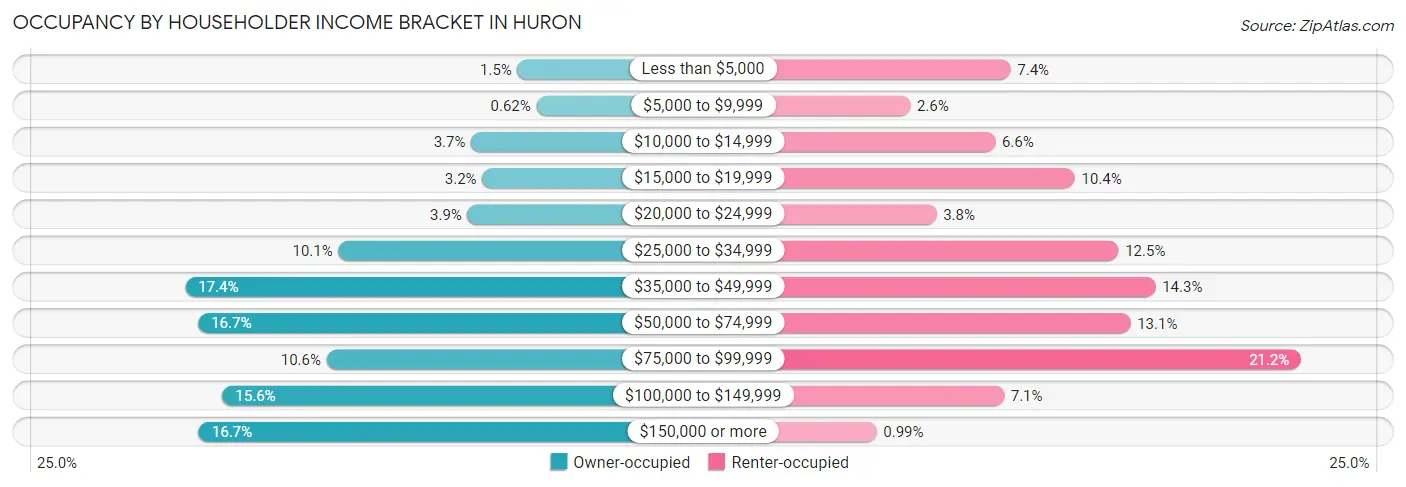
| Income Bracket | Owner-occupied | Renter-occupied |
| Less than $5,000 | 54 (1.5%) | 142 (7.4%) |
| $5,000 to $9,999 | 22 (0.6%) | 50 (2.6%) |
| $10,000 to $14,999 | 133 (3.7%) | 128 (6.6%) |
| $15,000 to $19,999 | 114 (3.2%) | 201 (10.4%) |
| $20,000 to $24,999 | 139 (3.9%) | 74 (3.8%) |
| $25,000 to $34,999 | 358 (10.1%) | 241 (12.5%) |
| $35,000 to $49,999 | 618 (17.3%) | 275 (14.3%) |
| $50,000 to $74,999 | 596 (16.7%) | 252 (13.1%) |
| $75,000 to $99,999 | 378 (10.6%) | 409 (21.2%) |
| $100,000 to $149,999 | 555 (15.6%) | 136 (7.1%) |
| $150,000 or more | 595 (16.7%) | 19 (1.0%) |
| Total | 3,562 (100.0%) | 1,927 (100.0%) |
Monthly Housing Cost Tiers in Huron
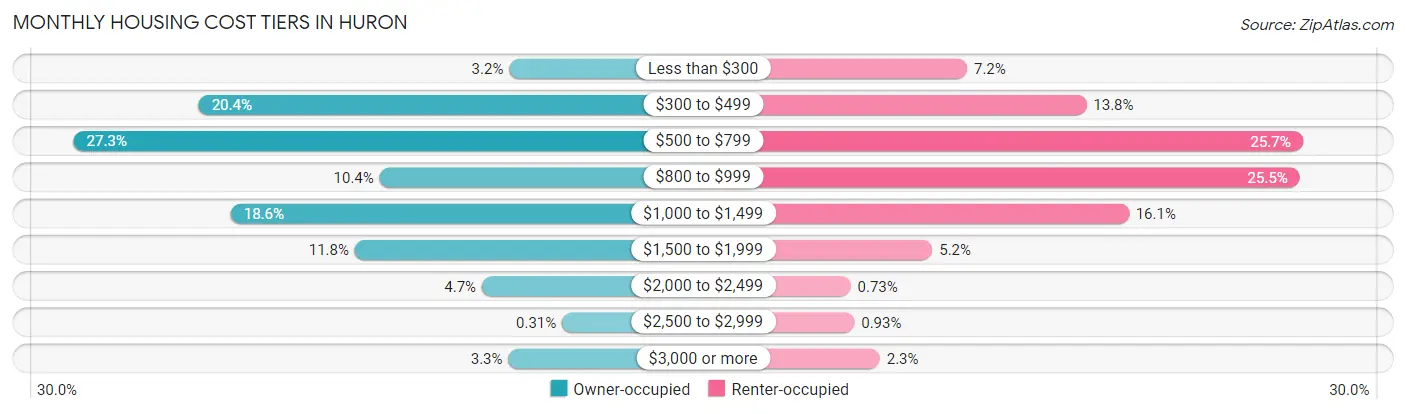
| Monthly Cost | Owner-occupied | Renter-occupied |
| Less than $300 | 115 (3.2%) | 138 (7.2%) |
| $300 to $499 | 726 (20.4%) | 265 (13.8%) |
| $500 to $799 | 972 (27.3%) | 495 (25.7%) |
| $800 to $999 | 370 (10.4%) | 492 (25.5%) |
| $1,000 to $1,499 | 663 (18.6%) | 310 (16.1%) |
| $1,500 to $1,999 | 419 (11.8%) | 101 (5.2%) |
| $2,000 to $2,499 | 169 (4.7%) | 14 (0.7%) |
| $2,500 to $2,999 | 11 (0.3%) | 18 (0.9%) |
| $3,000 or more | 117 (3.3%) | 45 (2.3%) |
| Total | 3,562 (100.0%) | 1,927 (100.0%) |
Physical Housing Characteristics in Huron
Housing Structures in Huron
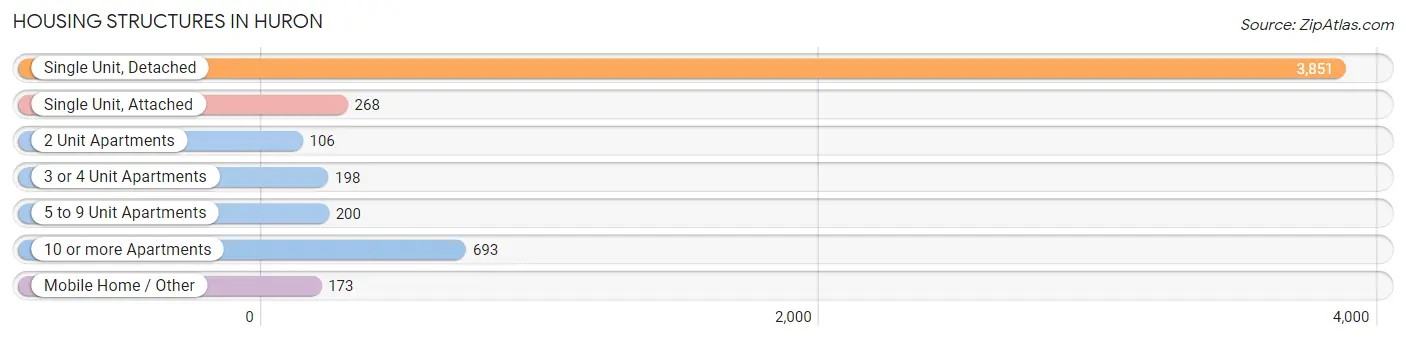
| Structure Type | # Housing Units | % Housing Units |
| Single Unit, Detached | 3,851 | 70.2% |
| Single Unit, Attached | 268 | 4.9% |
| 2 Unit Apartments | 106 | 1.9% |
| 3 or 4 Unit Apartments | 198 | 3.6% |
| 5 to 9 Unit Apartments | 200 | 3.6% |
| 10 or more Apartments | 693 | 12.6% |
| Mobile Home / Other | 173 | 3.2% |
| Total | 5,489 | 100.0% |
Housing Structures by Occupancy in Huron
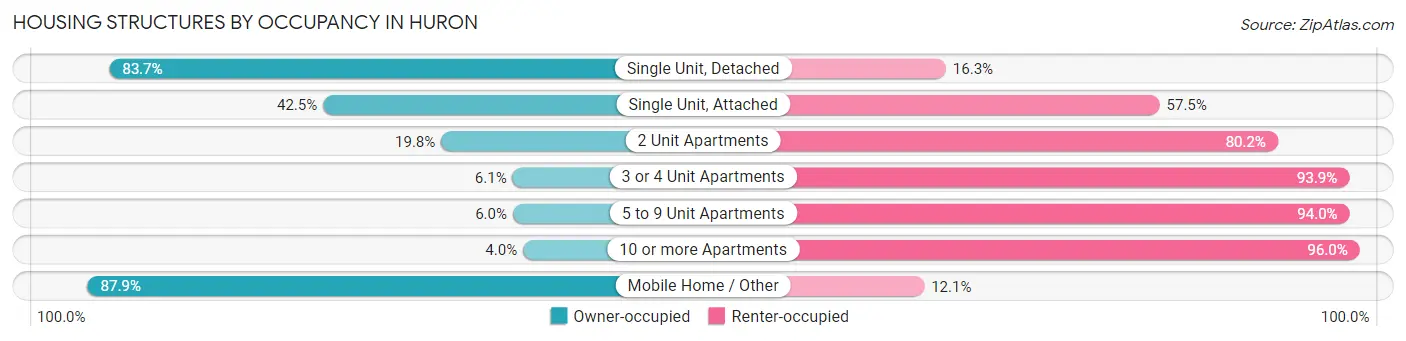
| Structure Type | Owner-occupied | Renter-occupied |
| Single Unit, Detached | 3,223 (83.7%) | 628 (16.3%) |
| Single Unit, Attached | 114 (42.5%) | 154 (57.5%) |
| 2 Unit Apartments | 21 (19.8%) | 85 (80.2%) |
| 3 or 4 Unit Apartments | 12 (6.1%) | 186 (93.9%) |
| 5 to 9 Unit Apartments | 12 (6.0%) | 188 (94.0%) |
| 10 or more Apartments | 28 (4.0%) | 665 (96.0%) |
| Mobile Home / Other | 152 (87.9%) | 21 (12.1%) |
| Total | 3,562 (64.9%) | 1,927 (35.1%) |
Housing Structures by Number of Rooms in Huron
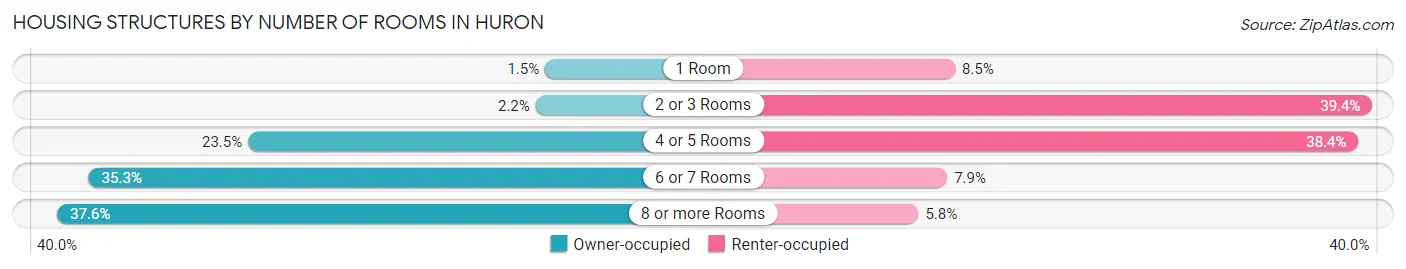
| Number of Rooms | Owner-occupied | Renter-occupied |
| 1 Room | 53 (1.5%) | 164 (8.5%) |
| 2 or 3 Rooms | 78 (2.2%) | 759 (39.4%) |
| 4 or 5 Rooms | 836 (23.5%) | 739 (38.4%) |
| 6 or 7 Rooms | 1,256 (35.3%) | 153 (7.9%) |
| 8 or more Rooms | 1,339 (37.6%) | 112 (5.8%) |
| Total | 3,562 (100.0%) | 1,927 (100.0%) |
Housing Structure by Heating Type in Huron
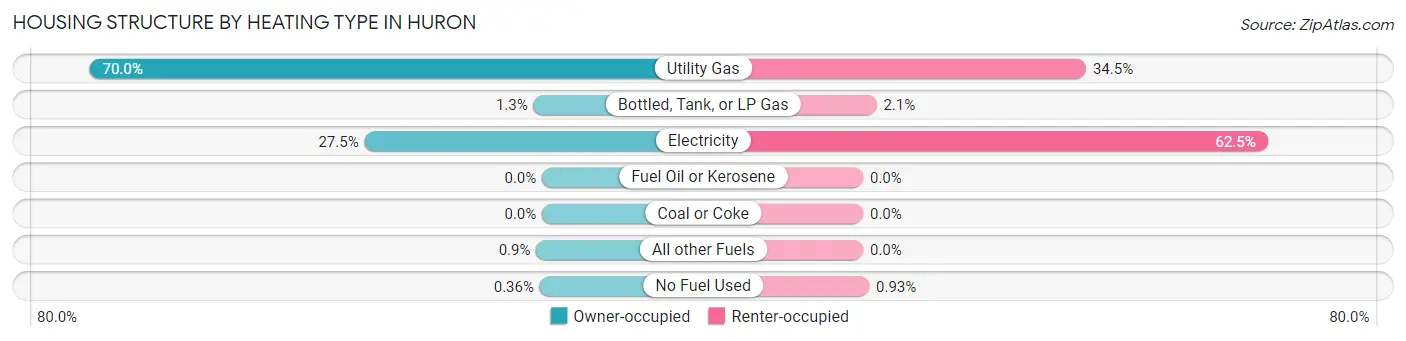
| Heating Type | Owner-occupied | Renter-occupied |
| Utility Gas | 2,492 (70.0%) | 664 (34.5%) |
| Bottled, Tank, or LP Gas | 47 (1.3%) | 40 (2.1%) |
| Electricity | 978 (27.5%) | 1,205 (62.5%) |
| Fuel Oil or Kerosene | 0 (0.0%) | 0 (0.0%) |
| Coal or Coke | 0 (0.0%) | 0 (0.0%) |
| All other Fuels | 32 (0.9%) | 0 (0.0%) |
| No Fuel Used | 13 (0.4%) | 18 (0.9%) |
| Total | 3,562 (100.0%) | 1,927 (100.0%) |
Household Vehicle Usage in Huron
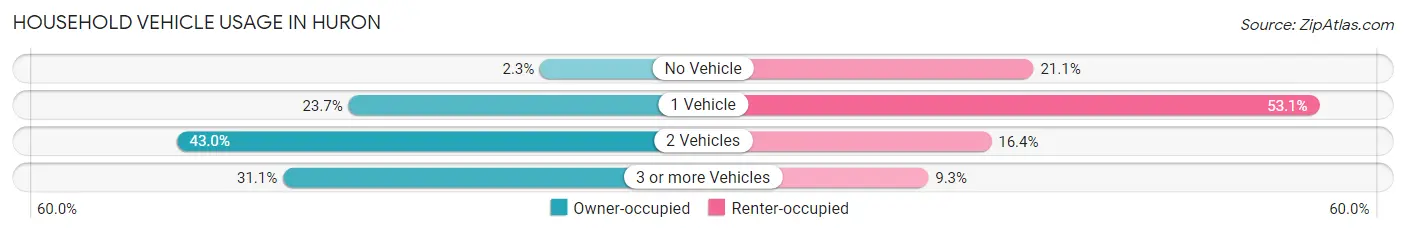
| Vehicles per Household | Owner-occupied | Renter-occupied |
| No Vehicle | 80 (2.2%) | 407 (21.1%) |
| 1 Vehicle | 845 (23.7%) | 1,024 (53.1%) |
| 2 Vehicles | 1,531 (43.0%) | 316 (16.4%) |
| 3 or more Vehicles | 1,106 (31.0%) | 180 (9.3%) |
| Total | 3,562 (100.0%) | 1,927 (100.0%) |
Real Estate & Mortgages in Huron
Real Estate and Mortgage Overview in Huron
| Characteristic | Without Mortgage | With Mortgage |
| Housing Units | 1,763 | 1,799 |
| Median Property Value | $97,600 | $171,300 |
| Median Household Income | $47,668 | $489 |
| Monthly Housing Costs | $515 | $117 |
| Real Estate Taxes | $1,507 | $42 |
Property Value by Mortgage Status in Huron
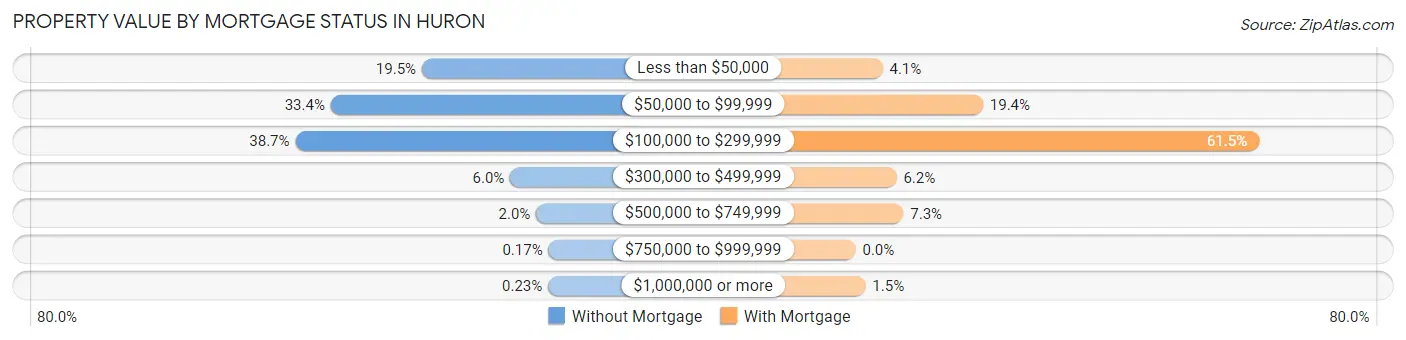
| Property Value | Without Mortgage | With Mortgage |
| Less than $50,000 | 343 (19.5%) | 74 (4.1%) |
| $50,000 to $99,999 | 588 (33.4%) | 349 (19.4%) |
| $100,000 to $299,999 | 683 (38.7%) | 1,106 (61.5%) |
| $300,000 to $499,999 | 106 (6.0%) | 112 (6.2%) |
| $500,000 to $749,999 | 36 (2.0%) | 131 (7.3%) |
| $750,000 to $999,999 | 3 (0.2%) | 0 (0.0%) |
| $1,000,000 or more | 4 (0.2%) | 27 (1.5%) |
| Total | 1,763 (100.0%) | 1,799 (100.0%) |
Household Income by Mortgage Status in Huron
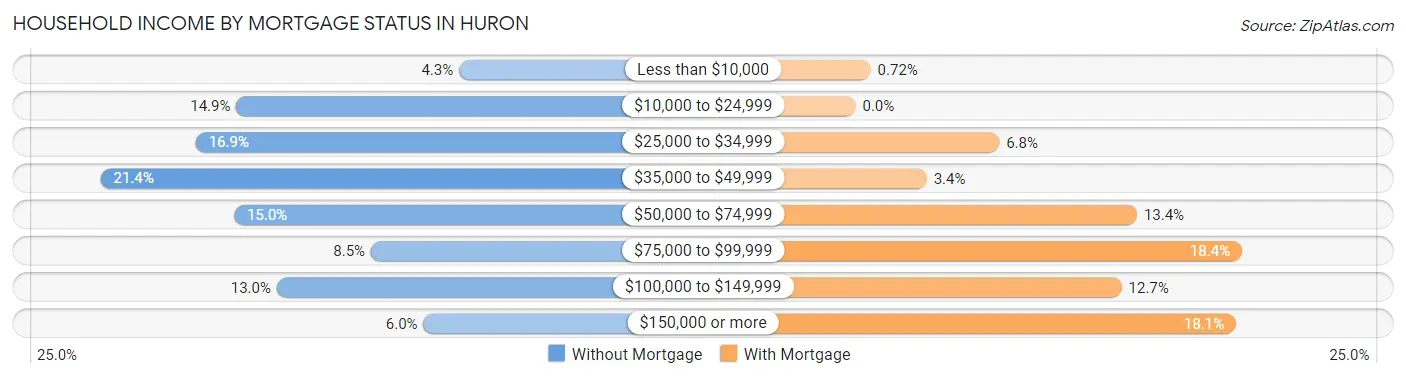
| Household Income | Without Mortgage | With Mortgage |
| Less than $10,000 | 76 (4.3%) | 13 (0.7%) |
| $10,000 to $24,999 | 263 (14.9%) | 0 (0.0%) |
| $25,000 to $34,999 | 297 (16.9%) | 123 (6.8%) |
| $35,000 to $49,999 | 377 (21.4%) | 61 (3.4%) |
| $50,000 to $74,999 | 265 (15.0%) | 241 (13.4%) |
| $75,000 to $99,999 | 150 (8.5%) | 331 (18.4%) |
| $100,000 to $149,999 | 229 (13.0%) | 228 (12.7%) |
| $150,000 or more | 106 (6.0%) | 326 (18.1%) |
| Total | 1,763 (100.0%) | 1,799 (100.0%) |
Property Value to Household Income Ratio in Huron
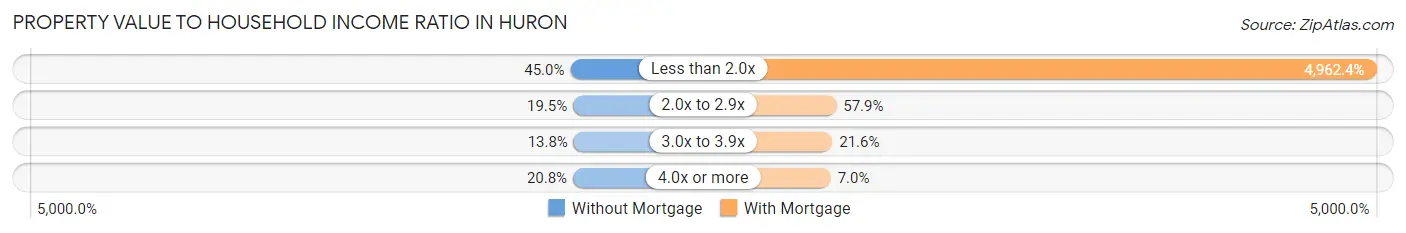
| Value-to-Income Ratio | Without Mortgage | With Mortgage |
| Less than 2.0x | 794 (45.0%) | 89,273 (4,962.4%) |
| 2.0x to 2.9x | 344 (19.5%) | 1,041 (57.9%) |
| 3.0x to 3.9x | 243 (13.8%) | 388 (21.6%) |
| 4.0x or more | 366 (20.8%) | 125 (7.0%) |
| Total | 1,763 (100.0%) | 1,799 (100.0%) |
Real Estate Taxes by Mortgage Status in Huron
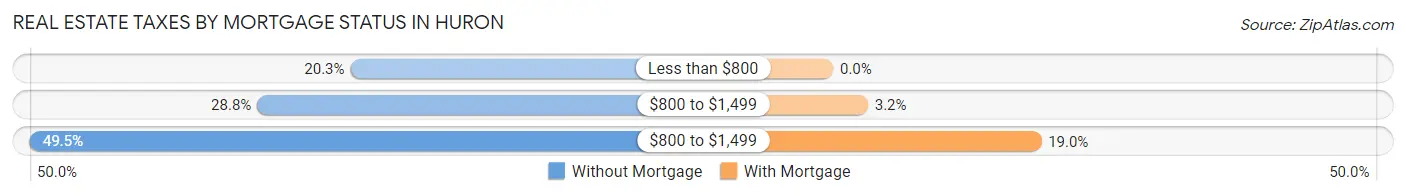
| Property Taxes | Without Mortgage | With Mortgage |
| Less than $800 | 357 (20.3%) | 0 (0.0%) |
| $800 to $1,499 | 507 (28.8%) | 57 (3.2%) |
| $800 to $1,499 | 873 (49.5%) | 342 (19.0%) |
| Total | 1,763 (100.0%) | 1,799 (100.0%) |
Health & Disability in Huron
Health Insurance Coverage by Age in Huron
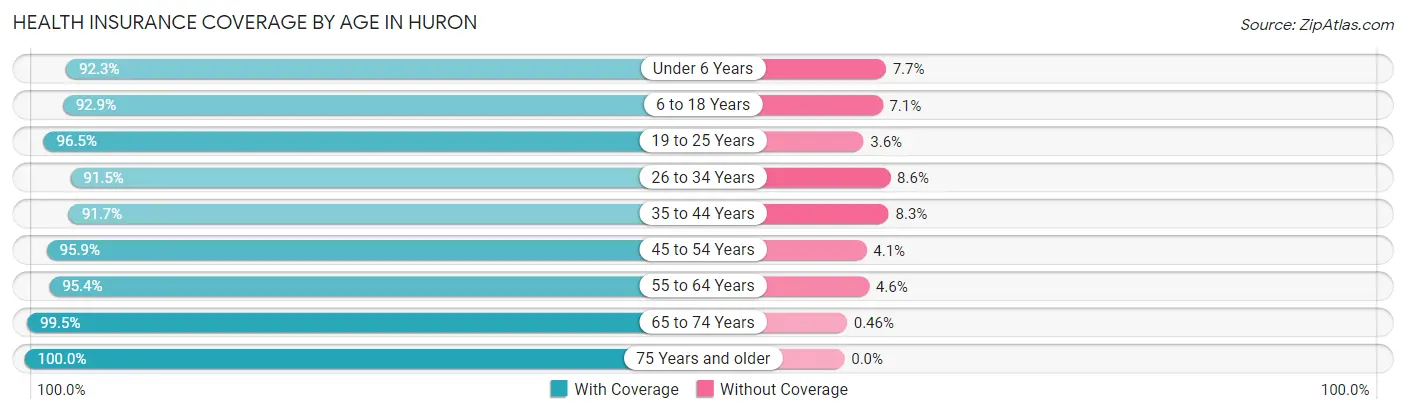
| Age Bracket | With Coverage | Without Coverage |
| Under 6 Years | 1,456 (92.3%) | 122 (7.7%) |
| 6 to 18 Years | 2,441 (92.9%) | 187 (7.1%) |
| 19 to 25 Years | 925 (96.5%) | 34 (3.5%) |
| 26 to 34 Years | 1,786 (91.4%) | 167 (8.6%) |
| 35 to 44 Years | 1,432 (91.7%) | 129 (8.3%) |
| 45 to 54 Years | 1,120 (95.9%) | 48 (4.1%) |
| 55 to 64 Years | 1,498 (95.4%) | 72 (4.6%) |
| 65 to 74 Years | 1,300 (99.5%) | 6 (0.5%) |
| 75 Years and older | 1,172 (100.0%) | 0 (0.0%) |
| Total | 13,130 (94.5%) | 765 (5.5%) |
Health Insurance Coverage by Citizenship Status in Huron
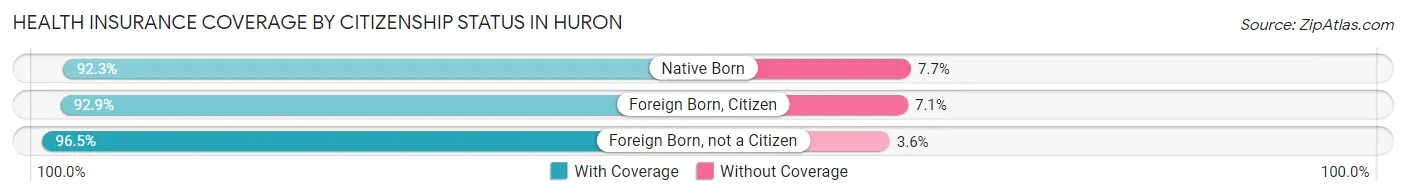
| Citizenship Status | With Coverage | Without Coverage |
| Native Born | 1,456 (92.3%) | 122 (7.7%) |
| Foreign Born, Citizen | 2,441 (92.9%) | 187 (7.1%) |
| Foreign Born, not a Citizen | 925 (96.5%) | 34 (3.5%) |
Health Insurance Coverage by Household Income in Huron
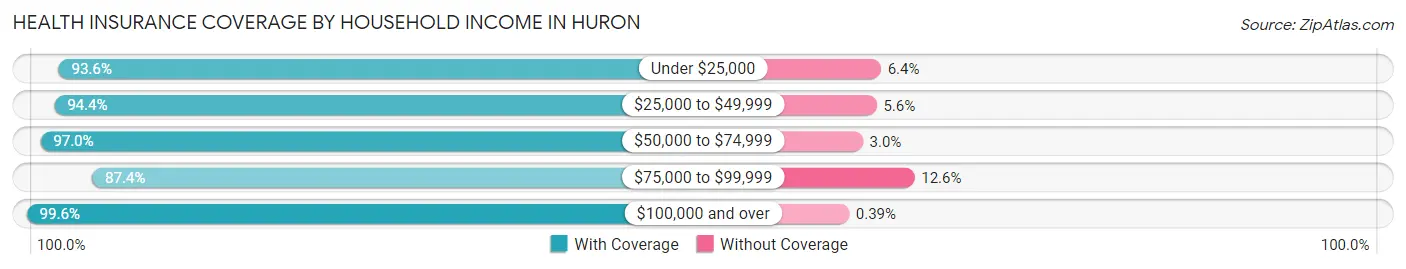
| Household Income | With Coverage | Without Coverage |
| Under $25,000 | 1,546 (93.6%) | 105 (6.4%) |
| $25,000 to $49,999 | 3,704 (94.4%) | 218 (5.6%) |
| $50,000 to $74,999 | 1,772 (97.0%) | 54 (3.0%) |
| $75,000 to $99,999 | 2,129 (87.4%) | 308 (12.6%) |
| $100,000 and over | 3,813 (99.6%) | 15 (0.4%) |
Public vs Private Health Insurance Coverage by Age in Huron
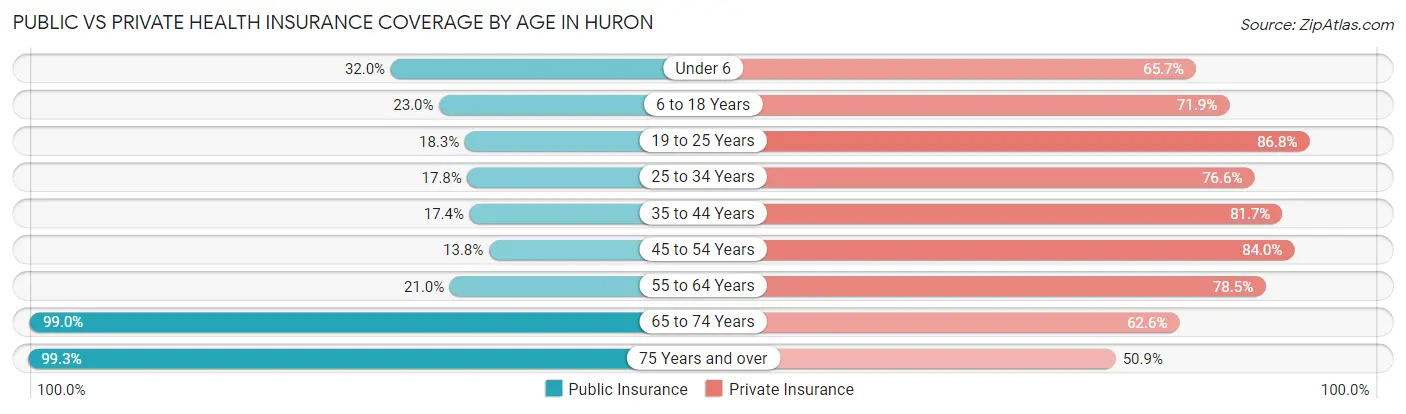
| Age Bracket | Public Insurance | Private Insurance |
| Under 6 | 505 (32.0%) | 1,036 (65.6%) |
| 6 to 18 Years | 605 (23.0%) | 1,889 (71.9%) |
| 19 to 25 Years | 175 (18.2%) | 832 (86.8%) |
| 25 to 34 Years | 347 (17.8%) | 1,495 (76.5%) |
| 35 to 44 Years | 271 (17.4%) | 1,276 (81.7%) |
| 45 to 54 Years | 161 (13.8%) | 981 (84.0%) |
| 55 to 64 Years | 330 (21.0%) | 1,233 (78.5%) |
| 65 to 74 Years | 1,293 (99.0%) | 818 (62.6%) |
| 75 Years and over | 1,164 (99.3%) | 596 (50.8%) |
| Total | 4,851 (34.9%) | 10,156 (73.1%) |
Disability Status by Sex by Age in Huron
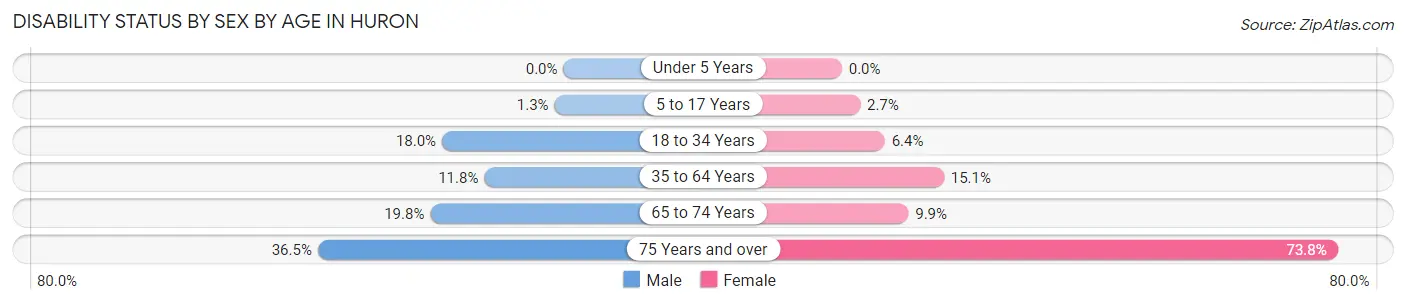
| Age Bracket | Male | Female |
| Under 5 Years | 0 (0.0%) | 0 (0.0%) |
| 5 to 17 Years | 18 (1.3%) | 36 (2.7%) |
| 18 to 34 Years | 254 (18.0%) | 107 (6.4%) |
| 35 to 64 Years | 274 (11.7%) | 298 (15.1%) |
| 65 to 74 Years | 136 (19.8%) | 61 (9.9%) |
| 75 Years and over | 155 (36.5%) | 551 (73.8%) |
Disability Class by Sex by Age in Huron
Disability Class: Hearing Difficulty
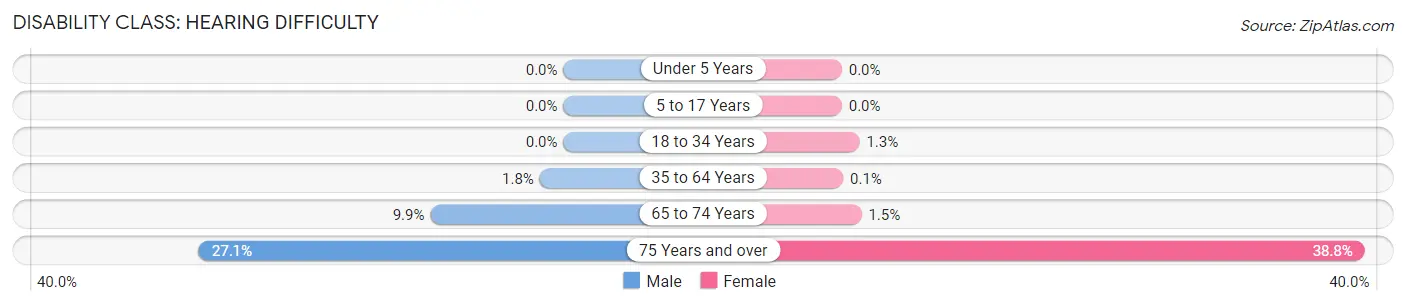
| Age Bracket | Male | Female |
| Under 5 Years | 0 (0.0%) | 0 (0.0%) |
| 5 to 17 Years | 0 (0.0%) | 0 (0.0%) |
| 18 to 34 Years | 0 (0.0%) | 22 (1.3%) |
| 35 to 64 Years | 41 (1.8%) | 2 (0.1%) |
| 65 to 74 Years | 68 (9.9%) | 9 (1.5%) |
| 75 Years and over | 115 (27.1%) | 290 (38.8%) |
Disability Class: Vision Difficulty
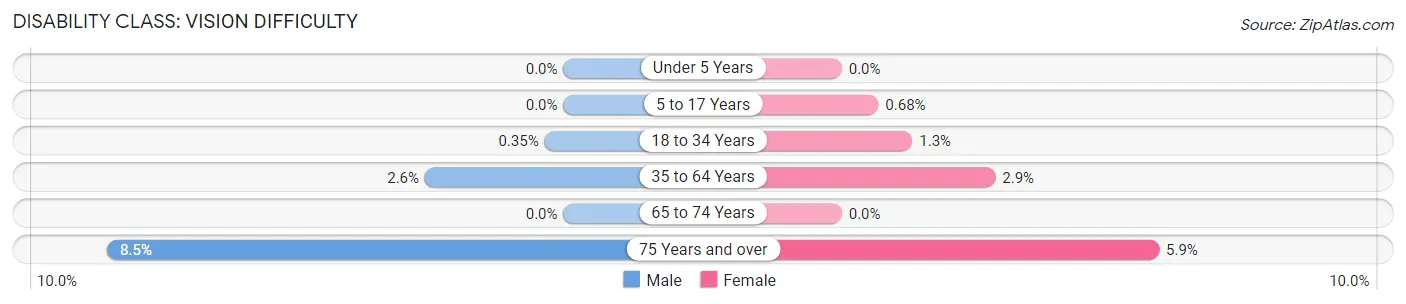
| Age Bracket | Male | Female |
| Under 5 Years | 0 (0.0%) | 0 (0.0%) |
| 5 to 17 Years | 0 (0.0%) | 9 (0.7%) |
| 18 to 34 Years | 5 (0.4%) | 22 (1.3%) |
| 35 to 64 Years | 60 (2.6%) | 56 (2.9%) |
| 65 to 74 Years | 0 (0.0%) | 0 (0.0%) |
| 75 Years and over | 36 (8.5%) | 44 (5.9%) |
Disability Class: Cognitive Difficulty
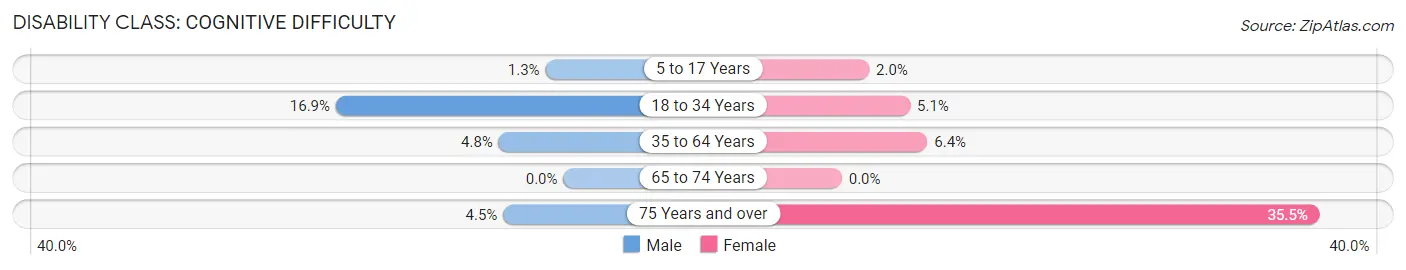
| Age Bracket | Male | Female |
| 5 to 17 Years | 18 (1.3%) | 27 (2.0%) |
| 18 to 34 Years | 238 (16.9%) | 85 (5.1%) |
| 35 to 64 Years | 112 (4.8%) | 125 (6.4%) |
| 65 to 74 Years | 0 (0.0%) | 0 (0.0%) |
| 75 Years and over | 19 (4.5%) | 265 (35.5%) |
Disability Class: Ambulatory Difficulty
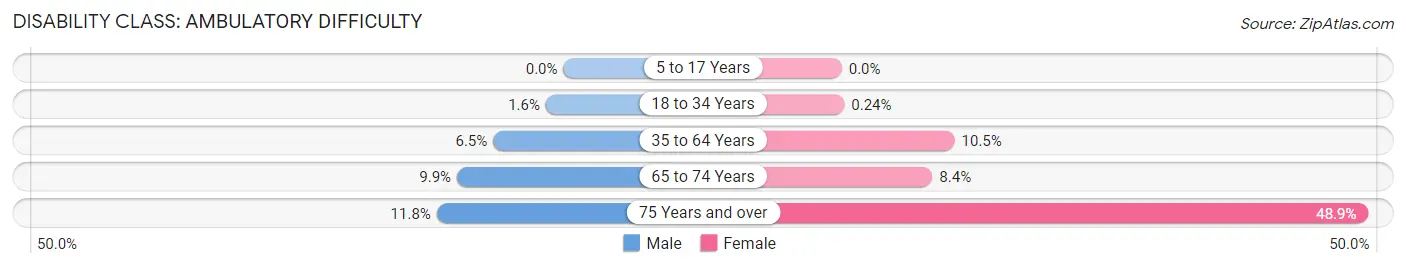
| Age Bracket | Male | Female |
| 5 to 17 Years | 0 (0.0%) | 0 (0.0%) |
| 18 to 34 Years | 23 (1.6%) | 4 (0.2%) |
| 35 to 64 Years | 152 (6.5%) | 206 (10.5%) |
| 65 to 74 Years | 68 (9.9%) | 52 (8.4%) |
| 75 Years and over | 50 (11.8%) | 365 (48.9%) |
Disability Class: Self-Care Difficulty
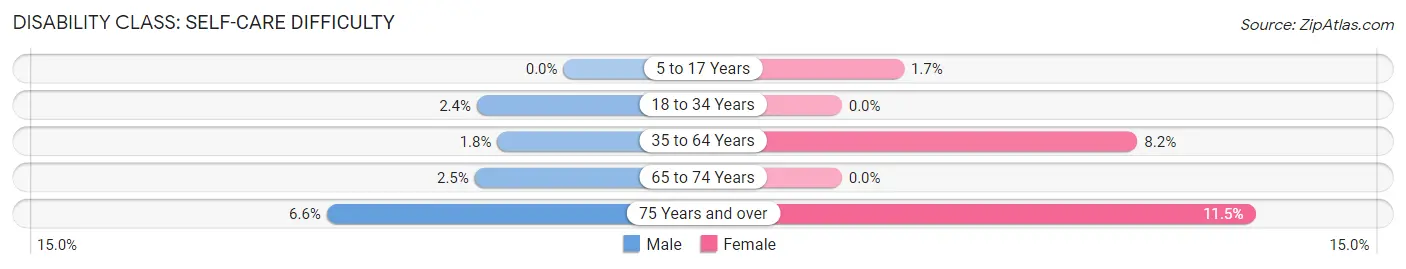
| Age Bracket | Male | Female |
| 5 to 17 Years | 0 (0.0%) | 23 (1.7%) |
| 18 to 34 Years | 34 (2.4%) | 0 (0.0%) |
| 35 to 64 Years | 43 (1.8%) | 162 (8.2%) |
| 65 to 74 Years | 17 (2.5%) | 0 (0.0%) |
| 75 Years and over | 28 (6.6%) | 86 (11.5%) |
Technology Access in Huron
Computing Device Access in Huron
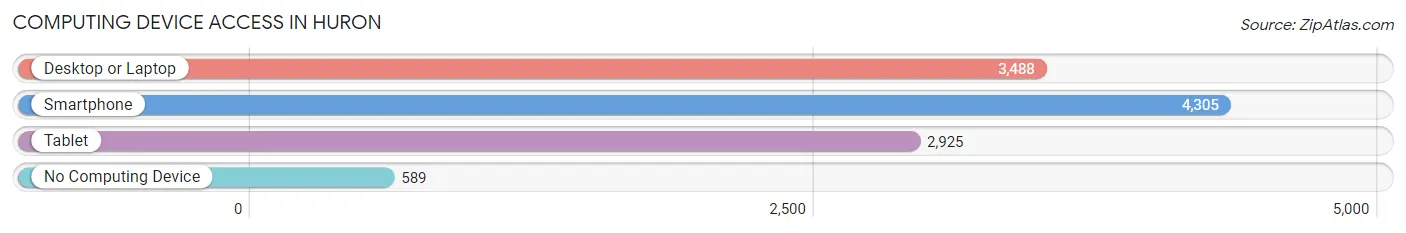
| Device Type | # Households | % Households |
| Desktop or Laptop | 3,488 | 63.5% |
| Smartphone | 4,305 | 78.4% |
| Tablet | 2,925 | 53.3% |
| No Computing Device | 589 | 10.7% |
| Total | 5,489 | 100.0% |
Internet Access in Huron
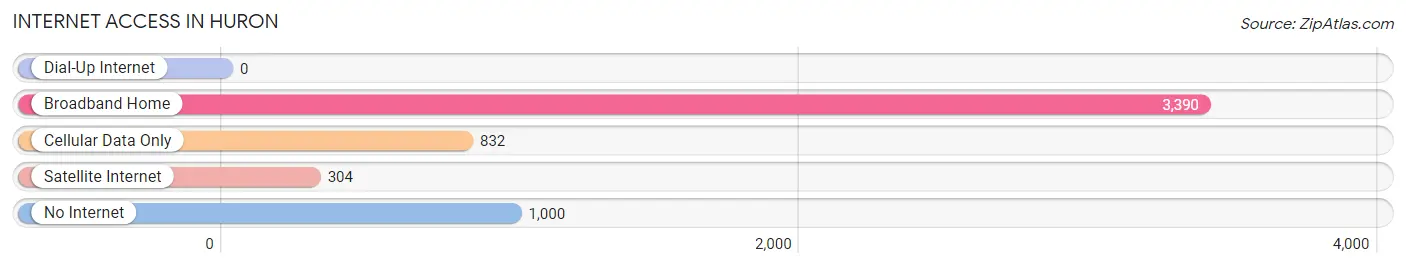
| Internet Type | # Households | % Households |
| Dial-Up Internet | 0 | 0.0% |
| Broadband Home | 3,390 | 61.8% |
| Cellular Data Only | 832 | 15.2% |
| Satellite Internet | 304 | 5.5% |
| No Internet | 1,000 | 18.2% |
| Total | 5,489 | 100.0% |
Huron Summary
Huron, South Dakota is a city located in the state’s Beadle County. It is the county seat and the largest city in the county. The city is located in the James River Valley, which is part of the Missouri Plateau. Huron is located in the center of the state, approximately 90 miles west of Sioux Falls and 130 miles east of Rapid City. The city is situated on the banks of the James River, which is a tributary of the Missouri River.
History
The area that is now Huron was first settled in 1879 by a group of homesteaders from Wisconsin. The city was originally known as “Hudson”, but the name was changed to “Huron” in 1883. The name was chosen to honor the Native American tribe of the same name. The city was officially incorporated in 1887.
In the late 19th century, Huron was a major center for the cattle industry. The city was also a major hub for the railroad industry, with the Chicago, Milwaukee, St. Paul and Pacific Railroad (the “Milwaukee Road”) running through the city. The railroad was a major employer in the city, and it helped to spur the city’s growth.
In the early 20th century, Huron was a major center for the agricultural industry. The city was home to several large grain elevators, and it was a major shipping point for grain and livestock. The city was also home to several large manufacturing companies, including a flour mill, a creamery, and a canning factory.
Geography
Huron is located in the James River Valley, which is part of the Missouri Plateau. The city is situated on the banks of the James River, which is a tributary of the Missouri River. The city is located in the center of the state, approximately 90 miles west of Sioux Falls and 130 miles east of Rapid City.
The city has a total area of 8.2 square miles, of which 8.1 square miles is land and 0.1 square miles is water. The city is located at an elevation of 1,717 feet above sea level.
Economy
The economy of Huron is largely based on agriculture and manufacturing. The city is home to several large grain elevators, and it is a major shipping point for grain and livestock. The city is also home to several large manufacturing companies, including a flour mill, a creamery, and a canning factory.
The city is also home to several large retail stores, including Walmart, Target, and Menards. The city is also home to several restaurants, hotels, and other businesses.
Demographics
As of the 2010 census, the population of Huron was 12,592. The racial makeup of the city was 91.2% White, 0.7% African American, 0.3% Native American, 0.7% Asian, 0.1% Pacific Islander, 5.2% from other races, and 1.9% from two or more races. Hispanic or Latino of any race were 8.2% of the population.
The median household income in Huron was $41,945, and the median family income was $50,945. The per capita income in the city was $20,945. About 11.2% of families and 14.2% of the population were below the poverty line, including 19.2% of those under age 18 and 8.2% of those age 65 or over.
Common Questions
What is Per Capita Income in Huron?
Per Capita income in Huron is $29,576.
What is the Median Family Income in Huron?
Median Family Income in Huron is $67,979.
What is the Median Household income in Huron?
Median Household Income in Huron is $57,702.
What is Income or Wage Gap in Huron?
Income or Wage Gap in Huron is 41.9%.
Women in Huron earn 58.1 cents for every dollar earned by a man.
What is Inequality or Gini Index in Huron?
Inequality or Gini Index in Huron is 0.44.
What is the Total Population of Huron?
Total Population of Huron is 14,179.
What is the Total Male Population of Huron?
Total Male Population of Huron is 6,850.
What is the Total Female Population of Huron?
Total Female Population of Huron is 7,329.
What is the Ratio of Males per 100 Females in Huron?
There are 93.46 Males per 100 Females in Huron.
What is the Ratio of Females per 100 Males in Huron?
There are 106.99 Females per 100 Males in Huron.
What is the Median Population Age in Huron?
Median Population Age in Huron is 34.8 Years.
What is the Average Family Size in Huron
Average Family Size in Huron is 3.2 People.
What is the Average Household Size in Huron
Average Household Size in Huron is 2.5 People.
How Large is the Labor Force in Huron?
There are 7,021 People in the Labor Forcein in Huron.
What is the Percentage of People in the Labor Force in Huron?
67.1% of People are in the Labor Force in Huron.
What is the Unemployment Rate in Huron?
Unemployment Rate in Huron is 2.7%.