Des Moines, IA Map & Demographics
Des Moines Map
Des Moines Overview
$34,347
PER CAPITA INCOME
$76,602
AVG FAMILY INCOME
$62,378
AVG HOUSEHOLD INCOME
23.7%
WAGE / INCOME GAP [ % ]
76.3¢/ $1
WAGE / INCOME GAP [ $ ]
$11,665
FAMILY INCOME DEFICIT
0.43
INEQUALITY / GINI INDEX
213,164
TOTAL POPULATION
105,258
MALE POPULATION
107,906
FEMALE POPULATION
97.55
MALES / 100 FEMALES
102.52
FEMALES / 100 MALES
34.4
MEDIAN AGE
3.1
AVG FAMILY SIZE
2.3
AVG HOUSEHOLD SIZE
118,731
LABOR FORCE [ PEOPLE ]
70.0%
PERCENT IN LABOR FORCE
5.9%
UNEMPLOYMENT RATE
Des Moines Area Codes
Income in Des Moines
Income Overview in Des Moines
Per Capita Income in Des Moines is $34,347, while median incomes of families and households are $76,602 and $62,378 respectively.
| Characteristic | Number | Measure |
| Per Capita Income | 213,164 | $34,347 |
| Median Family Income | 47,984 | $76,602 |
| Mean Family Income | 47,984 | $96,024 |
| Median Household Income | 88,894 | $62,378 |
| Mean Household Income | 88,894 | $79,959 |
| Income Deficit | 47,984 | $11,665 |
| Wage / Income Gap (%) | 213,164 | 23.66% |
| Wage / Income Gap ($) | 213,164 | 76.34¢ per $1 |
| Gini / Inequality Index | 213,164 | 0.43 |
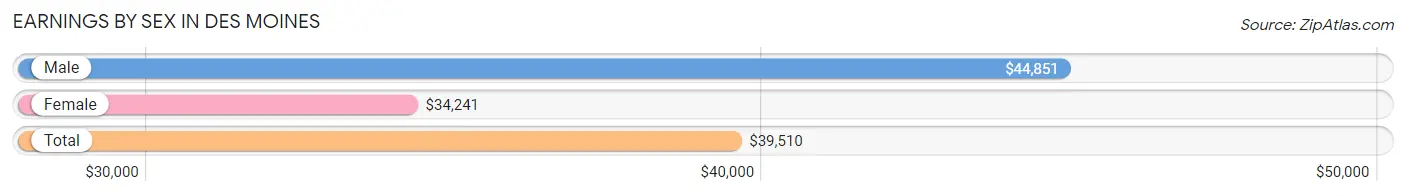
Earnings by Sex in Des Moines
Average Earnings in Des Moines are $39,510, $44,851 for men and $34,241 for women, a difference of 23.7%.
| Sex | Number | Average Earnings |
| Male | 63,745 (51.4%) | $44,851 |
| Female | 60,310 (48.6%) | $34,241 |
| Total | 124,055 (100.0%) | $39,510 |
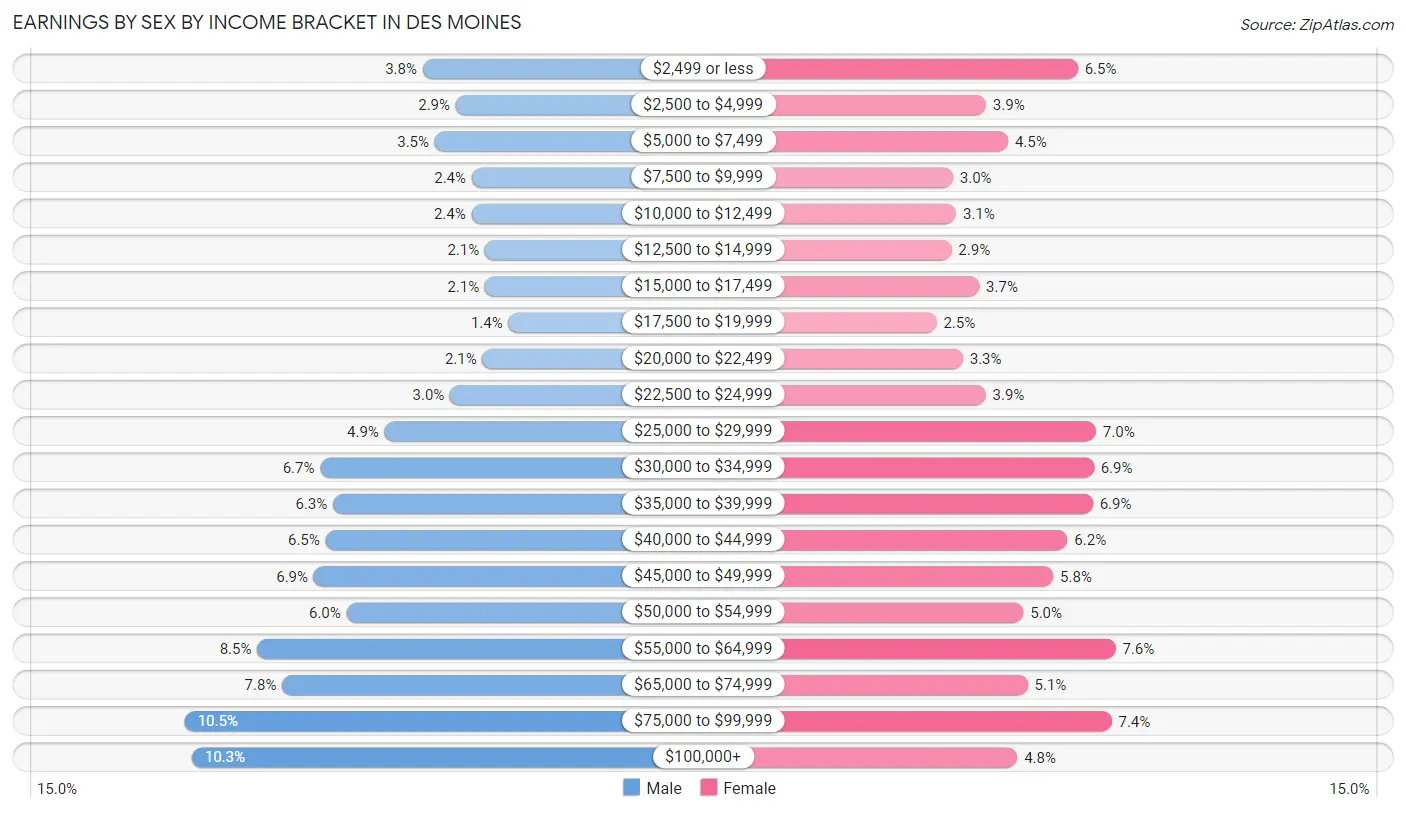
Earnings by Sex by Income Bracket in Des Moines
The most common earnings brackets in Des Moines are $75,000 to $99,999 for men (6,694 | 10.5%) and $55,000 to $64,999 for women (4,555 | 7.5%).
| Income | Male | Female |
| $2,499 or less | 2,431 (3.8%) | 3,915 (6.5%) |
| $2,500 to $4,999 | 1,839 (2.9%) | 2,357 (3.9%) |
| $5,000 to $7,499 | 2,215 (3.5%) | 2,733 (4.5%) |
| $7,500 to $9,999 | 1,551 (2.4%) | 1,795 (3.0%) |
| $10,000 to $12,499 | 1,553 (2.4%) | 1,850 (3.1%) |
| $12,500 to $14,999 | 1,314 (2.1%) | 1,775 (2.9%) |
| $15,000 to $17,499 | 1,312 (2.1%) | 2,243 (3.7%) |
| $17,500 to $19,999 | 890 (1.4%) | 1,521 (2.5%) |
| $20,000 to $22,499 | 1,356 (2.1%) | 1,965 (3.3%) |
| $22,500 to $24,999 | 1,940 (3.0%) | 2,354 (3.9%) |
| $25,000 to $29,999 | 3,111 (4.9%) | 4,222 (7.0%) |
| $30,000 to $34,999 | 4,263 (6.7%) | 4,186 (6.9%) |
| $35,000 to $39,999 | 4,032 (6.3%) | 4,170 (6.9%) |
| $40,000 to $44,999 | 4,168 (6.5%) | 3,739 (6.2%) |
| $45,000 to $49,999 | 4,378 (6.9%) | 3,498 (5.8%) |
| $50,000 to $54,999 | 3,795 (5.9%) | 2,992 (5.0%) |
| $55,000 to $64,999 | 5,392 (8.5%) | 4,555 (7.5%) |
| $65,000 to $74,999 | 4,947 (7.8%) | 3,061 (5.1%) |
| $75,000 to $99,999 | 6,694 (10.5%) | 4,488 (7.4%) |
| $100,000+ | 6,564 (10.3%) | 2,891 (4.8%) |
| Total | 63,745 (100.0%) | 60,310 (100.0%) |
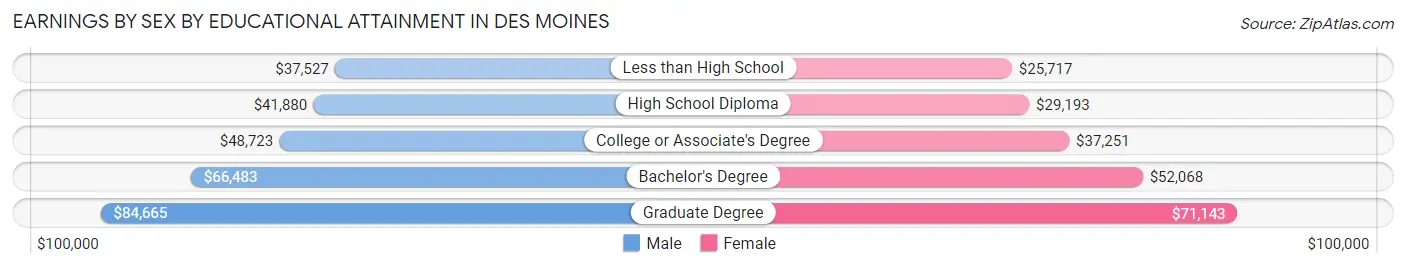
Earnings by Sex by Educational Attainment in Des Moines
Average earnings in Des Moines are $50,094 for men and $38,890 for women, a difference of 22.4%. Men with an educational attainment of graduate degree enjoy the highest average annual earnings of $84,665, while those with less than high school education earn the least with $37,527. Women with an educational attainment of graduate degree earn the most with the average annual earnings of $71,143, while those with less than high school education have the smallest earnings of $25,717.
| Educational Attainment | Male Income | Female Income |
| Less than High School | $37,527 | $25,717 |
| High School Diploma | $41,880 | $29,193 |
| College or Associate's Degree | $48,723 | $37,251 |
| Bachelor's Degree | $66,483 | $52,068 |
| Graduate Degree | $84,665 | $71,143 |
| Total | $50,094 | $38,890 |
Family Income in Des Moines
Family Income Brackets in Des Moines
According to the Des Moines family income data, there are 9,117 families falling into the $50,000 to $74,999 income range, which is the most common income bracket and makes up 19.0% of all families. Conversely, the $10,000 to $14,999 income bracket is the least frequent group with only 1,104 families (2.3%) belonging to this category.
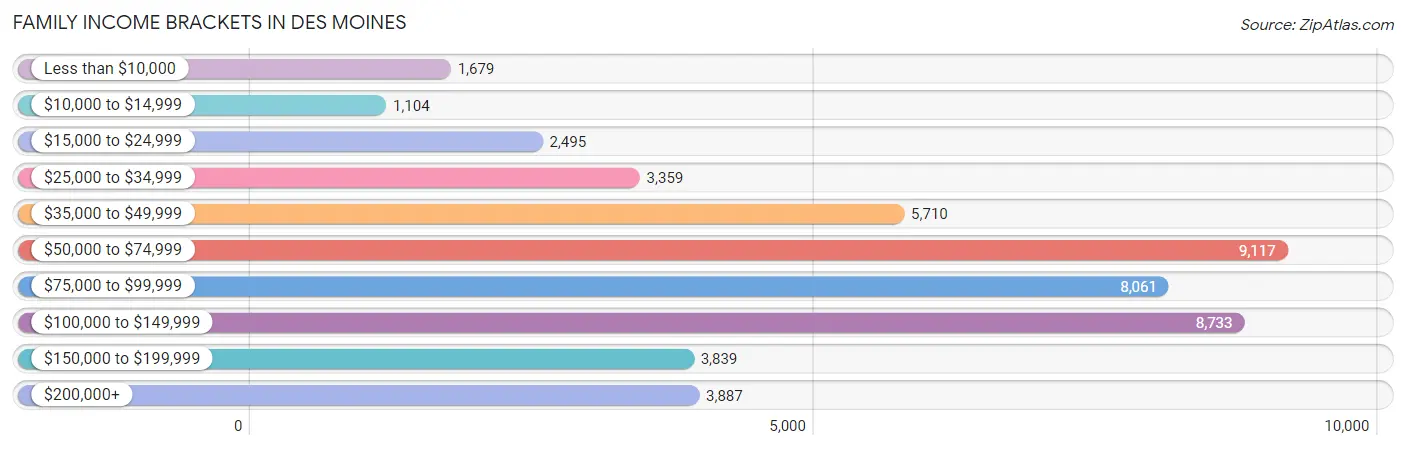
| Income Bracket | # Families | % Families |
| Less than $10,000 | 1,679 | 3.5% |
| $10,000 to $14,999 | 1,104 | 2.3% |
| $15,000 to $24,999 | 2,495 | 5.2% |
| $25,000 to $34,999 | 3,359 | 7.0% |
| $35,000 to $49,999 | 5,710 | 11.9% |
| $50,000 to $74,999 | 9,117 | 19.0% |
| $75,000 to $99,999 | 8,061 | 16.8% |
| $100,000 to $149,999 | 8,733 | 18.2% |
| $150,000 to $199,999 | 3,839 | 8.0% |
| $200,000+ | 3,887 | 8.1% |
Family Income by Famaliy Size in Des Moines
4-person families (8,173 | 17.0%) account for the highest median family income in Des Moines with $85,553 per family, while 2-person families (21,915 | 45.7%) have the highest median income of $37,121 per family member.
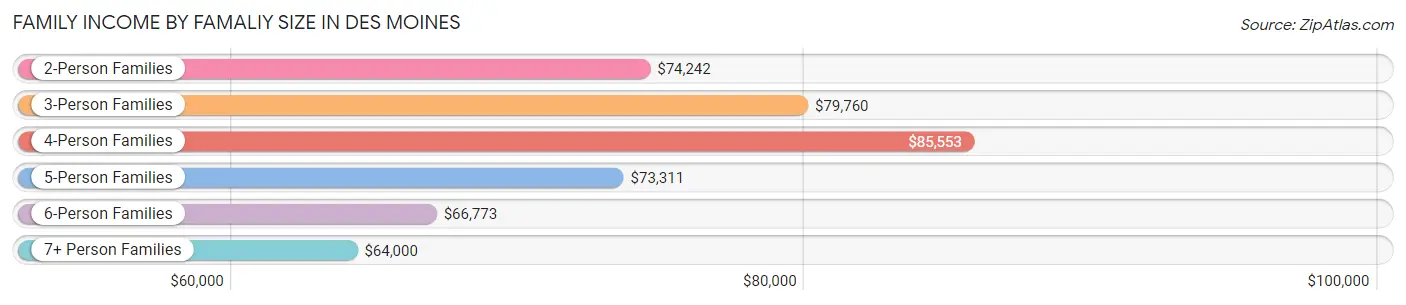
| Income Bracket | # Families | Median Income |
| 2-Person Families | 21,915 (45.7%) | $74,242 |
| 3-Person Families | 10,832 (22.6%) | $79,760 |
| 4-Person Families | 8,173 (17.0%) | $85,553 |
| 5-Person Families | 3,875 (8.1%) | $73,311 |
| 6-Person Families | 1,857 (3.9%) | $66,773 |
| 7+ Person Families | 1,332 (2.8%) | $64,000 |
| Total | 47,984 (100.0%) | $76,602 |
Family Income by Number of Earners in Des Moines
The median family income in Des Moines is $76,602, with families comprising 3+ earners (5,754) having the highest median family income of $110,318, while families with no earners (5,018) have the lowest median family income of $46,272, accounting for 12.0% and 10.5% of families, respectively.
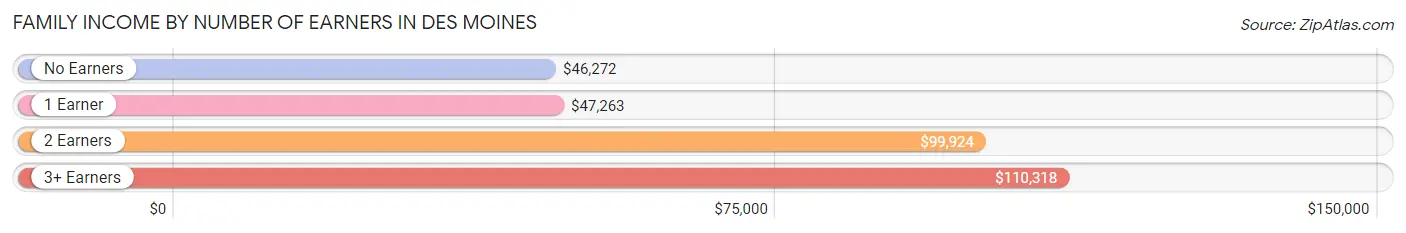
| Number of Earners | # Families | Median Income |
| No Earners | 5,018 (10.5%) | $46,272 |
| 1 Earner | 16,006 (33.4%) | $47,263 |
| 2 Earners | 21,206 (44.2%) | $99,924 |
| 3+ Earners | 5,754 (12.0%) | $110,318 |
| Total | 47,984 (100.0%) | $76,602 |
Household Income in Des Moines
Household Income Brackets in Des Moines
With 17,512 households falling in the category, the $50,000 to $74,999 income range is the most frequent in Des Moines, accounting for 19.7% of all households. In contrast, only 3,911 households (4.4%) fall into the $10,000 to $14,999 income bracket, making it the least populous group.
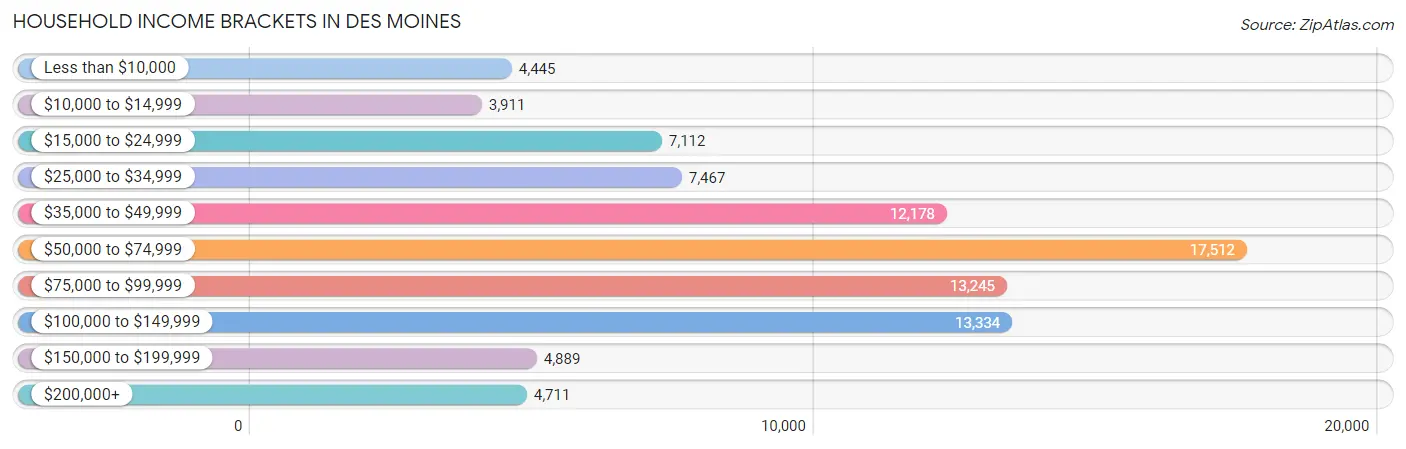
| Income Bracket | # Households | % Households |
| Less than $10,000 | 4,445 | 5.0% |
| $10,000 to $14,999 | 3,911 | 4.4% |
| $15,000 to $24,999 | 7,112 | 8.0% |
| $25,000 to $34,999 | 7,467 | 8.4% |
| $35,000 to $49,999 | 12,178 | 13.7% |
| $50,000 to $74,999 | 17,512 | 19.7% |
| $75,000 to $99,999 | 13,245 | 14.9% |
| $100,000 to $149,999 | 13,334 | 15.0% |
| $150,000 to $199,999 | 4,889 | 5.5% |
| $200,000+ | 4,711 | 5.3% |
Household Income by Householder Age in Des Moines
The median household income in Des Moines is $62,378, with the highest median household income of $73,116 found in the 45 to 64 years age bracket for the primary householder. A total of 30,165 households (33.9%) fall into this category. Meanwhile, the 15 to 24 years age bracket for the primary householder has the lowest median household income of $42,002, with 6,152 households (6.9%) in this group.
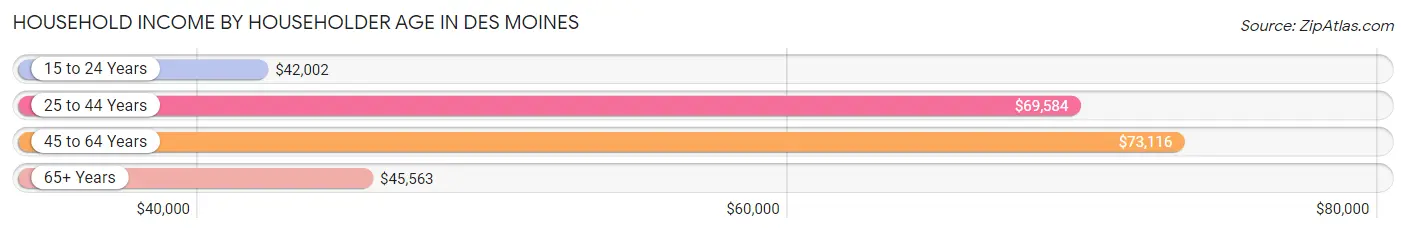
| Income Bracket | # Households | Median Income |
| 15 to 24 Years | 6,152 (6.9%) | $42,002 |
| 25 to 44 Years | 34,546 (38.9%) | $69,584 |
| 45 to 64 Years | 30,165 (33.9%) | $73,116 |
| 65+ Years | 18,031 (20.3%) | $45,563 |
| Total | 88,894 (100.0%) | $62,378 |
Poverty in Des Moines
Income Below Poverty by Sex and Age in Des Moines
With 14.6% poverty level for males and 15.8% for females among the residents of Des Moines, 12 to 14 year old males and 6 to 11 year old females are the most vulnerable to poverty, with 1,192 males (31.4%) and 1,936 females (25.7%) in their respective age groups living below the poverty level.
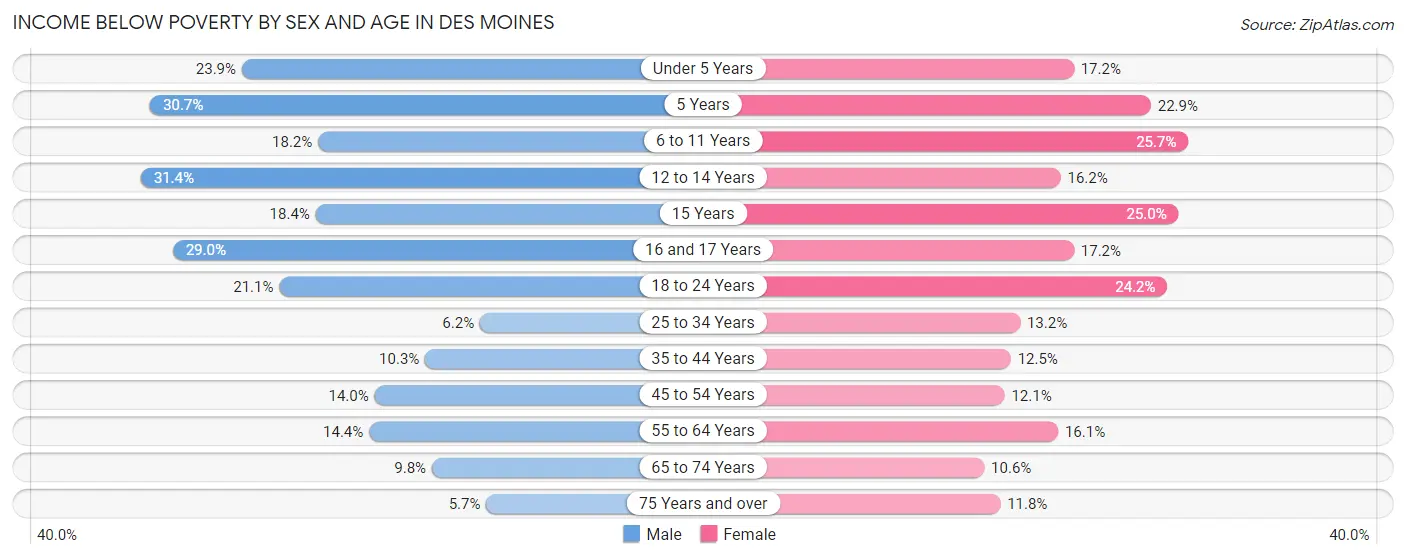
| Age Bracket | Male | Female |
| Under 5 Years | 1,698 (23.9%) | 1,215 (17.2%) |
| 5 Years | 403 (30.7%) | 307 (22.9%) |
| 6 to 11 Years | 1,425 (18.2%) | 1,936 (25.7%) |
| 12 to 14 Years | 1,192 (31.4%) | 686 (16.2%) |
| 15 Years | 271 (18.4%) | 288 (25.0%) |
| 16 and 17 Years | 756 (29.0%) | 561 (17.2%) |
| 18 to 24 Years | 2,195 (21.1%) | 2,529 (24.2%) |
| 25 to 34 Years | 1,113 (6.2%) | 2,324 (13.2%) |
| 35 to 44 Years | 1,445 (10.3%) | 1,664 (12.5%) |
| 45 to 54 Years | 1,813 (14.0%) | 1,480 (12.1%) |
| 55 to 64 Years | 1,743 (14.4%) | 2,108 (16.1%) |
| 65 to 74 Years | 741 (9.8%) | 906 (10.6%) |
| 75 Years and over | 213 (5.7%) | 669 (11.8%) |
| Total | 15,008 (14.6%) | 16,673 (15.8%) |
Income Above Poverty by Sex and Age in Des Moines
According to the poverty statistics in Des Moines, males aged 75 years and over and females aged 65 to 74 years are the age groups that are most secure financially, with 94.3% of males and 89.4% of females in these age groups living above the poverty line.
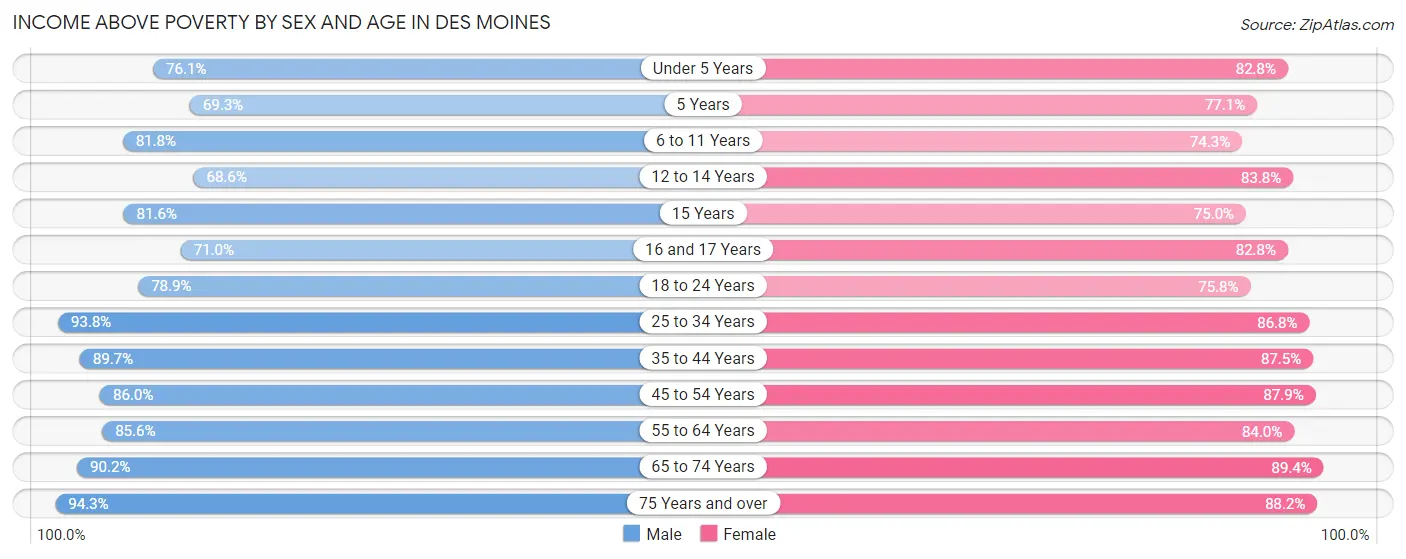
| Age Bracket | Male | Female |
| Under 5 Years | 5,416 (76.1%) | 5,839 (82.8%) |
| 5 Years | 910 (69.3%) | 1,031 (77.1%) |
| 6 to 11 Years | 6,401 (81.8%) | 5,590 (74.3%) |
| 12 to 14 Years | 2,608 (68.6%) | 3,538 (83.8%) |
| 15 Years | 1,203 (81.6%) | 864 (75.0%) |
| 16 and 17 Years | 1,851 (71.0%) | 2,695 (82.8%) |
| 18 to 24 Years | 8,212 (78.9%) | 7,933 (75.8%) |
| 25 to 34 Years | 16,871 (93.8%) | 15,246 (86.8%) |
| 35 to 44 Years | 12,638 (89.7%) | 11,602 (87.5%) |
| 45 to 54 Years | 11,117 (86.0%) | 10,772 (87.9%) |
| 55 to 64 Years | 10,346 (85.6%) | 11,023 (84.0%) |
| 65 to 74 Years | 6,850 (90.2%) | 7,667 (89.4%) |
| 75 Years and over | 3,512 (94.3%) | 5,022 (88.2%) |
| Total | 87,935 (85.4%) | 88,822 (84.2%) |
Income Below Poverty Among Married-Couple Families in Des Moines
The poverty statistics for married-couple families in Des Moines show that 5.4% or 1,659 of the total 30,832 families live below the poverty line. Families with 5 or more children have the highest poverty rate of 40.2%, comprising of 233 families. On the other hand, families with no children have the lowest poverty rate of 3.2%, which includes 537 families.
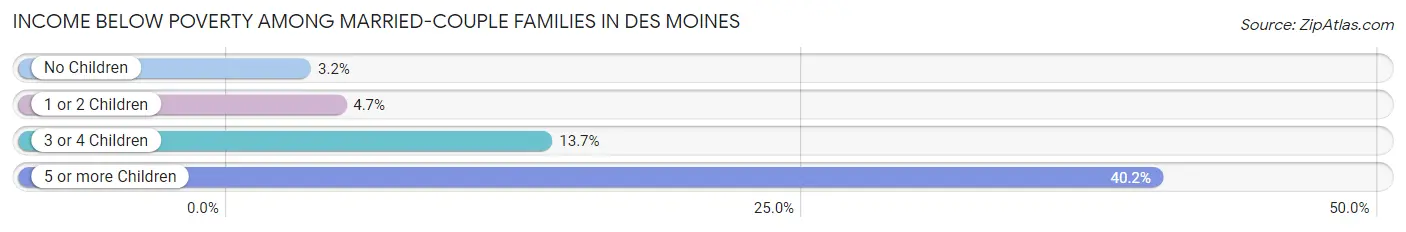
| Children | Above Poverty | Below Poverty |
| No Children | 16,330 (96.8%) | 537 (3.2%) |
| 1 or 2 Children | 10,005 (95.3%) | 494 (4.7%) |
| 3 or 4 Children | 2,492 (86.3%) | 395 (13.7%) |
| 5 or more Children | 346 (59.8%) | 233 (40.2%) |
| Total | 29,173 (94.6%) | 1,659 (5.4%) |
Income Below Poverty Among Single-Parent Households in Des Moines
According to the poverty data in Des Moines, 18.0% or 872 single-father households and 23.2% or 2,859 single-mother households are living below the poverty line. Among single-father households, those with 5 or more children have the highest poverty rate, with 16 households (100.0%) experiencing poverty. Likewise, among single-mother households, those with 5 or more children have the highest poverty rate, with 180 households (52.3%) falling below the poverty line.
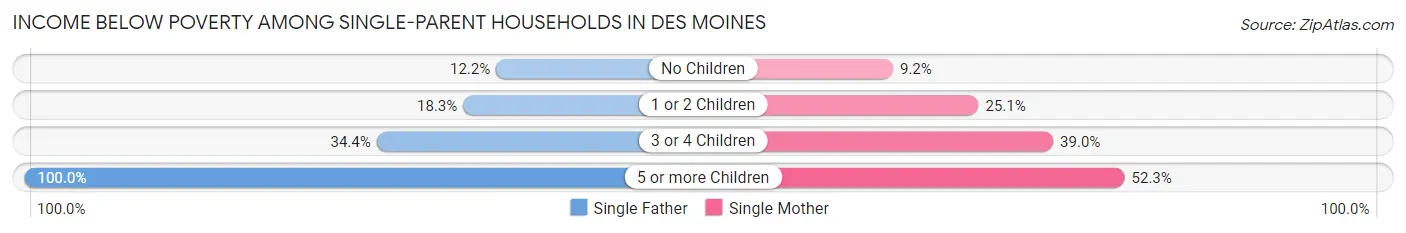
| Children | Single Father | Single Mother |
| No Children | 191 (12.2%) | 347 (9.2%) |
| 1 or 2 Children | 520 (18.3%) | 1,566 (25.1%) |
| 3 or 4 Children | 145 (34.4%) | 766 (39.0%) |
| 5 or more Children | 16 (100.0%) | 180 (52.3%) |
| Total | 872 (18.0%) | 2,859 (23.2%) |
Income Below Poverty Among Married-Couple vs Single-Parent Households in Des Moines
The poverty data for Des Moines shows that 1,659 of the married-couple family households (5.4%) and 3,731 of the single-parent households (21.7%) are living below the poverty level. Within the married-couple family households, those with 5 or more children have the highest poverty rate, with 233 households (40.2%) falling below the poverty line. Among the single-parent households, those with 5 or more children have the highest poverty rate, with 196 household (54.4%) living below poverty.
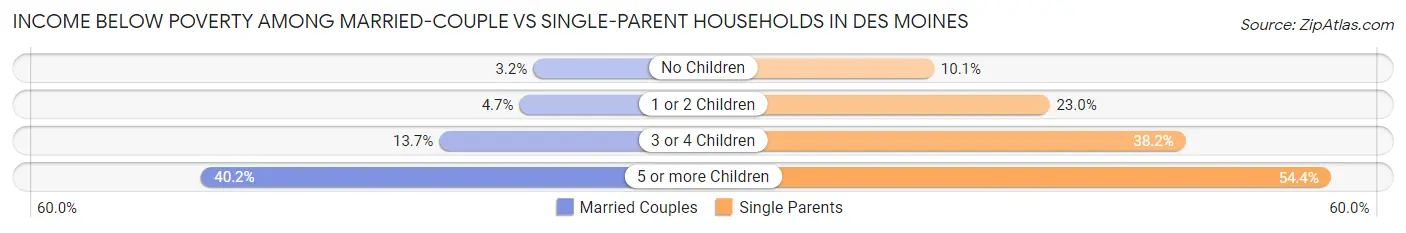
| Children | Married-Couple Families | Single-Parent Households |
| No Children | 537 (3.2%) | 538 (10.1%) |
| 1 or 2 Children | 494 (4.7%) | 2,086 (23.0%) |
| 3 or 4 Children | 395 (13.7%) | 911 (38.2%) |
| 5 or more Children | 233 (40.2%) | 196 (54.4%) |
| Total | 1,659 (5.4%) | 3,731 (21.7%) |
Race in Des Moines
The most populous races in Des Moines are White / Caucasian (149,019 | 69.9%), Hispanic or Latino (30,577 | 14.3%), and Black / African American (25,057 | 11.7%).
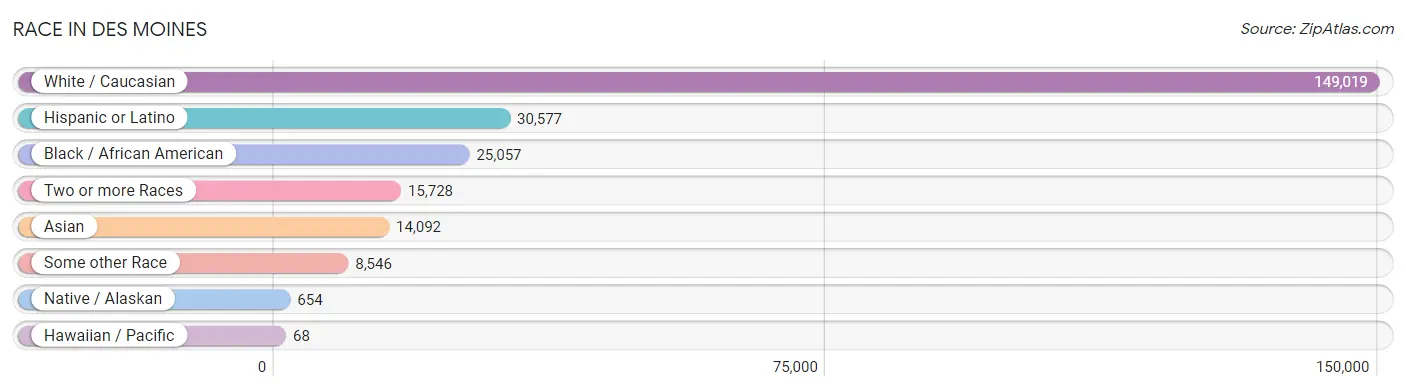
| Race | # Population | % Population |
| Asian | 14,092 | 6.6% |
| Black / African American | 25,057 | 11.7% |
| Hawaiian / Pacific | 68 | 0.0% |
| Hispanic or Latino | 30,577 | 14.3% |
| Native / Alaskan | 654 | 0.3% |
| White / Caucasian | 149,019 | 69.9% |
| Two or more Races | 15,728 | 7.4% |
| Some other Race | 8,546 | 4.0% |
| Total | 213,164 | 100.0% |
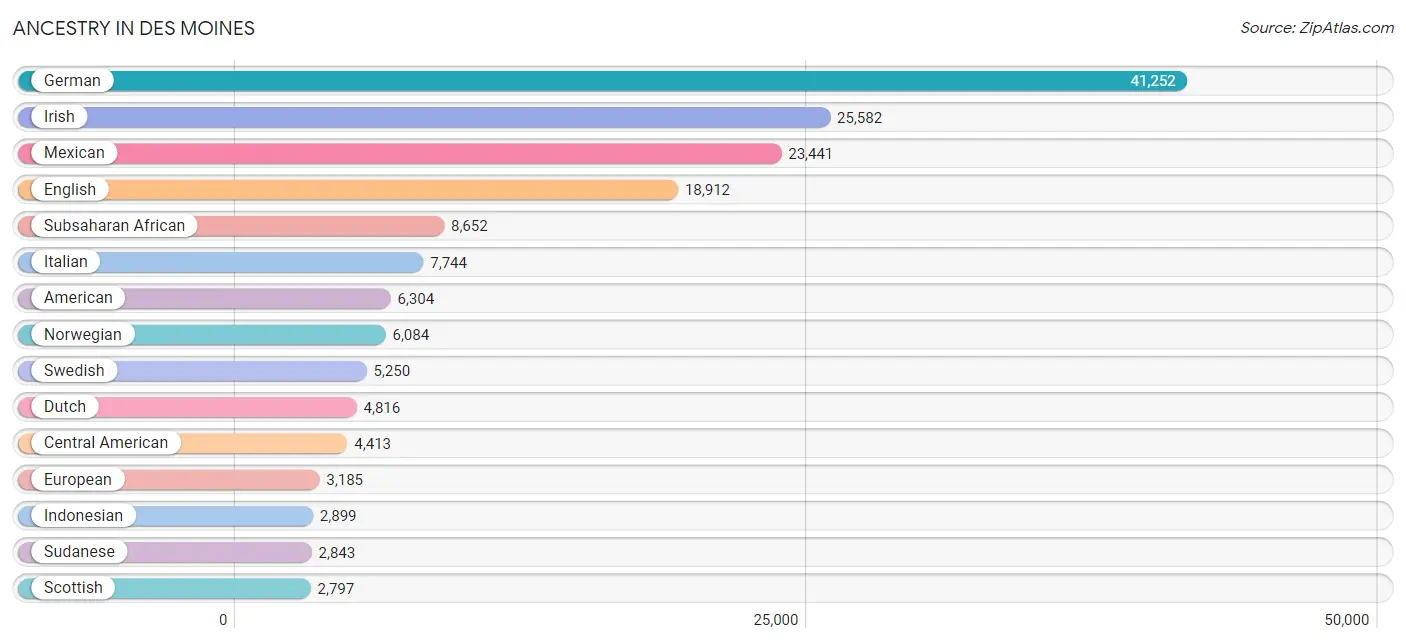
Ancestry in Des Moines
The most populous ancestries reported in Des Moines are German (41,252 | 19.4%), Irish (25,582 | 12.0%), Mexican (23,441 | 11.0%), English (18,912 | 8.9%), and Subsaharan African (8,652 | 4.1%), together accounting for 55.3% of all Des Moines residents.
| Ancestry | # Population | % Population |
| Afghan | 145 | 0.1% |
| African | 1,893 | 0.9% |
| Albanian | 4 | 0.0% |
| American | 6,304 | 3.0% |
| Apache | 23 | 0.0% |
| Arab | 368 | 0.2% |
| Argentinean | 37 | 0.0% |
| Assyrian / Chaldean / Syriac | 16 | 0.0% |
| Australian | 57 | 0.0% |
| Austrian | 299 | 0.1% |
| Bangladeshi | 200 | 0.1% |
| Belgian | 111 | 0.1% |
| Bhutanese | 113 | 0.1% |
| Blackfeet | 212 | 0.1% |
| Bolivian | 17 | 0.0% |
| Brazilian | 35 | 0.0% |
| British | 907 | 0.4% |
| Bulgarian | 33 | 0.0% |
| Burmese | 362 | 0.2% |
| Canadian | 192 | 0.1% |
| Celtic | 38 | 0.0% |
| Central American | 4,413 | 2.1% |
| Central American Indian | 139 | 0.1% |
| Cherokee | 147 | 0.1% |
| Chilean | 58 | 0.0% |
| Chippewa | 24 | 0.0% |
| Choctaw | 153 | 0.1% |
| Colombian | 146 | 0.1% |
| Comanche | 7 | 0.0% |
| Costa Rican | 67 | 0.0% |
| Creek | 22 | 0.0% |
| Croatian | 785 | 0.4% |
| Cuban | 485 | 0.2% |
| Czech | 1,662 | 0.8% |
| Czechoslovakian | 106 | 0.1% |
| Danish | 1,930 | 0.9% |
| Dominican | 175 | 0.1% |
| Dutch | 4,816 | 2.3% |
| Eastern European | 265 | 0.1% |
| Ecuadorian | 138 | 0.1% |
| Egyptian | 25 | 0.0% |
| English | 18,912 | 8.9% |
| Ethiopian | 522 | 0.2% |
| European | 3,185 | 1.5% |
| Filipino | 75 | 0.0% |
| Finnish | 86 | 0.0% |
| French | 2,753 | 1.3% |
| French American Indian | 21 | 0.0% |
| French Canadian | 330 | 0.2% |
| German | 41,252 | 19.4% |
| German Russian | 21 | 0.0% |
| Ghanaian | 3 | 0.0% |
| Greek | 529 | 0.3% |
| Guamanian / Chamorro | 21 | 0.0% |
| Guatemalan | 1,105 | 0.5% |
| Haitian | 187 | 0.1% |
| Honduran | 479 | 0.2% |
| Houma | 4 | 0.0% |
| Hungarian | 136 | 0.1% |
| Icelander | 110 | 0.1% |
| Indian (Asian) | 1,006 | 0.5% |
| Indonesian | 2,899 | 1.4% |
| Iranian | 38 | 0.0% |
| Iraqi | 126 | 0.1% |
| Irish | 25,582 | 12.0% |
| Israeli | 14 | 0.0% |
| Italian | 7,744 | 3.6% |
| Jamaican | 354 | 0.2% |
| Japanese | 507 | 0.2% |
| Kenyan | 34 | 0.0% |
| Korean | 860 | 0.4% |
| Laotian | 5 | 0.0% |
| Latvian | 148 | 0.1% |
| Lebanese | 116 | 0.1% |
| Liberian | 717 | 0.3% |
| Lithuanian | 113 | 0.1% |
| Luxembourger | 128 | 0.1% |
| Malaysian | 2,015 | 0.9% |
| Maltese | 19 | 0.0% |
| Mexican | 23,441 | 11.0% |
| Mexican American Indian | 184 | 0.1% |
| Mongolian | 19 | 0.0% |
| Moroccan | 15 | 0.0% |
| Native Hawaiian | 81 | 0.0% |
| Navajo | 259 | 0.1% |
| New Zealander | 11 | 0.0% |
| Nicaraguan | 7 | 0.0% |
| Nigerian | 311 | 0.2% |
| Northern European | 297 | 0.1% |
| Norwegian | 6,084 | 2.9% |
| Osage | 3 | 0.0% |
| Ottawa | 2 | 0.0% |
| Pakistani | 593 | 0.3% |
| Palestinian | 6 | 0.0% |
| Panamanian | 55 | 0.0% |
| Pennsylvania German | 74 | 0.0% |
| Peruvian | 83 | 0.0% |
| Polish | 2,367 | 1.1% |
| Portuguese | 158 | 0.1% |
| Pueblo | 19 | 0.0% |
| Puerto Rican | 717 | 0.3% |
| Romanian | 97 | 0.1% |
| Russian | 852 | 0.4% |
| Salvadoran | 2,664 | 1.3% |
| Samoan | 7 | 0.0% |
| Scandinavian | 1,015 | 0.5% |
| Scotch-Irish | 1,665 | 0.8% |
| Scottish | 2,797 | 1.3% |
| Seminole | 2 | 0.0% |
| Senegalese | 106 | 0.1% |
| Serbian | 41 | 0.0% |
| Sierra Leonean | 3 | 0.0% |
| Sioux | 405 | 0.2% |
| Slavic | 4 | 0.0% |
| Slovak | 98 | 0.1% |
| Slovene | 31 | 0.0% |
| Somali | 1,096 | 0.5% |
| South African | 15 | 0.0% |
| South American | 547 | 0.3% |
| South American Indian | 7 | 0.0% |
| Spaniard | 178 | 0.1% |
| Spanish | 148 | 0.1% |
| Spanish American Indian | 21 | 0.0% |
| Sri Lankan | 2,613 | 1.2% |
| Subsaharan African | 8,652 | 4.1% |
| Sudanese | 2,843 | 1.3% |
| Swedish | 5,250 | 2.5% |
| Swiss | 331 | 0.2% |
| Syrian | 15 | 0.0% |
| Thai | 1,268 | 0.6% |
| Tongan | 25 | 0.0% |
| Trinidadian and Tobagonian | 15 | 0.0% |
| Turkish | 9 | 0.0% |
| Ukrainian | 153 | 0.1% |
| Venezuelan | 68 | 0.0% |
| Welsh | 1,578 | 0.7% |
| Yaqui | 36 | 0.0% |
| Yugoslavian | 742 | 0.4% | View All 138 Rows |
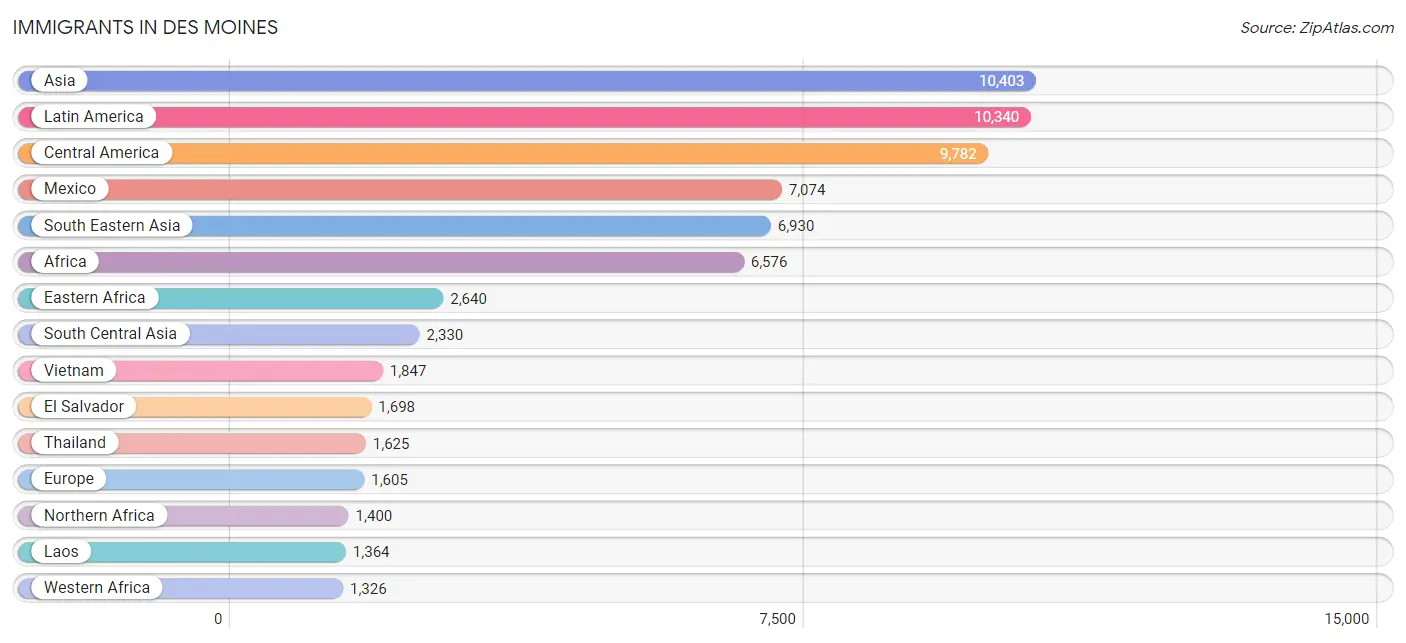
Immigrants in Des Moines
The most numerous immigrant groups reported in Des Moines came from Asia (10,403 | 4.9%), Latin America (10,340 | 4.9%), Central America (9,782 | 4.6%), Mexico (7,074 | 3.3%), and South Eastern Asia (6,930 | 3.3%), together accounting for 20.9% of all Des Moines residents.
| Immigration Origin | # Population | % Population |
| Afghanistan | 74 | 0.0% |
| Africa | 6,576 | 3.1% |
| Argentina | 52 | 0.0% |
| Asia | 10,403 | 4.9% |
| Australia | 35 | 0.0% |
| Belize | 15 | 0.0% |
| Bolivia | 5 | 0.0% |
| Bosnia and Herzegovina | 675 | 0.3% |
| Brazil | 59 | 0.0% |
| Bulgaria | 10 | 0.0% |
| Cambodia | 141 | 0.1% |
| Cameroon | 21 | 0.0% |
| Canada | 136 | 0.1% |
| Caribbean | 284 | 0.1% |
| Central America | 9,782 | 4.6% |
| Chile | 7 | 0.0% |
| China | 543 | 0.3% |
| Colombia | 38 | 0.0% |
| Congo | 611 | 0.3% |
| Costa Rica | 42 | 0.0% |
| Croatia | 106 | 0.1% |
| Cuba | 82 | 0.0% |
| Denmark | 11 | 0.0% |
| Dominican Republic | 138 | 0.1% |
| Eastern Africa | 2,640 | 1.2% |
| Eastern Asia | 746 | 0.4% |
| Eastern Europe | 1,076 | 0.5% |
| Ecuador | 61 | 0.0% |
| Egypt | 234 | 0.1% |
| El Salvador | 1,698 | 0.8% |
| England | 82 | 0.0% |
| Eritrea | 186 | 0.1% |
| Ethiopia | 322 | 0.2% |
| Europe | 1,605 | 0.7% |
| France | 7 | 0.0% |
| Germany | 127 | 0.1% |
| Ghana | 173 | 0.1% |
| Guatemala | 645 | 0.3% |
| Haiti | 25 | 0.0% |
| Honduras | 295 | 0.1% |
| Hong Kong | 21 | 0.0% |
| India | 636 | 0.3% |
| Indonesia | 5 | 0.0% |
| Iraq | 114 | 0.1% |
| Ireland | 5 | 0.0% |
| Israel | 28 | 0.0% |
| Italy | 51 | 0.0% |
| Jamaica | 24 | 0.0% |
| Japan | 50 | 0.0% |
| Kenya | 235 | 0.1% |
| Korea | 153 | 0.1% |
| Kuwait | 11 | 0.0% |
| Laos | 1,364 | 0.6% |
| Latin America | 10,340 | 4.9% |
| Latvia | 23 | 0.0% |
| Lebanon | 108 | 0.1% |
| Liberia | 697 | 0.3% |
| Malaysia | 137 | 0.1% |
| Mexico | 7,074 | 3.3% |
| Micronesia | 7 | 0.0% |
| Middle Africa | 852 | 0.4% |
| Morocco | 11 | 0.0% |
| Nepal | 376 | 0.2% |
| Netherlands | 27 | 0.0% |
| Nigeria | 123 | 0.1% |
| Northern Africa | 1,400 | 0.7% |
| Northern Europe | 194 | 0.1% |
| Oceania | 48 | 0.0% |
| Pakistan | 49 | 0.0% |
| Peru | 18 | 0.0% |
| Philippines | 298 | 0.1% |
| Poland | 42 | 0.0% |
| Romania | 7 | 0.0% |
| Russia | 148 | 0.1% |
| Saudi Arabia | 34 | 0.0% |
| Scotland | 16 | 0.0% |
| Senegal | 44 | 0.0% |
| Serbia | 13 | 0.0% |
| Sierra Leone | 82 | 0.0% |
| Somalia | 409 | 0.2% |
| South Africa | 124 | 0.1% |
| South America | 274 | 0.1% |
| South Central Asia | 2,330 | 1.1% |
| South Eastern Asia | 6,930 | 3.3% |
| Southern Europe | 167 | 0.1% |
| Spain | 97 | 0.1% |
| Sri Lanka | 201 | 0.1% |
| Sudan | 1,155 | 0.5% |
| Syria | 23 | 0.0% |
| Taiwan | 8 | 0.0% |
| Thailand | 1,625 | 0.8% |
| Trinidad and Tobago | 15 | 0.0% |
| Turkey | 41 | 0.0% |
| Ukraine | 17 | 0.0% |
| Venezuela | 34 | 0.0% |
| Vietnam | 1,847 | 0.9% |
| Western Africa | 1,326 | 0.6% |
| Western Asia | 388 | 0.2% |
| Western Europe | 168 | 0.1% |
| Zaire | 137 | 0.1% |
| Zimbabwe | 20 | 0.0% | View All 101 Rows |
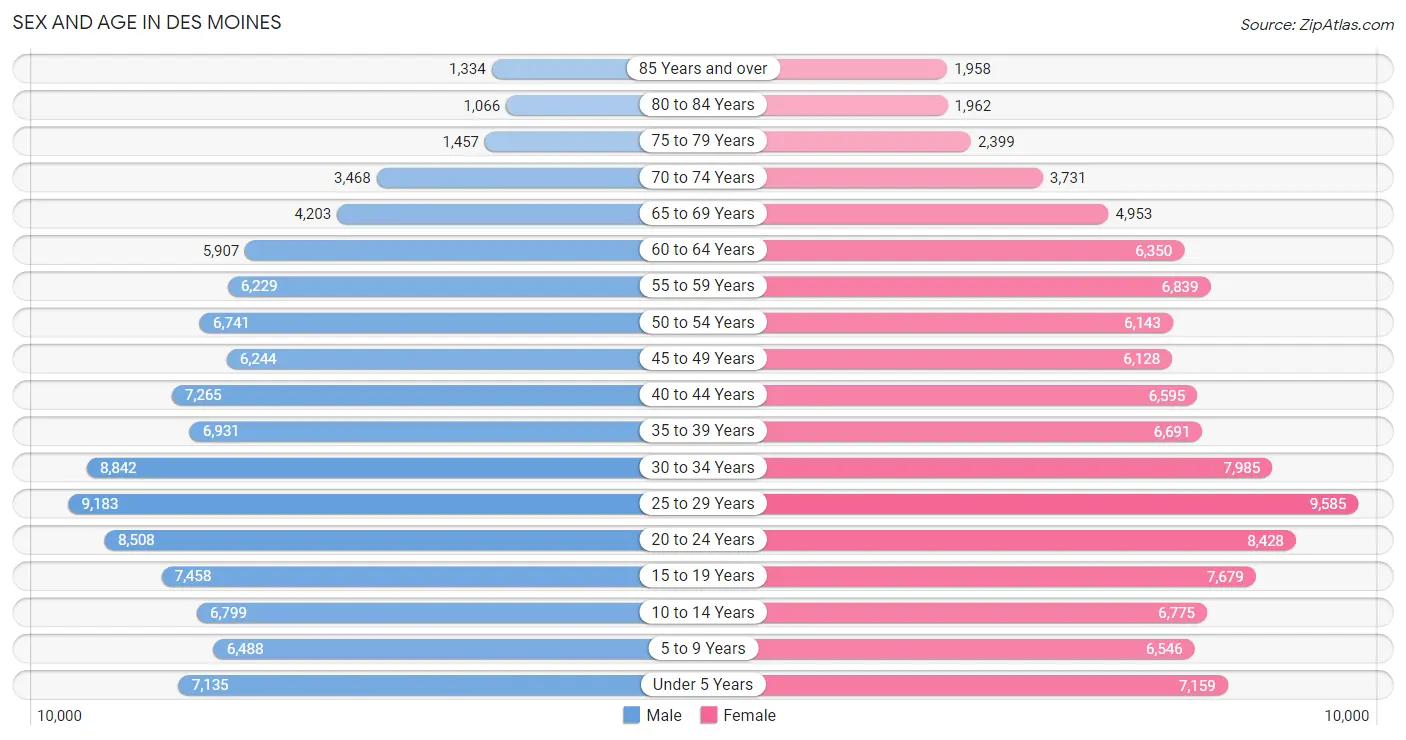
Sex and Age in Des Moines
Sex and Age in Des Moines
The most populous age groups in Des Moines are 25 to 29 Years (9,183 | 8.7%) for men and 25 to 29 Years (9,585 | 8.9%) for women.
| Age Bracket | Male | Female |
| Under 5 Years | 7,135 (6.8%) | 7,159 (6.6%) |
| 5 to 9 Years | 6,488 (6.2%) | 6,546 (6.1%) |
| 10 to 14 Years | 6,799 (6.5%) | 6,775 (6.3%) |
| 15 to 19 Years | 7,458 (7.1%) | 7,679 (7.1%) |
| 20 to 24 Years | 8,508 (8.1%) | 8,428 (7.8%) |
| 25 to 29 Years | 9,183 (8.7%) | 9,585 (8.9%) |
| 30 to 34 Years | 8,842 (8.4%) | 7,985 (7.4%) |
| 35 to 39 Years | 6,931 (6.6%) | 6,691 (6.2%) |
| 40 to 44 Years | 7,265 (6.9%) | 6,595 (6.1%) |
| 45 to 49 Years | 6,244 (5.9%) | 6,128 (5.7%) |
| 50 to 54 Years | 6,741 (6.4%) | 6,143 (5.7%) |
| 55 to 59 Years | 6,229 (5.9%) | 6,839 (6.3%) |
| 60 to 64 Years | 5,907 (5.6%) | 6,350 (5.9%) |
| 65 to 69 Years | 4,203 (4.0%) | 4,953 (4.6%) |
| 70 to 74 Years | 3,468 (3.3%) | 3,731 (3.5%) |
| 75 to 79 Years | 1,457 (1.4%) | 2,399 (2.2%) |
| 80 to 84 Years | 1,066 (1.0%) | 1,962 (1.8%) |
| 85 Years and over | 1,334 (1.3%) | 1,958 (1.8%) |
| Total | 105,258 (100.0%) | 107,906 (100.0%) |
Families and Households in Des Moines
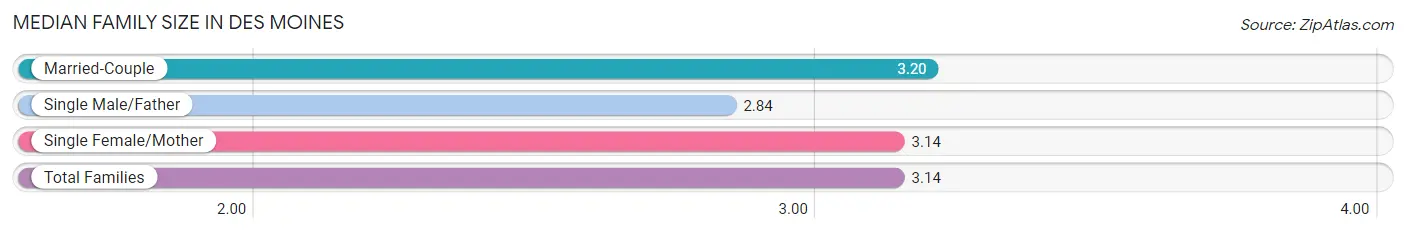
Median Family Size in Des Moines
The median family size in Des Moines is 3.14 persons per family, with married-couple families (30,832 | 64.2%) accounting for the largest median family size of 3.2 persons per family. On the other hand, single male/father families (4,842 | 10.1%) represent the smallest median family size with 2.84 persons per family.
| Family Type | # Families | Family Size |
| Married-Couple | 30,832 (64.2%) | 3.20 |
| Single Male/Father | 4,842 (10.1%) | 2.84 |
| Single Female/Mother | 12,310 (25.7%) | 3.14 |
| Total Families | 47,984 (100.0%) | 3.14 |
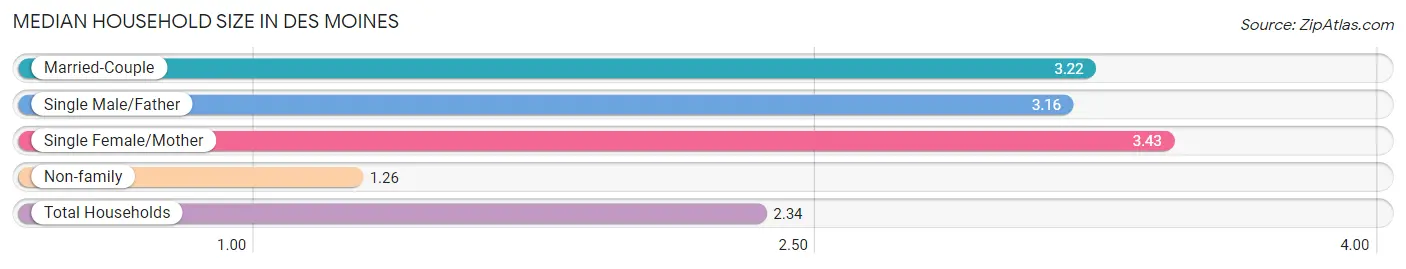
Median Household Size in Des Moines
The median household size in Des Moines is 2.34 persons per household, with single female/mother households (12,310 | 13.9%) accounting for the largest median household size of 3.43 persons per household. non-family households (40,910 | 46.0%) represent the smallest median household size with 1.26 persons per household.
| Household Type | # Households | Household Size |
| Married-Couple | 30,832 (34.7%) | 3.22 |
| Single Male/Father | 4,842 (5.4%) | 3.16 |
| Single Female/Mother | 12,310 (13.9%) | 3.43 |
| Non-family | 40,910 (46.0%) | 1.26 |
| Total Households | 88,894 (100.0%) | 2.34 |
Household Size by Marriage Status in Des Moines
Out of a total of 88,894 households in Des Moines, 47,984 (54.0%) are family households, while 40,910 (46.0%) are nonfamily households. The most numerous type of family households are 2-person households, comprising 19,918, and the most common type of nonfamily households are 1-person households, comprising 32,210.
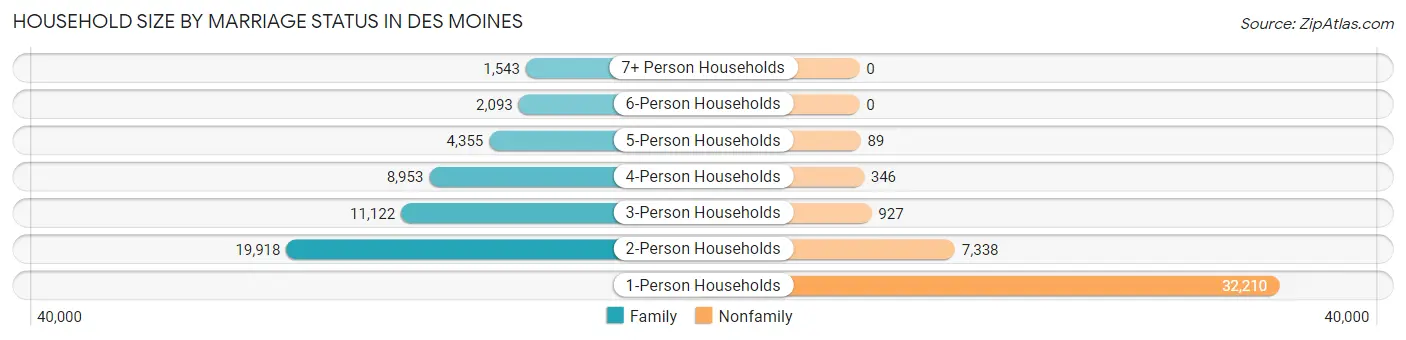
| Household Size | Family Households | Nonfamily Households |
| 1-Person Households | - | 32,210 (36.2%) |
| 2-Person Households | 19,918 (22.4%) | 7,338 (8.3%) |
| 3-Person Households | 11,122 (12.5%) | 927 (1.0%) |
| 4-Person Households | 8,953 (10.1%) | 346 (0.4%) |
| 5-Person Households | 4,355 (4.9%) | 89 (0.1%) |
| 6-Person Households | 2,093 (2.4%) | 0 (0.0%) |
| 7+ Person Households | 1,543 (1.7%) | 0 (0.0%) |
| Total | 47,984 (54.0%) | 40,910 (46.0%) |
Female Fertility in Des Moines
Fertility by Age in Des Moines
Average fertility rate in Des Moines is 47.0 births per 1,000 women. Women in the age bracket of 20 to 34 years have the highest fertility rate with 71.0 births per 1,000 women. Women in the age bracket of 20 to 34 years acount for 72.5% of all women with births.
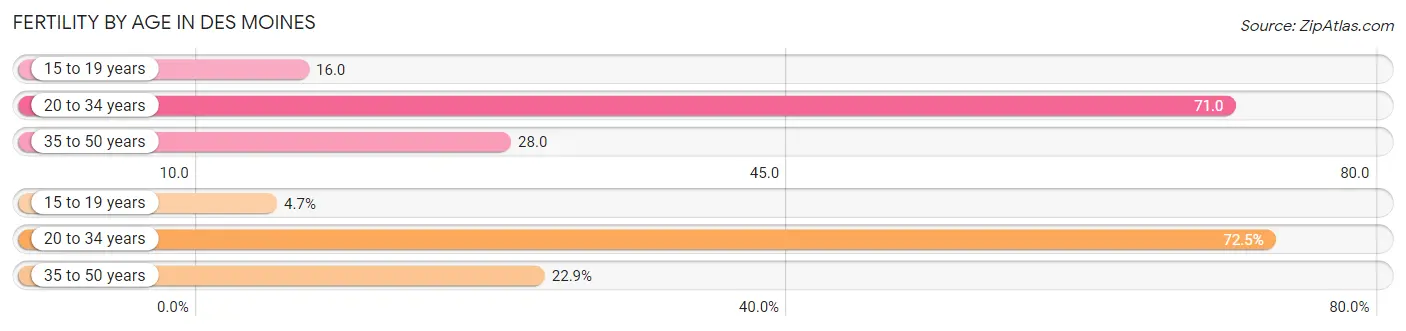
| Age Bracket | Women with Births | Births / 1,000 Women |
| 15 to 19 years | 120 (4.7%) | 16.0 |
| 20 to 34 years | 1,854 (72.5%) | 71.0 |
| 35 to 50 years | 585 (22.9%) | 28.0 |
| Total | 2,559 (100.0%) | 47.0 |
Fertility by Age by Marriage Status in Des Moines
68.5% of women with births (2,559) in Des Moines are married. The highest percentage of unmarried women with births falls into 15 to 19 years age bracket with 67.5% of them unmarried at the time of birth, while the lowest percentage of unmarried women with births belong to 35 to 50 years age bracket with 22.1% of them unmarried.
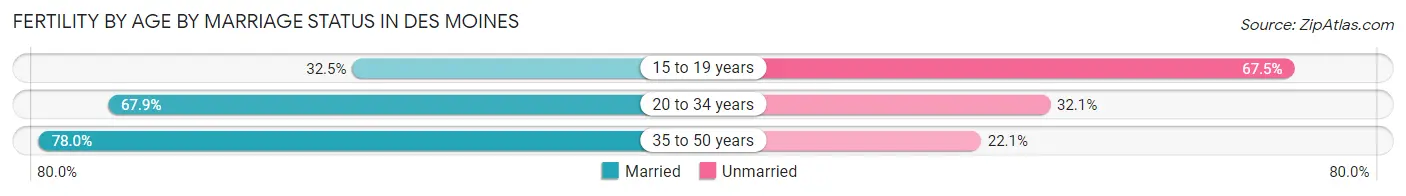
| Age Bracket | Married | Unmarried |
| 15 to 19 years | 39 (32.5%) | 81 (67.5%) |
| 20 to 34 years | 1,259 (67.9%) | 595 (32.1%) |
| 35 to 50 years | 456 (77.9%) | 129 (22.1%) |
| Total | 1,753 (68.5%) | 806 (31.5%) |
Fertility by Education in Des Moines
Average fertility rate in Des Moines is 47.0 births per 1,000 women. Women with the education attainment of high school diploma have the highest fertility rate of 62.0 births per 1,000 women, while women with the education attainment of college or associate's degree have the lowest fertility at 39.0 births per 1,000 women. Women with the education attainment of high school diploma represent 29.7% of all women with births.
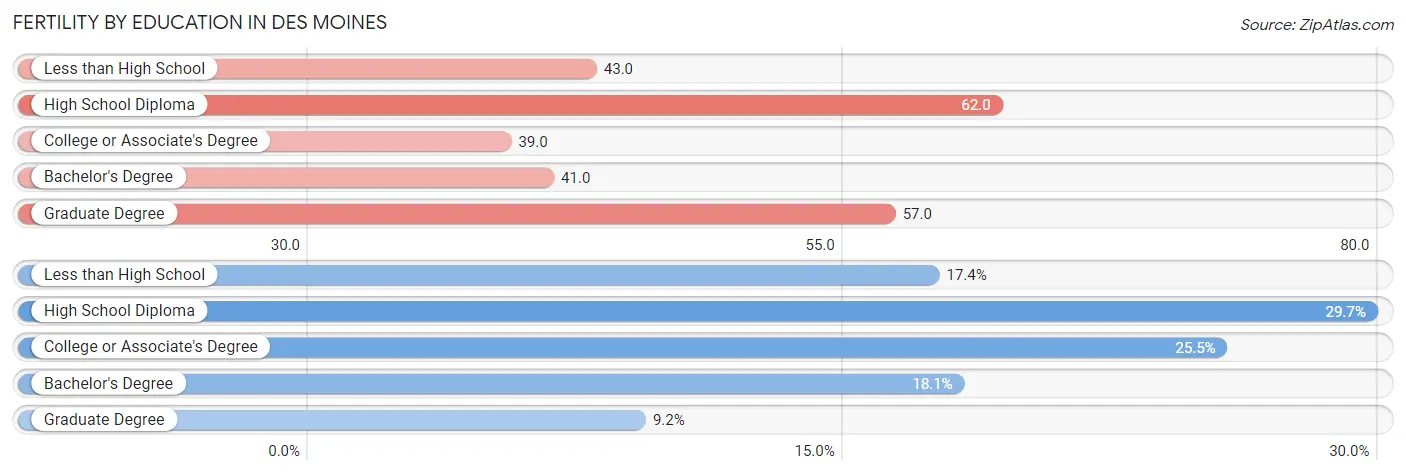
| Educational Attainment | Women with Births | Births / 1,000 Women |
| Less than High School | 446 (17.4%) | 43.0 |
| High School Diploma | 761 (29.7%) | 62.0 |
| College or Associate's Degree | 653 (25.5%) | 39.0 |
| Bachelor's Degree | 464 (18.1%) | 41.0 |
| Graduate Degree | 235 (9.2%) | 57.0 |
| Total | 2,559 (100.0%) | 47.0 |
Fertility by Education by Marriage Status in Des Moines
31.5% of women with births in Des Moines are unmarried. Women with the educational attainment of graduate degree are most likely to be married with 92.3% of them married at childbirth, while women with the educational attainment of high school diploma are least likely to be married with 48.9% of them unmarried at childbirth.
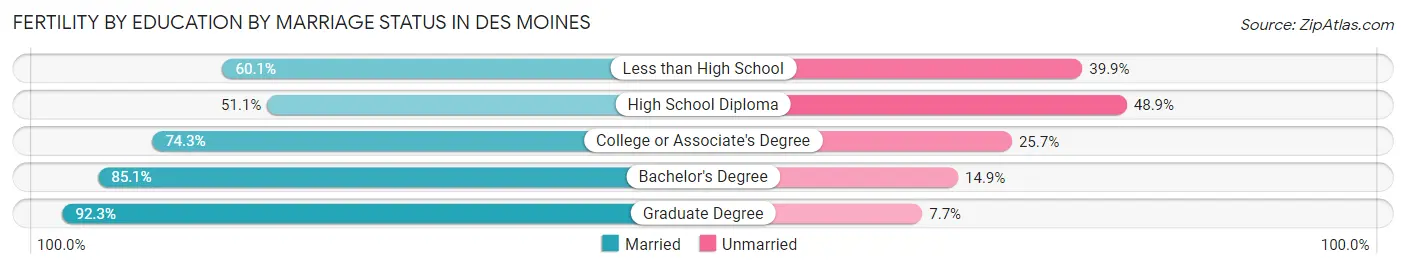
| Educational Attainment | Married | Unmarried |
| Less than High School | 268 (60.1%) | 178 (39.9%) |
| High School Diploma | 389 (51.1%) | 372 (48.9%) |
| College or Associate's Degree | 485 (74.3%) | 168 (25.7%) |
| Bachelor's Degree | 395 (85.1%) | 69 (14.9%) |
| Graduate Degree | 217 (92.3%) | 18 (7.7%) |
| Total | 1,753 (68.5%) | 806 (31.5%) |
Employment Characteristics in Des Moines
Employment by Class of Employer in Des Moines
Among the 108,847 employed individuals in Des Moines, private company employees (80,293 | 73.8%), not-for-profit organizations (10,279 | 9.4%), and self-employed (not incorporated) (4,896 | 4.5%) make up the most common classes of employment.
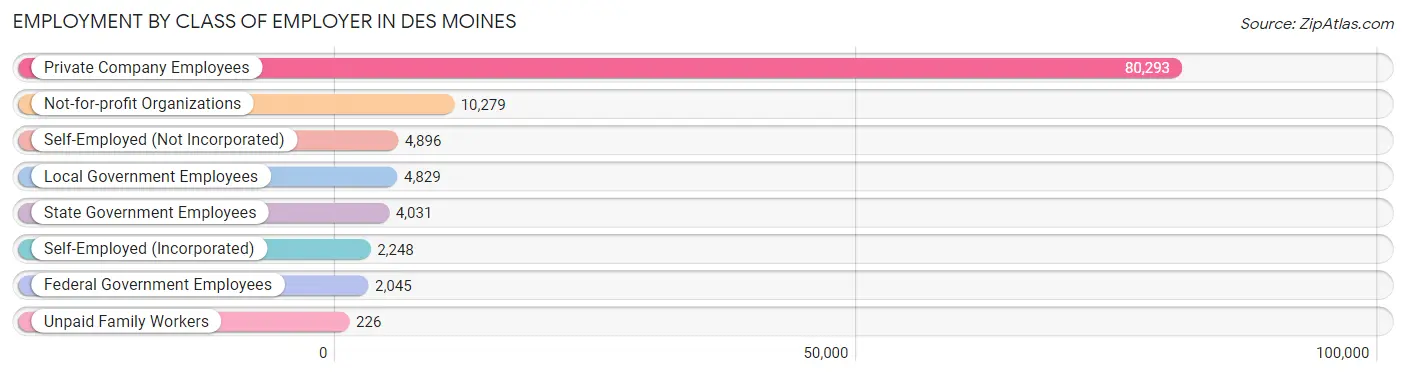
| Employer Class | # Employees | % Employees |
| Private Company Employees | 80,293 | 73.8% |
| Self-Employed (Incorporated) | 2,248 | 2.1% |
| Self-Employed (Not Incorporated) | 4,896 | 4.5% |
| Not-for-profit Organizations | 10,279 | 9.4% |
| Local Government Employees | 4,829 | 4.4% |
| State Government Employees | 4,031 | 3.7% |
| Federal Government Employees | 2,045 | 1.9% |
| Unpaid Family Workers | 226 | 0.2% |
| Total | 108,847 | 100.0% |
Employment Status by Age in Des Moines
According to the labor force statistics for Des Moines, out of the total population over 16 years of age (169,616), 70.0% or 118,731 individuals are in the labor force, with 5.9% or 7,005 of them unemployed. The age group with the highest labor force participation rate is 35 to 44 years, with 88.6% or 24,349 individuals in the labor force. Within the labor force, the 16 to 19 years age range has the highest percentage of unemployed individuals, with 17.3% or 1,128 of them being unemployed.
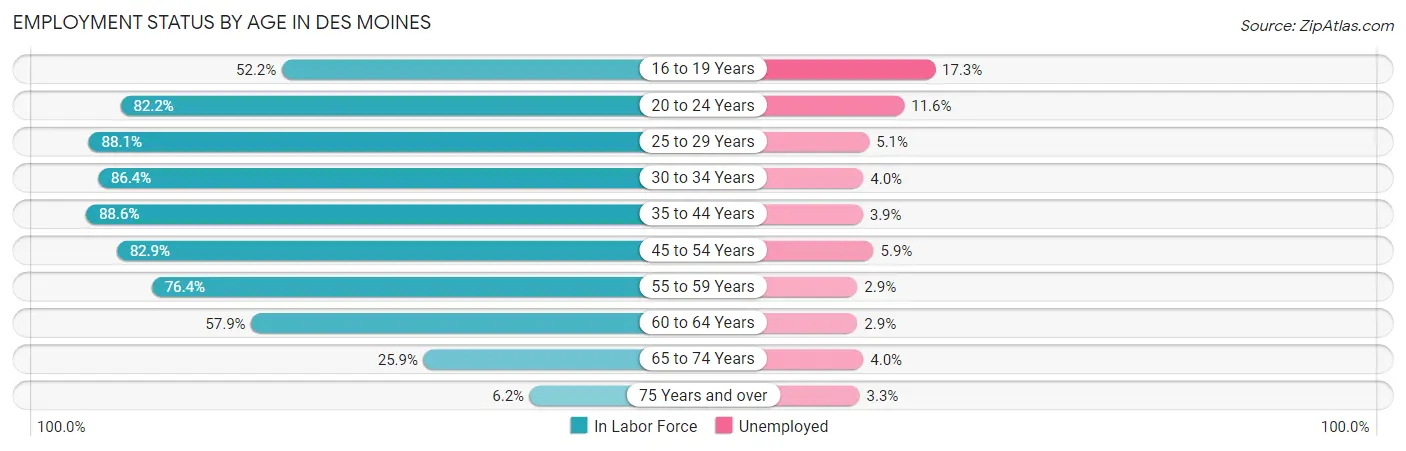
| Age Bracket | In Labor Force | Unemployed |
| 16 to 19 Years | 6,520 (52.2%) | 1,128 (17.3%) |
| 20 to 24 Years | 13,921 (82.2%) | 1,615 (11.6%) |
| 25 to 29 Years | 16,535 (88.1%) | 843 (5.1%) |
| 30 to 34 Years | 14,539 (86.4%) | 582 (4.0%) |
| 35 to 44 Years | 24,349 (88.6%) | 950 (3.9%) |
| 45 to 54 Years | 20,937 (82.9%) | 1,235 (5.9%) |
| 55 to 59 Years | 9,984 (76.4%) | 290 (2.9%) |
| 60 to 64 Years | 7,097 (57.9%) | 206 (2.9%) |
| 65 to 74 Years | 4,236 (25.9%) | 169 (4.0%) |
| 75 Years and over | 631 (6.2%) | 21 (3.3%) |
| Total | 118,731 (70.0%) | 7,005 (5.9%) |
Employment Status by Educational Attainment in Des Moines
According to labor force statistics for Des Moines, 82.2% of individuals (93,427) out of the total population between 25 and 64 years of age (113,658) are in the labor force, with 4.4% or 4,111 of them being unemployed. The group with the highest labor force participation rate are those with the educational attainment of bachelor's degree or higher, with 90.8% or 30,428 individuals in the labor force. Within the labor force, individuals with less than high school education have the highest percentage of unemployment, with 7.2% or 746 of them being unemployed.
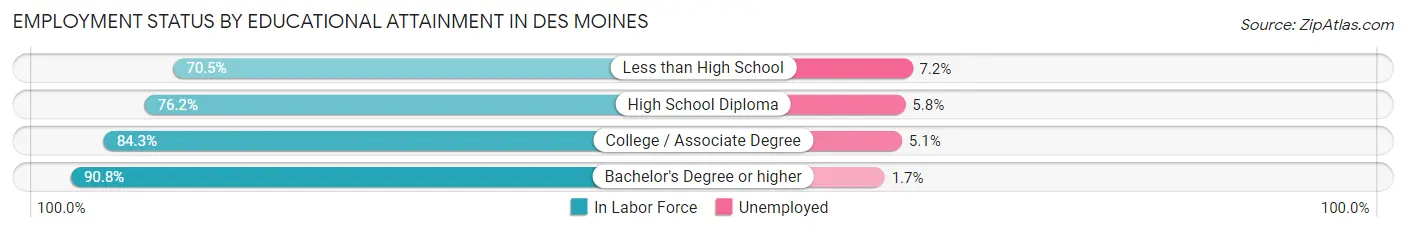
| Educational Attainment | In Labor Force | Unemployed |
| Less than High School | 10,365 (70.5%) | 1,059 (7.2%) |
| High School Diploma | 24,012 (76.2%) | 1,828 (5.8%) |
| College / Associate Degree | 28,606 (84.3%) | 1,731 (5.1%) |
| Bachelor's Degree or higher | 30,428 (90.8%) | 570 (1.7%) |
| Total | 93,427 (82.2%) | 5,001 (4.4%) |
Employment Occupations by Sex in Des Moines
Management, Business, Science and Arts Occupations
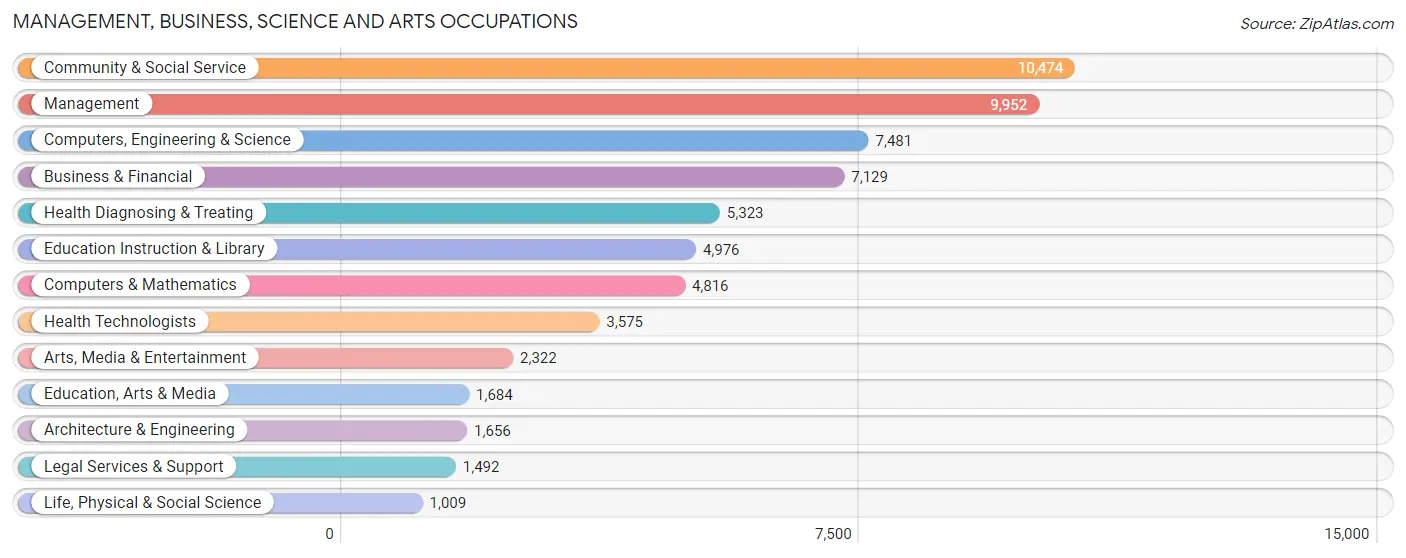
The most common Management, Business, Science and Arts occupations in Des Moines are Community & Social Service (10,474 | 9.4%), Management (9,952 | 8.9%), Computers, Engineering & Science (7,481 | 6.7%), Business & Financial (7,129 | 6.4%), and Health Diagnosing & Treating (5,323 | 4.8%).
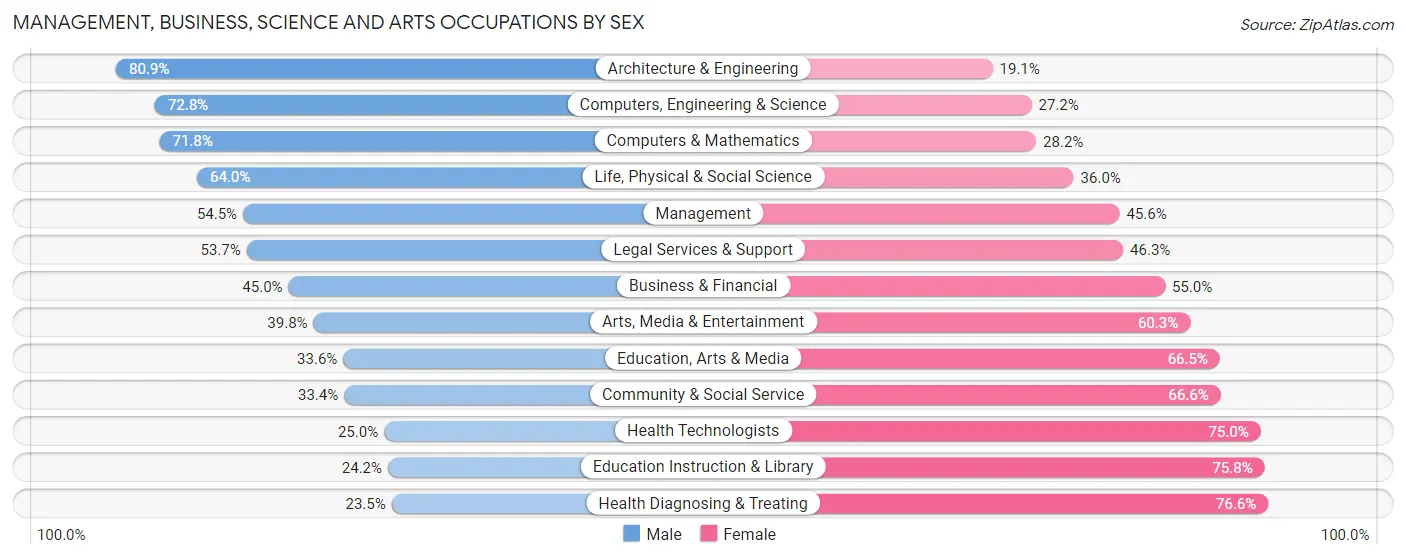
Management, Business, Science and Arts Occupations by Sex
Within the Management, Business, Science and Arts occupations in Des Moines, the most male-oriented occupations are Architecture & Engineering (80.9%), Computers, Engineering & Science (72.8%), and Computers & Mathematics (71.8%), while the most female-oriented occupations are Health Diagnosing & Treating (76.5%), Education Instruction & Library (75.8%), and Health Technologists (75.0%).
| Occupation | Male | Female |
| Management | 5,419 (54.4%) | 4,533 (45.6%) |
| Business & Financial | 3,206 (45.0%) | 3,923 (55.0%) |
| Computers, Engineering & Science | 5,446 (72.8%) | 2,035 (27.2%) |
| Computers & Mathematics | 3,460 (71.8%) | 1,356 (28.2%) |
| Architecture & Engineering | 1,340 (80.9%) | 316 (19.1%) |
| Life, Physical & Social Science | 646 (64.0%) | 363 (36.0%) |
| Community & Social Service | 3,494 (33.4%) | 6,980 (66.6%) |
| Education, Arts & Media | 565 (33.6%) | 1,119 (66.4%) |
| Legal Services & Support | 801 (53.7%) | 691 (46.3%) |
| Education Instruction & Library | 1,205 (24.2%) | 3,771 (75.8%) |
| Arts, Media & Entertainment | 923 (39.8%) | 1,399 (60.3%) |
| Health Diagnosing & Treating | 1,248 (23.4%) | 4,075 (76.5%) |
| Health Technologists | 895 (25.0%) | 2,680 (75.0%) |
| Total (Category) | 18,813 (46.6%) | 21,546 (53.4%) |
| Total (Overall) | 58,026 (52.0%) | 53,572 (48.0%) |
Services Occupations
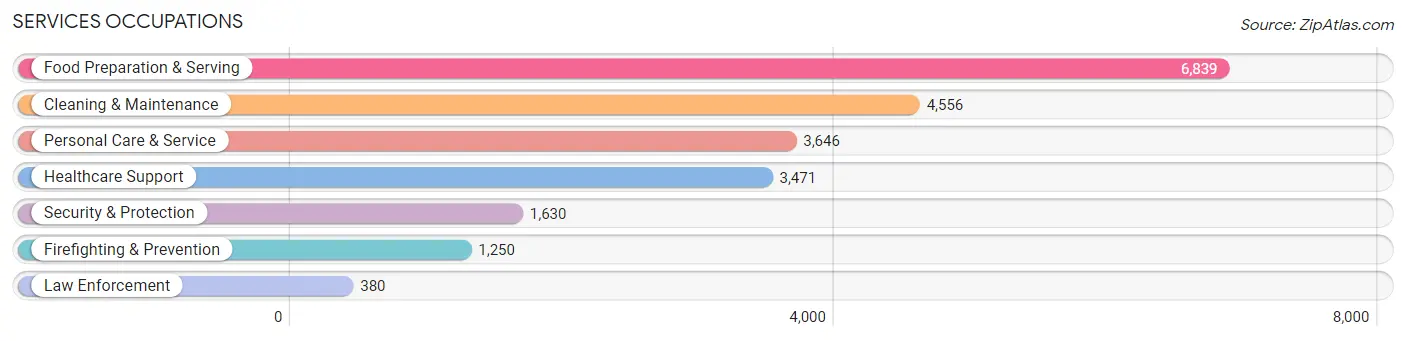
The most common Services occupations in Des Moines are Food Preparation & Serving (6,839 | 6.1%), Cleaning & Maintenance (4,556 | 4.1%), Personal Care & Service (3,646 | 3.3%), Healthcare Support (3,471 | 3.1%), and Security & Protection (1,630 | 1.5%).
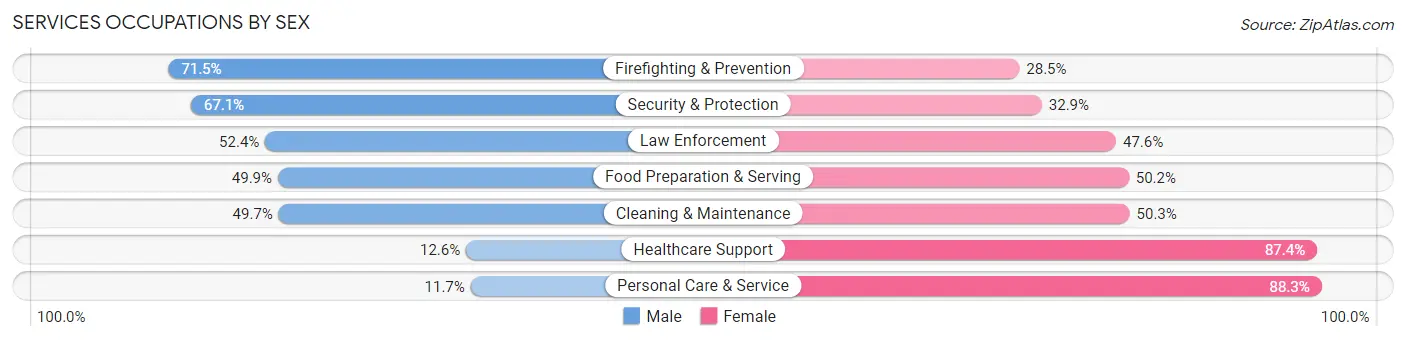
Services Occupations by Sex
Within the Services occupations in Des Moines, the most male-oriented occupations are Firefighting & Prevention (71.5%), Security & Protection (67.1%), and Law Enforcement (52.4%), while the most female-oriented occupations are Personal Care & Service (88.3%), Healthcare Support (87.4%), and Cleaning & Maintenance (50.3%).
| Occupation | Male | Female |
| Healthcare Support | 437 (12.6%) | 3,034 (87.4%) |
| Security & Protection | 1,093 (67.1%) | 537 (32.9%) |
| Firefighting & Prevention | 894 (71.5%) | 356 (28.5%) |
| Law Enforcement | 199 (52.4%) | 181 (47.6%) |
| Food Preparation & Serving | 3,409 (49.8%) | 3,430 (50.1%) |
| Cleaning & Maintenance | 2,264 (49.7%) | 2,292 (50.3%) |
| Personal Care & Service | 426 (11.7%) | 3,220 (88.3%) |
| Total (Category) | 7,629 (37.9%) | 12,513 (62.1%) |
| Total (Overall) | 58,026 (52.0%) | 53,572 (48.0%) |
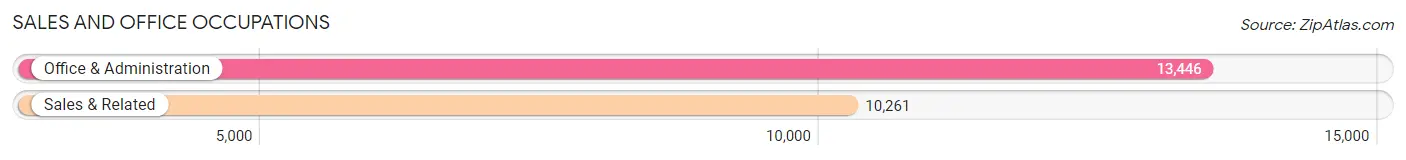
Sales and Office Occupations
The most common Sales and Office occupations in Des Moines are Office & Administration (13,446 | 12.0%), and Sales & Related (10,261 | 9.2%).
Sales and Office Occupations by Sex
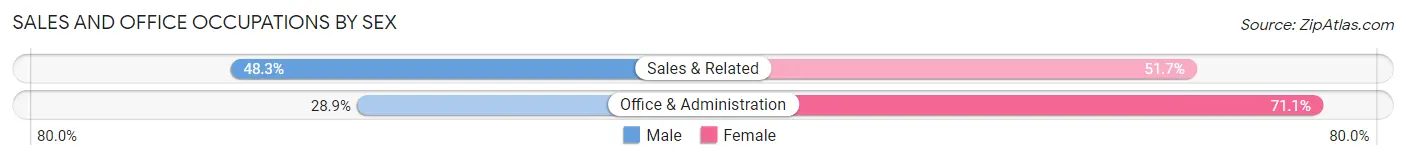
| Occupation | Male | Female |
| Sales & Related | 4,957 (48.3%) | 5,304 (51.7%) |
| Office & Administration | 3,885 (28.9%) | 9,561 (71.1%) |
| Total (Category) | 8,842 (37.3%) | 14,865 (62.7%) |
| Total (Overall) | 58,026 (52.0%) | 53,572 (48.0%) |
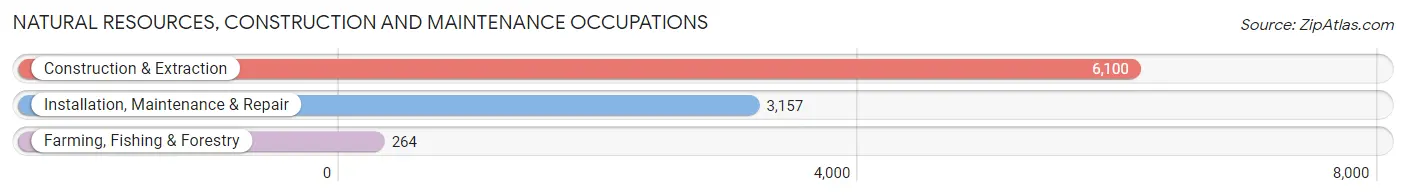
Natural Resources, Construction and Maintenance Occupations
The most common Natural Resources, Construction and Maintenance occupations in Des Moines are Construction & Extraction (6,100 | 5.5%), Installation, Maintenance & Repair (3,157 | 2.8%), and Farming, Fishing & Forestry (264 | 0.2%).
Natural Resources, Construction and Maintenance Occupations by Sex
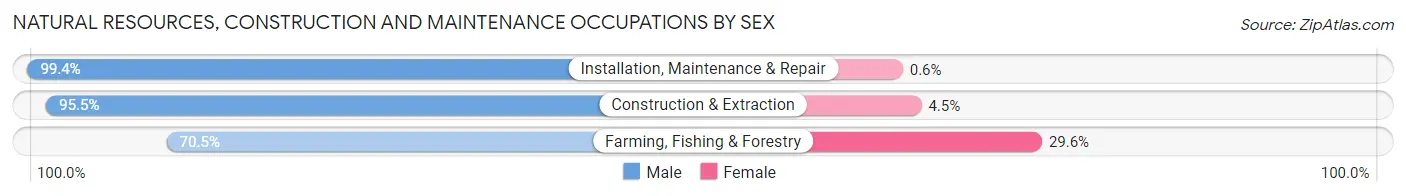
| Occupation | Male | Female |
| Farming, Fishing & Forestry | 186 (70.5%) | 78 (29.5%) |
| Construction & Extraction | 5,827 (95.5%) | 273 (4.5%) |
| Installation, Maintenance & Repair | 3,138 (99.4%) | 19 (0.6%) |
| Total (Category) | 9,151 (96.1%) | 370 (3.9%) |
| Total (Overall) | 58,026 (52.0%) | 53,572 (48.0%) |
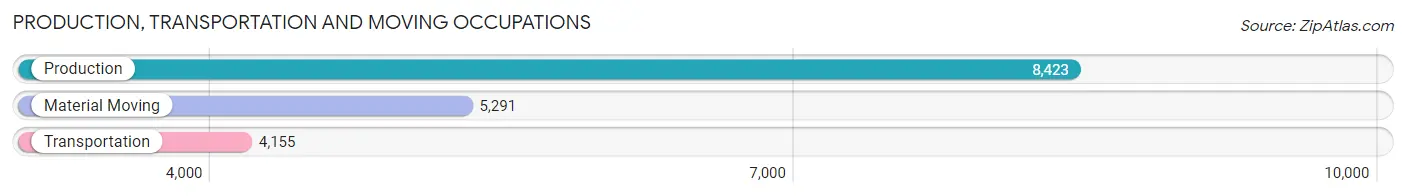
Production, Transportation and Moving Occupations
The most common Production, Transportation and Moving occupations in Des Moines are Production (8,423 | 7.5%), Material Moving (5,291 | 4.7%), and Transportation (4,155 | 3.7%).
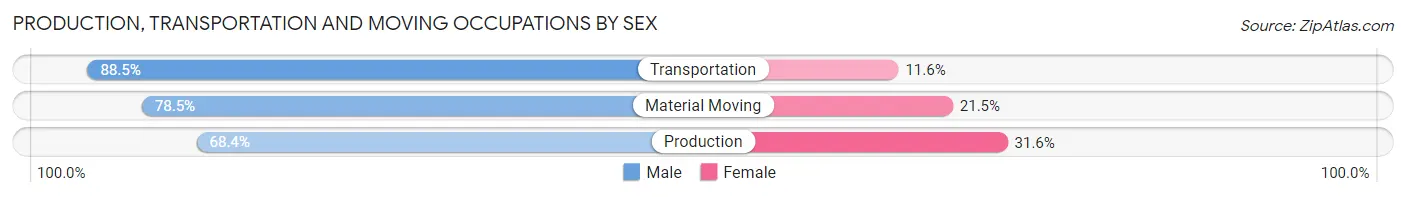
Production, Transportation and Moving Occupations by Sex
| Occupation | Male | Female |
| Production | 5,764 (68.4%) | 2,659 (31.6%) |
| Transportation | 3,675 (88.4%) | 480 (11.6%) |
| Material Moving | 4,152 (78.5%) | 1,139 (21.5%) |
| Total (Category) | 13,591 (76.1%) | 4,278 (23.9%) |
| Total (Overall) | 58,026 (52.0%) | 53,572 (48.0%) |
Employment Industries by Sex in Des Moines
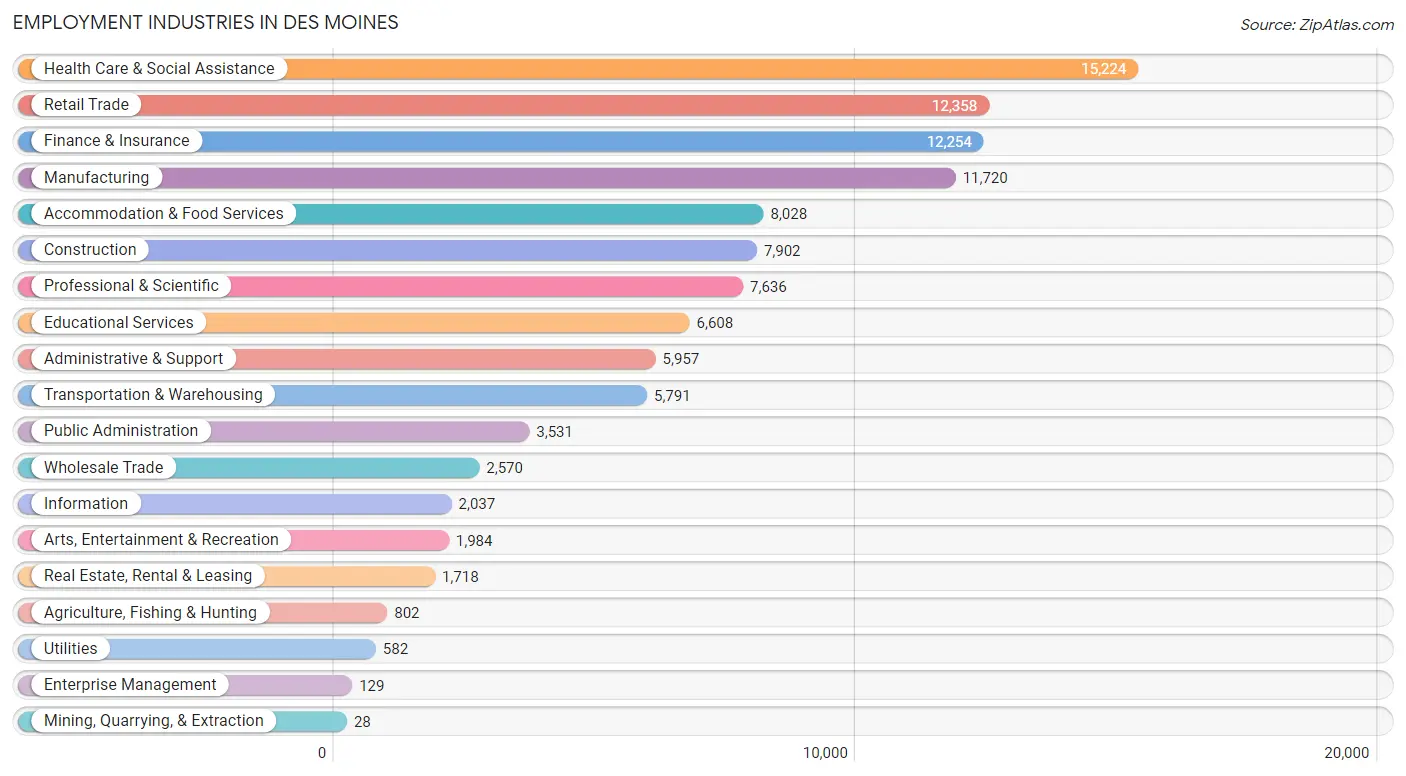
Employment Industries in Des Moines
The major employment industries in Des Moines include Health Care & Social Assistance (15,224 | 13.6%), Retail Trade (12,358 | 11.1%), Finance & Insurance (12,254 | 11.0%), Manufacturing (11,720 | 10.5%), and Accommodation & Food Services (8,028 | 7.2%).
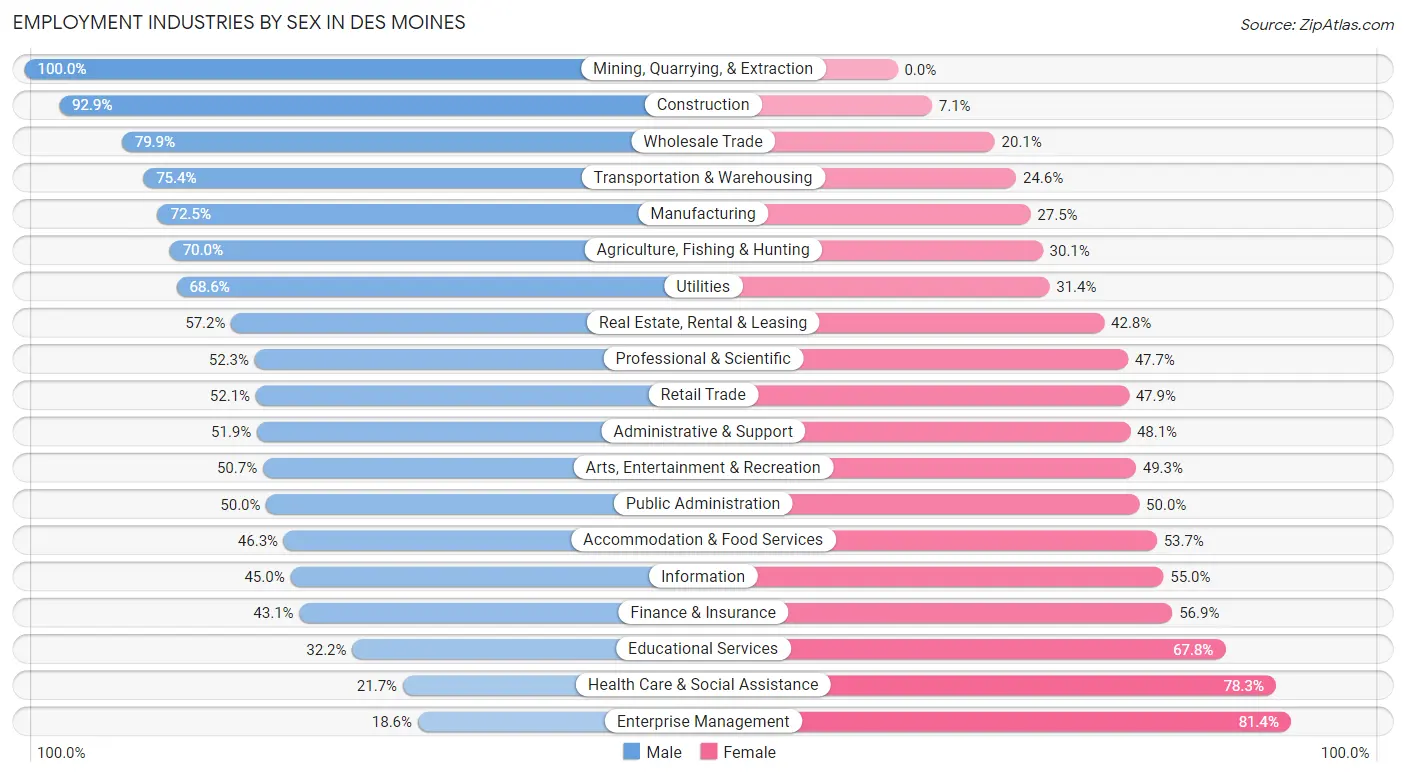
Employment Industries by Sex in Des Moines
The Des Moines industries that see more men than women are Mining, Quarrying, & Extraction (100.0%), Construction (92.9%), and Wholesale Trade (79.9%), whereas the industries that tend to have a higher number of women are Enterprise Management (81.4%), Health Care & Social Assistance (78.3%), and Educational Services (67.8%).
| Industry | Male | Female |
| Agriculture, Fishing & Hunting | 561 (70.0%) | 241 (30.0%) |
| Mining, Quarrying, & Extraction | 28 (100.0%) | 0 (0.0%) |
| Construction | 7,339 (92.9%) | 563 (7.1%) |
| Manufacturing | 8,494 (72.5%) | 3,226 (27.5%) |
| Wholesale Trade | 2,053 (79.9%) | 517 (20.1%) |
| Retail Trade | 6,441 (52.1%) | 5,917 (47.9%) |
| Transportation & Warehousing | 4,369 (75.4%) | 1,422 (24.6%) |
| Utilities | 399 (68.6%) | 183 (31.4%) |
| Information | 916 (45.0%) | 1,121 (55.0%) |
| Finance & Insurance | 5,284 (43.1%) | 6,970 (56.9%) |
| Real Estate, Rental & Leasing | 983 (57.2%) | 735 (42.8%) |
| Professional & Scientific | 3,997 (52.3%) | 3,639 (47.7%) |
| Enterprise Management | 24 (18.6%) | 105 (81.4%) |
| Administrative & Support | 3,090 (51.9%) | 2,867 (48.1%) |
| Educational Services | 2,125 (32.2%) | 4,483 (67.8%) |
| Health Care & Social Assistance | 3,304 (21.7%) | 11,920 (78.3%) |
| Arts, Entertainment & Recreation | 1,005 (50.7%) | 979 (49.3%) |
| Accommodation & Food Services | 3,719 (46.3%) | 4,309 (53.7%) |
| Public Administration | 1,764 (50.0%) | 1,767 (50.0%) |
| Total | 58,026 (52.0%) | 53,572 (48.0%) |
Education in Des Moines
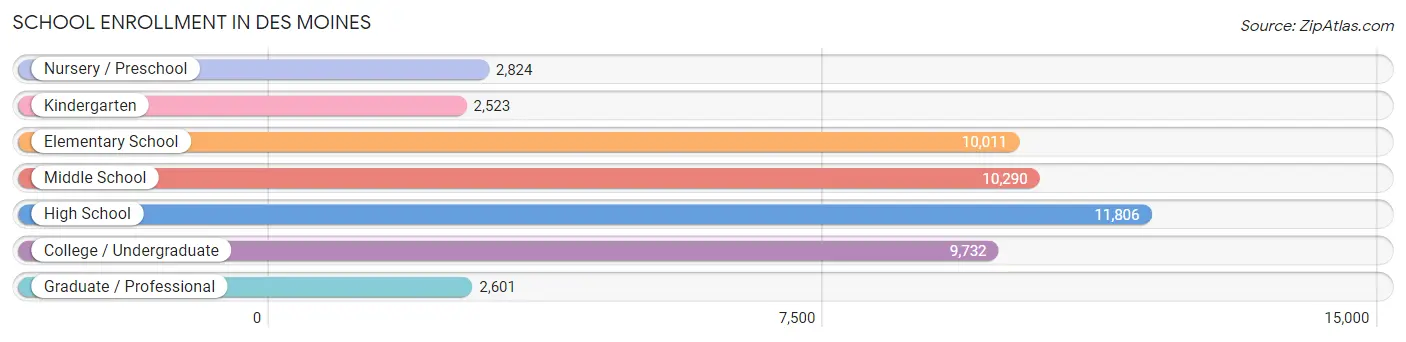
School Enrollment in Des Moines
The most common levels of schooling among the 49,787 students in Des Moines are high school (11,806 | 23.7%), middle school (10,290 | 20.7%), and elementary school (10,011 | 20.1%).
| School Level | # Students | % Students |
| Nursery / Preschool | 2,824 | 5.7% |
| Kindergarten | 2,523 | 5.1% |
| Elementary School | 10,011 | 20.1% |
| Middle School | 10,290 | 20.7% |
| High School | 11,806 | 23.7% |
| College / Undergraduate | 9,732 | 19.6% |
| Graduate / Professional | 2,601 | 5.2% |
| Total | 49,787 | 100.0% |
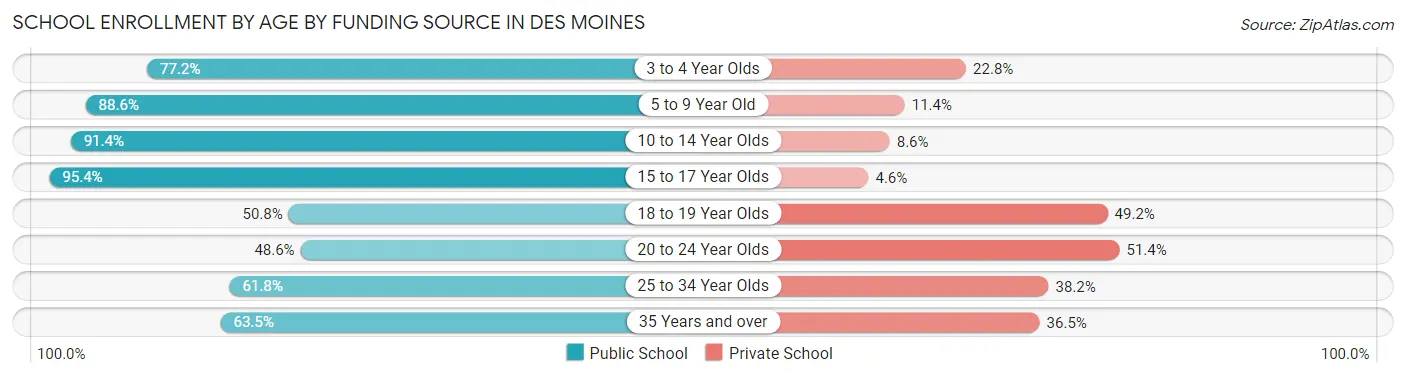
School Enrollment by Age by Funding Source in Des Moines
Out of a total of 49,787 students who are enrolled in schools in Des Moines, 10,057 (20.2%) attend a private institution, while the remaining 39,730 (79.8%) are enrolled in public schools. The age group of 20 to 24 year olds has the highest likelihood of being enrolled in private schools, with 2,727 (51.4% in the age bracket) enrolled. Conversely, the age group of 15 to 17 year olds has the lowest likelihood of being enrolled in a private school, with 7,664 (95.4% in the age bracket) attending a public institution.
| Age Bracket | Public School | Private School |
| 3 to 4 Year Olds | 1,462 (77.2%) | 432 (22.8%) |
| 5 to 9 Year Old | 10,730 (88.6%) | 1,378 (11.4%) |
| 10 to 14 Year Olds | 11,967 (91.4%) | 1,125 (8.6%) |
| 15 to 17 Year Olds | 7,664 (95.4%) | 372 (4.6%) |
| 18 to 19 Year Olds | 2,166 (50.8%) | 2,095 (49.2%) |
| 20 to 24 Year Olds | 2,580 (48.6%) | 2,727 (51.4%) |
| 25 to 34 Year Olds | 2,166 (61.8%) | 1,337 (38.2%) |
| 35 Years and over | 1,007 (63.5%) | 579 (36.5%) |
| Total | 39,730 (79.8%) | 10,057 (20.2%) |
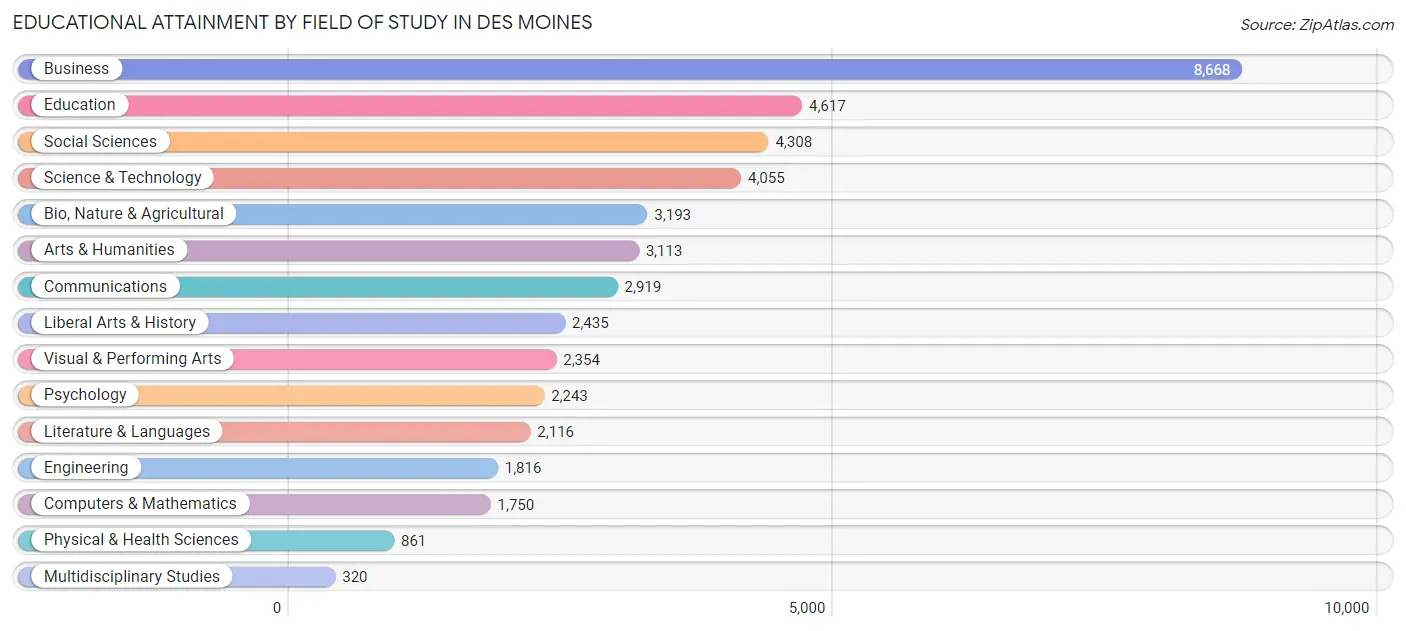
Educational Attainment by Field of Study in Des Moines
Business (8,668 | 19.4%), education (4,617 | 10.3%), social sciences (4,308 | 9.6%), science & technology (4,055 | 9.1%), and bio, nature & agricultural (3,193 | 7.1%) are the most common fields of study among 44,768 individuals in Des Moines who have obtained a bachelor's degree or higher.
| Field of Study | # Graduates | % Graduates |
| Computers & Mathematics | 1,750 | 3.9% |
| Bio, Nature & Agricultural | 3,193 | 7.1% |
| Physical & Health Sciences | 861 | 1.9% |
| Psychology | 2,243 | 5.0% |
| Social Sciences | 4,308 | 9.6% |
| Engineering | 1,816 | 4.1% |
| Multidisciplinary Studies | 320 | 0.7% |
| Science & Technology | 4,055 | 9.1% |
| Business | 8,668 | 19.4% |
| Education | 4,617 | 10.3% |
| Literature & Languages | 2,116 | 4.7% |
| Liberal Arts & History | 2,435 | 5.4% |
| Visual & Performing Arts | 2,354 | 5.3% |
| Communications | 2,919 | 6.5% |
| Arts & Humanities | 3,113 | 7.0% |
| Total | 44,768 | 100.0% |
Transportation & Commute in Des Moines
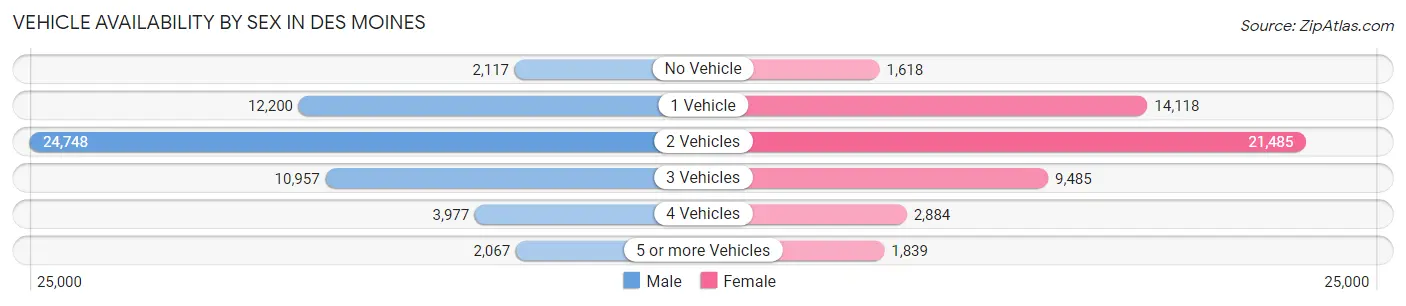
Vehicle Availability by Sex in Des Moines
The most prevalent vehicle ownership categories in Des Moines are males with 2 vehicles (24,748, accounting for 44.1%) and females with 2 vehicles (21,485, making up 48.1%).
| Vehicles Available | Male | Female |
| No Vehicle | 2,117 (3.8%) | 1,618 (3.2%) |
| 1 Vehicle | 12,200 (21.8%) | 14,118 (27.5%) |
| 2 Vehicles | 24,748 (44.1%) | 21,485 (41.8%) |
| 3 Vehicles | 10,957 (19.5%) | 9,485 (18.4%) |
| 4 Vehicles | 3,977 (7.1%) | 2,884 (5.6%) |
| 5 or more Vehicles | 2,067 (3.7%) | 1,839 (3.6%) |
| Total | 56,066 (100.0%) | 51,429 (100.0%) |
Commute Time in Des Moines
The most frequently occuring commute durations in Des Moines are 15 to 19 minutes (23,573 commuters, 24.1%), 20 to 24 minutes (19,090 commuters, 19.5%), and 10 to 14 minutes (18,790 commuters, 19.2%).
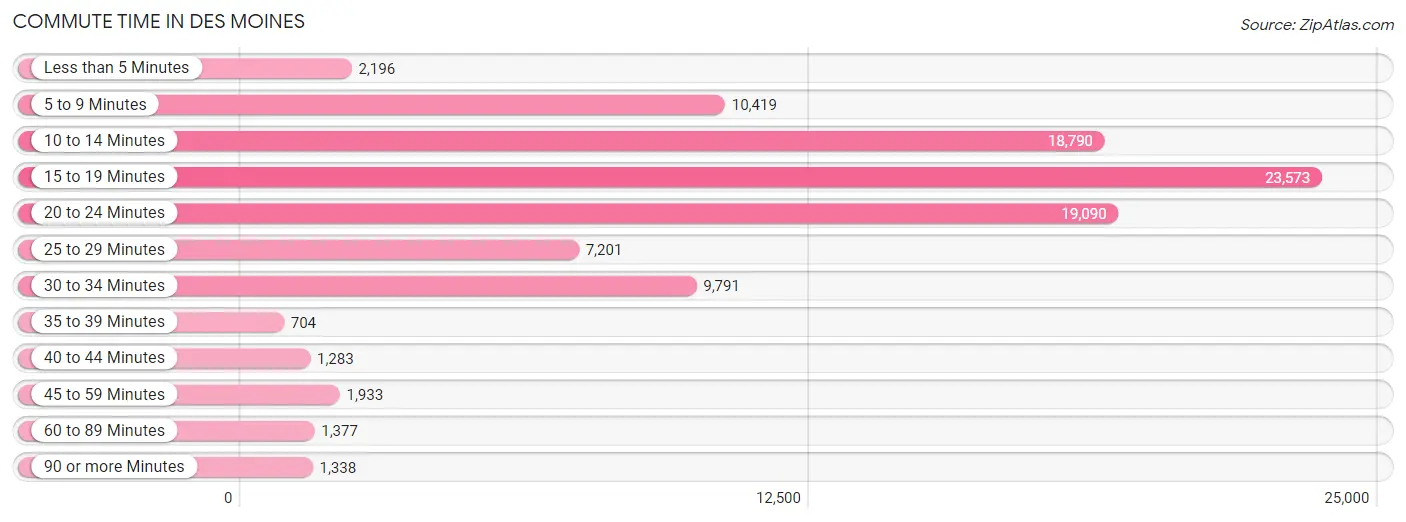
| Commute Time | # Commuters | % Commuters |
| Less than 5 Minutes | 2,196 | 2.2% |
| 5 to 9 Minutes | 10,419 | 10.7% |
| 10 to 14 Minutes | 18,790 | 19.2% |
| 15 to 19 Minutes | 23,573 | 24.1% |
| 20 to 24 Minutes | 19,090 | 19.5% |
| 25 to 29 Minutes | 7,201 | 7.4% |
| 30 to 34 Minutes | 9,791 | 10.0% |
| 35 to 39 Minutes | 704 | 0.7% |
| 40 to 44 Minutes | 1,283 | 1.3% |
| 45 to 59 Minutes | 1,933 | 2.0% |
| 60 to 89 Minutes | 1,377 | 1.4% |
| 90 or more Minutes | 1,338 | 1.4% |
Commute Time by Sex in Des Moines
The most common commute times in Des Moines are 15 to 19 minutes (12,090 commuters, 23.4%) for males and 15 to 19 minutes (11,483 commuters, 24.9%) for females.
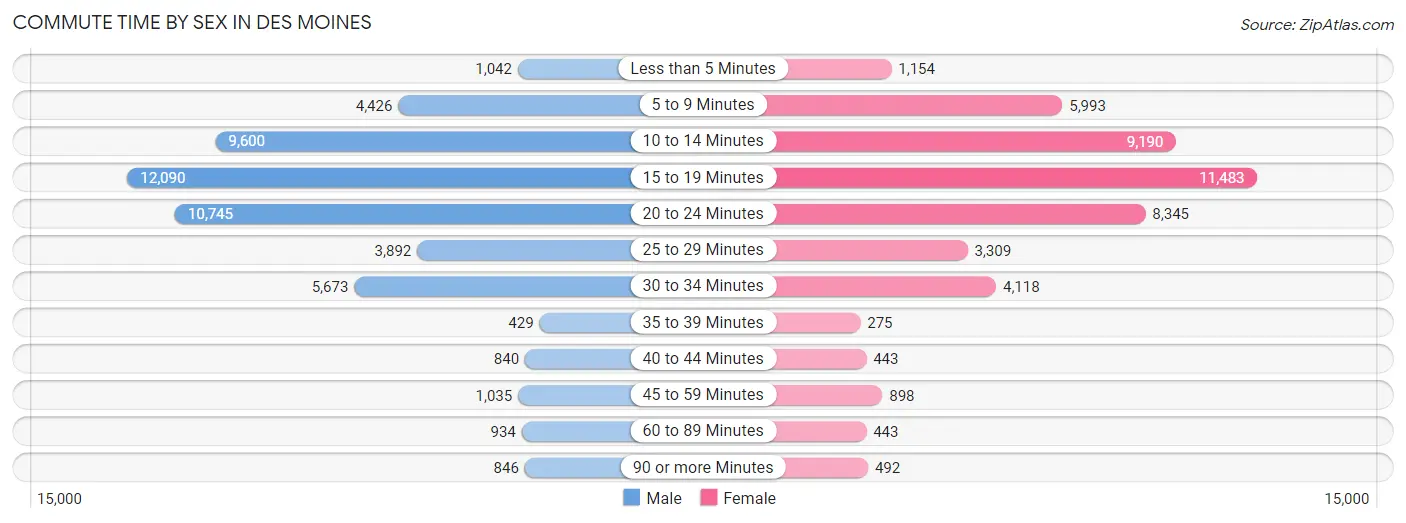
| Commute Time | Male | Female |
| Less than 5 Minutes | 1,042 (2.0%) | 1,154 (2.5%) |
| 5 to 9 Minutes | 4,426 (8.6%) | 5,993 (13.0%) |
| 10 to 14 Minutes | 9,600 (18.6%) | 9,190 (19.9%) |
| 15 to 19 Minutes | 12,090 (23.4%) | 11,483 (24.9%) |
| 20 to 24 Minutes | 10,745 (20.8%) | 8,345 (18.1%) |
| 25 to 29 Minutes | 3,892 (7.5%) | 3,309 (7.2%) |
| 30 to 34 Minutes | 5,673 (11.0%) | 4,118 (8.9%) |
| 35 to 39 Minutes | 429 (0.8%) | 275 (0.6%) |
| 40 to 44 Minutes | 840 (1.6%) | 443 (1.0%) |
| 45 to 59 Minutes | 1,035 (2.0%) | 898 (1.9%) |
| 60 to 89 Minutes | 934 (1.8%) | 443 (1.0%) |
| 90 or more Minutes | 846 (1.6%) | 492 (1.1%) |
Time of Departure to Work by Sex in Des Moines
The most frequent times of departure to work in Des Moines are 7:00 AM to 7:29 AM (6,714, 13.0%) for males and 7:30 AM to 7:59 AM (7,571, 16.4%) for females.
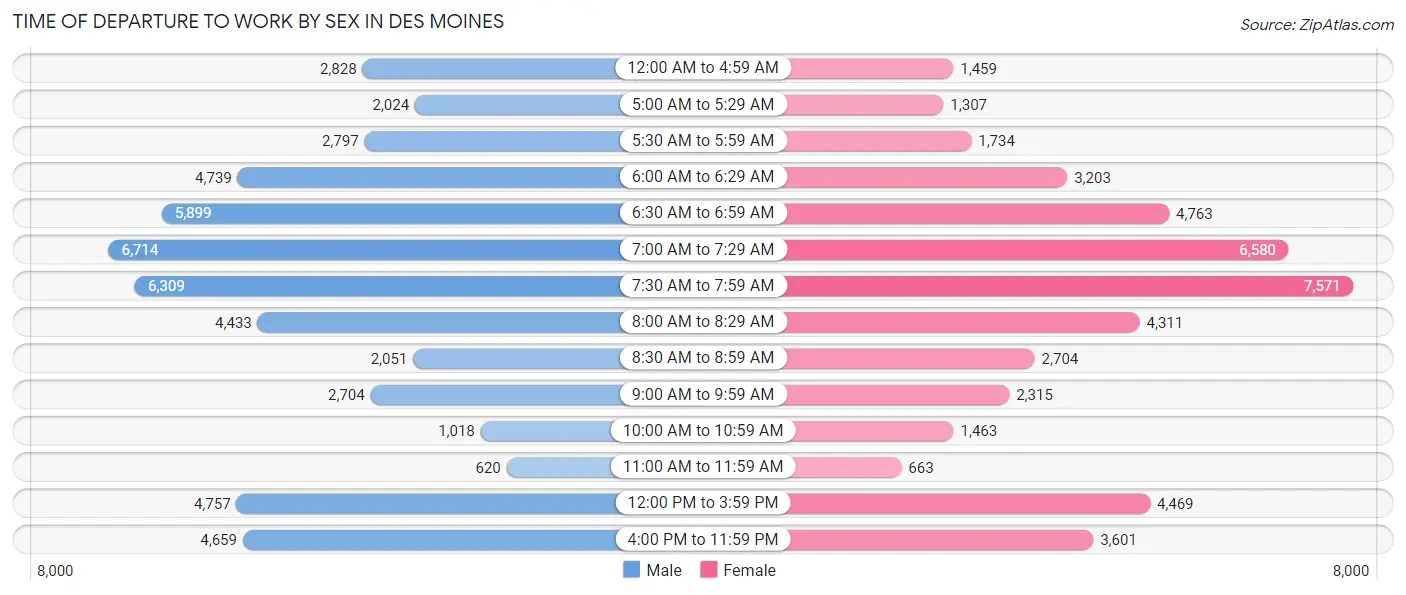
| Time of Departure | Male | Female |
| 12:00 AM to 4:59 AM | 2,828 (5.5%) | 1,459 (3.2%) |
| 5:00 AM to 5:29 AM | 2,024 (3.9%) | 1,307 (2.8%) |
| 5:30 AM to 5:59 AM | 2,797 (5.4%) | 1,734 (3.8%) |
| 6:00 AM to 6:29 AM | 4,739 (9.2%) | 3,203 (6.9%) |
| 6:30 AM to 6:59 AM | 5,899 (11.4%) | 4,763 (10.3%) |
| 7:00 AM to 7:29 AM | 6,714 (13.0%) | 6,580 (14.3%) |
| 7:30 AM to 7:59 AM | 6,309 (12.2%) | 7,571 (16.4%) |
| 8:00 AM to 8:29 AM | 4,433 (8.6%) | 4,311 (9.3%) |
| 8:30 AM to 8:59 AM | 2,051 (4.0%) | 2,704 (5.9%) |
| 9:00 AM to 9:59 AM | 2,704 (5.2%) | 2,315 (5.0%) |
| 10:00 AM to 10:59 AM | 1,018 (2.0%) | 1,463 (3.2%) |
| 11:00 AM to 11:59 AM | 620 (1.2%) | 663 (1.4%) |
| 12:00 PM to 3:59 PM | 4,757 (9.2%) | 4,469 (9.7%) |
| 4:00 PM to 11:59 PM | 4,659 (9.0%) | 3,601 (7.8%) |
| Total | 51,552 (100.0%) | 46,143 (100.0%) |
Housing Occupancy in Des Moines
Occupancy by Ownership in Des Moines
Of the total 88,894 dwellings in Des Moines, owner-occupied units account for 53,580 (60.3%), while renter-occupied units make up 35,314 (39.7%).
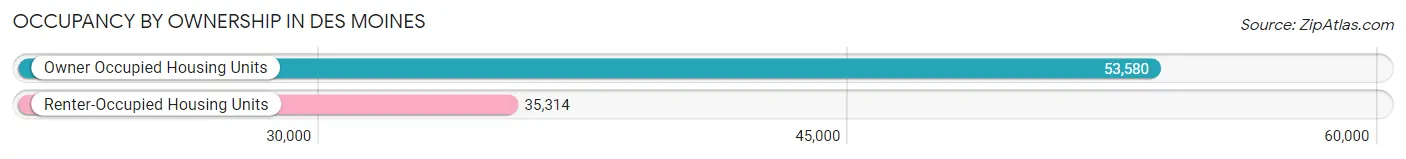
| Occupancy | # Housing Units | % Housing Units |
| Owner Occupied Housing Units | 53,580 | 60.3% |
| Renter-Occupied Housing Units | 35,314 | 39.7% |
| Total Occupied Housing Units | 88,894 | 100.0% |
Occupancy by Household Size in Des Moines
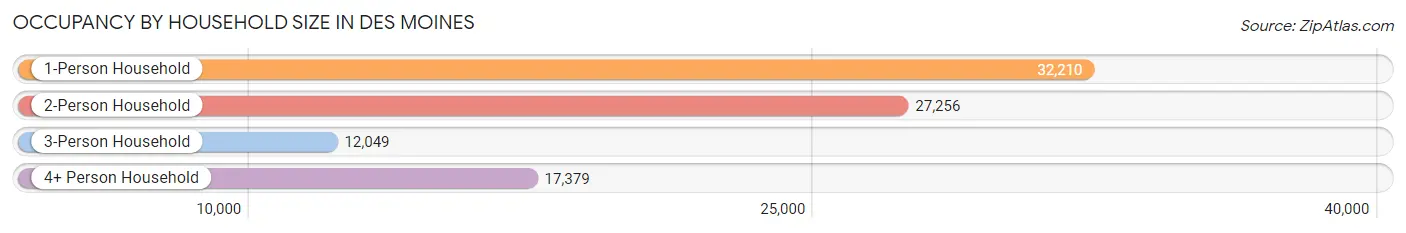
| Household Size | # Housing Units | % Housing Units |
| 1-Person Household | 32,210 | 36.2% |
| 2-Person Household | 27,256 | 30.7% |
| 3-Person Household | 12,049 | 13.6% |
| 4+ Person Household | 17,379 | 19.6% |
| Total Housing Units | 88,894 | 100.0% |
Occupancy by Ownership by Household Size in Des Moines
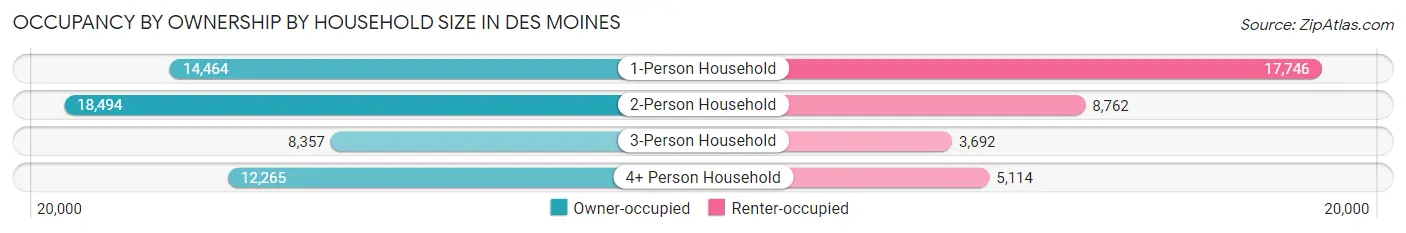
| Household Size | Owner-occupied | Renter-occupied |
| 1-Person Household | 14,464 (44.9%) | 17,746 (55.1%) |
| 2-Person Household | 18,494 (67.8%) | 8,762 (32.2%) |
| 3-Person Household | 8,357 (69.4%) | 3,692 (30.6%) |
| 4+ Person Household | 12,265 (70.6%) | 5,114 (29.4%) |
| Total Housing Units | 53,580 (60.3%) | 35,314 (39.7%) |
Occupancy by Educational Attainment in Des Moines
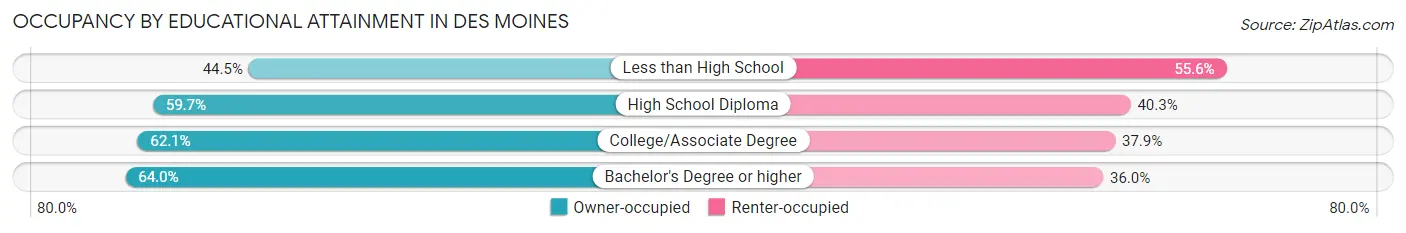
| Household Size | Owner-occupied | Renter-occupied |
| Less than High School | 4,033 (44.5%) | 5,040 (55.5%) |
| High School Diploma | 14,077 (59.7%) | 9,520 (40.3%) |
| College/Associate Degree | 17,072 (62.1%) | 10,414 (37.9%) |
| Bachelor's Degree or higher | 18,398 (64.0%) | 10,340 (36.0%) |
Occupancy by Age of Householder in Des Moines
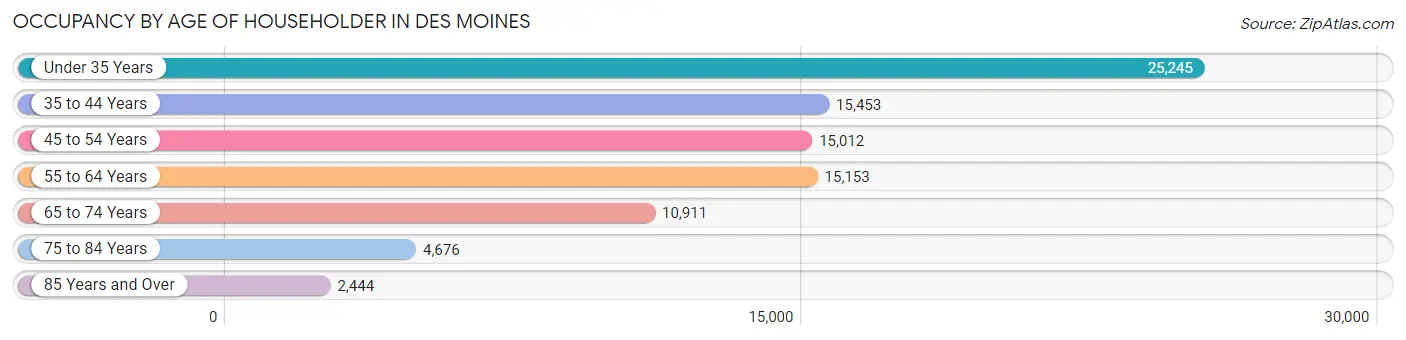
| Age Bracket | # Households | % Households |
| Under 35 Years | 25,245 | 28.4% |
| 35 to 44 Years | 15,453 | 17.4% |
| 45 to 54 Years | 15,012 | 16.9% |
| 55 to 64 Years | 15,153 | 17.1% |
| 65 to 74 Years | 10,911 | 12.3% |
| 75 to 84 Years | 4,676 | 5.3% |
| 85 Years and Over | 2,444 | 2.8% |
| Total | 88,894 | 100.0% |
Housing Finances in Des Moines
Median Income by Occupancy in Des Moines
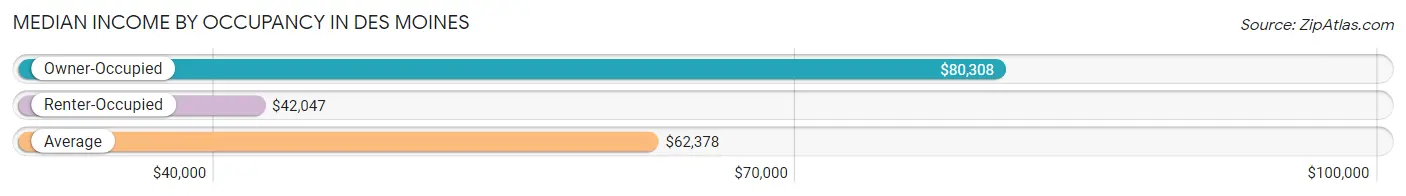
| Occupancy Type | # Households | Median Income |
| Owner-Occupied | 53,580 (60.3%) | $80,308 |
| Renter-Occupied | 35,314 (39.7%) | $42,047 |
| Average | 88,894 (100.0%) | $62,378 |
Occupancy by Householder Income Bracket in Des Moines
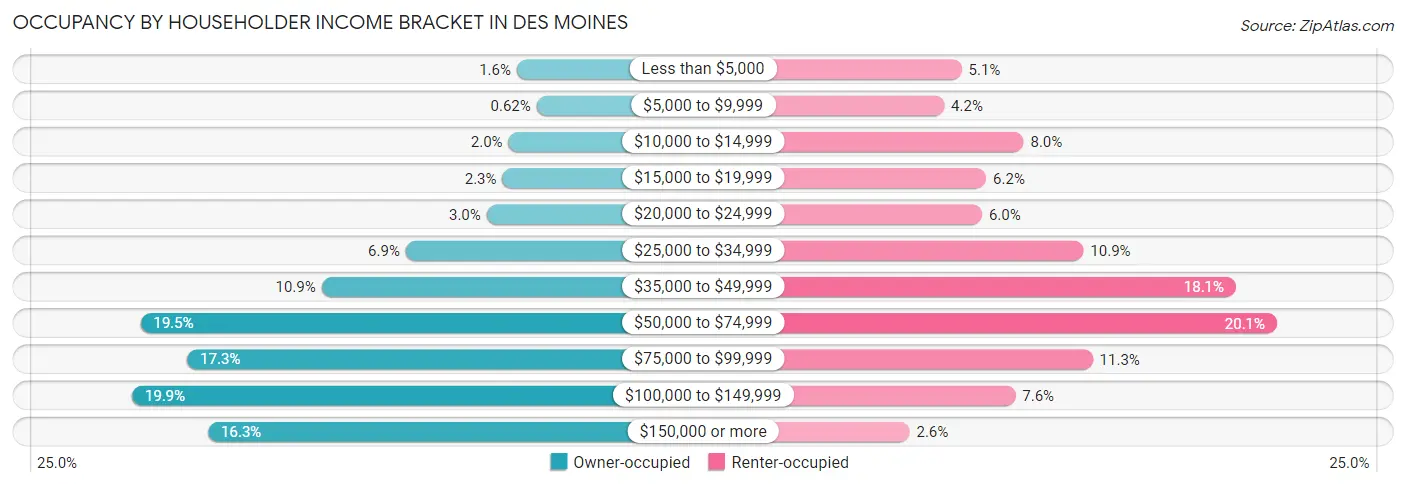
| Income Bracket | Owner-occupied | Renter-occupied |
| Less than $5,000 | 834 (1.6%) | 1,782 (5.1%) |
| $5,000 to $9,999 | 332 (0.6%) | 1,490 (4.2%) |
| $10,000 to $14,999 | 1,052 (2.0%) | 2,824 (8.0%) |
| $15,000 to $19,999 | 1,207 (2.2%) | 2,198 (6.2%) |
| $20,000 to $24,999 | 1,606 (3.0%) | 2,125 (6.0%) |
| $25,000 to $34,999 | 3,670 (6.9%) | 3,833 (10.8%) |
| $35,000 to $49,999 | 5,820 (10.9%) | 6,396 (18.1%) |
| $50,000 to $74,999 | 10,442 (19.5%) | 7,085 (20.1%) |
| $75,000 to $99,999 | 9,247 (17.3%) | 3,986 (11.3%) |
| $100,000 to $149,999 | 10,655 (19.9%) | 2,688 (7.6%) |
| $150,000 or more | 8,715 (16.3%) | 907 (2.6%) |
| Total | 53,580 (100.0%) | 35,314 (100.0%) |
Monthly Housing Cost Tiers in Des Moines
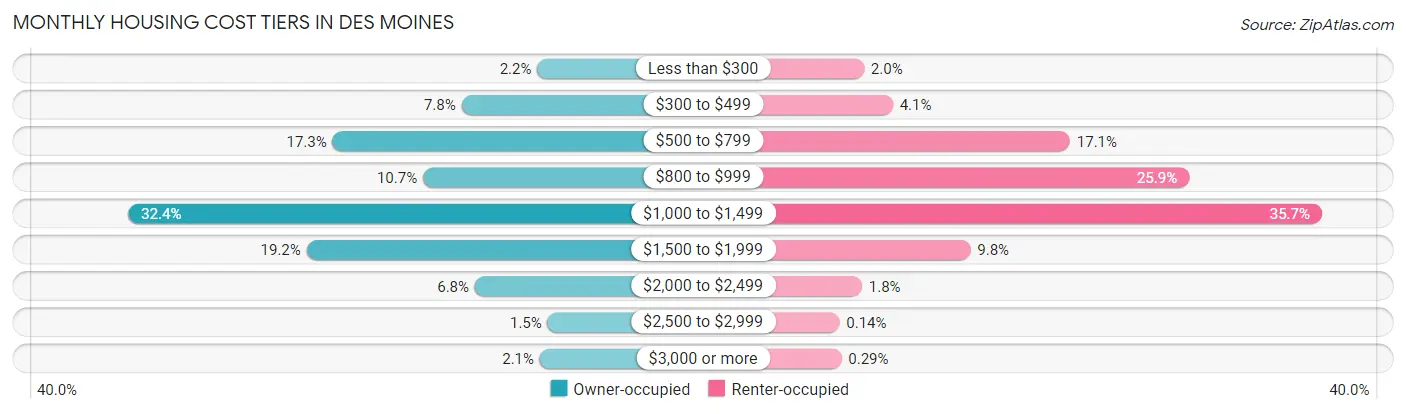
| Monthly Cost | Owner-occupied | Renter-occupied |
| Less than $300 | 1,200 (2.2%) | 690 (1.9%) |
| $300 to $499 | 4,188 (7.8%) | 1,436 (4.1%) |
| $500 to $799 | 9,278 (17.3%) | 6,044 (17.1%) |
| $800 to $999 | 5,710 (10.7%) | 9,143 (25.9%) |
| $1,000 to $1,499 | 17,344 (32.4%) | 12,597 (35.7%) |
| $1,500 to $1,999 | 10,304 (19.2%) | 3,459 (9.8%) |
| $2,000 to $2,499 | 3,667 (6.8%) | 637 (1.8%) |
| $2,500 to $2,999 | 791 (1.5%) | 50 (0.1%) |
| $3,000 or more | 1,098 (2.1%) | 104 (0.3%) |
| Total | 53,580 (100.0%) | 35,314 (100.0%) |
Physical Housing Characteristics in Des Moines
Housing Structures in Des Moines
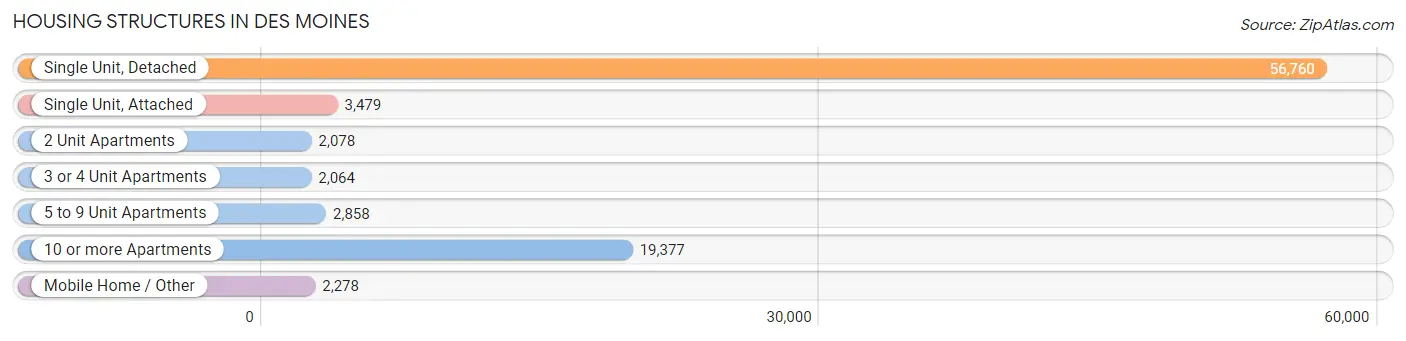
| Structure Type | # Housing Units | % Housing Units |
| Single Unit, Detached | 56,760 | 63.8% |
| Single Unit, Attached | 3,479 | 3.9% |
| 2 Unit Apartments | 2,078 | 2.3% |
| 3 or 4 Unit Apartments | 2,064 | 2.3% |
| 5 to 9 Unit Apartments | 2,858 | 3.2% |
| 10 or more Apartments | 19,377 | 21.8% |
| Mobile Home / Other | 2,278 | 2.6% |
| Total | 88,894 | 100.0% |
Housing Structures by Occupancy in Des Moines
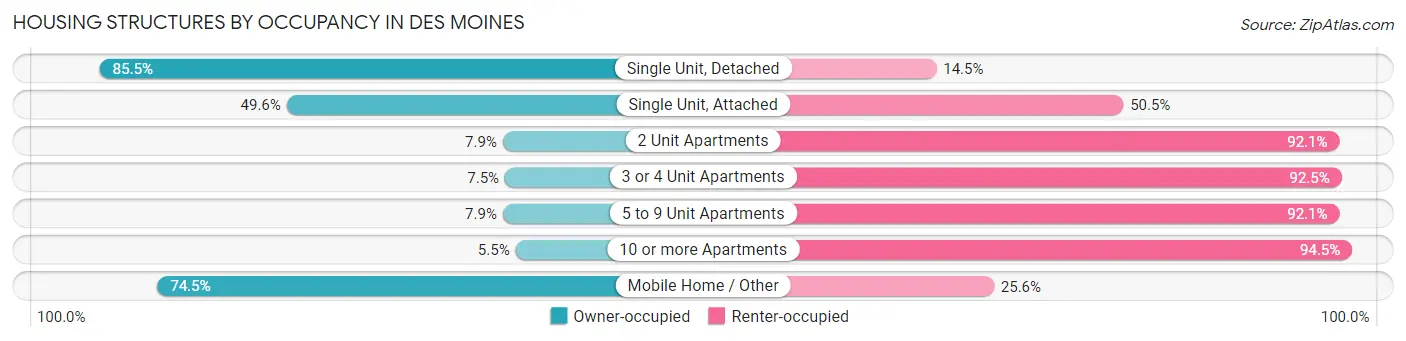
| Structure Type | Owner-occupied | Renter-occupied |
| Single Unit, Detached | 48,551 (85.5%) | 8,209 (14.5%) |
| Single Unit, Attached | 1,724 (49.5%) | 1,755 (50.4%) |
| 2 Unit Apartments | 165 (7.9%) | 1,913 (92.1%) |
| 3 or 4 Unit Apartments | 155 (7.5%) | 1,909 (92.5%) |
| 5 to 9 Unit Apartments | 227 (7.9%) | 2,631 (92.1%) |
| 10 or more Apartments | 1,062 (5.5%) | 18,315 (94.5%) |
| Mobile Home / Other | 1,696 (74.5%) | 582 (25.6%) |
| Total | 53,580 (60.3%) | 35,314 (39.7%) |
Housing Structures by Number of Rooms in Des Moines
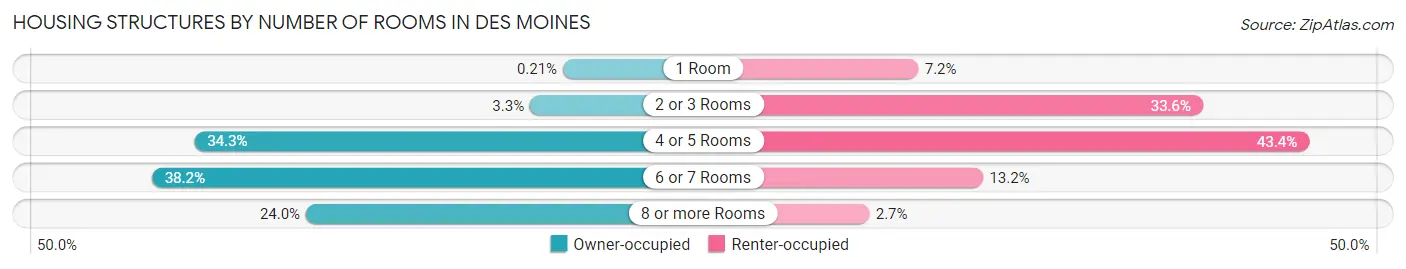
| Number of Rooms | Owner-occupied | Renter-occupied |
| 1 Room | 115 (0.2%) | 2,543 (7.2%) |
| 2 or 3 Rooms | 1,745 (3.3%) | 11,851 (33.6%) |
| 4 or 5 Rooms | 18,383 (34.3%) | 15,324 (43.4%) |
| 6 or 7 Rooms | 20,487 (38.2%) | 4,654 (13.2%) |
| 8 or more Rooms | 12,850 (24.0%) | 942 (2.7%) |
| Total | 53,580 (100.0%) | 35,314 (100.0%) |
Housing Structure by Heating Type in Des Moines
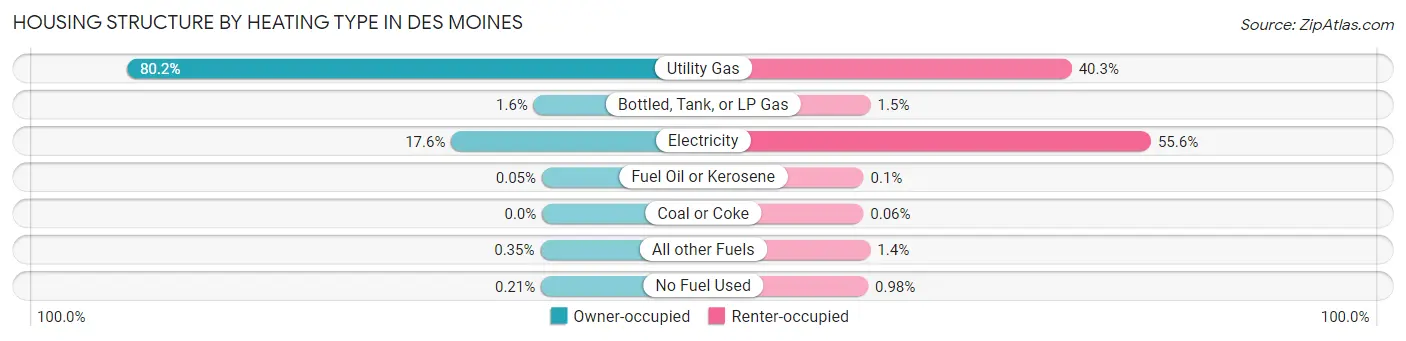
| Heating Type | Owner-occupied | Renter-occupied |
| Utility Gas | 42,978 (80.2%) | 14,243 (40.3%) |
| Bottled, Tank, or LP Gas | 866 (1.6%) | 518 (1.5%) |
| Electricity | 9,408 (17.6%) | 19,649 (55.6%) |
| Fuel Oil or Kerosene | 26 (0.1%) | 34 (0.1%) |
| Coal or Coke | 0 (0.0%) | 21 (0.1%) |
| All other Fuels | 189 (0.4%) | 502 (1.4%) |
| No Fuel Used | 113 (0.2%) | 347 (1.0%) |
| Total | 53,580 (100.0%) | 35,314 (100.0%) |
Household Vehicle Usage in Des Moines
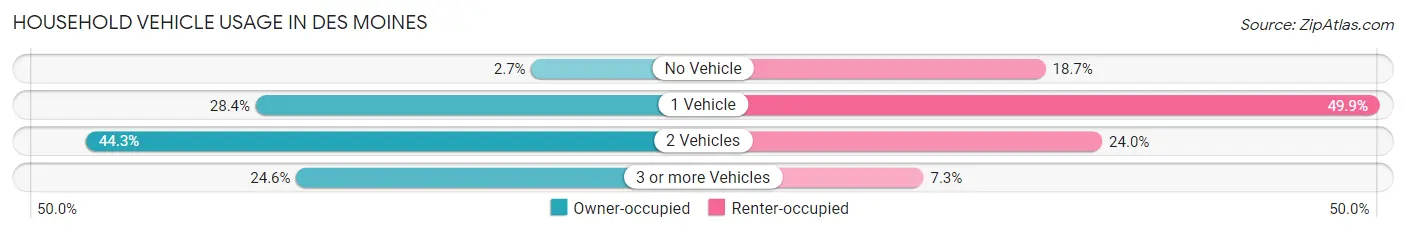
| Vehicles per Household | Owner-occupied | Renter-occupied |
| No Vehicle | 1,439 (2.7%) | 6,614 (18.7%) |
| 1 Vehicle | 15,222 (28.4%) | 17,629 (49.9%) |
| 2 Vehicles | 23,721 (44.3%) | 8,479 (24.0%) |
| 3 or more Vehicles | 13,198 (24.6%) | 2,592 (7.3%) |
| Total | 53,580 (100.0%) | 35,314 (100.0%) |
Real Estate & Mortgages in Des Moines
Real Estate and Mortgage Overview in Des Moines
| Characteristic | Without Mortgage | With Mortgage |
| Housing Units | 16,653 | 36,927 |
| Median Property Value | $158,800 | $175,100 |
| Median Household Income | $59,160 | $6,757 |
| Monthly Housing Costs | $598 | $1,077 |
| Real Estate Taxes | $3,182 | $959 |
Property Value by Mortgage Status in Des Moines
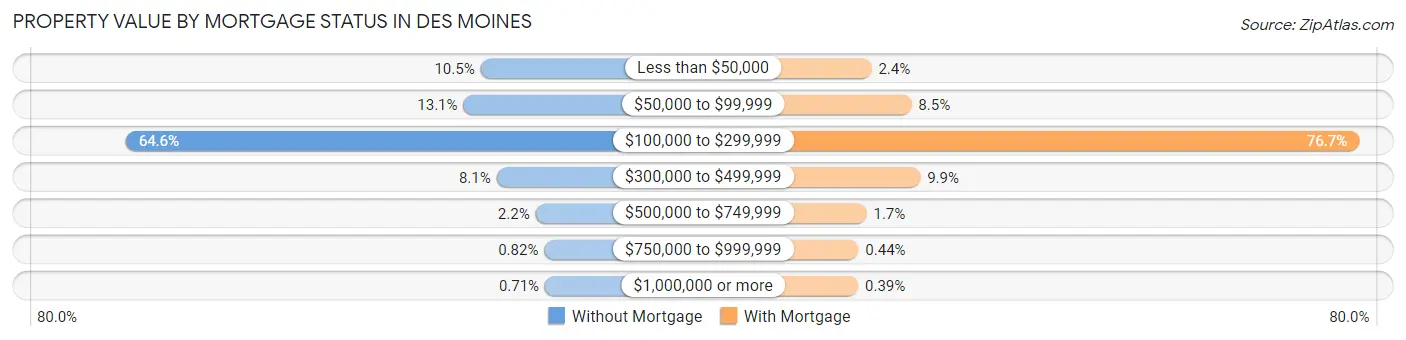
| Property Value | Without Mortgage | With Mortgage |
| Less than $50,000 | 1,754 (10.5%) | 892 (2.4%) |
| $50,000 to $99,999 | 2,188 (13.1%) | 3,141 (8.5%) |
| $100,000 to $299,999 | 10,753 (64.6%) | 28,330 (76.7%) |
| $300,000 to $499,999 | 1,346 (8.1%) | 3,640 (9.9%) |
| $500,000 to $749,999 | 358 (2.1%) | 617 (1.7%) |
| $750,000 to $999,999 | 136 (0.8%) | 164 (0.4%) |
| $1,000,000 or more | 118 (0.7%) | 143 (0.4%) |
| Total | 16,653 (100.0%) | 36,927 (100.0%) |
Household Income by Mortgage Status in Des Moines
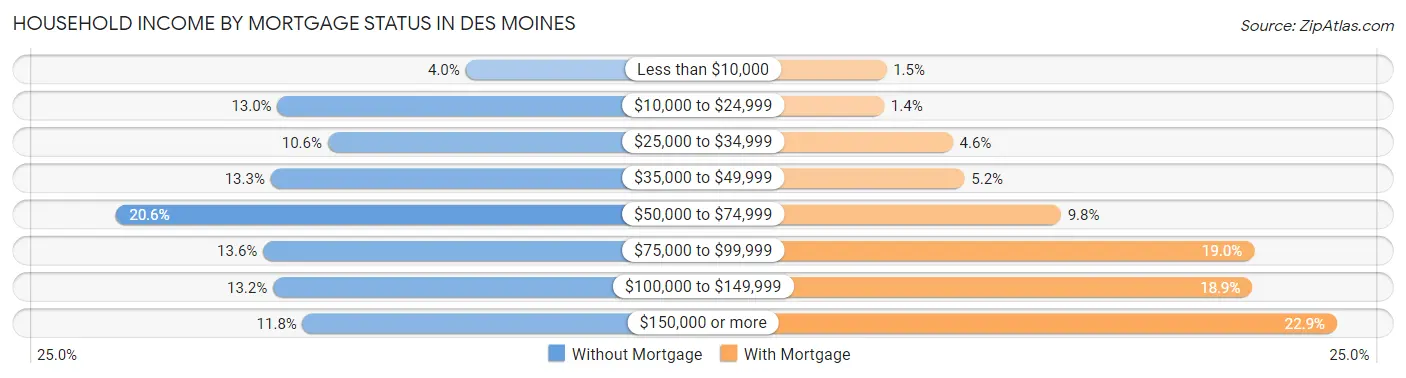
| Household Income | Without Mortgage | With Mortgage |
| Less than $10,000 | 666 (4.0%) | 540 (1.5%) |
| $10,000 to $24,999 | 2,159 (13.0%) | 500 (1.3%) |
| $25,000 to $34,999 | 1,759 (10.6%) | 1,706 (4.6%) |
| $35,000 to $49,999 | 2,211 (13.3%) | 1,911 (5.2%) |
| $50,000 to $74,999 | 3,435 (20.6%) | 3,609 (9.8%) |
| $75,000 to $99,999 | 2,272 (13.6%) | 7,007 (19.0%) |
| $100,000 to $149,999 | 2,193 (13.2%) | 6,975 (18.9%) |
| $150,000 or more | 1,958 (11.8%) | 8,462 (22.9%) |
| Total | 16,653 (100.0%) | 36,927 (100.0%) |
Property Value to Household Income Ratio in Des Moines
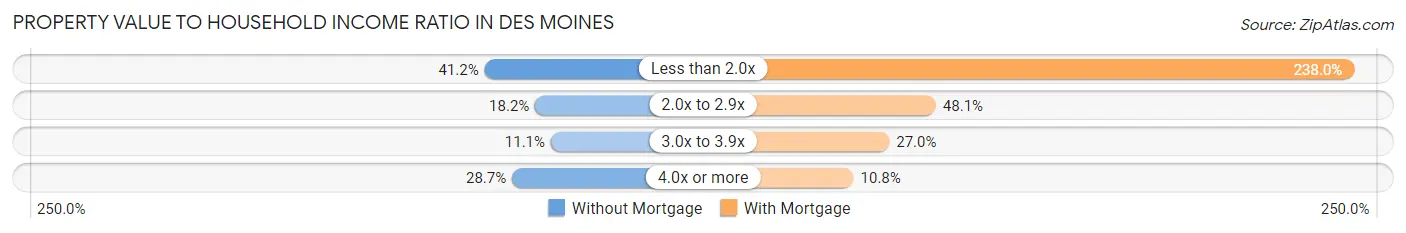
| Value-to-Income Ratio | Without Mortgage | With Mortgage |
| Less than 2.0x | 6,855 (41.2%) | 87,891 (238.0%) |
| 2.0x to 2.9x | 3,027 (18.2%) | 17,771 (48.1%) |
| 3.0x to 3.9x | 1,843 (11.1%) | 9,953 (27.0%) |
| 4.0x or more | 4,777 (28.7%) | 3,970 (10.7%) |
| Total | 16,653 (100.0%) | 36,927 (100.0%) |
Real Estate Taxes by Mortgage Status in Des Moines
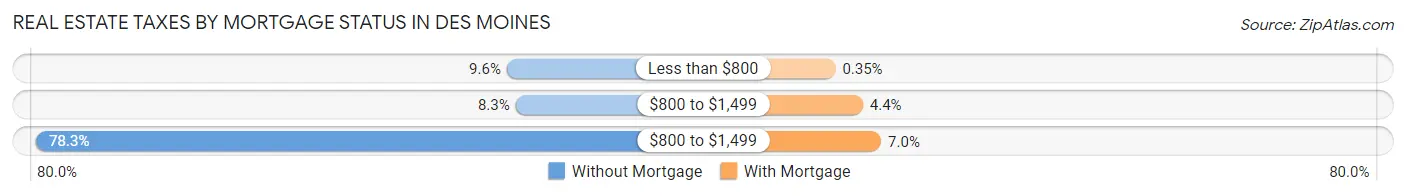
| Property Taxes | Without Mortgage | With Mortgage |
| Less than $800 | 1,590 (9.6%) | 131 (0.4%) |
| $800 to $1,499 | 1,376 (8.3%) | 1,610 (4.4%) |
| $800 to $1,499 | 13,045 (78.3%) | 2,596 (7.0%) |
| Total | 16,653 (100.0%) | 36,927 (100.0%) |
Health & Disability in Des Moines
Health Insurance Coverage by Age in Des Moines
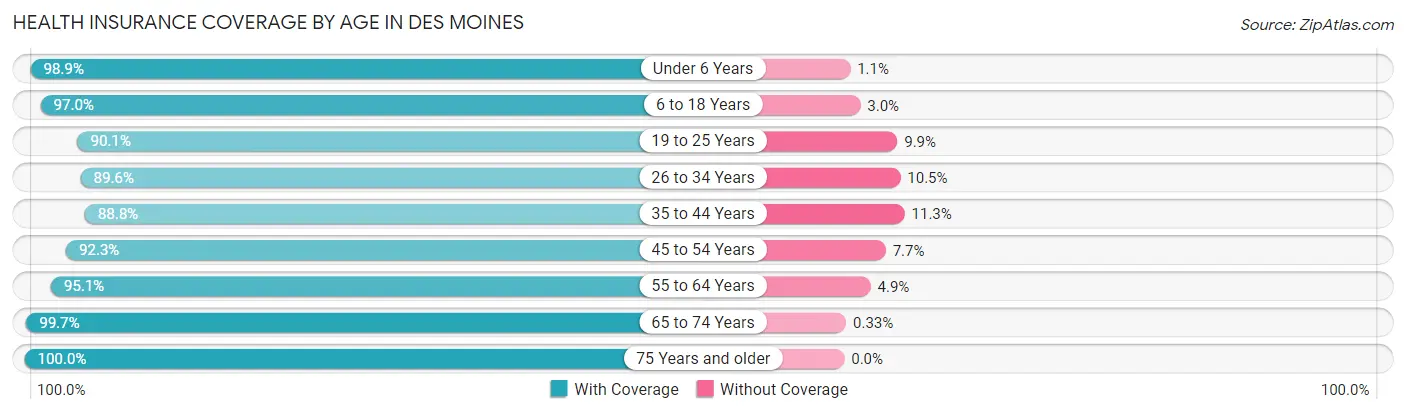
| Age Bracket | With Coverage | Without Coverage |
| Under 6 Years | 16,769 (98.9%) | 187 (1.1%) |
| 6 to 18 Years | 34,615 (97.0%) | 1,070 (3.0%) |
| 19 to 25 Years | 21,835 (90.1%) | 2,395 (9.9%) |
| 26 to 34 Years | 28,130 (89.5%) | 3,281 (10.4%) |
| 35 to 44 Years | 24,253 (88.7%) | 3,074 (11.3%) |
| 45 to 54 Years | 23,233 (92.3%) | 1,943 (7.7%) |
| 55 to 64 Years | 23,962 (95.1%) | 1,238 (4.9%) |
| 65 to 74 Years | 16,111 (99.7%) | 53 (0.3%) |
| 75 Years and older | 9,416 (100.0%) | 0 (0.0%) |
| Total | 198,324 (93.7%) | 13,241 (6.3%) |
Health Insurance Coverage by Citizenship Status in Des Moines
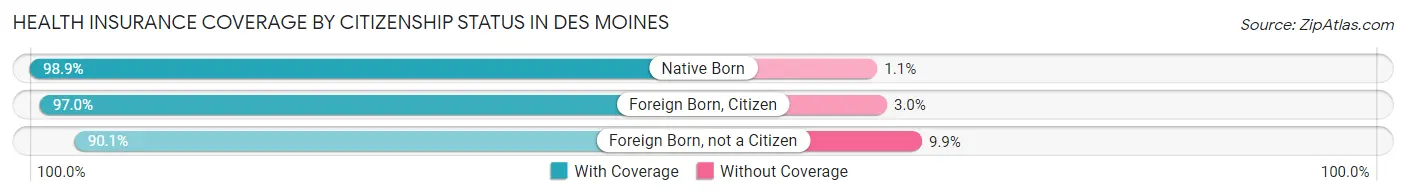
| Citizenship Status | With Coverage | Without Coverage |
| Native Born | 16,769 (98.9%) | 187 (1.1%) |
| Foreign Born, Citizen | 34,615 (97.0%) | 1,070 (3.0%) |
| Foreign Born, not a Citizen | 21,835 (90.1%) | 2,395 (9.9%) |
Health Insurance Coverage by Household Income in Des Moines
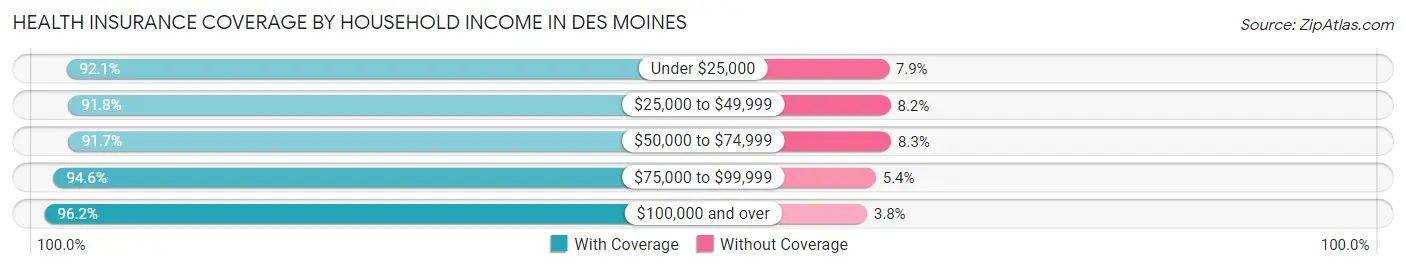
| Household Income | With Coverage | Without Coverage |
| Under $25,000 | 24,957 (92.1%) | 2,135 (7.9%) |
| $25,000 to $49,999 | 35,997 (91.8%) | 3,214 (8.2%) |
| $50,000 to $74,999 | 37,640 (91.7%) | 3,409 (8.3%) |
| $75,000 to $99,999 | 32,138 (94.6%) | 1,846 (5.4%) |
| $100,000 and over | 64,151 (96.2%) | 2,504 (3.8%) |
Public vs Private Health Insurance Coverage by Age in Des Moines
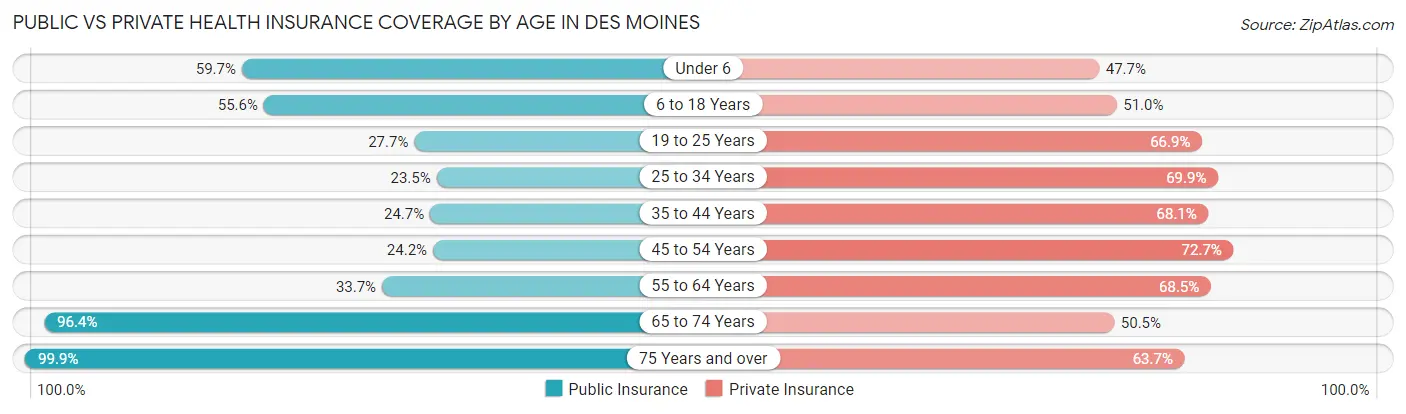
| Age Bracket | Public Insurance | Private Insurance |
| Under 6 | 10,119 (59.7%) | 8,088 (47.7%) |
| 6 to 18 Years | 19,841 (55.6%) | 18,181 (50.9%) |
| 19 to 25 Years | 6,706 (27.7%) | 16,209 (66.9%) |
| 25 to 34 Years | 7,393 (23.5%) | 21,948 (69.9%) |
| 35 to 44 Years | 6,761 (24.7%) | 18,608 (68.1%) |
| 45 to 54 Years | 6,095 (24.2%) | 18,310 (72.7%) |
| 55 to 64 Years | 8,486 (33.7%) | 17,273 (68.5%) |
| 65 to 74 Years | 15,579 (96.4%) | 8,163 (50.5%) |
| 75 Years and over | 9,407 (99.9%) | 5,993 (63.6%) |
| Total | 90,387 (42.7%) | 132,773 (62.8%) |
Disability Status by Sex by Age in Des Moines
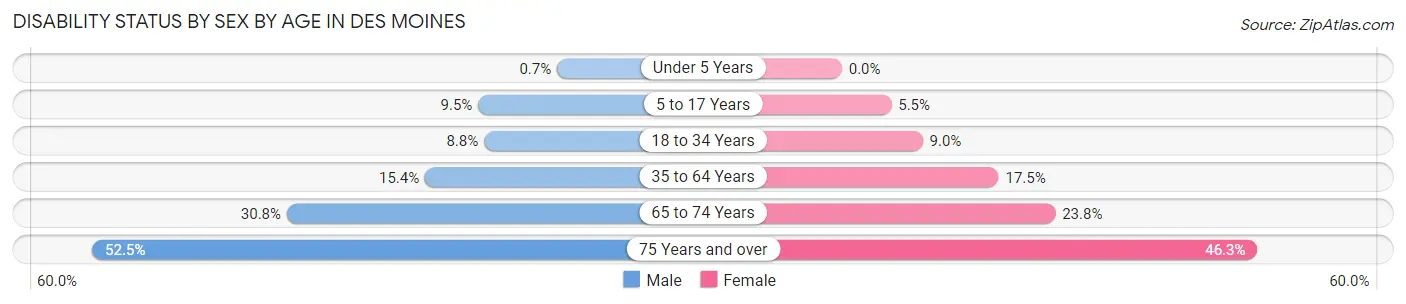
| Age Bracket | Male | Female |
| Under 5 Years | 50 (0.7%) | 0 (0.0%) |
| 5 to 17 Years | 1,647 (9.5%) | 977 (5.5%) |
| 18 to 34 Years | 2,621 (8.8%) | 2,629 (9.0%) |
| 35 to 64 Years | 6,018 (15.4%) | 6,745 (17.5%) |
| 65 to 74 Years | 2,337 (30.8%) | 2,038 (23.8%) |
| 75 Years and over | 1,955 (52.5%) | 2,633 (46.3%) |
Disability Class by Sex by Age in Des Moines
Disability Class: Hearing Difficulty
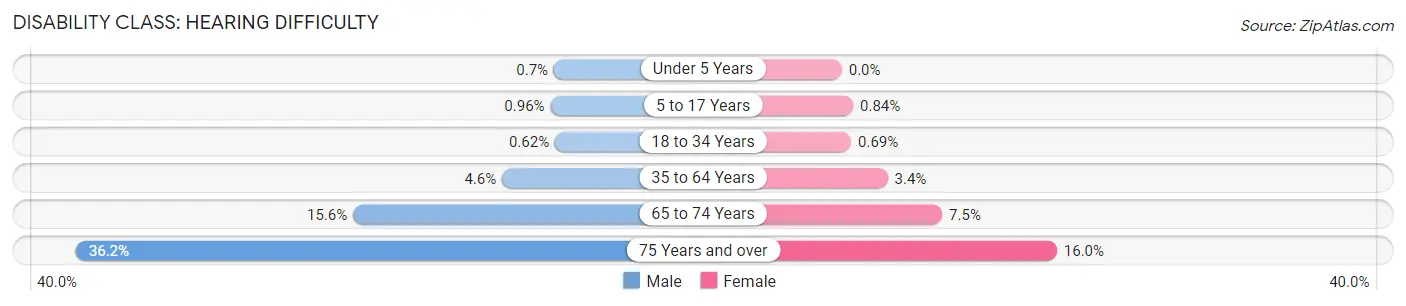
| Age Bracket | Male | Female |
| Under 5 Years | 50 (0.7%) | 0 (0.0%) |
| 5 to 17 Years | 167 (1.0%) | 148 (0.8%) |
| 18 to 34 Years | 183 (0.6%) | 203 (0.7%) |
| 35 to 64 Years | 1,778 (4.5%) | 1,312 (3.4%) |
| 65 to 74 Years | 1,185 (15.6%) | 639 (7.4%) |
| 75 Years and over | 1,348 (36.2%) | 909 (16.0%) |
Disability Class: Vision Difficulty
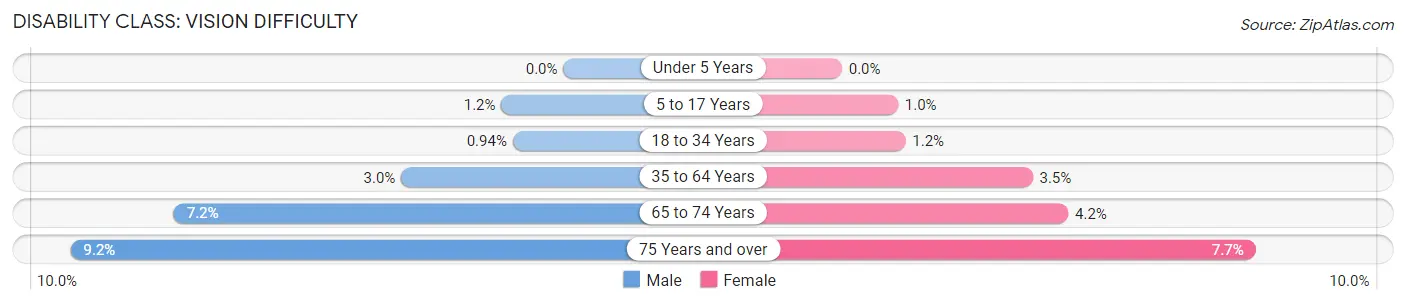
| Age Bracket | Male | Female |
| Under 5 Years | 0 (0.0%) | 0 (0.0%) |
| 5 to 17 Years | 200 (1.1%) | 184 (1.0%) |
| 18 to 34 Years | 279 (0.9%) | 346 (1.2%) |
| 35 to 64 Years | 1,178 (3.0%) | 1,367 (3.5%) |
| 65 to 74 Years | 549 (7.2%) | 360 (4.2%) |
| 75 Years and over | 341 (9.1%) | 437 (7.7%) |
Disability Class: Cognitive Difficulty
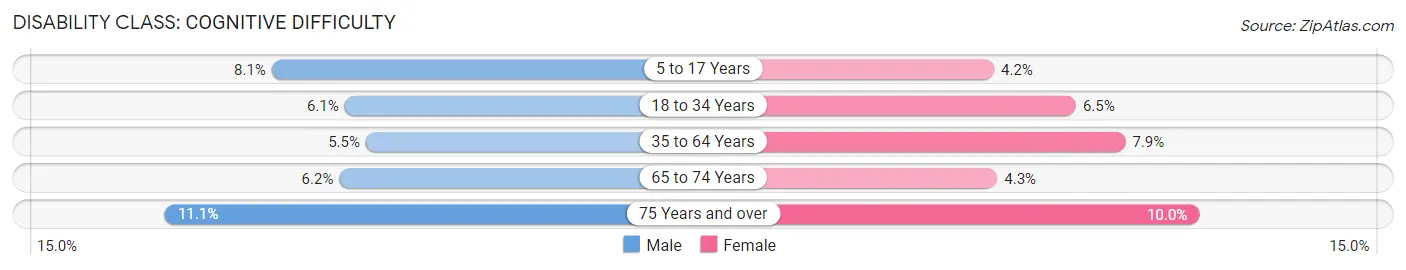
| Age Bracket | Male | Female |
| 5 to 17 Years | 1,409 (8.1%) | 752 (4.2%) |
| 18 to 34 Years | 1,808 (6.1%) | 1,904 (6.5%) |
| 35 to 64 Years | 2,151 (5.5%) | 3,051 (7.9%) |
| 65 to 74 Years | 474 (6.2%) | 371 (4.3%) |
| 75 Years and over | 413 (11.1%) | 566 (10.0%) |
Disability Class: Ambulatory Difficulty
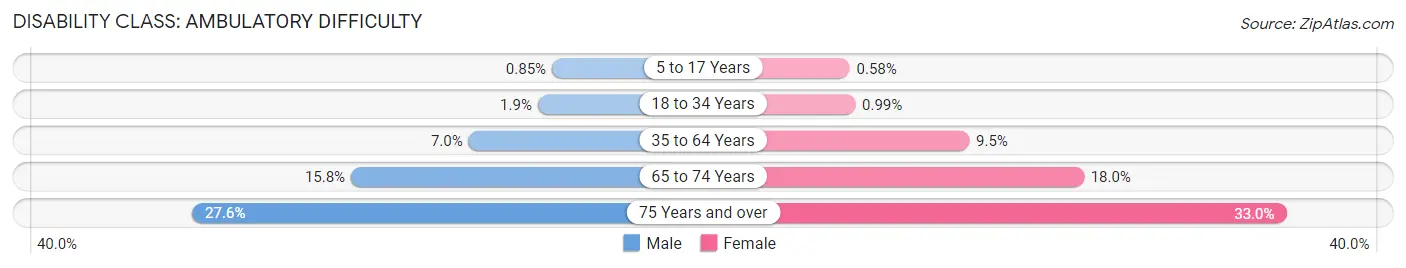
| Age Bracket | Male | Female |
| 5 to 17 Years | 148 (0.9%) | 102 (0.6%) |
| 18 to 34 Years | 563 (1.9%) | 290 (1.0%) |
| 35 to 64 Years | 2,751 (7.0%) | 3,650 (9.5%) |
| 65 to 74 Years | 1,197 (15.8%) | 1,540 (18.0%) |
| 75 Years and over | 1,027 (27.6%) | 1,878 (33.0%) |
Disability Class: Self-Care Difficulty
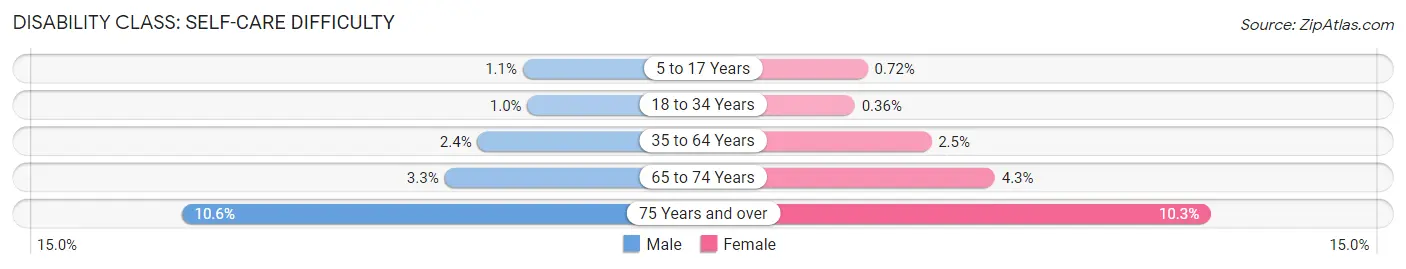
| Age Bracket | Male | Female |
| 5 to 17 Years | 196 (1.1%) | 128 (0.7%) |
| 18 to 34 Years | 297 (1.0%) | 106 (0.4%) |
| 35 to 64 Years | 935 (2.4%) | 963 (2.5%) |
| 65 to 74 Years | 251 (3.3%) | 365 (4.3%) |
| 75 Years and over | 396 (10.6%) | 585 (10.3%) |
Technology Access in Des Moines
Computing Device Access in Des Moines
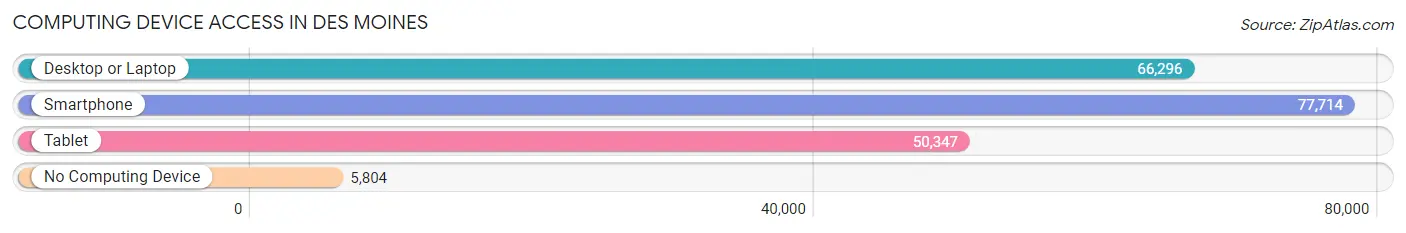
| Device Type | # Households | % Households |
| Desktop or Laptop | 66,296 | 74.6% |
| Smartphone | 77,714 | 87.4% |
| Tablet | 50,347 | 56.6% |
| No Computing Device | 5,804 | 6.5% |
| Total | 88,894 | 100.0% |
Internet Access in Des Moines
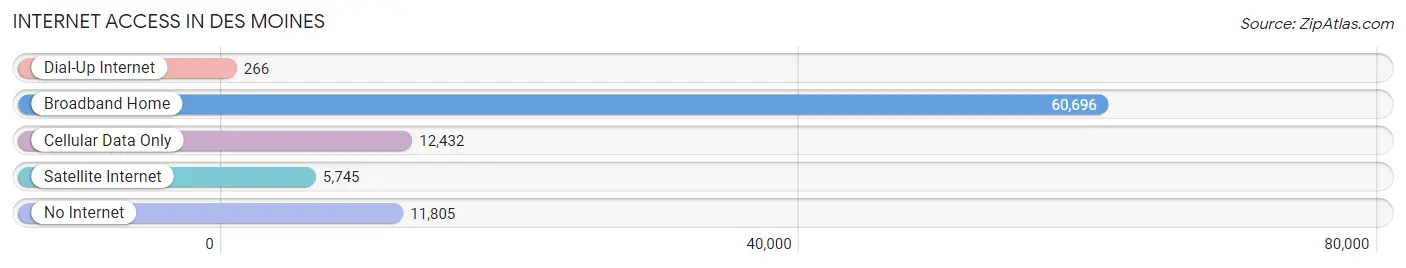
| Internet Type | # Households | % Households |
| Dial-Up Internet | 266 | 0.3% |
| Broadband Home | 60,696 | 68.3% |
| Cellular Data Only | 12,432 | 14.0% |
| Satellite Internet | 5,745 | 6.5% |
| No Internet | 11,805 | 13.3% |
| Total | 88,894 | 100.0% |
Des Moines Summary
Des Moines, Iowa is the capital and most populous city in the state of Iowa. It is located in the center of the state, along the Des Moines River. The city is home to a population of over 217,000 people, making it the largest city in the state. It is also the county seat of Polk County.
History
The area that is now Des Moines was first settled in 1843 by a group of settlers from the nearby town of Fort Des Moines. The settlers named the area after the river, which was named after the French explorer, Jean Baptiste Des Moines. The city was officially incorporated in 1851 and was named the capital of Iowa in 1857.
In the late 19th century, Des Moines became a major center for the agricultural industry. The city was home to several large grain mills and meatpacking plants. The city also became a major hub for the railroad industry, with several major railroads running through the city.
In the early 20th century, Des Moines experienced a period of rapid growth. The city was home to several large manufacturing plants, including the John Deere plant, which opened in 1910. The city also became a major center for the insurance industry, with several large insurance companies setting up their headquarters in the city.
Geography
Des Moines is located in the center of the state of Iowa, along the Des Moines River. The city is situated in a flat, open area, with the Des Moines River running through the center of the city. The city is surrounded by several small towns and rural areas. The city is located about 90 miles east of Omaha, Nebraska and about 150 miles west of Chicago, Illinois.
The city has a humid continental climate, with hot, humid summers and cold, snowy winters. The average temperature in the summer is around 80 degrees Fahrenheit, while the average temperature in the winter is around 20 degrees Fahrenheit.
Economy
Des Moines is a major economic center in the state of Iowa. The city is home to several large companies, including Principal Financial Group, Wells Fargo, and Meredith Corporation. The city is also home to several large insurance companies, including Nationwide Insurance and American Family Insurance.
The city is also home to several large manufacturing plants, including the John Deere plant and the DuPont plant. The city is also home to several large retail stores, including Target, Walmart, and Kohl's.
The city is also home to several large universities, including Drake University, Iowa State University, and the University of Iowa. The city is also home to several large hospitals, including Mercy Medical Center and Iowa Methodist Medical Center.
Demographics
As of the 2020 census, the population of Des Moines was 217,521. The city has a population density of 1,845 people per square mile. The racial makeup of the city is 79.2% White, 11.3% African American, 2.2% Asian, and 4.3% Hispanic or Latino.
The median household income in Des Moines is $50,845, and the median home value is $164,400. The city has a poverty rate of 15.2%. The city has a high rate of educational attainment, with over 90% of the population having a high school diploma or higher.
Des Moines is a diverse city, with a variety of cultures and backgrounds represented. The city is home to several large religious institutions, including the Roman Catholic Diocese of Des Moines and the Islamic Center of Des Moines. The city is also home to several large cultural institutions, including the Des Moines Art Center and the Des Moines Symphony Orchestra.
Common Questions
What is Per Capita Income in Des Moines?
Per Capita income in Des Moines is $34,347.
What is the Median Family Income in Des Moines?
Median Family Income in Des Moines is $76,602.
What is the Median Household income in Des Moines?
Median Household Income in Des Moines is $62,378.
What is Income or Wage Gap in Des Moines?
Income or Wage Gap in Des Moines is 23.7%.
Women in Des Moines earn 76.3 cents for every dollar earned by a man.
What is Family Income Deficit in Des Moines?
Family Income Deficit in Des Moines is $11,665.
Families that are below poverty line in Des Moines earn $11,665 less on average than the poverty threshold level.
What is Inequality or Gini Index in Des Moines?
Inequality or Gini Index in Des Moines is 0.43.
What is the Total Population of Des Moines?
Total Population of Des Moines is 213,164.
What is the Total Male Population of Des Moines?
Total Male Population of Des Moines is 105,258.
What is the Total Female Population of Des Moines?
Total Female Population of Des Moines is 107,906.
What is the Ratio of Males per 100 Females in Des Moines?
There are 97.55 Males per 100 Females in Des Moines.
What is the Ratio of Females per 100 Males in Des Moines?
There are 102.52 Females per 100 Males in Des Moines.
What is the Median Population Age in Des Moines?
Median Population Age in Des Moines is 34.4 Years.
What is the Average Family Size in Des Moines
Average Family Size in Des Moines is 3.1 People.
What is the Average Household Size in Des Moines
Average Household Size in Des Moines is 2.3 People.
How Large is the Labor Force in Des Moines?
There are 118,731 People in the Labor Forcein in Des Moines.
What is the Percentage of People in the Labor Force in Des Moines?
70.0% of People are in the Labor Force in Des Moines.
What is the Unemployment Rate in Des Moines?
Unemployment Rate in Des Moines is 5.9%.