Lincoln, NE Map & Demographics
Lincoln Map
Lincoln Overview
$37,210
PER CAPITA INCOME
$91,236
AVG FAMILY INCOME
$67,846
AVG HOUSEHOLD INCOME
25.1%
WAGE / INCOME GAP [ % ]
74.9¢/ $1
WAGE / INCOME GAP [ $ ]
$10,745
FAMILY INCOME DEFICIT
0.45
INEQUALITY / GINI INDEX
290,531
TOTAL POPULATION
146,428
MALE POPULATION
144,103
FEMALE POPULATION
101.61
MALES / 100 FEMALES
98.41
FEMALES / 100 MALES
33.1
MEDIAN AGE
3.0
AVG FAMILY SIZE
2.4
AVG HOUSEHOLD SIZE
165,763
LABOR FORCE [ PEOPLE ]
70.9%
PERCENT IN LABOR FORCE
3.3%
UNEMPLOYMENT RATE
Lincoln Zip Codes
Income in Lincoln
Income Overview in Lincoln
Per Capita Income in Lincoln is $37,210, while median incomes of families and households are $91,236 and $67,846 respectively.
| Characteristic | Number | Measure |
| Per Capita Income | 290,531 | $37,210 |
| Median Family Income | 67,409 | $91,236 |
| Mean Family Income | 67,409 | $113,760 |
| Median Household Income | 118,332 | $67,846 |
| Mean Household Income | 118,332 | $90,428 |
| Income Deficit | 67,409 | $10,745 |
| Wage / Income Gap (%) | 290,531 | 25.09% |
| Wage / Income Gap ($) | 290,531 | 74.91¢ per $1 |
| Gini / Inequality Index | 290,531 | 0.45 |
Earnings by Sex in Lincoln
Average Earnings in Lincoln are $36,331, $42,171 for men and $31,589 for women, a difference of 25.1%.
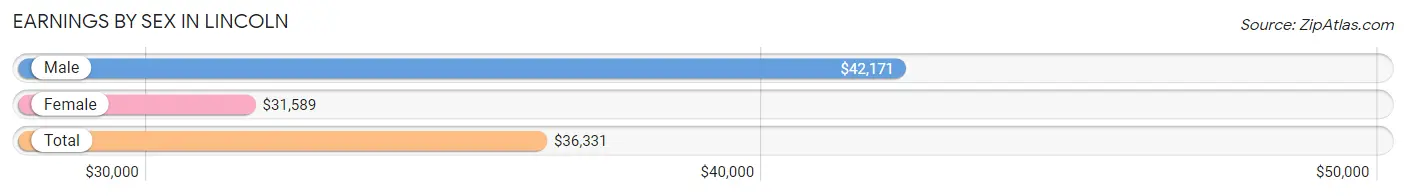
| Sex | Number | Average Earnings |
| Male | 93,956 (52.8%) | $42,171 |
| Female | 83,940 (47.2%) | $31,589 |
| Total | 177,896 (100.0%) | $36,331 |
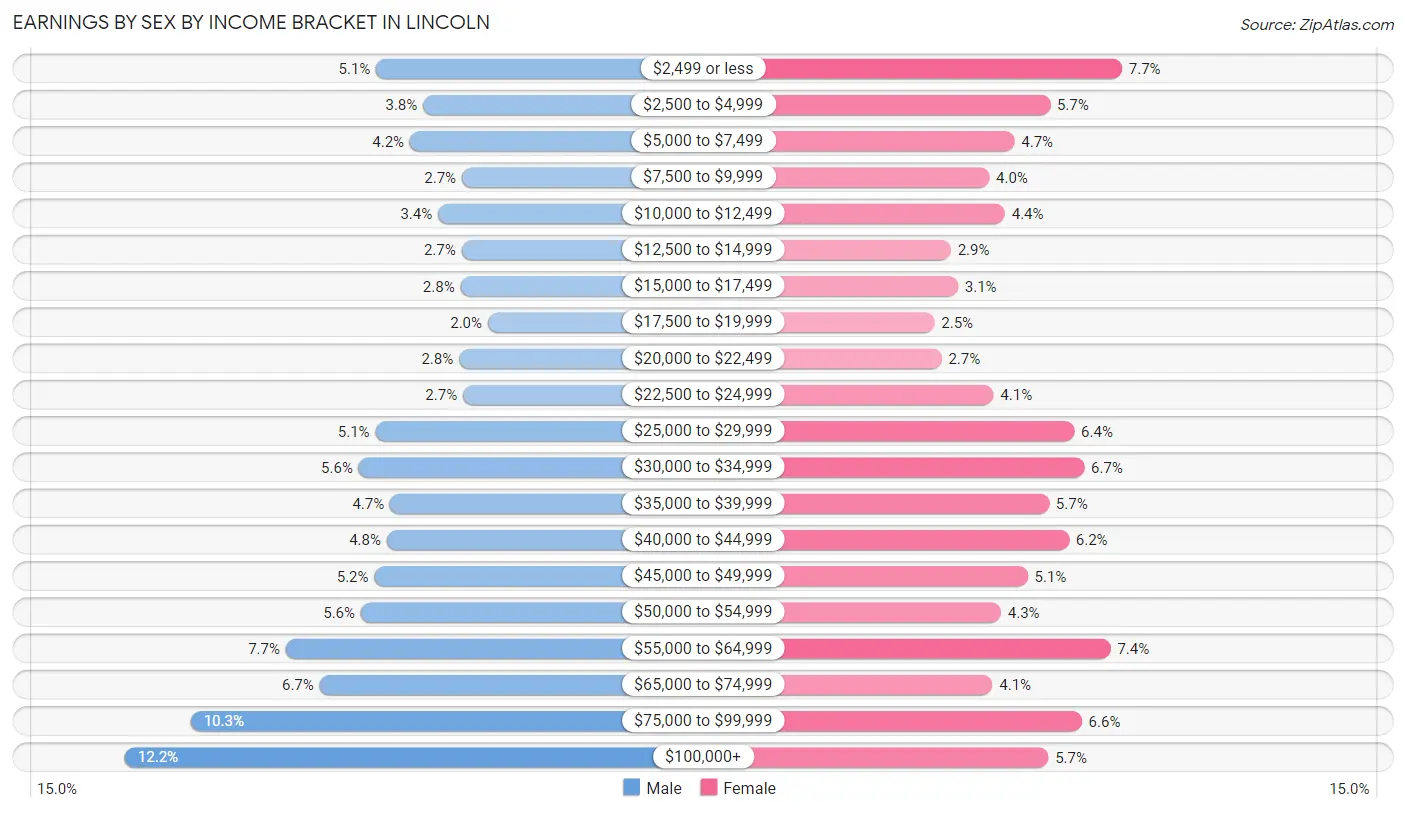
Earnings by Sex by Income Bracket in Lincoln
The most common earnings brackets in Lincoln are $100,000+ for men (11,448 | 12.2%) and $2,499 or less for women (6,486 | 7.7%).
| Income | Male | Female |
| $2,499 or less | 4,812 (5.1%) | 6,486 (7.7%) |
| $2,500 to $4,999 | 3,567 (3.8%) | 4,790 (5.7%) |
| $5,000 to $7,499 | 3,920 (4.2%) | 3,956 (4.7%) |
| $7,500 to $9,999 | 2,543 (2.7%) | 3,357 (4.0%) |
| $10,000 to $12,499 | 3,179 (3.4%) | 3,728 (4.4%) |
| $12,500 to $14,999 | 2,555 (2.7%) | 2,448 (2.9%) |
| $15,000 to $17,499 | 2,580 (2.8%) | 2,617 (3.1%) |
| $17,500 to $19,999 | 1,865 (2.0%) | 2,066 (2.5%) |
| $20,000 to $22,499 | 2,618 (2.8%) | 2,231 (2.7%) |
| $22,500 to $24,999 | 2,515 (2.7%) | 3,455 (4.1%) |
| $25,000 to $29,999 | 4,830 (5.1%) | 5,366 (6.4%) |
| $30,000 to $34,999 | 5,270 (5.6%) | 5,599 (6.7%) |
| $35,000 to $39,999 | 4,440 (4.7%) | 4,767 (5.7%) |
| $40,000 to $44,999 | 4,532 (4.8%) | 5,240 (6.2%) |
| $45,000 to $49,999 | 4,859 (5.2%) | 4,263 (5.1%) |
| $50,000 to $54,999 | 5,216 (5.6%) | 3,636 (4.3%) |
| $55,000 to $64,999 | 7,200 (7.7%) | 6,219 (7.4%) |
| $65,000 to $74,999 | 6,306 (6.7%) | 3,429 (4.1%) |
| $75,000 to $99,999 | 9,701 (10.3%) | 5,540 (6.6%) |
| $100,000+ | 11,448 (12.2%) | 4,747 (5.7%) |
| Total | 93,956 (100.0%) | 83,940 (100.0%) |
Earnings by Sex by Educational Attainment in Lincoln
Average earnings in Lincoln are $53,099 for men and $41,130 for women, a difference of 22.5%. Men with an educational attainment of graduate degree enjoy the highest average annual earnings of $76,531, while those with less than high school education earn the least with $36,459. Women with an educational attainment of graduate degree earn the most with the average annual earnings of $62,369, while those with less than high school education have the smallest earnings of $25,847.
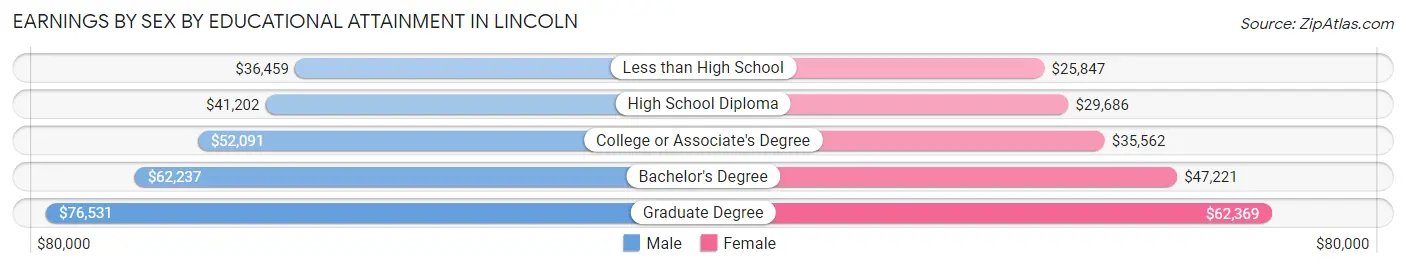
| Educational Attainment | Male Income | Female Income |
| Less than High School | $36,459 | $25,847 |
| High School Diploma | $41,202 | $29,686 |
| College or Associate's Degree | $52,091 | $35,562 |
| Bachelor's Degree | $62,237 | $47,221 |
| Graduate Degree | $76,531 | $62,369 |
| Total | $53,099 | $41,130 |
Family Income in Lincoln
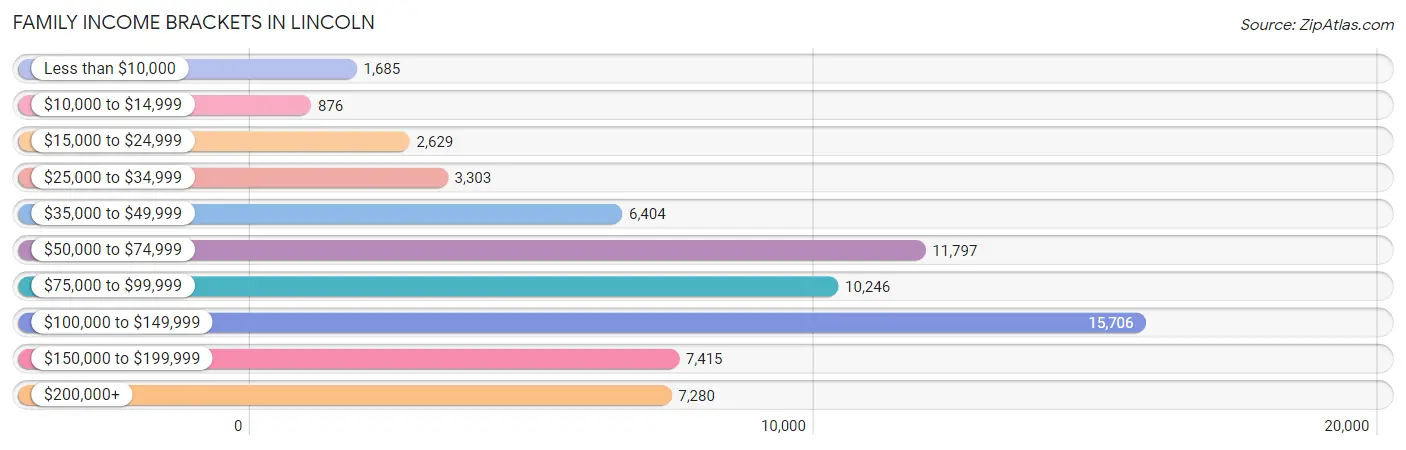
Family Income Brackets in Lincoln
According to the Lincoln family income data, there are 15,706 families falling into the $100,000 to $149,999 income range, which is the most common income bracket and makes up 23.3% of all families. Conversely, the $10,000 to $14,999 income bracket is the least frequent group with only 876 families (1.3%) belonging to this category.
| Income Bracket | # Families | % Families |
| Less than $10,000 | 1,685 | 2.5% |
| $10,000 to $14,999 | 876 | 1.3% |
| $15,000 to $24,999 | 2,629 | 3.9% |
| $25,000 to $34,999 | 3,303 | 4.9% |
| $35,000 to $49,999 | 6,404 | 9.5% |
| $50,000 to $74,999 | 11,797 | 17.5% |
| $75,000 to $99,999 | 10,246 | 15.2% |
| $100,000 to $149,999 | 15,706 | 23.3% |
| $150,000 to $199,999 | 7,415 | 11.0% |
| $200,000+ | 7,280 | 10.8% |
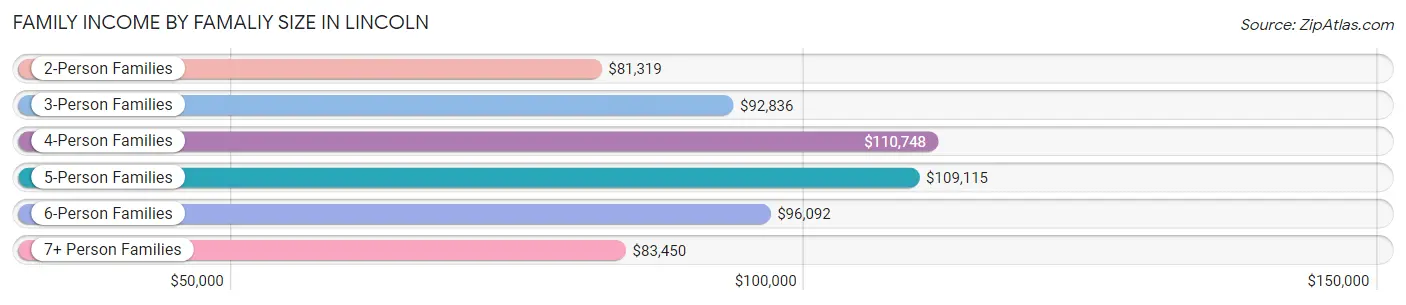
Family Income by Famaliy Size in Lincoln
4-person families (11,304 | 16.8%) account for the highest median family income in Lincoln with $110,748 per family, while 2-person families (32,754 | 48.6%) have the highest median income of $40,660 per family member.
| Income Bracket | # Families | Median Income |
| 2-Person Families | 32,754 (48.6%) | $81,319 |
| 3-Person Families | 14,096 (20.9%) | $92,836 |
| 4-Person Families | 11,304 (16.8%) | $110,748 |
| 5-Person Families | 5,698 (8.5%) | $109,115 |
| 6-Person Families | 2,640 (3.9%) | $96,092 |
| 7+ Person Families | 917 (1.4%) | $83,450 |
| Total | 67,409 (100.0%) | $91,236 |
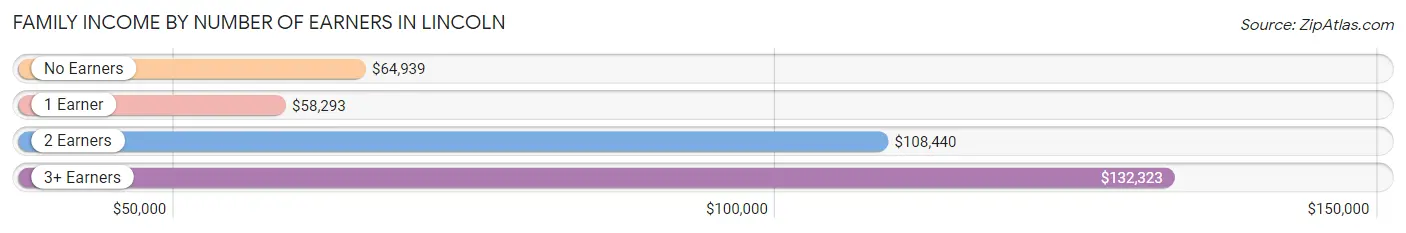
Family Income by Number of Earners in Lincoln
The median family income in Lincoln is $91,236, with families comprising 3+ earners (8,237) having the highest median family income of $132,323, while families with 1 earner (18,485) have the lowest median family income of $58,293, accounting for 12.2% and 27.4% of families, respectively.
| Number of Earners | # Families | Median Income |
| No Earners | 7,646 (11.3%) | $64,939 |
| 1 Earner | 18,485 (27.4%) | $58,293 |
| 2 Earners | 33,041 (49.0%) | $108,440 |
| 3+ Earners | 8,237 (12.2%) | $132,323 |
| Total | 67,409 (100.0%) | $91,236 |
Household Income in Lincoln
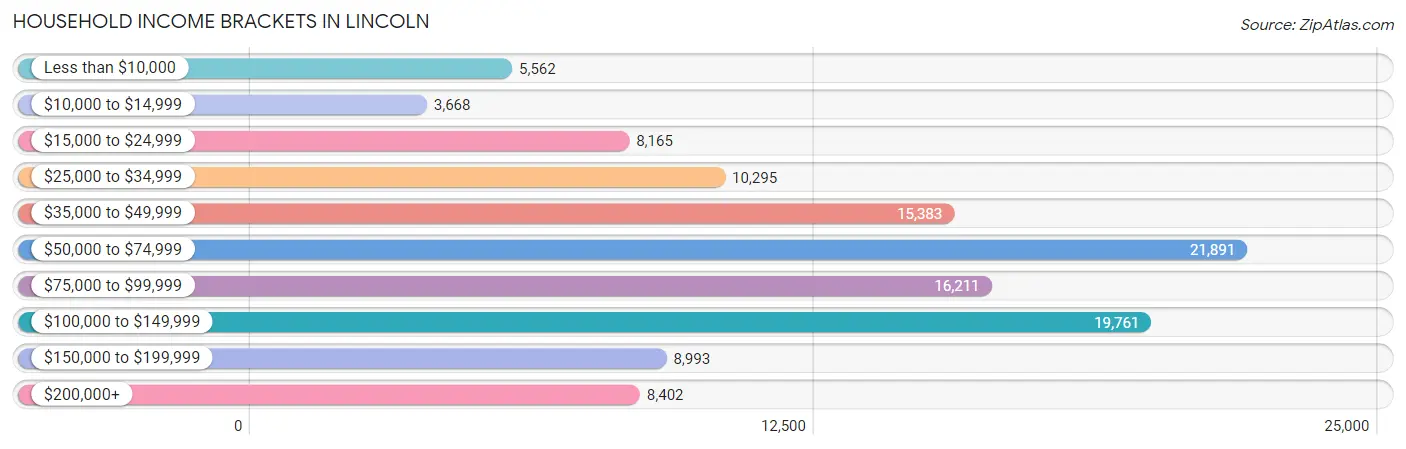
Household Income Brackets in Lincoln
With 21,891 households falling in the category, the $50,000 to $74,999 income range is the most frequent in Lincoln, accounting for 18.5% of all households. In contrast, only 3,668 households (3.1%) fall into the $10,000 to $14,999 income bracket, making it the least populous group.
| Income Bracket | # Households | % Households |
| Less than $10,000 | 5,562 | 4.7% |
| $10,000 to $14,999 | 3,668 | 3.1% |
| $15,000 to $24,999 | 8,165 | 6.9% |
| $25,000 to $34,999 | 10,295 | 8.7% |
| $35,000 to $49,999 | 15,383 | 13.0% |
| $50,000 to $74,999 | 21,891 | 18.5% |
| $75,000 to $99,999 | 16,211 | 13.7% |
| $100,000 to $149,999 | 19,761 | 16.7% |
| $150,000 to $199,999 | 8,993 | 7.6% |
| $200,000+ | 8,402 | 7.1% |
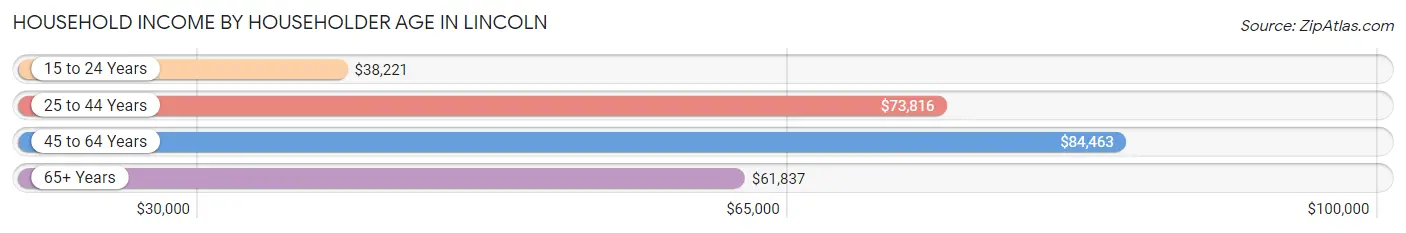
Household Income by Householder Age in Lincoln
The median household income in Lincoln is $67,846, with the highest median household income of $84,463 found in the 45 to 64 years age bracket for the primary householder. A total of 36,154 households (30.5%) fall into this category. Meanwhile, the 15 to 24 years age bracket for the primary householder has the lowest median household income of $38,221, with 13,613 households (11.5%) in this group.
| Income Bracket | # Households | Median Income |
| 15 to 24 Years | 13,613 (11.5%) | $38,221 |
| 25 to 44 Years | 42,157 (35.6%) | $73,816 |
| 45 to 64 Years | 36,154 (30.5%) | $84,463 |
| 65+ Years | 26,408 (22.3%) | $61,837 |
| Total | 118,332 (100.0%) | $67,846 |
Poverty in Lincoln
Income Below Poverty by Sex and Age in Lincoln
With 11.8% poverty level for males and 13.8% for females among the residents of Lincoln, 18 to 24 year old males and 18 to 24 year old females are the most vulnerable to poverty, with 5,423 males (27.5%) and 6,685 females (34.2%) in their respective age groups living below the poverty level.
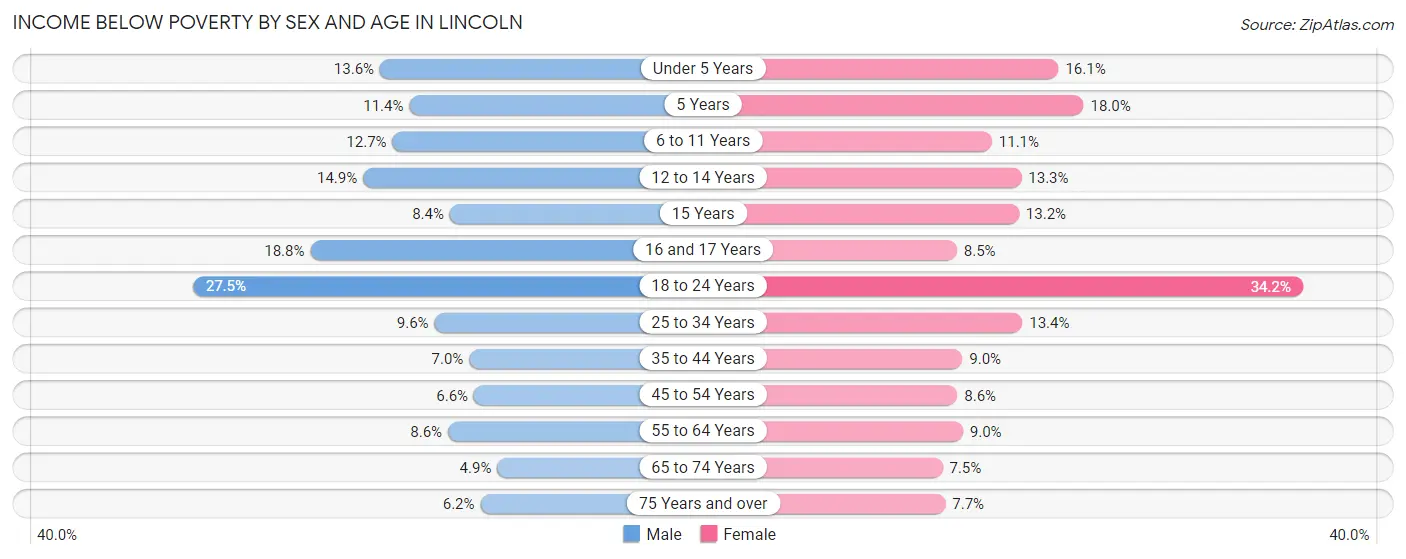
| Age Bracket | Male | Female |
| Under 5 Years | 1,203 (13.6%) | 1,285 (16.1%) |
| 5 Years | 197 (11.4%) | 342 (17.9%) |
| 6 to 11 Years | 1,388 (12.7%) | 1,094 (11.1%) |
| 12 to 14 Years | 770 (14.9%) | 711 (13.3%) |
| 15 Years | 168 (8.4%) | 234 (13.2%) |
| 16 and 17 Years | 668 (18.8%) | 303 (8.5%) |
| 18 to 24 Years | 5,423 (27.5%) | 6,685 (34.2%) |
| 25 to 34 Years | 2,014 (9.6%) | 2,585 (13.4%) |
| 35 to 44 Years | 1,281 (7.0%) | 1,579 (8.9%) |
| 45 to 54 Years | 1,019 (6.6%) | 1,231 (8.6%) |
| 55 to 64 Years | 1,254 (8.6%) | 1,383 (9.0%) |
| 65 to 74 Years | 552 (4.9%) | 978 (7.5%) |
| 75 Years and over | 391 (6.2%) | 712 (7.7%) |
| Total | 16,328 (11.8%) | 19,122 (13.8%) |
Income Above Poverty by Sex and Age in Lincoln
According to the poverty statistics in Lincoln, males aged 65 to 74 years and females aged 65 to 74 years are the age groups that are most secure financially, with 95.1% of males and 92.5% of females in these age groups living above the poverty line.
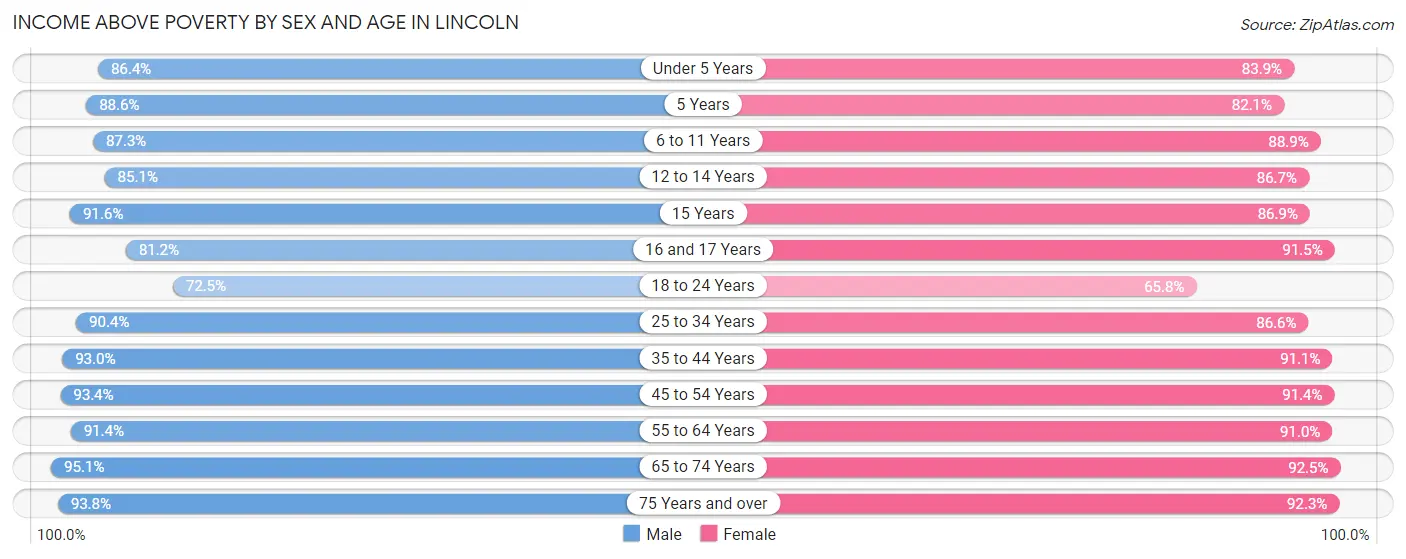
| Age Bracket | Male | Female |
| Under 5 Years | 7,628 (86.4%) | 6,699 (83.9%) |
| 5 Years | 1,525 (88.6%) | 1,563 (82.1%) |
| 6 to 11 Years | 9,546 (87.3%) | 8,725 (88.9%) |
| 12 to 14 Years | 4,407 (85.1%) | 4,624 (86.7%) |
| 15 Years | 1,825 (91.6%) | 1,546 (86.9%) |
| 16 and 17 Years | 2,887 (81.2%) | 3,245 (91.5%) |
| 18 to 24 Years | 14,292 (72.5%) | 12,853 (65.8%) |
| 25 to 34 Years | 19,036 (90.4%) | 16,702 (86.6%) |
| 35 to 44 Years | 17,049 (93.0%) | 16,057 (91.0%) |
| 45 to 54 Years | 14,317 (93.4%) | 13,117 (91.4%) |
| 55 to 64 Years | 13,378 (91.4%) | 14,003 (91.0%) |
| 65 to 74 Years | 10,697 (95.1%) | 12,096 (92.5%) |
| 75 Years and over | 5,956 (93.8%) | 8,552 (92.3%) |
| Total | 122,543 (88.2%) | 119,782 (86.2%) |
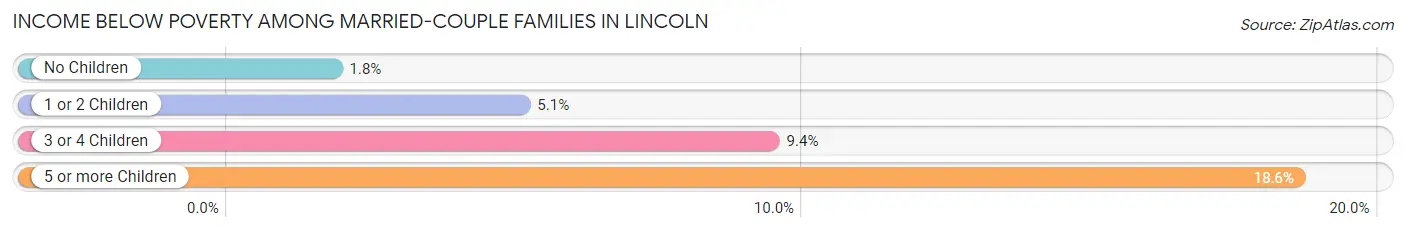
Income Below Poverty Among Married-Couple Families in Lincoln
The poverty statistics for married-couple families in Lincoln show that 3.8% or 1,950 of the total 50,792 families live below the poverty line. Families with 5 or more children have the highest poverty rate of 18.6%, comprising of 79 families. On the other hand, families with no children have the lowest poverty rate of 1.8%, which includes 522 families.
| Children | Above Poverty | Below Poverty |
| No Children | 28,189 (98.2%) | 522 (1.8%) |
| 1 or 2 Children | 15,157 (94.9%) | 813 (5.1%) |
| 3 or 4 Children | 5,150 (90.6%) | 536 (9.4%) |
| 5 or more Children | 346 (81.4%) | 79 (18.6%) |
| Total | 48,842 (96.2%) | 1,950 (3.8%) |
Income Below Poverty Among Single-Parent Households in Lincoln
According to the poverty data in Lincoln, 11.3% or 586 single-father households and 20.8% or 2,378 single-mother households are living below the poverty line. Among single-father households, those with 1 or 2 children have the highest poverty rate, with 338 households (13.8%) experiencing poverty. Likewise, among single-mother households, those with 5 or more children have the highest poverty rate, with 69 households (62.7%) falling below the poverty line.
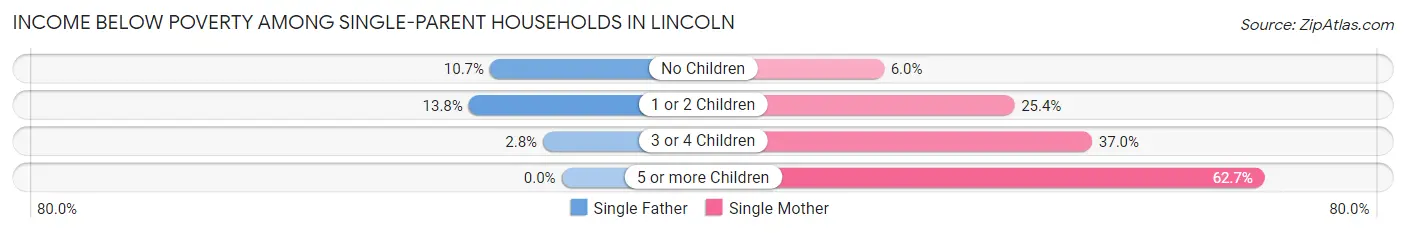
| Children | Single Father | Single Mother |
| No Children | 234 (10.7%) | 211 (6.0%) |
| 1 or 2 Children | 338 (13.8%) | 1,709 (25.4%) |
| 3 or 4 Children | 14 (2.8%) | 389 (37.0%) |
| 5 or more Children | 0 (0.0%) | 69 (62.7%) |
| Total | 586 (11.3%) | 2,378 (20.8%) |
Income Below Poverty Among Married-Couple vs Single-Parent Households in Lincoln
The poverty data for Lincoln shows that 1,950 of the married-couple family households (3.8%) and 2,964 of the single-parent households (17.8%) are living below the poverty level. Within the married-couple family households, those with 5 or more children have the highest poverty rate, with 79 households (18.6%) falling below the poverty line. Among the single-parent households, those with 5 or more children have the highest poverty rate, with 69 household (43.4%) living below poverty.
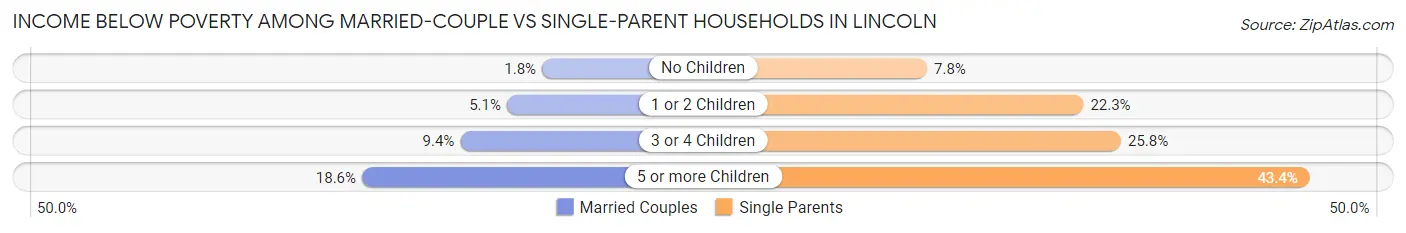
| Children | Married-Couple Families | Single-Parent Households |
| No Children | 522 (1.8%) | 445 (7.8%) |
| 1 or 2 Children | 813 (5.1%) | 2,047 (22.3%) |
| 3 or 4 Children | 536 (9.4%) | 403 (25.8%) |
| 5 or more Children | 79 (18.6%) | 69 (43.4%) |
| Total | 1,950 (3.8%) | 2,964 (17.8%) |
Race in Lincoln
The most populous races in Lincoln are White / Caucasian (238,130 | 82.0%), Hispanic or Latino (24,196 | 8.3%), and Two or more Races (19,253 | 6.6%).
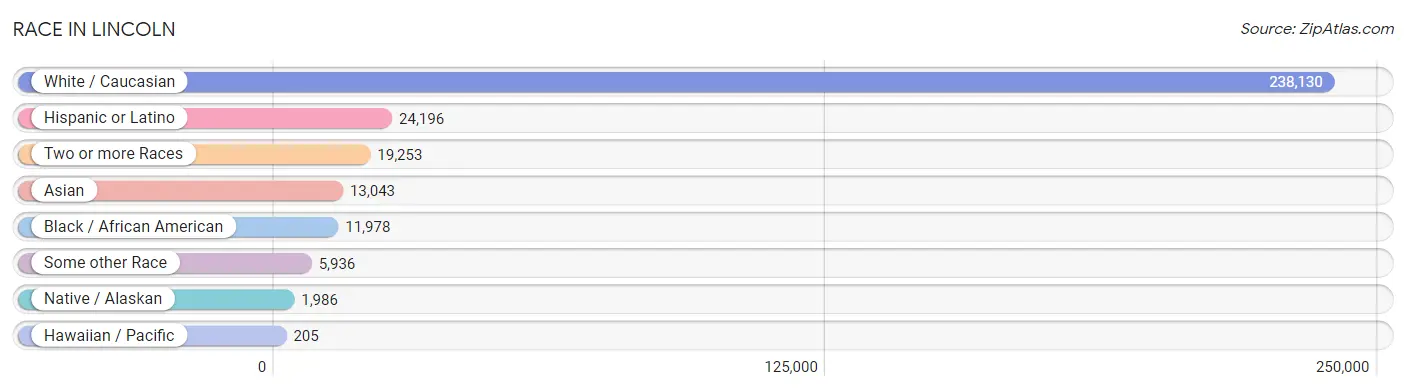
| Race | # Population | % Population |
| Asian | 13,043 | 4.5% |
| Black / African American | 11,978 | 4.1% |
| Hawaiian / Pacific | 205 | 0.1% |
| Hispanic or Latino | 24,196 | 8.3% |
| Native / Alaskan | 1,986 | 0.7% |
| White / Caucasian | 238,130 | 82.0% |
| Two or more Races | 19,253 | 6.6% |
| Some other Race | 5,936 | 2.0% |
| Total | 290,531 | 100.0% |
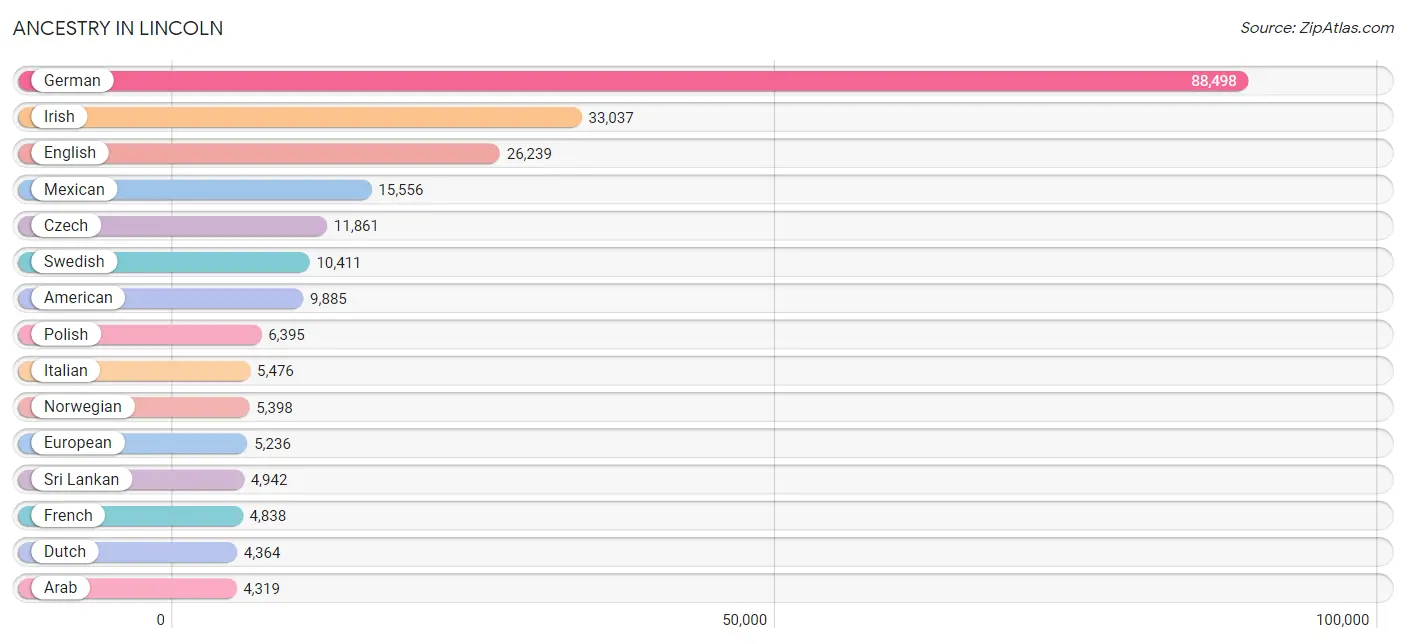
Ancestry in Lincoln
The most populous ancestries reported in Lincoln are German (88,498 | 30.5%), Irish (33,037 | 11.4%), English (26,239 | 9.0%), Mexican (15,556 | 5.3%), and Czech (11,861 | 4.1%), together accounting for 60.3% of all Lincoln residents.
| Ancestry | # Population | % Population |
| Afghan | 474 | 0.2% |
| African | 875 | 0.3% |
| Alaska Native | 22 | 0.0% |
| Albanian | 31 | 0.0% |
| American | 9,885 | 3.4% |
| Apache | 150 | 0.1% |
| Arab | 4,319 | 1.5% |
| Argentinean | 52 | 0.0% |
| Armenian | 108 | 0.0% |
| Assyrian / Chaldean / Syriac | 9 | 0.0% |
| Australian | 46 | 0.0% |
| Austrian | 404 | 0.1% |
| Bangladeshi | 77 | 0.0% |
| Barbadian | 6 | 0.0% |
| Basque | 10 | 0.0% |
| Belgian | 85 | 0.0% |
| Belizean | 10 | 0.0% |
| Bhutanese | 721 | 0.3% |
| Blackfeet | 98 | 0.0% |
| Bolivian | 8 | 0.0% |
| Brazilian | 153 | 0.1% |
| British | 1,607 | 0.5% |
| British West Indian | 177 | 0.1% |
| Bulgarian | 26 | 0.0% |
| Burmese | 829 | 0.3% |
| Cambodian | 111 | 0.0% |
| Canadian | 391 | 0.1% |
| Celtic | 142 | 0.1% |
| Central American | 3,043 | 1.1% |
| Central American Indian | 290 | 0.1% |
| Cherokee | 590 | 0.2% |
| Cheyenne | 8 | 0.0% |
| Chickasaw | 9 | 0.0% |
| Chilean | 63 | 0.0% |
| Chippewa | 118 | 0.0% |
| Choctaw | 34 | 0.0% |
| Colombian | 240 | 0.1% |
| Costa Rican | 36 | 0.0% |
| Creek | 80 | 0.0% |
| Croatian | 129 | 0.0% |
| Cuban | 649 | 0.2% |
| Czech | 11,861 | 4.1% |
| Czechoslovakian | 734 | 0.3% |
| Danish | 4,249 | 1.5% |
| Dominican | 329 | 0.1% |
| Dutch | 4,364 | 1.5% |
| Dutch West Indian | 33 | 0.0% |
| Eastern European | 274 | 0.1% |
| Ecuadorian | 80 | 0.0% |
| Egyptian | 73 | 0.0% |
| English | 26,239 | 9.0% |
| Ethiopian | 244 | 0.1% |
| European | 5,236 | 1.8% |
| Filipino | 99 | 0.0% |
| Finnish | 386 | 0.1% |
| French | 4,838 | 1.7% |
| French American Indian | 17 | 0.0% |
| French Canadian | 748 | 0.3% |
| German | 88,498 | 30.5% |
| German Russian | 267 | 0.1% |
| Ghanaian | 63 | 0.0% |
| Greek | 719 | 0.3% |
| Guamanian / Chamorro | 106 | 0.0% |
| Guatemalan | 1,507 | 0.5% |
| Guyanese | 7 | 0.0% |
| Haitian | 230 | 0.1% |
| Honduran | 179 | 0.1% |
| Houma | 4 | 0.0% |
| Hungarian | 404 | 0.1% |
| Icelander | 46 | 0.0% |
| Indian (Asian) | 2,178 | 0.7% |
| Indonesian | 1,317 | 0.4% |
| Inupiat | 13 | 0.0% |
| Iranian | 214 | 0.1% |
| Iraqi | 2,514 | 0.9% |
| Irish | 33,037 | 11.4% |
| Iroquois | 17 | 0.0% |
| Israeli | 10 | 0.0% |
| Italian | 5,476 | 1.9% |
| Jamaican | 89 | 0.0% |
| Japanese | 401 | 0.1% |
| Jordanian | 36 | 0.0% |
| Kenyan | 77 | 0.0% |
| Korean | 1,499 | 0.5% |
| Laotian | 103 | 0.0% |
| Latvian | 160 | 0.1% |
| Lebanese | 326 | 0.1% |
| Liberian | 33 | 0.0% |
| Lithuanian | 160 | 0.1% |
| Luxembourger | 68 | 0.0% |
| Macedonian | 94 | 0.0% |
| Malaysian | 94 | 0.0% |
| Mexican | 15,556 | 5.3% |
| Mexican American Indian | 426 | 0.2% |
| Mongolian | 290 | 0.1% |
| Moroccan | 147 | 0.1% |
| Native Hawaiian | 211 | 0.1% |
| Navajo | 56 | 0.0% |
| New Zealander | 10 | 0.0% |
| Nicaraguan | 62 | 0.0% |
| Nigerian | 192 | 0.1% |
| Northern European | 742 | 0.3% |
| Norwegian | 5,398 | 1.9% |
| Osage | 14 | 0.0% |
| Pakistani | 603 | 0.2% |
| Palestinian | 28 | 0.0% |
| Panamanian | 58 | 0.0% |
| Paraguayan | 10 | 0.0% |
| Pennsylvania German | 93 | 0.0% |
| Peruvian | 134 | 0.1% |
| Polish | 6,395 | 2.2% |
| Portuguese | 400 | 0.1% |
| Potawatomi | 16 | 0.0% |
| Pueblo | 118 | 0.0% |
| Puerto Rican | 954 | 0.3% |
| Romanian | 162 | 0.1% |
| Russian | 1,970 | 0.7% |
| Salvadoran | 1,125 | 0.4% |
| Samoan | 60 | 0.0% |
| Scandinavian | 841 | 0.3% |
| Scotch-Irish | 2,188 | 0.7% |
| Scottish | 3,823 | 1.3% |
| Serbian | 41 | 0.0% |
| Shoshone | 4 | 0.0% |
| Sioux | 868 | 0.3% |
| Slavic | 158 | 0.1% |
| Slovak | 204 | 0.1% |
| Slovene | 3 | 0.0% |
| Somali | 149 | 0.1% |
| South American | 767 | 0.3% |
| South American Indian | 72 | 0.0% |
| Spaniard | 227 | 0.1% |
| Spanish | 639 | 0.2% |
| Spanish American | 9 | 0.0% |
| Sri Lankan | 4,942 | 1.7% |
| Subsaharan African | 2,778 | 1.0% |
| Sudanese | 777 | 0.3% |
| Swedish | 10,411 | 3.6% |
| Swiss | 704 | 0.2% |
| Syrian | 86 | 0.0% |
| Thai | 2,096 | 0.7% |
| Trinidadian and Tobagonian | 68 | 0.0% |
| Turkish | 56 | 0.0% |
| Ugandan | 19 | 0.0% |
| Ukrainian | 1,477 | 0.5% |
| Venezuelan | 154 | 0.1% |
| Vietnamese | 49 | 0.0% |
| Welsh | 1,424 | 0.5% |
| West Indian | 80 | 0.0% |
| Yaqui | 21 | 0.0% |
| Yugoslavian | 222 | 0.1% |
| Yup'ik | 4 | 0.0% | View All 152 Rows |
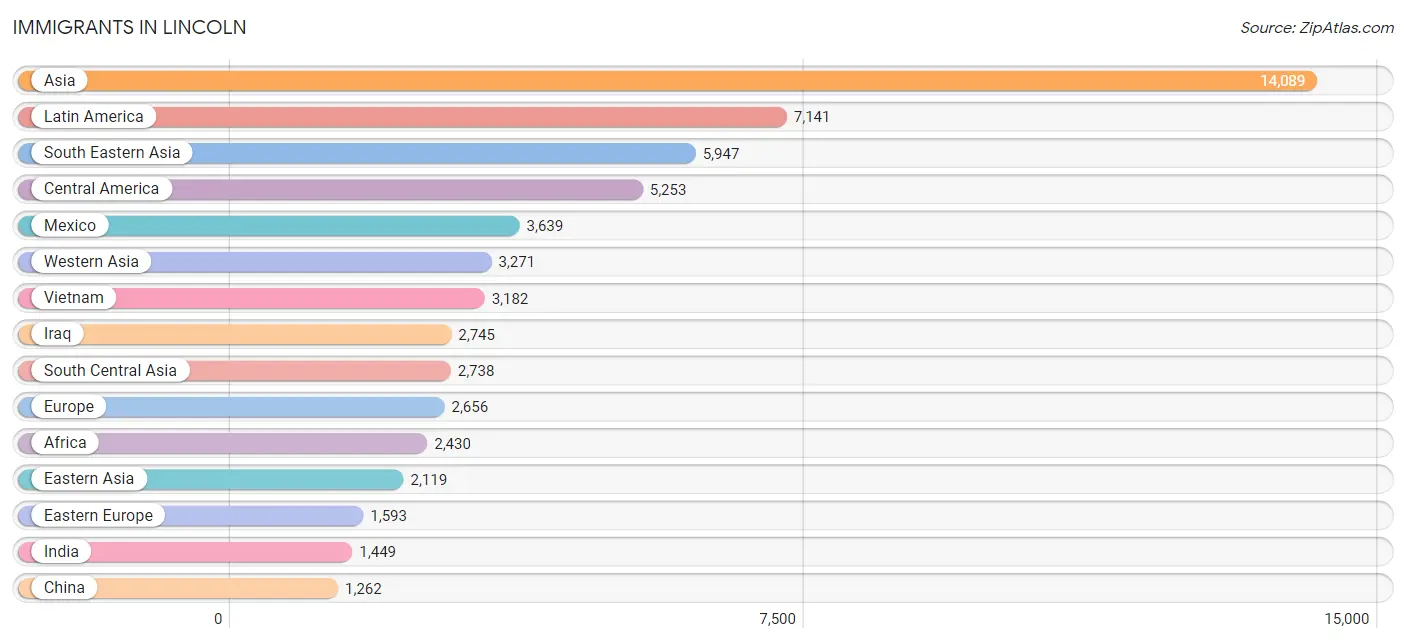
Immigrants in Lincoln
The most numerous immigrant groups reported in Lincoln came from Asia (14,089 | 4.9%), Latin America (7,141 | 2.5%), South Eastern Asia (5,947 | 2.1%), Central America (5,253 | 1.8%), and Mexico (3,639 | 1.3%), together accounting for 12.4% of all Lincoln residents.
| Immigration Origin | # Population | % Population |
| Afghanistan | 541 | 0.2% |
| Africa | 2,430 | 0.8% |
| Albania | 14 | 0.0% |
| Argentina | 47 | 0.0% |
| Asia | 14,089 | 4.9% |
| Australia | 25 | 0.0% |
| Austria | 22 | 0.0% |
| Bangladesh | 36 | 0.0% |
| Barbados | 6 | 0.0% |
| Belarus | 56 | 0.0% |
| Belgium | 55 | 0.0% |
| Belize | 10 | 0.0% |
| Bolivia | 8 | 0.0% |
| Bosnia and Herzegovina | 178 | 0.1% |
| Brazil | 468 | 0.2% |
| Bulgaria | 10 | 0.0% |
| Cambodia | 25 | 0.0% |
| Cameroon | 189 | 0.1% |
| Canada | 176 | 0.1% |
| Caribbean | 1,066 | 0.4% |
| Central America | 5,253 | 1.8% |
| Chile | 17 | 0.0% |
| China | 1,262 | 0.4% |
| Colombia | 122 | 0.0% |
| Congo | 9 | 0.0% |
| Costa Rica | 63 | 0.0% |
| Cuba | 253 | 0.1% |
| Denmark | 19 | 0.0% |
| Dominican Republic | 222 | 0.1% |
| Eastern Africa | 732 | 0.3% |
| Eastern Asia | 2,119 | 0.7% |
| Eastern Europe | 1,593 | 0.5% |
| Ecuador | 10 | 0.0% |
| Egypt | 15 | 0.0% |
| El Salvador | 759 | 0.3% |
| England | 128 | 0.0% |
| Eritrea | 12 | 0.0% |
| Ethiopia | 239 | 0.1% |
| Europe | 2,656 | 0.9% |
| France | 64 | 0.0% |
| Germany | 363 | 0.1% |
| Ghana | 115 | 0.0% |
| Greece | 87 | 0.0% |
| Grenada | 133 | 0.1% |
| Guatemala | 661 | 0.2% |
| Haiti | 241 | 0.1% |
| Honduras | 66 | 0.0% |
| Hong Kong | 10 | 0.0% |
| Hungary | 34 | 0.0% |
| India | 1,449 | 0.5% |
| Indonesia | 10 | 0.0% |
| Iran | 165 | 0.1% |
| Iraq | 2,745 | 0.9% |
| Ireland | 10 | 0.0% |
| Israel | 2 | 0.0% |
| Italy | 42 | 0.0% |
| Jamaica | 104 | 0.0% |
| Japan | 275 | 0.1% |
| Jordan | 100 | 0.0% |
| Kazakhstan | 32 | 0.0% |
| Kenya | 77 | 0.0% |
| Korea | 582 | 0.2% |
| Kuwait | 28 | 0.0% |
| Laos | 14 | 0.0% |
| Latin America | 7,141 | 2.5% |
| Latvia | 40 | 0.0% |
| Lebanon | 22 | 0.0% |
| Liberia | 64 | 0.0% |
| Lithuania | 13 | 0.0% |
| Malaysia | 524 | 0.2% |
| Mexico | 3,639 | 1.3% |
| Middle Africa | 251 | 0.1% |
| Moldova | 25 | 0.0% |
| Morocco | 71 | 0.0% |
| Nepal | 94 | 0.0% |
| Netherlands | 16 | 0.0% |
| Nicaragua | 30 | 0.0% |
| Nigeria | 188 | 0.1% |
| North Macedonia | 19 | 0.0% |
| Northern Africa | 657 | 0.2% |
| Northern Europe | 348 | 0.1% |
| Oceania | 42 | 0.0% |
| Pakistan | 228 | 0.1% |
| Panama | 25 | 0.0% |
| Peru | 74 | 0.0% |
| Philippines | 613 | 0.2% |
| Poland | 129 | 0.0% |
| Romania | 108 | 0.0% |
| Russia | 204 | 0.1% |
| Saudi Arabia | 185 | 0.1% |
| Scotland | 23 | 0.0% |
| Serbia | 30 | 0.0% |
| Somalia | 149 | 0.1% |
| South Africa | 17 | 0.0% |
| South America | 822 | 0.3% |
| South Central Asia | 2,738 | 0.9% |
| South Eastern Asia | 5,947 | 2.1% |
| Southern Europe | 143 | 0.1% |
| Spain | 14 | 0.0% |
| Sri Lanka | 14 | 0.0% |
| Sudan | 474 | 0.2% |
| Sweden | 68 | 0.0% |
| Switzerland | 10 | 0.0% |
| Syria | 105 | 0.0% |
| Taiwan | 109 | 0.0% |
| Thailand | 826 | 0.3% |
| Trinidad and Tobago | 23 | 0.0% |
| Turkey | 19 | 0.0% |
| Uganda | 28 | 0.0% |
| Ukraine | 717 | 0.3% |
| Uzbekistan | 45 | 0.0% |
| Venezuela | 74 | 0.0% |
| Vietnam | 3,182 | 1.1% |
| Western Africa | 681 | 0.2% |
| Western Asia | 3,271 | 1.1% |
| Western Europe | 530 | 0.2% |
| Zaire | 34 | 0.0% |
| Zimbabwe | 1 | 0.0% | View All 118 Rows |
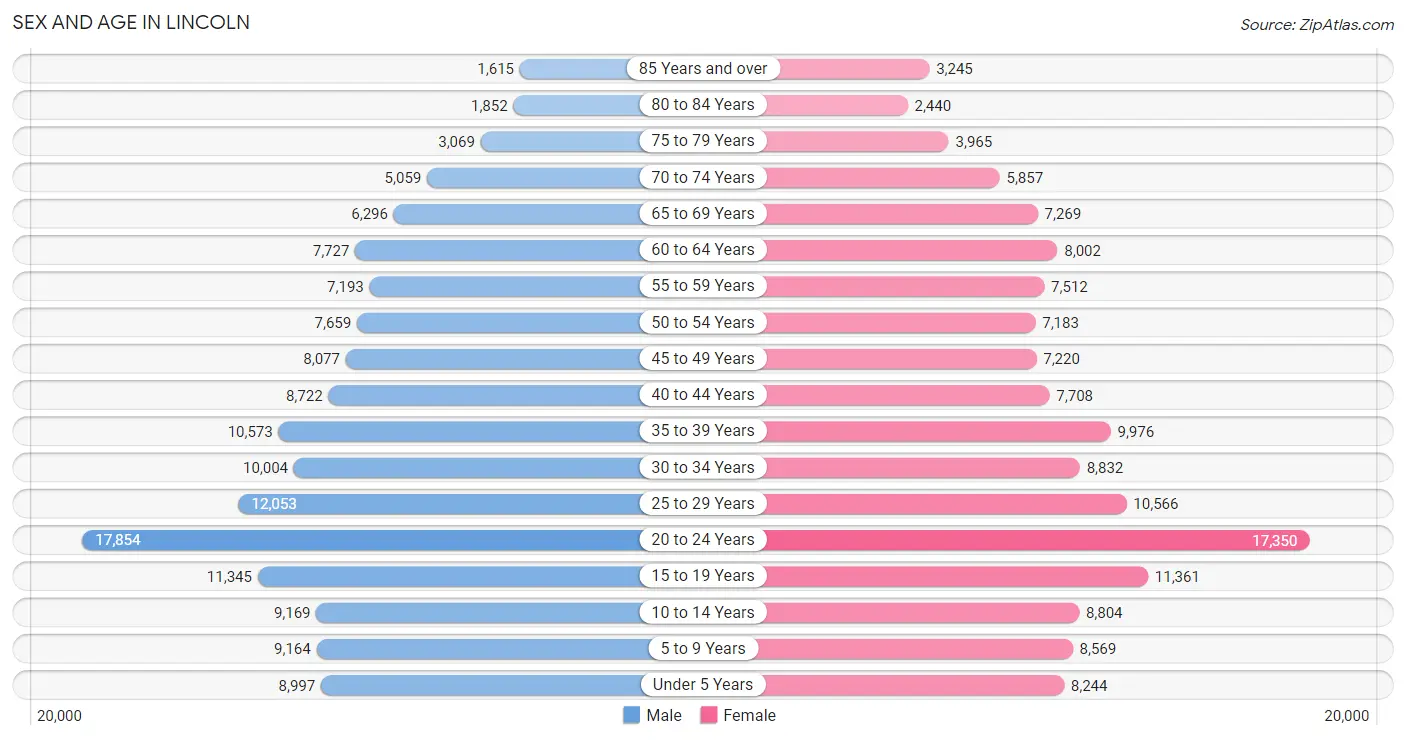
Sex and Age in Lincoln
Sex and Age in Lincoln
The most populous age groups in Lincoln are 20 to 24 Years (17,854 | 12.2%) for men and 20 to 24 Years (17,350 | 12.0%) for women.
| Age Bracket | Male | Female |
| Under 5 Years | 8,997 (6.1%) | 8,244 (5.7%) |
| 5 to 9 Years | 9,164 (6.3%) | 8,569 (5.9%) |
| 10 to 14 Years | 9,169 (6.3%) | 8,804 (6.1%) |
| 15 to 19 Years | 11,345 (7.7%) | 11,361 (7.9%) |
| 20 to 24 Years | 17,854 (12.2%) | 17,350 (12.0%) |
| 25 to 29 Years | 12,053 (8.2%) | 10,566 (7.3%) |
| 30 to 34 Years | 10,004 (6.8%) | 8,832 (6.1%) |
| 35 to 39 Years | 10,573 (7.2%) | 9,976 (6.9%) |
| 40 to 44 Years | 8,722 (6.0%) | 7,708 (5.3%) |
| 45 to 49 Years | 8,077 (5.5%) | 7,220 (5.0%) |
| 50 to 54 Years | 7,659 (5.2%) | 7,183 (5.0%) |
| 55 to 59 Years | 7,193 (4.9%) | 7,512 (5.2%) |
| 60 to 64 Years | 7,727 (5.3%) | 8,002 (5.6%) |
| 65 to 69 Years | 6,296 (4.3%) | 7,269 (5.0%) |
| 70 to 74 Years | 5,059 (3.5%) | 5,857 (4.1%) |
| 75 to 79 Years | 3,069 (2.1%) | 3,965 (2.8%) |
| 80 to 84 Years | 1,852 (1.3%) | 2,440 (1.7%) |
| 85 Years and over | 1,615 (1.1%) | 3,245 (2.2%) |
| Total | 146,428 (100.0%) | 144,103 (100.0%) |
Families and Households in Lincoln
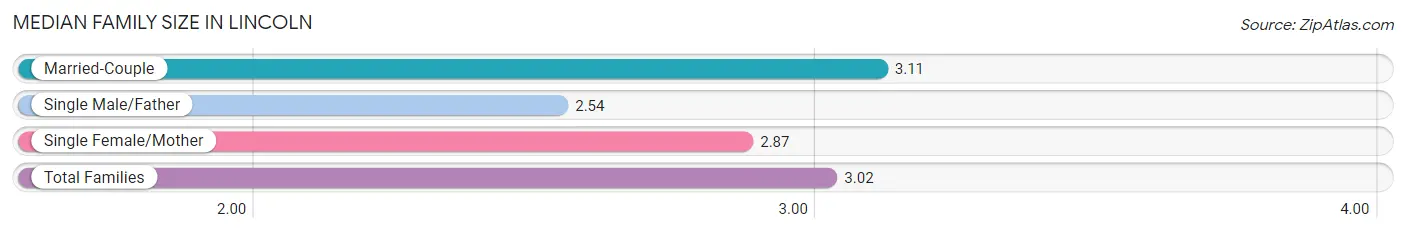
Median Family Size in Lincoln
The median family size in Lincoln is 3.02 persons per family, with married-couple families (50,792 | 75.3%) accounting for the largest median family size of 3.11 persons per family. On the other hand, single male/father families (5,193 | 7.7%) represent the smallest median family size with 2.54 persons per family.
| Family Type | # Families | Family Size |
| Married-Couple | 50,792 (75.3%) | 3.11 |
| Single Male/Father | 5,193 (7.7%) | 2.54 |
| Single Female/Mother | 11,424 (17.0%) | 2.87 |
| Total Families | 67,409 (100.0%) | 3.02 |
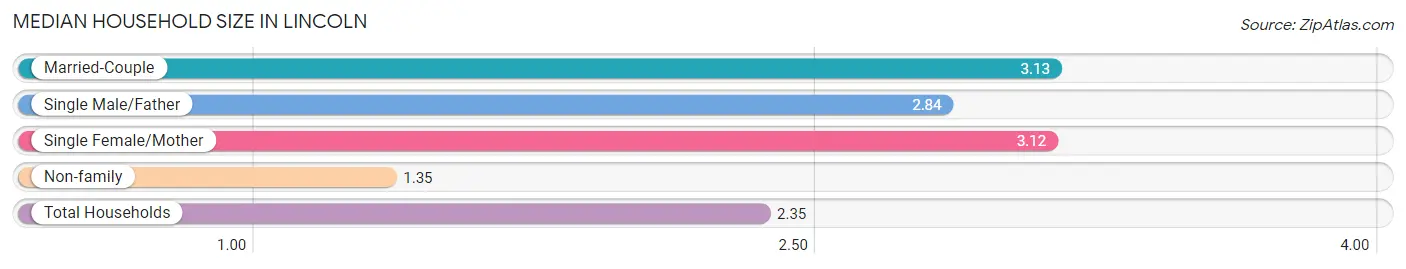
Median Household Size in Lincoln
The median household size in Lincoln is 2.35 persons per household, with married-couple households (50,792 | 42.9%) accounting for the largest median household size of 3.13 persons per household. non-family households (50,923 | 43.0%) represent the smallest median household size with 1.35 persons per household.
| Household Type | # Households | Household Size |
| Married-Couple | 50,792 (42.9%) | 3.13 |
| Single Male/Father | 5,193 (4.4%) | 2.84 |
| Single Female/Mother | 11,424 (9.7%) | 3.12 |
| Non-family | 50,923 (43.0%) | 1.35 |
| Total Households | 118,332 (100.0%) | 2.35 |
Household Size by Marriage Status in Lincoln
Out of a total of 118,332 households in Lincoln, 67,409 (57.0%) are family households, while 50,923 (43.0%) are nonfamily households. The most numerous type of family households are 2-person households, comprising 30,437, and the most common type of nonfamily households are 1-person households, comprising 37,939.
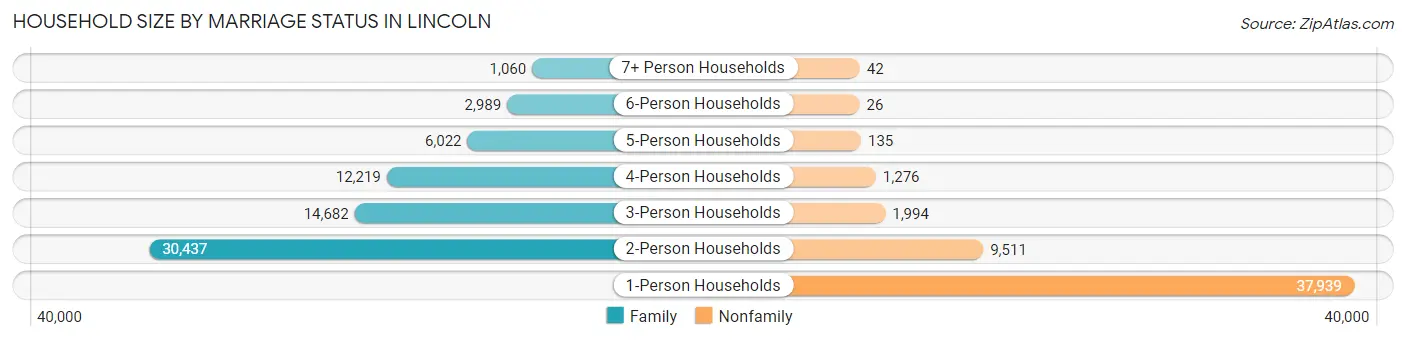
| Household Size | Family Households | Nonfamily Households |
| 1-Person Households | - | 37,939 (32.1%) |
| 2-Person Households | 30,437 (25.7%) | 9,511 (8.0%) |
| 3-Person Households | 14,682 (12.4%) | 1,994 (1.7%) |
| 4-Person Households | 12,219 (10.3%) | 1,276 (1.1%) |
| 5-Person Households | 6,022 (5.1%) | 135 (0.1%) |
| 6-Person Households | 2,989 (2.5%) | 26 (0.0%) |
| 7+ Person Households | 1,060 (0.9%) | 42 (0.0%) |
| Total | 67,409 (57.0%) | 50,923 (43.0%) |
Female Fertility in Lincoln
Fertility by Age in Lincoln
Average fertility rate in Lincoln is 47.0 births per 1,000 women. Women in the age bracket of 20 to 34 years have the highest fertility rate with 68.0 births per 1,000 women. Women in the age bracket of 20 to 34 years acount for 71.1% of all women with births.
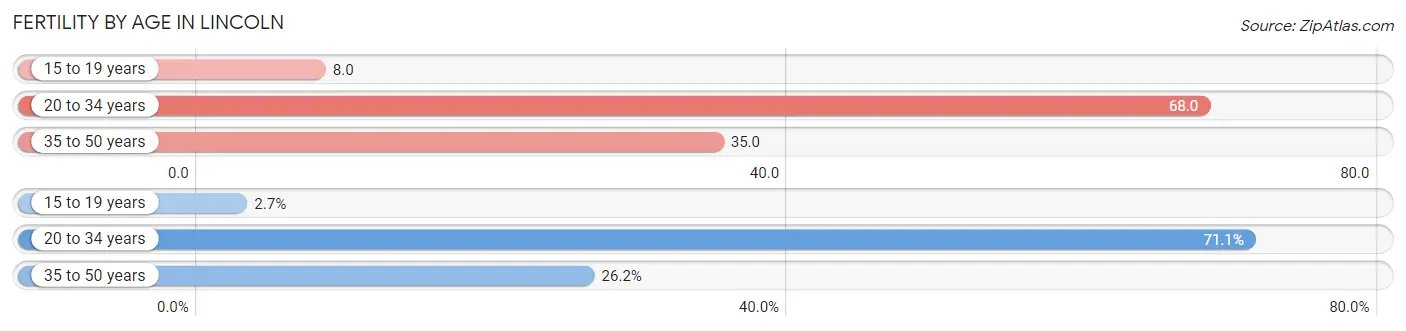
| Age Bracket | Women with Births | Births / 1,000 Women |
| 15 to 19 years | 94 (2.7%) | 8.0 |
| 20 to 34 years | 2,503 (71.1%) | 68.0 |
| 35 to 50 years | 924 (26.2%) | 35.0 |
| Total | 3,521 (100.0%) | 47.0 |
Fertility by Age by Marriage Status in Lincoln
67.3% of women with births (3,521) in Lincoln are married. The highest percentage of unmarried women with births falls into 15 to 19 years age bracket with 100.0% of them unmarried at the time of birth, while the lowest percentage of unmarried women with births belong to 35 to 50 years age bracket with 16.1% of them unmarried.
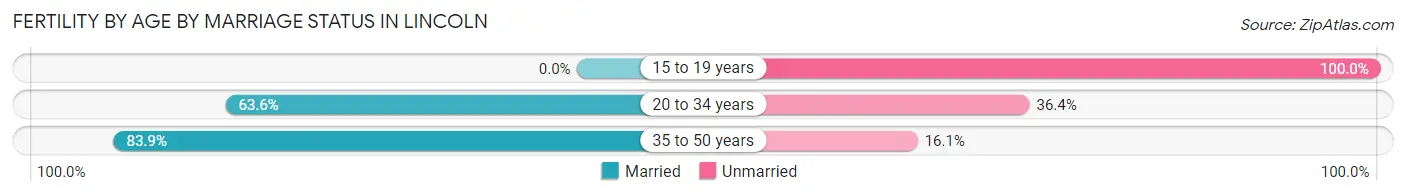
| Age Bracket | Married | Unmarried |
| 15 to 19 years | 0 (0.0%) | 94 (100.0%) |
| 20 to 34 years | 1,592 (63.6%) | 911 (36.4%) |
| 35 to 50 years | 775 (83.9%) | 149 (16.1%) |
| Total | 2,370 (67.3%) | 1,151 (32.7%) |
Fertility by Education in Lincoln
Average fertility rate in Lincoln is 47.0 births per 1,000 women. Women with the education attainment of bachelor's degree have the highest fertility rate of 59.0 births per 1,000 women, while women with the education attainment of less than high school have the lowest fertility at 30.0 births per 1,000 women. Women with the education attainment of bachelor's degree represent 32.4% of all women with births.
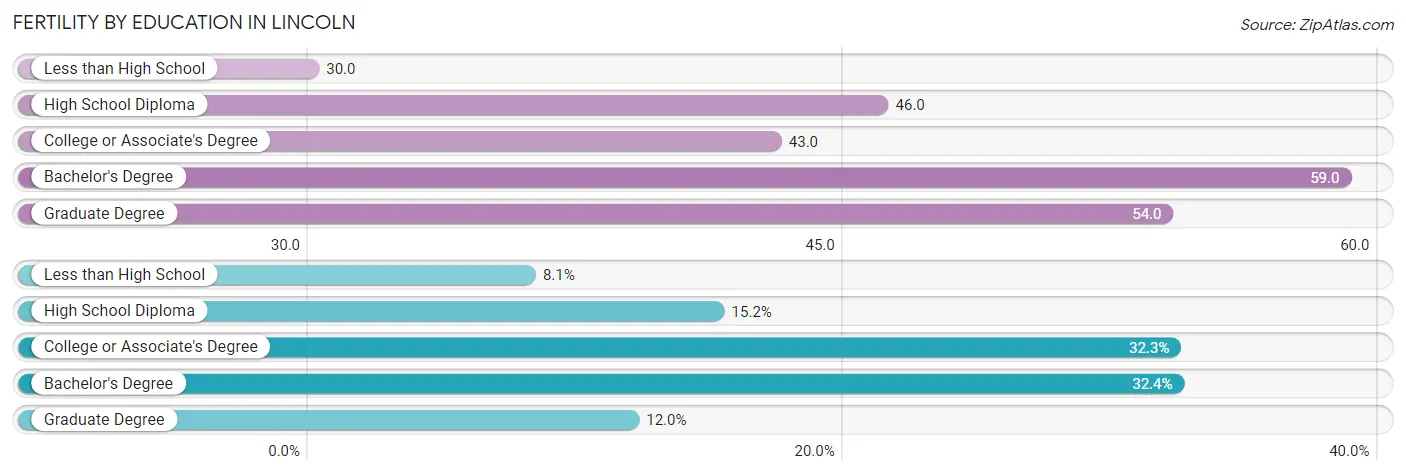
| Educational Attainment | Women with Births | Births / 1,000 Women |
| Less than High School | 286 (8.1%) | 30.0 |
| High School Diploma | 535 (15.2%) | 46.0 |
| College or Associate's Degree | 1,137 (32.3%) | 43.0 |
| Bachelor's Degree | 1,141 (32.4%) | 59.0 |
| Graduate Degree | 422 (12.0%) | 54.0 |
| Total | 3,521 (100.0%) | 47.0 |
Fertility by Education by Marriage Status in Lincoln
32.7% of women with births in Lincoln are unmarried. Women with the educational attainment of bachelor's degree are most likely to be married with 86.4% of them married at childbirth, while women with the educational attainment of high school diploma are least likely to be married with 52.9% of them unmarried at childbirth.
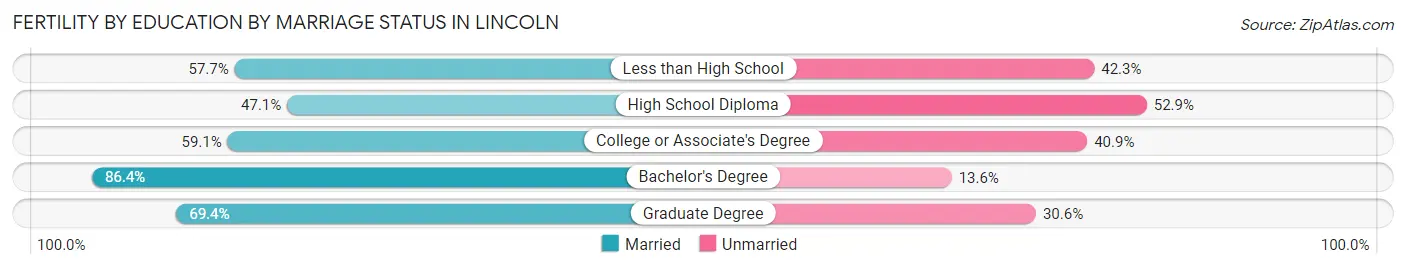
| Educational Attainment | Married | Unmarried |
| Less than High School | 165 (57.7%) | 121 (42.3%) |
| High School Diploma | 252 (47.1%) | 283 (52.9%) |
| College or Associate's Degree | 672 (59.1%) | 465 (40.9%) |
| Bachelor's Degree | 986 (86.4%) | 155 (13.6%) |
| Graduate Degree | 293 (69.4%) | 129 (30.6%) |
| Total | 2,370 (67.3%) | 1,151 (32.7%) |
Employment Characteristics in Lincoln
Employment by Class of Employer in Lincoln
Among the 157,701 employed individuals in Lincoln, private company employees (100,591 | 63.8%), not-for-profit organizations (16,228 | 10.3%), and state government employees (14,955 | 9.5%) make up the most common classes of employment.
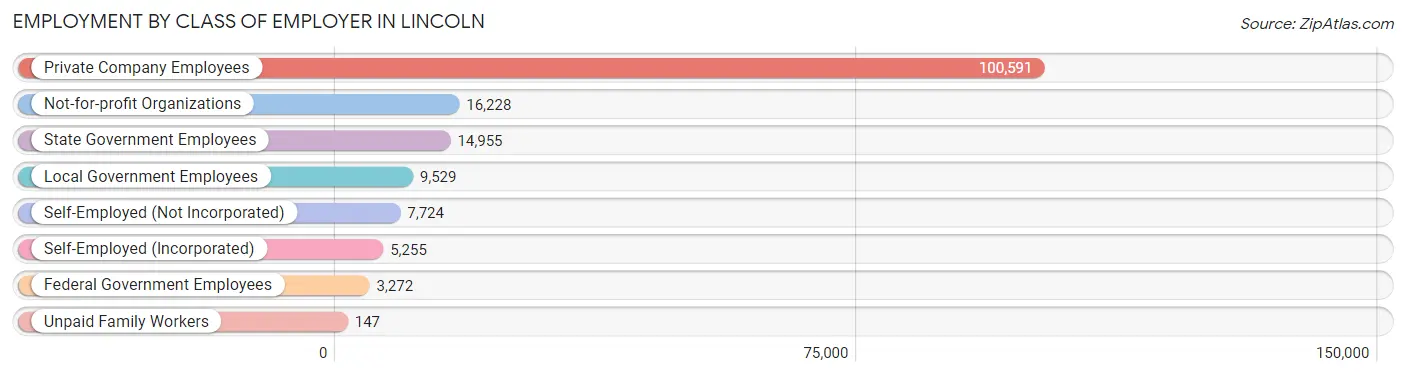
| Employer Class | # Employees | % Employees |
| Private Company Employees | 100,591 | 63.8% |
| Self-Employed (Incorporated) | 5,255 | 3.3% |
| Self-Employed (Not Incorporated) | 7,724 | 4.9% |
| Not-for-profit Organizations | 16,228 | 10.3% |
| Local Government Employees | 9,529 | 6.0% |
| State Government Employees | 14,955 | 9.5% |
| Federal Government Employees | 3,272 | 2.1% |
| Unpaid Family Workers | 147 | 0.1% |
| Total | 157,701 | 100.0% |
Employment Status by Age in Lincoln
According to the labor force statistics for Lincoln, out of the total population over 16 years of age (233,798), 70.9% or 165,763 individuals are in the labor force, with 3.3% or 5,470 of them unemployed. The age group with the highest labor force participation rate is 30 to 34 years, with 87.7% or 16,519 individuals in the labor force. Within the labor force, the 16 to 19 years age range has the highest percentage of unemployed individuals, with 10.2% or 1,092 of them being unemployed.
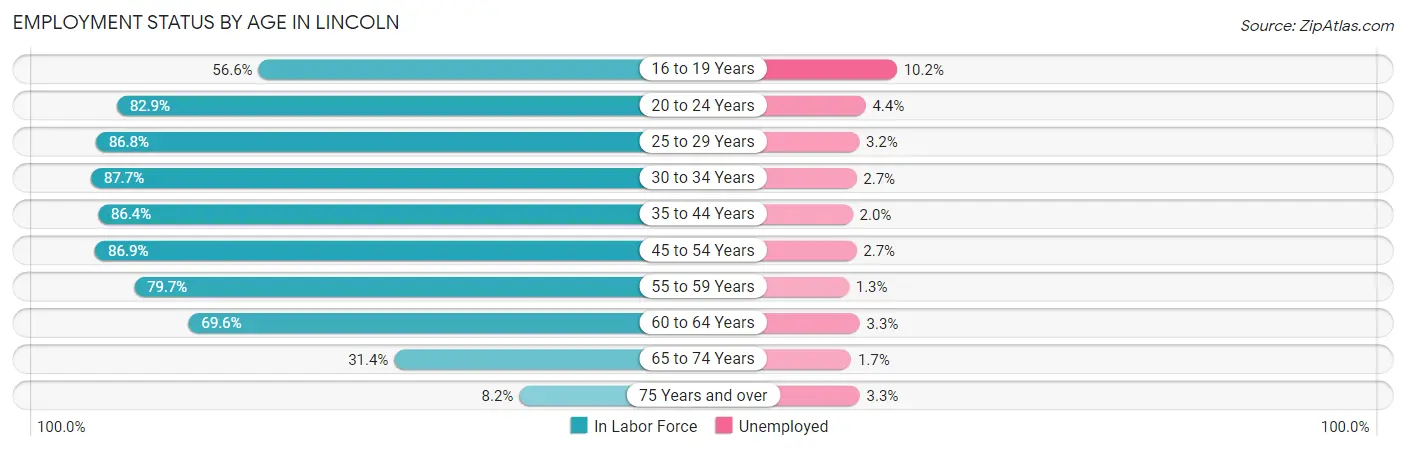
| Age Bracket | In Labor Force | Unemployed |
| 16 to 19 Years | 10,709 (56.6%) | 1,092 (10.2%) |
| 20 to 24 Years | 29,184 (82.9%) | 1,284 (4.4%) |
| 25 to 29 Years | 19,633 (86.8%) | 628 (3.2%) |
| 30 to 34 Years | 16,519 (87.7%) | 446 (2.7%) |
| 35 to 44 Years | 31,950 (86.4%) | 639 (2.0%) |
| 45 to 54 Years | 26,191 (86.9%) | 707 (2.7%) |
| 55 to 59 Years | 11,720 (79.7%) | 152 (1.3%) |
| 60 to 64 Years | 10,947 (69.6%) | 361 (3.3%) |
| 65 to 74 Years | 7,687 (31.4%) | 131 (1.7%) |
| 75 Years and over | 1,327 (8.2%) | 44 (3.3%) |
| Total | 165,763 (70.9%) | 5,470 (3.3%) |
Employment Status by Educational Attainment in Lincoln
According to labor force statistics for Lincoln, 84.2% of individuals (117,044) out of the total population between 25 and 64 years of age (139,007) are in the labor force, with 2.5% or 2,926 of them being unemployed. The group with the highest labor force participation rate are those with the educational attainment of bachelor's degree or higher, with 91.3% or 53,905 individuals in the labor force. Within the labor force, individuals with less than high school education have the highest percentage of unemployment, with 4.0% or 268 of them being unemployed.
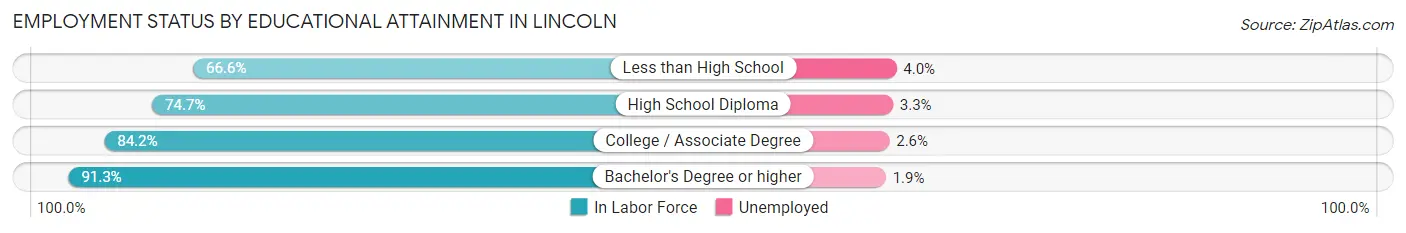
| Educational Attainment | In Labor Force | Unemployed |
| Less than High School | 6,703 (66.6%) | 403 (4.0%) |
| High School Diploma | 19,553 (74.7%) | 864 (3.3%) |
| College / Associate Degree | 36,817 (84.2%) | 1,137 (2.6%) |
| Bachelor's Degree or higher | 53,905 (91.3%) | 1,122 (1.9%) |
| Total | 117,044 (84.2%) | 3,475 (2.5%) |
Employment Occupations by Sex in Lincoln
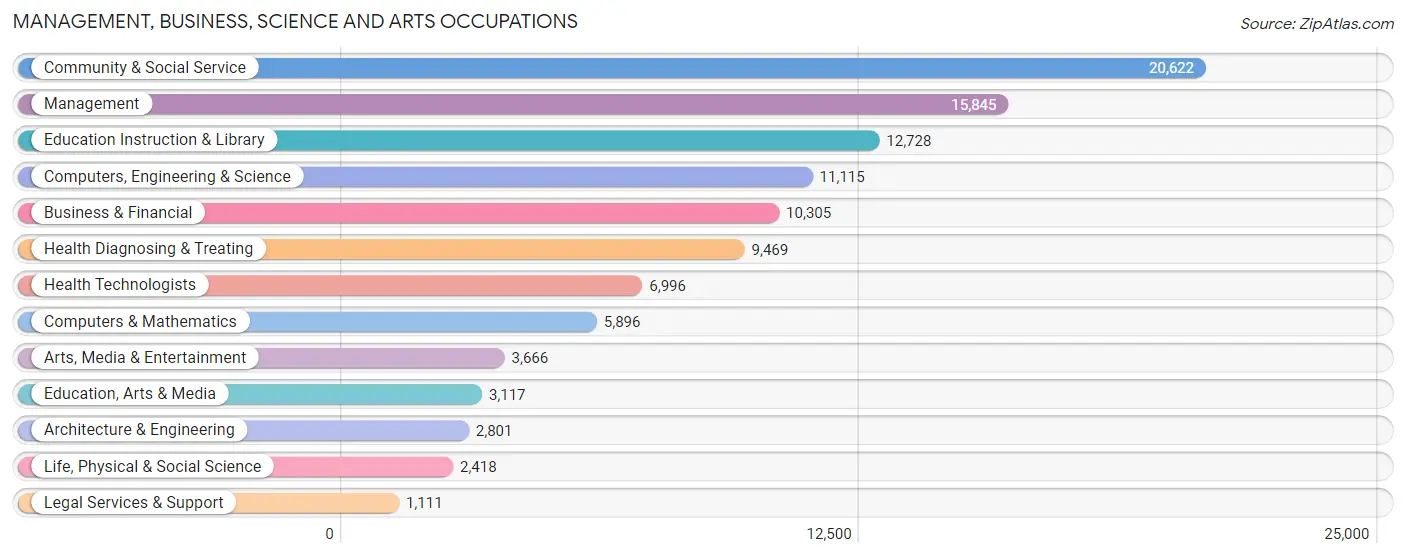
Management, Business, Science and Arts Occupations
The most common Management, Business, Science and Arts occupations in Lincoln are Community & Social Service (20,622 | 12.9%), Management (15,845 | 9.9%), Education Instruction & Library (12,728 | 8.0%), Computers, Engineering & Science (11,115 | 7.0%), and Business & Financial (10,305 | 6.4%).
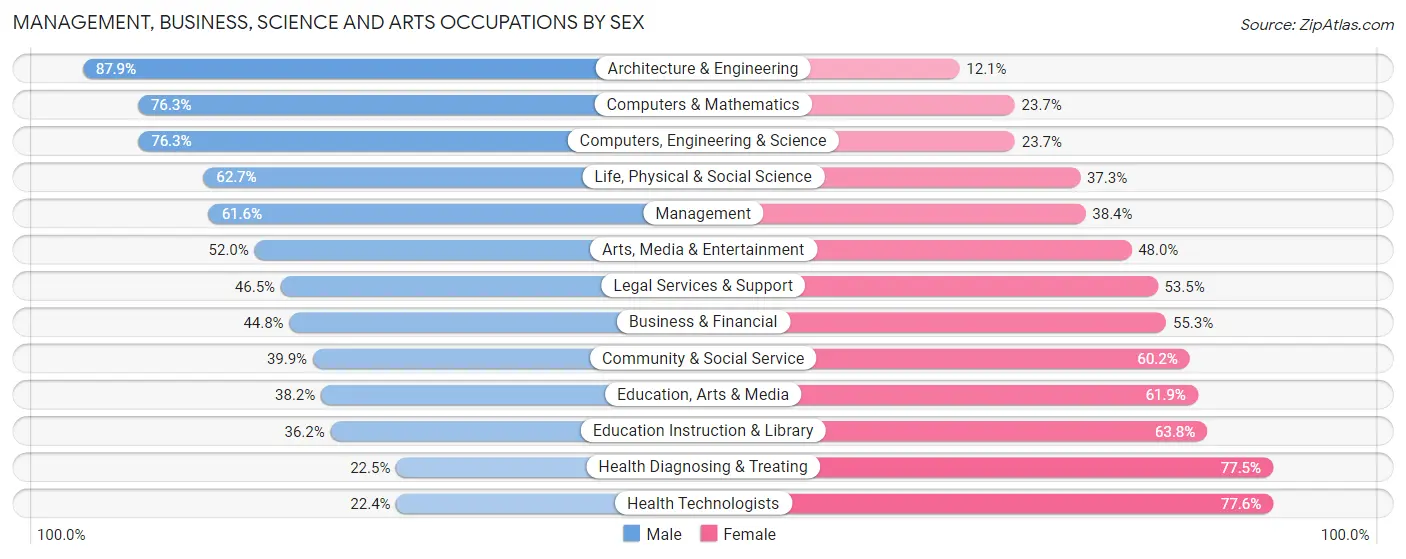
Management, Business, Science and Arts Occupations by Sex
Within the Management, Business, Science and Arts occupations in Lincoln, the most male-oriented occupations are Architecture & Engineering (87.9%), Computers & Mathematics (76.3%), and Computers, Engineering & Science (76.3%), while the most female-oriented occupations are Health Technologists (77.6%), Health Diagnosing & Treating (77.5%), and Education Instruction & Library (63.8%).
| Occupation | Male | Female |
| Management | 9,758 (61.6%) | 6,087 (38.4%) |
| Business & Financial | 4,611 (44.8%) | 5,694 (55.2%) |
| Computers, Engineering & Science | 8,478 (76.3%) | 2,637 (23.7%) |
| Computers & Mathematics | 4,501 (76.3%) | 1,395 (23.7%) |
| Architecture & Engineering | 2,461 (87.9%) | 340 (12.1%) |
| Life, Physical & Social Science | 1,516 (62.7%) | 902 (37.3%) |
| Community & Social Service | 8,218 (39.9%) | 12,404 (60.2%) |
| Education, Arts & Media | 1,189 (38.2%) | 1,928 (61.9%) |
| Legal Services & Support | 517 (46.5%) | 594 (53.5%) |
| Education Instruction & Library | 4,605 (36.2%) | 8,123 (63.8%) |
| Arts, Media & Entertainment | 1,907 (52.0%) | 1,759 (48.0%) |
| Health Diagnosing & Treating | 2,128 (22.5%) | 7,341 (77.5%) |
| Health Technologists | 1,570 (22.4%) | 5,426 (77.6%) |
| Total (Category) | 33,193 (49.3%) | 34,163 (50.7%) |
| Total (Overall) | 84,210 (52.6%) | 75,783 (47.4%) |
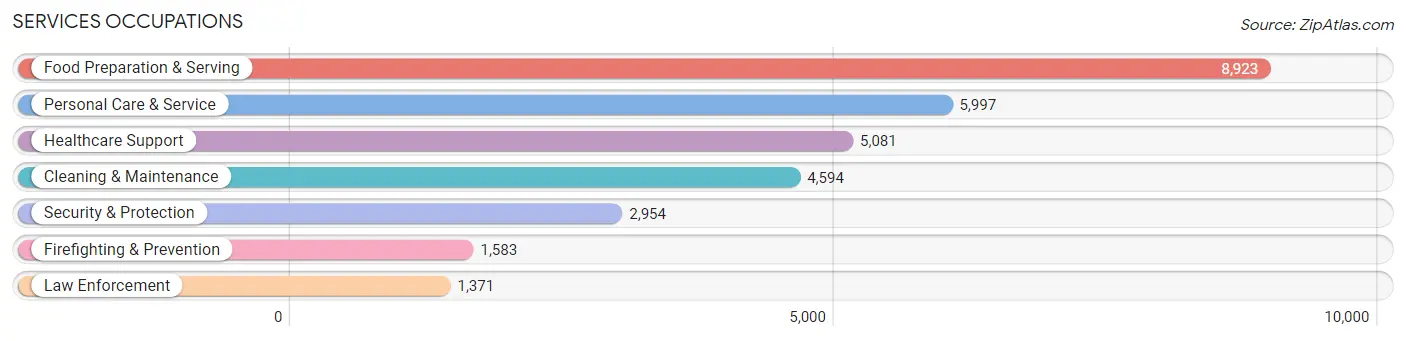
Services Occupations
The most common Services occupations in Lincoln are Food Preparation & Serving (8,923 | 5.6%), Personal Care & Service (5,997 | 3.7%), Healthcare Support (5,081 | 3.2%), Cleaning & Maintenance (4,594 | 2.9%), and Security & Protection (2,954 | 1.8%).
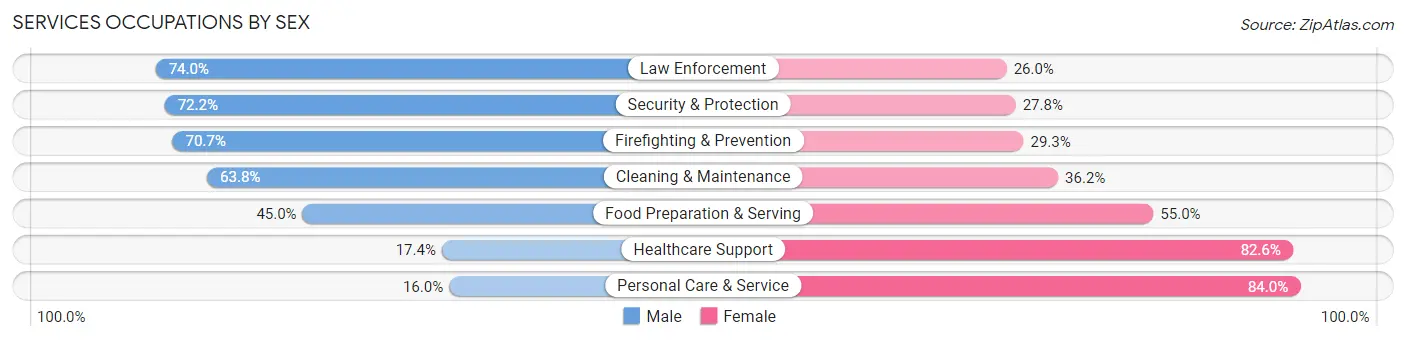
Services Occupations by Sex
Within the Services occupations in Lincoln, the most male-oriented occupations are Law Enforcement (74.0%), Security & Protection (72.2%), and Firefighting & Prevention (70.7%), while the most female-oriented occupations are Personal Care & Service (84.0%), Healthcare Support (82.6%), and Food Preparation & Serving (55.0%).
| Occupation | Male | Female |
| Healthcare Support | 884 (17.4%) | 4,197 (82.6%) |
| Security & Protection | 2,134 (72.2%) | 820 (27.8%) |
| Firefighting & Prevention | 1,119 (70.7%) | 464 (29.3%) |
| Law Enforcement | 1,015 (74.0%) | 356 (26.0%) |
| Food Preparation & Serving | 4,014 (45.0%) | 4,909 (55.0%) |
| Cleaning & Maintenance | 2,933 (63.8%) | 1,661 (36.2%) |
| Personal Care & Service | 957 (16.0%) | 5,040 (84.0%) |
| Total (Category) | 10,922 (39.7%) | 16,627 (60.4%) |
| Total (Overall) | 84,210 (52.6%) | 75,783 (47.4%) |
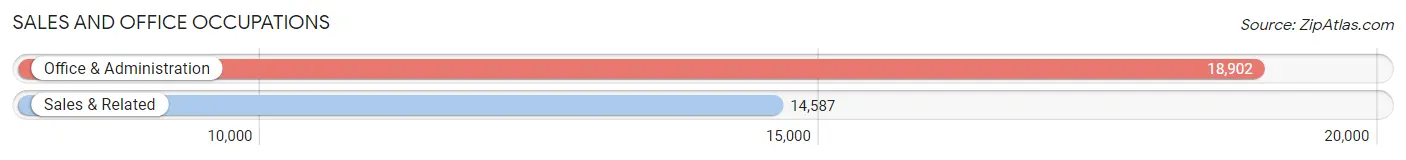
Sales and Office Occupations
The most common Sales and Office occupations in Lincoln are Office & Administration (18,902 | 11.8%), and Sales & Related (14,587 | 9.1%).
Sales and Office Occupations by Sex
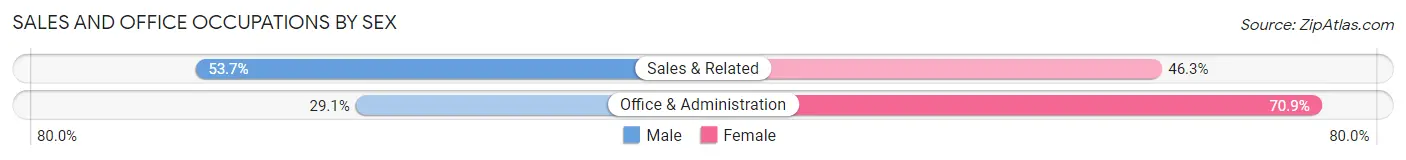
| Occupation | Male | Female |
| Sales & Related | 7,838 (53.7%) | 6,749 (46.3%) |
| Office & Administration | 5,498 (29.1%) | 13,404 (70.9%) |
| Total (Category) | 13,336 (39.8%) | 20,153 (60.2%) |
| Total (Overall) | 84,210 (52.6%) | 75,783 (47.4%) |
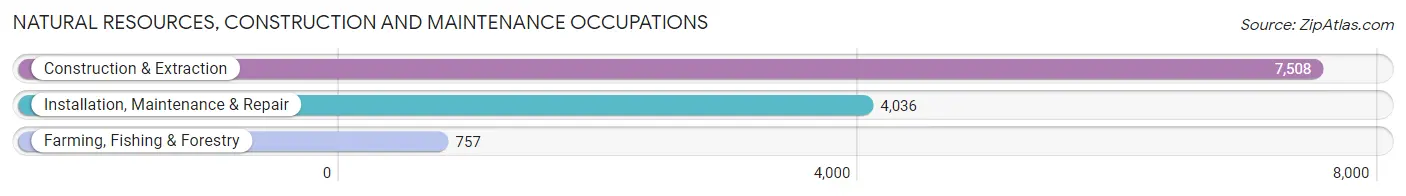
Natural Resources, Construction and Maintenance Occupations
The most common Natural Resources, Construction and Maintenance occupations in Lincoln are Construction & Extraction (7,508 | 4.7%), Installation, Maintenance & Repair (4,036 | 2.5%), and Farming, Fishing & Forestry (757 | 0.5%).
Natural Resources, Construction and Maintenance Occupations by Sex
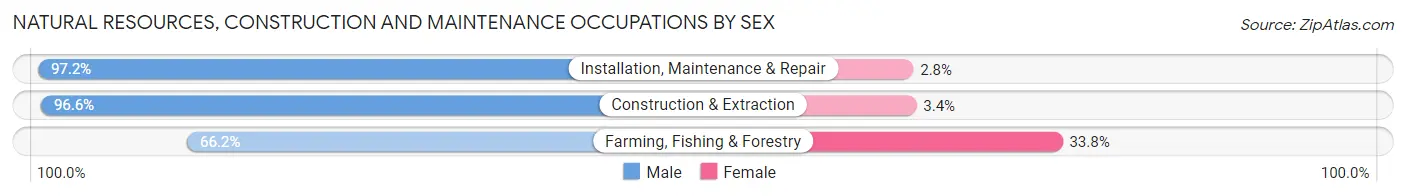
| Occupation | Male | Female |
| Farming, Fishing & Forestry | 501 (66.2%) | 256 (33.8%) |
| Construction & Extraction | 7,252 (96.6%) | 256 (3.4%) |
| Installation, Maintenance & Repair | 3,924 (97.2%) | 112 (2.8%) |
| Total (Category) | 11,677 (94.9%) | 624 (5.1%) |
| Total (Overall) | 84,210 (52.6%) | 75,783 (47.4%) |
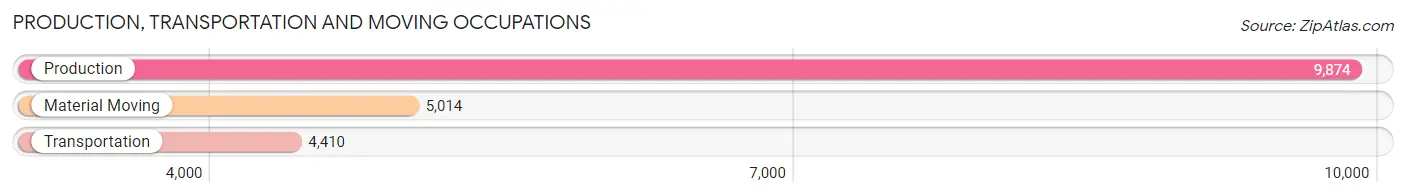
Production, Transportation and Moving Occupations
The most common Production, Transportation and Moving occupations in Lincoln are Production (9,874 | 6.2%), Material Moving (5,014 | 3.1%), and Transportation (4,410 | 2.8%).
Production, Transportation and Moving Occupations by Sex
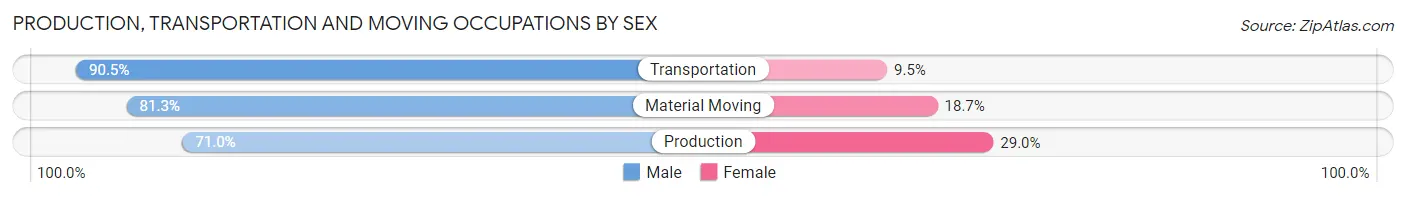
| Occupation | Male | Female |
| Production | 7,014 (71.0%) | 2,860 (29.0%) |
| Transportation | 3,993 (90.5%) | 417 (9.5%) |
| Material Moving | 4,075 (81.3%) | 939 (18.7%) |
| Total (Category) | 15,082 (78.1%) | 4,216 (21.8%) |
| Total (Overall) | 84,210 (52.6%) | 75,783 (47.4%) |
Employment Industries by Sex in Lincoln
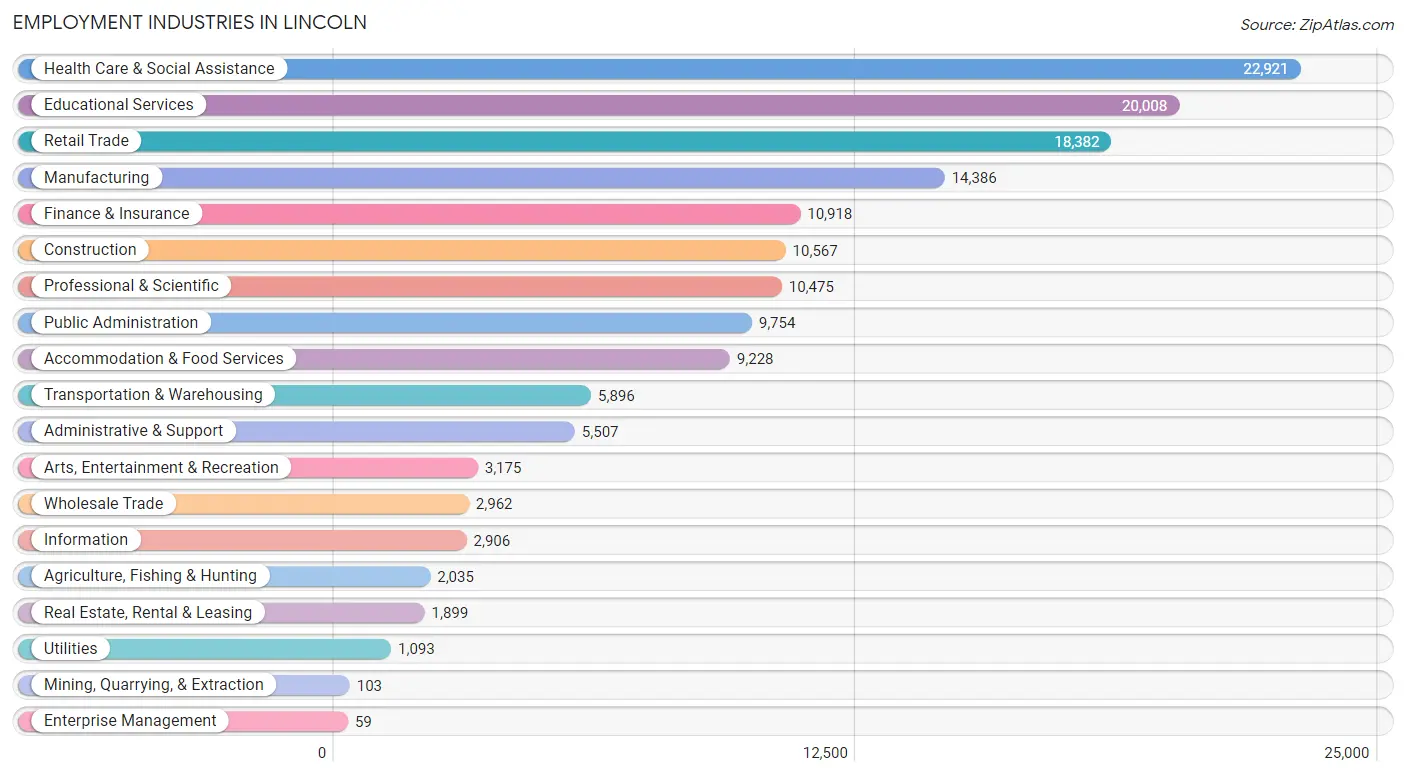
Employment Industries in Lincoln
The major employment industries in Lincoln include Health Care & Social Assistance (22,921 | 14.3%), Educational Services (20,008 | 12.5%), Retail Trade (18,382 | 11.5%), Manufacturing (14,386 | 9.0%), and Finance & Insurance (10,918 | 6.8%).
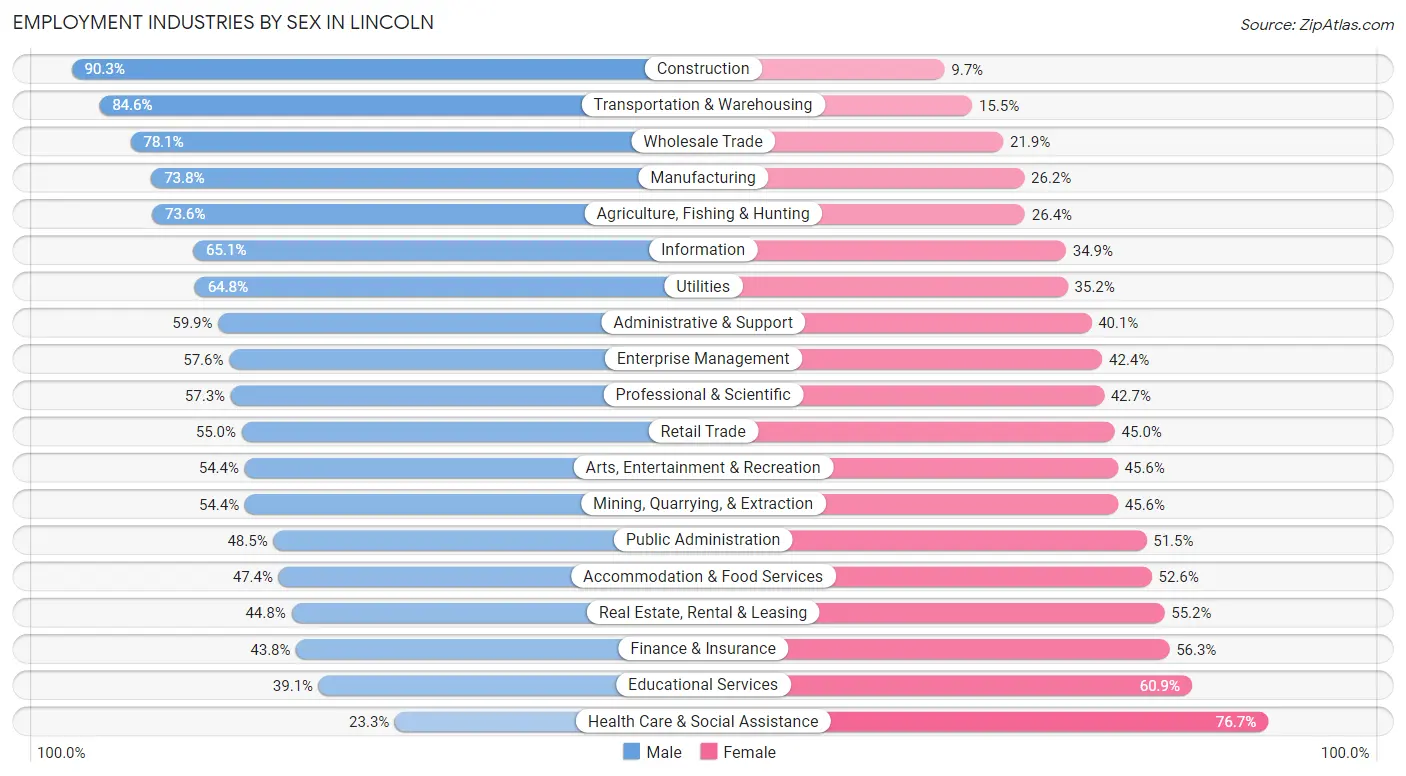
Employment Industries by Sex in Lincoln
The Lincoln industries that see more men than women are Construction (90.3%), Transportation & Warehousing (84.6%), and Wholesale Trade (78.1%), whereas the industries that tend to have a higher number of women are Health Care & Social Assistance (76.7%), Educational Services (60.9%), and Finance & Insurance (56.2%).
| Industry | Male | Female |
| Agriculture, Fishing & Hunting | 1,498 (73.6%) | 537 (26.4%) |
| Mining, Quarrying, & Extraction | 56 (54.4%) | 47 (45.6%) |
| Construction | 9,541 (90.3%) | 1,026 (9.7%) |
| Manufacturing | 10,614 (73.8%) | 3,772 (26.2%) |
| Wholesale Trade | 2,314 (78.1%) | 648 (21.9%) |
| Retail Trade | 10,116 (55.0%) | 8,266 (45.0%) |
| Transportation & Warehousing | 4,985 (84.6%) | 911 (15.4%) |
| Utilities | 708 (64.8%) | 385 (35.2%) |
| Information | 1,893 (65.1%) | 1,013 (34.9%) |
| Finance & Insurance | 4,777 (43.8%) | 6,141 (56.2%) |
| Real Estate, Rental & Leasing | 850 (44.8%) | 1,049 (55.2%) |
| Professional & Scientific | 6,002 (57.3%) | 4,473 (42.7%) |
| Enterprise Management | 34 (57.6%) | 25 (42.4%) |
| Administrative & Support | 3,298 (59.9%) | 2,209 (40.1%) |
| Educational Services | 7,820 (39.1%) | 12,188 (60.9%) |
| Health Care & Social Assistance | 5,340 (23.3%) | 17,581 (76.7%) |
| Arts, Entertainment & Recreation | 1,728 (54.4%) | 1,447 (45.6%) |
| Accommodation & Food Services | 4,373 (47.4%) | 4,855 (52.6%) |
| Public Administration | 4,729 (48.5%) | 5,025 (51.5%) |
| Total | 84,210 (52.6%) | 75,783 (47.4%) |
Education in Lincoln
School Enrollment in Lincoln
The most common levels of schooling among the 87,093 students in Lincoln are college / undergraduate (29,558 | 33.9%), high school (14,341 | 16.5%), and elementary school (14,218 | 16.3%).
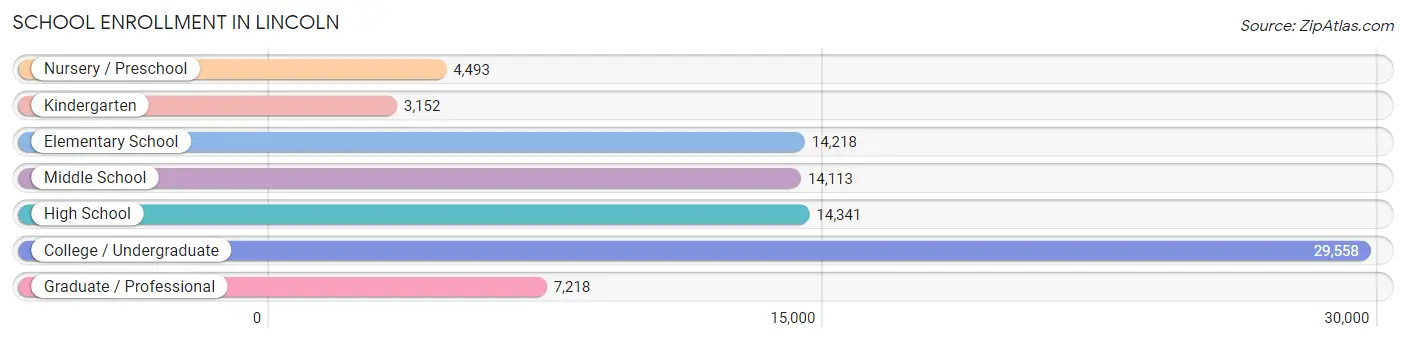
| School Level | # Students | % Students |
| Nursery / Preschool | 4,493 | 5.2% |
| Kindergarten | 3,152 | 3.6% |
| Elementary School | 14,218 | 16.3% |
| Middle School | 14,113 | 16.2% |
| High School | 14,341 | 16.5% |
| College / Undergraduate | 29,558 | 33.9% |
| Graduate / Professional | 7,218 | 8.3% |
| Total | 87,093 | 100.0% |
School Enrollment by Age by Funding Source in Lincoln
Out of a total of 87,093 students who are enrolled in schools in Lincoln, 14,109 (16.2%) attend a private institution, while the remaining 72,984 (83.8%) are enrolled in public schools. The age group of 3 to 4 year olds has the highest likelihood of being enrolled in private schools, with 1,577 (47.9% in the age bracket) enrolled. Conversely, the age group of 18 to 19 year olds has the lowest likelihood of being enrolled in a private school, with 9,217 (90.9% in the age bracket) attending a public institution.
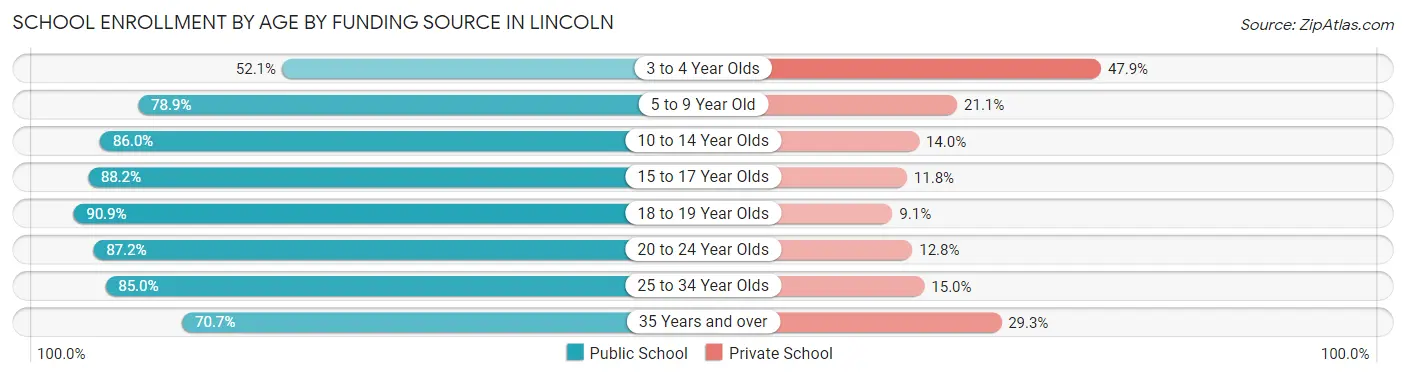
| Age Bracket | Public School | Private School |
| 3 to 4 Year Olds | 1,714 (52.1%) | 1,577 (47.9%) |
| 5 to 9 Year Old | 13,012 (78.9%) | 3,486 (21.1%) |
| 10 to 14 Year Olds | 15,356 (86.0%) | 2,507 (14.0%) |
| 15 to 17 Year Olds | 9,367 (88.2%) | 1,251 (11.8%) |
| 18 to 19 Year Olds | 9,217 (90.9%) | 920 (9.1%) |
| 20 to 24 Year Olds | 16,809 (87.2%) | 2,465 (12.8%) |
| 25 to 34 Year Olds | 5,211 (85.0%) | 922 (15.0%) |
| 35 Years and over | 2,317 (70.7%) | 962 (29.3%) |
| Total | 72,984 (83.8%) | 14,109 (16.2%) |
Educational Attainment by Field of Study in Lincoln
Business (15,590 | 19.3%), education (10,940 | 13.5%), science & technology (7,712 | 9.5%), bio, nature & agricultural (6,863 | 8.5%), and arts & humanities (6,287 | 7.8%) are the most common fields of study among 80,808 individuals in Lincoln who have obtained a bachelor's degree or higher.
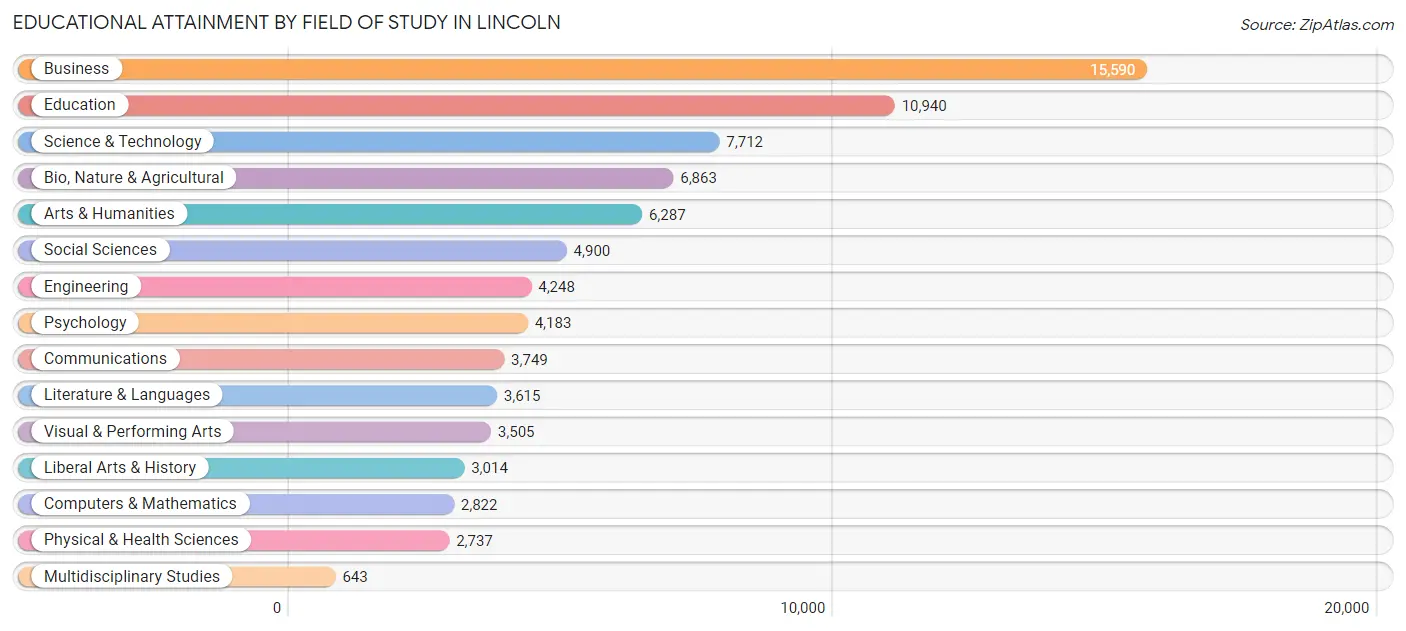
| Field of Study | # Graduates | % Graduates |
| Computers & Mathematics | 2,822 | 3.5% |
| Bio, Nature & Agricultural | 6,863 | 8.5% |
| Physical & Health Sciences | 2,737 | 3.4% |
| Psychology | 4,183 | 5.2% |
| Social Sciences | 4,900 | 6.1% |
| Engineering | 4,248 | 5.3% |
| Multidisciplinary Studies | 643 | 0.8% |
| Science & Technology | 7,712 | 9.5% |
| Business | 15,590 | 19.3% |
| Education | 10,940 | 13.5% |
| Literature & Languages | 3,615 | 4.5% |
| Liberal Arts & History | 3,014 | 3.7% |
| Visual & Performing Arts | 3,505 | 4.3% |
| Communications | 3,749 | 4.6% |
| Arts & Humanities | 6,287 | 7.8% |
| Total | 80,808 | 100.0% |
Transportation & Commute in Lincoln
Vehicle Availability by Sex in Lincoln
The most prevalent vehicle ownership categories in Lincoln are males with 2 vehicles (36,425, accounting for 44.5%) and females with 2 vehicles (31,490, making up 50.2%).
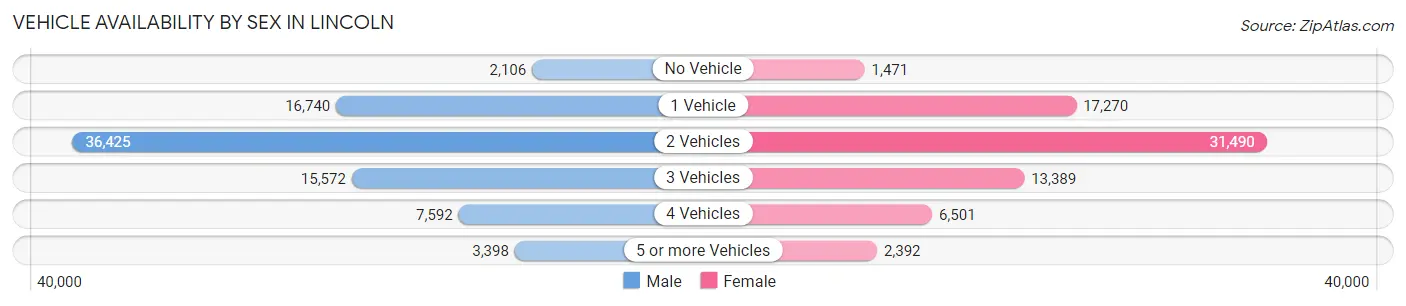
| Vehicles Available | Male | Female |
| No Vehicle | 2,106 (2.6%) | 1,471 (2.0%) |
| 1 Vehicle | 16,740 (20.5%) | 17,270 (23.8%) |
| 2 Vehicles | 36,425 (44.5%) | 31,490 (43.4%) |
| 3 Vehicles | 15,572 (19.0%) | 13,389 (18.5%) |
| 4 Vehicles | 7,592 (9.3%) | 6,501 (9.0%) |
| 5 or more Vehicles | 3,398 (4.2%) | 2,392 (3.3%) |
| Total | 81,833 (100.0%) | 72,513 (100.0%) |
Commute Time in Lincoln
The most frequently occuring commute durations in Lincoln are 15 to 19 minutes (34,811 commuters, 24.2%), 10 to 14 minutes (30,015 commuters, 20.9%), and 20 to 24 minutes (26,097 commuters, 18.2%).
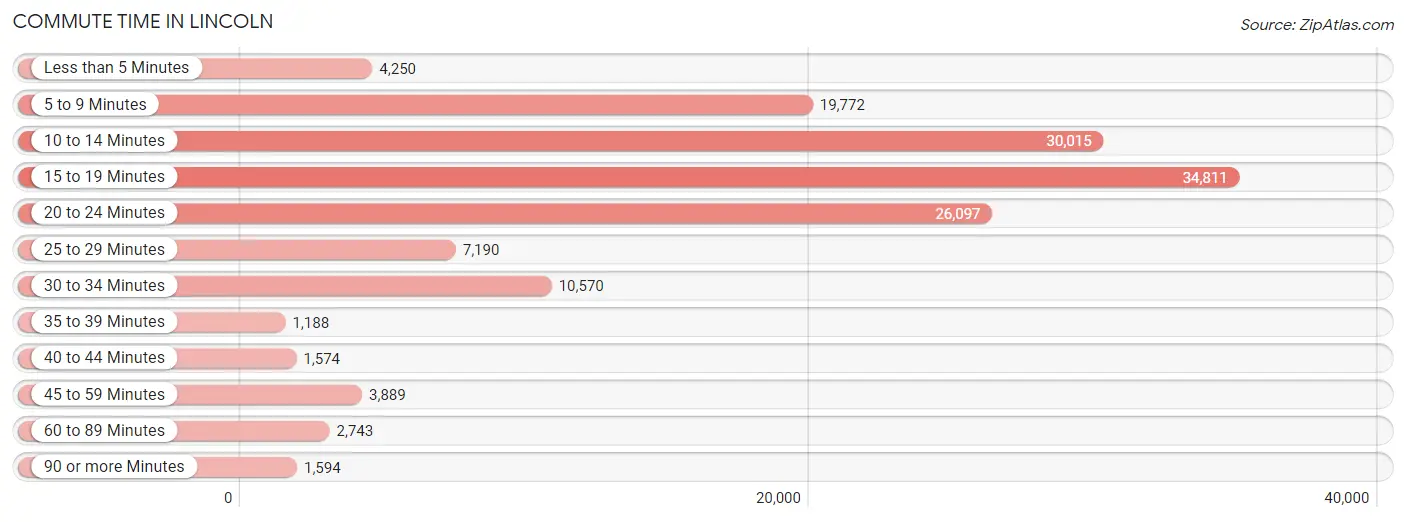
| Commute Time | # Commuters | % Commuters |
| Less than 5 Minutes | 4,250 | 3.0% |
| 5 to 9 Minutes | 19,772 | 13.8% |
| 10 to 14 Minutes | 30,015 | 20.9% |
| 15 to 19 Minutes | 34,811 | 24.2% |
| 20 to 24 Minutes | 26,097 | 18.2% |
| 25 to 29 Minutes | 7,190 | 5.0% |
| 30 to 34 Minutes | 10,570 | 7.4% |
| 35 to 39 Minutes | 1,188 | 0.8% |
| 40 to 44 Minutes | 1,574 | 1.1% |
| 45 to 59 Minutes | 3,889 | 2.7% |
| 60 to 89 Minutes | 2,743 | 1.9% |
| 90 or more Minutes | 1,594 | 1.1% |
Commute Time by Sex in Lincoln
The most common commute times in Lincoln are 15 to 19 minutes (18,059 commuters, 23.5%) for males and 15 to 19 minutes (16,752 commuters, 25.1%) for females.
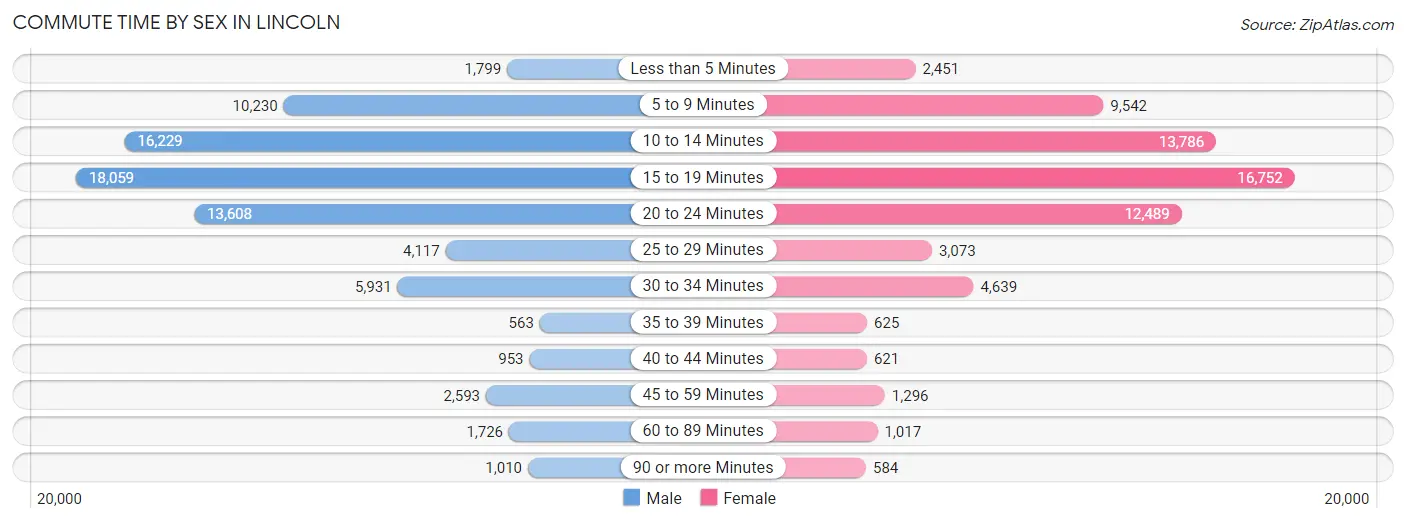
| Commute Time | Male | Female |
| Less than 5 Minutes | 1,799 (2.3%) | 2,451 (3.7%) |
| 5 to 9 Minutes | 10,230 (13.3%) | 9,542 (14.3%) |
| 10 to 14 Minutes | 16,229 (21.1%) | 13,786 (20.6%) |
| 15 to 19 Minutes | 18,059 (23.5%) | 16,752 (25.1%) |
| 20 to 24 Minutes | 13,608 (17.7%) | 12,489 (18.7%) |
| 25 to 29 Minutes | 4,117 (5.4%) | 3,073 (4.6%) |
| 30 to 34 Minutes | 5,931 (7.7%) | 4,639 (6.9%) |
| 35 to 39 Minutes | 563 (0.7%) | 625 (0.9%) |
| 40 to 44 Minutes | 953 (1.2%) | 621 (0.9%) |
| 45 to 59 Minutes | 2,593 (3.4%) | 1,296 (1.9%) |
| 60 to 89 Minutes | 1,726 (2.2%) | 1,017 (1.5%) |
| 90 or more Minutes | 1,010 (1.3%) | 584 (0.9%) |
Time of Departure to Work by Sex in Lincoln
The most frequent times of departure to work in Lincoln are 7:30 AM to 7:59 AM (13,560, 17.6%) for males and 7:30 AM to 7:59 AM (12,636, 18.9%) for females.
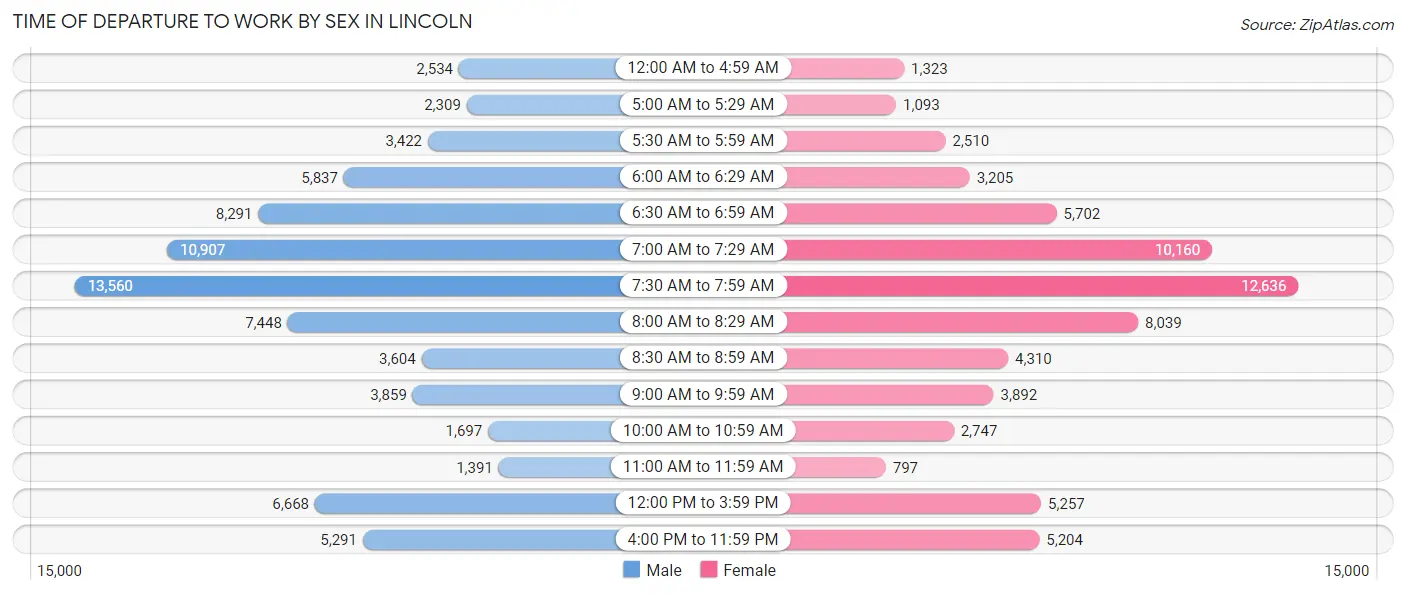
| Time of Departure | Male | Female |
| 12:00 AM to 4:59 AM | 2,534 (3.3%) | 1,323 (2.0%) |
| 5:00 AM to 5:29 AM | 2,309 (3.0%) | 1,093 (1.6%) |
| 5:30 AM to 5:59 AM | 3,422 (4.4%) | 2,510 (3.7%) |
| 6:00 AM to 6:29 AM | 5,837 (7.6%) | 3,205 (4.8%) |
| 6:30 AM to 6:59 AM | 8,291 (10.8%) | 5,702 (8.5%) |
| 7:00 AM to 7:29 AM | 10,907 (14.2%) | 10,160 (15.2%) |
| 7:30 AM to 7:59 AM | 13,560 (17.6%) | 12,636 (18.9%) |
| 8:00 AM to 8:29 AM | 7,448 (9.7%) | 8,039 (12.0%) |
| 8:30 AM to 8:59 AM | 3,604 (4.7%) | 4,310 (6.4%) |
| 9:00 AM to 9:59 AM | 3,859 (5.0%) | 3,892 (5.8%) |
| 10:00 AM to 10:59 AM | 1,697 (2.2%) | 2,747 (4.1%) |
| 11:00 AM to 11:59 AM | 1,391 (1.8%) | 797 (1.2%) |
| 12:00 PM to 3:59 PM | 6,668 (8.7%) | 5,257 (7.9%) |
| 4:00 PM to 11:59 PM | 5,291 (6.9%) | 5,204 (7.8%) |
| Total | 76,818 (100.0%) | 66,875 (100.0%) |
Housing Occupancy in Lincoln
Occupancy by Ownership in Lincoln
Of the total 118,332 dwellings in Lincoln, owner-occupied units account for 66,654 (56.3%), while renter-occupied units make up 51,678 (43.7%).
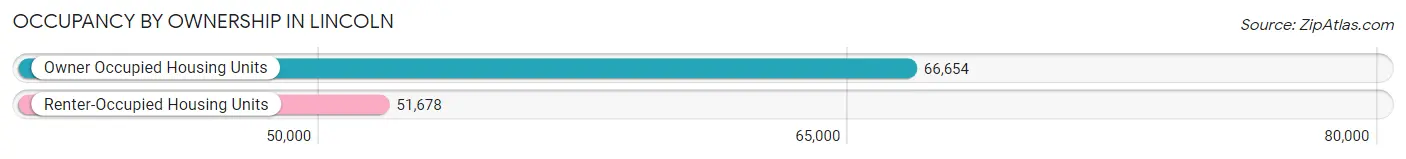
| Occupancy | # Housing Units | % Housing Units |
| Owner Occupied Housing Units | 66,654 | 56.3% |
| Renter-Occupied Housing Units | 51,678 | 43.7% |
| Total Occupied Housing Units | 118,332 | 100.0% |
Occupancy by Household Size in Lincoln
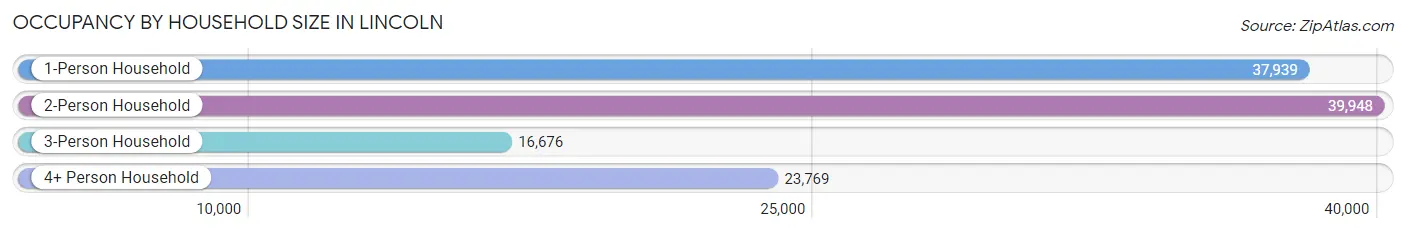
| Household Size | # Housing Units | % Housing Units |
| 1-Person Household | 37,939 | 32.1% |
| 2-Person Household | 39,948 | 33.8% |
| 3-Person Household | 16,676 | 14.1% |
| 4+ Person Household | 23,769 | 20.1% |
| Total Housing Units | 118,332 | 100.0% |
Occupancy by Ownership by Household Size in Lincoln
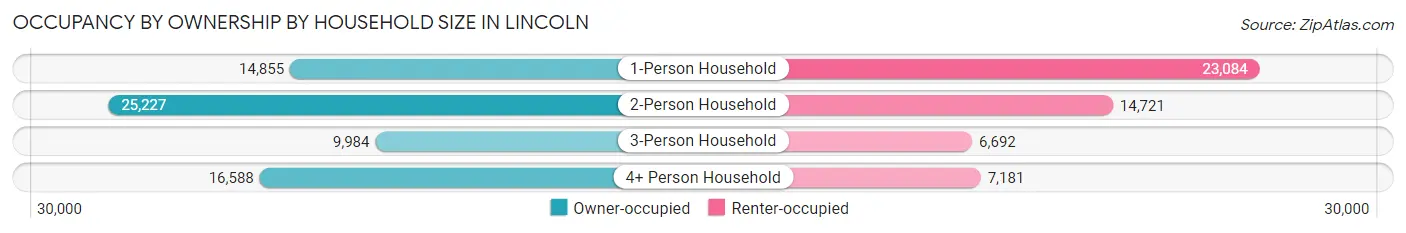
| Household Size | Owner-occupied | Renter-occupied |
| 1-Person Household | 14,855 (39.2%) | 23,084 (60.9%) |
| 2-Person Household | 25,227 (63.1%) | 14,721 (36.8%) |
| 3-Person Household | 9,984 (59.9%) | 6,692 (40.1%) |
| 4+ Person Household | 16,588 (69.8%) | 7,181 (30.2%) |
| Total Housing Units | 66,654 (56.3%) | 51,678 (43.7%) |
Occupancy by Educational Attainment in Lincoln
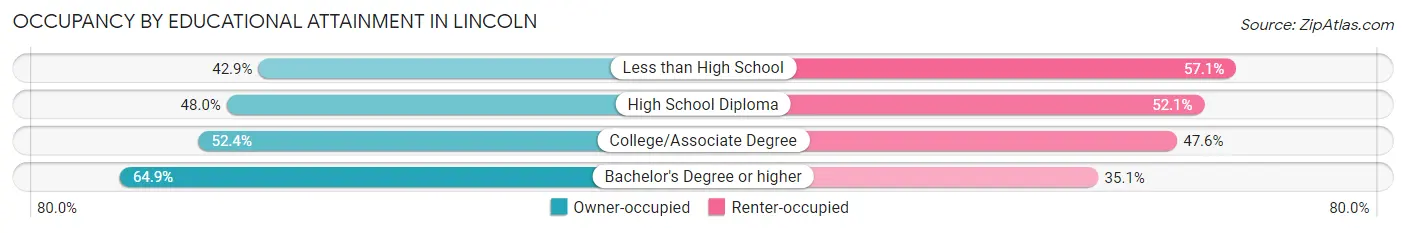
| Household Size | Owner-occupied | Renter-occupied |
| Less than High School | 2,726 (42.9%) | 3,624 (57.1%) |
| High School Diploma | 10,426 (47.9%) | 11,318 (52.0%) |
| College/Associate Degree | 21,159 (52.4%) | 19,224 (47.6%) |
| Bachelor's Degree or higher | 32,343 (64.9%) | 17,512 (35.1%) |
Occupancy by Age of Householder in Lincoln
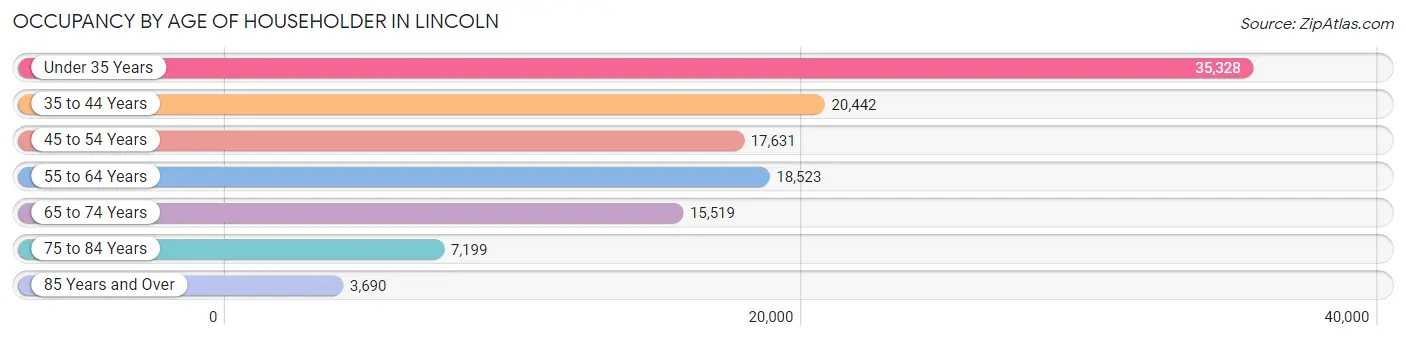
| Age Bracket | # Households | % Households |
| Under 35 Years | 35,328 | 29.8% |
| 35 to 44 Years | 20,442 | 17.3% |
| 45 to 54 Years | 17,631 | 14.9% |
| 55 to 64 Years | 18,523 | 15.7% |
| 65 to 74 Years | 15,519 | 13.1% |
| 75 to 84 Years | 7,199 | 6.1% |
| 85 Years and Over | 3,690 | 3.1% |
| Total | 118,332 | 100.0% |
Housing Finances in Lincoln
Median Income by Occupancy in Lincoln
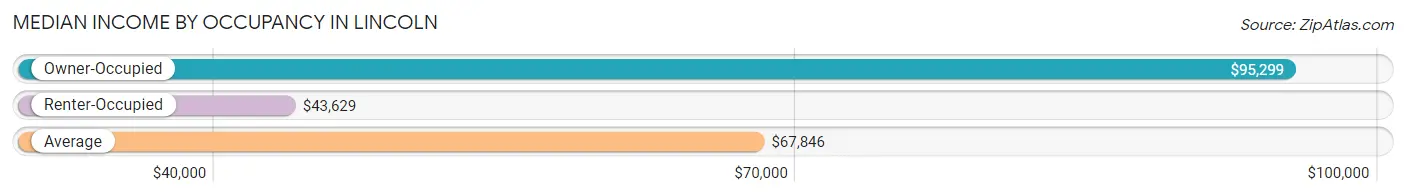
| Occupancy Type | # Households | Median Income |
| Owner-Occupied | 66,654 (56.3%) | $95,299 |
| Renter-Occupied | 51,678 (43.7%) | $43,629 |
| Average | 118,332 (100.0%) | $67,846 |
Occupancy by Householder Income Bracket in Lincoln
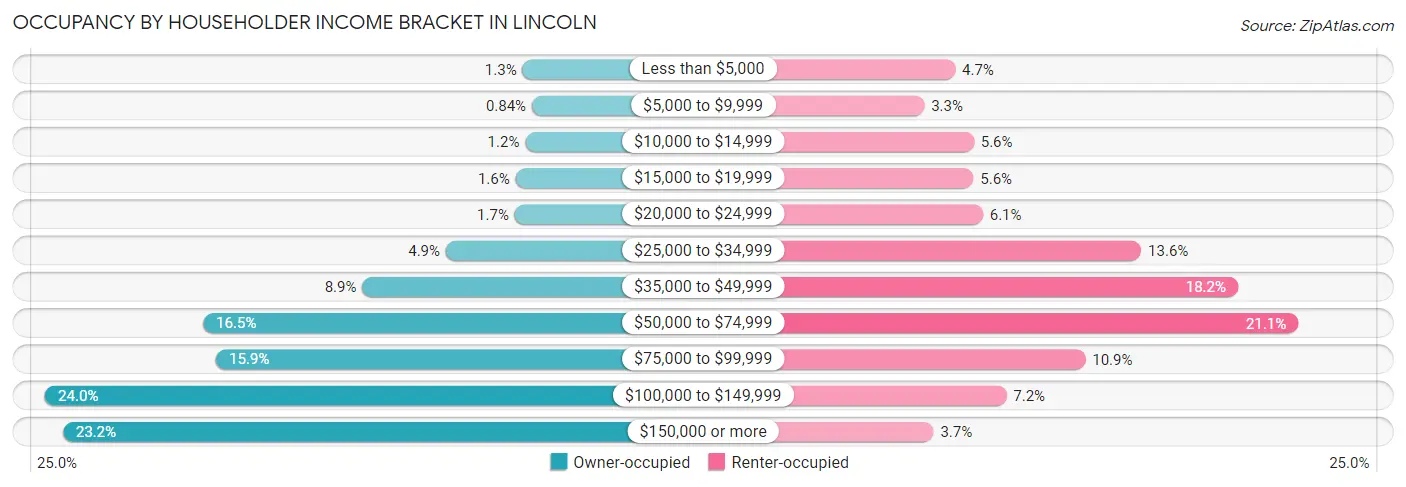
| Income Bracket | Owner-occupied | Renter-occupied |
| Less than $5,000 | 861 (1.3%) | 2,450 (4.7%) |
| $5,000 to $9,999 | 558 (0.8%) | 1,690 (3.3%) |
| $10,000 to $14,999 | 773 (1.2%) | 2,909 (5.6%) |
| $15,000 to $19,999 | 1,078 (1.6%) | 2,898 (5.6%) |
| $20,000 to $24,999 | 1,108 (1.7%) | 3,133 (6.1%) |
| $25,000 to $34,999 | 3,292 (4.9%) | 7,027 (13.6%) |
| $35,000 to $49,999 | 5,945 (8.9%) | 9,404 (18.2%) |
| $50,000 to $74,999 | 10,997 (16.5%) | 10,891 (21.1%) |
| $75,000 to $99,999 | 10,582 (15.9%) | 5,651 (10.9%) |
| $100,000 to $149,999 | 16,007 (24.0%) | 3,709 (7.2%) |
| $150,000 or more | 15,453 (23.2%) | 1,916 (3.7%) |
| Total | 66,654 (100.0%) | 51,678 (100.0%) |
Monthly Housing Cost Tiers in Lincoln
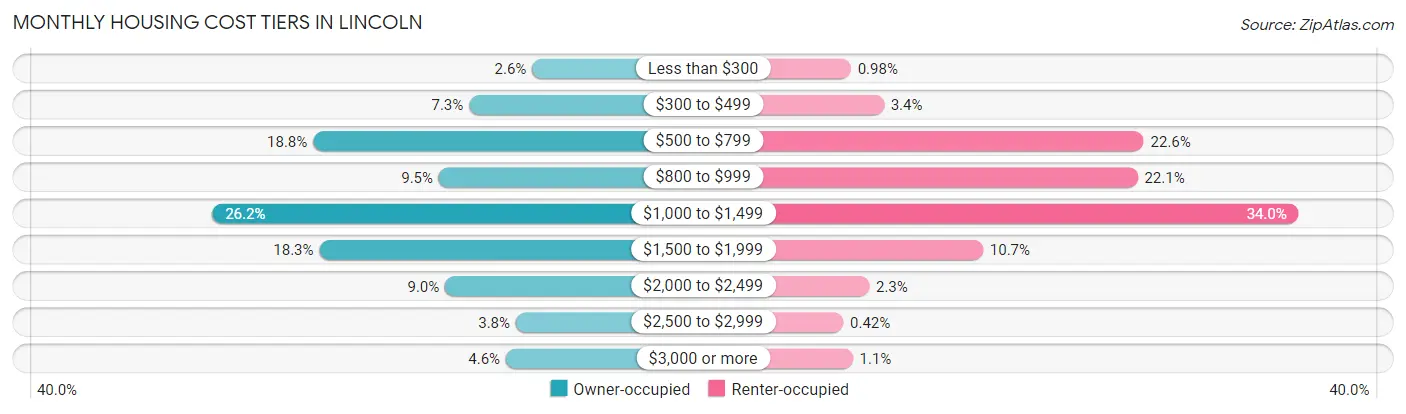
| Monthly Cost | Owner-occupied | Renter-occupied |
| Less than $300 | 1,745 (2.6%) | 506 (1.0%) |
| $300 to $499 | 4,841 (7.3%) | 1,763 (3.4%) |
| $500 to $799 | 12,498 (18.8%) | 11,654 (22.6%) |
| $800 to $999 | 6,324 (9.5%) | 11,420 (22.1%) |
| $1,000 to $1,499 | 17,453 (26.2%) | 17,555 (34.0%) |
| $1,500 to $1,999 | 12,190 (18.3%) | 5,537 (10.7%) |
| $2,000 to $2,499 | 6,020 (9.0%) | 1,206 (2.3%) |
| $2,500 to $2,999 | 2,547 (3.8%) | 216 (0.4%) |
| $3,000 or more | 3,036 (4.5%) | 578 (1.1%) |
| Total | 66,654 (100.0%) | 51,678 (100.0%) |
Physical Housing Characteristics in Lincoln
Housing Structures in Lincoln
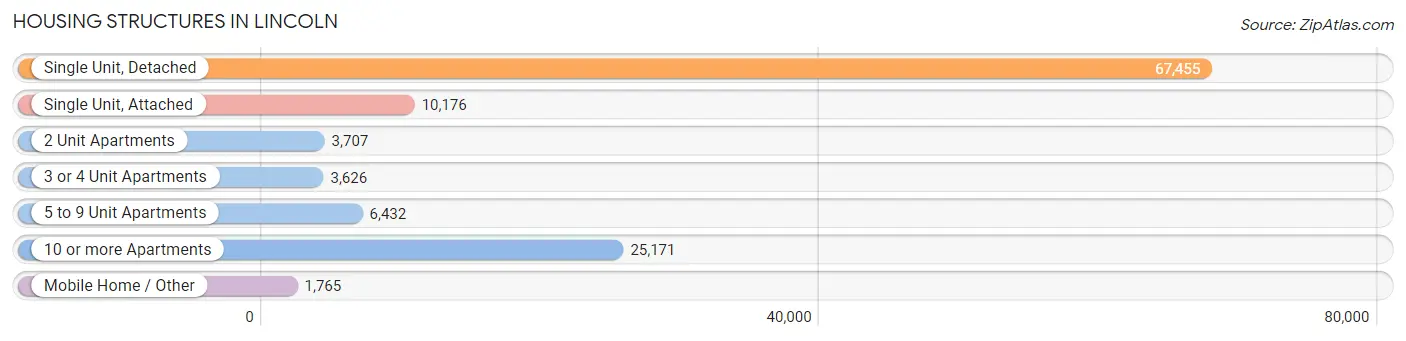
| Structure Type | # Housing Units | % Housing Units |
| Single Unit, Detached | 67,455 | 57.0% |
| Single Unit, Attached | 10,176 | 8.6% |
| 2 Unit Apartments | 3,707 | 3.1% |
| 3 or 4 Unit Apartments | 3,626 | 3.1% |
| 5 to 9 Unit Apartments | 6,432 | 5.4% |
| 10 or more Apartments | 25,171 | 21.3% |
| Mobile Home / Other | 1,765 | 1.5% |
| Total | 118,332 | 100.0% |
Housing Structures by Occupancy in Lincoln
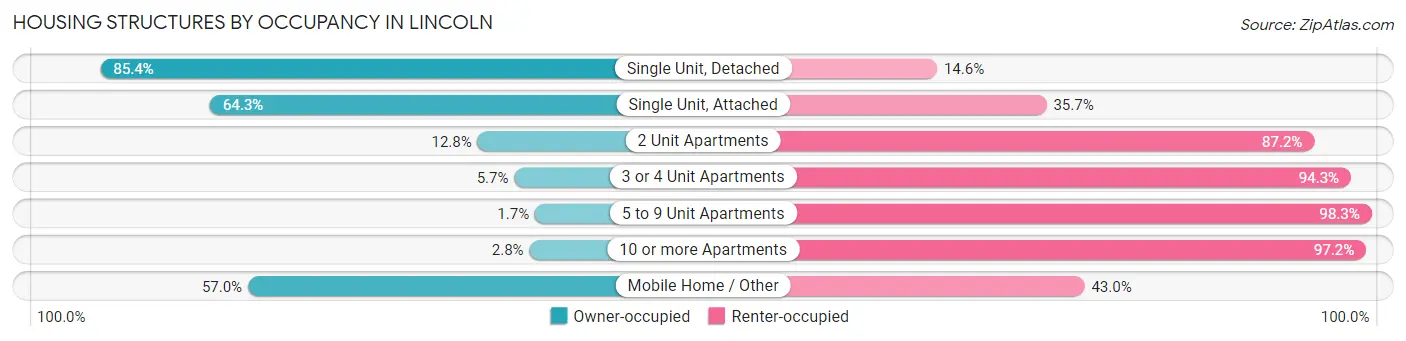
| Structure Type | Owner-occupied | Renter-occupied |
| Single Unit, Detached | 57,606 (85.4%) | 9,849 (14.6%) |
| Single Unit, Attached | 6,545 (64.3%) | 3,631 (35.7%) |
| 2 Unit Apartments | 474 (12.8%) | 3,233 (87.2%) |
| 3 or 4 Unit Apartments | 207 (5.7%) | 3,419 (94.3%) |
| 5 to 9 Unit Apartments | 111 (1.7%) | 6,321 (98.3%) |
| 10 or more Apartments | 705 (2.8%) | 24,466 (97.2%) |
| Mobile Home / Other | 1,006 (57.0%) | 759 (43.0%) |
| Total | 66,654 (56.3%) | 51,678 (43.7%) |
Housing Structures by Number of Rooms in Lincoln
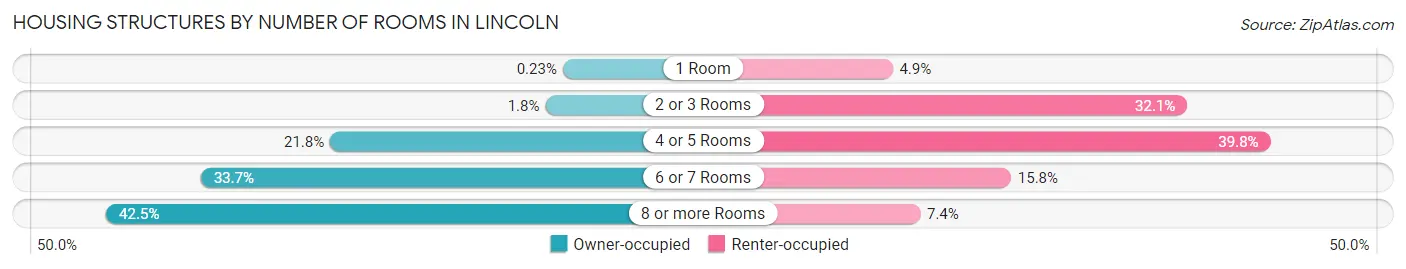
| Number of Rooms | Owner-occupied | Renter-occupied |
| 1 Room | 154 (0.2%) | 2,510 (4.9%) |
| 2 or 3 Rooms | 1,228 (1.8%) | 16,595 (32.1%) |
| 4 or 5 Rooms | 14,497 (21.7%) | 20,572 (39.8%) |
| 6 or 7 Rooms | 22,470 (33.7%) | 8,171 (15.8%) |
| 8 or more Rooms | 28,305 (42.5%) | 3,830 (7.4%) |
| Total | 66,654 (100.0%) | 51,678 (100.0%) |
Housing Structure by Heating Type in Lincoln
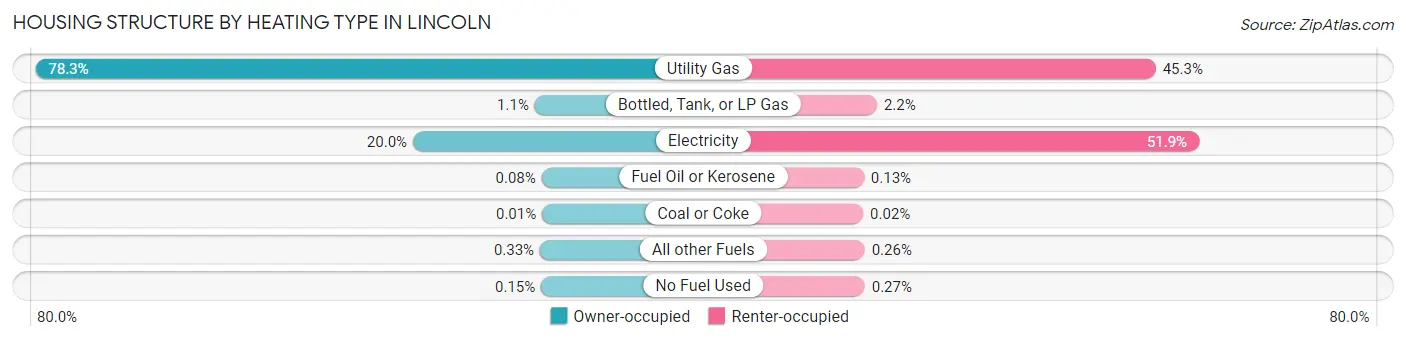
| Heating Type | Owner-occupied | Renter-occupied |
| Utility Gas | 52,208 (78.3%) | 23,386 (45.3%) |
| Bottled, Tank, or LP Gas | 757 (1.1%) | 1,112 (2.1%) |
| Electricity | 13,310 (20.0%) | 26,830 (51.9%) |
| Fuel Oil or Kerosene | 53 (0.1%) | 65 (0.1%) |
| Coal or Coke | 8 (0.0%) | 11 (0.0%) |
| All other Fuels | 217 (0.3%) | 134 (0.3%) |
| No Fuel Used | 101 (0.2%) | 140 (0.3%) |
| Total | 66,654 (100.0%) | 51,678 (100.0%) |
Household Vehicle Usage in Lincoln
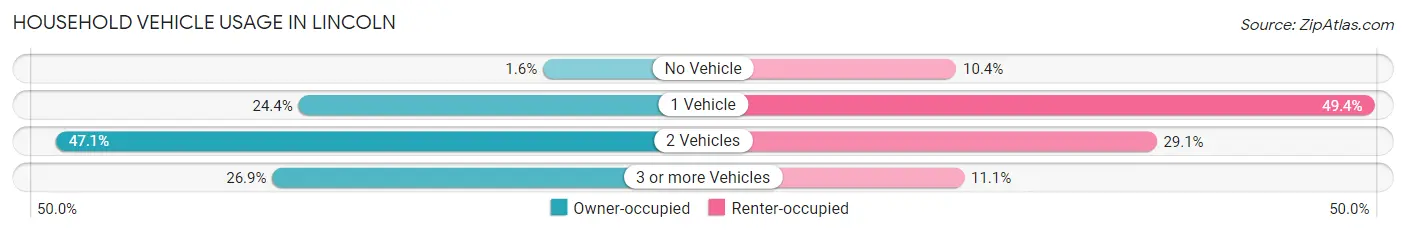
| Vehicles per Household | Owner-occupied | Renter-occupied |
| No Vehicle | 1,072 (1.6%) | 5,366 (10.4%) |
| 1 Vehicle | 16,283 (24.4%) | 25,537 (49.4%) |
| 2 Vehicles | 31,384 (47.1%) | 15,027 (29.1%) |
| 3 or more Vehicles | 17,915 (26.9%) | 5,748 (11.1%) |
| Total | 66,654 (100.0%) | 51,678 (100.0%) |
Real Estate & Mortgages in Lincoln
Real Estate and Mortgage Overview in Lincoln
| Characteristic | Without Mortgage | With Mortgage |
| Housing Units | 23,932 | 42,722 |
| Median Property Value | $226,200 | $232,400 |
| Median Household Income | $76,544 | $11,471 |
| Monthly Housing Costs | $647 | $3,001 |
| Real Estate Taxes | $3,706 | $1,171 |
Property Value by Mortgage Status in Lincoln
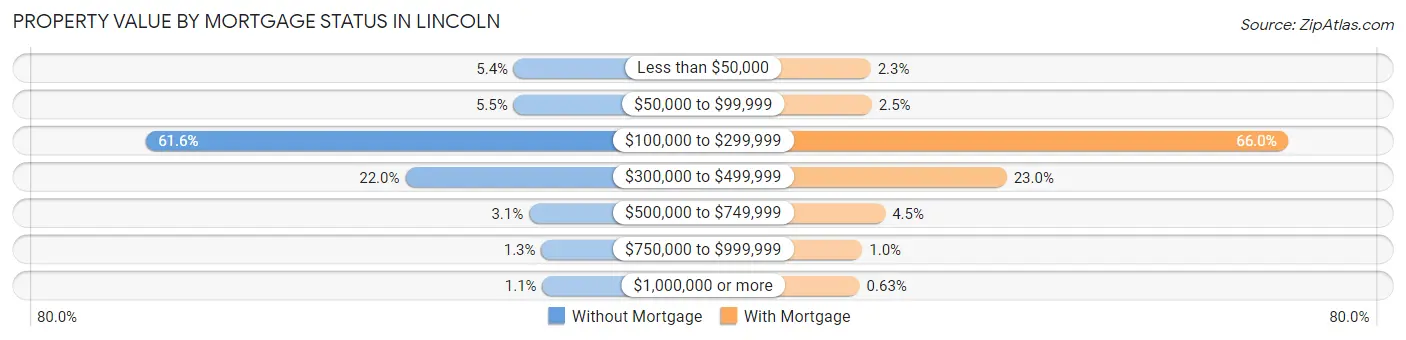
| Property Value | Without Mortgage | With Mortgage |
| Less than $50,000 | 1,301 (5.4%) | 988 (2.3%) |
| $50,000 to $99,999 | 1,313 (5.5%) | 1,060 (2.5%) |
| $100,000 to $299,999 | 14,747 (61.6%) | 28,186 (66.0%) |
| $300,000 to $499,999 | 5,262 (22.0%) | 9,844 (23.0%) |
| $500,000 to $749,999 | 749 (3.1%) | 1,930 (4.5%) |
| $750,000 to $999,999 | 299 (1.3%) | 443 (1.0%) |
| $1,000,000 or more | 261 (1.1%) | 271 (0.6%) |
| Total | 23,932 (100.0%) | 42,722 (100.0%) |
Household Income by Mortgage Status in Lincoln
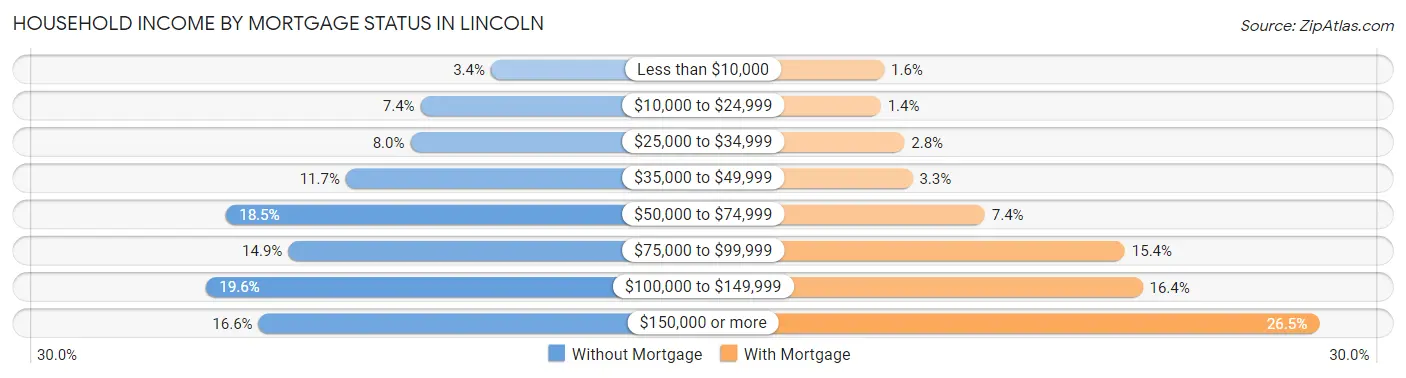
| Household Income | Without Mortgage | With Mortgage |
| Less than $10,000 | 803 (3.4%) | 698 (1.6%) |
| $10,000 to $24,999 | 1,766 (7.4%) | 616 (1.4%) |
| $25,000 to $34,999 | 1,904 (8.0%) | 1,193 (2.8%) |
| $35,000 to $49,999 | 2,787 (11.7%) | 1,388 (3.3%) |
| $50,000 to $74,999 | 4,420 (18.5%) | 3,158 (7.4%) |
| $75,000 to $99,999 | 3,576 (14.9%) | 6,577 (15.4%) |
| $100,000 to $149,999 | 4,694 (19.6%) | 7,006 (16.4%) |
| $150,000 or more | 3,982 (16.6%) | 11,313 (26.5%) |
| Total | 23,932 (100.0%) | 42,722 (100.0%) |
Property Value to Household Income Ratio in Lincoln
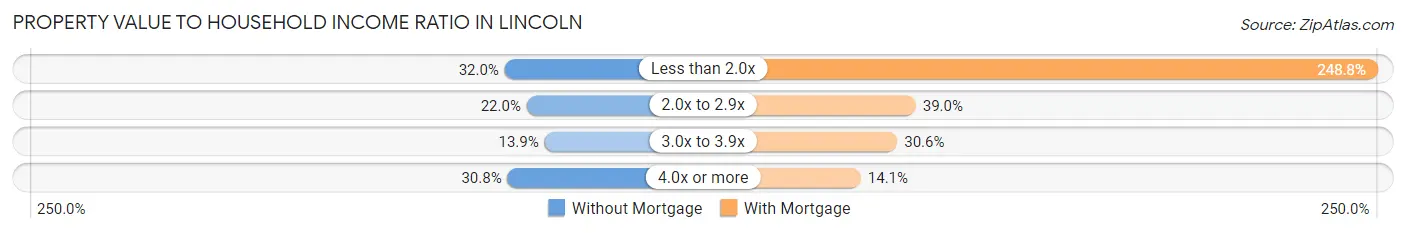
| Value-to-Income Ratio | Without Mortgage | With Mortgage |
| Less than 2.0x | 7,665 (32.0%) | 106,277 (248.8%) |
| 2.0x to 2.9x | 5,269 (22.0%) | 16,658 (39.0%) |
| 3.0x to 3.9x | 3,336 (13.9%) | 13,077 (30.6%) |
| 4.0x or more | 7,361 (30.8%) | 6,002 (14.1%) |
| Total | 23,932 (100.0%) | 42,722 (100.0%) |
Real Estate Taxes by Mortgage Status in Lincoln
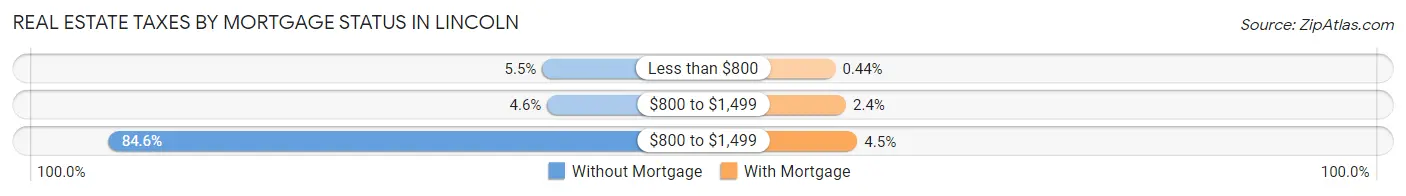
| Property Taxes | Without Mortgage | With Mortgage |
| Less than $800 | 1,310 (5.5%) | 188 (0.4%) |
| $800 to $1,499 | 1,089 (4.5%) | 1,022 (2.4%) |
| $800 to $1,499 | 20,252 (84.6%) | 1,900 (4.4%) |
| Total | 23,932 (100.0%) | 42,722 (100.0%) |
Health & Disability in Lincoln
Health Insurance Coverage by Age in Lincoln
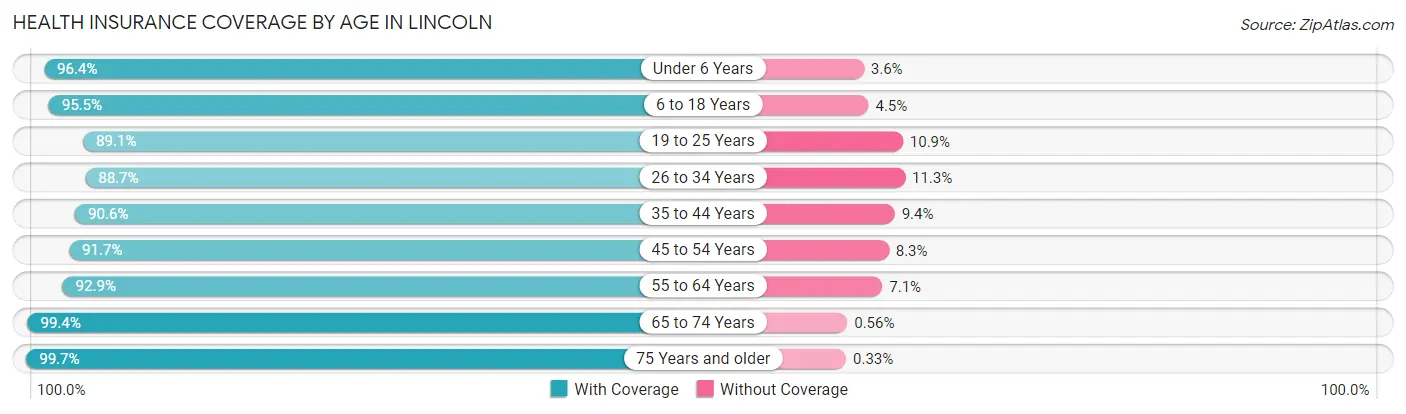
| Age Bracket | With Coverage | Without Coverage |
| Under 6 Years | 20,146 (96.4%) | 761 (3.6%) |
| 6 to 18 Years | 45,933 (95.5%) | 2,174 (4.5%) |
| 19 to 25 Years | 40,928 (89.1%) | 5,016 (10.9%) |
| 26 to 34 Years | 31,638 (88.7%) | 4,038 (11.3%) |
| 35 to 44 Years | 32,445 (90.6%) | 3,370 (9.4%) |
| 45 to 54 Years | 27,208 (91.7%) | 2,461 (8.3%) |
| 55 to 64 Years | 27,880 (92.9%) | 2,132 (7.1%) |
| 65 to 74 Years | 24,186 (99.4%) | 137 (0.6%) |
| 75 Years and older | 15,560 (99.7%) | 51 (0.3%) |
| Total | 265,924 (93.0%) | 20,140 (7.0%) |
Health Insurance Coverage by Citizenship Status in Lincoln
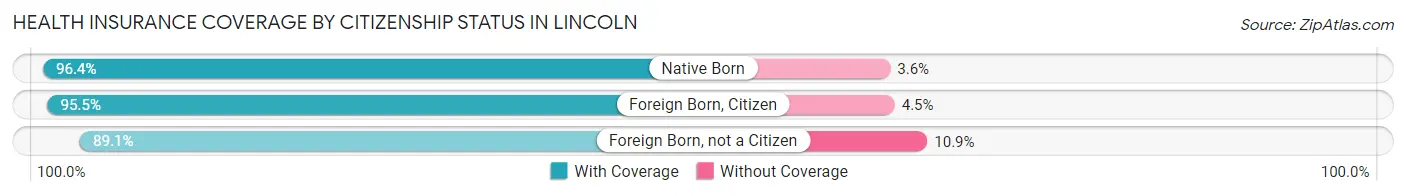
| Citizenship Status | With Coverage | Without Coverage |
| Native Born | 20,146 (96.4%) | 761 (3.6%) |
| Foreign Born, Citizen | 45,933 (95.5%) | 2,174 (4.5%) |
| Foreign Born, not a Citizen | 40,928 (89.1%) | 5,016 (10.9%) |
Health Insurance Coverage by Household Income in Lincoln
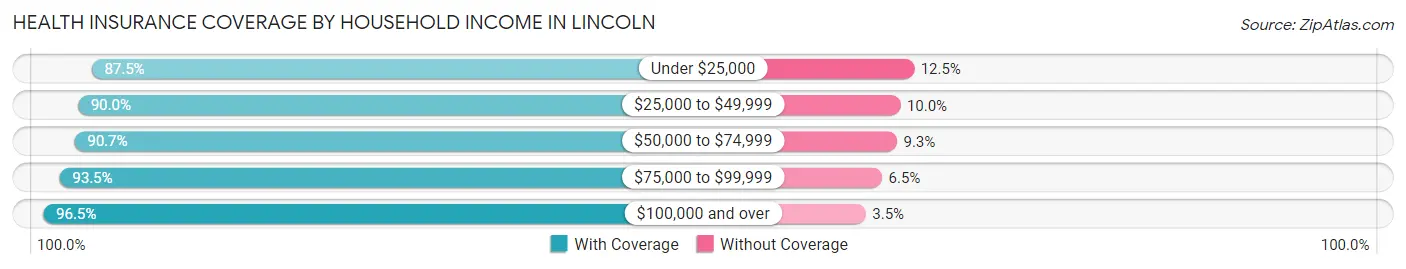
| Household Income | With Coverage | Without Coverage |
| Under $25,000 | 25,323 (87.5%) | 3,629 (12.5%) |
| $25,000 to $49,999 | 43,082 (90.0%) | 4,766 (10.0%) |
| $50,000 to $74,999 | 43,695 (90.7%) | 4,490 (9.3%) |
| $75,000 to $99,999 | 39,161 (93.5%) | 2,730 (6.5%) |
| $100,000 and over | 106,937 (96.5%) | 3,842 (3.5%) |
Public vs Private Health Insurance Coverage by Age in Lincoln
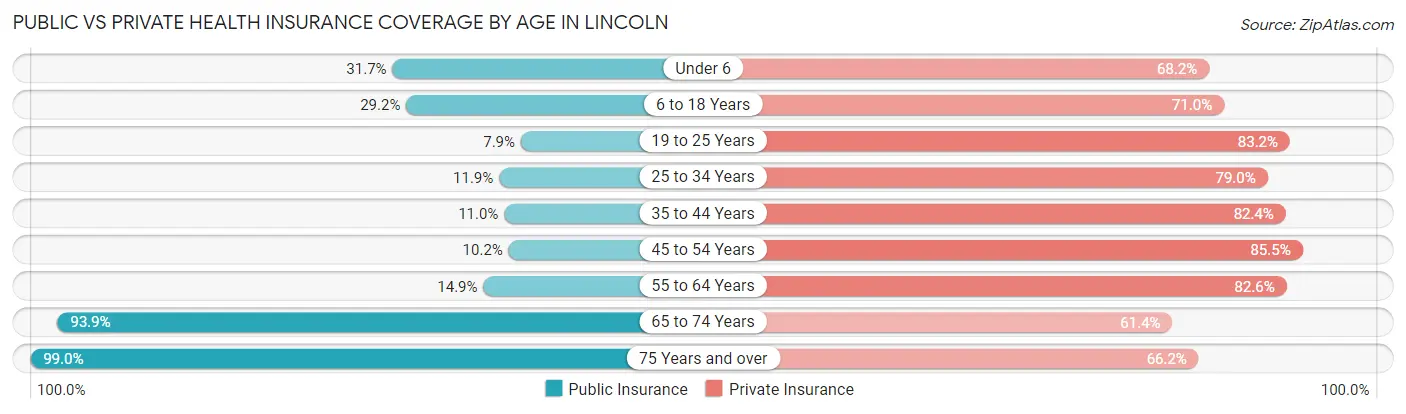
| Age Bracket | Public Insurance | Private Insurance |
| Under 6 | 6,633 (31.7%) | 14,255 (68.2%) |
| 6 to 18 Years | 14,030 (29.2%) | 34,133 (71.0%) |
| 19 to 25 Years | 3,623 (7.9%) | 38,208 (83.2%) |
| 25 to 34 Years | 4,251 (11.9%) | 28,190 (79.0%) |
| 35 to 44 Years | 3,933 (11.0%) | 29,508 (82.4%) |
| 45 to 54 Years | 3,012 (10.2%) | 25,367 (85.5%) |
| 55 to 64 Years | 4,457 (14.8%) | 24,779 (82.6%) |
| 65 to 74 Years | 22,844 (93.9%) | 14,925 (61.4%) |
| 75 Years and over | 15,447 (99.0%) | 10,341 (66.2%) |
| Total | 78,230 (27.4%) | 219,706 (76.8%) |
Disability Status by Sex by Age in Lincoln
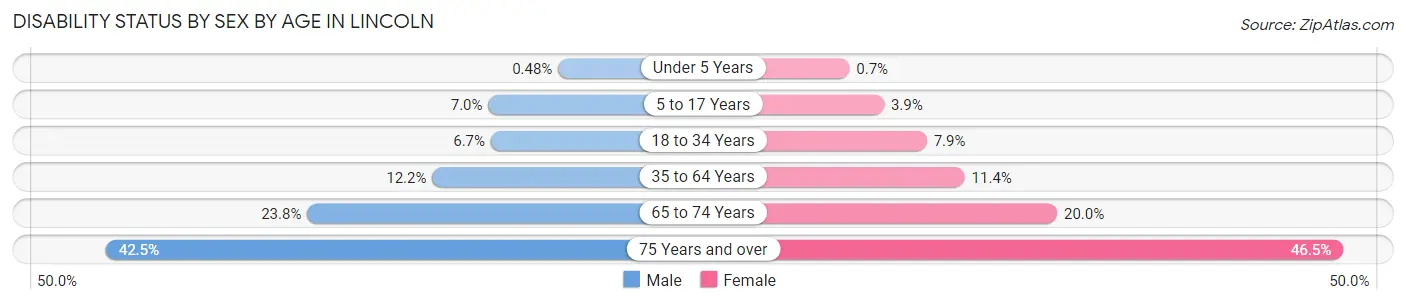
| Age Bracket | Male | Female |
| Under 5 Years | 43 (0.5%) | 58 (0.7%) |
| 5 to 17 Years | 1,661 (7.0%) | 887 (3.9%) |
| 18 to 34 Years | 2,975 (6.7%) | 3,356 (7.9%) |
| 35 to 64 Years | 5,864 (12.2%) | 5,391 (11.4%) |
| 65 to 74 Years | 2,674 (23.8%) | 2,612 (20.0%) |
| 75 Years and over | 2,695 (42.5%) | 4,310 (46.5%) |
Disability Class by Sex by Age in Lincoln
Disability Class: Hearing Difficulty
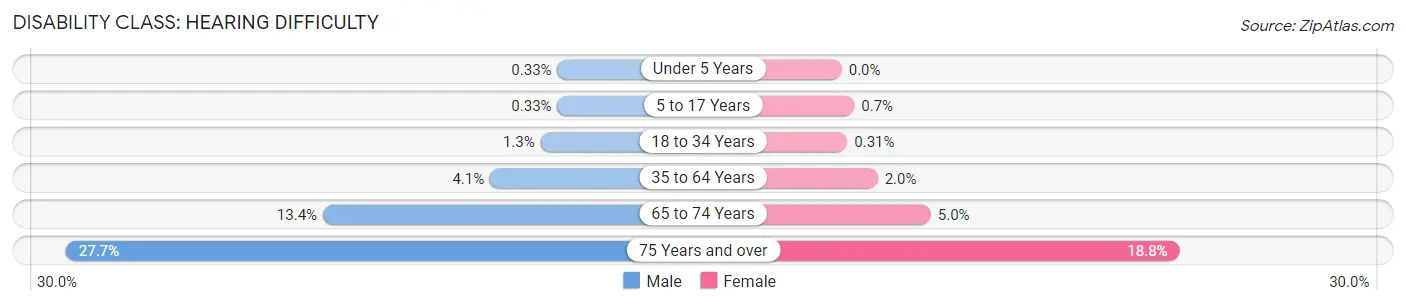
| Age Bracket | Male | Female |
| Under 5 Years | 30 (0.3%) | 0 (0.0%) |
| 5 to 17 Years | 78 (0.3%) | 159 (0.7%) |
| 18 to 34 Years | 563 (1.3%) | 130 (0.3%) |
| 35 to 64 Years | 1,966 (4.1%) | 946 (2.0%) |
| 65 to 74 Years | 1,506 (13.4%) | 648 (5.0%) |
| 75 Years and over | 1,758 (27.7%) | 1,742 (18.8%) |
Disability Class: Vision Difficulty
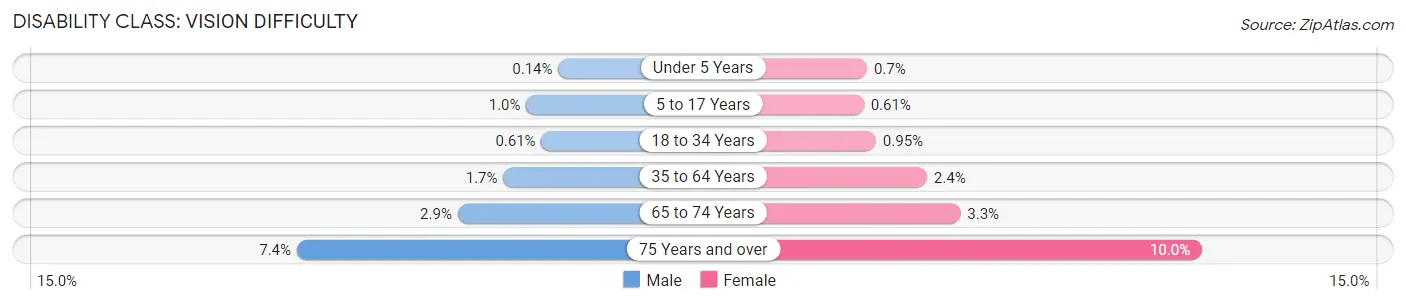
| Age Bracket | Male | Female |
| Under 5 Years | 13 (0.1%) | 58 (0.7%) |
| 5 to 17 Years | 246 (1.0%) | 139 (0.6%) |
| 18 to 34 Years | 268 (0.6%) | 405 (0.9%) |
| 35 to 64 Years | 805 (1.7%) | 1,121 (2.4%) |
| 65 to 74 Years | 331 (2.9%) | 431 (3.3%) |
| 75 Years and over | 471 (7.4%) | 929 (10.0%) |
Disability Class: Cognitive Difficulty
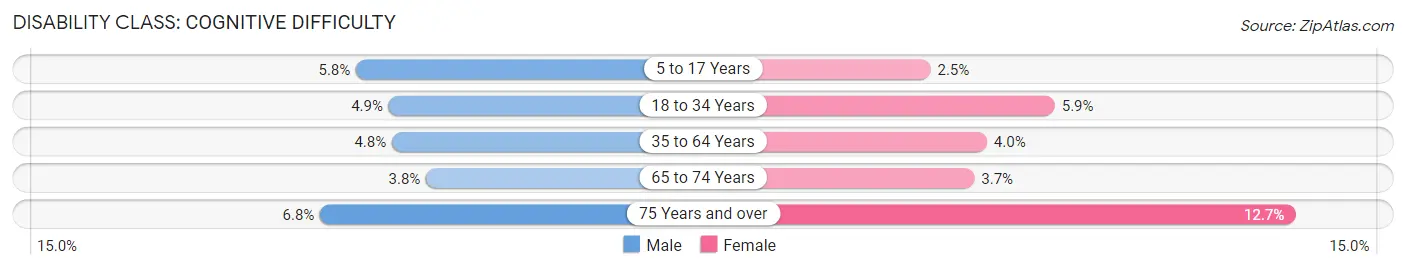
| Age Bracket | Male | Female |
| 5 to 17 Years | 1,377 (5.8%) | 561 (2.5%) |
| 18 to 34 Years | 2,151 (4.9%) | 2,525 (5.9%) |
| 35 to 64 Years | 2,299 (4.8%) | 1,910 (4.0%) |
| 65 to 74 Years | 430 (3.8%) | 483 (3.7%) |
| 75 Years and over | 430 (6.8%) | 1,172 (12.7%) |
Disability Class: Ambulatory Difficulty
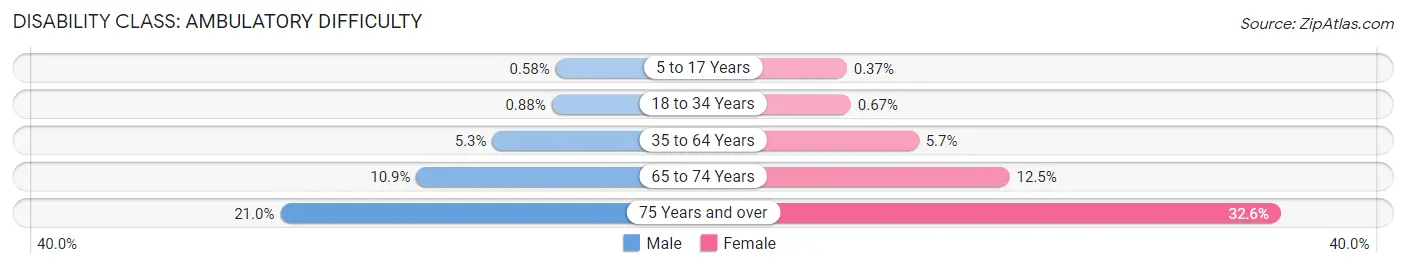
| Age Bracket | Male | Female |
| 5 to 17 Years | 138 (0.6%) | 84 (0.4%) |
| 18 to 34 Years | 391 (0.9%) | 285 (0.7%) |
| 35 to 64 Years | 2,540 (5.3%) | 2,701 (5.7%) |
| 65 to 74 Years | 1,228 (10.9%) | 1,629 (12.5%) |
| 75 Years and over | 1,334 (21.0%) | 3,019 (32.6%) |
Disability Class: Self-Care Difficulty
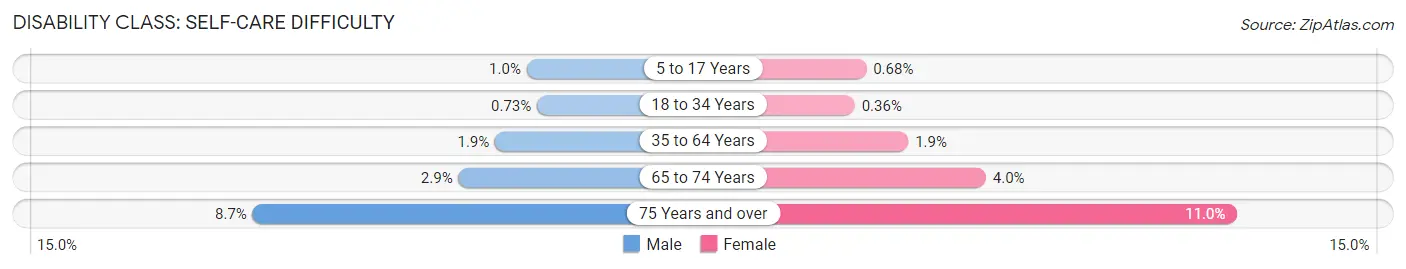
| Age Bracket | Male | Female |
| 5 to 17 Years | 243 (1.0%) | 154 (0.7%) |
| 18 to 34 Years | 323 (0.7%) | 152 (0.4%) |
| 35 to 64 Years | 915 (1.9%) | 875 (1.8%) |
| 65 to 74 Years | 328 (2.9%) | 524 (4.0%) |
| 75 Years and over | 549 (8.6%) | 1,020 (11.0%) |
Technology Access in Lincoln
Computing Device Access in Lincoln
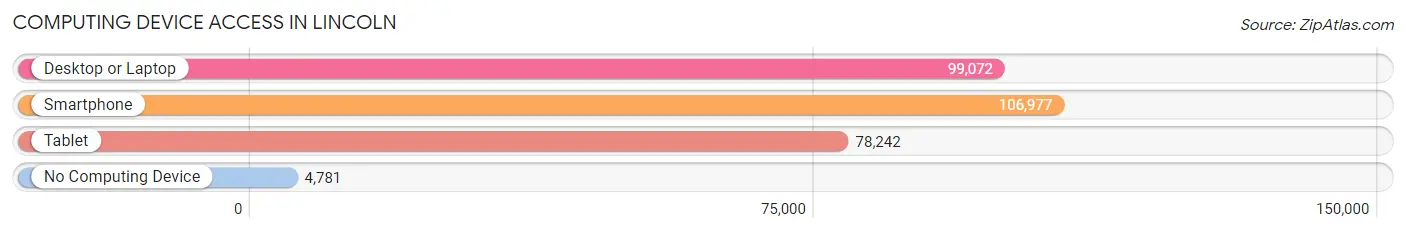
| Device Type | # Households | % Households |
| Desktop or Laptop | 99,072 | 83.7% |
| Smartphone | 106,977 | 90.4% |
| Tablet | 78,242 | 66.1% |
| No Computing Device | 4,781 | 4.0% |
| Total | 118,332 | 100.0% |
Internet Access in Lincoln
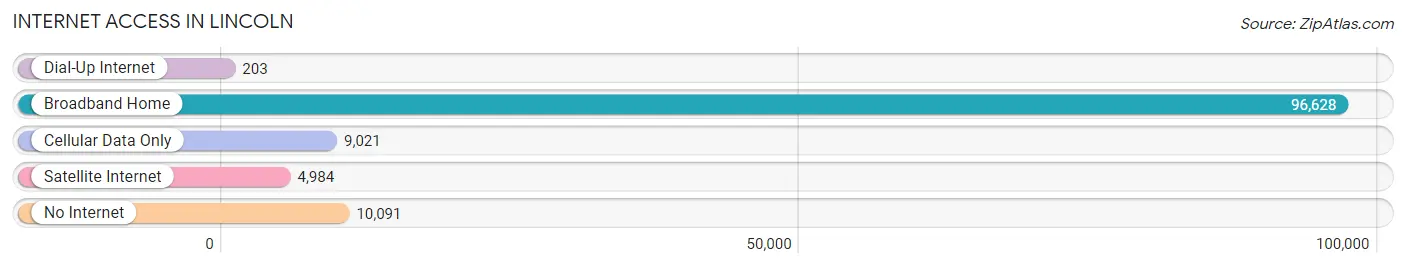
| Internet Type | # Households | % Households |
| Dial-Up Internet | 203 | 0.2% |
| Broadband Home | 96,628 | 81.7% |
| Cellular Data Only | 9,021 | 7.6% |
| Satellite Internet | 4,984 | 4.2% |
| No Internet | 10,091 | 8.5% |
| Total | 118,332 | 100.0% |
Lincoln Summary
Lincoln, Nebraska is the capital of the state of Nebraska and the county seat of Lancaster County. It is located in the southeastern part of the state, about 50 miles southwest of Omaha. The city is home to the University of Nebraska-Lincoln, the state's flagship university, and is the second-largest city in the state.
History
Lincoln was founded in 1856 as the village of Lancaster, and was later renamed for President Abraham Lincoln. The city was chosen as the state capital in 1867, and was incorporated in 1869. The city grew rapidly in the late 19th and early 20th centuries, and by the 1920s it had become a major industrial center. The city was also a major center for the railroad industry, and was home to several major railroads.
Geography
Lincoln is located in the southeastern part of the state, about 50 miles southwest of Omaha. The city is situated on the banks of the Platte River, and is surrounded by rolling hills and farmland. The city has a total area of 94.3 square miles, of which 92.9 square miles is land and 1.4 square miles is water.
Economy
Lincoln has a diverse economy, with a mix of manufacturing, services, and government. The city is home to several major employers, including the University of Nebraska-Lincoln, the state government, and several large corporations. The city is also a major center for the insurance industry, and is home to several major insurance companies.
Demographics
As of the 2010 census, Lincoln had a population of 258,379. The city has a population density of 2,741 people per square mile. The racial makeup of the city was 81.2% White, 8.2% African American, 0.7% Native American, 3.2% Asian, 0.1% Pacific Islander, 3.3% from other races, and 3.3% from two or more races. Hispanic or Latino of any race were 8.7% of the population.
The median income for a household in the city was $45,919, and the median income for a family was $56,845. The per capita income for the city was $24,945. About 11.2% of families and 15.3% of the population were below the poverty line, including 20.2% of those under age 18 and 8.2% of those age 65 or over.
Common Questions
What is Per Capita Income in Lincoln?
Per Capita income in Lincoln is $37,210.
What is the Median Family Income in Lincoln?
Median Family Income in Lincoln is $91,236.
What is the Median Household income in Lincoln?
Median Household Income in Lincoln is $67,846.
What is Income or Wage Gap in Lincoln?
Income or Wage Gap in Lincoln is 25.1%.
Women in Lincoln earn 74.9 cents for every dollar earned by a man.
What is Family Income Deficit in Lincoln?
Family Income Deficit in Lincoln is $10,745.
Families that are below poverty line in Lincoln earn $10,745 less on average than the poverty threshold level.
What is Inequality or Gini Index in Lincoln?
Inequality or Gini Index in Lincoln is 0.45.
What is the Total Population of Lincoln?
Total Population of Lincoln is 290,531.
What is the Total Male Population of Lincoln?
Total Male Population of Lincoln is 146,428.
What is the Total Female Population of Lincoln?
Total Female Population of Lincoln is 144,103.
What is the Ratio of Males per 100 Females in Lincoln?
There are 101.61 Males per 100 Females in Lincoln.
What is the Ratio of Females per 100 Males in Lincoln?
There are 98.41 Females per 100 Males in Lincoln.
What is the Median Population Age in Lincoln?
Median Population Age in Lincoln is 33.1 Years.
What is the Average Family Size in Lincoln
Average Family Size in Lincoln is 3.0 People.
What is the Average Household Size in Lincoln
Average Household Size in Lincoln is 2.4 People.
How Large is the Labor Force in Lincoln?
There are 165,763 People in the Labor Forcein in Lincoln.
What is the Percentage of People in the Labor Force in Lincoln?
70.9% of People are in the Labor Force in Lincoln.
What is the Unemployment Rate in Lincoln?
Unemployment Rate in Lincoln is 3.3%.