Amarillo, TX Map & Demographics
Amarillo Map
Amarillo Overview
$33,559
PER CAPITA INCOME
$76,749
AVG FAMILY INCOME
$60,628
AVG HOUSEHOLD INCOME
32.3%
WAGE / INCOME GAP [ % ]
67.7¢/ $1
WAGE / INCOME GAP [ $ ]
$10,110
FAMILY INCOME DEFICIT
0.47
INEQUALITY / GINI INDEX
200,360
TOTAL POPULATION
99,174
MALE POPULATION
101,186
FEMALE POPULATION
98.01
MALES / 100 FEMALES
102.03
FEMALES / 100 MALES
34.4
MEDIAN AGE
3.2
AVG FAMILY SIZE
2.5
AVG HOUSEHOLD SIZE
100,549
LABOR FORCE [ PEOPLE ]
65.6%
PERCENT IN LABOR FORCE
3.5%
UNEMPLOYMENT RATE
Amarillo Zip Codes
Amarillo Area Codes
Income in Amarillo
Income Overview in Amarillo
Per Capita Income in Amarillo is $33,559, while median incomes of families and households are $76,749 and $60,628 respectively.
| Characteristic | Number | Measure |
| Per Capita Income | 200,360 | $33,559 |
| Median Family Income | 49,553 | $76,749 |
| Mean Family Income | 49,553 | $99,631 |
| Median Household Income | 78,616 | $60,628 |
| Mean Household Income | 78,616 | $82,923 |
| Income Deficit | 49,553 | $10,110 |
| Wage / Income Gap (%) | 200,360 | 32.34% |
| Wage / Income Gap ($) | 200,360 | 67.66¢ per $1 |
| Gini / Inequality Index | 200,360 | 0.47 |
Earnings by Sex in Amarillo
Average Earnings in Amarillo are $36,880, $44,858 for men and $30,353 for women, a difference of 32.3%.
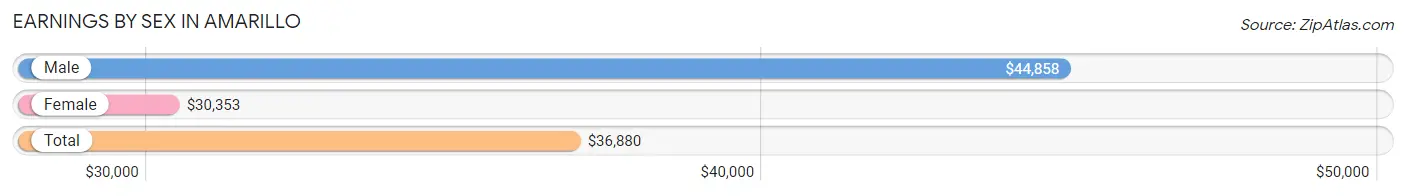
| Sex | Number | Average Earnings |
| Male | 55,608 (53.4%) | $44,858 |
| Female | 48,456 (46.6%) | $30,353 |
| Total | 104,064 (100.0%) | $36,880 |
Earnings by Sex by Income Bracket in Amarillo
The most common earnings brackets in Amarillo are $100,000+ for men (8,718 | 15.7%) and $25,000 to $29,999 for women (4,797 | 9.9%).
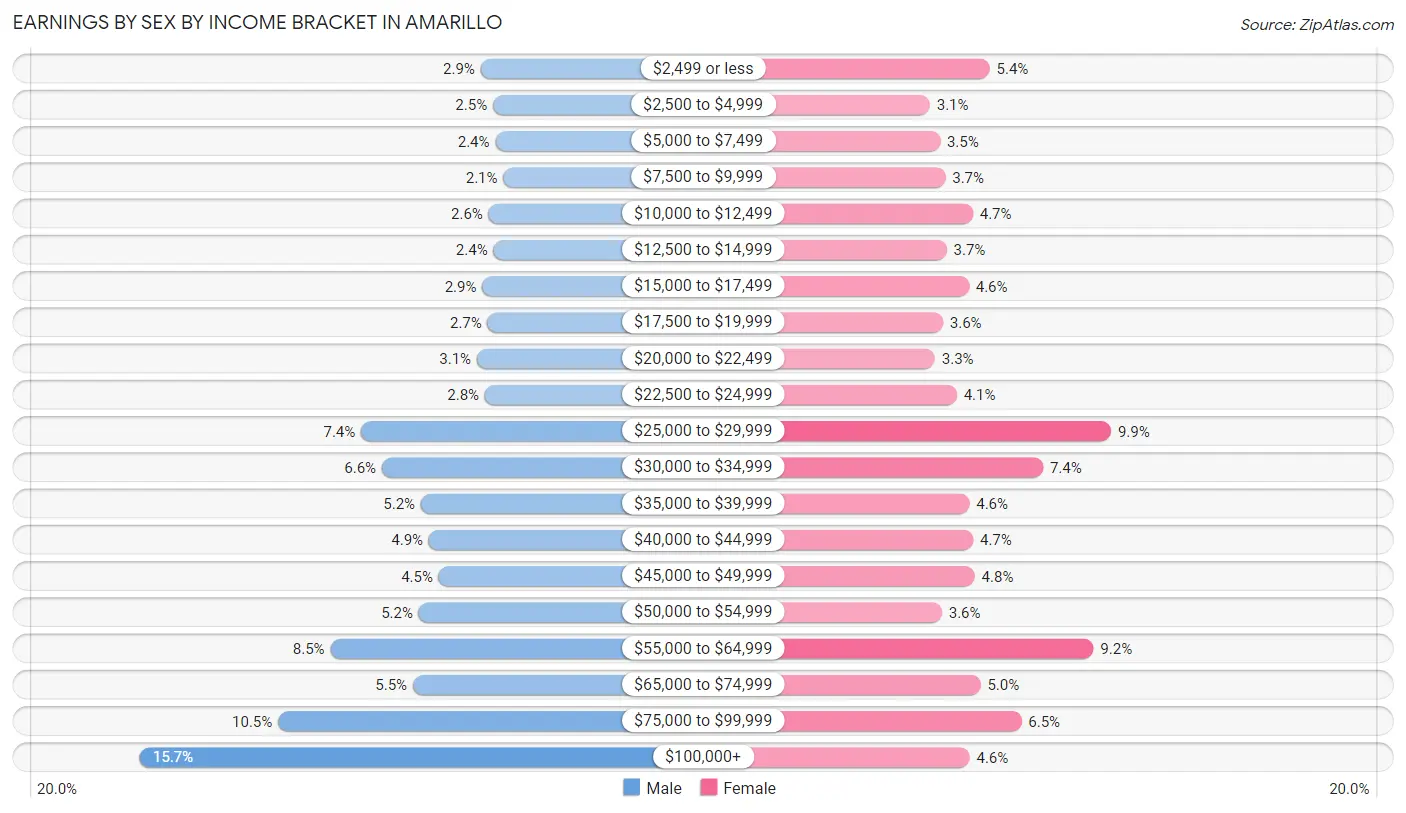
| Income | Male | Female |
| $2,499 or less | 1,616 (2.9%) | 2,592 (5.3%) |
| $2,500 to $4,999 | 1,363 (2.5%) | 1,505 (3.1%) |
| $5,000 to $7,499 | 1,310 (2.4%) | 1,692 (3.5%) |
| $7,500 to $9,999 | 1,148 (2.1%) | 1,787 (3.7%) |
| $10,000 to $12,499 | 1,454 (2.6%) | 2,286 (4.7%) |
| $12,500 to $14,999 | 1,349 (2.4%) | 1,810 (3.7%) |
| $15,000 to $17,499 | 1,585 (2.9%) | 2,213 (4.6%) |
| $17,500 to $19,999 | 1,473 (2.6%) | 1,745 (3.6%) |
| $20,000 to $22,499 | 1,696 (3.0%) | 1,601 (3.3%) |
| $22,500 to $24,999 | 1,532 (2.8%) | 1,998 (4.1%) |
| $25,000 to $29,999 | 4,108 (7.4%) | 4,797 (9.9%) |
| $30,000 to $34,999 | 3,678 (6.6%) | 3,563 (7.3%) |
| $35,000 to $39,999 | 2,865 (5.1%) | 2,226 (4.6%) |
| $40,000 to $44,999 | 2,695 (4.9%) | 2,292 (4.7%) |
| $45,000 to $49,999 | 2,491 (4.5%) | 2,321 (4.8%) |
| $50,000 to $54,999 | 2,909 (5.2%) | 1,727 (3.6%) |
| $55,000 to $64,999 | 4,751 (8.5%) | 4,476 (9.2%) |
| $65,000 to $74,999 | 3,030 (5.4%) | 2,429 (5.0%) |
| $75,000 to $99,999 | 5,837 (10.5%) | 3,169 (6.5%) |
| $100,000+ | 8,718 (15.7%) | 2,227 (4.6%) |
| Total | 55,608 (100.0%) | 48,456 (100.0%) |
Earnings by Sex by Educational Attainment in Amarillo
Average earnings in Amarillo are $52,645 for men and $34,448 for women, a difference of 34.6%. Men with an educational attainment of graduate degree enjoy the highest average annual earnings of $89,715, while those with less than high school education earn the least with $34,329. Women with an educational attainment of graduate degree earn the most with the average annual earnings of $67,500, while those with less than high school education have the smallest earnings of $23,261.
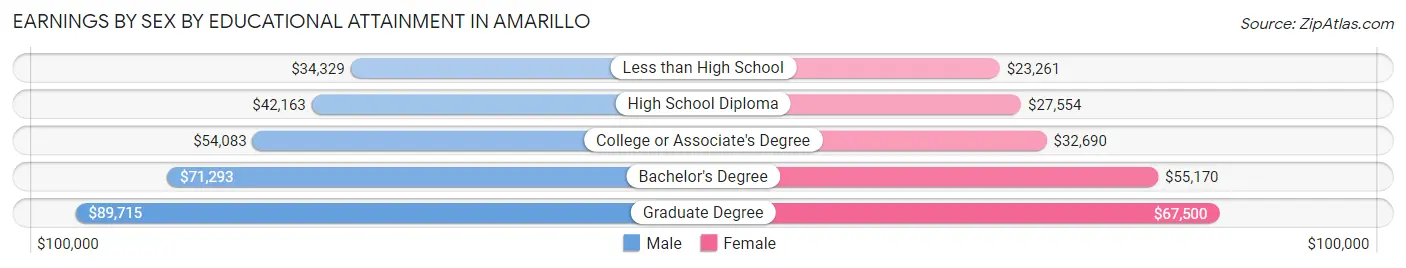
| Educational Attainment | Male Income | Female Income |
| Less than High School | $34,329 | $23,261 |
| High School Diploma | $42,163 | $27,554 |
| College or Associate's Degree | $54,083 | $32,690 |
| Bachelor's Degree | $71,293 | $55,170 |
| Graduate Degree | $89,715 | $67,500 |
| Total | $52,645 | $34,448 |
Family Income in Amarillo
Family Income Brackets in Amarillo
According to the Amarillo family income data, there are 9,712 families falling into the $100,000 to $149,999 income range, which is the most common income bracket and makes up 19.6% of all families. Conversely, the $10,000 to $14,999 income bracket is the least frequent group with only 942 families (1.9%) belonging to this category.
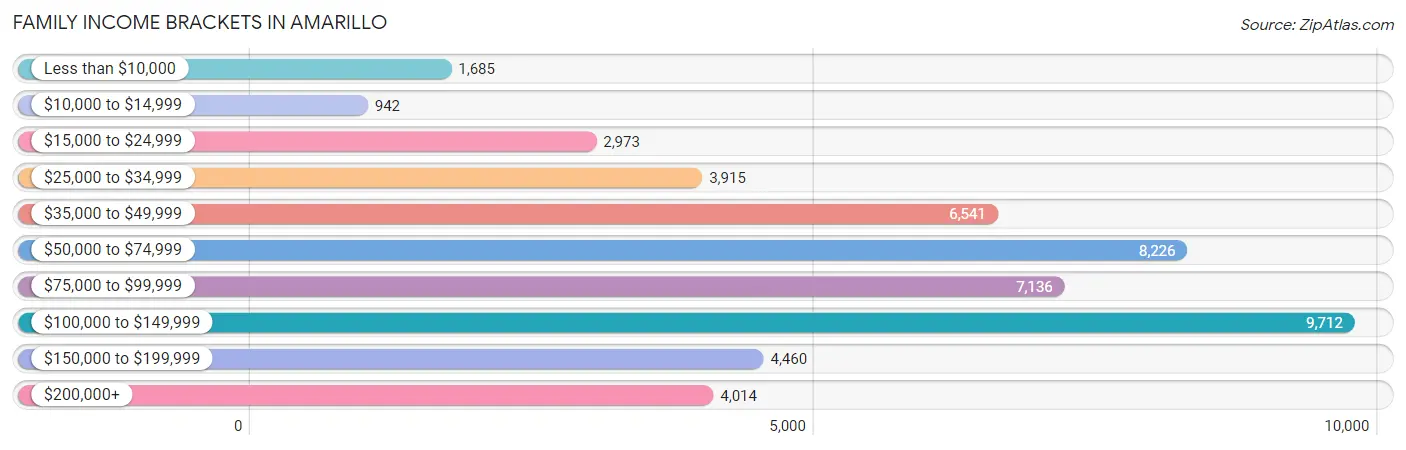
| Income Bracket | # Families | % Families |
| Less than $10,000 | 1,685 | 3.4% |
| $10,000 to $14,999 | 942 | 1.9% |
| $15,000 to $24,999 | 2,973 | 6.0% |
| $25,000 to $34,999 | 3,915 | 7.9% |
| $35,000 to $49,999 | 6,541 | 13.2% |
| $50,000 to $74,999 | 8,226 | 16.6% |
| $75,000 to $99,999 | 7,136 | 14.4% |
| $100,000 to $149,999 | 9,712 | 19.6% |
| $150,000 to $199,999 | 4,460 | 9.0% |
| $200,000+ | 4,014 | 8.1% |
Family Income by Famaliy Size in Amarillo
5-person families (4,604 | 9.3%) account for the highest median family income in Amarillo with $94,151 per family, while 2-person families (22,438 | 45.3%) have the highest median income of $34,412 per family member.
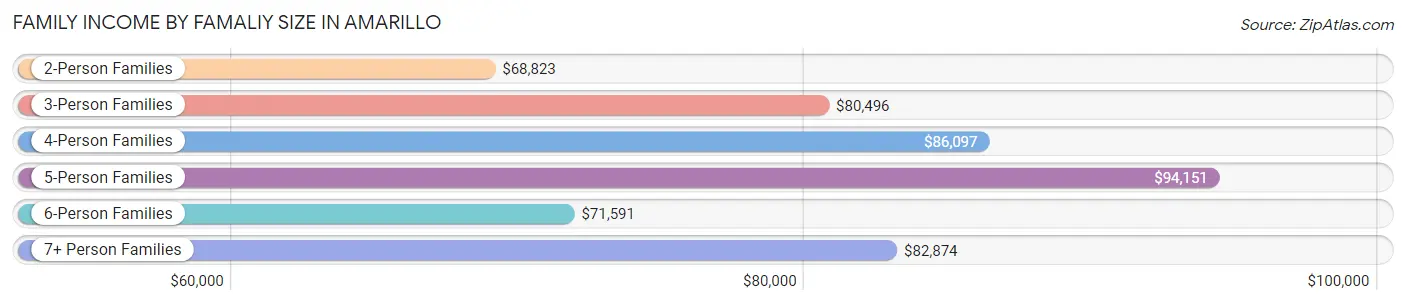
| Income Bracket | # Families | Median Income |
| 2-Person Families | 22,438 (45.3%) | $68,823 |
| 3-Person Families | 10,951 (22.1%) | $80,496 |
| 4-Person Families | 9,035 (18.2%) | $86,097 |
| 5-Person Families | 4,604 (9.3%) | $94,151 |
| 6-Person Families | 1,524 (3.1%) | $71,591 |
| 7+ Person Families | 1,001 (2.0%) | $82,874 |
| Total | 49,553 (100.0%) | $76,749 |
Family Income by Number of Earners in Amarillo
The median family income in Amarillo is $76,749, with families comprising 3+ earners (4,868) having the highest median family income of $124,762, while families with no earners (5,864) have the lowest median family income of $39,224, accounting for 9.8% and 11.8% of families, respectively.
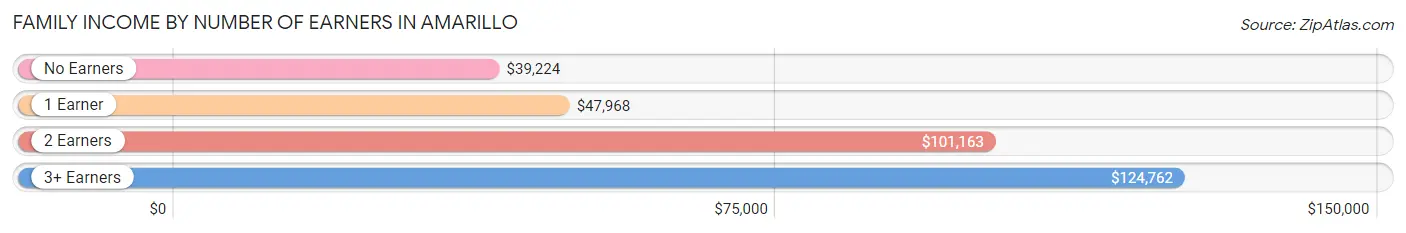
| Number of Earners | # Families | Median Income |
| No Earners | 5,864 (11.8%) | $39,224 |
| 1 Earner | 17,675 (35.7%) | $47,968 |
| 2 Earners | 21,146 (42.7%) | $101,163 |
| 3+ Earners | 4,868 (9.8%) | $124,762 |
| Total | 49,553 (100.0%) | $76,749 |
Household Income in Amarillo
Household Income Brackets in Amarillo
With 13,601 households falling in the category, the $50,000 to $74,999 income range is the most frequent in Amarillo, accounting for 17.3% of all households. In contrast, only 3,145 households (4.0%) fall into the $10,000 to $14,999 income bracket, making it the least populous group.
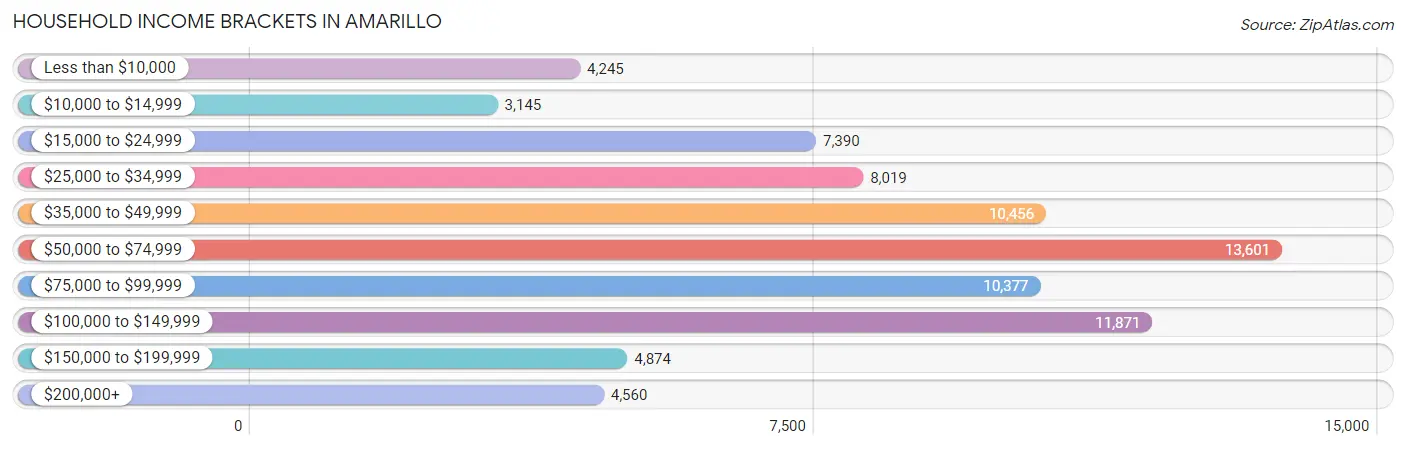
| Income Bracket | # Households | % Households |
| Less than $10,000 | 4,245 | 5.4% |
| $10,000 to $14,999 | 3,145 | 4.0% |
| $15,000 to $24,999 | 7,390 | 9.4% |
| $25,000 to $34,999 | 8,019 | 10.2% |
| $35,000 to $49,999 | 10,456 | 13.3% |
| $50,000 to $74,999 | 13,601 | 17.3% |
| $75,000 to $99,999 | 10,377 | 13.2% |
| $100,000 to $149,999 | 11,871 | 15.1% |
| $150,000 to $199,999 | 4,874 | 6.2% |
| $200,000+ | 4,560 | 5.8% |
Household Income by Householder Age in Amarillo
The median household income in Amarillo is $60,628, with the highest median household income of $72,252 found in the 45 to 64 years age bracket for the primary householder. A total of 24,395 households (31.0%) fall into this category. Meanwhile, the 15 to 24 years age bracket for the primary householder has the lowest median household income of $34,802, with 5,669 households (7.2%) in this group.
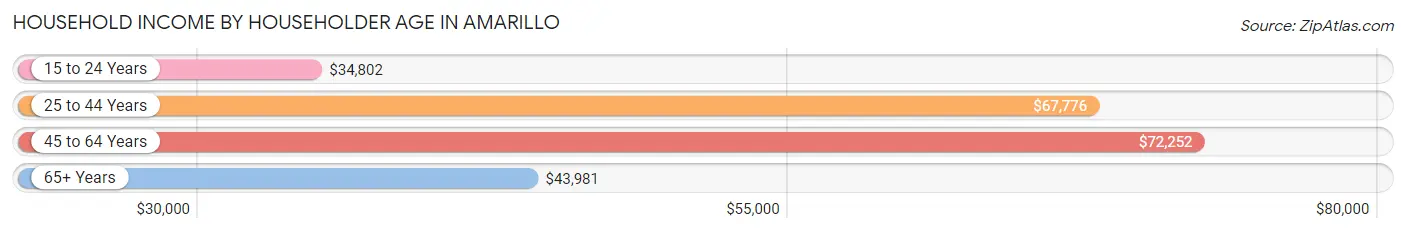
| Income Bracket | # Households | Median Income |
| 15 to 24 Years | 5,669 (7.2%) | $34,802 |
| 25 to 44 Years | 29,746 (37.8%) | $67,776 |
| 45 to 64 Years | 24,395 (31.0%) | $72,252 |
| 65+ Years | 18,806 (23.9%) | $43,981 |
| Total | 78,616 (100.0%) | $60,628 |
Poverty in Amarillo
Income Below Poverty by Sex and Age in Amarillo
With 14.1% poverty level for males and 16.9% for females among the residents of Amarillo, 15 year old males and under 5 year old females are the most vulnerable to poverty, with 384 males (29.1%) and 1,706 females (26.0%) in their respective age groups living below the poverty level.
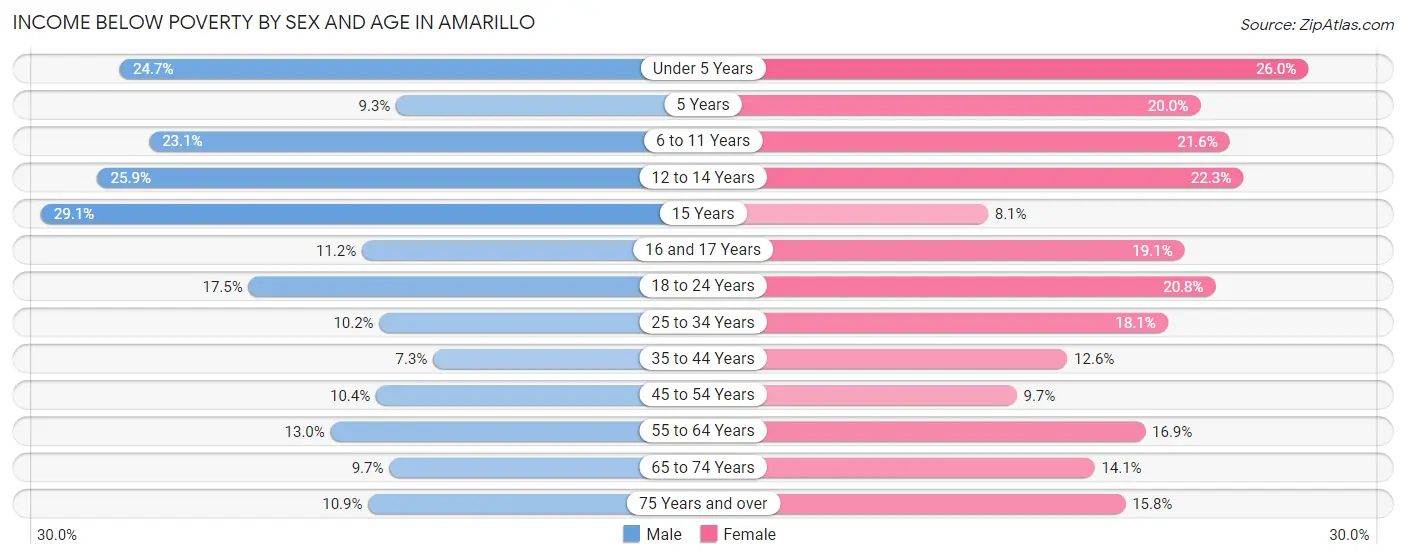
| Age Bracket | Male | Female |
| Under 5 Years | 1,821 (24.7%) | 1,706 (26.0%) |
| 5 Years | 116 (9.3%) | 303 (20.0%) |
| 6 to 11 Years | 2,156 (23.1%) | 1,779 (21.6%) |
| 12 to 14 Years | 1,214 (25.9%) | 1,002 (22.3%) |
| 15 Years | 384 (29.1%) | 132 (8.1%) |
| 16 and 17 Years | 355 (11.2%) | 541 (19.1%) |
| 18 to 24 Years | 1,706 (17.5%) | 1,876 (20.8%) |
| 25 to 34 Years | 1,513 (10.2%) | 2,698 (18.1%) |
| 35 to 44 Years | 1,009 (7.2%) | 1,679 (12.6%) |
| 45 to 54 Years | 1,089 (10.4%) | 1,084 (9.7%) |
| 55 to 64 Years | 1,307 (13.0%) | 1,766 (16.9%) |
| 65 to 74 Years | 737 (9.7%) | 1,282 (14.1%) |
| 75 Years and over | 483 (10.9%) | 1,080 (15.8%) |
| Total | 13,890 (14.1%) | 16,928 (16.9%) |
Income Above Poverty by Sex and Age in Amarillo
According to the poverty statistics in Amarillo, males aged 35 to 44 years and females aged 15 years are the age groups that are most secure financially, with 92.7% of males and 91.9% of females in these age groups living above the poverty line.
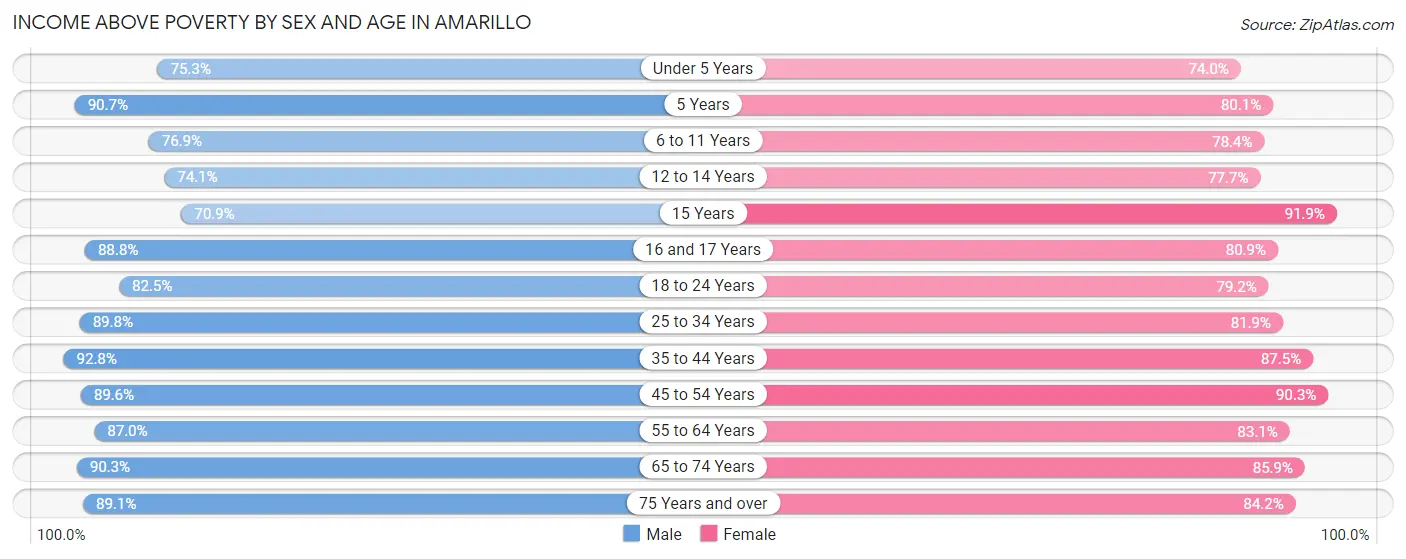
| Age Bracket | Male | Female |
| Under 5 Years | 5,556 (75.3%) | 4,864 (74.0%) |
| 5 Years | 1,130 (90.7%) | 1,216 (80.0%) |
| 6 to 11 Years | 7,194 (76.9%) | 6,462 (78.4%) |
| 12 to 14 Years | 3,467 (74.1%) | 3,484 (77.7%) |
| 15 Years | 936 (70.9%) | 1,491 (91.9%) |
| 16 and 17 Years | 2,811 (88.8%) | 2,295 (80.9%) |
| 18 to 24 Years | 8,024 (82.5%) | 7,142 (79.2%) |
| 25 to 34 Years | 13,260 (89.8%) | 12,172 (81.9%) |
| 35 to 44 Years | 12,905 (92.7%) | 11,697 (87.5%) |
| 45 to 54 Years | 9,350 (89.6%) | 10,058 (90.3%) |
| 55 to 64 Years | 8,777 (87.0%) | 8,691 (83.1%) |
| 65 to 74 Years | 6,870 (90.3%) | 7,831 (85.9%) |
| 75 Years and over | 3,964 (89.1%) | 5,766 (84.2%) |
| Total | 84,244 (85.9%) | 83,169 (83.1%) |
Income Below Poverty Among Married-Couple Families in Amarillo
The poverty statistics for married-couple families in Amarillo show that 6.2% or 2,190 of the total 35,151 families live below the poverty line. Families with 5 or more children have the highest poverty rate of 33.3%, comprising of 126 families. On the other hand, families with no children have the lowest poverty rate of 4.2%, which includes 799 families.
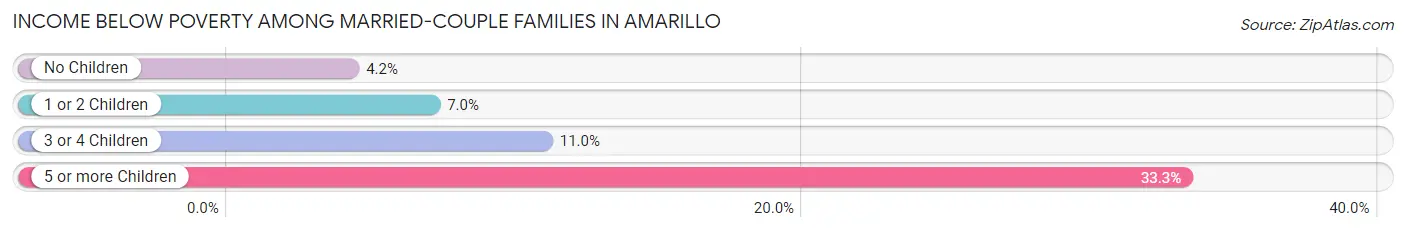
| Children | Above Poverty | Below Poverty |
| No Children | 18,136 (95.8%) | 799 (4.2%) |
| 1 or 2 Children | 11,159 (93.0%) | 845 (7.0%) |
| 3 or 4 Children | 3,413 (89.0%) | 420 (11.0%) |
| 5 or more Children | 253 (66.7%) | 126 (33.3%) |
| Total | 32,961 (93.8%) | 2,190 (6.2%) |
Income Below Poverty Among Single-Parent Households in Amarillo
According to the poverty data in Amarillo, 17.6% or 763 single-father households and 28.5% or 2,862 single-mother households are living below the poverty line. Among single-father households, those with 5 or more children have the highest poverty rate, with 12 households (75.0%) experiencing poverty. Likewise, among single-mother households, those with 5 or more children have the highest poverty rate, with 234 households (98.7%) falling below the poverty line.
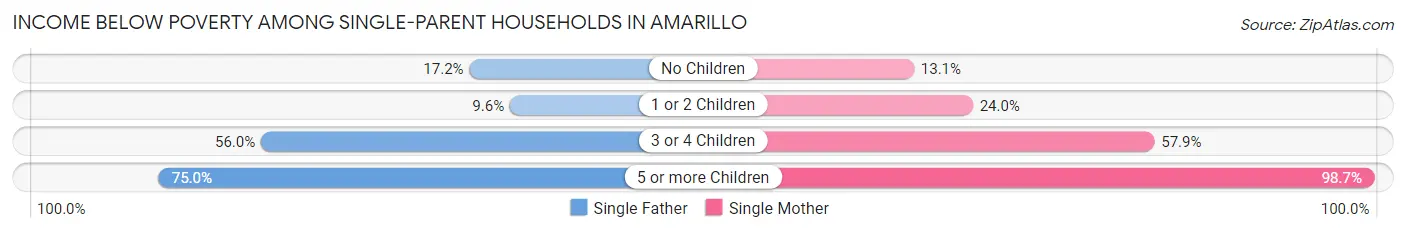
| Children | Single Father | Single Mother |
| No Children | 241 (17.2%) | 390 (13.1%) |
| 1 or 2 Children | 233 (9.6%) | 1,219 (24.0%) |
| 3 or 4 Children | 277 (56.0%) | 1,019 (57.9%) |
| 5 or more Children | 12 (75.0%) | 234 (98.7%) |
| Total | 763 (17.6%) | 2,862 (28.5%) |
Income Below Poverty Among Married-Couple vs Single-Parent Households in Amarillo
The poverty data for Amarillo shows that 2,190 of the married-couple family households (6.2%) and 3,625 of the single-parent households (25.2%) are living below the poverty level. Within the married-couple family households, those with 5 or more children have the highest poverty rate, with 126 households (33.3%) falling below the poverty line. Among the single-parent households, those with 5 or more children have the highest poverty rate, with 246 household (97.2%) living below poverty.
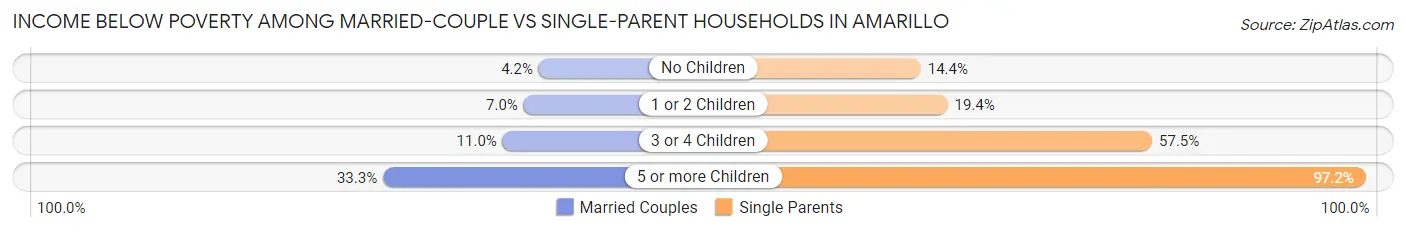
| Children | Married-Couple Families | Single-Parent Households |
| No Children | 799 (4.2%) | 631 (14.4%) |
| 1 or 2 Children | 845 (7.0%) | 1,452 (19.4%) |
| 3 or 4 Children | 420 (11.0%) | 1,296 (57.5%) |
| 5 or more Children | 126 (33.3%) | 246 (97.2%) |
| Total | 2,190 (6.2%) | 3,625 (25.2%) |
Race in Amarillo
The most populous races in Amarillo are White / Caucasian (145,417 | 72.6%), Hispanic or Latino (68,445 | 34.2%), and Two or more Races (22,089 | 11.0%).
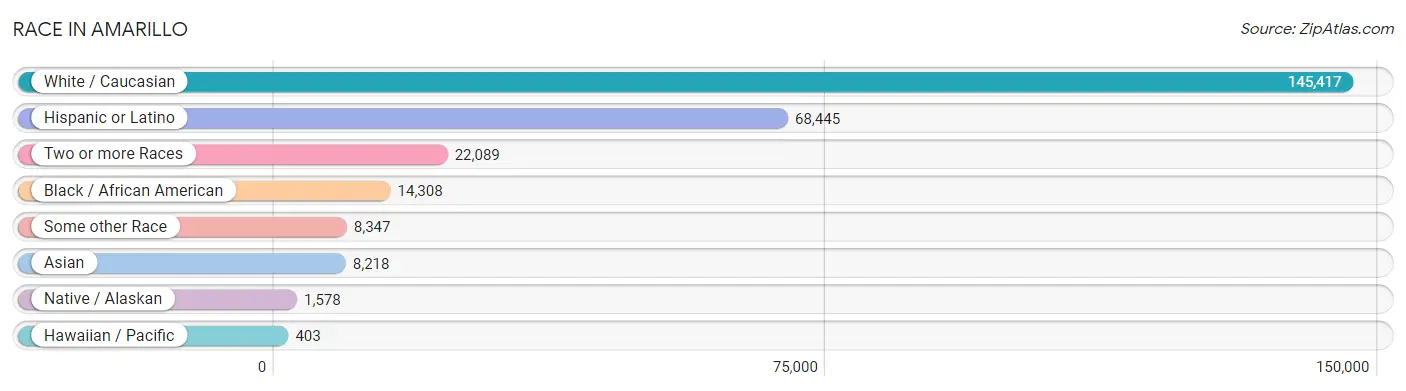
| Race | # Population | % Population |
| Asian | 8,218 | 4.1% |
| Black / African American | 14,308 | 7.1% |
| Hawaiian / Pacific | 403 | 0.2% |
| Hispanic or Latino | 68,445 | 34.2% |
| Native / Alaskan | 1,578 | 0.8% |
| White / Caucasian | 145,417 | 72.6% |
| Two or more Races | 22,089 | 11.0% |
| Some other Race | 8,347 | 4.2% |
| Total | 200,360 | 100.0% |
Ancestry in Amarillo
The most populous ancestries reported in Amarillo are Mexican (60,259 | 30.1%), German (16,786 | 8.4%), English (16,533 | 8.3%), Irish (14,749 | 7.4%), and American (11,074 | 5.5%), together accounting for 59.6% of all Amarillo residents.
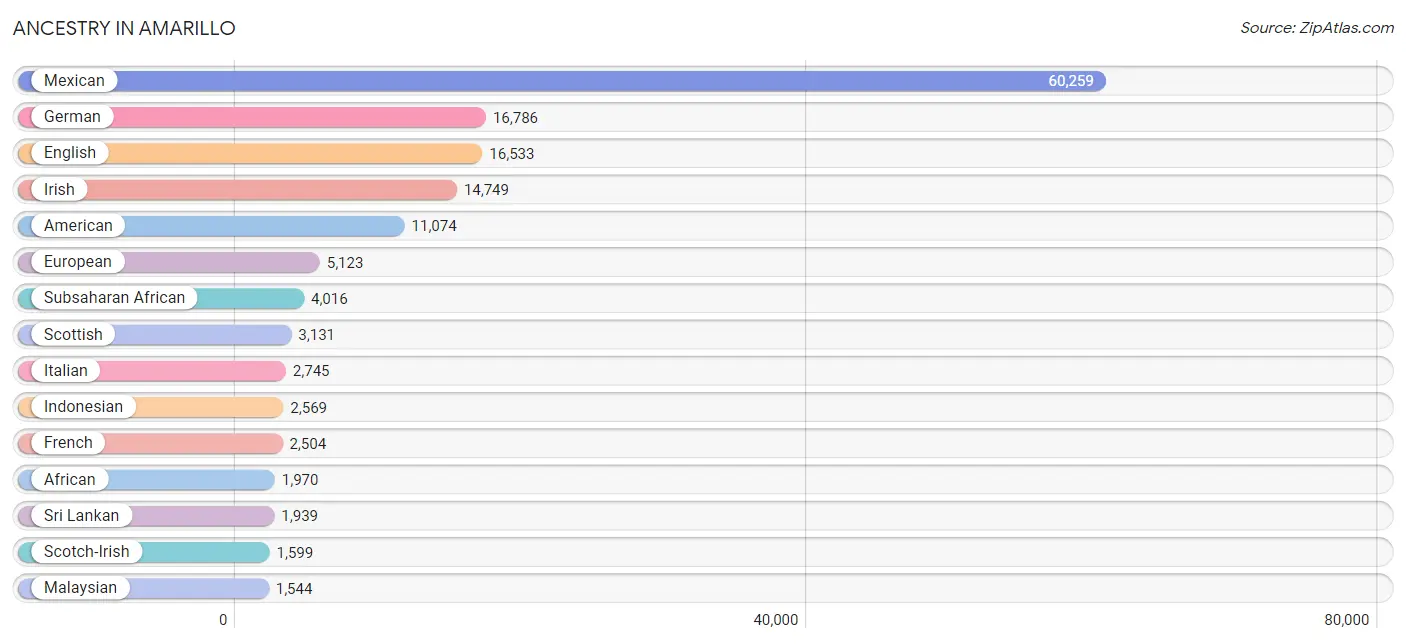
| Ancestry | # Population | % Population |
| Afghan | 36 | 0.0% |
| African | 1,970 | 1.0% |
| Albanian | 84 | 0.0% |
| American | 11,074 | 5.5% |
| Apache | 482 | 0.2% |
| Arab | 357 | 0.2% |
| Argentinean | 127 | 0.1% |
| Armenian | 64 | 0.0% |
| Australian | 37 | 0.0% |
| Austrian | 199 | 0.1% |
| Bangladeshi | 82 | 0.0% |
| Basque | 69 | 0.0% |
| Belgian | 10 | 0.0% |
| Bermudan | 7 | 0.0% |
| Bhutanese | 62 | 0.0% |
| Blackfeet | 38 | 0.0% |
| British | 698 | 0.4% |
| British West Indian | 26 | 0.0% |
| Bulgarian | 32 | 0.0% |
| Burmese | 287 | 0.1% |
| Cajun | 20 | 0.0% |
| Canadian | 92 | 0.1% |
| Celtic | 47 | 0.0% |
| Central American | 858 | 0.4% |
| Central American Indian | 10 | 0.0% |
| Cherokee | 778 | 0.4% |
| Chickasaw | 100 | 0.1% |
| Chippewa | 9 | 0.0% |
| Choctaw | 345 | 0.2% |
| Colombian | 149 | 0.1% |
| Comanche | 27 | 0.0% |
| Cree | 13 | 0.0% |
| Creek | 130 | 0.1% |
| Croatian | 147 | 0.1% |
| Crow | 23 | 0.0% |
| Cuban | 446 | 0.2% |
| Czech | 292 | 0.2% |
| Czechoslovakian | 49 | 0.0% |
| Danish | 166 | 0.1% |
| Delaware | 4 | 0.0% |
| Dominican | 86 | 0.0% |
| Dutch | 1,522 | 0.8% |
| Dutch West Indian | 58 | 0.0% |
| Eastern European | 238 | 0.1% |
| Ecuadorian | 169 | 0.1% |
| Egyptian | 12 | 0.0% |
| English | 16,533 | 8.3% |
| Ethiopian | 108 | 0.1% |
| European | 5,123 | 2.6% |
| Finnish | 6 | 0.0% |
| French | 2,504 | 1.3% |
| French American Indian | 5 | 0.0% |
| French Canadian | 312 | 0.2% |
| German | 16,786 | 8.4% |
| Ghanaian | 182 | 0.1% |
| Greek | 250 | 0.1% |
| Guamanian / Chamorro | 78 | 0.0% |
| Guatemalan | 205 | 0.1% |
| Haitian | 35 | 0.0% |
| Honduran | 301 | 0.2% |
| Hopi | 10 | 0.0% |
| Hungarian | 150 | 0.1% |
| Indian (Asian) | 201 | 0.1% |
| Indonesian | 2,569 | 1.3% |
| Iranian | 442 | 0.2% |
| Iraqi | 138 | 0.1% |
| Irish | 14,749 | 7.4% |
| Iroquois | 46 | 0.0% |
| Italian | 2,745 | 1.4% |
| Jamaican | 67 | 0.0% |
| Japanese | 20 | 0.0% |
| Korean | 574 | 0.3% |
| Laotian | 122 | 0.1% |
| Latvian | 3 | 0.0% |
| Lebanese | 99 | 0.1% |
| Lithuanian | 37 | 0.0% |
| Malaysian | 1,544 | 0.8% |
| Mexican | 60,259 | 30.1% |
| Mexican American Indian | 184 | 0.1% |
| Native Hawaiian | 564 | 0.3% |
| Navajo | 410 | 0.2% |
| Nicaraguan | 2 | 0.0% |
| Nigerian | 69 | 0.0% |
| Northern European | 111 | 0.1% |
| Norwegian | 1,403 | 0.7% |
| Pakistani | 451 | 0.2% |
| Panamanian | 29 | 0.0% |
| Pennsylvania German | 39 | 0.0% |
| Peruvian | 75 | 0.0% |
| Polish | 1,369 | 0.7% |
| Portuguese | 53 | 0.0% |
| Pueblo | 10 | 0.0% |
| Puerto Rican | 477 | 0.2% |
| Romanian | 97 | 0.1% |
| Russian | 271 | 0.1% |
| Salvadoran | 321 | 0.2% |
| Samoan | 22 | 0.0% |
| Scandinavian | 362 | 0.2% |
| Scotch-Irish | 1,599 | 0.8% |
| Scottish | 3,131 | 1.6% |
| Seminole | 3 | 0.0% |
| Sierra Leonean | 8 | 0.0% |
| Sioux | 23 | 0.0% |
| Slavic | 37 | 0.0% |
| Slovak | 59 | 0.0% |
| Somali | 319 | 0.2% |
| South American | 569 | 0.3% |
| Spaniard | 1,306 | 0.6% |
| Spanish | 1,143 | 0.6% |
| Spanish American | 105 | 0.1% |
| Sri Lankan | 1,939 | 1.0% |
| Subsaharan African | 4,016 | 2.0% |
| Sudanese | 435 | 0.2% |
| Swedish | 880 | 0.4% |
| Swiss | 216 | 0.1% |
| Syrian | 21 | 0.0% |
| Thai | 620 | 0.3% |
| Tlingit-Haida | 16 | 0.0% |
| Tongan | 25 | 0.0% |
| Trinidadian and Tobagonian | 30 | 0.0% |
| Turkish | 86 | 0.0% |
| Ugandan | 21 | 0.0% |
| Ukrainian | 13 | 0.0% |
| Venezuelan | 49 | 0.0% |
| Vietnamese | 52 | 0.0% |
| Welsh | 870 | 0.4% |
| West Indian | 23 | 0.0% |
| Yugoslavian | 77 | 0.0% |
| Yup'ik | 3 | 0.0% | View All 129 Rows |
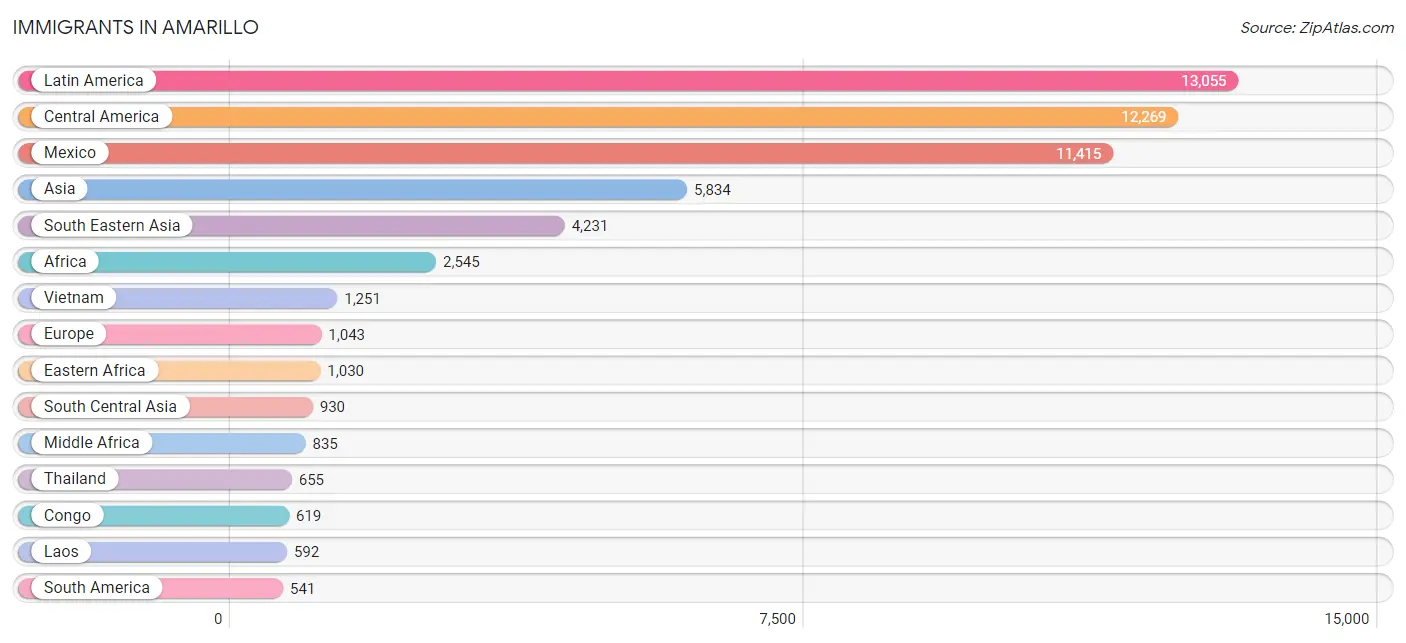
Immigrants in Amarillo
The most numerous immigrant groups reported in Amarillo came from Latin America (13,055 | 6.5%), Central America (12,269 | 6.1%), Mexico (11,415 | 5.7%), Asia (5,834 | 2.9%), and South Eastern Asia (4,231 | 2.1%), together accounting for 23.4% of all Amarillo residents.
| Immigration Origin | # Population | % Population |
| Afghanistan | 36 | 0.0% |
| Africa | 2,545 | 1.3% |
| Argentina | 68 | 0.0% |
| Asia | 5,834 | 2.9% |
| Austria | 14 | 0.0% |
| Bangladesh | 37 | 0.0% |
| Belgium | 12 | 0.0% |
| Bosnia and Herzegovina | 84 | 0.0% |
| Brazil | 76 | 0.0% |
| Cambodia | 14 | 0.0% |
| Canada | 65 | 0.0% |
| Caribbean | 245 | 0.1% |
| Central America | 12,269 | 6.1% |
| China | 107 | 0.1% |
| Colombia | 124 | 0.1% |
| Congo | 619 | 0.3% |
| Cuba | 175 | 0.1% |
| Dominica | 26 | 0.0% |
| Dominican Republic | 34 | 0.0% |
| Eastern Africa | 1,030 | 0.5% |
| Eastern Asia | 328 | 0.2% |
| Eastern Europe | 435 | 0.2% |
| Ecuador | 140 | 0.1% |
| Egypt | 211 | 0.1% |
| El Salvador | 360 | 0.2% |
| England | 24 | 0.0% |
| Ethiopia | 142 | 0.1% |
| Europe | 1,043 | 0.5% |
| France | 163 | 0.1% |
| Germany | 93 | 0.1% |
| Ghana | 131 | 0.1% |
| Greece | 73 | 0.0% |
| Guatemala | 190 | 0.1% |
| Honduras | 292 | 0.2% |
| Hong Kong | 61 | 0.0% |
| Hungary | 16 | 0.0% |
| India | 361 | 0.2% |
| Iran | 448 | 0.2% |
| Iraq | 202 | 0.1% |
| Ireland | 13 | 0.0% |
| Italy | 8 | 0.0% |
| Jamaica | 10 | 0.0% |
| Japan | 9 | 0.0% |
| Jordan | 23 | 0.0% |
| Kenya | 196 | 0.1% |
| Korea | 212 | 0.1% |
| Laos | 592 | 0.3% |
| Latin America | 13,055 | 6.5% |
| Lebanon | 18 | 0.0% |
| Liberia | 115 | 0.1% |
| Malaysia | 12 | 0.0% |
| Mexico | 11,415 | 5.7% |
| Middle Africa | 835 | 0.4% |
| Nicaragua | 2 | 0.0% |
| Nigeria | 47 | 0.0% |
| Northern Africa | 360 | 0.2% |
| Northern Europe | 161 | 0.1% |
| Pakistan | 48 | 0.0% |
| Panama | 10 | 0.0% |
| Peru | 75 | 0.0% |
| Philippines | 440 | 0.2% |
| Poland | 54 | 0.0% |
| Romania | 10 | 0.0% |
| Russia | 228 | 0.1% |
| Sierra Leone | 8 | 0.0% |
| Somalia | 226 | 0.1% |
| South America | 541 | 0.3% |
| South Central Asia | 930 | 0.5% |
| South Eastern Asia | 4,231 | 2.1% |
| Southern Europe | 165 | 0.1% |
| Spain | 84 | 0.0% |
| Sudan | 149 | 0.1% |
| Syria | 21 | 0.0% |
| Thailand | 655 | 0.3% |
| Turkey | 20 | 0.0% |
| Uganda | 31 | 0.0% |
| Ukraine | 13 | 0.0% |
| Venezuela | 40 | 0.0% |
| Vietnam | 1,251 | 0.6% |
| Western Africa | 301 | 0.2% |
| Western Asia | 345 | 0.2% |
| Western Europe | 282 | 0.1% |
| Yemen | 39 | 0.0% |
| Zaire | 216 | 0.1% | View All 84 Rows |
Sex and Age in Amarillo
Sex and Age in Amarillo
The most populous age groups in Amarillo are 35 to 39 Years (7,708 | 7.8%) for men and 25 to 29 Years (7,557 | 7.5%) for women.
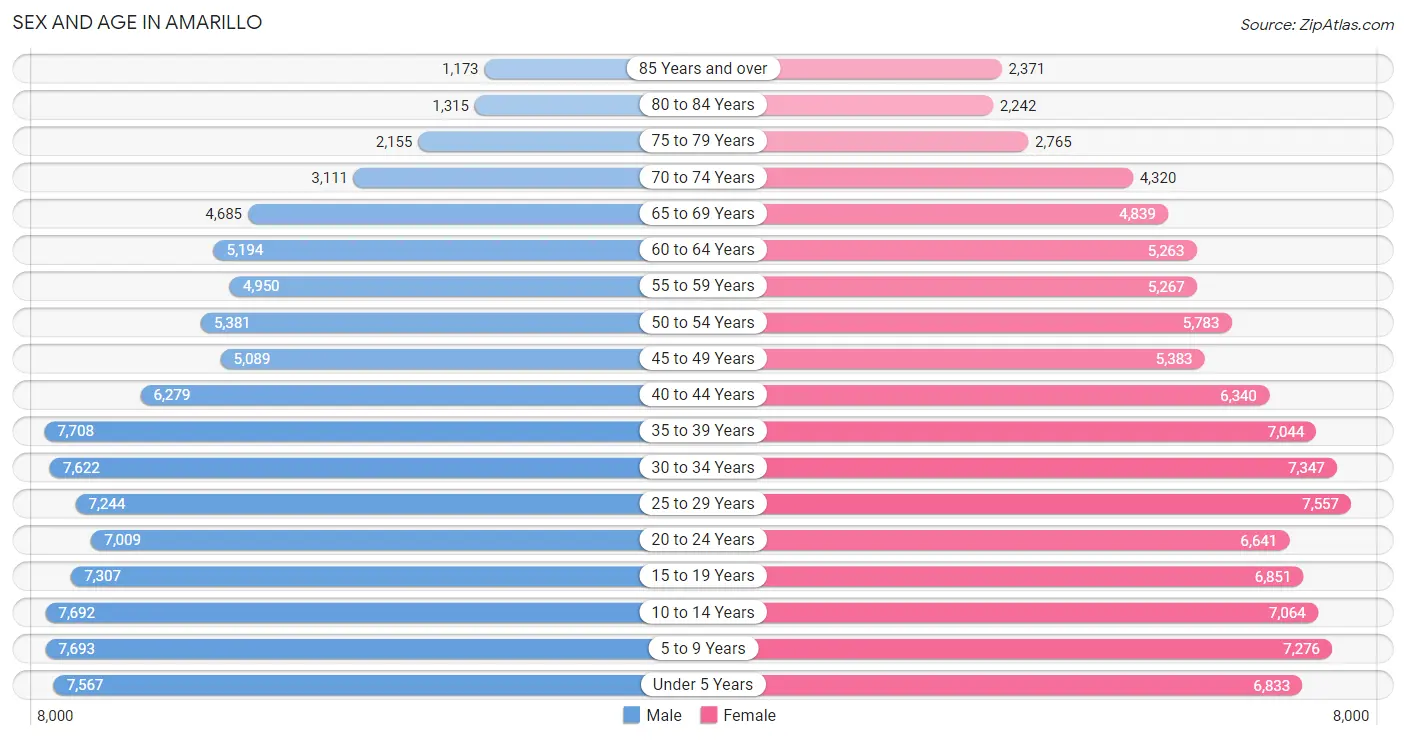
| Age Bracket | Male | Female |
| Under 5 Years | 7,567 (7.6%) | 6,833 (6.8%) |
| 5 to 9 Years | 7,693 (7.8%) | 7,276 (7.2%) |
| 10 to 14 Years | 7,692 (7.8%) | 7,064 (7.0%) |
| 15 to 19 Years | 7,307 (7.4%) | 6,851 (6.8%) |
| 20 to 24 Years | 7,009 (7.1%) | 6,641 (6.6%) |
| 25 to 29 Years | 7,244 (7.3%) | 7,557 (7.5%) |
| 30 to 34 Years | 7,622 (7.7%) | 7,347 (7.3%) |
| 35 to 39 Years | 7,708 (7.8%) | 7,044 (7.0%) |
| 40 to 44 Years | 6,279 (6.3%) | 6,340 (6.3%) |
| 45 to 49 Years | 5,089 (5.1%) | 5,383 (5.3%) |
| 50 to 54 Years | 5,381 (5.4%) | 5,783 (5.7%) |
| 55 to 59 Years | 4,950 (5.0%) | 5,267 (5.2%) |
| 60 to 64 Years | 5,194 (5.2%) | 5,263 (5.2%) |
| 65 to 69 Years | 4,685 (4.7%) | 4,839 (4.8%) |
| 70 to 74 Years | 3,111 (3.1%) | 4,320 (4.3%) |
| 75 to 79 Years | 2,155 (2.2%) | 2,765 (2.7%) |
| 80 to 84 Years | 1,315 (1.3%) | 2,242 (2.2%) |
| 85 Years and over | 1,173 (1.2%) | 2,371 (2.3%) |
| Total | 99,174 (100.0%) | 101,186 (100.0%) |
Families and Households in Amarillo
Median Family Size in Amarillo
The median family size in Amarillo is 3.24 persons per family, with married-couple families (35,151 | 70.9%) accounting for the largest median family size of 3.29 persons per family. On the other hand, single male/father families (4,346 | 8.8%) represent the smallest median family size with 2.90 persons per family.
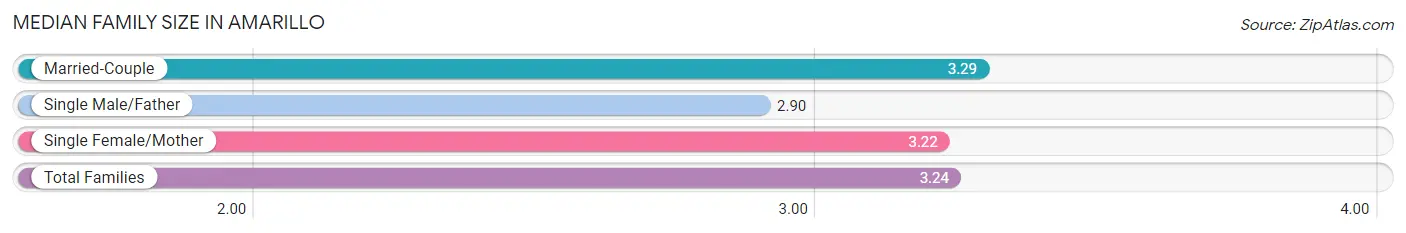
| Family Type | # Families | Family Size |
| Married-Couple | 35,151 (70.9%) | 3.29 |
| Single Male/Father | 4,346 (8.8%) | 2.90 |
| Single Female/Mother | 10,056 (20.3%) | 3.22 |
| Total Families | 49,553 (100.0%) | 3.24 |
Median Household Size in Amarillo
The median household size in Amarillo is 2.52 persons per household, with single female/mother households (10,056 | 12.8%) accounting for the largest median household size of 3.36 persons per household. non-family households (29,063 | 37.0%) represent the smallest median household size with 1.17 persons per household.
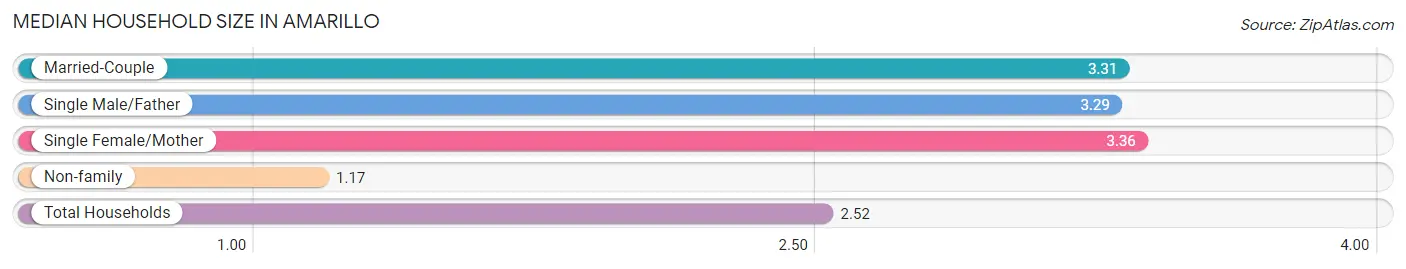
| Household Type | # Households | Household Size |
| Married-Couple | 35,151 (44.7%) | 3.31 |
| Single Male/Father | 4,346 (5.5%) | 3.29 |
| Single Female/Mother | 10,056 (12.8%) | 3.36 |
| Non-family | 29,063 (37.0%) | 1.17 |
| Total Households | 78,616 (100.0%) | 2.52 |
Household Size by Marriage Status in Amarillo
Out of a total of 78,616 households in Amarillo, 49,553 (63.0%) are family households, while 29,063 (37.0%) are nonfamily households. The most numerous type of family households are 2-person households, comprising 20,994, and the most common type of nonfamily households are 1-person households, comprising 25,345.
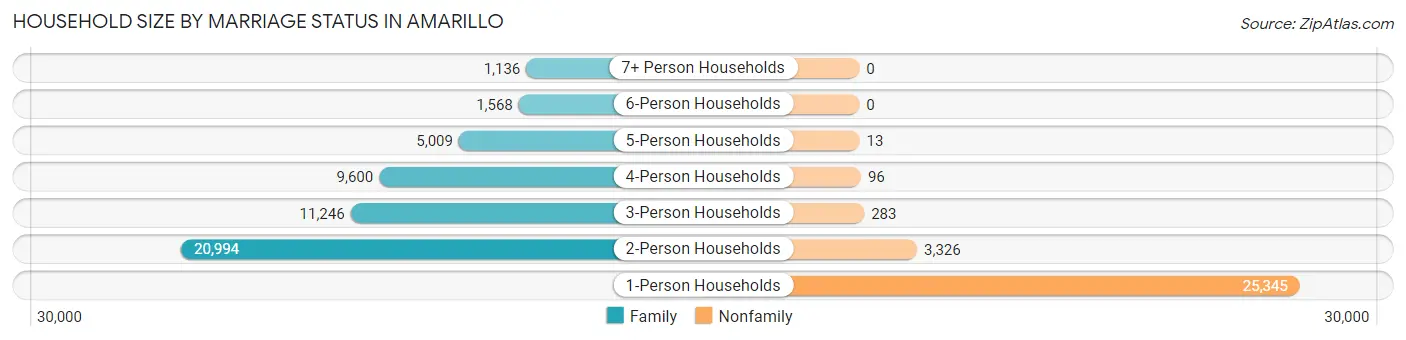
| Household Size | Family Households | Nonfamily Households |
| 1-Person Households | - | 25,345 (32.2%) |
| 2-Person Households | 20,994 (26.7%) | 3,326 (4.2%) |
| 3-Person Households | 11,246 (14.3%) | 283 (0.4%) |
| 4-Person Households | 9,600 (12.2%) | 96 (0.1%) |
| 5-Person Households | 5,009 (6.4%) | 13 (0.0%) |
| 6-Person Households | 1,568 (2.0%) | 0 (0.0%) |
| 7+ Person Households | 1,136 (1.4%) | 0 (0.0%) |
| Total | 49,553 (63.0%) | 29,063 (37.0%) |
Female Fertility in Amarillo
Fertility by Age in Amarillo
Average fertility rate in Amarillo is 54.0 births per 1,000 women. Women in the age bracket of 20 to 34 years have the highest fertility rate with 100.0 births per 1,000 women. Women in the age bracket of 20 to 34 years acount for 83.2% of all women with births.
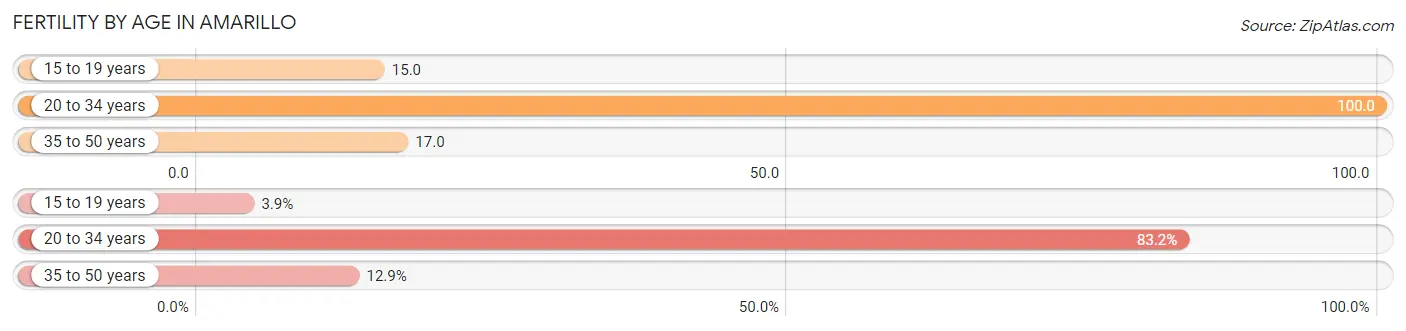
| Age Bracket | Women with Births | Births / 1,000 Women |
| 15 to 19 years | 102 (3.9%) | 15.0 |
| 20 to 34 years | 2,157 (83.2%) | 100.0 |
| 35 to 50 years | 333 (12.9%) | 17.0 |
| Total | 2,592 (100.0%) | 54.0 |
Fertility by Age by Marriage Status in Amarillo
69.9% of women with births (2,592) in Amarillo are married. The highest percentage of unmarried women with births falls into 15 to 19 years age bracket with 100.0% of them unmarried at the time of birth, while the lowest percentage of unmarried women with births belong to 35 to 50 years age bracket with 15.9% of them unmarried.
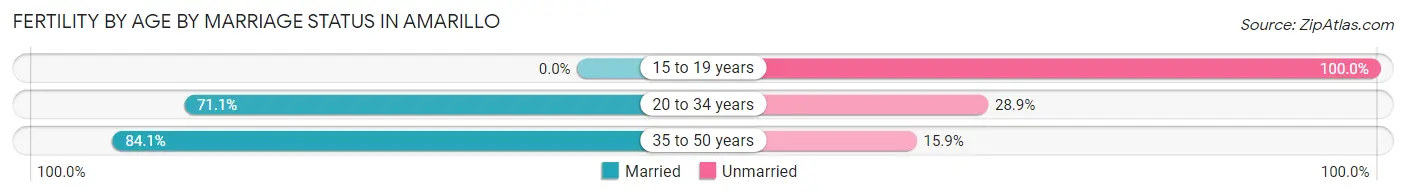
| Age Bracket | Married | Unmarried |
| 15 to 19 years | 0 (0.0%) | 102 (100.0%) |
| 20 to 34 years | 1,534 (71.1%) | 623 (28.9%) |
| 35 to 50 years | 280 (84.1%) | 53 (15.9%) |
| Total | 1,812 (69.9%) | 780 (30.1%) |
Fertility by Education in Amarillo
Average fertility rate in Amarillo is 54.0 births per 1,000 women. Women with the education attainment of graduate degree have the highest fertility rate of 80.0 births per 1,000 women, while women with the education attainment of bachelor's degree have the lowest fertility at 39.0 births per 1,000 women. Women with the education attainment of college or associate's degree represent 35.9% of all women with births.
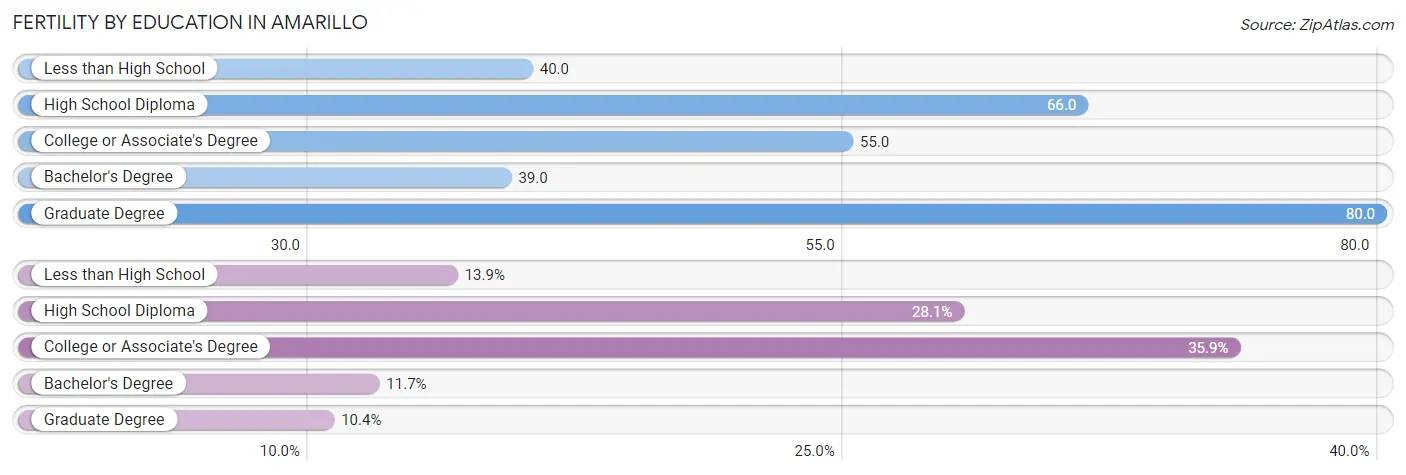
| Educational Attainment | Women with Births | Births / 1,000 Women |
| Less than High School | 360 (13.9%) | 40.0 |
| High School Diploma | 729 (28.1%) | 66.0 |
| College or Associate's Degree | 930 (35.9%) | 55.0 |
| Bachelor's Degree | 303 (11.7%) | 39.0 |
| Graduate Degree | 270 (10.4%) | 80.0 |
| Total | 2,592 (100.0%) | 54.0 |
Fertility by Education by Marriage Status in Amarillo
30.1% of women with births in Amarillo are unmarried. Women with the educational attainment of graduate degree are most likely to be married with 100.0% of them married at childbirth, while women with the educational attainment of high school diploma are least likely to be married with 41.4% of them unmarried at childbirth.
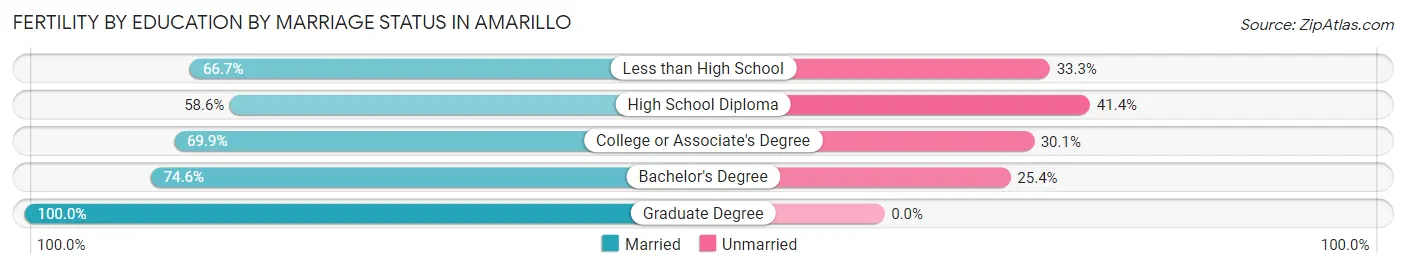
| Educational Attainment | Married | Unmarried |
| Less than High School | 240 (66.7%) | 120 (33.3%) |
| High School Diploma | 427 (58.6%) | 302 (41.4%) |
| College or Associate's Degree | 650 (69.9%) | 280 (30.1%) |
| Bachelor's Degree | 226 (74.6%) | 77 (25.4%) |
| Graduate Degree | 270 (100.0%) | 0 (0.0%) |
| Total | 1,812 (69.9%) | 780 (30.1%) |
Employment Characteristics in Amarillo
Employment by Class of Employer in Amarillo
Among the 95,986 employed individuals in Amarillo, private company employees (67,178 | 70.0%), local government employees (7,399 | 7.7%), and self-employed (not incorporated) (5,712 | 5.9%) make up the most common classes of employment.
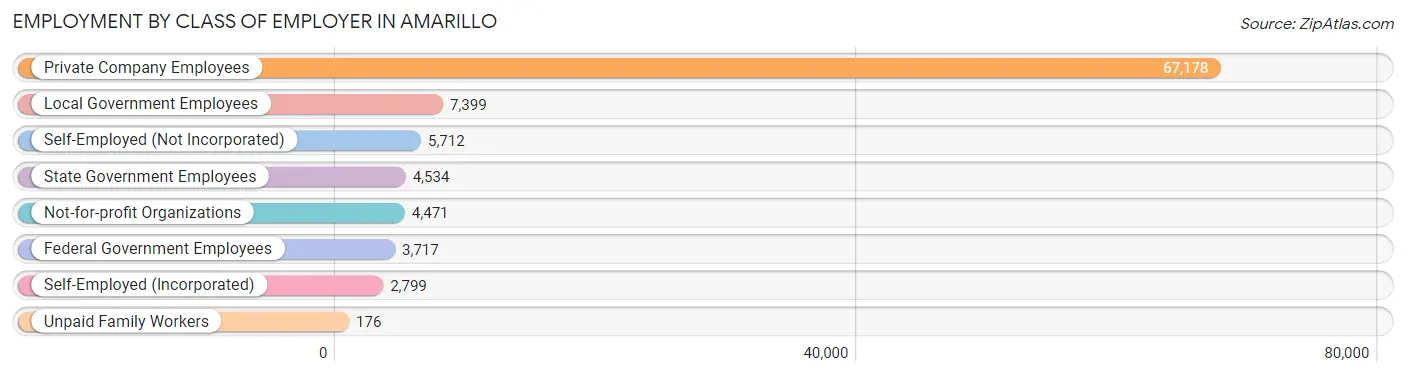
| Employer Class | # Employees | % Employees |
| Private Company Employees | 67,178 | 70.0% |
| Self-Employed (Incorporated) | 2,799 | 2.9% |
| Self-Employed (Not Incorporated) | 5,712 | 5.9% |
| Not-for-profit Organizations | 4,471 | 4.7% |
| Local Government Employees | 7,399 | 7.7% |
| State Government Employees | 4,534 | 4.7% |
| Federal Government Employees | 3,717 | 3.9% |
| Unpaid Family Workers | 176 | 0.2% |
| Total | 95,986 | 100.0% |
Employment Status by Age in Amarillo
According to the labor force statistics for Amarillo, out of the total population over 16 years of age (153,276), 65.6% or 100,549 individuals are in the labor force, with 3.5% or 3,519 of them unemployed. The age group with the highest labor force participation rate is 35 to 44 years, with 84.6% or 23,156 individuals in the labor force. Within the labor force, the 75 years and over age range has the highest percentage of unemployed individuals, with 6.9% or 61 of them being unemployed.
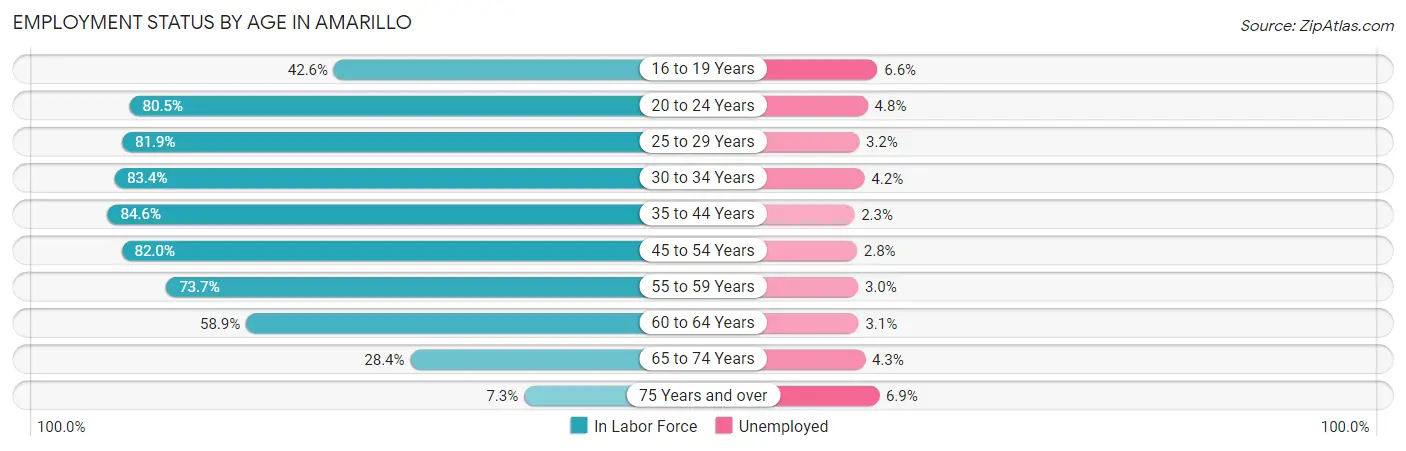
| Age Bracket | In Labor Force | Unemployed |
| 16 to 19 Years | 4,771 (42.6%) | 315 (6.6%) |
| 20 to 24 Years | 10,988 (80.5%) | 527 (4.8%) |
| 25 to 29 Years | 12,122 (81.9%) | 388 (3.2%) |
| 30 to 34 Years | 12,484 (83.4%) | 524 (4.2%) |
| 35 to 44 Years | 23,156 (84.6%) | 533 (2.3%) |
| 45 to 54 Years | 17,742 (82.0%) | 497 (2.8%) |
| 55 to 59 Years | 7,530 (73.7%) | 226 (3.0%) |
| 60 to 64 Years | 6,159 (58.9%) | 191 (3.1%) |
| 65 to 74 Years | 4,815 (28.4%) | 207 (4.3%) |
| 75 Years and over | 878 (7.3%) | 61 (6.9%) |
| Total | 100,549 (65.6%) | 3,519 (3.5%) |
Employment Status by Educational Attainment in Amarillo
According to labor force statistics for Amarillo, 79.6% of individuals (79,163) out of the total population between 25 and 64 years of age (99,451) are in the labor force, with 3.0% or 2,375 of them being unemployed. The group with the highest labor force participation rate are those with the educational attainment of bachelor's degree or higher, with 89.0% or 22,126 individuals in the labor force. Within the labor force, individuals with less than high school education have the highest percentage of unemployment, with 3.9% or 335 of them being unemployed.
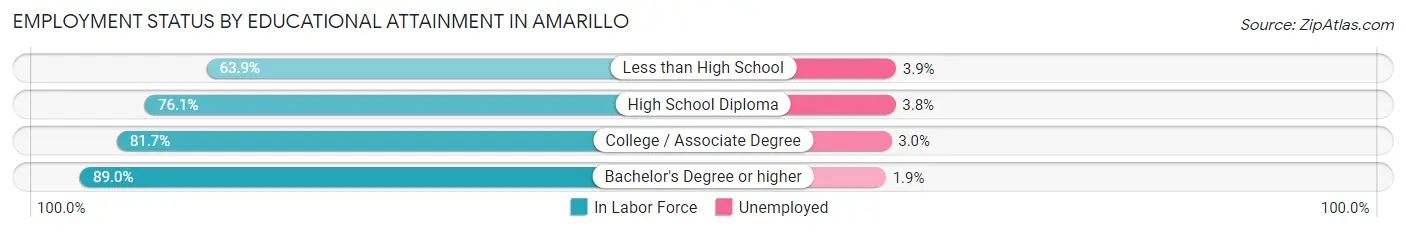
| Educational Attainment | In Labor Force | Unemployed |
| Less than High School | 8,596 (63.9%) | 525 (3.9%) |
| High School Diploma | 20,303 (76.1%) | 1,014 (3.8%) |
| College / Associate Degree | 28,151 (81.7%) | 1,034 (3.0%) |
| Bachelor's Degree or higher | 22,126 (89.0%) | 472 (1.9%) |
| Total | 79,163 (79.6%) | 2,984 (3.0%) |
Employment Occupations by Sex in Amarillo
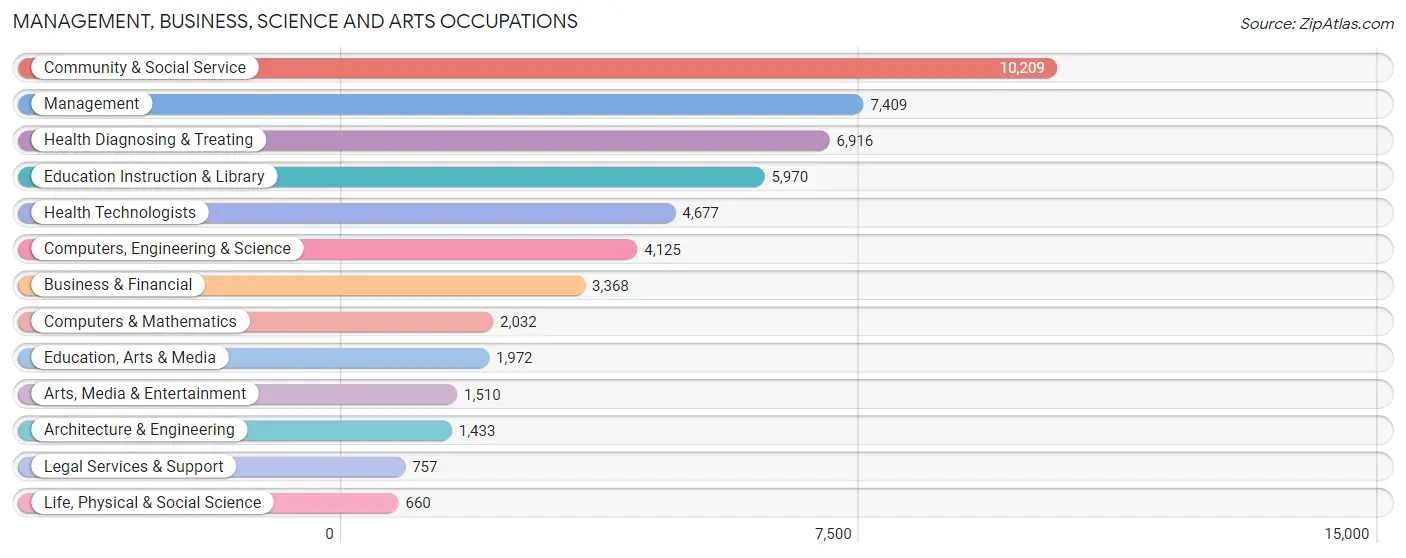
Management, Business, Science and Arts Occupations
The most common Management, Business, Science and Arts occupations in Amarillo are Community & Social Service (10,209 | 10.5%), Management (7,409 | 7.6%), Health Diagnosing & Treating (6,916 | 7.1%), Education Instruction & Library (5,970 | 6.2%), and Health Technologists (4,677 | 4.8%).
Management, Business, Science and Arts Occupations by Sex
Within the Management, Business, Science and Arts occupations in Amarillo, the most male-oriented occupations are Architecture & Engineering (92.2%), Computers, Engineering & Science (80.1%), and Computers & Mathematics (77.8%), while the most female-oriented occupations are Education Instruction & Library (75.6%), Legal Services & Support (74.8%), and Health Technologists (70.9%).
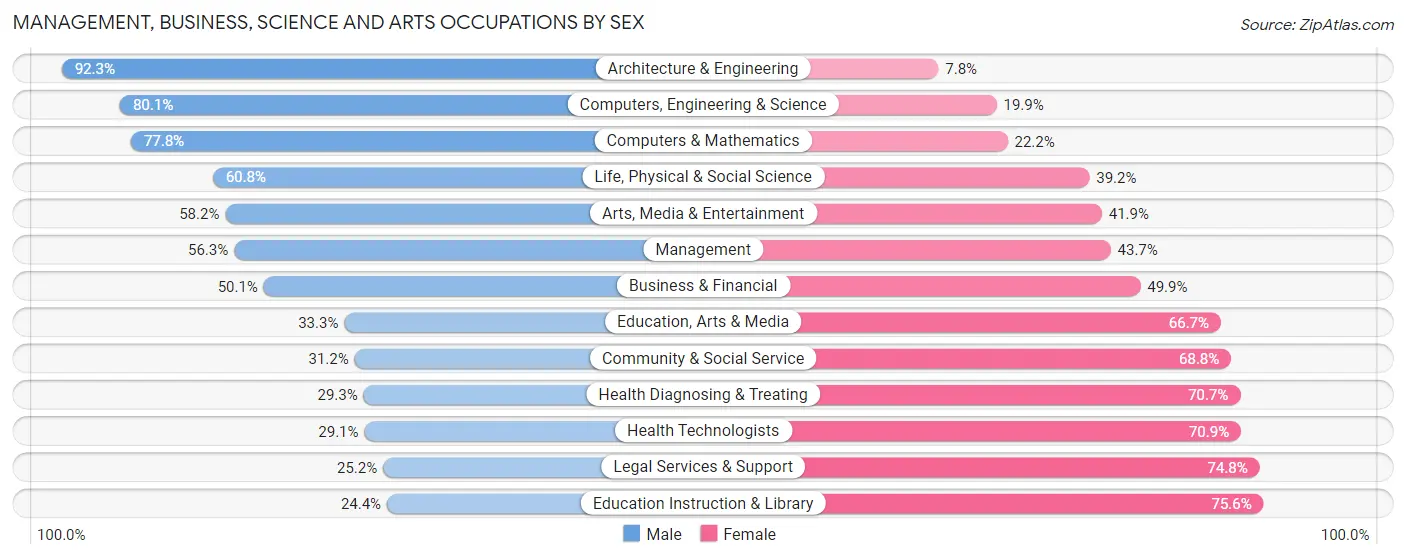
| Occupation | Male | Female |
| Management | 4,172 (56.3%) | 3,237 (43.7%) |
| Business & Financial | 1,688 (50.1%) | 1,680 (49.9%) |
| Computers, Engineering & Science | 3,304 (80.1%) | 821 (19.9%) |
| Computers & Mathematics | 1,581 (77.8%) | 451 (22.2%) |
| Architecture & Engineering | 1,322 (92.2%) | 111 (7.7%) |
| Life, Physical & Social Science | 401 (60.8%) | 259 (39.2%) |
| Community & Social Service | 3,183 (31.2%) | 7,026 (68.8%) |
| Education, Arts & Media | 657 (33.3%) | 1,315 (66.7%) |
| Legal Services & Support | 191 (25.2%) | 566 (74.8%) |
| Education Instruction & Library | 1,457 (24.4%) | 4,513 (75.6%) |
| Arts, Media & Entertainment | 878 (58.2%) | 632 (41.8%) |
| Health Diagnosing & Treating | 2,026 (29.3%) | 4,890 (70.7%) |
| Health Technologists | 1,362 (29.1%) | 3,315 (70.9%) |
| Total (Category) | 14,373 (44.9%) | 17,654 (55.1%) |
| Total (Overall) | 52,556 (54.2%) | 44,346 (45.8%) |
Services Occupations
The most common Services occupations in Amarillo are Food Preparation & Serving (6,947 | 7.2%), Cleaning & Maintenance (4,009 | 4.1%), Security & Protection (3,288 | 3.4%), Healthcare Support (2,632 | 2.7%), and Personal Care & Service (2,287 | 2.4%).

Services Occupations by Sex
Within the Services occupations in Amarillo, the most male-oriented occupations are Law Enforcement (83.1%), Security & Protection (82.2%), and Firefighting & Prevention (81.1%), while the most female-oriented occupations are Personal Care & Service (83.6%), Healthcare Support (83.3%), and Food Preparation & Serving (54.9%).
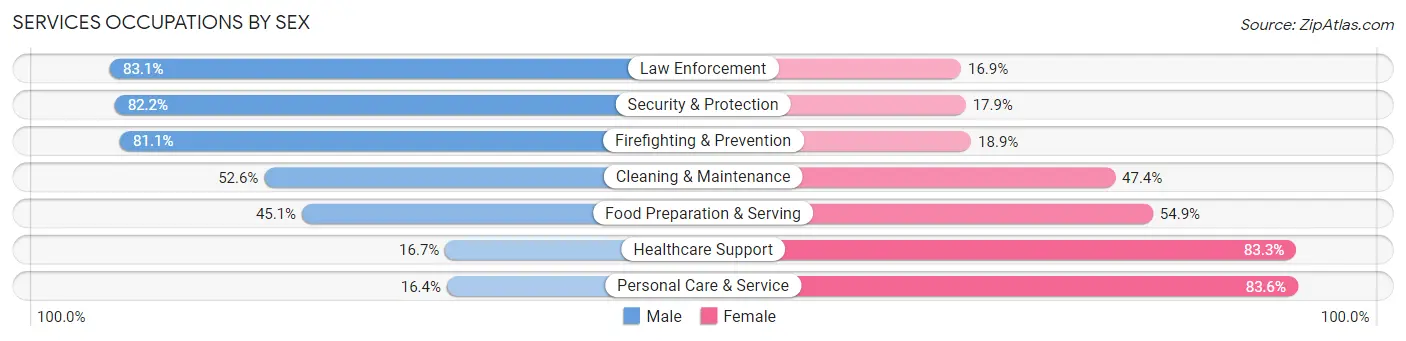
| Occupation | Male | Female |
| Healthcare Support | 440 (16.7%) | 2,192 (83.3%) |
| Security & Protection | 2,701 (82.2%) | 587 (17.8%) |
| Firefighting & Prevention | 1,229 (81.1%) | 287 (18.9%) |
| Law Enforcement | 1,472 (83.1%) | 300 (16.9%) |
| Food Preparation & Serving | 3,132 (45.1%) | 3,815 (54.9%) |
| Cleaning & Maintenance | 2,107 (52.6%) | 1,902 (47.4%) |
| Personal Care & Service | 375 (16.4%) | 1,912 (83.6%) |
| Total (Category) | 8,755 (45.7%) | 10,408 (54.3%) |
| Total (Overall) | 52,556 (54.2%) | 44,346 (45.8%) |
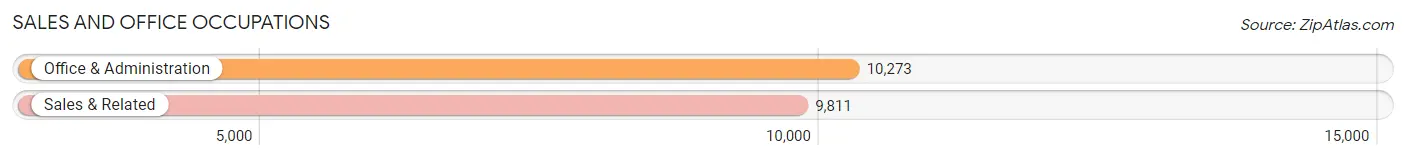
Sales and Office Occupations
The most common Sales and Office occupations in Amarillo are Office & Administration (10,273 | 10.6%), and Sales & Related (9,811 | 10.1%).
Sales and Office Occupations by Sex
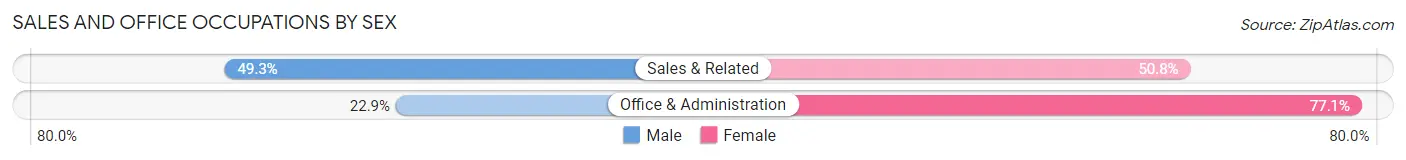
| Occupation | Male | Female |
| Sales & Related | 4,832 (49.2%) | 4,979 (50.7%) |
| Office & Administration | 2,350 (22.9%) | 7,923 (77.1%) |
| Total (Category) | 7,182 (35.8%) | 12,902 (64.2%) |
| Total (Overall) | 52,556 (54.2%) | 44,346 (45.8%) |
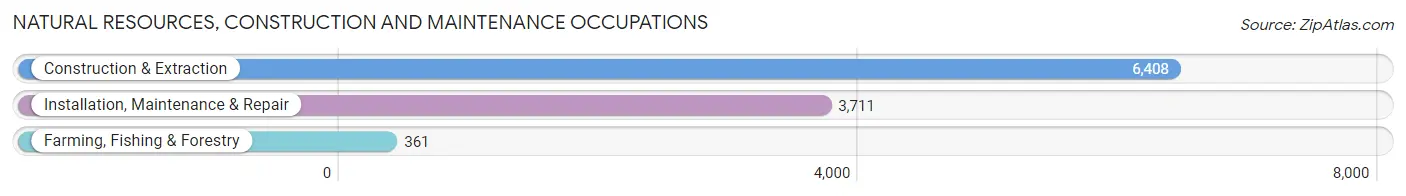
Natural Resources, Construction and Maintenance Occupations
The most common Natural Resources, Construction and Maintenance occupations in Amarillo are Construction & Extraction (6,408 | 6.6%), Installation, Maintenance & Repair (3,711 | 3.8%), and Farming, Fishing & Forestry (361 | 0.4%).
Natural Resources, Construction and Maintenance Occupations by Sex
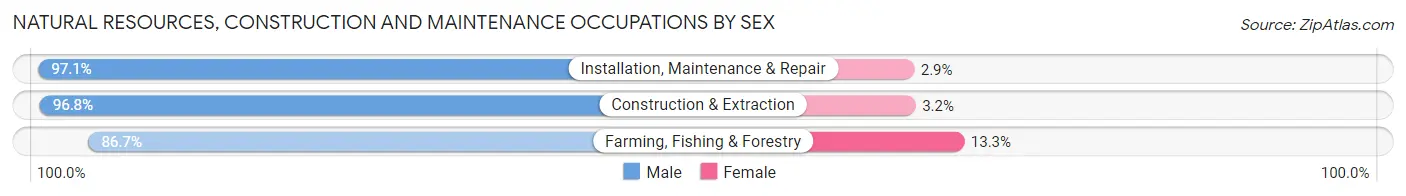
| Occupation | Male | Female |
| Farming, Fishing & Forestry | 313 (86.7%) | 48 (13.3%) |
| Construction & Extraction | 6,204 (96.8%) | 204 (3.2%) |
| Installation, Maintenance & Repair | 3,604 (97.1%) | 107 (2.9%) |
| Total (Category) | 10,121 (96.6%) | 359 (3.4%) |
| Total (Overall) | 52,556 (54.2%) | 44,346 (45.8%) |
Production, Transportation and Moving Occupations
The most common Production, Transportation and Moving occupations in Amarillo are Production (6,478 | 6.7%), Transportation (4,907 | 5.1%), and Material Moving (3,763 | 3.9%).
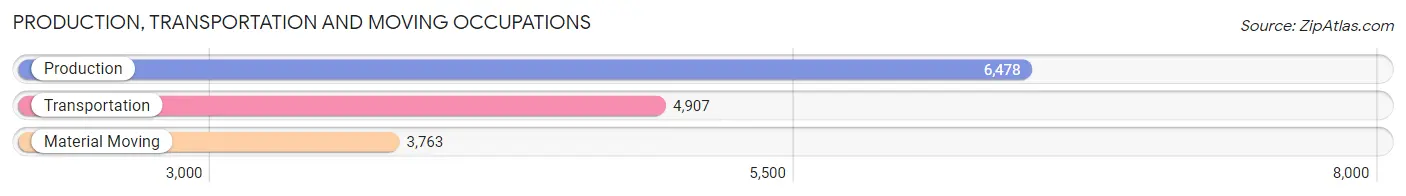
Production, Transportation and Moving Occupations by Sex
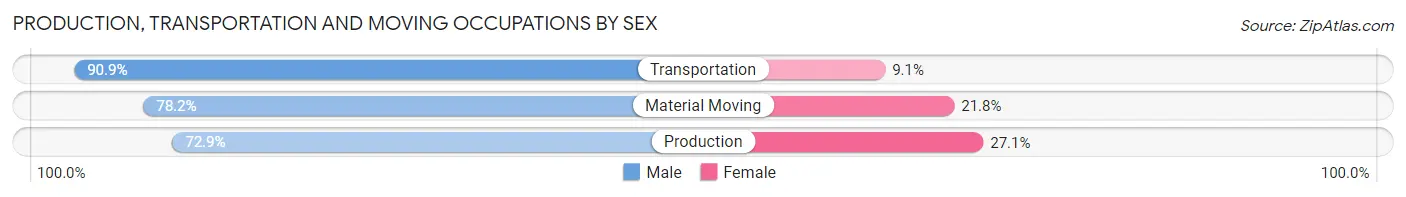
| Occupation | Male | Female |
| Production | 4,722 (72.9%) | 1,756 (27.1%) |
| Transportation | 4,460 (90.9%) | 447 (9.1%) |
| Material Moving | 2,943 (78.2%) | 820 (21.8%) |
| Total (Category) | 12,125 (80.0%) | 3,023 (20.0%) |
| Total (Overall) | 52,556 (54.2%) | 44,346 (45.8%) |
Employment Industries by Sex in Amarillo
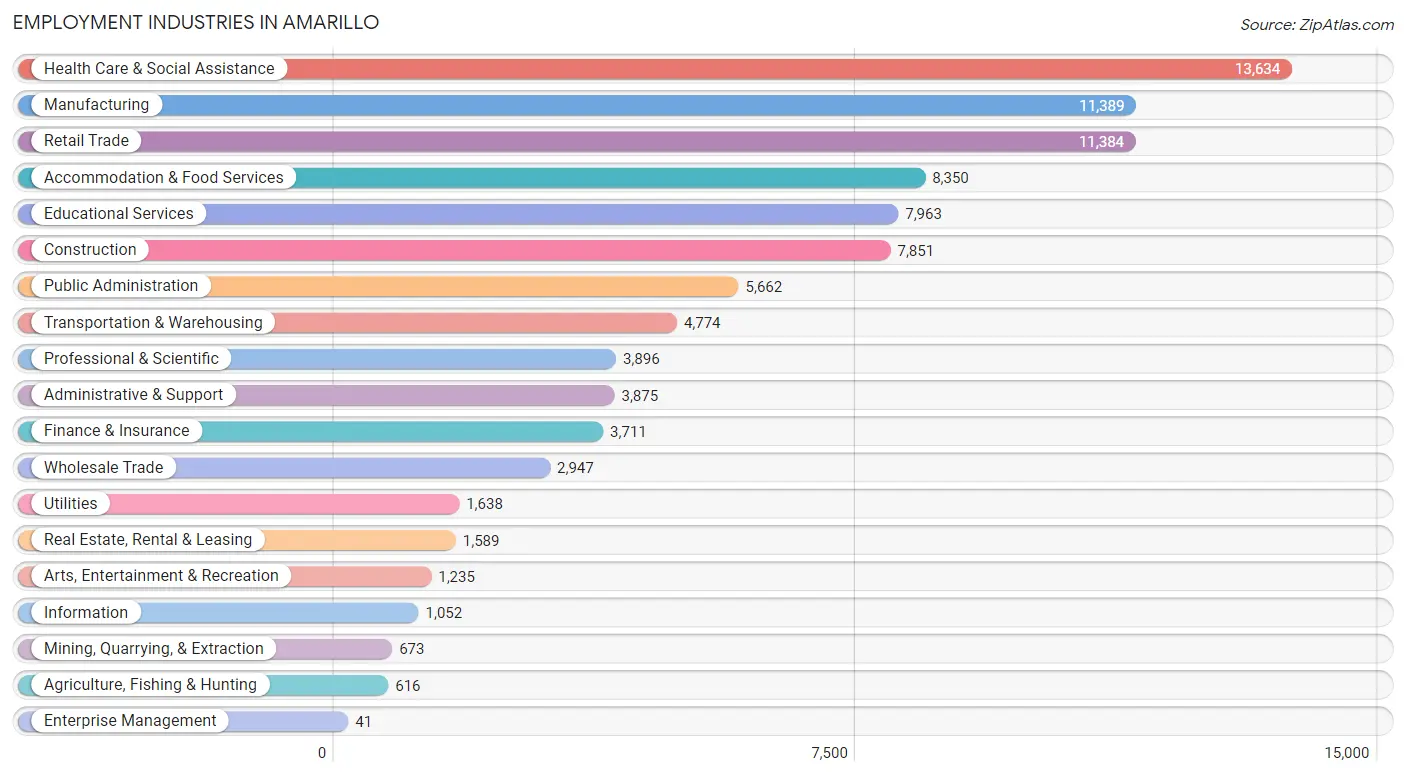
Employment Industries in Amarillo
The major employment industries in Amarillo include Health Care & Social Assistance (13,634 | 14.1%), Manufacturing (11,389 | 11.7%), Retail Trade (11,384 | 11.7%), Accommodation & Food Services (8,350 | 8.6%), and Educational Services (7,963 | 8.2%).
Employment Industries by Sex in Amarillo
The Amarillo industries that see more men than women are Construction (90.8%), Mining, Quarrying, & Extraction (86.8%), and Transportation & Warehousing (86.4%), whereas the industries that tend to have a higher number of women are Health Care & Social Assistance (77.3%), Educational Services (73.1%), and Finance & Insurance (68.3%).
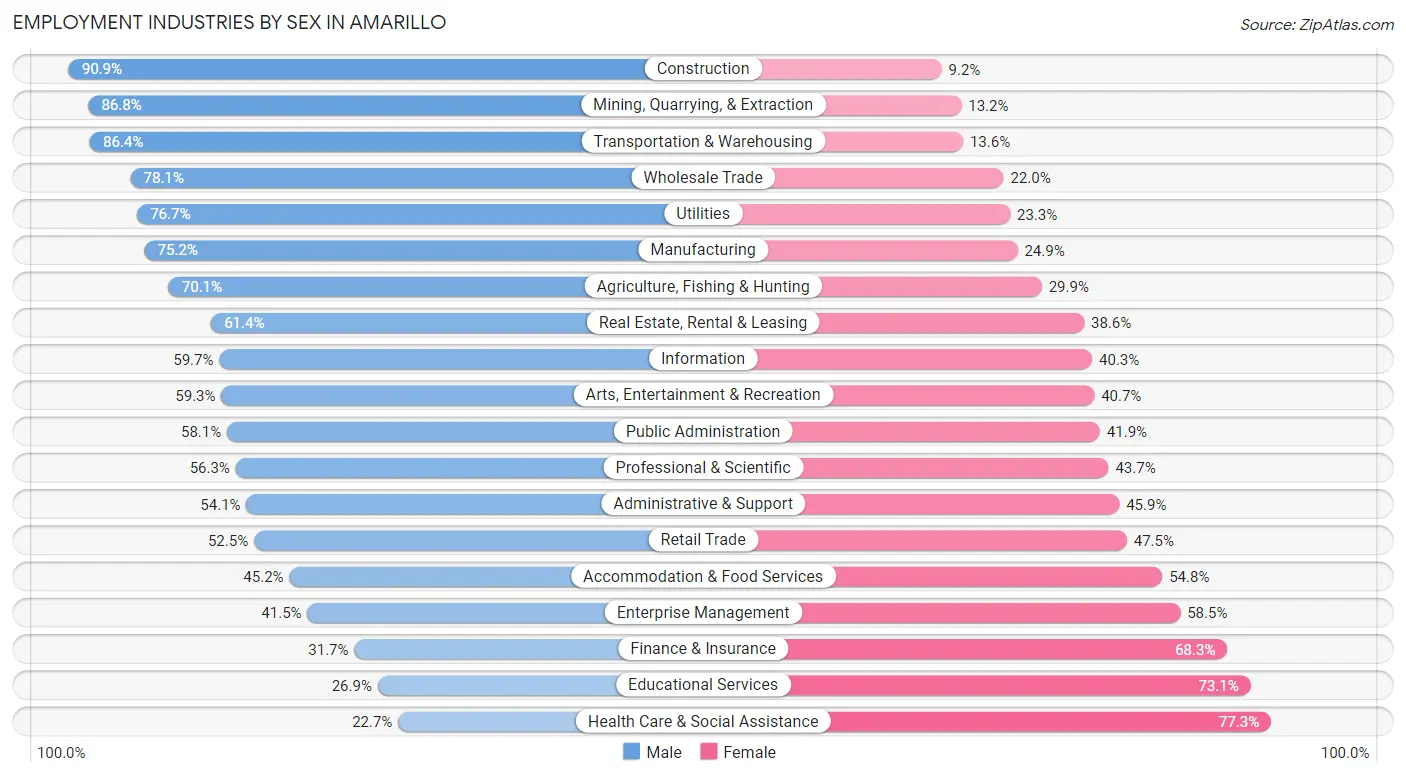
| Industry | Male | Female |
| Agriculture, Fishing & Hunting | 432 (70.1%) | 184 (29.9%) |
| Mining, Quarrying, & Extraction | 584 (86.8%) | 89 (13.2%) |
| Construction | 7,133 (90.8%) | 718 (9.1%) |
| Manufacturing | 8,559 (75.1%) | 2,830 (24.8%) |
| Wholesale Trade | 2,300 (78.0%) | 647 (22.0%) |
| Retail Trade | 5,979 (52.5%) | 5,405 (47.5%) |
| Transportation & Warehousing | 4,126 (86.4%) | 648 (13.6%) |
| Utilities | 1,256 (76.7%) | 382 (23.3%) |
| Information | 628 (59.7%) | 424 (40.3%) |
| Finance & Insurance | 1,178 (31.7%) | 2,533 (68.3%) |
| Real Estate, Rental & Leasing | 975 (61.4%) | 614 (38.6%) |
| Professional & Scientific | 2,194 (56.3%) | 1,702 (43.7%) |
| Enterprise Management | 17 (41.5%) | 24 (58.5%) |
| Administrative & Support | 2,096 (54.1%) | 1,779 (45.9%) |
| Educational Services | 2,143 (26.9%) | 5,820 (73.1%) |
| Health Care & Social Assistance | 3,091 (22.7%) | 10,543 (77.3%) |
| Arts, Entertainment & Recreation | 732 (59.3%) | 503 (40.7%) |
| Accommodation & Food Services | 3,773 (45.2%) | 4,577 (54.8%) |
| Public Administration | 3,289 (58.1%) | 2,373 (41.9%) |
| Total | 52,556 (54.2%) | 44,346 (45.8%) |
Education in Amarillo
School Enrollment in Amarillo
The most common levels of schooling among the 51,930 students in Amarillo are elementary school (12,262 | 23.6%), high school (11,408 | 22.0%), and middle school (11,224 | 21.6%).
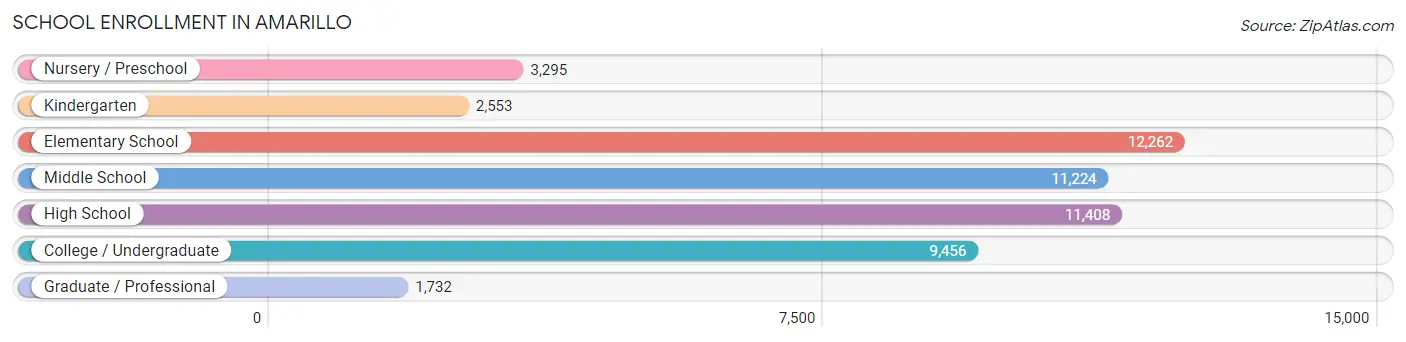
| School Level | # Students | % Students |
| Nursery / Preschool | 3,295 | 6.4% |
| Kindergarten | 2,553 | 4.9% |
| Elementary School | 12,262 | 23.6% |
| Middle School | 11,224 | 21.6% |
| High School | 11,408 | 22.0% |
| College / Undergraduate | 9,456 | 18.2% |
| Graduate / Professional | 1,732 | 3.3% |
| Total | 51,930 | 100.0% |
School Enrollment by Age by Funding Source in Amarillo
Out of a total of 51,930 students who are enrolled in schools in Amarillo, 3,947 (7.6%) attend a private institution, while the remaining 47,983 (92.4%) are enrolled in public schools. The age group of 3 to 4 year olds has the highest likelihood of being enrolled in private schools, with 790 (30.9% in the age bracket) enrolled. Conversely, the age group of 15 to 17 year olds has the lowest likelihood of being enrolled in a private school, with 7,933 (96.1% in the age bracket) attending a public institution.
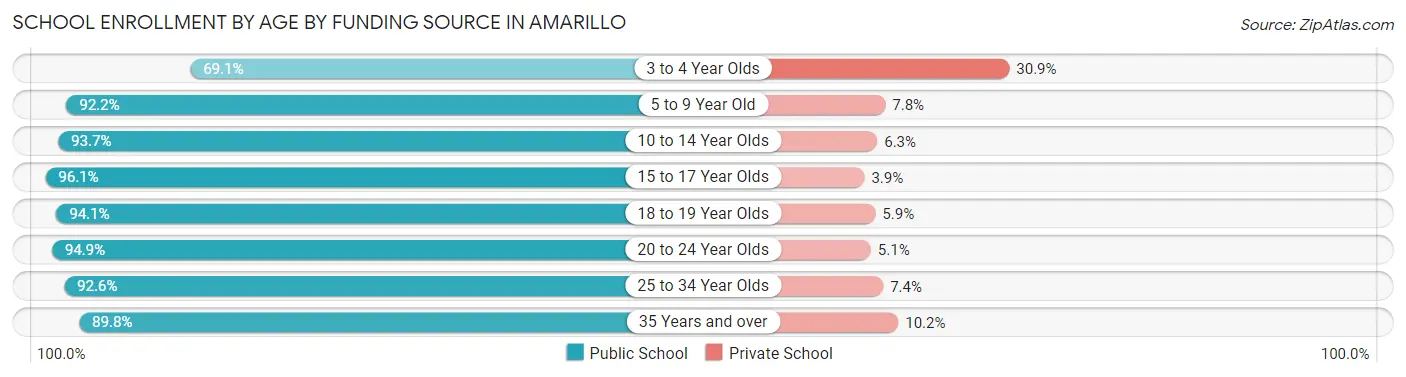
| Age Bracket | Public School | Private School |
| 3 to 4 Year Olds | 1,770 (69.1%) | 790 (30.9%) |
| 5 to 9 Year Old | 12,824 (92.2%) | 1,081 (7.8%) |
| 10 to 14 Year Olds | 13,278 (93.7%) | 886 (6.3%) |
| 15 to 17 Year Olds | 7,933 (96.1%) | 319 (3.9%) |
| 18 to 19 Year Olds | 3,106 (94.1%) | 195 (5.9%) |
| 20 to 24 Year Olds | 4,043 (94.9%) | 216 (5.1%) |
| 25 to 34 Year Olds | 3,408 (92.6%) | 271 (7.4%) |
| 35 Years and over | 1,626 (89.8%) | 184 (10.2%) |
| Total | 47,983 (92.4%) | 3,947 (7.6%) |
Educational Attainment by Field of Study in Amarillo
Business (6,424 | 18.8%), education (5,808 | 17.0%), science & technology (4,177 | 12.2%), bio, nature & agricultural (2,809 | 8.2%), and arts & humanities (2,754 | 8.1%) are the most common fields of study among 34,169 individuals in Amarillo who have obtained a bachelor's degree or higher.
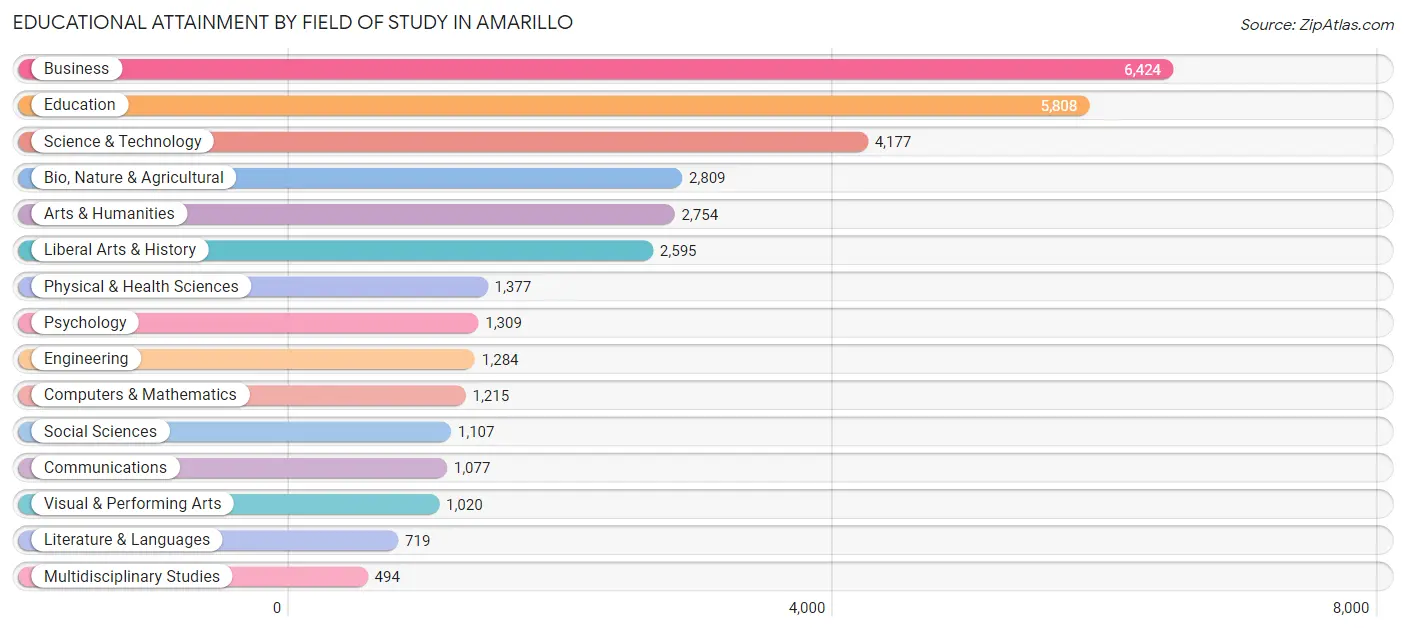
| Field of Study | # Graduates | % Graduates |
| Computers & Mathematics | 1,215 | 3.6% |
| Bio, Nature & Agricultural | 2,809 | 8.2% |
| Physical & Health Sciences | 1,377 | 4.0% |
| Psychology | 1,309 | 3.8% |
| Social Sciences | 1,107 | 3.2% |
| Engineering | 1,284 | 3.8% |
| Multidisciplinary Studies | 494 | 1.5% |
| Science & Technology | 4,177 | 12.2% |
| Business | 6,424 | 18.8% |
| Education | 5,808 | 17.0% |
| Literature & Languages | 719 | 2.1% |
| Liberal Arts & History | 2,595 | 7.6% |
| Visual & Performing Arts | 1,020 | 3.0% |
| Communications | 1,077 | 3.2% |
| Arts & Humanities | 2,754 | 8.1% |
| Total | 34,169 | 100.0% |
Transportation & Commute in Amarillo
Vehicle Availability by Sex in Amarillo
The most prevalent vehicle ownership categories in Amarillo are males with 2 vehicles (23,204, accounting for 44.4%) and females with 2 vehicles (17,640, making up 53.3%).
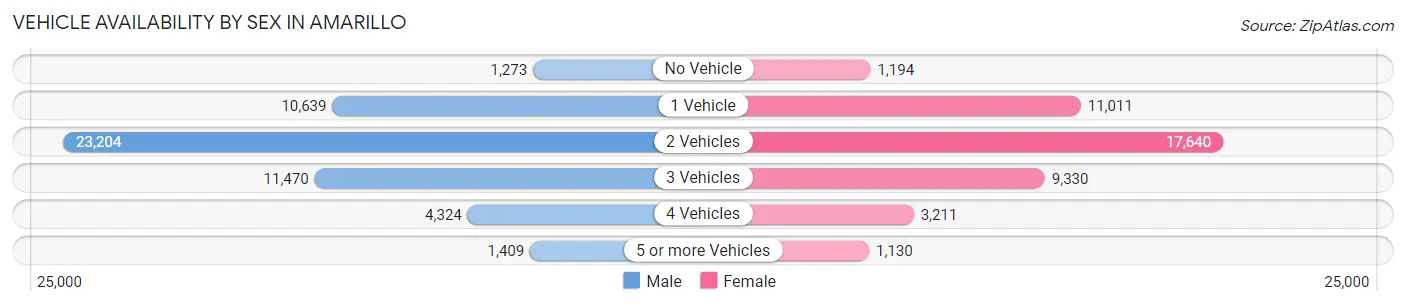
| Vehicles Available | Male | Female |
| No Vehicle | 1,273 (2.4%) | 1,194 (2.7%) |
| 1 Vehicle | 10,639 (20.3%) | 11,011 (25.3%) |
| 2 Vehicles | 23,204 (44.4%) | 17,640 (40.5%) |
| 3 Vehicles | 11,470 (21.9%) | 9,330 (21.4%) |
| 4 Vehicles | 4,324 (8.3%) | 3,211 (7.4%) |
| 5 or more Vehicles | 1,409 (2.7%) | 1,130 (2.6%) |
| Total | 52,319 (100.0%) | 43,516 (100.0%) |
Commute Time in Amarillo
The most frequently occuring commute durations in Amarillo are 15 to 19 minutes (27,831 commuters, 30.5%), 10 to 14 minutes (20,180 commuters, 22.1%), and 20 to 24 minutes (13,976 commuters, 15.3%).
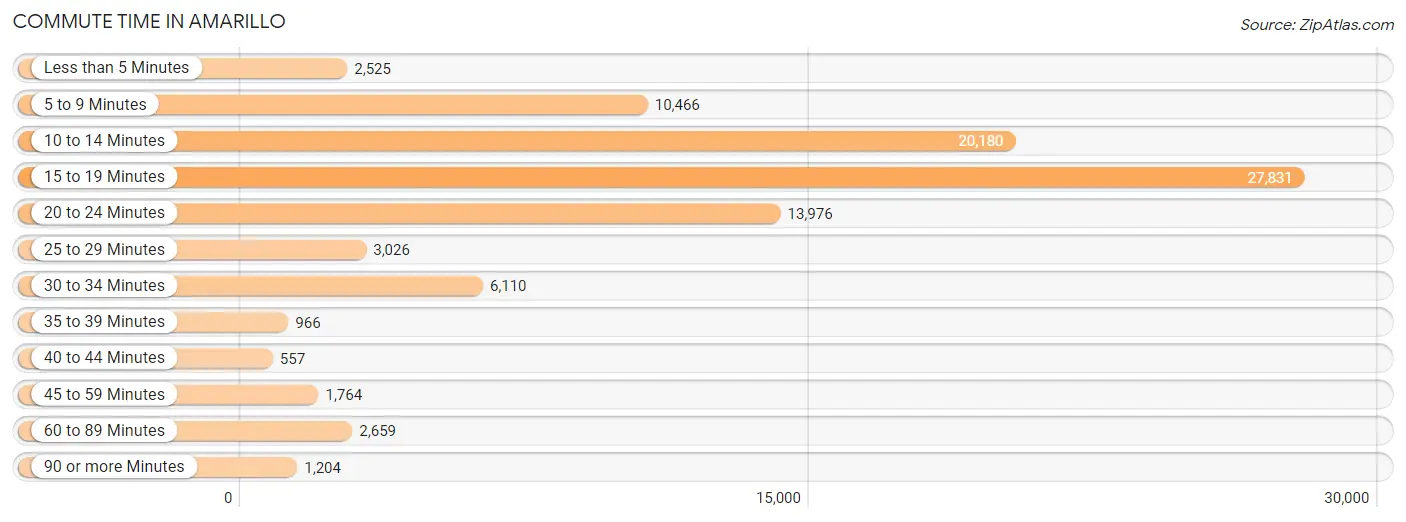
| Commute Time | # Commuters | % Commuters |
| Less than 5 Minutes | 2,525 | 2.8% |
| 5 to 9 Minutes | 10,466 | 11.5% |
| 10 to 14 Minutes | 20,180 | 22.1% |
| 15 to 19 Minutes | 27,831 | 30.5% |
| 20 to 24 Minutes | 13,976 | 15.3% |
| 25 to 29 Minutes | 3,026 | 3.3% |
| 30 to 34 Minutes | 6,110 | 6.7% |
| 35 to 39 Minutes | 966 | 1.1% |
| 40 to 44 Minutes | 557 | 0.6% |
| 45 to 59 Minutes | 1,764 | 1.9% |
| 60 to 89 Minutes | 2,659 | 2.9% |
| 90 or more Minutes | 1,204 | 1.3% |
Commute Time by Sex in Amarillo
The most common commute times in Amarillo are 15 to 19 minutes (14,906 commuters, 29.7%) for males and 15 to 19 minutes (12,925 commuters, 31.4%) for females.
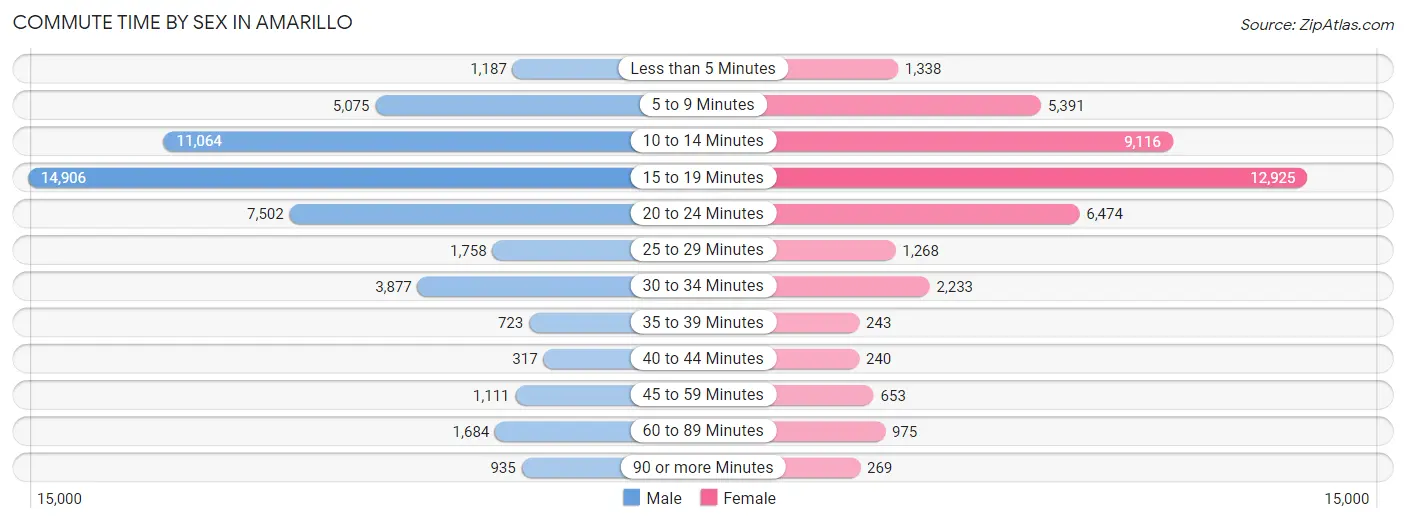
| Commute Time | Male | Female |
| Less than 5 Minutes | 1,187 (2.4%) | 1,338 (3.3%) |
| 5 to 9 Minutes | 5,075 (10.1%) | 5,391 (13.1%) |
| 10 to 14 Minutes | 11,064 (22.1%) | 9,116 (22.2%) |
| 15 to 19 Minutes | 14,906 (29.7%) | 12,925 (31.4%) |
| 20 to 24 Minutes | 7,502 (15.0%) | 6,474 (15.7%) |
| 25 to 29 Minutes | 1,758 (3.5%) | 1,268 (3.1%) |
| 30 to 34 Minutes | 3,877 (7.7%) | 2,233 (5.4%) |
| 35 to 39 Minutes | 723 (1.4%) | 243 (0.6%) |
| 40 to 44 Minutes | 317 (0.6%) | 240 (0.6%) |
| 45 to 59 Minutes | 1,111 (2.2%) | 653 (1.6%) |
| 60 to 89 Minutes | 1,684 (3.4%) | 975 (2.4%) |
| 90 or more Minutes | 935 (1.9%) | 269 (0.6%) |
Time of Departure to Work by Sex in Amarillo
The most frequent times of departure to work in Amarillo are 7:00 AM to 7:29 AM (9,156, 18.3%) for males and 7:30 AM to 7:59 AM (7,779, 18.9%) for females.
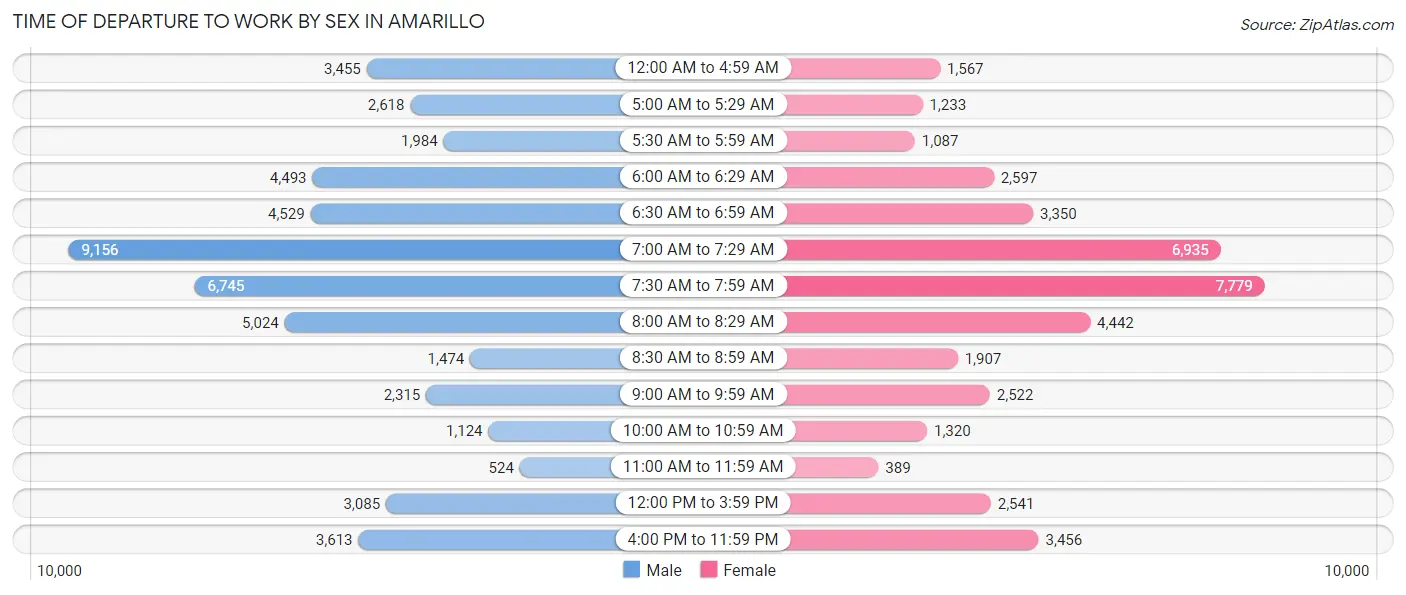
| Time of Departure | Male | Female |
| 12:00 AM to 4:59 AM | 3,455 (6.9%) | 1,567 (3.8%) |
| 5:00 AM to 5:29 AM | 2,618 (5.2%) | 1,233 (3.0%) |
| 5:30 AM to 5:59 AM | 1,984 (4.0%) | 1,087 (2.6%) |
| 6:00 AM to 6:29 AM | 4,493 (9.0%) | 2,597 (6.3%) |
| 6:30 AM to 6:59 AM | 4,529 (9.0%) | 3,350 (8.2%) |
| 7:00 AM to 7:29 AM | 9,156 (18.3%) | 6,935 (16.9%) |
| 7:30 AM to 7:59 AM | 6,745 (13.5%) | 7,779 (18.9%) |
| 8:00 AM to 8:29 AM | 5,024 (10.0%) | 4,442 (10.8%) |
| 8:30 AM to 8:59 AM | 1,474 (2.9%) | 1,907 (4.6%) |
| 9:00 AM to 9:59 AM | 2,315 (4.6%) | 2,522 (6.1%) |
| 10:00 AM to 10:59 AM | 1,124 (2.2%) | 1,320 (3.2%) |
| 11:00 AM to 11:59 AM | 524 (1.1%) | 389 (0.9%) |
| 12:00 PM to 3:59 PM | 3,085 (6.1%) | 2,541 (6.2%) |
| 4:00 PM to 11:59 PM | 3,613 (7.2%) | 3,456 (8.4%) |
| Total | 50,139 (100.0%) | 41,125 (100.0%) |
Housing Occupancy in Amarillo
Occupancy by Ownership in Amarillo
Of the total 78,616 dwellings in Amarillo, owner-occupied units account for 46,840 (59.6%), while renter-occupied units make up 31,776 (40.4%).
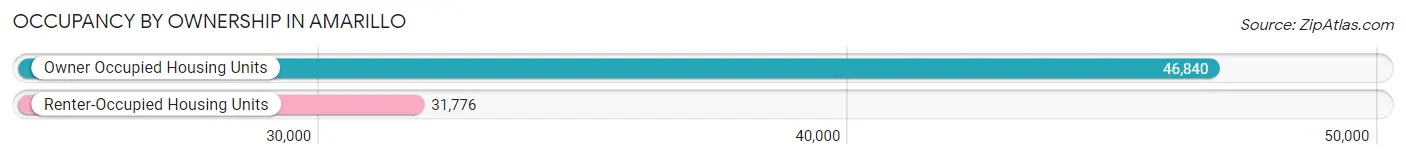
| Occupancy | # Housing Units | % Housing Units |
| Owner Occupied Housing Units | 46,840 | 59.6% |
| Renter-Occupied Housing Units | 31,776 | 40.4% |
| Total Occupied Housing Units | 78,616 | 100.0% |
Occupancy by Household Size in Amarillo
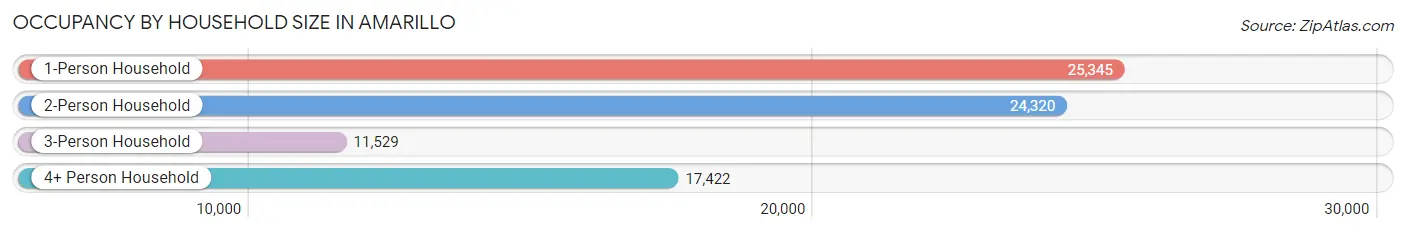
| Household Size | # Housing Units | % Housing Units |
| 1-Person Household | 25,345 | 32.2% |
| 2-Person Household | 24,320 | 30.9% |
| 3-Person Household | 11,529 | 14.7% |
| 4+ Person Household | 17,422 | 22.2% |
| Total Housing Units | 78,616 | 100.0% |
Occupancy by Ownership by Household Size in Amarillo
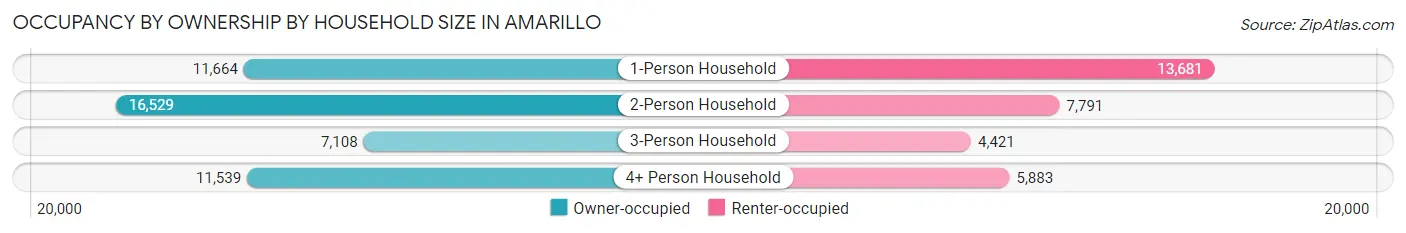
| Household Size | Owner-occupied | Renter-occupied |
| 1-Person Household | 11,664 (46.0%) | 13,681 (54.0%) |
| 2-Person Household | 16,529 (68.0%) | 7,791 (32.0%) |
| 3-Person Household | 7,108 (61.7%) | 4,421 (38.4%) |
| 4+ Person Household | 11,539 (66.2%) | 5,883 (33.8%) |
| Total Housing Units | 46,840 (59.6%) | 31,776 (40.4%) |
Occupancy by Educational Attainment in Amarillo
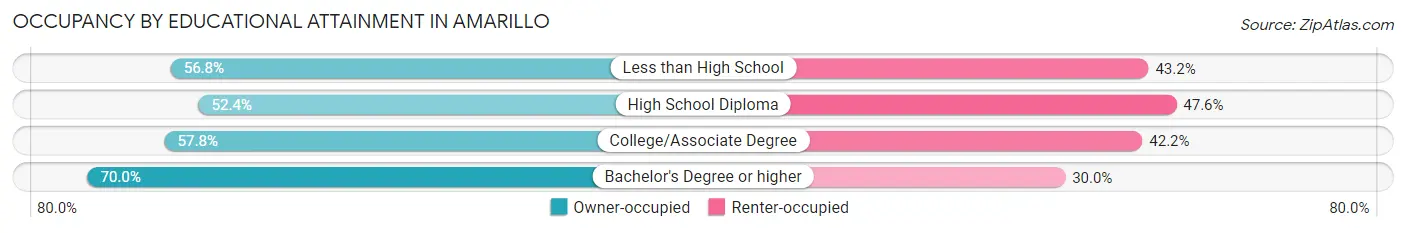
| Household Size | Owner-occupied | Renter-occupied |
| Less than High School | 5,284 (56.8%) | 4,017 (43.2%) |
| High School Diploma | 10,145 (52.4%) | 9,221 (47.6%) |
| College/Associate Degree | 16,818 (57.8%) | 12,289 (42.2%) |
| Bachelor's Degree or higher | 14,593 (70.0%) | 6,249 (30.0%) |
Occupancy by Age of Householder in Amarillo
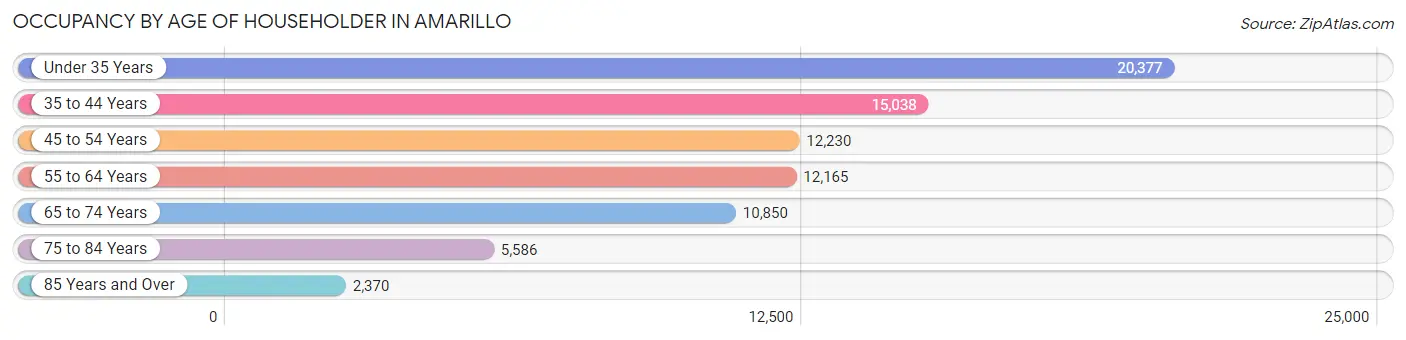
| Age Bracket | # Households | % Households |
| Under 35 Years | 20,377 | 25.9% |
| 35 to 44 Years | 15,038 | 19.1% |
| 45 to 54 Years | 12,230 | 15.6% |
| 55 to 64 Years | 12,165 | 15.5% |
| 65 to 74 Years | 10,850 | 13.8% |
| 75 to 84 Years | 5,586 | 7.1% |
| 85 Years and Over | 2,370 | 3.0% |
| Total | 78,616 | 100.0% |
Housing Finances in Amarillo
Median Income by Occupancy in Amarillo
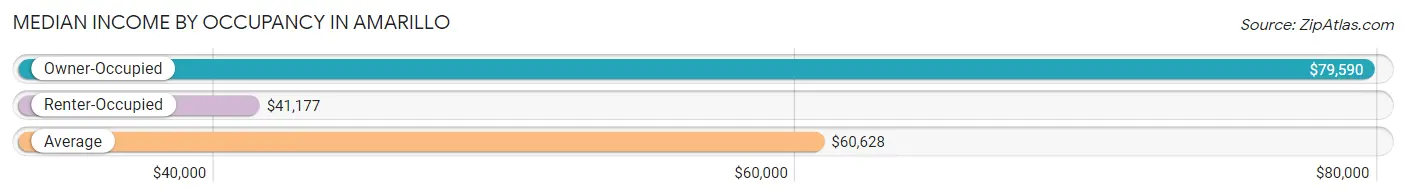
| Occupancy Type | # Households | Median Income |
| Owner-Occupied | 46,840 (59.6%) | $79,590 |
| Renter-Occupied | 31,776 (40.4%) | $41,177 |
| Average | 78,616 (100.0%) | $60,628 |
Occupancy by Householder Income Bracket in Amarillo
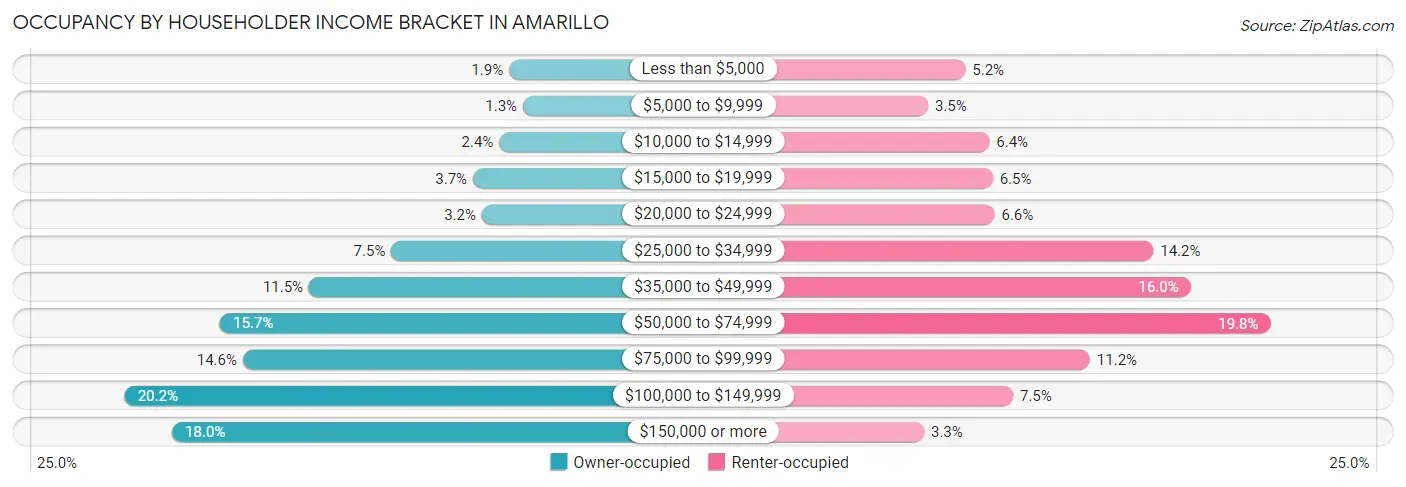
| Income Bracket | Owner-occupied | Renter-occupied |
| Less than $5,000 | 904 (1.9%) | 1,663 (5.2%) |
| $5,000 to $9,999 | 597 (1.3%) | 1,097 (3.5%) |
| $10,000 to $14,999 | 1,126 (2.4%) | 2,024 (6.4%) |
| $15,000 to $19,999 | 1,709 (3.6%) | 2,074 (6.5%) |
| $20,000 to $24,999 | 1,514 (3.2%) | 2,102 (6.6%) |
| $25,000 to $34,999 | 3,530 (7.5%) | 4,506 (14.2%) |
| $35,000 to $49,999 | 5,370 (11.5%) | 5,068 (16.0%) |
| $50,000 to $74,999 | 7,347 (15.7%) | 6,277 (19.8%) |
| $75,000 to $99,999 | 6,845 (14.6%) | 3,546 (11.2%) |
| $100,000 to $149,999 | 9,477 (20.2%) | 2,383 (7.5%) |
| $150,000 or more | 8,421 (18.0%) | 1,036 (3.3%) |
| Total | 46,840 (100.0%) | 31,776 (100.0%) |
Monthly Housing Cost Tiers in Amarillo
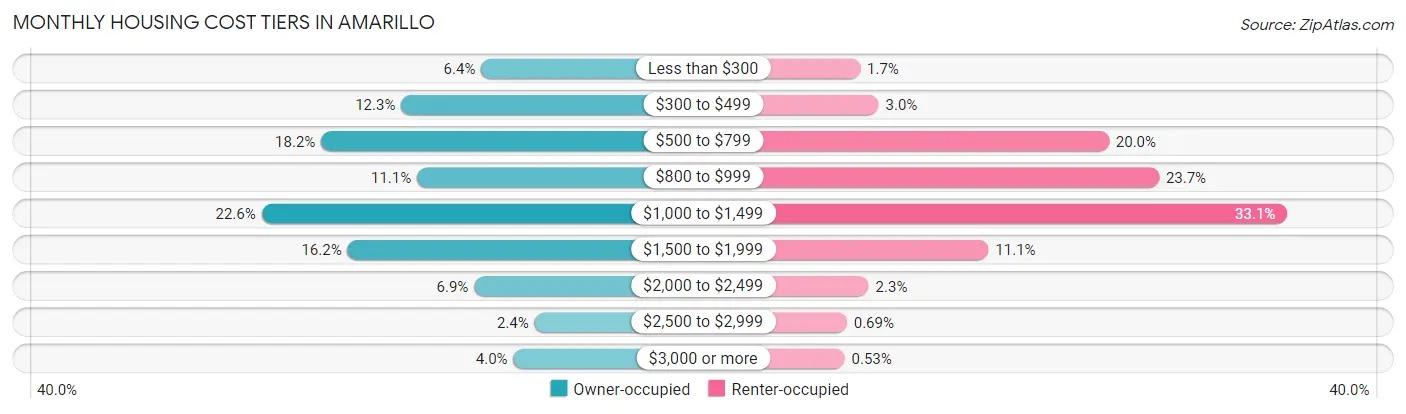
| Monthly Cost | Owner-occupied | Renter-occupied |
| Less than $300 | 2,985 (6.4%) | 530 (1.7%) |
| $300 to $499 | 5,742 (12.3%) | 962 (3.0%) |
| $500 to $799 | 8,506 (18.2%) | 6,353 (20.0%) |
| $800 to $999 | 5,201 (11.1%) | 7,526 (23.7%) |
| $1,000 to $1,499 | 10,564 (22.6%) | 10,524 (33.1%) |
| $1,500 to $1,999 | 7,598 (16.2%) | 3,535 (11.1%) |
| $2,000 to $2,499 | 3,228 (6.9%) | 730 (2.3%) |
| $2,500 to $2,999 | 1,144 (2.4%) | 218 (0.7%) |
| $3,000 or more | 1,872 (4.0%) | 169 (0.5%) |
| Total | 46,840 (100.0%) | 31,776 (100.0%) |
Physical Housing Characteristics in Amarillo
Housing Structures in Amarillo
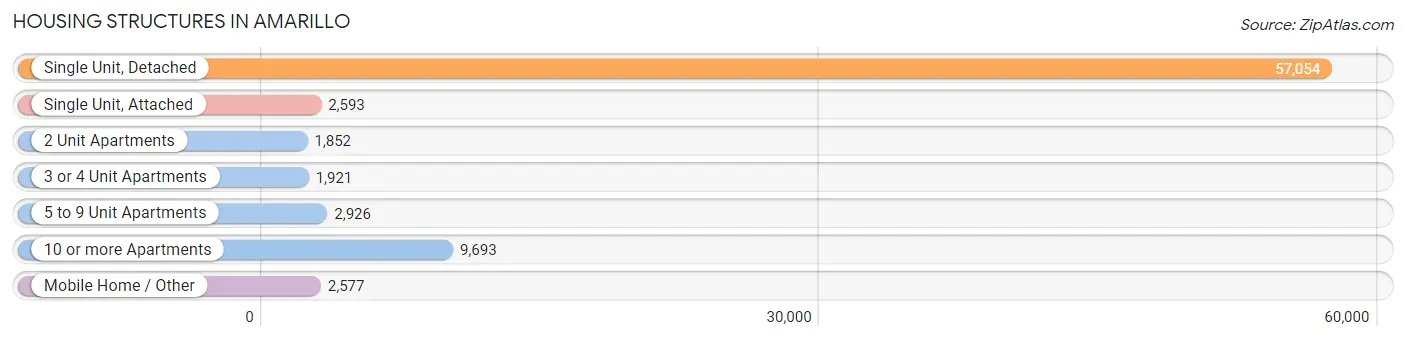
| Structure Type | # Housing Units | % Housing Units |
| Single Unit, Detached | 57,054 | 72.6% |
| Single Unit, Attached | 2,593 | 3.3% |
| 2 Unit Apartments | 1,852 | 2.4% |
| 3 or 4 Unit Apartments | 1,921 | 2.4% |
| 5 to 9 Unit Apartments | 2,926 | 3.7% |
| 10 or more Apartments | 9,693 | 12.3% |
| Mobile Home / Other | 2,577 | 3.3% |
| Total | 78,616 | 100.0% |
Housing Structures by Occupancy in Amarillo
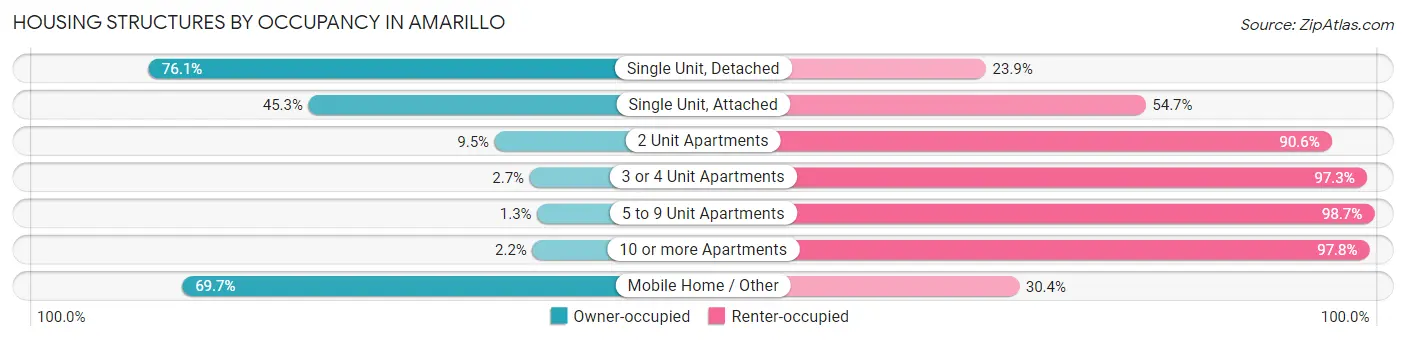
| Structure Type | Owner-occupied | Renter-occupied |
| Single Unit, Detached | 43,397 (76.1%) | 13,657 (23.9%) |
| Single Unit, Attached | 1,174 (45.3%) | 1,419 (54.7%) |
| 2 Unit Apartments | 175 (9.5%) | 1,677 (90.5%) |
| 3 or 4 Unit Apartments | 52 (2.7%) | 1,869 (97.3%) |
| 5 to 9 Unit Apartments | 37 (1.3%) | 2,889 (98.7%) |
| 10 or more Apartments | 210 (2.2%) | 9,483 (97.8%) |
| Mobile Home / Other | 1,795 (69.7%) | 782 (30.3%) |
| Total | 46,840 (59.6%) | 31,776 (40.4%) |
Housing Structures by Number of Rooms in Amarillo
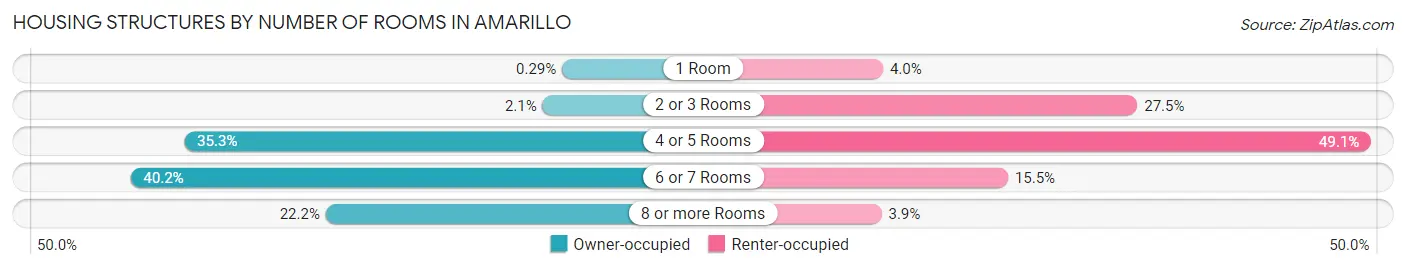
| Number of Rooms | Owner-occupied | Renter-occupied |
| 1 Room | 136 (0.3%) | 1,265 (4.0%) |
| 2 or 3 Rooms | 985 (2.1%) | 8,737 (27.5%) |
| 4 or 5 Rooms | 16,511 (35.2%) | 15,612 (49.1%) |
| 6 or 7 Rooms | 18,834 (40.2%) | 4,939 (15.5%) |
| 8 or more Rooms | 10,374 (22.2%) | 1,223 (3.8%) |
| Total | 46,840 (100.0%) | 31,776 (100.0%) |
Housing Structure by Heating Type in Amarillo
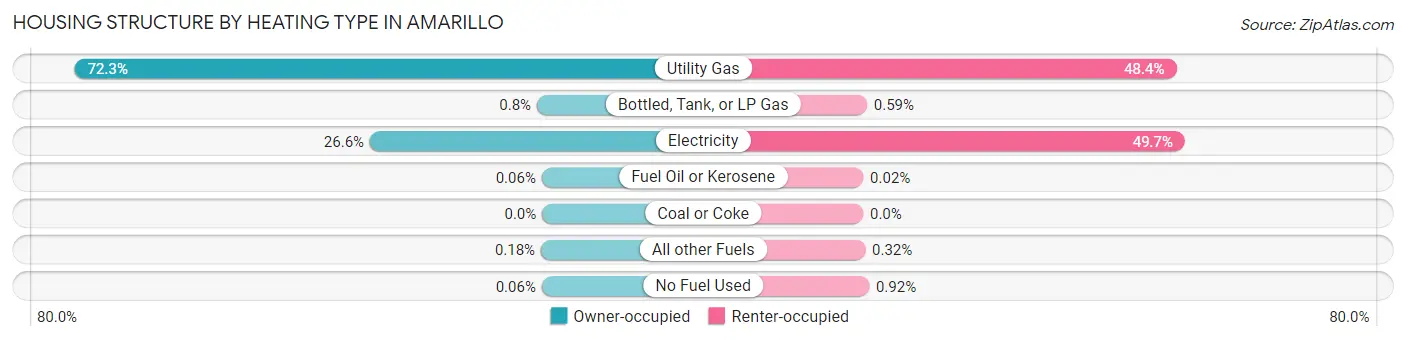
| Heating Type | Owner-occupied | Renter-occupied |
| Utility Gas | 33,857 (72.3%) | 15,384 (48.4%) |
| Bottled, Tank, or LP Gas | 373 (0.8%) | 189 (0.6%) |
| Electricity | 12,469 (26.6%) | 15,803 (49.7%) |
| Fuel Oil or Kerosene | 27 (0.1%) | 7 (0.0%) |
| Coal or Coke | 0 (0.0%) | 0 (0.0%) |
| All other Fuels | 85 (0.2%) | 101 (0.3%) |
| No Fuel Used | 29 (0.1%) | 292 (0.9%) |
| Total | 46,840 (100.0%) | 31,776 (100.0%) |
Household Vehicle Usage in Amarillo
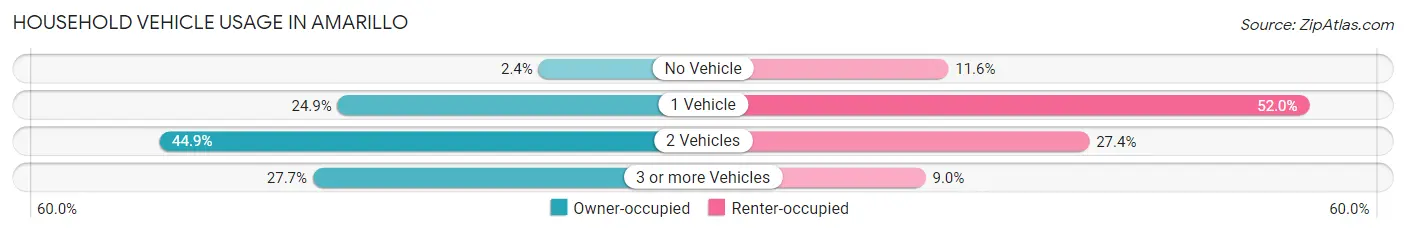
| Vehicles per Household | Owner-occupied | Renter-occupied |
| No Vehicle | 1,132 (2.4%) | 3,679 (11.6%) |
| 1 Vehicle | 11,682 (24.9%) | 16,530 (52.0%) |
| 2 Vehicles | 21,046 (44.9%) | 8,698 (27.4%) |
| 3 or more Vehicles | 12,980 (27.7%) | 2,869 (9.0%) |
| Total | 46,840 (100.0%) | 31,776 (100.0%) |
Real Estate & Mortgages in Amarillo
Real Estate and Mortgage Overview in Amarillo
| Characteristic | Without Mortgage | With Mortgage |
| Housing Units | 20,385 | 26,455 |
| Median Property Value | $149,500 | $185,500 |
| Median Household Income | $59,460 | $5,826 |
| Monthly Housing Costs | $563 | $1,797 |
| Real Estate Taxes | $2,310 | $747 |
Property Value by Mortgage Status in Amarillo
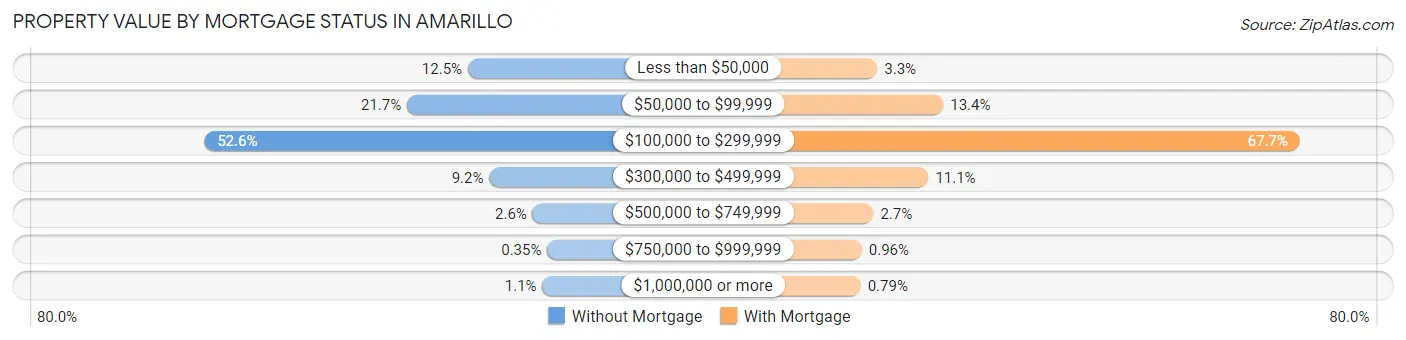
| Property Value | Without Mortgage | With Mortgage |
| Less than $50,000 | 2,537 (12.4%) | 879 (3.3%) |
| $50,000 to $99,999 | 4,428 (21.7%) | 3,538 (13.4%) |
| $100,000 to $299,999 | 10,727 (52.6%) | 17,910 (67.7%) |
| $300,000 to $499,999 | 1,874 (9.2%) | 2,940 (11.1%) |
| $500,000 to $749,999 | 525 (2.6%) | 725 (2.7%) |
| $750,000 to $999,999 | 71 (0.4%) | 254 (1.0%) |
| $1,000,000 or more | 223 (1.1%) | 209 (0.8%) |
| Total | 20,385 (100.0%) | 26,455 (100.0%) |
Household Income by Mortgage Status in Amarillo
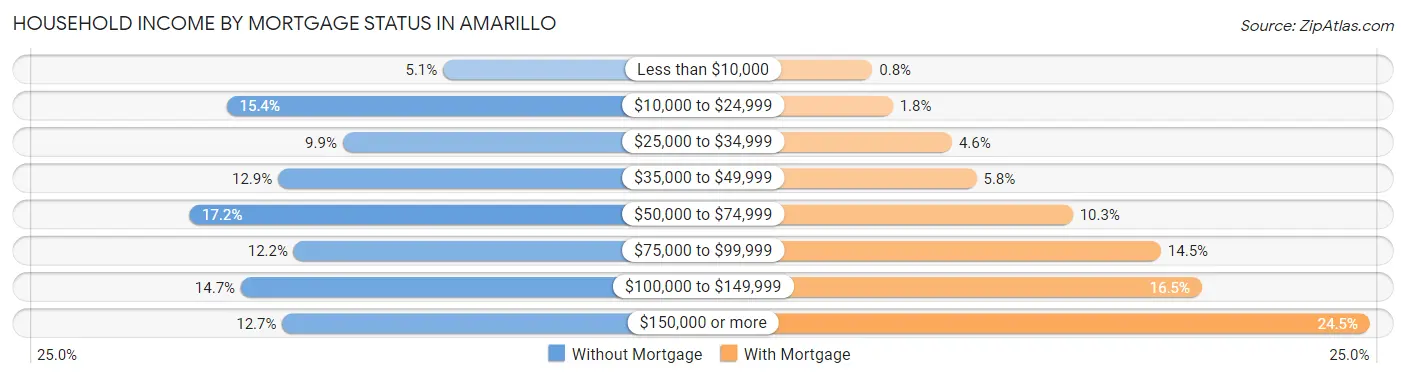
| Household Income | Without Mortgage | With Mortgage |
| Less than $10,000 | 1,034 (5.1%) | 212 (0.8%) |
| $10,000 to $24,999 | 3,135 (15.4%) | 467 (1.8%) |
| $25,000 to $34,999 | 2,007 (9.9%) | 1,214 (4.6%) |
| $35,000 to $49,999 | 2,635 (12.9%) | 1,523 (5.8%) |
| $50,000 to $74,999 | 3,500 (17.2%) | 2,735 (10.3%) |
| $75,000 to $99,999 | 2,482 (12.2%) | 3,847 (14.5%) |
| $100,000 to $149,999 | 2,997 (14.7%) | 4,363 (16.5%) |
| $150,000 or more | 2,595 (12.7%) | 6,480 (24.5%) |
| Total | 20,385 (100.0%) | 26,455 (100.0%) |
Property Value to Household Income Ratio in Amarillo
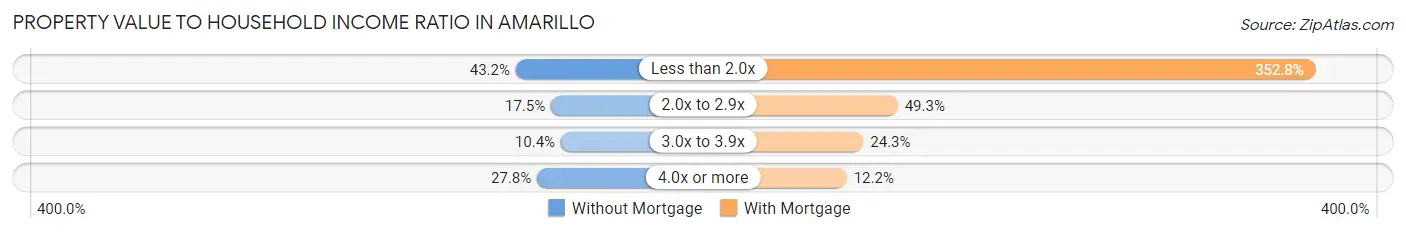
| Value-to-Income Ratio | Without Mortgage | With Mortgage |
| Less than 2.0x | 8,804 (43.2%) | 93,342 (352.8%) |
| 2.0x to 2.9x | 3,575 (17.5%) | 13,032 (49.3%) |
| 3.0x to 3.9x | 2,113 (10.4%) | 6,425 (24.3%) |
| 4.0x or more | 5,656 (27.8%) | 3,233 (12.2%) |
| Total | 20,385 (100.0%) | 26,455 (100.0%) |
Real Estate Taxes by Mortgage Status in Amarillo
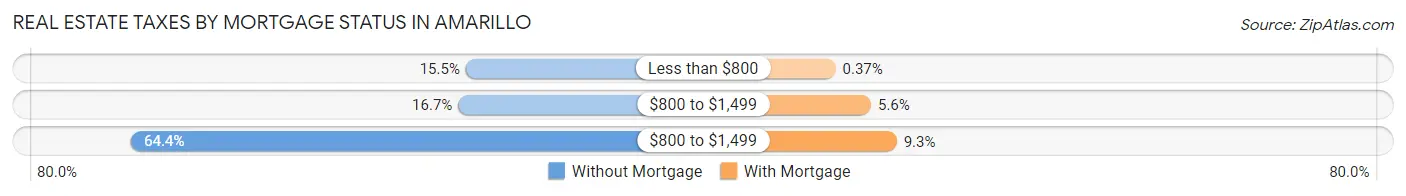
| Property Taxes | Without Mortgage | With Mortgage |
| Less than $800 | 3,167 (15.5%) | 97 (0.4%) |
| $800 to $1,499 | 3,395 (16.7%) | 1,469 (5.6%) |
| $800 to $1,499 | 13,135 (64.4%) | 2,459 (9.3%) |
| Total | 20,385 (100.0%) | 26,455 (100.0%) |
Health & Disability in Amarillo
Health Insurance Coverage by Age in Amarillo
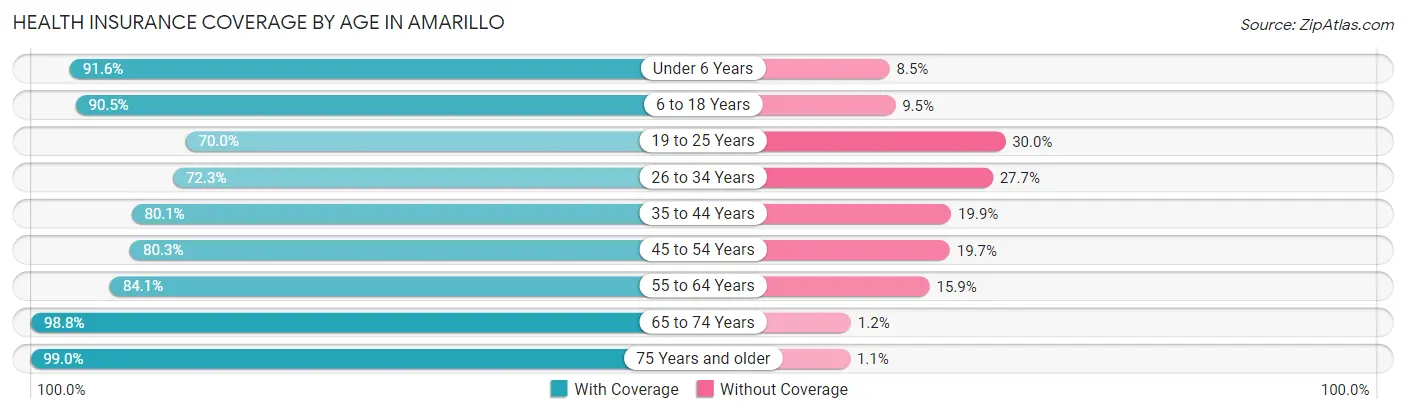
| Age Bracket | With Coverage | Without Coverage |
| Under 6 Years | 15,735 (91.5%) | 1,452 (8.5%) |
| 6 to 18 Years | 34,399 (90.5%) | 3,608 (9.5%) |
| 19 to 25 Years | 13,532 (70.0%) | 5,801 (30.0%) |
| 26 to 34 Years | 19,319 (72.3%) | 7,393 (27.7%) |
| 35 to 44 Years | 21,816 (80.1%) | 5,430 (19.9%) |
| 45 to 54 Years | 17,334 (80.3%) | 4,247 (19.7%) |
| 55 to 64 Years | 17,274 (84.1%) | 3,267 (15.9%) |
| 65 to 74 Years | 16,515 (98.8%) | 205 (1.2%) |
| 75 Years and older | 11,174 (99.0%) | 119 (1.1%) |
| Total | 167,098 (84.1%) | 31,522 (15.9%) |
Health Insurance Coverage by Citizenship Status in Amarillo
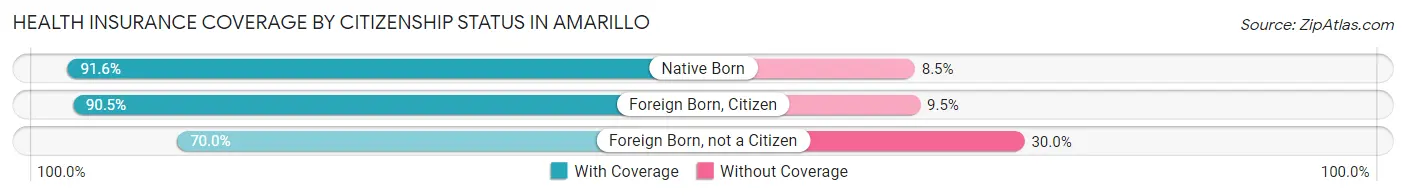
| Citizenship Status | With Coverage | Without Coverage |
| Native Born | 15,735 (91.5%) | 1,452 (8.5%) |
| Foreign Born, Citizen | 34,399 (90.5%) | 3,608 (9.5%) |
| Foreign Born, not a Citizen | 13,532 (70.0%) | 5,801 (30.0%) |
Health Insurance Coverage by Household Income in Amarillo
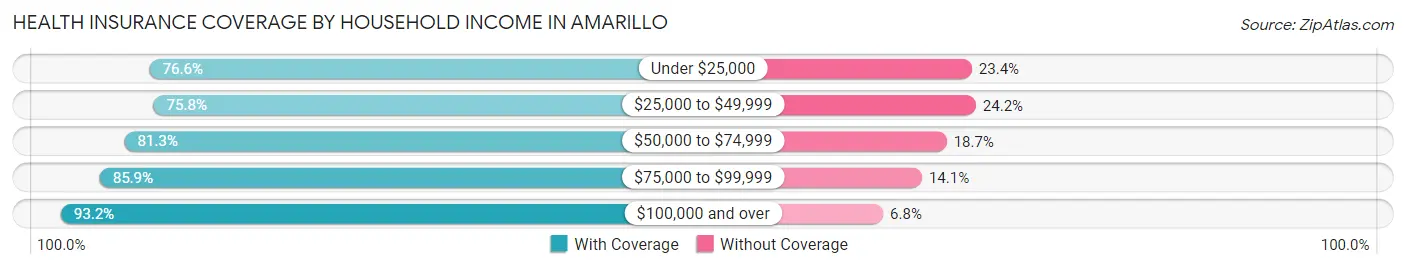
| Household Income | With Coverage | Without Coverage |
| Under $25,000 | 19,661 (76.6%) | 6,020 (23.4%) |
| $25,000 to $49,999 | 32,526 (75.8%) | 10,379 (24.2%) |
| $50,000 to $74,999 | 27,643 (81.3%) | 6,366 (18.7%) |
| $75,000 to $99,999 | 24,284 (85.9%) | 3,983 (14.1%) |
| $100,000 and over | 62,660 (93.2%) | 4,578 (6.8%) |
Public vs Private Health Insurance Coverage by Age in Amarillo
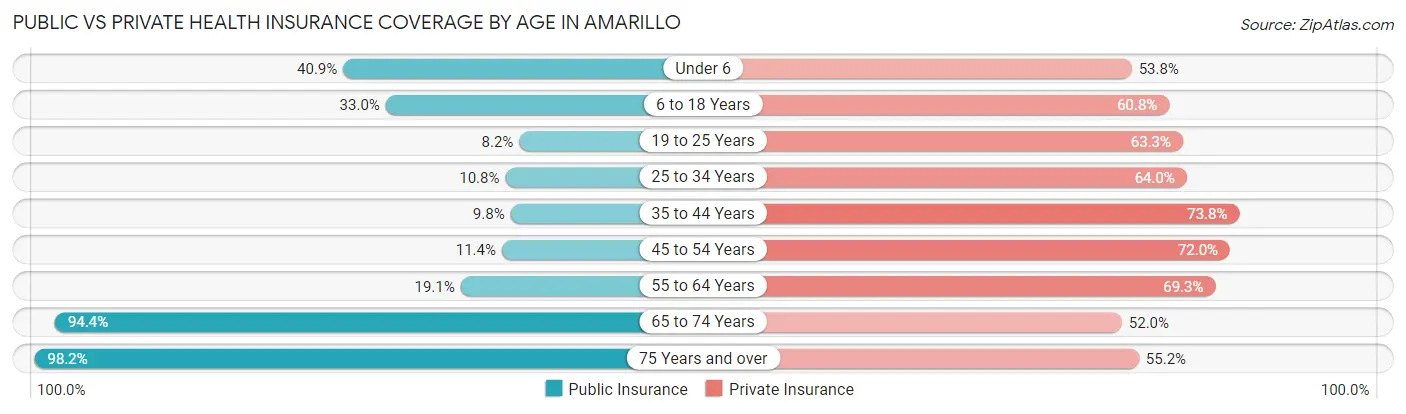
| Age Bracket | Public Insurance | Private Insurance |
| Under 6 | 7,026 (40.9%) | 9,248 (53.8%) |
| 6 to 18 Years | 12,536 (33.0%) | 23,094 (60.8%) |
| 19 to 25 Years | 1,585 (8.2%) | 12,237 (63.3%) |
| 25 to 34 Years | 2,878 (10.8%) | 17,099 (64.0%) |
| 35 to 44 Years | 2,672 (9.8%) | 20,103 (73.8%) |
| 45 to 54 Years | 2,466 (11.4%) | 15,546 (72.0%) |
| 55 to 64 Years | 3,922 (19.1%) | 14,242 (69.3%) |
| 65 to 74 Years | 15,781 (94.4%) | 8,692 (52.0%) |
| 75 Years and over | 11,087 (98.2%) | 6,228 (55.1%) |
| Total | 59,953 (30.2%) | 126,489 (63.7%) |
Disability Status by Sex by Age in Amarillo
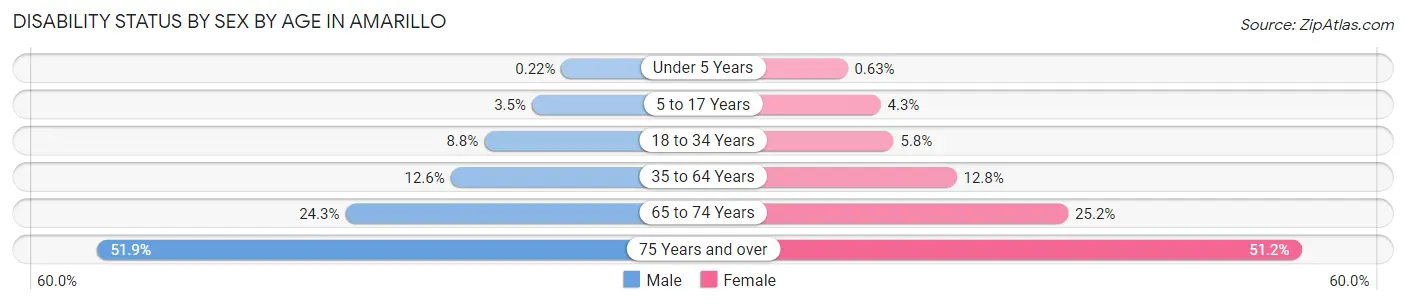
| Age Bracket | Male | Female |
| Under 5 Years | 17 (0.2%) | 43 (0.6%) |
| 5 to 17 Years | 697 (3.5%) | 811 (4.3%) |
| 18 to 34 Years | 2,148 (8.8%) | 1,374 (5.8%) |
| 35 to 64 Years | 4,321 (12.6%) | 4,471 (12.8%) |
| 65 to 74 Years | 1,848 (24.3%) | 2,297 (25.2%) |
| 75 Years and over | 2,307 (51.9%) | 3,503 (51.2%) |
Disability Class by Sex by Age in Amarillo
Disability Class: Hearing Difficulty
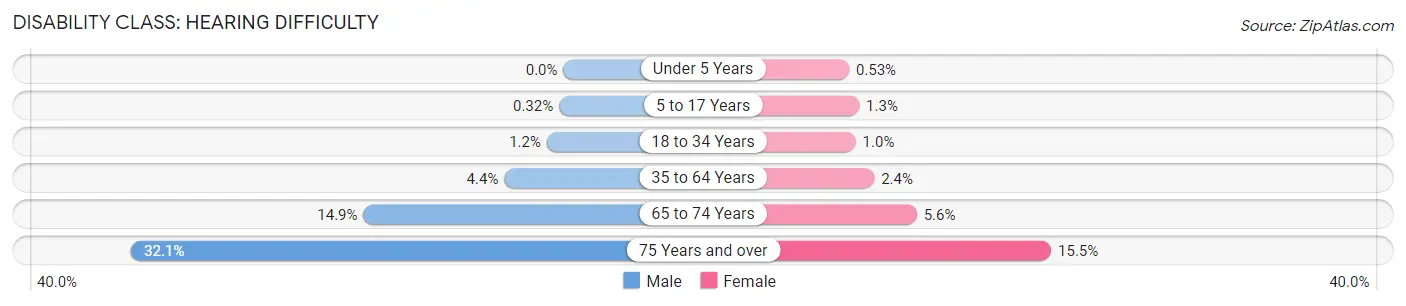
| Age Bracket | Male | Female |
| Under 5 Years | 0 (0.0%) | 36 (0.5%) |
| 5 to 17 Years | 63 (0.3%) | 243 (1.3%) |
| 18 to 34 Years | 299 (1.2%) | 246 (1.0%) |
| 35 to 64 Years | 1,510 (4.4%) | 844 (2.4%) |
| 65 to 74 Years | 1,130 (14.8%) | 507 (5.6%) |
| 75 Years and over | 1,427 (32.1%) | 1,064 (15.5%) |
Disability Class: Vision Difficulty
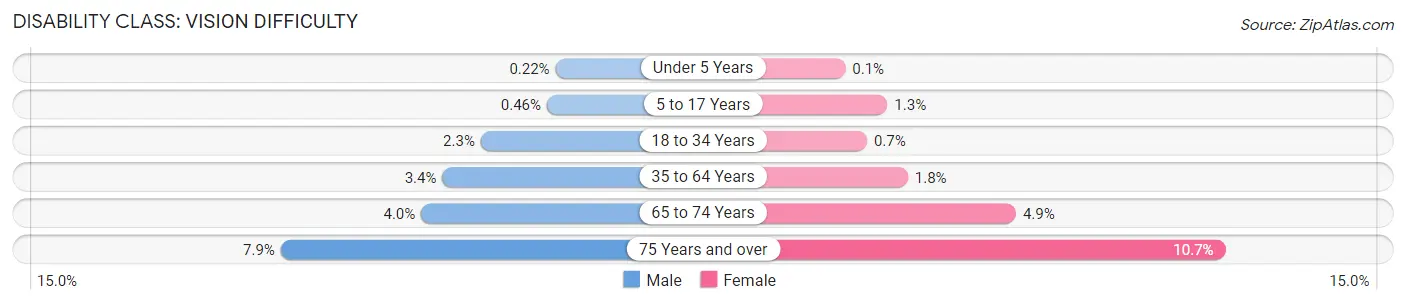
| Age Bracket | Male | Female |
| Under 5 Years | 17 (0.2%) | 7 (0.1%) |
| 5 to 17 Years | 92 (0.5%) | 238 (1.3%) |
| 18 to 34 Years | 560 (2.3%) | 167 (0.7%) |
| 35 to 64 Years | 1,158 (3.4%) | 645 (1.8%) |
| 65 to 74 Years | 301 (4.0%) | 442 (4.9%) |
| 75 Years and over | 350 (7.9%) | 731 (10.7%) |
Disability Class: Cognitive Difficulty
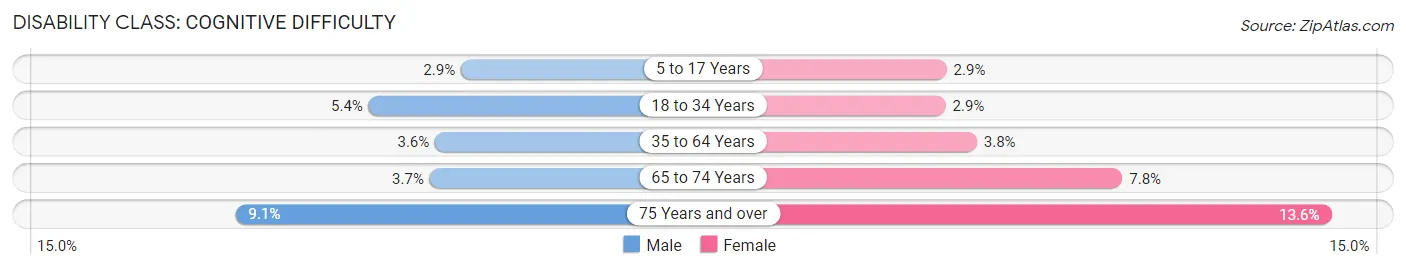
| Age Bracket | Male | Female |
| 5 to 17 Years | 565 (2.9%) | 549 (2.9%) |
| 18 to 34 Years | 1,318 (5.4%) | 690 (2.9%) |
| 35 to 64 Years | 1,228 (3.6%) | 1,315 (3.8%) |
| 65 to 74 Years | 283 (3.7%) | 712 (7.8%) |
| 75 Years and over | 406 (9.1%) | 933 (13.6%) |
Disability Class: Ambulatory Difficulty
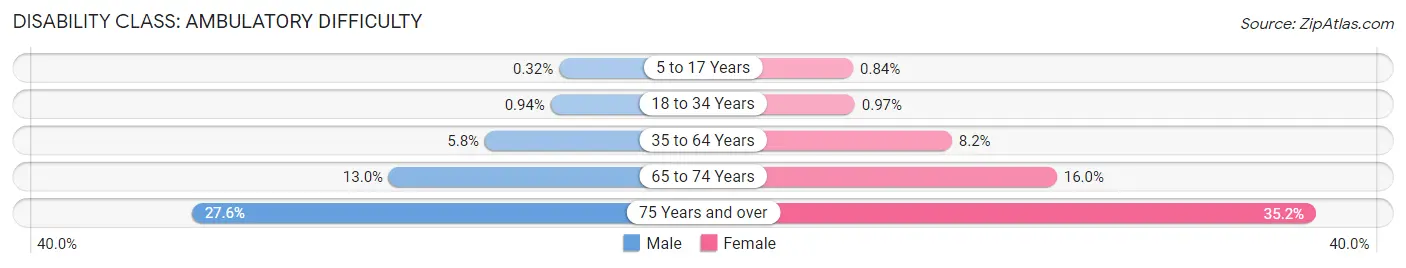
| Age Bracket | Male | Female |
| 5 to 17 Years | 64 (0.3%) | 157 (0.8%) |
| 18 to 34 Years | 228 (0.9%) | 231 (1.0%) |
| 35 to 64 Years | 2,001 (5.8%) | 2,858 (8.2%) |
| 65 to 74 Years | 985 (13.0%) | 1,454 (16.0%) |
| 75 Years and over | 1,227 (27.6%) | 2,410 (35.2%) |
Disability Class: Self-Care Difficulty
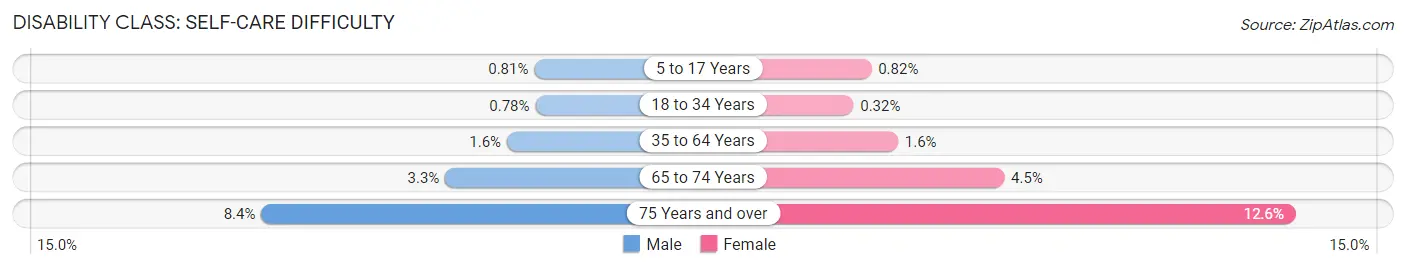
| Age Bracket | Male | Female |
| 5 to 17 Years | 160 (0.8%) | 155 (0.8%) |
| 18 to 34 Years | 189 (0.8%) | 77 (0.3%) |
| 35 to 64 Years | 541 (1.6%) | 547 (1.6%) |
| 65 to 74 Years | 250 (3.3%) | 412 (4.5%) |
| 75 Years and over | 374 (8.4%) | 865 (12.6%) |
Technology Access in Amarillo
Computing Device Access in Amarillo
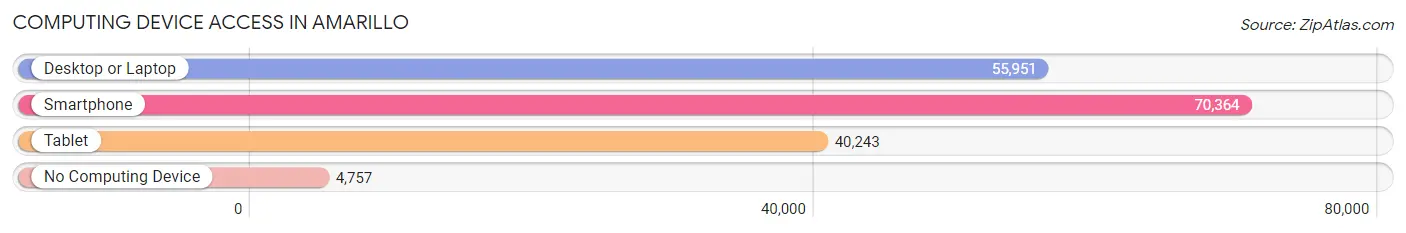
| Device Type | # Households | % Households |
| Desktop or Laptop | 55,951 | 71.2% |
| Smartphone | 70,364 | 89.5% |
| Tablet | 40,243 | 51.2% |
| No Computing Device | 4,757 | 6.0% |
| Total | 78,616 | 100.0% |
Internet Access in Amarillo
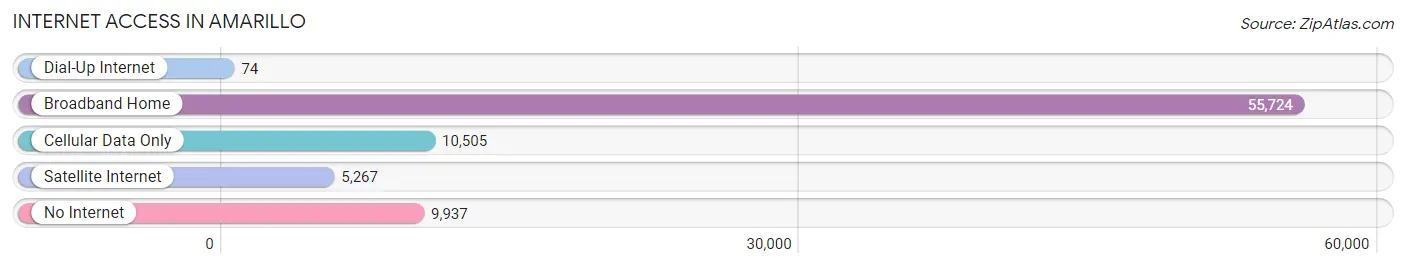
| Internet Type | # Households | % Households |
| Dial-Up Internet | 74 | 0.1% |
| Broadband Home | 55,724 | 70.9% |
| Cellular Data Only | 10,505 | 13.4% |
| Satellite Internet | 5,267 | 6.7% |
| No Internet | 9,937 | 12.6% |
| Total | 78,616 | 100.0% |
Amarillo Summary
Amarillo, Texas is a city located in the northern part of the state, in the Texas Panhandle region. It is the 14th most populous city in the state, with an estimated population of 199,826 in 2019. The city is the county seat of Potter County and is the economic center of the Amarillo metropolitan area, which has an estimated population of 276,020.
History
The area that is now Amarillo was first inhabited by Native American tribes, including the Apache, Comanche, and Kiowa. The first European settlers arrived in the area in the late 19th century, and the city was officially founded in 1887. The city was named after the Spanish word for yellow, in reference to the yellow-colored soil in the area.
In the early 20th century, Amarillo experienced a period of rapid growth, due to the discovery of oil in the area. The city became a major center for the oil industry, and the population grew rapidly. The city also became a major center for the cattle industry, and the city's economy was further bolstered by the establishment of the Amarillo Air Force Base in 1942.
Geography
Amarillo is located in the northern part of the state, in the Texas Panhandle region. It is situated at the intersection of Interstate 40 and US Highway 287. The city is located at an elevation of 3,605 feet above sea level, and covers an area of 90.5 square miles. The city is located in a semi-arid climate zone, and experiences hot summers and mild winters.
Economy
Amarillo's economy is largely based on the oil and gas industry, as well as the cattle industry. The city is home to several major oil and gas companies, including Chevron, ConocoPhillips, and ExxonMobil. The city is also home to several major beef processing plants, including Tyson Foods and Cargill.
The city is also home to several major employers, including the Amarillo Independent School District, the Amarillo VA Health Care System, and the Pantex Plant. The city is also home to several major retail and entertainment venues, including the Amarillo Civic Center, the Amarillo Zoo, and the Wonderland Amusement Park.
Demographics
As of 2019, the population of Amarillo was estimated to be 199,826. The city has a population density of 2,200 people per square mile. The racial makeup of the city is 73.3% White, 5.3% African American, 1.2% Native American, 1.7% Asian, 0.1% Pacific Islander, 15.7% from other races, and 2.1% from two or more races. The median household income in the city is $45,837, and the median age is 33.7 years.
Common Questions
What is Per Capita Income in Amarillo?
Per Capita income in Amarillo is $33,559.
What is the Median Family Income in Amarillo?
Median Family Income in Amarillo is $76,749.
What is the Median Household income in Amarillo?
Median Household Income in Amarillo is $60,628.
What is Income or Wage Gap in Amarillo?
Income or Wage Gap in Amarillo is 32.3%.
Women in Amarillo earn 67.7 cents for every dollar earned by a man.
What is Family Income Deficit in Amarillo?
Family Income Deficit in Amarillo is $10,110.
Families that are below poverty line in Amarillo earn $10,110 less on average than the poverty threshold level.
What is Inequality or Gini Index in Amarillo?
Inequality or Gini Index in Amarillo is 0.47.
What is the Total Population of Amarillo?
Total Population of Amarillo is 200,360.
What is the Total Male Population of Amarillo?
Total Male Population of Amarillo is 99,174.
What is the Total Female Population of Amarillo?
Total Female Population of Amarillo is 101,186.
What is the Ratio of Males per 100 Females in Amarillo?
There are 98.01 Males per 100 Females in Amarillo.
What is the Ratio of Females per 100 Males in Amarillo?
There are 102.03 Females per 100 Males in Amarillo.
What is the Median Population Age in Amarillo?
Median Population Age in Amarillo is 34.4 Years.
What is the Average Family Size in Amarillo
Average Family Size in Amarillo is 3.2 People.
What is the Average Household Size in Amarillo
Average Household Size in Amarillo is 2.5 People.
How Large is the Labor Force in Amarillo?
There are 100,549 People in the Labor Forcein in Amarillo.
What is the Percentage of People in the Labor Force in Amarillo?
65.6% of People are in the Labor Force in Amarillo.
What is the Unemployment Rate in Amarillo?
Unemployment Rate in Amarillo is 3.5%.