Bowling Green, KY Map & Demographics
Bowling Green Map
Bowling Green Overview
$28,088
PER CAPITA INCOME
$63,502
AVG FAMILY INCOME
$47,118
AVG HOUSEHOLD INCOME
36.0%
WAGE / INCOME GAP [ % ]
64.0¢/ $1
WAGE / INCOME GAP [ $ ]
$14,413
FAMILY INCOME DEFICIT
0.50
INEQUALITY / GINI INDEX
72,385
TOTAL POPULATION
35,028
MALE POPULATION
37,357
FEMALE POPULATION
93.77
MALES / 100 FEMALES
106.65
FEMALES / 100 MALES
27.8
MEDIAN AGE
3.0
AVG FAMILY SIZE
2.3
AVG HOUSEHOLD SIZE
39,297
LABOR FORCE [ PEOPLE ]
67.4%
PERCENT IN LABOR FORCE
5.6%
UNEMPLOYMENT RATE
Bowling Green Area Codes
Income in Bowling Green
Income Overview in Bowling Green
Per Capita Income in Bowling Green is $28,088, while median incomes of families and households are $63,502 and $47,118 respectively.
| Characteristic | Number | Measure |
| Per Capita Income | 72,385 | $28,088 |
| Median Family Income | 15,038 | $63,502 |
| Mean Family Income | 15,038 | $87,360 |
| Median Household Income | 28,686 | $47,118 |
| Mean Household Income | 28,686 | $69,390 |
| Income Deficit | 15,038 | $14,413 |
| Wage / Income Gap (%) | 72,385 | 36.05% |
| Wage / Income Gap ($) | 72,385 | 63.95¢ per $1 |
| Gini / Inequality Index | 72,385 | 0.50 |
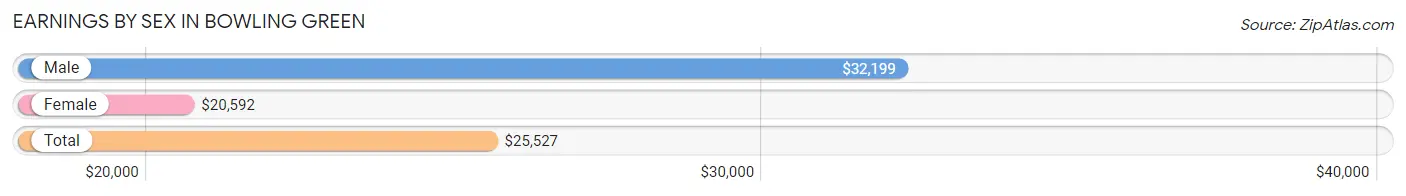
Earnings by Sex in Bowling Green
Average Earnings in Bowling Green are $25,527, $32,199 for men and $20,592 for women, a difference of 36.0%.
| Sex | Number | Average Earnings |
| Male | 21,498 (51.1%) | $32,199 |
| Female | 20,608 (48.9%) | $20,592 |
| Total | 42,106 (100.0%) | $25,527 |
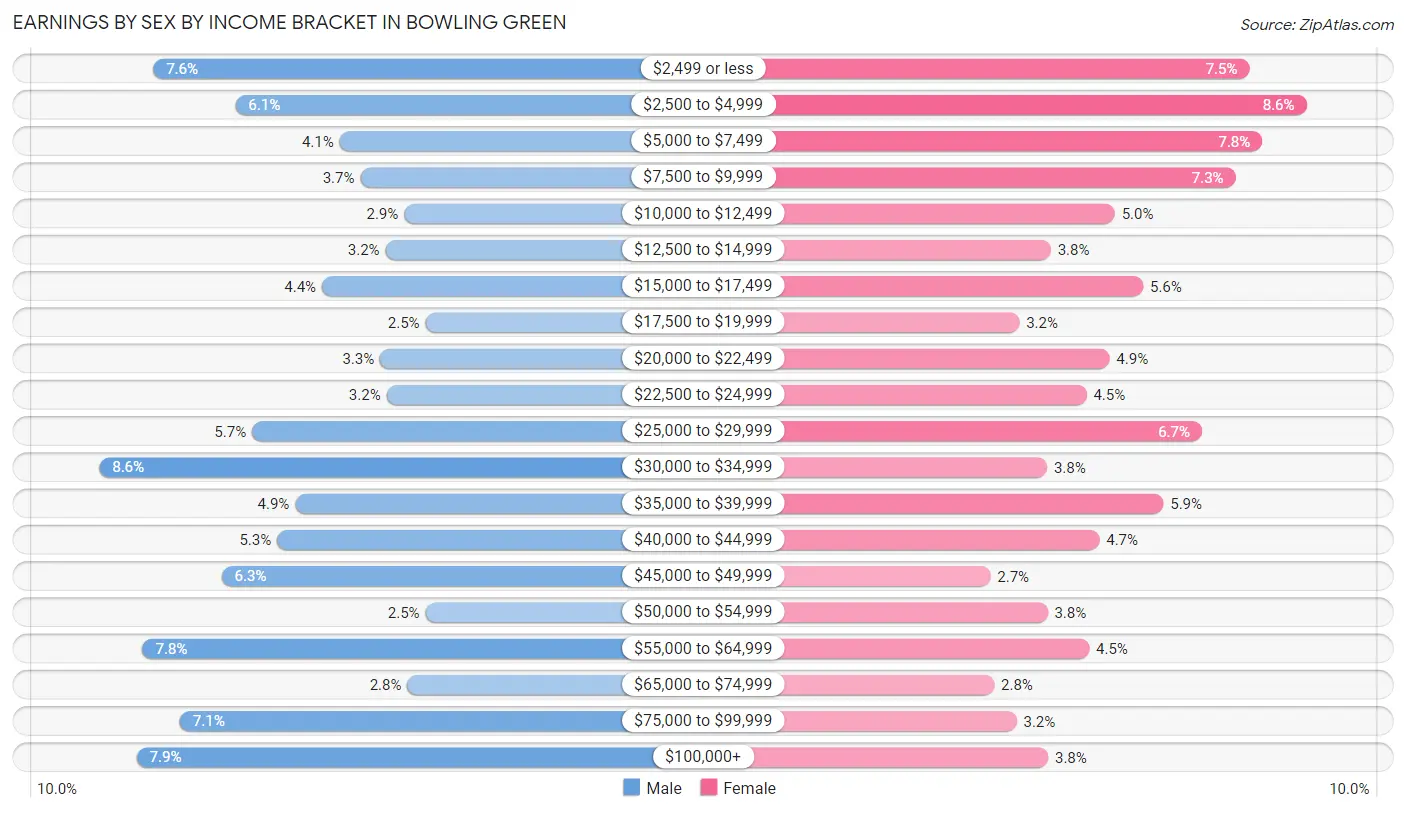
Earnings by Sex by Income Bracket in Bowling Green
The most common earnings brackets in Bowling Green are $30,000 to $34,999 for men (1,848 | 8.6%) and $2,500 to $4,999 for women (1,774 | 8.6%).
| Income | Male | Female |
| $2,499 or less | 1,632 (7.6%) | 1,554 (7.5%) |
| $2,500 to $4,999 | 1,301 (6.0%) | 1,774 (8.6%) |
| $5,000 to $7,499 | 881 (4.1%) | 1,604 (7.8%) |
| $7,500 to $9,999 | 798 (3.7%) | 1,500 (7.3%) |
| $10,000 to $12,499 | 621 (2.9%) | 1,035 (5.0%) |
| $12,500 to $14,999 | 696 (3.2%) | 787 (3.8%) |
| $15,000 to $17,499 | 952 (4.4%) | 1,144 (5.6%) |
| $17,500 to $19,999 | 535 (2.5%) | 666 (3.2%) |
| $20,000 to $22,499 | 719 (3.3%) | 1,013 (4.9%) |
| $22,500 to $24,999 | 692 (3.2%) | 925 (4.5%) |
| $25,000 to $29,999 | 1,234 (5.7%) | 1,371 (6.7%) |
| $30,000 to $34,999 | 1,848 (8.6%) | 772 (3.7%) |
| $35,000 to $39,999 | 1,059 (4.9%) | 1,222 (5.9%) |
| $40,000 to $44,999 | 1,132 (5.3%) | 974 (4.7%) |
| $45,000 to $49,999 | 1,357 (6.3%) | 555 (2.7%) |
| $50,000 to $54,999 | 535 (2.5%) | 775 (3.8%) |
| $55,000 to $64,999 | 1,675 (7.8%) | 935 (4.5%) |
| $65,000 to $74,999 | 608 (2.8%) | 569 (2.8%) |
| $75,000 to $99,999 | 1,524 (7.1%) | 656 (3.2%) |
| $100,000+ | 1,699 (7.9%) | 777 (3.8%) |
| Total | 21,498 (100.0%) | 20,608 (100.0%) |
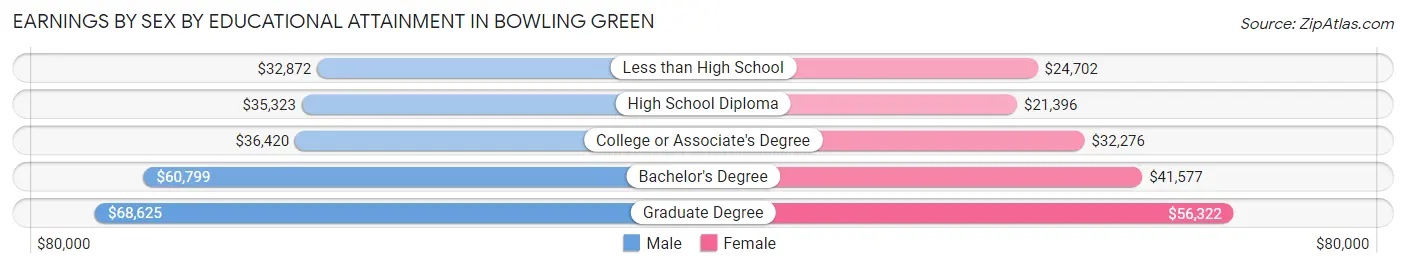
Earnings by Sex by Educational Attainment in Bowling Green
Average earnings in Bowling Green are $41,824 for men and $33,336 for women, a difference of 20.3%. Men with an educational attainment of graduate degree enjoy the highest average annual earnings of $68,625, while those with less than high school education earn the least with $32,872. Women with an educational attainment of graduate degree earn the most with the average annual earnings of $56,322, while those with high school diploma education have the smallest earnings of $21,396.
| Educational Attainment | Male Income | Female Income |
| Less than High School | $32,872 | $24,702 |
| High School Diploma | $35,323 | $21,396 |
| College or Associate's Degree | $36,420 | $32,276 |
| Bachelor's Degree | $60,799 | $41,577 |
| Graduate Degree | $68,625 | $56,322 |
| Total | $41,824 | $33,336 |
Family Income in Bowling Green
Family Income Brackets in Bowling Green
According to the Bowling Green family income data, there are 2,286 families falling into the $100,000 to $149,999 income range, which is the most common income bracket and makes up 15.2% of all families. Conversely, the $10,000 to $14,999 income bracket is the least frequent group with only 541 families (3.6%) belonging to this category.
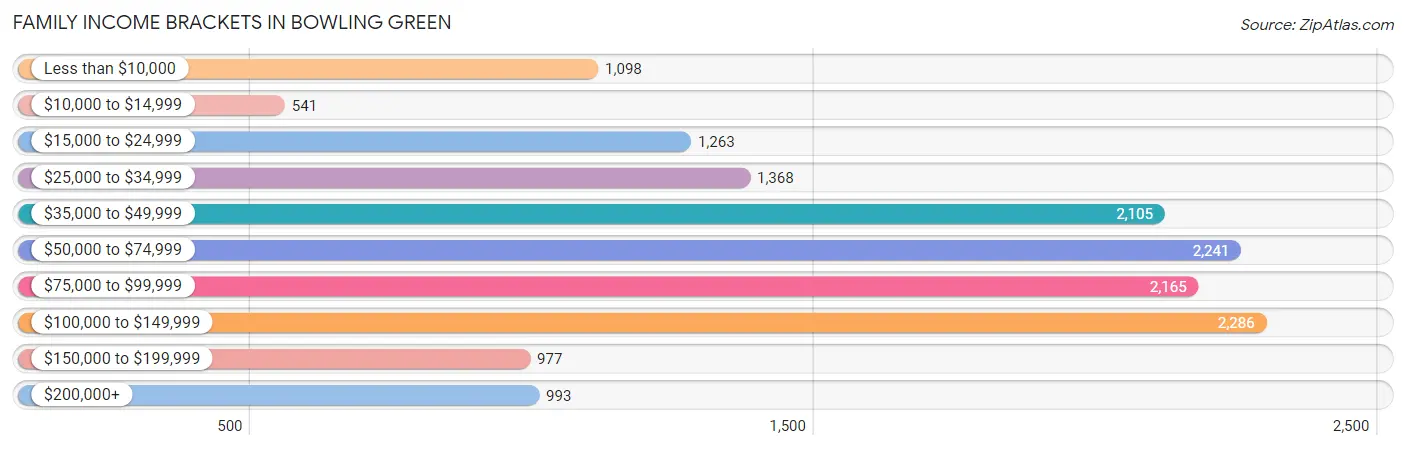
| Income Bracket | # Families | % Families |
| Less than $10,000 | 1,098 | 7.3% |
| $10,000 to $14,999 | 541 | 3.6% |
| $15,000 to $24,999 | 1,263 | 8.4% |
| $25,000 to $34,999 | 1,368 | 9.1% |
| $35,000 to $49,999 | 2,105 | 14.0% |
| $50,000 to $74,999 | 2,241 | 14.9% |
| $75,000 to $99,999 | 2,165 | 14.4% |
| $100,000 to $149,999 | 2,286 | 15.2% |
| $150,000 to $199,999 | 977 | 6.5% |
| $200,000+ | 993 | 6.6% |
Family Income by Famaliy Size in Bowling Green
4-person families (2,538 | 16.9%) account for the highest median family income in Bowling Green with $81,000 per family, while 2-person families (6,668 | 44.3%) have the highest median income of $33,682 per family member.
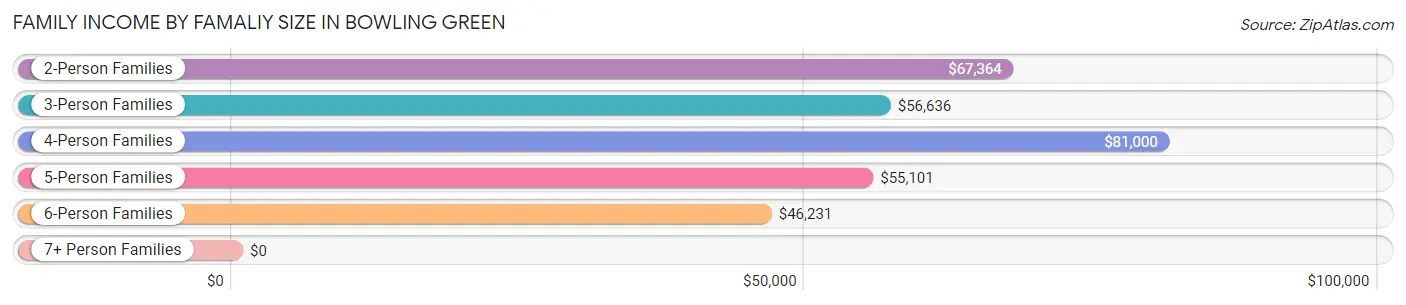
| Income Bracket | # Families | Median Income |
| 2-Person Families | 6,668 (44.3%) | $67,364 |
| 3-Person Families | 3,413 (22.7%) | $56,636 |
| 4-Person Families | 2,538 (16.9%) | $81,000 |
| 5-Person Families | 1,193 (7.9%) | $55,101 |
| 6-Person Families | 536 (3.6%) | $46,231 |
| 7+ Person Families | 690 (4.6%) | $0 |
| Total | 15,038 (100.0%) | $63,502 |
Family Income by Number of Earners in Bowling Green
The median family income in Bowling Green is $63,502, with families comprising 3+ earners (1,482) having the highest median family income of $92,014, while families with no earners (1,816) have the lowest median family income of $37,269, accounting for 9.9% and 12.1% of families, respectively.
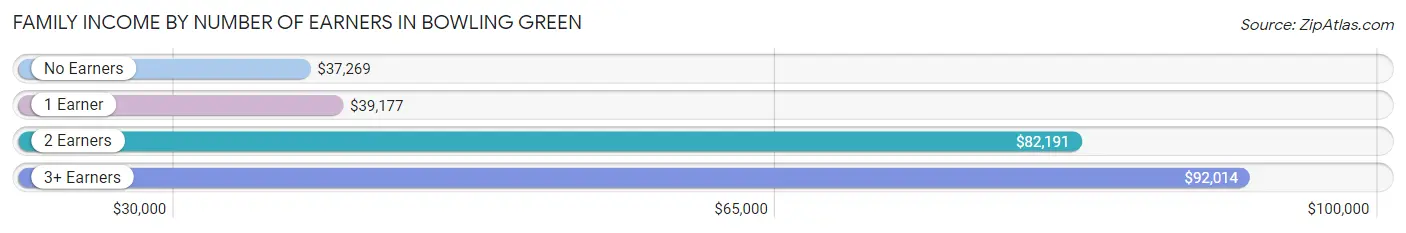
| Number of Earners | # Families | Median Income |
| No Earners | 1,816 (12.1%) | $37,269 |
| 1 Earner | 6,057 (40.3%) | $39,177 |
| 2 Earners | 5,683 (37.8%) | $82,191 |
| 3+ Earners | 1,482 (9.9%) | $92,014 |
| Total | 15,038 (100.0%) | $63,502 |
Household Income in Bowling Green
Household Income Brackets in Bowling Green
With 4,561 households falling in the category, the $50,000 to $74,999 income range is the most frequent in Bowling Green, accounting for 15.9% of all households. In contrast, only 1,061 households (3.7%) fall into the $200,000+ income bracket, making it the least populous group.
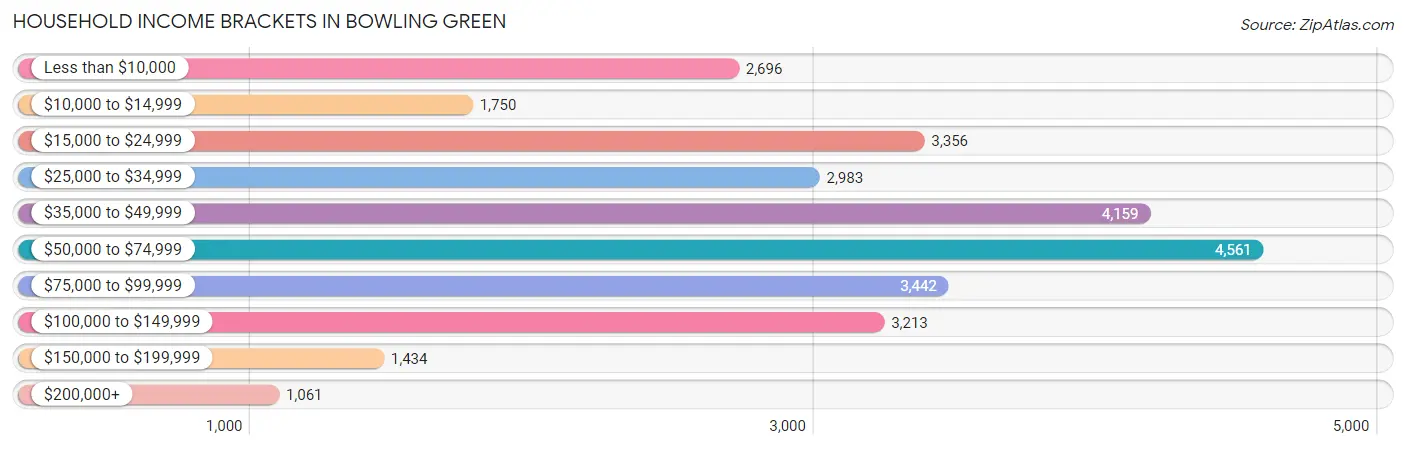
| Income Bracket | # Households | % Households |
| Less than $10,000 | 2,696 | 9.4% |
| $10,000 to $14,999 | 1,750 | 6.1% |
| $15,000 to $24,999 | 3,356 | 11.7% |
| $25,000 to $34,999 | 2,983 | 10.4% |
| $35,000 to $49,999 | 4,159 | 14.5% |
| $50,000 to $74,999 | 4,561 | 15.9% |
| $75,000 to $99,999 | 3,442 | 12.0% |
| $100,000 to $149,999 | 3,213 | 11.2% |
| $150,000 to $199,999 | 1,434 | 5.0% |
| $200,000+ | 1,061 | 3.7% |
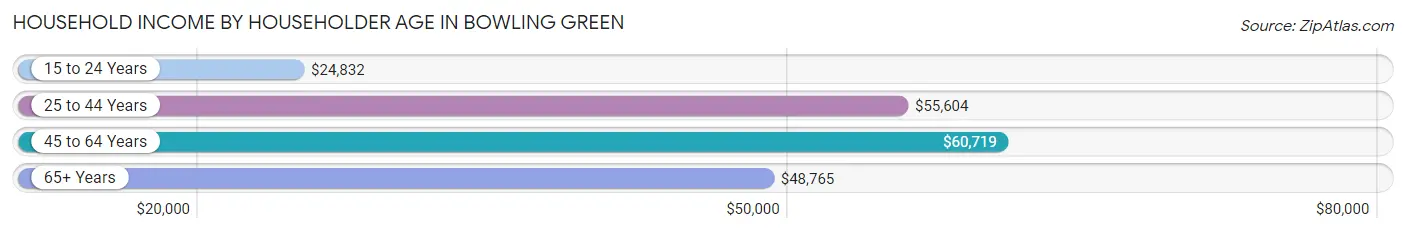
Household Income by Householder Age in Bowling Green
The median household income in Bowling Green is $47,118, with the highest median household income of $60,719 found in the 45 to 64 years age bracket for the primary householder. A total of 7,835 households (27.3%) fall into this category. Meanwhile, the 15 to 24 years age bracket for the primary householder has the lowest median household income of $24,832, with 4,899 households (17.1%) in this group.
| Income Bracket | # Households | Median Income |
| 15 to 24 Years | 4,899 (17.1%) | $24,832 |
| 25 to 44 Years | 10,892 (38.0%) | $55,604 |
| 45 to 64 Years | 7,835 (27.3%) | $60,719 |
| 65+ Years | 5,060 (17.6%) | $48,765 |
| Total | 28,686 (100.0%) | $47,118 |
Poverty in Bowling Green
Income Below Poverty by Sex and Age in Bowling Green
With 23.3% poverty level for males and 29.8% for females among the residents of Bowling Green, 15 year old males and 18 to 24 year old females are the most vulnerable to poverty, with 213 males (40.5%) and 3,267 females (54.3%) in their respective age groups living below the poverty level.
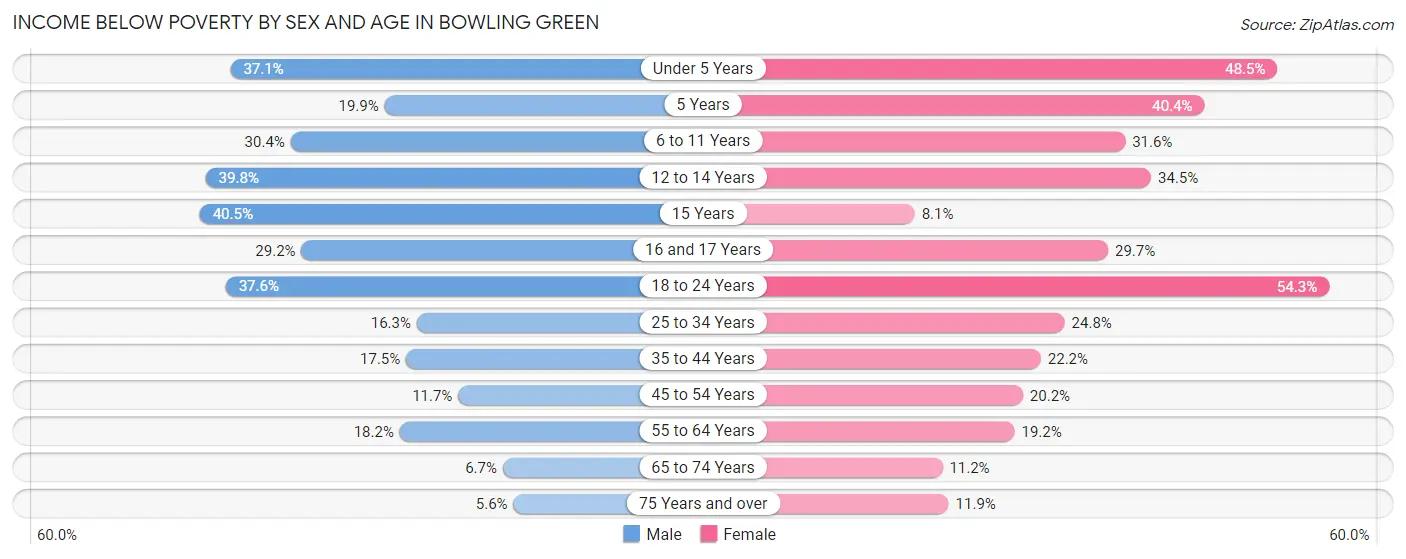
| Age Bracket | Male | Female |
| Under 5 Years | 910 (37.1%) | 1,199 (48.5%) |
| 5 Years | 92 (19.9%) | 254 (40.4%) |
| 6 to 11 Years | 724 (30.4%) | 693 (31.6%) |
| 12 to 14 Years | 478 (39.8%) | 421 (34.4%) |
| 15 Years | 213 (40.5%) | 26 (8.1%) |
| 16 and 17 Years | 203 (29.2%) | 220 (29.6%) |
| 18 to 24 Years | 2,228 (37.6%) | 3,267 (54.3%) |
| 25 to 34 Years | 895 (16.3%) | 1,321 (24.8%) |
| 35 to 44 Years | 792 (17.5%) | 908 (22.2%) |
| 45 to 54 Years | 325 (11.7%) | 679 (20.2%) |
| 55 to 64 Years | 518 (18.2%) | 634 (19.2%) |
| 65 to 74 Years | 135 (6.7%) | 280 (11.2%) |
| 75 Years and over | 70 (5.6%) | 208 (11.9%) |
| Total | 7,583 (23.3%) | 10,110 (29.8%) |
Income Above Poverty by Sex and Age in Bowling Green
According to the poverty statistics in Bowling Green, males aged 75 years and over and females aged 15 years are the age groups that are most secure financially, with 94.4% of males and 91.9% of females in these age groups living above the poverty line.
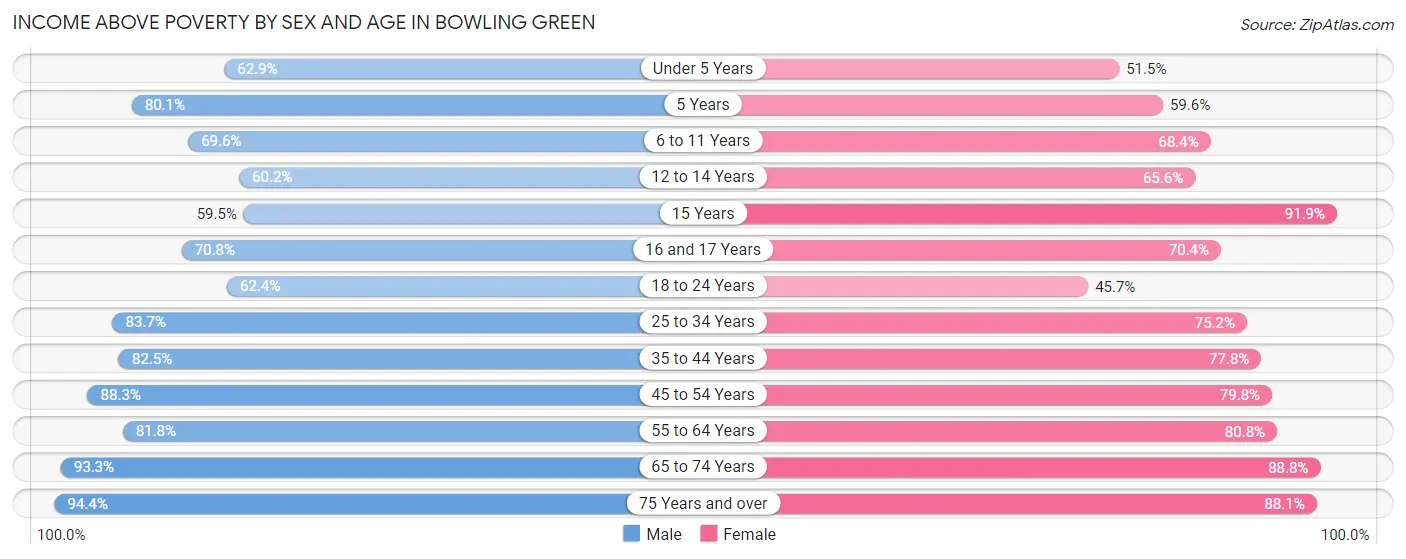
| Age Bracket | Male | Female |
| Under 5 Years | 1,545 (62.9%) | 1,273 (51.5%) |
| 5 Years | 370 (80.1%) | 375 (59.6%) |
| 6 to 11 Years | 1,660 (69.6%) | 1,503 (68.4%) |
| 12 to 14 Years | 722 (60.2%) | 801 (65.5%) |
| 15 Years | 313 (59.5%) | 294 (91.9%) |
| 16 and 17 Years | 493 (70.8%) | 522 (70.4%) |
| 18 to 24 Years | 3,698 (62.4%) | 2,754 (45.7%) |
| 25 to 34 Years | 4,588 (83.7%) | 4,002 (75.2%) |
| 35 to 44 Years | 3,730 (82.5%) | 3,188 (77.8%) |
| 45 to 54 Years | 2,450 (88.3%) | 2,687 (79.8%) |
| 55 to 64 Years | 2,325 (81.8%) | 2,662 (80.8%) |
| 65 to 74 Years | 1,867 (93.3%) | 2,217 (88.8%) |
| 75 Years and over | 1,190 (94.4%) | 1,540 (88.1%) |
| Total | 24,951 (76.7%) | 23,818 (70.2%) |
Income Below Poverty Among Married-Couple Families in Bowling Green
The poverty statistics for married-couple families in Bowling Green show that 11.8% or 1,123 of the total 9,499 families live below the poverty line. Families with 5 or more children have the highest poverty rate of 84.1%, comprising of 467 families. On the other hand, families with no children have the lowest poverty rate of 2.7%, which includes 132 families.
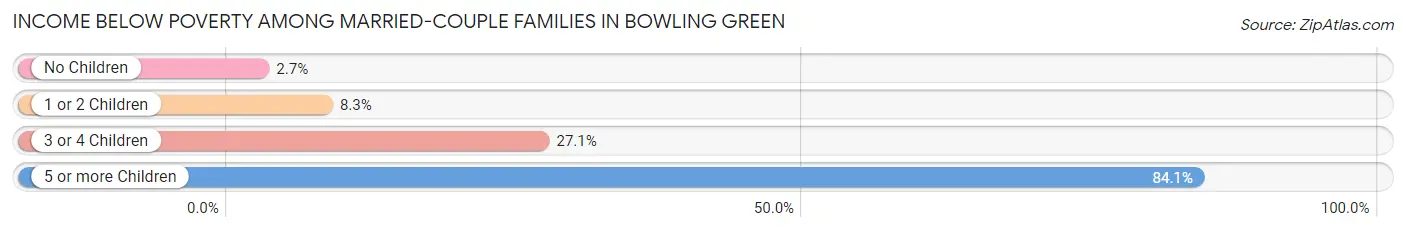
| Children | Above Poverty | Below Poverty |
| No Children | 4,699 (97.3%) | 132 (2.7%) |
| 1 or 2 Children | 2,877 (91.7%) | 259 (8.3%) |
| 3 or 4 Children | 712 (72.9%) | 265 (27.1%) |
| 5 or more Children | 88 (15.9%) | 467 (84.1%) |
| Total | 8,376 (88.2%) | 1,123 (11.8%) |
Income Below Poverty Among Single-Parent Households in Bowling Green
According to the poverty data in Bowling Green, 16.0% or 245 single-father households and 40.6% or 1,628 single-mother households are living below the poverty line. Among single-father households, those with 3 or 4 children have the highest poverty rate, with 27 households (28.7%) experiencing poverty. Likewise, among single-mother households, those with 5 or more children have the highest poverty rate, with 149 households (100.0%) falling below the poverty line.
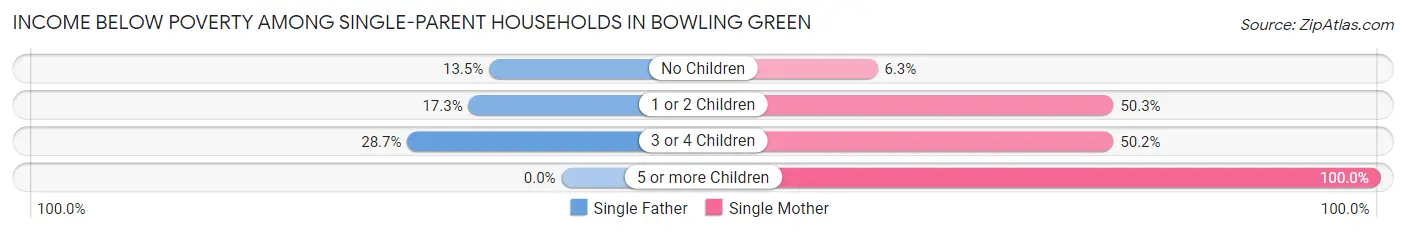
| Children | Single Father | Single Mother |
| No Children | 85 (13.5%) | 66 (6.3%) |
| 1 or 2 Children | 133 (17.3%) | 1,197 (50.2%) |
| 3 or 4 Children | 27 (28.7%) | 216 (50.2%) |
| 5 or more Children | 0 (0.0%) | 149 (100.0%) |
| Total | 245 (16.0%) | 1,628 (40.6%) |
Income Below Poverty Among Married-Couple vs Single-Parent Households in Bowling Green
The poverty data for Bowling Green shows that 1,123 of the married-couple family households (11.8%) and 1,873 of the single-parent households (33.8%) are living below the poverty level. Within the married-couple family households, those with 5 or more children have the highest poverty rate, with 467 households (84.1%) falling below the poverty line. Among the single-parent households, those with 5 or more children have the highest poverty rate, with 149 household (80.5%) living below poverty.
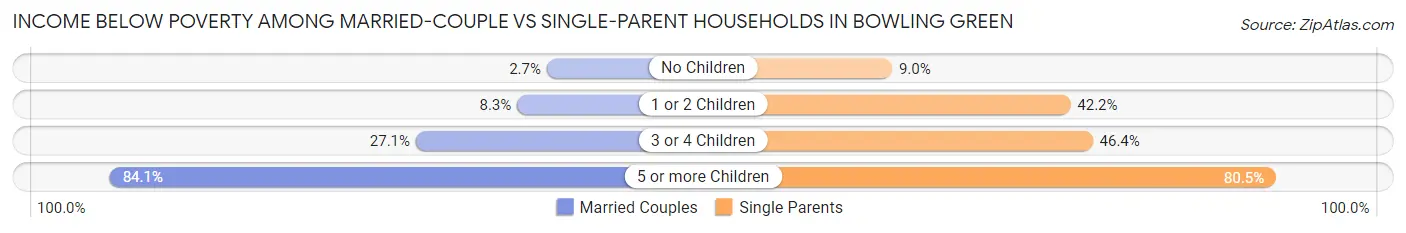
| Children | Married-Couple Families | Single-Parent Households |
| No Children | 132 (2.7%) | 151 (9.0%) |
| 1 or 2 Children | 259 (8.3%) | 1,330 (42.2%) |
| 3 or 4 Children | 265 (27.1%) | 243 (46.4%) |
| 5 or more Children | 467 (84.1%) | 149 (80.5%) |
| Total | 1,123 (11.8%) | 1,873 (33.8%) |
Race in Bowling Green
The most populous races in Bowling Green are White / Caucasian (50,410 | 69.6%), Black / African American (9,360 | 12.9%), and Hispanic or Latino (6,188 | 8.6%).
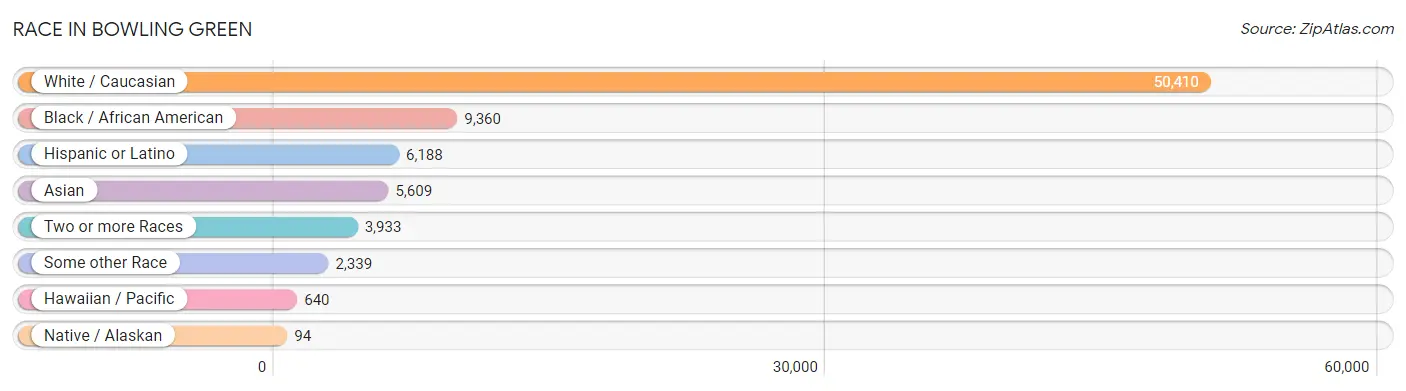
| Race | # Population | % Population |
| Asian | 5,609 | 7.7% |
| Black / African American | 9,360 | 12.9% |
| Hawaiian / Pacific | 640 | 0.9% |
| Hispanic or Latino | 6,188 | 8.6% |
| Native / Alaskan | 94 | 0.1% |
| White / Caucasian | 50,410 | 69.6% |
| Two or more Races | 3,933 | 5.4% |
| Some other Race | 2,339 | 3.2% |
| Total | 72,385 | 100.0% |
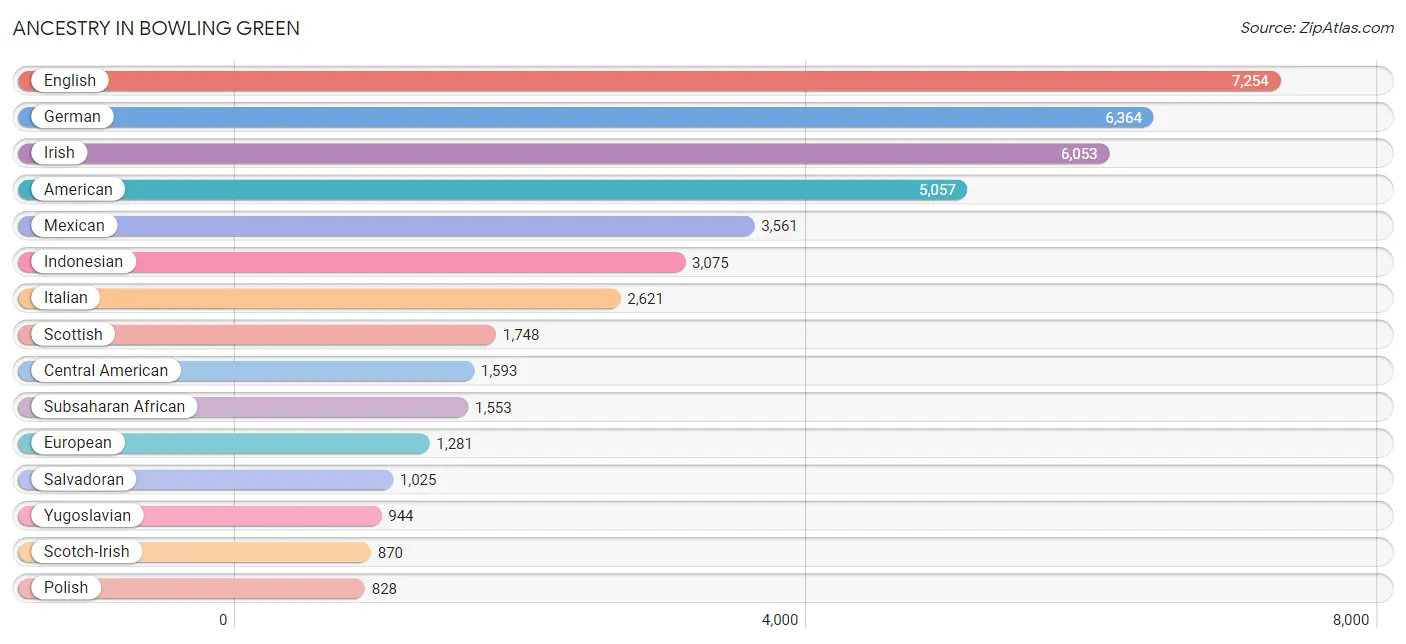
Ancestry in Bowling Green
The most populous ancestries reported in Bowling Green are English (7,254 | 10.0%), German (6,364 | 8.8%), Irish (6,053 | 8.4%), American (5,057 | 7.0%), and Mexican (3,561 | 4.9%), together accounting for 39.1% of all Bowling Green residents.
| Ancestry | # Population | % Population |
| African | 431 | 0.6% |
| Albanian | 288 | 0.4% |
| American | 5,057 | 7.0% |
| Apache | 9 | 0.0% |
| Arab | 658 | 0.9% |
| Argentinean | 43 | 0.1% |
| Australian | 20 | 0.0% |
| Austrian | 70 | 0.1% |
| Belgian | 28 | 0.0% |
| Bhutanese | 151 | 0.2% |
| Blackfeet | 94 | 0.1% |
| British | 582 | 0.8% |
| Bulgarian | 37 | 0.1% |
| Burmese | 67 | 0.1% |
| Canadian | 21 | 0.0% |
| Central American | 1,593 | 2.2% |
| Cherokee | 341 | 0.5% |
| Chickasaw | 18 | 0.0% |
| Chippewa | 9 | 0.0% |
| Colombian | 88 | 0.1% |
| Costa Rican | 16 | 0.0% |
| Croatian | 167 | 0.2% |
| Cuban | 196 | 0.3% |
| Czech | 29 | 0.0% |
| Czechoslovakian | 8 | 0.0% |
| Danish | 173 | 0.2% |
| Dominican | 47 | 0.1% |
| Dutch | 345 | 0.5% |
| Ecuadorian | 83 | 0.1% |
| Egyptian | 35 | 0.1% |
| English | 7,254 | 10.0% |
| Ethiopian | 15 | 0.0% |
| European | 1,281 | 1.8% |
| Filipino | 38 | 0.1% |
| French | 666 | 0.9% |
| French Canadian | 96 | 0.1% |
| German | 6,364 | 8.8% |
| Greek | 77 | 0.1% |
| Guatemalan | 174 | 0.2% |
| Haitian | 200 | 0.3% |
| Honduran | 298 | 0.4% |
| Hungarian | 94 | 0.1% |
| Indian (Asian) | 323 | 0.4% |
| Indonesian | 3,075 | 4.3% |
| Iranian | 12 | 0.0% |
| Iraqi | 242 | 0.3% |
| Irish | 6,053 | 8.4% |
| Italian | 2,621 | 3.6% |
| Jamaican | 42 | 0.1% |
| Japanese | 301 | 0.4% |
| Kenyan | 5 | 0.0% |
| Korean | 437 | 0.6% |
| Lebanese | 62 | 0.1% |
| Liberian | 97 | 0.1% |
| Lithuanian | 8 | 0.0% |
| Mexican | 3,561 | 4.9% |
| Native Hawaiian | 89 | 0.1% |
| Navajo | 4 | 0.0% |
| Nicaraguan | 46 | 0.1% |
| Northern European | 182 | 0.3% |
| Norwegian | 246 | 0.3% |
| Pakistani | 20 | 0.0% |
| Palestinian | 7 | 0.0% |
| Panamanian | 34 | 0.1% |
| Peruvian | 151 | 0.2% |
| Polish | 828 | 1.1% |
| Portuguese | 106 | 0.2% |
| Pueblo | 4 | 0.0% |
| Puerto Rican | 103 | 0.1% |
| Puget Sound Salish | 18 | 0.0% |
| Romanian | 4 | 0.0% |
| Russian | 386 | 0.5% |
| Salvadoran | 1,025 | 1.4% |
| Scandinavian | 135 | 0.2% |
| Scotch-Irish | 870 | 1.2% |
| Scottish | 1,748 | 2.4% |
| Serbian | 74 | 0.1% |
| Sierra Leonean | 19 | 0.0% |
| Slovak | 283 | 0.4% |
| Somali | 207 | 0.3% |
| South American | 402 | 0.6% |
| Spaniard | 50 | 0.1% |
| Spanish | 26 | 0.0% |
| Sri Lankan | 306 | 0.4% |
| Subsaharan African | 1,553 | 2.1% |
| Swedish | 213 | 0.3% |
| Swiss | 45 | 0.1% |
| Syrian | 42 | 0.1% |
| Thai | 492 | 0.7% |
| Turkish | 114 | 0.2% |
| Ukrainian | 268 | 0.4% |
| Ute | 4 | 0.0% |
| Venezuelan | 37 | 0.1% |
| Welsh | 378 | 0.5% |
| Yugoslavian | 944 | 1.3% | View All 95 Rows |
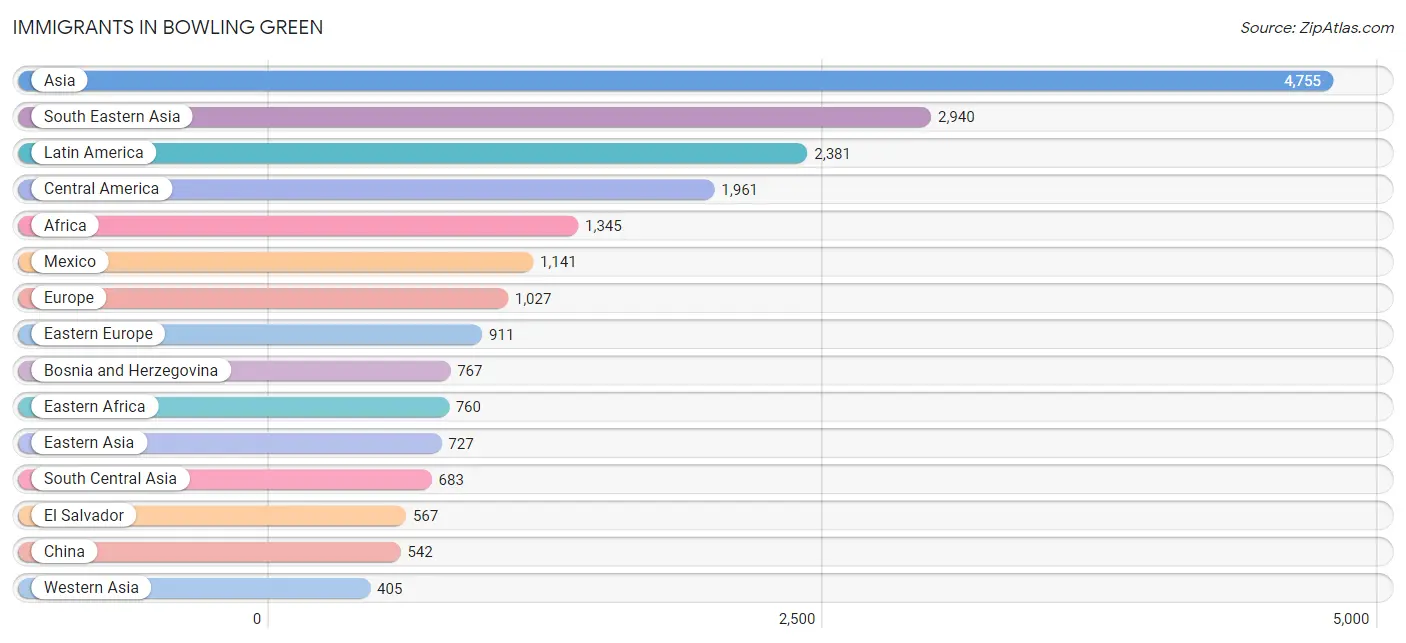
Immigrants in Bowling Green
The most numerous immigrant groups reported in Bowling Green came from Asia (4,755 | 6.6%), South Eastern Asia (2,940 | 4.1%), Latin America (2,381 | 3.3%), Central America (1,961 | 2.7%), and Africa (1,345 | 1.9%), together accounting for 18.5% of all Bowling Green residents.
| Immigration Origin | # Population | % Population |
| Africa | 1,345 | 1.9% |
| Albania | 20 | 0.0% |
| Argentina | 28 | 0.0% |
| Asia | 4,755 | 6.6% |
| Australia | 28 | 0.0% |
| Bosnia and Herzegovina | 767 | 1.1% |
| Cambodia | 34 | 0.1% |
| Cameroon | 52 | 0.1% |
| Canada | 142 | 0.2% |
| Caribbean | 274 | 0.4% |
| Central America | 1,961 | 2.7% |
| China | 542 | 0.7% |
| Colombia | 36 | 0.1% |
| Congo | 182 | 0.3% |
| Costa Rica | 16 | 0.0% |
| Cuba | 136 | 0.2% |
| Dominican Republic | 30 | 0.0% |
| Eastern Africa | 760 | 1.1% |
| Eastern Asia | 727 | 1.0% |
| Eastern Europe | 911 | 1.3% |
| Ecuador | 67 | 0.1% |
| Egypt | 118 | 0.2% |
| El Salvador | 567 | 0.8% |
| Ethiopia | 7 | 0.0% |
| Europe | 1,027 | 1.4% |
| Germany | 51 | 0.1% |
| Guatemala | 55 | 0.1% |
| Haiti | 66 | 0.1% |
| Honduras | 182 | 0.3% |
| India | 236 | 0.3% |
| Iraq | 216 | 0.3% |
| Jamaica | 42 | 0.1% |
| Japan | 168 | 0.2% |
| Kenya | 9 | 0.0% |
| Korea | 17 | 0.0% |
| Laos | 14 | 0.0% |
| Latin America | 2,381 | 3.3% |
| Liberia | 97 | 0.1% |
| Malaysia | 260 | 0.4% |
| Mexico | 1,141 | 1.6% |
| Micronesia | 360 | 0.5% |
| Middle Africa | 367 | 0.5% |
| Nepal | 175 | 0.2% |
| Northern Africa | 118 | 0.2% |
| Northern Europe | 57 | 0.1% |
| Oceania | 388 | 0.5% |
| Pakistan | 37 | 0.1% |
| Philippines | 282 | 0.4% |
| Russia | 73 | 0.1% |
| Saudi Arabia | 130 | 0.2% |
| Somalia | 207 | 0.3% |
| South Africa | 3 | 0.0% |
| South America | 146 | 0.2% |
| South Central Asia | 683 | 0.9% |
| South Eastern Asia | 2,940 | 4.1% |
| Syria | 16 | 0.0% |
| Taiwan | 31 | 0.0% |
| Thailand | 307 | 0.4% |
| Uganda | 68 | 0.1% |
| Uzbekistan | 48 | 0.1% |
| Venezuela | 15 | 0.0% |
| Vietnam | 213 | 0.3% |
| Western Africa | 97 | 0.1% |
| Western Asia | 405 | 0.6% |
| Western Europe | 51 | 0.1% |
| Zaire | 133 | 0.2% | View All 66 Rows |
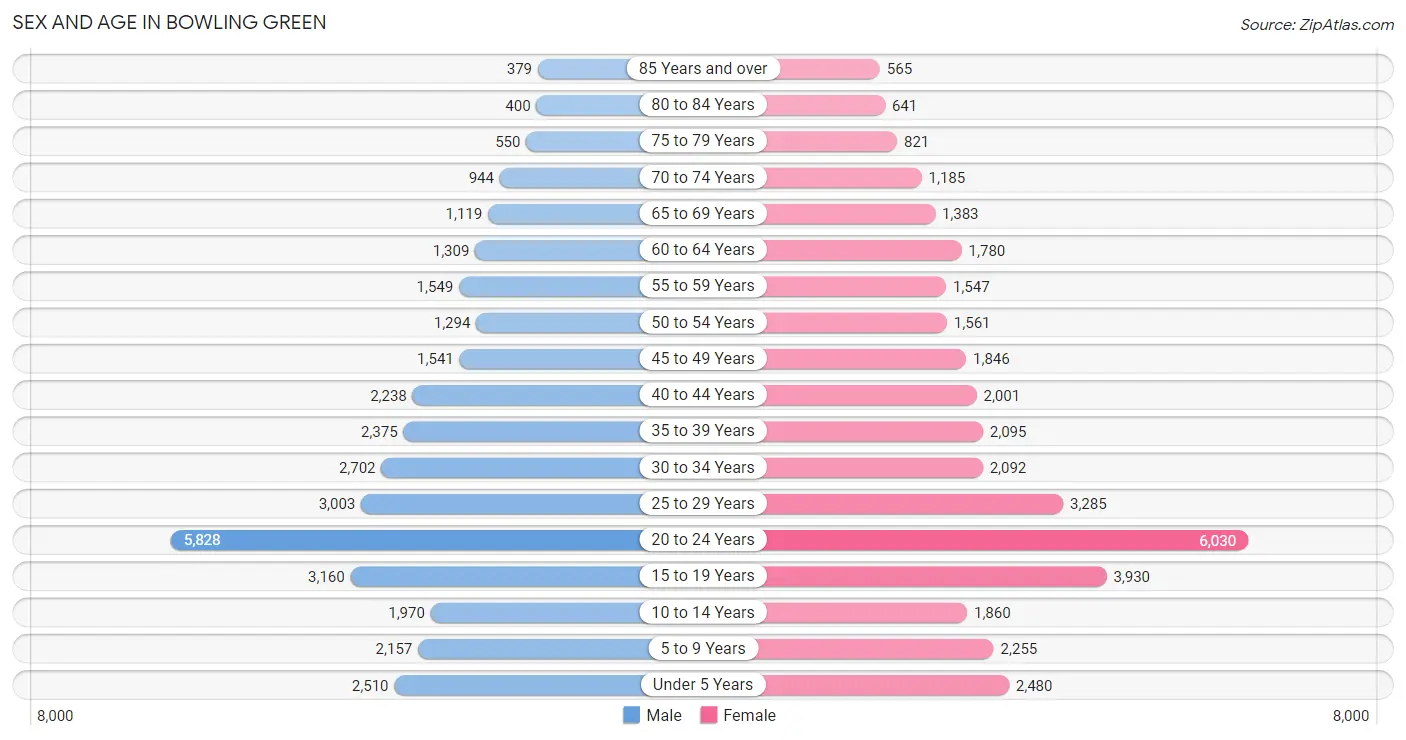
Sex and Age in Bowling Green
Sex and Age in Bowling Green
The most populous age groups in Bowling Green are 20 to 24 Years (5,828 | 16.6%) for men and 20 to 24 Years (6,030 | 16.1%) for women.
| Age Bracket | Male | Female |
| Under 5 Years | 2,510 (7.2%) | 2,480 (6.6%) |
| 5 to 9 Years | 2,157 (6.2%) | 2,255 (6.0%) |
| 10 to 14 Years | 1,970 (5.6%) | 1,860 (5.0%) |
| 15 to 19 Years | 3,160 (9.0%) | 3,930 (10.5%) |
| 20 to 24 Years | 5,828 (16.6%) | 6,030 (16.1%) |
| 25 to 29 Years | 3,003 (8.6%) | 3,285 (8.8%) |
| 30 to 34 Years | 2,702 (7.7%) | 2,092 (5.6%) |
| 35 to 39 Years | 2,375 (6.8%) | 2,095 (5.6%) |
| 40 to 44 Years | 2,238 (6.4%) | 2,001 (5.4%) |
| 45 to 49 Years | 1,541 (4.4%) | 1,846 (4.9%) |
| 50 to 54 Years | 1,294 (3.7%) | 1,561 (4.2%) |
| 55 to 59 Years | 1,549 (4.4%) | 1,547 (4.1%) |
| 60 to 64 Years | 1,309 (3.7%) | 1,780 (4.8%) |
| 65 to 69 Years | 1,119 (3.2%) | 1,383 (3.7%) |
| 70 to 74 Years | 944 (2.7%) | 1,185 (3.2%) |
| 75 to 79 Years | 550 (1.6%) | 821 (2.2%) |
| 80 to 84 Years | 400 (1.1%) | 641 (1.7%) |
| 85 Years and over | 379 (1.1%) | 565 (1.5%) |
| Total | 35,028 (100.0%) | 37,357 (100.0%) |
Families and Households in Bowling Green
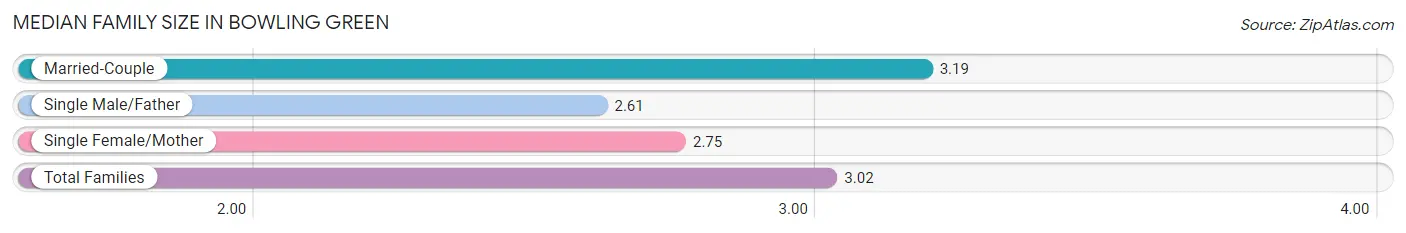
Median Family Size in Bowling Green
The median family size in Bowling Green is 3.02 persons per family, with married-couple families (9,499 | 63.2%) accounting for the largest median family size of 3.19 persons per family. On the other hand, single male/father families (1,528 | 10.2%) represent the smallest median family size with 2.61 persons per family.
| Family Type | # Families | Family Size |
| Married-Couple | 9,499 (63.2%) | 3.19 |
| Single Male/Father | 1,528 (10.2%) | 2.61 |
| Single Female/Mother | 4,011 (26.7%) | 2.75 |
| Total Families | 15,038 (100.0%) | 3.02 |
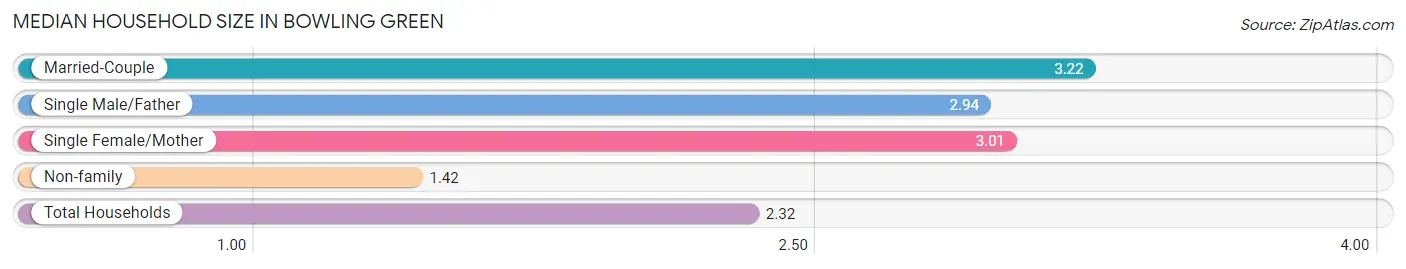
Median Household Size in Bowling Green
The median household size in Bowling Green is 2.32 persons per household, with married-couple households (9,499 | 33.1%) accounting for the largest median household size of 3.22 persons per household. non-family households (13,648 | 47.6%) represent the smallest median household size with 1.42 persons per household.
| Household Type | # Households | Household Size |
| Married-Couple | 9,499 (33.1%) | 3.22 |
| Single Male/Father | 1,528 (5.3%) | 2.94 |
| Single Female/Mother | 4,011 (14.0%) | 3.01 |
| Non-family | 13,648 (47.6%) | 1.42 |
| Total Households | 28,686 (100.0%) | 2.32 |
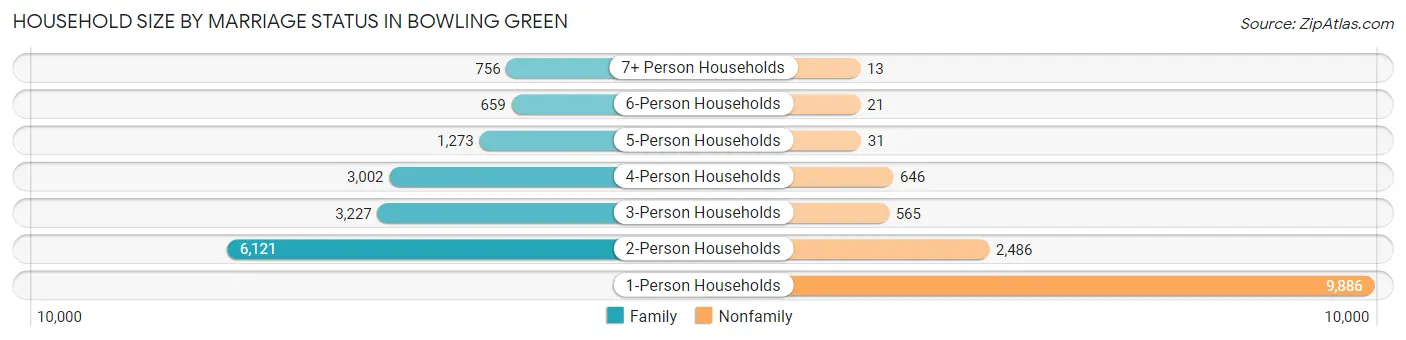
Household Size by Marriage Status in Bowling Green
Out of a total of 28,686 households in Bowling Green, 15,038 (52.4%) are family households, while 13,648 (47.6%) are nonfamily households. The most numerous type of family households are 2-person households, comprising 6,121, and the most common type of nonfamily households are 1-person households, comprising 9,886.
| Household Size | Family Households | Nonfamily Households |
| 1-Person Households | - | 9,886 (34.5%) |
| 2-Person Households | 6,121 (21.3%) | 2,486 (8.7%) |
| 3-Person Households | 3,227 (11.3%) | 565 (2.0%) |
| 4-Person Households | 3,002 (10.5%) | 646 (2.2%) |
| 5-Person Households | 1,273 (4.4%) | 31 (0.1%) |
| 6-Person Households | 659 (2.3%) | 21 (0.1%) |
| 7+ Person Households | 756 (2.6%) | 13 (0.1%) |
| Total | 15,038 (52.4%) | 13,648 (47.6%) |
Female Fertility in Bowling Green
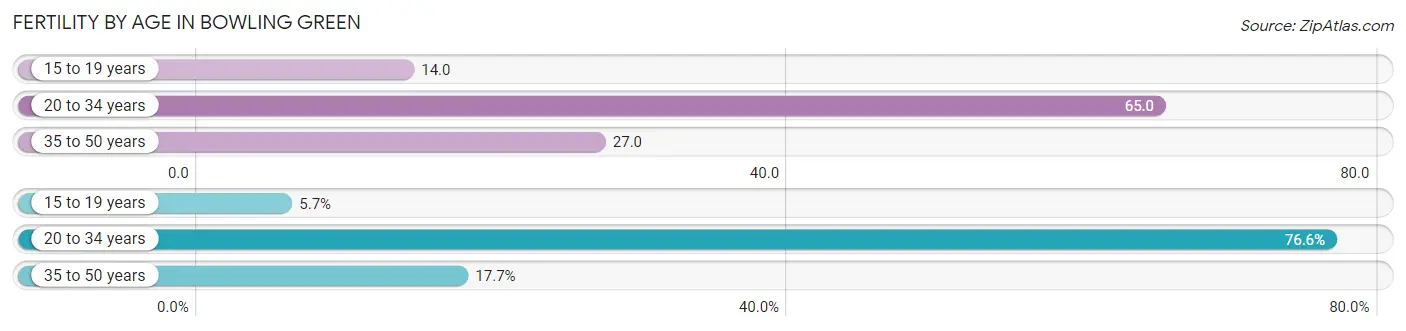
Fertility by Age in Bowling Green
Average fertility rate in Bowling Green is 44.0 births per 1,000 women. Women in the age bracket of 20 to 34 years have the highest fertility rate with 65.0 births per 1,000 women. Women in the age bracket of 20 to 34 years acount for 76.6% of all women with births.
| Age Bracket | Women with Births | Births / 1,000 Women |
| 15 to 19 years | 55 (5.7%) | 14.0 |
| 20 to 34 years | 737 (76.6%) | 65.0 |
| 35 to 50 years | 170 (17.7%) | 27.0 |
| Total | 962 (100.0%) | 44.0 |
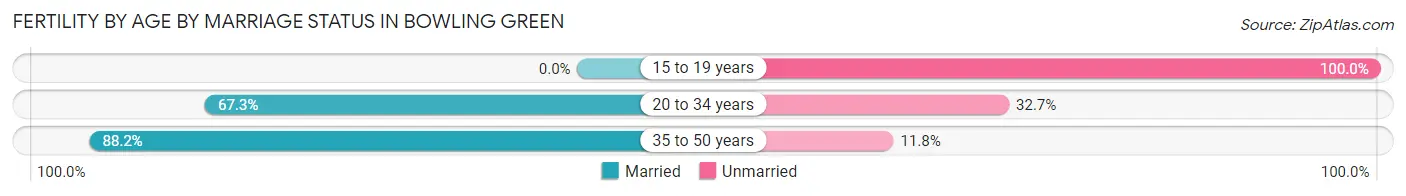
Fertility by Age by Marriage Status in Bowling Green
67.2% of women with births (962) in Bowling Green are married. The highest percentage of unmarried women with births falls into 15 to 19 years age bracket with 100.0% of them unmarried at the time of birth, while the lowest percentage of unmarried women with births belong to 35 to 50 years age bracket with 11.8% of them unmarried.
| Age Bracket | Married | Unmarried |
| 15 to 19 years | 0 (0.0%) | 55 (100.0%) |
| 20 to 34 years | 496 (67.3%) | 241 (32.7%) |
| 35 to 50 years | 150 (88.2%) | 20 (11.8%) |
| Total | 646 (67.1%) | 316 (32.9%) |
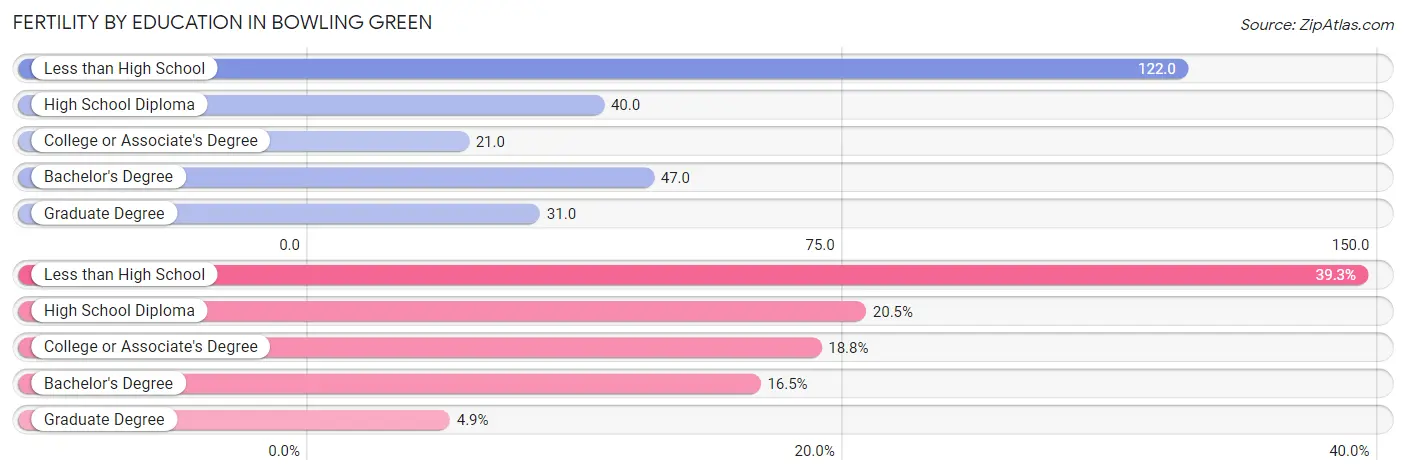
Fertility by Education in Bowling Green
Average fertility rate in Bowling Green is 44.0 births per 1,000 women. Women with the education attainment of less than high school have the highest fertility rate of 122.0 births per 1,000 women, while women with the education attainment of college or associate's degree have the lowest fertility at 21.0 births per 1,000 women. Women with the education attainment of less than high school represent 39.3% of all women with births.
| Educational Attainment | Women with Births | Births / 1,000 Women |
| Less than High School | 378 (39.3%) | 122.0 |
| High School Diploma | 197 (20.5%) | 40.0 |
| College or Associate's Degree | 181 (18.8%) | 21.0 |
| Bachelor's Degree | 159 (16.5%) | 47.0 |
| Graduate Degree | 47 (4.9%) | 31.0 |
| Total | 962 (100.0%) | 44.0 |
Fertility by Education by Marriage Status in Bowling Green
32.9% of women with births in Bowling Green are unmarried. Women with the educational attainment of graduate degree are most likely to be married with 100.0% of them married at childbirth, while women with the educational attainment of college or associate's degree are least likely to be married with 64.6% of them unmarried at childbirth.
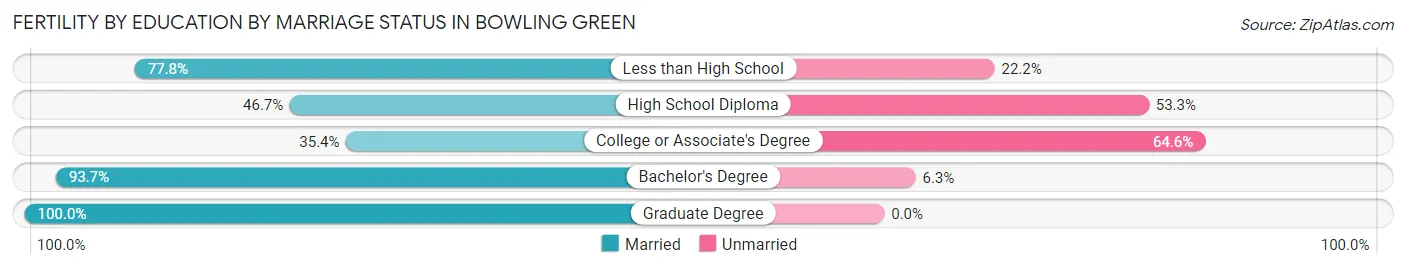
| Educational Attainment | Married | Unmarried |
| Less than High School | 294 (77.8%) | 84 (22.2%) |
| High School Diploma | 92 (46.7%) | 105 (53.3%) |
| College or Associate's Degree | 64 (35.4%) | 117 (64.6%) |
| Bachelor's Degree | 149 (93.7%) | 10 (6.3%) |
| Graduate Degree | 47 (100.0%) | 0 (0.0%) |
| Total | 646 (67.1%) | 316 (32.9%) |
Employment Characteristics in Bowling Green
Employment by Class of Employer in Bowling Green
Among the 35,128 employed individuals in Bowling Green, private company employees (25,838 | 73.6%), not-for-profit organizations (2,917 | 8.3%), and state government employees (2,051 | 5.8%) make up the most common classes of employment.
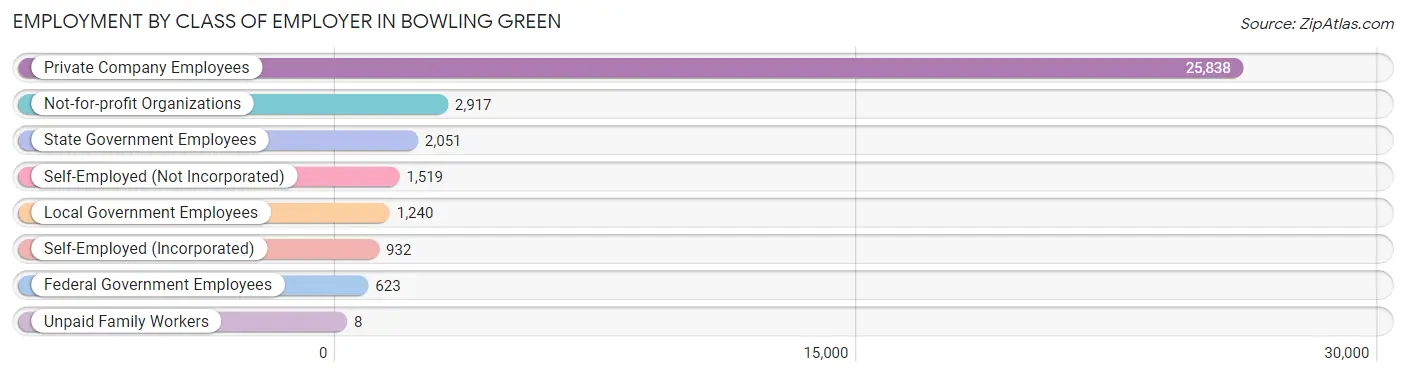
| Employer Class | # Employees | % Employees |
| Private Company Employees | 25,838 | 73.6% |
| Self-Employed (Incorporated) | 932 | 2.6% |
| Self-Employed (Not Incorporated) | 1,519 | 4.3% |
| Not-for-profit Organizations | 2,917 | 8.3% |
| Local Government Employees | 1,240 | 3.5% |
| State Government Employees | 2,051 | 5.8% |
| Federal Government Employees | 623 | 1.8% |
| Unpaid Family Workers | 8 | 0.0% |
| Total | 35,128 | 100.0% |
Employment Status by Age in Bowling Green
According to the labor force statistics for Bowling Green, out of the total population over 16 years of age (58,304), 67.4% or 39,297 individuals are in the labor force, with 5.6% or 2,201 of them unemployed. The age group with the highest labor force participation rate is 20 to 24 years, with 82.5% or 9,783 individuals in the labor force. Within the labor force, the 16 to 19 years age range has the highest percentage of unemployed individuals, with 13.3% or 443 of them being unemployed.
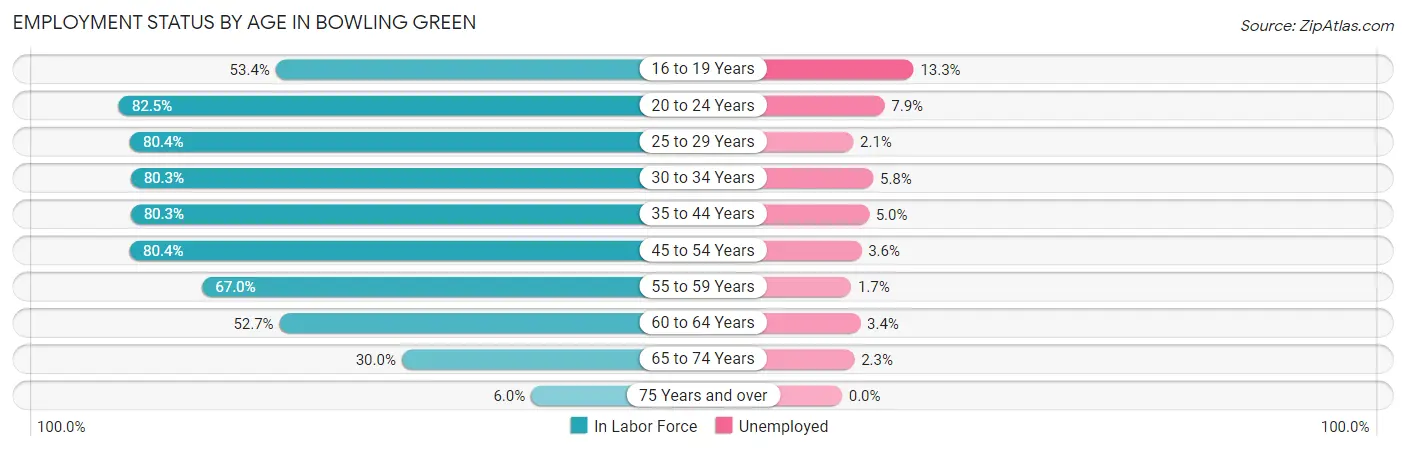
| Age Bracket | In Labor Force | Unemployed |
| 16 to 19 Years | 3,333 (53.4%) | 443 (13.3%) |
| 20 to 24 Years | 9,783 (82.5%) | 773 (7.9%) |
| 25 to 29 Years | 5,056 (80.4%) | 106 (2.1%) |
| 30 to 34 Years | 3,850 (80.3%) | 223 (5.8%) |
| 35 to 44 Years | 6,993 (80.3%) | 350 (5.0%) |
| 45 to 54 Years | 5,019 (80.4%) | 181 (3.6%) |
| 55 to 59 Years | 2,074 (67.0%) | 35 (1.7%) |
| 60 to 64 Years | 1,628 (52.7%) | 55 (3.4%) |
| 65 to 74 Years | 1,389 (30.0%) | 32 (2.3%) |
| 75 Years and over | 201 (6.0%) | 0 (0.0%) |
| Total | 39,297 (67.4%) | 2,201 (5.6%) |
Employment Status by Educational Attainment in Bowling Green
According to labor force statistics for Bowling Green, 76.4% of individuals (24,615) out of the total population between 25 and 64 years of age (32,218) are in the labor force, with 3.9% or 960 of them being unemployed. The group with the highest labor force participation rate are those with the educational attainment of bachelor's degree or higher, with 87.8% or 8,694 individuals in the labor force. Within the labor force, individuals with high school diploma education have the highest percentage of unemployment, with 6.2% or 353 of them being unemployed.
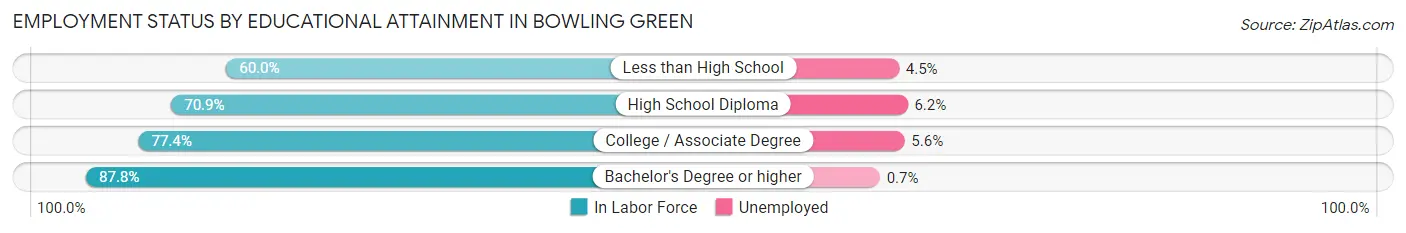
| Educational Attainment | In Labor Force | Unemployed |
| Less than High School | 2,848 (60.0%) | 214 (4.5%) |
| High School Diploma | 5,696 (70.9%) | 498 (6.2%) |
| College / Associate Degree | 7,381 (77.4%) | 534 (5.6%) |
| Bachelor's Degree or higher | 8,694 (87.8%) | 69 (0.7%) |
| Total | 24,615 (76.4%) | 1,257 (3.9%) |
Employment Occupations by Sex in Bowling Green
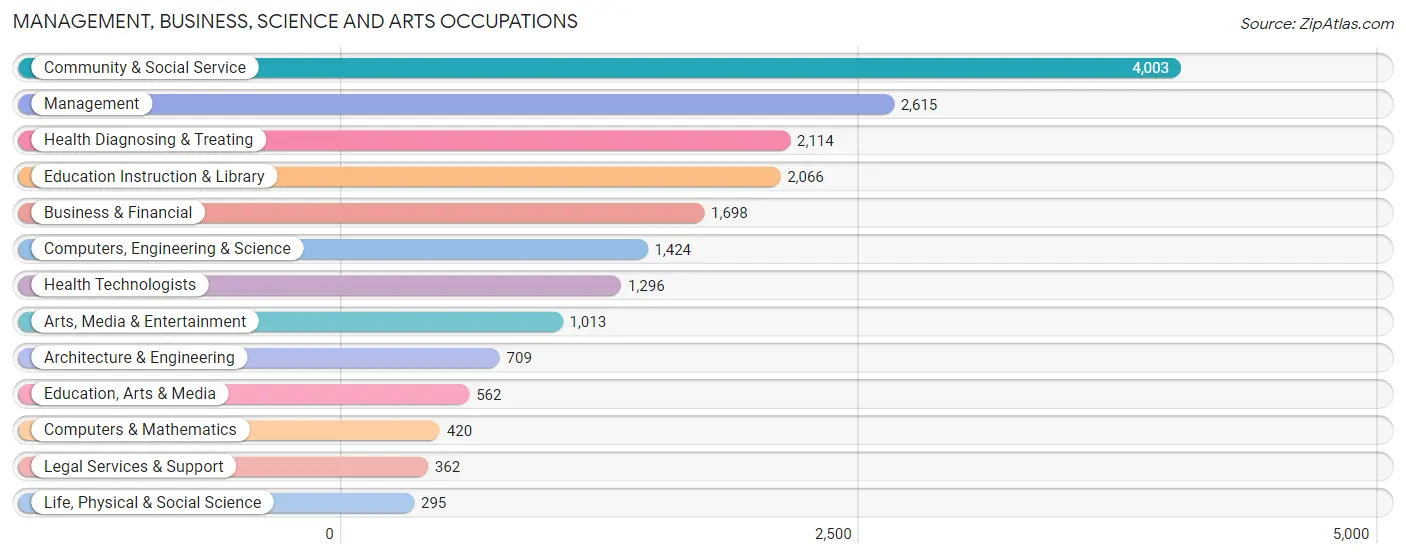
Management, Business, Science and Arts Occupations
The most common Management, Business, Science and Arts occupations in Bowling Green are Community & Social Service (4,003 | 10.8%), Management (2,615 | 7.0%), Health Diagnosing & Treating (2,114 | 5.7%), Education Instruction & Library (2,066 | 5.6%), and Business & Financial (1,698 | 4.6%).
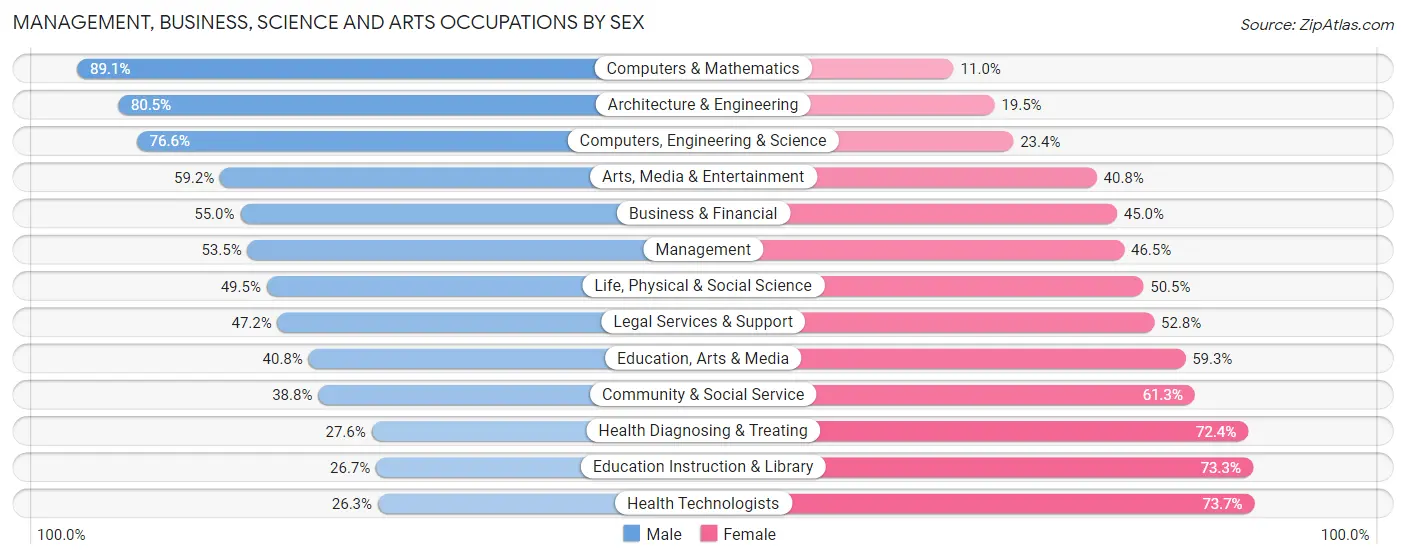
Management, Business, Science and Arts Occupations by Sex
Within the Management, Business, Science and Arts occupations in Bowling Green, the most male-oriented occupations are Computers & Mathematics (89.0%), Architecture & Engineering (80.5%), and Computers, Engineering & Science (76.6%), while the most female-oriented occupations are Health Technologists (73.7%), Education Instruction & Library (73.3%), and Health Diagnosing & Treating (72.4%).
| Occupation | Male | Female |
| Management | 1,399 (53.5%) | 1,216 (46.5%) |
| Business & Financial | 934 (55.0%) | 764 (45.0%) |
| Computers, Engineering & Science | 1,091 (76.6%) | 333 (23.4%) |
| Computers & Mathematics | 374 (89.0%) | 46 (11.0%) |
| Architecture & Engineering | 571 (80.5%) | 138 (19.5%) |
| Life, Physical & Social Science | 146 (49.5%) | 149 (50.5%) |
| Community & Social Service | 1,551 (38.8%) | 2,452 (61.3%) |
| Education, Arts & Media | 229 (40.7%) | 333 (59.3%) |
| Legal Services & Support | 171 (47.2%) | 191 (52.8%) |
| Education Instruction & Library | 551 (26.7%) | 1,515 (73.3%) |
| Arts, Media & Entertainment | 600 (59.2%) | 413 (40.8%) |
| Health Diagnosing & Treating | 584 (27.6%) | 1,530 (72.4%) |
| Health Technologists | 341 (26.3%) | 955 (73.7%) |
| Total (Category) | 5,559 (46.9%) | 6,295 (53.1%) |
| Total (Overall) | 19,003 (51.2%) | 18,101 (48.8%) |
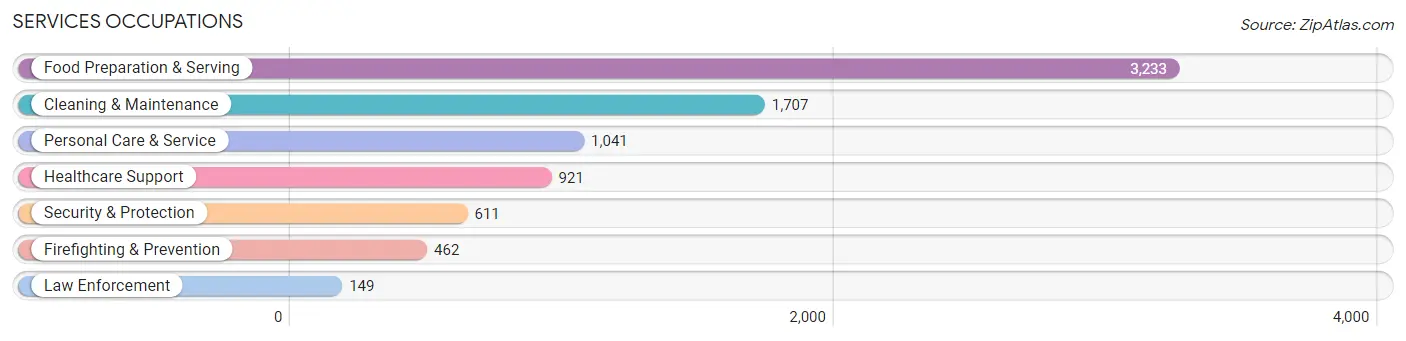
Services Occupations
The most common Services occupations in Bowling Green are Food Preparation & Serving (3,233 | 8.7%), Cleaning & Maintenance (1,707 | 4.6%), Personal Care & Service (1,041 | 2.8%), Healthcare Support (921 | 2.5%), and Security & Protection (611 | 1.7%).
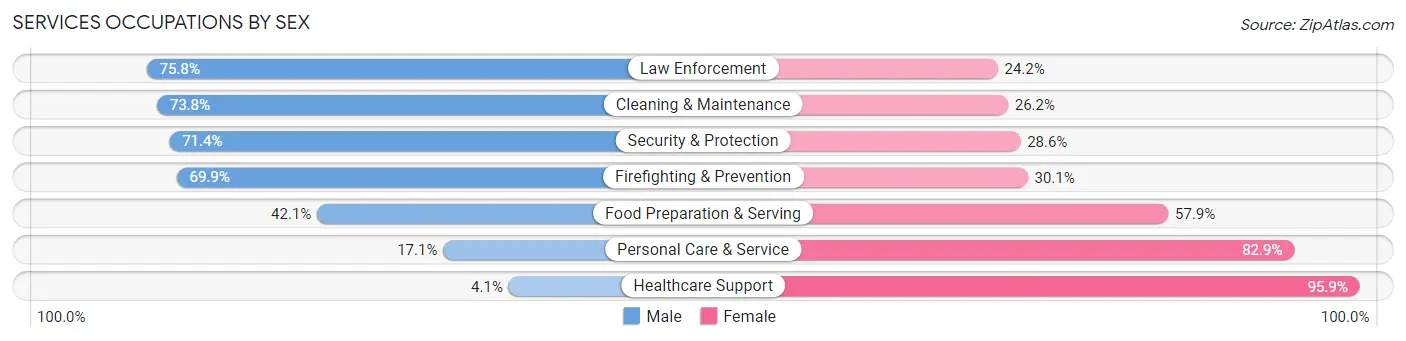
Services Occupations by Sex
Within the Services occupations in Bowling Green, the most male-oriented occupations are Law Enforcement (75.8%), Cleaning & Maintenance (73.8%), and Security & Protection (71.4%), while the most female-oriented occupations are Healthcare Support (95.9%), Personal Care & Service (82.9%), and Food Preparation & Serving (57.9%).
| Occupation | Male | Female |
| Healthcare Support | 38 (4.1%) | 883 (95.9%) |
| Security & Protection | 436 (71.4%) | 175 (28.6%) |
| Firefighting & Prevention | 323 (69.9%) | 139 (30.1%) |
| Law Enforcement | 113 (75.8%) | 36 (24.2%) |
| Food Preparation & Serving | 1,360 (42.1%) | 1,873 (57.9%) |
| Cleaning & Maintenance | 1,260 (73.8%) | 447 (26.2%) |
| Personal Care & Service | 178 (17.1%) | 863 (82.9%) |
| Total (Category) | 3,272 (43.5%) | 4,241 (56.5%) |
| Total (Overall) | 19,003 (51.2%) | 18,101 (48.8%) |
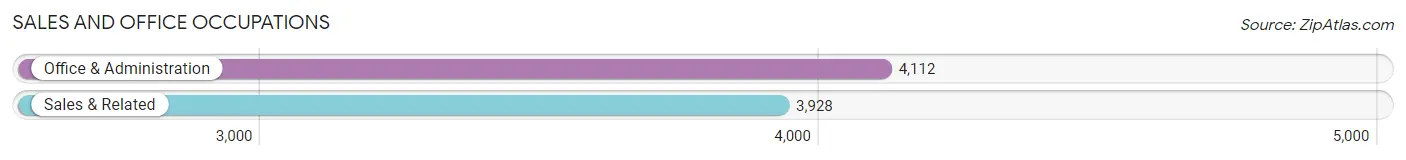
Sales and Office Occupations
The most common Sales and Office occupations in Bowling Green are Office & Administration (4,112 | 11.1%), and Sales & Related (3,928 | 10.6%).
Sales and Office Occupations by Sex
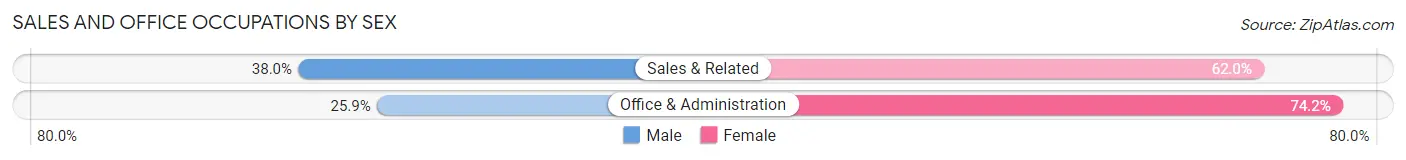
| Occupation | Male | Female |
| Sales & Related | 1,491 (38.0%) | 2,437 (62.0%) |
| Office & Administration | 1,063 (25.9%) | 3,049 (74.2%) |
| Total (Category) | 2,554 (31.8%) | 5,486 (68.2%) |
| Total (Overall) | 19,003 (51.2%) | 18,101 (48.8%) |
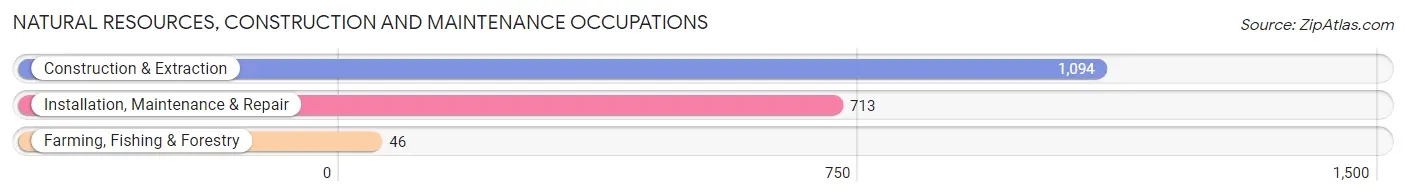
Natural Resources, Construction and Maintenance Occupations
The most common Natural Resources, Construction and Maintenance occupations in Bowling Green are Construction & Extraction (1,094 | 2.9%), Installation, Maintenance & Repair (713 | 1.9%), and Farming, Fishing & Forestry (46 | 0.1%).
Natural Resources, Construction and Maintenance Occupations by Sex
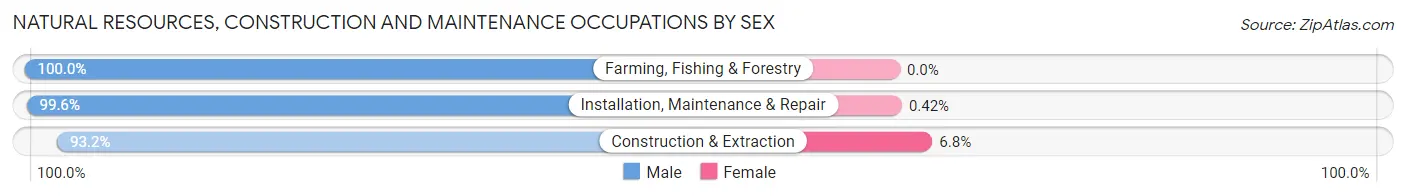
| Occupation | Male | Female |
| Farming, Fishing & Forestry | 46 (100.0%) | 0 (0.0%) |
| Construction & Extraction | 1,020 (93.2%) | 74 (6.8%) |
| Installation, Maintenance & Repair | 710 (99.6%) | 3 (0.4%) |
| Total (Category) | 1,776 (95.8%) | 77 (4.2%) |
| Total (Overall) | 19,003 (51.2%) | 18,101 (48.8%) |
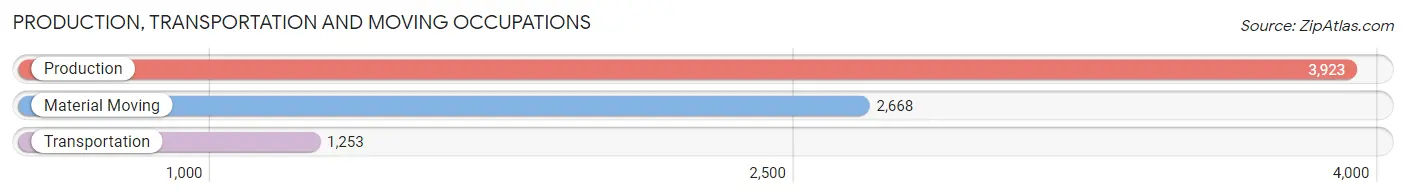
Production, Transportation and Moving Occupations
The most common Production, Transportation and Moving occupations in Bowling Green are Production (3,923 | 10.6%), Material Moving (2,668 | 7.2%), and Transportation (1,253 | 3.4%).
Production, Transportation and Moving Occupations by Sex
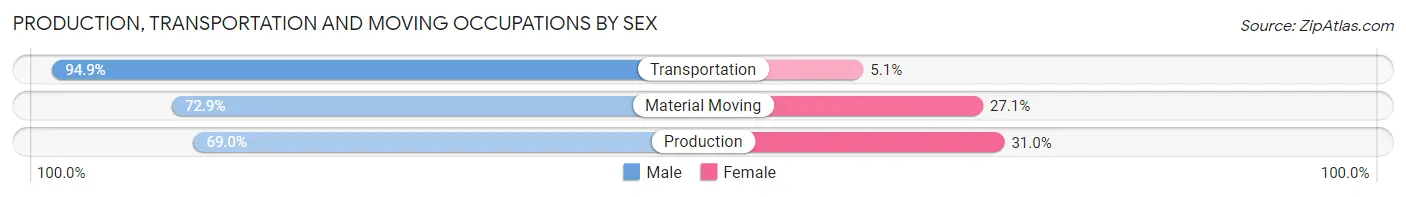
| Occupation | Male | Female |
| Production | 2,707 (69.0%) | 1,216 (31.0%) |
| Transportation | 1,189 (94.9%) | 64 (5.1%) |
| Material Moving | 1,946 (72.9%) | 722 (27.1%) |
| Total (Category) | 5,842 (74.5%) | 2,002 (25.5%) |
| Total (Overall) | 19,003 (51.2%) | 18,101 (48.8%) |
Employment Industries by Sex in Bowling Green
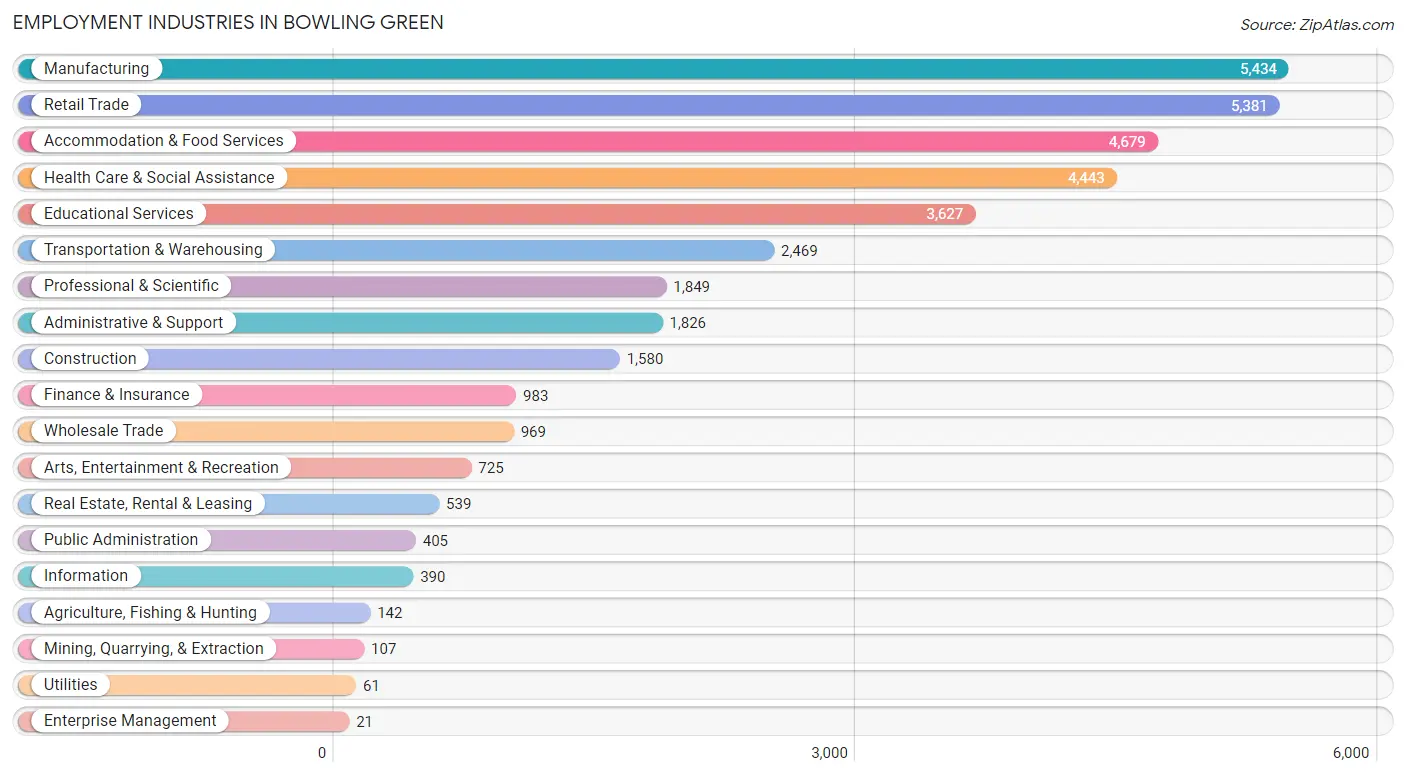
Employment Industries in Bowling Green
The major employment industries in Bowling Green include Manufacturing (5,434 | 14.6%), Retail Trade (5,381 | 14.5%), Accommodation & Food Services (4,679 | 12.6%), Health Care & Social Assistance (4,443 | 12.0%), and Educational Services (3,627 | 9.8%).
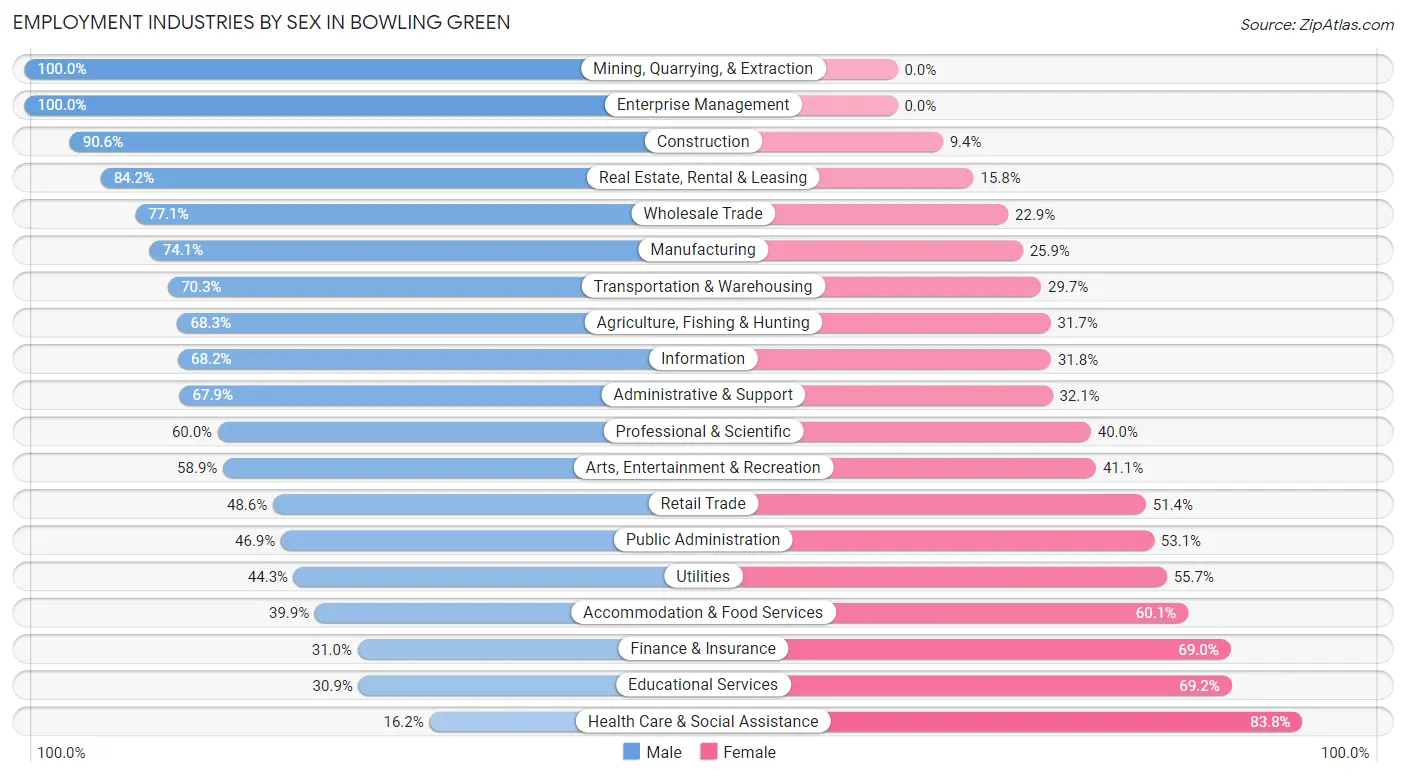
Employment Industries by Sex in Bowling Green
The Bowling Green industries that see more men than women are Mining, Quarrying, & Extraction (100.0%), Enterprise Management (100.0%), and Construction (90.6%), whereas the industries that tend to have a higher number of women are Health Care & Social Assistance (83.8%), Educational Services (69.2%), and Finance & Insurance (69.0%).
| Industry | Male | Female |
| Agriculture, Fishing & Hunting | 97 (68.3%) | 45 (31.7%) |
| Mining, Quarrying, & Extraction | 107 (100.0%) | 0 (0.0%) |
| Construction | 1,432 (90.6%) | 148 (9.4%) |
| Manufacturing | 4,025 (74.1%) | 1,409 (25.9%) |
| Wholesale Trade | 747 (77.1%) | 222 (22.9%) |
| Retail Trade | 2,614 (48.6%) | 2,767 (51.4%) |
| Transportation & Warehousing | 1,735 (70.3%) | 734 (29.7%) |
| Utilities | 27 (44.3%) | 34 (55.7%) |
| Information | 266 (68.2%) | 124 (31.8%) |
| Finance & Insurance | 305 (31.0%) | 678 (69.0%) |
| Real Estate, Rental & Leasing | 454 (84.2%) | 85 (15.8%) |
| Professional & Scientific | 1,109 (60.0%) | 740 (40.0%) |
| Enterprise Management | 21 (100.0%) | 0 (0.0%) |
| Administrative & Support | 1,240 (67.9%) | 586 (32.1%) |
| Educational Services | 1,119 (30.8%) | 2,508 (69.2%) |
| Health Care & Social Assistance | 719 (16.2%) | 3,724 (83.8%) |
| Arts, Entertainment & Recreation | 427 (58.9%) | 298 (41.1%) |
| Accommodation & Food Services | 1,866 (39.9%) | 2,813 (60.1%) |
| Public Administration | 190 (46.9%) | 215 (53.1%) |
| Total | 19,003 (51.2%) | 18,101 (48.8%) |
Education in Bowling Green
School Enrollment in Bowling Green
The most common levels of schooling among the 22,775 students in Bowling Green are college / undergraduate (10,182 | 44.7%), high school (3,183 | 14.0%), and elementary school (3,130 | 13.7%).
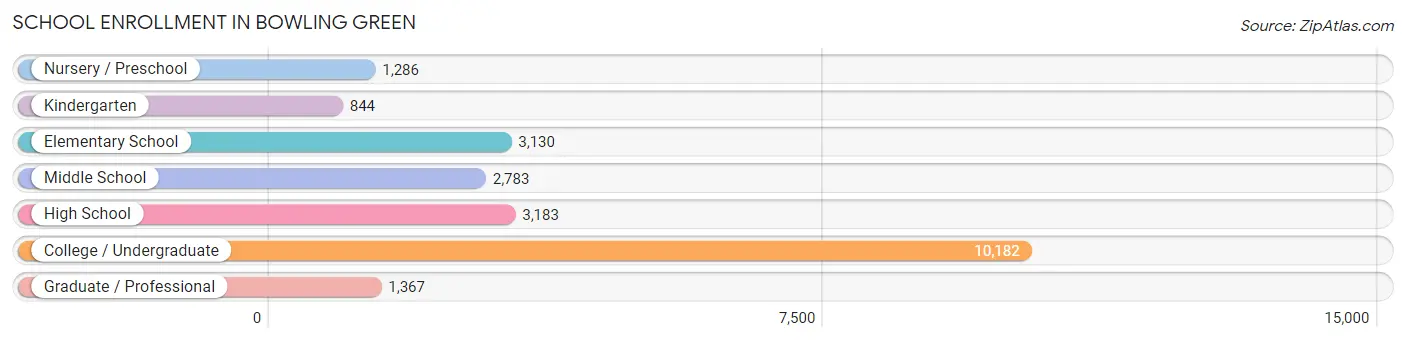
| School Level | # Students | % Students |
| Nursery / Preschool | 1,286 | 5.7% |
| Kindergarten | 844 | 3.7% |
| Elementary School | 3,130 | 13.7% |
| Middle School | 2,783 | 12.2% |
| High School | 3,183 | 14.0% |
| College / Undergraduate | 10,182 | 44.7% |
| Graduate / Professional | 1,367 | 6.0% |
| Total | 22,775 | 100.0% |
School Enrollment by Age by Funding Source in Bowling Green
Out of a total of 22,775 students who are enrolled in schools in Bowling Green, 2,050 (9.0%) attend a private institution, while the remaining 20,725 (91.0%) are enrolled in public schools. The age group of 3 to 4 year olds has the highest likelihood of being enrolled in private schools, with 419 (45.9% in the age bracket) enrolled. Conversely, the age group of 10 to 14 year olds has the lowest likelihood of being enrolled in a private school, with 3,549 (95.9% in the age bracket) attending a public institution.
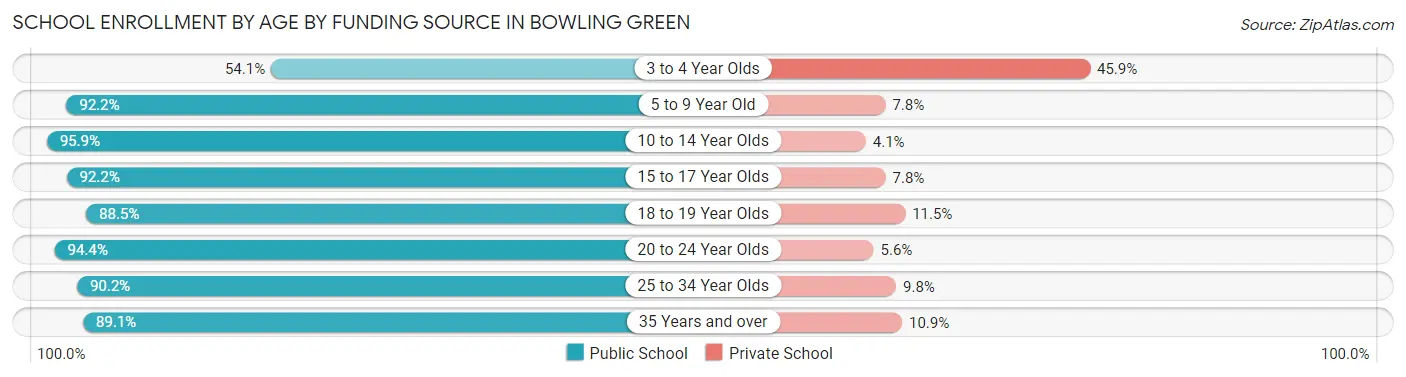
| Age Bracket | Public School | Private School |
| 3 to 4 Year Olds | 494 (54.1%) | 419 (45.9%) |
| 5 to 9 Year Old | 3,605 (92.2%) | 304 (7.8%) |
| 10 to 14 Year Olds | 3,549 (95.9%) | 153 (4.1%) |
| 15 to 17 Year Olds | 2,147 (92.2%) | 182 (7.8%) |
| 18 to 19 Year Olds | 3,617 (88.5%) | 468 (11.5%) |
| 20 to 24 Year Olds | 5,656 (94.4%) | 334 (5.6%) |
| 25 to 34 Year Olds | 1,285 (90.2%) | 139 (9.8%) |
| 35 Years and over | 377 (89.1%) | 46 (10.9%) |
| Total | 20,725 (91.0%) | 2,050 (9.0%) |
Educational Attainment by Field of Study in Bowling Green
Business (2,189 | 16.1%), science & technology (2,078 | 15.3%), education (1,880 | 13.8%), bio, nature & agricultural (1,175 | 8.6%), and social sciences (972 | 7.1%) are the most common fields of study among 13,605 individuals in Bowling Green who have obtained a bachelor's degree or higher.
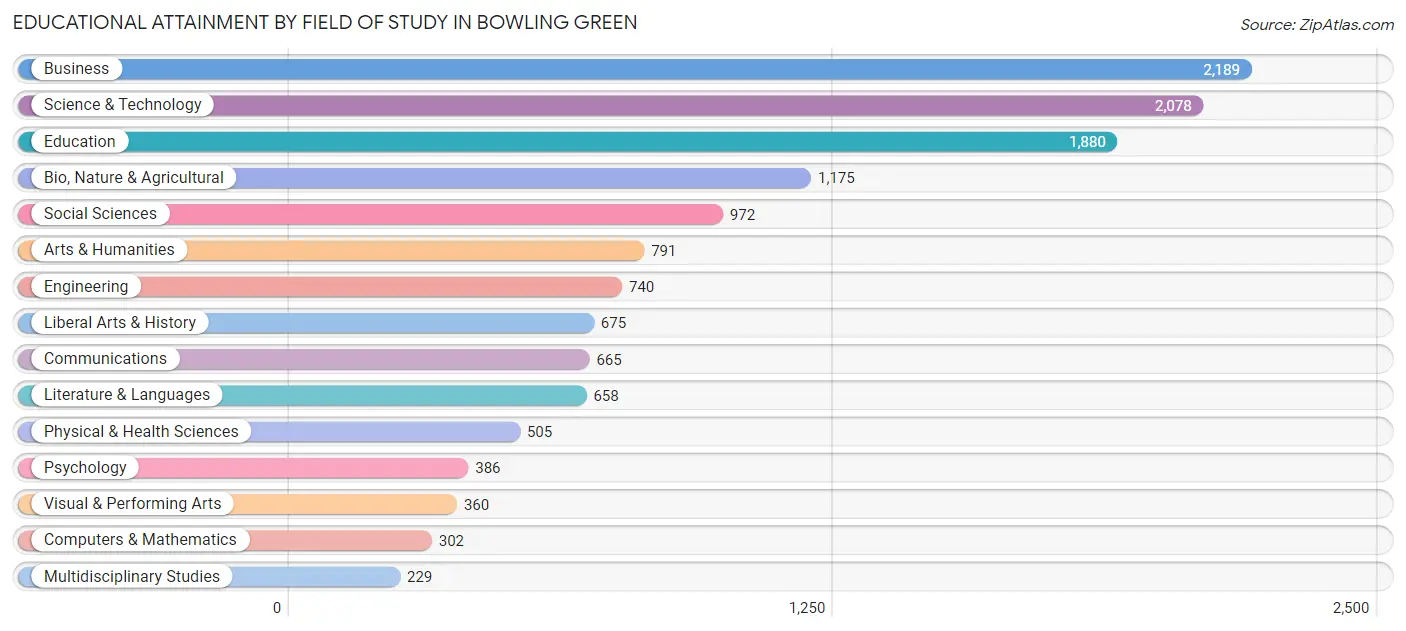
| Field of Study | # Graduates | % Graduates |
| Computers & Mathematics | 302 | 2.2% |
| Bio, Nature & Agricultural | 1,175 | 8.6% |
| Physical & Health Sciences | 505 | 3.7% |
| Psychology | 386 | 2.8% |
| Social Sciences | 972 | 7.1% |
| Engineering | 740 | 5.4% |
| Multidisciplinary Studies | 229 | 1.7% |
| Science & Technology | 2,078 | 15.3% |
| Business | 2,189 | 16.1% |
| Education | 1,880 | 13.8% |
| Literature & Languages | 658 | 4.8% |
| Liberal Arts & History | 675 | 5.0% |
| Visual & Performing Arts | 360 | 2.6% |
| Communications | 665 | 4.9% |
| Arts & Humanities | 791 | 5.8% |
| Total | 13,605 | 100.0% |
Transportation & Commute in Bowling Green
Vehicle Availability by Sex in Bowling Green
The most prevalent vehicle ownership categories in Bowling Green are males with 2 vehicles (7,842, accounting for 44.0%) and females with 2 vehicles (5,854, making up 49.7%).
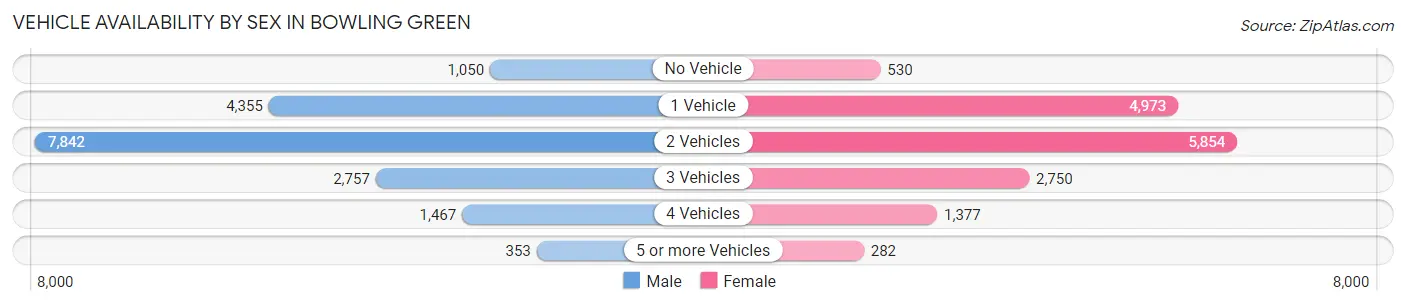
| Vehicles Available | Male | Female |
| No Vehicle | 1,050 (5.9%) | 530 (3.4%) |
| 1 Vehicle | 4,355 (24.4%) | 4,973 (31.5%) |
| 2 Vehicles | 7,842 (44.0%) | 5,854 (37.1%) |
| 3 Vehicles | 2,757 (15.5%) | 2,750 (17.4%) |
| 4 Vehicles | 1,467 (8.2%) | 1,377 (8.7%) |
| 5 or more Vehicles | 353 (2.0%) | 282 (1.8%) |
| Total | 17,824 (100.0%) | 15,766 (100.0%) |
Commute Time in Bowling Green
The most frequently occuring commute durations in Bowling Green are 10 to 14 minutes (7,626 commuters, 22.8%), 15 to 19 minutes (6,723 commuters, 20.1%), and 5 to 9 minutes (6,533 commuters, 19.5%).
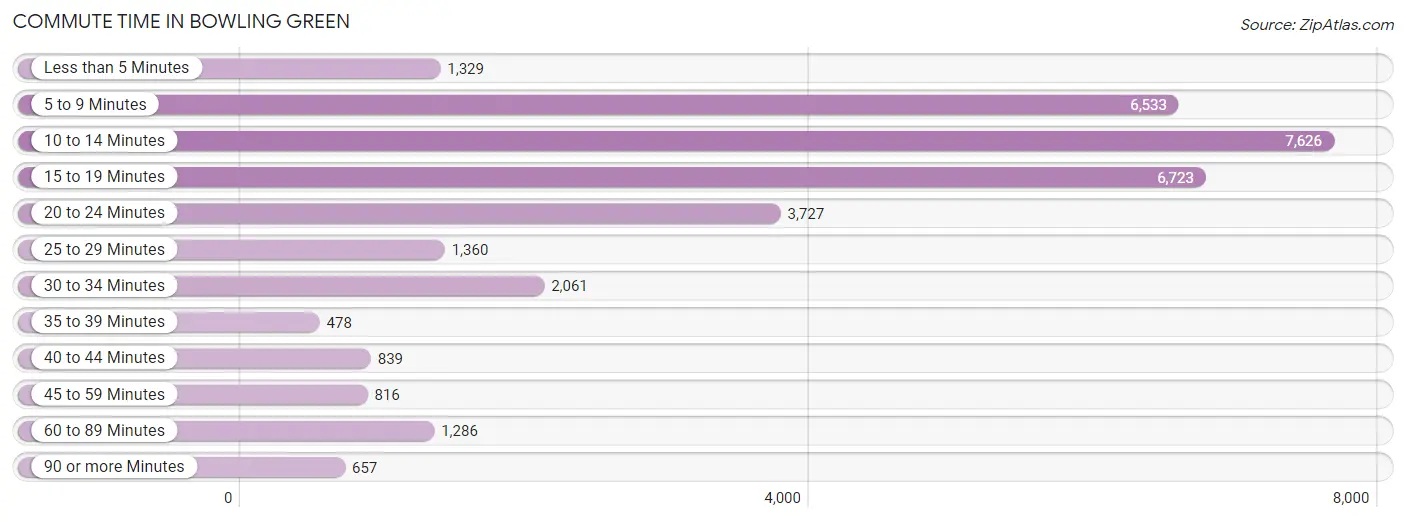
| Commute Time | # Commuters | % Commuters |
| Less than 5 Minutes | 1,329 | 4.0% |
| 5 to 9 Minutes | 6,533 | 19.5% |
| 10 to 14 Minutes | 7,626 | 22.8% |
| 15 to 19 Minutes | 6,723 | 20.1% |
| 20 to 24 Minutes | 3,727 | 11.2% |
| 25 to 29 Minutes | 1,360 | 4.1% |
| 30 to 34 Minutes | 2,061 | 6.2% |
| 35 to 39 Minutes | 478 | 1.4% |
| 40 to 44 Minutes | 839 | 2.5% |
| 45 to 59 Minutes | 816 | 2.4% |
| 60 to 89 Minutes | 1,286 | 3.8% |
| 90 or more Minutes | 657 | 2.0% |
Commute Time by Sex in Bowling Green
The most common commute times in Bowling Green are 10 to 14 minutes (3,558 commuters, 20.5%) for males and 10 to 14 minutes (4,068 commuters, 25.3%) for females.
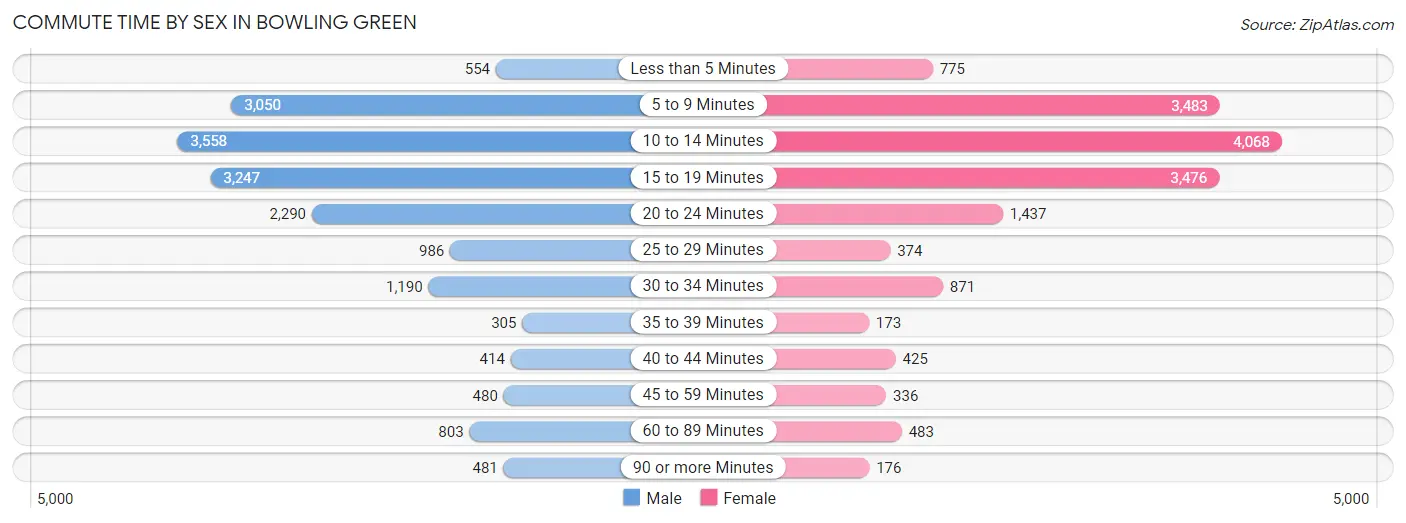
| Commute Time | Male | Female |
| Less than 5 Minutes | 554 (3.2%) | 775 (4.8%) |
| 5 to 9 Minutes | 3,050 (17.6%) | 3,483 (21.7%) |
| 10 to 14 Minutes | 3,558 (20.5%) | 4,068 (25.3%) |
| 15 to 19 Minutes | 3,247 (18.7%) | 3,476 (21.6%) |
| 20 to 24 Minutes | 2,290 (13.2%) | 1,437 (8.9%) |
| 25 to 29 Minutes | 986 (5.7%) | 374 (2.3%) |
| 30 to 34 Minutes | 1,190 (6.9%) | 871 (5.4%) |
| 35 to 39 Minutes | 305 (1.8%) | 173 (1.1%) |
| 40 to 44 Minutes | 414 (2.4%) | 425 (2.6%) |
| 45 to 59 Minutes | 480 (2.8%) | 336 (2.1%) |
| 60 to 89 Minutes | 803 (4.6%) | 483 (3.0%) |
| 90 or more Minutes | 481 (2.8%) | 176 (1.1%) |
Time of Departure to Work by Sex in Bowling Green
The most frequent times of departure to work in Bowling Green are 4:00 PM to 11:59 PM (2,447, 14.1%) for males and 7:30 AM to 7:59 AM (2,428, 15.1%) for females.
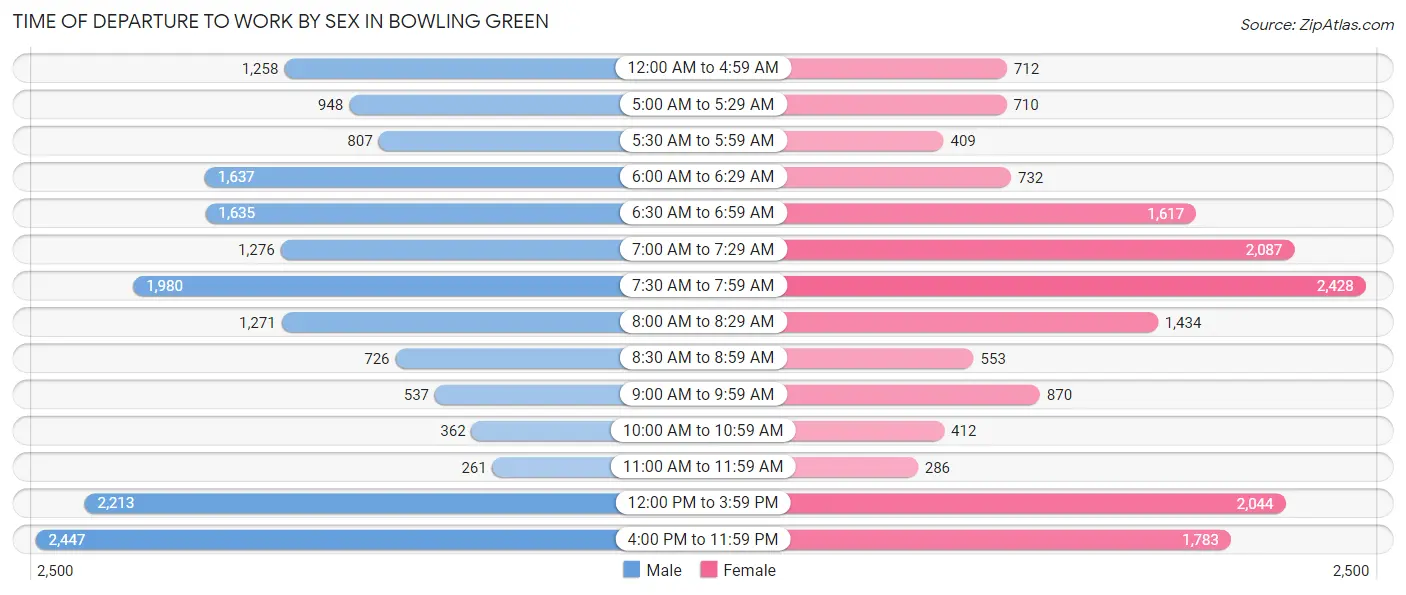
| Time of Departure | Male | Female |
| 12:00 AM to 4:59 AM | 1,258 (7.2%) | 712 (4.4%) |
| 5:00 AM to 5:29 AM | 948 (5.5%) | 710 (4.4%) |
| 5:30 AM to 5:59 AM | 807 (4.6%) | 409 (2.5%) |
| 6:00 AM to 6:29 AM | 1,637 (9.4%) | 732 (4.5%) |
| 6:30 AM to 6:59 AM | 1,635 (9.4%) | 1,617 (10.1%) |
| 7:00 AM to 7:29 AM | 1,276 (7.3%) | 2,087 (13.0%) |
| 7:30 AM to 7:59 AM | 1,980 (11.4%) | 2,428 (15.1%) |
| 8:00 AM to 8:29 AM | 1,271 (7.3%) | 1,434 (8.9%) |
| 8:30 AM to 8:59 AM | 726 (4.2%) | 553 (3.4%) |
| 9:00 AM to 9:59 AM | 537 (3.1%) | 870 (5.4%) |
| 10:00 AM to 10:59 AM | 362 (2.1%) | 412 (2.6%) |
| 11:00 AM to 11:59 AM | 261 (1.5%) | 286 (1.8%) |
| 12:00 PM to 3:59 PM | 2,213 (12.8%) | 2,044 (12.7%) |
| 4:00 PM to 11:59 PM | 2,447 (14.1%) | 1,783 (11.1%) |
| Total | 17,358 (100.0%) | 16,077 (100.0%) |
Housing Occupancy in Bowling Green
Occupancy by Ownership in Bowling Green
Of the total 28,686 dwellings in Bowling Green, owner-occupied units account for 10,864 (37.9%), while renter-occupied units make up 17,822 (62.1%).
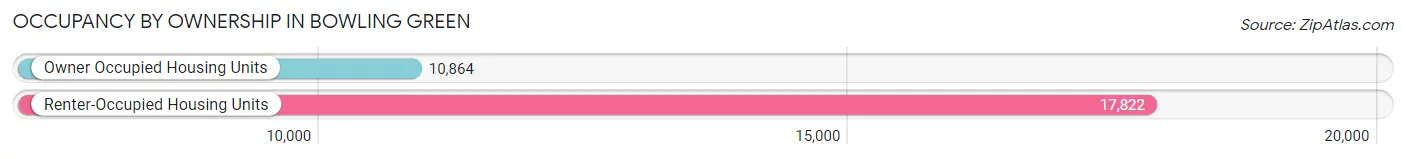
| Occupancy | # Housing Units | % Housing Units |
| Owner Occupied Housing Units | 10,864 | 37.9% |
| Renter-Occupied Housing Units | 17,822 | 62.1% |
| Total Occupied Housing Units | 28,686 | 100.0% |
Occupancy by Household Size in Bowling Green
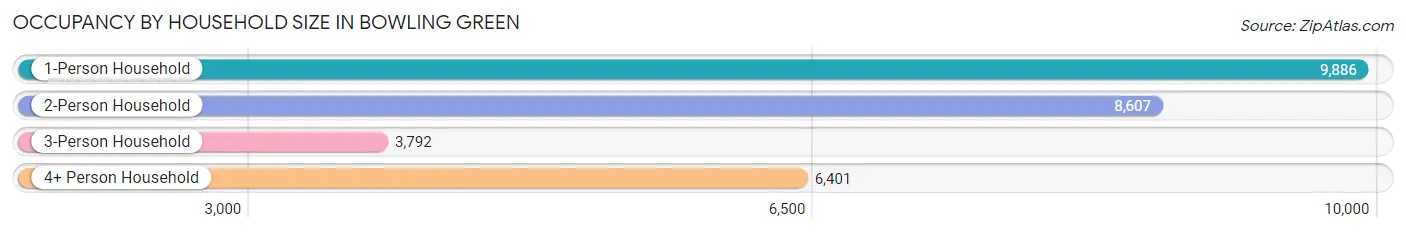
| Household Size | # Housing Units | % Housing Units |
| 1-Person Household | 9,886 | 34.5% |
| 2-Person Household | 8,607 | 30.0% |
| 3-Person Household | 3,792 | 13.2% |
| 4+ Person Household | 6,401 | 22.3% |
| Total Housing Units | 28,686 | 100.0% |
Occupancy by Ownership by Household Size in Bowling Green
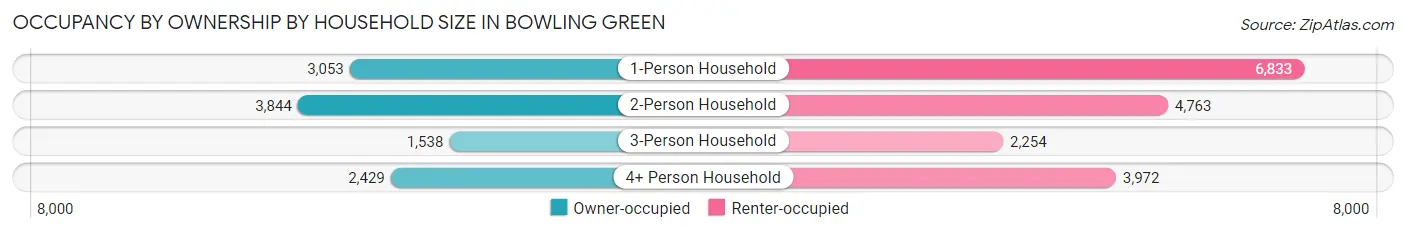
| Household Size | Owner-occupied | Renter-occupied |
| 1-Person Household | 3,053 (30.9%) | 6,833 (69.1%) |
| 2-Person Household | 3,844 (44.7%) | 4,763 (55.3%) |
| 3-Person Household | 1,538 (40.6%) | 2,254 (59.4%) |
| 4+ Person Household | 2,429 (38.0%) | 3,972 (62.1%) |
| Total Housing Units | 10,864 (37.9%) | 17,822 (62.1%) |
Occupancy by Educational Attainment in Bowling Green
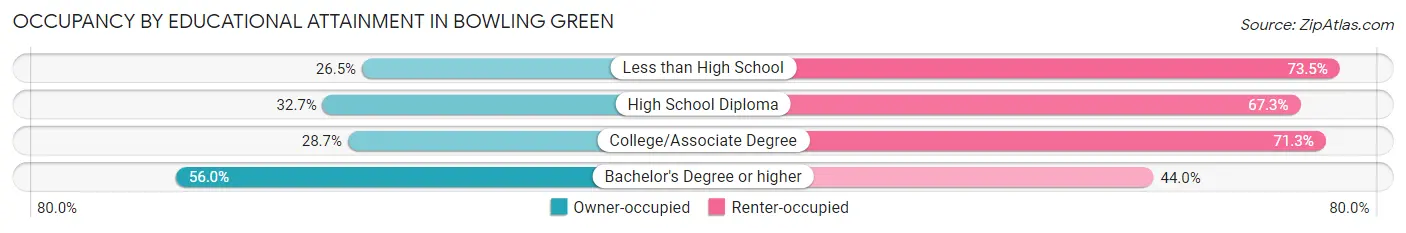
| Household Size | Owner-occupied | Renter-occupied |
| Less than High School | 889 (26.5%) | 2,466 (73.5%) |
| High School Diploma | 2,103 (32.7%) | 4,324 (67.3%) |
| College/Associate Degree | 2,860 (28.7%) | 7,094 (71.3%) |
| Bachelor's Degree or higher | 5,012 (56.0%) | 3,938 (44.0%) |
Occupancy by Age of Householder in Bowling Green
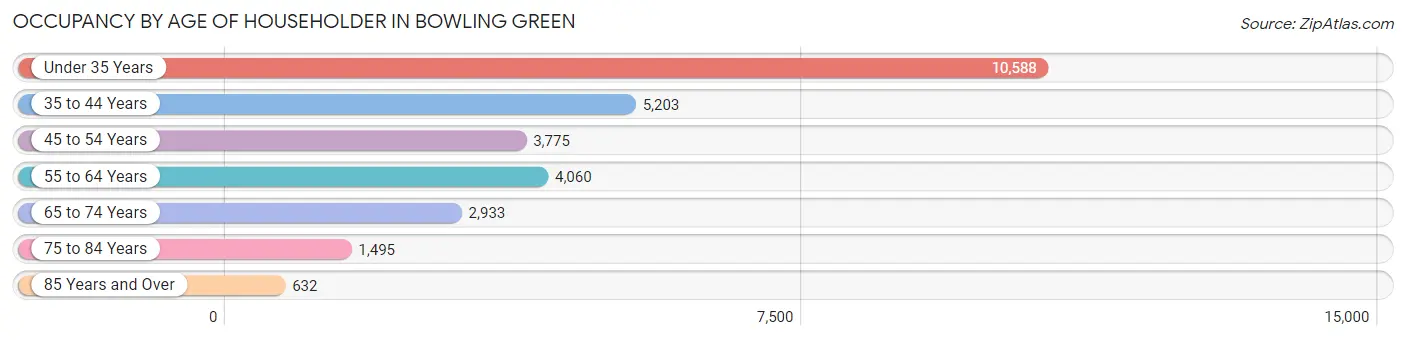
| Age Bracket | # Households | % Households |
| Under 35 Years | 10,588 | 36.9% |
| 35 to 44 Years | 5,203 | 18.1% |
| 45 to 54 Years | 3,775 | 13.2% |
| 55 to 64 Years | 4,060 | 14.1% |
| 65 to 74 Years | 2,933 | 10.2% |
| 75 to 84 Years | 1,495 | 5.2% |
| 85 Years and Over | 632 | 2.2% |
| Total | 28,686 | 100.0% |
Housing Finances in Bowling Green
Median Income by Occupancy in Bowling Green
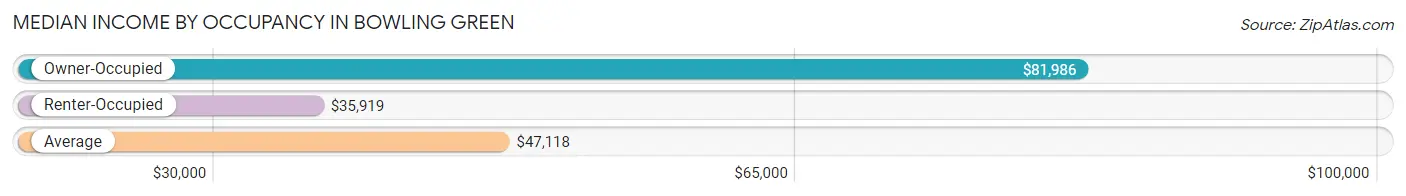
| Occupancy Type | # Households | Median Income |
| Owner-Occupied | 10,864 (37.9%) | $81,986 |
| Renter-Occupied | 17,822 (62.1%) | $35,919 |
| Average | 28,686 (100.0%) | $47,118 |
Occupancy by Householder Income Bracket in Bowling Green
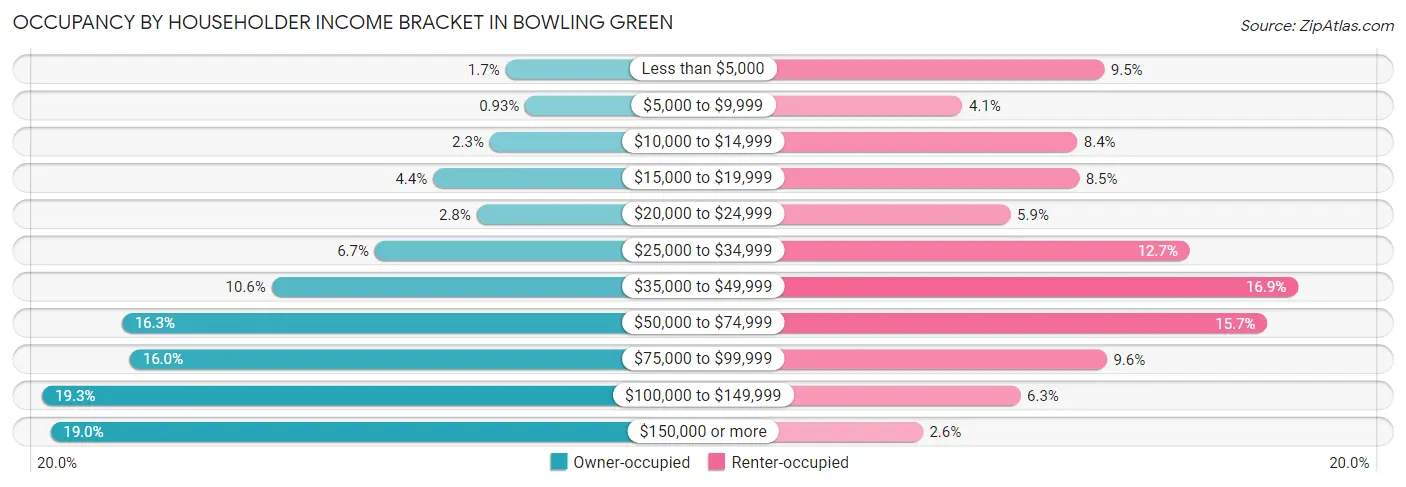
| Income Bracket | Owner-occupied | Renter-occupied |
| Less than $5,000 | 182 (1.7%) | 1,686 (9.5%) |
| $5,000 to $9,999 | 101 (0.9%) | 724 (4.1%) |
| $10,000 to $14,999 | 248 (2.3%) | 1,503 (8.4%) |
| $15,000 to $19,999 | 482 (4.4%) | 1,515 (8.5%) |
| $20,000 to $24,999 | 302 (2.8%) | 1,049 (5.9%) |
| $25,000 to $34,999 | 724 (6.7%) | 2,269 (12.7%) |
| $35,000 to $49,999 | 1,151 (10.6%) | 3,005 (16.9%) |
| $50,000 to $74,999 | 1,771 (16.3%) | 2,796 (15.7%) |
| $75,000 to $99,999 | 1,737 (16.0%) | 1,704 (9.6%) |
| $100,000 to $149,999 | 2,100 (19.3%) | 1,117 (6.3%) |
| $150,000 or more | 2,066 (19.0%) | 454 (2.5%) |
| Total | 10,864 (100.0%) | 17,822 (100.0%) |
Monthly Housing Cost Tiers in Bowling Green
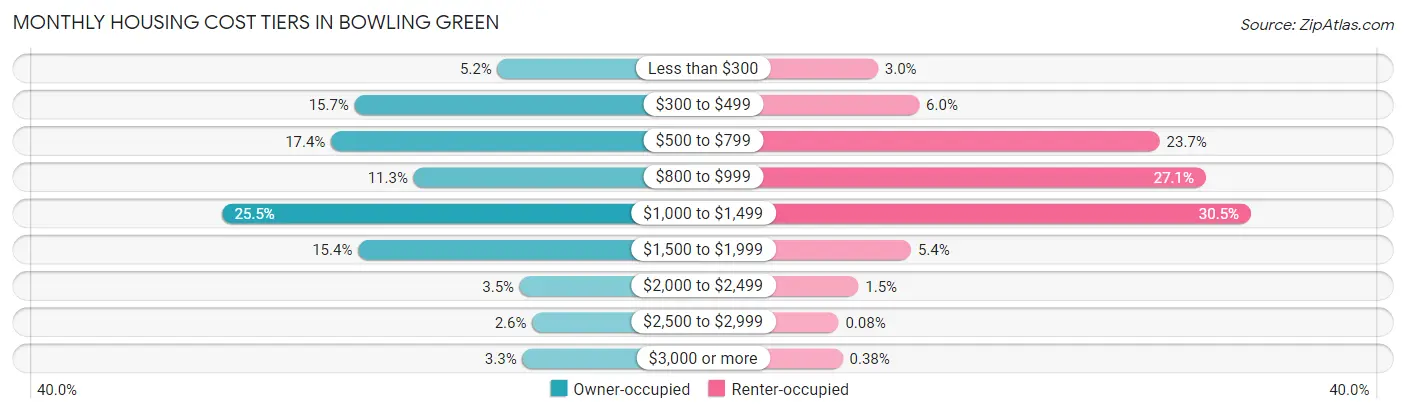
| Monthly Cost | Owner-occupied | Renter-occupied |
| Less than $300 | 561 (5.2%) | 531 (3.0%) |
| $300 to $499 | 1,705 (15.7%) | 1,073 (6.0%) |
| $500 to $799 | 1,892 (17.4%) | 4,230 (23.7%) |
| $800 to $999 | 1,232 (11.3%) | 4,835 (27.1%) |
| $1,000 to $1,499 | 2,770 (25.5%) | 5,427 (30.4%) |
| $1,500 to $1,999 | 1,676 (15.4%) | 966 (5.4%) |
| $2,000 to $2,499 | 382 (3.5%) | 275 (1.5%) |
| $2,500 to $2,999 | 284 (2.6%) | 14 (0.1%) |
| $3,000 or more | 362 (3.3%) | 68 (0.4%) |
| Total | 10,864 (100.0%) | 17,822 (100.0%) |
Physical Housing Characteristics in Bowling Green
Housing Structures in Bowling Green
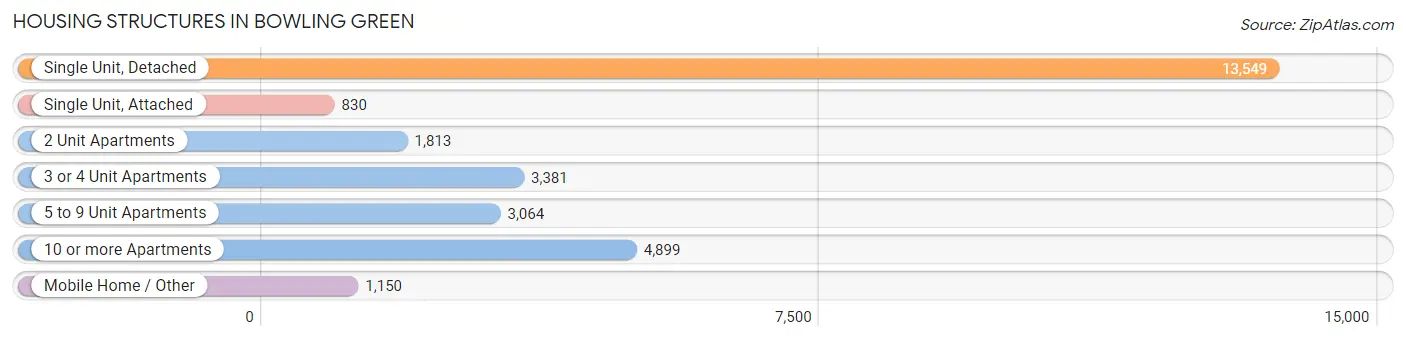
| Structure Type | # Housing Units | % Housing Units |
| Single Unit, Detached | 13,549 | 47.2% |
| Single Unit, Attached | 830 | 2.9% |
| 2 Unit Apartments | 1,813 | 6.3% |
| 3 or 4 Unit Apartments | 3,381 | 11.8% |
| 5 to 9 Unit Apartments | 3,064 | 10.7% |
| 10 or more Apartments | 4,899 | 17.1% |
| Mobile Home / Other | 1,150 | 4.0% |
| Total | 28,686 | 100.0% |
Housing Structures by Occupancy in Bowling Green
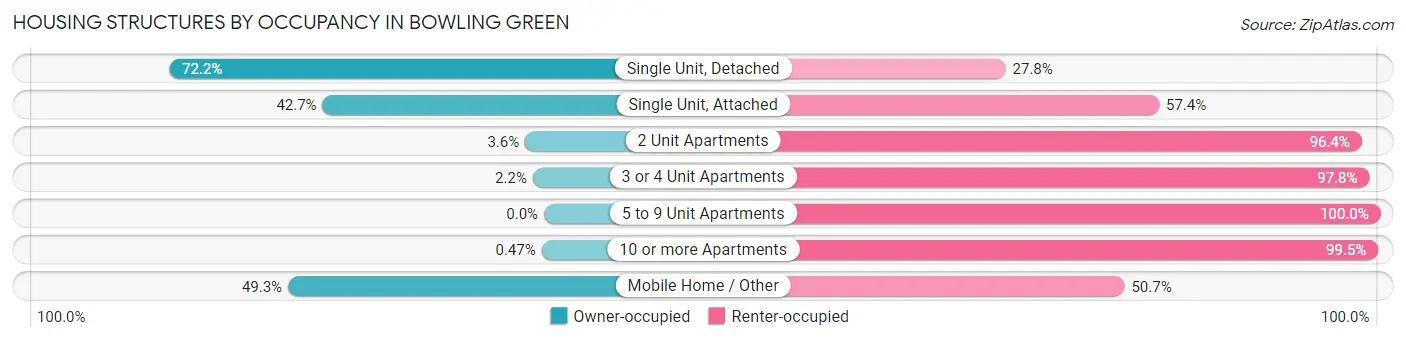
| Structure Type | Owner-occupied | Renter-occupied |
| Single Unit, Detached | 9,781 (72.2%) | 3,768 (27.8%) |
| Single Unit, Attached | 354 (42.6%) | 476 (57.4%) |
| 2 Unit Apartments | 66 (3.6%) | 1,747 (96.4%) |
| 3 or 4 Unit Apartments | 73 (2.2%) | 3,308 (97.8%) |
| 5 to 9 Unit Apartments | 0 (0.0%) | 3,064 (100.0%) |
| 10 or more Apartments | 23 (0.5%) | 4,876 (99.5%) |
| Mobile Home / Other | 567 (49.3%) | 583 (50.7%) |
| Total | 10,864 (37.9%) | 17,822 (62.1%) |
Housing Structures by Number of Rooms in Bowling Green
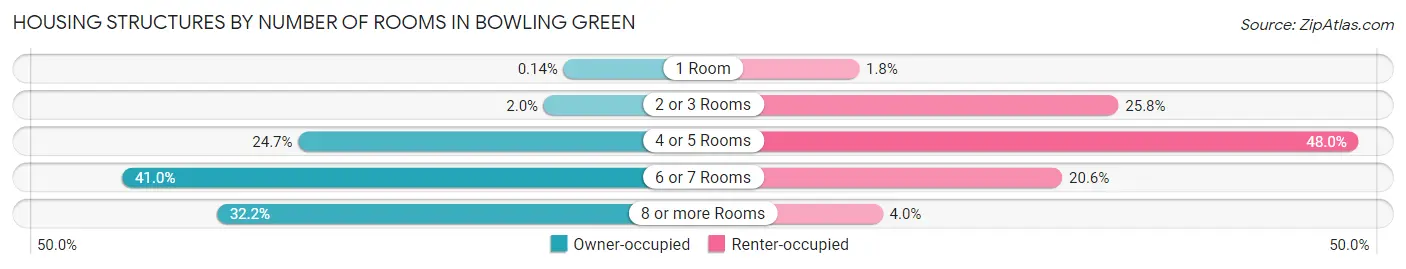
| Number of Rooms | Owner-occupied | Renter-occupied |
| 1 Room | 15 (0.1%) | 315 (1.8%) |
| 2 or 3 Rooms | 214 (2.0%) | 4,590 (25.8%) |
| 4 or 5 Rooms | 2,681 (24.7%) | 8,550 (48.0%) |
| 6 or 7 Rooms | 4,453 (41.0%) | 3,663 (20.5%) |
| 8 or more Rooms | 3,501 (32.2%) | 704 (4.0%) |
| Total | 10,864 (100.0%) | 17,822 (100.0%) |
Housing Structure by Heating Type in Bowling Green
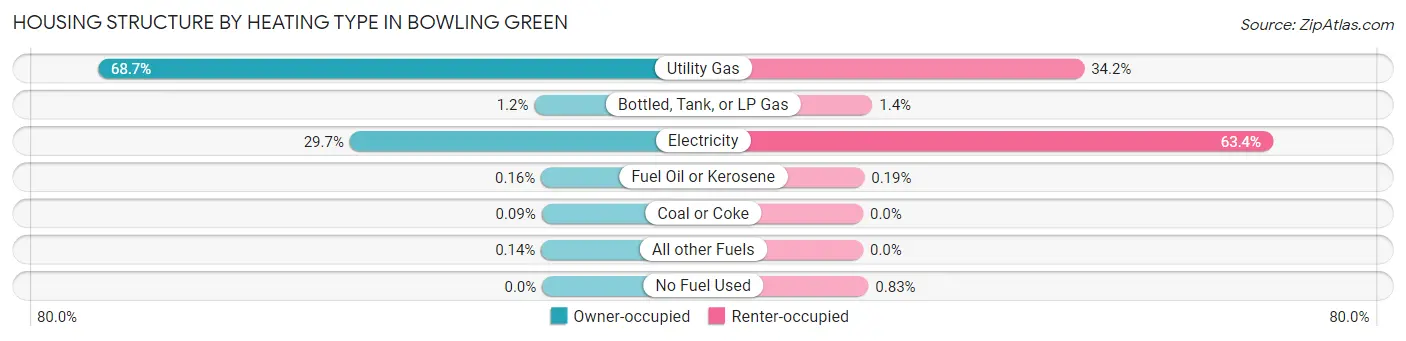
| Heating Type | Owner-occupied | Renter-occupied |
| Utility Gas | 7,460 (68.7%) | 6,094 (34.2%) |
| Bottled, Tank, or LP Gas | 131 (1.2%) | 256 (1.4%) |
| Electricity | 3,231 (29.7%) | 11,291 (63.3%) |
| Fuel Oil or Kerosene | 17 (0.2%) | 33 (0.2%) |
| Coal or Coke | 10 (0.1%) | 0 (0.0%) |
| All other Fuels | 15 (0.1%) | 0 (0.0%) |
| No Fuel Used | 0 (0.0%) | 148 (0.8%) |
| Total | 10,864 (100.0%) | 17,822 (100.0%) |
Household Vehicle Usage in Bowling Green
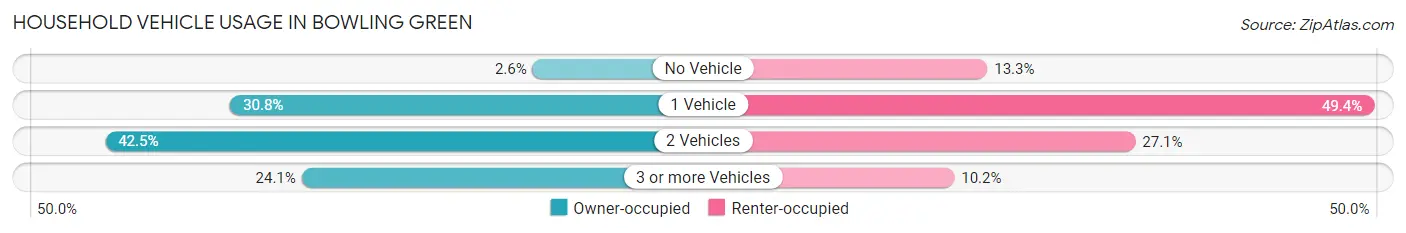
| Vehicles per Household | Owner-occupied | Renter-occupied |
| No Vehicle | 280 (2.6%) | 2,368 (13.3%) |
| 1 Vehicle | 3,347 (30.8%) | 8,803 (49.4%) |
| 2 Vehicles | 4,614 (42.5%) | 4,832 (27.1%) |
| 3 or more Vehicles | 2,623 (24.1%) | 1,819 (10.2%) |
| Total | 10,864 (100.0%) | 17,822 (100.0%) |
Real Estate & Mortgages in Bowling Green
Real Estate and Mortgage Overview in Bowling Green
| Characteristic | Without Mortgage | With Mortgage |
| Housing Units | 4,284 | 6,580 |
| Median Property Value | $223,700 | $208,000 |
| Median Household Income | $59,722 | $1,454 |
| Monthly Housing Costs | $504 | $362 |
| Real Estate Taxes | $1,763 | $250 |
Property Value by Mortgage Status in Bowling Green
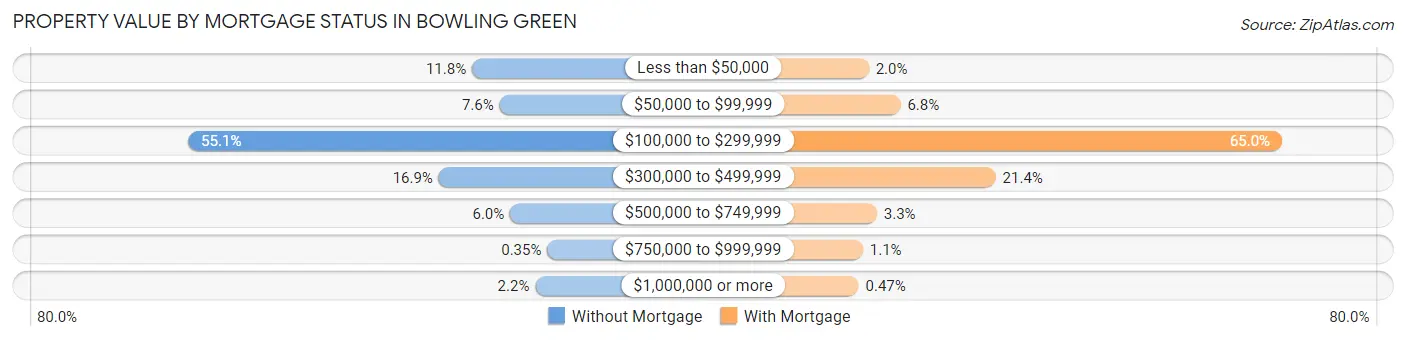
| Property Value | Without Mortgage | With Mortgage |
| Less than $50,000 | 507 (11.8%) | 132 (2.0%) |
| $50,000 to $99,999 | 327 (7.6%) | 450 (6.8%) |
| $100,000 to $299,999 | 2,359 (55.1%) | 4,275 (65.0%) |
| $300,000 to $499,999 | 724 (16.9%) | 1,405 (21.3%) |
| $500,000 to $749,999 | 258 (6.0%) | 214 (3.3%) |
| $750,000 to $999,999 | 15 (0.4%) | 73 (1.1%) |
| $1,000,000 or more | 94 (2.2%) | 31 (0.5%) |
| Total | 4,284 (100.0%) | 6,580 (100.0%) |
Household Income by Mortgage Status in Bowling Green
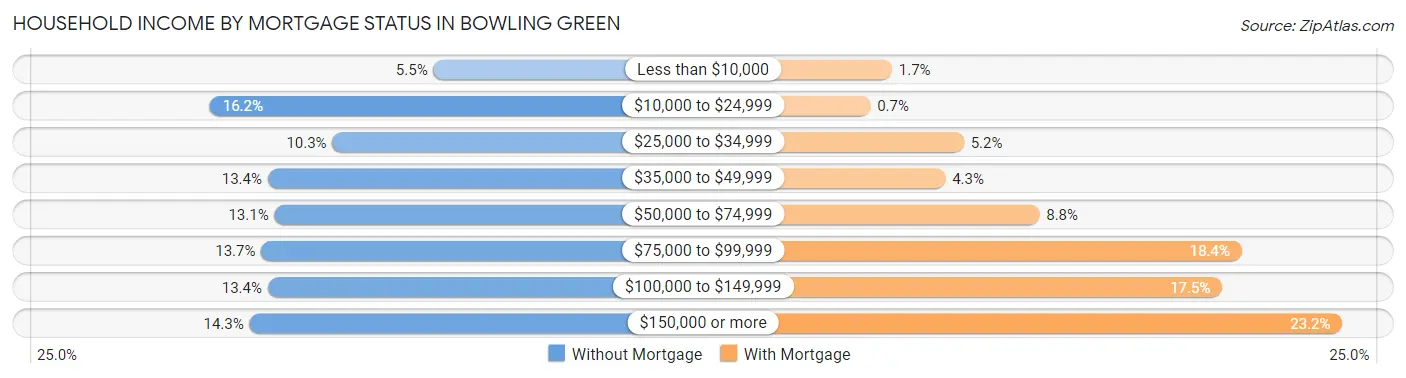
| Household Income | Without Mortgage | With Mortgage |
| Less than $10,000 | 237 (5.5%) | 114 (1.7%) |
| $10,000 to $24,999 | 693 (16.2%) | 46 (0.7%) |
| $25,000 to $34,999 | 443 (10.3%) | 339 (5.1%) |
| $35,000 to $49,999 | 575 (13.4%) | 281 (4.3%) |
| $50,000 to $74,999 | 561 (13.1%) | 576 (8.7%) |
| $75,000 to $99,999 | 588 (13.7%) | 1,210 (18.4%) |
| $100,000 to $149,999 | 575 (13.4%) | 1,149 (17.5%) |
| $150,000 or more | 612 (14.3%) | 1,525 (23.2%) |
| Total | 4,284 (100.0%) | 6,580 (100.0%) |
Property Value to Household Income Ratio in Bowling Green
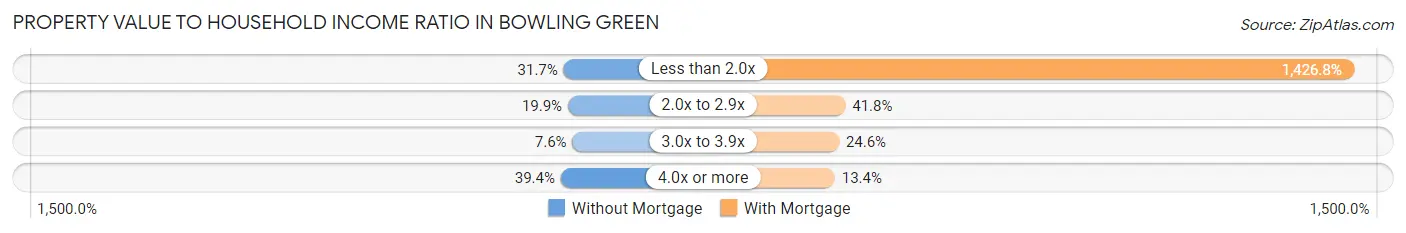
| Value-to-Income Ratio | Without Mortgage | With Mortgage |
| Less than 2.0x | 1,357 (31.7%) | 93,883 (1,426.8%) |
| 2.0x to 2.9x | 852 (19.9%) | 2,750 (41.8%) |
| 3.0x to 3.9x | 325 (7.6%) | 1,616 (24.6%) |
| 4.0x or more | 1,688 (39.4%) | 879 (13.4%) |
| Total | 4,284 (100.0%) | 6,580 (100.0%) |
Real Estate Taxes by Mortgage Status in Bowling Green
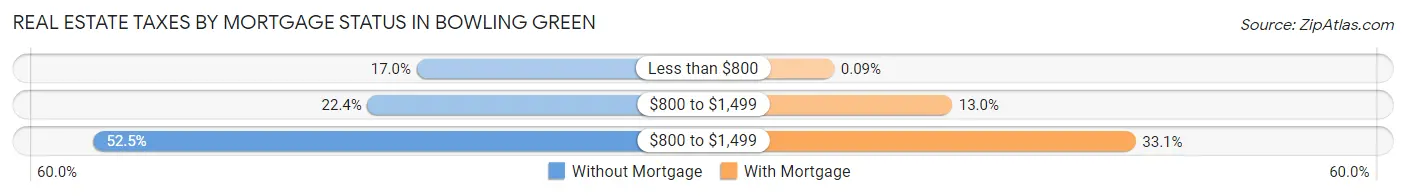
| Property Taxes | Without Mortgage | With Mortgage |
| Less than $800 | 729 (17.0%) | 6 (0.1%) |
| $800 to $1,499 | 960 (22.4%) | 856 (13.0%) |
| $800 to $1,499 | 2,247 (52.4%) | 2,180 (33.1%) |
| Total | 4,284 (100.0%) | 6,580 (100.0%) |
Health & Disability in Bowling Green
Health Insurance Coverage by Age in Bowling Green
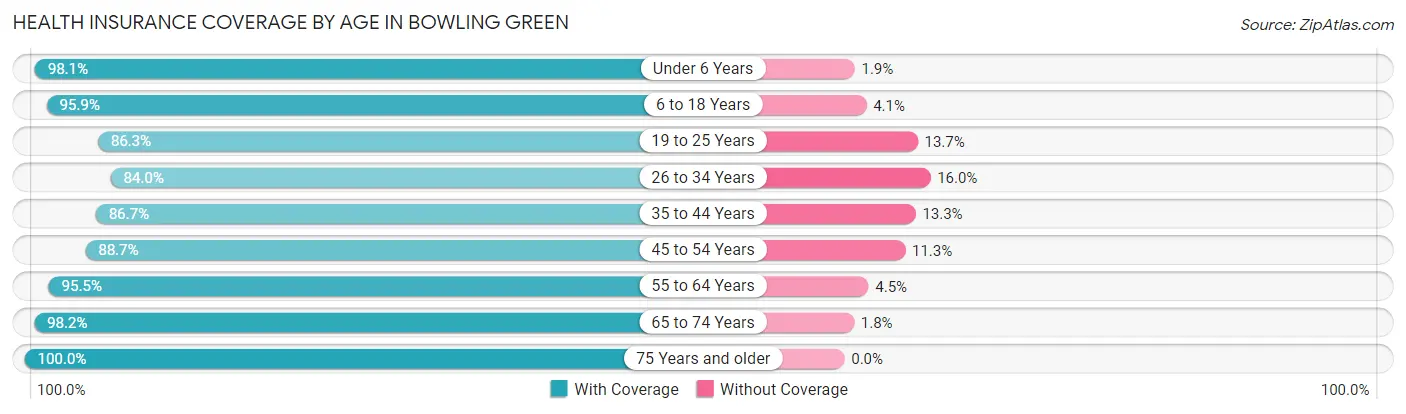
| Age Bracket | With Coverage | Without Coverage |
| Under 6 Years | 5,968 (98.1%) | 116 (1.9%) |
| 6 to 18 Years | 11,500 (95.9%) | 490 (4.1%) |
| 19 to 25 Years | 13,220 (86.3%) | 2,091 (13.7%) |
| 26 to 34 Years | 7,973 (84.0%) | 1,521 (16.0%) |
| 35 to 44 Years | 7,474 (86.7%) | 1,144 (13.3%) |
| 45 to 54 Years | 5,446 (88.7%) | 695 (11.3%) |
| 55 to 64 Years | 5,864 (95.5%) | 275 (4.5%) |
| 65 to 74 Years | 4,419 (98.2%) | 80 (1.8%) |
| 75 Years and older | 3,008 (100.0%) | 0 (0.0%) |
| Total | 64,872 (91.0%) | 6,412 (9.0%) |
Health Insurance Coverage by Citizenship Status in Bowling Green
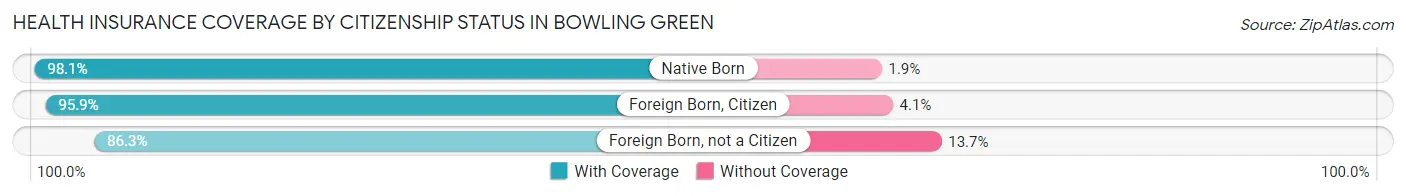
| Citizenship Status | With Coverage | Without Coverage |
| Native Born | 5,968 (98.1%) | 116 (1.9%) |
| Foreign Born, Citizen | 11,500 (95.9%) | 490 (4.1%) |
| Foreign Born, not a Citizen | 13,220 (86.3%) | 2,091 (13.7%) |
Health Insurance Coverage by Household Income in Bowling Green
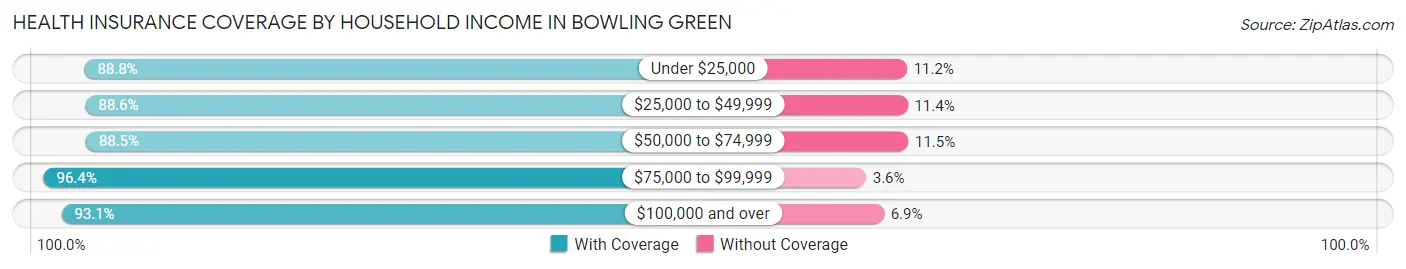
| Household Income | With Coverage | Without Coverage |
| Under $25,000 | 12,435 (88.8%) | 1,572 (11.2%) |
| $25,000 to $49,999 | 14,511 (88.6%) | 1,861 (11.4%) |
| $50,000 to $74,999 | 9,490 (88.5%) | 1,231 (11.5%) |
| $75,000 to $99,999 | 8,064 (96.4%) | 298 (3.6%) |
| $100,000 and over | 15,900 (93.1%) | 1,180 (6.9%) |
Public vs Private Health Insurance Coverage by Age in Bowling Green
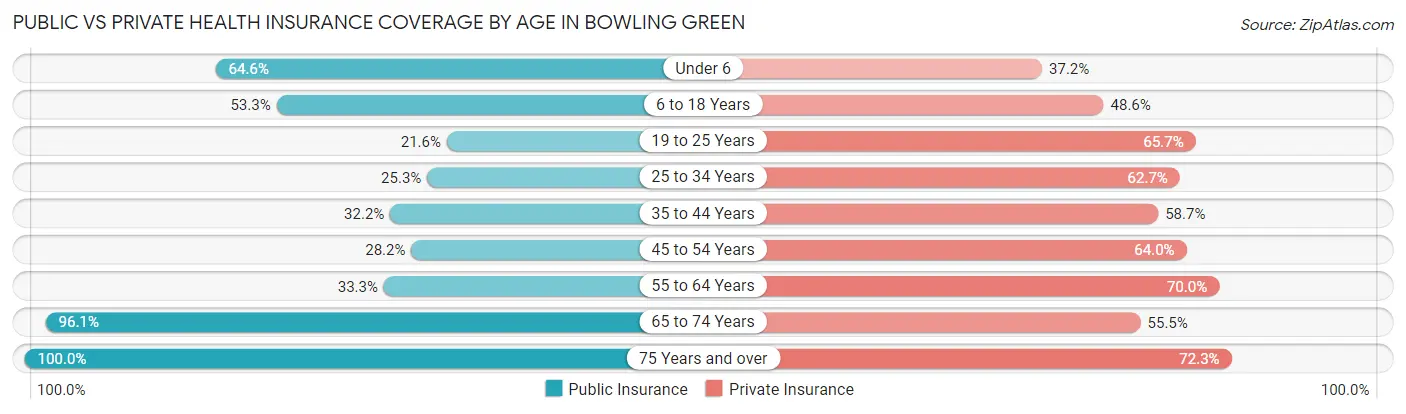
| Age Bracket | Public Insurance | Private Insurance |
| Under 6 | 3,927 (64.5%) | 2,262 (37.2%) |
| 6 to 18 Years | 6,385 (53.2%) | 5,827 (48.6%) |
| 19 to 25 Years | 3,312 (21.6%) | 10,052 (65.6%) |
| 25 to 34 Years | 2,400 (25.3%) | 5,954 (62.7%) |
| 35 to 44 Years | 2,771 (32.2%) | 5,062 (58.7%) |
| 45 to 54 Years | 1,733 (28.2%) | 3,928 (64.0%) |
| 55 to 64 Years | 2,046 (33.3%) | 4,298 (70.0%) |
| 65 to 74 Years | 4,323 (96.1%) | 2,495 (55.5%) |
| 75 Years and over | 3,008 (100.0%) | 2,175 (72.3%) |
| Total | 29,905 (41.9%) | 42,053 (59.0%) |
Disability Status by Sex by Age in Bowling Green
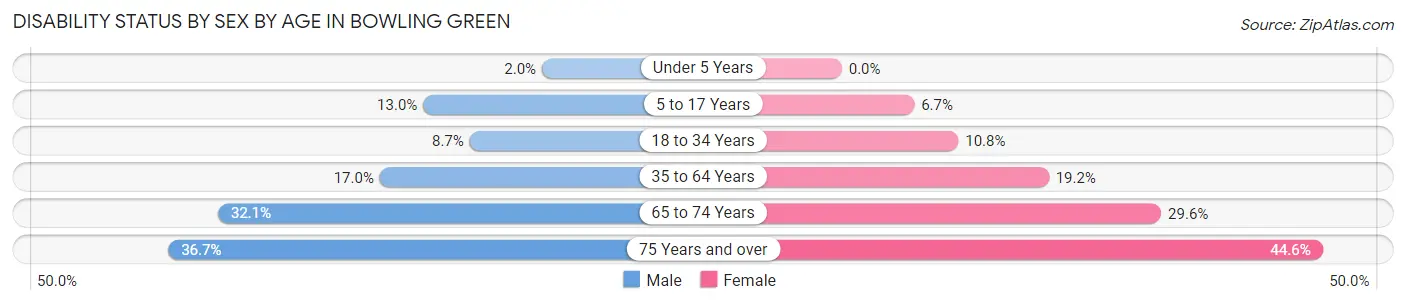
| Age Bracket | Male | Female |
| Under 5 Years | 50 (2.0%) | 0 (0.0%) |
| 5 to 17 Years | 701 (13.0%) | 351 (6.7%) |
| 18 to 34 Years | 1,140 (8.7%) | 1,531 (10.8%) |
| 35 to 64 Years | 1,728 (17.0%) | 2,065 (19.2%) |
| 65 to 74 Years | 642 (32.1%) | 740 (29.6%) |
| 75 Years and over | 462 (36.7%) | 780 (44.6%) |
Disability Class by Sex by Age in Bowling Green
Disability Class: Hearing Difficulty
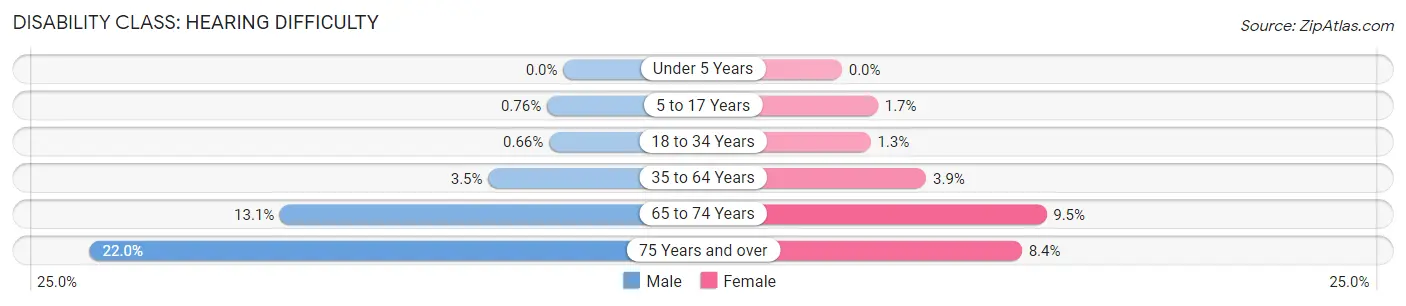
| Age Bracket | Male | Female |
| Under 5 Years | 0 (0.0%) | 0 (0.0%) |
| 5 to 17 Years | 41 (0.8%) | 87 (1.7%) |
| 18 to 34 Years | 87 (0.7%) | 188 (1.3%) |
| 35 to 64 Years | 353 (3.5%) | 421 (3.9%) |
| 65 to 74 Years | 263 (13.1%) | 237 (9.5%) |
| 75 Years and over | 277 (22.0%) | 146 (8.4%) |
Disability Class: Vision Difficulty
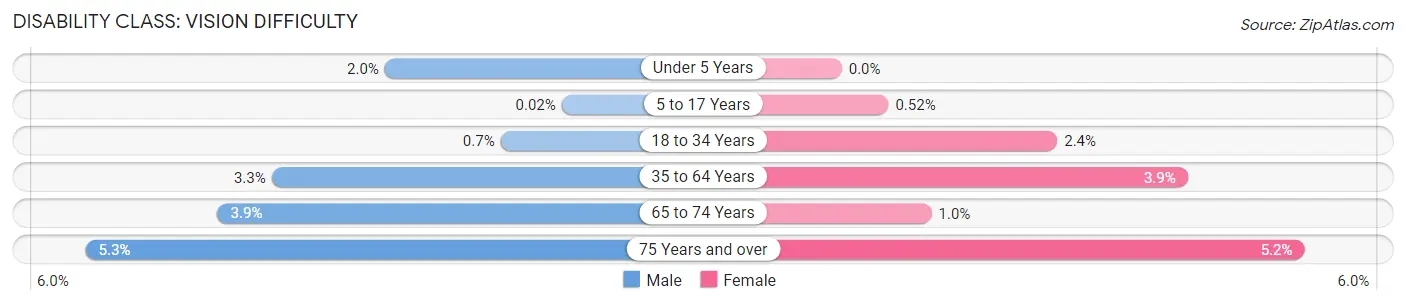
| Age Bracket | Male | Female |
| Under 5 Years | 50 (2.0%) | 0 (0.0%) |
| 5 to 17 Years | 1 (0.0%) | 27 (0.5%) |
| 18 to 34 Years | 92 (0.7%) | 340 (2.4%) |
| 35 to 64 Years | 330 (3.3%) | 414 (3.8%) |
| 65 to 74 Years | 77 (3.8%) | 25 (1.0%) |
| 75 Years and over | 67 (5.3%) | 90 (5.1%) |
Disability Class: Cognitive Difficulty
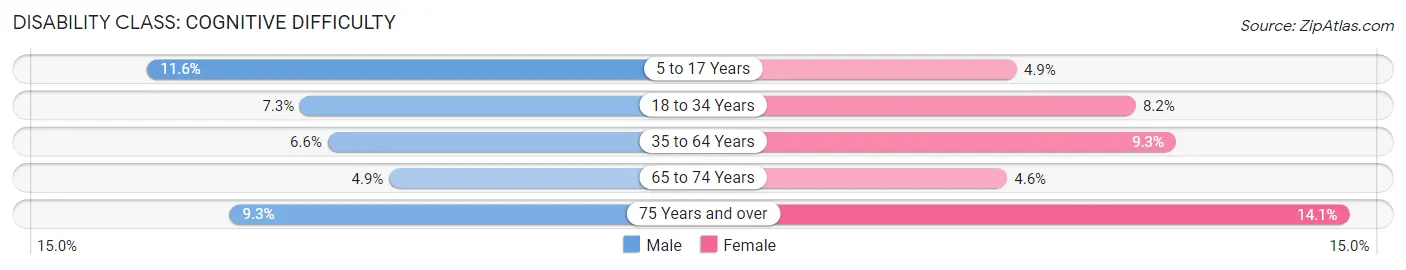
| Age Bracket | Male | Female |
| 5 to 17 Years | 624 (11.6%) | 255 (4.9%) |
| 18 to 34 Years | 961 (7.3%) | 1,161 (8.2%) |
| 35 to 64 Years | 665 (6.6%) | 1,000 (9.3%) |
| 65 to 74 Years | 97 (4.9%) | 115 (4.6%) |
| 75 Years and over | 117 (9.3%) | 247 (14.1%) |
Disability Class: Ambulatory Difficulty
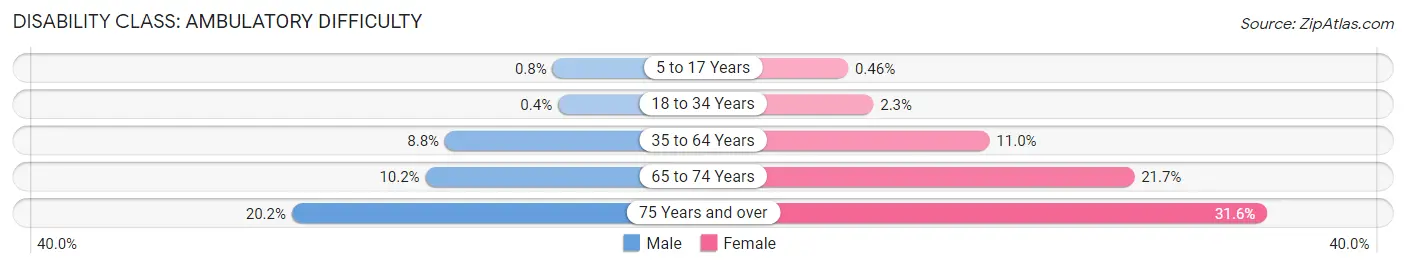
| Age Bracket | Male | Female |
| 5 to 17 Years | 43 (0.8%) | 24 (0.5%) |
| 18 to 34 Years | 53 (0.4%) | 331 (2.3%) |
| 35 to 64 Years | 891 (8.8%) | 1,179 (11.0%) |
| 65 to 74 Years | 205 (10.2%) | 542 (21.7%) |
| 75 Years and over | 254 (20.2%) | 552 (31.6%) |
Disability Class: Self-Care Difficulty
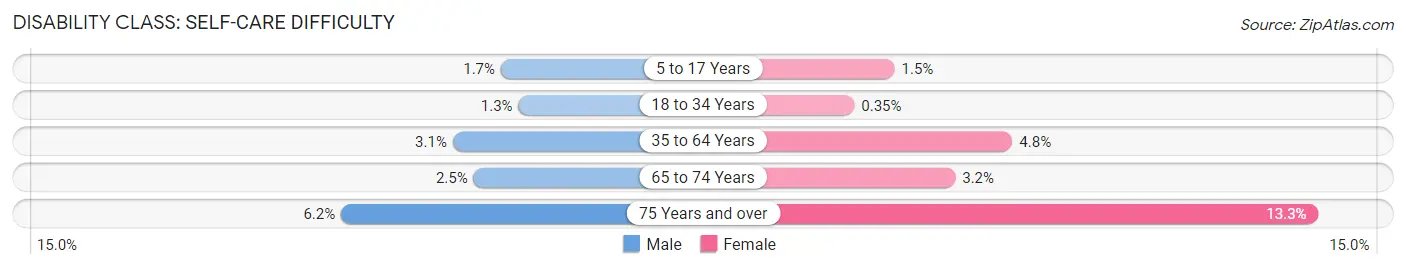
| Age Bracket | Male | Female |
| 5 to 17 Years | 94 (1.7%) | 77 (1.5%) |
| 18 to 34 Years | 164 (1.3%) | 50 (0.4%) |
| 35 to 64 Years | 312 (3.1%) | 511 (4.8%) |
| 65 to 74 Years | 50 (2.5%) | 79 (3.2%) |
| 75 Years and over | 78 (6.2%) | 232 (13.3%) |
Technology Access in Bowling Green
Computing Device Access in Bowling Green
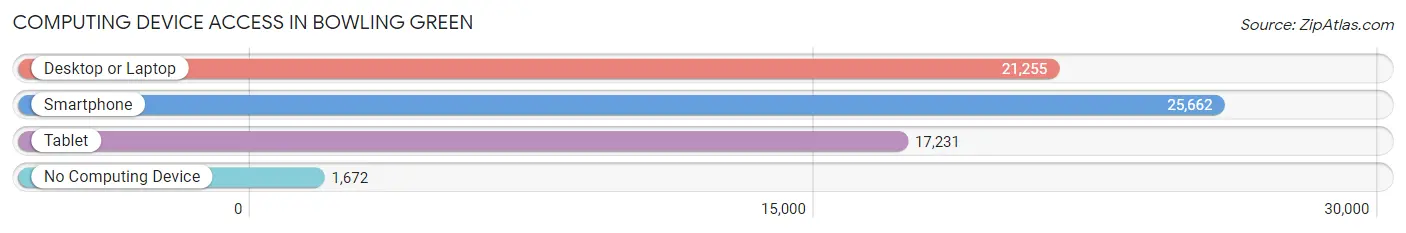
| Device Type | # Households | % Households |
| Desktop or Laptop | 21,255 | 74.1% |
| Smartphone | 25,662 | 89.5% |
| Tablet | 17,231 | 60.1% |
| No Computing Device | 1,672 | 5.8% |
| Total | 28,686 | 100.0% |
Internet Access in Bowling Green
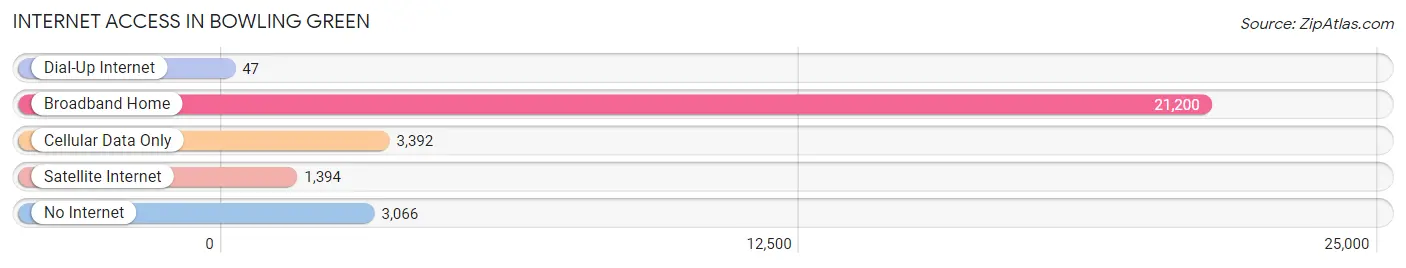
| Internet Type | # Households | % Households |
| Dial-Up Internet | 47 | 0.2% |
| Broadband Home | 21,200 | 73.9% |
| Cellular Data Only | 3,392 | 11.8% |
| Satellite Internet | 1,394 | 4.9% |
| No Internet | 3,066 | 10.7% |
| Total | 28,686 | 100.0% |
Bowling Green Summary
Bowling Green, Kentucky is a city located in the south-central part of the state, about 110 miles south of Louisville and 65 miles north of Nashville, Tennessee. It is the third-largest city in the state and the county seat of Warren County. The city has a population of approximately 67,000 people, making it the 11th largest city in the state.
History
The area that is now Bowling Green was first settled in 1798 by Robert and George Moore, two brothers from Virginia. The city was officially founded in 1798 and was named after Bowling Green, Virginia. The city was incorporated in 1810 and was the first city in the state to be incorporated.
In the early 19th century, Bowling Green was a major center for the slave trade. It was also a major stop on the Underground Railroad. During the Civil War, the city was the site of a major battle between Union and Confederate forces.
In the late 19th century, the city became a major center for the tobacco industry. The city was also home to several major manufacturing companies, including the General Motors plant, which opened in 1931.
Geography
Bowling Green is located in south-central Kentucky, about 110 miles south of Louisville and 65 miles north of Nashville, Tennessee. The city is situated in the Barren River Valley, which is part of the Western Coal Fields region of Kentucky. The city is located at the intersection of Interstate 65 and Interstate 24.
The city has a total area of 28.3 square miles, of which 28.2 square miles is land and 0.1 square miles is water. The city is located at an elevation of 486 feet above sea level.
Economy
Bowling Green has a diverse economy that is driven by manufacturing, healthcare, education, and tourism. The city is home to several major employers, including General Motors, Fruit of the Loom, and the Medical Center at Bowling Green.
The city is also home to several higher education institutions, including Western Kentucky University, which is the third-largest public university in the state. The university has an enrollment of over 20,000 students and is a major economic driver for the city.
Demographics
As of the 2020 census, the population of Bowling Green was 67,067. The city has a population density of 2,364 people per square mile. The median age of the population is 33.7 years, and the median household income is $45,845.
The racial makeup of the city is 79.2% White, 15.2% African American, 0.7% Asian, 0.3% Native American, and 4.6% from other races. The city is also home to a large Hispanic population, which makes up 8.2% of the population.
Conclusion
Bowling Green, Kentucky is a city located in the south-central part of the state. It has a population of approximately 67,000 people and is the 11th largest city in the state. The city has a diverse economy that is driven by manufacturing, healthcare, education, and tourism. The city is also home to several higher education institutions, including Western Kentucky University. The city has a population that is 79.2% White, 15.2% African American, 0.7% Asian, 0.3% Native American, and 4.6% from other races. The city is also home to a large Hispanic population, which makes up 8.2% of the population.
Common Questions
What is Per Capita Income in Bowling Green?
Per Capita income in Bowling Green is $28,088.
What is the Median Family Income in Bowling Green?
Median Family Income in Bowling Green is $63,502.
What is the Median Household income in Bowling Green?
Median Household Income in Bowling Green is $47,118.
What is Income or Wage Gap in Bowling Green?
Income or Wage Gap in Bowling Green is 36.0%.
Women in Bowling Green earn 64.0 cents for every dollar earned by a man.
What is Family Income Deficit in Bowling Green?
Family Income Deficit in Bowling Green is $14,413.
Families that are below poverty line in Bowling Green earn $14,413 less on average than the poverty threshold level.
What is Inequality or Gini Index in Bowling Green?
Inequality or Gini Index in Bowling Green is 0.50.
What is the Total Population of Bowling Green?
Total Population of Bowling Green is 72,385.
What is the Total Male Population of Bowling Green?
Total Male Population of Bowling Green is 35,028.
What is the Total Female Population of Bowling Green?
Total Female Population of Bowling Green is 37,357.
What is the Ratio of Males per 100 Females in Bowling Green?
There are 93.77 Males per 100 Females in Bowling Green.
What is the Ratio of Females per 100 Males in Bowling Green?
There are 106.65 Females per 100 Males in Bowling Green.
What is the Median Population Age in Bowling Green?
Median Population Age in Bowling Green is 27.8 Years.
What is the Average Family Size in Bowling Green
Average Family Size in Bowling Green is 3.0 People.
What is the Average Household Size in Bowling Green
Average Household Size in Bowling Green is 2.3 People.
How Large is the Labor Force in Bowling Green?
There are 39,297 People in the Labor Forcein in Bowling Green.
What is the Percentage of People in the Labor Force in Bowling Green?
67.4% of People are in the Labor Force in Bowling Green.
What is the Unemployment Rate in Bowling Green?
Unemployment Rate in Bowling Green is 5.6%.