Owensboro, KY Map & Demographics
Owensboro Map
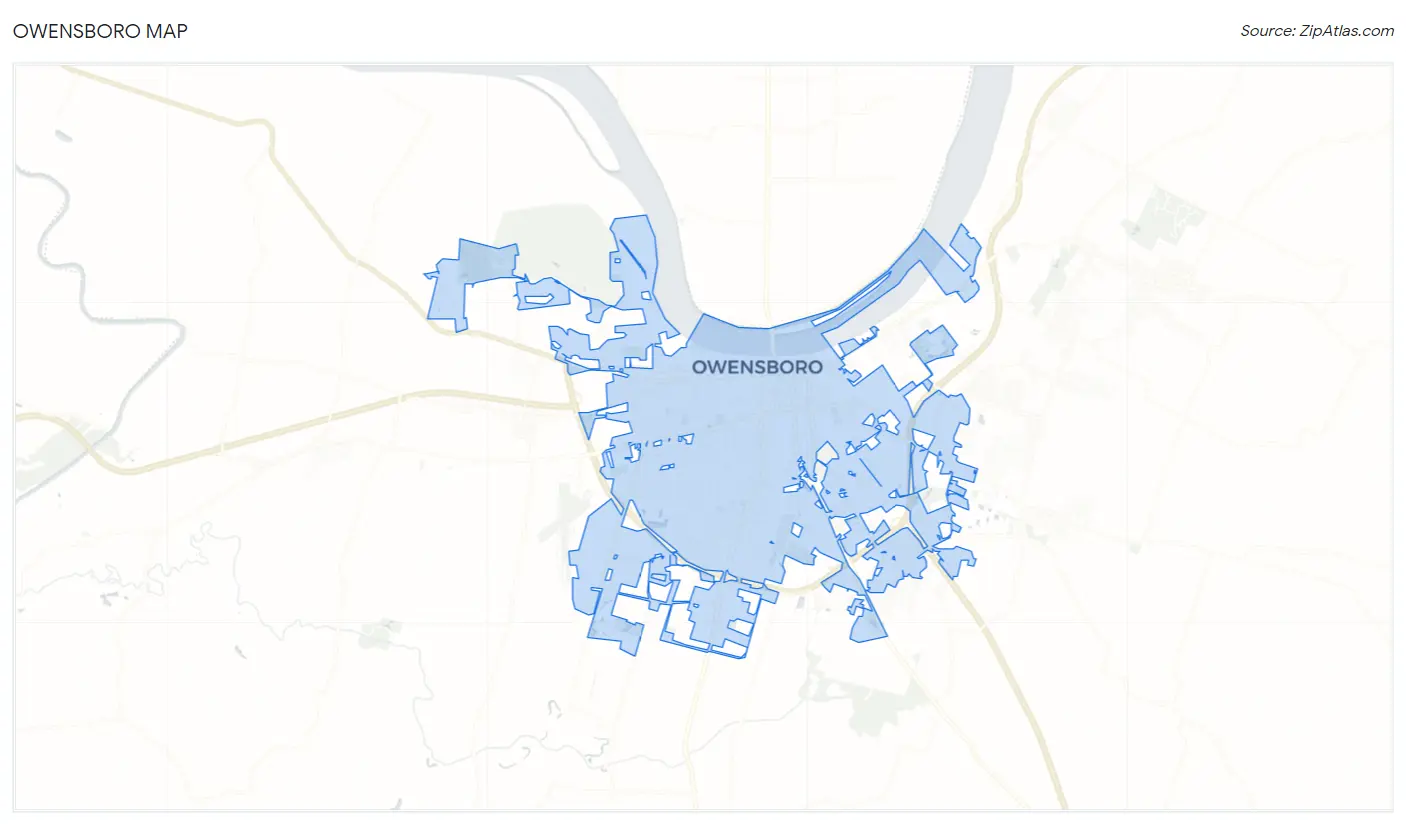
Owensboro Overview
$30,702
PER CAPITA INCOME
$66,889
AVG FAMILY INCOME
$51,982
AVG HOUSEHOLD INCOME
30.6%
WAGE / INCOME GAP [ % ]
69.4¢/ $1
WAGE / INCOME GAP [ $ ]
$12,976
FAMILY INCOME DEFICIT
0.47
INEQUALITY / GINI INDEX
60,019
TOTAL POPULATION
28,997
MALE POPULATION
31,022
FEMALE POPULATION
93.47
MALES / 100 FEMALES
106.98
FEMALES / 100 MALES
37.8
MEDIAN AGE
2.9
AVG FAMILY SIZE
2.3
AVG HOUSEHOLD SIZE
27,630
LABOR FORCE [ PEOPLE ]
58.3%
PERCENT IN LABOR FORCE
4.2%
UNEMPLOYMENT RATE
Owensboro Area Codes
Income in Owensboro
Income Overview in Owensboro
Per Capita Income in Owensboro is $30,702, while median incomes of families and households are $66,889 and $51,982 respectively.
| Characteristic | Number | Measure |
| Per Capita Income | 60,019 | $30,702 |
| Median Family Income | 14,751 | $66,889 |
| Mean Family Income | 14,751 | $83,919 |
| Median Household Income | 25,228 | $51,982 |
| Mean Household Income | 25,228 | $72,132 |
| Income Deficit | 14,751 | $12,976 |
| Wage / Income Gap (%) | 60,019 | 30.60% |
| Wage / Income Gap ($) | 60,019 | 69.40¢ per $1 |
| Gini / Inequality Index | 60,019 | 0.47 |
Earnings by Sex in Owensboro
Average Earnings in Owensboro are $34,398, $41,818 for men and $29,022 for women, a difference of 30.6%.
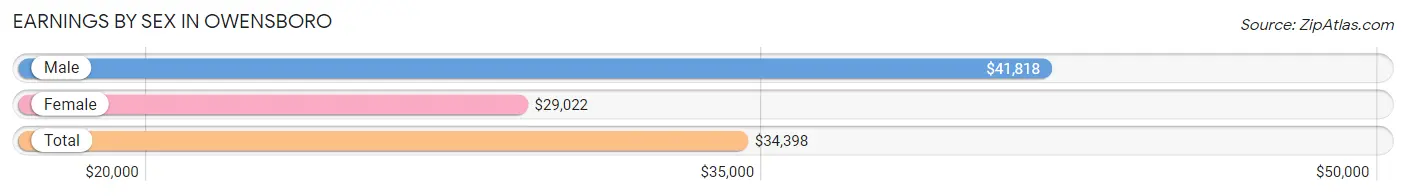
| Sex | Number | Average Earnings |
| Male | 14,636 (50.5%) | $41,818 |
| Female | 14,319 (49.4%) | $29,022 |
| Total | 28,955 (100.0%) | $34,398 |
Earnings by Sex by Income Bracket in Owensboro
The most common earnings brackets in Owensboro are $100,000+ for men (1,809 | 12.4%) and $25,000 to $29,999 for women (1,298 | 9.1%).
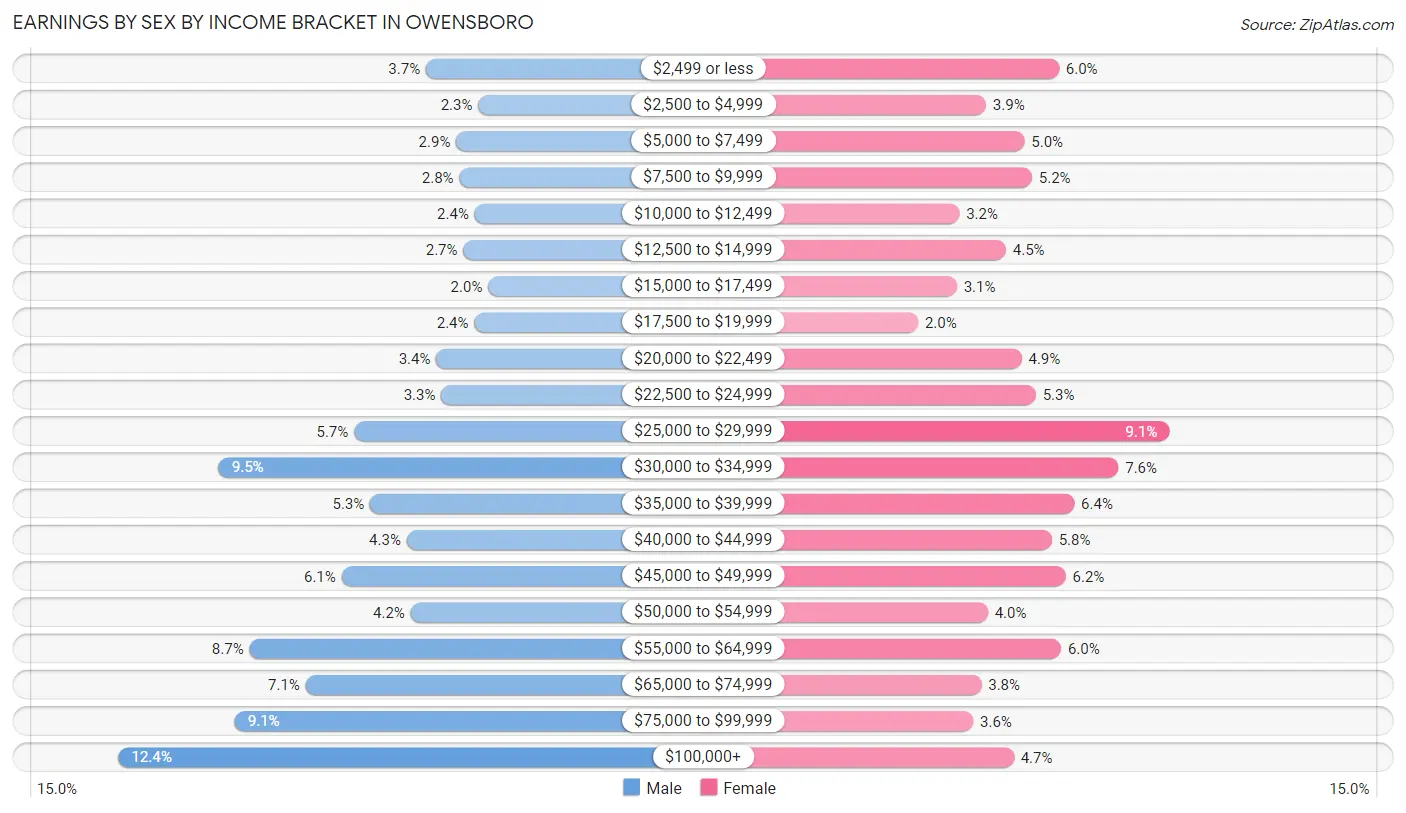
| Income | Male | Female |
| $2,499 or less | 545 (3.7%) | 854 (6.0%) |
| $2,500 to $4,999 | 329 (2.2%) | 560 (3.9%) |
| $5,000 to $7,499 | 420 (2.9%) | 714 (5.0%) |
| $7,500 to $9,999 | 407 (2.8%) | 745 (5.2%) |
| $10,000 to $12,499 | 344 (2.4%) | 453 (3.2%) |
| $12,500 to $14,999 | 391 (2.7%) | 640 (4.5%) |
| $15,000 to $17,499 | 288 (2.0%) | 442 (3.1%) |
| $17,500 to $19,999 | 345 (2.4%) | 287 (2.0%) |
| $20,000 to $22,499 | 502 (3.4%) | 703 (4.9%) |
| $22,500 to $24,999 | 481 (3.3%) | 760 (5.3%) |
| $25,000 to $29,999 | 840 (5.7%) | 1,298 (9.1%) |
| $30,000 to $34,999 | 1,396 (9.5%) | 1,092 (7.6%) |
| $35,000 to $39,999 | 774 (5.3%) | 915 (6.4%) |
| $40,000 to $44,999 | 624 (4.3%) | 825 (5.8%) |
| $45,000 to $49,999 | 892 (6.1%) | 880 (6.1%) |
| $50,000 to $54,999 | 608 (4.2%) | 567 (4.0%) |
| $55,000 to $64,999 | 1,271 (8.7%) | 862 (6.0%) |
| $65,000 to $74,999 | 1,039 (7.1%) | 541 (3.8%) |
| $75,000 to $99,999 | 1,331 (9.1%) | 509 (3.5%) |
| $100,000+ | 1,809 (12.4%) | 672 (4.7%) |
| Total | 14,636 (100.0%) | 14,319 (100.0%) |
Earnings by Sex by Educational Attainment in Owensboro
Average earnings in Owensboro are $48,993 for men and $34,056 for women, a difference of 30.5%. Men with an educational attainment of graduate degree enjoy the highest average annual earnings of $69,013, while those with less than high school education earn the least with $31,816. Women with an educational attainment of graduate degree earn the most with the average annual earnings of $55,216, while those with less than high school education have the smallest earnings of $25,082.
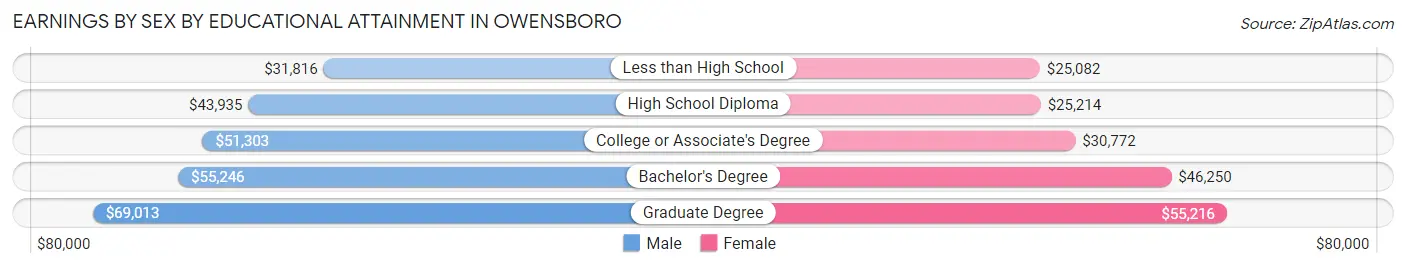
| Educational Attainment | Male Income | Female Income |
| Less than High School | $31,816 | $25,082 |
| High School Diploma | $43,935 | $25,214 |
| College or Associate's Degree | $51,303 | $30,772 |
| Bachelor's Degree | $55,246 | $46,250 |
| Graduate Degree | $69,013 | $55,216 |
| Total | $48,993 | $34,056 |
Family Income in Owensboro
Family Income Brackets in Owensboro
According to the Owensboro family income data, there are 2,832 families falling into the $100,000 to $149,999 income range, which is the most common income bracket and makes up 19.2% of all families. Conversely, the $10,000 to $14,999 income bracket is the least frequent group with only 546 families (3.7%) belonging to this category.
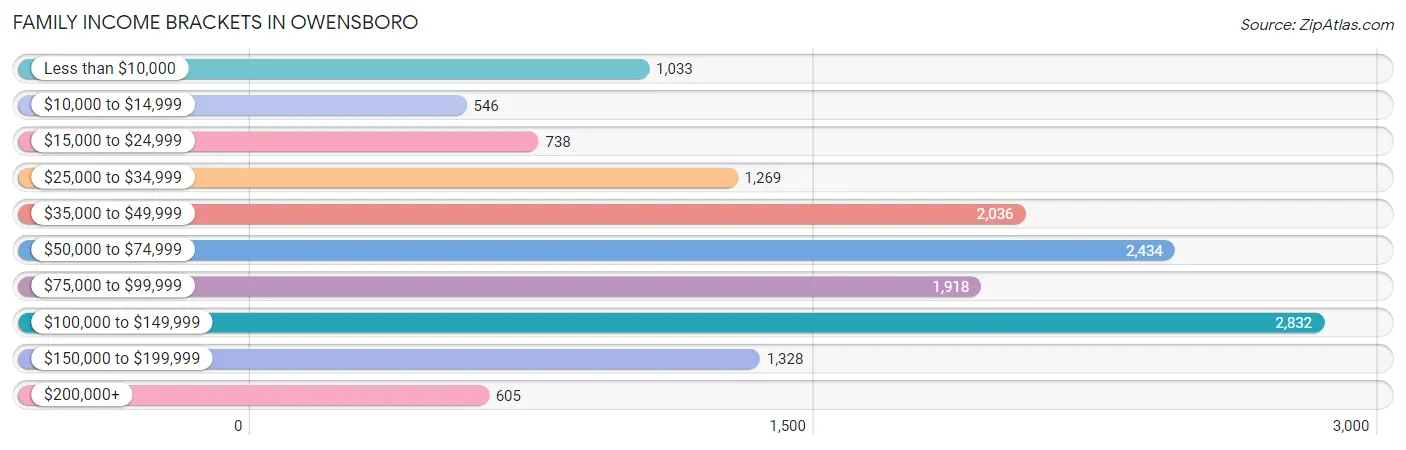
| Income Bracket | # Families | % Families |
| Less than $10,000 | 1,033 | 7.0% |
| $10,000 to $14,999 | 546 | 3.7% |
| $15,000 to $24,999 | 738 | 5.0% |
| $25,000 to $34,999 | 1,269 | 8.6% |
| $35,000 to $49,999 | 2,036 | 13.8% |
| $50,000 to $74,999 | 2,434 | 16.5% |
| $75,000 to $99,999 | 1,918 | 13.0% |
| $100,000 to $149,999 | 2,832 | 19.2% |
| $150,000 to $199,999 | 1,328 | 9.0% |
| $200,000+ | 605 | 4.1% |
Family Income by Famaliy Size in Owensboro
6-person families (524 | 3.5%) account for the highest median family income in Owensboro with $104,444 per family, while 2-person families (7,216 | 48.9%) have the highest median income of $29,758 per family member.
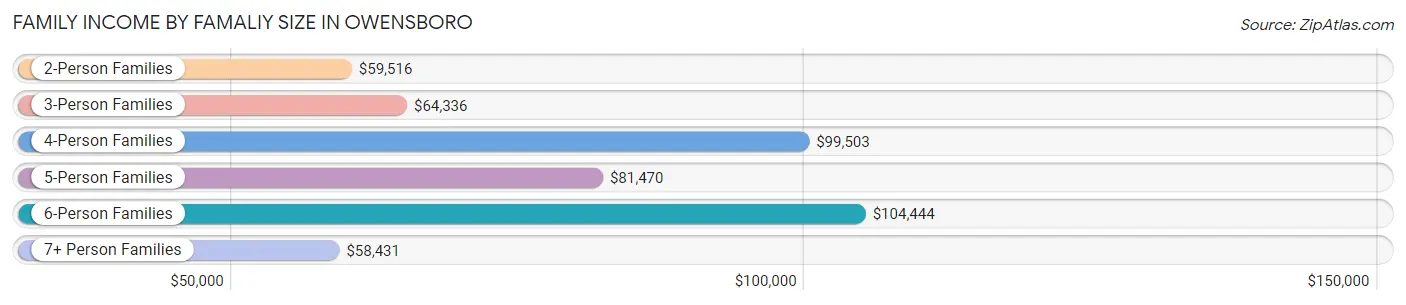
| Income Bracket | # Families | Median Income |
| 2-Person Families | 7,216 (48.9%) | $59,516 |
| 3-Person Families | 3,889 (26.4%) | $64,336 |
| 4-Person Families | 1,837 (12.4%) | $99,503 |
| 5-Person Families | 1,003 (6.8%) | $81,470 |
| 6-Person Families | 524 (3.5%) | $104,444 |
| 7+ Person Families | 282 (1.9%) | $58,431 |
| Total | 14,751 (100.0%) | $66,889 |
Family Income by Number of Earners in Owensboro
The median family income in Owensboro is $66,889, with families comprising 3+ earners (1,589) having the highest median family income of $129,866, while families with no earners (3,140) have the lowest median family income of $37,951, accounting for 10.8% and 21.3% of families, respectively.
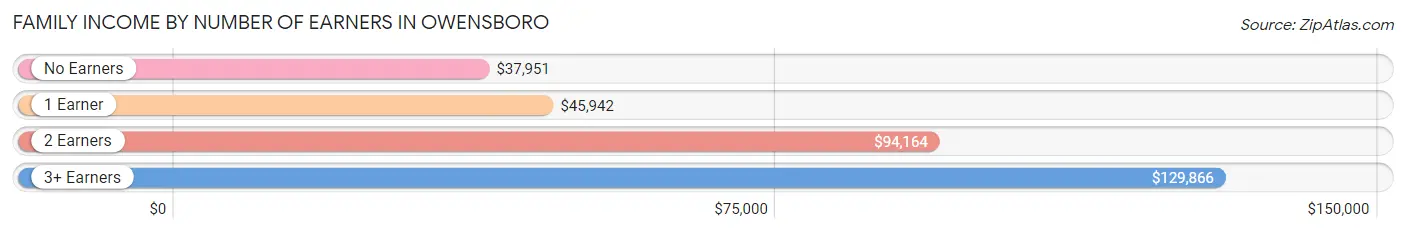
| Number of Earners | # Families | Median Income |
| No Earners | 3,140 (21.3%) | $37,951 |
| 1 Earner | 4,955 (33.6%) | $45,942 |
| 2 Earners | 5,067 (34.4%) | $94,164 |
| 3+ Earners | 1,589 (10.8%) | $129,866 |
| Total | 14,751 (100.0%) | $66,889 |
Household Income in Owensboro
Household Income Brackets in Owensboro
With 4,415 households falling in the category, the $50,000 to $74,999 income range is the most frequent in Owensboro, accounting for 17.5% of all households. In contrast, only 883 households (3.5%) fall into the $200,000+ income bracket, making it the least populous group.
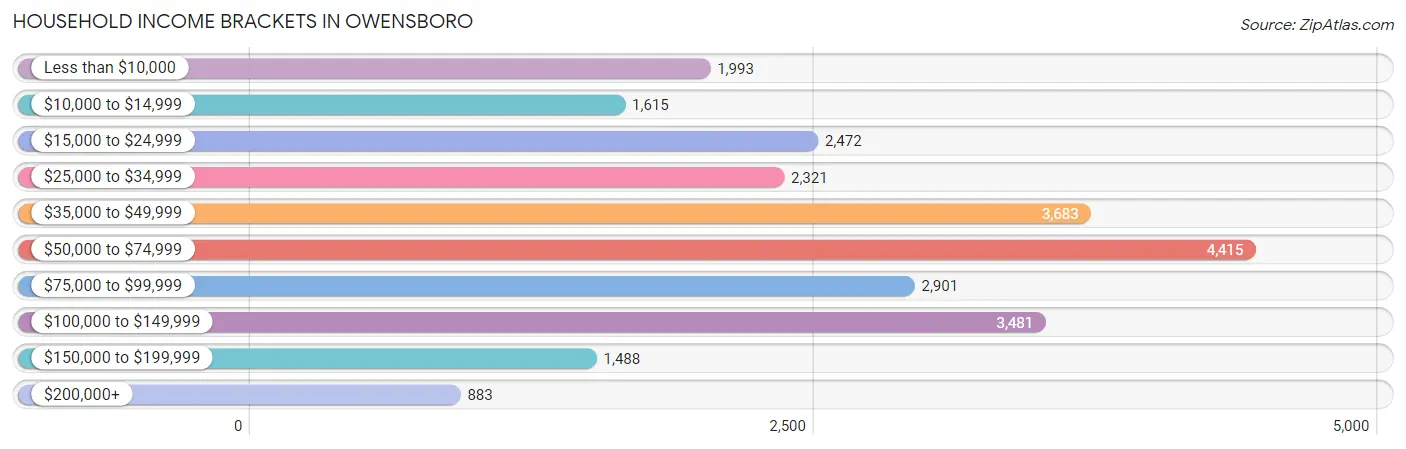
| Income Bracket | # Households | % Households |
| Less than $10,000 | 1,993 | 7.9% |
| $10,000 to $14,999 | 1,615 | 6.4% |
| $15,000 to $24,999 | 2,472 | 9.8% |
| $25,000 to $34,999 | 2,321 | 9.2% |
| $35,000 to $49,999 | 3,683 | 14.6% |
| $50,000 to $74,999 | 4,415 | 17.5% |
| $75,000 to $99,999 | 2,901 | 11.5% |
| $100,000 to $149,999 | 3,481 | 13.8% |
| $150,000 to $199,999 | 1,488 | 5.9% |
| $200,000+ | 883 | 3.5% |
Household Income by Householder Age in Owensboro
The median household income in Owensboro is $51,982, with the highest median household income of $66,799 found in the 25 to 44 years age bracket for the primary householder. A total of 7,777 households (30.8%) fall into this category. Meanwhile, the 15 to 24 years age bracket for the primary householder has the lowest median household income of $39,107, with 1,347 households (5.3%) in this group.
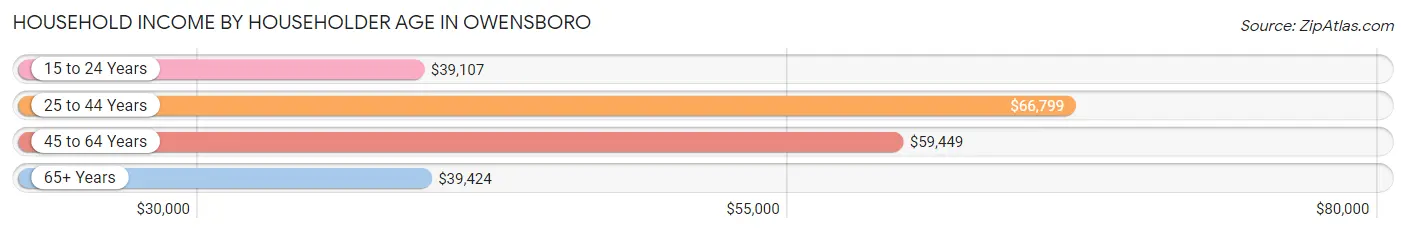
| Income Bracket | # Households | Median Income |
| 15 to 24 Years | 1,347 (5.3%) | $39,107 |
| 25 to 44 Years | 7,777 (30.8%) | $66,799 |
| 45 to 64 Years | 8,431 (33.4%) | $59,449 |
| 65+ Years | 7,673 (30.4%) | $39,424 |
| Total | 25,228 (100.0%) | $51,982 |
Poverty in Owensboro
Income Below Poverty by Sex and Age in Owensboro
With 16.9% poverty level for males and 19.9% for females among the residents of Owensboro, 15 year old males and 5 year old females are the most vulnerable to poverty, with 158 males (35.9%) and 170 females (59.2%) in their respective age groups living below the poverty level.
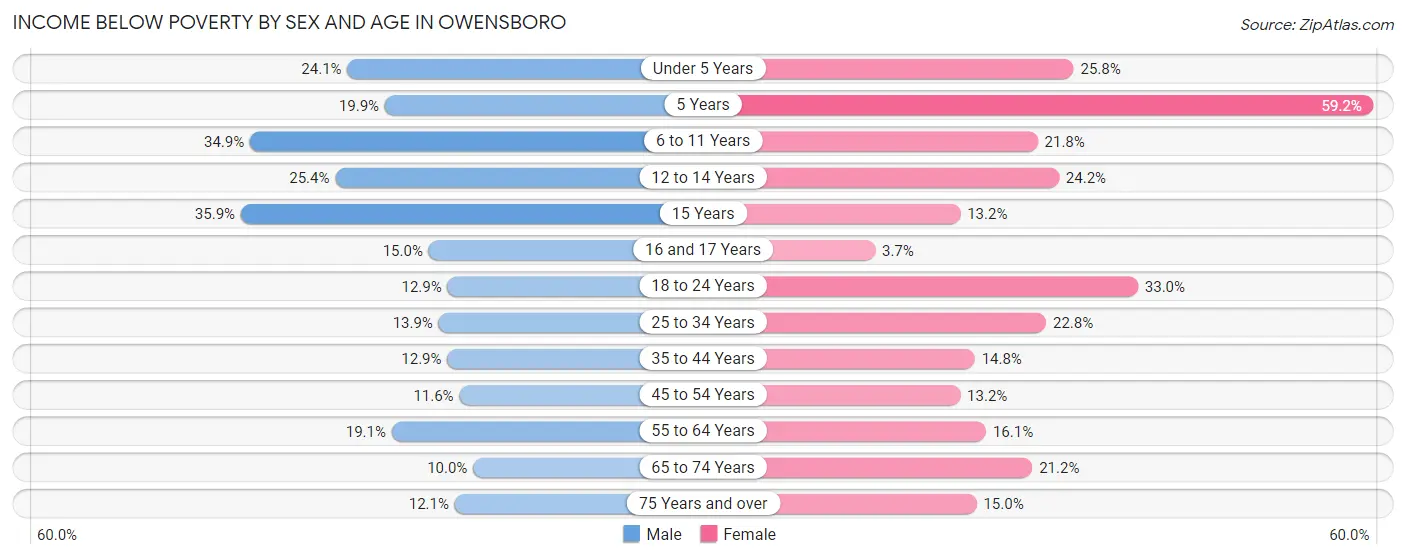
| Age Bracket | Male | Female |
| Under 5 Years | 518 (24.0%) | 511 (25.8%) |
| 5 Years | 89 (19.9%) | 170 (59.2%) |
| 6 to 11 Years | 775 (34.9%) | 433 (21.8%) |
| 12 to 14 Years | 271 (25.4%) | 237 (24.2%) |
| 15 Years | 158 (35.9%) | 72 (13.2%) |
| 16 and 17 Years | 118 (15.0%) | 25 (3.7%) |
| 18 to 24 Years | 318 (12.9%) | 867 (33.0%) |
| 25 to 34 Years | 554 (13.9%) | 970 (22.8%) |
| 35 to 44 Years | 410 (12.9%) | 488 (14.8%) |
| 45 to 54 Years | 364 (11.6%) | 438 (13.2%) |
| 55 to 64 Years | 661 (19.1%) | 631 (16.1%) |
| 65 to 74 Years | 288 (10.0%) | 682 (21.2%) |
| 75 Years and over | 209 (12.1%) | 423 (15.0%) |
| Total | 4,733 (16.9%) | 5,947 (19.9%) |
Income Above Poverty by Sex and Age in Owensboro
According to the poverty statistics in Owensboro, males aged 65 to 74 years and females aged 16 and 17 years are the age groups that are most secure financially, with 90.0% of males and 96.3% of females in these age groups living above the poverty line.
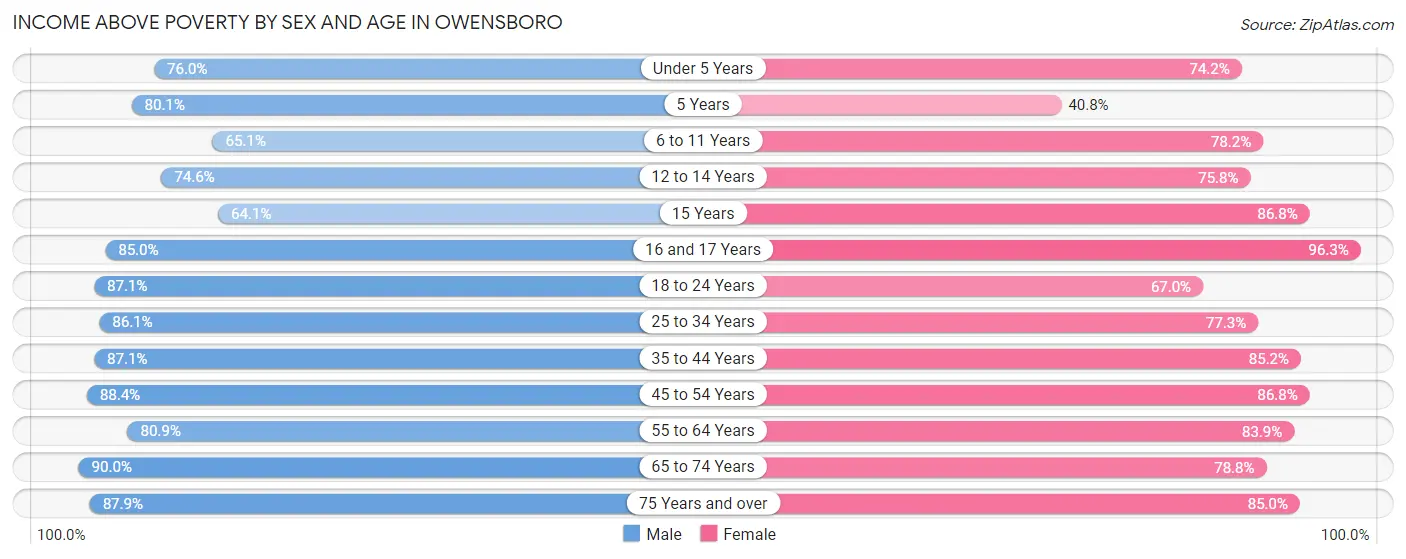
| Age Bracket | Male | Female |
| Under 5 Years | 1,636 (75.9%) | 1,469 (74.2%) |
| 5 Years | 359 (80.1%) | 117 (40.8%) |
| 6 to 11 Years | 1,446 (65.1%) | 1,552 (78.2%) |
| 12 to 14 Years | 796 (74.6%) | 743 (75.8%) |
| 15 Years | 282 (64.1%) | 474 (86.8%) |
| 16 and 17 Years | 669 (85.0%) | 651 (96.3%) |
| 18 to 24 Years | 2,148 (87.1%) | 1,763 (67.0%) |
| 25 to 34 Years | 3,436 (86.1%) | 3,293 (77.2%) |
| 35 to 44 Years | 2,763 (87.1%) | 2,810 (85.2%) |
| 45 to 54 Years | 2,781 (88.4%) | 2,884 (86.8%) |
| 55 to 64 Years | 2,798 (80.9%) | 3,298 (83.9%) |
| 65 to 74 Years | 2,581 (90.0%) | 2,534 (78.8%) |
| 75 Years and over | 1,520 (87.9%) | 2,397 (85.0%) |
| Total | 23,215 (83.1%) | 23,985 (80.1%) |
Income Below Poverty Among Married-Couple Families in Owensboro
The poverty statistics for married-couple families in Owensboro show that 6.6% or 618 of the total 9,426 families live below the poverty line. Families with 5 or more children have the highest poverty rate of 58.1%, comprising of 97 families. On the other hand, families with no children have the lowest poverty rate of 4.0%, which includes 228 families.
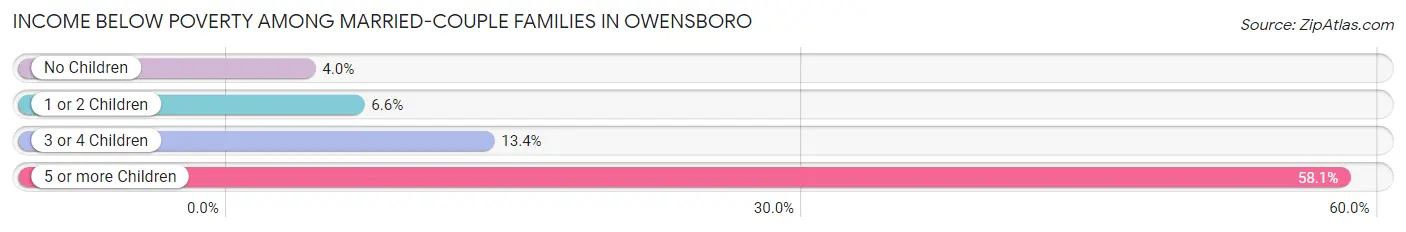
| Children | Above Poverty | Below Poverty |
| No Children | 5,415 (96.0%) | 228 (4.0%) |
| 1 or 2 Children | 2,631 (93.4%) | 186 (6.6%) |
| 3 or 4 Children | 692 (86.6%) | 107 (13.4%) |
| 5 or more Children | 70 (41.9%) | 97 (58.1%) |
| Total | 8,808 (93.4%) | 618 (6.6%) |
Income Below Poverty Among Single-Parent Households in Owensboro
According to the poverty data in Owensboro, 17.0% or 268 single-father households and 35.6% or 1,337 single-mother households are living below the poverty line. Among single-father households, those with 3 or 4 children have the highest poverty rate, with 33 households (51.6%) experiencing poverty. Likewise, among single-mother households, those with 5 or more children have the highest poverty rate, with 58 households (100.0%) falling below the poverty line.
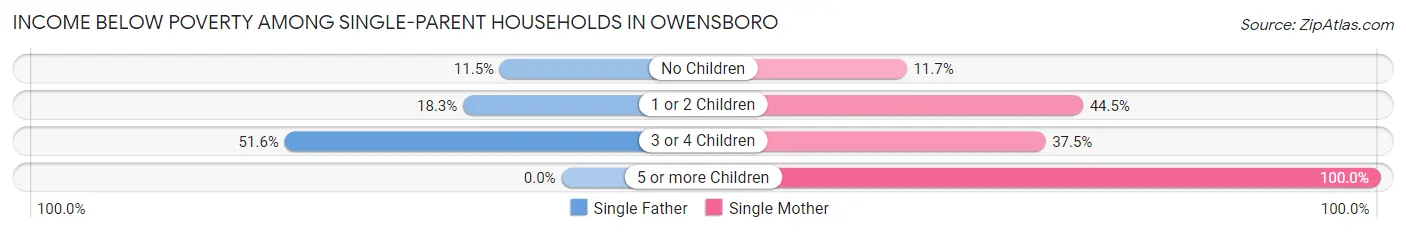
| Children | Single Father | Single Mother |
| No Children | 61 (11.5%) | 122 (11.7%) |
| 1 or 2 Children | 174 (18.3%) | 1,032 (44.5%) |
| 3 or 4 Children | 33 (51.6%) | 125 (37.5%) |
| 5 or more Children | 0 (0.0%) | 58 (100.0%) |
| Total | 268 (17.0%) | 1,337 (35.6%) |
Income Below Poverty Among Married-Couple vs Single-Parent Households in Owensboro
The poverty data for Owensboro shows that 618 of the married-couple family households (6.6%) and 1,605 of the single-parent households (30.1%) are living below the poverty level. Within the married-couple family households, those with 5 or more children have the highest poverty rate, with 97 households (58.1%) falling below the poverty line. Among the single-parent households, those with 5 or more children have the highest poverty rate, with 58 household (67.4%) living below poverty.
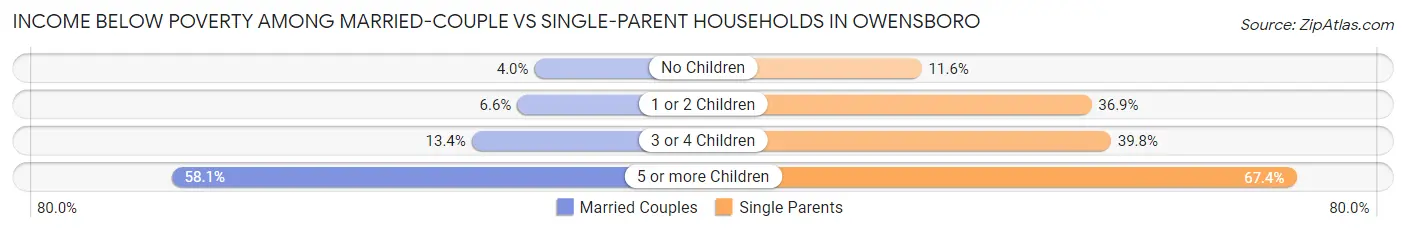
| Children | Married-Couple Families | Single-Parent Households |
| No Children | 228 (4.0%) | 183 (11.6%) |
| 1 or 2 Children | 186 (6.6%) | 1,206 (36.9%) |
| 3 or 4 Children | 107 (13.4%) | 158 (39.8%) |
| 5 or more Children | 97 (58.1%) | 58 (67.4%) |
| Total | 618 (6.6%) | 1,605 (30.1%) |
Race in Owensboro
The most populous races in Owensboro are White / Caucasian (49,738 | 82.9%), Black / African American (4,251 | 7.1%), and Two or more Races (2,772 | 4.6%).
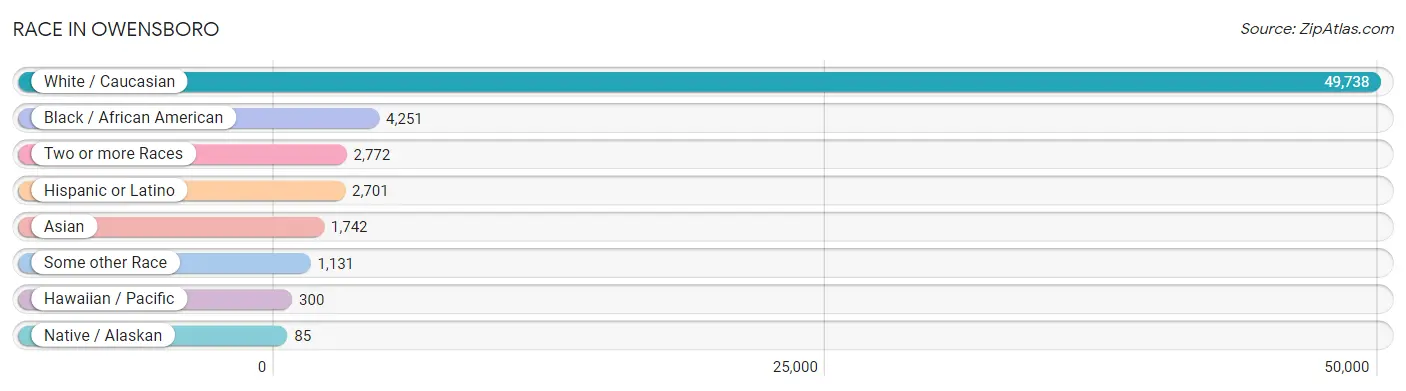
| Race | # Population | % Population |
| Asian | 1,742 | 2.9% |
| Black / African American | 4,251 | 7.1% |
| Hawaiian / Pacific | 300 | 0.5% |
| Hispanic or Latino | 2,701 | 4.5% |
| Native / Alaskan | 85 | 0.1% |
| White / Caucasian | 49,738 | 82.9% |
| Two or more Races | 2,772 | 4.6% |
| Some other Race | 1,131 | 1.9% |
| Total | 60,019 | 100.0% |
Ancestry in Owensboro
The most populous ancestries reported in Owensboro are American (7,527 | 12.5%), Irish (6,935 | 11.6%), English (6,741 | 11.2%), German (6,733 | 11.2%), and Scottish (1,557 | 2.6%), together accounting for 49.1% of all Owensboro residents.
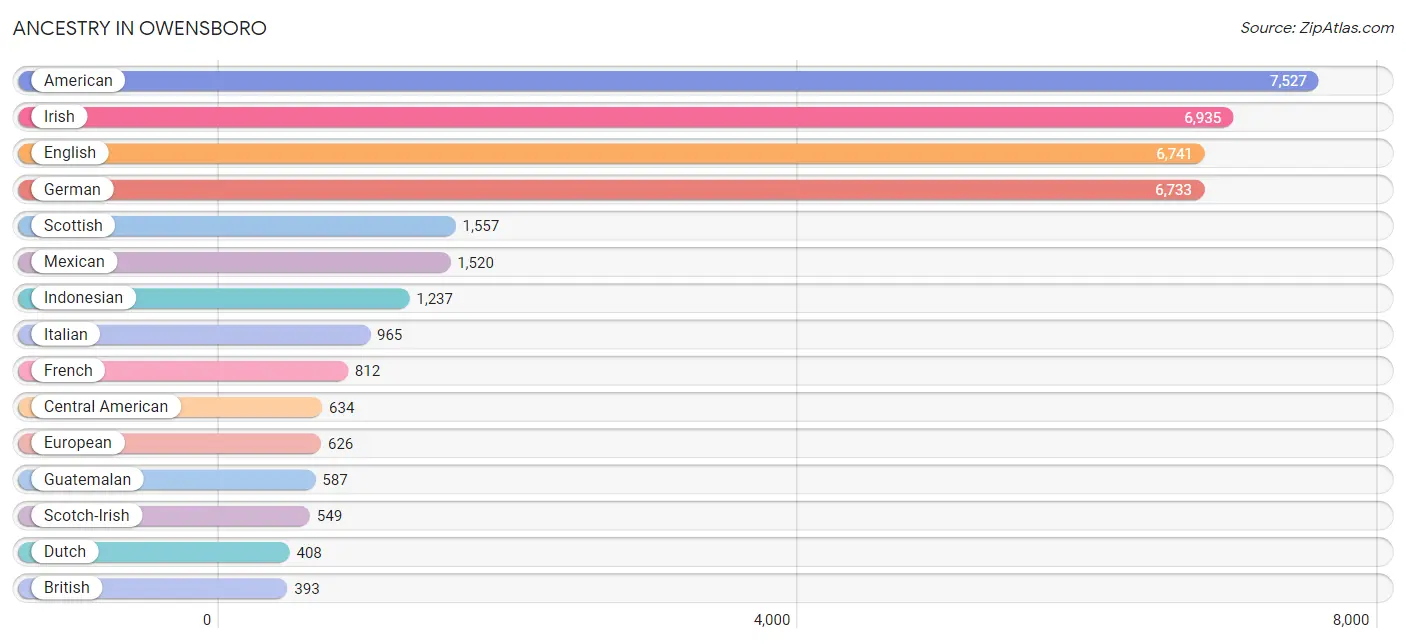
| Ancestry | # Population | % Population |
| African | 50 | 0.1% |
| American | 7,527 | 12.5% |
| Apache | 9 | 0.0% |
| Arab | 37 | 0.1% |
| Argentinean | 57 | 0.1% |
| Armenian | 19 | 0.0% |
| Austrian | 6 | 0.0% |
| Belgian | 11 | 0.0% |
| Bhutanese | 28 | 0.1% |
| Blackfeet | 20 | 0.0% |
| Bolivian | 12 | 0.0% |
| British | 393 | 0.6% |
| Burmese | 36 | 0.1% |
| Cajun | 18 | 0.0% |
| Canadian | 98 | 0.2% |
| Central American | 634 | 1.1% |
| Central American Indian | 41 | 0.1% |
| Cherokee | 62 | 0.1% |
| Chippewa | 1 | 0.0% |
| Choctaw | 25 | 0.0% |
| Cuban | 43 | 0.1% |
| Czech | 17 | 0.0% |
| Czechoslovakian | 111 | 0.2% |
| Danish | 45 | 0.1% |
| Dutch | 408 | 0.7% |
| Eastern European | 132 | 0.2% |
| English | 6,741 | 11.2% |
| Ethiopian | 96 | 0.2% |
| European | 626 | 1.0% |
| Filipino | 11 | 0.0% |
| Finnish | 34 | 0.1% |
| French | 812 | 1.3% |
| French Canadian | 121 | 0.2% |
| German | 6,733 | 11.2% |
| Greek | 126 | 0.2% |
| Guamanian / Chamorro | 280 | 0.5% |
| Guatemalan | 587 | 1.0% |
| Haitian | 11 | 0.0% |
| Honduran | 41 | 0.1% |
| Hungarian | 47 | 0.1% |
| Icelander | 16 | 0.0% |
| Indian (Asian) | 41 | 0.1% |
| Indonesian | 1,237 | 2.1% |
| Irish | 6,935 | 11.6% |
| Italian | 965 | 1.6% |
| Korean | 141 | 0.2% |
| Laotian | 28 | 0.1% |
| Mexican | 1,520 | 2.5% |
| Mexican American Indian | 23 | 0.0% |
| Native Hawaiian | 6 | 0.0% |
| Nigerian | 10 | 0.0% |
| Northern European | 15 | 0.0% |
| Norwegian | 113 | 0.2% |
| Pakistani | 16 | 0.0% |
| Pennsylvania German | 10 | 0.0% |
| Polish | 303 | 0.5% |
| Portuguese | 58 | 0.1% |
| Puerto Rican | 268 | 0.4% |
| Romanian | 1 | 0.0% |
| Russian | 160 | 0.3% |
| Salvadoran | 6 | 0.0% |
| Scandinavian | 106 | 0.2% |
| Scotch-Irish | 549 | 0.9% |
| Scottish | 1,557 | 2.6% |
| Slovak | 12 | 0.0% |
| South American | 96 | 0.2% |
| Sri Lankan | 13 | 0.0% |
| Subsaharan African | 156 | 0.3% |
| Swedish | 88 | 0.2% |
| Swiss | 46 | 0.1% |
| Thai | 331 | 0.5% |
| Ukrainian | 112 | 0.2% |
| Venezuelan | 27 | 0.0% |
| Welsh | 187 | 0.3% |
| West Indian | 13 | 0.0% | View All 75 Rows |
Immigrants in Owensboro
The most numerous immigrant groups reported in Owensboro came from Asia (1,404 | 2.3%), South Eastern Asia (857 | 1.4%), Latin America (807 | 1.3%), Central America (678 | 1.1%), and Mexico (411 | 0.7%), together accounting for 6.9% of all Owensboro residents.
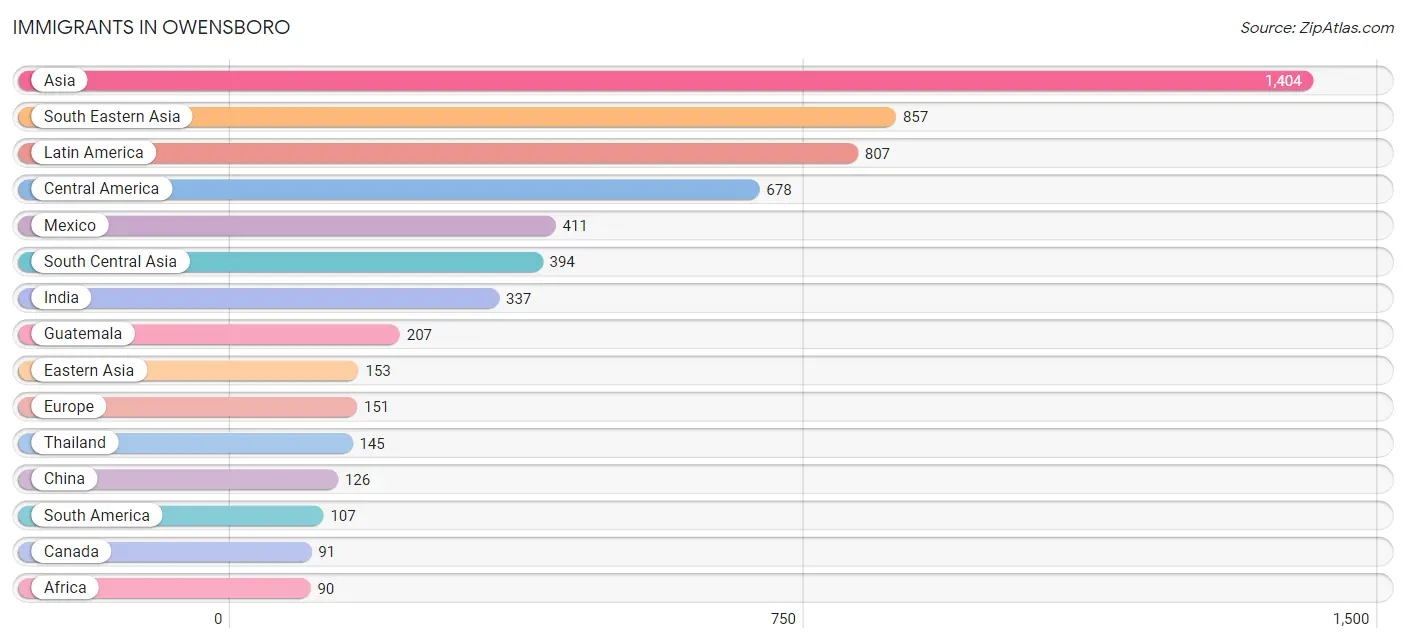
| Immigration Origin | # Population | % Population |
| Africa | 90 | 0.2% |
| Argentina | 30 | 0.1% |
| Asia | 1,404 | 2.3% |
| Bangladesh | 57 | 0.1% |
| Bolivia | 12 | 0.0% |
| Canada | 91 | 0.2% |
| Caribbean | 22 | 0.0% |
| Central America | 678 | 1.1% |
| China | 126 | 0.2% |
| Colombia | 3 | 0.0% |
| Congo | 19 | 0.0% |
| Cuba | 22 | 0.0% |
| Eastern Africa | 71 | 0.1% |
| Eastern Asia | 153 | 0.3% |
| El Salvador | 22 | 0.0% |
| England | 31 | 0.1% |
| Ethiopia | 49 | 0.1% |
| Europe | 151 | 0.3% |
| France | 14 | 0.0% |
| Germany | 54 | 0.1% |
| Greece | 11 | 0.0% |
| Guatemala | 207 | 0.3% |
| Guyana | 62 | 0.1% |
| Honduras | 38 | 0.1% |
| India | 337 | 0.6% |
| Indonesia | 14 | 0.0% |
| Ireland | 23 | 0.0% |
| Korea | 27 | 0.0% |
| Latin America | 807 | 1.3% |
| Malaysia | 52 | 0.1% |
| Mexico | 411 | 0.7% |
| Middle Africa | 19 | 0.0% |
| Northern Europe | 72 | 0.1% |
| Oceania | 2 | 0.0% |
| Philippines | 61 | 0.1% |
| South America | 107 | 0.2% |
| South Central Asia | 394 | 0.7% |
| South Eastern Asia | 857 | 1.4% |
| Southern Europe | 11 | 0.0% |
| Taiwan | 11 | 0.0% |
| Thailand | 145 | 0.2% |
| Uganda | 22 | 0.0% |
| Vietnam | 13 | 0.0% |
| Western Europe | 68 | 0.1% | View All 44 Rows |
Sex and Age in Owensboro
Sex and Age in Owensboro
The most populous age groups in Owensboro are Under 5 Years (2,216 | 7.6%) for men and 25 to 29 Years (2,166 | 7.0%) for women.
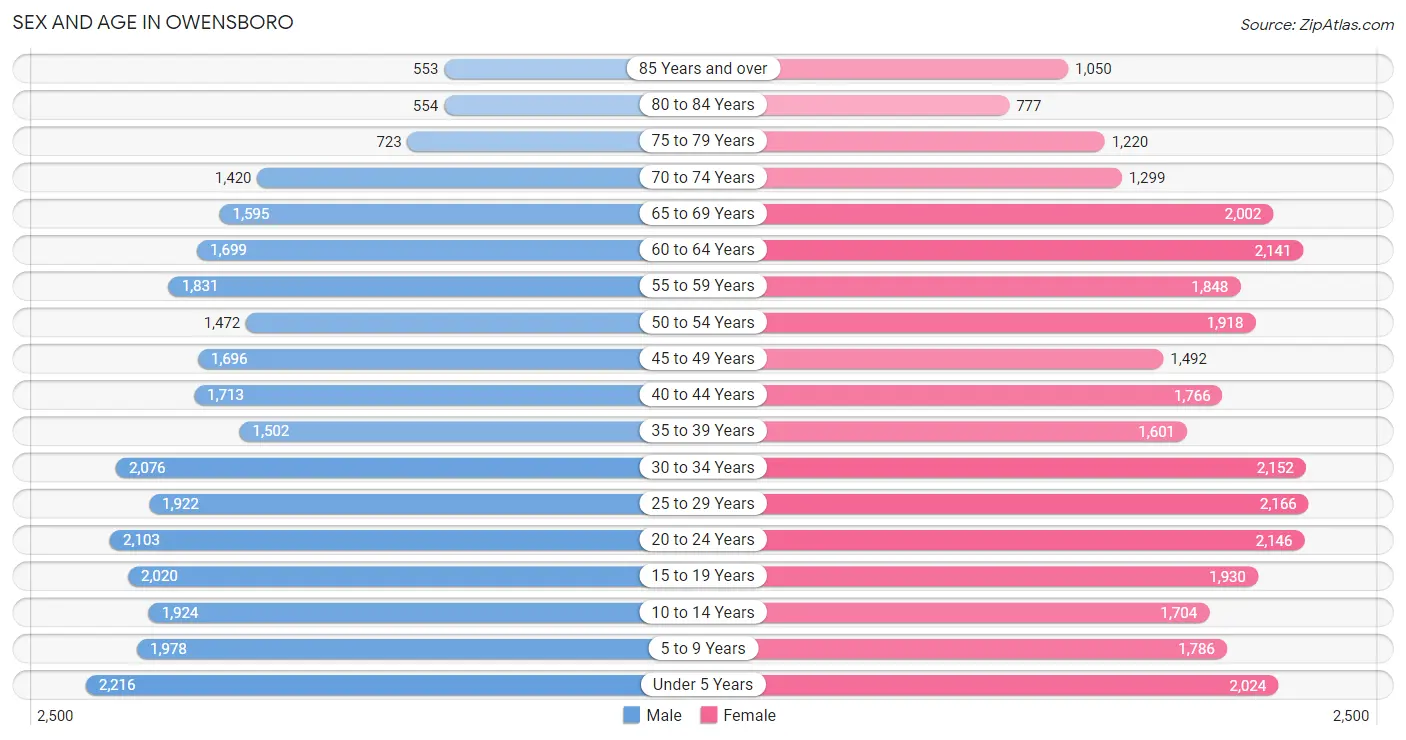
| Age Bracket | Male | Female |
| Under 5 Years | 2,216 (7.6%) | 2,024 (6.5%) |
| 5 to 9 Years | 1,978 (6.8%) | 1,786 (5.8%) |
| 10 to 14 Years | 1,924 (6.6%) | 1,704 (5.5%) |
| 15 to 19 Years | 2,020 (7.0%) | 1,930 (6.2%) |
| 20 to 24 Years | 2,103 (7.2%) | 2,146 (6.9%) |
| 25 to 29 Years | 1,922 (6.6%) | 2,166 (7.0%) |
| 30 to 34 Years | 2,076 (7.2%) | 2,152 (6.9%) |
| 35 to 39 Years | 1,502 (5.2%) | 1,601 (5.2%) |
| 40 to 44 Years | 1,713 (5.9%) | 1,766 (5.7%) |
| 45 to 49 Years | 1,696 (5.9%) | 1,492 (4.8%) |
| 50 to 54 Years | 1,472 (5.1%) | 1,918 (6.2%) |
| 55 to 59 Years | 1,831 (6.3%) | 1,848 (6.0%) |
| 60 to 64 Years | 1,699 (5.9%) | 2,141 (6.9%) |
| 65 to 69 Years | 1,595 (5.5%) | 2,002 (6.5%) |
| 70 to 74 Years | 1,420 (4.9%) | 1,299 (4.2%) |
| 75 to 79 Years | 723 (2.5%) | 1,220 (3.9%) |
| 80 to 84 Years | 554 (1.9%) | 777 (2.5%) |
| 85 Years and over | 553 (1.9%) | 1,050 (3.4%) |
| Total | 28,997 (100.0%) | 31,022 (100.0%) |
Families and Households in Owensboro
Median Family Size in Owensboro
The median family size in Owensboro is 2.91 persons per family, with married-couple families (9,426 | 63.9%) accounting for the largest median family size of 3.01 persons per family. On the other hand, single female/mother families (3,752 | 25.4%) represent the smallest median family size with 2.73 persons per family.
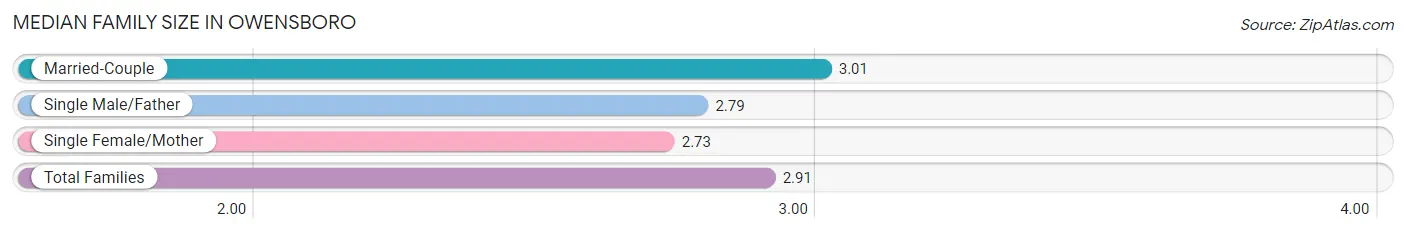
| Family Type | # Families | Family Size |
| Married-Couple | 9,426 (63.9%) | 3.01 |
| Single Male/Father | 1,573 (10.7%) | 2.79 |
| Single Female/Mother | 3,752 (25.4%) | 2.73 |
| Total Families | 14,751 (100.0%) | 2.91 |
Median Household Size in Owensboro
The median household size in Owensboro is 2.30 persons per household, with single male/father households (1,573 | 6.2%) accounting for the largest median household size of 3.43 persons per household. non-family households (10,477 | 41.5%) represent the smallest median household size with 1.20 persons per household.
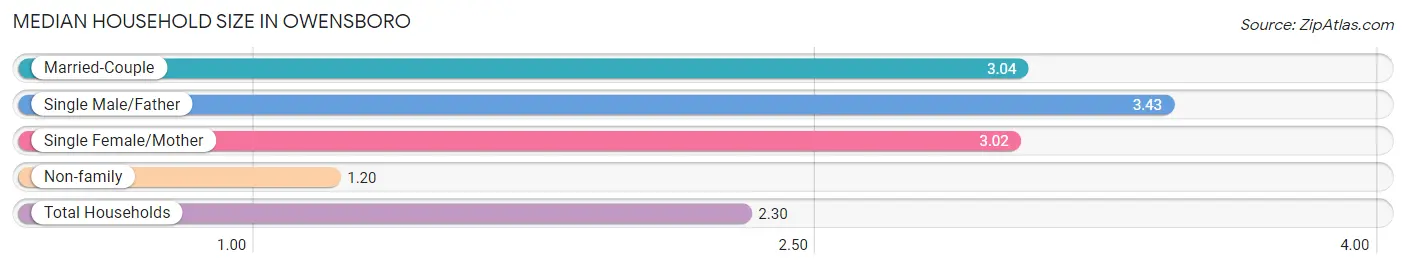
| Household Type | # Households | Household Size |
| Married-Couple | 9,426 (37.4%) | 3.04 |
| Single Male/Father | 1,573 (6.2%) | 3.43 |
| Single Female/Mother | 3,752 (14.9%) | 3.02 |
| Non-family | 10,477 (41.5%) | 1.20 |
| Total Households | 25,228 (100.0%) | 2.30 |
Household Size by Marriage Status in Owensboro
Out of a total of 25,228 households in Owensboro, 14,751 (58.5%) are family households, while 10,477 (41.5%) are nonfamily households. The most numerous type of family households are 2-person households, comprising 6,511, and the most common type of nonfamily households are 1-person households, comprising 8,669.
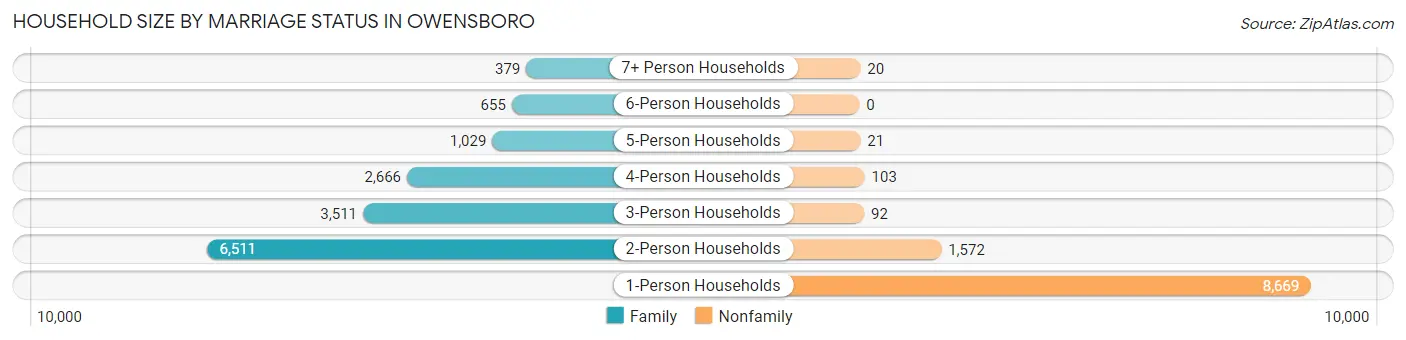
| Household Size | Family Households | Nonfamily Households |
| 1-Person Households | - | 8,669 (34.4%) |
| 2-Person Households | 6,511 (25.8%) | 1,572 (6.2%) |
| 3-Person Households | 3,511 (13.9%) | 92 (0.4%) |
| 4-Person Households | 2,666 (10.6%) | 103 (0.4%) |
| 5-Person Households | 1,029 (4.1%) | 21 (0.1%) |
| 6-Person Households | 655 (2.6%) | 0 (0.0%) |
| 7+ Person Households | 379 (1.5%) | 20 (0.1%) |
| Total | 14,751 (58.5%) | 10,477 (41.5%) |
Female Fertility in Owensboro
Fertility by Age in Owensboro
Average fertility rate in Owensboro is 68.0 births per 1,000 women. Women in the age bracket of 20 to 34 years have the highest fertility rate with 125.0 births per 1,000 women. Women in the age bracket of 20 to 34 years acount for 87.4% of all women with births.
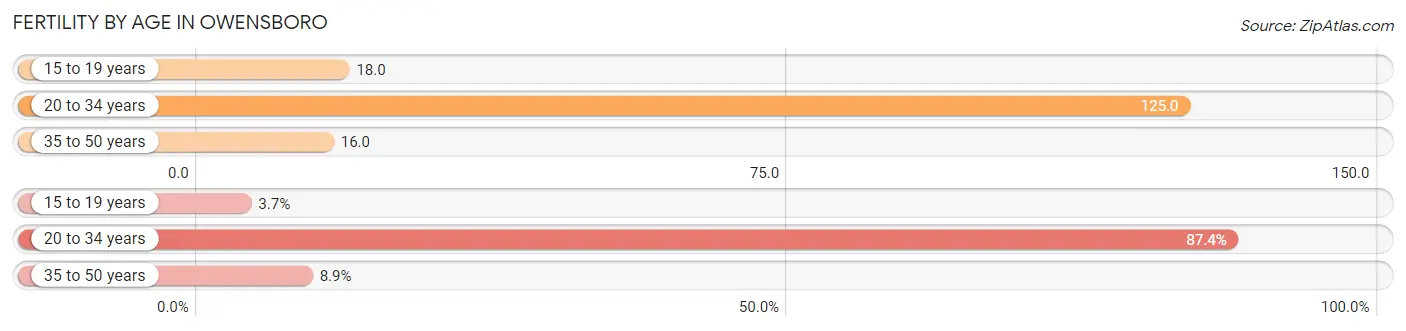
| Age Bracket | Women with Births | Births / 1,000 Women |
| 15 to 19 years | 34 (3.7%) | 18.0 |
| 20 to 34 years | 807 (87.4%) | 125.0 |
| 35 to 50 years | 82 (8.9%) | 16.0 |
| Total | 923 (100.0%) | 68.0 |
Fertility by Age by Marriage Status in Owensboro
45.2% of women with births (923) in Owensboro are married. The highest percentage of unmarried women with births falls into 15 to 19 years age bracket with 100.0% of them unmarried at the time of birth, while the lowest percentage of unmarried women with births belong to 20 to 34 years age bracket with 49.4% of them unmarried.
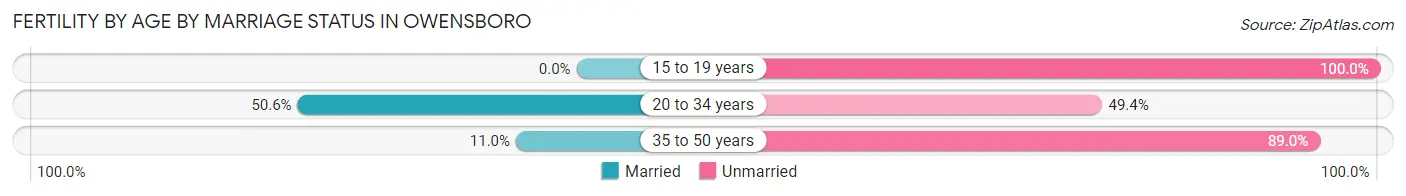
| Age Bracket | Married | Unmarried |
| 15 to 19 years | 0 (0.0%) | 34 (100.0%) |
| 20 to 34 years | 408 (50.6%) | 399 (49.4%) |
| 35 to 50 years | 9 (11.0%) | 73 (89.0%) |
| Total | 417 (45.2%) | 506 (54.8%) |
Fertility by Education in Owensboro
Average fertility rate in Owensboro is 68.0 births per 1,000 women. Women with the education attainment of high school diploma have the highest fertility rate of 87.0 births per 1,000 women, while women with the education attainment of less than high school have the lowest fertility at 30.0 births per 1,000 women. Women with the education attainment of college or associate's degree represent 35.2% of all women with births.
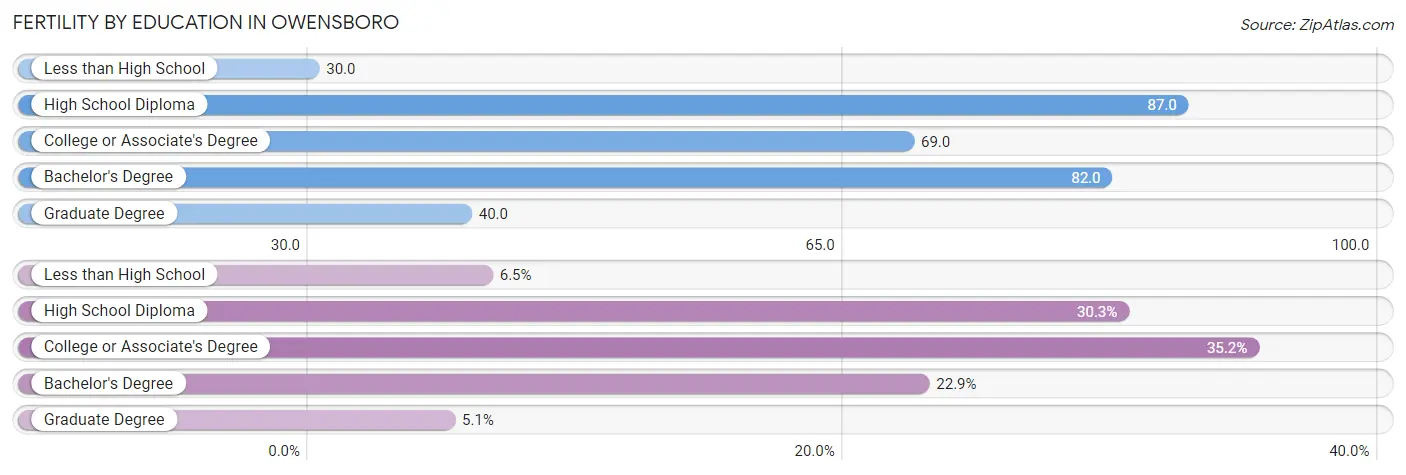
| Educational Attainment | Women with Births | Births / 1,000 Women |
| Less than High School | 60 (6.5%) | 30.0 |
| High School Diploma | 280 (30.3%) | 87.0 |
| College or Associate's Degree | 325 (35.2%) | 69.0 |
| Bachelor's Degree | 211 (22.9%) | 82.0 |
| Graduate Degree | 47 (5.1%) | 40.0 |
| Total | 923 (100.0%) | 68.0 |
Fertility by Education by Marriage Status in Owensboro
54.8% of women with births in Owensboro are unmarried. Women with the educational attainment of graduate degree are most likely to be married with 100.0% of them married at childbirth, while women with the educational attainment of bachelor's degree are least likely to be married with 82.5% of them unmarried at childbirth.
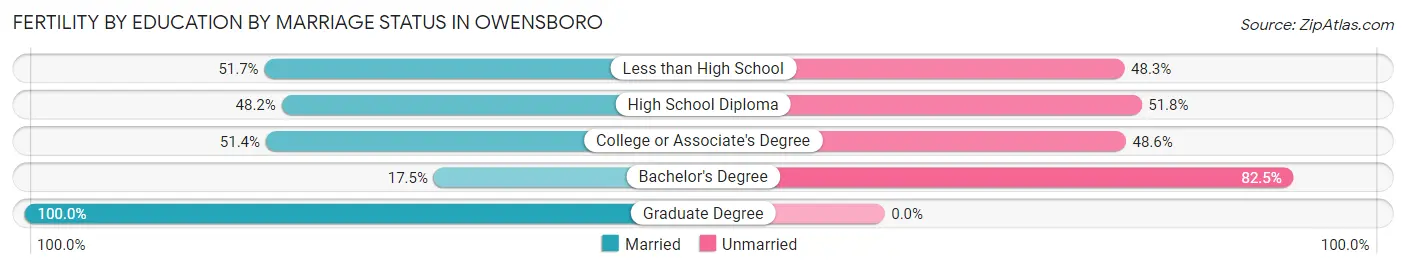
| Educational Attainment | Married | Unmarried |
| Less than High School | 31 (51.7%) | 29 (48.3%) |
| High School Diploma | 135 (48.2%) | 145 (51.8%) |
| College or Associate's Degree | 167 (51.4%) | 158 (48.6%) |
| Bachelor's Degree | 37 (17.5%) | 174 (82.5%) |
| Graduate Degree | 47 (100.0%) | 0 (0.0%) |
| Total | 417 (45.2%) | 506 (54.8%) |
Employment Characteristics in Owensboro
Employment by Class of Employer in Owensboro
Among the 26,062 employed individuals in Owensboro, private company employees (18,615 | 71.4%), not-for-profit organizations (2,651 | 10.2%), and local government employees (1,405 | 5.4%) make up the most common classes of employment.
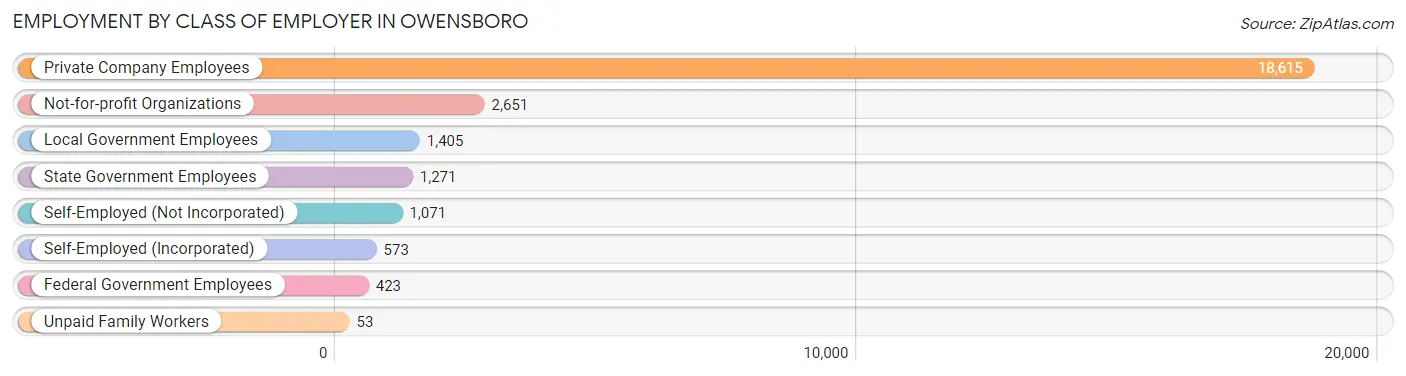
| Employer Class | # Employees | % Employees |
| Private Company Employees | 18,615 | 71.4% |
| Self-Employed (Incorporated) | 573 | 2.2% |
| Self-Employed (Not Incorporated) | 1,071 | 4.1% |
| Not-for-profit Organizations | 2,651 | 10.2% |
| Local Government Employees | 1,405 | 5.4% |
| State Government Employees | 1,271 | 4.9% |
| Federal Government Employees | 423 | 1.6% |
| Unpaid Family Workers | 53 | 0.2% |
| Total | 26,062 | 100.0% |
Employment Status by Age in Owensboro
According to the labor force statistics for Owensboro, out of the total population over 16 years of age (47,393), 58.3% or 27,630 individuals are in the labor force, with 4.2% or 1,160 of them unemployed. The age group with the highest labor force participation rate is 20 to 24 years, with 82.0% or 3,484 individuals in the labor force. Within the labor force, the 16 to 19 years age range has the highest percentage of unemployed individuals, with 20.7% or 309 of them being unemployed.
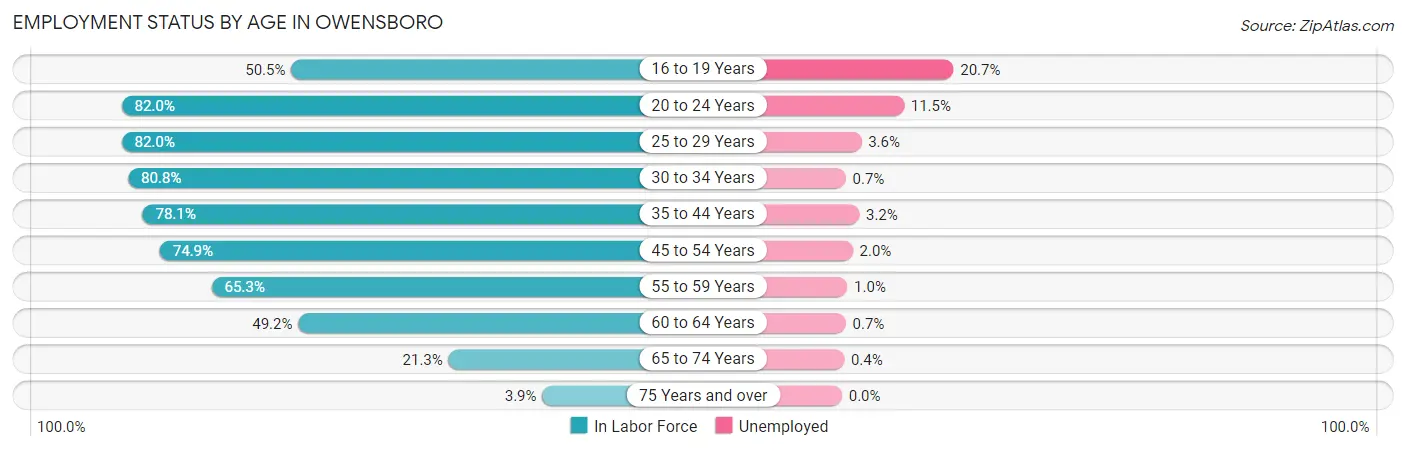
| Age Bracket | In Labor Force | Unemployed |
| 16 to 19 Years | 1,493 (50.5%) | 309 (20.7%) |
| 20 to 24 Years | 3,484 (82.0%) | 401 (11.5%) |
| 25 to 29 Years | 3,352 (82.0%) | 121 (3.6%) |
| 30 to 34 Years | 3,416 (80.8%) | 24 (0.7%) |
| 35 to 44 Years | 5,141 (78.1%) | 165 (3.2%) |
| 45 to 54 Years | 4,927 (74.9%) | 99 (2.0%) |
| 55 to 59 Years | 2,402 (65.3%) | 24 (1.0%) |
| 60 to 64 Years | 1,889 (49.2%) | 13 (0.7%) |
| 65 to 74 Years | 1,345 (21.3%) | 5 (0.4%) |
| 75 Years and over | 190 (3.9%) | 0 (0.0%) |
| Total | 27,630 (58.3%) | 1,160 (4.2%) |
Employment Status by Educational Attainment in Owensboro
According to labor force statistics for Owensboro, 72.9% of individuals (21,137) out of the total population between 25 and 64 years of age (28,995) are in the labor force, with 2.1% or 444 of them being unemployed. The group with the highest labor force participation rate are those with the educational attainment of bachelor's degree or higher, with 86.2% or 6,885 individuals in the labor force. Within the labor force, individuals with less than high school education have the highest percentage of unemployment, with 4.7% or 55 of them being unemployed.
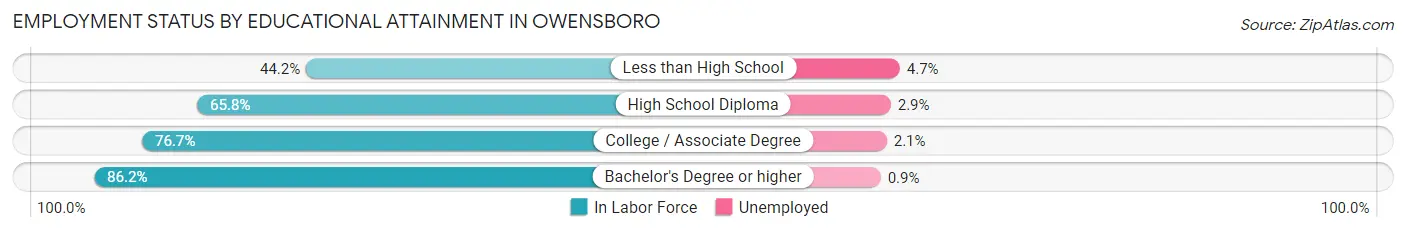
| Educational Attainment | In Labor Force | Unemployed |
| Less than High School | 1,169 (44.2%) | 124 (4.7%) |
| High School Diploma | 6,113 (65.8%) | 269 (2.9%) |
| College / Associate Degree | 6,959 (76.7%) | 191 (2.1%) |
| Bachelor's Degree or higher | 6,885 (86.2%) | 72 (0.9%) |
| Total | 21,137 (72.9%) | 609 (2.1%) |
Employment Occupations by Sex in Owensboro
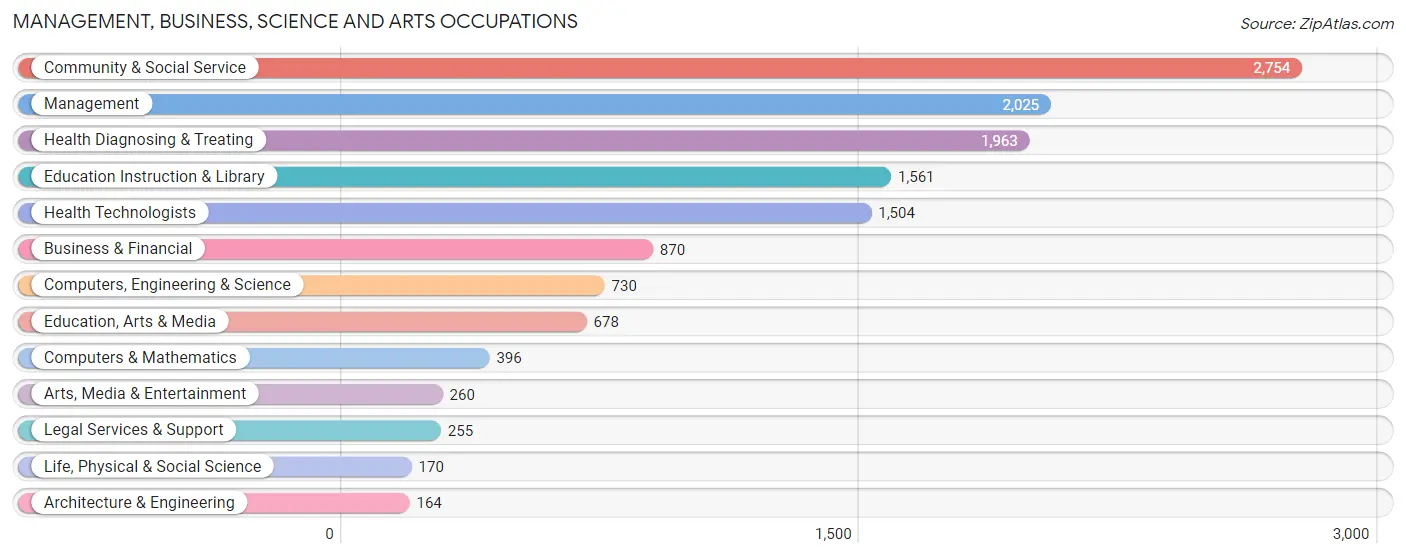
Management, Business, Science and Arts Occupations
The most common Management, Business, Science and Arts occupations in Owensboro are Community & Social Service (2,754 | 10.4%), Management (2,025 | 7.6%), Health Diagnosing & Treating (1,963 | 7.4%), Education Instruction & Library (1,561 | 5.9%), and Health Technologists (1,504 | 5.7%).
Management, Business, Science and Arts Occupations by Sex
Within the Management, Business, Science and Arts occupations in Owensboro, the most male-oriented occupations are Architecture & Engineering (90.2%), Computers & Mathematics (67.7%), and Computers, Engineering & Science (63.4%), while the most female-oriented occupations are Health Diagnosing & Treating (80.6%), Health Technologists (80.1%), and Education Instruction & Library (74.0%).
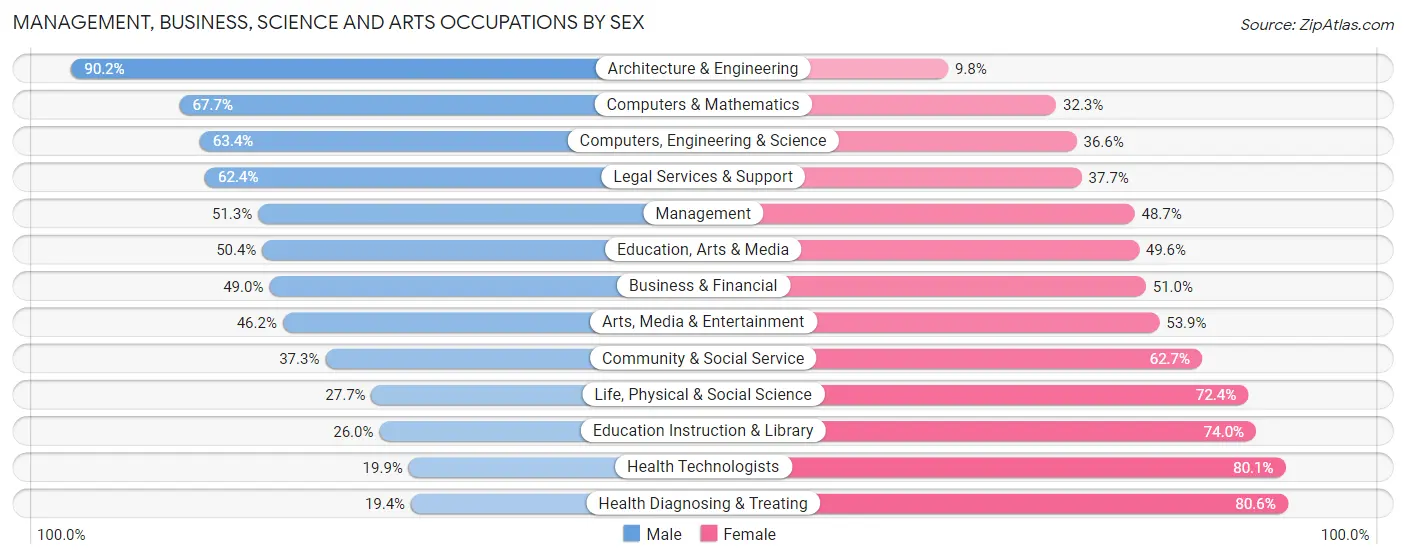
| Occupation | Male | Female |
| Management | 1,039 (51.3%) | 986 (48.7%) |
| Business & Financial | 426 (49.0%) | 444 (51.0%) |
| Computers, Engineering & Science | 463 (63.4%) | 267 (36.6%) |
| Computers & Mathematics | 268 (67.7%) | 128 (32.3%) |
| Architecture & Engineering | 148 (90.2%) | 16 (9.8%) |
| Life, Physical & Social Science | 47 (27.7%) | 123 (72.4%) |
| Community & Social Service | 1,027 (37.3%) | 1,727 (62.7%) |
| Education, Arts & Media | 342 (50.4%) | 336 (49.6%) |
| Legal Services & Support | 159 (62.4%) | 96 (37.7%) |
| Education Instruction & Library | 406 (26.0%) | 1,155 (74.0%) |
| Arts, Media & Entertainment | 120 (46.2%) | 140 (53.8%) |
| Health Diagnosing & Treating | 381 (19.4%) | 1,582 (80.6%) |
| Health Technologists | 299 (19.9%) | 1,205 (80.1%) |
| Total (Category) | 3,336 (40.0%) | 5,006 (60.0%) |
| Total (Overall) | 13,426 (50.7%) | 13,033 (49.3%) |
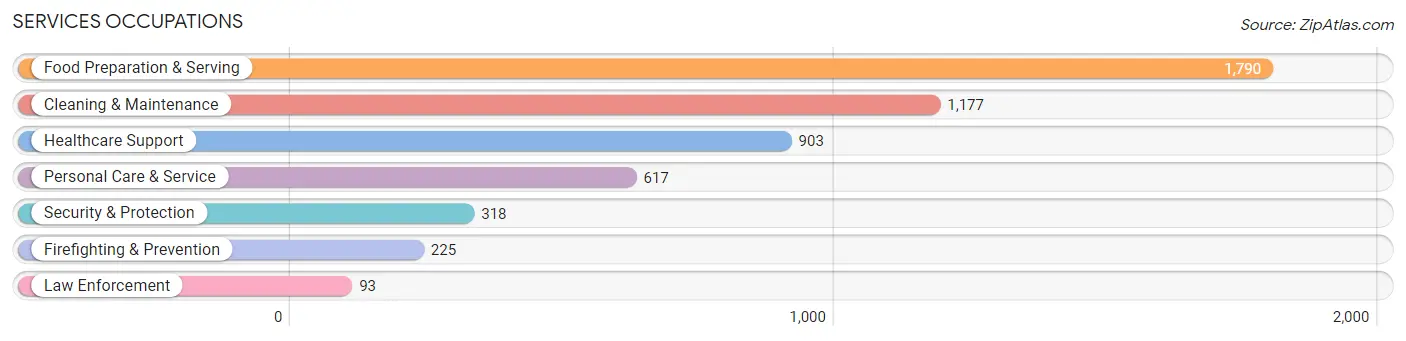
Services Occupations
The most common Services occupations in Owensboro are Food Preparation & Serving (1,790 | 6.8%), Cleaning & Maintenance (1,177 | 4.4%), Healthcare Support (903 | 3.4%), Personal Care & Service (617 | 2.3%), and Security & Protection (318 | 1.2%).
Services Occupations by Sex
Within the Services occupations in Owensboro, the most male-oriented occupations are Law Enforcement (100.0%), Security & Protection (84.3%), and Firefighting & Prevention (77.8%), while the most female-oriented occupations are Healthcare Support (96.0%), Personal Care & Service (73.7%), and Food Preparation & Serving (63.1%).
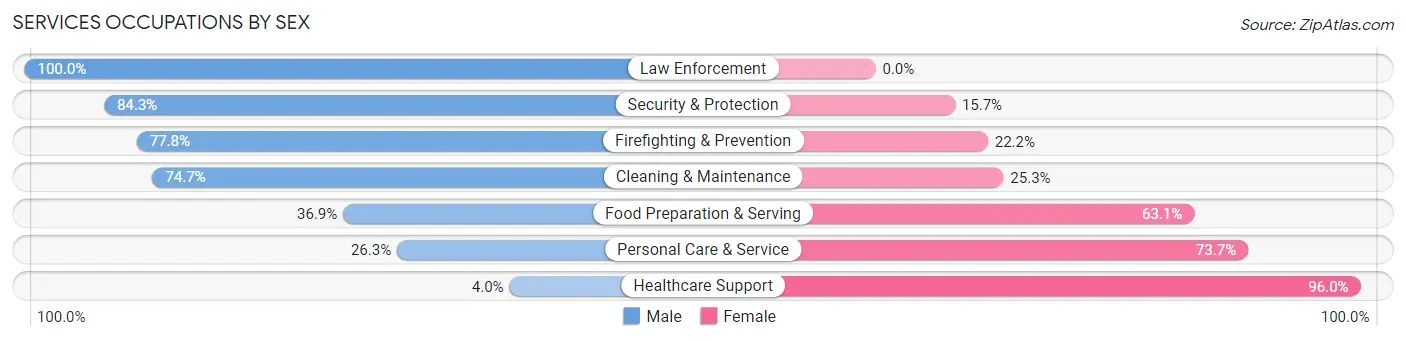
| Occupation | Male | Female |
| Healthcare Support | 36 (4.0%) | 867 (96.0%) |
| Security & Protection | 268 (84.3%) | 50 (15.7%) |
| Firefighting & Prevention | 175 (77.8%) | 50 (22.2%) |
| Law Enforcement | 93 (100.0%) | 0 (0.0%) |
| Food Preparation & Serving | 661 (36.9%) | 1,129 (63.1%) |
| Cleaning & Maintenance | 879 (74.7%) | 298 (25.3%) |
| Personal Care & Service | 162 (26.3%) | 455 (73.7%) |
| Total (Category) | 2,006 (41.7%) | 2,799 (58.3%) |
| Total (Overall) | 13,426 (50.7%) | 13,033 (49.3%) |
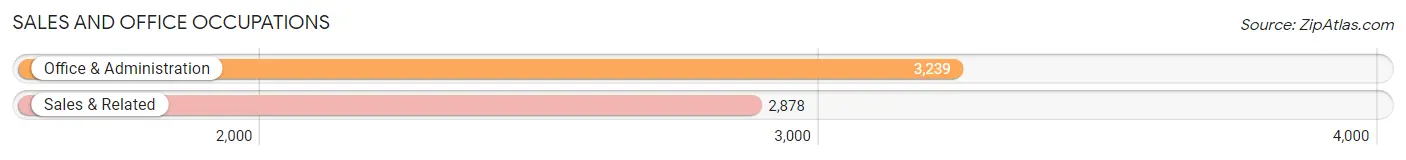
Sales and Office Occupations
The most common Sales and Office occupations in Owensboro are Office & Administration (3,239 | 12.2%), and Sales & Related (2,878 | 10.9%).
Sales and Office Occupations by Sex
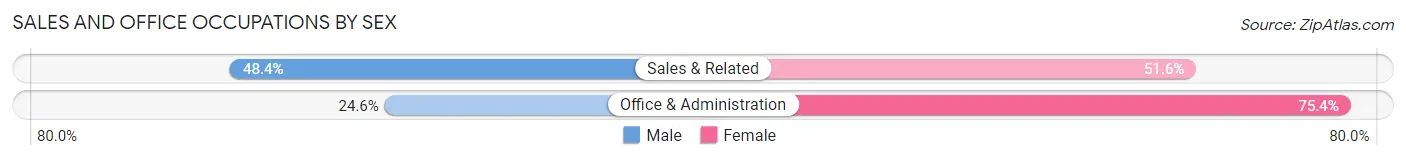
| Occupation | Male | Female |
| Sales & Related | 1,392 (48.4%) | 1,486 (51.6%) |
| Office & Administration | 797 (24.6%) | 2,442 (75.4%) |
| Total (Category) | 2,189 (35.8%) | 3,928 (64.2%) |
| Total (Overall) | 13,426 (50.7%) | 13,033 (49.3%) |
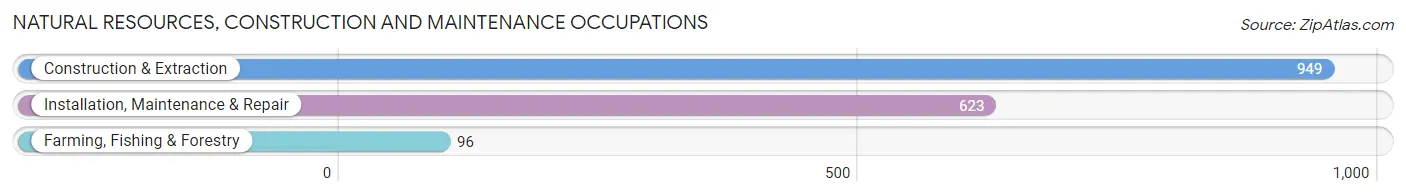
Natural Resources, Construction and Maintenance Occupations
The most common Natural Resources, Construction and Maintenance occupations in Owensboro are Construction & Extraction (949 | 3.6%), Installation, Maintenance & Repair (623 | 2.4%), and Farming, Fishing & Forestry (96 | 0.4%).
Natural Resources, Construction and Maintenance Occupations by Sex
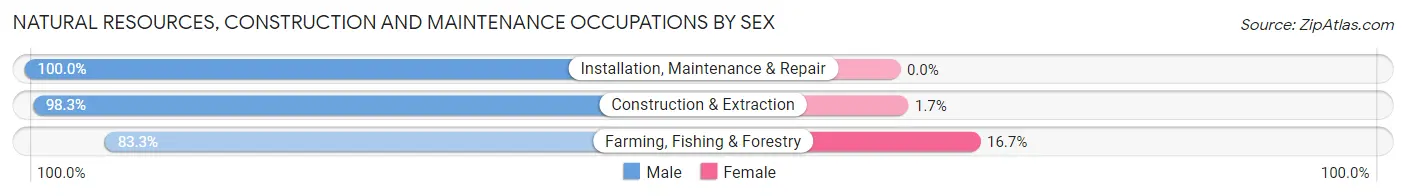
| Occupation | Male | Female |
| Farming, Fishing & Forestry | 80 (83.3%) | 16 (16.7%) |
| Construction & Extraction | 933 (98.3%) | 16 (1.7%) |
| Installation, Maintenance & Repair | 623 (100.0%) | 0 (0.0%) |
| Total (Category) | 1,636 (98.1%) | 32 (1.9%) |
| Total (Overall) | 13,426 (50.7%) | 13,033 (49.3%) |
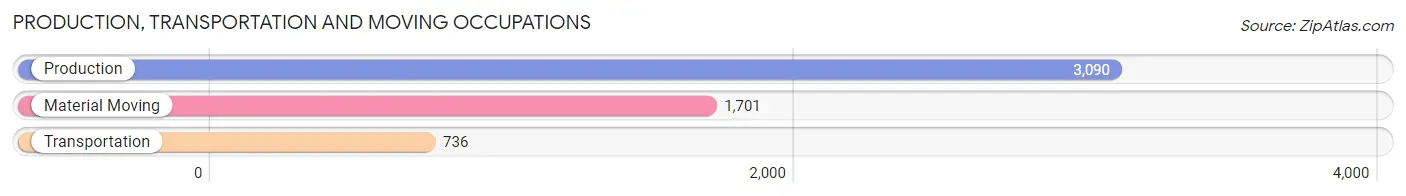
Production, Transportation and Moving Occupations
The most common Production, Transportation and Moving occupations in Owensboro are Production (3,090 | 11.7%), Material Moving (1,701 | 6.4%), and Transportation (736 | 2.8%).
Production, Transportation and Moving Occupations by Sex
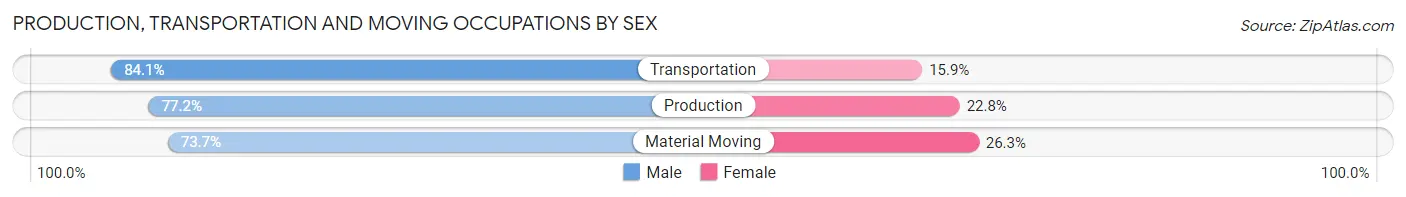
| Occupation | Male | Female |
| Production | 2,386 (77.2%) | 704 (22.8%) |
| Transportation | 619 (84.1%) | 117 (15.9%) |
| Material Moving | 1,254 (73.7%) | 447 (26.3%) |
| Total (Category) | 4,259 (77.1%) | 1,268 (22.9%) |
| Total (Overall) | 13,426 (50.7%) | 13,033 (49.3%) |
Employment Industries by Sex in Owensboro
Employment Industries in Owensboro
The major employment industries in Owensboro include Health Care & Social Assistance (4,641 | 17.5%), Manufacturing (4,302 | 16.3%), Retail Trade (3,240 | 12.2%), Accommodation & Food Services (2,123 | 8.0%), and Educational Services (2,053 | 7.8%).
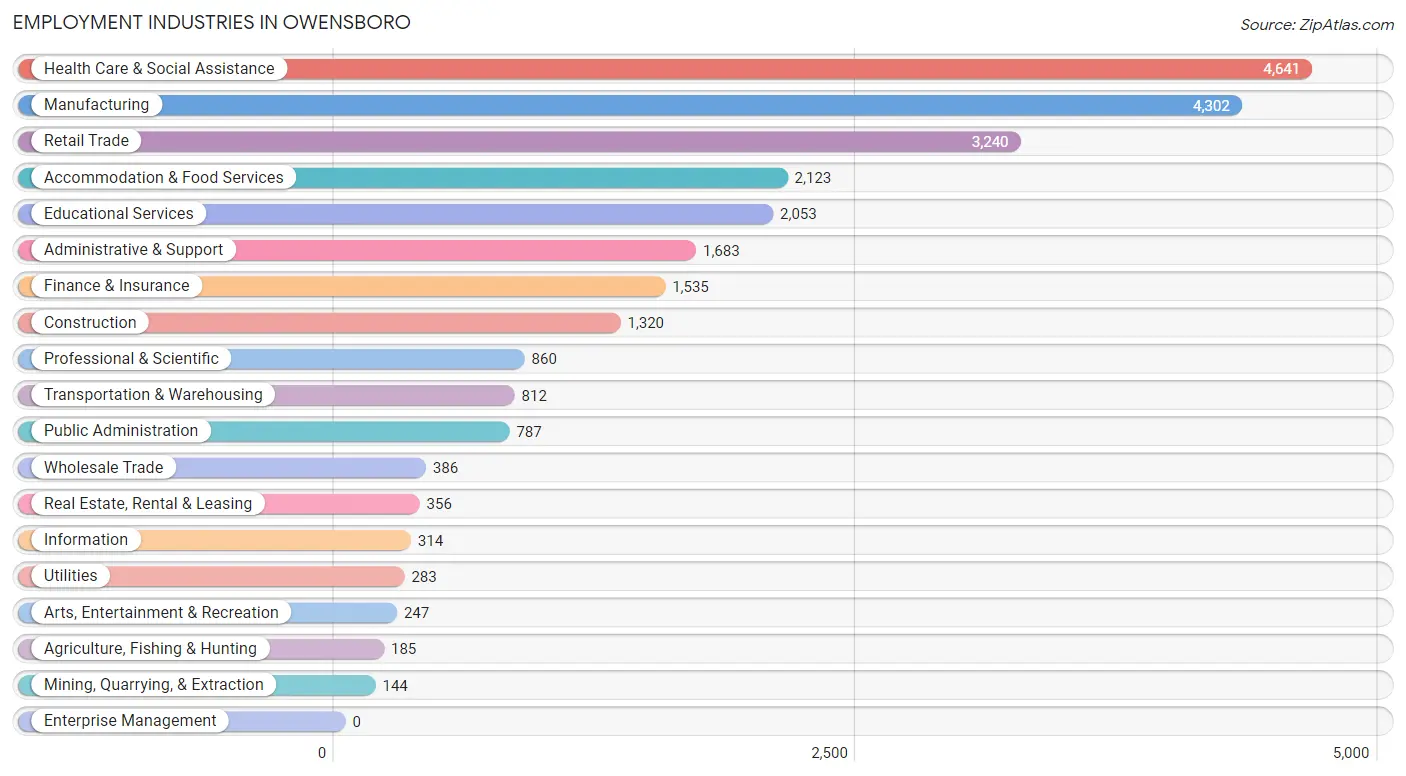
Employment Industries by Sex in Owensboro
The Owensboro industries that see more men than women are Mining, Quarrying, & Extraction (100.0%), Construction (90.2%), and Administrative & Support (75.6%), whereas the industries that tend to have a higher number of women are Health Care & Social Assistance (83.4%), Educational Services (68.8%), and Accommodation & Food Services (62.2%).
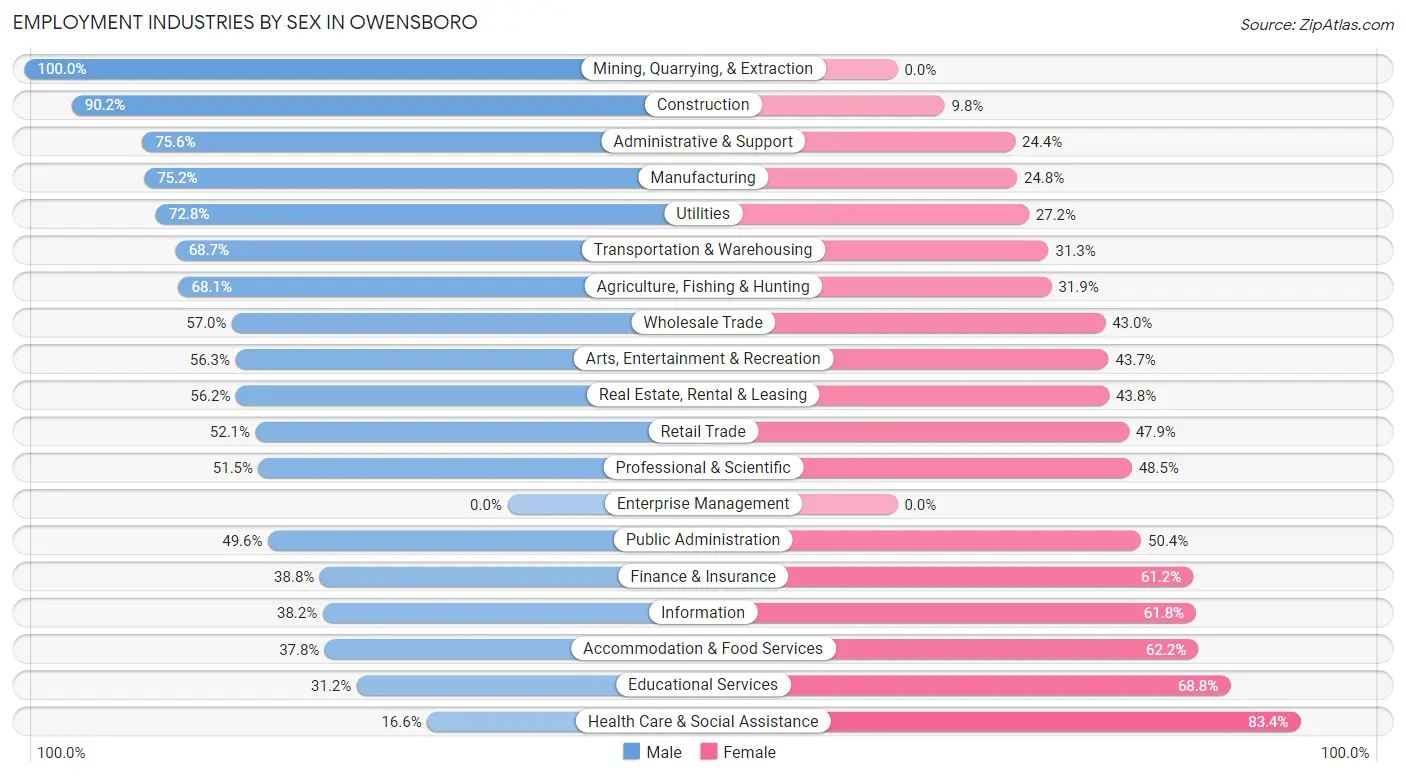
| Industry | Male | Female |
| Agriculture, Fishing & Hunting | 126 (68.1%) | 59 (31.9%) |
| Mining, Quarrying, & Extraction | 144 (100.0%) | 0 (0.0%) |
| Construction | 1,191 (90.2%) | 129 (9.8%) |
| Manufacturing | 3,237 (75.2%) | 1,065 (24.8%) |
| Wholesale Trade | 220 (57.0%) | 166 (43.0%) |
| Retail Trade | 1,689 (52.1%) | 1,551 (47.9%) |
| Transportation & Warehousing | 558 (68.7%) | 254 (31.3%) |
| Utilities | 206 (72.8%) | 77 (27.2%) |
| Information | 120 (38.2%) | 194 (61.8%) |
| Finance & Insurance | 596 (38.8%) | 939 (61.2%) |
| Real Estate, Rental & Leasing | 200 (56.2%) | 156 (43.8%) |
| Professional & Scientific | 443 (51.5%) | 417 (48.5%) |
| Enterprise Management | 0 (0.0%) | 0 (0.0%) |
| Administrative & Support | 1,273 (75.6%) | 410 (24.4%) |
| Educational Services | 640 (31.2%) | 1,413 (68.8%) |
| Health Care & Social Assistance | 771 (16.6%) | 3,870 (83.4%) |
| Arts, Entertainment & Recreation | 139 (56.3%) | 108 (43.7%) |
| Accommodation & Food Services | 802 (37.8%) | 1,321 (62.2%) |
| Public Administration | 390 (49.6%) | 397 (50.4%) |
| Total | 13,426 (50.7%) | 13,033 (49.3%) |
Education in Owensboro
School Enrollment in Owensboro
The most common levels of schooling among the 13,244 students in Owensboro are middle school (2,900 | 21.9%), high school (2,864 | 21.6%), and elementary school (2,791 | 21.1%).
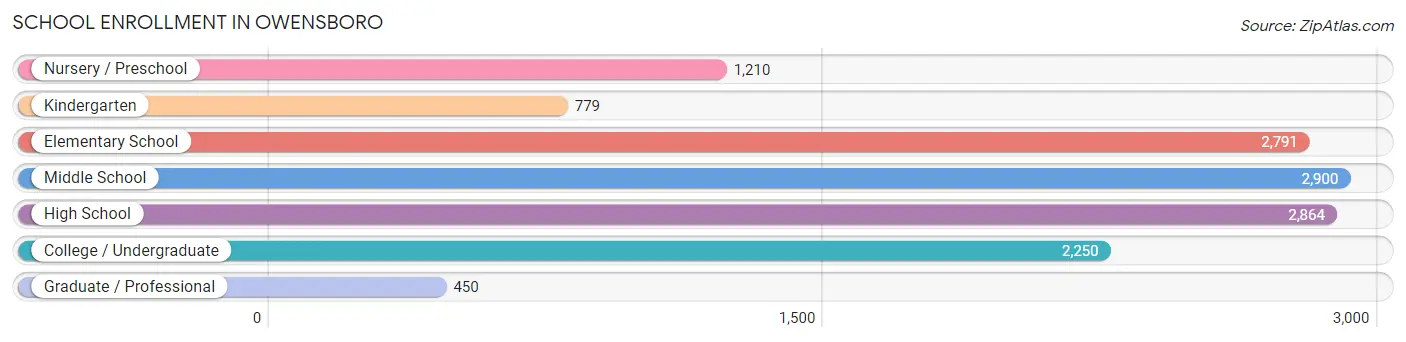
| School Level | # Students | % Students |
| Nursery / Preschool | 1,210 | 9.1% |
| Kindergarten | 779 | 5.9% |
| Elementary School | 2,791 | 21.1% |
| Middle School | 2,900 | 21.9% |
| High School | 2,864 | 21.6% |
| College / Undergraduate | 2,250 | 17.0% |
| Graduate / Professional | 450 | 3.4% |
| Total | 13,244 | 100.0% |
School Enrollment by Age by Funding Source in Owensboro
Out of a total of 13,244 students who are enrolled in schools in Owensboro, 2,265 (17.1%) attend a private institution, while the remaining 10,979 (82.9%) are enrolled in public schools. The age group of 20 to 24 year olds has the highest likelihood of being enrolled in private schools, with 330 (36.9% in the age bracket) enrolled. Conversely, the age group of 5 to 9 year old has the lowest likelihood of being enrolled in a private school, with 3,135 (89.4% in the age bracket) attending a public institution.
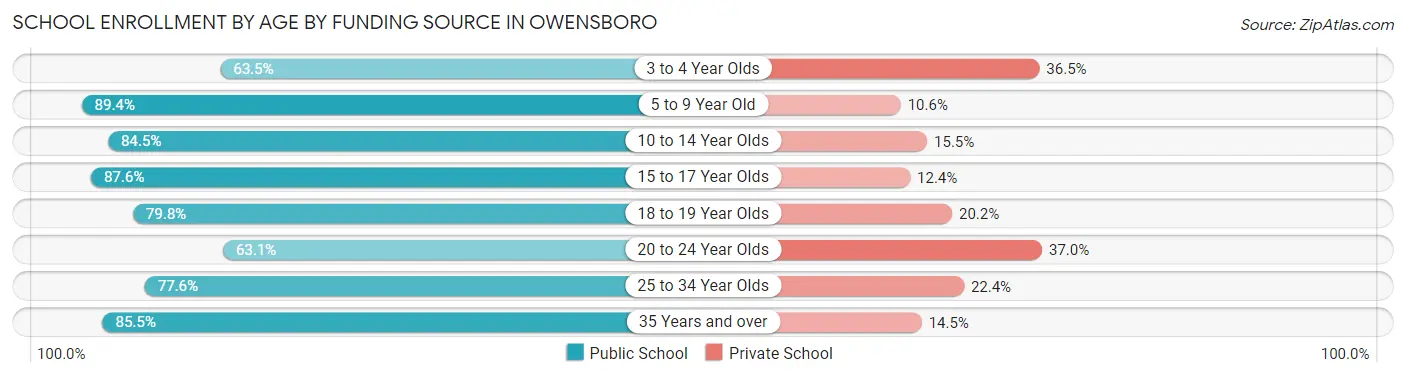
| Age Bracket | Public School | Private School |
| 3 to 4 Year Olds | 521 (63.5%) | 299 (36.5%) |
| 5 to 9 Year Old | 3,135 (89.4%) | 373 (10.6%) |
| 10 to 14 Year Olds | 2,918 (84.5%) | 537 (15.5%) |
| 15 to 17 Year Olds | 2,146 (87.6%) | 303 (12.4%) |
| 18 to 19 Year Olds | 811 (79.8%) | 205 (20.2%) |
| 20 to 24 Year Olds | 563 (63.0%) | 330 (36.9%) |
| 25 to 34 Year Olds | 589 (77.6%) | 170 (22.4%) |
| 35 Years and over | 294 (85.5%) | 50 (14.5%) |
| Total | 10,979 (82.9%) | 2,265 (17.1%) |
Educational Attainment by Field of Study in Owensboro
Business (1,763 | 15.7%), education (1,661 | 14.8%), science & technology (1,651 | 14.7%), arts & humanities (990 | 8.8%), and liberal arts & history (850 | 7.6%) are the most common fields of study among 11,203 individuals in Owensboro who have obtained a bachelor's degree or higher.
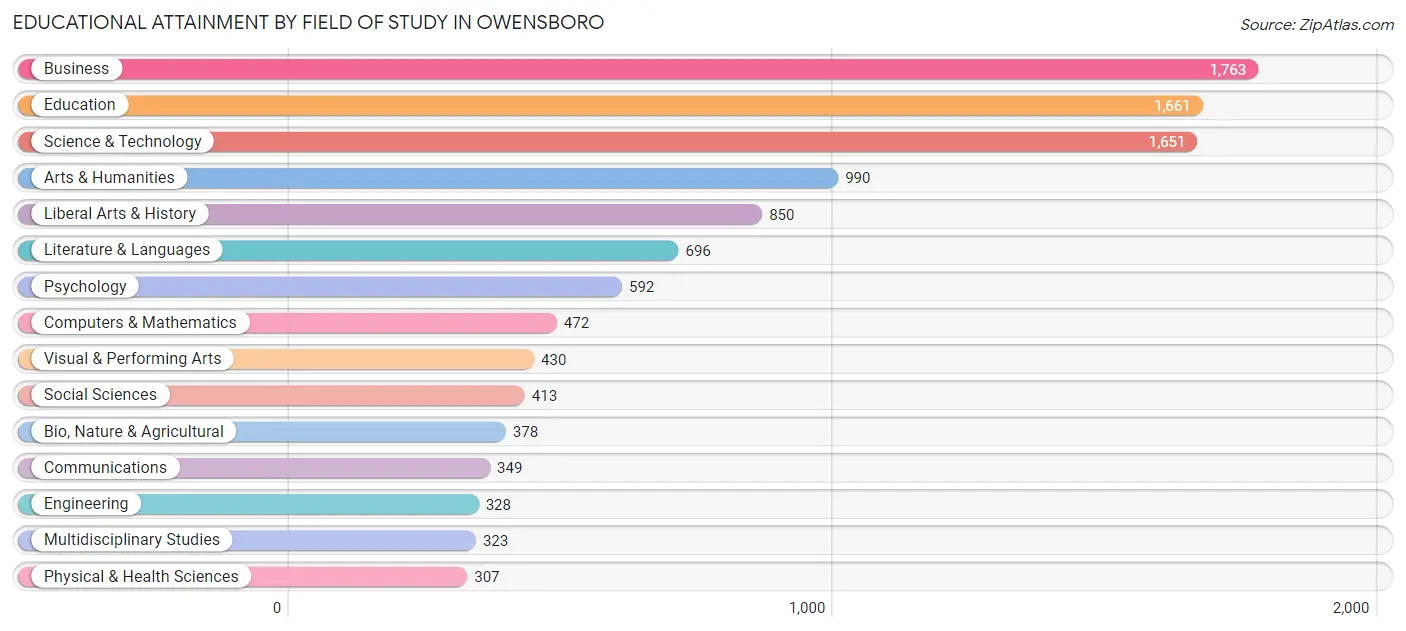
| Field of Study | # Graduates | % Graduates |
| Computers & Mathematics | 472 | 4.2% |
| Bio, Nature & Agricultural | 378 | 3.4% |
| Physical & Health Sciences | 307 | 2.7% |
| Psychology | 592 | 5.3% |
| Social Sciences | 413 | 3.7% |
| Engineering | 328 | 2.9% |
| Multidisciplinary Studies | 323 | 2.9% |
| Science & Technology | 1,651 | 14.7% |
| Business | 1,763 | 15.7% |
| Education | 1,661 | 14.8% |
| Literature & Languages | 696 | 6.2% |
| Liberal Arts & History | 850 | 7.6% |
| Visual & Performing Arts | 430 | 3.8% |
| Communications | 349 | 3.1% |
| Arts & Humanities | 990 | 8.8% |
| Total | 11,203 | 100.0% |
Transportation & Commute in Owensboro
Vehicle Availability by Sex in Owensboro
The most prevalent vehicle ownership categories in Owensboro are males with 2 vehicles (5,930, accounting for 44.8%) and females with 2 vehicles (4,989, making up 46.8%).
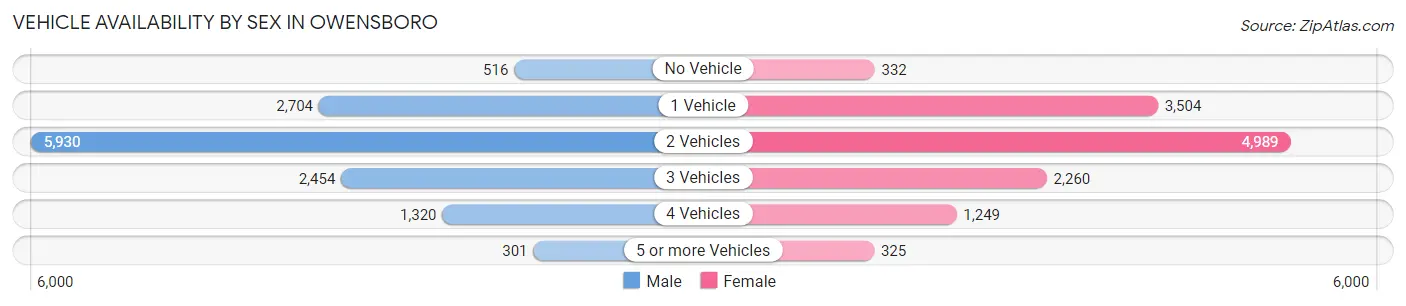
| Vehicles Available | Male | Female |
| No Vehicle | 516 (3.9%) | 332 (2.6%) |
| 1 Vehicle | 2,704 (20.4%) | 3,504 (27.7%) |
| 2 Vehicles | 5,930 (44.8%) | 4,989 (39.4%) |
| 3 Vehicles | 2,454 (18.6%) | 2,260 (17.8%) |
| 4 Vehicles | 1,320 (10.0%) | 1,249 (9.9%) |
| 5 or more Vehicles | 301 (2.3%) | 325 (2.6%) |
| Total | 13,225 (100.0%) | 12,659 (100.0%) |
Commute Time in Owensboro
The most frequently occuring commute durations in Owensboro are 10 to 14 minutes (7,580 commuters, 30.7%), 5 to 9 minutes (5,009 commuters, 20.3%), and 15 to 19 minutes (4,804 commuters, 19.4%).
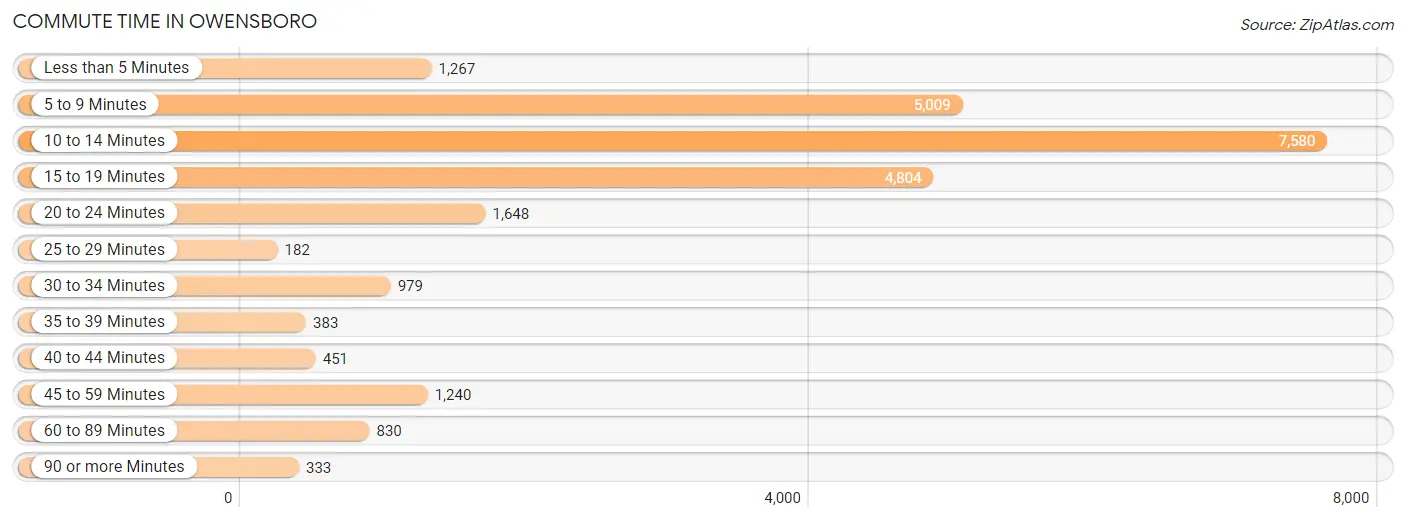
| Commute Time | # Commuters | % Commuters |
| Less than 5 Minutes | 1,267 | 5.1% |
| 5 to 9 Minutes | 5,009 | 20.3% |
| 10 to 14 Minutes | 7,580 | 30.7% |
| 15 to 19 Minutes | 4,804 | 19.4% |
| 20 to 24 Minutes | 1,648 | 6.7% |
| 25 to 29 Minutes | 182 | 0.7% |
| 30 to 34 Minutes | 979 | 4.0% |
| 35 to 39 Minutes | 383 | 1.5% |
| 40 to 44 Minutes | 451 | 1.8% |
| 45 to 59 Minutes | 1,240 | 5.0% |
| 60 to 89 Minutes | 830 | 3.4% |
| 90 or more Minutes | 333 | 1.3% |
Commute Time by Sex in Owensboro
The most common commute times in Owensboro are 10 to 14 minutes (3,688 commuters, 29.2%) for males and 10 to 14 minutes (3,892 commuters, 32.3%) for females.
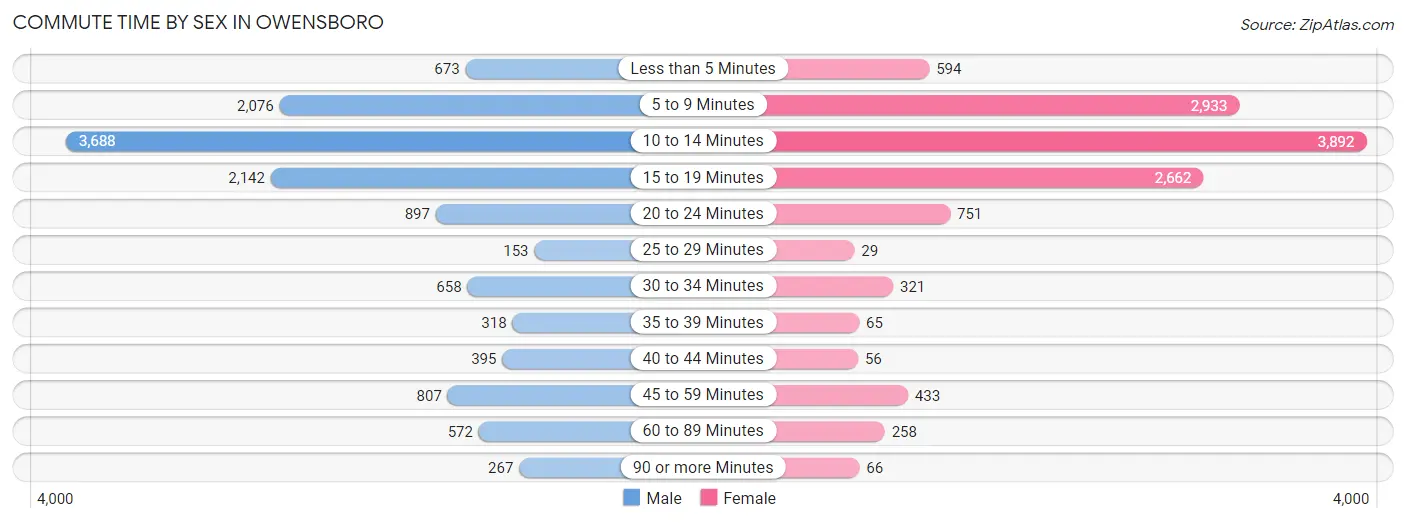
| Commute Time | Male | Female |
| Less than 5 Minutes | 673 (5.3%) | 594 (4.9%) |
| 5 to 9 Minutes | 2,076 (16.4%) | 2,933 (24.3%) |
| 10 to 14 Minutes | 3,688 (29.2%) | 3,892 (32.3%) |
| 15 to 19 Minutes | 2,142 (16.9%) | 2,662 (22.1%) |
| 20 to 24 Minutes | 897 (7.1%) | 751 (6.2%) |
| 25 to 29 Minutes | 153 (1.2%) | 29 (0.2%) |
| 30 to 34 Minutes | 658 (5.2%) | 321 (2.7%) |
| 35 to 39 Minutes | 318 (2.5%) | 65 (0.5%) |
| 40 to 44 Minutes | 395 (3.1%) | 56 (0.5%) |
| 45 to 59 Minutes | 807 (6.4%) | 433 (3.6%) |
| 60 to 89 Minutes | 572 (4.5%) | 258 (2.1%) |
| 90 or more Minutes | 267 (2.1%) | 66 (0.5%) |
Time of Departure to Work by Sex in Owensboro
The most frequent times of departure to work in Owensboro are 6:30 AM to 6:59 AM (1,621, 12.8%) for males and 7:30 AM to 7:59 AM (2,245, 18.6%) for females.
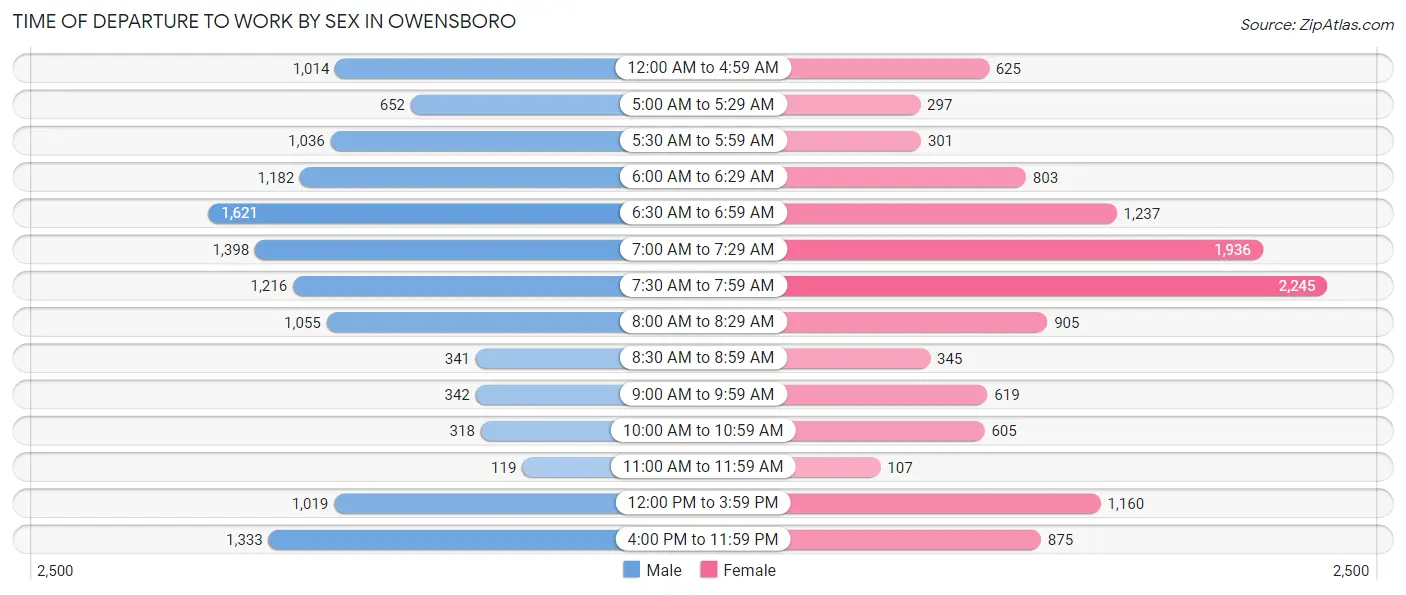
| Time of Departure | Male | Female |
| 12:00 AM to 4:59 AM | 1,014 (8.0%) | 625 (5.2%) |
| 5:00 AM to 5:29 AM | 652 (5.2%) | 297 (2.5%) |
| 5:30 AM to 5:59 AM | 1,036 (8.2%) | 301 (2.5%) |
| 6:00 AM to 6:29 AM | 1,182 (9.3%) | 803 (6.7%) |
| 6:30 AM to 6:59 AM | 1,621 (12.8%) | 1,237 (10.3%) |
| 7:00 AM to 7:29 AM | 1,398 (11.1%) | 1,936 (16.1%) |
| 7:30 AM to 7:59 AM | 1,216 (9.6%) | 2,245 (18.6%) |
| 8:00 AM to 8:29 AM | 1,055 (8.3%) | 905 (7.5%) |
| 8:30 AM to 8:59 AM | 341 (2.7%) | 345 (2.9%) |
| 9:00 AM to 9:59 AM | 342 (2.7%) | 619 (5.1%) |
| 10:00 AM to 10:59 AM | 318 (2.5%) | 605 (5.0%) |
| 11:00 AM to 11:59 AM | 119 (0.9%) | 107 (0.9%) |
| 12:00 PM to 3:59 PM | 1,019 (8.1%) | 1,160 (9.6%) |
| 4:00 PM to 11:59 PM | 1,333 (10.5%) | 875 (7.3%) |
| Total | 12,646 (100.0%) | 12,060 (100.0%) |
Housing Occupancy in Owensboro
Occupancy by Ownership in Owensboro
Of the total 25,228 dwellings in Owensboro, owner-occupied units account for 14,398 (57.1%), while renter-occupied units make up 10,830 (42.9%).
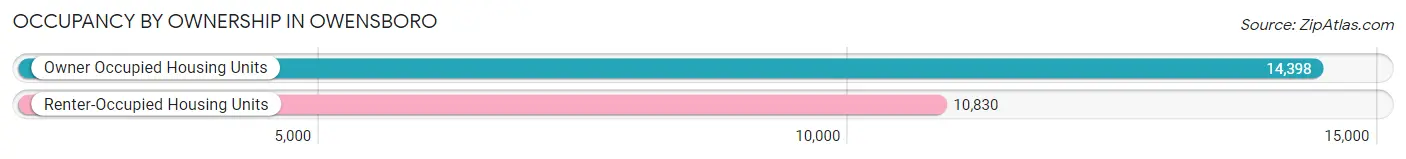
| Occupancy | # Housing Units | % Housing Units |
| Owner Occupied Housing Units | 14,398 | 57.1% |
| Renter-Occupied Housing Units | 10,830 | 42.9% |
| Total Occupied Housing Units | 25,228 | 100.0% |
Occupancy by Household Size in Owensboro
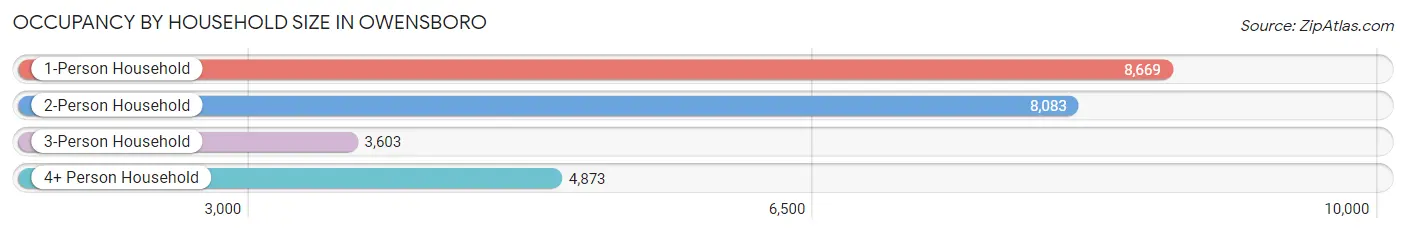
| Household Size | # Housing Units | % Housing Units |
| 1-Person Household | 8,669 | 34.4% |
| 2-Person Household | 8,083 | 32.0% |
| 3-Person Household | 3,603 | 14.3% |
| 4+ Person Household | 4,873 | 19.3% |
| Total Housing Units | 25,228 | 100.0% |
Occupancy by Ownership by Household Size in Owensboro
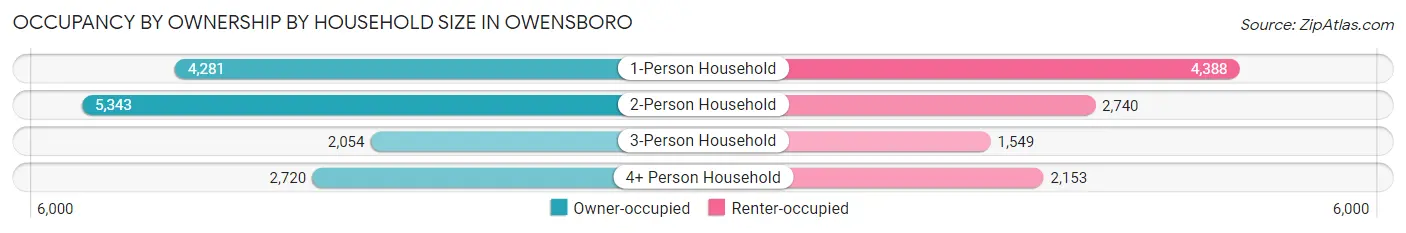
| Household Size | Owner-occupied | Renter-occupied |
| 1-Person Household | 4,281 (49.4%) | 4,388 (50.6%) |
| 2-Person Household | 5,343 (66.1%) | 2,740 (33.9%) |
| 3-Person Household | 2,054 (57.0%) | 1,549 (43.0%) |
| 4+ Person Household | 2,720 (55.8%) | 2,153 (44.2%) |
| Total Housing Units | 14,398 (57.1%) | 10,830 (42.9%) |
Occupancy by Educational Attainment in Owensboro
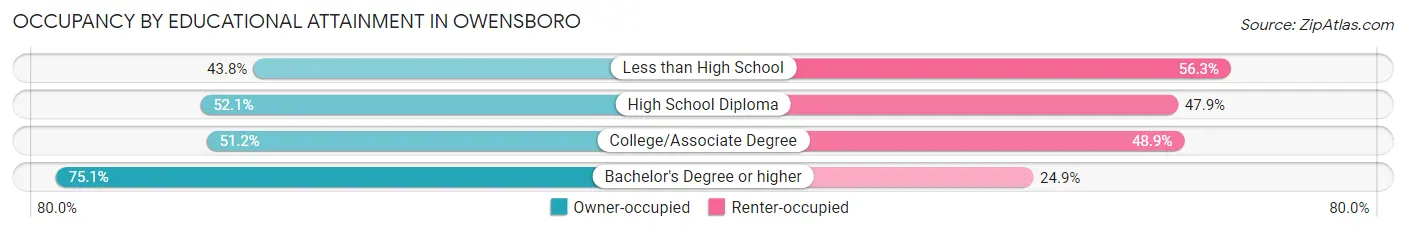
| Household Size | Owner-occupied | Renter-occupied |
| Less than High School | 942 (43.8%) | 1,211 (56.2%) |
| High School Diploma | 4,145 (52.1%) | 3,805 (47.9%) |
| College/Associate Degree | 4,373 (51.1%) | 4,177 (48.8%) |
| Bachelor's Degree or higher | 4,938 (75.1%) | 1,637 (24.9%) |
Occupancy by Age of Householder in Owensboro
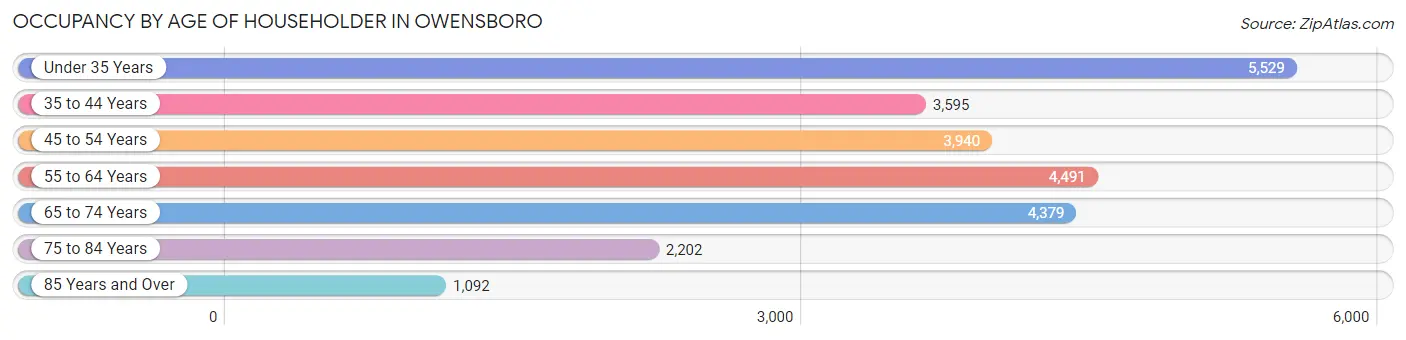
| Age Bracket | # Households | % Households |
| Under 35 Years | 5,529 | 21.9% |
| 35 to 44 Years | 3,595 | 14.2% |
| 45 to 54 Years | 3,940 | 15.6% |
| 55 to 64 Years | 4,491 | 17.8% |
| 65 to 74 Years | 4,379 | 17.4% |
| 75 to 84 Years | 2,202 | 8.7% |
| 85 Years and Over | 1,092 | 4.3% |
| Total | 25,228 | 100.0% |
Housing Finances in Owensboro
Median Income by Occupancy in Owensboro
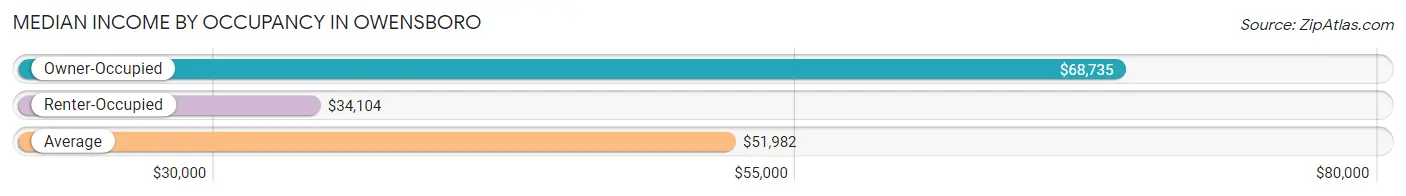
| Occupancy Type | # Households | Median Income |
| Owner-Occupied | 14,398 (57.1%) | $68,735 |
| Renter-Occupied | 10,830 (42.9%) | $34,104 |
| Average | 25,228 (100.0%) | $51,982 |
Occupancy by Householder Income Bracket in Owensboro
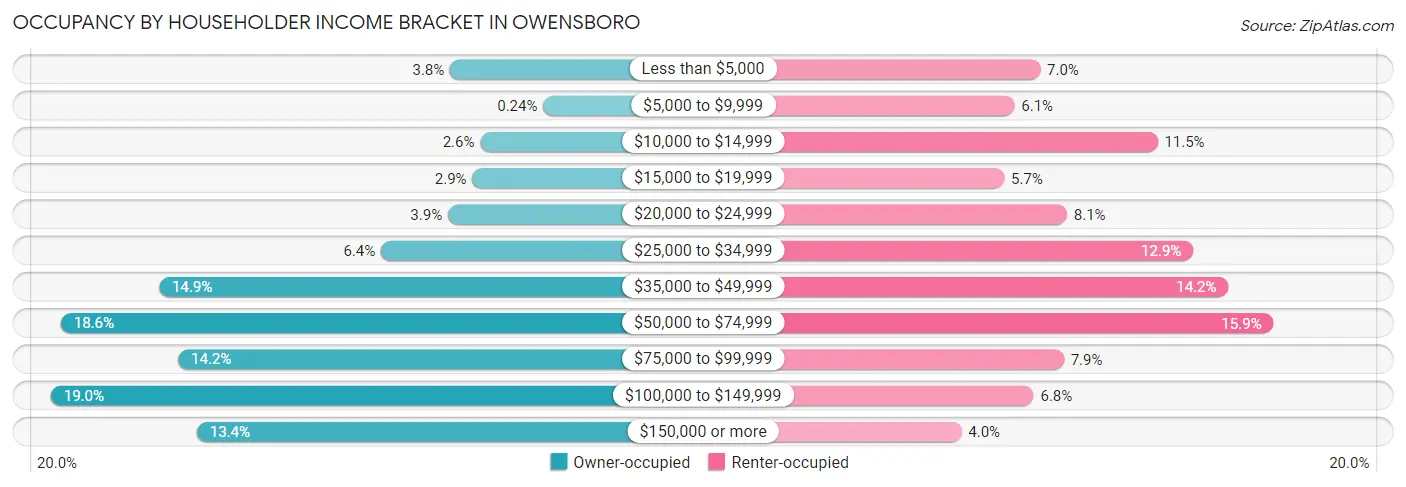
| Income Bracket | Owner-occupied | Renter-occupied |
| Less than $5,000 | 546 (3.8%) | 761 (7.0%) |
| $5,000 to $9,999 | 34 (0.2%) | 655 (6.0%) |
| $10,000 to $14,999 | 380 (2.6%) | 1,245 (11.5%) |
| $15,000 to $19,999 | 424 (2.9%) | 613 (5.7%) |
| $20,000 to $24,999 | 557 (3.9%) | 872 (8.1%) |
| $25,000 to $34,999 | 925 (6.4%) | 1,393 (12.9%) |
| $35,000 to $49,999 | 2,143 (14.9%) | 1,538 (14.2%) |
| $50,000 to $74,999 | 2,681 (18.6%) | 1,724 (15.9%) |
| $75,000 to $99,999 | 2,037 (14.1%) | 859 (7.9%) |
| $100,000 to $149,999 | 2,736 (19.0%) | 734 (6.8%) |
| $150,000 or more | 1,935 (13.4%) | 436 (4.0%) |
| Total | 14,398 (100.0%) | 10,830 (100.0%) |
Monthly Housing Cost Tiers in Owensboro
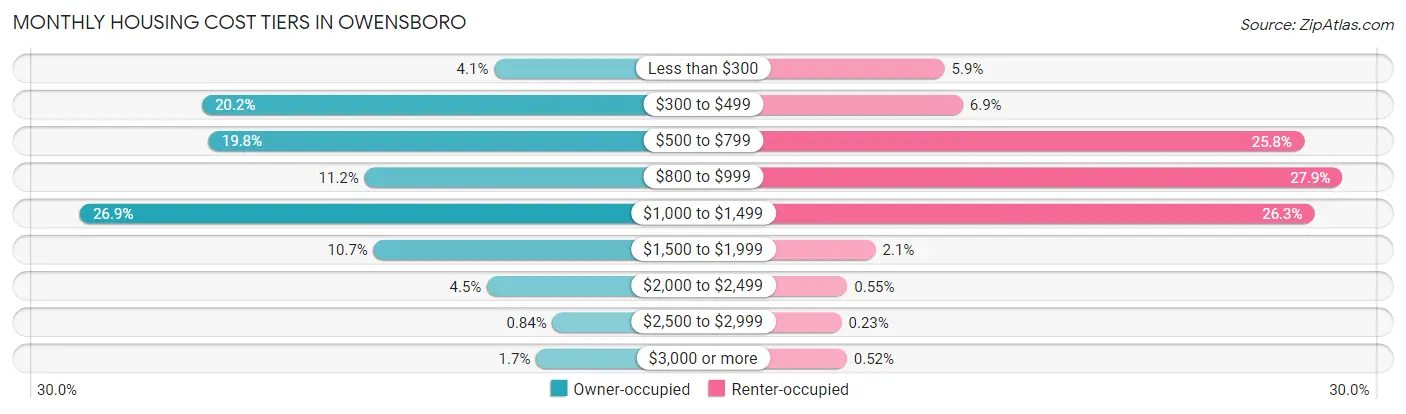
| Monthly Cost | Owner-occupied | Renter-occupied |
| Less than $300 | 585 (4.1%) | 641 (5.9%) |
| $300 to $499 | 2,909 (20.2%) | 751 (6.9%) |
| $500 to $799 | 2,854 (19.8%) | 2,790 (25.8%) |
| $800 to $999 | 1,616 (11.2%) | 3,019 (27.9%) |
| $1,000 to $1,499 | 3,879 (26.9%) | 2,853 (26.3%) |
| $1,500 to $1,999 | 1,543 (10.7%) | 229 (2.1%) |
| $2,000 to $2,499 | 641 (4.4%) | 60 (0.5%) |
| $2,500 to $2,999 | 121 (0.8%) | 25 (0.2%) |
| $3,000 or more | 250 (1.7%) | 56 (0.5%) |
| Total | 14,398 (100.0%) | 10,830 (100.0%) |
Physical Housing Characteristics in Owensboro
Housing Structures in Owensboro
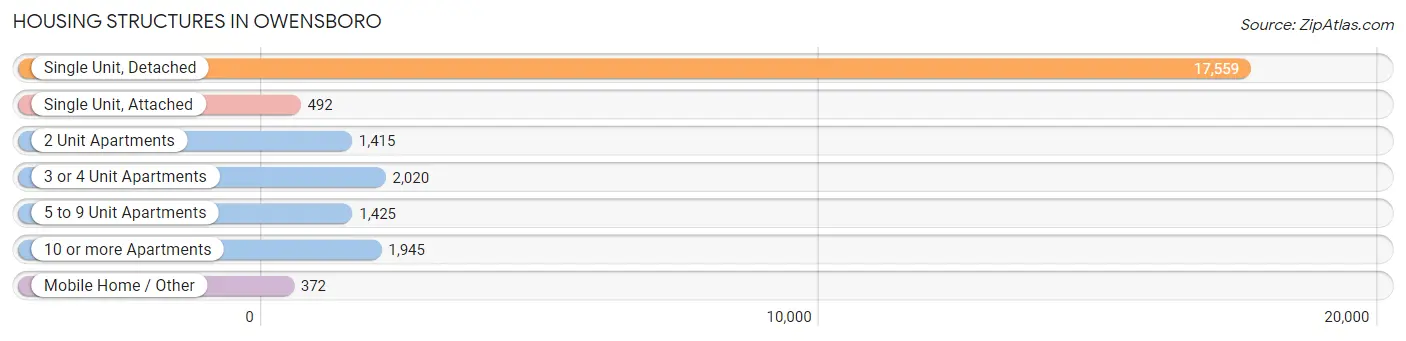
| Structure Type | # Housing Units | % Housing Units |
| Single Unit, Detached | 17,559 | 69.6% |
| Single Unit, Attached | 492 | 1.9% |
| 2 Unit Apartments | 1,415 | 5.6% |
| 3 or 4 Unit Apartments | 2,020 | 8.0% |
| 5 to 9 Unit Apartments | 1,425 | 5.7% |
| 10 or more Apartments | 1,945 | 7.7% |
| Mobile Home / Other | 372 | 1.5% |
| Total | 25,228 | 100.0% |
Housing Structures by Occupancy in Owensboro
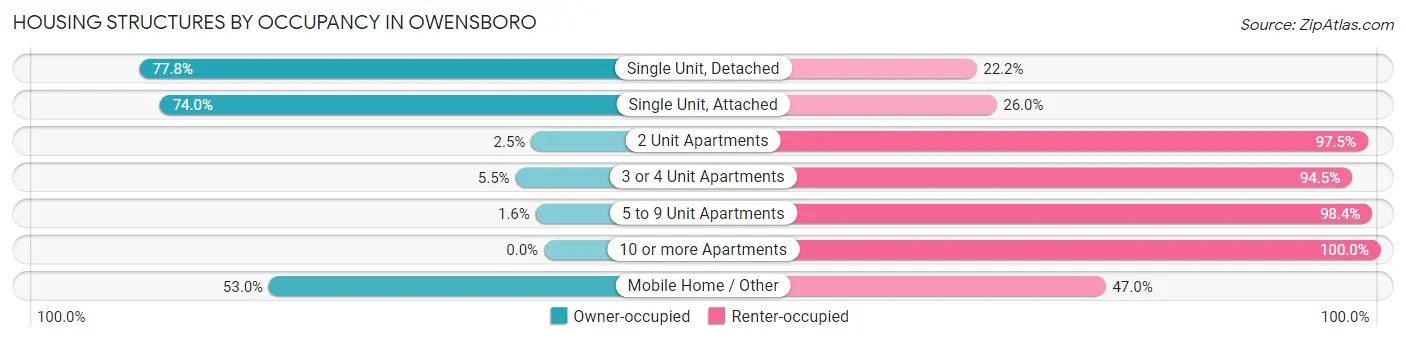
| Structure Type | Owner-occupied | Renter-occupied |
| Single Unit, Detached | 13,668 (77.8%) | 3,891 (22.2%) |
| Single Unit, Attached | 364 (74.0%) | 128 (26.0%) |
| 2 Unit Apartments | 35 (2.5%) | 1,380 (97.5%) |
| 3 or 4 Unit Apartments | 111 (5.5%) | 1,909 (94.5%) |
| 5 to 9 Unit Apartments | 23 (1.6%) | 1,402 (98.4%) |
| 10 or more Apartments | 0 (0.0%) | 1,945 (100.0%) |
| Mobile Home / Other | 197 (53.0%) | 175 (47.0%) |
| Total | 14,398 (57.1%) | 10,830 (42.9%) |
Housing Structures by Number of Rooms in Owensboro
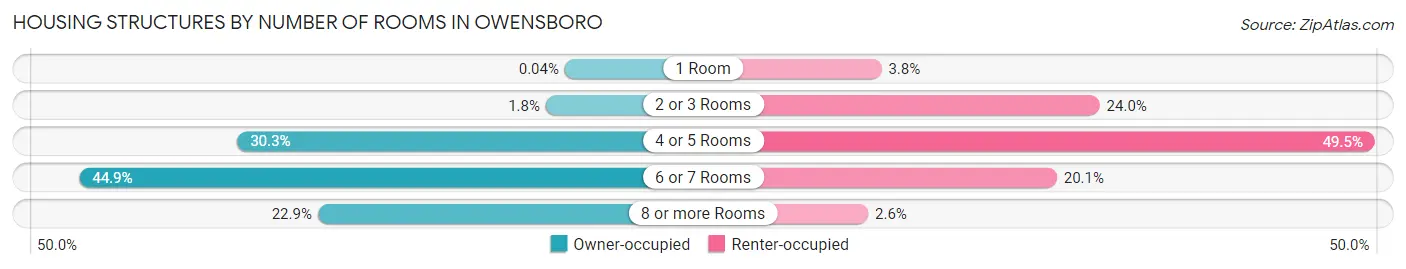
| Number of Rooms | Owner-occupied | Renter-occupied |
| 1 Room | 6 (0.0%) | 416 (3.8%) |
| 2 or 3 Rooms | 259 (1.8%) | 2,601 (24.0%) |
| 4 or 5 Rooms | 4,367 (30.3%) | 5,357 (49.5%) |
| 6 or 7 Rooms | 6,471 (44.9%) | 2,173 (20.1%) |
| 8 or more Rooms | 3,295 (22.9%) | 283 (2.6%) |
| Total | 14,398 (100.0%) | 10,830 (100.0%) |
Housing Structure by Heating Type in Owensboro
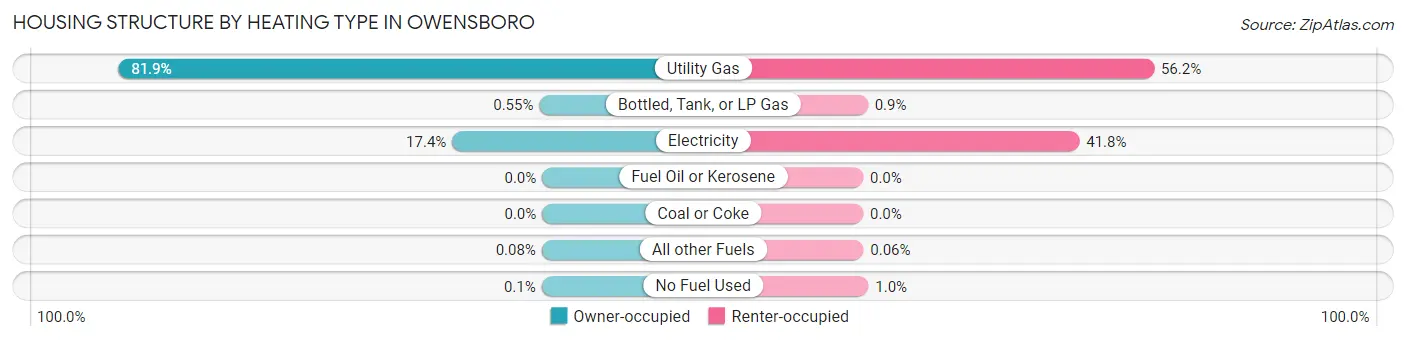
| Heating Type | Owner-occupied | Renter-occupied |
| Utility Gas | 11,790 (81.9%) | 6,089 (56.2%) |
| Bottled, Tank, or LP Gas | 79 (0.5%) | 97 (0.9%) |
| Electricity | 2,503 (17.4%) | 4,526 (41.8%) |
| Fuel Oil or Kerosene | 0 (0.0%) | 0 (0.0%) |
| Coal or Coke | 0 (0.0%) | 0 (0.0%) |
| All other Fuels | 11 (0.1%) | 6 (0.1%) |
| No Fuel Used | 15 (0.1%) | 112 (1.0%) |
| Total | 14,398 (100.0%) | 10,830 (100.0%) |
Household Vehicle Usage in Owensboro
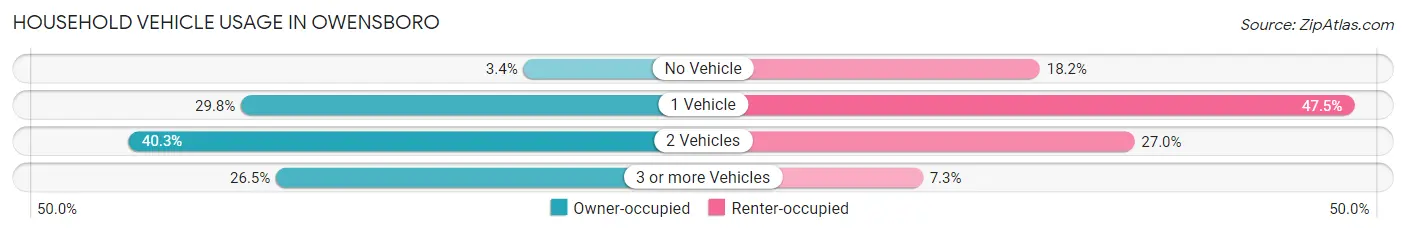
| Vehicles per Household | Owner-occupied | Renter-occupied |
| No Vehicle | 494 (3.4%) | 1,970 (18.2%) |
| 1 Vehicle | 4,289 (29.8%) | 5,148 (47.5%) |
| 2 Vehicles | 5,796 (40.3%) | 2,926 (27.0%) |
| 3 or more Vehicles | 3,819 (26.5%) | 786 (7.3%) |
| Total | 14,398 (100.0%) | 10,830 (100.0%) |
Real Estate & Mortgages in Owensboro
Real Estate and Mortgage Overview in Owensboro
| Characteristic | Without Mortgage | With Mortgage |
| Housing Units | 5,960 | 8,438 |
| Median Property Value | $138,400 | $158,200 |
| Median Household Income | $56,279 | $1,307 |
| Monthly Housing Costs | $476 | $250 |
| Real Estate Taxes | $1,278 | $249 |
Property Value by Mortgage Status in Owensboro
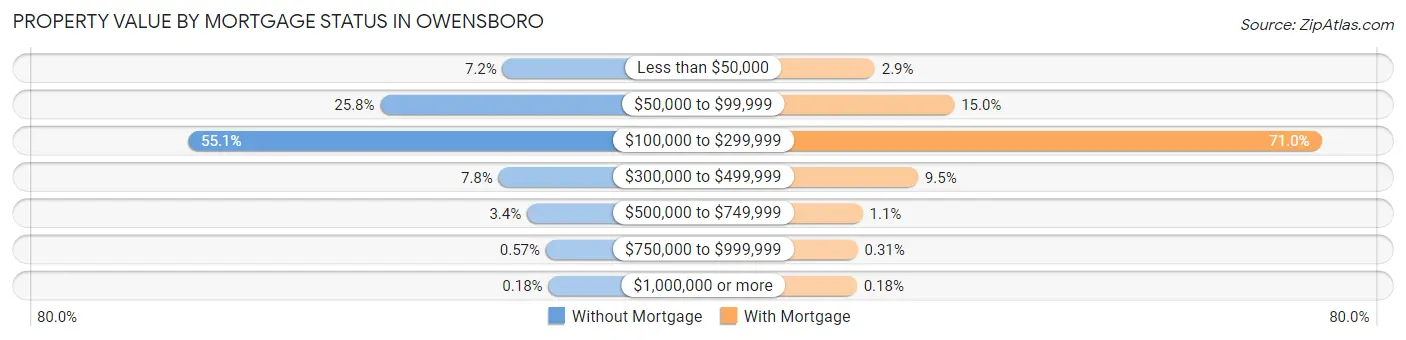
| Property Value | Without Mortgage | With Mortgage |
| Less than $50,000 | 427 (7.2%) | 247 (2.9%) |
| $50,000 to $99,999 | 1,537 (25.8%) | 1,268 (15.0%) |
| $100,000 to $299,999 | 3,283 (55.1%) | 5,989 (71.0%) |
| $300,000 to $499,999 | 463 (7.8%) | 802 (9.5%) |
| $500,000 to $749,999 | 205 (3.4%) | 91 (1.1%) |
| $750,000 to $999,999 | 34 (0.6%) | 26 (0.3%) |
| $1,000,000 or more | 11 (0.2%) | 15 (0.2%) |
| Total | 5,960 (100.0%) | 8,438 (100.0%) |
Household Income by Mortgage Status in Owensboro
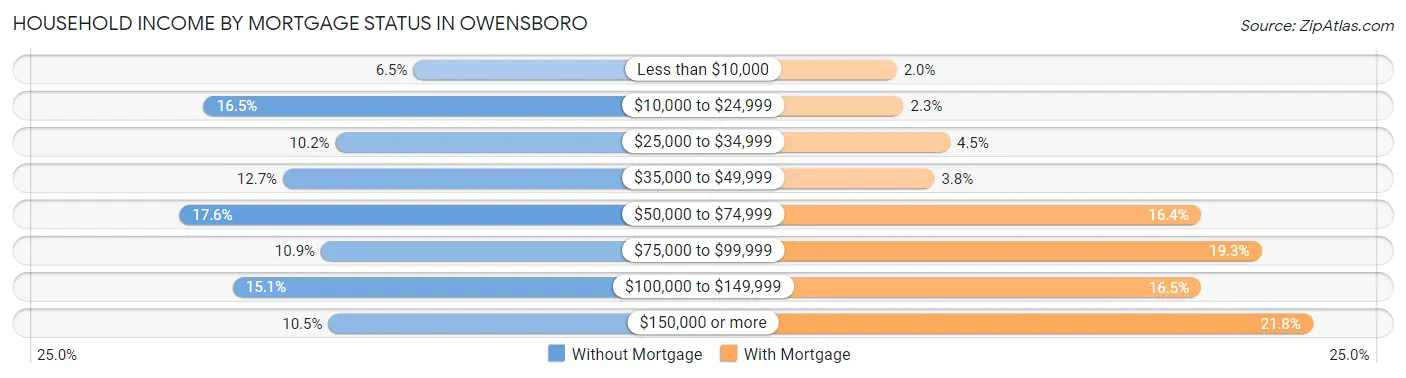
| Household Income | Without Mortgage | With Mortgage |
| Less than $10,000 | 387 (6.5%) | 165 (2.0%) |
| $10,000 to $24,999 | 981 (16.5%) | 193 (2.3%) |
| $25,000 to $34,999 | 608 (10.2%) | 380 (4.5%) |
| $35,000 to $49,999 | 757 (12.7%) | 317 (3.8%) |
| $50,000 to $74,999 | 1,051 (17.6%) | 1,386 (16.4%) |
| $75,000 to $99,999 | 649 (10.9%) | 1,630 (19.3%) |
| $100,000 to $149,999 | 899 (15.1%) | 1,388 (16.5%) |
| $150,000 or more | 628 (10.5%) | 1,837 (21.8%) |
| Total | 5,960 (100.0%) | 8,438 (100.0%) |
Property Value to Household Income Ratio in Owensboro
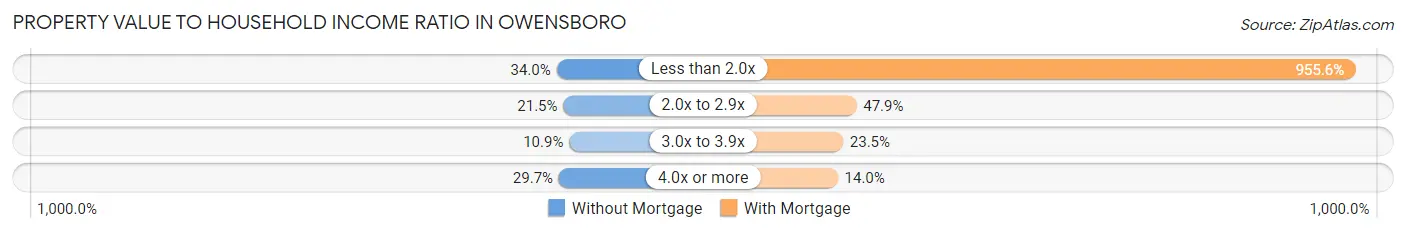
| Value-to-Income Ratio | Without Mortgage | With Mortgage |
| Less than 2.0x | 2,024 (34.0%) | 80,629 (955.6%) |
| 2.0x to 2.9x | 1,284 (21.5%) | 4,043 (47.9%) |
| 3.0x to 3.9x | 647 (10.9%) | 1,982 (23.5%) |
| 4.0x or more | 1,767 (29.6%) | 1,177 (14.0%) |
| Total | 5,960 (100.0%) | 8,438 (100.0%) |
Real Estate Taxes by Mortgage Status in Owensboro
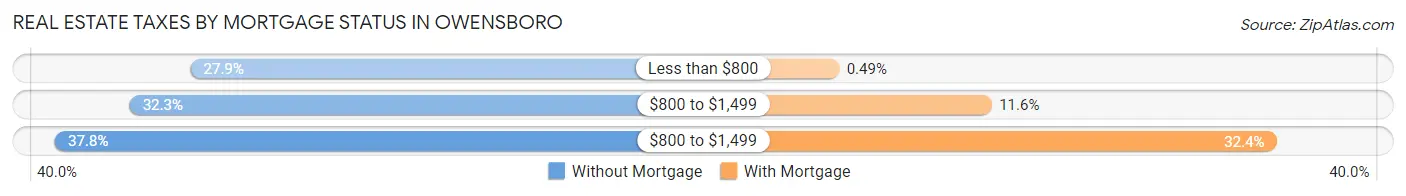
| Property Taxes | Without Mortgage | With Mortgage |
| Less than $800 | 1,661 (27.9%) | 41 (0.5%) |
| $800 to $1,499 | 1,926 (32.3%) | 981 (11.6%) |
| $800 to $1,499 | 2,251 (37.8%) | 2,733 (32.4%) |
| Total | 5,960 (100.0%) | 8,438 (100.0%) |
Health & Disability in Owensboro
Health Insurance Coverage by Age in Owensboro
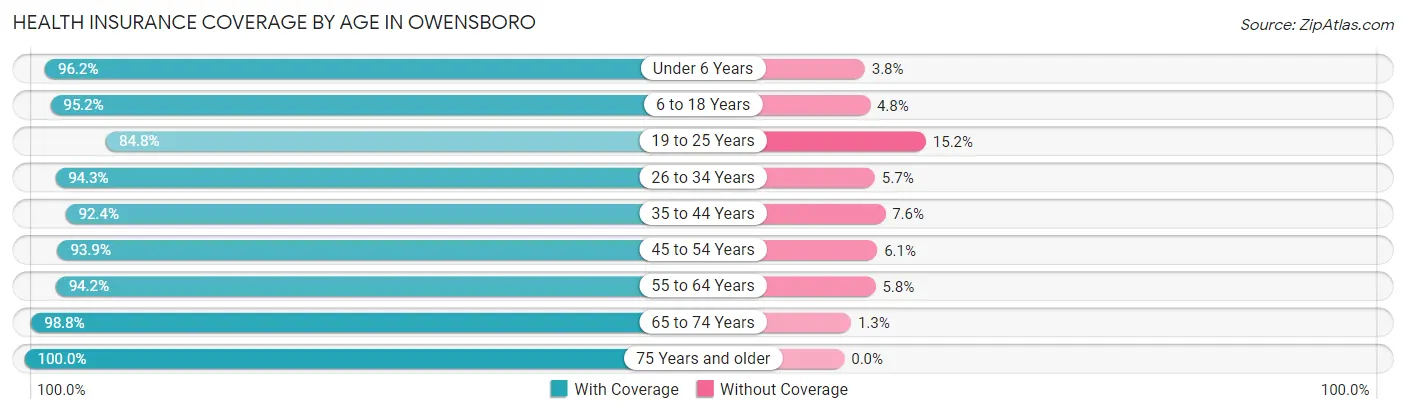
| Age Bracket | With Coverage | Without Coverage |
| Under 6 Years | 4,838 (96.2%) | 192 (3.8%) |
| 6 to 18 Years | 9,166 (95.2%) | 461 (4.8%) |
| 19 to 25 Years | 5,078 (84.8%) | 911 (15.2%) |
| 26 to 34 Years | 6,974 (94.3%) | 422 (5.7%) |
| 35 to 44 Years | 5,955 (92.4%) | 492 (7.6%) |
| 45 to 54 Years | 6,070 (93.9%) | 397 (6.1%) |
| 55 to 64 Years | 6,959 (94.2%) | 429 (5.8%) |
| 65 to 74 Years | 6,009 (98.8%) | 76 (1.3%) |
| 75 Years and older | 4,549 (100.0%) | 0 (0.0%) |
| Total | 55,598 (94.3%) | 3,380 (5.7%) |
Health Insurance Coverage by Citizenship Status in Owensboro
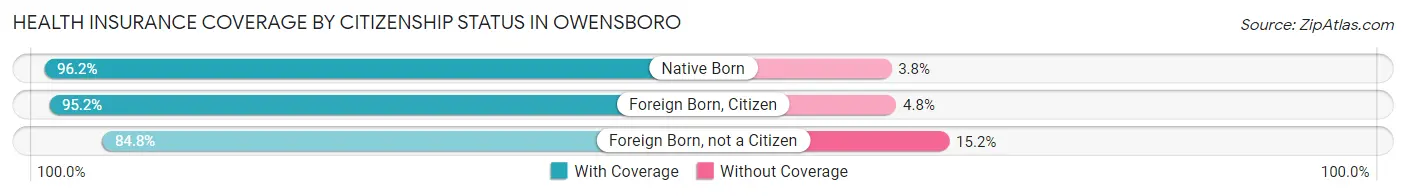
| Citizenship Status | With Coverage | Without Coverage |
| Native Born | 4,838 (96.2%) | 192 (3.8%) |
| Foreign Born, Citizen | 9,166 (95.2%) | 461 (4.8%) |
| Foreign Born, not a Citizen | 5,078 (84.8%) | 911 (15.2%) |
Health Insurance Coverage by Household Income in Owensboro
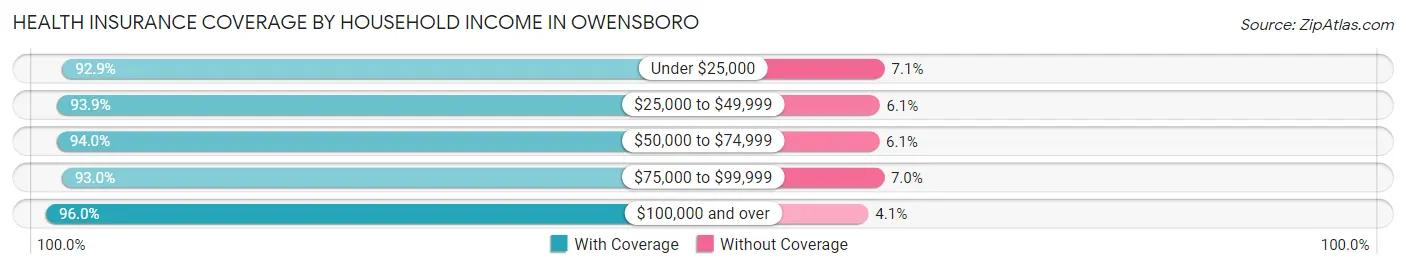
| Household Income | With Coverage | Without Coverage |
| Under $25,000 | 9,416 (92.9%) | 719 (7.1%) |
| $25,000 to $49,999 | 11,233 (93.9%) | 735 (6.1%) |
| $50,000 to $74,999 | 9,977 (94.0%) | 642 (6.0%) |
| $75,000 to $99,999 | 7,086 (93.0%) | 530 (7.0%) |
| $100,000 and over | 16,921 (96.0%) | 714 (4.1%) |
Public vs Private Health Insurance Coverage by Age in Owensboro
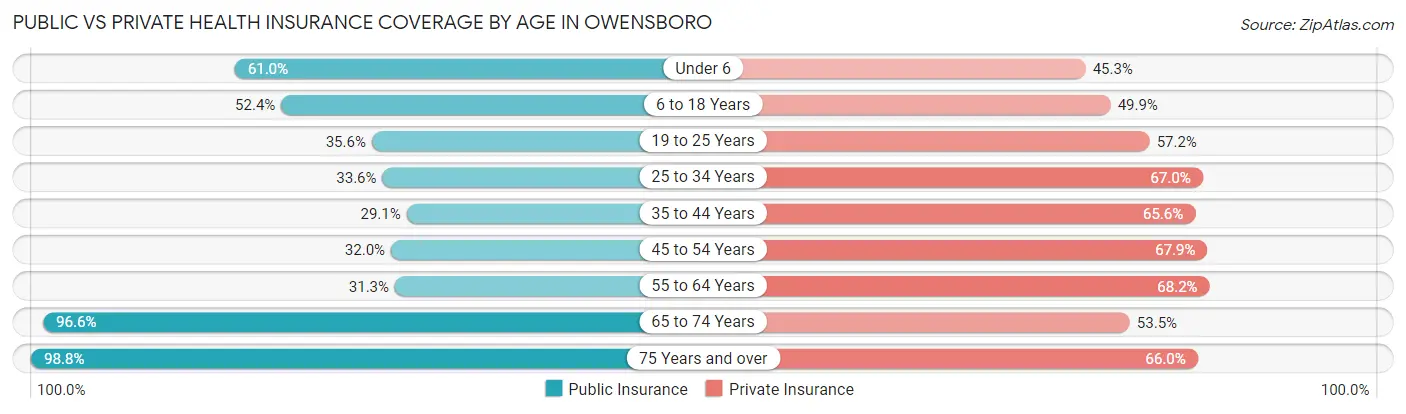
| Age Bracket | Public Insurance | Private Insurance |
| Under 6 | 3,067 (61.0%) | 2,277 (45.3%) |
| 6 to 18 Years | 5,043 (52.4%) | 4,805 (49.9%) |
| 19 to 25 Years | 2,130 (35.6%) | 3,423 (57.2%) |
| 25 to 34 Years | 2,484 (33.6%) | 4,953 (67.0%) |
| 35 to 44 Years | 1,877 (29.1%) | 4,227 (65.6%) |
| 45 to 54 Years | 2,070 (32.0%) | 4,388 (67.8%) |
| 55 to 64 Years | 2,310 (31.3%) | 5,041 (68.2%) |
| 65 to 74 Years | 5,875 (96.6%) | 3,254 (53.5%) |
| 75 Years and over | 4,494 (98.8%) | 3,004 (66.0%) |
| Total | 29,350 (49.8%) | 35,372 (60.0%) |
Disability Status by Sex by Age in Owensboro
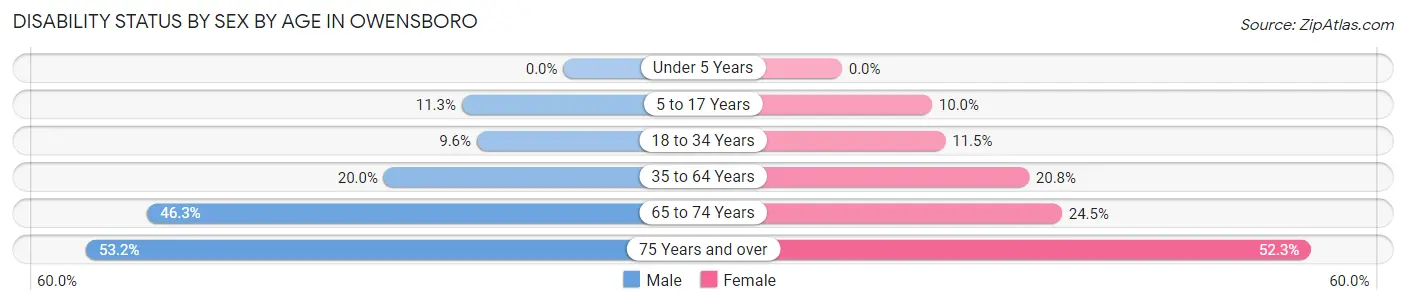
| Age Bracket | Male | Female |
| Under 5 Years | 0 (0.0%) | 0 (0.0%) |
| 5 to 17 Years | 580 (11.3%) | 472 (10.0%) |
| 18 to 34 Years | 661 (9.6%) | 819 (11.5%) |
| 35 to 64 Years | 1,954 (20.0%) | 2,194 (20.8%) |
| 65 to 74 Years | 1,329 (46.3%) | 788 (24.5%) |
| 75 Years and over | 919 (53.1%) | 1,474 (52.3%) |
Disability Class by Sex by Age in Owensboro
Disability Class: Hearing Difficulty
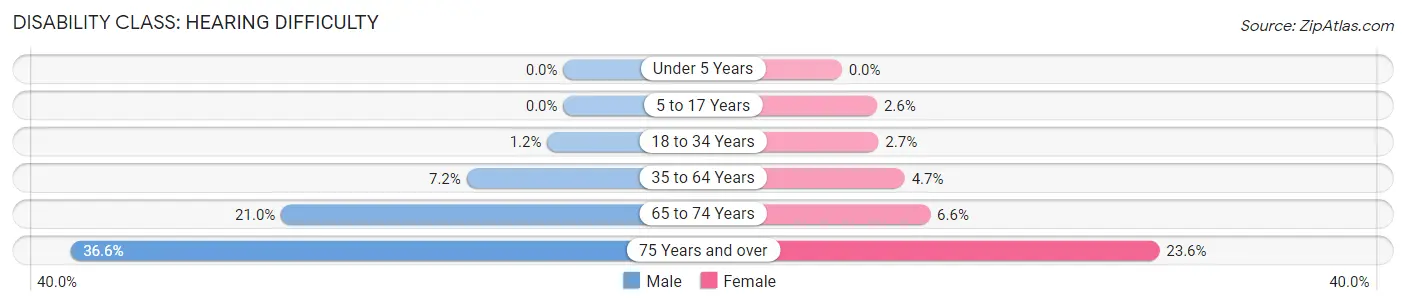
| Age Bracket | Male | Female |
| Under 5 Years | 0 (0.0%) | 0 (0.0%) |
| 5 to 17 Years | 0 (0.0%) | 123 (2.6%) |
| 18 to 34 Years | 82 (1.2%) | 193 (2.7%) |
| 35 to 64 Years | 702 (7.2%) | 492 (4.7%) |
| 65 to 74 Years | 601 (20.9%) | 211 (6.6%) |
| 75 Years and over | 633 (36.6%) | 665 (23.6%) |
Disability Class: Vision Difficulty
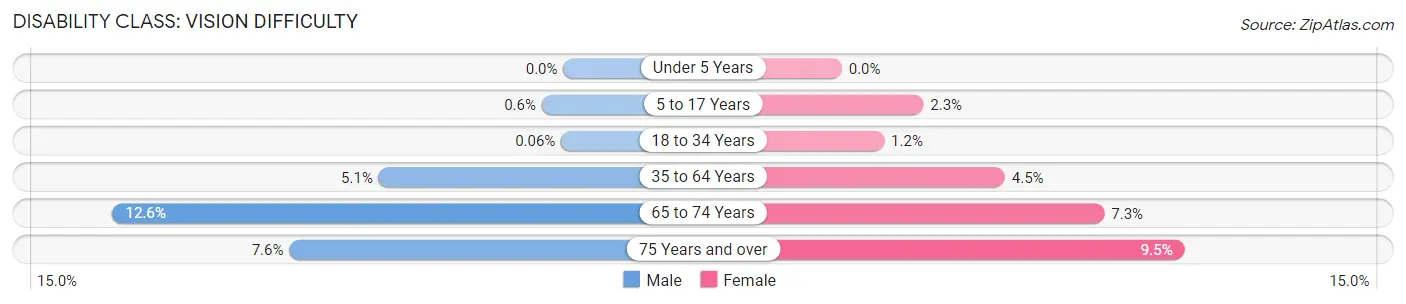
| Age Bracket | Male | Female |
| Under 5 Years | 0 (0.0%) | 0 (0.0%) |
| 5 to 17 Years | 31 (0.6%) | 107 (2.3%) |
| 18 to 34 Years | 4 (0.1%) | 84 (1.2%) |
| 35 to 64 Years | 502 (5.1%) | 478 (4.5%) |
| 65 to 74 Years | 360 (12.6%) | 235 (7.3%) |
| 75 Years and over | 132 (7.6%) | 269 (9.5%) |
Disability Class: Cognitive Difficulty
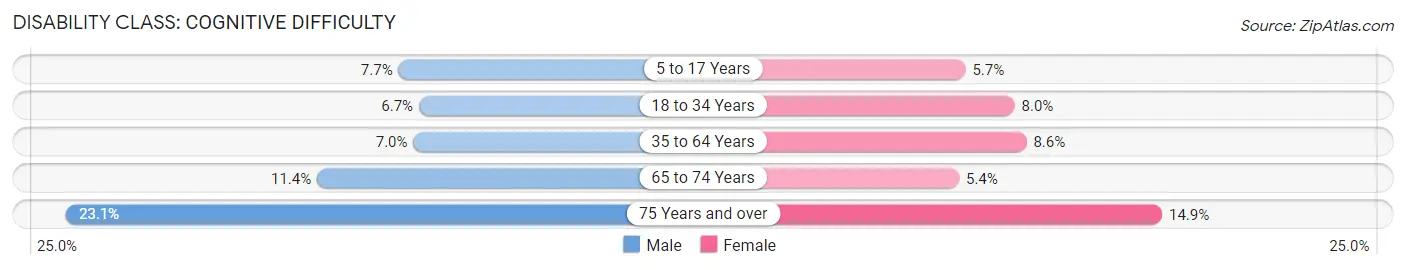
| Age Bracket | Male | Female |
| 5 to 17 Years | 392 (7.6%) | 270 (5.7%) |
| 18 to 34 Years | 460 (6.7%) | 570 (8.0%) |
| 35 to 64 Years | 680 (7.0%) | 902 (8.6%) |
| 65 to 74 Years | 328 (11.4%) | 175 (5.4%) |
| 75 Years and over | 399 (23.1%) | 419 (14.9%) |
Disability Class: Ambulatory Difficulty
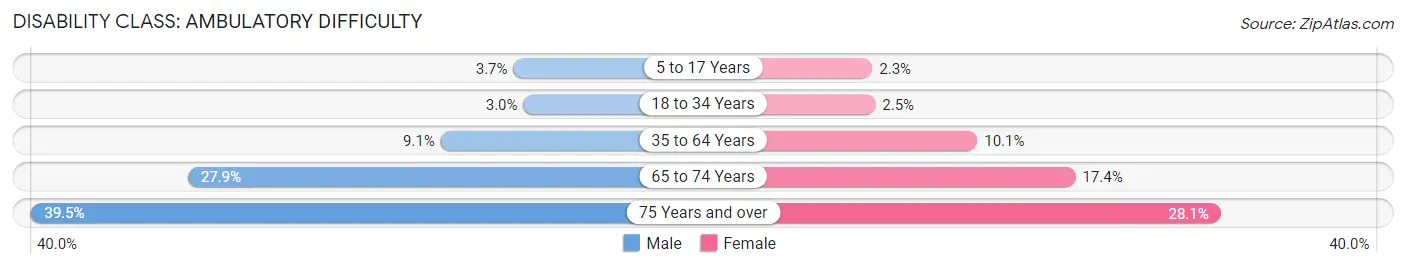
| Age Bracket | Male | Female |
| 5 to 17 Years | 190 (3.7%) | 107 (2.3%) |
| 18 to 34 Years | 204 (3.0%) | 177 (2.5%) |
| 35 to 64 Years | 890 (9.1%) | 1,059 (10.1%) |
| 65 to 74 Years | 800 (27.9%) | 558 (17.3%) |
| 75 Years and over | 683 (39.5%) | 793 (28.1%) |
Disability Class: Self-Care Difficulty
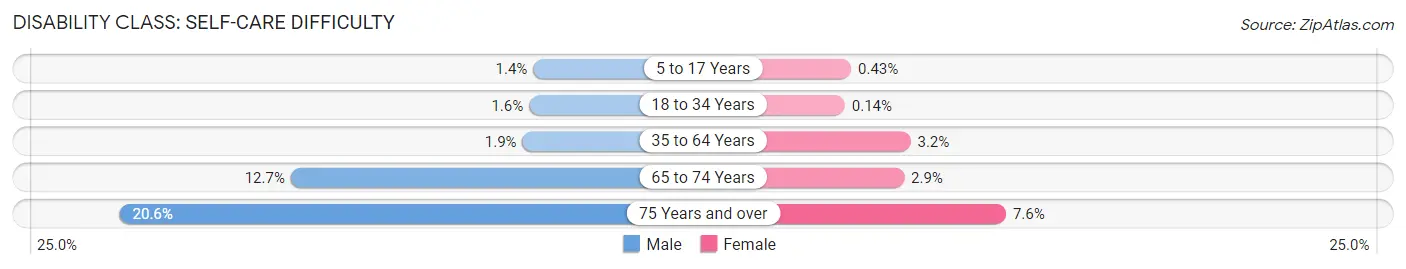
| Age Bracket | Male | Female |
| 5 to 17 Years | 72 (1.4%) | 20 (0.4%) |
| 18 to 34 Years | 109 (1.6%) | 10 (0.1%) |
| 35 to 64 Years | 186 (1.9%) | 336 (3.2%) |
| 65 to 74 Years | 363 (12.7%) | 93 (2.9%) |
| 75 Years and over | 356 (20.6%) | 215 (7.6%) |
Technology Access in Owensboro
Computing Device Access in Owensboro
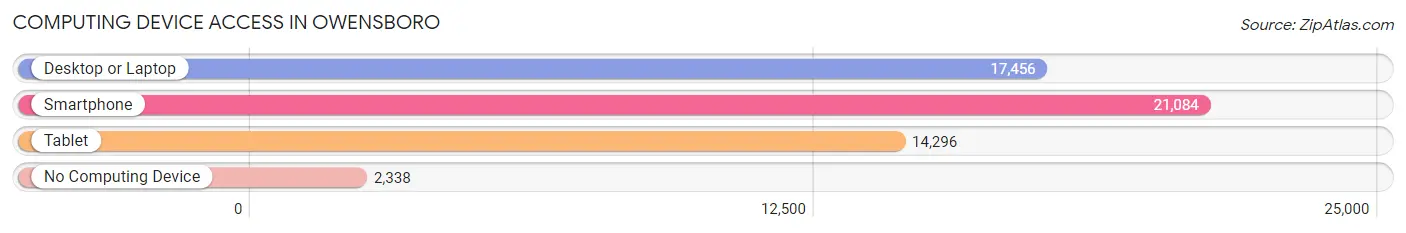
| Device Type | # Households | % Households |
| Desktop or Laptop | 17,456 | 69.2% |
| Smartphone | 21,084 | 83.6% |
| Tablet | 14,296 | 56.7% |
| No Computing Device | 2,338 | 9.3% |
| Total | 25,228 | 100.0% |
Internet Access in Owensboro
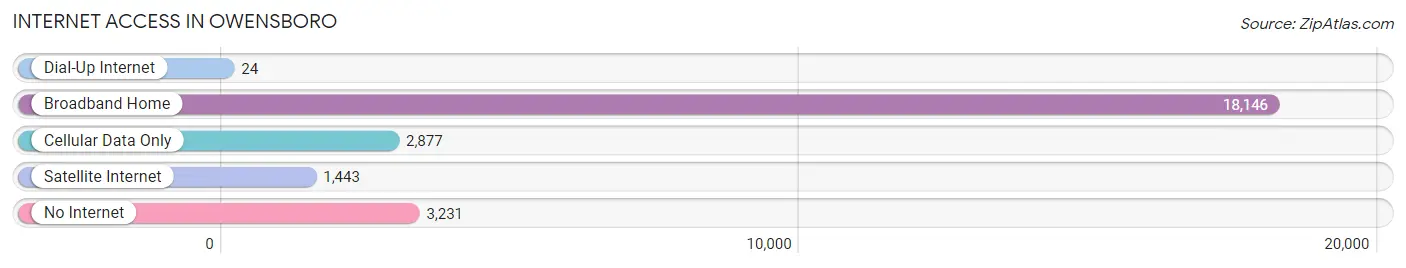
| Internet Type | # Households | % Households |
| Dial-Up Internet | 24 | 0.1% |
| Broadband Home | 18,146 | 71.9% |
| Cellular Data Only | 2,877 | 11.4% |
| Satellite Internet | 1,443 | 5.7% |
| No Internet | 3,231 | 12.8% |
| Total | 25,228 | 100.0% |
Owensboro Summary
Owensboro, Kentucky is a city located in Daviess County, Kentucky, United States. It is the county seat of Daviess County and the fourth-largest city in the state. The population was 57,265 at the 2010 census. It is located on the Ohio River in the western part of the state.
History
Owensboro was founded in 1817 by William Smeathers, a Revolutionary War veteran. The city was named after Colonel Abraham Owen, a Revolutionary War veteran and one of the first settlers of the area. The city was incorporated in 1838.
Owensboro was a major center for the tobacco industry in the 19th century. The city was also a major center for the production of hemp and cotton. During the Civil War, Owensboro was a major supply center for the Confederate Army.
In the late 19th century, Owensboro became a major center for the production of coal and iron. The city was also a major center for the production of whiskey and other spirits.
In the early 20th century, Owensboro was a major center for the production of automobiles and other transportation equipment. The city was also a major center for the production of furniture and other wood products.
Geography
Owensboro is located in western Kentucky, on the Ohio River. The city is located at 37°45'N, 87°7'W. The city has an area of 28.2 square miles, of which 27.9 square miles is land and 0.3 square miles is water.
Owensboro is located in the Western Coal Fields region of Kentucky. The city is located in the Central Time Zone.
Economy
Owensboro's economy is largely based on manufacturing, healthcare, and education. The city is home to several major employers, including Owensboro Medical Health System, Owensboro Public Schools, and Owensboro-Daviess County Regional Airport.
The city is also home to several major industries, including automotive, food processing, and metal fabrication. Owensboro is also home to several major retail stores, including Walmart, Lowe's, and Target.
Demographics
As of the 2010 census, the population of Owensboro was 57,265. The racial makeup of the city was 79.2% White, 15.3% African American, 0.3% Native American, 1.2% Asian, 0.1% Pacific Islander, 1.7% from other races, and 2.4% from two or more races. Hispanic or Latino of any race were 4.2% of the population.
The median income for a household in the city was $37,945, and the median income for a family was $45,945. The per capita income for the city was $20,945. About 15.2% of families and 18.3% of the population were below the poverty line, including 25.2% of those under age 18 and 11.2% of those age 65 or over.
Common Questions
What is Per Capita Income in Owensboro?
Per Capita income in Owensboro is $30,702.
What is the Median Family Income in Owensboro?
Median Family Income in Owensboro is $66,889.
What is the Median Household income in Owensboro?
Median Household Income in Owensboro is $51,982.
What is Income or Wage Gap in Owensboro?
Income or Wage Gap in Owensboro is 30.6%.
Women in Owensboro earn 69.4 cents for every dollar earned by a man.
What is Family Income Deficit in Owensboro?
Family Income Deficit in Owensboro is $12,976.
Families that are below poverty line in Owensboro earn $12,976 less on average than the poverty threshold level.
What is Inequality or Gini Index in Owensboro?
Inequality or Gini Index in Owensboro is 0.47.
What is the Total Population of Owensboro?
Total Population of Owensboro is 60,019.
What is the Total Male Population of Owensboro?
Total Male Population of Owensboro is 28,997.
What is the Total Female Population of Owensboro?
Total Female Population of Owensboro is 31,022.
What is the Ratio of Males per 100 Females in Owensboro?
There are 93.47 Males per 100 Females in Owensboro.
What is the Ratio of Females per 100 Males in Owensboro?
There are 106.98 Females per 100 Males in Owensboro.
What is the Median Population Age in Owensboro?
Median Population Age in Owensboro is 37.8 Years.
What is the Average Family Size in Owensboro
Average Family Size in Owensboro is 2.9 People.
What is the Average Household Size in Owensboro
Average Household Size in Owensboro is 2.3 People.
How Large is the Labor Force in Owensboro?
There are 27,630 People in the Labor Forcein in Owensboro.
What is the Percentage of People in the Labor Force in Owensboro?
58.3% of People are in the Labor Force in Owensboro.
What is the Unemployment Rate in Owensboro?
Unemployment Rate in Owensboro is 4.2%.