Fort Wayne, IN Map & Demographics
Fort Wayne Map
Fort Wayne Overview
$31,910
PER CAPITA INCOME
$72,419
AVG FAMILY INCOME
$58,233
AVG HOUSEHOLD INCOME
29.8%
WAGE / INCOME GAP [ % ]
70.2¢/ $1
WAGE / INCOME GAP [ $ ]
$11,088
FAMILY INCOME DEFICIT
0.44
INEQUALITY / GINI INDEX
264,514
TOTAL POPULATION
129,178
MALE POPULATION
135,336
FEMALE POPULATION
95.45
MALES / 100 FEMALES
104.77
FEMALES / 100 MALES
35.1
MEDIAN AGE
3.1
AVG FAMILY SIZE
2.4
AVG HOUSEHOLD SIZE
137,518
LABOR FORCE [ PEOPLE ]
66.2%
PERCENT IN LABOR FORCE
5.8%
UNEMPLOYMENT RATE
Fort Wayne Zip Codes
Fort Wayne Area Codes
Income in Fort Wayne
Income Overview in Fort Wayne
Per Capita Income in Fort Wayne is $31,910, while median incomes of families and households are $72,419 and $58,233 respectively.
| Characteristic | Number | Measure |
| Per Capita Income | 264,514 | $31,910 |
| Median Family Income | 63,683 | $72,419 |
| Mean Family Income | 63,683 | $91,346 |
| Median Household Income | 107,764 | $58,233 |
| Mean Household Income | 107,764 | $76,890 |
| Income Deficit | 63,683 | $11,088 |
| Wage / Income Gap (%) | 264,514 | 29.81% |
| Wage / Income Gap ($) | 264,514 | 70.19¢ per $1 |
| Gini / Inequality Index | 264,514 | 0.44 |
Earnings by Sex in Fort Wayne
Average Earnings in Fort Wayne are $35,647, $42,728 for men and $29,992 for women, a difference of 29.8%.
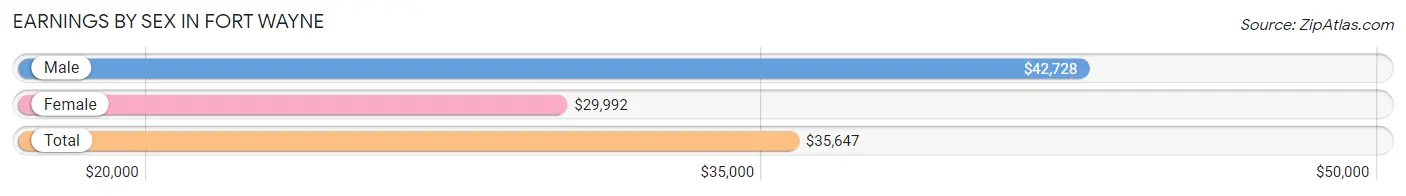
| Sex | Number | Average Earnings |
| Male | 74,336 (51.7%) | $42,728 |
| Female | 69,483 (48.3%) | $29,992 |
| Total | 143,819 (100.0%) | $35,647 |
Earnings by Sex by Income Bracket in Fort Wayne
The most common earnings brackets in Fort Wayne are $100,000+ for men (8,844 | 11.9%) and $30,000 to $34,999 for women (5,675 | 8.2%).
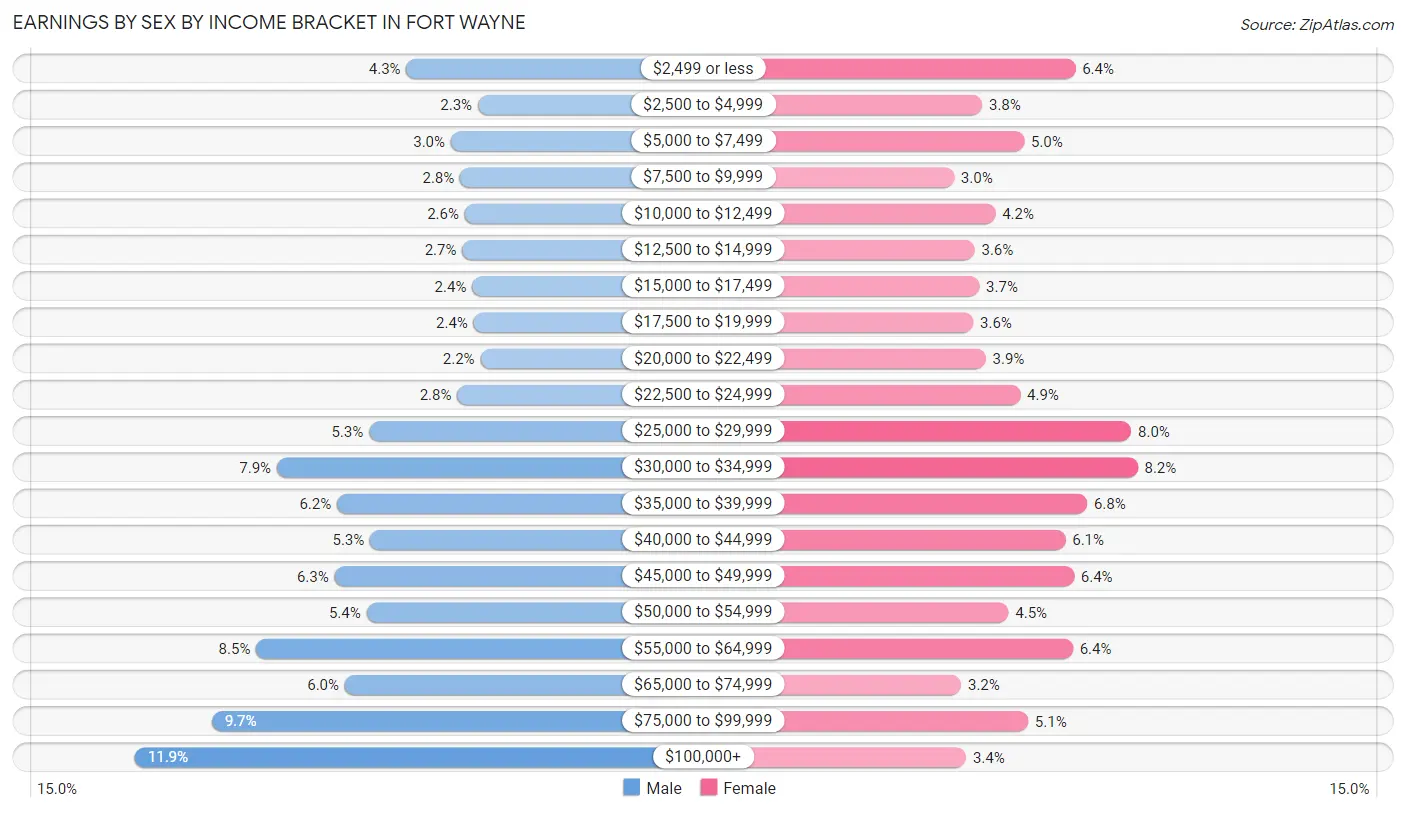
| Income | Male | Female |
| $2,499 or less | 3,171 (4.3%) | 4,462 (6.4%) |
| $2,500 to $4,999 | 1,682 (2.3%) | 2,642 (3.8%) |
| $5,000 to $7,499 | 2,245 (3.0%) | 3,459 (5.0%) |
| $7,500 to $9,999 | 2,054 (2.8%) | 2,094 (3.0%) |
| $10,000 to $12,499 | 1,957 (2.6%) | 2,896 (4.2%) |
| $12,500 to $14,999 | 2,010 (2.7%) | 2,492 (3.6%) |
| $15,000 to $17,499 | 1,801 (2.4%) | 2,587 (3.7%) |
| $17,500 to $19,999 | 1,771 (2.4%) | 2,470 (3.5%) |
| $20,000 to $22,499 | 1,626 (2.2%) | 2,713 (3.9%) |
| $22,500 to $24,999 | 2,111 (2.8%) | 3,384 (4.9%) |
| $25,000 to $29,999 | 3,952 (5.3%) | 5,552 (8.0%) |
| $30,000 to $34,999 | 5,877 (7.9%) | 5,675 (8.2%) |
| $35,000 to $39,999 | 4,620 (6.2%) | 4,692 (6.8%) |
| $40,000 to $44,999 | 3,932 (5.3%) | 4,269 (6.1%) |
| $45,000 to $49,999 | 4,675 (6.3%) | 4,430 (6.4%) |
| $50,000 to $54,999 | 4,003 (5.4%) | 3,155 (4.5%) |
| $55,000 to $64,999 | 6,309 (8.5%) | 4,415 (6.4%) |
| $65,000 to $74,999 | 4,457 (6.0%) | 2,229 (3.2%) |
| $75,000 to $99,999 | 7,239 (9.7%) | 3,536 (5.1%) |
| $100,000+ | 8,844 (11.9%) | 2,331 (3.4%) |
| Total | 74,336 (100.0%) | 69,483 (100.0%) |
Earnings by Sex by Educational Attainment in Fort Wayne
Average earnings in Fort Wayne are $49,140 for men and $34,907 for women, a difference of 29.0%. Men with an educational attainment of graduate degree enjoy the highest average annual earnings of $83,666, while those with less than high school education earn the least with $34,132. Women with an educational attainment of graduate degree earn the most with the average annual earnings of $57,323, while those with less than high school education have the smallest earnings of $24,242.
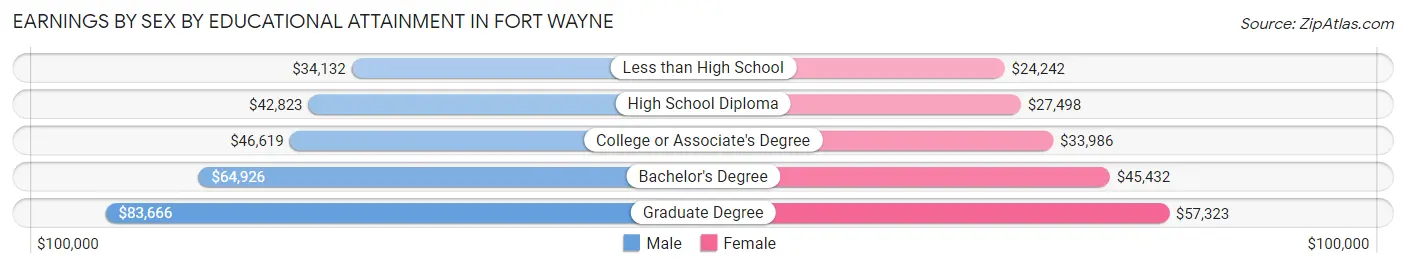
| Educational Attainment | Male Income | Female Income |
| Less than High School | $34,132 | $24,242 |
| High School Diploma | $42,823 | $27,498 |
| College or Associate's Degree | $46,619 | $33,986 |
| Bachelor's Degree | $64,926 | $45,432 |
| Graduate Degree | $83,666 | $57,323 |
| Total | $49,140 | $34,907 |
Family Income in Fort Wayne
Family Income Brackets in Fort Wayne
According to the Fort Wayne family income data, there are 13,564 families falling into the $50,000 to $74,999 income range, which is the most common income bracket and makes up 21.3% of all families. Conversely, the $10,000 to $14,999 income bracket is the least frequent group with only 1,592 families (2.5%) belonging to this category.
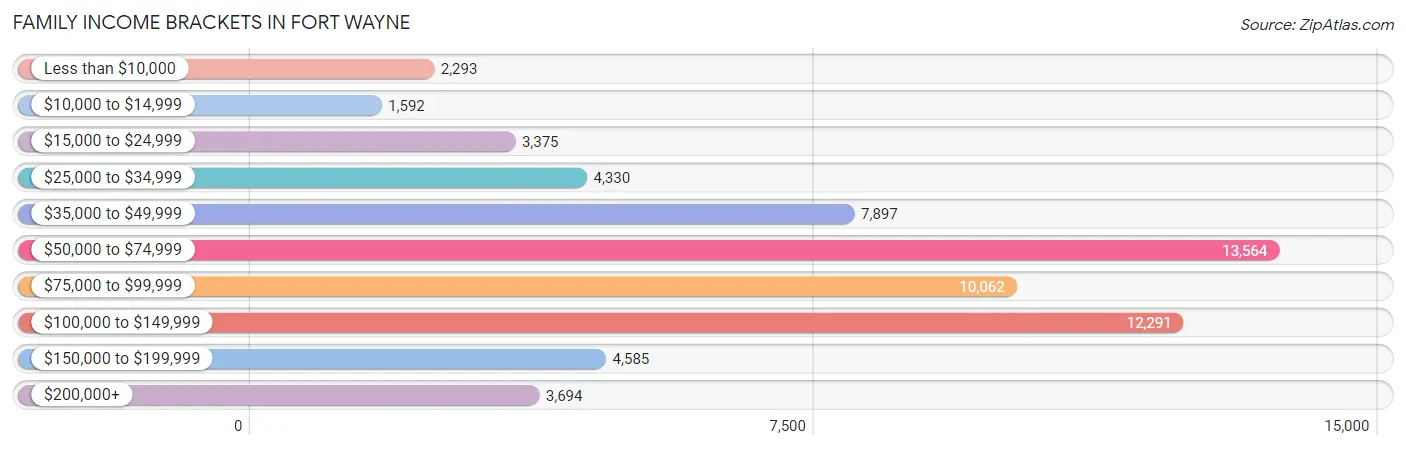
| Income Bracket | # Families | % Families |
| Less than $10,000 | 2,293 | 3.6% |
| $10,000 to $14,999 | 1,592 | 2.5% |
| $15,000 to $24,999 | 3,375 | 5.3% |
| $25,000 to $34,999 | 4,330 | 6.8% |
| $35,000 to $49,999 | 7,897 | 12.4% |
| $50,000 to $74,999 | 13,564 | 21.3% |
| $75,000 to $99,999 | 10,062 | 15.8% |
| $100,000 to $149,999 | 12,291 | 19.3% |
| $150,000 to $199,999 | 4,585 | 7.2% |
| $200,000+ | 3,694 | 5.8% |
Family Income by Famaliy Size in Fort Wayne
4-person families (10,283 | 16.2%) account for the highest median family income in Fort Wayne with $85,359 per family, while 2-person families (30,733 | 48.3%) have the highest median income of $33,840 per family member.
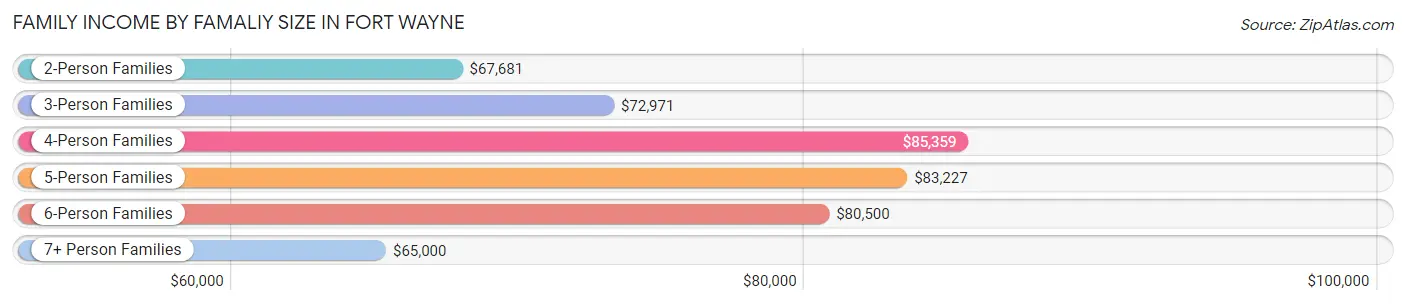
| Income Bracket | # Families | Median Income |
| 2-Person Families | 30,733 (48.3%) | $67,681 |
| 3-Person Families | 13,408 (21.0%) | $72,971 |
| 4-Person Families | 10,283 (16.2%) | $85,359 |
| 5-Person Families | 5,631 (8.8%) | $83,227 |
| 6-Person Families | 2,444 (3.8%) | $80,500 |
| 7+ Person Families | 1,184 (1.9%) | $65,000 |
| Total | 63,683 (100.0%) | $72,419 |
Family Income by Number of Earners in Fort Wayne
The median family income in Fort Wayne is $72,419, with families comprising 3+ earners (7,036) having the highest median family income of $126,589, while families with no earners (7,985) have the lowest median family income of $45,125, accounting for 11.1% and 12.5% of families, respectively.
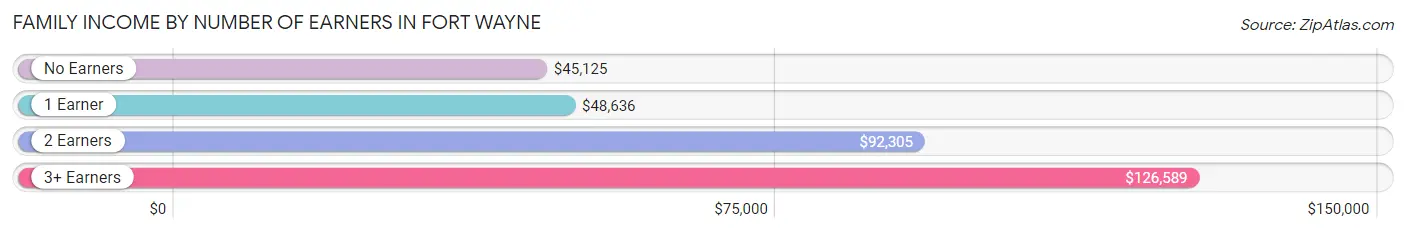
| Number of Earners | # Families | Median Income |
| No Earners | 7,985 (12.5%) | $45,125 |
| 1 Earner | 22,028 (34.6%) | $48,636 |
| 2 Earners | 26,634 (41.8%) | $92,305 |
| 3+ Earners | 7,036 (11.1%) | $126,589 |
| Total | 63,683 (100.0%) | $72,419 |
Household Income in Fort Wayne
Household Income Brackets in Fort Wayne
With 21,661 households falling in the category, the $50,000 to $74,999 income range is the most frequent in Fort Wayne, accounting for 20.1% of all households. In contrast, only 4,634 households (4.3%) fall into the $200,000+ income bracket, making it the least populous group.
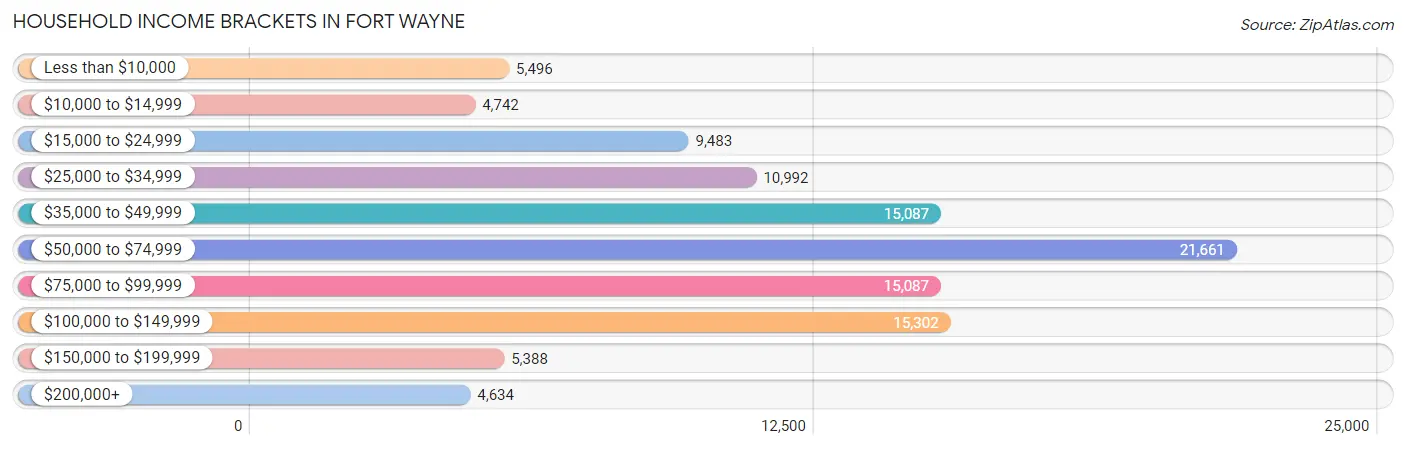
| Income Bracket | # Households | % Households |
| Less than $10,000 | 5,496 | 5.1% |
| $10,000 to $14,999 | 4,742 | 4.4% |
| $15,000 to $24,999 | 9,483 | 8.8% |
| $25,000 to $34,999 | 10,992 | 10.2% |
| $35,000 to $49,999 | 15,087 | 14.0% |
| $50,000 to $74,999 | 21,661 | 20.1% |
| $75,000 to $99,999 | 15,087 | 14.0% |
| $100,000 to $149,999 | 15,302 | 14.2% |
| $150,000 to $199,999 | 5,388 | 5.0% |
| $200,000+ | 4,634 | 4.3% |
Household Income by Householder Age in Fort Wayne
The median household income in Fort Wayne is $58,233, with the highest median household income of $69,998 found in the 45 to 64 years age bracket for the primary householder. A total of 36,247 households (33.6%) fall into this category. Meanwhile, the 15 to 24 years age bracket for the primary householder has the lowest median household income of $39,489, with 7,235 households (6.7%) in this group.
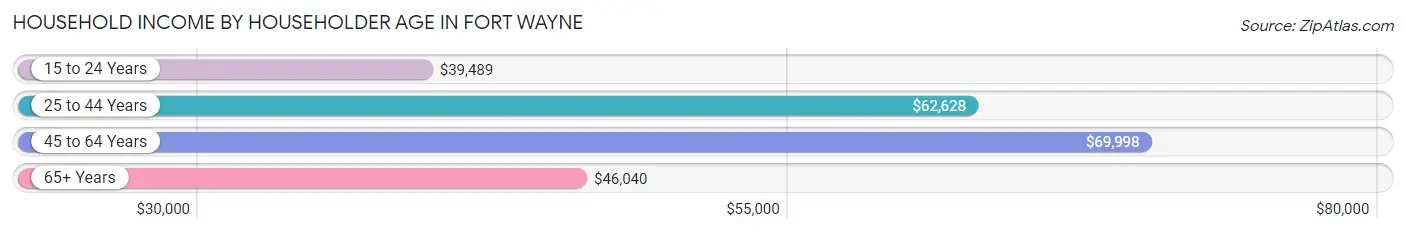
| Income Bracket | # Households | Median Income |
| 15 to 24 Years | 7,235 (6.7%) | $39,489 |
| 25 to 44 Years | 38,947 (36.1%) | $62,628 |
| 45 to 64 Years | 36,247 (33.6%) | $69,998 |
| 65+ Years | 25,335 (23.5%) | $46,040 |
| Total | 107,764 (100.0%) | $58,233 |
Poverty in Fort Wayne
Income Below Poverty by Sex and Age in Fort Wayne
With 13.3% poverty level for males and 16.9% for females among the residents of Fort Wayne, under 5 year old males and under 5 year old females are the most vulnerable to poverty, with 2,494 males (26.6%) and 2,491 females (28.4%) in their respective age groups living below the poverty level.

| Age Bracket | Male | Female |
| Under 5 Years | 2,494 (26.6%) | 2,491 (28.4%) |
| 5 Years | 394 (21.7%) | 385 (24.8%) |
| 6 to 11 Years | 2,294 (23.4%) | 2,254 (22.3%) |
| 12 to 14 Years | 1,056 (18.2%) | 827 (16.9%) |
| 15 Years | 304 (16.1%) | 160 (10.8%) |
| 16 and 17 Years | 608 (16.7%) | 678 (18.4%) |
| 18 to 24 Years | 2,065 (15.7%) | 3,111 (23.3%) |
| 25 to 34 Years | 1,897 (9.7%) | 3,764 (18.8%) |
| 35 to 44 Years | 1,876 (11.8%) | 2,704 (16.5%) |
| 45 to 54 Years | 1,333 (9.1%) | 1,868 (12.2%) |
| 55 to 64 Years | 1,444 (9.9%) | 2,134 (13.4%) |
| 65 to 74 Years | 696 (6.8%) | 1,192 (9.8%) |
| 75 Years and over | 375 (6.4%) | 900 (9.9%) |
| Total | 16,836 (13.3%) | 22,468 (16.9%) |
Income Above Poverty by Sex and Age in Fort Wayne
According to the poverty statistics in Fort Wayne, males aged 75 years and over and females aged 65 to 74 years are the age groups that are most secure financially, with 93.6% of males and 90.2% of females in these age groups living above the poverty line.
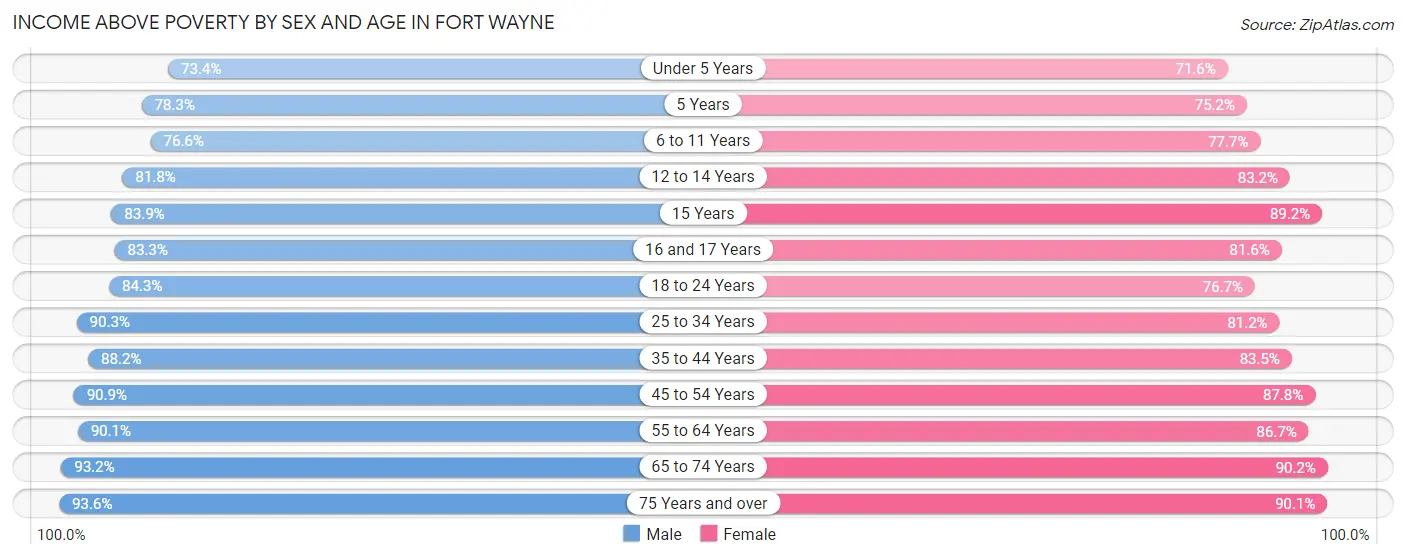
| Age Bracket | Male | Female |
| Under 5 Years | 6,869 (73.4%) | 6,276 (71.6%) |
| 5 Years | 1,422 (78.3%) | 1,165 (75.2%) |
| 6 to 11 Years | 7,511 (76.6%) | 7,835 (77.7%) |
| 12 to 14 Years | 4,759 (81.8%) | 4,080 (83.2%) |
| 15 Years | 1,582 (83.9%) | 1,315 (89.1%) |
| 16 and 17 Years | 3,032 (83.3%) | 3,015 (81.6%) |
| 18 to 24 Years | 11,102 (84.3%) | 10,224 (76.7%) |
| 25 to 34 Years | 17,723 (90.3%) | 16,286 (81.2%) |
| 35 to 44 Years | 14,046 (88.2%) | 13,682 (83.5%) |
| 45 to 54 Years | 13,278 (90.9%) | 13,483 (87.8%) |
| 55 to 64 Years | 13,204 (90.1%) | 13,855 (86.7%) |
| 65 to 74 Years | 9,516 (93.2%) | 10,951 (90.2%) |
| 75 Years and over | 5,492 (93.6%) | 8,191 (90.1%) |
| Total | 109,536 (86.7%) | 110,358 (83.1%) |
Income Below Poverty Among Married-Couple Families in Fort Wayne
The poverty statistics for married-couple families in Fort Wayne show that 5.1% or 2,205 of the total 42,993 families live below the poverty line. Families with 5 or more children have the highest poverty rate of 39.9%, comprising of 179 families. On the other hand, families with no children have the lowest poverty rate of 2.9%, which includes 735 families.
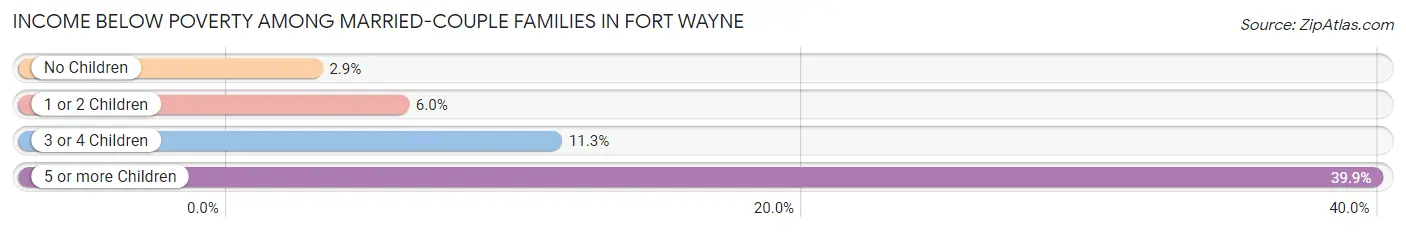
| Children | Above Poverty | Below Poverty |
| No Children | 24,274 (97.1%) | 735 (2.9%) |
| 1 or 2 Children | 12,113 (94.1%) | 766 (5.9%) |
| 3 or 4 Children | 4,131 (88.7%) | 525 (11.3%) |
| 5 or more Children | 270 (60.1%) | 179 (39.9%) |
| Total | 40,788 (94.9%) | 2,205 (5.1%) |
Income Below Poverty Among Single-Parent Households in Fort Wayne
According to the poverty data in Fort Wayne, 13.1% or 751 single-father households and 28.5% or 4,261 single-mother households are living below the poverty line. Among single-father households, those with 5 or more children have the highest poverty rate, with 22 households (100.0%) experiencing poverty. Likewise, among single-mother households, those with 5 or more children have the highest poverty rate, with 150 households (61.0%) falling below the poverty line.
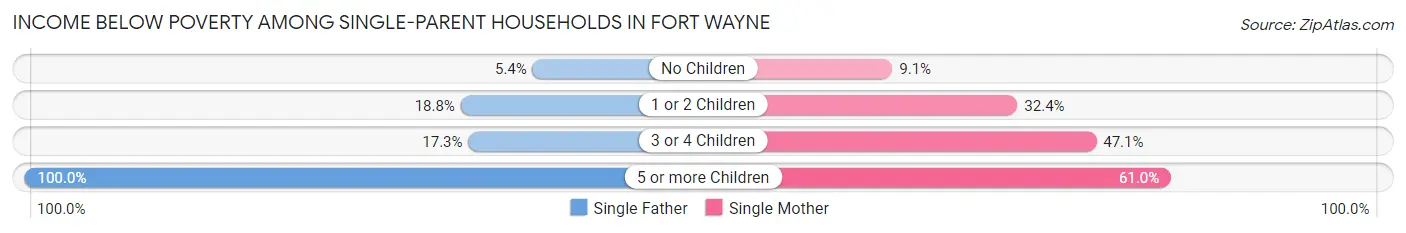
| Children | Single Father | Single Mother |
| No Children | 136 (5.4%) | 384 (9.1%) |
| 1 or 2 Children | 507 (18.8%) | 2,628 (32.4%) |
| 3 or 4 Children | 86 (17.3%) | 1,099 (47.0%) |
| 5 or more Children | 22 (100.0%) | 150 (61.0%) |
| Total | 751 (13.1%) | 4,261 (28.5%) |
Income Below Poverty Among Married-Couple vs Single-Parent Households in Fort Wayne
The poverty data for Fort Wayne shows that 2,205 of the married-couple family households (5.1%) and 5,012 of the single-parent households (24.2%) are living below the poverty level. Within the married-couple family households, those with 5 or more children have the highest poverty rate, with 179 households (39.9%) falling below the poverty line. Among the single-parent households, those with 5 or more children have the highest poverty rate, with 172 household (64.2%) living below poverty.
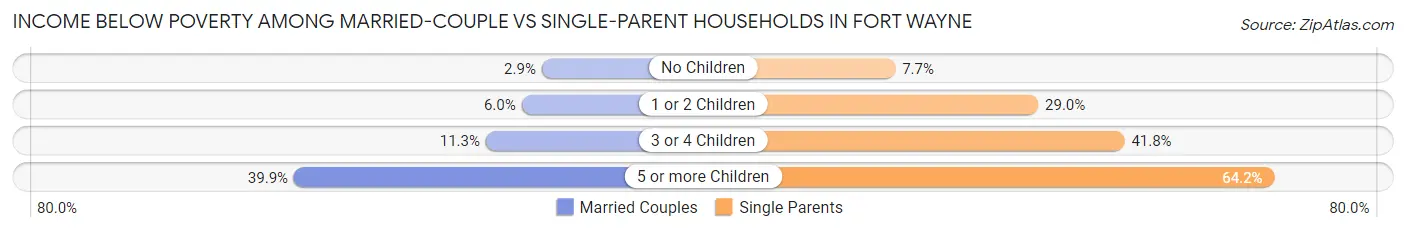
| Children | Married-Couple Families | Single-Parent Households |
| No Children | 735 (2.9%) | 520 (7.7%) |
| 1 or 2 Children | 766 (5.9%) | 3,135 (29.0%) |
| 3 or 4 Children | 525 (11.3%) | 1,185 (41.8%) |
| 5 or more Children | 179 (39.9%) | 172 (64.2%) |
| Total | 2,205 (5.1%) | 5,012 (24.2%) |
Race in Fort Wayne
The most populous races in Fort Wayne are White / Caucasian (180,054 | 68.1%), Black / African American (40,285 | 15.2%), and Hispanic or Latino (25,595 | 9.7%).
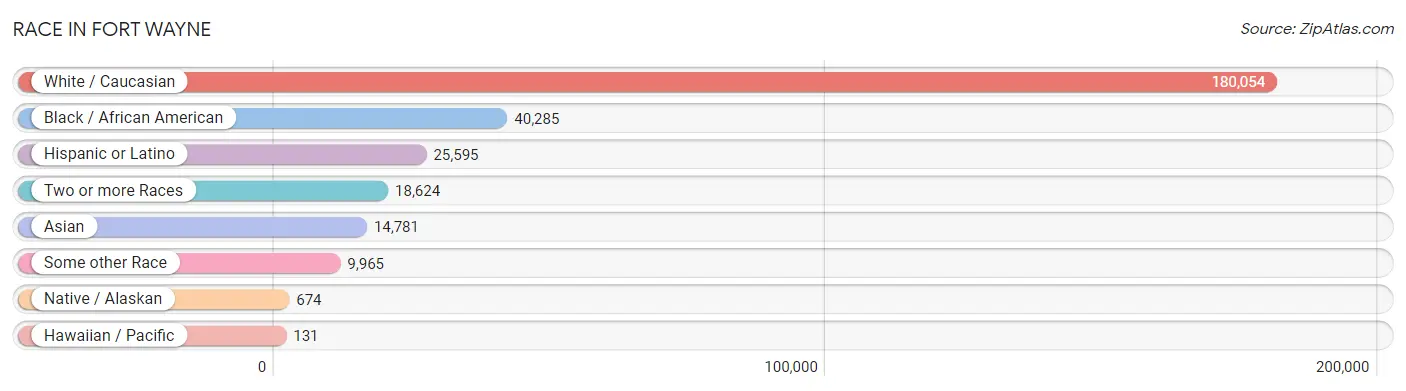
| Race | # Population | % Population |
| Asian | 14,781 | 5.6% |
| Black / African American | 40,285 | 15.2% |
| Hawaiian / Pacific | 131 | 0.1% |
| Hispanic or Latino | 25,595 | 9.7% |
| Native / Alaskan | 674 | 0.3% |
| White / Caucasian | 180,054 | 68.1% |
| Two or more Races | 18,624 | 7.0% |
| Some other Race | 9,965 | 3.8% |
| Total | 264,514 | 100.0% |
Ancestry in Fort Wayne
The most populous ancestries reported in Fort Wayne are German (59,933 | 22.7%), Irish (24,331 | 9.2%), English (22,199 | 8.4%), Mexican (19,141 | 7.2%), and American (13,633 | 5.1%), together accounting for 52.6% of all Fort Wayne residents.
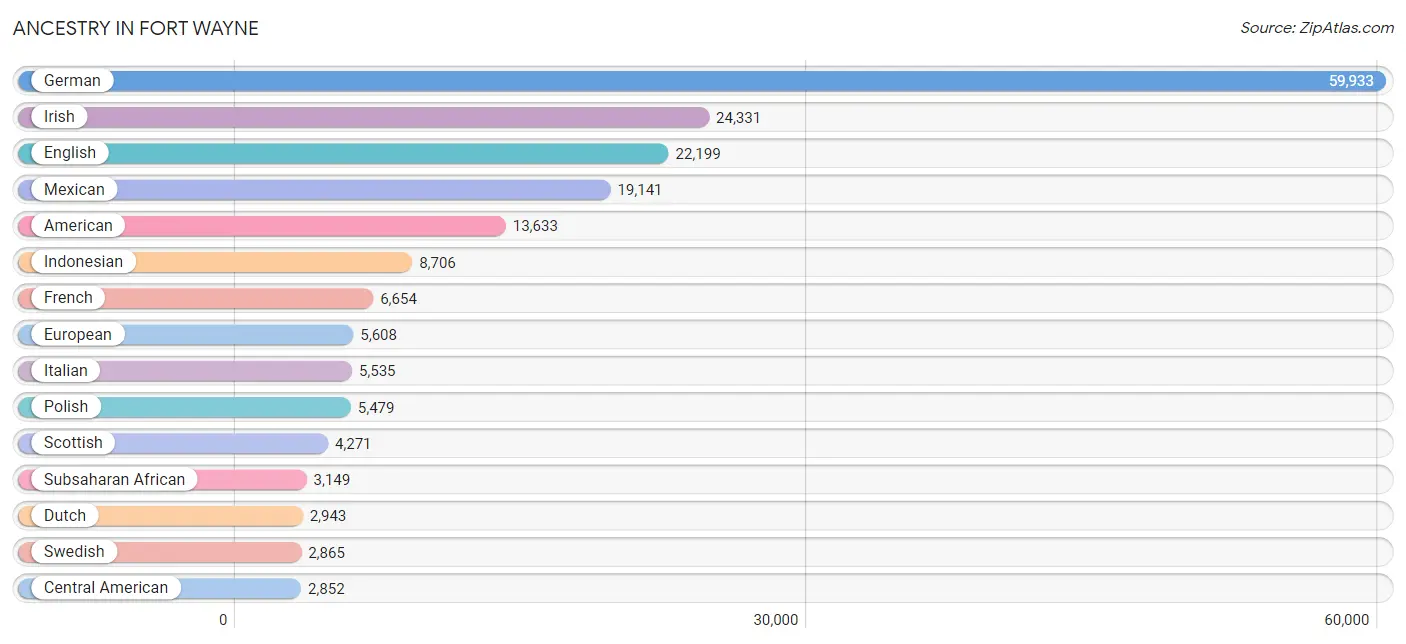
| Ancestry | # Population | % Population |
| Afghan | 15 | 0.0% |
| African | 1,601 | 0.6% |
| Albanian | 56 | 0.0% |
| Alsatian | 8 | 0.0% |
| American | 13,633 | 5.1% |
| Apache | 53 | 0.0% |
| Arab | 1,047 | 0.4% |
| Argentinean | 62 | 0.0% |
| Armenian | 23 | 0.0% |
| Australian | 65 | 0.0% |
| Austrian | 366 | 0.1% |
| Bahamian | 13 | 0.0% |
| Barbadian | 9 | 0.0% |
| Basque | 17 | 0.0% |
| Belgian | 301 | 0.1% |
| Belizean | 27 | 0.0% |
| Bhutanese | 212 | 0.1% |
| Blackfeet | 163 | 0.1% |
| Bolivian | 29 | 0.0% |
| Brazilian | 20 | 0.0% |
| British | 1,148 | 0.4% |
| British West Indian | 32 | 0.0% |
| Bulgarian | 98 | 0.0% |
| Burmese | 764 | 0.3% |
| Canadian | 267 | 0.1% |
| Carpatho Rusyn | 66 | 0.0% |
| Celtic | 42 | 0.0% |
| Central American | 2,852 | 1.1% |
| Central American Indian | 167 | 0.1% |
| Cherokee | 840 | 0.3% |
| Cheyenne | 4 | 0.0% |
| Chickasaw | 26 | 0.0% |
| Chippewa | 65 | 0.0% |
| Choctaw | 77 | 0.0% |
| Colombian | 178 | 0.1% |
| Comanche | 40 | 0.0% |
| Costa Rican | 13 | 0.0% |
| Croatian | 526 | 0.2% |
| Cuban | 115 | 0.0% |
| Czech | 509 | 0.2% |
| Czechoslovakian | 54 | 0.0% |
| Danish | 453 | 0.2% |
| Dominican | 54 | 0.0% |
| Dutch | 2,943 | 1.1% |
| Eastern European | 444 | 0.2% |
| Ecuadorian | 57 | 0.0% |
| English | 22,199 | 8.4% |
| Ethiopian | 374 | 0.1% |
| European | 5,608 | 2.1% |
| Filipino | 56 | 0.0% |
| Finnish | 393 | 0.2% |
| French | 6,654 | 2.5% |
| French American Indian | 23 | 0.0% |
| French Canadian | 553 | 0.2% |
| German | 59,933 | 22.7% |
| German Russian | 214 | 0.1% |
| Ghanaian | 30 | 0.0% |
| Greek | 869 | 0.3% |
| Guamanian / Chamorro | 56 | 0.0% |
| Guatemalan | 1,717 | 0.6% |
| Haitian | 85 | 0.0% |
| Honduran | 221 | 0.1% |
| Hungarian | 1,100 | 0.4% |
| Indian (Asian) | 812 | 0.3% |
| Indonesian | 8,706 | 3.3% |
| Iranian | 258 | 0.1% |
| Iraqi | 57 | 0.0% |
| Irish | 24,331 | 9.2% |
| Iroquois | 33 | 0.0% |
| Israeli | 45 | 0.0% |
| Italian | 5,535 | 2.1% |
| Jamaican | 173 | 0.1% |
| Japanese | 49 | 0.0% |
| Jordanian | 40 | 0.0% |
| Kenyan | 177 | 0.1% |
| Korean | 1,189 | 0.4% |
| Laotian | 17 | 0.0% |
| Latvian | 58 | 0.0% |
| Lebanese | 144 | 0.1% |
| Liberian | 40 | 0.0% |
| Lithuanian | 173 | 0.1% |
| Lumbee | 10 | 0.0% |
| Luxembourger | 24 | 0.0% |
| Macedonian | 493 | 0.2% |
| Malaysian | 274 | 0.1% |
| Mexican | 19,141 | 7.2% |
| Mexican American Indian | 225 | 0.1% |
| Mongolian | 295 | 0.1% |
| Moroccan | 157 | 0.1% |
| Native Hawaiian | 97 | 0.0% |
| Navajo | 2 | 0.0% |
| Nicaraguan | 42 | 0.0% |
| Nigerian | 232 | 0.1% |
| Northern European | 346 | 0.1% |
| Norwegian | 1,114 | 0.4% |
| Okinawan | 5 | 0.0% |
| Ottawa | 43 | 0.0% |
| Pakistani | 324 | 0.1% |
| Palestinian | 100 | 0.0% |
| Panamanian | 332 | 0.1% |
| Pennsylvania German | 136 | 0.1% |
| Peruvian | 34 | 0.0% |
| Pima | 10 | 0.0% |
| Polish | 5,479 | 2.1% |
| Portuguese | 157 | 0.1% |
| Puerto Rican | 1,631 | 0.6% |
| Puget Sound Salish | 9 | 0.0% |
| Romanian | 419 | 0.2% |
| Russian | 436 | 0.2% |
| Salvadoran | 527 | 0.2% |
| Samoan | 22 | 0.0% |
| Scandinavian | 653 | 0.3% |
| Scotch-Irish | 1,490 | 0.6% |
| Scottish | 4,271 | 1.6% |
| Serbian | 104 | 0.0% |
| Sioux | 93 | 0.0% |
| Slavic | 31 | 0.0% |
| Slovak | 389 | 0.2% |
| Slovene | 83 | 0.0% |
| Somali | 134 | 0.1% |
| South African | 42 | 0.0% |
| South American | 434 | 0.2% |
| South American Indian | 13 | 0.0% |
| Spaniard | 112 | 0.0% |
| Spanish | 173 | 0.1% |
| Sri Lankan | 1,327 | 0.5% |
| Subsaharan African | 3,149 | 1.2% |
| Sudanese | 337 | 0.1% |
| Swedish | 2,865 | 1.1% |
| Swiss | 1,929 | 0.7% |
| Syrian | 244 | 0.1% |
| Thai | 1,919 | 0.7% |
| Trinidadian and Tobagonian | 54 | 0.0% |
| Ukrainian | 342 | 0.1% |
| Venezuelan | 74 | 0.0% |
| Vietnamese | 113 | 0.0% |
| Welsh | 1,398 | 0.5% |
| West Indian | 83 | 0.0% |
| Yugoslavian | 384 | 0.2% |
| Zimbabwean | 10 | 0.0% | View All 140 Rows |
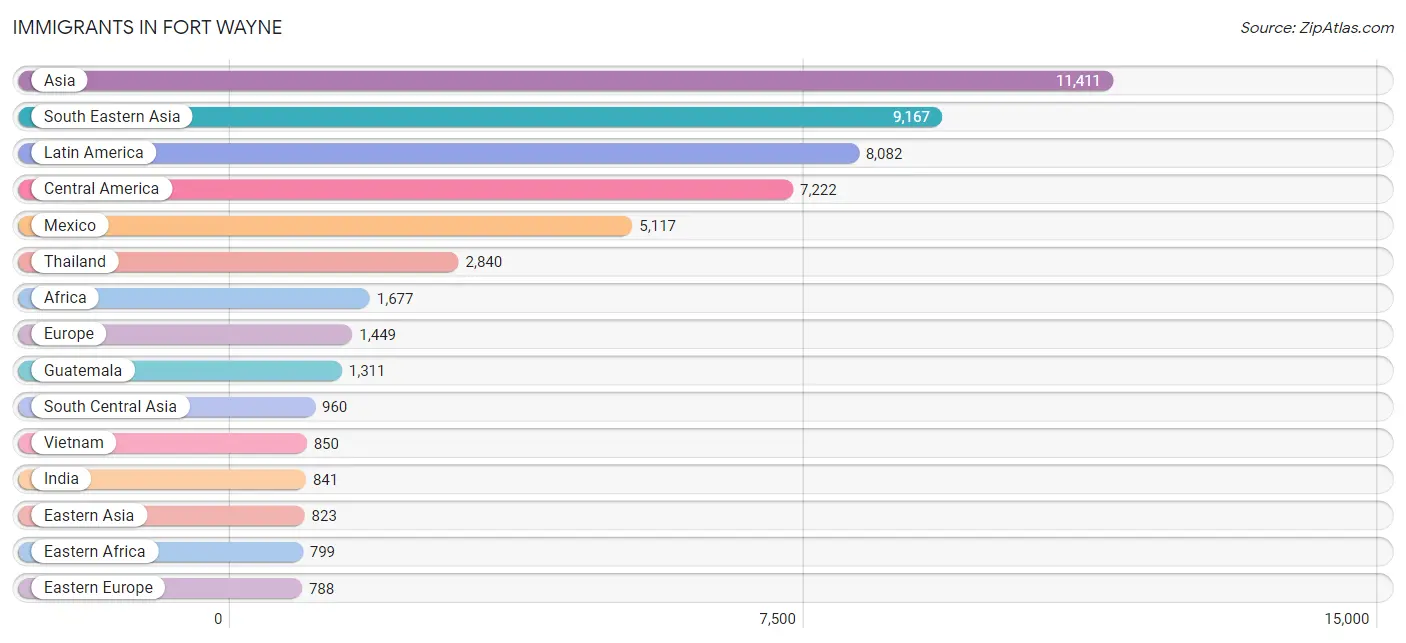
Immigrants in Fort Wayne
The most numerous immigrant groups reported in Fort Wayne came from Asia (11,411 | 4.3%), South Eastern Asia (9,167 | 3.5%), Latin America (8,082 | 3.1%), Central America (7,222 | 2.7%), and Mexico (5,117 | 1.9%), together accounting for 15.5% of all Fort Wayne residents.
| Immigration Origin | # Population | % Population |
| Africa | 1,677 | 0.6% |
| Albania | 43 | 0.0% |
| Argentina | 35 | 0.0% |
| Asia | 11,411 | 4.3% |
| Bahamas | 34 | 0.0% |
| Bangladesh | 35 | 0.0% |
| Barbados | 119 | 0.0% |
| Belarus | 20 | 0.0% |
| Bolivia | 37 | 0.0% |
| Bosnia and Herzegovina | 237 | 0.1% |
| Brazil | 41 | 0.0% |
| Bulgaria | 33 | 0.0% |
| Canada | 456 | 0.2% |
| Caribbean | 431 | 0.2% |
| Central America | 7,222 | 2.7% |
| China | 530 | 0.2% |
| Colombia | 188 | 0.1% |
| Congo | 140 | 0.1% |
| Croatia | 21 | 0.0% |
| Cuba | 39 | 0.0% |
| Czechoslovakia | 11 | 0.0% |
| Denmark | 6 | 0.0% |
| Dominican Republic | 5 | 0.0% |
| Eastern Africa | 799 | 0.3% |
| Eastern Asia | 823 | 0.3% |
| Eastern Europe | 788 | 0.3% |
| Ecuador | 70 | 0.0% |
| El Salvador | 552 | 0.2% |
| England | 93 | 0.0% |
| Ethiopia | 140 | 0.1% |
| Europe | 1,449 | 0.5% |
| France | 18 | 0.0% |
| Germany | 273 | 0.1% |
| Ghana | 82 | 0.0% |
| Greece | 45 | 0.0% |
| Grenada | 32 | 0.0% |
| Guatemala | 1,311 | 0.5% |
| Guyana | 15 | 0.0% |
| Haiti | 90 | 0.0% |
| Honduras | 183 | 0.1% |
| Hong Kong | 16 | 0.0% |
| Hungary | 81 | 0.0% |
| India | 841 | 0.3% |
| Indonesia | 17 | 0.0% |
| Iran | 7 | 0.0% |
| Iraq | 27 | 0.0% |
| Ireland | 58 | 0.0% |
| Israel | 11 | 0.0% |
| Italy | 60 | 0.0% |
| Jamaica | 41 | 0.0% |
| Japan | 60 | 0.0% |
| Kazakhstan | 2 | 0.0% |
| Kenya | 302 | 0.1% |
| Korea | 233 | 0.1% |
| Kuwait | 14 | 0.0% |
| Laos | 92 | 0.0% |
| Latin America | 8,082 | 3.1% |
| Latvia | 37 | 0.0% |
| Lebanon | 33 | 0.0% |
| Liberia | 59 | 0.0% |
| Malaysia | 407 | 0.2% |
| Mexico | 5,117 | 1.9% |
| Middle Africa | 263 | 0.1% |
| Morocco | 96 | 0.0% |
| Nicaragua | 30 | 0.0% |
| Nigeria | 155 | 0.1% |
| Northern Africa | 222 | 0.1% |
| Northern Europe | 249 | 0.1% |
| Norway | 10 | 0.0% |
| Pakistan | 73 | 0.0% |
| Panama | 29 | 0.0% |
| Peru | 15 | 0.0% |
| Philippines | 642 | 0.2% |
| Poland | 25 | 0.0% |
| Romania | 32 | 0.0% |
| Russia | 83 | 0.0% |
| Saudi Arabia | 106 | 0.0% |
| Scotland | 59 | 0.0% |
| Serbia | 10 | 0.0% |
| Somalia | 134 | 0.1% |
| South Africa | 82 | 0.0% |
| South America | 429 | 0.2% |
| South Central Asia | 960 | 0.4% |
| South Eastern Asia | 9,167 | 3.5% |
| Southern Europe | 105 | 0.0% |
| Sri Lanka | 2 | 0.0% |
| Sudan | 101 | 0.0% |
| Switzerland | 16 | 0.0% |
| Syria | 83 | 0.0% |
| Taiwan | 128 | 0.1% |
| Thailand | 2,840 | 1.1% |
| Trinidad and Tobago | 71 | 0.0% |
| Uganda | 13 | 0.0% |
| Ukraine | 117 | 0.0% |
| Venezuela | 28 | 0.0% |
| Vietnam | 850 | 0.3% |
| Western Africa | 311 | 0.1% |
| Western Asia | 354 | 0.1% |
| Western Europe | 307 | 0.1% |
| Yemen | 80 | 0.0% |
| Zaire | 51 | 0.0% |
| Zimbabwe | 10 | 0.0% | View All 102 Rows |
Sex and Age in Fort Wayne
Sex and Age in Fort Wayne
The most populous age groups in Fort Wayne are 25 to 29 Years (10,909 | 8.4%) for men and 25 to 29 Years (10,759 | 8.0%) for women.
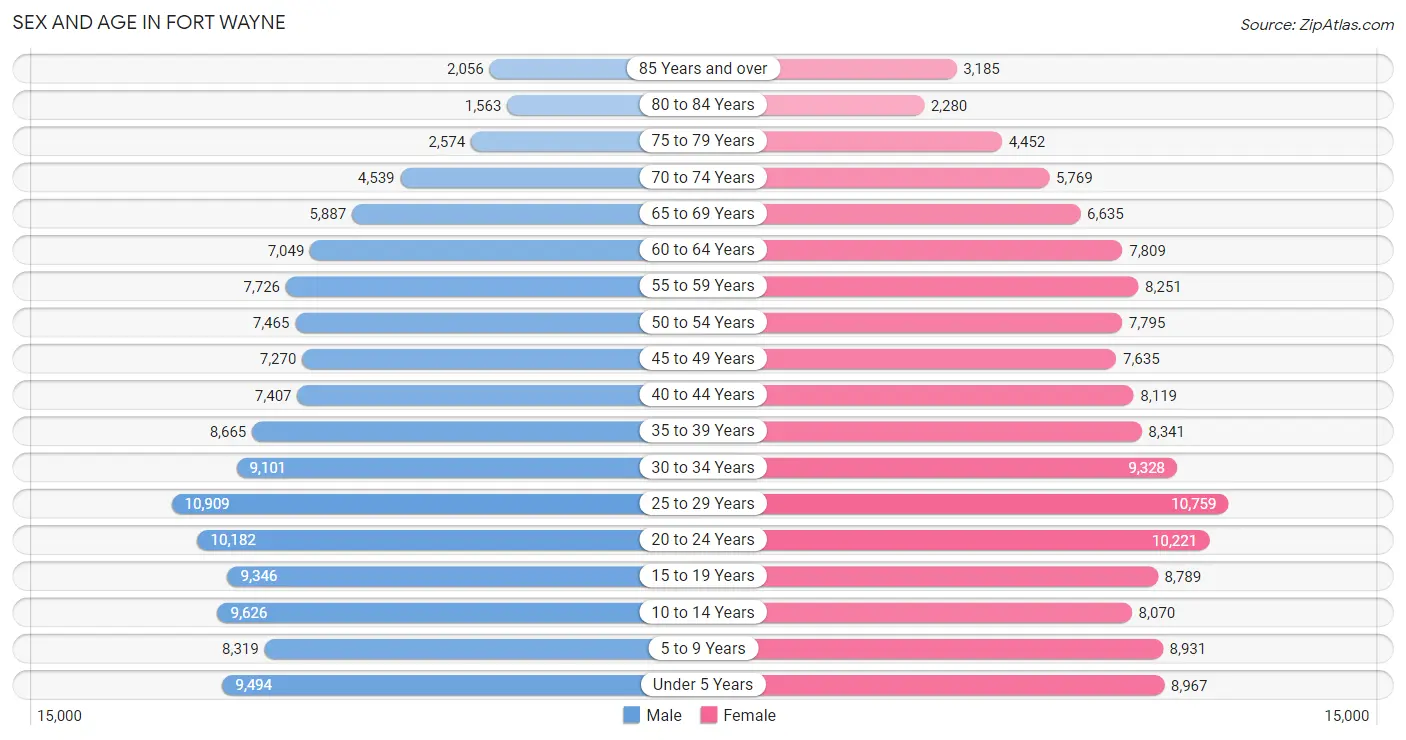
| Age Bracket | Male | Female |
| Under 5 Years | 9,494 (7.3%) | 8,967 (6.6%) |
| 5 to 9 Years | 8,319 (6.4%) | 8,931 (6.6%) |
| 10 to 14 Years | 9,626 (7.4%) | 8,070 (6.0%) |
| 15 to 19 Years | 9,346 (7.2%) | 8,789 (6.5%) |
| 20 to 24 Years | 10,182 (7.9%) | 10,221 (7.5%) |
| 25 to 29 Years | 10,909 (8.4%) | 10,759 (8.0%) |
| 30 to 34 Years | 9,101 (7.0%) | 9,328 (6.9%) |
| 35 to 39 Years | 8,665 (6.7%) | 8,341 (6.2%) |
| 40 to 44 Years | 7,407 (5.7%) | 8,119 (6.0%) |
| 45 to 49 Years | 7,270 (5.6%) | 7,635 (5.6%) |
| 50 to 54 Years | 7,465 (5.8%) | 7,795 (5.8%) |
| 55 to 59 Years | 7,726 (6.0%) | 8,251 (6.1%) |
| 60 to 64 Years | 7,049 (5.5%) | 7,809 (5.8%) |
| 65 to 69 Years | 5,887 (4.6%) | 6,635 (4.9%) |
| 70 to 74 Years | 4,539 (3.5%) | 5,769 (4.3%) |
| 75 to 79 Years | 2,574 (2.0%) | 4,452 (3.3%) |
| 80 to 84 Years | 1,563 (1.2%) | 2,280 (1.7%) |
| 85 Years and over | 2,056 (1.6%) | 3,185 (2.4%) |
| Total | 129,178 (100.0%) | 135,336 (100.0%) |
Families and Households in Fort Wayne
Median Family Size in Fort Wayne
The median family size in Fort Wayne is 3.11 persons per family, with single female/mother families (14,938 | 23.5%) accounting for the largest median family size of 3.19 persons per family. On the other hand, single male/father families (5,752 | 9.0%) represent the smallest median family size with 2.65 persons per family.
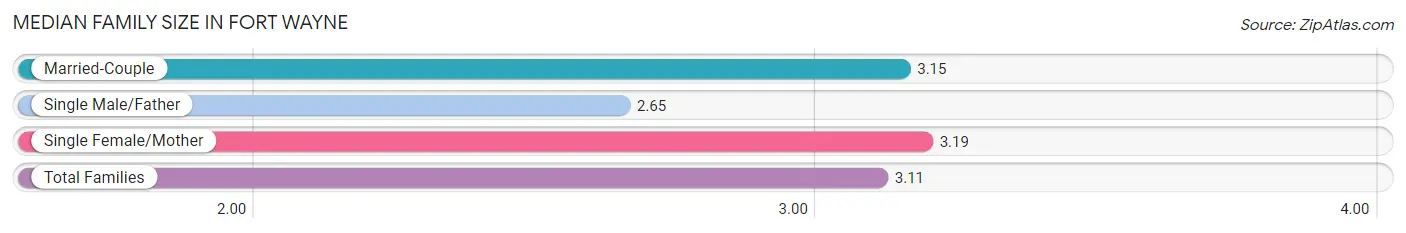
| Family Type | # Families | Family Size |
| Married-Couple | 42,993 (67.5%) | 3.15 |
| Single Male/Father | 5,752 (9.0%) | 2.65 |
| Single Female/Mother | 14,938 (23.5%) | 3.19 |
| Total Families | 63,683 (100.0%) | 3.11 |
Median Household Size in Fort Wayne
The median household size in Fort Wayne is 2.41 persons per household, with single female/mother households (14,938 | 13.9%) accounting for the largest median household size of 3.4 persons per household. non-family households (44,081 | 40.9%) represent the smallest median household size with 1.24 persons per household.
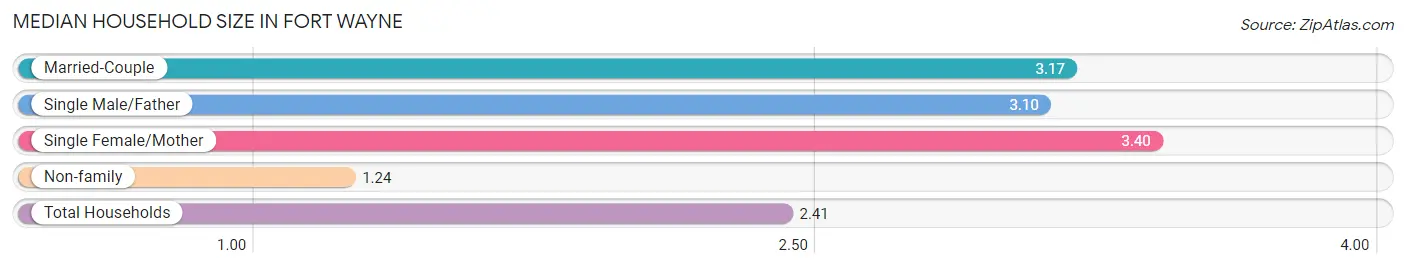
| Household Type | # Households | Household Size |
| Married-Couple | 42,993 (39.9%) | 3.17 |
| Single Male/Father | 5,752 (5.3%) | 3.10 |
| Single Female/Mother | 14,938 (13.9%) | 3.40 |
| Non-family | 44,081 (40.9%) | 1.24 |
| Total Households | 107,764 (100.0%) | 2.41 |
Household Size by Marriage Status in Fort Wayne
Out of a total of 107,764 households in Fort Wayne, 63,683 (59.1%) are family households, while 44,081 (40.9%) are nonfamily households. The most numerous type of family households are 2-person households, comprising 28,153, and the most common type of nonfamily households are 1-person households, comprising 35,311.
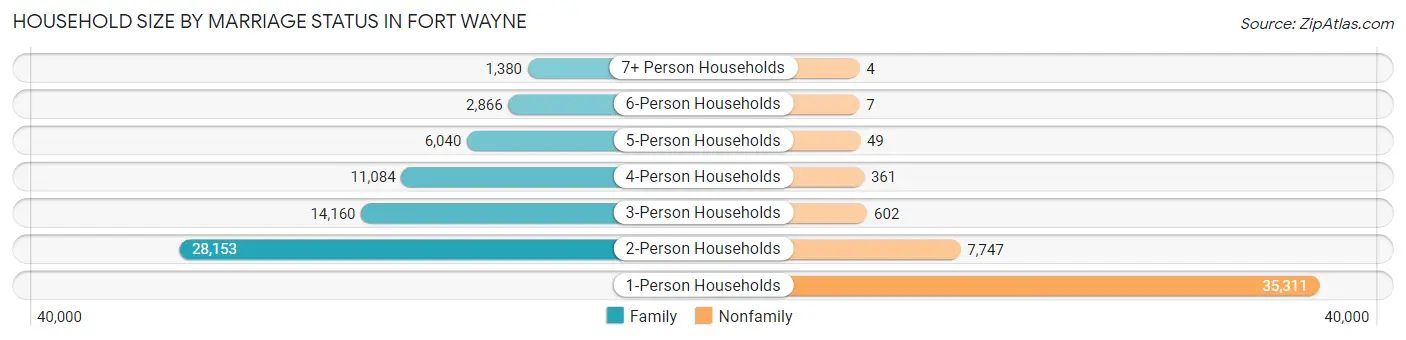
| Household Size | Family Households | Nonfamily Households |
| 1-Person Households | - | 35,311 (32.8%) |
| 2-Person Households | 28,153 (26.1%) | 7,747 (7.2%) |
| 3-Person Households | 14,160 (13.1%) | 602 (0.6%) |
| 4-Person Households | 11,084 (10.3%) | 361 (0.3%) |
| 5-Person Households | 6,040 (5.6%) | 49 (0.1%) |
| 6-Person Households | 2,866 (2.7%) | 7 (0.0%) |
| 7+ Person Households | 1,380 (1.3%) | 4 (0.0%) |
| Total | 63,683 (59.1%) | 44,081 (40.9%) |
Female Fertility in Fort Wayne
Fertility by Age in Fort Wayne
Average fertility rate in Fort Wayne is 64.0 births per 1,000 women. Women in the age bracket of 20 to 34 years have the highest fertility rate with 110.0 births per 1,000 women. Women in the age bracket of 20 to 34 years acount for 80.7% of all women with births.
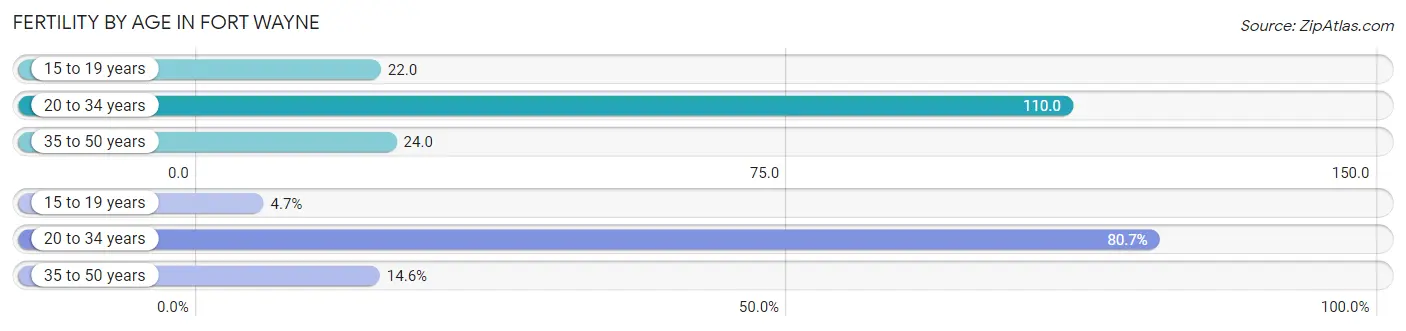
| Age Bracket | Women with Births | Births / 1,000 Women |
| 15 to 19 years | 195 (4.7%) | 22.0 |
| 20 to 34 years | 3,344 (80.7%) | 110.0 |
| 35 to 50 years | 604 (14.6%) | 24.0 |
| Total | 4,143 (100.0%) | 64.0 |
Fertility by Age by Marriage Status in Fort Wayne
60.7% of women with births (4,143) in Fort Wayne are married. The highest percentage of unmarried women with births falls into 15 to 19 years age bracket with 94.4% of them unmarried at the time of birth, while the lowest percentage of unmarried women with births belong to 35 to 50 years age bracket with 29.3% of them unmarried.
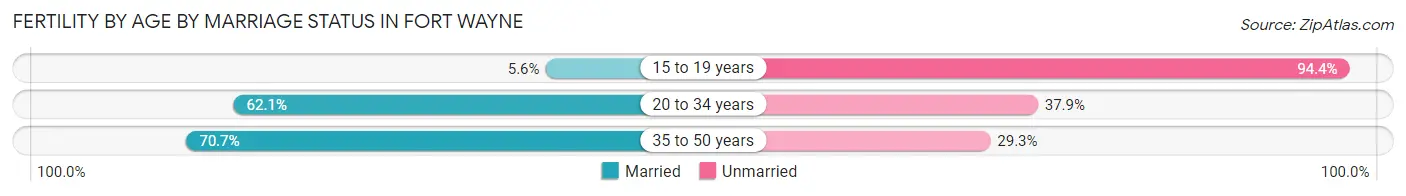
| Age Bracket | Married | Unmarried |
| 15 to 19 years | 11 (5.6%) | 184 (94.4%) |
| 20 to 34 years | 2,077 (62.1%) | 1,267 (37.9%) |
| 35 to 50 years | 427 (70.7%) | 177 (29.3%) |
| Total | 2,515 (60.7%) | 1,628 (39.3%) |
Fertility by Education in Fort Wayne
Average fertility rate in Fort Wayne is 64.0 births per 1,000 women. Women with the education attainment of high school diploma have the highest fertility rate of 88.0 births per 1,000 women, while women with the education attainment of less than high school have the lowest fertility at 43.0 births per 1,000 women. Women with the education attainment of high school diploma represent 33.7% of all women with births.
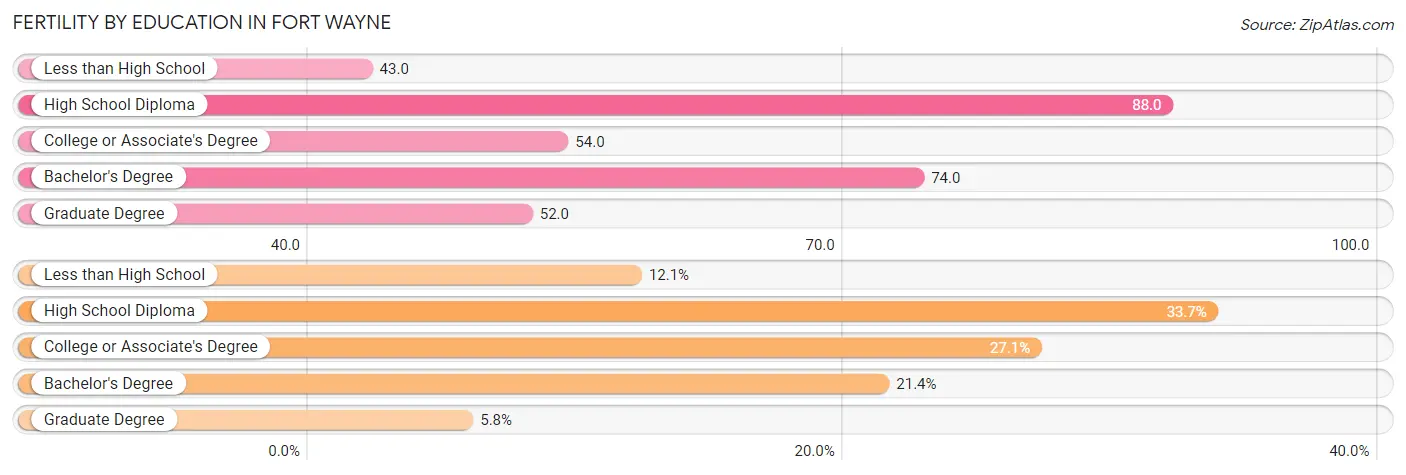
| Educational Attainment | Women with Births | Births / 1,000 Women |
| Less than High School | 501 (12.1%) | 43.0 |
| High School Diploma | 1,396 (33.7%) | 88.0 |
| College or Associate's Degree | 1,122 (27.1%) | 54.0 |
| Bachelor's Degree | 885 (21.4%) | 74.0 |
| Graduate Degree | 239 (5.8%) | 52.0 |
| Total | 4,143 (100.0%) | 64.0 |
Fertility by Education by Marriage Status in Fort Wayne
39.3% of women with births in Fort Wayne are unmarried. Women with the educational attainment of bachelor's degree are most likely to be married with 94.0% of them married at childbirth, while women with the educational attainment of less than high school are least likely to be married with 56.7% of them unmarried at childbirth.
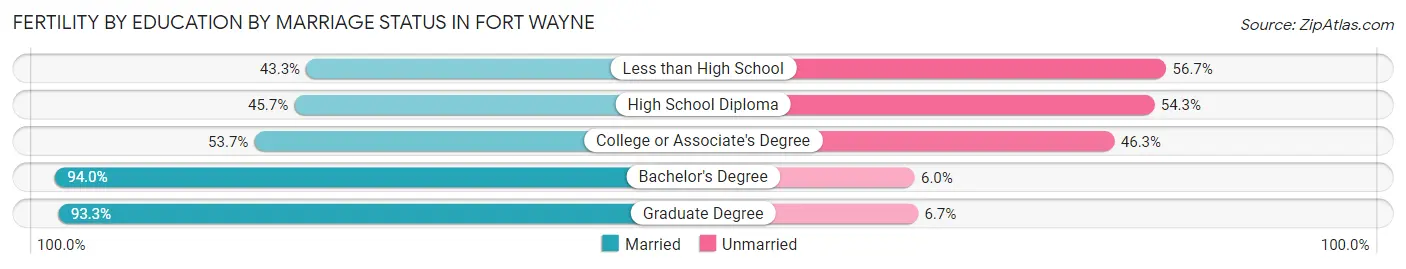
| Educational Attainment | Married | Unmarried |
| Less than High School | 217 (43.3%) | 284 (56.7%) |
| High School Diploma | 638 (45.7%) | 758 (54.3%) |
| College or Associate's Degree | 603 (53.7%) | 519 (46.3%) |
| Bachelor's Degree | 832 (94.0%) | 53 (6.0%) |
| Graduate Degree | 223 (93.3%) | 16 (6.7%) |
| Total | 2,515 (60.7%) | 1,628 (39.3%) |
Employment Characteristics in Fort Wayne
Employment by Class of Employer in Fort Wayne
Among the 126,938 employed individuals in Fort Wayne, private company employees (92,794 | 73.1%), not-for-profit organizations (14,397 | 11.3%), and local government employees (6,805 | 5.4%) make up the most common classes of employment.
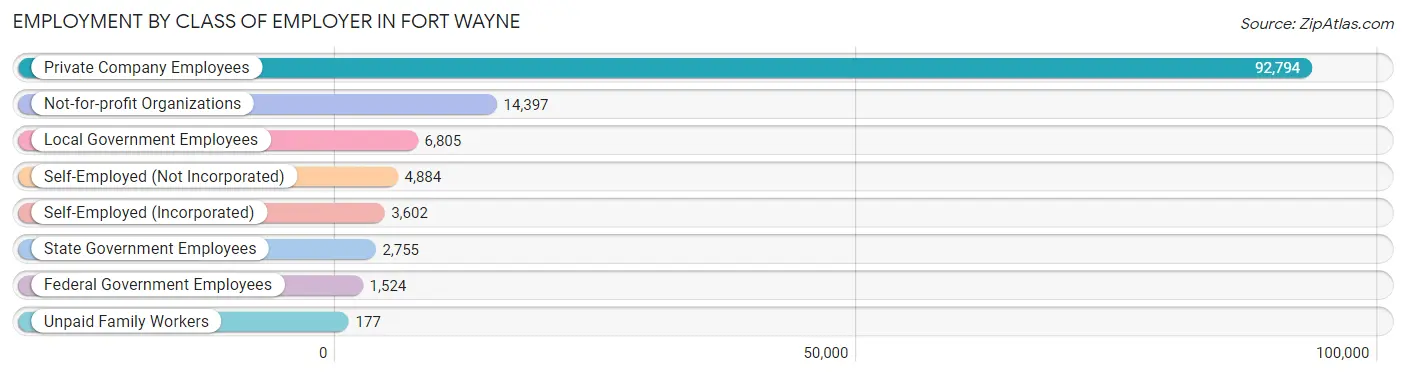
| Employer Class | # Employees | % Employees |
| Private Company Employees | 92,794 | 73.1% |
| Self-Employed (Incorporated) | 3,602 | 2.8% |
| Self-Employed (Not Incorporated) | 4,884 | 3.8% |
| Not-for-profit Organizations | 14,397 | 11.3% |
| Local Government Employees | 6,805 | 5.4% |
| State Government Employees | 2,755 | 2.2% |
| Federal Government Employees | 1,524 | 1.2% |
| Unpaid Family Workers | 177 | 0.1% |
| Total | 126,938 | 100.0% |
Employment Status by Age in Fort Wayne
According to the labor force statistics for Fort Wayne, out of the total population over 16 years of age (207,731), 66.2% or 137,518 individuals are in the labor force, with 5.8% or 7,976 of them unemployed. The age group with the highest labor force participation rate is 25 to 29 years, with 85.8% or 18,591 individuals in the labor force. Within the labor force, the 16 to 19 years age range has the highest percentage of unemployed individuals, with 15.2% or 1,126 of them being unemployed.
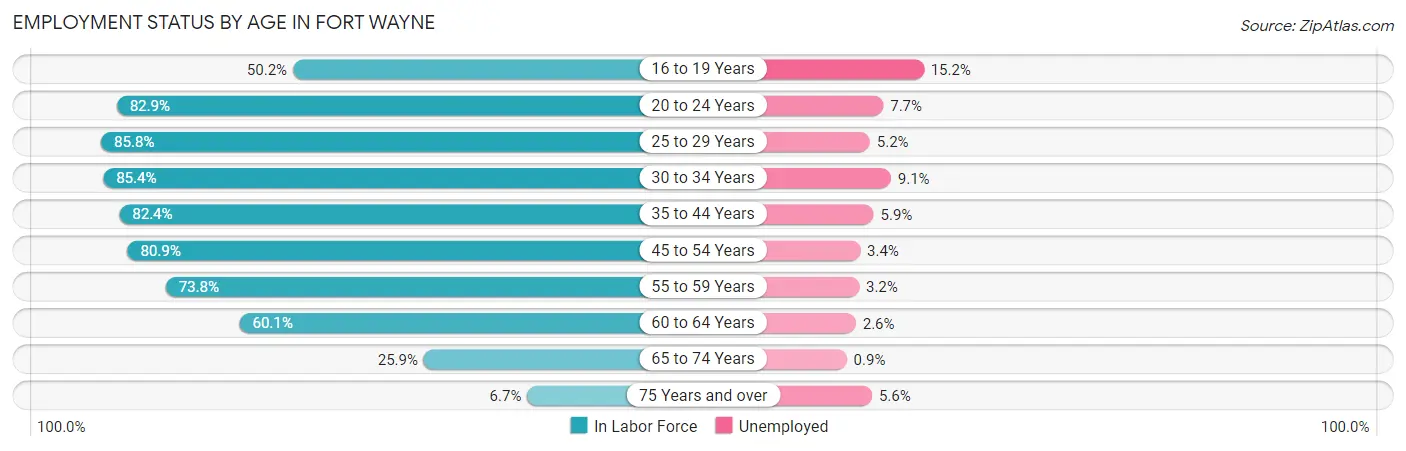
| Age Bracket | In Labor Force | Unemployed |
| 16 to 19 Years | 7,409 (50.2%) | 1,126 (15.2%) |
| 20 to 24 Years | 16,914 (82.9%) | 1,302 (7.7%) |
| 25 to 29 Years | 18,591 (85.8%) | 967 (5.2%) |
| 30 to 34 Years | 15,738 (85.4%) | 1,432 (9.1%) |
| 35 to 44 Years | 26,806 (82.4%) | 1,582 (5.9%) |
| 45 to 54 Years | 24,403 (80.9%) | 830 (3.4%) |
| 55 to 59 Years | 11,791 (73.8%) | 377 (3.2%) |
| 60 to 64 Years | 8,930 (60.1%) | 232 (2.6%) |
| 65 to 74 Years | 5,913 (25.9%) | 53 (0.9%) |
| 75 Years and over | 1,079 (6.7%) | 60 (5.6%) |
| Total | 137,518 (66.2%) | 7,976 (5.8%) |
Employment Status by Educational Attainment in Fort Wayne
According to labor force statistics for Fort Wayne, 79.5% of individuals (106,235) out of the total population between 25 and 64 years of age (133,629) are in the labor force, with 5.1% or 5,418 of them being unemployed. The group with the highest labor force participation rate are those with the educational attainment of bachelor's degree or higher, with 88.1% or 34,400 individuals in the labor force. Within the labor force, individuals with less than high school education have the highest percentage of unemployment, with 10.9% or 1,004 of them being unemployed.
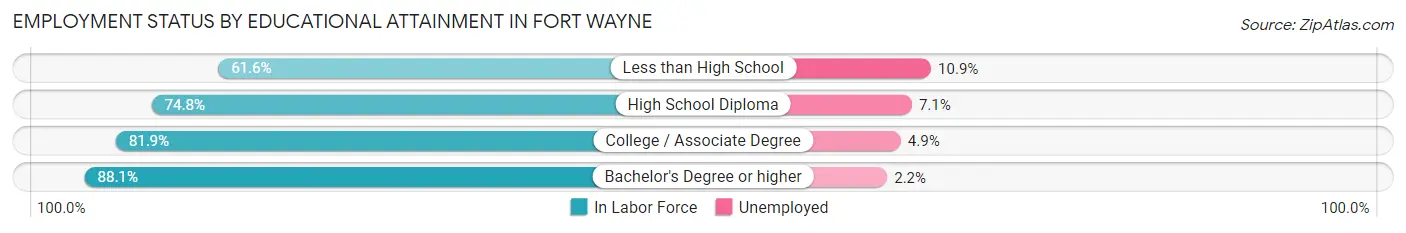
| Educational Attainment | In Labor Force | Unemployed |
| Less than High School | 9,210 (61.6%) | 1,630 (10.9%) |
| High School Diploma | 27,381 (74.8%) | 2,599 (7.1%) |
| College / Associate Degree | 35,237 (81.9%) | 2,108 (4.9%) |
| Bachelor's Degree or higher | 34,400 (88.1%) | 859 (2.2%) |
| Total | 106,235 (79.5%) | 6,815 (5.1%) |
Employment Occupations by Sex in Fort Wayne
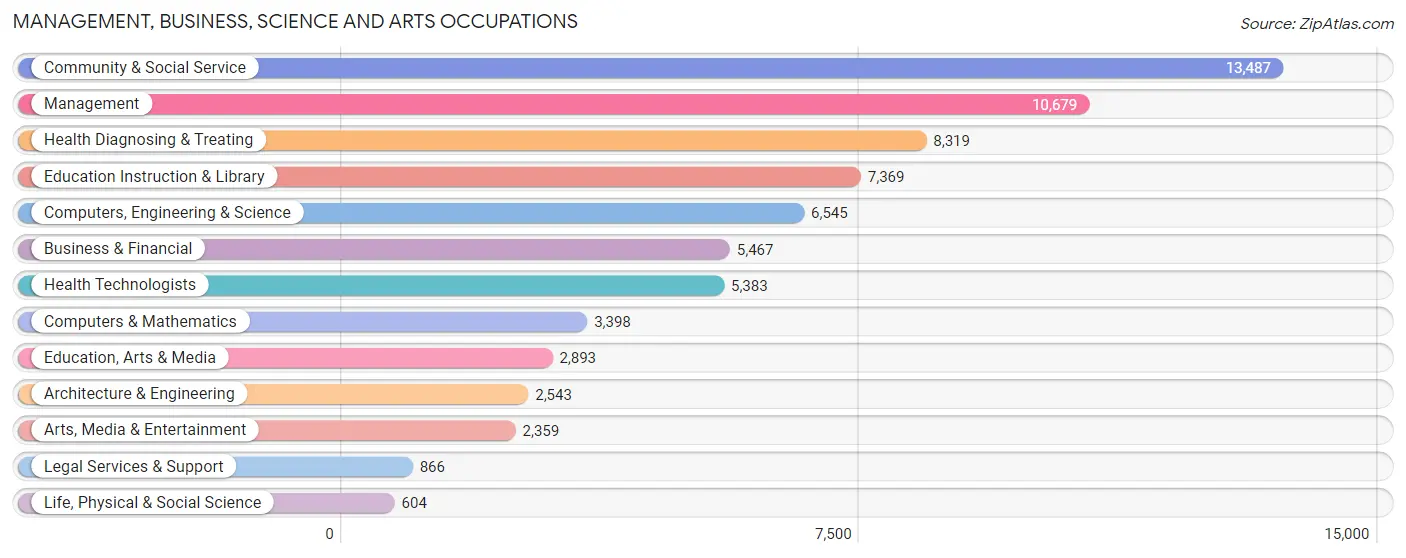
Management, Business, Science and Arts Occupations
The most common Management, Business, Science and Arts occupations in Fort Wayne are Community & Social Service (13,487 | 10.4%), Management (10,679 | 8.3%), Health Diagnosing & Treating (8,319 | 6.4%), Education Instruction & Library (7,369 | 5.7%), and Computers, Engineering & Science (6,545 | 5.1%).
Management, Business, Science and Arts Occupations by Sex
Within the Management, Business, Science and Arts occupations in Fort Wayne, the most male-oriented occupations are Architecture & Engineering (91.3%), Computers, Engineering & Science (78.6%), and Computers & Mathematics (73.5%), while the most female-oriented occupations are Health Technologists (77.2%), Health Diagnosing & Treating (77.2%), and Education Instruction & Library (73.8%).
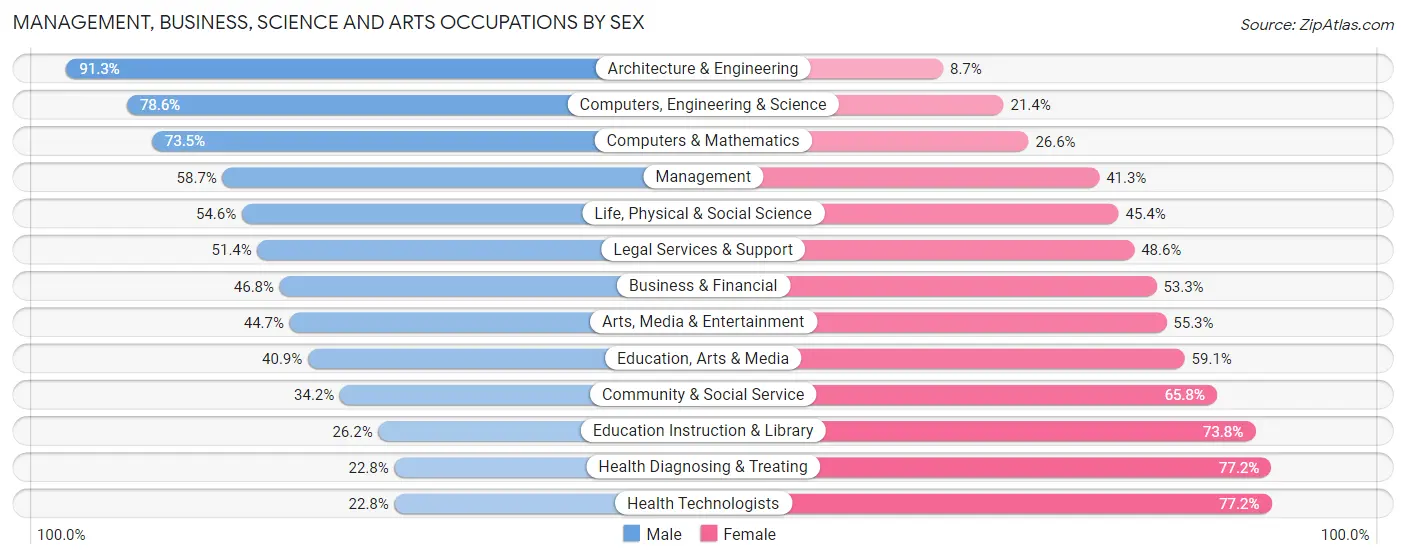
| Occupation | Male | Female |
| Management | 6,268 (58.7%) | 4,411 (41.3%) |
| Business & Financial | 2,556 (46.8%) | 2,911 (53.2%) |
| Computers, Engineering & Science | 5,147 (78.6%) | 1,398 (21.4%) |
| Computers & Mathematics | 2,496 (73.5%) | 902 (26.6%) |
| Architecture & Engineering | 2,321 (91.3%) | 222 (8.7%) |
| Life, Physical & Social Science | 330 (54.6%) | 274 (45.4%) |
| Community & Social Service | 4,610 (34.2%) | 8,877 (65.8%) |
| Education, Arts & Media | 1,182 (40.9%) | 1,711 (59.1%) |
| Legal Services & Support | 445 (51.4%) | 421 (48.6%) |
| Education Instruction & Library | 1,929 (26.2%) | 5,440 (73.8%) |
| Arts, Media & Entertainment | 1,054 (44.7%) | 1,305 (55.3%) |
| Health Diagnosing & Treating | 1,899 (22.8%) | 6,420 (77.2%) |
| Health Technologists | 1,228 (22.8%) | 4,155 (77.2%) |
| Total (Category) | 20,480 (46.0%) | 24,017 (54.0%) |
| Total (Overall) | 67,281 (52.0%) | 62,208 (48.0%) |
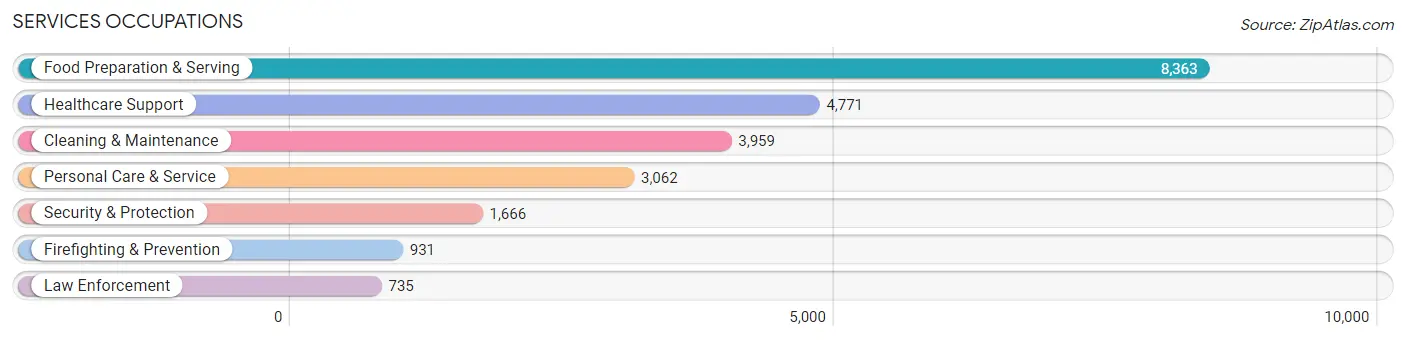
Services Occupations
The most common Services occupations in Fort Wayne are Food Preparation & Serving (8,363 | 6.5%), Healthcare Support (4,771 | 3.7%), Cleaning & Maintenance (3,959 | 3.1%), Personal Care & Service (3,062 | 2.4%), and Security & Protection (1,666 | 1.3%).
Services Occupations by Sex
Within the Services occupations in Fort Wayne, the most male-oriented occupations are Law Enforcement (87.5%), Security & Protection (80.8%), and Firefighting & Prevention (75.5%), while the most female-oriented occupations are Healthcare Support (88.8%), Personal Care & Service (80.2%), and Food Preparation & Serving (57.4%).
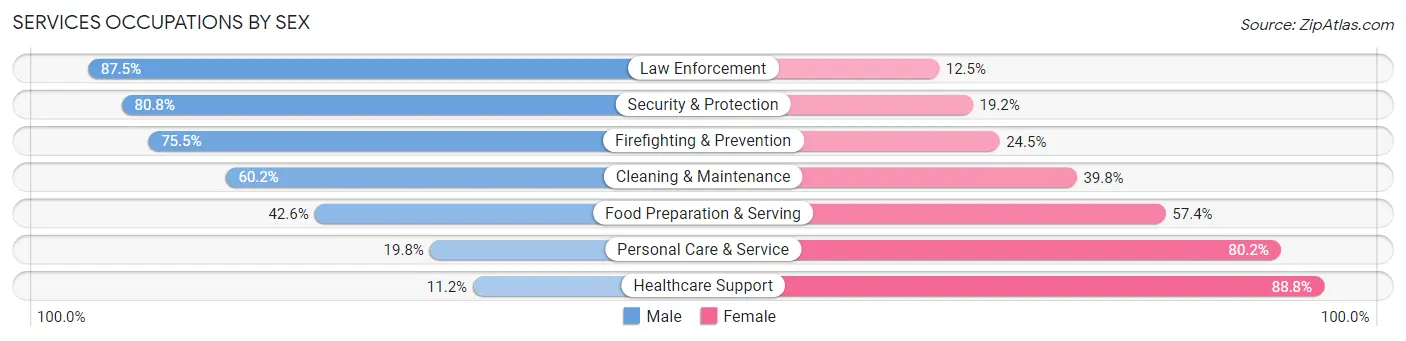
| Occupation | Male | Female |
| Healthcare Support | 536 (11.2%) | 4,235 (88.8%) |
| Security & Protection | 1,346 (80.8%) | 320 (19.2%) |
| Firefighting & Prevention | 703 (75.5%) | 228 (24.5%) |
| Law Enforcement | 643 (87.5%) | 92 (12.5%) |
| Food Preparation & Serving | 3,563 (42.6%) | 4,800 (57.4%) |
| Cleaning & Maintenance | 2,384 (60.2%) | 1,575 (39.8%) |
| Personal Care & Service | 606 (19.8%) | 2,456 (80.2%) |
| Total (Category) | 8,435 (38.7%) | 13,386 (61.3%) |
| Total (Overall) | 67,281 (52.0%) | 62,208 (48.0%) |
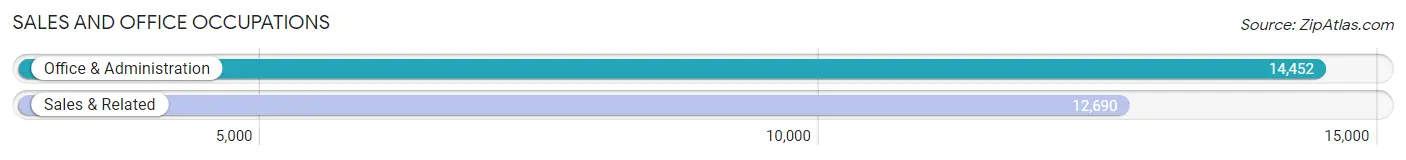
Sales and Office Occupations
The most common Sales and Office occupations in Fort Wayne are Office & Administration (14,452 | 11.2%), and Sales & Related (12,690 | 9.8%).
Sales and Office Occupations by Sex
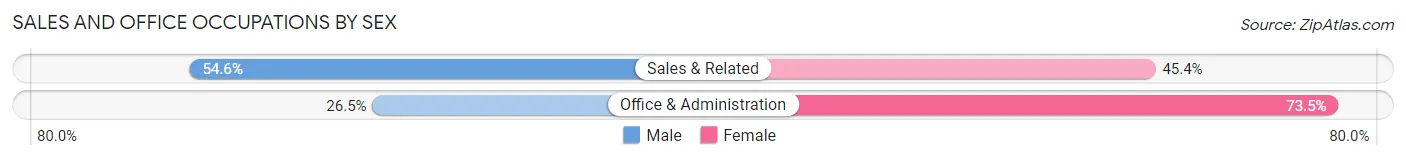
| Occupation | Male | Female |
| Sales & Related | 6,933 (54.6%) | 5,757 (45.4%) |
| Office & Administration | 3,829 (26.5%) | 10,623 (73.5%) |
| Total (Category) | 10,762 (39.7%) | 16,380 (60.4%) |
| Total (Overall) | 67,281 (52.0%) | 62,208 (48.0%) |
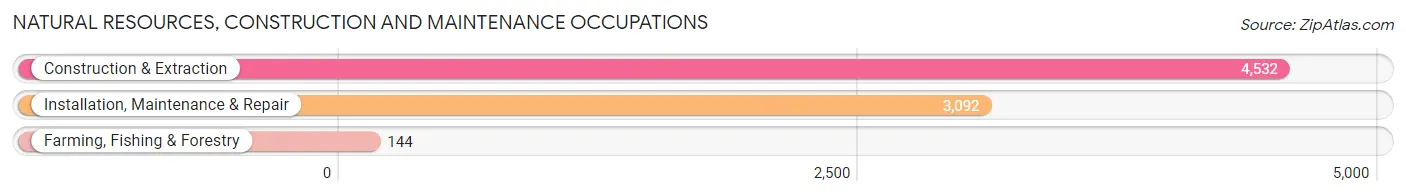
Natural Resources, Construction and Maintenance Occupations
The most common Natural Resources, Construction and Maintenance occupations in Fort Wayne are Construction & Extraction (4,532 | 3.5%), Installation, Maintenance & Repair (3,092 | 2.4%), and Farming, Fishing & Forestry (144 | 0.1%).
Natural Resources, Construction and Maintenance Occupations by Sex
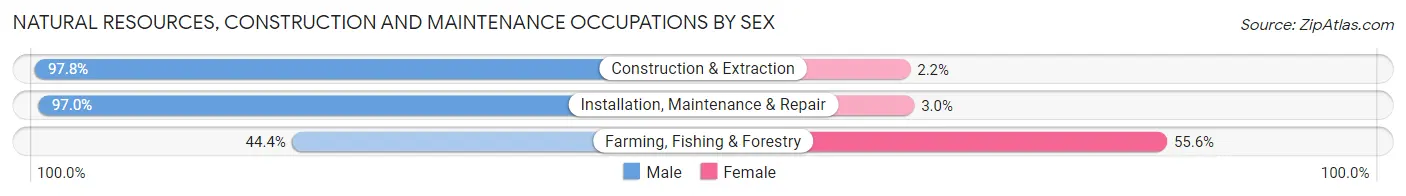
| Occupation | Male | Female |
| Farming, Fishing & Forestry | 64 (44.4%) | 80 (55.6%) |
| Construction & Extraction | 4,434 (97.8%) | 98 (2.2%) |
| Installation, Maintenance & Repair | 3,000 (97.0%) | 92 (3.0%) |
| Total (Category) | 7,498 (96.5%) | 270 (3.5%) |
| Total (Overall) | 67,281 (52.0%) | 62,208 (48.0%) |
Production, Transportation and Moving Occupations
The most common Production, Transportation and Moving occupations in Fort Wayne are Production (15,352 | 11.9%), Material Moving (7,877 | 6.1%), and Transportation (5,032 | 3.9%).
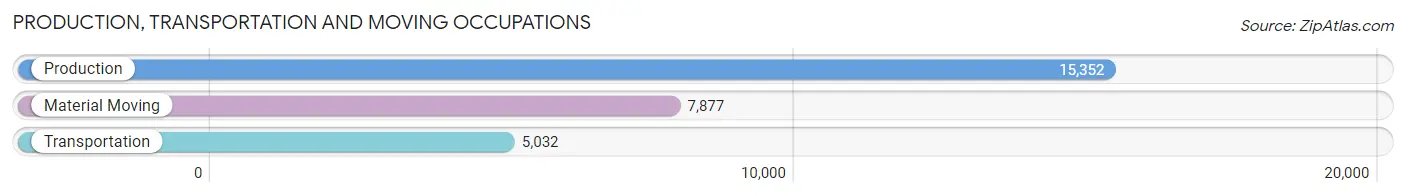
Production, Transportation and Moving Occupations by Sex
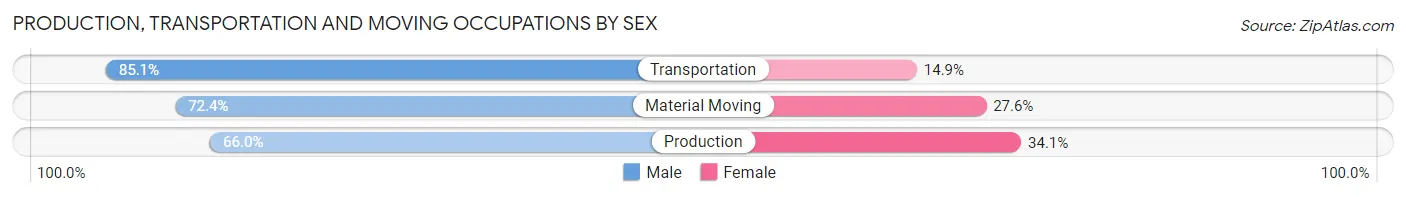
| Occupation | Male | Female |
| Production | 10,125 (65.9%) | 5,227 (34.1%) |
| Transportation | 4,281 (85.1%) | 751 (14.9%) |
| Material Moving | 5,700 (72.4%) | 2,177 (27.6%) |
| Total (Category) | 20,106 (71.1%) | 8,155 (28.9%) |
| Total (Overall) | 67,281 (52.0%) | 62,208 (48.0%) |
Employment Industries by Sex in Fort Wayne
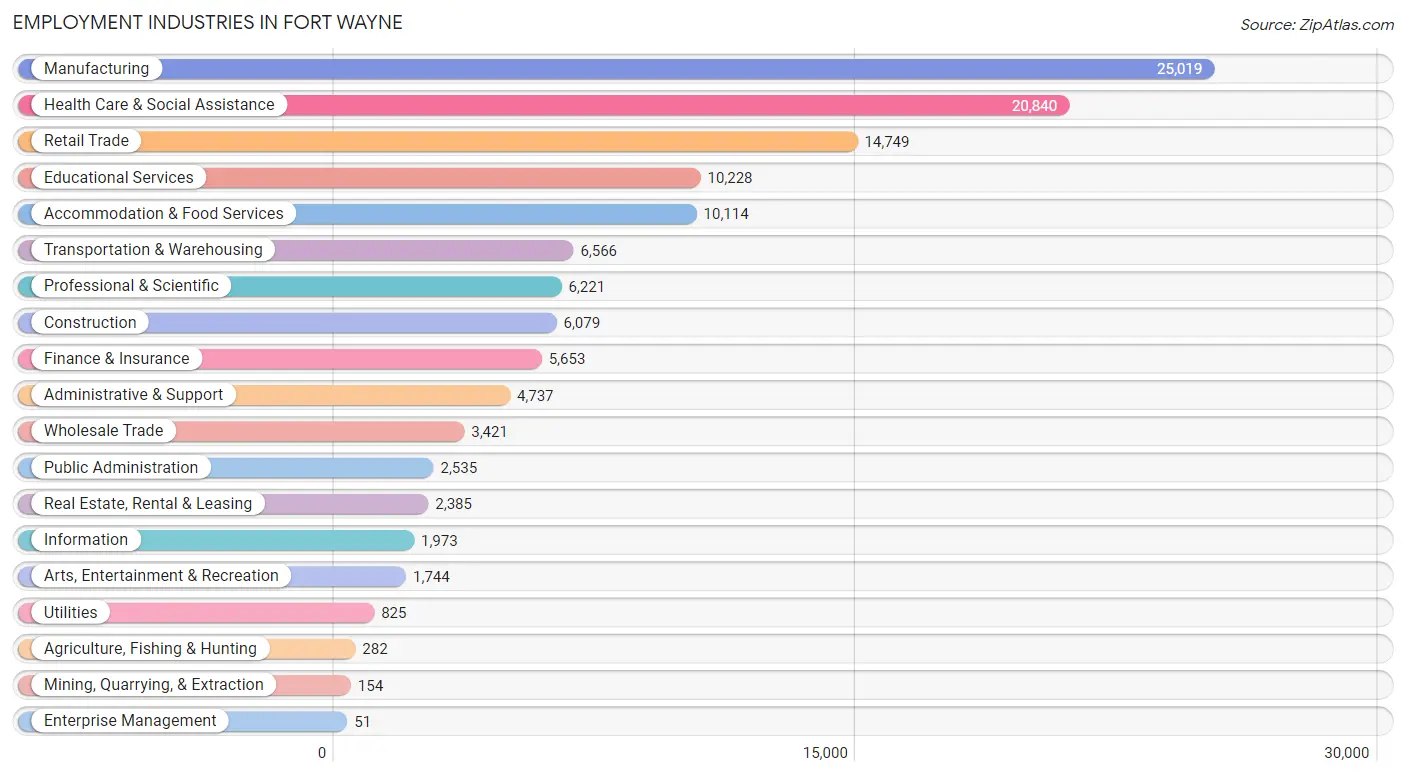
Employment Industries in Fort Wayne
The major employment industries in Fort Wayne include Manufacturing (25,019 | 19.3%), Health Care & Social Assistance (20,840 | 16.1%), Retail Trade (14,749 | 11.4%), Educational Services (10,228 | 7.9%), and Accommodation & Food Services (10,114 | 7.8%).
Employment Industries by Sex in Fort Wayne
The Fort Wayne industries that see more men than women are Mining, Quarrying, & Extraction (100.0%), Construction (93.8%), and Agriculture, Fishing & Hunting (82.6%), whereas the industries that tend to have a higher number of women are Health Care & Social Assistance (79.3%), Educational Services (68.2%), and Finance & Insurance (59.2%).
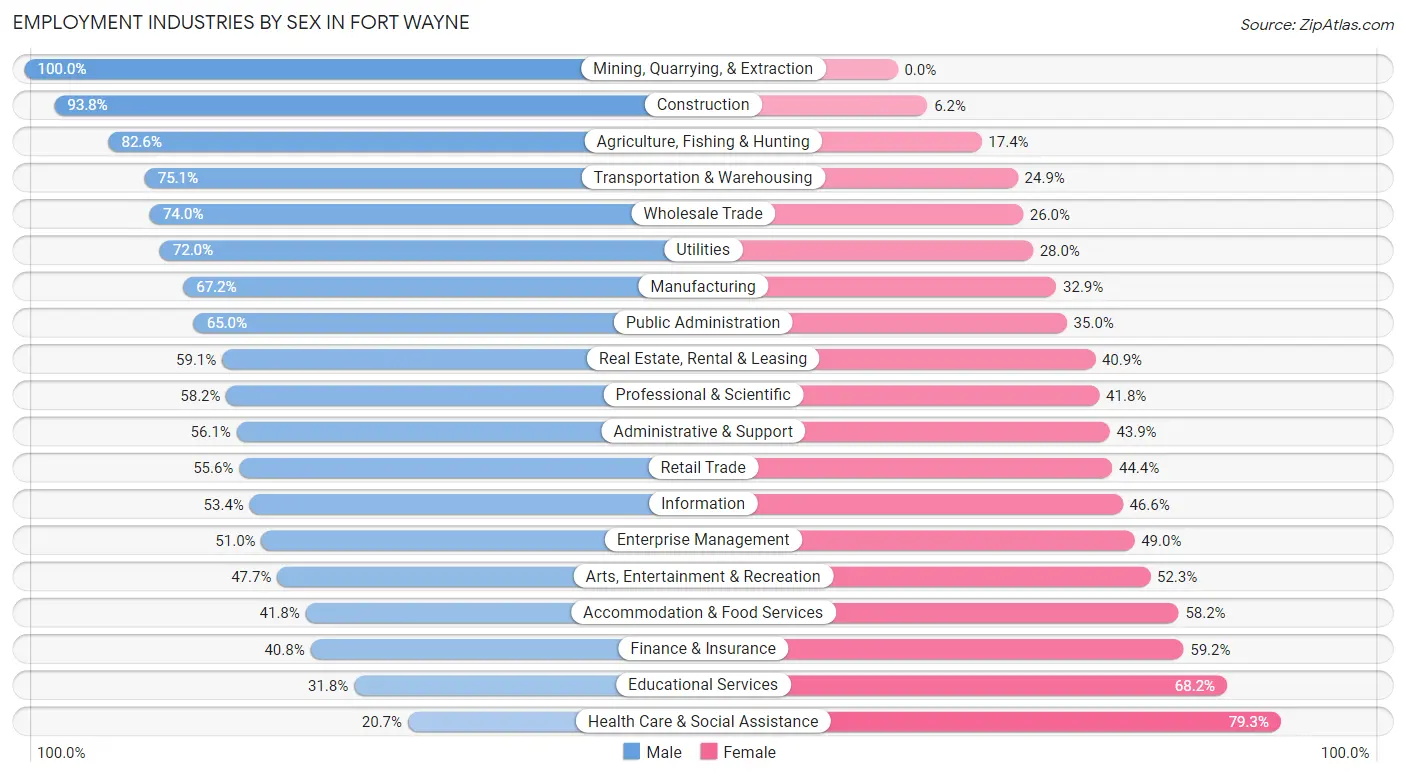
| Industry | Male | Female |
| Agriculture, Fishing & Hunting | 233 (82.6%) | 49 (17.4%) |
| Mining, Quarrying, & Extraction | 154 (100.0%) | 0 (0.0%) |
| Construction | 5,704 (93.8%) | 375 (6.2%) |
| Manufacturing | 16,801 (67.1%) | 8,218 (32.9%) |
| Wholesale Trade | 2,533 (74.0%) | 888 (26.0%) |
| Retail Trade | 8,198 (55.6%) | 6,551 (44.4%) |
| Transportation & Warehousing | 4,932 (75.1%) | 1,634 (24.9%) |
| Utilities | 594 (72.0%) | 231 (28.0%) |
| Information | 1,054 (53.4%) | 919 (46.6%) |
| Finance & Insurance | 2,308 (40.8%) | 3,345 (59.2%) |
| Real Estate, Rental & Leasing | 1,410 (59.1%) | 975 (40.9%) |
| Professional & Scientific | 3,623 (58.2%) | 2,598 (41.8%) |
| Enterprise Management | 26 (51.0%) | 25 (49.0%) |
| Administrative & Support | 2,658 (56.1%) | 2,079 (43.9%) |
| Educational Services | 3,254 (31.8%) | 6,974 (68.2%) |
| Health Care & Social Assistance | 4,308 (20.7%) | 16,532 (79.3%) |
| Arts, Entertainment & Recreation | 832 (47.7%) | 912 (52.3%) |
| Accommodation & Food Services | 4,231 (41.8%) | 5,883 (58.2%) |
| Public Administration | 1,647 (65.0%) | 888 (35.0%) |
| Total | 67,281 (52.0%) | 62,208 (48.0%) |
Education in Fort Wayne
School Enrollment in Fort Wayne
The most common levels of schooling among the 65,467 students in Fort Wayne are high school (14,679 | 22.4%), middle school (14,214 | 21.7%), and elementary school (13,782 | 21.0%).
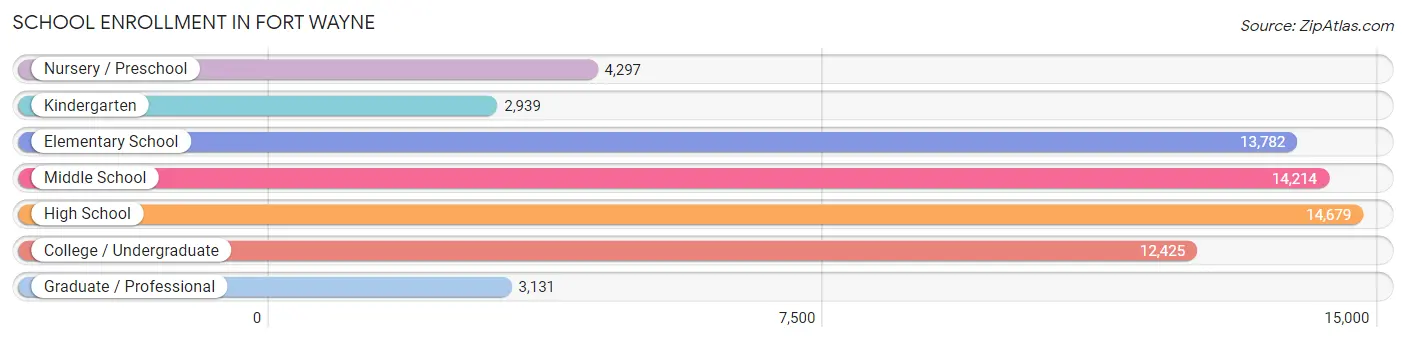
| School Level | # Students | % Students |
| Nursery / Preschool | 4,297 | 6.6% |
| Kindergarten | 2,939 | 4.5% |
| Elementary School | 13,782 | 21.0% |
| Middle School | 14,214 | 21.7% |
| High School | 14,679 | 22.4% |
| College / Undergraduate | 12,425 | 19.0% |
| Graduate / Professional | 3,131 | 4.8% |
| Total | 65,467 | 100.0% |
School Enrollment by Age by Funding Source in Fort Wayne
Out of a total of 65,467 students who are enrolled in schools in Fort Wayne, 14,992 (22.9%) attend a private institution, while the remaining 50,475 (77.1%) are enrolled in public schools. The age group of 3 to 4 year olds has the highest likelihood of being enrolled in private schools, with 1,336 (47.2% in the age bracket) enrolled. Conversely, the age group of 10 to 14 year olds has the lowest likelihood of being enrolled in a private school, with 13,881 (80.1% in the age bracket) attending a public institution.
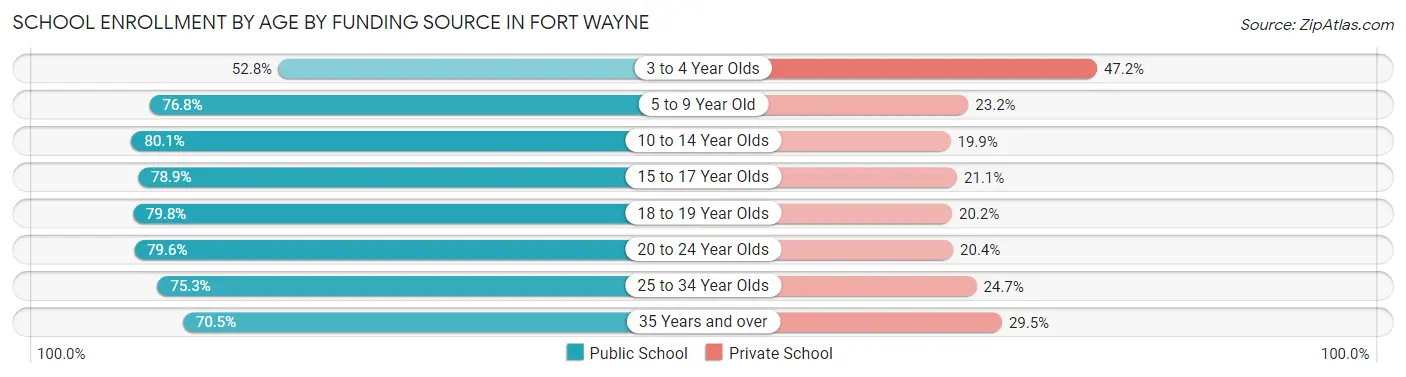
| Age Bracket | Public School | Private School |
| 3 to 4 Year Olds | 1,496 (52.8%) | 1,336 (47.2%) |
| 5 to 9 Year Old | 12,295 (76.8%) | 3,720 (23.2%) |
| 10 to 14 Year Olds | 13,881 (80.1%) | 3,448 (19.9%) |
| 15 to 17 Year Olds | 8,369 (78.9%) | 2,242 (21.1%) |
| 18 to 19 Year Olds | 4,011 (79.8%) | 1,014 (20.2%) |
| 20 to 24 Year Olds | 5,320 (79.6%) | 1,362 (20.4%) |
| 25 to 34 Year Olds | 3,011 (75.3%) | 990 (24.7%) |
| 35 Years and over | 2,096 (70.5%) | 876 (29.5%) |
| Total | 50,475 (77.1%) | 14,992 (22.9%) |
Educational Attainment by Field of Study in Fort Wayne
Business (10,491 | 20.1%), education (8,068 | 15.4%), science & technology (6,176 | 11.8%), arts & humanities (3,692 | 7.1%), and engineering (3,310 | 6.3%) are the most common fields of study among 52,250 individuals in Fort Wayne who have obtained a bachelor's degree or higher.
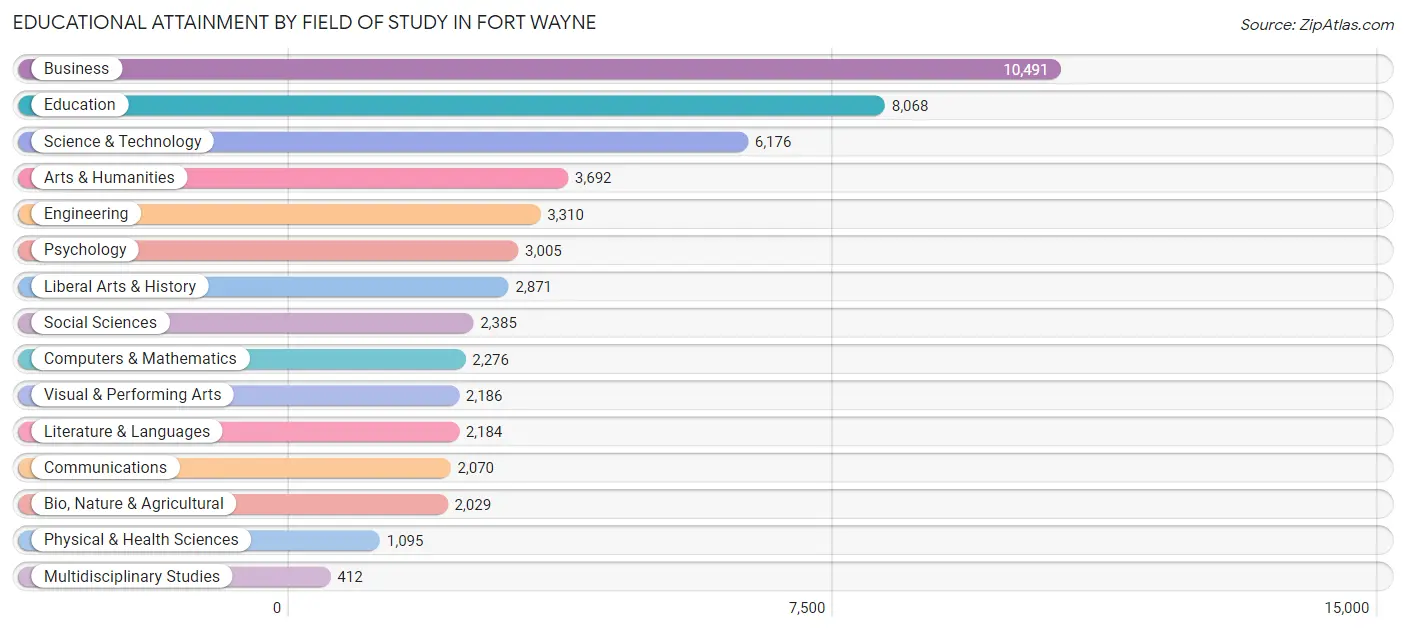
| Field of Study | # Graduates | % Graduates |
| Computers & Mathematics | 2,276 | 4.4% |
| Bio, Nature & Agricultural | 2,029 | 3.9% |
| Physical & Health Sciences | 1,095 | 2.1% |
| Psychology | 3,005 | 5.8% |
| Social Sciences | 2,385 | 4.6% |
| Engineering | 3,310 | 6.3% |
| Multidisciplinary Studies | 412 | 0.8% |
| Science & Technology | 6,176 | 11.8% |
| Business | 10,491 | 20.1% |
| Education | 8,068 | 15.4% |
| Literature & Languages | 2,184 | 4.2% |
| Liberal Arts & History | 2,871 | 5.5% |
| Visual & Performing Arts | 2,186 | 4.2% |
| Communications | 2,070 | 4.0% |
| Arts & Humanities | 3,692 | 7.1% |
| Total | 52,250 | 100.0% |
Transportation & Commute in Fort Wayne
Vehicle Availability by Sex in Fort Wayne
The most prevalent vehicle ownership categories in Fort Wayne are males with 2 vehicles (28,380, accounting for 43.1%) and females with 2 vehicles (24,629, making up 47.1%).
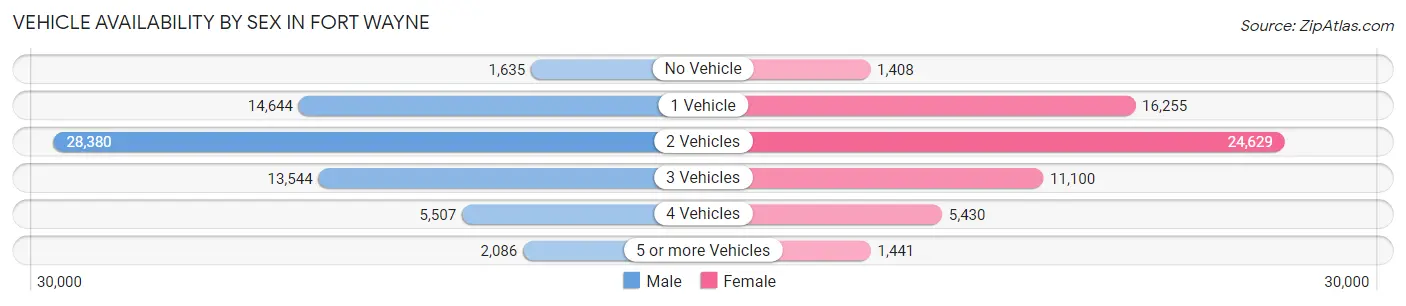
| Vehicles Available | Male | Female |
| No Vehicle | 1,635 (2.5%) | 1,408 (2.3%) |
| 1 Vehicle | 14,644 (22.3%) | 16,255 (27.0%) |
| 2 Vehicles | 28,380 (43.1%) | 24,629 (40.9%) |
| 3 Vehicles | 13,544 (20.6%) | 11,100 (18.4%) |
| 4 Vehicles | 5,507 (8.4%) | 5,430 (9.0%) |
| 5 or more Vehicles | 2,086 (3.2%) | 1,441 (2.4%) |
| Total | 65,796 (100.0%) | 60,263 (100.0%) |
Commute Time in Fort Wayne
The most frequently occuring commute durations in Fort Wayne are 15 to 19 minutes (25,116 commuters, 21.3%), 20 to 24 minutes (24,031 commuters, 20.3%), and 10 to 14 minutes (21,082 commuters, 17.8%).
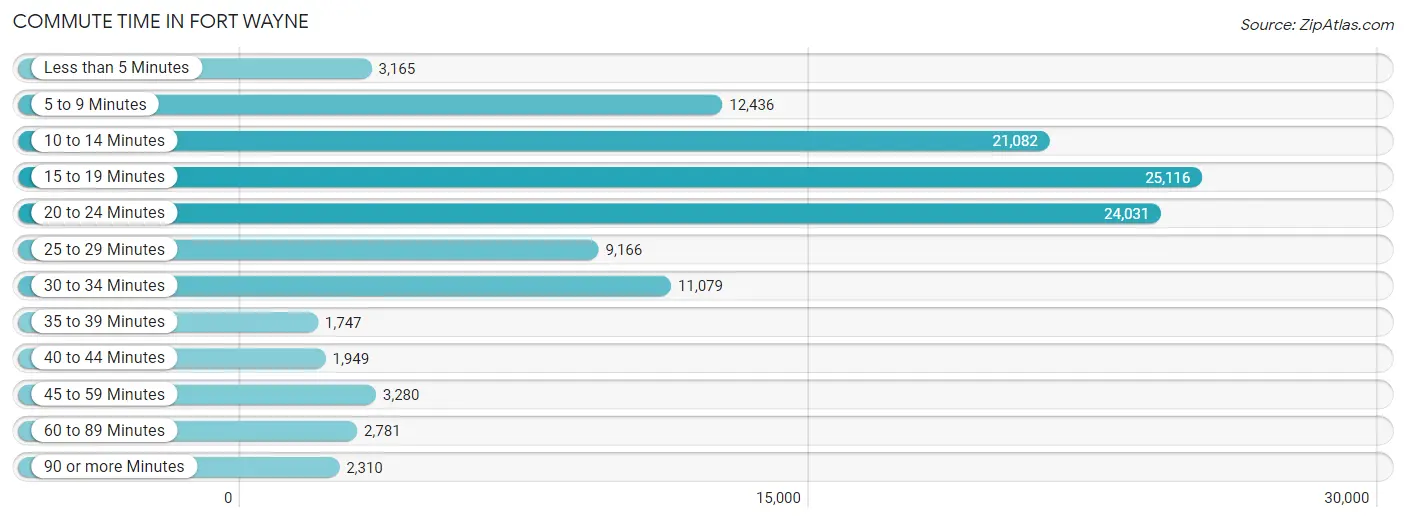
| Commute Time | # Commuters | % Commuters |
| Less than 5 Minutes | 3,165 | 2.7% |
| 5 to 9 Minutes | 12,436 | 10.5% |
| 10 to 14 Minutes | 21,082 | 17.8% |
| 15 to 19 Minutes | 25,116 | 21.3% |
| 20 to 24 Minutes | 24,031 | 20.3% |
| 25 to 29 Minutes | 9,166 | 7.8% |
| 30 to 34 Minutes | 11,079 | 9.4% |
| 35 to 39 Minutes | 1,747 | 1.5% |
| 40 to 44 Minutes | 1,949 | 1.7% |
| 45 to 59 Minutes | 3,280 | 2.8% |
| 60 to 89 Minutes | 2,781 | 2.4% |
| 90 or more Minutes | 2,310 | 2.0% |
Commute Time by Sex in Fort Wayne
The most common commute times in Fort Wayne are 15 to 19 minutes (12,554 commuters, 20.2%) for males and 15 to 19 minutes (12,562 commuters, 22.4%) for females.
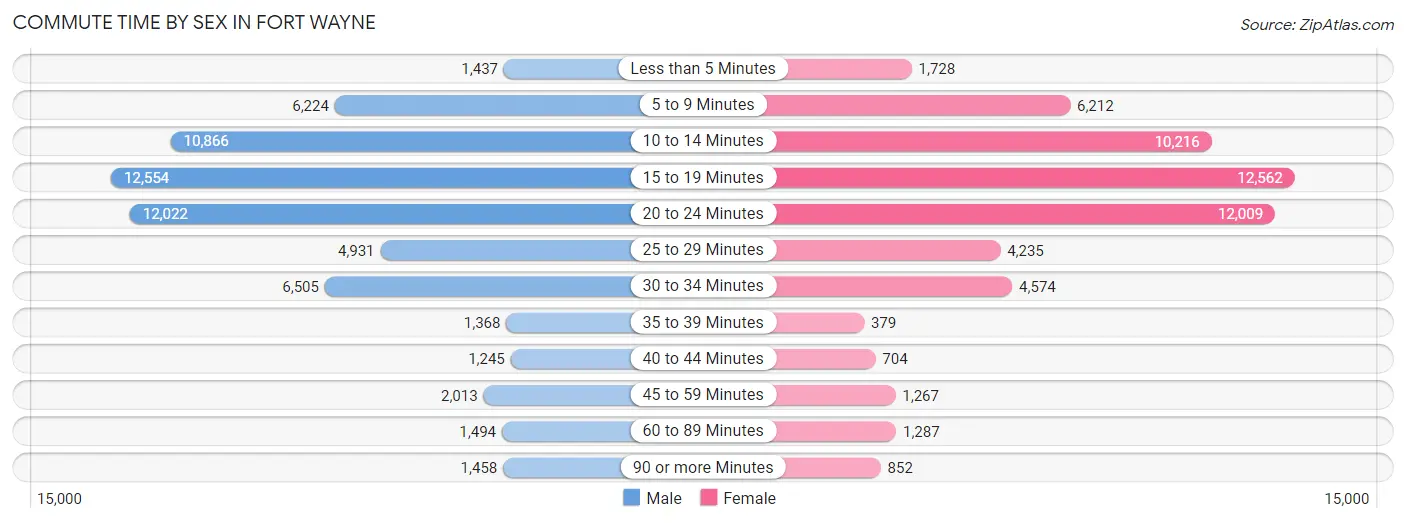
| Commute Time | Male | Female |
| Less than 5 Minutes | 1,437 (2.3%) | 1,728 (3.1%) |
| 5 to 9 Minutes | 6,224 (10.0%) | 6,212 (11.1%) |
| 10 to 14 Minutes | 10,866 (17.5%) | 10,216 (18.2%) |
| 15 to 19 Minutes | 12,554 (20.2%) | 12,562 (22.4%) |
| 20 to 24 Minutes | 12,022 (19.4%) | 12,009 (21.4%) |
| 25 to 29 Minutes | 4,931 (7.9%) | 4,235 (7.6%) |
| 30 to 34 Minutes | 6,505 (10.5%) | 4,574 (8.2%) |
| 35 to 39 Minutes | 1,368 (2.2%) | 379 (0.7%) |
| 40 to 44 Minutes | 1,245 (2.0%) | 704 (1.3%) |
| 45 to 59 Minutes | 2,013 (3.2%) | 1,267 (2.3%) |
| 60 to 89 Minutes | 1,494 (2.4%) | 1,287 (2.3%) |
| 90 or more Minutes | 1,458 (2.4%) | 852 (1.5%) |
Time of Departure to Work by Sex in Fort Wayne
The most frequent times of departure to work in Fort Wayne are 7:00 AM to 7:29 AM (8,133, 13.1%) for males and 7:30 AM to 7:59 AM (7,488, 13.4%) for females.
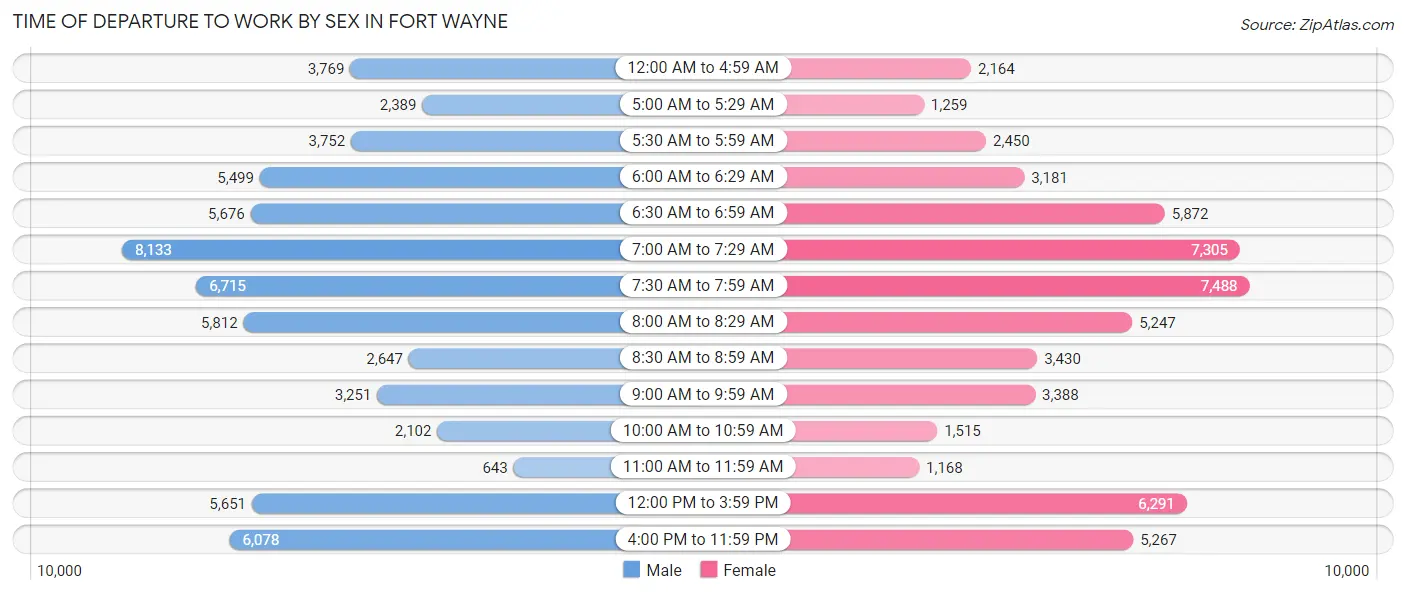
| Time of Departure | Male | Female |
| 12:00 AM to 4:59 AM | 3,769 (6.1%) | 2,164 (3.9%) |
| 5:00 AM to 5:29 AM | 2,389 (3.8%) | 1,259 (2.2%) |
| 5:30 AM to 5:59 AM | 3,752 (6.0%) | 2,450 (4.4%) |
| 6:00 AM to 6:29 AM | 5,499 (8.8%) | 3,181 (5.7%) |
| 6:30 AM to 6:59 AM | 5,676 (9.1%) | 5,872 (10.5%) |
| 7:00 AM to 7:29 AM | 8,133 (13.1%) | 7,305 (13.0%) |
| 7:30 AM to 7:59 AM | 6,715 (10.8%) | 7,488 (13.4%) |
| 8:00 AM to 8:29 AM | 5,812 (9.4%) | 5,247 (9.4%) |
| 8:30 AM to 8:59 AM | 2,647 (4.3%) | 3,430 (6.1%) |
| 9:00 AM to 9:59 AM | 3,251 (5.2%) | 3,388 (6.0%) |
| 10:00 AM to 10:59 AM | 2,102 (3.4%) | 1,515 (2.7%) |
| 11:00 AM to 11:59 AM | 643 (1.0%) | 1,168 (2.1%) |
| 12:00 PM to 3:59 PM | 5,651 (9.1%) | 6,291 (11.2%) |
| 4:00 PM to 11:59 PM | 6,078 (9.8%) | 5,267 (9.4%) |
| Total | 62,117 (100.0%) | 56,025 (100.0%) |
Housing Occupancy in Fort Wayne
Occupancy by Ownership in Fort Wayne
Of the total 107,764 dwellings in Fort Wayne, owner-occupied units account for 67,430 (62.6%), while renter-occupied units make up 40,334 (37.4%).
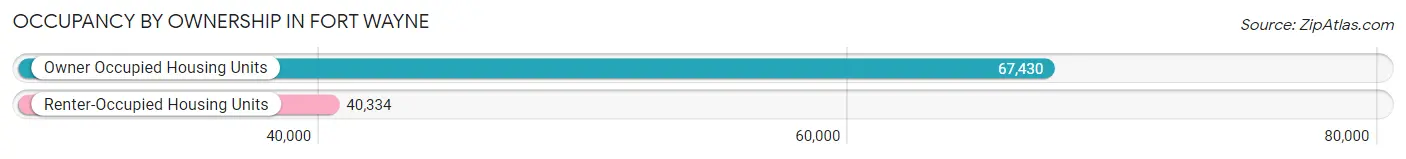
| Occupancy | # Housing Units | % Housing Units |
| Owner Occupied Housing Units | 67,430 | 62.6% |
| Renter-Occupied Housing Units | 40,334 | 37.4% |
| Total Occupied Housing Units | 107,764 | 100.0% |
Occupancy by Household Size in Fort Wayne
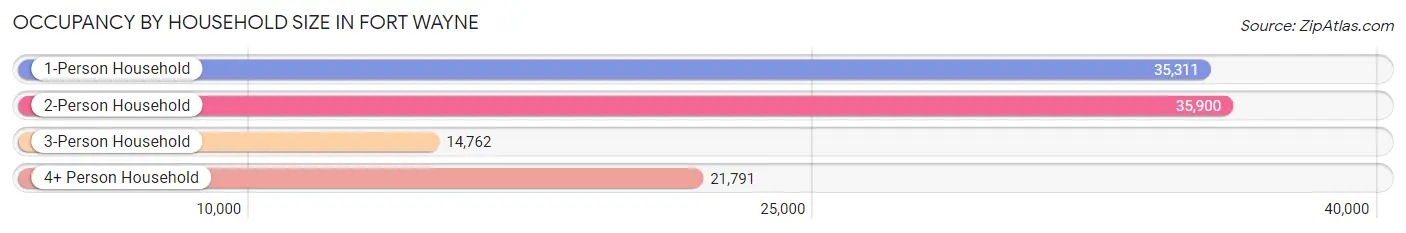
| Household Size | # Housing Units | % Housing Units |
| 1-Person Household | 35,311 | 32.8% |
| 2-Person Household | 35,900 | 33.3% |
| 3-Person Household | 14,762 | 13.7% |
| 4+ Person Household | 21,791 | 20.2% |
| Total Housing Units | 107,764 | 100.0% |
Occupancy by Ownership by Household Size in Fort Wayne
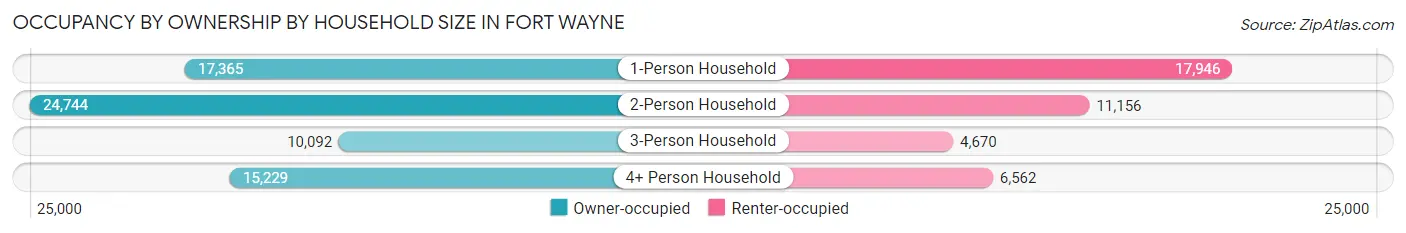
| Household Size | Owner-occupied | Renter-occupied |
| 1-Person Household | 17,365 (49.2%) | 17,946 (50.8%) |
| 2-Person Household | 24,744 (68.9%) | 11,156 (31.1%) |
| 3-Person Household | 10,092 (68.4%) | 4,670 (31.6%) |
| 4+ Person Household | 15,229 (69.9%) | 6,562 (30.1%) |
| Total Housing Units | 67,430 (62.6%) | 40,334 (37.4%) |
Occupancy by Educational Attainment in Fort Wayne
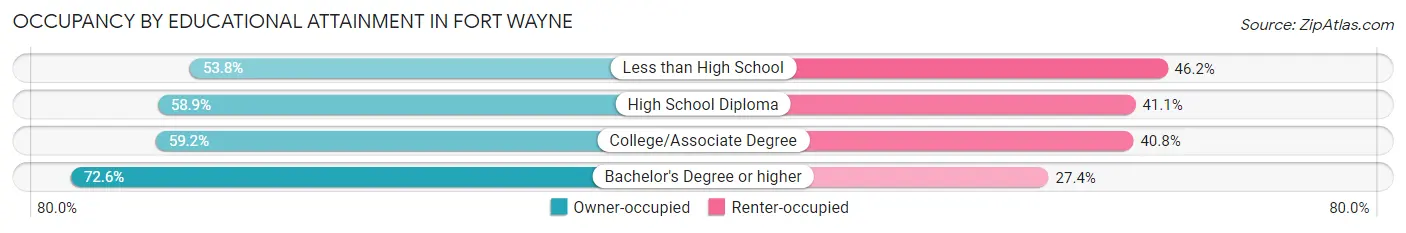
| Household Size | Owner-occupied | Renter-occupied |
| Less than High School | 5,547 (53.8%) | 4,769 (46.2%) |
| High School Diploma | 16,890 (58.9%) | 11,801 (41.1%) |
| College/Associate Degree | 21,798 (59.2%) | 15,027 (40.8%) |
| Bachelor's Degree or higher | 23,195 (72.6%) | 8,737 (27.4%) |
Occupancy by Age of Householder in Fort Wayne
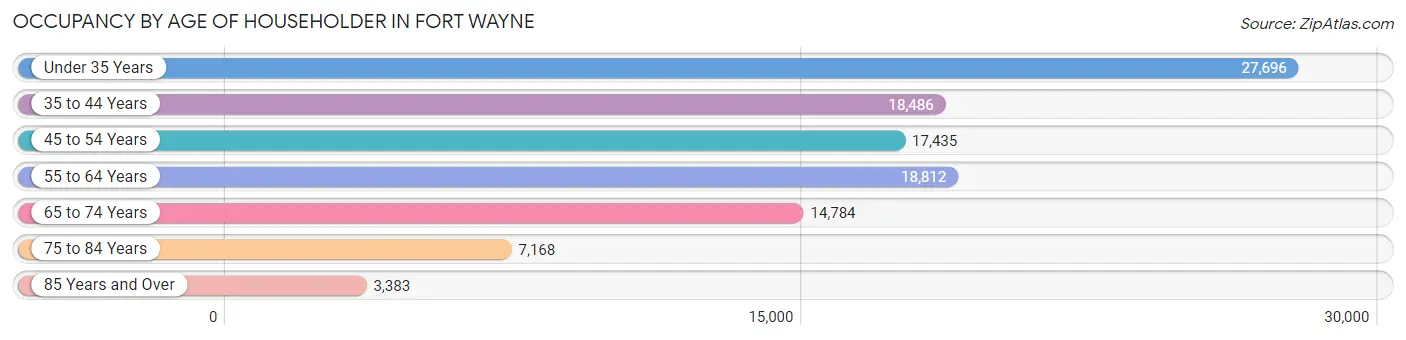
| Age Bracket | # Households | % Households |
| Under 35 Years | 27,696 | 25.7% |
| 35 to 44 Years | 18,486 | 17.2% |
| 45 to 54 Years | 17,435 | 16.2% |
| 55 to 64 Years | 18,812 | 17.5% |
| 65 to 74 Years | 14,784 | 13.7% |
| 75 to 84 Years | 7,168 | 6.7% |
| 85 Years and Over | 3,383 | 3.1% |
| Total | 107,764 | 100.0% |
Housing Finances in Fort Wayne
Median Income by Occupancy in Fort Wayne
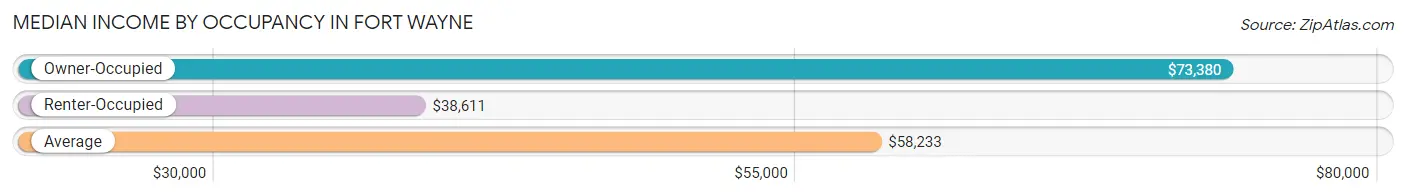
| Occupancy Type | # Households | Median Income |
| Owner-Occupied | 67,430 (62.6%) | $73,380 |
| Renter-Occupied | 40,334 (37.4%) | $38,611 |
| Average | 107,764 (100.0%) | $58,233 |
Occupancy by Householder Income Bracket in Fort Wayne
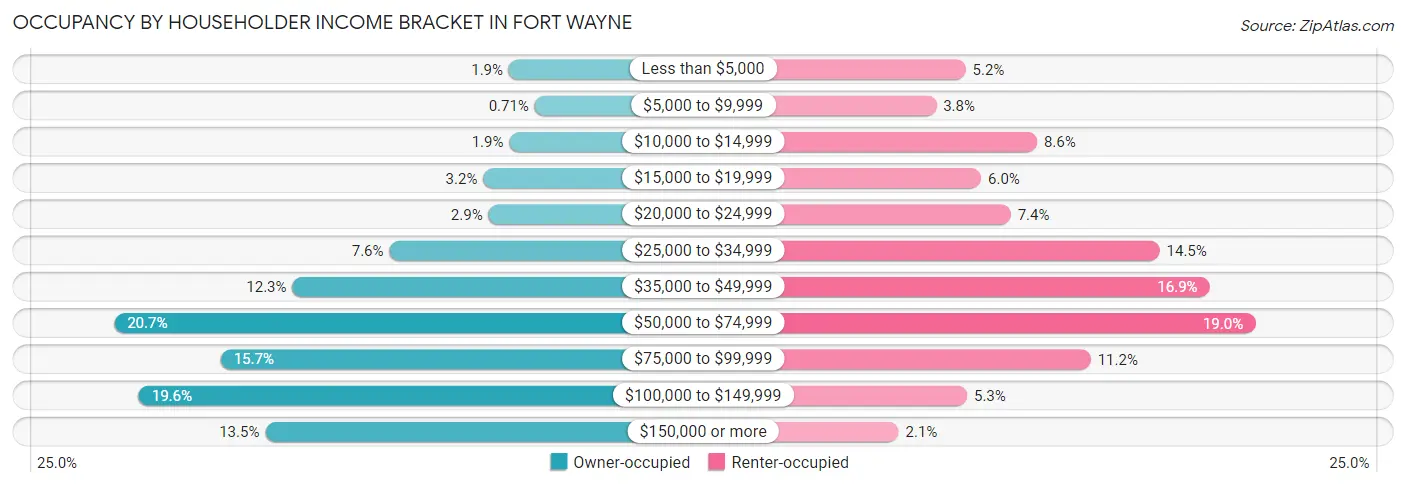
| Income Bracket | Owner-occupied | Renter-occupied |
| Less than $5,000 | 1,305 (1.9%) | 2,115 (5.2%) |
| $5,000 to $9,999 | 479 (0.7%) | 1,549 (3.8%) |
| $10,000 to $14,999 | 1,294 (1.9%) | 3,486 (8.6%) |
| $15,000 to $19,999 | 2,133 (3.2%) | 2,412 (6.0%) |
| $20,000 to $24,999 | 1,959 (2.9%) | 2,982 (7.4%) |
| $25,000 to $34,999 | 5,145 (7.6%) | 5,840 (14.5%) |
| $35,000 to $49,999 | 8,257 (12.2%) | 6,796 (16.9%) |
| $50,000 to $74,999 | 13,980 (20.7%) | 7,672 (19.0%) |
| $75,000 to $99,999 | 10,561 (15.7%) | 4,516 (11.2%) |
| $100,000 to $149,999 | 13,187 (19.6%) | 2,140 (5.3%) |
| $150,000 or more | 9,130 (13.5%) | 826 (2.1%) |
| Total | 67,430 (100.0%) | 40,334 (100.0%) |
Monthly Housing Cost Tiers in Fort Wayne
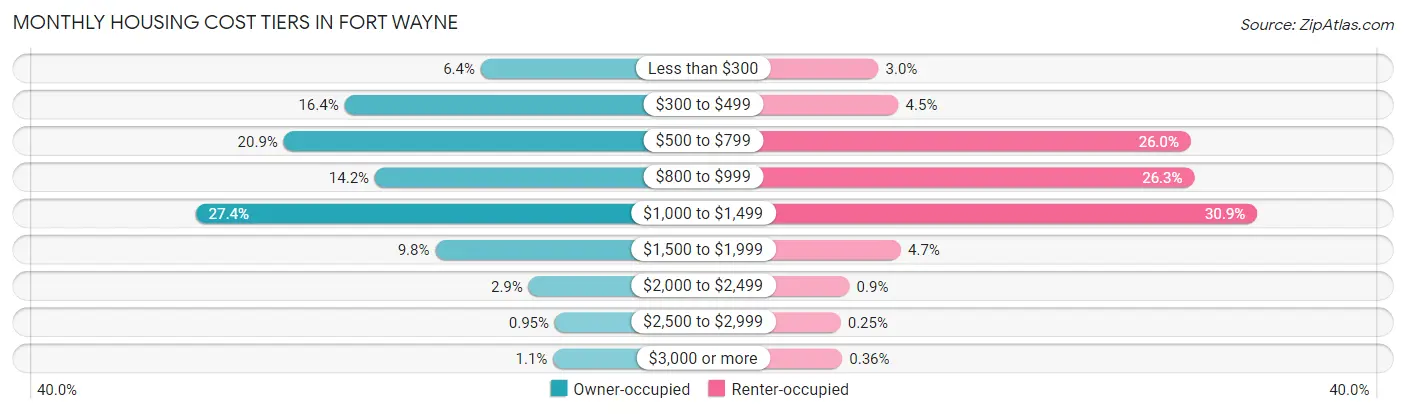
| Monthly Cost | Owner-occupied | Renter-occupied |
| Less than $300 | 4,316 (6.4%) | 1,224 (3.0%) |
| $300 to $499 | 11,087 (16.4%) | 1,818 (4.5%) |
| $500 to $799 | 14,107 (20.9%) | 10,494 (26.0%) |
| $800 to $999 | 9,574 (14.2%) | 10,600 (26.3%) |
| $1,000 to $1,499 | 18,475 (27.4%) | 12,466 (30.9%) |
| $1,500 to $1,999 | 6,572 (9.8%) | 1,892 (4.7%) |
| $2,000 to $2,499 | 1,942 (2.9%) | 365 (0.9%) |
| $2,500 to $2,999 | 638 (0.9%) | 102 (0.3%) |
| $3,000 or more | 719 (1.1%) | 146 (0.4%) |
| Total | 67,430 (100.0%) | 40,334 (100.0%) |
Physical Housing Characteristics in Fort Wayne
Housing Structures in Fort Wayne
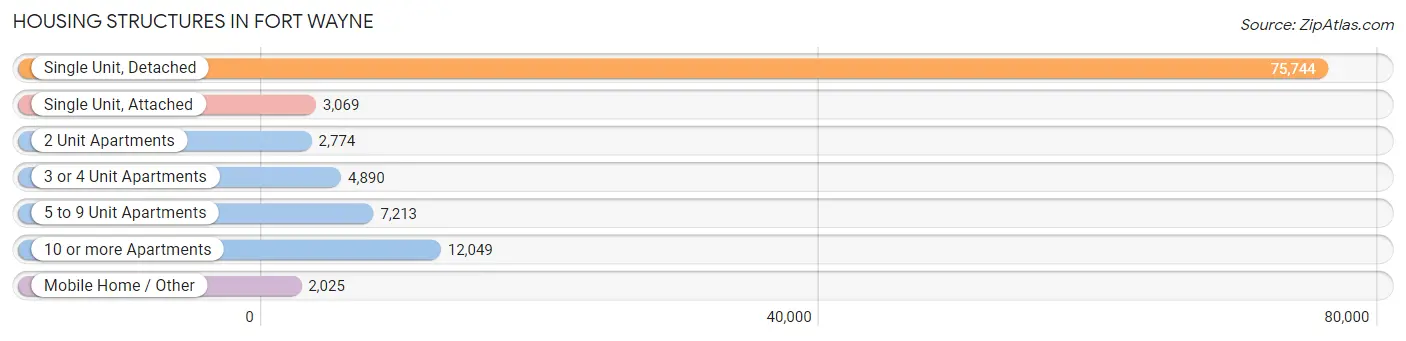
| Structure Type | # Housing Units | % Housing Units |
| Single Unit, Detached | 75,744 | 70.3% |
| Single Unit, Attached | 3,069 | 2.9% |
| 2 Unit Apartments | 2,774 | 2.6% |
| 3 or 4 Unit Apartments | 4,890 | 4.5% |
| 5 to 9 Unit Apartments | 7,213 | 6.7% |
| 10 or more Apartments | 12,049 | 11.2% |
| Mobile Home / Other | 2,025 | 1.9% |
| Total | 107,764 | 100.0% |
Housing Structures by Occupancy in Fort Wayne
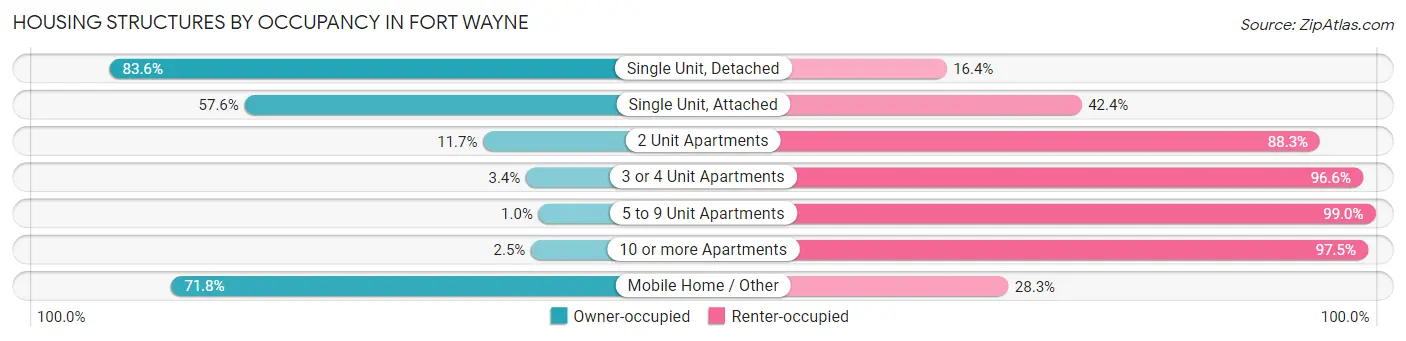
| Structure Type | Owner-occupied | Renter-occupied |
| Single Unit, Detached | 63,346 (83.6%) | 12,398 (16.4%) |
| Single Unit, Attached | 1,769 (57.6%) | 1,300 (42.4%) |
| 2 Unit Apartments | 324 (11.7%) | 2,450 (88.3%) |
| 3 or 4 Unit Apartments | 168 (3.4%) | 4,722 (96.6%) |
| 5 to 9 Unit Apartments | 73 (1.0%) | 7,140 (99.0%) |
| 10 or more Apartments | 297 (2.5%) | 11,752 (97.5%) |
| Mobile Home / Other | 1,453 (71.8%) | 572 (28.2%) |
| Total | 67,430 (62.6%) | 40,334 (37.4%) |
Housing Structures by Number of Rooms in Fort Wayne
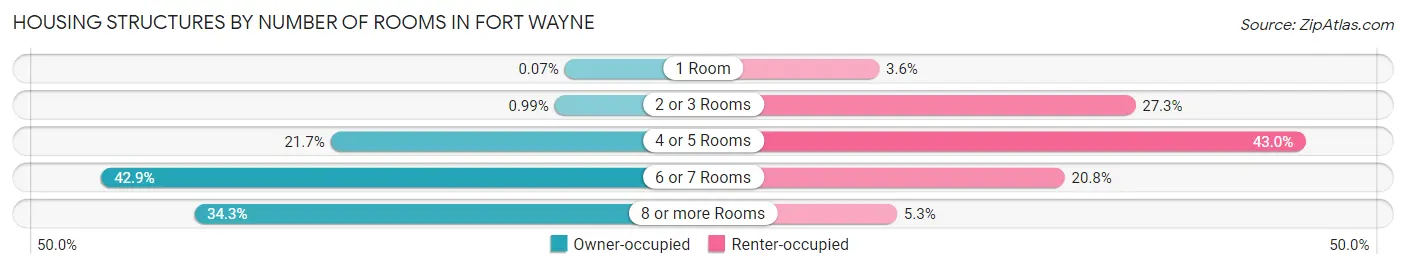
| Number of Rooms | Owner-occupied | Renter-occupied |
| 1 Room | 50 (0.1%) | 1,459 (3.6%) |
| 2 or 3 Rooms | 666 (1.0%) | 11,019 (27.3%) |
| 4 or 5 Rooms | 14,637 (21.7%) | 17,348 (43.0%) |
| 6 or 7 Rooms | 28,936 (42.9%) | 8,381 (20.8%) |
| 8 or more Rooms | 23,141 (34.3%) | 2,127 (5.3%) |
| Total | 67,430 (100.0%) | 40,334 (100.0%) |
Housing Structure by Heating Type in Fort Wayne
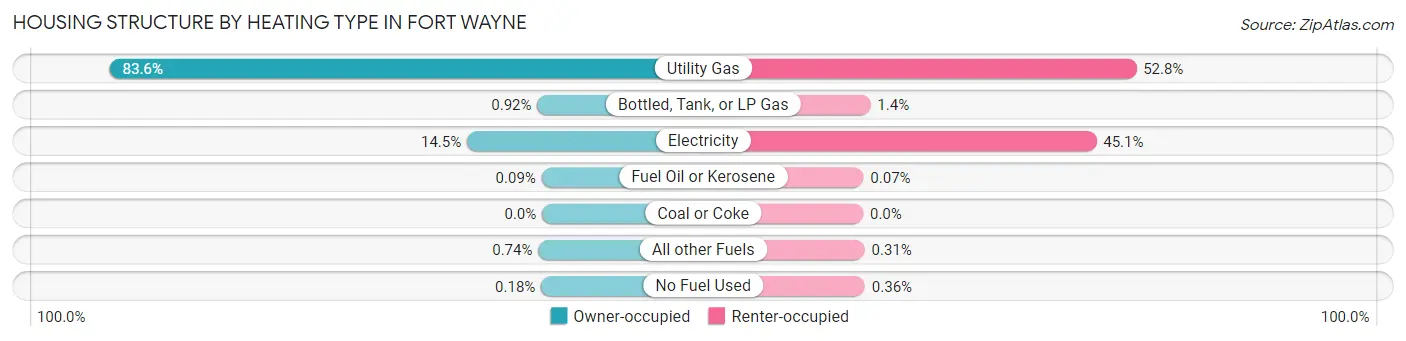
| Heating Type | Owner-occupied | Renter-occupied |
| Utility Gas | 56,351 (83.6%) | 21,287 (52.8%) |
| Bottled, Tank, or LP Gas | 620 (0.9%) | 571 (1.4%) |
| Electricity | 9,778 (14.5%) | 18,177 (45.1%) |
| Fuel Oil or Kerosene | 61 (0.1%) | 29 (0.1%) |
| Coal or Coke | 0 (0.0%) | 0 (0.0%) |
| All other Fuels | 496 (0.7%) | 124 (0.3%) |
| No Fuel Used | 124 (0.2%) | 146 (0.4%) |
| Total | 67,430 (100.0%) | 40,334 (100.0%) |
Household Vehicle Usage in Fort Wayne
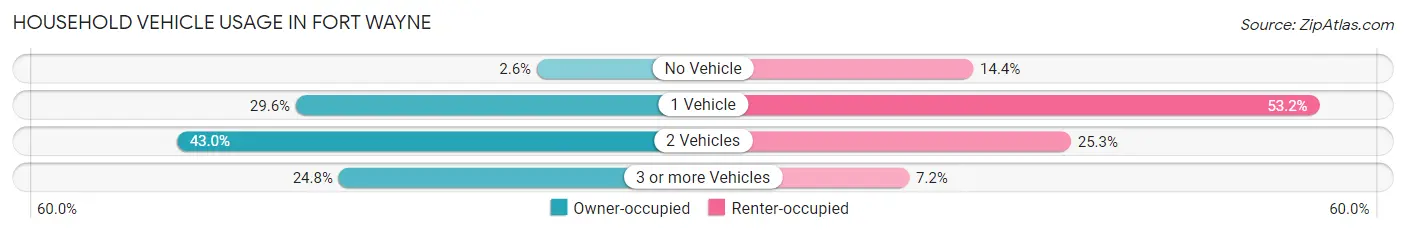
| Vehicles per Household | Owner-occupied | Renter-occupied |
| No Vehicle | 1,763 (2.6%) | 5,791 (14.4%) |
| 1 Vehicle | 19,964 (29.6%) | 21,439 (53.1%) |
| 2 Vehicles | 28,971 (43.0%) | 10,204 (25.3%) |
| 3 or more Vehicles | 16,732 (24.8%) | 2,900 (7.2%) |
| Total | 67,430 (100.0%) | 40,334 (100.0%) |
Real Estate & Mortgages in Fort Wayne
Real Estate and Mortgage Overview in Fort Wayne
| Characteristic | Without Mortgage | With Mortgage |
| Housing Units | 23,837 | 43,593 |
| Median Property Value | $141,400 | $157,200 |
| Median Household Income | $56,742 | $6,773 |
| Monthly Housing Costs | $448 | $654 |
| Real Estate Taxes | $1,250 | $1,551 |
Property Value by Mortgage Status in Fort Wayne
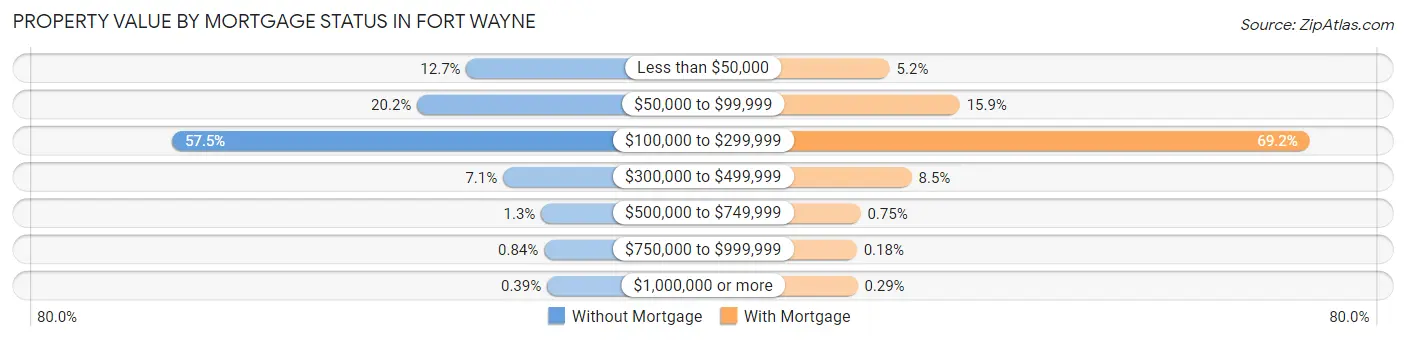
| Property Value | Without Mortgage | With Mortgage |
| Less than $50,000 | 3,022 (12.7%) | 2,268 (5.2%) |
| $50,000 to $99,999 | 4,811 (20.2%) | 6,917 (15.9%) |
| $100,000 to $299,999 | 13,715 (57.5%) | 30,153 (69.2%) |
| $300,000 to $499,999 | 1,689 (7.1%) | 3,721 (8.5%) |
| $500,000 to $749,999 | 305 (1.3%) | 329 (0.7%) |
| $750,000 to $999,999 | 201 (0.8%) | 79 (0.2%) |
| $1,000,000 or more | 94 (0.4%) | 126 (0.3%) |
| Total | 23,837 (100.0%) | 43,593 (100.0%) |
Household Income by Mortgage Status in Fort Wayne
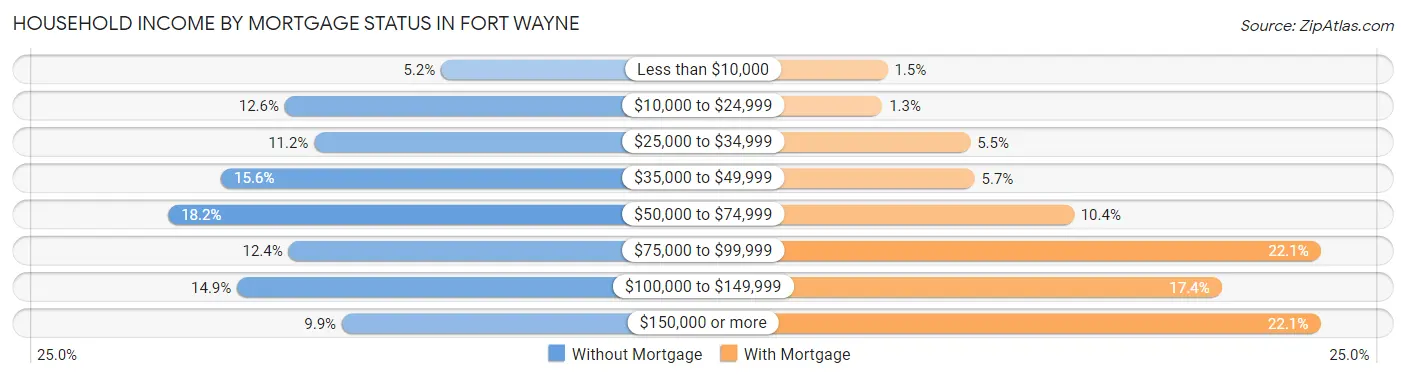
| Household Income | Without Mortgage | With Mortgage |
| Less than $10,000 | 1,232 (5.2%) | 663 (1.5%) |
| $10,000 to $24,999 | 3,007 (12.6%) | 552 (1.3%) |
| $25,000 to $34,999 | 2,673 (11.2%) | 2,379 (5.5%) |
| $35,000 to $49,999 | 3,729 (15.6%) | 2,472 (5.7%) |
| $50,000 to $74,999 | 4,329 (18.2%) | 4,528 (10.4%) |
| $75,000 to $99,999 | 2,964 (12.4%) | 9,651 (22.1%) |
| $100,000 to $149,999 | 3,546 (14.9%) | 7,597 (17.4%) |
| $150,000 or more | 2,357 (9.9%) | 9,641 (22.1%) |
| Total | 23,837 (100.0%) | 43,593 (100.0%) |
Property Value to Household Income Ratio in Fort Wayne
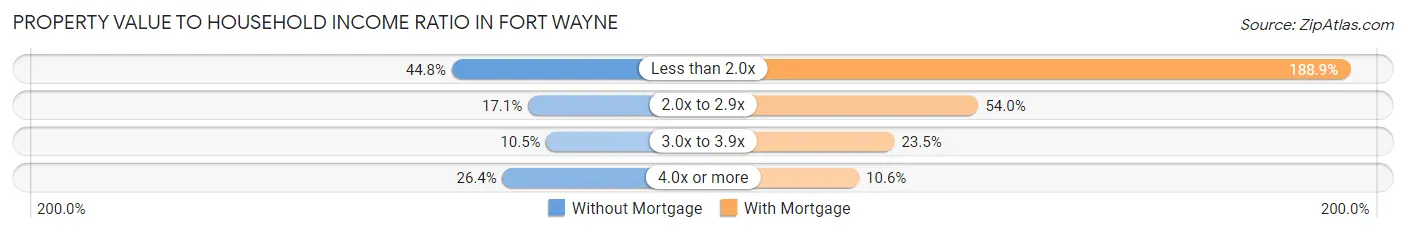
| Value-to-Income Ratio | Without Mortgage | With Mortgage |
| Less than 2.0x | 10,687 (44.8%) | 82,353 (188.9%) |
| 2.0x to 2.9x | 4,084 (17.1%) | 23,528 (54.0%) |
| 3.0x to 3.9x | 2,494 (10.5%) | 10,224 (23.4%) |
| 4.0x or more | 6,286 (26.4%) | 4,631 (10.6%) |
| Total | 23,837 (100.0%) | 43,593 (100.0%) |
Real Estate Taxes by Mortgage Status in Fort Wayne
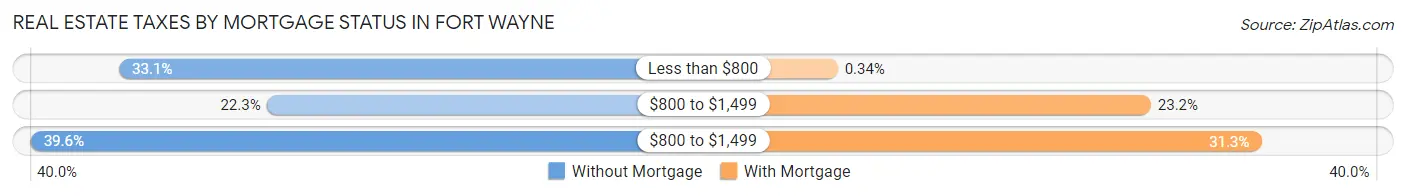
| Property Taxes | Without Mortgage | With Mortgage |
| Less than $800 | 7,888 (33.1%) | 149 (0.3%) |
| $800 to $1,499 | 5,322 (22.3%) | 10,121 (23.2%) |
| $800 to $1,499 | 9,427 (39.6%) | 13,642 (31.3%) |
| Total | 23,837 (100.0%) | 43,593 (100.0%) |
Health & Disability in Fort Wayne
Health Insurance Coverage by Age in Fort Wayne
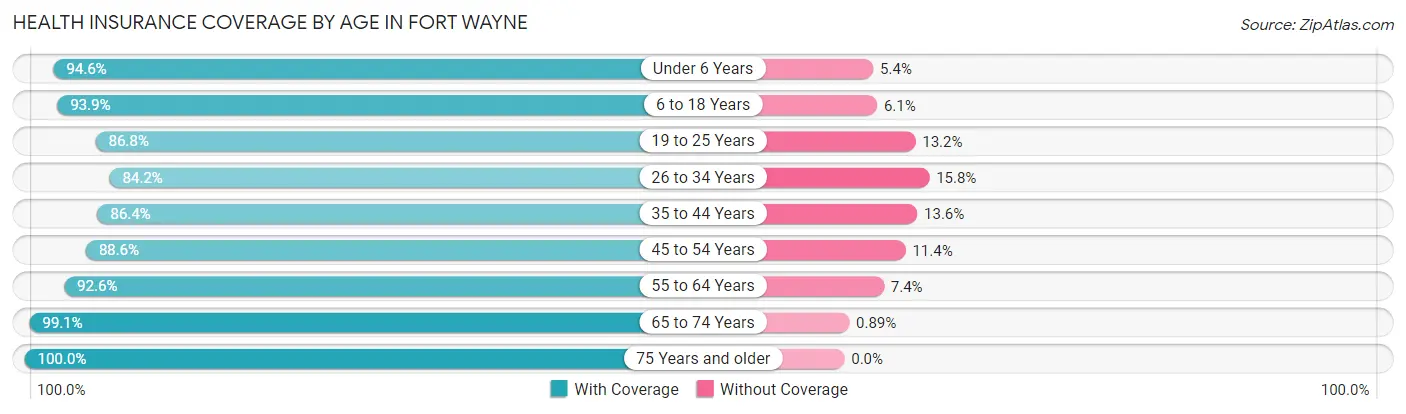
| Age Bracket | With Coverage | Without Coverage |
| Under 6 Years | 20,811 (94.6%) | 1,184 (5.4%) |
| 6 to 18 Years | 42,975 (93.9%) | 2,788 (6.1%) |
| 19 to 25 Years | 24,638 (86.8%) | 3,759 (13.2%) |
| 26 to 34 Years | 29,677 (84.2%) | 5,582 (15.8%) |
| 35 to 44 Years | 27,893 (86.4%) | 4,382 (13.6%) |
| 45 to 54 Years | 26,569 (88.6%) | 3,423 (11.4%) |
| 55 to 64 Years | 28,383 (92.6%) | 2,262 (7.4%) |
| 65 to 74 Years | 22,157 (99.1%) | 198 (0.9%) |
| 75 Years and older | 14,958 (100.0%) | 0 (0.0%) |
| Total | 238,061 (91.0%) | 23,578 (9.0%) |
Health Insurance Coverage by Citizenship Status in Fort Wayne
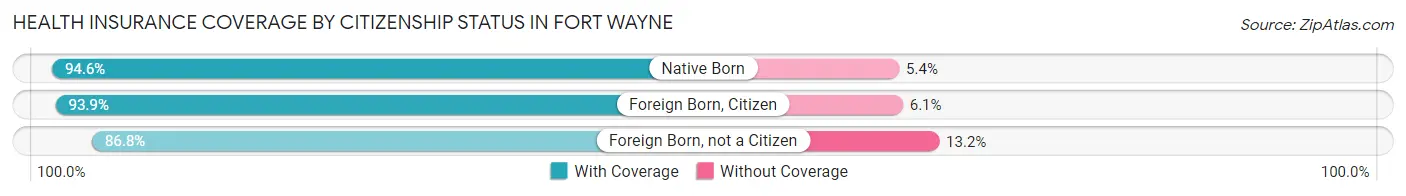
| Citizenship Status | With Coverage | Without Coverage |
| Native Born | 20,811 (94.6%) | 1,184 (5.4%) |
| Foreign Born, Citizen | 42,975 (93.9%) | 2,788 (6.1%) |
| Foreign Born, not a Citizen | 24,638 (86.8%) | 3,759 (13.2%) |
Health Insurance Coverage by Household Income in Fort Wayne
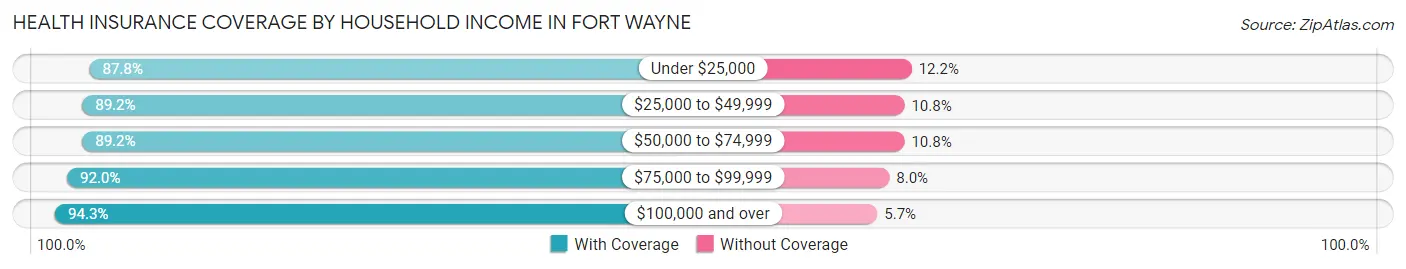
| Household Income | With Coverage | Without Coverage |
| Under $25,000 | 30,094 (87.8%) | 4,170 (12.2%) |
| $25,000 to $49,999 | 47,477 (89.2%) | 5,755 (10.8%) |
| $50,000 to $74,999 | 48,458 (89.2%) | 5,871 (10.8%) |
| $75,000 to $99,999 | 37,171 (92.0%) | 3,217 (8.0%) |
| $100,000 and over | 72,915 (94.3%) | 4,436 (5.7%) |
Public vs Private Health Insurance Coverage by Age in Fort Wayne
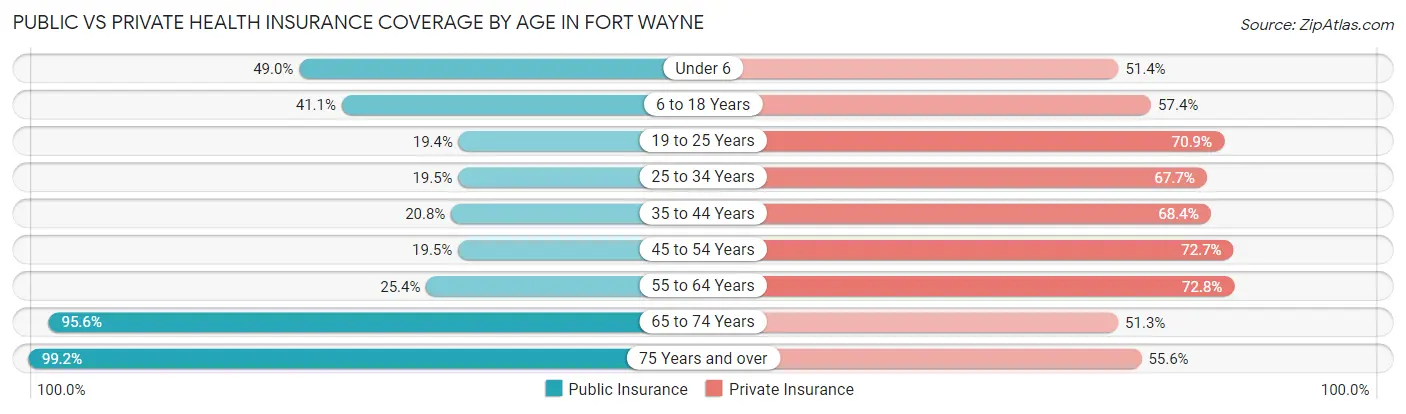
| Age Bracket | Public Insurance | Private Insurance |
| Under 6 | 10,784 (49.0%) | 11,295 (51.3%) |
| 6 to 18 Years | 18,817 (41.1%) | 26,277 (57.4%) |
| 19 to 25 Years | 5,510 (19.4%) | 20,135 (70.9%) |
| 25 to 34 Years | 6,865 (19.5%) | 23,873 (67.7%) |
| 35 to 44 Years | 6,719 (20.8%) | 22,086 (68.4%) |
| 45 to 54 Years | 5,860 (19.5%) | 21,799 (72.7%) |
| 55 to 64 Years | 7,795 (25.4%) | 22,315 (72.8%) |
| 65 to 74 Years | 21,360 (95.6%) | 11,468 (51.3%) |
| 75 Years and over | 14,841 (99.2%) | 8,319 (55.6%) |
| Total | 98,551 (37.7%) | 167,567 (64.0%) |
Disability Status by Sex by Age in Fort Wayne
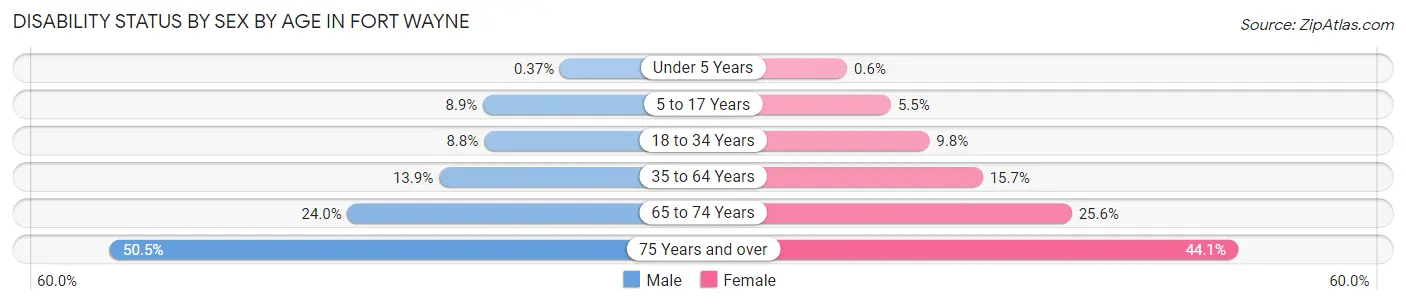
| Age Bracket | Male | Female |
| Under 5 Years | 35 (0.4%) | 54 (0.6%) |
| 5 to 17 Years | 2,095 (8.9%) | 1,216 (5.5%) |
| 18 to 34 Years | 2,951 (8.8%) | 3,306 (9.8%) |
| 35 to 64 Years | 6,254 (13.9%) | 7,493 (15.7%) |
| 65 to 74 Years | 2,454 (24.0%) | 3,110 (25.6%) |
| 75 Years and over | 2,961 (50.5%) | 4,008 (44.1%) |
Disability Class by Sex by Age in Fort Wayne
Disability Class: Hearing Difficulty
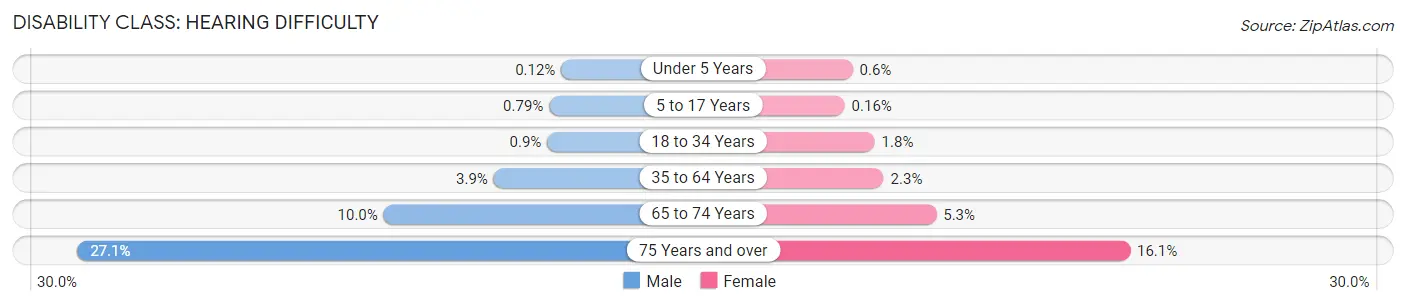
| Age Bracket | Male | Female |
| Under 5 Years | 11 (0.1%) | 54 (0.6%) |
| 5 to 17 Years | 186 (0.8%) | 35 (0.2%) |
| 18 to 34 Years | 301 (0.9%) | 621 (1.8%) |
| 35 to 64 Years | 1,750 (3.9%) | 1,111 (2.3%) |
| 65 to 74 Years | 1,022 (10.0%) | 639 (5.3%) |
| 75 Years and over | 1,588 (27.1%) | 1,459 (16.1%) |
Disability Class: Vision Difficulty
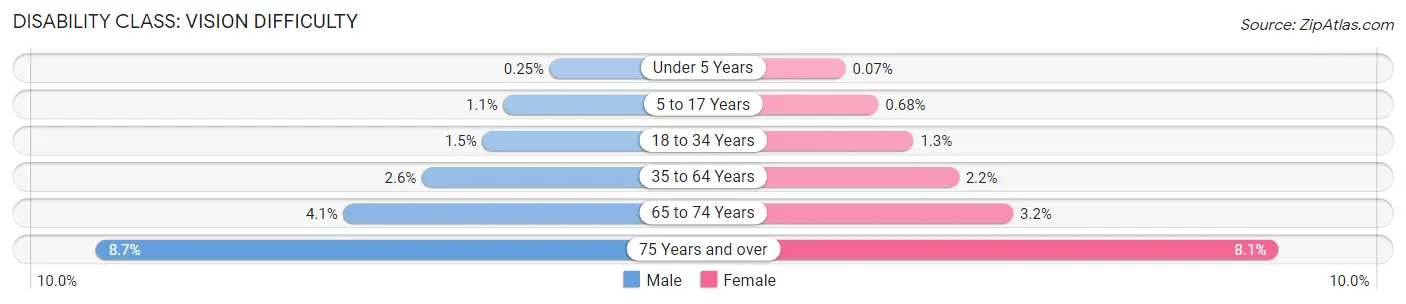
| Age Bracket | Male | Female |
| Under 5 Years | 24 (0.3%) | 6 (0.1%) |
| 5 to 17 Years | 260 (1.1%) | 151 (0.7%) |
| 18 to 34 Years | 501 (1.5%) | 450 (1.3%) |
| 35 to 64 Years | 1,184 (2.6%) | 1,035 (2.2%) |
| 65 to 74 Years | 417 (4.1%) | 386 (3.2%) |
| 75 Years and over | 509 (8.7%) | 736 (8.1%) |
Disability Class: Cognitive Difficulty
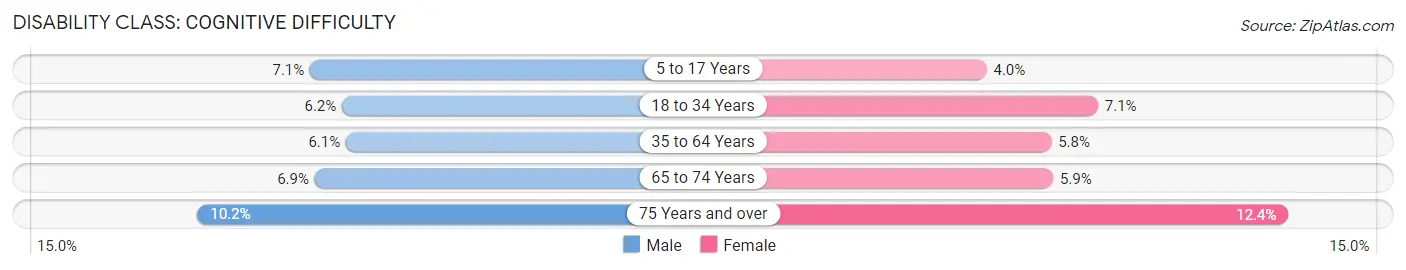
| Age Bracket | Male | Female |
| 5 to 17 Years | 1,654 (7.0%) | 893 (4.0%) |
| 18 to 34 Years | 2,061 (6.2%) | 2,414 (7.1%) |
| 35 to 64 Years | 2,730 (6.0%) | 2,783 (5.8%) |
| 65 to 74 Years | 707 (6.9%) | 714 (5.9%) |
| 75 Years and over | 598 (10.2%) | 1,130 (12.4%) |
Disability Class: Ambulatory Difficulty
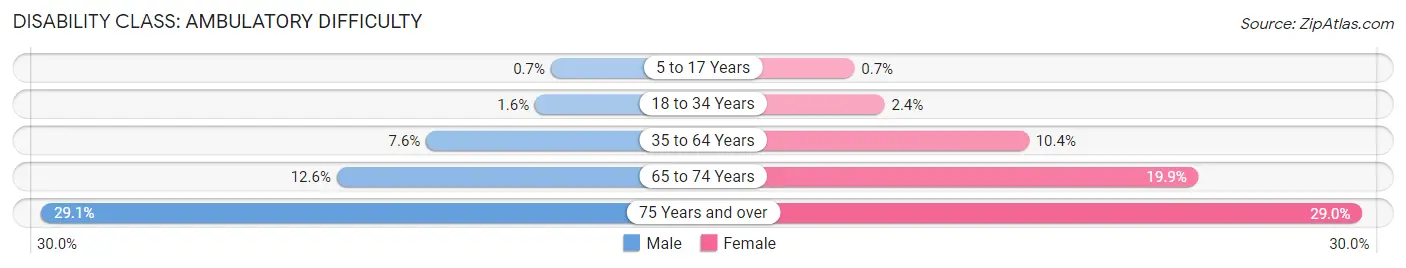
| Age Bracket | Male | Female |
| 5 to 17 Years | 164 (0.7%) | 156 (0.7%) |
| 18 to 34 Years | 527 (1.6%) | 805 (2.4%) |
| 35 to 64 Years | 3,450 (7.6%) | 4,974 (10.4%) |
| 65 to 74 Years | 1,289 (12.6%) | 2,413 (19.9%) |
| 75 Years and over | 1,706 (29.1%) | 2,635 (29.0%) |
Disability Class: Self-Care Difficulty
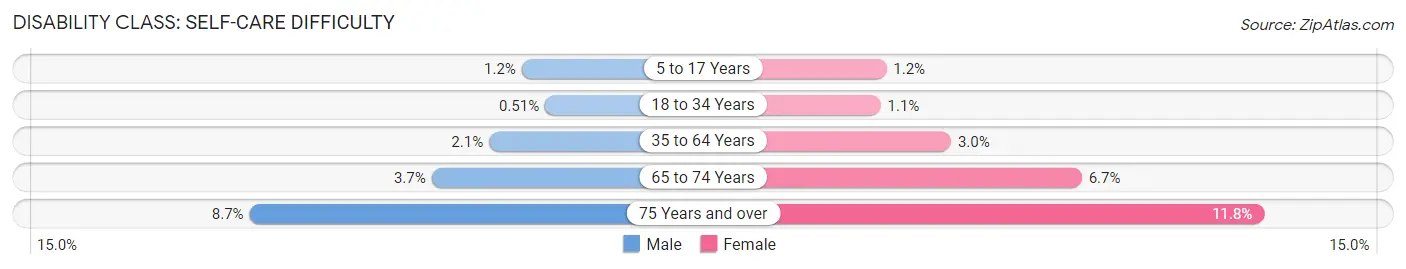
| Age Bracket | Male | Female |
| 5 to 17 Years | 273 (1.2%) | 274 (1.2%) |
| 18 to 34 Years | 171 (0.5%) | 365 (1.1%) |
| 35 to 64 Years | 935 (2.1%) | 1,454 (3.0%) |
| 65 to 74 Years | 375 (3.7%) | 811 (6.7%) |
| 75 Years and over | 513 (8.7%) | 1,069 (11.8%) |
Technology Access in Fort Wayne
Computing Device Access in Fort Wayne
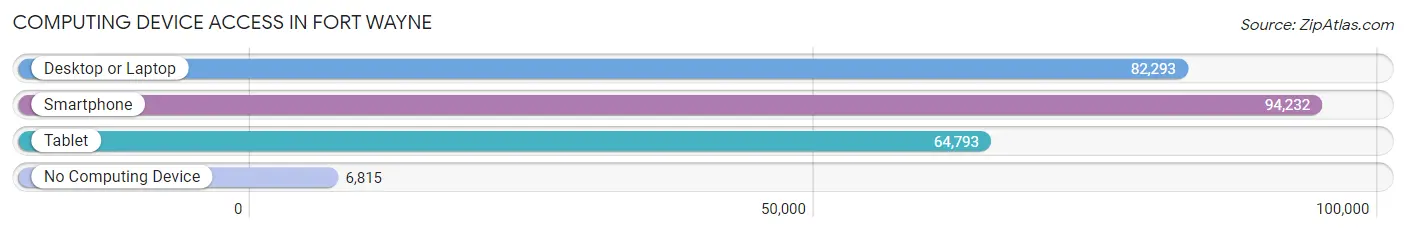
| Device Type | # Households | % Households |
| Desktop or Laptop | 82,293 | 76.4% |
| Smartphone | 94,232 | 87.4% |
| Tablet | 64,793 | 60.1% |
| No Computing Device | 6,815 | 6.3% |
| Total | 107,764 | 100.0% |
Internet Access in Fort Wayne
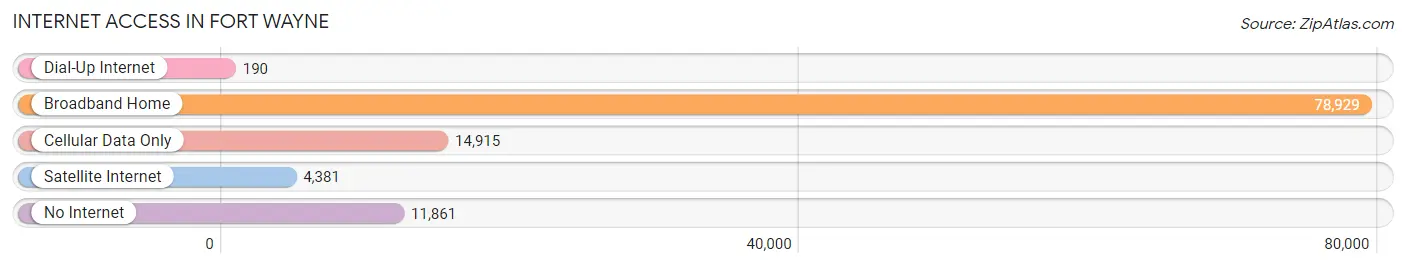
| Internet Type | # Households | % Households |
| Dial-Up Internet | 190 | 0.2% |
| Broadband Home | 78,929 | 73.2% |
| Cellular Data Only | 14,915 | 13.8% |
| Satellite Internet | 4,381 | 4.1% |
| No Internet | 11,861 | 11.0% |
| Total | 107,764 | 100.0% |
Fort Wayne Summary
Fort Wayne, Indiana is the second largest city in the state and the 77th largest city in the United States. It is located in northeastern Indiana, along the banks of the Maumee River and is the county seat of Allen County. The city has a population of 253,691 as of the 2019 census, making it the second most populous city in Indiana after Indianapolis.
History
The area that is now Fort Wayne was first inhabited by the Miami tribe of Native Americans. The first European settlers arrived in the area in 1790 and established a trading post. The settlement was named Fort Wayne after General “Mad” Anthony Wayne, who had led the American forces to victory in the Battle of Fallen Timbers in 1794.
In 1819, Fort Wayne was officially incorporated as a city. The city quickly grew and by the mid-1800s, it was a major transportation hub, with several railroads and canals connecting it to other parts of the country. The city also became a major industrial center, with several factories and mills being established in the area.
In the late 1800s, Fort Wayne became a major center for the automotive industry, with several car companies setting up shop in the city. The city also became a major center for the defense industry during World War II, with several military bases being established in the area.
Geography
Fort Wayne is located in northeastern Indiana, along the banks of the Maumee River. The city is situated in the Tipton Till Plain, a flat, low-lying area of the Midwest. The city is surrounded by several small lakes and rivers, including the St. Joseph, St. Marys, and St. Josephs rivers.
The city has a total area of 109.3 square miles, of which 107.3 square miles is land and 2.0 square miles is water. The city has a humid continental climate, with hot, humid summers and cold, snowy winters.
Economy
Fort Wayne has a diversified economy, with several major industries. The city is home to several major companies, including Steel Dynamics, Lincoln Financial Group, and Do it Best Corp. The city is also home to several major healthcare providers, including Parkview Health, Lutheran Health Network, and Dupont Hospital.
The city is also home to several major educational institutions, including Indiana University-Purdue University Fort Wayne, Indiana Institute of Technology, and the University of Saint Francis.
Demographics
As of the 2019 census, Fort Wayne had a population of 253,691. The city has a population density of 2,346 people per square mile. The racial makeup of the city is 79.2% White, 13.3% African American, 0.5% Native American, 2.2% Asian, and 4.8% from other races.
The median household income in Fort Wayne is $45,945, and the median family income is $54,945. The city has a poverty rate of 17.3%. The largest employers in the city are Parkview Health, Steel Dynamics, and Lincoln Financial Group.
Common Questions
What is Per Capita Income in Fort Wayne?
Per Capita income in Fort Wayne is $31,910.
What is the Median Family Income in Fort Wayne?
Median Family Income in Fort Wayne is $72,419.
What is the Median Household income in Fort Wayne?
Median Household Income in Fort Wayne is $58,233.
What is Income or Wage Gap in Fort Wayne?
Income or Wage Gap in Fort Wayne is 29.8%.
Women in Fort Wayne earn 70.2 cents for every dollar earned by a man.
What is Family Income Deficit in Fort Wayne?
Family Income Deficit in Fort Wayne is $11,088.
Families that are below poverty line in Fort Wayne earn $11,088 less on average than the poverty threshold level.
What is Inequality or Gini Index in Fort Wayne?
Inequality or Gini Index in Fort Wayne is 0.44.
What is the Total Population of Fort Wayne?
Total Population of Fort Wayne is 264,514.
What is the Total Male Population of Fort Wayne?
Total Male Population of Fort Wayne is 129,178.
What is the Total Female Population of Fort Wayne?
Total Female Population of Fort Wayne is 135,336.
What is the Ratio of Males per 100 Females in Fort Wayne?
There are 95.45 Males per 100 Females in Fort Wayne.
What is the Ratio of Females per 100 Males in Fort Wayne?
There are 104.77 Females per 100 Males in Fort Wayne.
What is the Median Population Age in Fort Wayne?
Median Population Age in Fort Wayne is 35.1 Years.
What is the Average Family Size in Fort Wayne
Average Family Size in Fort Wayne is 3.1 People.
What is the Average Household Size in Fort Wayne
Average Household Size in Fort Wayne is 2.4 People.
How Large is the Labor Force in Fort Wayne?
There are 137,518 People in the Labor Forcein in Fort Wayne.
What is the Percentage of People in the Labor Force in Fort Wayne?
66.2% of People are in the Labor Force in Fort Wayne.
What is the Unemployment Rate in Fort Wayne?
Unemployment Rate in Fort Wayne is 5.8%.