Urban Honolulu, HI Map & Demographics
Urban Honolulu Map
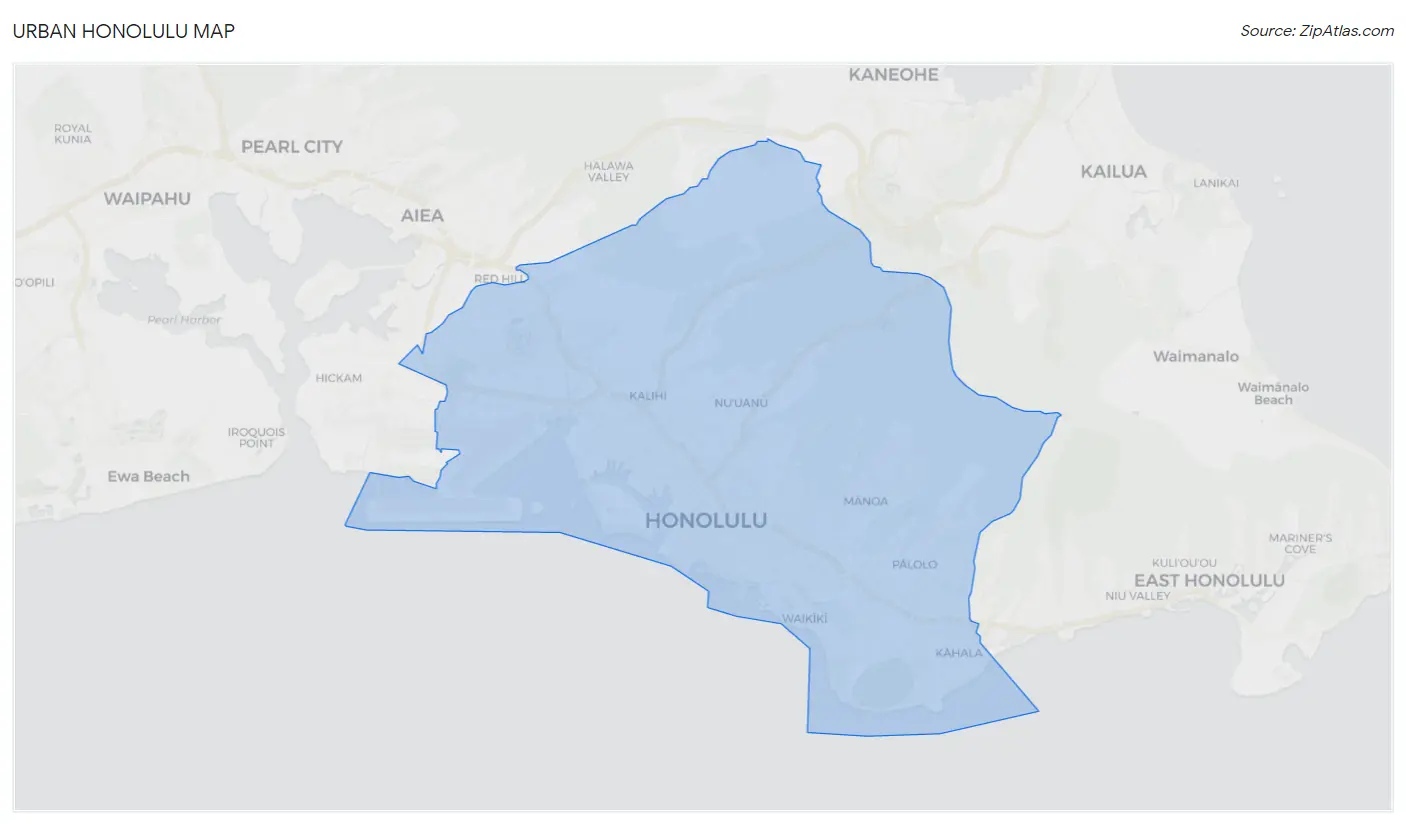
Urban Honolulu Overview
$45,784
PER CAPITA INCOME
$106,192
AVG FAMILY INCOME
$82,772
AVG HOUSEHOLD INCOME
21.2%
WAGE / INCOME GAP [ % ]
78.8¢/ $1
WAGE / INCOME GAP [ $ ]
$10,959
FAMILY INCOME DEFICIT
0.48
INEQUALITY / GINI INDEX
348,547
TOTAL POPULATION
175,554
MALE POPULATION
172,993
FEMALE POPULATION
101.48
MALES / 100 FEMALES
98.54
FEMALES / 100 MALES
42.5
MEDIAN AGE
3.3
AVG FAMILY SIZE
2.5
AVG HOUSEHOLD SIZE
192,360
LABOR FORCE [ PEOPLE ]
64.8%
PERCENT IN LABOR FORCE
5.1%
UNEMPLOYMENT RATE
Income in Urban Honolulu
Income Overview in Urban Honolulu
Per Capita Income in Urban Honolulu is $45,784, while median incomes of families and households are $106,192 and $82,772 respectively.
| Characteristic | Number | Measure |
| Per Capita Income | 348,547 | $45,784 |
| Median Family Income | 76,879 | $106,192 |
| Mean Family Income | 76,879 | $138,634 |
| Median Household Income | 134,264 | $82,772 |
| Mean Household Income | 134,264 | $115,513 |
| Income Deficit | 76,879 | $10,959 |
| Wage / Income Gap (%) | 348,547 | 21.19% |
| Wage / Income Gap ($) | 348,547 | 78.81¢ per $1 |
| Gini / Inequality Index | 348,547 | 0.48 |
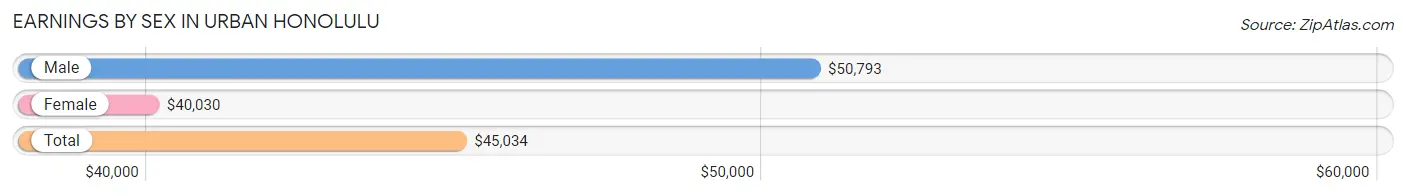
Earnings by Sex in Urban Honolulu
Average Earnings in Urban Honolulu are $45,034, $50,793 for men and $40,030 for women, a difference of 21.2%.
| Sex | Number | Average Earnings |
| Male | 105,695 (53.1%) | $50,793 |
| Female | 93,234 (46.9%) | $40,030 |
| Total | 198,929 (100.0%) | $45,034 |
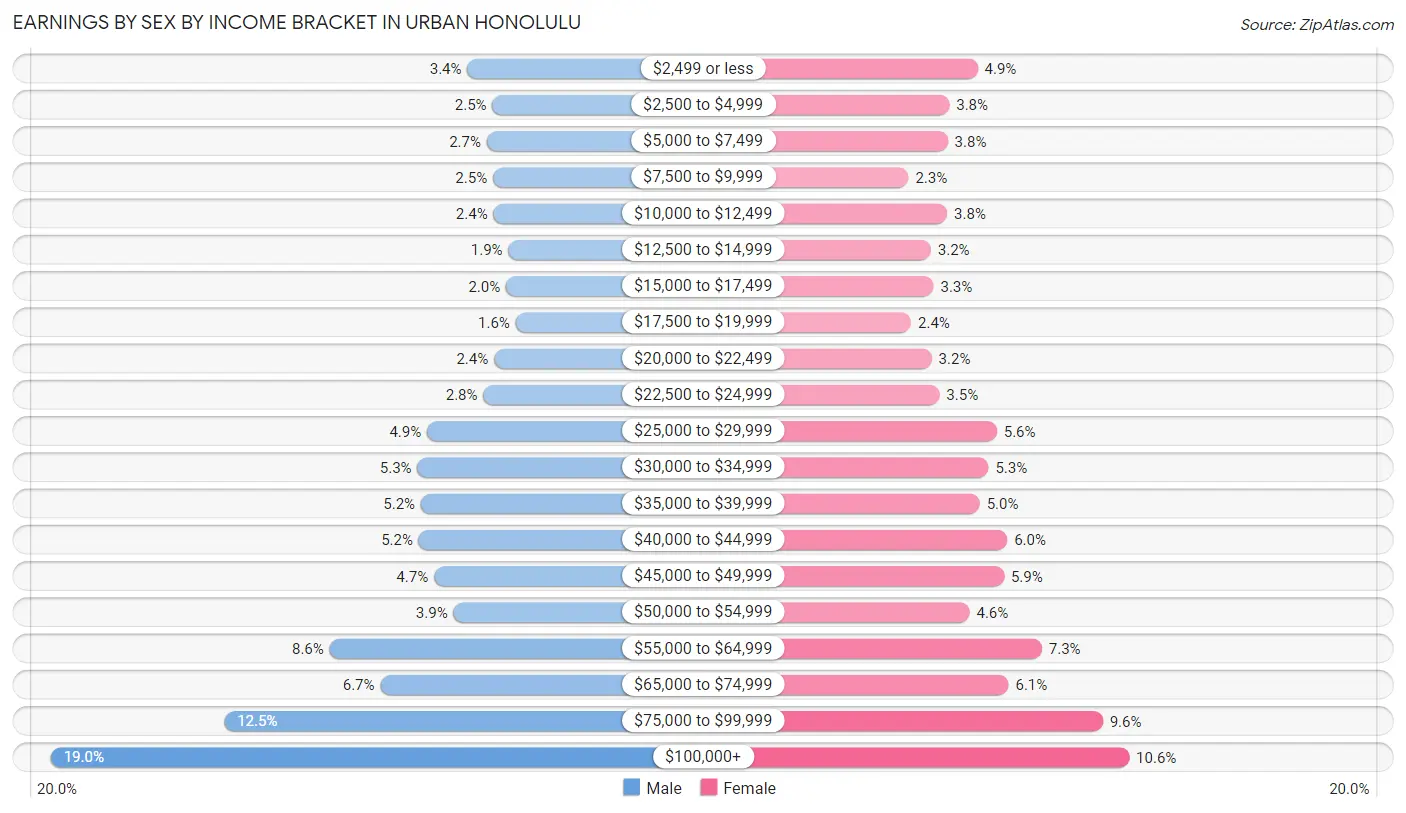
Earnings by Sex by Income Bracket in Urban Honolulu
The most common earnings brackets in Urban Honolulu are $100,000+ for men (20,102 | 19.0%) and $100,000+ for women (9,864 | 10.6%).
| Income | Male | Female |
| $2,499 or less | 3,605 (3.4%) | 4,564 (4.9%) |
| $2,500 to $4,999 | 2,606 (2.5%) | 3,582 (3.8%) |
| $5,000 to $7,499 | 2,830 (2.7%) | 3,528 (3.8%) |
| $7,500 to $9,999 | 2,587 (2.5%) | 2,158 (2.3%) |
| $10,000 to $12,499 | 2,571 (2.4%) | 3,502 (3.8%) |
| $12,500 to $14,999 | 1,981 (1.9%) | 2,941 (3.2%) |
| $15,000 to $17,499 | 2,067 (2.0%) | 3,028 (3.3%) |
| $17,500 to $19,999 | 1,695 (1.6%) | 2,243 (2.4%) |
| $20,000 to $22,499 | 2,546 (2.4%) | 2,964 (3.2%) |
| $22,500 to $24,999 | 2,965 (2.8%) | 3,236 (3.5%) |
| $25,000 to $29,999 | 5,198 (4.9%) | 5,244 (5.6%) |
| $30,000 to $34,999 | 5,577 (5.3%) | 4,947 (5.3%) |
| $35,000 to $39,999 | 5,439 (5.1%) | 4,645 (5.0%) |
| $40,000 to $44,999 | 5,524 (5.2%) | 5,605 (6.0%) |
| $45,000 to $49,999 | 4,921 (4.7%) | 5,488 (5.9%) |
| $50,000 to $54,999 | 4,150 (3.9%) | 4,286 (4.6%) |
| $55,000 to $64,999 | 9,055 (8.6%) | 6,818 (7.3%) |
| $65,000 to $74,999 | 7,047 (6.7%) | 5,648 (6.1%) |
| $75,000 to $99,999 | 13,229 (12.5%) | 8,943 (9.6%) |
| $100,000+ | 20,102 (19.0%) | 9,864 (10.6%) |
| Total | 105,695 (100.0%) | 93,234 (100.0%) |
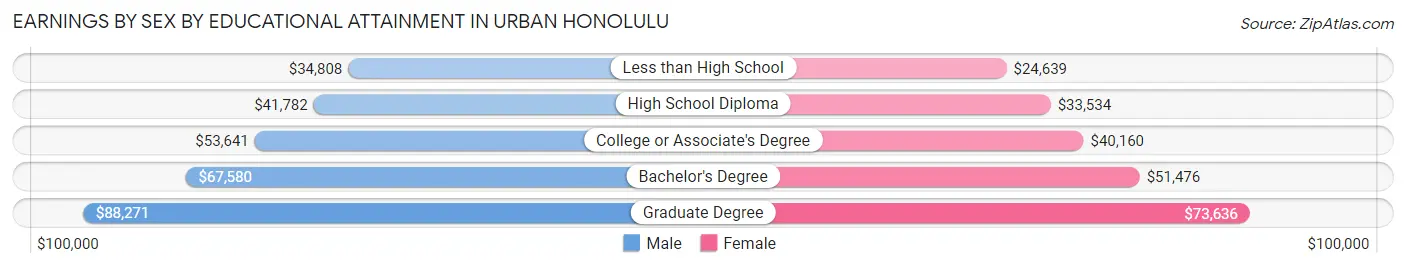
Earnings by Sex by Educational Attainment in Urban Honolulu
Average earnings in Urban Honolulu are $56,689 for men and $44,345 for women, a difference of 21.8%. Men with an educational attainment of graduate degree enjoy the highest average annual earnings of $88,271, while those with less than high school education earn the least with $34,808. Women with an educational attainment of graduate degree earn the most with the average annual earnings of $73,636, while those with less than high school education have the smallest earnings of $24,639.
| Educational Attainment | Male Income | Female Income |
| Less than High School | $34,808 | $24,639 |
| High School Diploma | $41,782 | $33,534 |
| College or Associate's Degree | $53,641 | $40,160 |
| Bachelor's Degree | $67,580 | $51,476 |
| Graduate Degree | $88,271 | $73,636 |
| Total | $56,689 | $44,345 |
Family Income in Urban Honolulu
Family Income Brackets in Urban Honolulu
According to the Urban Honolulu family income data, there are 16,375 families falling into the $100,000 to $149,999 income range, which is the most common income bracket and makes up 21.3% of all families. Conversely, the $10,000 to $14,999 income bracket is the least frequent group with only 1,076 families (1.4%) belonging to this category.
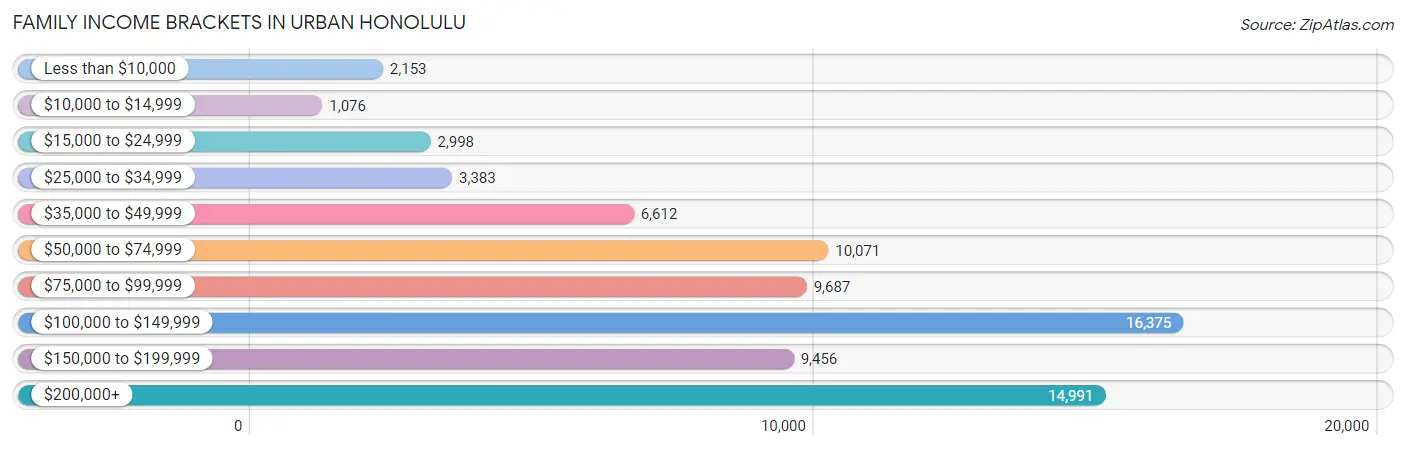
| Income Bracket | # Families | % Families |
| Less than $10,000 | 2,153 | 2.8% |
| $10,000 to $14,999 | 1,076 | 1.4% |
| $15,000 to $24,999 | 2,998 | 3.9% |
| $25,000 to $34,999 | 3,383 | 4.4% |
| $35,000 to $49,999 | 6,612 | 8.6% |
| $50,000 to $74,999 | 10,071 | 13.1% |
| $75,000 to $99,999 | 9,687 | 12.6% |
| $100,000 to $149,999 | 16,375 | 21.3% |
| $150,000 to $199,999 | 9,456 | 12.3% |
| $200,000+ | 14,991 | 19.5% |
Family Income by Famaliy Size in Urban Honolulu
7+ person families (3,041 | 4.0%) account for the highest median family income in Urban Honolulu with $183,622 per family, while 2-person families (35,797 | 46.6%) have the highest median income of $43,993 per family member.
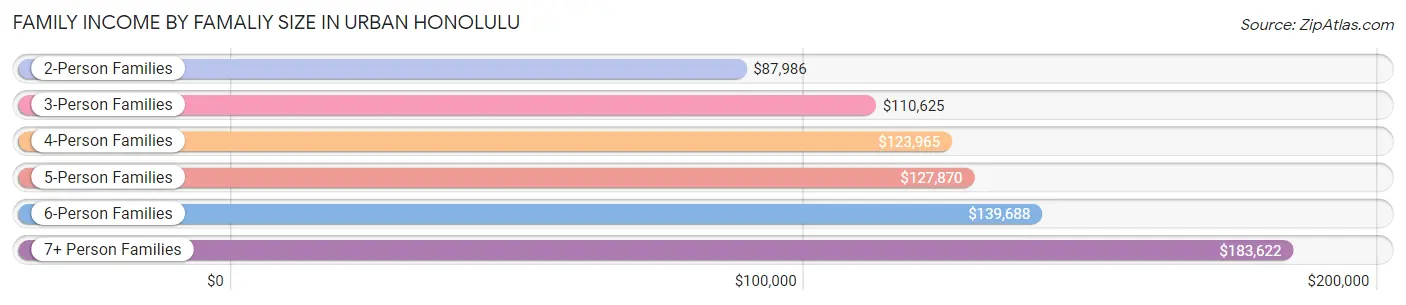
| Income Bracket | # Families | Median Income |
| 2-Person Families | 35,797 (46.6%) | $87,986 |
| 3-Person Families | 17,617 (22.9%) | $110,625 |
| 4-Person Families | 12,683 (16.5%) | $123,965 |
| 5-Person Families | 5,473 (7.1%) | $127,870 |
| 6-Person Families | 2,268 (2.9%) | $139,688 |
| 7+ Person Families | 3,041 (4.0%) | $183,622 |
| Total | 76,879 (100.0%) | $106,192 |
Family Income by Number of Earners in Urban Honolulu
The median family income in Urban Honolulu is $106,192, with families comprising 3+ earners (12,710) having the highest median family income of $164,272, while families with no earners (10,004) have the lowest median family income of $52,935, accounting for 16.5% and 13.0% of families, respectively.
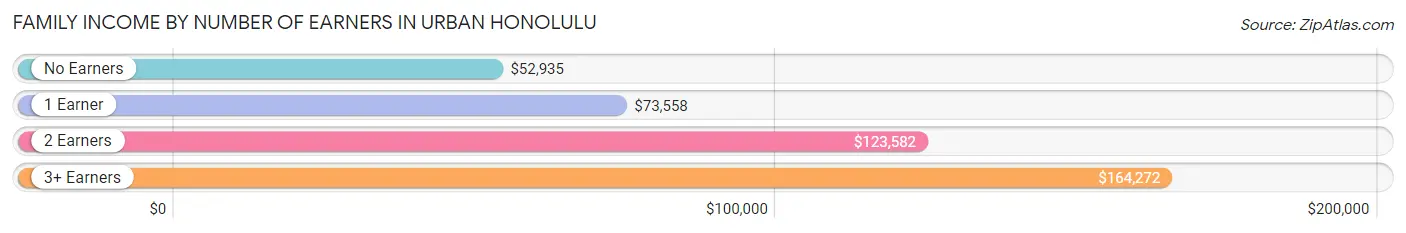
| Number of Earners | # Families | Median Income |
| No Earners | 10,004 (13.0%) | $52,935 |
| 1 Earner | 21,946 (28.5%) | $73,558 |
| 2 Earners | 32,219 (41.9%) | $123,582 |
| 3+ Earners | 12,710 (16.5%) | $164,272 |
| Total | 76,879 (100.0%) | $106,192 |
Household Income in Urban Honolulu
Household Income Brackets in Urban Honolulu
With 23,630 households falling in the category, the $100,000 to $149,999 income range is the most frequent in Urban Honolulu, accounting for 17.6% of all households. In contrast, only 4,431 households (3.3%) fall into the $10,000 to $14,999 income bracket, making it the least populous group.
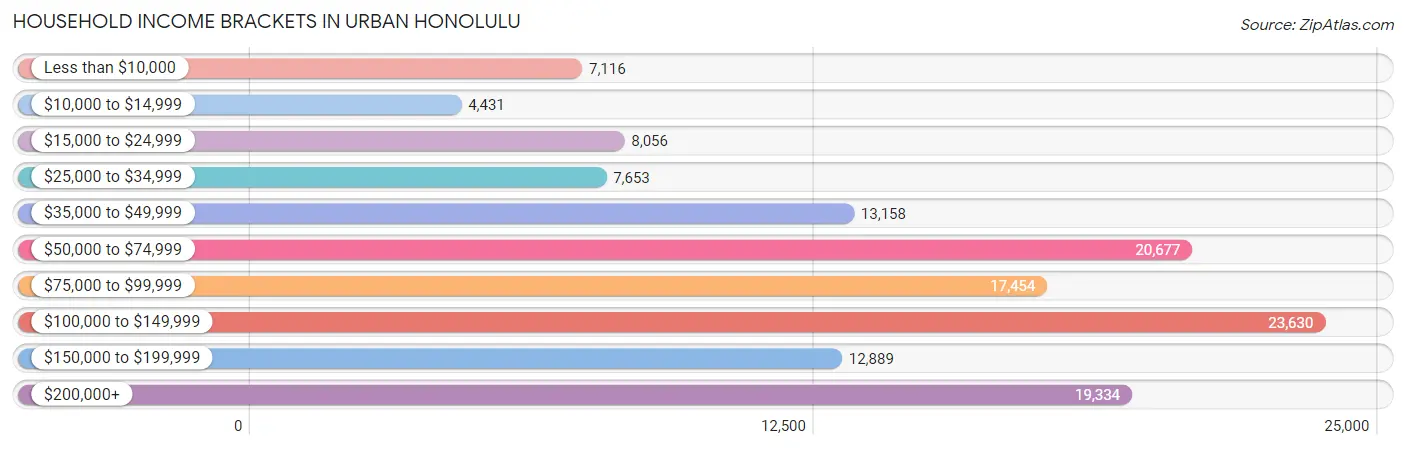
| Income Bracket | # Households | % Households |
| Less than $10,000 | 7,116 | 5.3% |
| $10,000 to $14,999 | 4,431 | 3.3% |
| $15,000 to $24,999 | 8,056 | 6.0% |
| $25,000 to $34,999 | 7,653 | 5.7% |
| $35,000 to $49,999 | 13,158 | 9.8% |
| $50,000 to $74,999 | 20,677 | 15.4% |
| $75,000 to $99,999 | 17,454 | 13.0% |
| $100,000 to $149,999 | 23,630 | 17.6% |
| $150,000 to $199,999 | 12,889 | 9.6% |
| $200,000+ | 19,334 | 14.4% |
Household Income by Householder Age in Urban Honolulu
The median household income in Urban Honolulu is $82,772, with the highest median household income of $93,228 found in the 45 to 64 years age bracket for the primary householder. A total of 45,212 households (33.7%) fall into this category. Meanwhile, the 15 to 24 years age bracket for the primary householder has the lowest median household income of $51,817, with 4,279 households (3.2%) in this group.
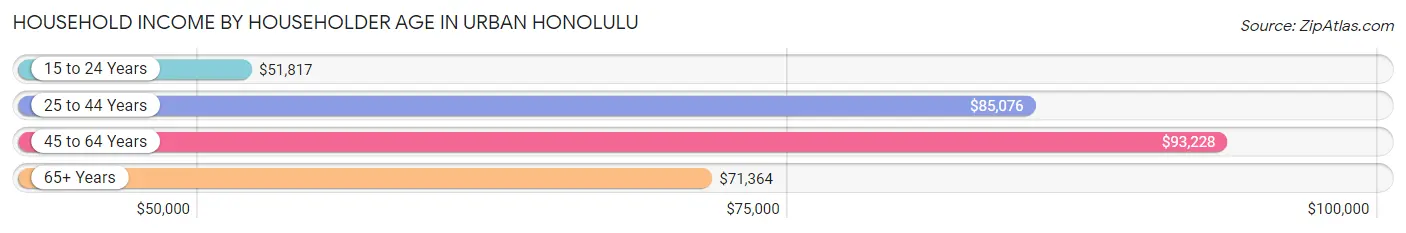
| Income Bracket | # Households | Median Income |
| 15 to 24 Years | 4,279 (3.2%) | $51,817 |
| 25 to 44 Years | 41,498 (30.9%) | $85,076 |
| 45 to 64 Years | 45,212 (33.7%) | $93,228 |
| 65+ Years | 43,275 (32.2%) | $71,364 |
| Total | 134,264 (100.0%) | $82,772 |
Poverty in Urban Honolulu
Income Below Poverty by Sex and Age in Urban Honolulu
With 10.7% poverty level for males and 11.8% for females among the residents of Urban Honolulu, 6 to 11 year old males and 18 to 24 year old females are the most vulnerable to poverty, with 1,816 males (17.1%) and 2,528 females (21.3%) in their respective age groups living below the poverty level.
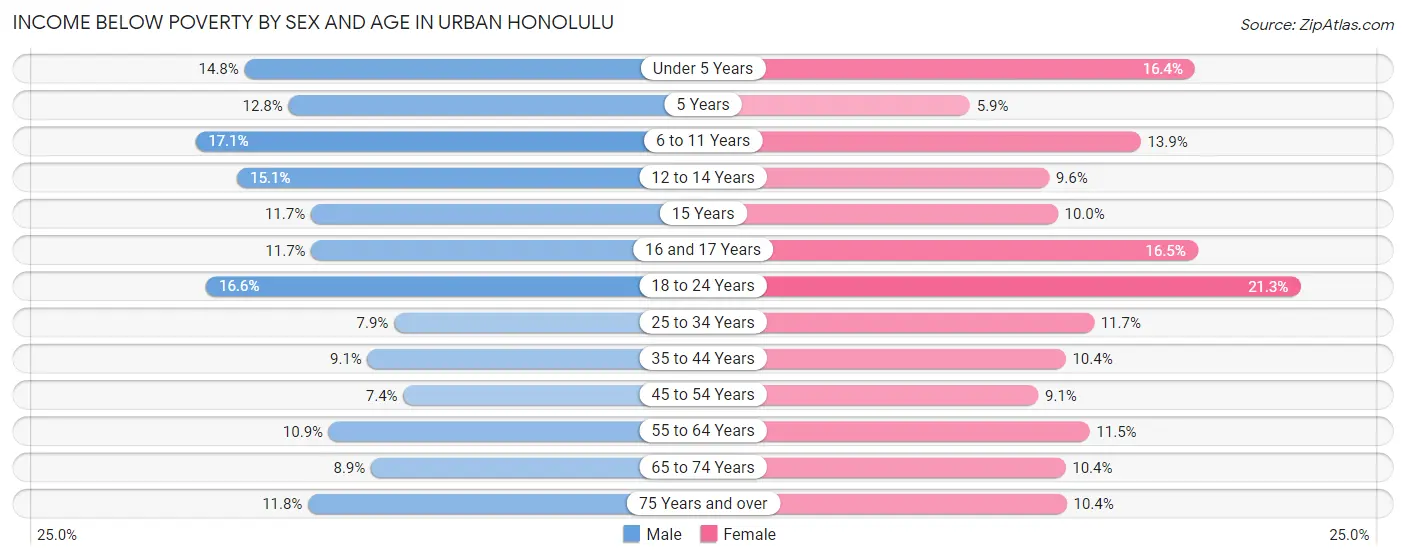
| Age Bracket | Male | Female |
| Under 5 Years | 1,182 (14.8%) | 1,291 (16.4%) |
| 5 Years | 161 (12.8%) | 85 (5.9%) |
| 6 to 11 Years | 1,816 (17.1%) | 1,166 (13.9%) |
| 12 to 14 Years | 785 (15.1%) | 429 (9.6%) |
| 15 Years | 160 (11.7%) | 138 (10.0%) |
| 16 and 17 Years | 371 (11.7%) | 578 (16.5%) |
| 18 to 24 Years | 2,249 (16.6%) | 2,528 (21.3%) |
| 25 to 34 Years | 2,096 (7.9%) | 2,812 (11.7%) |
| 35 to 44 Years | 2,164 (9.1%) | 2,366 (10.4%) |
| 45 to 54 Years | 1,716 (7.4%) | 1,954 (9.1%) |
| 55 to 64 Years | 2,346 (10.9%) | 2,519 (11.5%) |
| 65 to 74 Years | 1,664 (8.9%) | 2,131 (10.4%) |
| 75 Years and over | 1,607 (11.8%) | 2,061 (10.4%) |
| Total | 18,317 (10.7%) | 20,058 (11.8%) |
Income Above Poverty by Sex and Age in Urban Honolulu
According to the poverty statistics in Urban Honolulu, males aged 45 to 54 years and females aged 5 years are the age groups that are most secure financially, with 92.6% of males and 94.1% of females in these age groups living above the poverty line.
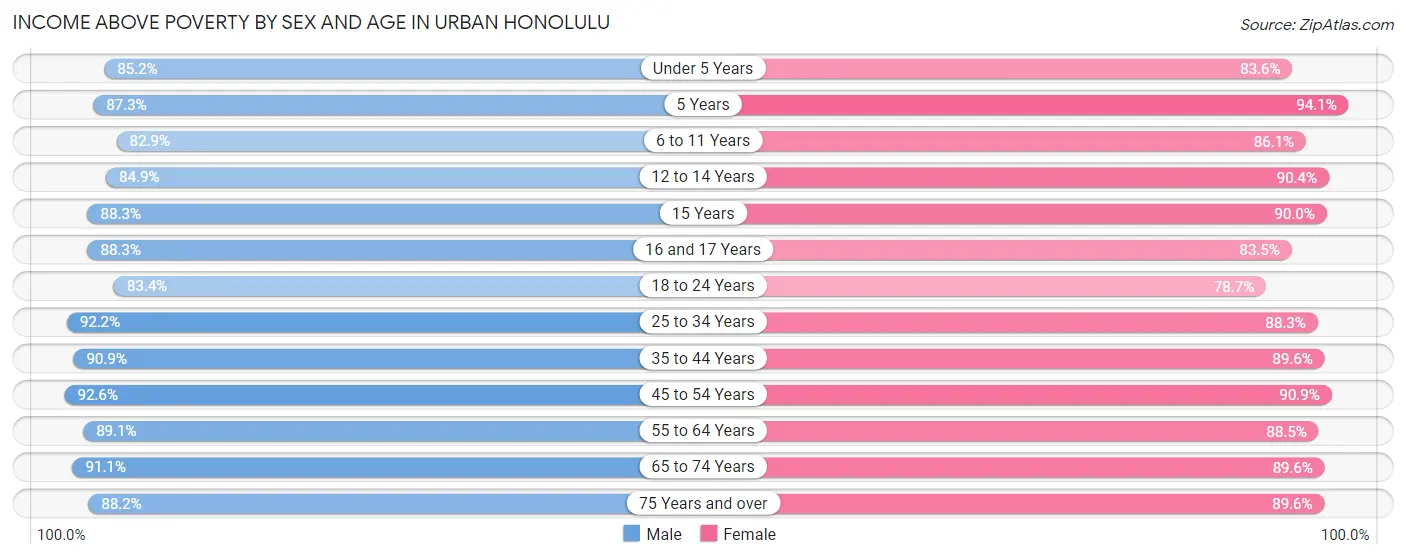
| Age Bracket | Male | Female |
| Under 5 Years | 6,811 (85.2%) | 6,591 (83.6%) |
| 5 Years | 1,102 (87.3%) | 1,345 (94.1%) |
| 6 to 11 Years | 8,817 (82.9%) | 7,244 (86.1%) |
| 12 to 14 Years | 4,401 (84.9%) | 4,037 (90.4%) |
| 15 Years | 1,206 (88.3%) | 1,240 (90.0%) |
| 16 and 17 Years | 2,802 (88.3%) | 2,923 (83.5%) |
| 18 to 24 Years | 11,314 (83.4%) | 9,358 (78.7%) |
| 25 to 34 Years | 24,616 (92.1%) | 21,252 (88.3%) |
| 35 to 44 Years | 21,680 (90.9%) | 20,421 (89.6%) |
| 45 to 54 Years | 21,396 (92.6%) | 19,505 (90.9%) |
| 55 to 64 Years | 19,226 (89.1%) | 19,410 (88.5%) |
| 65 to 74 Years | 16,999 (91.1%) | 18,409 (89.6%) |
| 75 Years and over | 11,971 (88.2%) | 17,693 (89.6%) |
| Total | 152,341 (89.3%) | 149,428 (88.2%) |
Income Below Poverty Among Married-Couple Families in Urban Honolulu
The poverty statistics for married-couple families in Urban Honolulu show that 4.4% or 2,374 of the total 54,097 families live below the poverty line. Families with 5 or more children have the highest poverty rate of 37.7%, comprising of 182 families. On the other hand, families with no children have the lowest poverty rate of 3.7%, which includes 1,225 families.
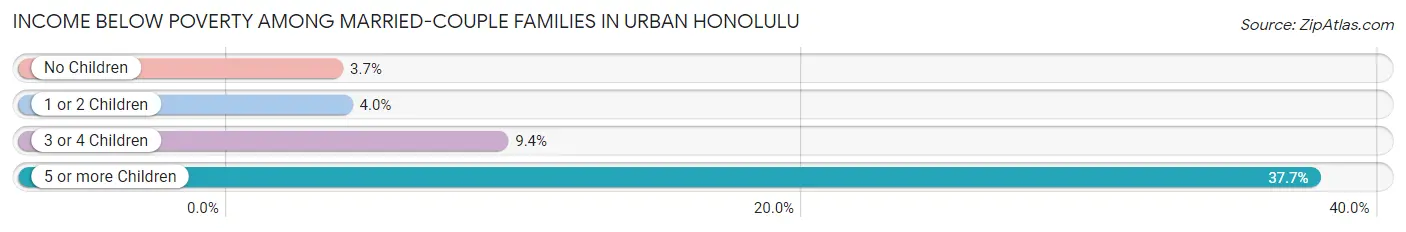
| Children | Above Poverty | Below Poverty |
| No Children | 32,242 (96.3%) | 1,225 (3.7%) |
| 1 or 2 Children | 16,447 (96.0%) | 683 (4.0%) |
| 3 or 4 Children | 2,733 (90.6%) | 284 (9.4%) |
| 5 or more Children | 301 (62.3%) | 182 (37.7%) |
| Total | 51,723 (95.6%) | 2,374 (4.4%) |
Income Below Poverty Among Single-Parent Households in Urban Honolulu
According to the poverty data in Urban Honolulu, 11.4% or 785 single-father households and 15.6% or 2,478 single-mother households are living below the poverty line. Among single-father households, those with 1 or 2 children have the highest poverty rate, with 603 households (28.0%) experiencing poverty. Likewise, among single-mother households, those with 5 or more children have the highest poverty rate, with 126 households (77.3%) falling below the poverty line.
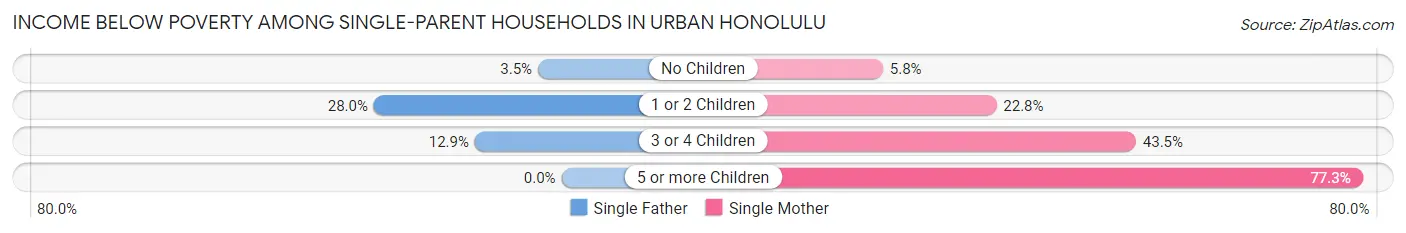
| Children | Single Father | Single Mother |
| No Children | 159 (3.5%) | 492 (5.8%) |
| 1 or 2 Children | 603 (28.0%) | 1,459 (22.8%) |
| 3 or 4 Children | 23 (12.9%) | 401 (43.5%) |
| 5 or more Children | 0 (0.0%) | 126 (77.3%) |
| Total | 785 (11.4%) | 2,478 (15.6%) |
Income Below Poverty Among Married-Couple vs Single-Parent Households in Urban Honolulu
The poverty data for Urban Honolulu shows that 2,374 of the married-couple family households (4.4%) and 3,263 of the single-parent households (14.3%) are living below the poverty level. Within the married-couple family households, those with 5 or more children have the highest poverty rate, with 182 households (37.7%) falling below the poverty line. Among the single-parent households, those with 5 or more children have the highest poverty rate, with 126 household (77.3%) living below poverty.
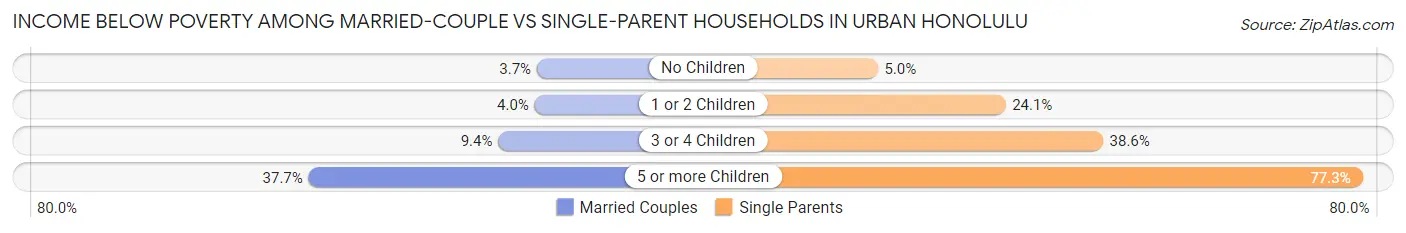
| Children | Married-Couple Families | Single-Parent Households |
| No Children | 1,225 (3.7%) | 651 (5.0%) |
| 1 or 2 Children | 683 (4.0%) | 2,062 (24.1%) |
| 3 or 4 Children | 284 (9.4%) | 424 (38.6%) |
| 5 or more Children | 182 (37.7%) | 126 (77.3%) |
| Total | 2,374 (4.4%) | 3,263 (14.3%) |
Race in Urban Honolulu
The most populous races in Urban Honolulu are Asian (182,297 | 52.3%), Two or more Races (65,207 | 18.7%), and White / Caucasian (60,123 | 17.2%).
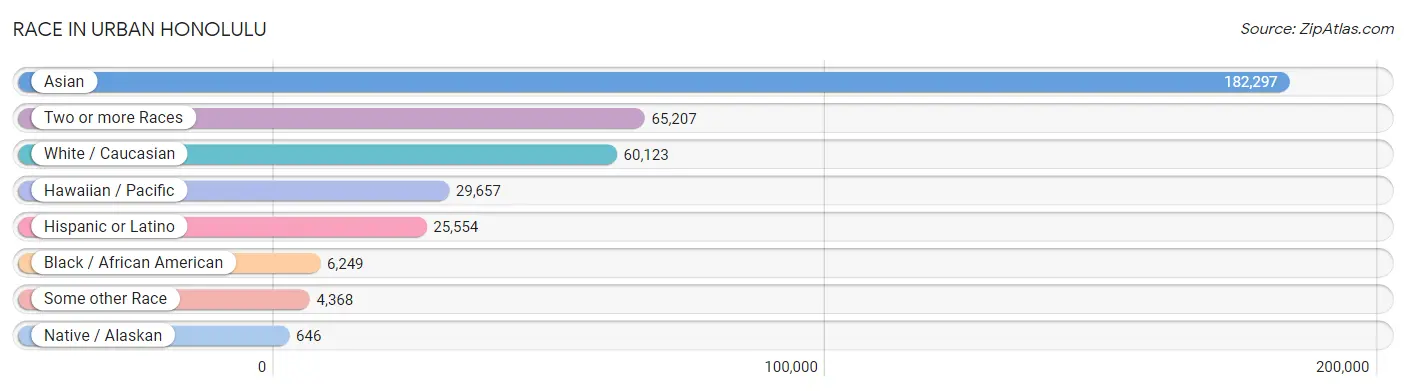
| Race | # Population | % Population |
| Asian | 182,297 | 52.3% |
| Black / African American | 6,249 | 1.8% |
| Hawaiian / Pacific | 29,657 | 8.5% |
| Hispanic or Latino | 25,554 | 7.3% |
| Native / Alaskan | 646 | 0.2% |
| White / Caucasian | 60,123 | 17.2% |
| Two or more Races | 65,207 | 18.7% |
| Some other Race | 4,368 | 1.3% |
| Total | 348,547 | 100.0% |
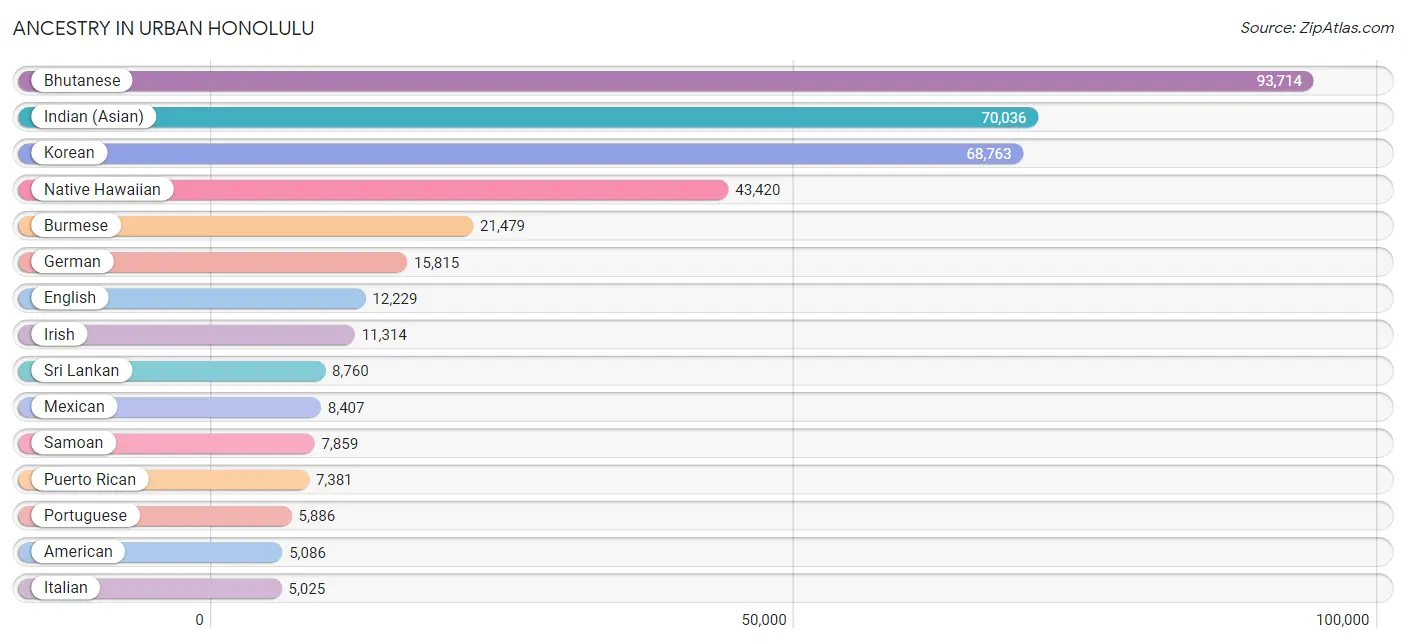
Ancestry in Urban Honolulu
The most populous ancestries reported in Urban Honolulu are Bhutanese (93,714 | 26.9%), Indian (Asian) (70,036 | 20.1%), Korean (68,763 | 19.7%), Native Hawaiian (43,420 | 12.5%), and Burmese (21,479 | 6.2%), together accounting for 85.3% of all Urban Honolulu residents.
| Ancestry | # Population | % Population |
| Afghan | 88 | 0.0% |
| African | 452 | 0.1% |
| Alaska Native | 25 | 0.0% |
| Albanian | 6 | 0.0% |
| Aleut | 47 | 0.0% |
| Alsatian | 16 | 0.0% |
| American | 5,086 | 1.5% |
| Apache | 183 | 0.1% |
| Arab | 489 | 0.1% |
| Argentinean | 170 | 0.1% |
| Armenian | 94 | 0.0% |
| Australian | 116 | 0.0% |
| Austrian | 362 | 0.1% |
| Bangladeshi | 8 | 0.0% |
| Barbadian | 12 | 0.0% |
| Belgian | 116 | 0.0% |
| Belizean | 123 | 0.0% |
| Bermudan | 39 | 0.0% |
| Bhutanese | 93,714 | 26.9% |
| Blackfeet | 314 | 0.1% |
| Bolivian | 63 | 0.0% |
| Brazilian | 183 | 0.1% |
| British | 699 | 0.2% |
| British West Indian | 24 | 0.0% |
| Bulgarian | 310 | 0.1% |
| Burmese | 21,479 | 6.2% |
| Cajun | 18 | 0.0% |
| Cambodian | 114 | 0.0% |
| Canadian | 339 | 0.1% |
| Cape Verdean | 10 | 0.0% |
| Celtic | 11 | 0.0% |
| Central American | 721 | 0.2% |
| Central American Indian | 214 | 0.1% |
| Cherokee | 1,654 | 0.5% |
| Cheyenne | 44 | 0.0% |
| Chickasaw | 10 | 0.0% |
| Chilean | 87 | 0.0% |
| Chinese | 2,711 | 0.8% |
| Chippewa | 108 | 0.0% |
| Choctaw | 105 | 0.0% |
| Colombian | 246 | 0.1% |
| Colville | 36 | 0.0% |
| Comanche | 4 | 0.0% |
| Costa Rican | 106 | 0.0% |
| Cree | 8 | 0.0% |
| Creek | 46 | 0.0% |
| Croatian | 113 | 0.0% |
| Cuban | 396 | 0.1% |
| Czech | 282 | 0.1% |
| Czechoslovakian | 148 | 0.0% |
| Danish | 711 | 0.2% |
| Delaware | 77 | 0.0% |
| Dominican | 355 | 0.1% |
| Dutch | 798 | 0.2% |
| Eastern European | 259 | 0.1% |
| Ecuadorian | 154 | 0.0% |
| Egyptian | 74 | 0.0% |
| English | 12,229 | 3.5% |
| Estonian | 18 | 0.0% |
| Ethiopian | 39 | 0.0% |
| European | 2,048 | 0.6% |
| Fijian | 2,239 | 0.6% |
| Filipino | 1,275 | 0.4% |
| Finnish | 342 | 0.1% |
| French | 3,036 | 0.9% |
| French American Indian | 12 | 0.0% |
| French Canadian | 596 | 0.2% |
| German | 15,815 | 4.5% |
| German Russian | 11 | 0.0% |
| Ghanaian | 57 | 0.0% |
| Greek | 499 | 0.1% |
| Guamanian / Chamorro | 1,643 | 0.5% |
| Guatemalan | 135 | 0.0% |
| Guyanese | 57 | 0.0% |
| Haitian | 209 | 0.1% |
| Honduran | 45 | 0.0% |
| Hungarian | 380 | 0.1% |
| Icelander | 7 | 0.0% |
| Indian (Asian) | 70,036 | 20.1% |
| Indonesian | 97 | 0.0% |
| Inupiat | 44 | 0.0% |
| Iranian | 373 | 0.1% |
| Iraqi | 16 | 0.0% |
| Irish | 11,314 | 3.3% |
| Iroquois | 85 | 0.0% |
| Israeli | 61 | 0.0% |
| Italian | 5,025 | 1.4% |
| Jamaican | 164 | 0.1% |
| Japanese | 276 | 0.1% |
| Jordanian | 18 | 0.0% |
| Kenyan | 65 | 0.0% |
| Kiowa | 5 | 0.0% |
| Korean | 68,763 | 19.7% |
| Laotian | 181 | 0.1% |
| Latvian | 56 | 0.0% |
| Lebanese | 197 | 0.1% |
| Lithuanian | 207 | 0.1% |
| Lumbee | 20 | 0.0% |
| Luxembourger | 27 | 0.0% |
| Malaysian | 905 | 0.3% |
| Marshallese | 2,467 | 0.7% |
| Mexican | 8,407 | 2.4% |
| Mexican American Indian | 155 | 0.0% |
| Mongolian | 114 | 0.0% |
| Moroccan | 5 | 0.0% |
| Native Hawaiian | 43,420 | 12.5% |
| Navajo | 182 | 0.1% |
| New Zealander | 41 | 0.0% |
| Nicaraguan | 143 | 0.0% |
| Nigerian | 166 | 0.1% |
| Northern European | 244 | 0.1% |
| Norwegian | 1,944 | 0.6% |
| Okinawan | 17 | 0.0% |
| Osage | 5 | 0.0% |
| Pakistani | 2,075 | 0.6% |
| Palestinian | 22 | 0.0% |
| Panamanian | 49 | 0.0% |
| Pennsylvania German | 59 | 0.0% |
| Peruvian | 242 | 0.1% |
| Polish | 3,101 | 0.9% |
| Portuguese | 5,886 | 1.7% |
| Potawatomi | 3 | 0.0% |
| Pueblo | 43 | 0.0% |
| Puerto Rican | 7,381 | 2.1% |
| Puget Sound Salish | 7 | 0.0% |
| Romanian | 154 | 0.0% |
| Russian | 1,642 | 0.5% |
| Salvadoran | 243 | 0.1% |
| Samoan | 7,859 | 2.2% |
| Scandinavian | 358 | 0.1% |
| Scotch-Irish | 1,037 | 0.3% |
| Scottish | 2,245 | 0.6% |
| Seminole | 16 | 0.0% |
| Serbian | 270 | 0.1% |
| Shoshone | 9 | 0.0% |
| Sierra Leonean | 4 | 0.0% |
| Sioux | 117 | 0.0% |
| Slavic | 107 | 0.0% |
| Slovak | 82 | 0.0% |
| Slovene | 50 | 0.0% |
| South African | 34 | 0.0% |
| South American | 1,140 | 0.3% |
| South American Indian | 208 | 0.1% |
| Spaniard | 1,407 | 0.4% |
| Spanish | 4,843 | 1.4% |
| Spanish American | 12 | 0.0% |
| Spanish American Indian | 15 | 0.0% |
| Sri Lankan | 8,760 | 2.5% |
| Subsaharan African | 979 | 0.3% |
| Swedish | 1,974 | 0.6% |
| Swiss | 372 | 0.1% |
| Syrian | 26 | 0.0% |
| Taiwanese | 42 | 0.0% |
| Thai | 1,888 | 0.5% |
| Tlingit-Haida | 11 | 0.0% |
| Tohono O'Odham | 28 | 0.0% |
| Tongan | 2,042 | 0.6% |
| Trinidadian and Tobagonian | 15 | 0.0% |
| Turkish | 17 | 0.0% |
| Ukrainian | 336 | 0.1% |
| Venezuelan | 156 | 0.0% |
| Vietnamese | 132 | 0.0% |
| Welsh | 574 | 0.2% |
| West Indian | 177 | 0.1% |
| Yaqui | 15 | 0.0% |
| Yugoslavian | 46 | 0.0% |
| Yup'ik | 6 | 0.0% |
| Zimbabwean | 5 | 0.0% | View All 168 Rows |
Immigrants in Urban Honolulu
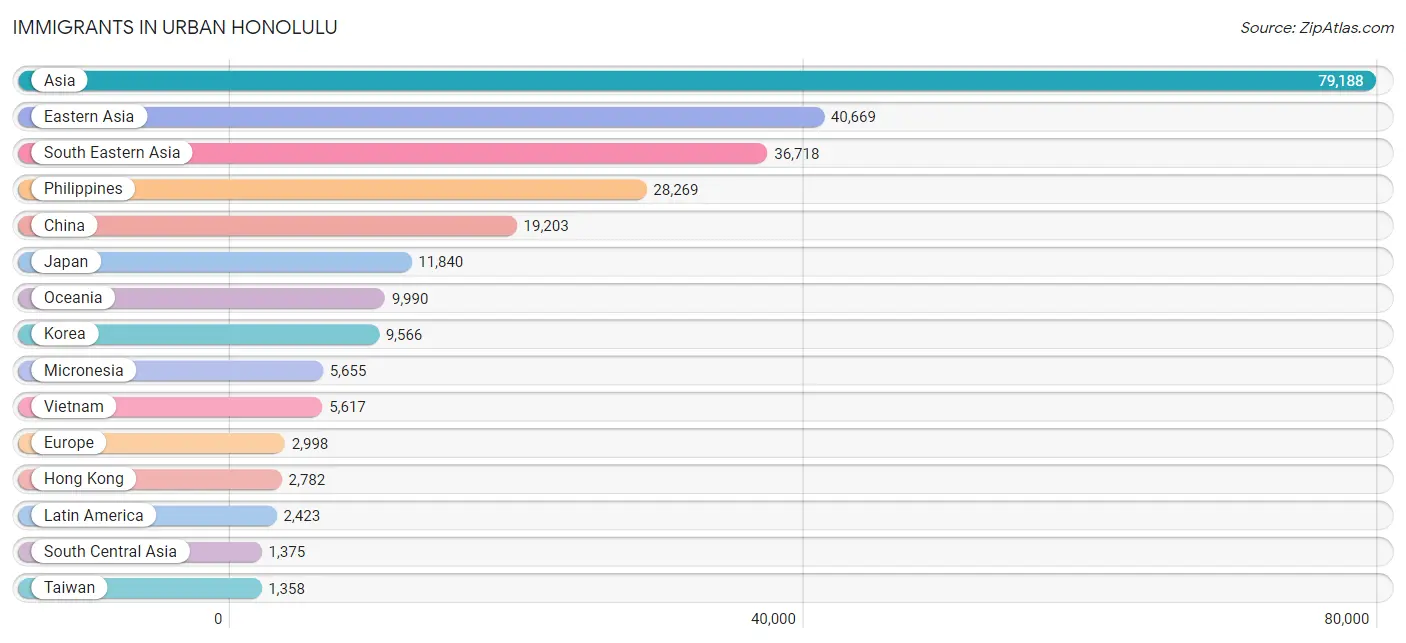
The most numerous immigrant groups reported in Urban Honolulu came from Asia (79,188 | 22.7%), Eastern Asia (40,669 | 11.7%), South Eastern Asia (36,718 | 10.5%), Philippines (28,269 | 8.1%), and China (19,203 | 5.5%), together accounting for 58.5% of all Urban Honolulu residents.
| Immigration Origin | # Population | % Population |
| Afghanistan | 47 | 0.0% |
| Africa | 487 | 0.1% |
| Albania | 4 | 0.0% |
| Argentina | 67 | 0.0% |
| Asia | 79,188 | 22.7% |
| Australia | 243 | 0.1% |
| Austria | 54 | 0.0% |
| Bangladesh | 67 | 0.0% |
| Belgium | 24 | 0.0% |
| Belize | 59 | 0.0% |
| Bosnia and Herzegovina | 9 | 0.0% |
| Brazil | 361 | 0.1% |
| Bulgaria | 315 | 0.1% |
| Cabo Verde | 19 | 0.0% |
| Cambodia | 132 | 0.0% |
| Cameroon | 101 | 0.0% |
| Canada | 577 | 0.2% |
| Caribbean | 493 | 0.1% |
| Central America | 989 | 0.3% |
| Chile | 103 | 0.0% |
| China | 19,203 | 5.5% |
| Colombia | 151 | 0.0% |
| Costa Rica | 9 | 0.0% |
| Cuba | 70 | 0.0% |
| Czechoslovakia | 39 | 0.0% |
| Denmark | 3 | 0.0% |
| Dominica | 1 | 0.0% |
| Dominican Republic | 66 | 0.0% |
| Eastern Africa | 126 | 0.0% |
| Eastern Asia | 40,669 | 11.7% |
| Eastern Europe | 1,094 | 0.3% |
| Ecuador | 59 | 0.0% |
| Egypt | 73 | 0.0% |
| El Salvador | 44 | 0.0% |
| England | 195 | 0.1% |
| Eritrea | 29 | 0.0% |
| Ethiopia | 17 | 0.0% |
| Europe | 2,998 | 0.9% |
| Fiji | 173 | 0.1% |
| France | 194 | 0.1% |
| Germany | 704 | 0.2% |
| Greece | 8 | 0.0% |
| Grenada | 29 | 0.0% |
| Guatemala | 10 | 0.0% |
| Haiti | 140 | 0.0% |
| Hong Kong | 2,782 | 0.8% |
| Hungary | 37 | 0.0% |
| India | 557 | 0.2% |
| Indonesia | 157 | 0.1% |
| Iran | 314 | 0.1% |
| Iraq | 29 | 0.0% |
| Ireland | 74 | 0.0% |
| Israel | 94 | 0.0% |
| Italy | 93 | 0.0% |
| Jamaica | 104 | 0.0% |
| Japan | 11,840 | 3.4% |
| Jordan | 9 | 0.0% |
| Kazakhstan | 30 | 0.0% |
| Kenya | 65 | 0.0% |
| Korea | 9,566 | 2.7% |
| Laos | 454 | 0.1% |
| Latin America | 2,423 | 0.7% |
| Latvia | 4 | 0.0% |
| Liberia | 8 | 0.0% |
| Lithuania | 66 | 0.0% |
| Malaysia | 735 | 0.2% |
| Mexico | 759 | 0.2% |
| Micronesia | 5,655 | 1.6% |
| Middle Africa | 101 | 0.0% |
| Nepal | 94 | 0.0% |
| Netherlands | 17 | 0.0% |
| Nicaragua | 84 | 0.0% |
| Nigeria | 29 | 0.0% |
| Northern Africa | 82 | 0.0% |
| Northern Europe | 684 | 0.2% |
| Norway | 69 | 0.0% |
| Oceania | 9,990 | 2.9% |
| Pakistan | 51 | 0.0% |
| Panama | 24 | 0.0% |
| Peru | 74 | 0.0% |
| Philippines | 28,269 | 8.1% |
| Poland | 105 | 0.0% |
| Portugal | 14 | 0.0% |
| Romania | 62 | 0.0% |
| Russia | 237 | 0.1% |
| Saudi Arabia | 32 | 0.0% |
| Scotland | 2 | 0.0% |
| Serbia | 94 | 0.0% |
| Sierra Leone | 20 | 0.0% |
| Singapore | 166 | 0.1% |
| South Africa | 95 | 0.0% |
| South America | 941 | 0.3% |
| South Central Asia | 1,375 | 0.4% |
| South Eastern Asia | 36,718 | 10.5% |
| Southern Europe | 151 | 0.0% |
| Spain | 36 | 0.0% |
| Sri Lanka | 94 | 0.0% |
| Sudan | 9 | 0.0% |
| Sweden | 63 | 0.0% |
| Switzerland | 76 | 0.0% |
| Taiwan | 1,358 | 0.4% |
| Thailand | 1,093 | 0.3% |
| Trinidad and Tobago | 70 | 0.0% |
| Turkey | 109 | 0.0% |
| Ukraine | 76 | 0.0% |
| Uzbekistan | 25 | 0.0% |
| Venezuela | 115 | 0.0% |
| Vietnam | 5,617 | 1.6% |
| Western Africa | 83 | 0.0% |
| Western Asia | 277 | 0.1% |
| Western Europe | 1,069 | 0.3% |
| Zimbabwe | 5 | 0.0% | View All 112 Rows |
Sex and Age in Urban Honolulu
Sex and Age in Urban Honolulu
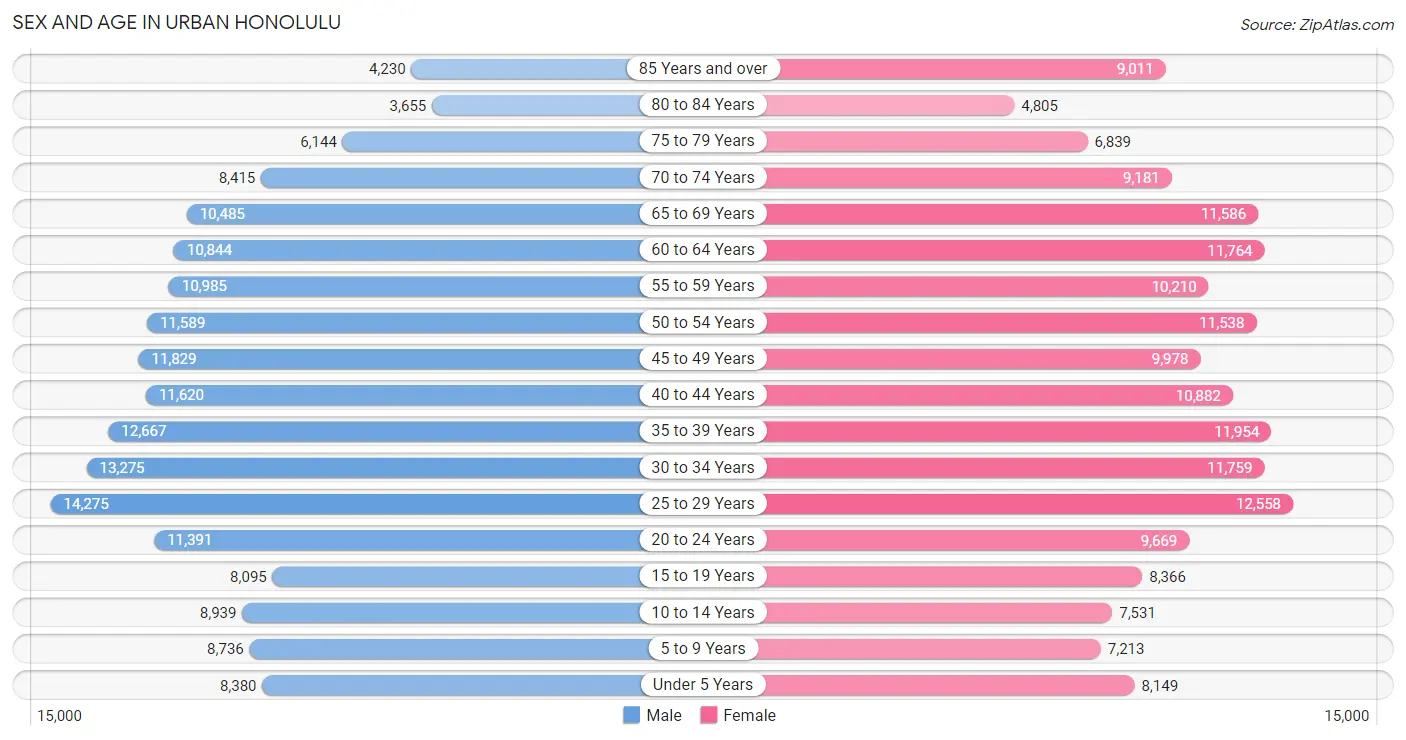
The most populous age groups in Urban Honolulu are 25 to 29 Years (14,275 | 8.1%) for men and 25 to 29 Years (12,558 | 7.3%) for women.
| Age Bracket | Male | Female |
| Under 5 Years | 8,380 (4.8%) | 8,149 (4.7%) |
| 5 to 9 Years | 8,736 (5.0%) | 7,213 (4.2%) |
| 10 to 14 Years | 8,939 (5.1%) | 7,531 (4.3%) |
| 15 to 19 Years | 8,095 (4.6%) | 8,366 (4.8%) |
| 20 to 24 Years | 11,391 (6.5%) | 9,669 (5.6%) |
| 25 to 29 Years | 14,275 (8.1%) | 12,558 (7.3%) |
| 30 to 34 Years | 13,275 (7.6%) | 11,759 (6.8%) |
| 35 to 39 Years | 12,667 (7.2%) | 11,954 (6.9%) |
| 40 to 44 Years | 11,620 (6.6%) | 10,882 (6.3%) |
| 45 to 49 Years | 11,829 (6.7%) | 9,978 (5.8%) |
| 50 to 54 Years | 11,589 (6.6%) | 11,538 (6.7%) |
| 55 to 59 Years | 10,985 (6.3%) | 10,210 (5.9%) |
| 60 to 64 Years | 10,844 (6.2%) | 11,764 (6.8%) |
| 65 to 69 Years | 10,485 (6.0%) | 11,586 (6.7%) |
| 70 to 74 Years | 8,415 (4.8%) | 9,181 (5.3%) |
| 75 to 79 Years | 6,144 (3.5%) | 6,839 (4.0%) |
| 80 to 84 Years | 3,655 (2.1%) | 4,805 (2.8%) |
| 85 Years and over | 4,230 (2.4%) | 9,011 (5.2%) |
| Total | 175,554 (100.0%) | 172,993 (100.0%) |
Families and Households in Urban Honolulu
Median Family Size in Urban Honolulu
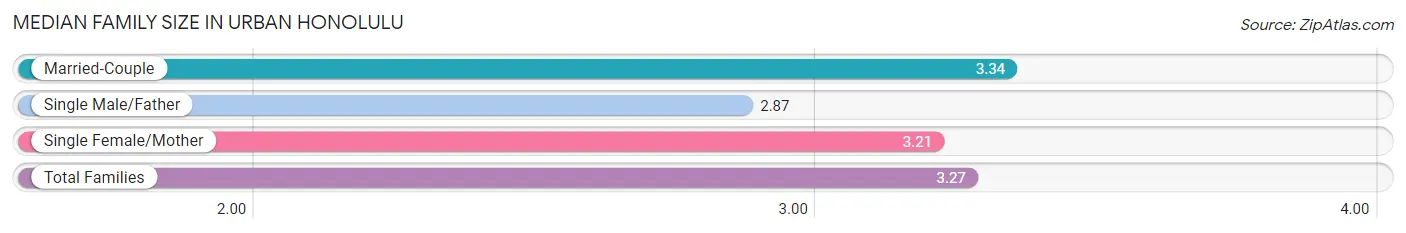
The median family size in Urban Honolulu is 3.27 persons per family, with married-couple families (54,097 | 70.4%) accounting for the largest median family size of 3.34 persons per family. On the other hand, single male/father families (6,864 | 8.9%) represent the smallest median family size with 2.87 persons per family.
| Family Type | # Families | Family Size |
| Married-Couple | 54,097 (70.4%) | 3.34 |
| Single Male/Father | 6,864 (8.9%) | 2.87 |
| Single Female/Mother | 15,918 (20.7%) | 3.21 |
| Total Families | 76,879 (100.0%) | 3.27 |
Median Household Size in Urban Honolulu
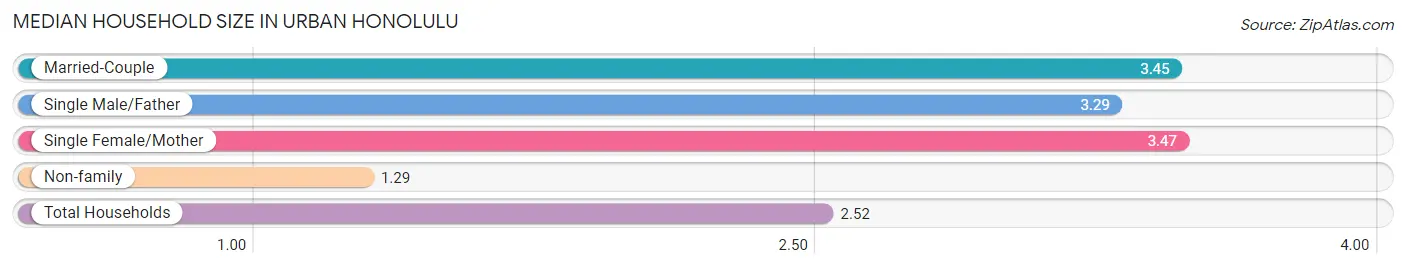
The median household size in Urban Honolulu is 2.52 persons per household, with single female/mother households (15,918 | 11.9%) accounting for the largest median household size of 3.47 persons per household. non-family households (57,385 | 42.7%) represent the smallest median household size with 1.29 persons per household.
| Household Type | # Households | Household Size |
| Married-Couple | 54,097 (40.3%) | 3.45 |
| Single Male/Father | 6,864 (5.1%) | 3.29 |
| Single Female/Mother | 15,918 (11.9%) | 3.47 |
| Non-family | 57,385 (42.7%) | 1.29 |
| Total Households | 134,264 (100.0%) | 2.52 |
Household Size by Marriage Status in Urban Honolulu
Out of a total of 134,264 households in Urban Honolulu, 76,879 (57.3%) are family households, while 57,385 (42.7%) are nonfamily households. The most numerous type of family households are 2-person households, comprising 33,057, and the most common type of nonfamily households are 1-person households, comprising 46,320.
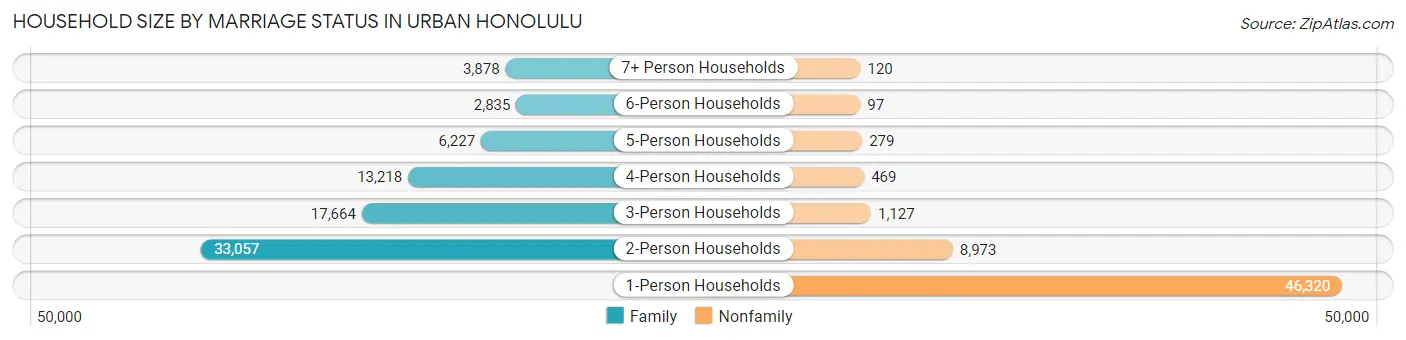
| Household Size | Family Households | Nonfamily Households |
| 1-Person Households | - | 46,320 (34.5%) |
| 2-Person Households | 33,057 (24.6%) | 8,973 (6.7%) |
| 3-Person Households | 17,664 (13.2%) | 1,127 (0.8%) |
| 4-Person Households | 13,218 (9.8%) | 469 (0.4%) |
| 5-Person Households | 6,227 (4.6%) | 279 (0.2%) |
| 6-Person Households | 2,835 (2.1%) | 97 (0.1%) |
| 7+ Person Households | 3,878 (2.9%) | 120 (0.1%) |
| Total | 76,879 (57.3%) | 57,385 (42.7%) |
Female Fertility in Urban Honolulu
Fertility by Age in Urban Honolulu
Average fertility rate in Urban Honolulu is 48.0 births per 1,000 women. Women in the age bracket of 20 to 34 years have the highest fertility rate with 59.0 births per 1,000 women. Women in the age bracket of 20 to 34 years acount for 53.8% of all women with births.
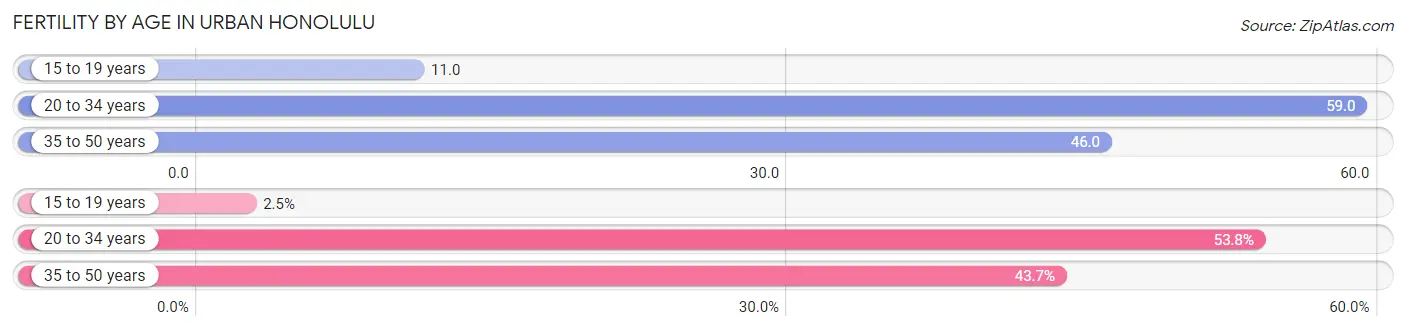
| Age Bracket | Women with Births | Births / 1,000 Women |
| 15 to 19 years | 91 (2.5%) | 11.0 |
| 20 to 34 years | 2,000 (53.8%) | 59.0 |
| 35 to 50 years | 1,624 (43.7%) | 46.0 |
| Total | 3,715 (100.0%) | 48.0 |
Fertility by Age by Marriage Status in Urban Honolulu
69.7% of women with births (3,715) in Urban Honolulu are married. The highest percentage of unmarried women with births falls into 15 to 19 years age bracket with 72.5% of them unmarried at the time of birth, while the lowest percentage of unmarried women with births belong to 35 to 50 years age bracket with 15.6% of them unmarried.
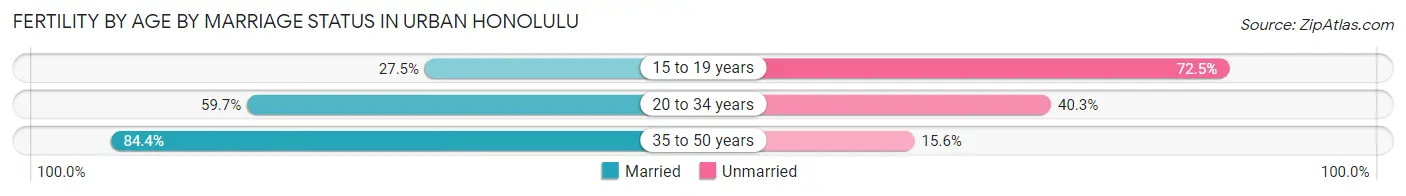
| Age Bracket | Married | Unmarried |
| 15 to 19 years | 25 (27.5%) | 66 (72.5%) |
| 20 to 34 years | 1,194 (59.7%) | 806 (40.3%) |
| 35 to 50 years | 1,371 (84.4%) | 253 (15.6%) |
| Total | 2,589 (69.7%) | 1,126 (30.3%) |
Fertility by Education in Urban Honolulu
Average fertility rate in Urban Honolulu is 48.0 births per 1,000 women. Women with the education attainment of graduate degree have the highest fertility rate of 55.0 births per 1,000 women, while women with the education attainment of less than high school have the lowest fertility at 43.0 births per 1,000 women. Women with the education attainment of college or associate's degree represent 28.1% of all women with births.
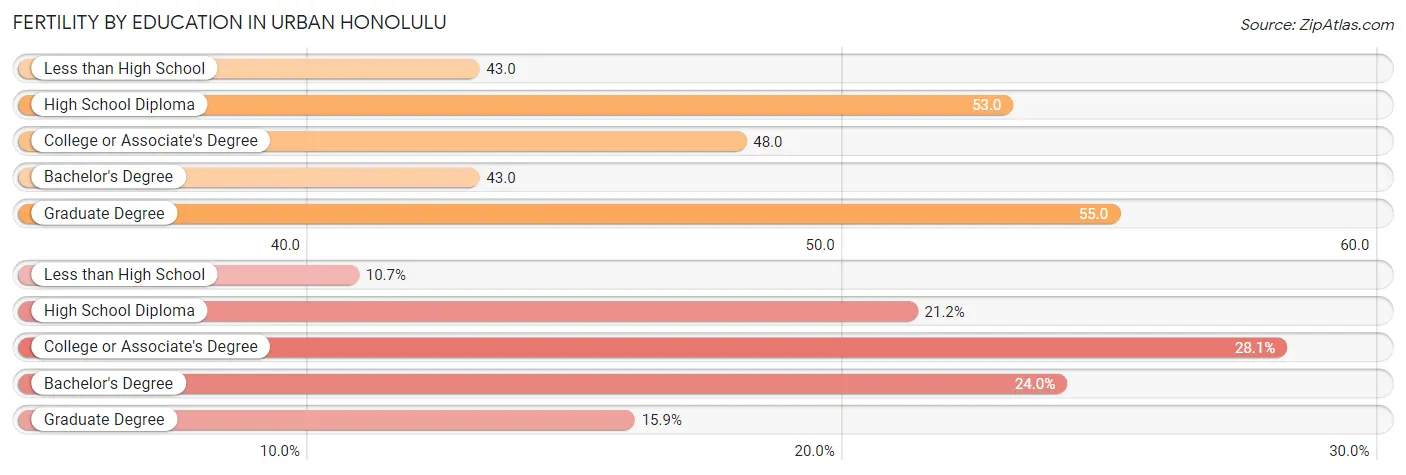
| Educational Attainment | Women with Births | Births / 1,000 Women |
| Less than High School | 399 (10.7%) | 43.0 |
| High School Diploma | 788 (21.2%) | 53.0 |
| College or Associate's Degree | 1,045 (28.1%) | 48.0 |
| Bachelor's Degree | 892 (24.0%) | 43.0 |
| Graduate Degree | 591 (15.9%) | 55.0 |
| Total | 3,715 (100.0%) | 48.0 |
Fertility by Education by Marriage Status in Urban Honolulu
30.3% of women with births in Urban Honolulu are unmarried. Women with the educational attainment of graduate degree are most likely to be married with 93.4% of them married at childbirth, while women with the educational attainment of less than high school are least likely to be married with 60.9% of them unmarried at childbirth.
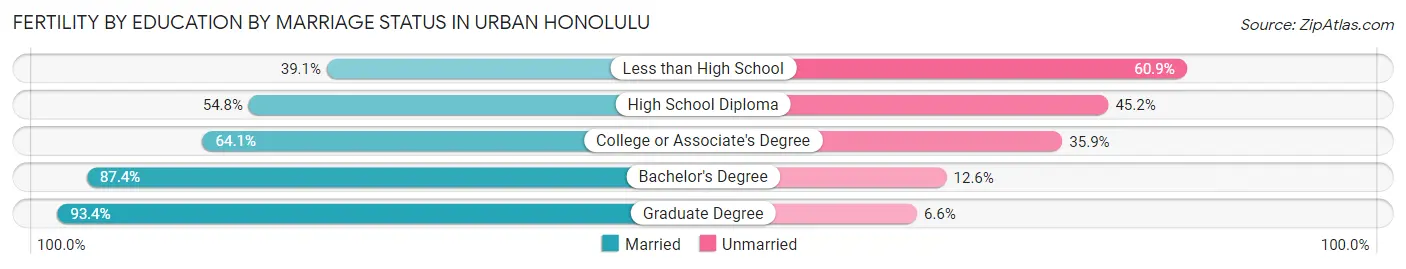
| Educational Attainment | Married | Unmarried |
| Less than High School | 156 (39.1%) | 243 (60.9%) |
| High School Diploma | 432 (54.8%) | 356 (45.2%) |
| College or Associate's Degree | 670 (64.1%) | 375 (35.9%) |
| Bachelor's Degree | 780 (87.4%) | 112 (12.6%) |
| Graduate Degree | 552 (93.4%) | 39 (6.6%) |
| Total | 2,589 (69.7%) | 1,126 (30.3%) |
Employment Characteristics in Urban Honolulu
Employment by Class of Employer in Urban Honolulu
Among the 178,314 employed individuals in Urban Honolulu, private company employees (101,728 | 57.1%), federal government employees (19,123 | 10.7%), and state government employees (17,637 | 9.9%) make up the most common classes of employment.
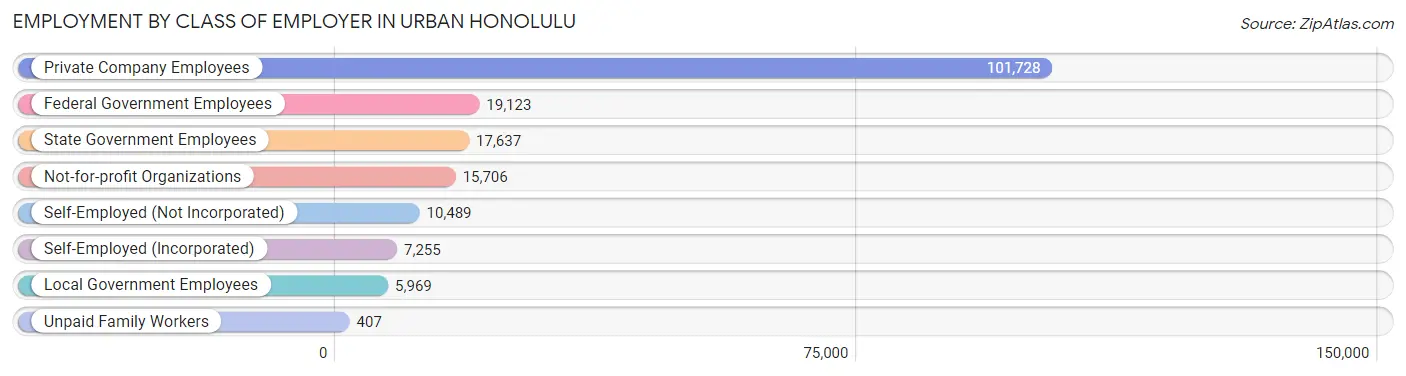
| Employer Class | # Employees | % Employees |
| Private Company Employees | 101,728 | 57.1% |
| Self-Employed (Incorporated) | 7,255 | 4.1% |
| Self-Employed (Not Incorporated) | 10,489 | 5.9% |
| Not-for-profit Organizations | 15,706 | 8.8% |
| Local Government Employees | 5,969 | 3.4% |
| State Government Employees | 17,637 | 9.9% |
| Federal Government Employees | 19,123 | 10.7% |
| Unpaid Family Workers | 407 | 0.2% |
| Total | 178,314 | 100.0% |
Employment Status by Age in Urban Honolulu
According to the labor force statistics for Urban Honolulu, out of the total population over 16 years of age (296,852), 64.8% or 192,360 individuals are in the labor force, with 5.1% or 9,810 of them unemployed. The age group with the highest labor force participation rate is 25 to 29 years, with 85.3% or 22,889 individuals in the labor force. Within the labor force, the 16 to 19 years age range has the highest percentage of unemployed individuals, with 16.5% or 867 of them being unemployed.
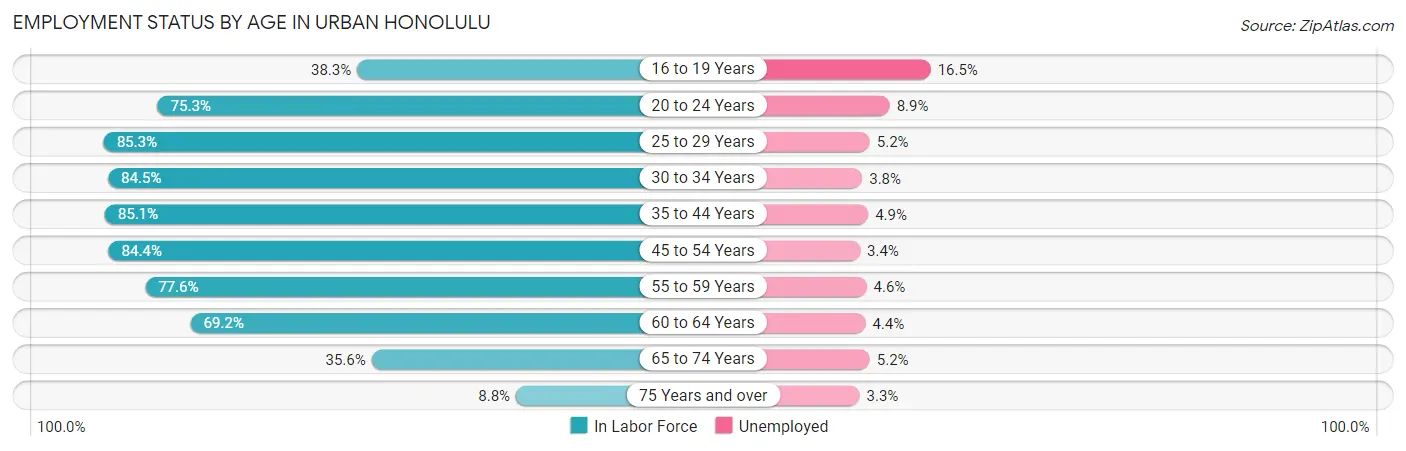
| Age Bracket | In Labor Force | Unemployed |
| 16 to 19 Years | 5,252 (38.3%) | 867 (16.5%) |
| 20 to 24 Years | 15,858 (75.3%) | 1,411 (8.9%) |
| 25 to 29 Years | 22,889 (85.3%) | 1,190 (5.2%) |
| 30 to 34 Years | 21,154 (84.5%) | 804 (3.8%) |
| 35 to 44 Years | 40,102 (85.1%) | 1,965 (4.9%) |
| 45 to 54 Years | 37,924 (84.4%) | 1,289 (3.4%) |
| 55 to 59 Years | 16,447 (77.6%) | 757 (4.6%) |
| 60 to 64 Years | 15,645 (69.2%) | 688 (4.4%) |
| 65 to 74 Years | 14,121 (35.6%) | 734 (5.2%) |
| 75 Years and over | 3,052 (8.8%) | 101 (3.3%) |
| Total | 192,360 (64.8%) | 9,810 (5.1%) |
Employment Status by Educational Attainment in Urban Honolulu
According to labor force statistics for Urban Honolulu, 82.1% of individuals (154,124) out of the total population between 25 and 64 years of age (187,727) are in the labor force, with 4.3% or 6,627 of them being unemployed. The group with the highest labor force participation rate are those with the educational attainment of bachelor's degree or higher, with 88.6% or 68,995 individuals in the labor force. Within the labor force, individuals with high school diploma education have the highest percentage of unemployment, with 7.0% or 2,114 of them being unemployed.
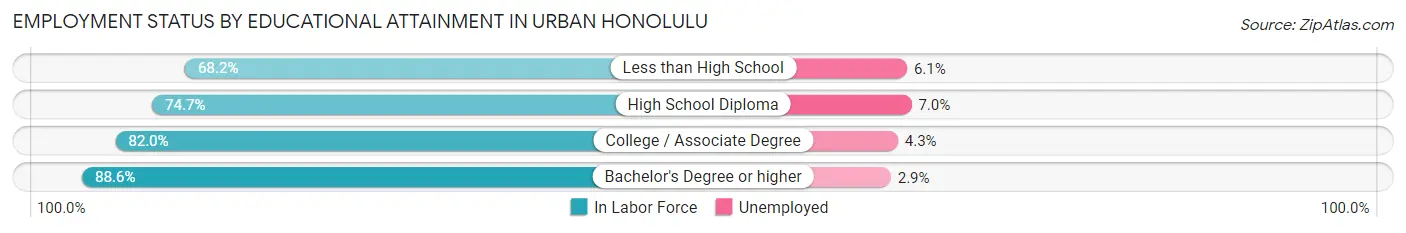
| Educational Attainment | In Labor Force | Unemployed |
| Less than High School | 9,522 (68.2%) | 852 (6.1%) |
| High School Diploma | 30,206 (74.7%) | 2,831 (7.0%) |
| College / Associate Degree | 45,475 (82.0%) | 2,385 (4.3%) |
| Bachelor's Degree or higher | 68,995 (88.6%) | 2,258 (2.9%) |
| Total | 154,124 (82.1%) | 8,072 (4.3%) |
Employment Occupations by Sex in Urban Honolulu
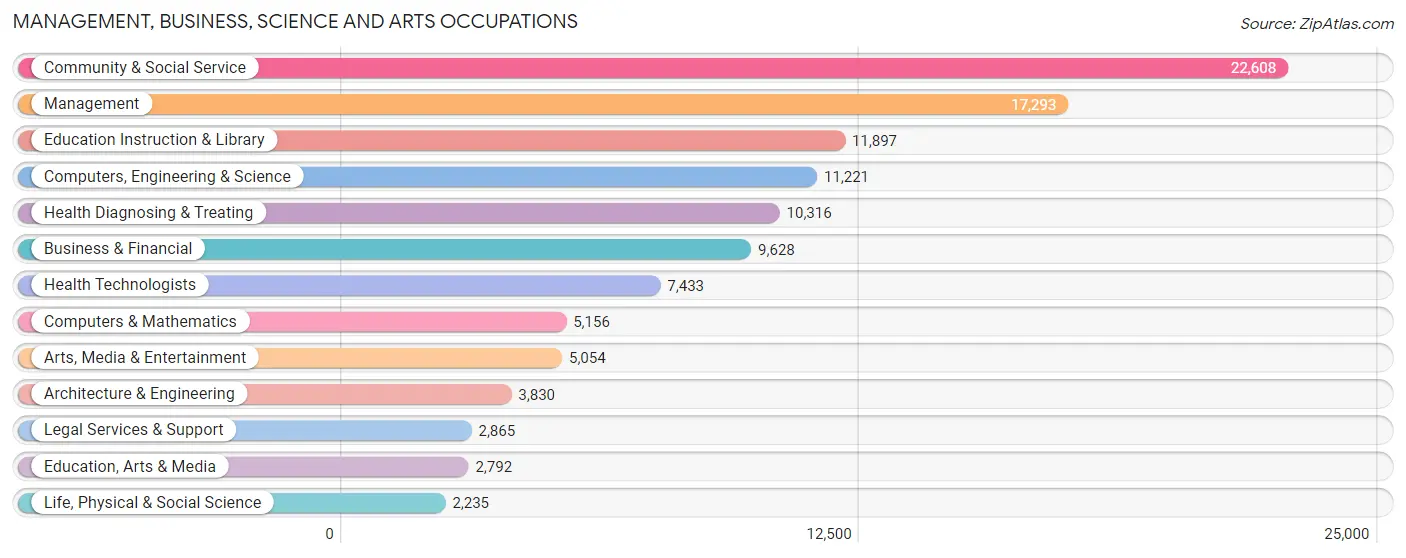
Management, Business, Science and Arts Occupations
The most common Management, Business, Science and Arts occupations in Urban Honolulu are Community & Social Service (22,608 | 12.9%), Management (17,293 | 9.9%), Education Instruction & Library (11,897 | 6.8%), Computers, Engineering & Science (11,221 | 6.4%), and Health Diagnosing & Treating (10,316 | 5.9%).
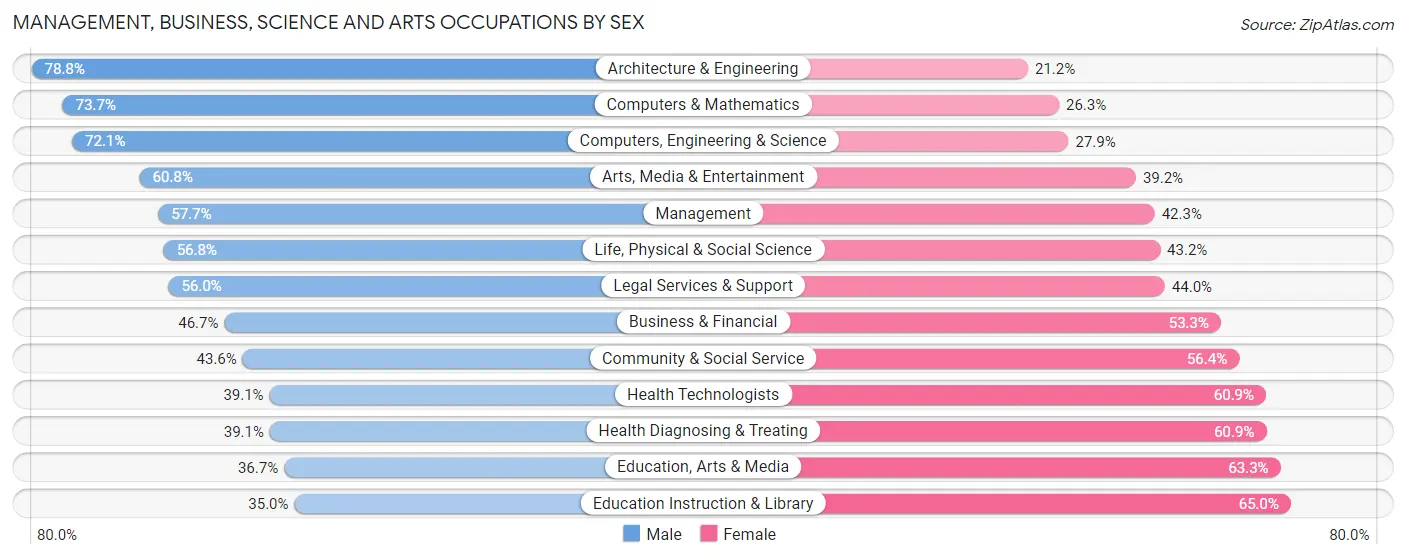
Management, Business, Science and Arts Occupations by Sex
Within the Management, Business, Science and Arts occupations in Urban Honolulu, the most male-oriented occupations are Architecture & Engineering (78.8%), Computers & Mathematics (73.7%), and Computers, Engineering & Science (72.1%), while the most female-oriented occupations are Education Instruction & Library (65.0%), Education, Arts & Media (63.3%), and Health Diagnosing & Treating (60.9%).
| Occupation | Male | Female |
| Management | 9,974 (57.7%) | 7,319 (42.3%) |
| Business & Financial | 4,493 (46.7%) | 5,135 (53.3%) |
| Computers, Engineering & Science | 8,086 (72.1%) | 3,135 (27.9%) |
| Computers & Mathematics | 3,798 (73.7%) | 1,358 (26.3%) |
| Architecture & Engineering | 3,019 (78.8%) | 811 (21.2%) |
| Life, Physical & Social Science | 1,269 (56.8%) | 966 (43.2%) |
| Community & Social Service | 9,864 (43.6%) | 12,744 (56.4%) |
| Education, Arts & Media | 1,025 (36.7%) | 1,767 (63.3%) |
| Legal Services & Support | 1,604 (56.0%) | 1,261 (44.0%) |
| Education Instruction & Library | 4,161 (35.0%) | 7,736 (65.0%) |
| Arts, Media & Entertainment | 3,074 (60.8%) | 1,980 (39.2%) |
| Health Diagnosing & Treating | 4,032 (39.1%) | 6,284 (60.9%) |
| Health Technologists | 2,909 (39.1%) | 4,524 (60.9%) |
| Total (Category) | 36,449 (51.3%) | 34,617 (48.7%) |
| Total (Overall) | 90,792 (52.0%) | 83,892 (48.0%) |
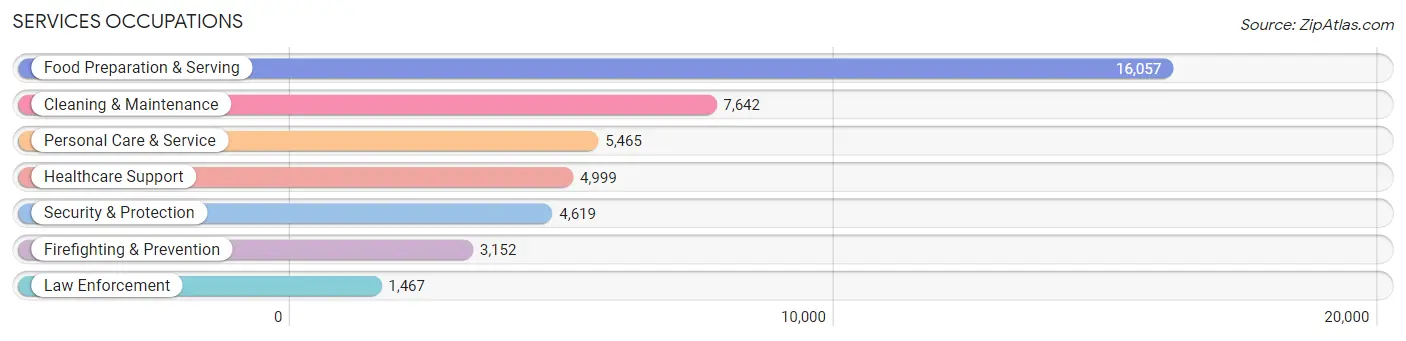
Services Occupations
The most common Services occupations in Urban Honolulu are Food Preparation & Serving (16,057 | 9.2%), Cleaning & Maintenance (7,642 | 4.4%), Personal Care & Service (5,465 | 3.1%), Healthcare Support (4,999 | 2.9%), and Security & Protection (4,619 | 2.6%).
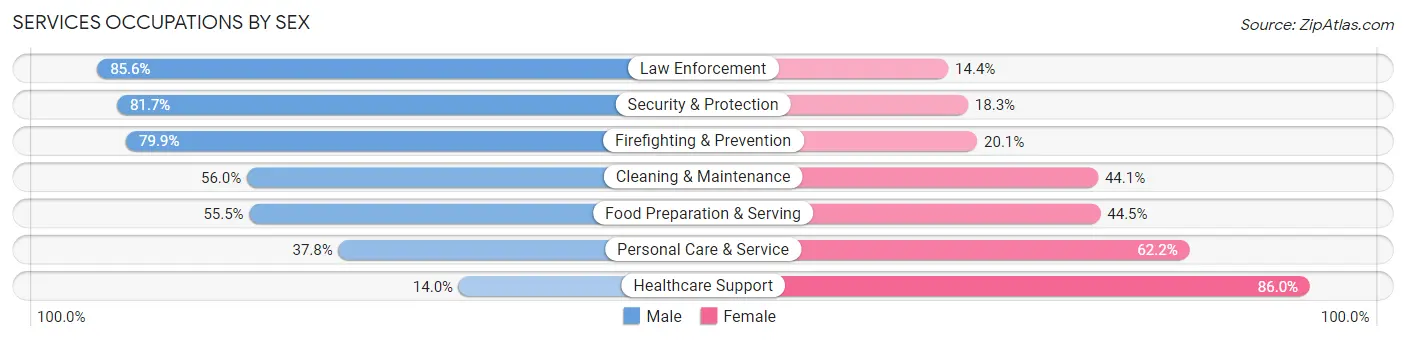
Services Occupations by Sex
Within the Services occupations in Urban Honolulu, the most male-oriented occupations are Law Enforcement (85.6%), Security & Protection (81.7%), and Firefighting & Prevention (79.9%), while the most female-oriented occupations are Healthcare Support (86.0%), Personal Care & Service (62.2%), and Food Preparation & Serving (44.5%).
| Occupation | Male | Female |
| Healthcare Support | 700 (14.0%) | 4,299 (86.0%) |
| Security & Protection | 3,774 (81.7%) | 845 (18.3%) |
| Firefighting & Prevention | 2,518 (79.9%) | 634 (20.1%) |
| Law Enforcement | 1,256 (85.6%) | 211 (14.4%) |
| Food Preparation & Serving | 8,909 (55.5%) | 7,148 (44.5%) |
| Cleaning & Maintenance | 4,276 (55.9%) | 3,366 (44.1%) |
| Personal Care & Service | 2,068 (37.8%) | 3,397 (62.2%) |
| Total (Category) | 19,727 (50.9%) | 19,055 (49.1%) |
| Total (Overall) | 90,792 (52.0%) | 83,892 (48.0%) |
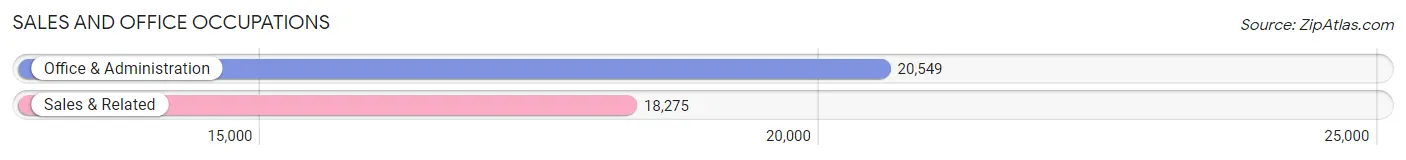
Sales and Office Occupations
The most common Sales and Office occupations in Urban Honolulu are Office & Administration (20,549 | 11.8%), and Sales & Related (18,275 | 10.5%).
Sales and Office Occupations by Sex
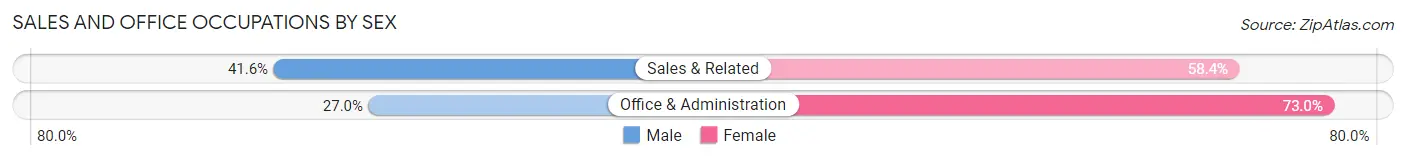
| Occupation | Male | Female |
| Sales & Related | 7,609 (41.6%) | 10,666 (58.4%) |
| Office & Administration | 5,557 (27.0%) | 14,992 (73.0%) |
| Total (Category) | 13,166 (33.9%) | 25,658 (66.1%) |
| Total (Overall) | 90,792 (52.0%) | 83,892 (48.0%) |
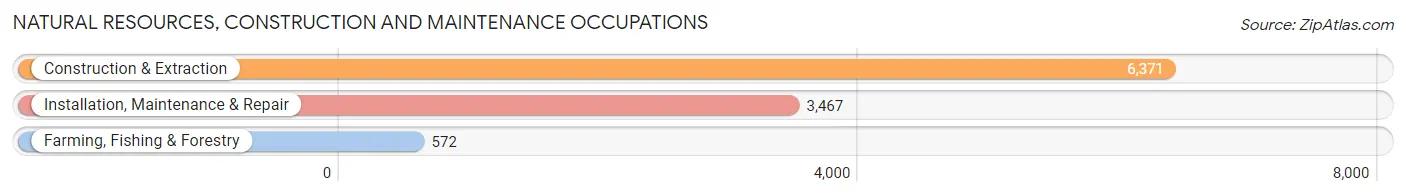
Natural Resources, Construction and Maintenance Occupations
The most common Natural Resources, Construction and Maintenance occupations in Urban Honolulu are Construction & Extraction (6,371 | 3.6%), Installation, Maintenance & Repair (3,467 | 2.0%), and Farming, Fishing & Forestry (572 | 0.3%).
Natural Resources, Construction and Maintenance Occupations by Sex
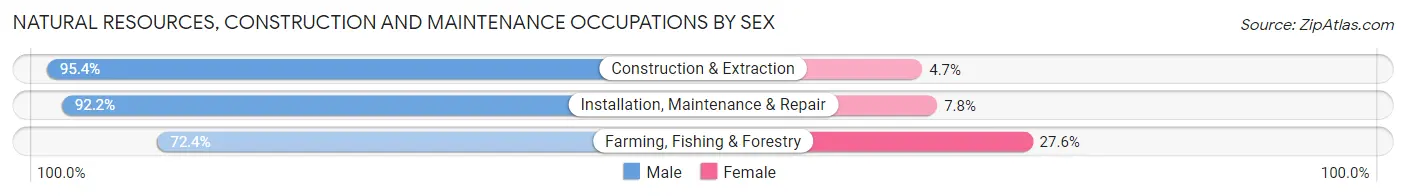
| Occupation | Male | Female |
| Farming, Fishing & Forestry | 414 (72.4%) | 158 (27.6%) |
| Construction & Extraction | 6,075 (95.4%) | 296 (4.6%) |
| Installation, Maintenance & Repair | 3,198 (92.2%) | 269 (7.8%) |
| Total (Category) | 9,687 (93.0%) | 723 (7.0%) |
| Total (Overall) | 90,792 (52.0%) | 83,892 (48.0%) |
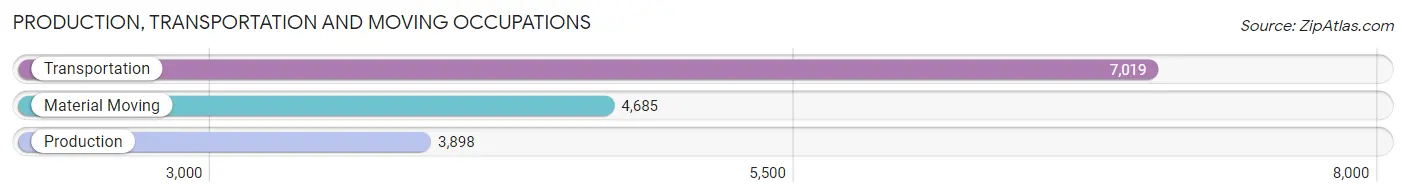
Production, Transportation and Moving Occupations
The most common Production, Transportation and Moving occupations in Urban Honolulu are Transportation (7,019 | 4.0%), Material Moving (4,685 | 2.7%), and Production (3,898 | 2.2%).
Production, Transportation and Moving Occupations by Sex
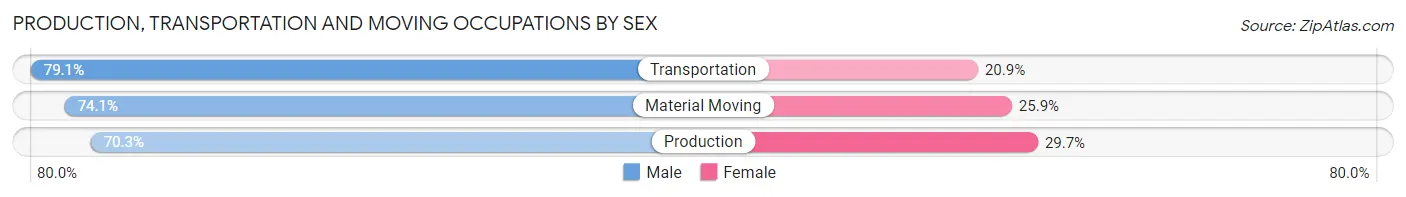
| Occupation | Male | Female |
| Production | 2,740 (70.3%) | 1,158 (29.7%) |
| Transportation | 5,551 (79.1%) | 1,468 (20.9%) |
| Material Moving | 3,472 (74.1%) | 1,213 (25.9%) |
| Total (Category) | 11,763 (75.4%) | 3,839 (24.6%) |
| Total (Overall) | 90,792 (52.0%) | 83,892 (48.0%) |
Employment Industries by Sex in Urban Honolulu
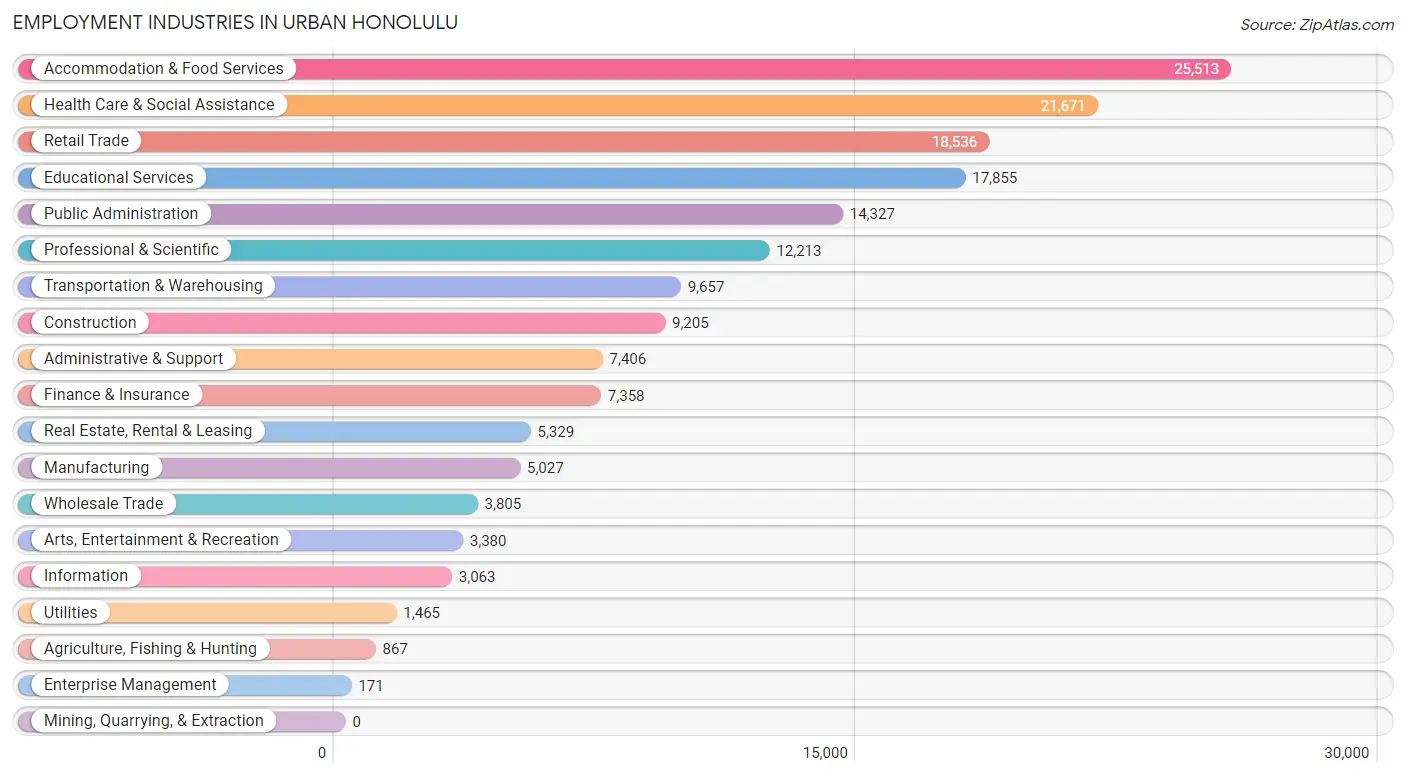
Employment Industries in Urban Honolulu
The major employment industries in Urban Honolulu include Accommodation & Food Services (25,513 | 14.6%), Health Care & Social Assistance (21,671 | 12.4%), Retail Trade (18,536 | 10.6%), Educational Services (17,855 | 10.2%), and Public Administration (14,327 | 8.2%).
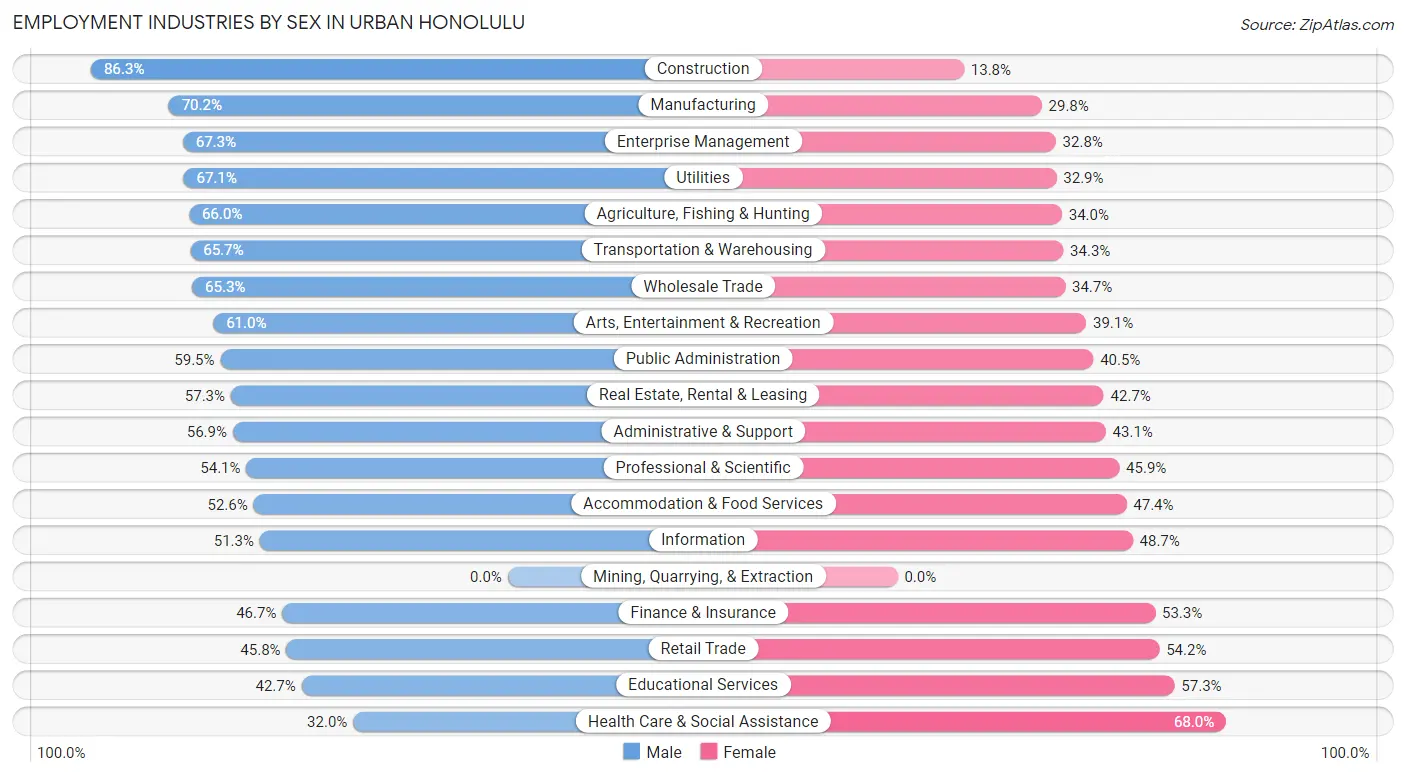
Employment Industries by Sex in Urban Honolulu
The Urban Honolulu industries that see more men than women are Construction (86.3%), Manufacturing (70.2%), and Enterprise Management (67.2%), whereas the industries that tend to have a higher number of women are Health Care & Social Assistance (68.0%), Educational Services (57.3%), and Retail Trade (54.2%).
| Industry | Male | Female |
| Agriculture, Fishing & Hunting | 572 (66.0%) | 295 (34.0%) |
| Mining, Quarrying, & Extraction | 0 (0.0%) | 0 (0.0%) |
| Construction | 7,939 (86.3%) | 1,266 (13.8%) |
| Manufacturing | 3,527 (70.2%) | 1,500 (29.8%) |
| Wholesale Trade | 2,485 (65.3%) | 1,320 (34.7%) |
| Retail Trade | 8,492 (45.8%) | 10,044 (54.2%) |
| Transportation & Warehousing | 6,344 (65.7%) | 3,313 (34.3%) |
| Utilities | 983 (67.1%) | 482 (32.9%) |
| Information | 1,572 (51.3%) | 1,491 (48.7%) |
| Finance & Insurance | 3,434 (46.7%) | 3,924 (53.3%) |
| Real Estate, Rental & Leasing | 3,054 (57.3%) | 2,275 (42.7%) |
| Professional & Scientific | 6,607 (54.1%) | 5,606 (45.9%) |
| Enterprise Management | 115 (67.2%) | 56 (32.8%) |
| Administrative & Support | 4,214 (56.9%) | 3,192 (43.1%) |
| Educational Services | 7,618 (42.7%) | 10,237 (57.3%) |
| Health Care & Social Assistance | 6,932 (32.0%) | 14,739 (68.0%) |
| Arts, Entertainment & Recreation | 2,060 (61.0%) | 1,320 (39.1%) |
| Accommodation & Food Services | 13,422 (52.6%) | 12,091 (47.4%) |
| Public Administration | 8,522 (59.5%) | 5,805 (40.5%) |
| Total | 90,792 (52.0%) | 83,892 (48.0%) |
Education in Urban Honolulu
School Enrollment in Urban Honolulu
The most common levels of schooling among the 71,957 students in Urban Honolulu are college / undergraduate (20,446 | 28.4%), high school (13,211 | 18.4%), and elementary school (12,443 | 17.3%).
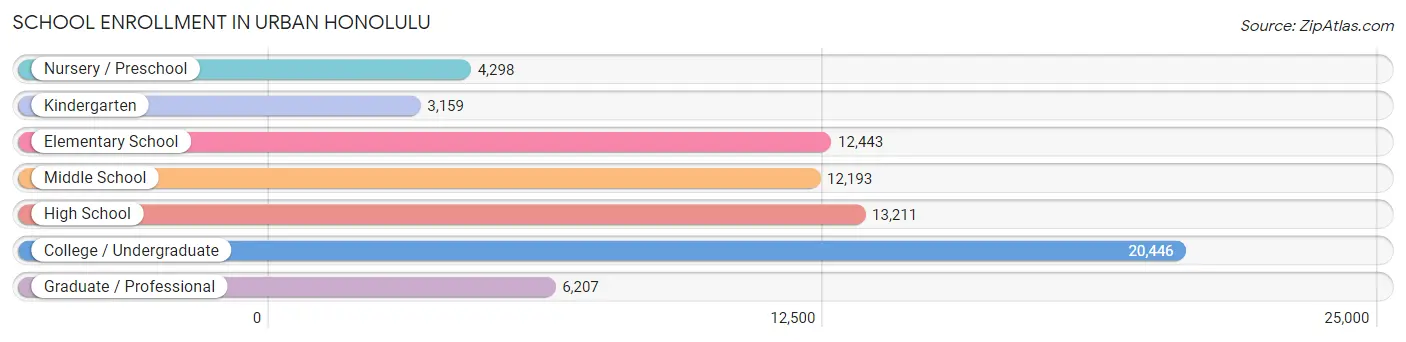
| School Level | # Students | % Students |
| Nursery / Preschool | 4,298 | 6.0% |
| Kindergarten | 3,159 | 4.4% |
| Elementary School | 12,443 | 17.3% |
| Middle School | 12,193 | 16.9% |
| High School | 13,211 | 18.4% |
| College / Undergraduate | 20,446 | 28.4% |
| Graduate / Professional | 6,207 | 8.6% |
| Total | 71,957 | 100.0% |
School Enrollment by Age by Funding Source in Urban Honolulu
Out of a total of 71,957 students who are enrolled in schools in Urban Honolulu, 18,997 (26.4%) attend a private institution, while the remaining 52,960 (73.6%) are enrolled in public schools. The age group of 3 to 4 year olds has the highest likelihood of being enrolled in private schools, with 2,422 (66.4% in the age bracket) enrolled. Conversely, the age group of 20 to 24 year olds has the lowest likelihood of being enrolled in a private school, with 7,503 (83.8% in the age bracket) attending a public institution.
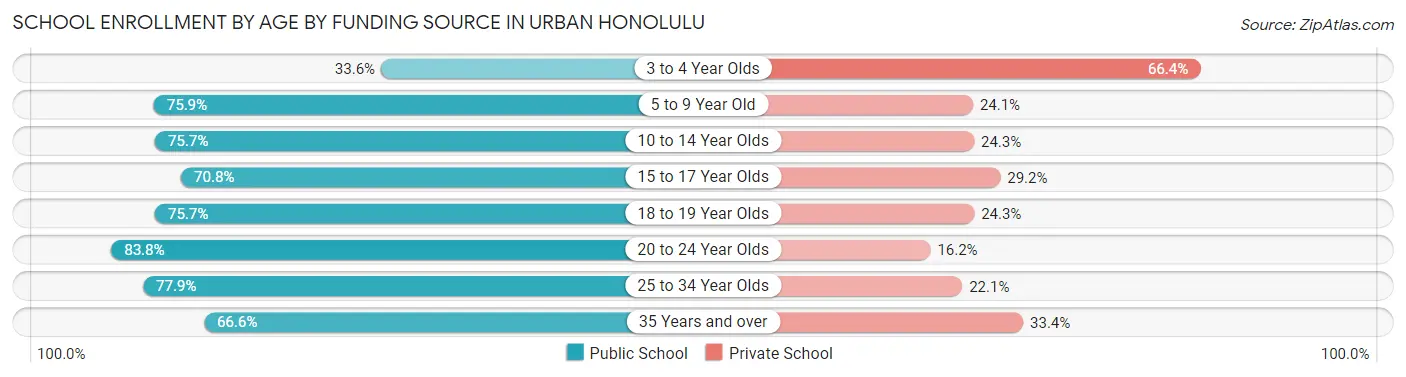
| Age Bracket | Public School | Private School |
| 3 to 4 Year Olds | 1,227 (33.6%) | 2,422 (66.4%) |
| 5 to 9 Year Old | 11,369 (75.9%) | 3,605 (24.1%) |
| 10 to 14 Year Olds | 11,904 (75.7%) | 3,820 (24.3%) |
| 15 to 17 Year Olds | 6,499 (70.8%) | 2,677 (29.2%) |
| 18 to 19 Year Olds | 3,866 (75.7%) | 1,242 (24.3%) |
| 20 to 24 Year Olds | 7,503 (83.8%) | 1,446 (16.2%) |
| 25 to 34 Year Olds | 6,849 (77.9%) | 1,941 (22.1%) |
| 35 Years and over | 3,720 (66.6%) | 1,867 (33.4%) |
| Total | 52,960 (73.6%) | 18,997 (26.4%) |
Educational Attainment by Field of Study in Urban Honolulu
Business (21,111 | 19.1%), social sciences (12,217 | 11.1%), science & technology (9,892 | 9.0%), education (9,661 | 8.7%), and engineering (7,823 | 7.1%) are the most common fields of study among 110,409 individuals in Urban Honolulu who have obtained a bachelor's degree or higher.
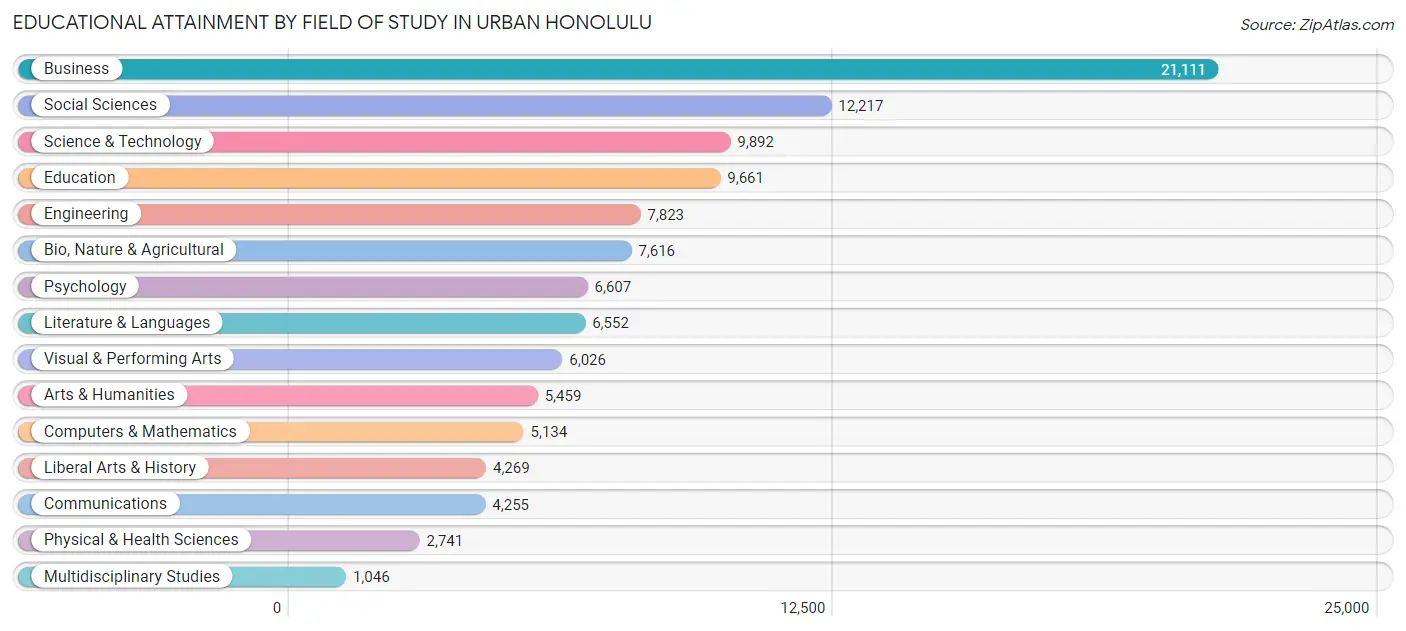
| Field of Study | # Graduates | % Graduates |
| Computers & Mathematics | 5,134 | 4.6% |
| Bio, Nature & Agricultural | 7,616 | 6.9% |
| Physical & Health Sciences | 2,741 | 2.5% |
| Psychology | 6,607 | 6.0% |
| Social Sciences | 12,217 | 11.1% |
| Engineering | 7,823 | 7.1% |
| Multidisciplinary Studies | 1,046 | 0.9% |
| Science & Technology | 9,892 | 9.0% |
| Business | 21,111 | 19.1% |
| Education | 9,661 | 8.7% |
| Literature & Languages | 6,552 | 5.9% |
| Liberal Arts & History | 4,269 | 3.9% |
| Visual & Performing Arts | 6,026 | 5.5% |
| Communications | 4,255 | 3.8% |
| Arts & Humanities | 5,459 | 4.9% |
| Total | 110,409 | 100.0% |
Transportation & Commute in Urban Honolulu
Vehicle Availability by Sex in Urban Honolulu
The most prevalent vehicle ownership categories in Urban Honolulu are males with 1 vehicle (30,975, accounting for 32.8%) and females with 1 vehicle (28,798, making up 37.9%).
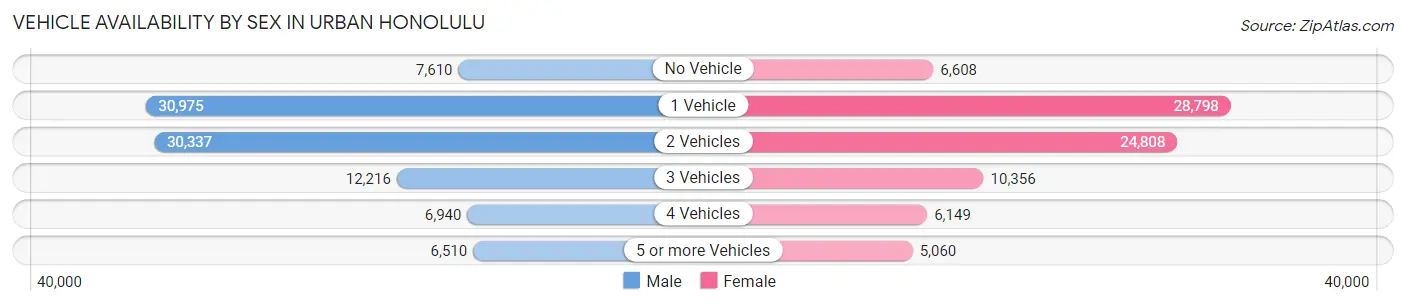
| Vehicles Available | Male | Female |
| No Vehicle | 7,610 (8.1%) | 6,608 (8.1%) |
| 1 Vehicle | 30,975 (32.8%) | 28,798 (35.2%) |
| 2 Vehicles | 30,337 (32.1%) | 24,808 (30.3%) |
| 3 Vehicles | 12,216 (12.9%) | 10,356 (12.7%) |
| 4 Vehicles | 6,940 (7.3%) | 6,149 (7.5%) |
| 5 or more Vehicles | 6,510 (6.9%) | 5,060 (6.2%) |
| Total | 94,588 (100.0%) | 81,779 (100.0%) |
Commute Time in Urban Honolulu
The most frequently occuring commute durations in Urban Honolulu are 15 to 19 minutes (35,918 commuters, 21.8%), 20 to 24 minutes (28,874 commuters, 17.5%), and 10 to 14 minutes (27,540 commuters, 16.7%).
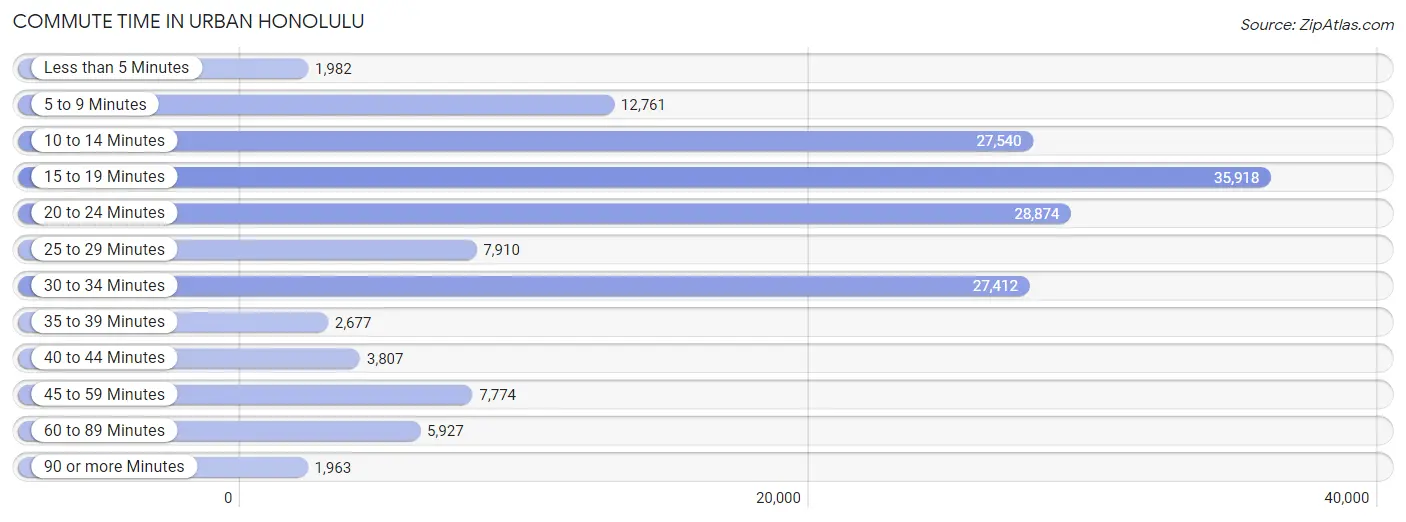
| Commute Time | # Commuters | % Commuters |
| Less than 5 Minutes | 1,982 | 1.2% |
| 5 to 9 Minutes | 12,761 | 7.8% |
| 10 to 14 Minutes | 27,540 | 16.7% |
| 15 to 19 Minutes | 35,918 | 21.8% |
| 20 to 24 Minutes | 28,874 | 17.5% |
| 25 to 29 Minutes | 7,910 | 4.8% |
| 30 to 34 Minutes | 27,412 | 16.7% |
| 35 to 39 Minutes | 2,677 | 1.6% |
| 40 to 44 Minutes | 3,807 | 2.3% |
| 45 to 59 Minutes | 7,774 | 4.7% |
| 60 to 89 Minutes | 5,927 | 3.6% |
| 90 or more Minutes | 1,963 | 1.2% |
Commute Time by Sex in Urban Honolulu
The most common commute times in Urban Honolulu are 15 to 19 minutes (18,863 commuters, 21.1%) for males and 15 to 19 minutes (17,055 commuters, 22.7%) for females.
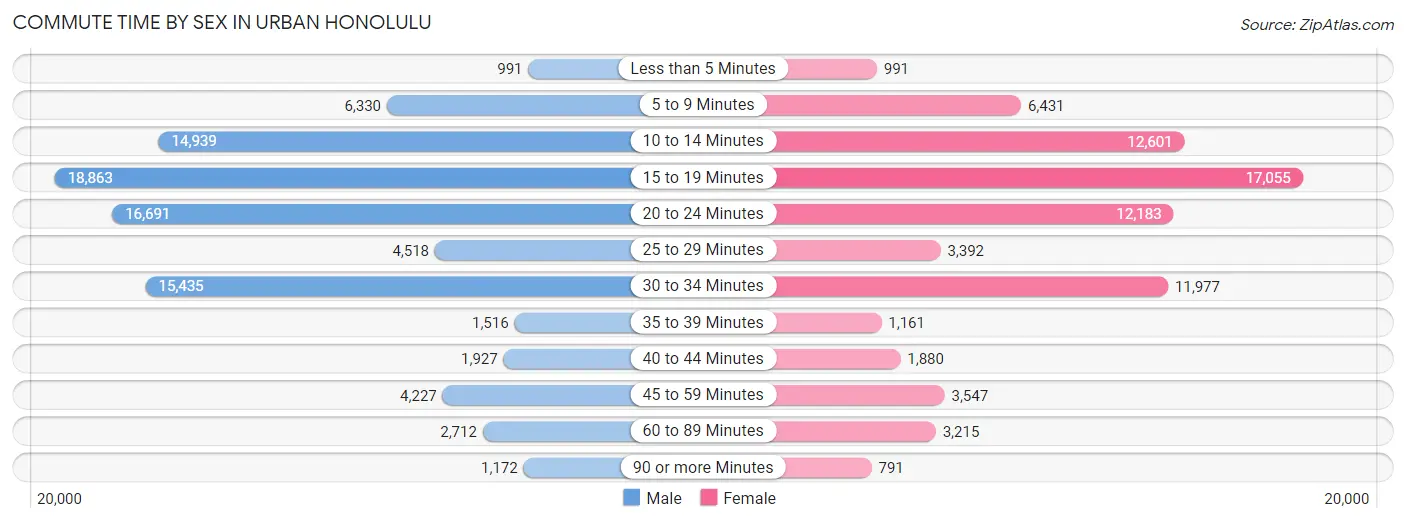
| Commute Time | Male | Female |
| Less than 5 Minutes | 991 (1.1%) | 991 (1.3%) |
| 5 to 9 Minutes | 6,330 (7.1%) | 6,431 (8.6%) |
| 10 to 14 Minutes | 14,939 (16.7%) | 12,601 (16.8%) |
| 15 to 19 Minutes | 18,863 (21.1%) | 17,055 (22.7%) |
| 20 to 24 Minutes | 16,691 (18.7%) | 12,183 (16.2%) |
| 25 to 29 Minutes | 4,518 (5.1%) | 3,392 (4.5%) |
| 30 to 34 Minutes | 15,435 (17.3%) | 11,977 (15.9%) |
| 35 to 39 Minutes | 1,516 (1.7%) | 1,161 (1.5%) |
| 40 to 44 Minutes | 1,927 (2.2%) | 1,880 (2.5%) |
| 45 to 59 Minutes | 4,227 (4.7%) | 3,547 (4.7%) |
| 60 to 89 Minutes | 2,712 (3.0%) | 3,215 (4.3%) |
| 90 or more Minutes | 1,172 (1.3%) | 791 (1.1%) |
Time of Departure to Work by Sex in Urban Honolulu
The most frequent times of departure to work in Urban Honolulu are 7:00 AM to 7:29 AM (11,678, 13.1%) for males and 7:00 AM to 7:29 AM (12,270, 16.3%) for females.
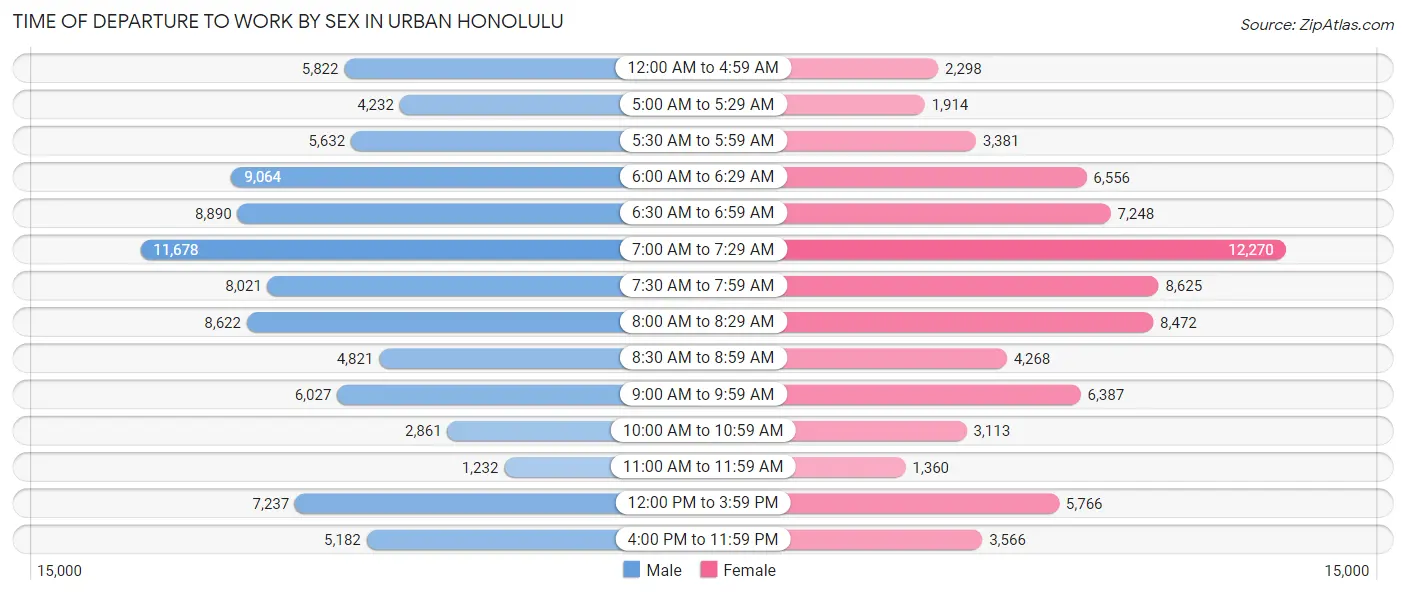
| Time of Departure | Male | Female |
| 12:00 AM to 4:59 AM | 5,822 (6.5%) | 2,298 (3.0%) |
| 5:00 AM to 5:29 AM | 4,232 (4.7%) | 1,914 (2.5%) |
| 5:30 AM to 5:59 AM | 5,632 (6.3%) | 3,381 (4.5%) |
| 6:00 AM to 6:29 AM | 9,064 (10.2%) | 6,556 (8.7%) |
| 6:30 AM to 6:59 AM | 8,890 (10.0%) | 7,248 (9.6%) |
| 7:00 AM to 7:29 AM | 11,678 (13.1%) | 12,270 (16.3%) |
| 7:30 AM to 7:59 AM | 8,021 (9.0%) | 8,625 (11.5%) |
| 8:00 AM to 8:29 AM | 8,622 (9.7%) | 8,472 (11.3%) |
| 8:30 AM to 8:59 AM | 4,821 (5.4%) | 4,268 (5.7%) |
| 9:00 AM to 9:59 AM | 6,027 (6.8%) | 6,387 (8.5%) |
| 10:00 AM to 10:59 AM | 2,861 (3.2%) | 3,113 (4.1%) |
| 11:00 AM to 11:59 AM | 1,232 (1.4%) | 1,360 (1.8%) |
| 12:00 PM to 3:59 PM | 7,237 (8.1%) | 5,766 (7.7%) |
| 4:00 PM to 11:59 PM | 5,182 (5.8%) | 3,566 (4.7%) |
| Total | 89,321 (100.0%) | 75,224 (100.0%) |
Housing Occupancy in Urban Honolulu
Occupancy by Ownership in Urban Honolulu
Of the total 134,264 dwellings in Urban Honolulu, owner-occupied units account for 64,504 (48.0%), while renter-occupied units make up 69,760 (52.0%).
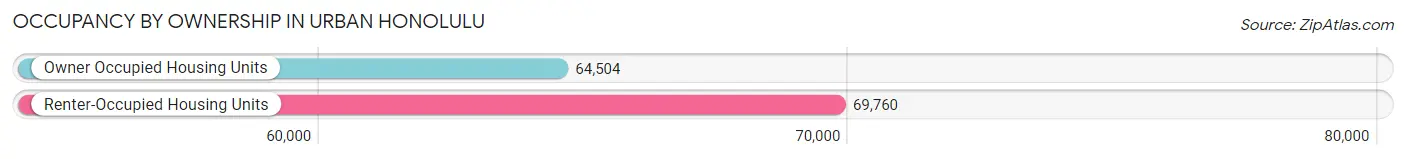
| Occupancy | # Housing Units | % Housing Units |
| Owner Occupied Housing Units | 64,504 | 48.0% |
| Renter-Occupied Housing Units | 69,760 | 52.0% |
| Total Occupied Housing Units | 134,264 | 100.0% |
Occupancy by Household Size in Urban Honolulu
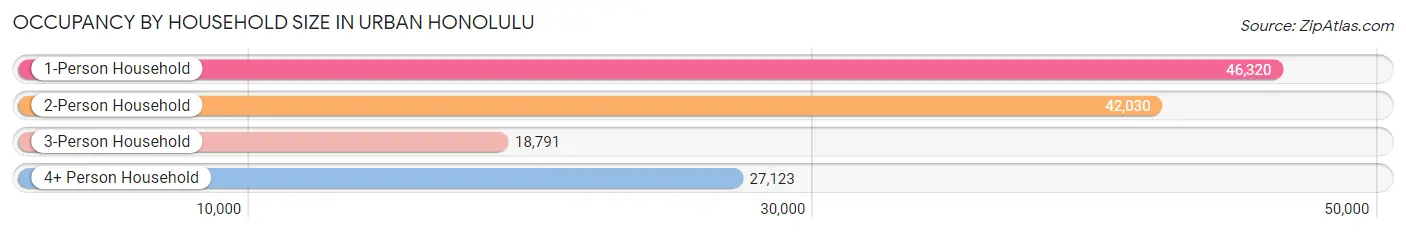
| Household Size | # Housing Units | % Housing Units |
| 1-Person Household | 46,320 | 34.5% |
| 2-Person Household | 42,030 | 31.3% |
| 3-Person Household | 18,791 | 14.0% |
| 4+ Person Household | 27,123 | 20.2% |
| Total Housing Units | 134,264 | 100.0% |
Occupancy by Ownership by Household Size in Urban Honolulu
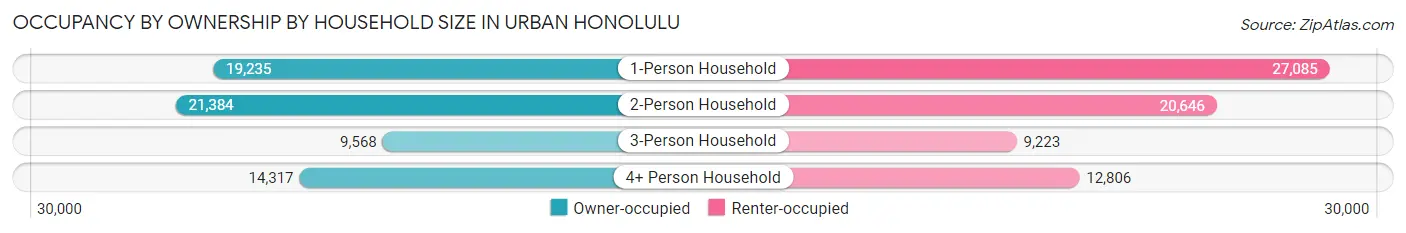
| Household Size | Owner-occupied | Renter-occupied |
| 1-Person Household | 19,235 (41.5%) | 27,085 (58.5%) |
| 2-Person Household | 21,384 (50.9%) | 20,646 (49.1%) |
| 3-Person Household | 9,568 (50.9%) | 9,223 (49.1%) |
| 4+ Person Household | 14,317 (52.8%) | 12,806 (47.2%) |
| Total Housing Units | 64,504 (48.0%) | 69,760 (52.0%) |
Occupancy by Educational Attainment in Urban Honolulu
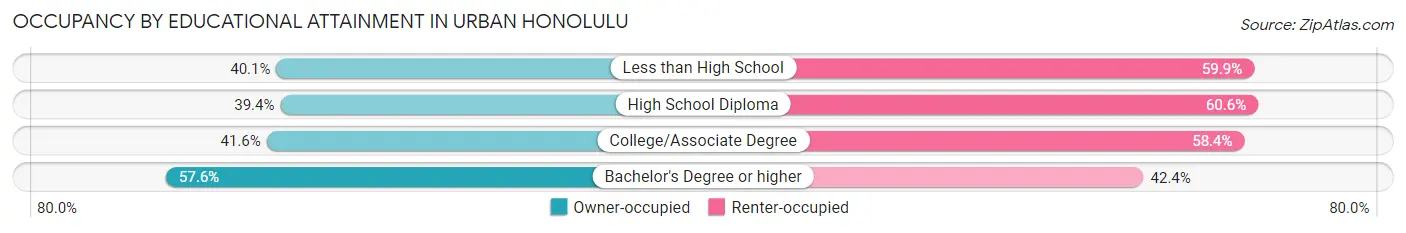
| Household Size | Owner-occupied | Renter-occupied |
| Less than High School | 3,788 (40.1%) | 5,662 (59.9%) |
| High School Diploma | 10,347 (39.4%) | 15,891 (60.6%) |
| College/Associate Degree | 16,658 (41.6%) | 23,368 (58.4%) |
| Bachelor's Degree or higher | 33,711 (57.6%) | 24,839 (42.4%) |
Occupancy by Age of Householder in Urban Honolulu
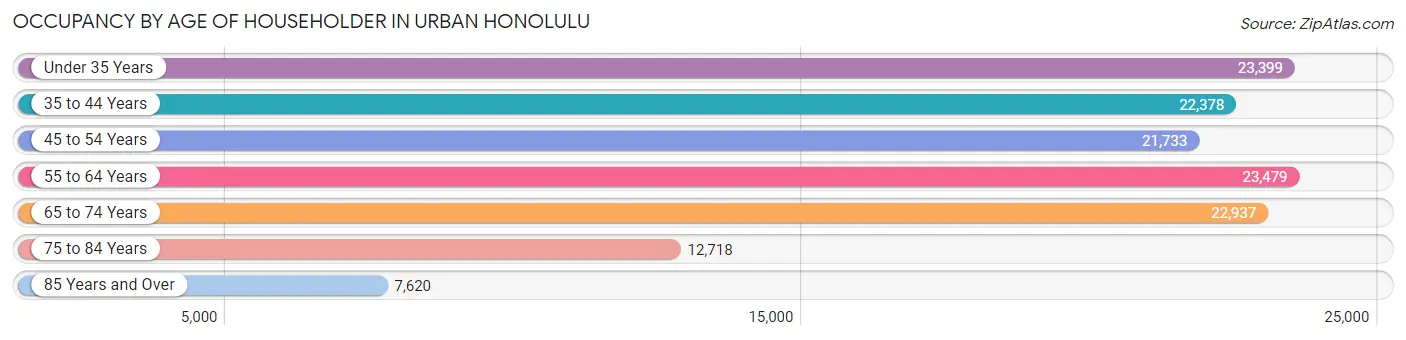
| Age Bracket | # Households | % Households |
| Under 35 Years | 23,399 | 17.4% |
| 35 to 44 Years | 22,378 | 16.7% |
| 45 to 54 Years | 21,733 | 16.2% |
| 55 to 64 Years | 23,479 | 17.5% |
| 65 to 74 Years | 22,937 | 17.1% |
| 75 to 84 Years | 12,718 | 9.5% |
| 85 Years and Over | 7,620 | 5.7% |
| Total | 134,264 | 100.0% |
Housing Finances in Urban Honolulu
Median Income by Occupancy in Urban Honolulu
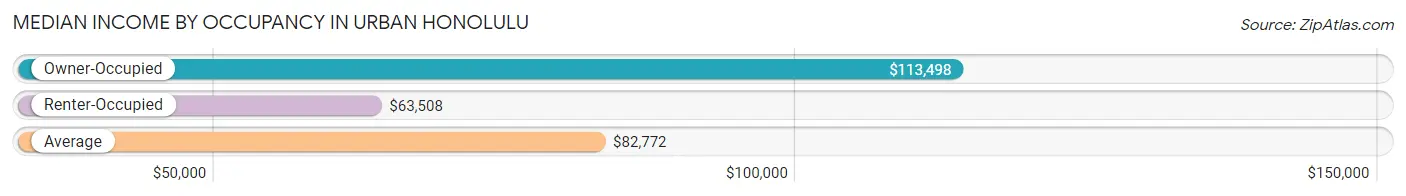
| Occupancy Type | # Households | Median Income |
| Owner-Occupied | 64,504 (48.0%) | $113,498 |
| Renter-Occupied | 69,760 (52.0%) | $63,508 |
| Average | 134,264 (100.0%) | $82,772 |
Occupancy by Householder Income Bracket in Urban Honolulu
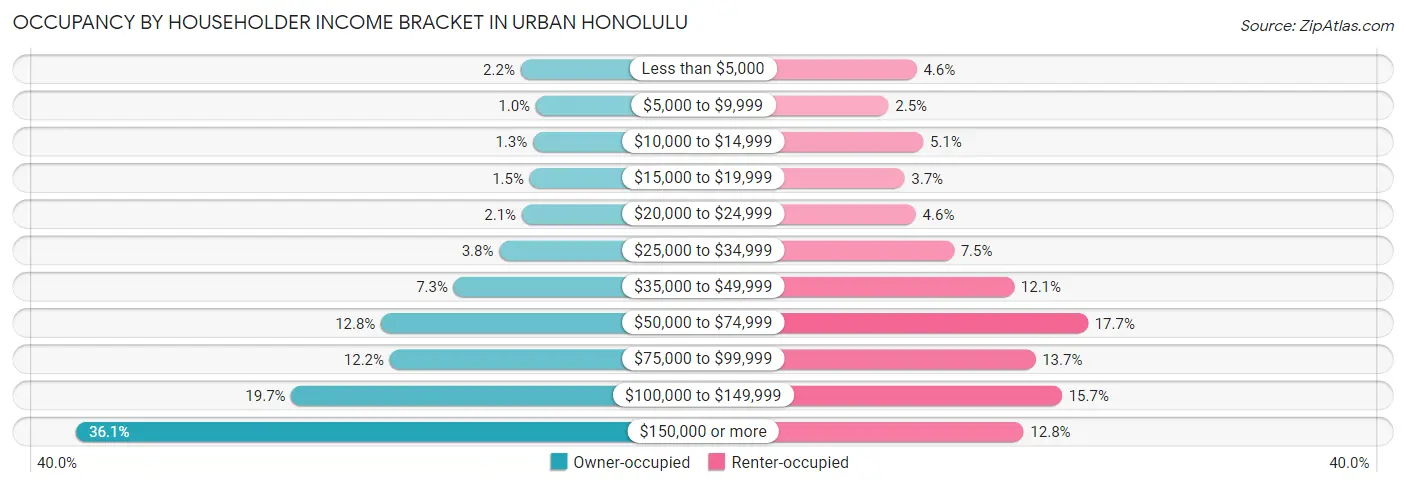
| Income Bracket | Owner-occupied | Renter-occupied |
| Less than $5,000 | 1,417 (2.2%) | 3,235 (4.6%) |
| $5,000 to $9,999 | 673 (1.0%) | 1,742 (2.5%) |
| $10,000 to $14,999 | 812 (1.3%) | 3,585 (5.1%) |
| $15,000 to $19,999 | 973 (1.5%) | 2,593 (3.7%) |
| $20,000 to $24,999 | 1,359 (2.1%) | 3,195 (4.6%) |
| $25,000 to $34,999 | 2,470 (3.8%) | 5,221 (7.5%) |
| $35,000 to $49,999 | 4,708 (7.3%) | 8,412 (12.1%) |
| $50,000 to $74,999 | 8,275 (12.8%) | 12,342 (17.7%) |
| $75,000 to $99,999 | 7,853 (12.2%) | 9,553 (13.7%) |
| $100,000 to $149,999 | 12,688 (19.7%) | 10,959 (15.7%) |
| $150,000 or more | 23,276 (36.1%) | 8,923 (12.8%) |
| Total | 64,504 (100.0%) | 69,760 (100.0%) |
Monthly Housing Cost Tiers in Urban Honolulu
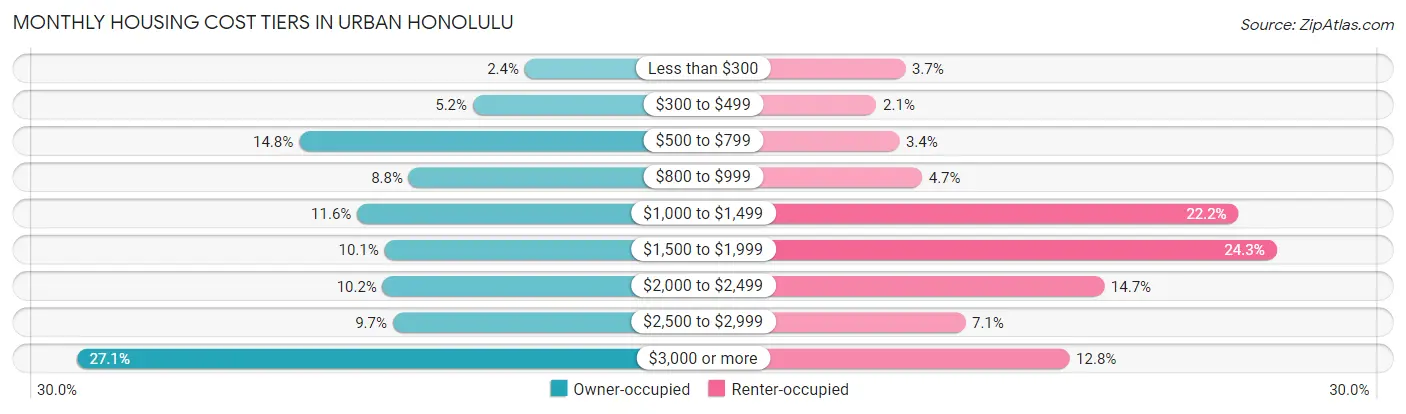
| Monthly Cost | Owner-occupied | Renter-occupied |
| Less than $300 | 1,527 (2.4%) | 2,603 (3.7%) |
| $300 to $499 | 3,378 (5.2%) | 1,494 (2.1%) |
| $500 to $799 | 9,575 (14.8%) | 2,370 (3.4%) |
| $800 to $999 | 5,666 (8.8%) | 3,252 (4.7%) |
| $1,000 to $1,499 | 7,504 (11.6%) | 15,449 (22.2%) |
| $1,500 to $1,999 | 6,529 (10.1%) | 16,916 (24.2%) |
| $2,000 to $2,499 | 6,593 (10.2%) | 10,270 (14.7%) |
| $2,500 to $2,999 | 6,229 (9.7%) | 4,920 (7.0%) |
| $3,000 or more | 17,503 (27.1%) | 8,927 (12.8%) |
| Total | 64,504 (100.0%) | 69,760 (100.0%) |
Physical Housing Characteristics in Urban Honolulu
Housing Structures in Urban Honolulu
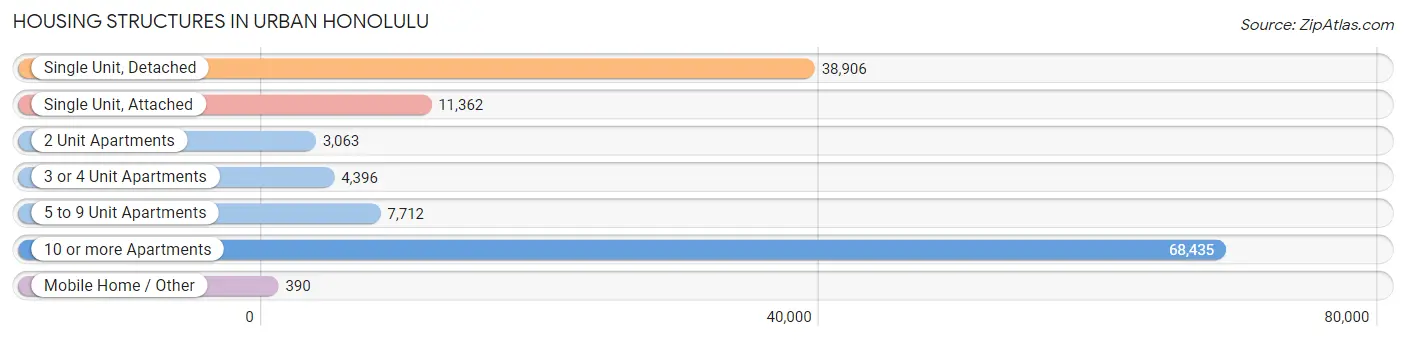
| Structure Type | # Housing Units | % Housing Units |
| Single Unit, Detached | 38,906 | 29.0% |
| Single Unit, Attached | 11,362 | 8.5% |
| 2 Unit Apartments | 3,063 | 2.3% |
| 3 or 4 Unit Apartments | 4,396 | 3.3% |
| 5 to 9 Unit Apartments | 7,712 | 5.7% |
| 10 or more Apartments | 68,435 | 51.0% |
| Mobile Home / Other | 390 | 0.3% |
| Total | 134,264 | 100.0% |
Housing Structures by Occupancy in Urban Honolulu
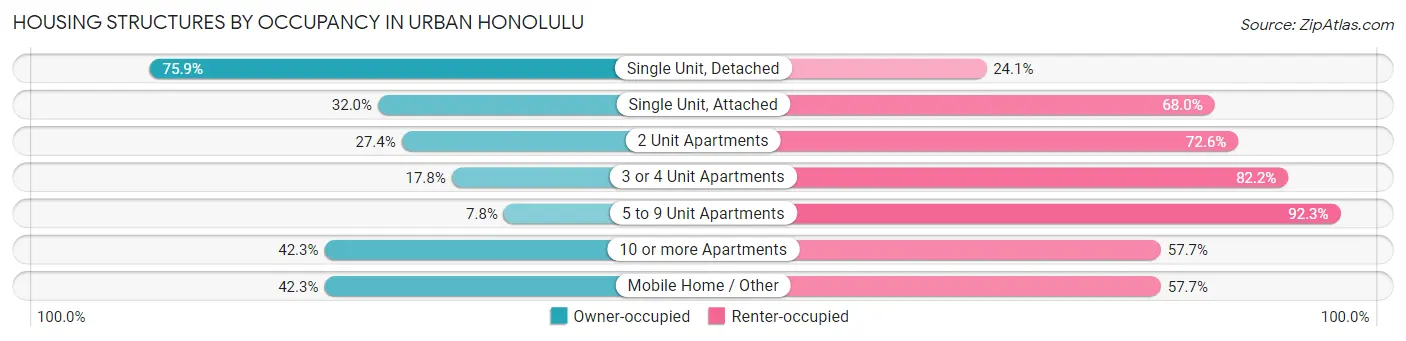
| Structure Type | Owner-occupied | Renter-occupied |
| Single Unit, Detached | 29,536 (75.9%) | 9,370 (24.1%) |
| Single Unit, Attached | 3,634 (32.0%) | 7,728 (68.0%) |
| 2 Unit Apartments | 840 (27.4%) | 2,223 (72.6%) |
| 3 or 4 Unit Apartments | 782 (17.8%) | 3,614 (82.2%) |
| 5 to 9 Unit Apartments | 598 (7.7%) | 7,114 (92.2%) |
| 10 or more Apartments | 28,949 (42.3%) | 39,486 (57.7%) |
| Mobile Home / Other | 165 (42.3%) | 225 (57.7%) |
| Total | 64,504 (48.0%) | 69,760 (52.0%) |
Housing Structures by Number of Rooms in Urban Honolulu
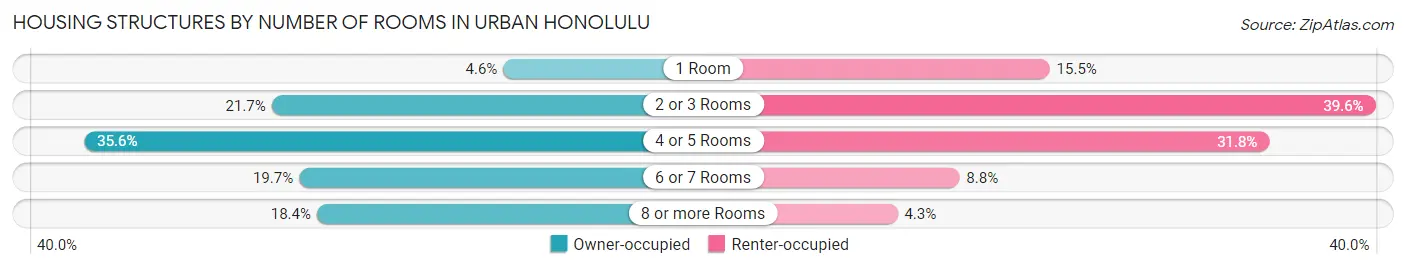
| Number of Rooms | Owner-occupied | Renter-occupied |
| 1 Room | 2,962 (4.6%) | 10,824 (15.5%) |
| 2 or 3 Rooms | 14,016 (21.7%) | 27,639 (39.6%) |
| 4 or 5 Rooms | 22,961 (35.6%) | 22,158 (31.8%) |
| 6 or 7 Rooms | 12,709 (19.7%) | 6,165 (8.8%) |
| 8 or more Rooms | 11,856 (18.4%) | 2,974 (4.3%) |
| Total | 64,504 (100.0%) | 69,760 (100.0%) |
Housing Structure by Heating Type in Urban Honolulu
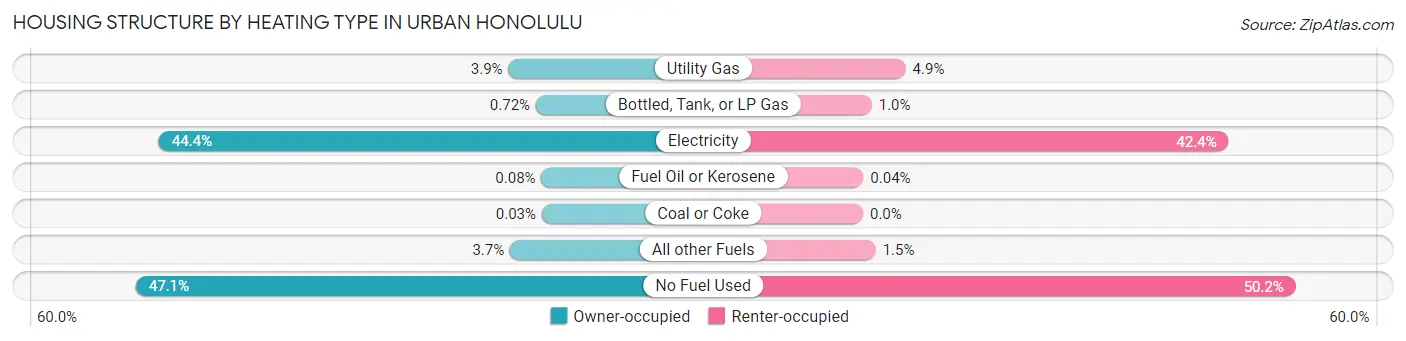
| Heating Type | Owner-occupied | Renter-occupied |
| Utility Gas | 2,518 (3.9%) | 3,443 (4.9%) |
| Bottled, Tank, or LP Gas | 464 (0.7%) | 708 (1.0%) |
| Electricity | 28,666 (44.4%) | 29,564 (42.4%) |
| Fuel Oil or Kerosene | 54 (0.1%) | 28 (0.0%) |
| Coal or Coke | 20 (0.0%) | 0 (0.0%) |
| All other Fuels | 2,399 (3.7%) | 1,027 (1.5%) |
| No Fuel Used | 30,383 (47.1%) | 34,990 (50.2%) |
| Total | 64,504 (100.0%) | 69,760 (100.0%) |
Household Vehicle Usage in Urban Honolulu
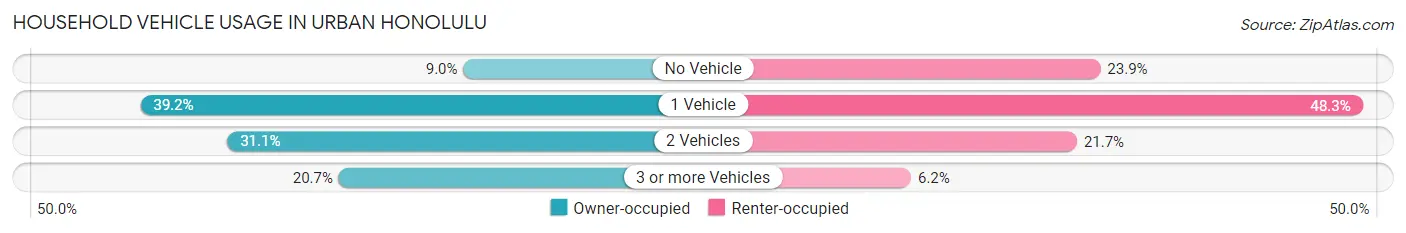
| Vehicles per Household | Owner-occupied | Renter-occupied |
| No Vehicle | 5,830 (9.0%) | 16,637 (23.8%) |
| 1 Vehicle | 25,287 (39.2%) | 33,711 (48.3%) |
| 2 Vehicles | 20,051 (31.1%) | 15,108 (21.7%) |
| 3 or more Vehicles | 13,336 (20.7%) | 4,304 (6.2%) |
| Total | 64,504 (100.0%) | 69,760 (100.0%) |
Real Estate & Mortgages in Urban Honolulu
Real Estate and Mortgage Overview in Urban Honolulu
| Characteristic | Without Mortgage | With Mortgage |
| Housing Units | 27,792 | 36,712 |
| Median Property Value | $796,900 | $812,600 |
| Median Household Income | $86,793 | $16,259 |
| Monthly Housing Costs | $798 | $17,167 |
| Real Estate Taxes | $2,370 | $2,027 |
Property Value by Mortgage Status in Urban Honolulu
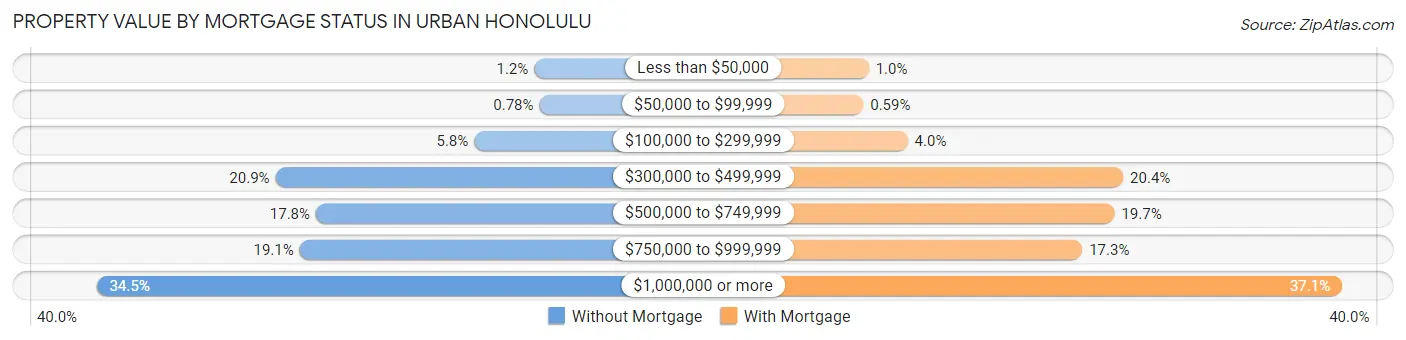
| Property Value | Without Mortgage | With Mortgage |
| Less than $50,000 | 329 (1.2%) | 367 (1.0%) |
| $50,000 to $99,999 | 218 (0.8%) | 216 (0.6%) |
| $100,000 to $299,999 | 1,598 (5.8%) | 1,457 (4.0%) |
| $300,000 to $499,999 | 5,807 (20.9%) | 7,484 (20.4%) |
| $500,000 to $749,999 | 4,950 (17.8%) | 7,244 (19.7%) |
| $750,000 to $999,999 | 5,295 (19.1%) | 6,340 (17.3%) |
| $1,000,000 or more | 9,595 (34.5%) | 13,604 (37.1%) |
| Total | 27,792 (100.0%) | 36,712 (100.0%) |
Household Income by Mortgage Status in Urban Honolulu
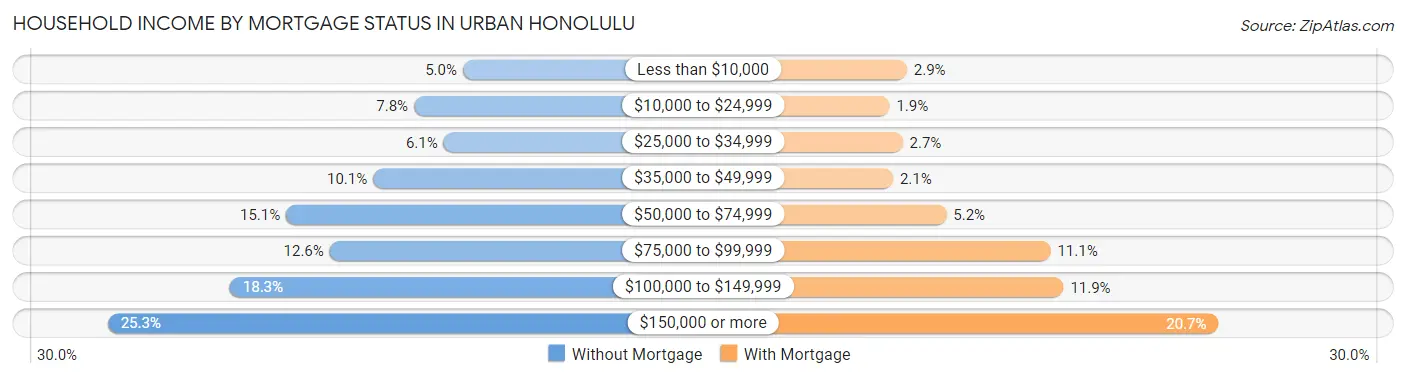
| Household Income | Without Mortgage | With Mortgage |
| Less than $10,000 | 1,378 (5.0%) | 1,077 (2.9%) |
| $10,000 to $24,999 | 2,155 (7.7%) | 712 (1.9%) |
| $25,000 to $34,999 | 1,683 (6.1%) | 989 (2.7%) |
| $35,000 to $49,999 | 2,803 (10.1%) | 787 (2.1%) |
| $50,000 to $74,999 | 4,186 (15.1%) | 1,905 (5.2%) |
| $75,000 to $99,999 | 3,493 (12.6%) | 4,089 (11.1%) |
| $100,000 to $149,999 | 5,077 (18.3%) | 4,360 (11.9%) |
| $150,000 or more | 7,017 (25.3%) | 7,611 (20.7%) |
| Total | 27,792 (100.0%) | 36,712 (100.0%) |
Property Value to Household Income Ratio in Urban Honolulu
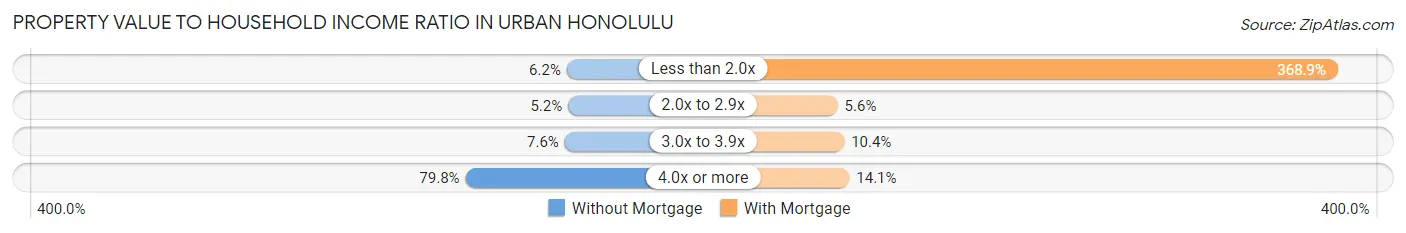
| Value-to-Income Ratio | Without Mortgage | With Mortgage |
| Less than 2.0x | 1,717 (6.2%) | 135,434 (368.9%) |
| 2.0x to 2.9x | 1,452 (5.2%) | 2,059 (5.6%) |
| 3.0x to 3.9x | 2,124 (7.6%) | 3,808 (10.4%) |
| 4.0x or more | 22,175 (79.8%) | 5,191 (14.1%) |
| Total | 27,792 (100.0%) | 36,712 (100.0%) |
Real Estate Taxes by Mortgage Status in Urban Honolulu
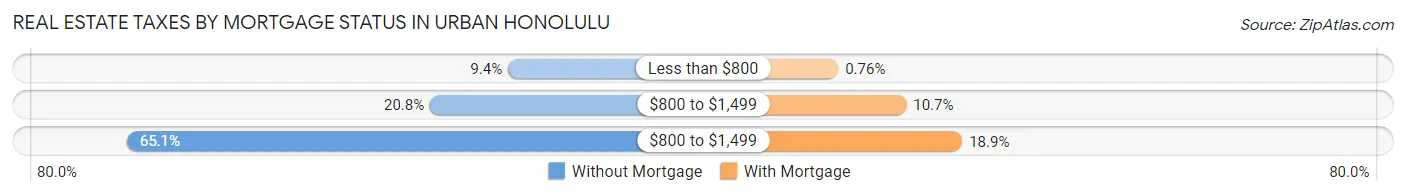
| Property Taxes | Without Mortgage | With Mortgage |
| Less than $800 | 2,604 (9.4%) | 278 (0.8%) |
| $800 to $1,499 | 5,770 (20.8%) | 3,929 (10.7%) |
| $800 to $1,499 | 18,082 (65.1%) | 6,930 (18.9%) |
| Total | 27,792 (100.0%) | 36,712 (100.0%) |
Health & Disability in Urban Honolulu
Health Insurance Coverage by Age in Urban Honolulu
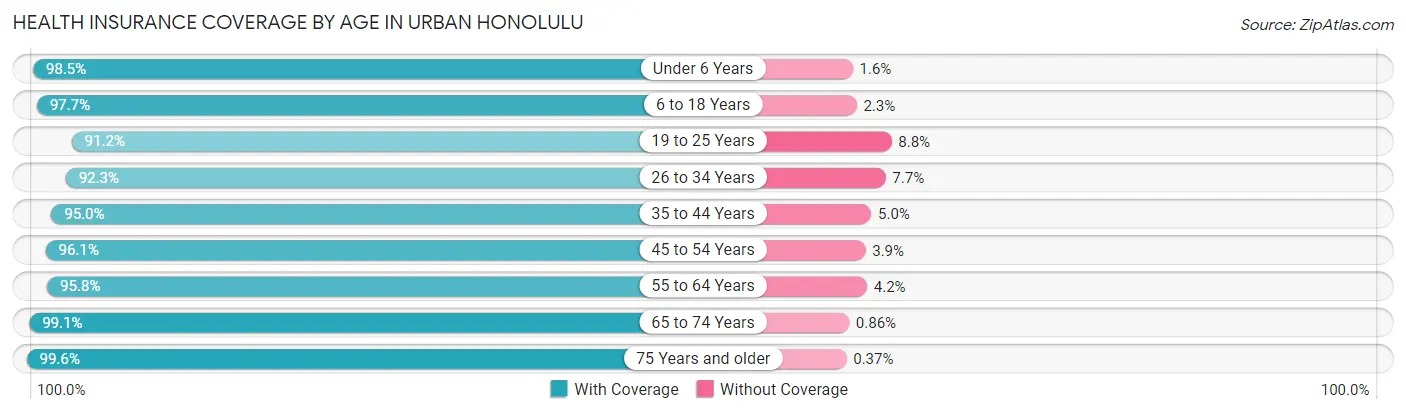
| Age Bracket | With Coverage | Without Coverage |
| Under 6 Years | 19,022 (98.5%) | 299 (1.5%) |
| 6 to 18 Years | 41,564 (97.7%) | 967 (2.3%) |
| 19 to 25 Years | 24,838 (91.2%) | 2,390 (8.8%) |
| 26 to 34 Years | 39,550 (92.3%) | 3,286 (7.7%) |
| 35 to 44 Years | 42,503 (95.0%) | 2,236 (5.0%) |
| 45 to 54 Years | 42,057 (96.1%) | 1,711 (3.9%) |
| 55 to 64 Years | 41,685 (95.8%) | 1,828 (4.2%) |
| 65 to 74 Years | 38,864 (99.1%) | 339 (0.9%) |
| 75 Years and older | 33,209 (99.6%) | 123 (0.4%) |
| Total | 323,292 (96.1%) | 13,179 (3.9%) |
Health Insurance Coverage by Citizenship Status in Urban Honolulu
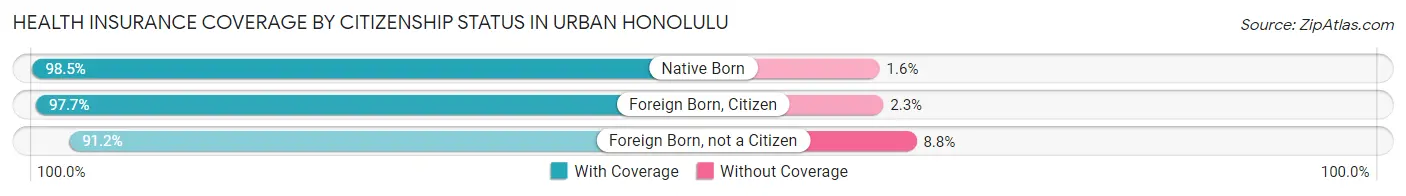
| Citizenship Status | With Coverage | Without Coverage |
| Native Born | 19,022 (98.5%) | 299 (1.5%) |
| Foreign Born, Citizen | 41,564 (97.7%) | 967 (2.3%) |
| Foreign Born, not a Citizen | 24,838 (91.2%) | 2,390 (8.8%) |
Health Insurance Coverage by Household Income in Urban Honolulu
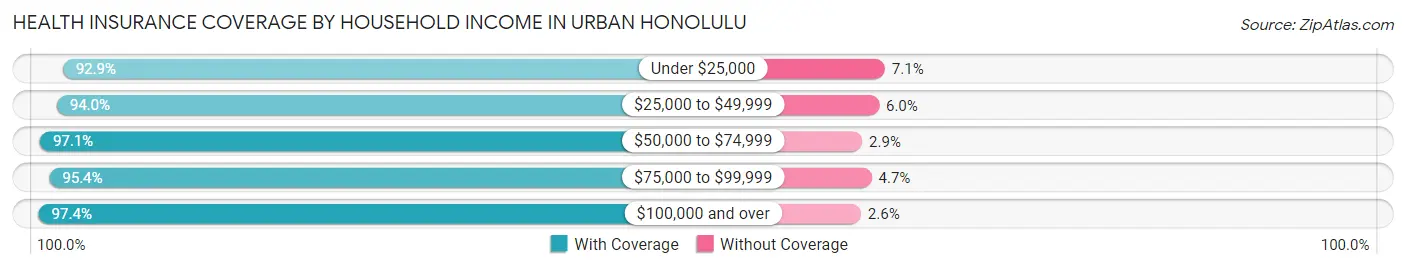
| Household Income | With Coverage | Without Coverage |
| Under $25,000 | 28,069 (92.9%) | 2,157 (7.1%) |
| $25,000 to $49,999 | 38,758 (94.0%) | 2,492 (6.0%) |
| $50,000 to $74,999 | 39,288 (97.1%) | 1,164 (2.9%) |
| $75,000 to $99,999 | 37,140 (95.4%) | 1,812 (4.6%) |
| $100,000 and over | 175,141 (97.4%) | 4,745 (2.6%) |
Public vs Private Health Insurance Coverage by Age in Urban Honolulu
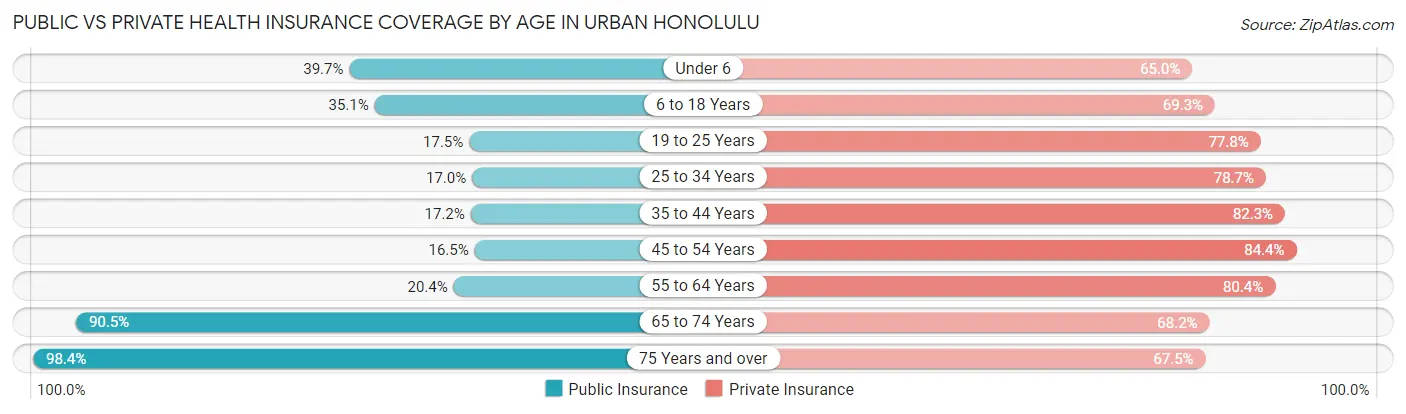
| Age Bracket | Public Insurance | Private Insurance |
| Under 6 | 7,678 (39.7%) | 12,566 (65.0%) |
| 6 to 18 Years | 14,909 (35.0%) | 29,453 (69.3%) |
| 19 to 25 Years | 4,761 (17.5%) | 21,170 (77.7%) |
| 25 to 34 Years | 7,261 (17.0%) | 33,713 (78.7%) |
| 35 to 44 Years | 7,705 (17.2%) | 36,796 (82.3%) |
| 45 to 54 Years | 7,211 (16.5%) | 36,922 (84.4%) |
| 55 to 64 Years | 8,866 (20.4%) | 34,992 (80.4%) |
| 65 to 74 Years | 35,462 (90.5%) | 26,750 (68.2%) |
| 75 Years and over | 32,808 (98.4%) | 22,497 (67.5%) |
| Total | 126,661 (37.6%) | 254,859 (75.7%) |
Disability Status by Sex by Age in Urban Honolulu
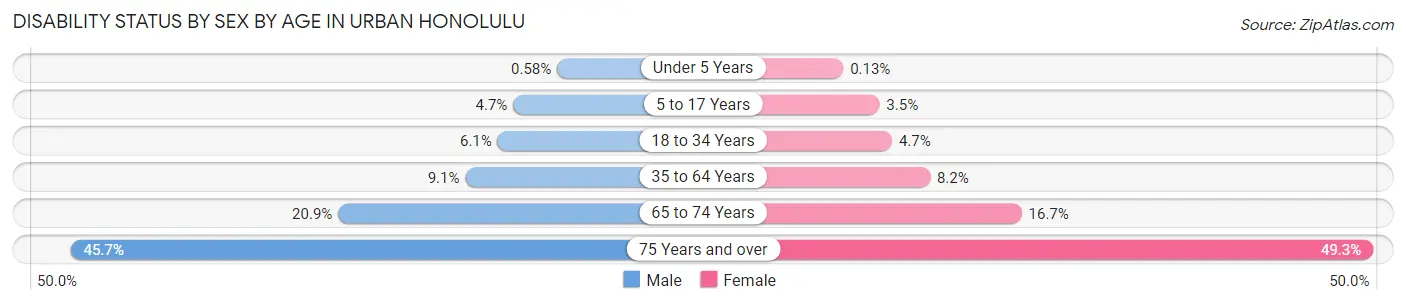
| Age Bracket | Male | Female |
| Under 5 Years | 49 (0.6%) | 11 (0.1%) |
| 5 to 17 Years | 1,035 (4.7%) | 686 (3.5%) |
| 18 to 34 Years | 2,264 (6.1%) | 1,697 (4.7%) |
| 35 to 64 Years | 6,029 (9.1%) | 5,381 (8.2%) |
| 65 to 74 Years | 3,901 (20.9%) | 3,428 (16.7%) |
| 75 Years and over | 6,209 (45.7%) | 9,738 (49.3%) |
Disability Class by Sex by Age in Urban Honolulu
Disability Class: Hearing Difficulty

| Age Bracket | Male | Female |
| Under 5 Years | 49 (0.6%) | 11 (0.1%) |
| 5 to 17 Years | 113 (0.5%) | 126 (0.6%) |
| 18 to 34 Years | 376 (1.0%) | 198 (0.5%) |
| 35 to 64 Years | 1,200 (1.8%) | 771 (1.2%) |
| 65 to 74 Years | 1,589 (8.5%) | 825 (4.0%) |
| 75 Years and over | 3,484 (25.7%) | 3,482 (17.6%) |
Disability Class: Vision Difficulty
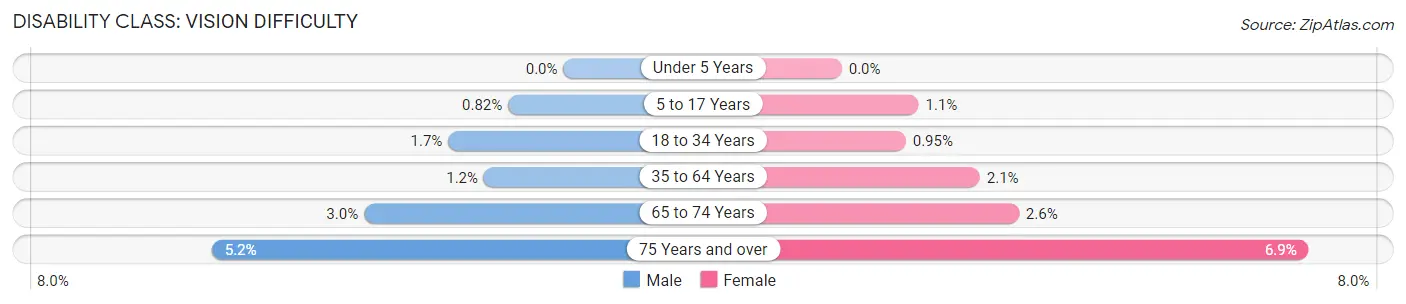
| Age Bracket | Male | Female |
| Under 5 Years | 0 (0.0%) | 0 (0.0%) |
| 5 to 17 Years | 183 (0.8%) | 225 (1.1%) |
| 18 to 34 Years | 636 (1.7%) | 346 (0.9%) |
| 35 to 64 Years | 782 (1.2%) | 1,345 (2.1%) |
| 65 to 74 Years | 553 (3.0%) | 541 (2.6%) |
| 75 Years and over | 709 (5.2%) | 1,368 (6.9%) |
Disability Class: Cognitive Difficulty
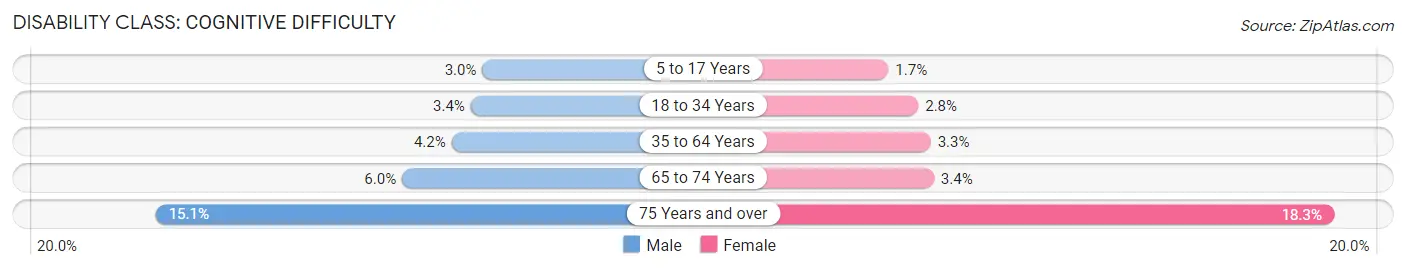
| Age Bracket | Male | Female |
| 5 to 17 Years | 670 (3.0%) | 340 (1.7%) |
| 18 to 34 Years | 1,277 (3.4%) | 1,034 (2.8%) |
| 35 to 64 Years | 2,749 (4.2%) | 2,173 (3.3%) |
| 65 to 74 Years | 1,117 (6.0%) | 702 (3.4%) |
| 75 Years and over | 2,055 (15.1%) | 3,607 (18.3%) |
Disability Class: Ambulatory Difficulty
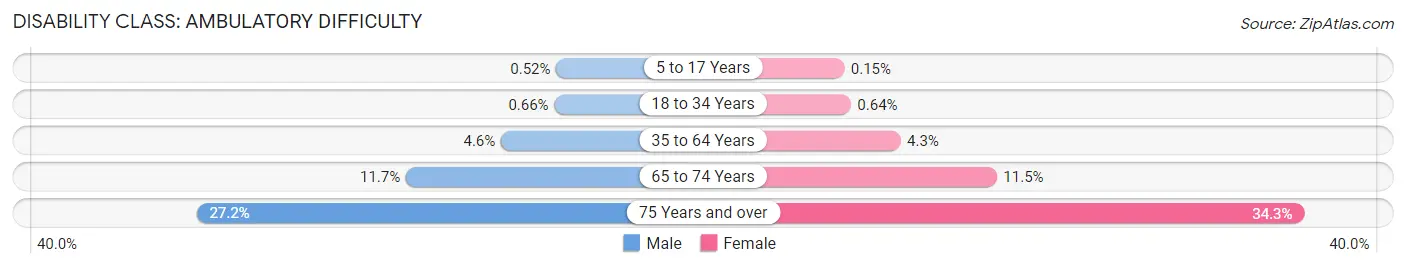
| Age Bracket | Male | Female |
| 5 to 17 Years | 115 (0.5%) | 30 (0.2%) |
| 18 to 34 Years | 245 (0.7%) | 232 (0.6%) |
| 35 to 64 Years | 3,062 (4.6%) | 2,849 (4.3%) |
| 65 to 74 Years | 2,180 (11.7%) | 2,357 (11.5%) |
| 75 Years and over | 3,698 (27.2%) | 6,783 (34.3%) |
Disability Class: Self-Care Difficulty
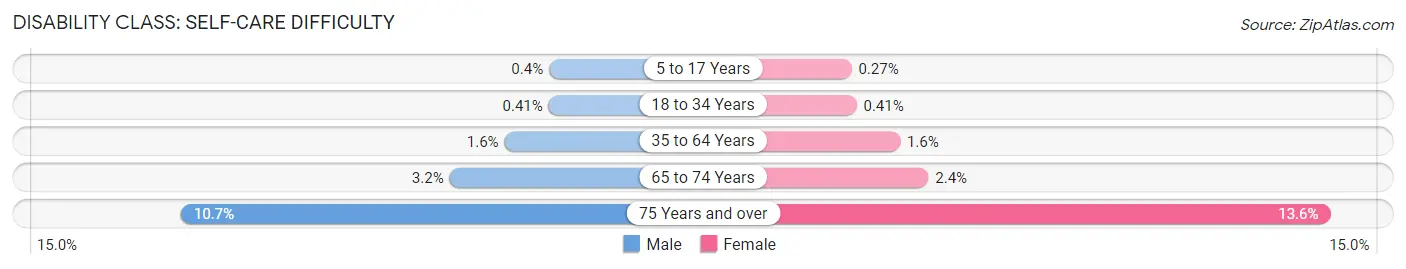
| Age Bracket | Male | Female |
| 5 to 17 Years | 88 (0.4%) | 54 (0.3%) |
| 18 to 34 Years | 153 (0.4%) | 148 (0.4%) |
| 35 to 64 Years | 1,089 (1.6%) | 1,065 (1.6%) |
| 65 to 74 Years | 592 (3.2%) | 495 (2.4%) |
| 75 Years and over | 1,446 (10.6%) | 2,687 (13.6%) |
Technology Access in Urban Honolulu
Computing Device Access in Urban Honolulu
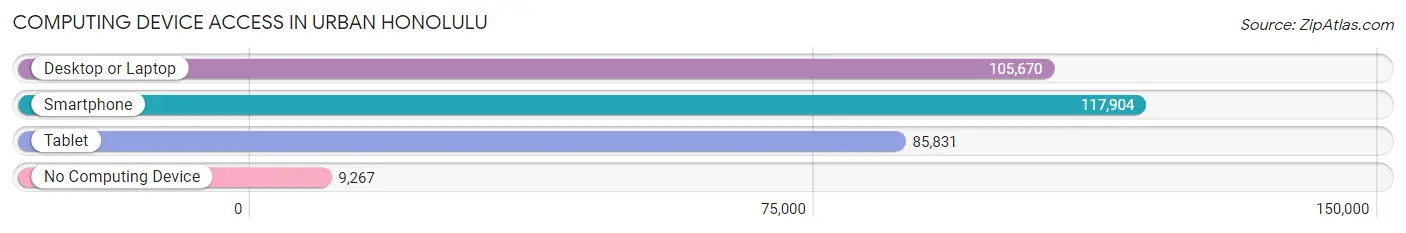
| Device Type | # Households | % Households |
| Desktop or Laptop | 105,670 | 78.7% |
| Smartphone | 117,904 | 87.8% |
| Tablet | 85,831 | 63.9% |
| No Computing Device | 9,267 | 6.9% |
| Total | 134,264 | 100.0% |
Internet Access in Urban Honolulu
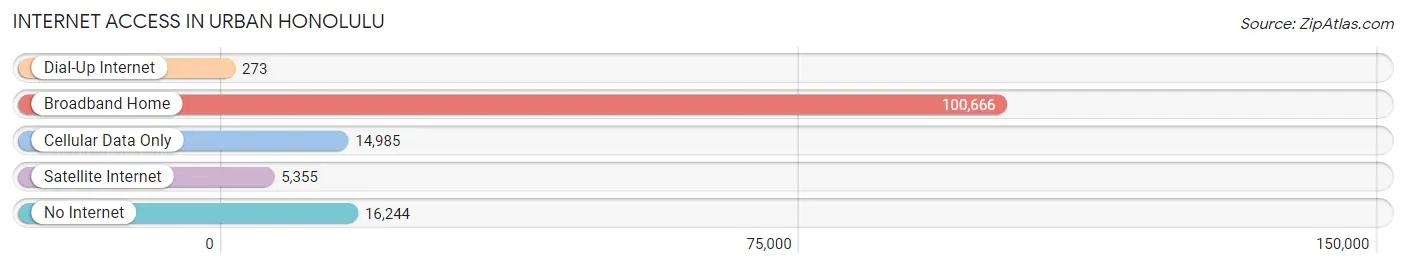
| Internet Type | # Households | % Households |
| Dial-Up Internet | 273 | 0.2% |
| Broadband Home | 100,666 | 75.0% |
| Cellular Data Only | 14,985 | 11.2% |
| Satellite Internet | 5,355 | 4.0% |
| No Internet | 16,244 | 12.1% |
| Total | 134,264 | 100.0% |
Urban Honolulu Summary
Honolulu is the capital and largest city of the U.S. state of Hawaii. It is located on the island of Oahu in the Central Pacific Ocean. The city is home to the University of Hawaii at Manoa, the largest university in the state, and the East-West Center, a research center dedicated to promoting better understanding between the United States and the countries of the Asia-Pacific region.
History
The area that is now Honolulu was first settled by Polynesian voyagers in the 11th century. The first European contact with the area was in 1778, when British explorer Captain James Cook arrived in the area. Cook named the area “Sandwich Islands” after the Earl of Sandwich, and the name was later changed to “Hawaii”.
In 1809, King Kamehameha I moved his court from the island of Hawaii to Oahu, and the city of Honolulu was established. The city quickly grew in importance as a port of call for ships traveling between the United States and Asia. In 1845, the city was declared the capital of the Kingdom of Hawaii.
In 1898, the United States annexed Hawaii and Honolulu became the capital of the Territory of Hawaii. In 1959, Hawaii became the 50th state of the United States and Honolulu became the state capital.
Geography
Honolulu is located on the southeastern coast of the island of Oahu. The city is situated on a narrow plain between the Koolau Mountains and the Pacific Ocean. The city covers an area of about 68 square miles and has a population of about 350,000 people.
The climate in Honolulu is tropical, with temperatures ranging from an average low of 65°F in the winter to an average high of 85°F in the summer. The city receives an average of about 20 inches of rain per year.
Economy
Honolulu’s economy is largely based on tourism, with the city being a popular destination for visitors from around the world. The city is also home to a number of military bases, including Pearl Harbor, which is the headquarters of the U.S. Pacific Fleet.
The city is also home to a number of major corporations, including Bank of Hawaii, Hawaiian Electric Industries, and Hawaiian Airlines. The University of Hawaii at Manoa is also a major employer in the city.
Demographics
As of the 2010 census, the population of Honolulu was about 390,000 people. The city is racially diverse, with the largest racial groups being Asian (44.3%), White (25.2%), Native Hawaiian or Pacific Islander (17.7%), and Hispanic or Latino (7.2%).
The median household income in Honolulu is about $68,000, and the median home value is about $600,000. The city has a high cost of living, with the average rent for a one-bedroom apartment being about $1,500 per month.
Honolulu is a culturally diverse city, with a variety of ethnic restaurants, art galleries, and cultural events. The city is also home to a number of museums, including the Honolulu Museum of Art and the Bishop Museum. The city is also home to a number of professional sports teams, including the Honolulu Sharks of the Pacific Coast League.
Common Questions
What is Per Capita Income in Urban Honolulu?
Per Capita income in Urban Honolulu is $45,784.
What is the Median Family Income in Urban Honolulu?
Median Family Income in Urban Honolulu is $106,192.
What is the Median Household income in Urban Honolulu?
Median Household Income in Urban Honolulu is $82,772.
What is Income or Wage Gap in Urban Honolulu?
Income or Wage Gap in Urban Honolulu is 21.2%.
Women in Urban Honolulu earn 78.8 cents for every dollar earned by a man.
What is Family Income Deficit in Urban Honolulu?
Family Income Deficit in Urban Honolulu is $10,959.
Families that are below poverty line in Urban Honolulu earn $10,959 less on average than the poverty threshold level.
What is Inequality or Gini Index in Urban Honolulu?
Inequality or Gini Index in Urban Honolulu is 0.48.
What is the Total Population of Urban Honolulu?
Total Population of Urban Honolulu is 348,547.
What is the Total Male Population of Urban Honolulu?
Total Male Population of Urban Honolulu is 175,554.
What is the Total Female Population of Urban Honolulu?
Total Female Population of Urban Honolulu is 172,993.
What is the Ratio of Males per 100 Females in Urban Honolulu?
There are 101.48 Males per 100 Females in Urban Honolulu.
What is the Ratio of Females per 100 Males in Urban Honolulu?
There are 98.54 Females per 100 Males in Urban Honolulu.
What is the Median Population Age in Urban Honolulu?
Median Population Age in Urban Honolulu is 42.5 Years.
What is the Average Family Size in Urban Honolulu
Average Family Size in Urban Honolulu is 3.3 People.
What is the Average Household Size in Urban Honolulu
Average Household Size in Urban Honolulu is 2.5 People.
How Large is the Labor Force in Urban Honolulu?
There are 192,360 People in the Labor Forcein in Urban Honolulu.
What is the Percentage of People in the Labor Force in Urban Honolulu?
64.8% of People are in the Labor Force in Urban Honolulu.
What is the Unemployment Rate in Urban Honolulu?
Unemployment Rate in Urban Honolulu is 5.1%.