Kailua CDP Honolulu County, HI Map & Demographics
Kailua CDP Honolulu County Overview
$57,727
PER CAPITA INCOME
$157,108
AVG FAMILY INCOME
$138,363
AVG HOUSEHOLD INCOME
34.8%
WAGE / INCOME GAP [ % ]
65.2¢/ $1
WAGE / INCOME GAP [ $ ]
0.41
INEQUALITY / GINI INDEX
40,323
TOTAL POPULATION
20,190
MALE POPULATION
20,133
FEMALE POPULATION
100.28
MALES / 100 FEMALES
99.72
FEMALES / 100 MALES
42.2
MEDIAN AGE
3.4
AVG FAMILY SIZE
3.0
AVG HOUSEHOLD SIZE
21,034
LABOR FORCE [ PEOPLE ]
65.3%
PERCENT IN LABOR FORCE
3.3%
UNEMPLOYMENT RATE
Income in Kailua CDP Honolulu County
Income Overview in Kailua CDP Honolulu County
Per Capita Income in Kailua CDP Honolulu County is $57,727, while median incomes of families and households are $157,108 and $138,363 respectively.
| Characteristic | Number | Measure |
| Per Capita Income | 40,323 | $57,727 |
| Median Family Income | 9,792 | $157,108 |
| Mean Family Income | 9,792 | $189,015 |
| Median Household Income | 13,262 | $138,363 |
| Mean Household Income | 13,262 | $171,826 |
| Income Deficit | 9,792 | $0 |
| Wage / Income Gap (%) | 40,323 | 34.84% |
| Wage / Income Gap ($) | 40,323 | 65.16¢ per $1 |
| Gini / Inequality Index | 40,323 | 0.41 |
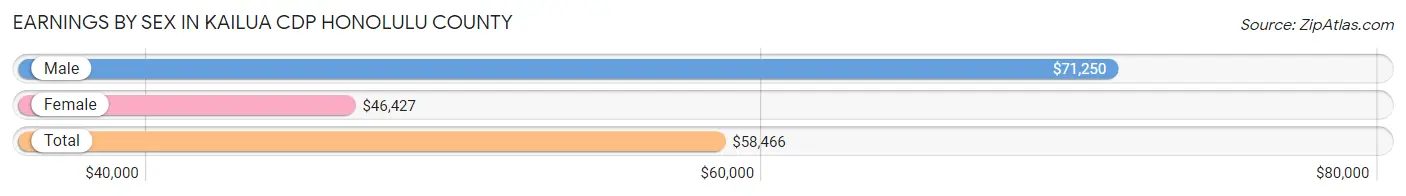
Earnings by Sex in Kailua CDP Honolulu County
Average Earnings in Kailua CDP Honolulu County are $58,466, $71,250 for men and $46,427 for women, a difference of 34.8%.
| Sex | Number | Average Earnings |
| Male | 11,842 (53.1%) | $71,250 |
| Female | 10,438 (46.9%) | $46,427 |
| Total | 22,280 (100.0%) | $58,466 |
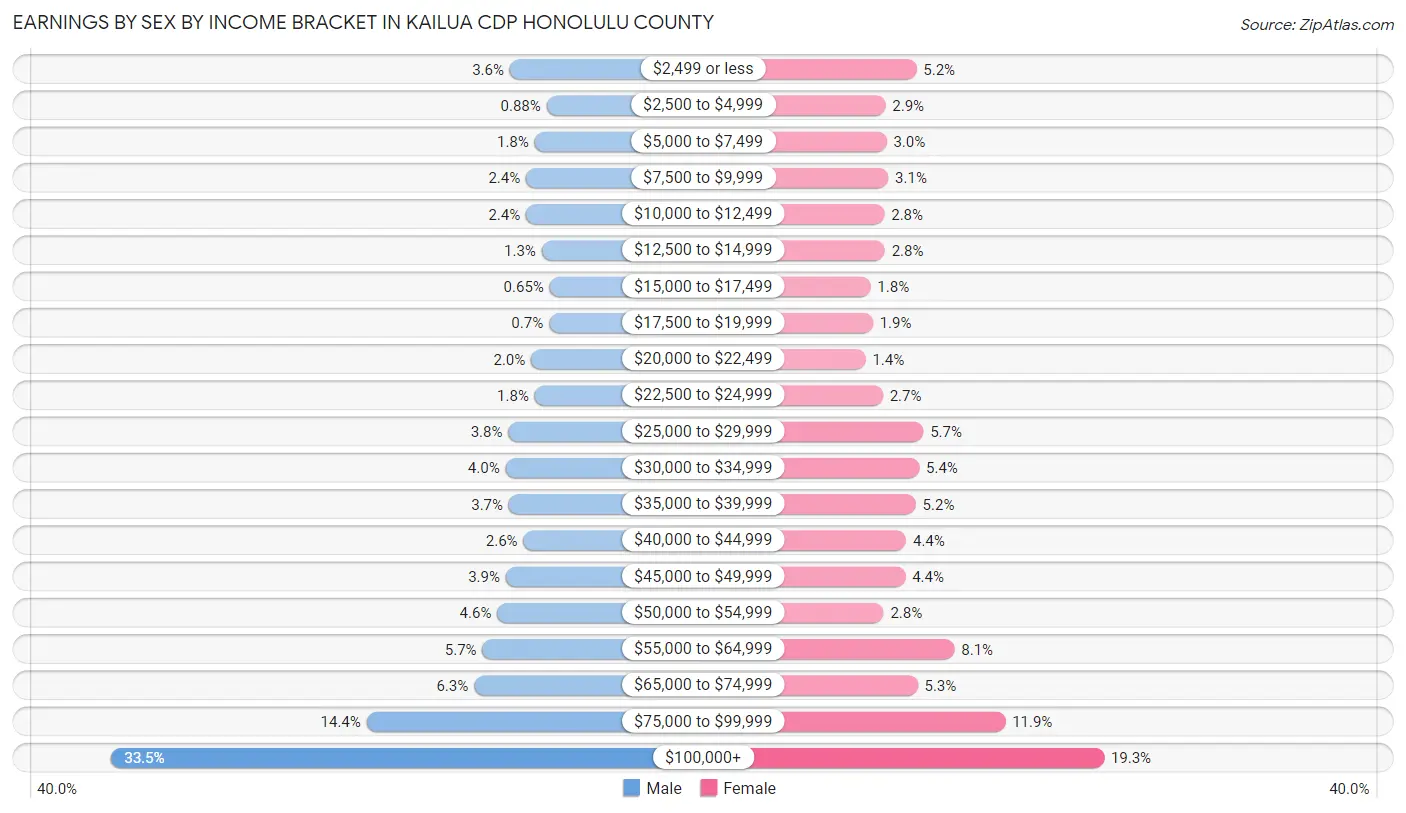
Earnings by Sex by Income Bracket in Kailua CDP Honolulu County
The most common earnings brackets in Kailua CDP Honolulu County are $100,000+ for men (3,967 | 33.5%) and $100,000+ for women (2,011 | 19.3%).
| Income | Male | Female |
| $2,499 or less | 431 (3.6%) | 544 (5.2%) |
| $2,500 to $4,999 | 104 (0.9%) | 302 (2.9%) |
| $5,000 to $7,499 | 211 (1.8%) | 310 (3.0%) |
| $7,500 to $9,999 | 287 (2.4%) | 324 (3.1%) |
| $10,000 to $12,499 | 287 (2.4%) | 293 (2.8%) |
| $12,500 to $14,999 | 148 (1.3%) | 296 (2.8%) |
| $15,000 to $17,499 | 77 (0.6%) | 185 (1.8%) |
| $17,500 to $19,999 | 83 (0.7%) | 203 (1.9%) |
| $20,000 to $22,499 | 241 (2.0%) | 146 (1.4%) |
| $22,500 to $24,999 | 210 (1.8%) | 281 (2.7%) |
| $25,000 to $29,999 | 444 (3.7%) | 598 (5.7%) |
| $30,000 to $34,999 | 469 (4.0%) | 566 (5.4%) |
| $35,000 to $39,999 | 439 (3.7%) | 539 (5.2%) |
| $40,000 to $44,999 | 310 (2.6%) | 463 (4.4%) |
| $45,000 to $49,999 | 467 (3.9%) | 457 (4.4%) |
| $50,000 to $54,999 | 542 (4.6%) | 287 (2.8%) |
| $55,000 to $64,999 | 674 (5.7%) | 841 (8.1%) |
| $65,000 to $74,999 | 749 (6.3%) | 553 (5.3%) |
| $75,000 to $99,999 | 1,702 (14.4%) | 1,239 (11.9%) |
| $100,000+ | 3,967 (33.5%) | 2,011 (19.3%) |
| Total | 11,842 (100.0%) | 10,438 (100.0%) |
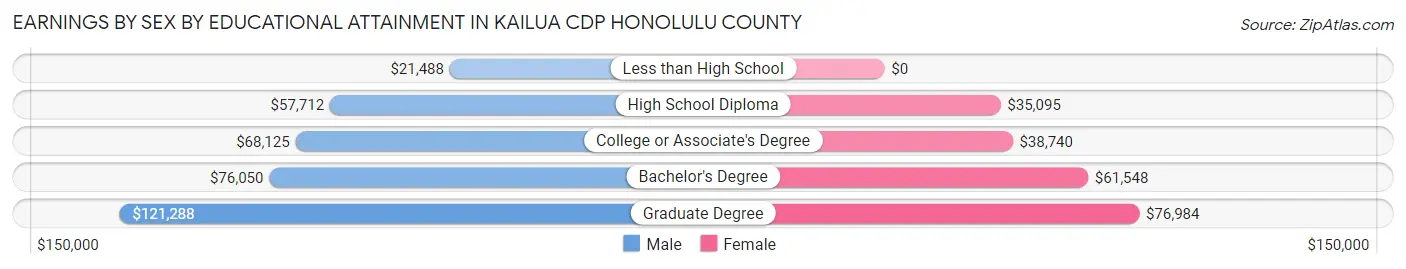
Earnings by Sex by Educational Attainment in Kailua CDP Honolulu County
Average earnings in Kailua CDP Honolulu County are $77,431 for men and $50,345 for women, a difference of 35.0%. Men with an educational attainment of graduate degree enjoy the highest average annual earnings of $121,288, while those with less than high school education earn the least with $21,488. Women with an educational attainment of graduate degree earn the most with the average annual earnings of $76,984, while those with high school diploma education have the smallest earnings of $35,095.
| Educational Attainment | Male Income | Female Income |
| Less than High School | $21,488 | $0 |
| High School Diploma | $57,712 | $35,095 |
| College or Associate's Degree | $68,125 | $38,740 |
| Bachelor's Degree | $76,050 | $61,548 |
| Graduate Degree | $121,288 | $76,984 |
| Total | $77,431 | $50,345 |
Family Income in Kailua CDP Honolulu County
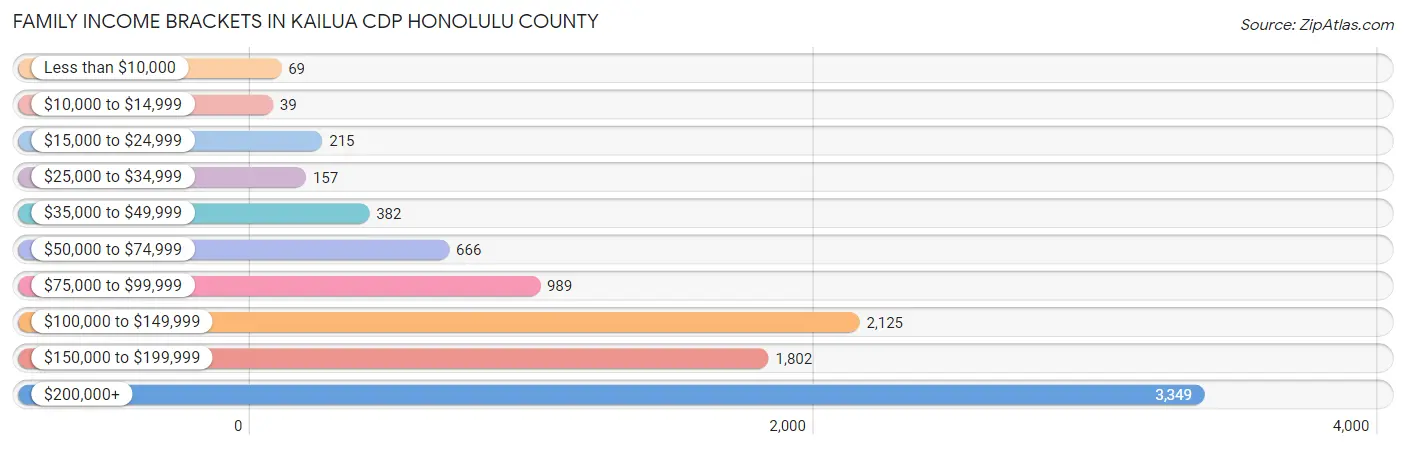
Family Income Brackets in Kailua CDP Honolulu County
According to the Kailua CDP Honolulu County family income data, there are 3,349 families falling into the $200,000+ income range, which is the most common income bracket and makes up 34.2% of all families. Conversely, the $10,000 to $14,999 income bracket is the least frequent group with only 39 families (0.4%) belonging to this category.
| Income Bracket | # Families | % Families |
| Less than $10,000 | 69 | 0.7% |
| $10,000 to $14,999 | 39 | 0.4% |
| $15,000 to $24,999 | 215 | 2.2% |
| $25,000 to $34,999 | 157 | 1.6% |
| $35,000 to $49,999 | 382 | 3.9% |
| $50,000 to $74,999 | 666 | 6.8% |
| $75,000 to $99,999 | 989 | 10.1% |
| $100,000 to $149,999 | 2,125 | 21.7% |
| $150,000 to $199,999 | 1,802 | 18.4% |
| $200,000+ | 3,349 | 34.2% |
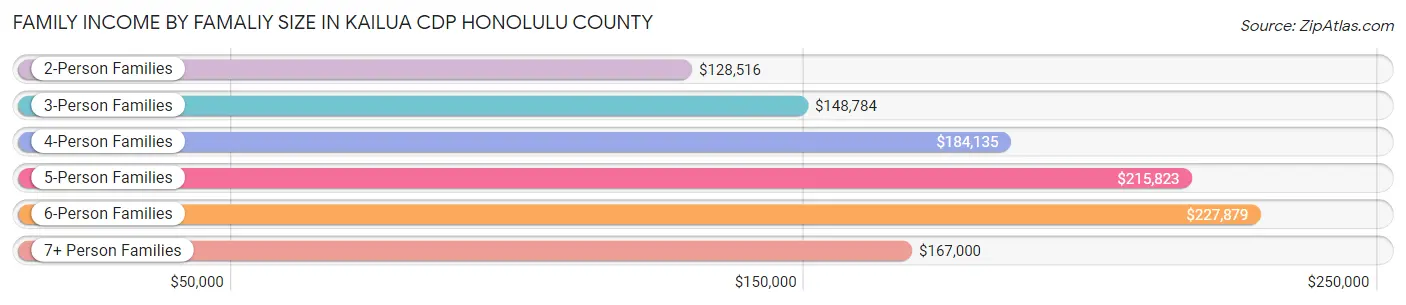
Family Income by Famaliy Size in Kailua CDP Honolulu County
6-person families (390 | 4.0%) account for the highest median family income in Kailua CDP Honolulu County with $227,879 per family, while 2-person families (4,120 | 42.1%) have the highest median income of $64,258 per family member.
| Income Bracket | # Families | Median Income |
| 2-Person Families | 4,120 (42.1%) | $128,516 |
| 3-Person Families | 2,146 (21.9%) | $148,784 |
| 4-Person Families | 2,003 (20.5%) | $184,135 |
| 5-Person Families | 829 (8.5%) | $215,823 |
| 6-Person Families | 390 (4.0%) | $227,879 |
| 7+ Person Families | 304 (3.1%) | $167,000 |
| Total | 9,792 (100.0%) | $157,108 |
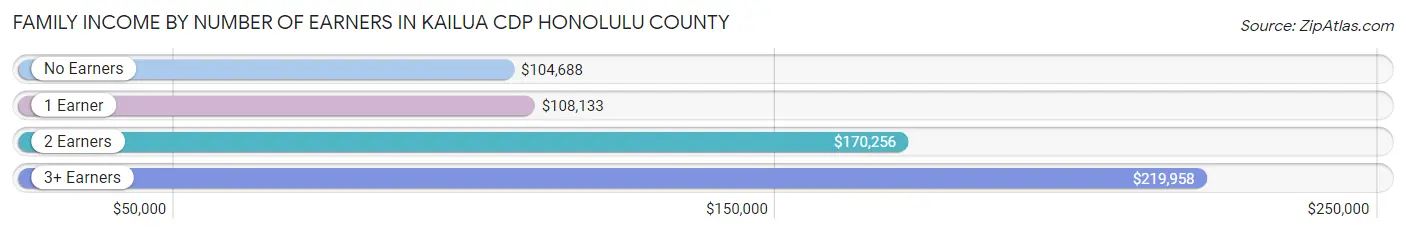
Family Income by Number of Earners in Kailua CDP Honolulu County
The median family income in Kailua CDP Honolulu County is $157,108, with families comprising 3+ earners (1,437) having the highest median family income of $219,958, while families with no earners (973) have the lowest median family income of $104,688, accounting for 14.7% and 9.9% of families, respectively.
| Number of Earners | # Families | Median Income |
| No Earners | 973 (9.9%) | $104,688 |
| 1 Earner | 2,760 (28.2%) | $108,133 |
| 2 Earners | 4,622 (47.2%) | $170,256 |
| 3+ Earners | 1,437 (14.7%) | $219,958 |
| Total | 9,792 (100.0%) | $157,108 |
Household Income in Kailua CDP Honolulu County
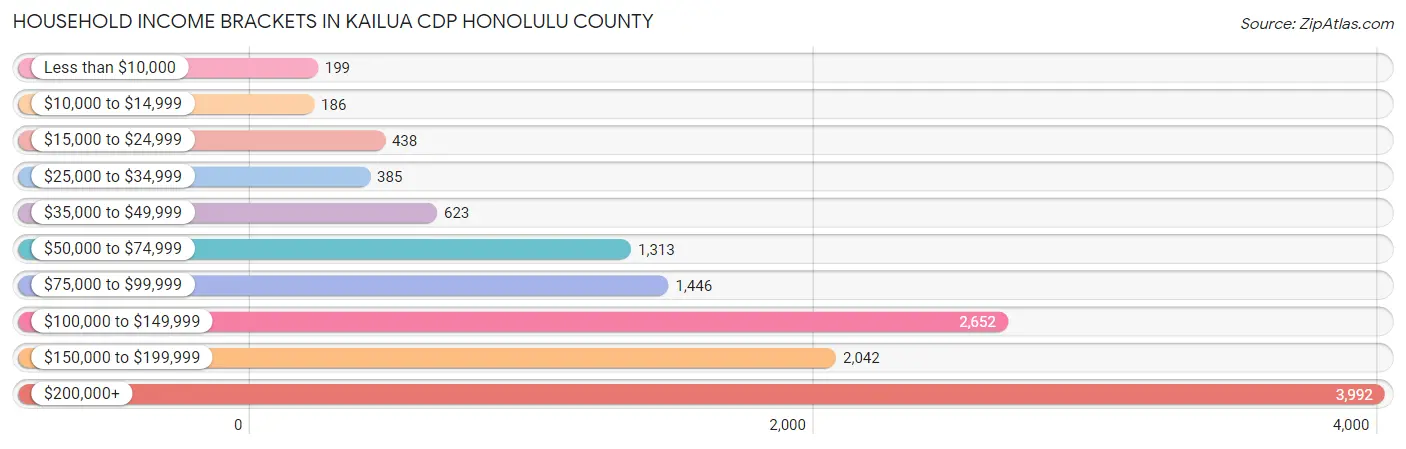
Household Income Brackets in Kailua CDP Honolulu County
With 3,992 households falling in the category, the $200,000+ income range is the most frequent in Kailua CDP Honolulu County, accounting for 30.1% of all households. In contrast, only 186 households (1.4%) fall into the $10,000 to $14,999 income bracket, making it the least populous group.
| Income Bracket | # Households | % Households |
| Less than $10,000 | 199 | 1.5% |
| $10,000 to $14,999 | 186 | 1.4% |
| $15,000 to $24,999 | 438 | 3.3% |
| $25,000 to $34,999 | 385 | 2.9% |
| $35,000 to $49,999 | 623 | 4.7% |
| $50,000 to $74,999 | 1,313 | 9.9% |
| $75,000 to $99,999 | 1,446 | 10.9% |
| $100,000 to $149,999 | 2,652 | 20.0% |
| $150,000 to $199,999 | 2,042 | 15.4% |
| $200,000+ | 3,992 | 30.1% |
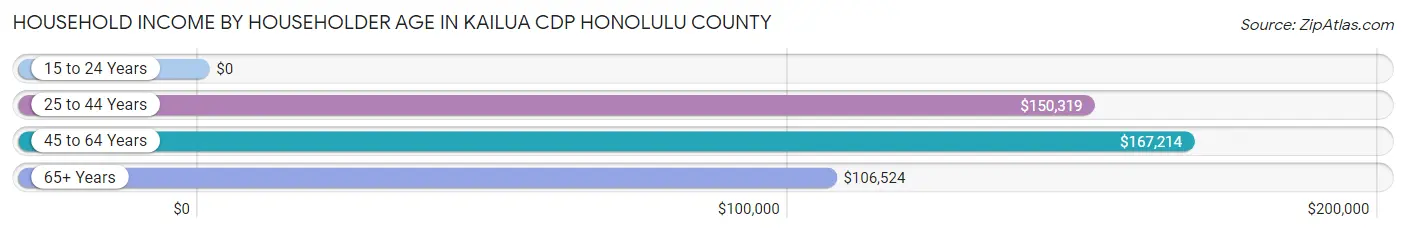
Household Income by Householder Age in Kailua CDP Honolulu County
The median household income in Kailua CDP Honolulu County is $138,363, with the highest median household income of $167,214 found in the 45 to 64 years age bracket for the primary householder. A total of 4,849 households (36.6%) fall into this category. Meanwhile, the 15 to 24 years age bracket for the primary householder has the lowest median household income of $0, with 318 households (2.4%) in this group.
| Income Bracket | # Households | Median Income |
| 15 to 24 Years | 318 (2.4%) | $0 |
| 25 to 44 Years | 3,506 (26.4%) | $150,319 |
| 45 to 64 Years | 4,849 (36.6%) | $167,214 |
| 65+ Years | 4,589 (34.6%) | $106,524 |
| Total | 13,262 (100.0%) | $138,363 |
Poverty in Kailua CDP Honolulu County
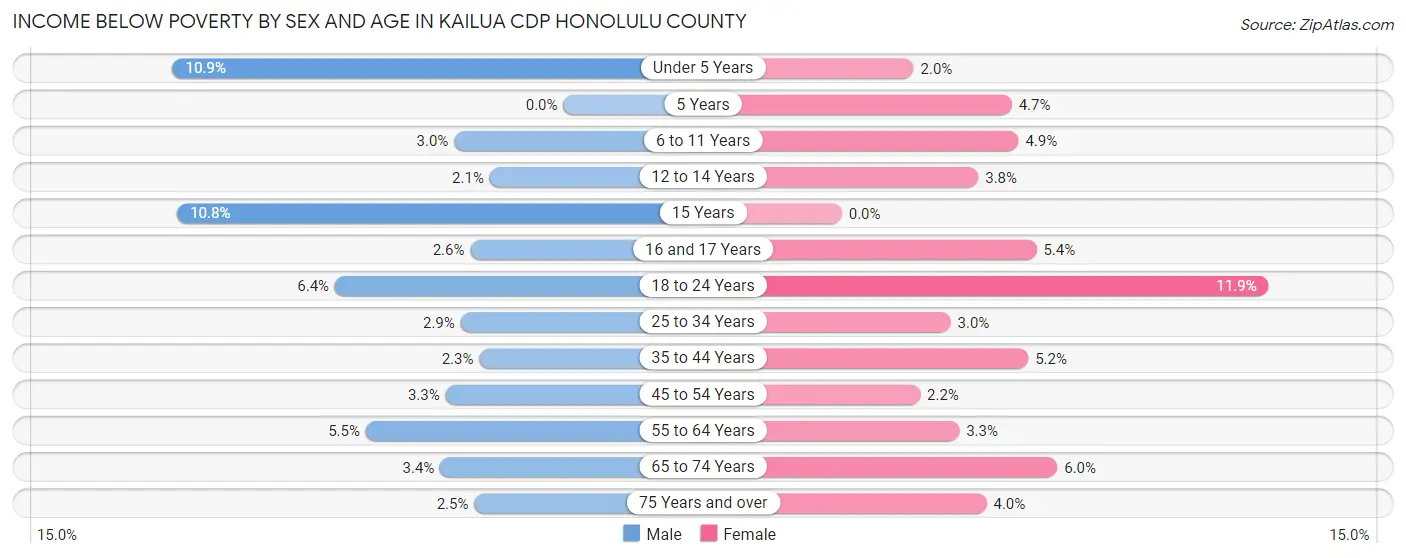
Income Below Poverty by Sex and Age in Kailua CDP Honolulu County
With 4.0% poverty level for males and 4.4% for females among the residents of Kailua CDP Honolulu County, under 5 year old males and 18 to 24 year old females are the most vulnerable to poverty, with 108 males (10.9%) and 125 females (11.9%) in their respective age groups living below the poverty level.
| Age Bracket | Male | Female |
| Under 5 Years | 108 (10.9%) | 20 (2.0%) |
| 5 Years | 0 (0.0%) | 8 (4.7%) |
| 6 to 11 Years | 49 (3.0%) | 83 (4.9%) |
| 12 to 14 Years | 15 (2.1%) | 32 (3.8%) |
| 15 Years | 36 (10.7%) | 0 (0.0%) |
| 16 and 17 Years | 13 (2.6%) | 15 (5.4%) |
| 18 to 24 Years | 95 (6.4%) | 125 (11.9%) |
| 25 to 34 Years | 67 (2.9%) | 64 (3.0%) |
| 35 to 44 Years | 73 (2.3%) | 153 (5.2%) |
| 45 to 54 Years | 73 (3.3%) | 54 (2.2%) |
| 55 to 64 Years | 153 (5.5%) | 88 (3.3%) |
| 65 to 74 Years | 74 (3.4%) | 153 (6.0%) |
| 75 Years and over | 36 (2.5%) | 81 (4.0%) |
| Total | 792 (4.0%) | 876 (4.4%) |
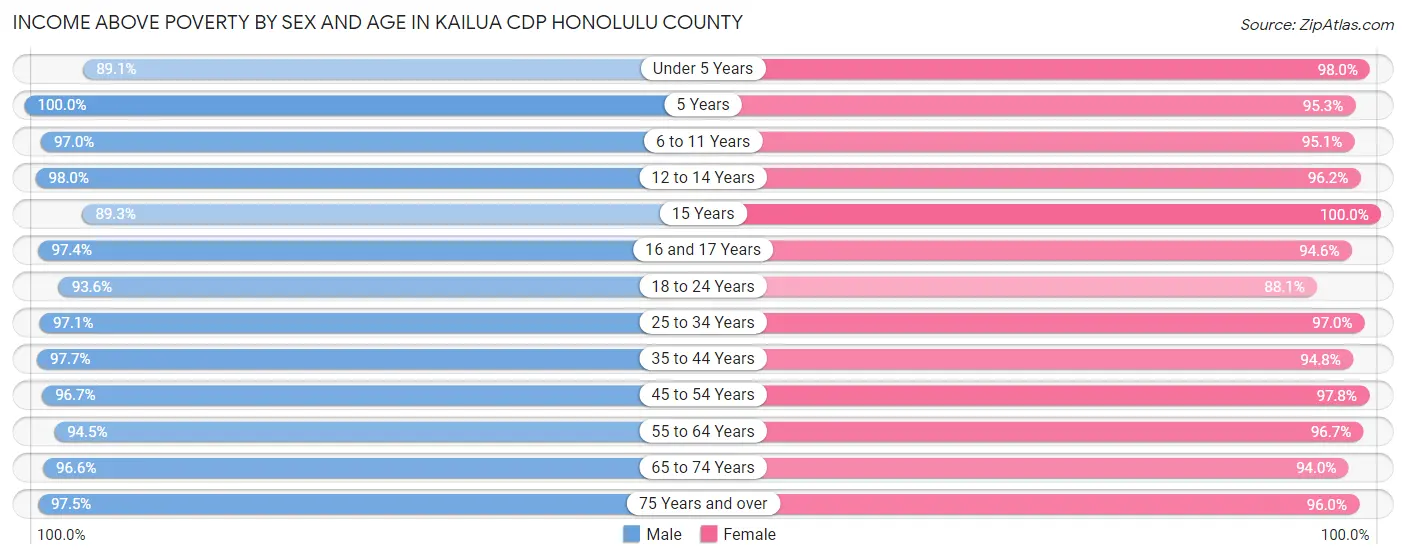
Income Above Poverty by Sex and Age in Kailua CDP Honolulu County
According to the poverty statistics in Kailua CDP Honolulu County, males aged 5 years and females aged 15 years are the age groups that are most secure financially, with 100.0% of males and 100.0% of females in these age groups living above the poverty line.
| Age Bracket | Male | Female |
| Under 5 Years | 885 (89.1%) | 979 (98.0%) |
| 5 Years | 318 (100.0%) | 161 (95.3%) |
| 6 to 11 Years | 1,561 (97.0%) | 1,605 (95.1%) |
| 12 to 14 Years | 716 (98.0%) | 810 (96.2%) |
| 15 Years | 299 (89.2%) | 153 (100.0%) |
| 16 and 17 Years | 488 (97.4%) | 262 (94.6%) |
| 18 to 24 Years | 1,398 (93.6%) | 927 (88.1%) |
| 25 to 34 Years | 2,279 (97.1%) | 2,051 (97.0%) |
| 35 to 44 Years | 3,050 (97.7%) | 2,793 (94.8%) |
| 45 to 54 Years | 2,150 (96.7%) | 2,422 (97.8%) |
| 55 to 64 Years | 2,628 (94.5%) | 2,604 (96.7%) |
| 65 to 74 Years | 2,081 (96.6%) | 2,399 (94.0%) |
| 75 Years and over | 1,417 (97.5%) | 1,928 (96.0%) |
| Total | 19,270 (96.1%) | 19,094 (95.6%) |
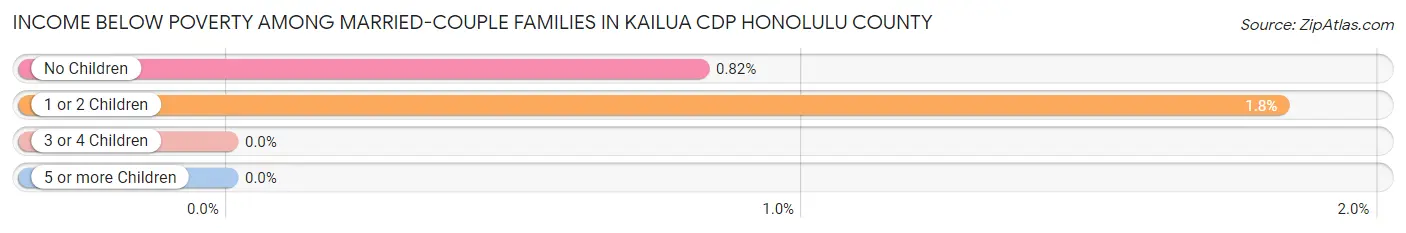
Income Below Poverty Among Married-Couple Families in Kailua CDP Honolulu County
The poverty statistics for married-couple families in Kailua CDP Honolulu County show that 1.1% or 83 of the total 7,666 families live below the poverty line. Families with 1 or 2 children have the highest poverty rate of 1.8%, comprising of 46 families. On the other hand, families with 3 or 4 children have the lowest poverty rate of 0.0%, which includes 0 families.
| Children | Above Poverty | Below Poverty |
| No Children | 4,454 (99.2%) | 37 (0.8%) |
| 1 or 2 Children | 2,473 (98.2%) | 46 (1.8%) |
| 3 or 4 Children | 571 (100.0%) | 0 (0.0%) |
| 5 or more Children | 85 (100.0%) | 0 (0.0%) |
| Total | 7,583 (98.9%) | 83 (1.1%) |
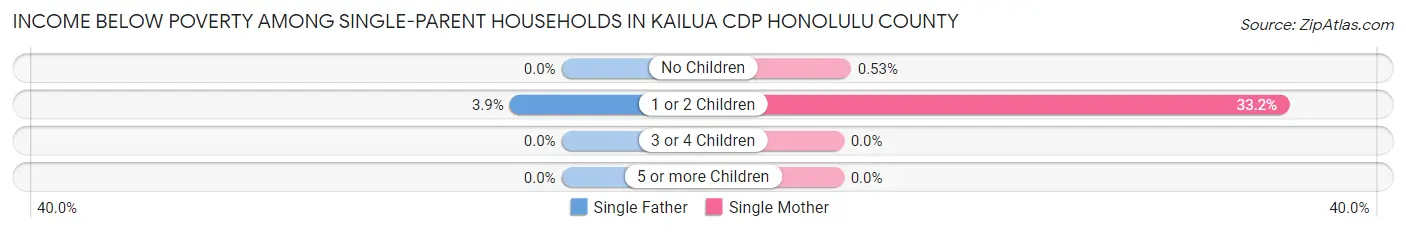
Income Below Poverty Among Single-Parent Households in Kailua CDP Honolulu County
According to the poverty data in Kailua CDP Honolulu County, 1.5% or 11 single-father households and 9.9% or 138 single-mother households are living below the poverty line. Among single-father households, those with 1 or 2 children have the highest poverty rate, with 11 households (3.9%) experiencing poverty. Likewise, among single-mother households, those with 1 or 2 children have the highest poverty rate, with 133 households (33.2%) falling below the poverty line.
| Children | Single Father | Single Mother |
| No Children | 0 (0.0%) | 5 (0.5%) |
| 1 or 2 Children | 11 (3.9%) | 133 (33.2%) |
| 3 or 4 Children | 0 (0.0%) | 0 (0.0%) |
| 5 or more Children | 0 (0.0%) | 0 (0.0%) |
| Total | 11 (1.5%) | 138 (9.9%) |
Income Below Poverty Among Married-Couple vs Single-Parent Households in Kailua CDP Honolulu County
The poverty data for Kailua CDP Honolulu County shows that 83 of the married-couple family households (1.1%) and 149 of the single-parent households (7.0%) are living below the poverty level. Within the married-couple family households, those with 1 or 2 children have the highest poverty rate, with 46 households (1.8%) falling below the poverty line. Among the single-parent households, those with 1 or 2 children have the highest poverty rate, with 144 household (21.0%) living below poverty.
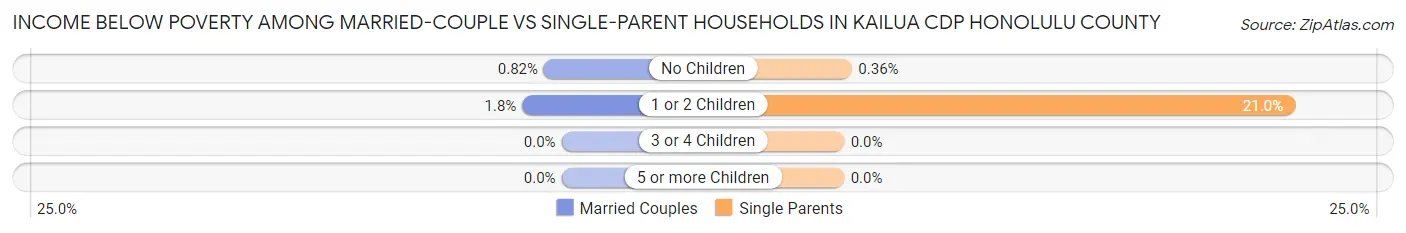
| Children | Married-Couple Families | Single-Parent Households |
| No Children | 37 (0.8%) | 5 (0.4%) |
| 1 or 2 Children | 46 (1.8%) | 144 (21.0%) |
| 3 or 4 Children | 0 (0.0%) | 0 (0.0%) |
| 5 or more Children | 0 (0.0%) | 0 (0.0%) |
| Total | 83 (1.1%) | 149 (7.0%) |
Race in Kailua CDP Honolulu County
The most populous races in Kailua CDP Honolulu County are White / Caucasian (17,118 | 42.4%), Two or more Races (11,502 | 28.5%), and Asian (8,583 | 21.3%).
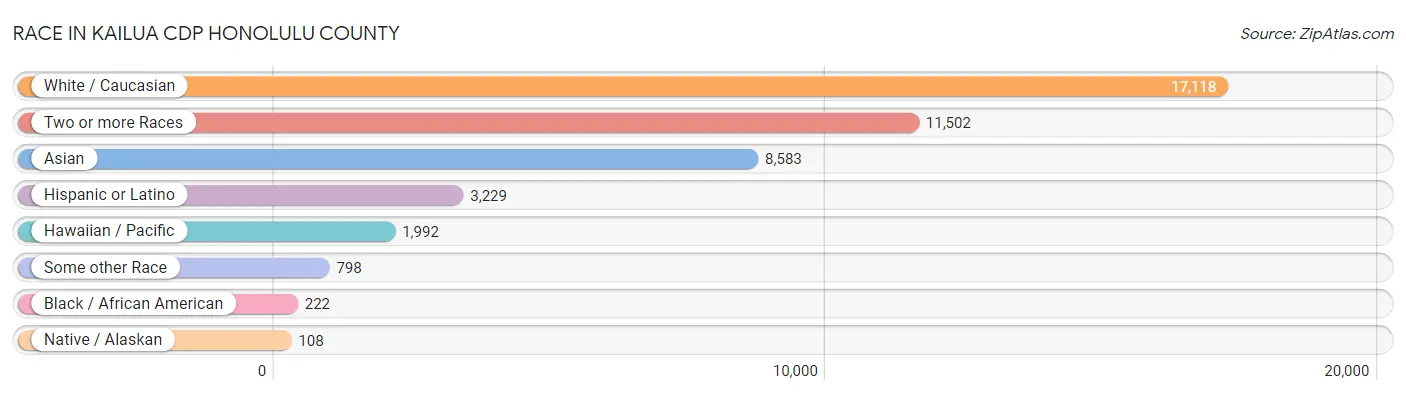
| Race | # Population | % Population |
| Asian | 8,583 | 21.3% |
| Black / African American | 222 | 0.5% |
| Hawaiian / Pacific | 1,992 | 4.9% |
| Hispanic or Latino | 3,229 | 8.0% |
| Native / Alaskan | 108 | 0.3% |
| White / Caucasian | 17,118 | 42.4% |
| Two or more Races | 11,502 | 28.5% |
| Some other Race | 798 | 2.0% |
| Total | 40,323 | 100.0% |
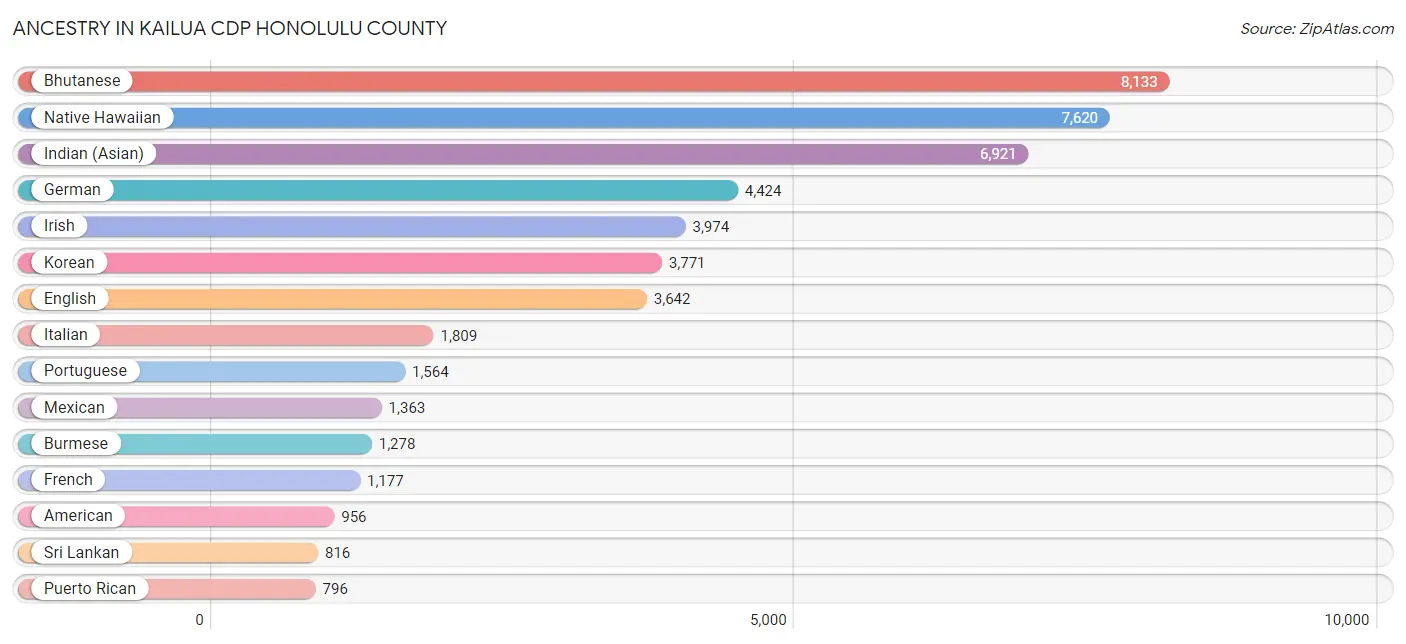
Ancestry in Kailua CDP Honolulu County
The most populous ancestries reported in Kailua CDP Honolulu County are Bhutanese (8,133 | 20.2%), Native Hawaiian (7,620 | 18.9%), Indian (Asian) (6,921 | 17.2%), German (4,424 | 11.0%), and Irish (3,974 | 9.9%), together accounting for 77.1% of all Kailua CDP Honolulu County residents.
| Ancestry | # Population | % Population |
| African | 49 | 0.1% |
| Alaskan Athabascan | 5 | 0.0% |
| American | 956 | 2.4% |
| Apache | 119 | 0.3% |
| Arab | 81 | 0.2% |
| Argentinean | 13 | 0.0% |
| Armenian | 21 | 0.1% |
| Australian | 34 | 0.1% |
| Austrian | 70 | 0.2% |
| Bangladeshi | 52 | 0.1% |
| Belgian | 23 | 0.1% |
| Bhutanese | 8,133 | 20.2% |
| Blackfeet | 121 | 0.3% |
| Brazilian | 16 | 0.0% |
| British | 141 | 0.4% |
| Burmese | 1,278 | 3.2% |
| Canadian | 121 | 0.3% |
| Celtic | 6 | 0.0% |
| Central American | 65 | 0.2% |
| Central American Indian | 48 | 0.1% |
| Cherokee | 393 | 1.0% |
| Chickasaw | 38 | 0.1% |
| Chilean | 13 | 0.0% |
| Chinese | 395 | 1.0% |
| Choctaw | 43 | 0.1% |
| Colombian | 59 | 0.2% |
| Croatian | 28 | 0.1% |
| Cuban | 136 | 0.3% |
| Czech | 65 | 0.2% |
| Czechoslovakian | 17 | 0.0% |
| Danish | 191 | 0.5% |
| Delaware | 10 | 0.0% |
| Dutch | 295 | 0.7% |
| Eastern European | 104 | 0.3% |
| Ecuadorian | 23 | 0.1% |
| Egyptian | 44 | 0.1% |
| English | 3,642 | 9.0% |
| European | 677 | 1.7% |
| Fijian | 60 | 0.2% |
| Filipino | 44 | 0.1% |
| Finnish | 153 | 0.4% |
| French | 1,177 | 2.9% |
| French Canadian | 105 | 0.3% |
| German | 4,424 | 11.0% |
| Greek | 367 | 0.9% |
| Guamanian / Chamorro | 110 | 0.3% |
| Hungarian | 78 | 0.2% |
| Icelander | 68 | 0.2% |
| Indian (Asian) | 6,921 | 17.2% |
| Inupiat | 4 | 0.0% |
| Iranian | 8 | 0.0% |
| Irish | 3,974 | 9.9% |
| Italian | 1,809 | 4.5% |
| Korean | 3,771 | 9.3% |
| Laotian | 17 | 0.0% |
| Latvian | 19 | 0.1% |
| Lebanese | 10 | 0.0% |
| Lithuanian | 43 | 0.1% |
| Malaysian | 6 | 0.0% |
| Mexican | 1,363 | 3.4% |
| Native Hawaiian | 7,620 | 18.9% |
| Navajo | 13 | 0.0% |
| New Zealander | 37 | 0.1% |
| Nigerian | 5 | 0.0% |
| Northern European | 64 | 0.2% |
| Norwegian | 378 | 0.9% |
| Pakistani | 94 | 0.2% |
| Peruvian | 260 | 0.6% |
| Polish | 758 | 1.9% |
| Portuguese | 1,564 | 3.9% |
| Puerto Rican | 796 | 2.0% |
| Romanian | 23 | 0.1% |
| Russian | 245 | 0.6% |
| Salvadoran | 65 | 0.2% |
| Samoan | 432 | 1.1% |
| Scandinavian | 175 | 0.4% |
| Scotch-Irish | 393 | 1.0% |
| Scottish | 731 | 1.8% |
| Sioux | 6 | 0.0% |
| Slavic | 23 | 0.1% |
| Slovak | 74 | 0.2% |
| Slovene | 25 | 0.1% |
| South American | 381 | 0.9% |
| South American Indian | 5 | 0.0% |
| Spaniard | 103 | 0.3% |
| Spanish | 314 | 0.8% |
| Spanish American Indian | 6 | 0.0% |
| Sri Lankan | 816 | 2.0% |
| Subsaharan African | 81 | 0.2% |
| Sudanese | 12 | 0.0% |
| Swedish | 405 | 1.0% |
| Swiss | 178 | 0.4% |
| Syrian | 22 | 0.1% |
| Thai | 180 | 0.4% |
| Tlingit-Haida | 4 | 0.0% |
| Tongan | 129 | 0.3% |
| Turkish | 9 | 0.0% |
| Ukrainian | 100 | 0.3% |
| Uruguayan | 9 | 0.0% |
| Venezuelan | 4 | 0.0% |
| Vietnamese | 7 | 0.0% |
| Welsh | 236 | 0.6% | View All 102 Rows |
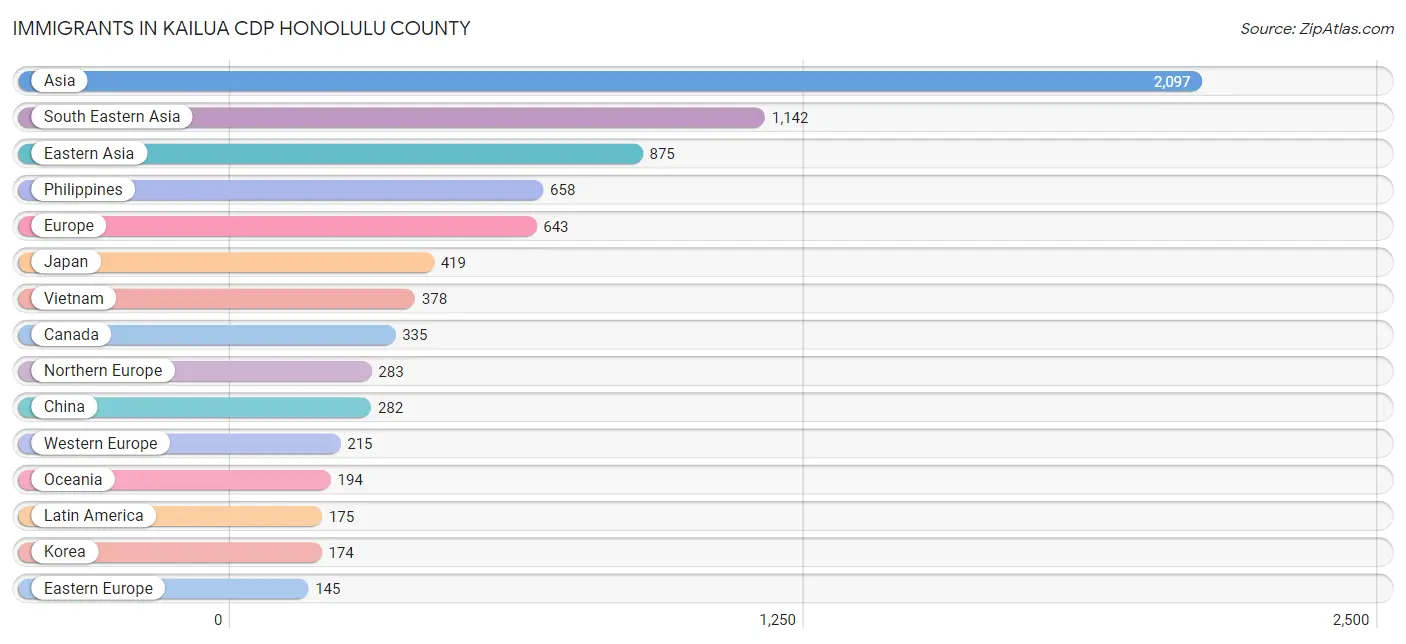
Immigrants in Kailua CDP Honolulu County
The most numerous immigrant groups reported in Kailua CDP Honolulu County came from Asia (2,097 | 5.2%), South Eastern Asia (1,142 | 2.8%), Eastern Asia (875 | 2.2%), Philippines (658 | 1.6%), and Europe (643 | 1.6%), together accounting for 13.4% of all Kailua CDP Honolulu County residents.
| Immigration Origin | # Population | % Population |
| Africa | 97 | 0.2% |
| Argentina | 13 | 0.0% |
| Asia | 2,097 | 5.2% |
| Australia | 25 | 0.1% |
| Austria | 18 | 0.0% |
| Bangladesh | 7 | 0.0% |
| Belgium | 4 | 0.0% |
| Brazil | 69 | 0.2% |
| Bulgaria | 89 | 0.2% |
| Cambodia | 14 | 0.0% |
| Canada | 335 | 0.8% |
| Central America | 51 | 0.1% |
| Chile | 28 | 0.1% |
| China | 282 | 0.7% |
| Croatia | 4 | 0.0% |
| Denmark | 46 | 0.1% |
| Eastern Africa | 10 | 0.0% |
| Eastern Asia | 875 | 2.2% |
| Eastern Europe | 145 | 0.4% |
| England | 49 | 0.1% |
| Europe | 643 | 1.6% |
| France | 64 | 0.2% |
| Germany | 119 | 0.3% |
| Hong Kong | 108 | 0.3% |
| India | 56 | 0.1% |
| Indonesia | 16 | 0.0% |
| Iran | 8 | 0.0% |
| Ireland | 25 | 0.1% |
| Japan | 419 | 1.0% |
| Korea | 174 | 0.4% |
| Latin America | 175 | 0.4% |
| Malaysia | 16 | 0.0% |
| Mexico | 51 | 0.1% |
| Micronesia | 18 | 0.0% |
| Middle Africa | 17 | 0.0% |
| Moldova | 10 | 0.0% |
| Nigeria | 5 | 0.0% |
| Northern Africa | 49 | 0.1% |
| Northern Europe | 283 | 0.7% |
| Oceania | 194 | 0.5% |
| Peru | 6 | 0.0% |
| Philippines | 658 | 1.6% |
| Russia | 29 | 0.1% |
| Singapore | 11 | 0.0% |
| South Africa | 16 | 0.0% |
| South America | 124 | 0.3% |
| South Central Asia | 71 | 0.2% |
| South Eastern Asia | 1,142 | 2.8% |
| Sudan | 12 | 0.0% |
| Sweden | 36 | 0.1% |
| Switzerland | 10 | 0.0% |
| Taiwan | 39 | 0.1% |
| Thailand | 49 | 0.1% |
| Turkey | 9 | 0.0% |
| Ukraine | 13 | 0.0% |
| Venezuela | 8 | 0.0% |
| Vietnam | 378 | 0.9% |
| Western Africa | 5 | 0.0% |
| Western Asia | 9 | 0.0% |
| Western Europe | 215 | 0.5% |
| Zaire | 5 | 0.0% | View All 61 Rows |
Sex and Age in Kailua CDP Honolulu County
Sex and Age in Kailua CDP Honolulu County
The most populous age groups in Kailua CDP Honolulu County are 35 to 39 Years (1,616 | 8.0%) for men and 10 to 14 Years (1,575 | 7.8%) for women.
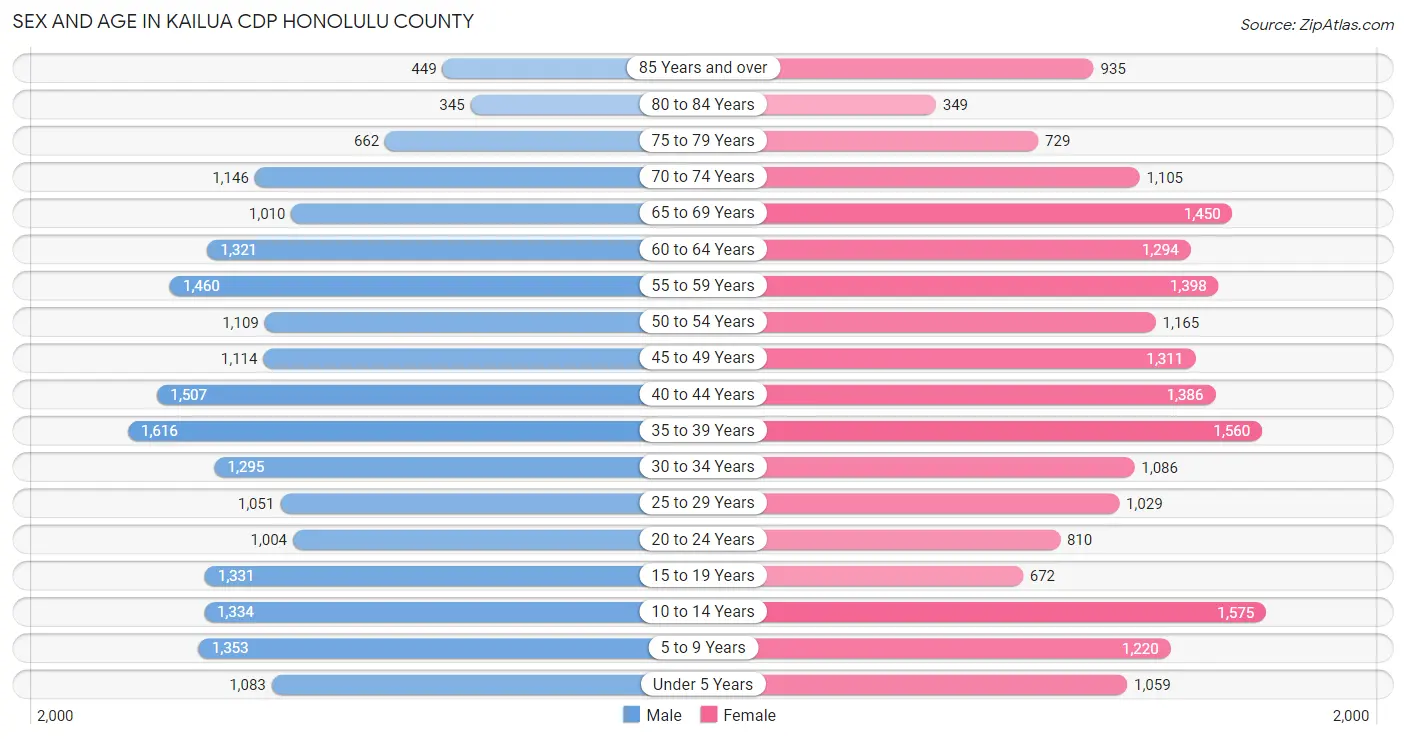
| Age Bracket | Male | Female |
| Under 5 Years | 1,083 (5.4%) | 1,059 (5.3%) |
| 5 to 9 Years | 1,353 (6.7%) | 1,220 (6.1%) |
| 10 to 14 Years | 1,334 (6.6%) | 1,575 (7.8%) |
| 15 to 19 Years | 1,331 (6.6%) | 672 (3.3%) |
| 20 to 24 Years | 1,004 (5.0%) | 810 (4.0%) |
| 25 to 29 Years | 1,051 (5.2%) | 1,029 (5.1%) |
| 30 to 34 Years | 1,295 (6.4%) | 1,086 (5.4%) |
| 35 to 39 Years | 1,616 (8.0%) | 1,560 (7.7%) |
| 40 to 44 Years | 1,507 (7.5%) | 1,386 (6.9%) |
| 45 to 49 Years | 1,114 (5.5%) | 1,311 (6.5%) |
| 50 to 54 Years | 1,109 (5.5%) | 1,165 (5.8%) |
| 55 to 59 Years | 1,460 (7.2%) | 1,398 (6.9%) |
| 60 to 64 Years | 1,321 (6.5%) | 1,294 (6.4%) |
| 65 to 69 Years | 1,010 (5.0%) | 1,450 (7.2%) |
| 70 to 74 Years | 1,146 (5.7%) | 1,105 (5.5%) |
| 75 to 79 Years | 662 (3.3%) | 729 (3.6%) |
| 80 to 84 Years | 345 (1.7%) | 349 (1.7%) |
| 85 Years and over | 449 (2.2%) | 935 (4.6%) |
| Total | 20,190 (100.0%) | 20,133 (100.0%) |
Families and Households in Kailua CDP Honolulu County
Median Family Size in Kailua CDP Honolulu County
The median family size in Kailua CDP Honolulu County is 3.44 persons per family, with single female/mother families (1,393 | 14.2%) accounting for the largest median family size of 3.59 persons per family. On the other hand, single male/father families (733 | 7.5%) represent the smallest median family size with 3.08 persons per family.
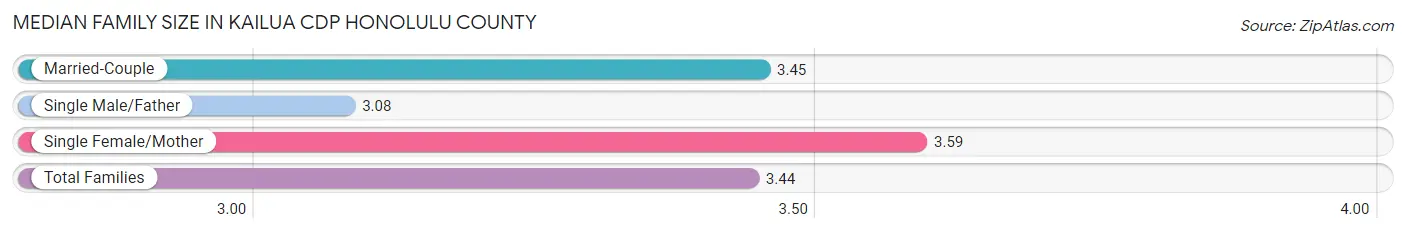
| Family Type | # Families | Family Size |
| Married-Couple | 7,666 (78.3%) | 3.45 |
| Single Male/Father | 733 (7.5%) | 3.08 |
| Single Female/Mother | 1,393 (14.2%) | 3.59 |
| Total Families | 9,792 (100.0%) | 3.44 |
Median Household Size in Kailua CDP Honolulu County
The median household size in Kailua CDP Honolulu County is 3.03 persons per household, with single female/mother households (1,393 | 10.5%) accounting for the largest median household size of 3.77 persons per household. non-family households (3,470 | 26.2%) represent the smallest median household size with 1.45 persons per household.
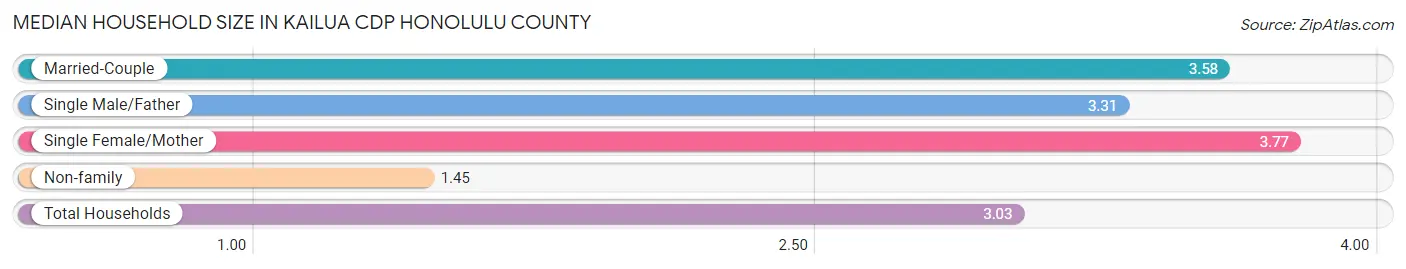
| Household Type | # Households | Household Size |
| Married-Couple | 7,666 (57.8%) | 3.58 |
| Single Male/Father | 733 (5.5%) | 3.31 |
| Single Female/Mother | 1,393 (10.5%) | 3.77 |
| Non-family | 3,470 (26.2%) | 1.45 |
| Total Households | 13,262 (100.0%) | 3.03 |
Household Size by Marriage Status in Kailua CDP Honolulu County
Out of a total of 13,262 households in Kailua CDP Honolulu County, 9,792 (73.8%) are family households, while 3,470 (26.2%) are nonfamily households. The most numerous type of family households are 2-person households, comprising 3,814, and the most common type of nonfamily households are 1-person households, comprising 2,501.
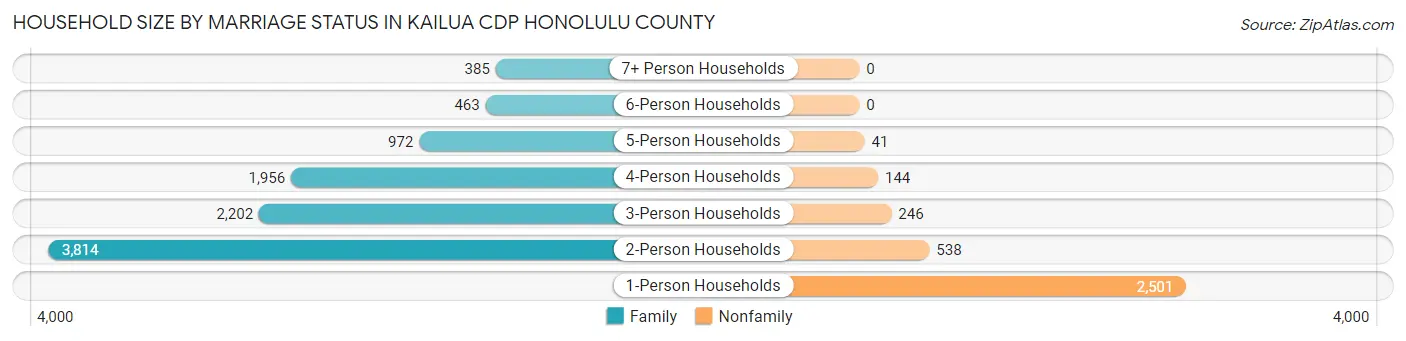
| Household Size | Family Households | Nonfamily Households |
| 1-Person Households | - | 2,501 (18.9%) |
| 2-Person Households | 3,814 (28.8%) | 538 (4.1%) |
| 3-Person Households | 2,202 (16.6%) | 246 (1.8%) |
| 4-Person Households | 1,956 (14.7%) | 144 (1.1%) |
| 5-Person Households | 972 (7.3%) | 41 (0.3%) |
| 6-Person Households | 463 (3.5%) | 0 (0.0%) |
| 7+ Person Households | 385 (2.9%) | 0 (0.0%) |
| Total | 9,792 (73.8%) | 3,470 (26.2%) |
Female Fertility in Kailua CDP Honolulu County
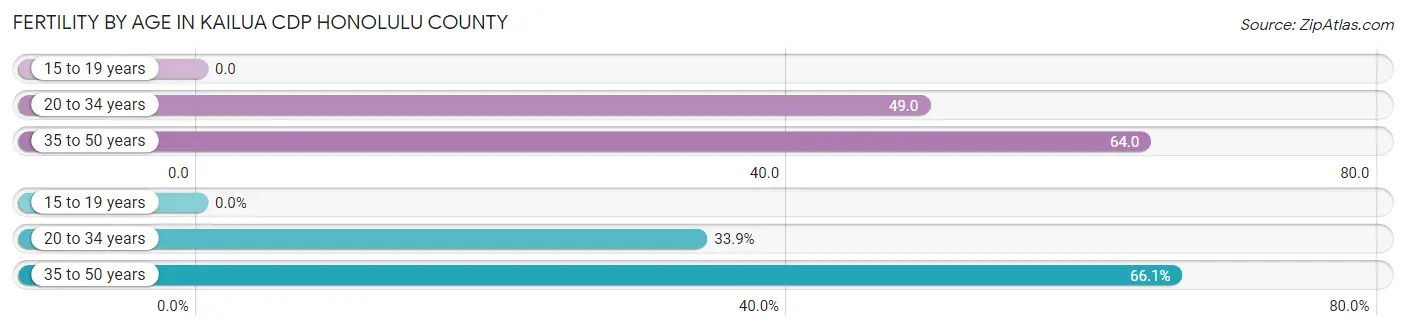
Fertility by Age in Kailua CDP Honolulu County
Average fertility rate in Kailua CDP Honolulu County is 53.0 births per 1,000 women. Women in the age bracket of 35 to 50 years have the highest fertility rate with 64.0 births per 1,000 women. Women in the age bracket of 35 to 50 years acount for 66.1% of all women with births.
| Age Bracket | Women with Births | Births / 1,000 Women |
| 15 to 19 years | 0 (0.0%) | 0.0 |
| 20 to 34 years | 143 (33.9%) | 49.0 |
| 35 to 50 years | 279 (66.1%) | 64.0 |
| Total | 422 (100.0%) | 53.0 |
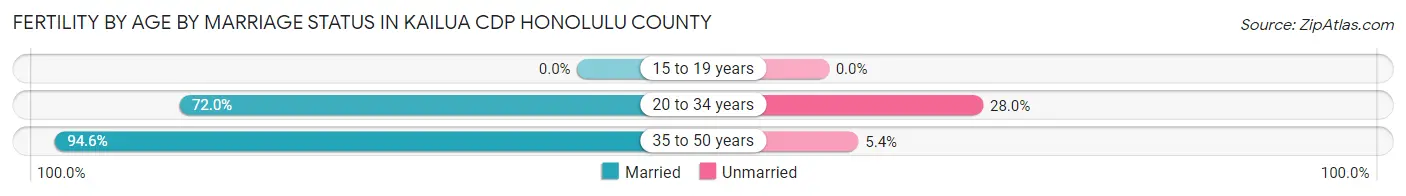
Fertility by Age by Marriage Status in Kailua CDP Honolulu County
87.0% of women with births (422) in Kailua CDP Honolulu County are married. The highest percentage of unmarried women with births falls into 20 to 34 years age bracket with 28.0% of them unmarried at the time of birth, while the lowest percentage of unmarried women with births belong to 35 to 50 years age bracket with 5.4% of them unmarried.
| Age Bracket | Married | Unmarried |
| 15 to 19 years | 0 (0.0%) | 0 (0.0%) |
| 20 to 34 years | 103 (72.0%) | 40 (28.0%) |
| 35 to 50 years | 264 (94.6%) | 15 (5.4%) |
| Total | 367 (87.0%) | 55 (13.0%) |
Fertility by Education in Kailua CDP Honolulu County
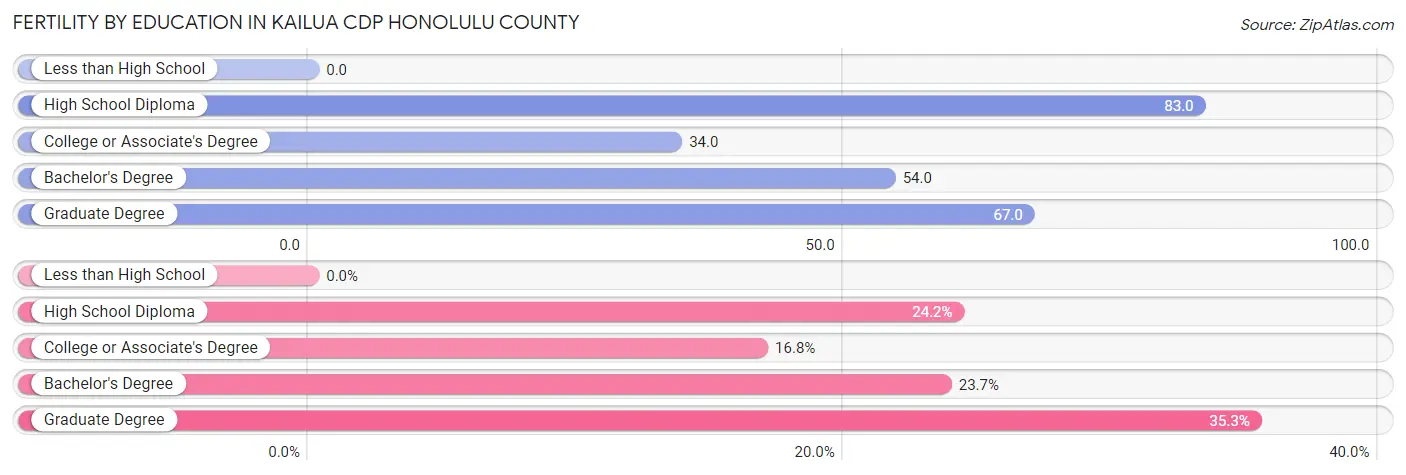
| Educational Attainment | Women with Births | Births / 1,000 Women |
| Less than High School | 0 (0.0%) | 0.0 |
| High School Diploma | 102 (24.2%) | 83.0 |
| College or Associate's Degree | 71 (16.8%) | 34.0 |
| Bachelor's Degree | 100 (23.7%) | 54.0 |
| Graduate Degree | 149 (35.3%) | 67.0 |
| Total | 422 (100.0%) | 53.0 |
Fertility by Education by Marriage Status in Kailua CDP Honolulu County
13.0% of women with births in Kailua CDP Honolulu County are unmarried. Women with the educational attainment of college or associate's degree are most likely to be married with 100.0% of them married at childbirth, while women with the educational attainment of high school diploma are least likely to be married with 45.1% of them unmarried at childbirth.
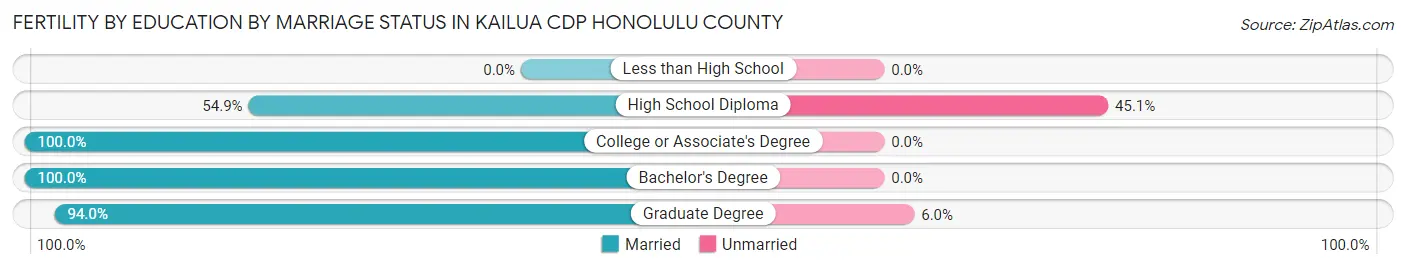
| Educational Attainment | Married | Unmarried |
| Less than High School | 0 (0.0%) | 0 (0.0%) |
| High School Diploma | 56 (54.9%) | 46 (45.1%) |
| College or Associate's Degree | 71 (100.0%) | 0 (0.0%) |
| Bachelor's Degree | 100 (100.0%) | 0 (0.0%) |
| Graduate Degree | 140 (94.0%) | 9 (6.0%) |
| Total | 367 (87.0%) | 55 (13.0%) |
Employment Characteristics in Kailua CDP Honolulu County
Employment by Class of Employer in Kailua CDP Honolulu County
Among the 19,838 employed individuals in Kailua CDP Honolulu County, private company employees (10,118 | 51.0%), federal government employees (3,203 | 16.2%), and state government employees (1,765 | 8.9%) make up the most common classes of employment.
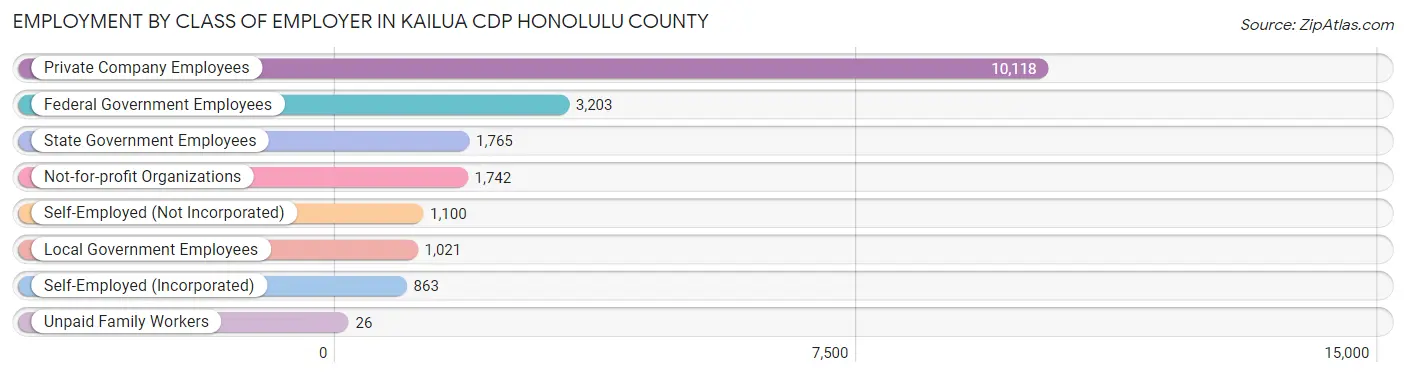
| Employer Class | # Employees | % Employees |
| Private Company Employees | 10,118 | 51.0% |
| Self-Employed (Incorporated) | 863 | 4.3% |
| Self-Employed (Not Incorporated) | 1,100 | 5.5% |
| Not-for-profit Organizations | 1,742 | 8.8% |
| Local Government Employees | 1,021 | 5.1% |
| State Government Employees | 1,765 | 8.9% |
| Federal Government Employees | 3,203 | 16.2% |
| Unpaid Family Workers | 26 | 0.1% |
| Total | 19,838 | 100.0% |
Employment Status by Age in Kailua CDP Honolulu County
According to the labor force statistics for Kailua CDP Honolulu County, out of the total population over 16 years of age (32,211), 65.3% or 21,034 individuals are in the labor force, with 3.3% or 694 of them unemployed. The age group with the highest labor force participation rate is 25 to 29 years, with 88.9% or 1,849 individuals in the labor force. Within the labor force, the 16 to 19 years age range has the highest percentage of unemployed individuals, with 18.1% or 75 of them being unemployed.
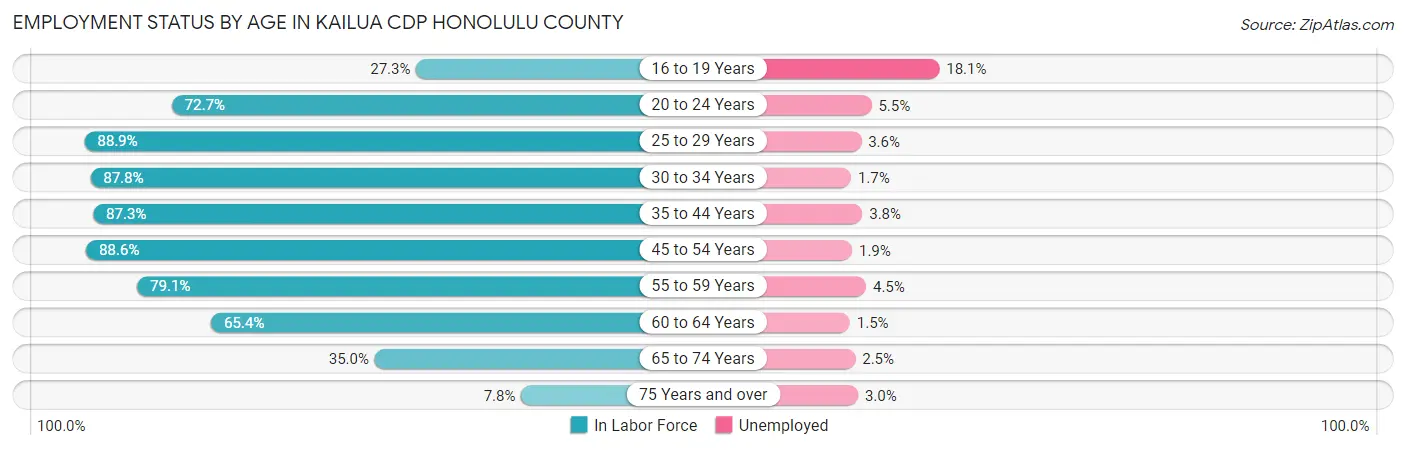
| Age Bracket | In Labor Force | Unemployed |
| 16 to 19 Years | 414 (27.3%) | 75 (18.1%) |
| 20 to 24 Years | 1,319 (72.7%) | 73 (5.5%) |
| 25 to 29 Years | 1,849 (88.9%) | 67 (3.6%) |
| 30 to 34 Years | 2,091 (87.8%) | 36 (1.7%) |
| 35 to 44 Years | 5,298 (87.3%) | 201 (3.8%) |
| 45 to 54 Years | 4,163 (88.6%) | 79 (1.9%) |
| 55 to 59 Years | 2,261 (79.1%) | 102 (4.5%) |
| 60 to 64 Years | 1,710 (65.4%) | 26 (1.5%) |
| 65 to 74 Years | 1,649 (35.0%) | 41 (2.5%) |
| 75 Years and over | 271 (7.8%) | 8 (3.0%) |
| Total | 21,034 (65.3%) | 694 (3.3%) |
Employment Status by Educational Attainment in Kailua CDP Honolulu County
According to labor force statistics for Kailua CDP Honolulu County, 83.9% of individuals (17,369) out of the total population between 25 and 64 years of age (20,702) are in the labor force, with 2.9% or 504 of them being unemployed. The group with the highest labor force participation rate are those with the educational attainment of bachelor's degree or higher, with 86.5% or 9,626 individuals in the labor force. Within the labor force, individuals with less than high school education have the highest percentage of unemployment, with 6.5% or 14 of them being unemployed.
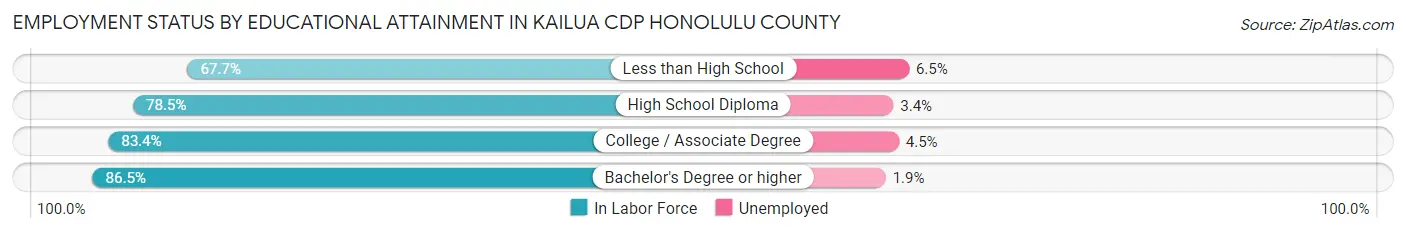
| Educational Attainment | In Labor Force | Unemployed |
| Less than High School | 216 (67.7%) | 21 (6.5%) |
| High School Diploma | 2,908 (78.5%) | 126 (3.4%) |
| College / Associate Degree | 4,629 (83.4%) | 250 (4.5%) |
| Bachelor's Degree or higher | 9,626 (86.5%) | 211 (1.9%) |
| Total | 17,369 (83.9%) | 600 (2.9%) |
Employment Occupations by Sex in Kailua CDP Honolulu County
Management, Business, Science and Arts Occupations
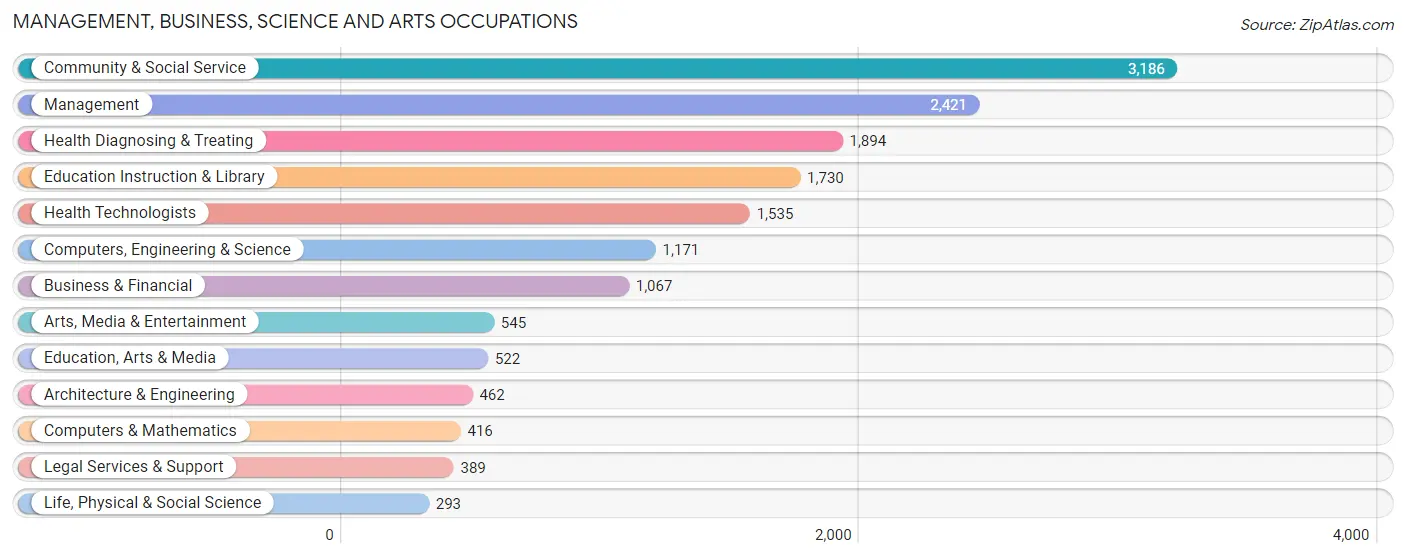
The most common Management, Business, Science and Arts occupations in Kailua CDP Honolulu County are Community & Social Service (3,186 | 16.9%), Management (2,421 | 12.8%), Health Diagnosing & Treating (1,894 | 10.0%), Education Instruction & Library (1,730 | 9.1%), and Health Technologists (1,535 | 8.1%).
Management, Business, Science and Arts Occupations by Sex
Within the Management, Business, Science and Arts occupations in Kailua CDP Honolulu County, the most male-oriented occupations are Architecture & Engineering (90.5%), Computers & Mathematics (71.6%), and Computers, Engineering & Science (71.0%), while the most female-oriented occupations are Education, Arts & Media (80.8%), Education Instruction & Library (72.0%), and Community & Social Service (66.4%).
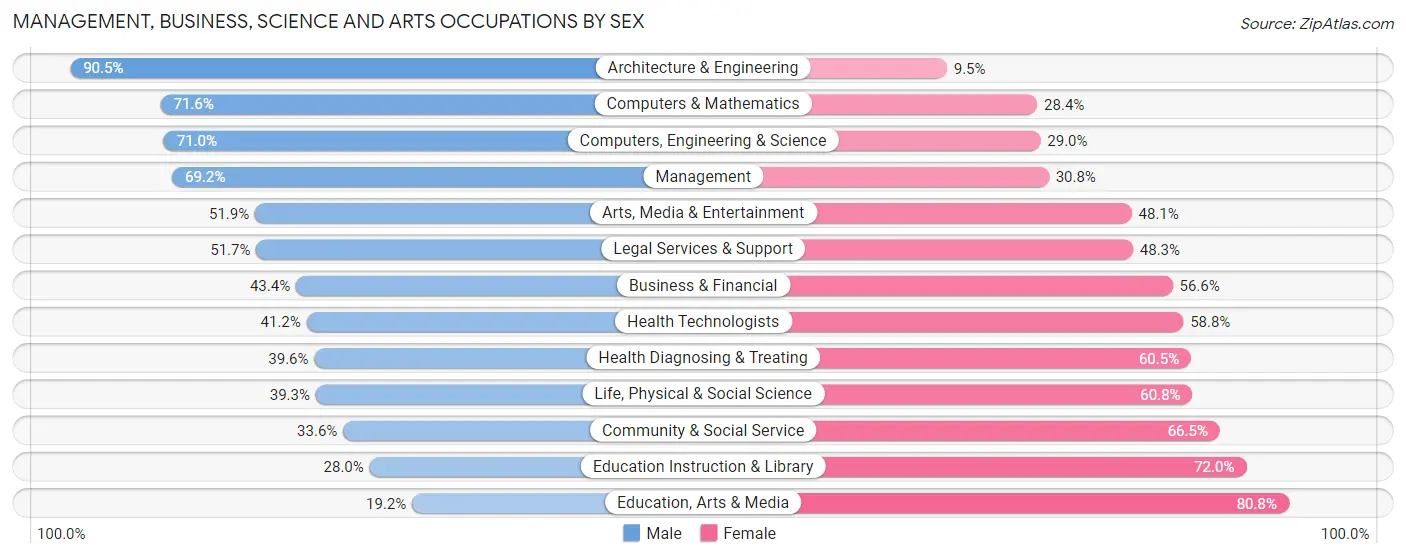
| Occupation | Male | Female |
| Management | 1,676 (69.2%) | 745 (30.8%) |
| Business & Financial | 463 (43.4%) | 604 (56.6%) |
| Computers, Engineering & Science | 831 (71.0%) | 340 (29.0%) |
| Computers & Mathematics | 298 (71.6%) | 118 (28.4%) |
| Architecture & Engineering | 418 (90.5%) | 44 (9.5%) |
| Life, Physical & Social Science | 115 (39.3%) | 178 (60.8%) |
| Community & Social Service | 1,069 (33.6%) | 2,117 (66.4%) |
| Education, Arts & Media | 100 (19.2%) | 422 (80.8%) |
| Legal Services & Support | 201 (51.7%) | 188 (48.3%) |
| Education Instruction & Library | 485 (28.0%) | 1,245 (72.0%) |
| Arts, Media & Entertainment | 283 (51.9%) | 262 (48.1%) |
| Health Diagnosing & Treating | 749 (39.6%) | 1,145 (60.5%) |
| Health Technologists | 632 (41.2%) | 903 (58.8%) |
| Total (Category) | 4,788 (49.2%) | 4,951 (50.8%) |
| Total (Overall) | 9,711 (51.4%) | 9,187 (48.6%) |
Services Occupations
The most common Services occupations in Kailua CDP Honolulu County are Food Preparation & Serving (915 | 4.8%), Security & Protection (534 | 2.8%), Personal Care & Service (483 | 2.6%), Cleaning & Maintenance (410 | 2.2%), and Firefighting & Prevention (282 | 1.5%).
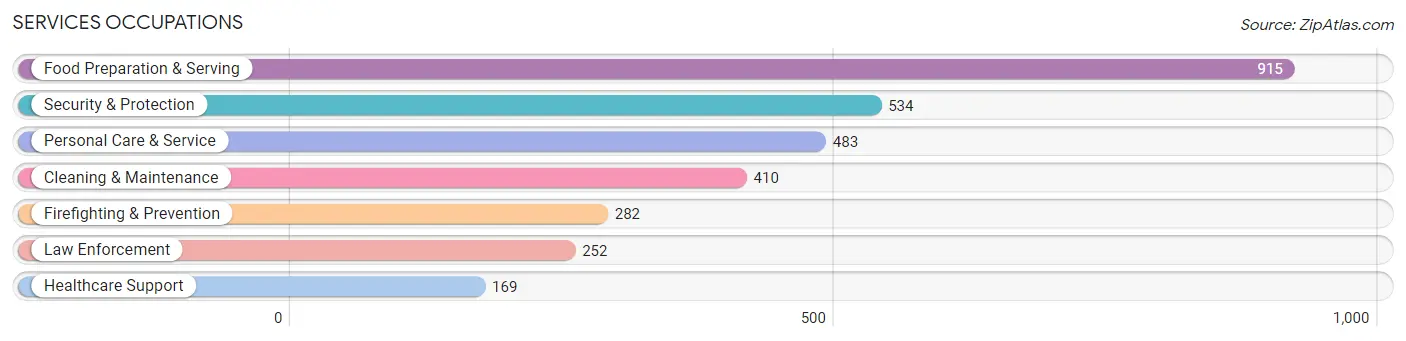
Services Occupations by Sex
Within the Services occupations in Kailua CDP Honolulu County, the most male-oriented occupations are Firefighting & Prevention (94.0%), Security & Protection (87.1%), and Law Enforcement (79.4%), while the most female-oriented occupations are Healthcare Support (97.6%), Personal Care & Service (89.4%), and Food Preparation & Serving (56.3%).
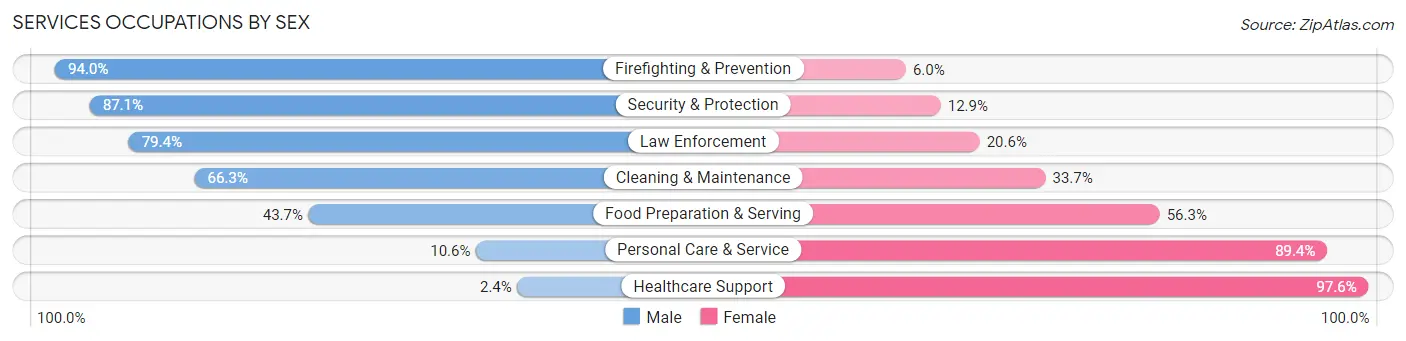
| Occupation | Male | Female |
| Healthcare Support | 4 (2.4%) | 165 (97.6%) |
| Security & Protection | 465 (87.1%) | 69 (12.9%) |
| Firefighting & Prevention | 265 (94.0%) | 17 (6.0%) |
| Law Enforcement | 200 (79.4%) | 52 (20.6%) |
| Food Preparation & Serving | 400 (43.7%) | 515 (56.3%) |
| Cleaning & Maintenance | 272 (66.3%) | 138 (33.7%) |
| Personal Care & Service | 51 (10.6%) | 432 (89.4%) |
| Total (Category) | 1,192 (47.5%) | 1,319 (52.5%) |
| Total (Overall) | 9,711 (51.4%) | 9,187 (48.6%) |
Sales and Office Occupations
The most common Sales and Office occupations in Kailua CDP Honolulu County are Office & Administration (2,048 | 10.8%), and Sales & Related (1,918 | 10.2%).
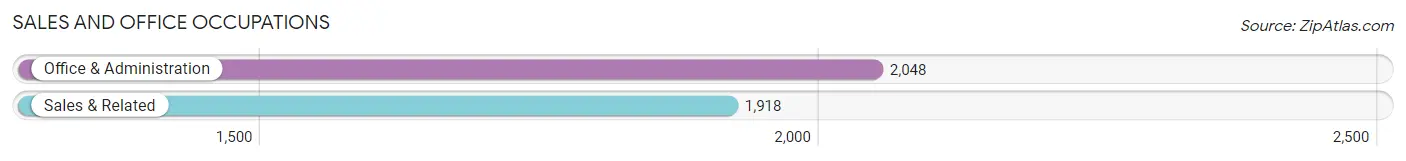
Sales and Office Occupations by Sex
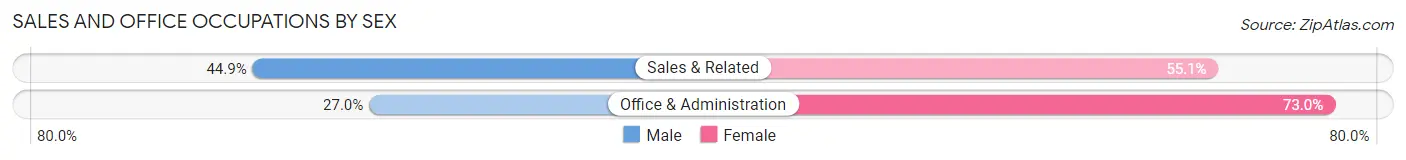
| Occupation | Male | Female |
| Sales & Related | 862 (44.9%) | 1,056 (55.1%) |
| Office & Administration | 553 (27.0%) | 1,495 (73.0%) |
| Total (Category) | 1,415 (35.7%) | 2,551 (64.3%) |
| Total (Overall) | 9,711 (51.4%) | 9,187 (48.6%) |
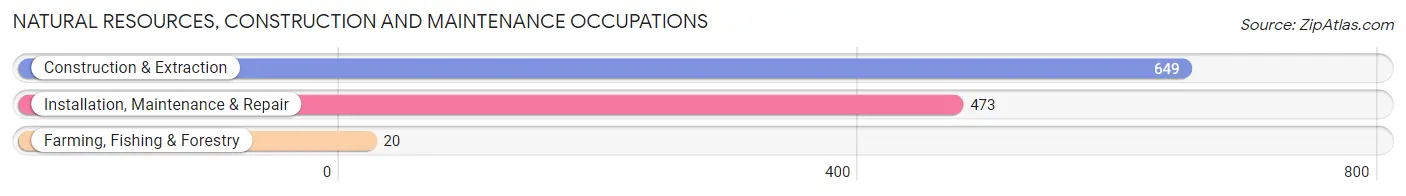
Natural Resources, Construction and Maintenance Occupations
The most common Natural Resources, Construction and Maintenance occupations in Kailua CDP Honolulu County are Construction & Extraction (649 | 3.4%), Installation, Maintenance & Repair (473 | 2.5%), and Farming, Fishing & Forestry (20 | 0.1%).
Natural Resources, Construction and Maintenance Occupations by Sex
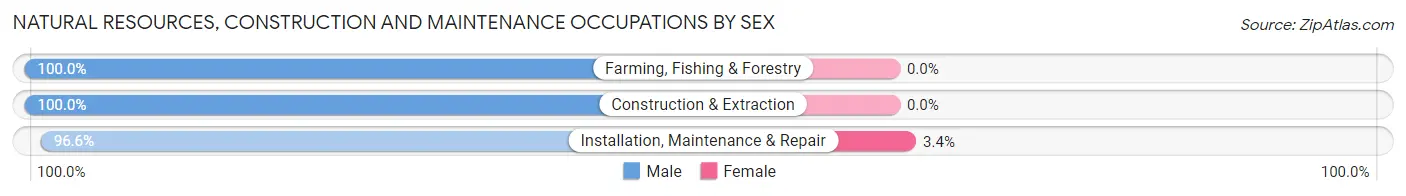
| Occupation | Male | Female |
| Farming, Fishing & Forestry | 20 (100.0%) | 0 (0.0%) |
| Construction & Extraction | 649 (100.0%) | 0 (0.0%) |
| Installation, Maintenance & Repair | 457 (96.6%) | 16 (3.4%) |
| Total (Category) | 1,126 (98.6%) | 16 (1.4%) |
| Total (Overall) | 9,711 (51.4%) | 9,187 (48.6%) |
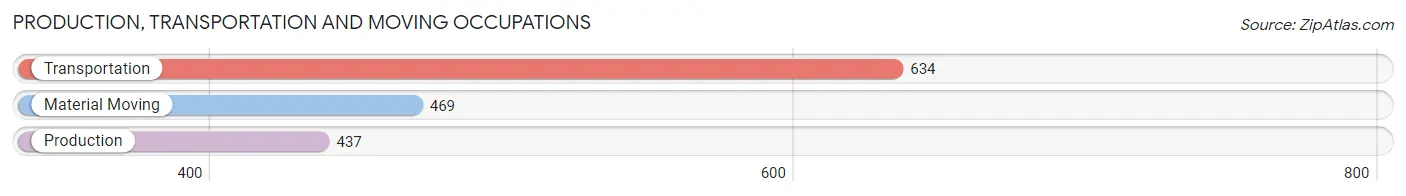
Production, Transportation and Moving Occupations
The most common Production, Transportation and Moving occupations in Kailua CDP Honolulu County are Transportation (634 | 3.4%), Material Moving (469 | 2.5%), and Production (437 | 2.3%).
Production, Transportation and Moving Occupations by Sex
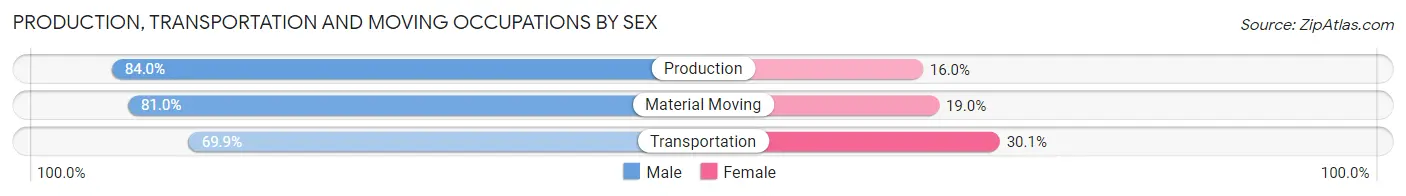
| Occupation | Male | Female |
| Production | 367 (84.0%) | 70 (16.0%) |
| Transportation | 443 (69.9%) | 191 (30.1%) |
| Material Moving | 380 (81.0%) | 89 (19.0%) |
| Total (Category) | 1,190 (77.3%) | 350 (22.7%) |
| Total (Overall) | 9,711 (51.4%) | 9,187 (48.6%) |
Employment Industries by Sex in Kailua CDP Honolulu County
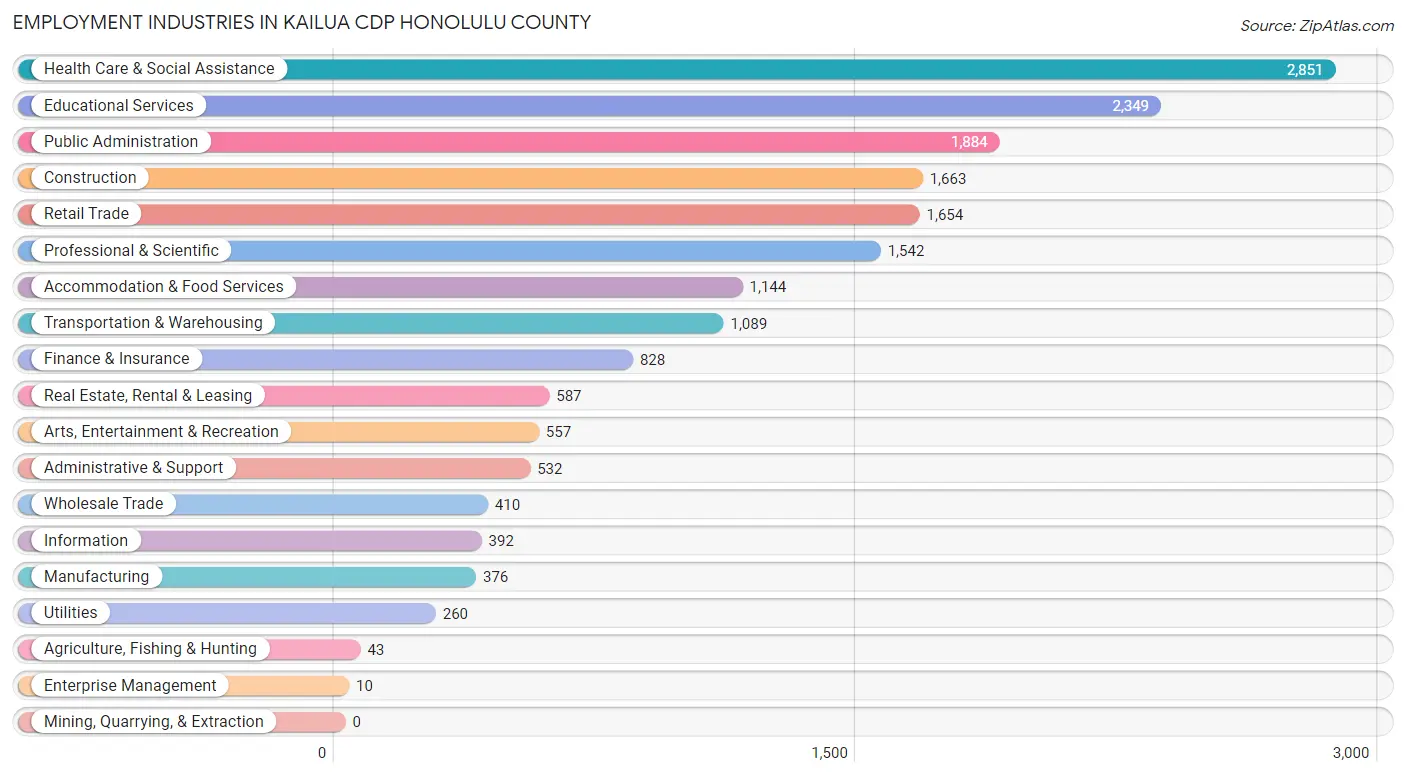
Employment Industries in Kailua CDP Honolulu County
The major employment industries in Kailua CDP Honolulu County include Health Care & Social Assistance (2,851 | 15.1%), Educational Services (2,349 | 12.4%), Public Administration (1,884 | 10.0%), Construction (1,663 | 8.8%), and Retail Trade (1,654 | 8.7%).
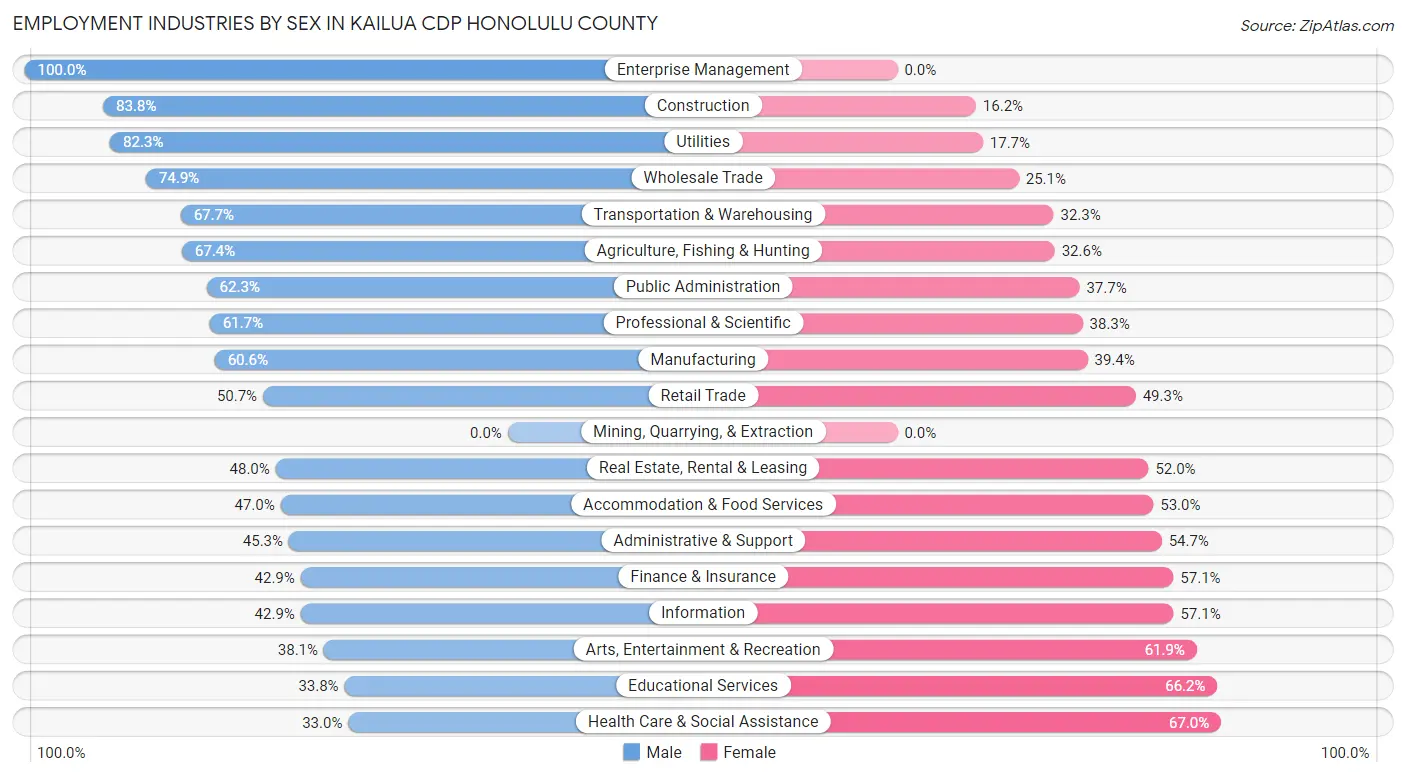
Employment Industries by Sex in Kailua CDP Honolulu County
The Kailua CDP Honolulu County industries that see more men than women are Enterprise Management (100.0%), Construction (83.8%), and Utilities (82.3%), whereas the industries that tend to have a higher number of women are Health Care & Social Assistance (67.0%), Educational Services (66.2%), and Arts, Entertainment & Recreation (61.9%).
| Industry | Male | Female |
| Agriculture, Fishing & Hunting | 29 (67.4%) | 14 (32.6%) |
| Mining, Quarrying, & Extraction | 0 (0.0%) | 0 (0.0%) |
| Construction | 1,393 (83.8%) | 270 (16.2%) |
| Manufacturing | 228 (60.6%) | 148 (39.4%) |
| Wholesale Trade | 307 (74.9%) | 103 (25.1%) |
| Retail Trade | 838 (50.7%) | 816 (49.3%) |
| Transportation & Warehousing | 737 (67.7%) | 352 (32.3%) |
| Utilities | 214 (82.3%) | 46 (17.7%) |
| Information | 168 (42.9%) | 224 (57.1%) |
| Finance & Insurance | 355 (42.9%) | 473 (57.1%) |
| Real Estate, Rental & Leasing | 282 (48.0%) | 305 (52.0%) |
| Professional & Scientific | 951 (61.7%) | 591 (38.3%) |
| Enterprise Management | 10 (100.0%) | 0 (0.0%) |
| Administrative & Support | 241 (45.3%) | 291 (54.7%) |
| Educational Services | 794 (33.8%) | 1,555 (66.2%) |
| Health Care & Social Assistance | 941 (33.0%) | 1,910 (67.0%) |
| Arts, Entertainment & Recreation | 212 (38.1%) | 345 (61.9%) |
| Accommodation & Food Services | 538 (47.0%) | 606 (53.0%) |
| Public Administration | 1,174 (62.3%) | 710 (37.7%) |
| Total | 9,711 (51.4%) | 9,187 (48.6%) |
Education in Kailua CDP Honolulu County
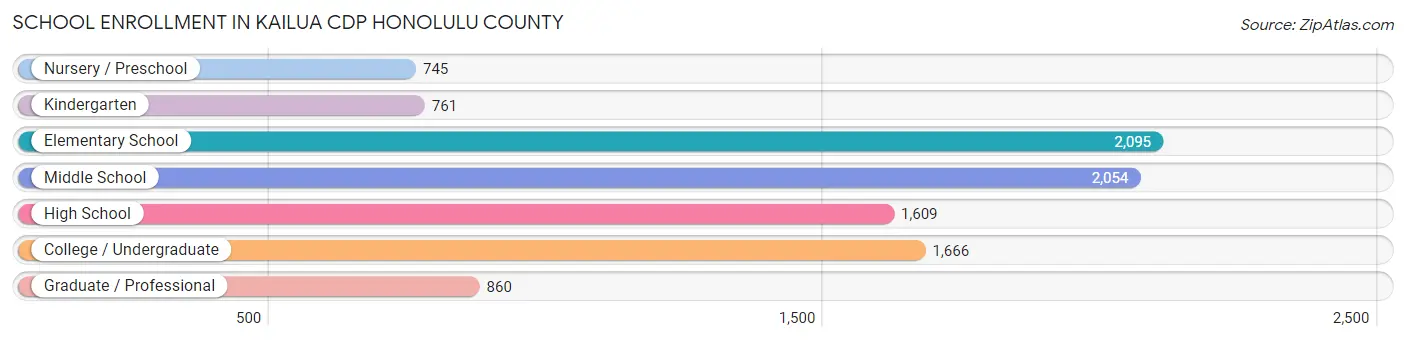
School Enrollment in Kailua CDP Honolulu County
The most common levels of schooling among the 9,790 students in Kailua CDP Honolulu County are elementary school (2,095 | 21.4%), middle school (2,054 | 21.0%), and college / undergraduate (1,666 | 17.0%).
| School Level | # Students | % Students |
| Nursery / Preschool | 745 | 7.6% |
| Kindergarten | 761 | 7.8% |
| Elementary School | 2,095 | 21.4% |
| Middle School | 2,054 | 21.0% |
| High School | 1,609 | 16.4% |
| College / Undergraduate | 1,666 | 17.0% |
| Graduate / Professional | 860 | 8.8% |
| Total | 9,790 | 100.0% |
School Enrollment by Age by Funding Source in Kailua CDP Honolulu County
Out of a total of 9,790 students who are enrolled in schools in Kailua CDP Honolulu County, 3,847 (39.3%) attend a private institution, while the remaining 5,943 (60.7%) are enrolled in public schools. The age group of 3 to 4 year olds has the highest likelihood of being enrolled in private schools, with 407 (72.8% in the age bracket) enrolled. Conversely, the age group of 20 to 24 year olds has the lowest likelihood of being enrolled in a private school, with 476 (77.6% in the age bracket) attending a public institution.
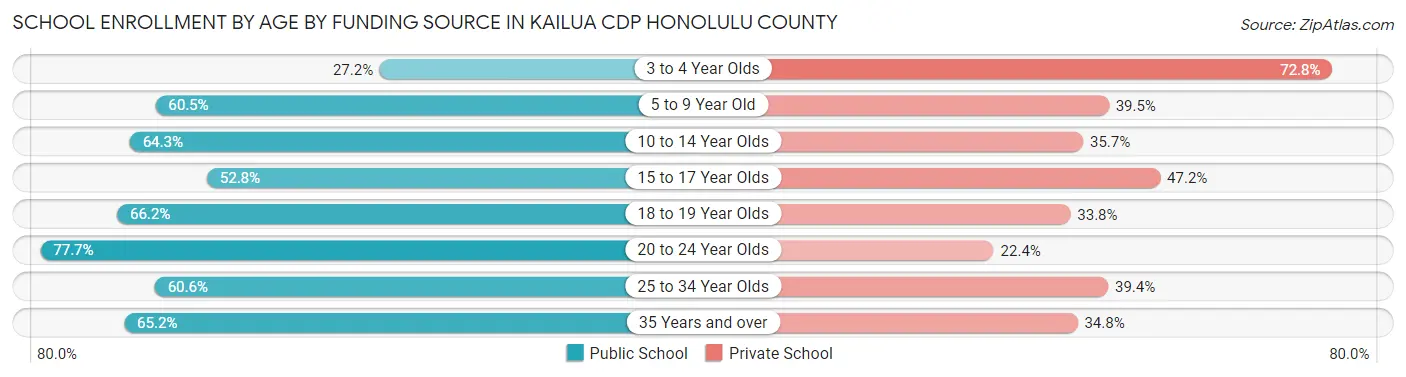
| Age Bracket | Public School | Private School |
| 3 to 4 Year Olds | 152 (27.2%) | 407 (72.8%) |
| 5 to 9 Year Old | 1,557 (60.5%) | 1,016 (39.5%) |
| 10 to 14 Year Olds | 1,829 (64.3%) | 1,014 (35.7%) |
| 15 to 17 Year Olds | 595 (52.8%) | 531 (47.2%) |
| 18 to 19 Year Olds | 394 (66.2%) | 201 (33.8%) |
| 20 to 24 Year Olds | 476 (77.6%) | 137 (22.4%) |
| 25 to 34 Year Olds | 320 (60.6%) | 208 (39.4%) |
| 35 Years and over | 621 (65.2%) | 332 (34.8%) |
| Total | 5,943 (60.7%) | 3,847 (39.3%) |
Educational Attainment by Field of Study in Kailua CDP Honolulu County
Business (2,427 | 14.9%), social sciences (1,992 | 12.2%), science & technology (1,718 | 10.5%), bio, nature & agricultural (1,322 | 8.1%), and education (1,176 | 7.2%) are the most common fields of study among 16,312 individuals in Kailua CDP Honolulu County who have obtained a bachelor's degree or higher.
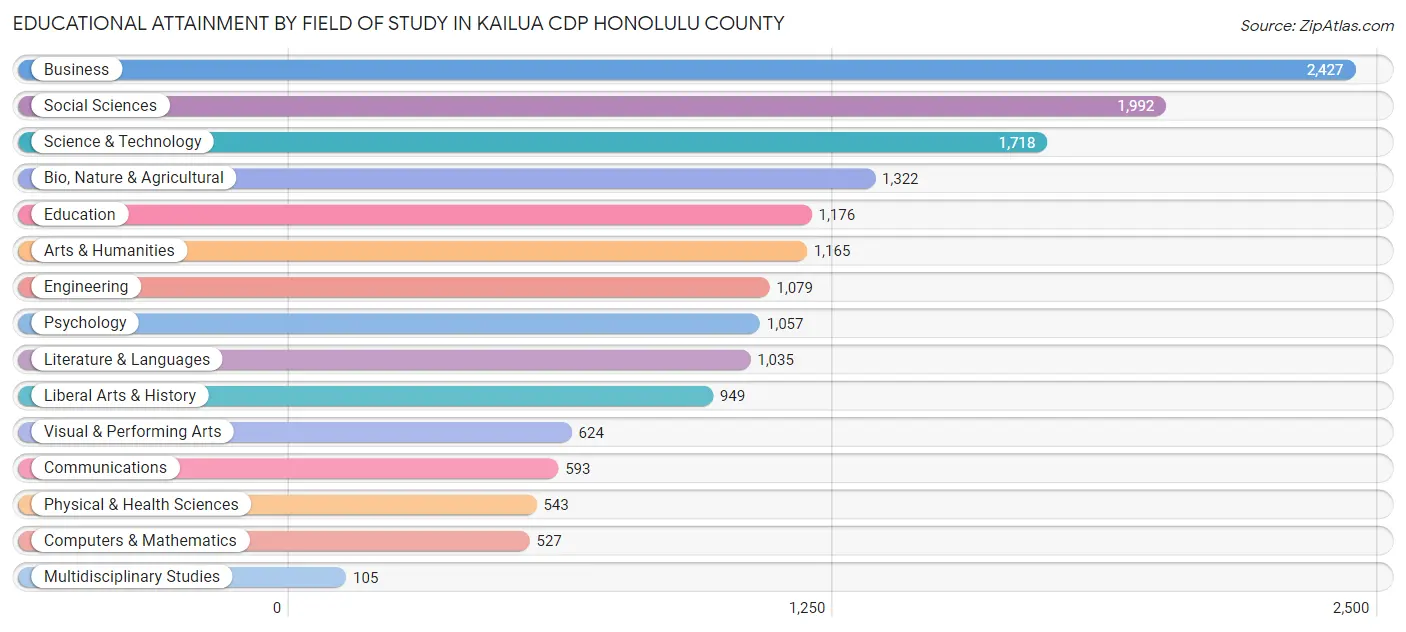
| Field of Study | # Graduates | % Graduates |
| Computers & Mathematics | 527 | 3.2% |
| Bio, Nature & Agricultural | 1,322 | 8.1% |
| Physical & Health Sciences | 543 | 3.3% |
| Psychology | 1,057 | 6.5% |
| Social Sciences | 1,992 | 12.2% |
| Engineering | 1,079 | 6.6% |
| Multidisciplinary Studies | 105 | 0.6% |
| Science & Technology | 1,718 | 10.5% |
| Business | 2,427 | 14.9% |
| Education | 1,176 | 7.2% |
| Literature & Languages | 1,035 | 6.4% |
| Liberal Arts & History | 949 | 5.8% |
| Visual & Performing Arts | 624 | 3.8% |
| Communications | 593 | 3.6% |
| Arts & Humanities | 1,165 | 7.1% |
| Total | 16,312 | 100.0% |
Transportation & Commute in Kailua CDP Honolulu County
Vehicle Availability by Sex in Kailua CDP Honolulu County
The most prevalent vehicle ownership categories in Kailua CDP Honolulu County are males with 2 vehicles (4,163, accounting for 38.7%) and females with 2 vehicles (2,975, making up 45.9%).
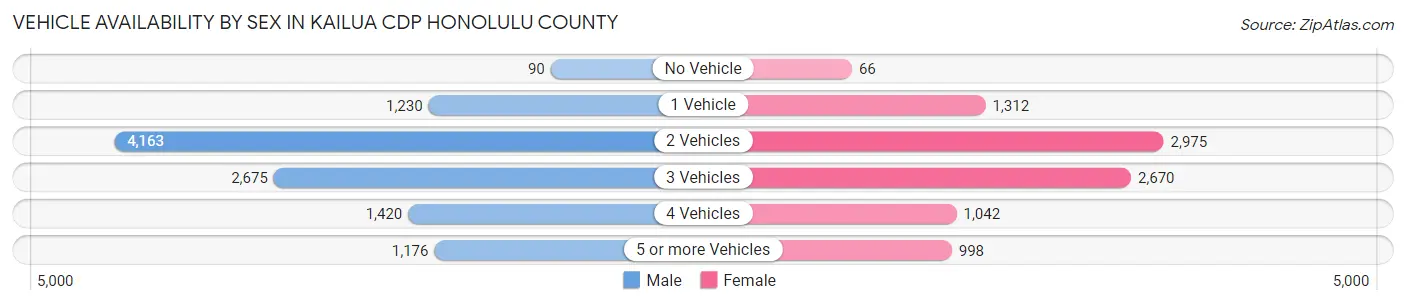
| Vehicles Available | Male | Female |
| No Vehicle | 90 (0.8%) | 66 (0.7%) |
| 1 Vehicle | 1,230 (11.4%) | 1,312 (14.5%) |
| 2 Vehicles | 4,163 (38.7%) | 2,975 (32.8%) |
| 3 Vehicles | 2,675 (24.9%) | 2,670 (29.5%) |
| 4 Vehicles | 1,420 (13.2%) | 1,042 (11.5%) |
| 5 or more Vehicles | 1,176 (10.9%) | 998 (11.0%) |
| Total | 10,754 (100.0%) | 9,063 (100.0%) |
Commute Time in Kailua CDP Honolulu County
The most frequently occuring commute durations in Kailua CDP Honolulu County are 30 to 34 minutes (4,809 commuters, 26.9%), 45 to 59 minutes (2,294 commuters, 12.9%), and 10 to 14 minutes (1,779 commuters, 10.0%).
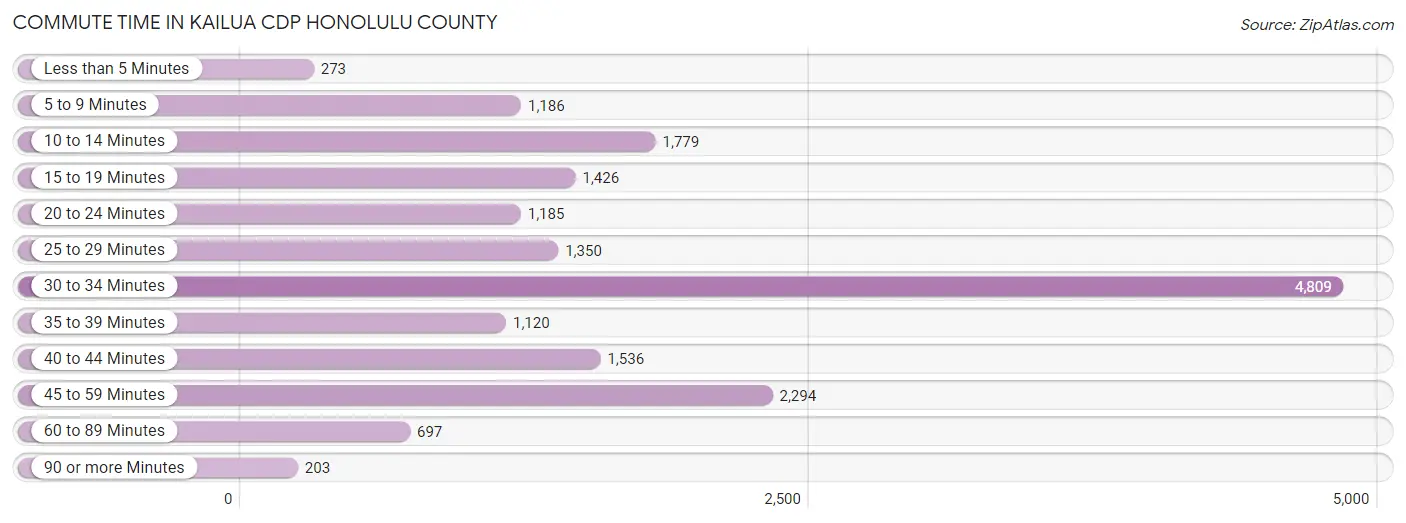
| Commute Time | # Commuters | % Commuters |
| Less than 5 Minutes | 273 | 1.5% |
| 5 to 9 Minutes | 1,186 | 6.6% |
| 10 to 14 Minutes | 1,779 | 10.0% |
| 15 to 19 Minutes | 1,426 | 8.0% |
| 20 to 24 Minutes | 1,185 | 6.6% |
| 25 to 29 Minutes | 1,350 | 7.6% |
| 30 to 34 Minutes | 4,809 | 26.9% |
| 35 to 39 Minutes | 1,120 | 6.3% |
| 40 to 44 Minutes | 1,536 | 8.6% |
| 45 to 59 Minutes | 2,294 | 12.9% |
| 60 to 89 Minutes | 697 | 3.9% |
| 90 or more Minutes | 203 | 1.1% |
Commute Time by Sex in Kailua CDP Honolulu County
The most common commute times in Kailua CDP Honolulu County are 30 to 34 minutes (3,027 commuters, 30.8%) for males and 30 to 34 minutes (1,782 commuters, 22.2%) for females.
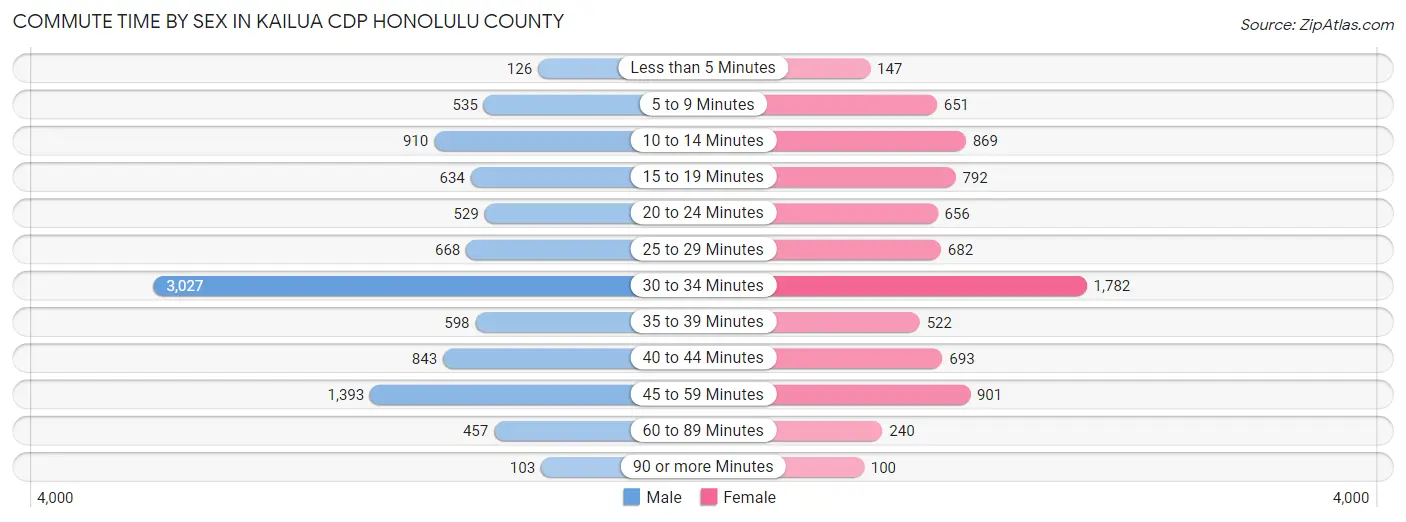
| Commute Time | Male | Female |
| Less than 5 Minutes | 126 (1.3%) | 147 (1.8%) |
| 5 to 9 Minutes | 535 (5.4%) | 651 (8.1%) |
| 10 to 14 Minutes | 910 (9.3%) | 869 (10.8%) |
| 15 to 19 Minutes | 634 (6.5%) | 792 (9.9%) |
| 20 to 24 Minutes | 529 (5.4%) | 656 (8.2%) |
| 25 to 29 Minutes | 668 (6.8%) | 682 (8.5%) |
| 30 to 34 Minutes | 3,027 (30.8%) | 1,782 (22.2%) |
| 35 to 39 Minutes | 598 (6.1%) | 522 (6.5%) |
| 40 to 44 Minutes | 843 (8.6%) | 693 (8.6%) |
| 45 to 59 Minutes | 1,393 (14.2%) | 901 (11.2%) |
| 60 to 89 Minutes | 457 (4.6%) | 240 (3.0%) |
| 90 or more Minutes | 103 (1.1%) | 100 (1.2%) |
Time of Departure to Work by Sex in Kailua CDP Honolulu County
The most frequent times of departure to work in Kailua CDP Honolulu County are 6:00 AM to 6:29 AM (1,661, 16.9%) for males and 7:00 AM to 7:29 AM (1,442, 17.9%) for females.
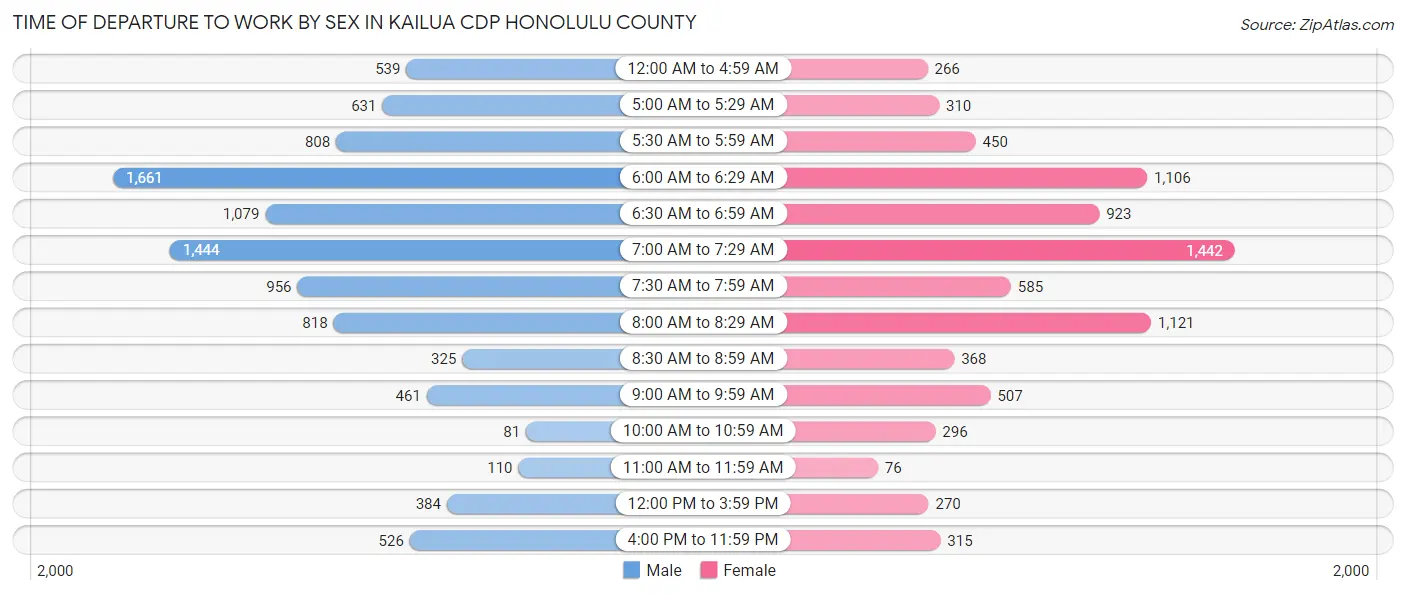
| Time of Departure | Male | Female |
| 12:00 AM to 4:59 AM | 539 (5.5%) | 266 (3.3%) |
| 5:00 AM to 5:29 AM | 631 (6.4%) | 310 (3.9%) |
| 5:30 AM to 5:59 AM | 808 (8.2%) | 450 (5.6%) |
| 6:00 AM to 6:29 AM | 1,661 (16.9%) | 1,106 (13.8%) |
| 6:30 AM to 6:59 AM | 1,079 (11.0%) | 923 (11.5%) |
| 7:00 AM to 7:29 AM | 1,444 (14.7%) | 1,442 (17.9%) |
| 7:30 AM to 7:59 AM | 956 (9.7%) | 585 (7.3%) |
| 8:00 AM to 8:29 AM | 818 (8.3%) | 1,121 (14.0%) |
| 8:30 AM to 8:59 AM | 325 (3.3%) | 368 (4.6%) |
| 9:00 AM to 9:59 AM | 461 (4.7%) | 507 (6.3%) |
| 10:00 AM to 10:59 AM | 81 (0.8%) | 296 (3.7%) |
| 11:00 AM to 11:59 AM | 110 (1.1%) | 76 (0.9%) |
| 12:00 PM to 3:59 PM | 384 (3.9%) | 270 (3.4%) |
| 4:00 PM to 11:59 PM | 526 (5.3%) | 315 (3.9%) |
| Total | 9,823 (100.0%) | 8,035 (100.0%) |
Housing Occupancy in Kailua CDP Honolulu County
Occupancy by Ownership in Kailua CDP Honolulu County
Of the total 13,262 dwellings in Kailua CDP Honolulu County, owner-occupied units account for 9,799 (73.9%), while renter-occupied units make up 3,463 (26.1%).
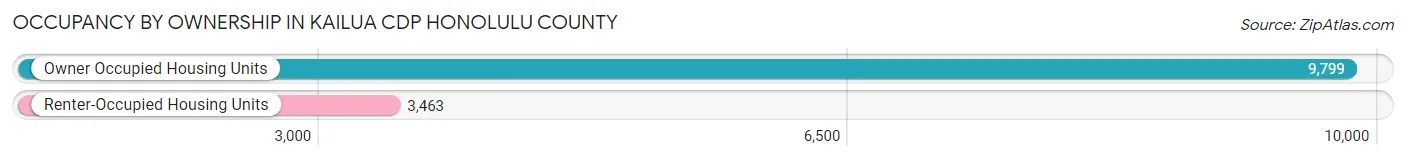
| Occupancy | # Housing Units | % Housing Units |
| Owner Occupied Housing Units | 9,799 | 73.9% |
| Renter-Occupied Housing Units | 3,463 | 26.1% |
| Total Occupied Housing Units | 13,262 | 100.0% |
Occupancy by Household Size in Kailua CDP Honolulu County
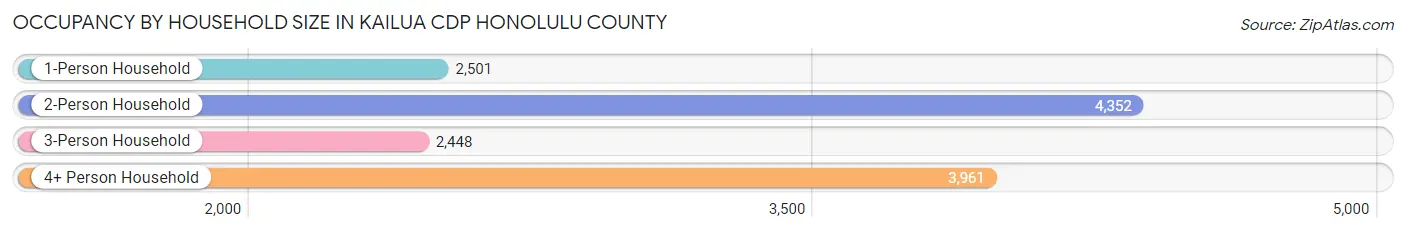
| Household Size | # Housing Units | % Housing Units |
| 1-Person Household | 2,501 | 18.9% |
| 2-Person Household | 4,352 | 32.8% |
| 3-Person Household | 2,448 | 18.5% |
| 4+ Person Household | 3,961 | 29.9% |
| Total Housing Units | 13,262 | 100.0% |
Occupancy by Ownership by Household Size in Kailua CDP Honolulu County
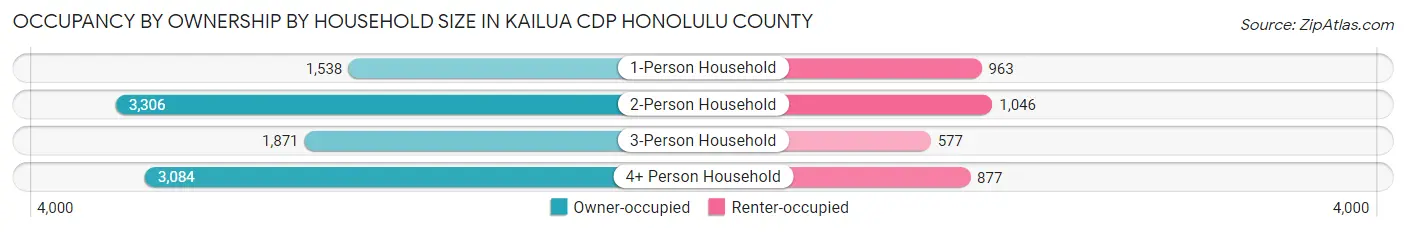
| Household Size | Owner-occupied | Renter-occupied |
| 1-Person Household | 1,538 (61.5%) | 963 (38.5%) |
| 2-Person Household | 3,306 (76.0%) | 1,046 (24.0%) |
| 3-Person Household | 1,871 (76.4%) | 577 (23.6%) |
| 4+ Person Household | 3,084 (77.9%) | 877 (22.1%) |
| Total Housing Units | 9,799 (73.9%) | 3,463 (26.1%) |
Occupancy by Educational Attainment in Kailua CDP Honolulu County
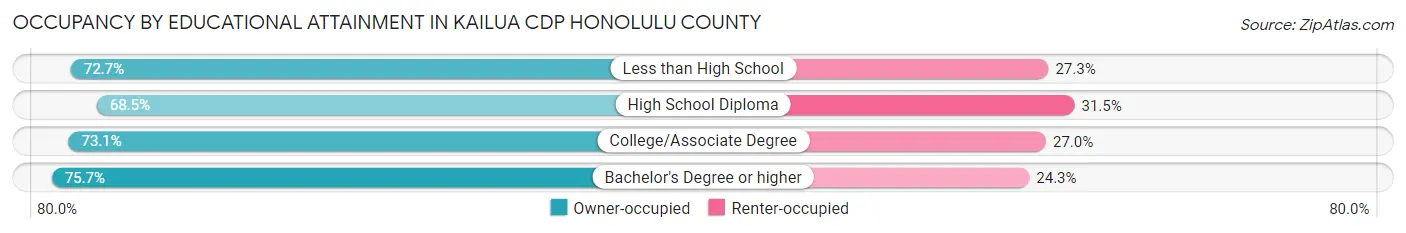
| Household Size | Owner-occupied | Renter-occupied |
| Less than High School | 125 (72.7%) | 47 (27.3%) |
| High School Diploma | 1,388 (68.5%) | 637 (31.5%) |
| College/Associate Degree | 2,491 (73.1%) | 919 (27.0%) |
| Bachelor's Degree or higher | 5,795 (75.7%) | 1,860 (24.3%) |
Occupancy by Age of Householder in Kailua CDP Honolulu County
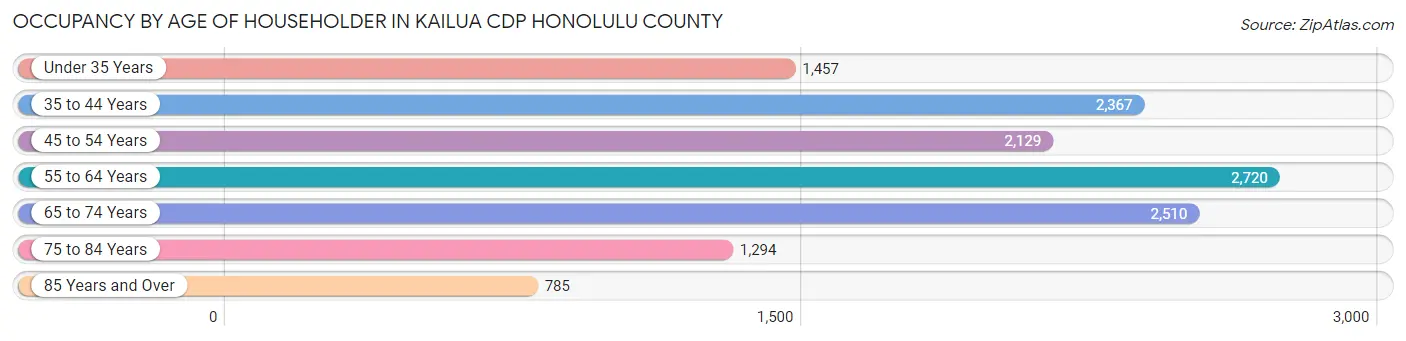
| Age Bracket | # Households | % Households |
| Under 35 Years | 1,457 | 11.0% |
| 35 to 44 Years | 2,367 | 17.8% |
| 45 to 54 Years | 2,129 | 16.1% |
| 55 to 64 Years | 2,720 | 20.5% |
| 65 to 74 Years | 2,510 | 18.9% |
| 75 to 84 Years | 1,294 | 9.8% |
| 85 Years and Over | 785 | 5.9% |
| Total | 13,262 | 100.0% |
Housing Finances in Kailua CDP Honolulu County
Median Income by Occupancy in Kailua CDP Honolulu County
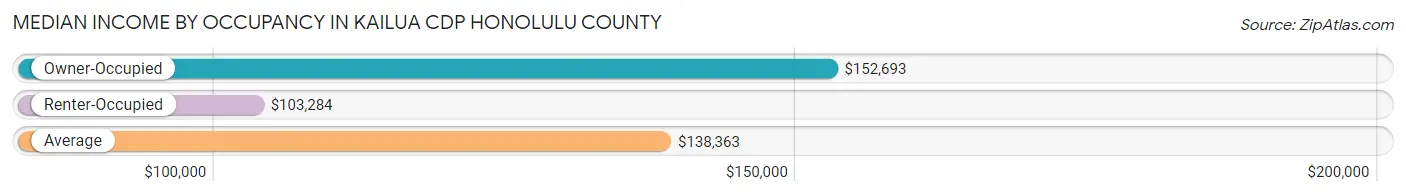
| Occupancy Type | # Households | Median Income |
| Owner-Occupied | 9,799 (73.9%) | $152,693 |
| Renter-Occupied | 3,463 (26.1%) | $103,284 |
| Average | 13,262 (100.0%) | $138,363 |
Occupancy by Householder Income Bracket in Kailua CDP Honolulu County
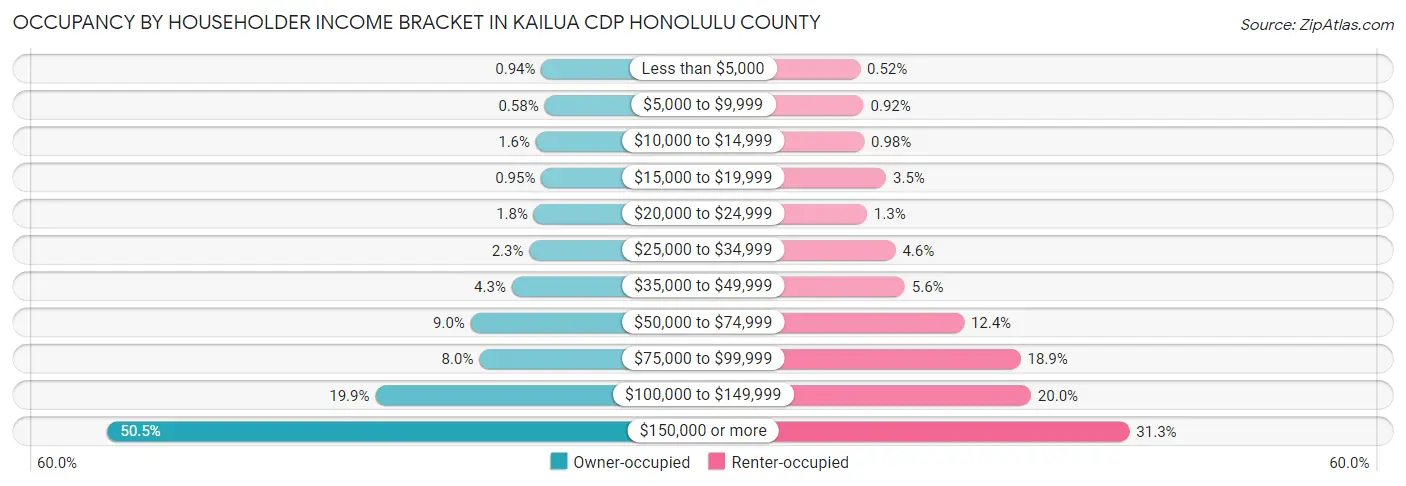
| Income Bracket | Owner-occupied | Renter-occupied |
| Less than $5,000 | 92 (0.9%) | 18 (0.5%) |
| $5,000 to $9,999 | 57 (0.6%) | 32 (0.9%) |
| $10,000 to $14,999 | 154 (1.6%) | 34 (1.0%) |
| $15,000 to $19,999 | 93 (0.9%) | 121 (3.5%) |
| $20,000 to $24,999 | 177 (1.8%) | 45 (1.3%) |
| $25,000 to $34,999 | 227 (2.3%) | 158 (4.6%) |
| $35,000 to $49,999 | 424 (4.3%) | 195 (5.6%) |
| $50,000 to $74,999 | 884 (9.0%) | 429 (12.4%) |
| $75,000 to $99,999 | 788 (8.0%) | 653 (18.9%) |
| $100,000 to $149,999 | 1,952 (19.9%) | 694 (20.0%) |
| $150,000 or more | 4,951 (50.5%) | 1,084 (31.3%) |
| Total | 9,799 (100.0%) | 3,463 (100.0%) |
Monthly Housing Cost Tiers in Kailua CDP Honolulu County
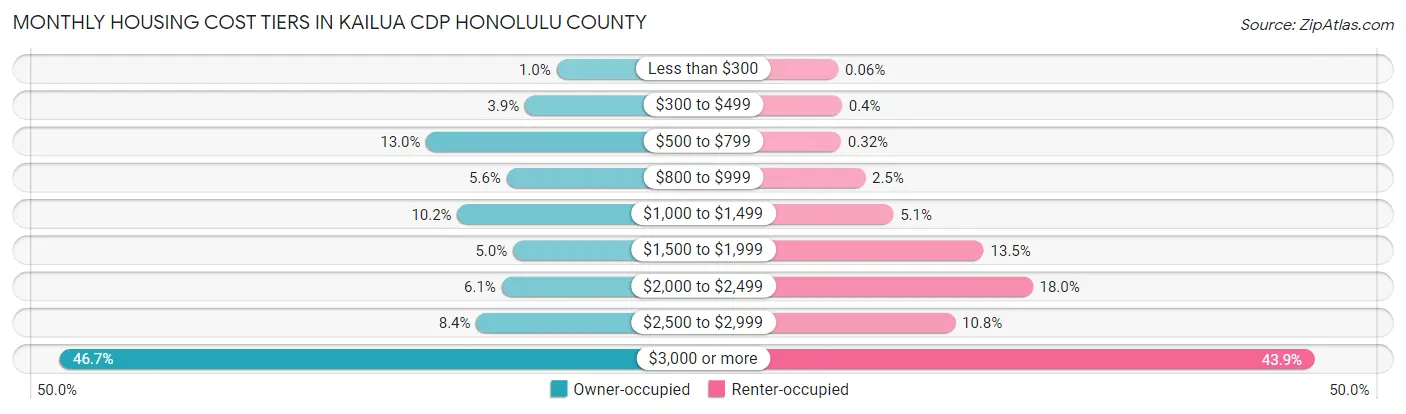
| Monthly Cost | Owner-occupied | Renter-occupied |
| Less than $300 | 100 (1.0%) | 2 (0.1%) |
| $300 to $499 | 385 (3.9%) | 14 (0.4%) |
| $500 to $799 | 1,276 (13.0%) | 11 (0.3%) |
| $800 to $999 | 551 (5.6%) | 88 (2.5%) |
| $1,000 to $1,499 | 995 (10.2%) | 178 (5.1%) |
| $1,500 to $1,999 | 493 (5.0%) | 466 (13.5%) |
| $2,000 to $2,499 | 596 (6.1%) | 622 (18.0%) |
| $2,500 to $2,999 | 824 (8.4%) | 375 (10.8%) |
| $3,000 or more | 4,579 (46.7%) | 1,519 (43.9%) |
| Total | 9,799 (100.0%) | 3,463 (100.0%) |
Physical Housing Characteristics in Kailua CDP Honolulu County
Housing Structures in Kailua CDP Honolulu County
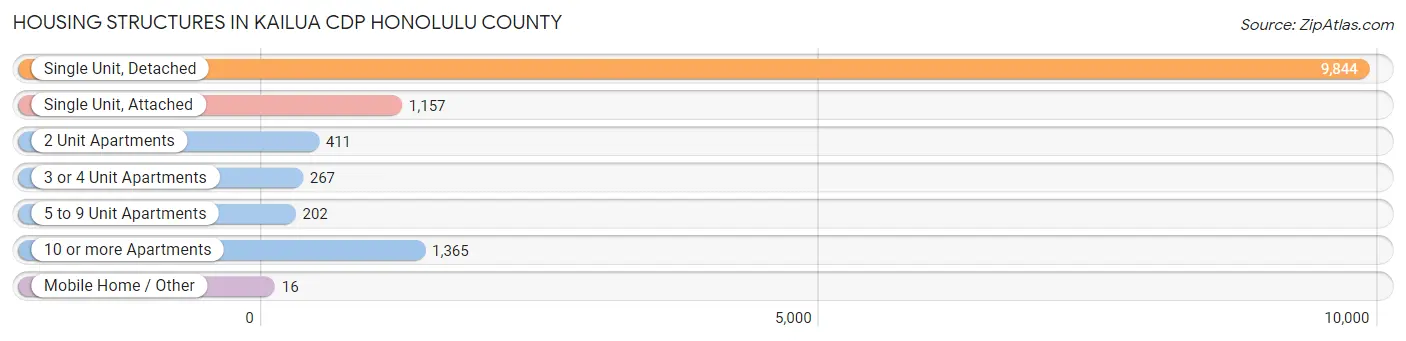
| Structure Type | # Housing Units | % Housing Units |
| Single Unit, Detached | 9,844 | 74.2% |
| Single Unit, Attached | 1,157 | 8.7% |
| 2 Unit Apartments | 411 | 3.1% |
| 3 or 4 Unit Apartments | 267 | 2.0% |
| 5 to 9 Unit Apartments | 202 | 1.5% |
| 10 or more Apartments | 1,365 | 10.3% |
| Mobile Home / Other | 16 | 0.1% |
| Total | 13,262 | 100.0% |
Housing Structures by Occupancy in Kailua CDP Honolulu County
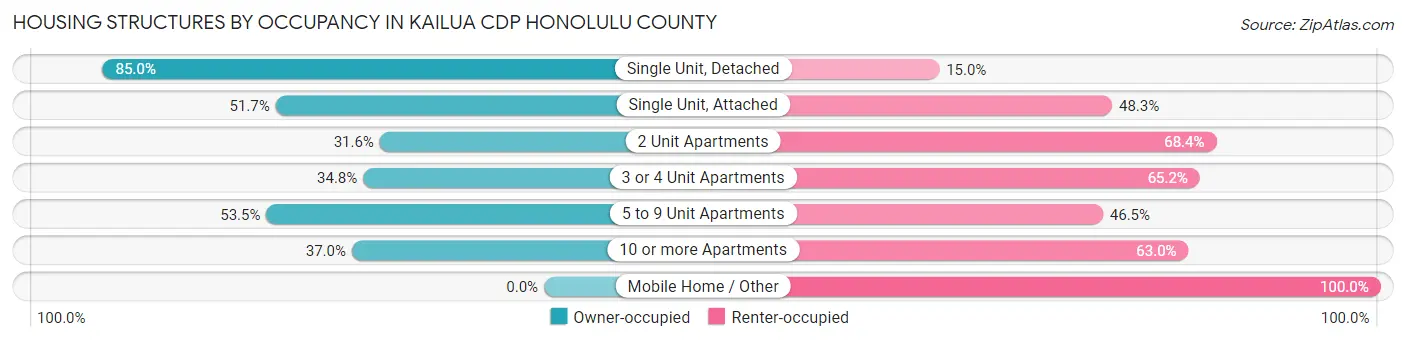
| Structure Type | Owner-occupied | Renter-occupied |
| Single Unit, Detached | 8,365 (85.0%) | 1,479 (15.0%) |
| Single Unit, Attached | 598 (51.7%) | 559 (48.3%) |
| 2 Unit Apartments | 130 (31.6%) | 281 (68.4%) |
| 3 or 4 Unit Apartments | 93 (34.8%) | 174 (65.2%) |
| 5 to 9 Unit Apartments | 108 (53.5%) | 94 (46.5%) |
| 10 or more Apartments | 505 (37.0%) | 860 (63.0%) |
| Mobile Home / Other | 0 (0.0%) | 16 (100.0%) |
| Total | 9,799 (73.9%) | 3,463 (26.1%) |
Housing Structures by Number of Rooms in Kailua CDP Honolulu County
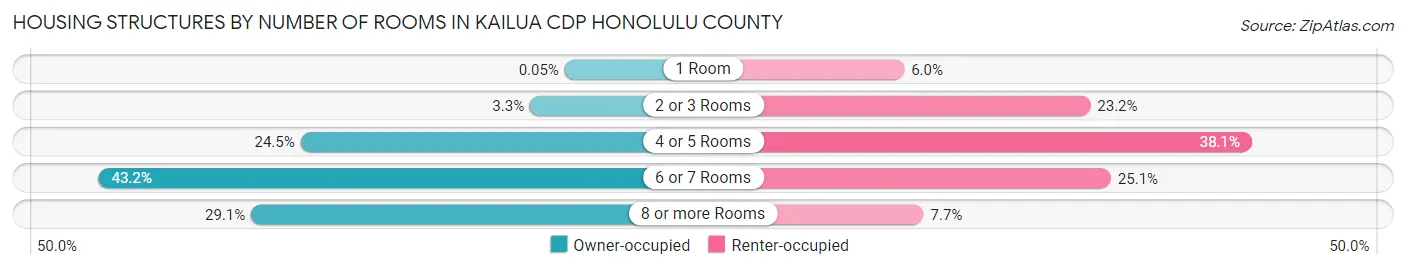
| Number of Rooms | Owner-occupied | Renter-occupied |
| 1 Room | 5 (0.1%) | 206 (5.9%) |
| 2 or 3 Rooms | 319 (3.3%) | 802 (23.2%) |
| 4 or 5 Rooms | 2,399 (24.5%) | 1,319 (38.1%) |
| 6 or 7 Rooms | 4,229 (43.2%) | 868 (25.1%) |
| 8 or more Rooms | 2,847 (29.0%) | 268 (7.7%) |
| Total | 9,799 (100.0%) | 3,463 (100.0%) |
Housing Structure by Heating Type in Kailua CDP Honolulu County
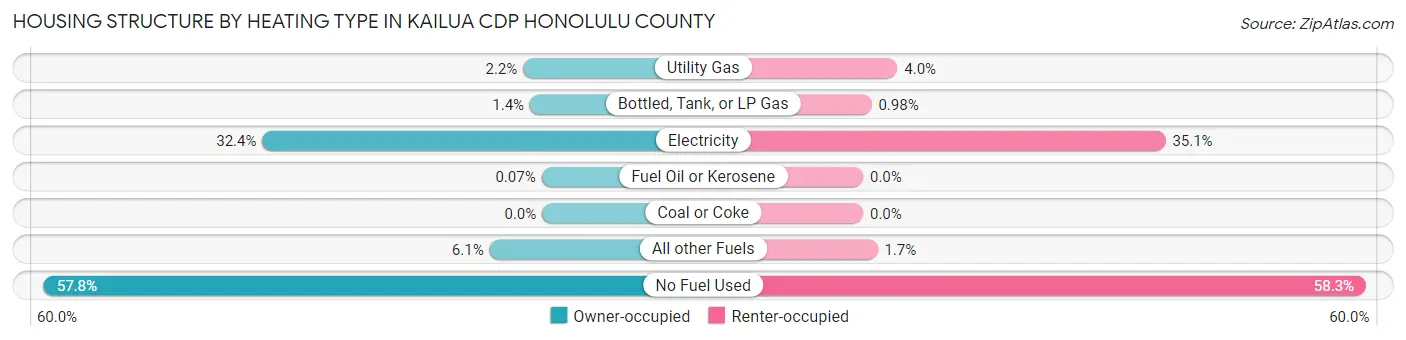
| Heating Type | Owner-occupied | Renter-occupied |
| Utility Gas | 216 (2.2%) | 138 (4.0%) |
| Bottled, Tank, or LP Gas | 138 (1.4%) | 34 (1.0%) |
| Electricity | 3,179 (32.4%) | 1,214 (35.1%) |
| Fuel Oil or Kerosene | 7 (0.1%) | 0 (0.0%) |
| Coal or Coke | 0 (0.0%) | 0 (0.0%) |
| All other Fuels | 598 (6.1%) | 58 (1.7%) |
| No Fuel Used | 5,661 (57.8%) | 2,019 (58.3%) |
| Total | 9,799 (100.0%) | 3,463 (100.0%) |
Household Vehicle Usage in Kailua CDP Honolulu County
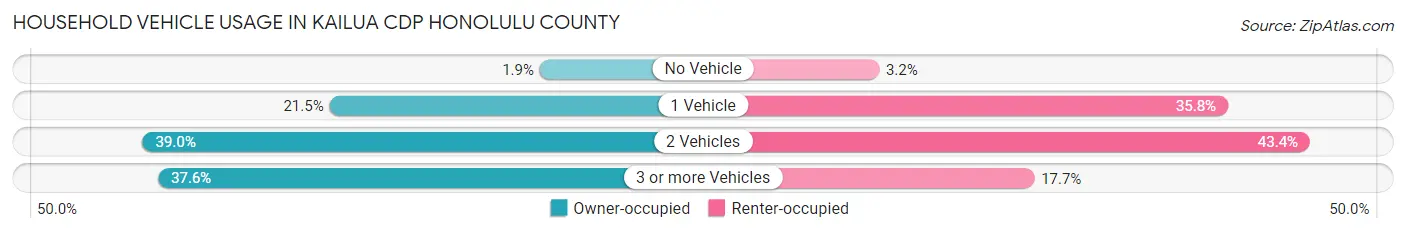
| Vehicles per Household | Owner-occupied | Renter-occupied |
| No Vehicle | 187 (1.9%) | 110 (3.2%) |
| 1 Vehicle | 2,111 (21.5%) | 1,238 (35.7%) |
| 2 Vehicles | 3,821 (39.0%) | 1,503 (43.4%) |
| 3 or more Vehicles | 3,680 (37.6%) | 612 (17.7%) |
| Total | 9,799 (100.0%) | 3,463 (100.0%) |
Real Estate & Mortgages in Kailua CDP Honolulu County
Real Estate and Mortgage Overview in Kailua CDP Honolulu County
| Characteristic | Without Mortgage | With Mortgage |
| Housing Units | 3,198 | 6,601 |
| Median Property Value | $1,170,700 | $1,228,100 |
| Median Household Income | $94,214 | $3,930 |
| Monthly Housing Costs | $783 | $4,552 |
| Real Estate Taxes | $3,686 | $211 |
Property Value by Mortgage Status in Kailua CDP Honolulu County
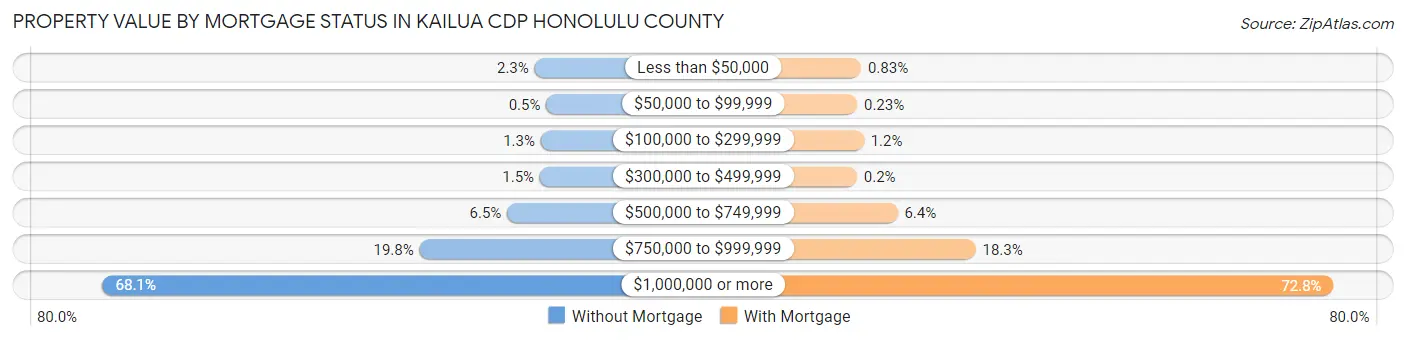
| Property Value | Without Mortgage | With Mortgage |
| Less than $50,000 | 73 (2.3%) | 55 (0.8%) |
| $50,000 to $99,999 | 16 (0.5%) | 15 (0.2%) |
| $100,000 to $299,999 | 43 (1.3%) | 82 (1.2%) |
| $300,000 to $499,999 | 47 (1.5%) | 13 (0.2%) |
| $500,000 to $749,999 | 207 (6.5%) | 422 (6.4%) |
| $750,000 to $999,999 | 634 (19.8%) | 1,207 (18.3%) |
| $1,000,000 or more | 2,178 (68.1%) | 4,807 (72.8%) |
| Total | 3,198 (100.0%) | 6,601 (100.0%) |
Household Income by Mortgage Status in Kailua CDP Honolulu County
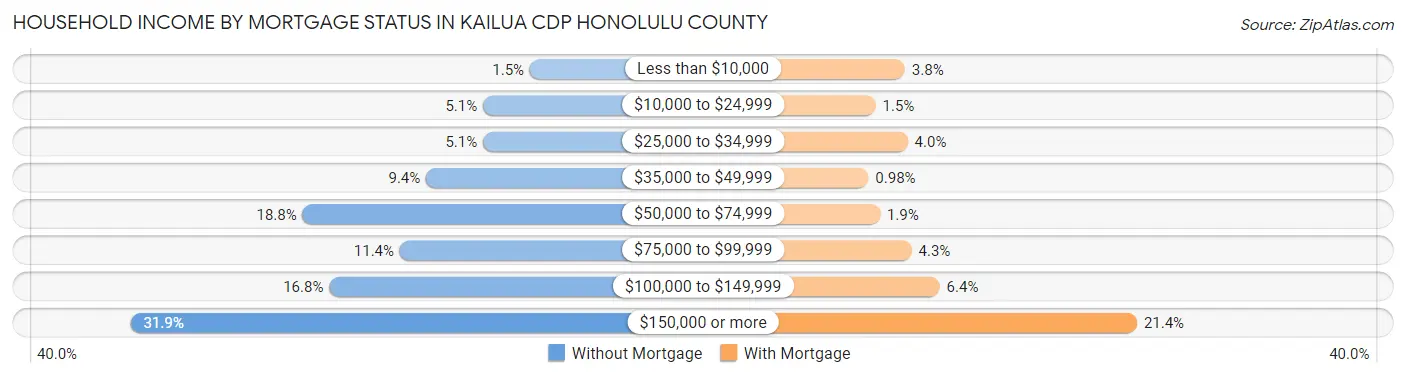
| Household Income | Without Mortgage | With Mortgage |
| Less than $10,000 | 48 (1.5%) | 248 (3.8%) |
| $10,000 to $24,999 | 162 (5.1%) | 101 (1.5%) |
| $25,000 to $34,999 | 162 (5.1%) | 262 (4.0%) |
| $35,000 to $49,999 | 301 (9.4%) | 65 (1.0%) |
| $50,000 to $74,999 | 602 (18.8%) | 123 (1.9%) |
| $75,000 to $99,999 | 365 (11.4%) | 282 (4.3%) |
| $100,000 to $149,999 | 537 (16.8%) | 423 (6.4%) |
| $150,000 or more | 1,021 (31.9%) | 1,415 (21.4%) |
| Total | 3,198 (100.0%) | 6,601 (100.0%) |
Property Value to Household Income Ratio in Kailua CDP Honolulu County
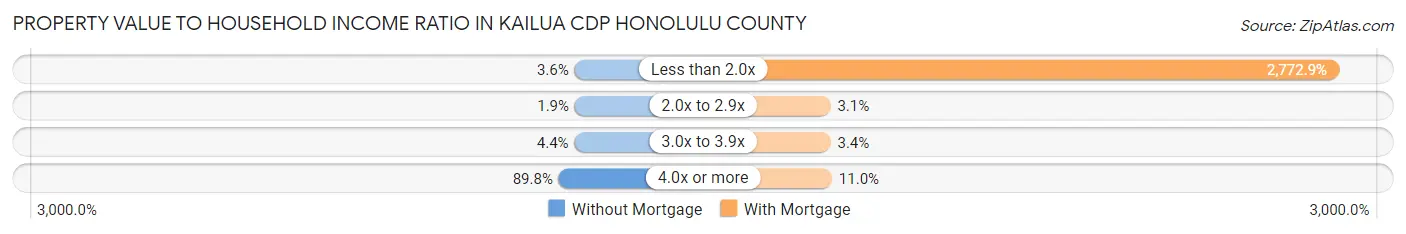
| Value-to-Income Ratio | Without Mortgage | With Mortgage |
| Less than 2.0x | 116 (3.6%) | 183,039 (2,772.9%) |
| 2.0x to 2.9x | 60 (1.9%) | 203 (3.1%) |
| 3.0x to 3.9x | 140 (4.4%) | 223 (3.4%) |
| 4.0x or more | 2,873 (89.8%) | 723 (11.0%) |
| Total | 3,198 (100.0%) | 6,601 (100.0%) |
Real Estate Taxes by Mortgage Status in Kailua CDP Honolulu County
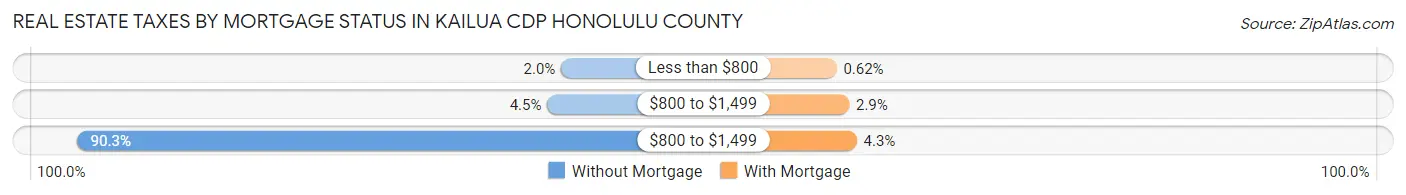
| Property Taxes | Without Mortgage | With Mortgage |
| Less than $800 | 64 (2.0%) | 41 (0.6%) |
| $800 to $1,499 | 145 (4.5%) | 193 (2.9%) |
| $800 to $1,499 | 2,888 (90.3%) | 284 (4.3%) |
| Total | 3,198 (100.0%) | 6,601 (100.0%) |
Health & Disability in Kailua CDP Honolulu County
Health Insurance Coverage by Age in Kailua CDP Honolulu County
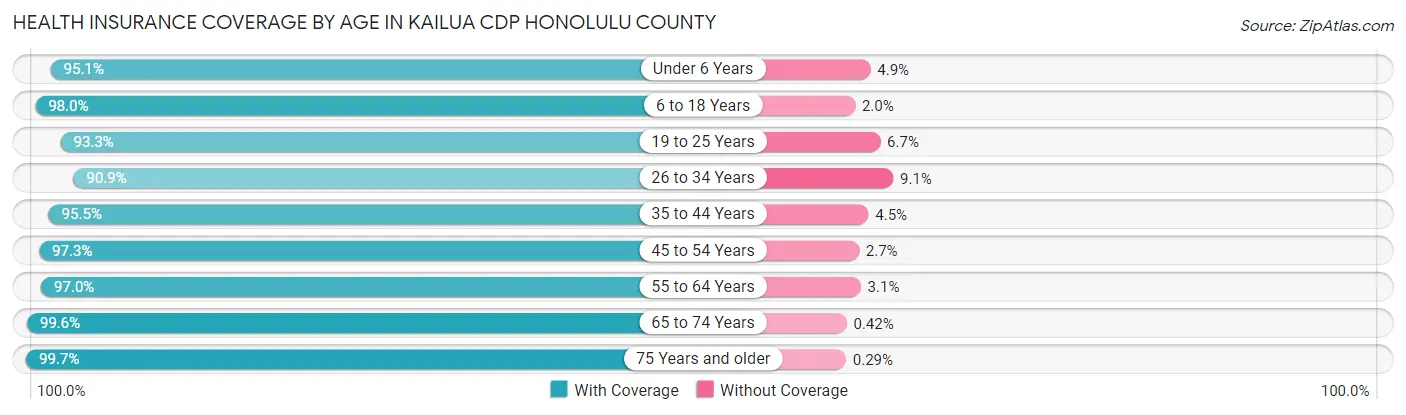
| Age Bracket | With Coverage | Without Coverage |
| Under 6 Years | 2,508 (95.1%) | 128 (4.9%) |
| 6 to 18 Years | 6,439 (98.0%) | 131 (2.0%) |
| 19 to 25 Years | 2,147 (93.3%) | 154 (6.7%) |
| 26 to 34 Years | 3,278 (90.9%) | 328 (9.1%) |
| 35 to 44 Years | 5,314 (95.5%) | 250 (4.5%) |
| 45 to 54 Years | 4,388 (97.3%) | 122 (2.7%) |
| 55 to 64 Years | 5,306 (97.0%) | 167 (3.0%) |
| 65 to 74 Years | 4,687 (99.6%) | 20 (0.4%) |
| 75 Years and older | 3,452 (99.7%) | 10 (0.3%) |
| Total | 37,519 (96.6%) | 1,310 (3.4%) |
Health Insurance Coverage by Citizenship Status in Kailua CDP Honolulu County
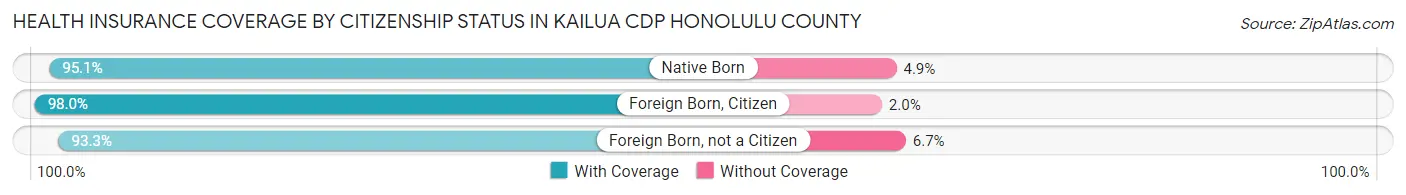
| Citizenship Status | With Coverage | Without Coverage |
| Native Born | 2,508 (95.1%) | 128 (4.9%) |
| Foreign Born, Citizen | 6,439 (98.0%) | 131 (2.0%) |
| Foreign Born, not a Citizen | 2,147 (93.3%) | 154 (6.7%) |
Health Insurance Coverage by Household Income in Kailua CDP Honolulu County
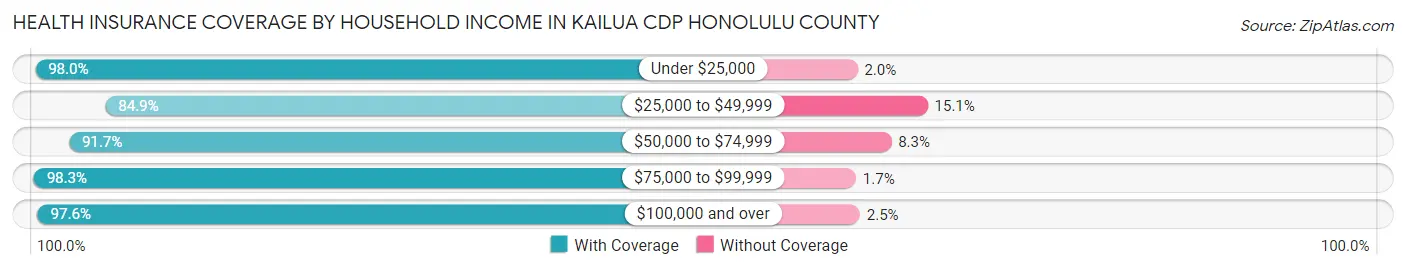
| Household Income | With Coverage | Without Coverage |
| Under $25,000 | 1,324 (98.0%) | 27 (2.0%) |
| $25,000 to $49,999 | 1,592 (84.9%) | 284 (15.1%) |
| $50,000 to $74,999 | 2,304 (91.7%) | 209 (8.3%) |
| $75,000 to $99,999 | 3,053 (98.3%) | 53 (1.7%) |
| $100,000 and over | 29,112 (97.6%) | 732 (2.5%) |
Public vs Private Health Insurance Coverage by Age in Kailua CDP Honolulu County
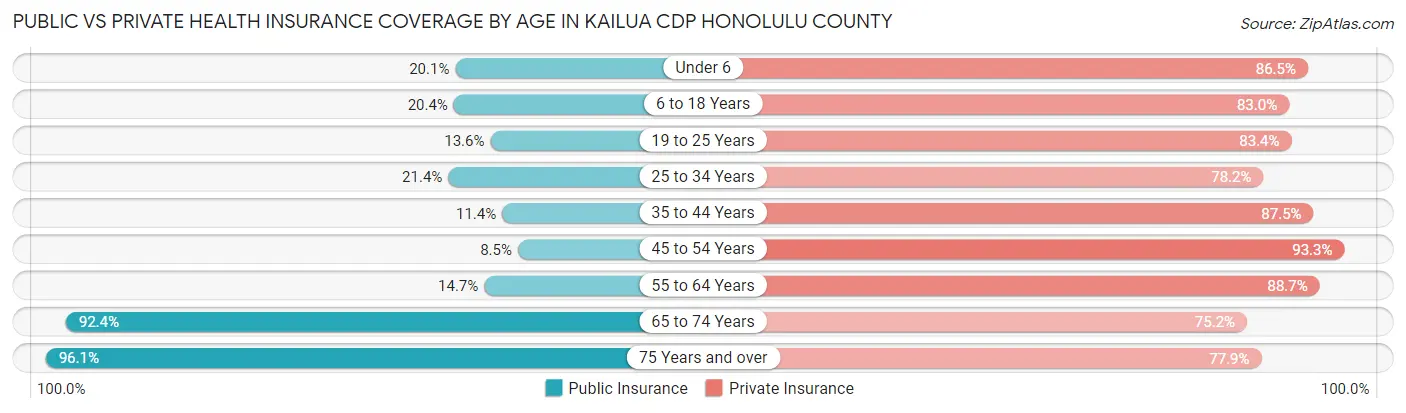
| Age Bracket | Public Insurance | Private Insurance |
| Under 6 | 529 (20.1%) | 2,280 (86.5%) |
| 6 to 18 Years | 1,337 (20.3%) | 5,453 (83.0%) |
| 19 to 25 Years | 312 (13.6%) | 1,920 (83.4%) |
| 25 to 34 Years | 771 (21.4%) | 2,821 (78.2%) |
| 35 to 44 Years | 633 (11.4%) | 4,870 (87.5%) |
| 45 to 54 Years | 381 (8.5%) | 4,206 (93.3%) |
| 55 to 64 Years | 805 (14.7%) | 4,853 (88.7%) |
| 65 to 74 Years | 4,347 (92.3%) | 3,539 (75.2%) |
| 75 Years and over | 3,326 (96.1%) | 2,696 (77.9%) |
| Total | 12,441 (32.0%) | 32,638 (84.1%) |
Disability Status by Sex by Age in Kailua CDP Honolulu County
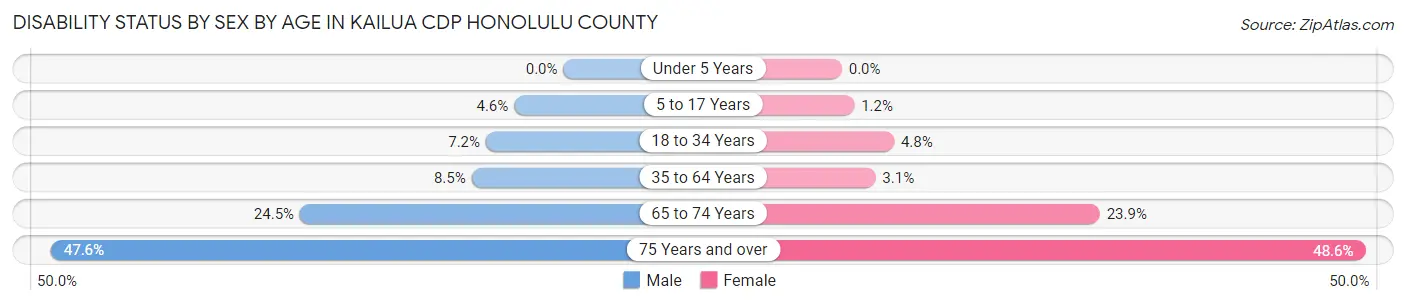
| Age Bracket | Male | Female |
| Under 5 Years | 0 (0.0%) | 0 (0.0%) |
| 5 to 17 Years | 161 (4.6%) | 37 (1.1%) |
| 18 to 34 Years | 226 (7.2%) | 149 (4.8%) |
| 35 to 64 Years | 645 (8.5%) | 249 (3.1%) |
| 65 to 74 Years | 527 (24.4%) | 611 (23.9%) |
| 75 Years and over | 691 (47.6%) | 976 (48.6%) |
Disability Class by Sex by Age in Kailua CDP Honolulu County
Disability Class: Hearing Difficulty
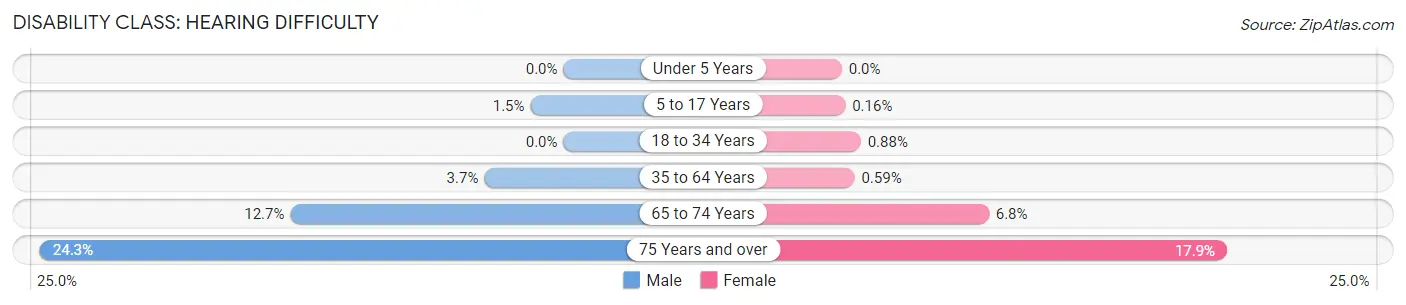
| Age Bracket | Male | Female |
| Under 5 Years | 0 (0.0%) | 0 (0.0%) |
| 5 to 17 Years | 54 (1.5%) | 5 (0.2%) |
| 18 to 34 Years | 0 (0.0%) | 27 (0.9%) |
| 35 to 64 Years | 278 (3.7%) | 47 (0.6%) |
| 65 to 74 Years | 273 (12.7%) | 174 (6.8%) |
| 75 Years and over | 353 (24.3%) | 359 (17.9%) |
Disability Class: Vision Difficulty
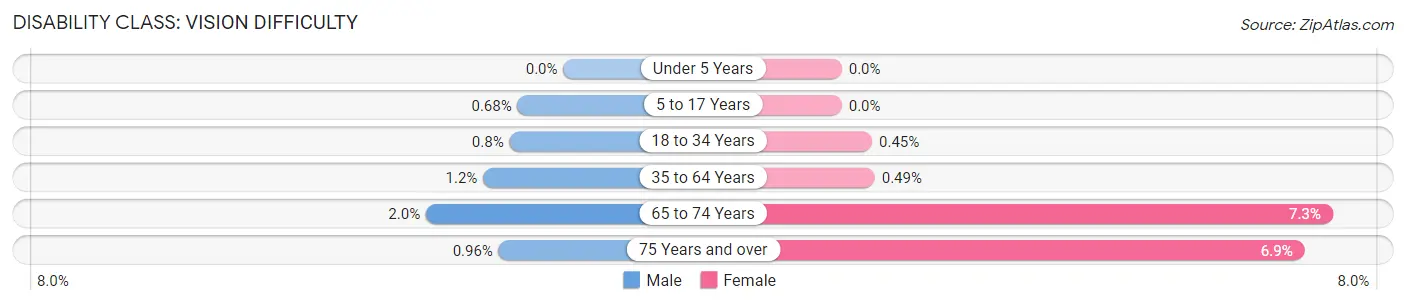
| Age Bracket | Male | Female |
| Under 5 Years | 0 (0.0%) | 0 (0.0%) |
| 5 to 17 Years | 24 (0.7%) | 0 (0.0%) |
| 18 to 34 Years | 25 (0.8%) | 14 (0.4%) |
| 35 to 64 Years | 90 (1.2%) | 39 (0.5%) |
| 65 to 74 Years | 44 (2.0%) | 186 (7.3%) |
| 75 Years and over | 14 (1.0%) | 138 (6.9%) |
Disability Class: Cognitive Difficulty
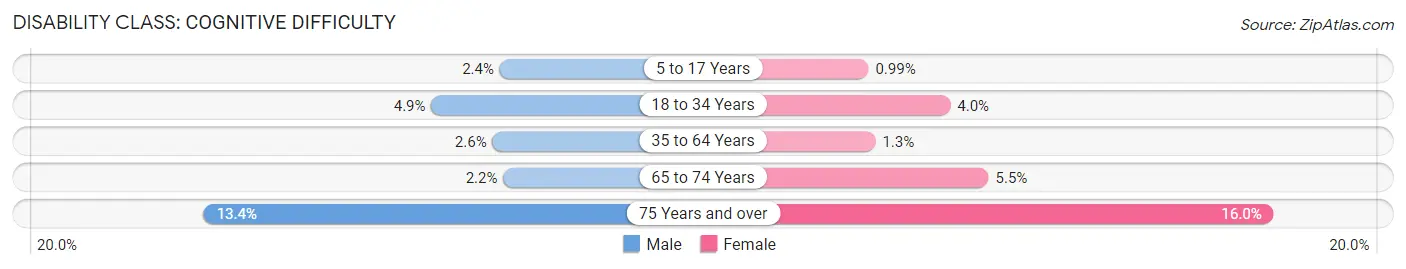
| Age Bracket | Male | Female |
| 5 to 17 Years | 83 (2.4%) | 32 (1.0%) |
| 18 to 34 Years | 154 (4.9%) | 124 (4.0%) |
| 35 to 64 Years | 199 (2.6%) | 100 (1.3%) |
| 65 to 74 Years | 48 (2.2%) | 139 (5.4%) |
| 75 Years and over | 194 (13.4%) | 322 (16.0%) |
Disability Class: Ambulatory Difficulty
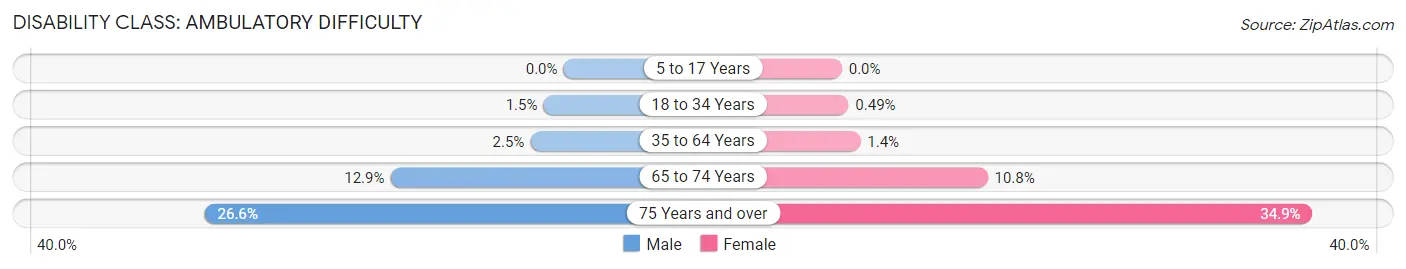
| Age Bracket | Male | Female |
| 5 to 17 Years | 0 (0.0%) | 0 (0.0%) |
| 18 to 34 Years | 47 (1.5%) | 15 (0.5%) |
| 35 to 64 Years | 186 (2.5%) | 110 (1.4%) |
| 65 to 74 Years | 277 (12.9%) | 276 (10.8%) |
| 75 Years and over | 387 (26.6%) | 702 (34.9%) |
Disability Class: Self-Care Difficulty
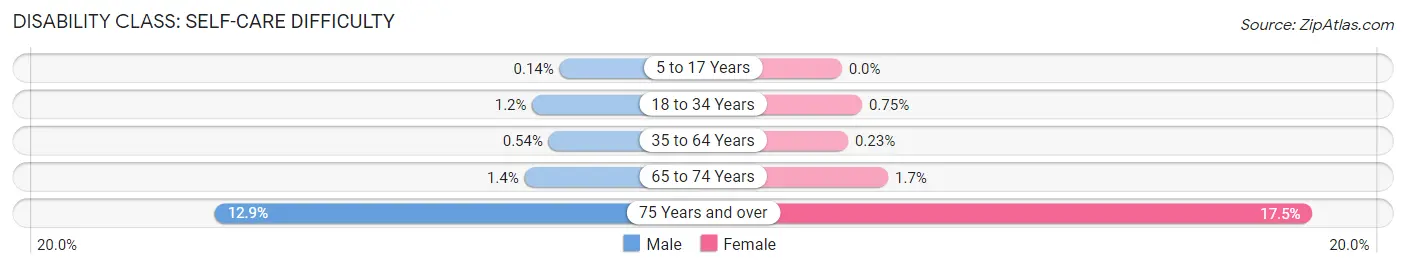
| Age Bracket | Male | Female |
| 5 to 17 Years | 5 (0.1%) | 0 (0.0%) |
| 18 to 34 Years | 36 (1.1%) | 23 (0.7%) |
| 35 to 64 Years | 41 (0.5%) | 18 (0.2%) |
| 65 to 74 Years | 31 (1.4%) | 44 (1.7%) |
| 75 Years and over | 188 (12.9%) | 351 (17.5%) |
Technology Access in Kailua CDP Honolulu County
Computing Device Access in Kailua CDP Honolulu County
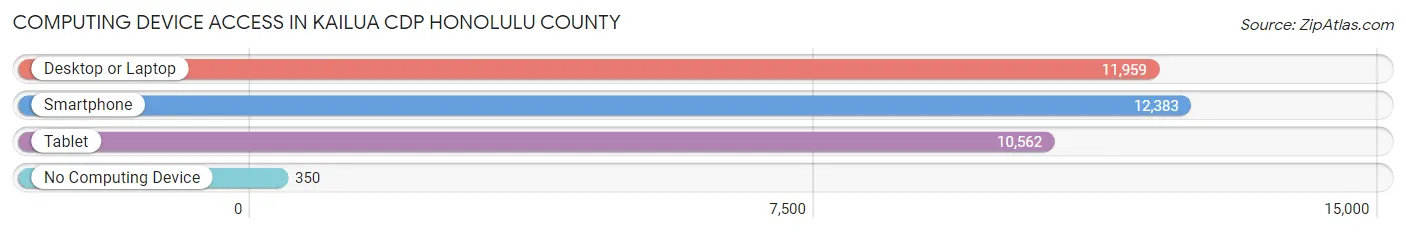
| Device Type | # Households | % Households |
| Desktop or Laptop | 11,959 | 90.2% |
| Smartphone | 12,383 | 93.4% |
| Tablet | 10,562 | 79.6% |
| No Computing Device | 350 | 2.6% |
| Total | 13,262 | 100.0% |
Internet Access in Kailua CDP Honolulu County
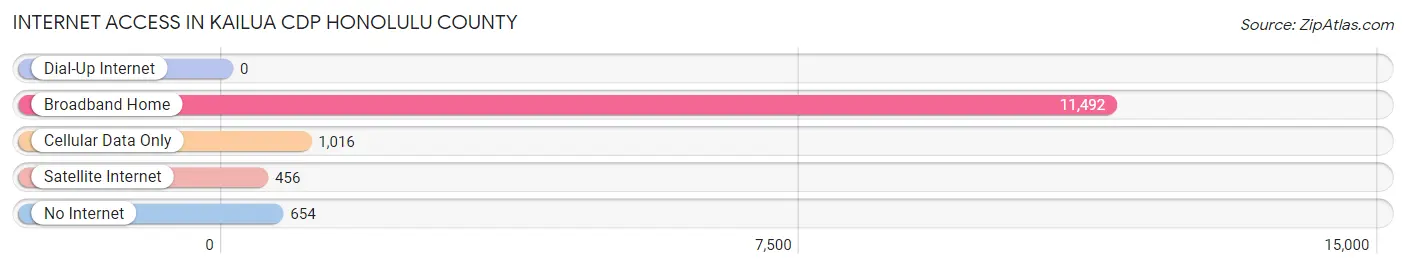
| Internet Type | # Households | % Households |
| Dial-Up Internet | 0 | 0.0% |
| Broadband Home | 11,492 | 86.7% |
| Cellular Data Only | 1,016 | 7.7% |
| Satellite Internet | 456 | 3.4% |
| No Internet | 654 | 4.9% |
| Total | 13,262 | 100.0% |
Kailua CDP Honolulu County Summary
Kailua Cdp Honolulu County, HI is a census-designated place (CDP) located in Honolulu County, Hawaii. It is located on the eastern side of the island of Oahu, and is part of the City and County of Honolulu. The population of Kailua Cdp Honolulu County, HI was 38,635 at the 2010 census.
History
Kailua Cdp Honolulu County, HI has a long and rich history. The area was first settled by Polynesian voyagers in the 13th century. The area was then known as Kailua-a-Kona, which translates to “two seas” in Hawaiian. The area was a popular spot for fishing and surfing, and was home to many Hawaiian chiefs.
In the late 1700s, Kailua Cdp Honolulu County, HI was visited by British explorer Captain James Cook. He named the area Kailua after the two bays he found there. In the early 1800s, the area was home to a number of whaling ships, and the population began to grow.
In the late 1800s, Kailua Cdp Honolulu County, HI was annexed by the Kingdom of Hawaii. The area was then developed as a resort town, and many of the original Hawaiian homes were replaced with vacation homes. In the early 1900s, the area was home to a number of military bases, and the population continued to grow.
In 1959, Hawaii became the 50th state of the United States, and Kailua Cdp Honolulu County, HI became part of the City and County of Honolulu. The area has since become a popular tourist destination, and is home to a number of resorts, restaurants, and shops.
Geography
Kailua Cdp Honolulu County, HI is located on the eastern side of the island of Oahu. It is bordered by the Pacific Ocean to the east, and the Koolau Mountains to the west. The area is home to two bays, Kailua Bay and Kaneohe Bay. The area is also home to a number of beaches, including Lanikai Beach, Kailua Beach, and Kalama Beach.
The climate in Kailua Cdp Honolulu County, HI is tropical, with temperatures ranging from the mid-70s to the mid-80s year-round. The area receives an average of about 20 inches of rain per year.
Economy
Kailua Cdp Honolulu County, HI is a popular tourist destination, and the area’s economy is largely driven by tourism. The area is home to a number of resorts, restaurants, and shops. The area is also home to a number of military bases, and the military is a major employer in the area.
Demographics
As of the 2010 census, the population of Kailua Cdp Honolulu County, HI was 38,635. The population is made up of a diverse mix of ethnicities, including White (37.3%), Asian (25.3%), Native Hawaiian and Other Pacific Islander (17.2%), Hispanic or Latino (7.2%), and African American (2.2%). The median household income in the area is $76,845, and the median age is 40.7 years.
Common Questions
What is Per Capita Income in Kailua CDP Honolulu County?
Per Capita income in Kailua CDP Honolulu County is $57,727.
What is the Median Family Income in Kailua CDP Honolulu County?
Median Family Income in Kailua CDP Honolulu County is $157,108.
What is the Median Household income in Kailua CDP Honolulu County?
Median Household Income in Kailua CDP Honolulu County is $138,363.
What is Income or Wage Gap in Kailua CDP Honolulu County?
Income or Wage Gap in Kailua CDP Honolulu County is 34.8%.
Women in Kailua CDP Honolulu County earn 65.2 cents for every dollar earned by a man.
What is Inequality or Gini Index in Kailua CDP Honolulu County?
Inequality or Gini Index in Kailua CDP Honolulu County is 0.41.
What is the Total Population of Kailua CDP Honolulu County?
Total Population of Kailua CDP Honolulu County is 40,323.
What is the Total Male Population of Kailua CDP Honolulu County?
Total Male Population of Kailua CDP Honolulu County is 20,190.
What is the Total Female Population of Kailua CDP Honolulu County?
Total Female Population of Kailua CDP Honolulu County is 20,133.
What is the Ratio of Males per 100 Females in Kailua CDP Honolulu County?
There are 100.28 Males per 100 Females in Kailua CDP Honolulu County.
What is the Ratio of Females per 100 Males in Kailua CDP Honolulu County?
There are 99.72 Females per 100 Males in Kailua CDP Honolulu County.
What is the Median Population Age in Kailua CDP Honolulu County?
Median Population Age in Kailua CDP Honolulu County is 42.2 Years.
What is the Average Family Size in Kailua CDP Honolulu County
Average Family Size in Kailua CDP Honolulu County is 3.4 People.
What is the Average Household Size in Kailua CDP Honolulu County
Average Household Size in Kailua CDP Honolulu County is 3.0 People.
How Large is the Labor Force in Kailua CDP Honolulu County?
There are 21,034 People in the Labor Forcein in Kailua CDP Honolulu County.
What is the Percentage of People in the Labor Force in Kailua CDP Honolulu County?
65.3% of People are in the Labor Force in Kailua CDP Honolulu County.
What is the Unemployment Rate in Kailua CDP Honolulu County?
Unemployment Rate in Kailua CDP Honolulu County is 3.3%.