Kaneohe, HI Map & Demographics
Kaneohe Map
Kaneohe Overview
$48,696
PER CAPITA INCOME
$142,582
AVG FAMILY INCOME
$120,451
AVG HOUSEHOLD INCOME
16.9%
WAGE / INCOME GAP [ % ]
83.1¢/ $1
WAGE / INCOME GAP [ $ ]
$15,838
FAMILY INCOME DEFICIT
0.42
INEQUALITY / GINI INDEX
35,493
TOTAL POPULATION
17,635
MALE POPULATION
17,858
FEMALE POPULATION
98.75
MALES / 100 FEMALES
101.26
FEMALES / 100 MALES
45.1
MEDIAN AGE
3.5
AVG FAMILY SIZE
3.0
AVG HOUSEHOLD SIZE
18,613
LABOR FORCE [ PEOPLE ]
62.2%
PERCENT IN LABOR FORCE
4.5%
UNEMPLOYMENT RATE
Kaneohe Zip Codes
Kaneohe Area Codes
Income in Kaneohe
Income Overview in Kaneohe
Per Capita Income in Kaneohe is $48,696, while median incomes of families and households are $142,582 and $120,451 respectively.
| Characteristic | Number | Measure |
| Per Capita Income | 35,493 | $48,696 |
| Median Family Income | 8,341 | $142,582 |
| Mean Family Income | 8,341 | $163,301 |
| Median Household Income | 11,285 | $120,451 |
| Mean Household Income | 11,285 | $146,985 |
| Income Deficit | 8,341 | $15,838 |
| Wage / Income Gap (%) | 35,493 | 16.87% |
| Wage / Income Gap ($) | 35,493 | 83.13¢ per $1 |
| Gini / Inequality Index | 35,493 | 0.42 |
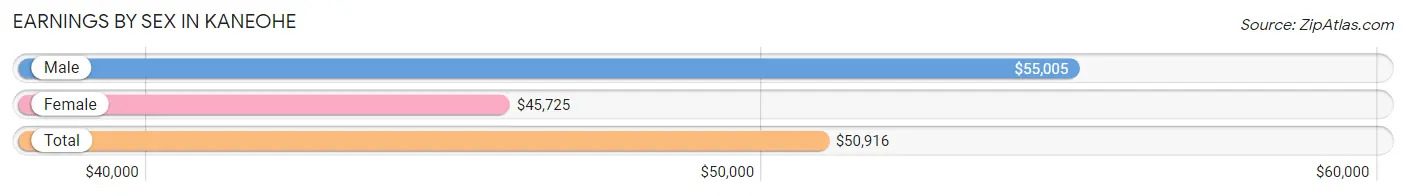
Earnings by Sex in Kaneohe
Average Earnings in Kaneohe are $50,916, $55,005 for men and $45,725 for women, a difference of 16.9%.
| Sex | Number | Average Earnings |
| Male | 10,167 (53.2%) | $55,005 |
| Female | 8,929 (46.8%) | $45,725 |
| Total | 19,096 (100.0%) | $50,916 |
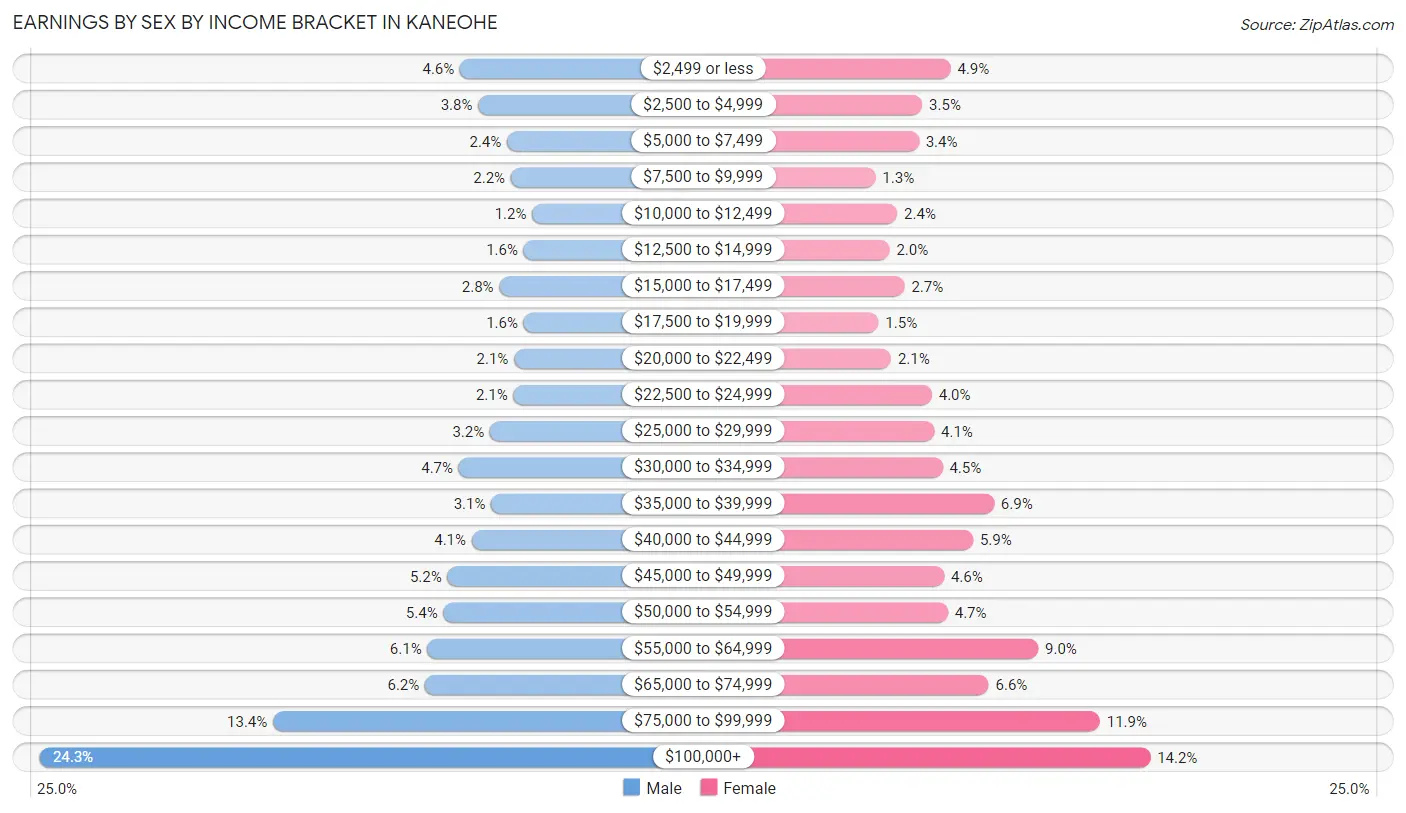
Earnings by Sex by Income Bracket in Kaneohe
The most common earnings brackets in Kaneohe are $100,000+ for men (2,469 | 24.3%) and $100,000+ for women (1,269 | 14.2%).
| Income | Male | Female |
| $2,499 or less | 468 (4.6%) | 434 (4.9%) |
| $2,500 to $4,999 | 381 (3.7%) | 315 (3.5%) |
| $5,000 to $7,499 | 244 (2.4%) | 301 (3.4%) |
| $7,500 to $9,999 | 226 (2.2%) | 120 (1.3%) |
| $10,000 to $12,499 | 124 (1.2%) | 211 (2.4%) |
| $12,500 to $14,999 | 165 (1.6%) | 179 (2.0%) |
| $15,000 to $17,499 | 281 (2.8%) | 241 (2.7%) |
| $17,500 to $19,999 | 165 (1.6%) | 132 (1.5%) |
| $20,000 to $22,499 | 210 (2.1%) | 185 (2.1%) |
| $22,500 to $24,999 | 214 (2.1%) | 355 (4.0%) |
| $25,000 to $29,999 | 325 (3.2%) | 365 (4.1%) |
| $30,000 to $34,999 | 474 (4.7%) | 400 (4.5%) |
| $35,000 to $39,999 | 319 (3.1%) | 615 (6.9%) |
| $40,000 to $44,999 | 412 (4.1%) | 528 (5.9%) |
| $45,000 to $49,999 | 528 (5.2%) | 406 (4.5%) |
| $50,000 to $54,999 | 547 (5.4%) | 422 (4.7%) |
| $55,000 to $64,999 | 623 (6.1%) | 800 (9.0%) |
| $65,000 to $74,999 | 634 (6.2%) | 593 (6.6%) |
| $75,000 to $99,999 | 1,358 (13.4%) | 1,058 (11.8%) |
| $100,000+ | 2,469 (24.3%) | 1,269 (14.2%) |
| Total | 10,167 (100.0%) | 8,929 (100.0%) |
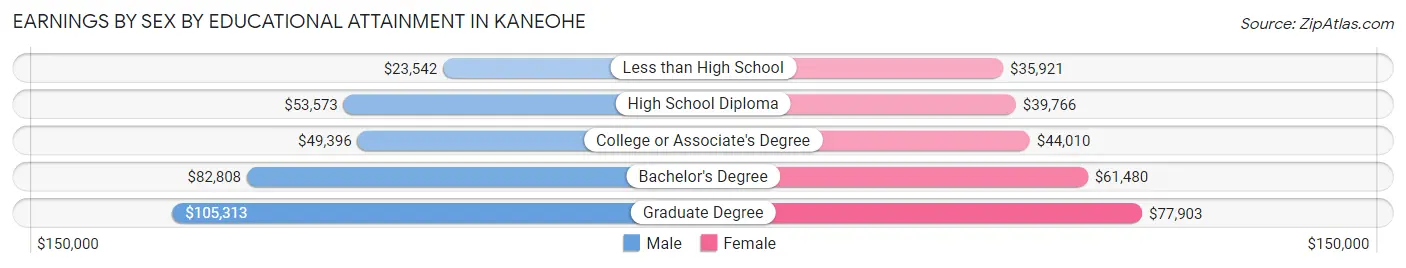
Earnings by Sex by Educational Attainment in Kaneohe
Average earnings in Kaneohe are $63,821 for men and $50,602 for women, a difference of 20.7%. Men with an educational attainment of graduate degree enjoy the highest average annual earnings of $105,313, while those with less than high school education earn the least with $23,542. Women with an educational attainment of graduate degree earn the most with the average annual earnings of $77,903, while those with less than high school education have the smallest earnings of $35,921.
| Educational Attainment | Male Income | Female Income |
| Less than High School | $23,542 | $35,921 |
| High School Diploma | $53,573 | $39,766 |
| College or Associate's Degree | $49,396 | $44,010 |
| Bachelor's Degree | $82,808 | $61,480 |
| Graduate Degree | $105,313 | $77,903 |
| Total | $63,821 | $50,602 |
Family Income in Kaneohe
Family Income Brackets in Kaneohe
According to the Kaneohe family income data, there are 2,302 families falling into the $200,000+ income range, which is the most common income bracket and makes up 27.6% of all families. Conversely, the $15,000 to $24,999 income bracket is the least frequent group with only 92 families (1.1%) belonging to this category.
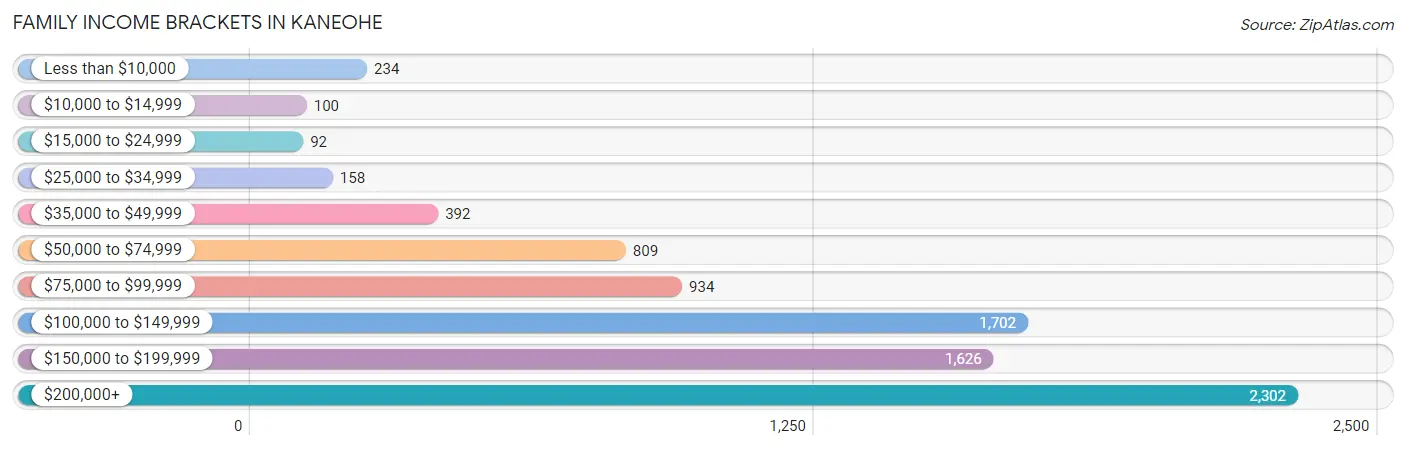
| Income Bracket | # Families | % Families |
| Less than $10,000 | 234 | 2.8% |
| $10,000 to $14,999 | 100 | 1.2% |
| $15,000 to $24,999 | 92 | 1.1% |
| $25,000 to $34,999 | 158 | 1.9% |
| $35,000 to $49,999 | 392 | 4.7% |
| $50,000 to $74,999 | 809 | 9.7% |
| $75,000 to $99,999 | 934 | 11.2% |
| $100,000 to $149,999 | 1,702 | 20.4% |
| $150,000 to $199,999 | 1,626 | 19.5% |
| $200,000+ | 2,302 | 27.6% |
Family Income by Famaliy Size in Kaneohe
7+ person families (347 | 4.2%) account for the highest median family income in Kaneohe with $213,375 per family, while 2-person families (3,451 | 41.4%) have the highest median income of $56,178 per family member.
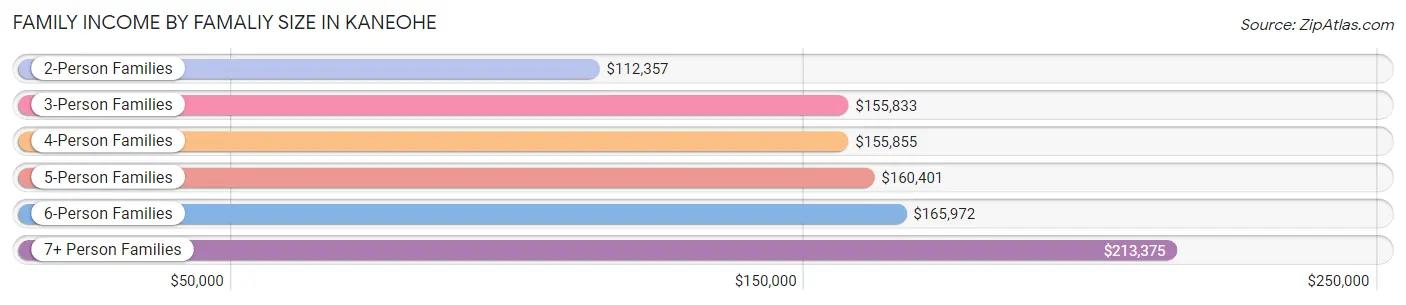
| Income Bracket | # Families | Median Income |
| 2-Person Families | 3,451 (41.4%) | $112,357 |
| 3-Person Families | 1,900 (22.8%) | $155,833 |
| 4-Person Families | 1,553 (18.6%) | $155,855 |
| 5-Person Families | 657 (7.9%) | $160,401 |
| 6-Person Families | 433 (5.2%) | $165,972 |
| 7+ Person Families | 347 (4.2%) | $213,375 |
| Total | 8,341 (100.0%) | $142,582 |
Family Income by Number of Earners in Kaneohe
The median family income in Kaneohe is $142,582, with families comprising 3+ earners (1,930) having the highest median family income of $193,598, while families with no earners (1,125) have the lowest median family income of $64,260, accounting for 23.1% and 13.5% of families, respectively.
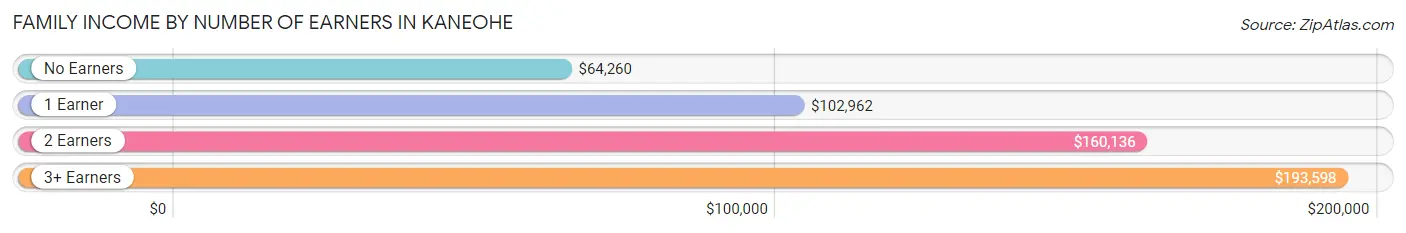
| Number of Earners | # Families | Median Income |
| No Earners | 1,125 (13.5%) | $64,260 |
| 1 Earner | 2,289 (27.4%) | $102,962 |
| 2 Earners | 2,997 (35.9%) | $160,136 |
| 3+ Earners | 1,930 (23.1%) | $193,598 |
| Total | 8,341 (100.0%) | $142,582 |
Household Income in Kaneohe
Household Income Brackets in Kaneohe
With 2,686 households falling in the category, the $200,000+ income range is the most frequent in Kaneohe, accounting for 23.8% of all households. In contrast, only 203 households (1.8%) fall into the $10,000 to $14,999 income bracket, making it the least populous group.
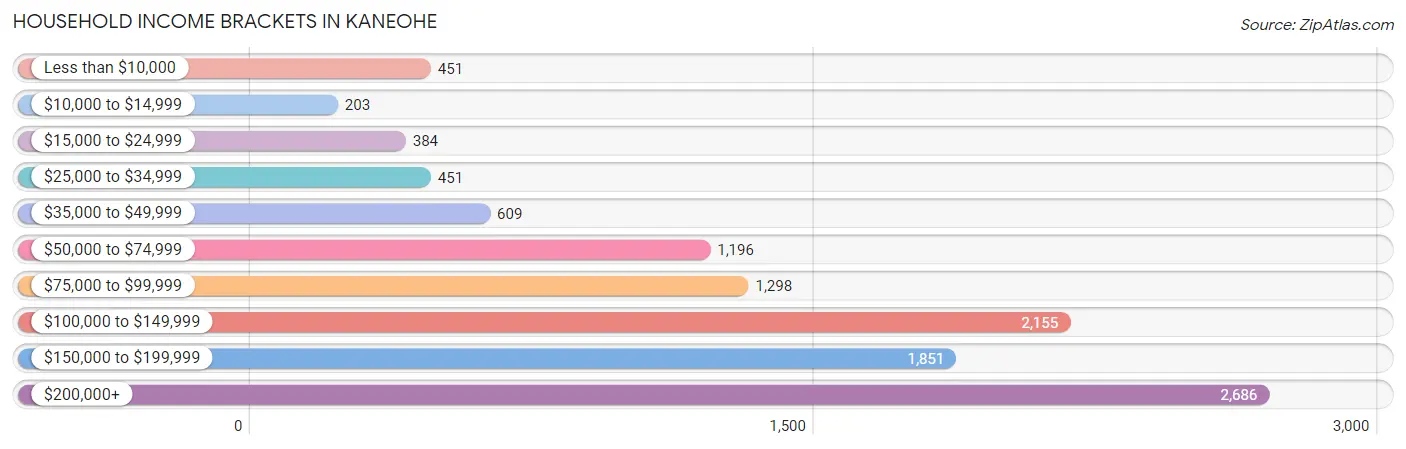
| Income Bracket | # Households | % Households |
| Less than $10,000 | 451 | 4.0% |
| $10,000 to $14,999 | 203 | 1.8% |
| $15,000 to $24,999 | 384 | 3.4% |
| $25,000 to $34,999 | 451 | 4.0% |
| $35,000 to $49,999 | 609 | 5.4% |
| $50,000 to $74,999 | 1,196 | 10.6% |
| $75,000 to $99,999 | 1,298 | 11.5% |
| $100,000 to $149,999 | 2,155 | 19.1% |
| $150,000 to $199,999 | 1,851 | 16.4% |
| $200,000+ | 2,686 | 23.8% |
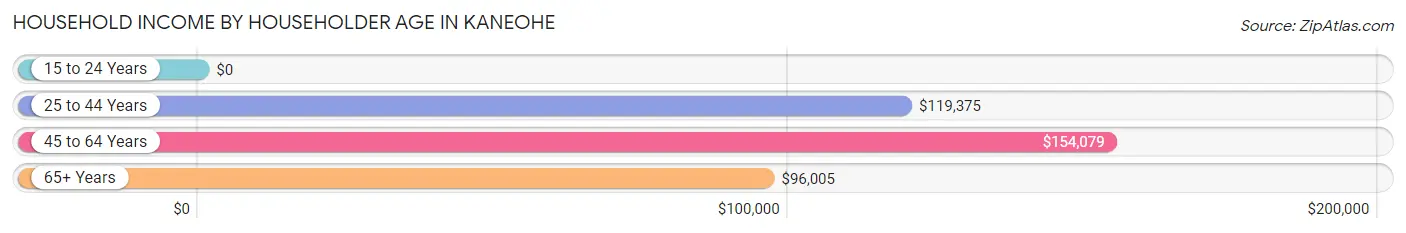
Household Income by Householder Age in Kaneohe
The median household income in Kaneohe is $120,451, with the highest median household income of $154,079 found in the 45 to 64 years age bracket for the primary householder. A total of 4,418 households (39.2%) fall into this category. Meanwhile, the 15 to 24 years age bracket for the primary householder has the lowest median household income of $0, with 113 households (1.0%) in this group.
| Income Bracket | # Households | Median Income |
| 15 to 24 Years | 113 (1.0%) | $0 |
| 25 to 44 Years | 2,289 (20.3%) | $119,375 |
| 45 to 64 Years | 4,418 (39.2%) | $154,079 |
| 65+ Years | 4,465 (39.6%) | $96,005 |
| Total | 11,285 (100.0%) | $120,451 |
Poverty in Kaneohe
Income Below Poverty by Sex and Age in Kaneohe
With 6.2% poverty level for males and 8.4% for females among the residents of Kaneohe, 45 to 54 year old males and 25 to 34 year old females are the most vulnerable to poverty, with 194 males (10.6%) and 304 females (13.3%) in their respective age groups living below the poverty level.
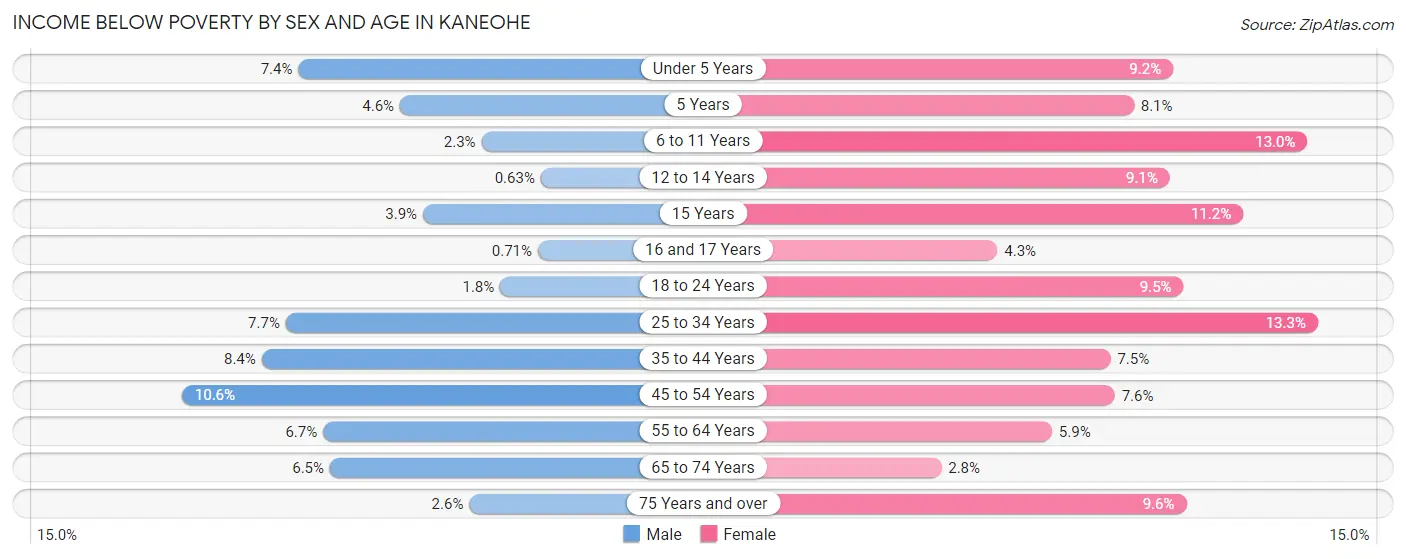
| Age Bracket | Male | Female |
| Under 5 Years | 73 (7.4%) | 82 (9.2%) |
| 5 Years | 9 (4.5%) | 10 (8.1%) |
| 6 to 11 Years | 16 (2.3%) | 126 (13.0%) |
| 12 to 14 Years | 3 (0.6%) | 64 (9.1%) |
| 15 Years | 9 (3.9%) | 21 (11.2%) |
| 16 and 17 Years | 3 (0.7%) | 9 (4.3%) |
| 18 to 24 Years | 22 (1.8%) | 95 (9.5%) |
| 25 to 34 Years | 216 (7.7%) | 304 (13.3%) |
| 35 to 44 Years | 178 (8.4%) | 146 (7.5%) |
| 45 to 54 Years | 194 (10.6%) | 153 (7.6%) |
| 55 to 64 Years | 178 (6.7%) | 152 (5.9%) |
| 65 to 74 Years | 132 (6.5%) | 55 (2.8%) |
| 75 Years and over | 40 (2.6%) | 253 (9.6%) |
| Total | 1,073 (6.2%) | 1,470 (8.4%) |
Income Above Poverty by Sex and Age in Kaneohe
According to the poverty statistics in Kaneohe, males aged 12 to 14 years and females aged 65 to 74 years are the age groups that are most secure financially, with 99.4% of males and 97.2% of females in these age groups living above the poverty line.
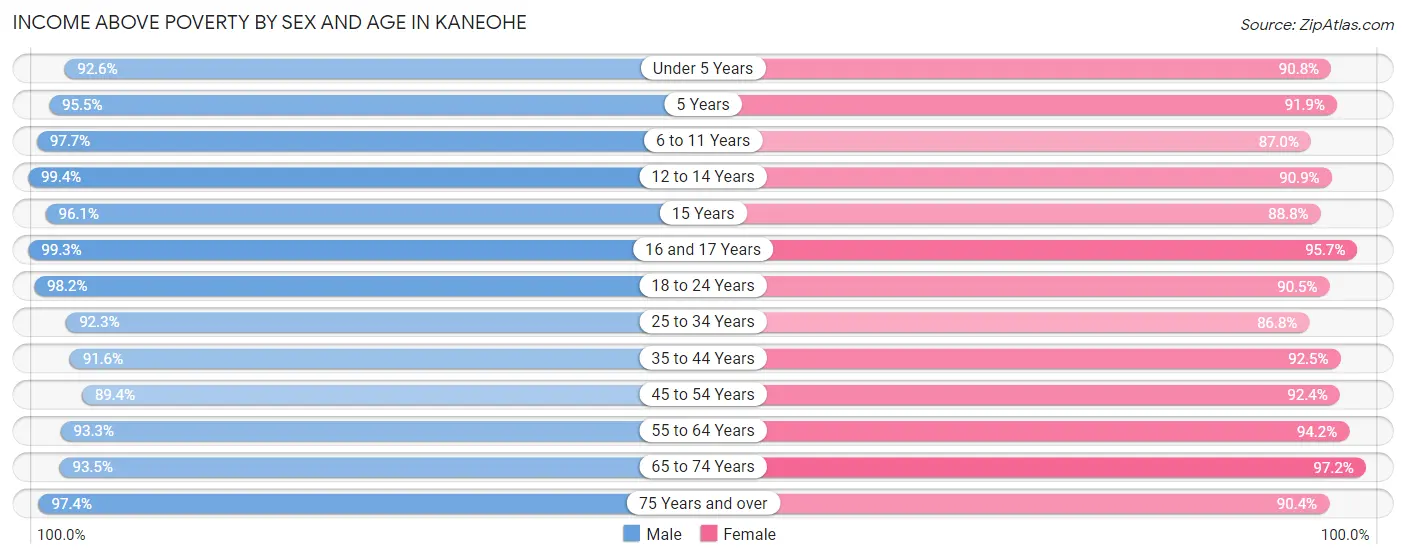
| Age Bracket | Male | Female |
| Under 5 Years | 916 (92.6%) | 807 (90.8%) |
| 5 Years | 189 (95.5%) | 113 (91.9%) |
| 6 to 11 Years | 686 (97.7%) | 846 (87.0%) |
| 12 to 14 Years | 474 (99.4%) | 637 (90.9%) |
| 15 Years | 221 (96.1%) | 167 (88.8%) |
| 16 and 17 Years | 418 (99.3%) | 199 (95.7%) |
| 18 to 24 Years | 1,228 (98.2%) | 904 (90.5%) |
| 25 to 34 Years | 2,578 (92.3%) | 1,991 (86.8%) |
| 35 to 44 Years | 1,940 (91.6%) | 1,807 (92.5%) |
| 45 to 54 Years | 1,633 (89.4%) | 1,860 (92.4%) |
| 55 to 64 Years | 2,482 (93.3%) | 2,446 (94.2%) |
| 65 to 74 Years | 1,898 (93.5%) | 1,930 (97.2%) |
| 75 Years and over | 1,488 (97.4%) | 2,384 (90.4%) |
| Total | 16,151 (93.8%) | 16,091 (91.6%) |
Income Below Poverty Among Married-Couple Families in Kaneohe
The poverty statistics for married-couple families in Kaneohe show that 3.0% or 179 of the total 5,951 families live below the poverty line. Families with 3 or 4 children have the highest poverty rate of 4.0%, comprising of 11 families. On the other hand, families with 5 or more children have the lowest poverty rate of 0.0%, which includes 0 families.
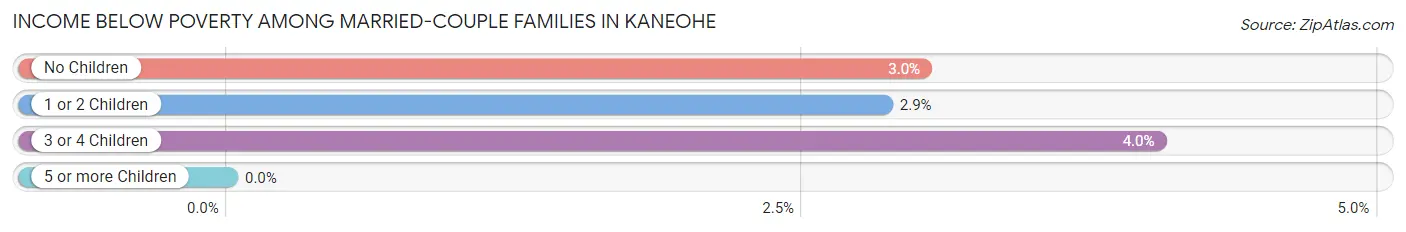
| Children | Above Poverty | Below Poverty |
| No Children | 3,663 (97.0%) | 114 (3.0%) |
| 1 or 2 Children | 1,843 (97.2%) | 54 (2.9%) |
| 3 or 4 Children | 261 (96.0%) | 11 (4.0%) |
| 5 or more Children | 5 (100.0%) | 0 (0.0%) |
| Total | 5,772 (97.0%) | 179 (3.0%) |
Income Below Poverty Among Single-Parent Households in Kaneohe
According to the poverty data in Kaneohe, 7.5% or 47 single-father households and 9.5% or 167 single-mother households are living below the poverty line. Among single-father households, those with 3 or 4 children have the highest poverty rate, with 10 households (20.4%) experiencing poverty. Likewise, among single-mother households, those with 3 or 4 children have the highest poverty rate, with 83 households (82.2%) falling below the poverty line.
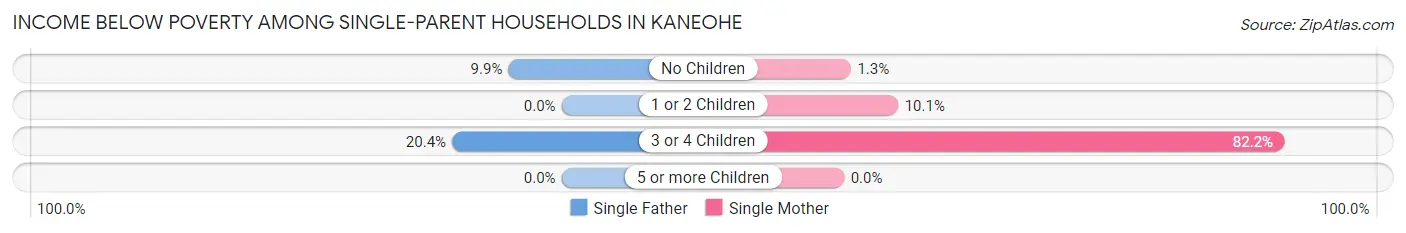
| Children | Single Father | Single Mother |
| No Children | 37 (9.9%) | 12 (1.3%) |
| 1 or 2 Children | 0 (0.0%) | 72 (10.1%) |
| 3 or 4 Children | 10 (20.4%) | 83 (82.2%) |
| 5 or more Children | 0 (0.0%) | 0 (0.0%) |
| Total | 47 (7.5%) | 167 (9.5%) |
Income Below Poverty Among Married-Couple vs Single-Parent Households in Kaneohe
The poverty data for Kaneohe shows that 179 of the married-couple family households (3.0%) and 214 of the single-parent households (8.9%) are living below the poverty level. Within the married-couple family households, those with 3 or 4 children have the highest poverty rate, with 11 households (4.0%) falling below the poverty line. Among the single-parent households, those with 3 or 4 children have the highest poverty rate, with 93 household (62.0%) living below poverty.
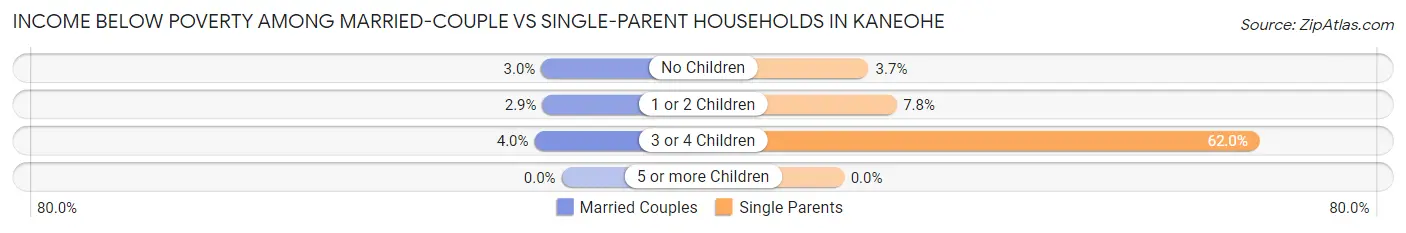
| Children | Married-Couple Families | Single-Parent Households |
| No Children | 114 (3.0%) | 49 (3.7%) |
| 1 or 2 Children | 54 (2.9%) | 72 (7.8%) |
| 3 or 4 Children | 11 (4.0%) | 93 (62.0%) |
| 5 or more Children | 0 (0.0%) | 0 (0.0%) |
| Total | 179 (3.0%) | 214 (8.9%) |
Race in Kaneohe
The most populous races in Kaneohe are Asian (14,012 | 39.5%), Two or more Races (11,533 | 32.5%), and White / Caucasian (6,464 | 18.2%).
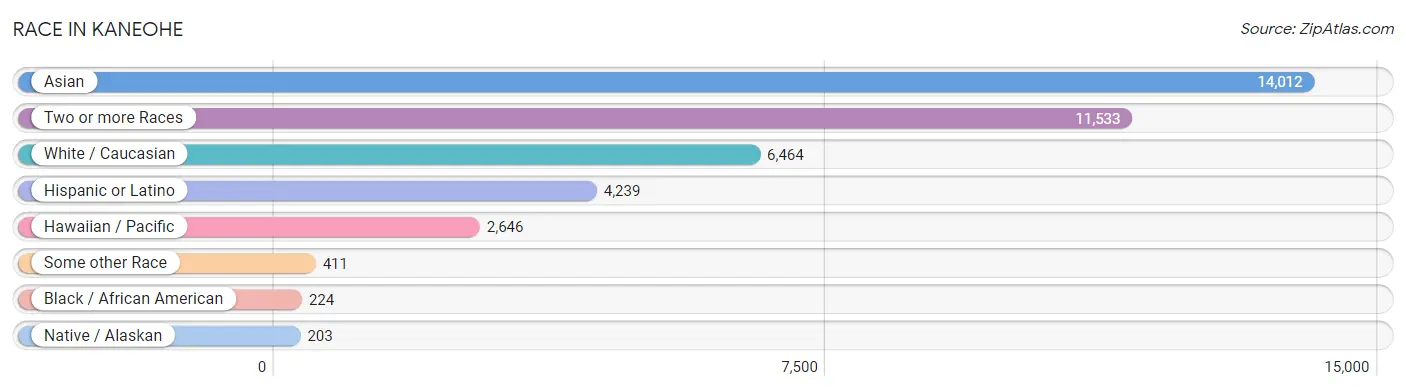
| Race | # Population | % Population |
| Asian | 14,012 | 39.5% |
| Black / African American | 224 | 0.6% |
| Hawaiian / Pacific | 2,646 | 7.4% |
| Hispanic or Latino | 4,239 | 11.9% |
| Native / Alaskan | 203 | 0.6% |
| White / Caucasian | 6,464 | 18.2% |
| Two or more Races | 11,533 | 32.5% |
| Some other Race | 411 | 1.2% |
| Total | 35,493 | 100.0% |
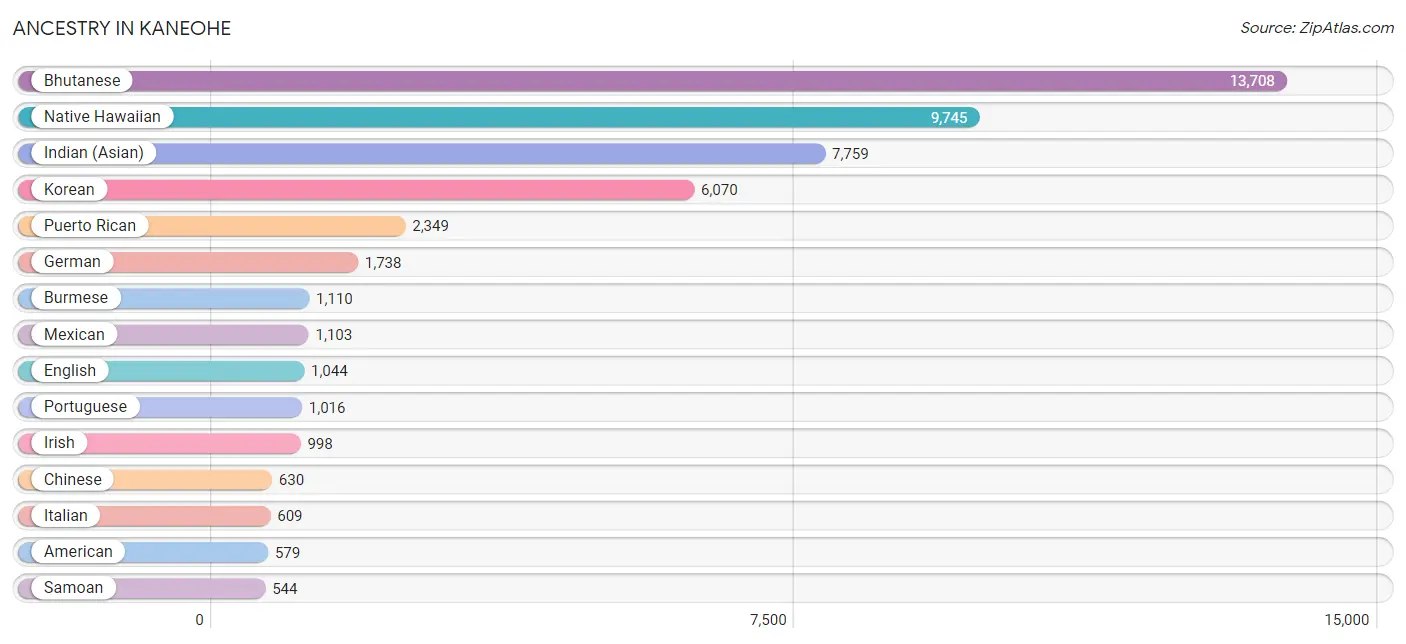
Ancestry in Kaneohe
The most populous ancestries reported in Kaneohe are Bhutanese (13,708 | 38.6%), Native Hawaiian (9,745 | 27.5%), Indian (Asian) (7,759 | 21.9%), Korean (6,070 | 17.1%), and Puerto Rican (2,349 | 6.6%), together accounting for 111.7% of all Kaneohe residents.
| Ancestry | # Population | % Population |
| African | 14 | 0.0% |
| American | 579 | 1.6% |
| Apache | 5 | 0.0% |
| Arab | 18 | 0.1% |
| Australian | 29 | 0.1% |
| Austrian | 22 | 0.1% |
| Bhutanese | 13,708 | 38.6% |
| Blackfeet | 33 | 0.1% |
| Brazilian | 26 | 0.1% |
| British | 51 | 0.1% |
| Burmese | 1,110 | 3.1% |
| Canadian | 27 | 0.1% |
| Celtic | 9 | 0.0% |
| Central American | 60 | 0.2% |
| Cherokee | 175 | 0.5% |
| Chickasaw | 27 | 0.1% |
| Chilean | 7 | 0.0% |
| Chinese | 630 | 1.8% |
| Choctaw | 39 | 0.1% |
| Colombian | 7 | 0.0% |
| Colville | 7 | 0.0% |
| Costa Rican | 27 | 0.1% |
| Creek | 11 | 0.0% |
| Croatian | 12 | 0.0% |
| Cuban | 14 | 0.0% |
| Czech | 141 | 0.4% |
| Czechoslovakian | 27 | 0.1% |
| Danish | 96 | 0.3% |
| Dominican | 46 | 0.1% |
| Dutch | 129 | 0.4% |
| Eastern European | 17 | 0.1% |
| English | 1,044 | 2.9% |
| European | 168 | 0.5% |
| Fijian | 26 | 0.1% |
| Filipino | 19 | 0.1% |
| Finnish | 55 | 0.2% |
| French | 217 | 0.6% |
| French Canadian | 36 | 0.1% |
| German | 1,738 | 4.9% |
| Greek | 77 | 0.2% |
| Guamanian / Chamorro | 196 | 0.5% |
| Haitian | 8 | 0.0% |
| Hungarian | 18 | 0.1% |
| Indian (Asian) | 7,759 | 21.9% |
| Indonesian | 9 | 0.0% |
| Iranian | 9 | 0.0% |
| Irish | 998 | 2.8% |
| Iroquois | 27 | 0.1% |
| Italian | 609 | 1.7% |
| Japanese | 30 | 0.1% |
| Korean | 6,070 | 17.1% |
| Laotian | 44 | 0.1% |
| Latvian | 22 | 0.1% |
| Lebanese | 5 | 0.0% |
| Lithuanian | 7 | 0.0% |
| Marshallese | 6 | 0.0% |
| Mexican | 1,103 | 3.1% |
| Mexican American Indian | 118 | 0.3% |
| Native Hawaiian | 9,745 | 27.5% |
| Navajo | 22 | 0.1% |
| New Zealander | 7 | 0.0% |
| Nicaraguan | 25 | 0.1% |
| Northern European | 66 | 0.2% |
| Norwegian | 151 | 0.4% |
| Pakistani | 202 | 0.6% |
| Pennsylvania German | 12 | 0.0% |
| Peruvian | 7 | 0.0% |
| Polish | 298 | 0.8% |
| Portuguese | 1,016 | 2.9% |
| Puerto Rican | 2,349 | 6.6% |
| Russian | 106 | 0.3% |
| Salvadoran | 8 | 0.0% |
| Samoan | 544 | 1.5% |
| Scandinavian | 32 | 0.1% |
| Scotch-Irish | 83 | 0.2% |
| Scottish | 265 | 0.7% |
| Sioux | 41 | 0.1% |
| Slovak | 9 | 0.0% |
| Slovene | 23 | 0.1% |
| South American | 53 | 0.2% |
| Spaniard | 260 | 0.7% |
| Spanish | 207 | 0.6% |
| Sri Lankan | 107 | 0.3% |
| Subsaharan African | 14 | 0.0% |
| Swedish | 157 | 0.4% |
| Swiss | 31 | 0.1% |
| Thai | 214 | 0.6% |
| Tongan | 3 | 0.0% |
| Ukrainian | 29 | 0.1% |
| Venezuelan | 32 | 0.1% |
| Welsh | 81 | 0.2% |
| Yugoslavian | 68 | 0.2% | View All 92 Rows |
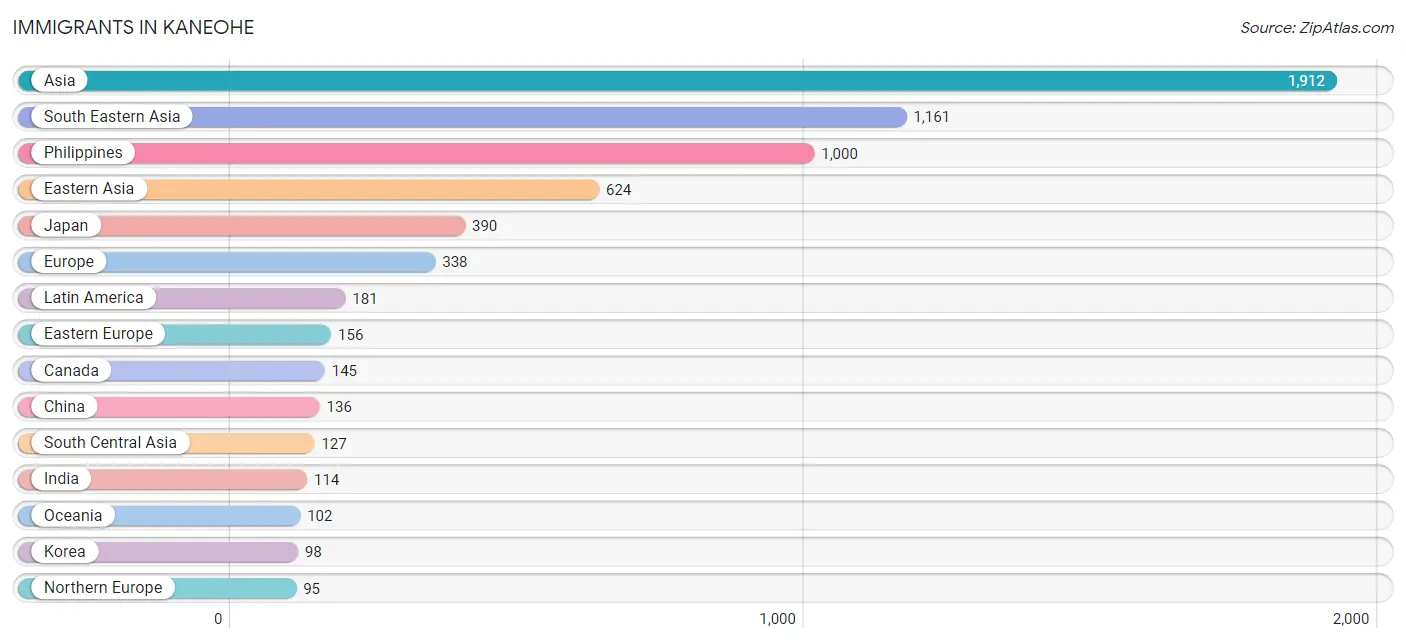
Immigrants in Kaneohe
The most numerous immigrant groups reported in Kaneohe came from Asia (1,912 | 5.4%), South Eastern Asia (1,161 | 3.3%), Philippines (1,000 | 2.8%), Eastern Asia (624 | 1.8%), and Japan (390 | 1.1%), together accounting for 14.3% of all Kaneohe residents.
| Immigration Origin | # Population | % Population |
| Africa | 9 | 0.0% |
| Asia | 1,912 | 5.4% |
| Brazil | 21 | 0.1% |
| Cambodia | 19 | 0.1% |
| Canada | 145 | 0.4% |
| Caribbean | 55 | 0.2% |
| Central America | 53 | 0.2% |
| China | 136 | 0.4% |
| Colombia | 7 | 0.0% |
| Croatia | 26 | 0.1% |
| Denmark | 5 | 0.0% |
| Dominican Republic | 13 | 0.0% |
| Eastern Asia | 624 | 1.8% |
| Eastern Europe | 156 | 0.4% |
| England | 5 | 0.0% |
| Europe | 338 | 0.9% |
| Germany | 66 | 0.2% |
| Hong Kong | 31 | 0.1% |
| India | 114 | 0.3% |
| Indonesia | 11 | 0.0% |
| Italy | 21 | 0.1% |
| Japan | 390 | 1.1% |
| Kazakhstan | 13 | 0.0% |
| Korea | 98 | 0.3% |
| Latin America | 181 | 0.5% |
| Malaysia | 9 | 0.0% |
| Mexico | 43 | 0.1% |
| Micronesia | 20 | 0.1% |
| Nicaragua | 10 | 0.0% |
| Northern Europe | 95 | 0.3% |
| Norway | 25 | 0.1% |
| Oceania | 102 | 0.3% |
| Peru | 7 | 0.0% |
| Philippines | 1,000 | 2.8% |
| Poland | 61 | 0.2% |
| Russia | 69 | 0.2% |
| Singapore | 7 | 0.0% |
| South Africa | 9 | 0.0% |
| South America | 73 | 0.2% |
| South Central Asia | 127 | 0.4% |
| South Eastern Asia | 1,161 | 3.3% |
| Southern Europe | 21 | 0.1% |
| Sweden | 15 | 0.0% |
| Taiwan | 15 | 0.0% |
| Thailand | 84 | 0.2% |
| Trinidad and Tobago | 42 | 0.1% |
| Venezuela | 38 | 0.1% |
| Vietnam | 22 | 0.1% |
| Western Europe | 66 | 0.2% | View All 49 Rows |
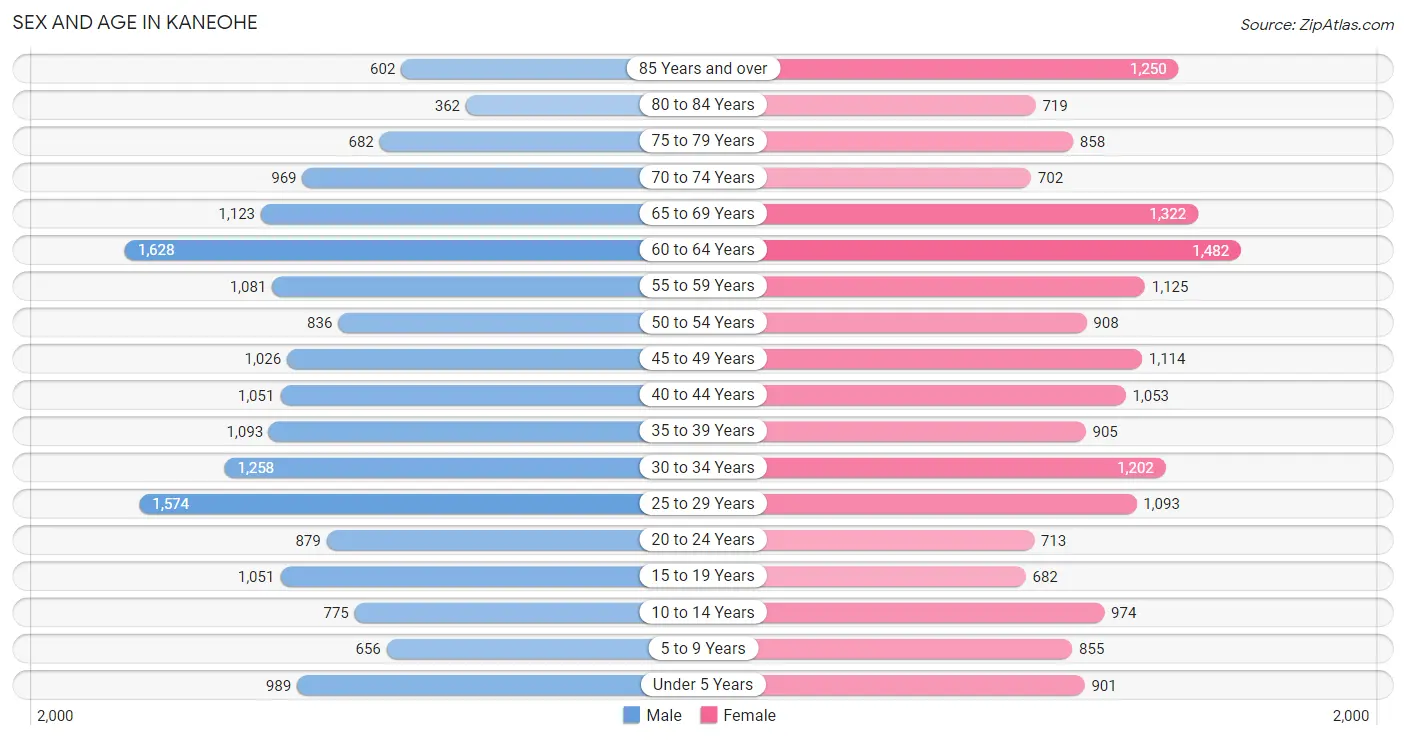
Sex and Age in Kaneohe
Sex and Age in Kaneohe
The most populous age groups in Kaneohe are 60 to 64 Years (1,628 | 9.2%) for men and 60 to 64 Years (1,482 | 8.3%) for women.
| Age Bracket | Male | Female |
| Under 5 Years | 989 (5.6%) | 901 (5.1%) |
| 5 to 9 Years | 656 (3.7%) | 855 (4.8%) |
| 10 to 14 Years | 775 (4.4%) | 974 (5.4%) |
| 15 to 19 Years | 1,051 (6.0%) | 682 (3.8%) |
| 20 to 24 Years | 879 (5.0%) | 713 (4.0%) |
| 25 to 29 Years | 1,574 (8.9%) | 1,093 (6.1%) |
| 30 to 34 Years | 1,258 (7.1%) | 1,202 (6.7%) |
| 35 to 39 Years | 1,093 (6.2%) | 905 (5.1%) |
| 40 to 44 Years | 1,051 (6.0%) | 1,053 (5.9%) |
| 45 to 49 Years | 1,026 (5.8%) | 1,114 (6.2%) |
| 50 to 54 Years | 836 (4.7%) | 908 (5.1%) |
| 55 to 59 Years | 1,081 (6.1%) | 1,125 (6.3%) |
| 60 to 64 Years | 1,628 (9.2%) | 1,482 (8.3%) |
| 65 to 69 Years | 1,123 (6.4%) | 1,322 (7.4%) |
| 70 to 74 Years | 969 (5.5%) | 702 (3.9%) |
| 75 to 79 Years | 682 (3.9%) | 858 (4.8%) |
| 80 to 84 Years | 362 (2.1%) | 719 (4.0%) |
| 85 Years and over | 602 (3.4%) | 1,250 (7.0%) |
| Total | 17,635 (100.0%) | 17,858 (100.0%) |
Families and Households in Kaneohe
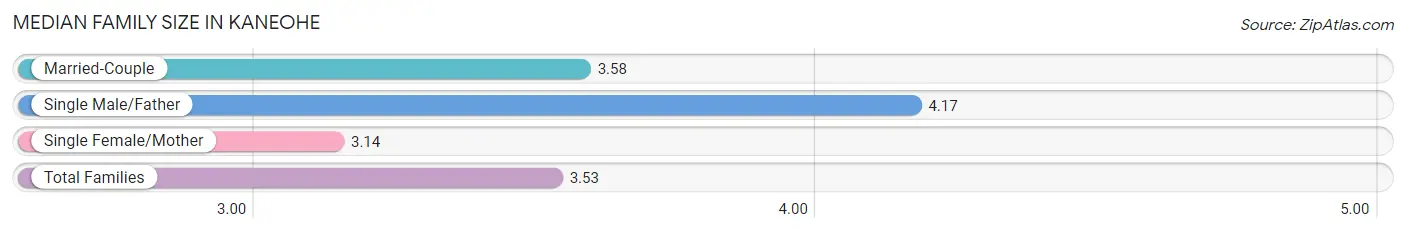
Median Family Size in Kaneohe
The median family size in Kaneohe is 3.53 persons per family, with single male/father families (626 | 7.5%) accounting for the largest median family size of 4.17 persons per family. On the other hand, single female/mother families (1,764 | 21.1%) represent the smallest median family size with 3.14 persons per family.
| Family Type | # Families | Family Size |
| Married-Couple | 5,951 (71.4%) | 3.58 |
| Single Male/Father | 626 (7.5%) | 4.17 |
| Single Female/Mother | 1,764 (21.1%) | 3.14 |
| Total Families | 8,341 (100.0%) | 3.53 |
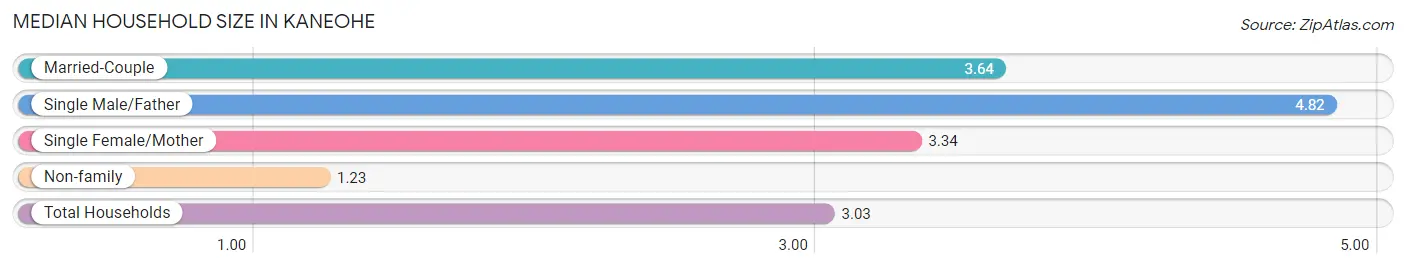
Median Household Size in Kaneohe
The median household size in Kaneohe is 3.03 persons per household, with single male/father households (626 | 5.6%) accounting for the largest median household size of 4.82 persons per household. non-family households (2,944 | 26.1%) represent the smallest median household size with 1.23 persons per household.
| Household Type | # Households | Household Size |
| Married-Couple | 5,951 (52.7%) | 3.64 |
| Single Male/Father | 626 (5.6%) | 4.82 |
| Single Female/Mother | 1,764 (15.6%) | 3.34 |
| Non-family | 2,944 (26.1%) | 1.23 |
| Total Households | 11,285 (100.0%) | 3.03 |
Household Size by Marriage Status in Kaneohe
Out of a total of 11,285 households in Kaneohe, 8,341 (73.9%) are family households, while 2,944 (26.1%) are nonfamily households. The most numerous type of family households are 2-person households, comprising 3,238, and the most common type of nonfamily households are 1-person households, comprising 2,452.
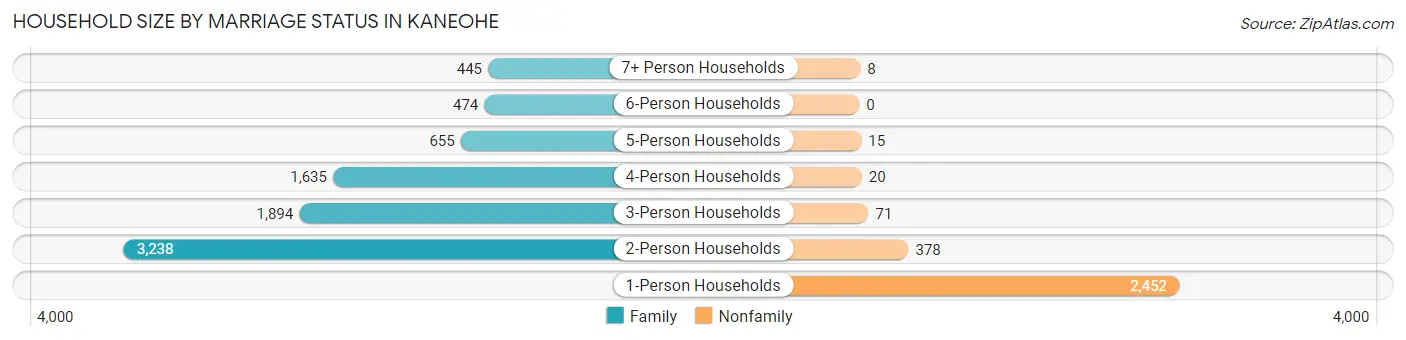
| Household Size | Family Households | Nonfamily Households |
| 1-Person Households | - | 2,452 (21.7%) |
| 2-Person Households | 3,238 (28.7%) | 378 (3.4%) |
| 3-Person Households | 1,894 (16.8%) | 71 (0.6%) |
| 4-Person Households | 1,635 (14.5%) | 20 (0.2%) |
| 5-Person Households | 655 (5.8%) | 15 (0.1%) |
| 6-Person Households | 474 (4.2%) | 0 (0.0%) |
| 7+ Person Households | 445 (3.9%) | 8 (0.1%) |
| Total | 8,341 (73.9%) | 2,944 (26.1%) |
Female Fertility in Kaneohe
Fertility by Age in Kaneohe
Average fertility rate in Kaneohe is 44.0 births per 1,000 women. Women in the age bracket of 20 to 34 years have the highest fertility rate with 63.0 births per 1,000 women. Women in the age bracket of 20 to 34 years acount for 61.0% of all women with births.
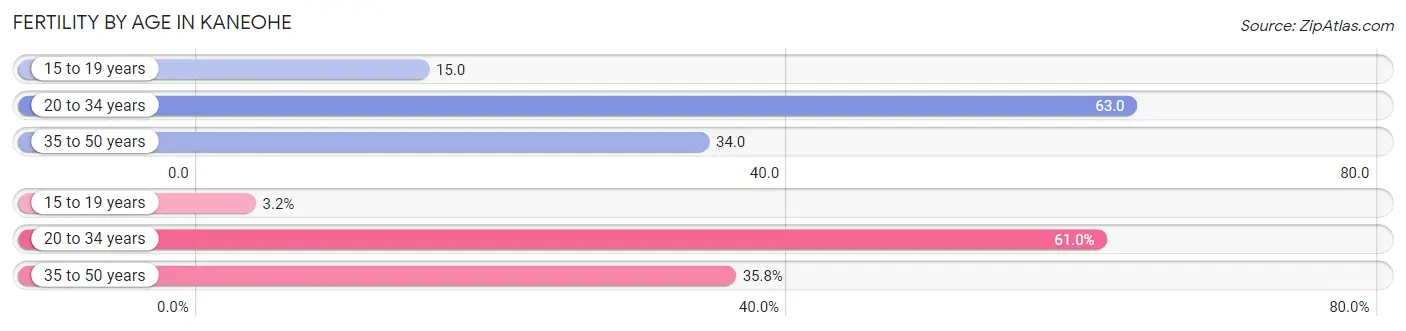
| Age Bracket | Women with Births | Births / 1,000 Women |
| 15 to 19 years | 10 (3.2%) | 15.0 |
| 20 to 34 years | 189 (61.0%) | 63.0 |
| 35 to 50 years | 111 (35.8%) | 34.0 |
| Total | 310 (100.0%) | 44.0 |
Fertility by Age by Marriage Status in Kaneohe
68.7% of women with births (310) in Kaneohe are married. The highest percentage of unmarried women with births falls into 15 to 19 years age bracket with 100.0% of them unmarried at the time of birth, while the lowest percentage of unmarried women with births belong to 35 to 50 years age bracket with 15.3% of them unmarried.
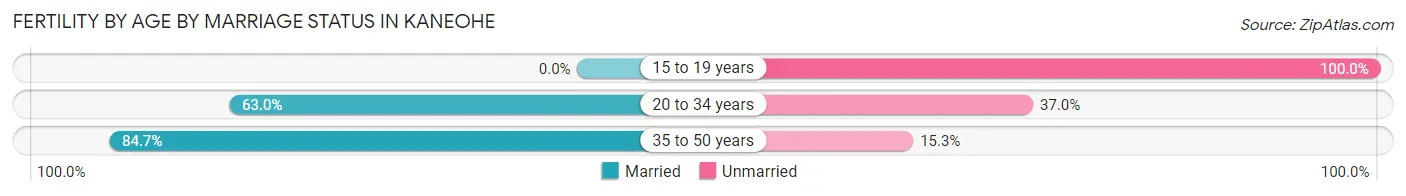
| Age Bracket | Married | Unmarried |
| 15 to 19 years | 0 (0.0%) | 10 (100.0%) |
| 20 to 34 years | 119 (63.0%) | 70 (37.0%) |
| 35 to 50 years | 94 (84.7%) | 17 (15.3%) |
| Total | 213 (68.7%) | 97 (31.3%) |
Fertility by Education in Kaneohe
Average fertility rate in Kaneohe is 44.0 births per 1,000 women. Women with the education attainment of college or associate's degree have the highest fertility rate of 77.0 births per 1,000 women, while women with the education attainment of less than high school have the lowest fertility at 20.0 births per 1,000 women. Women with the education attainment of college or associate's degree represent 51.9% of all women with births.
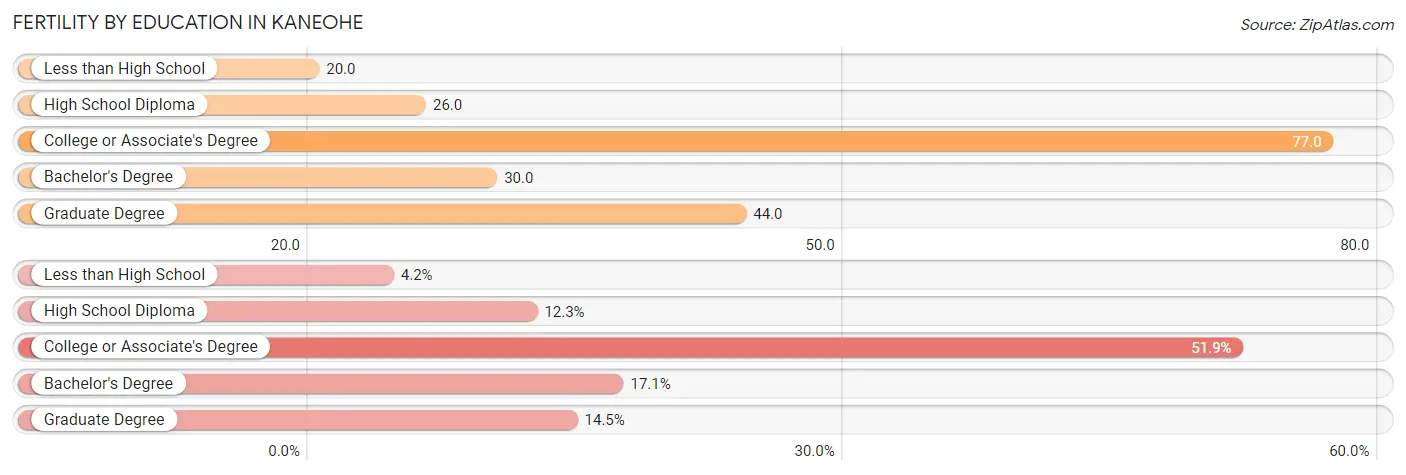
| Educational Attainment | Women with Births | Births / 1,000 Women |
| Less than High School | 13 (4.2%) | 20.0 |
| High School Diploma | 38 (12.3%) | 26.0 |
| College or Associate's Degree | 161 (51.9%) | 77.0 |
| Bachelor's Degree | 53 (17.1%) | 30.0 |
| Graduate Degree | 45 (14.5%) | 44.0 |
| Total | 310 (100.0%) | 44.0 |
Fertility by Education by Marriage Status in Kaneohe
31.3% of women with births in Kaneohe are unmarried. Women with the educational attainment of graduate degree are most likely to be married with 80.0% of them married at childbirth, while women with the educational attainment of less than high school are least likely to be married with 100.0% of them unmarried at childbirth.
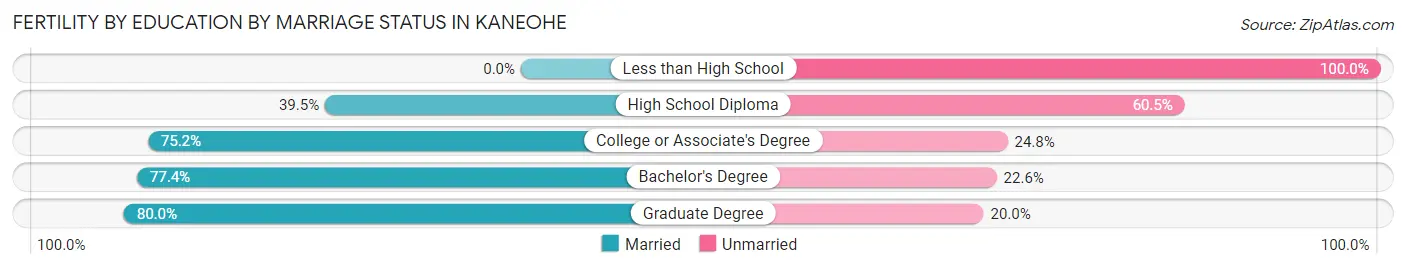
| Educational Attainment | Married | Unmarried |
| Less than High School | 0 (0.0%) | 13 (100.0%) |
| High School Diploma | 15 (39.5%) | 23 (60.5%) |
| College or Associate's Degree | 121 (75.2%) | 40 (24.8%) |
| Bachelor's Degree | 41 (77.4%) | 12 (22.6%) |
| Graduate Degree | 36 (80.0%) | 9 (20.0%) |
| Total | 213 (68.7%) | 97 (31.3%) |
Employment Characteristics in Kaneohe
Employment by Class of Employer in Kaneohe
Among the 17,321 employed individuals in Kaneohe, private company employees (9,588 | 55.3%), federal government employees (2,020 | 11.7%), and state government employees (1,761 | 10.2%) make up the most common classes of employment.
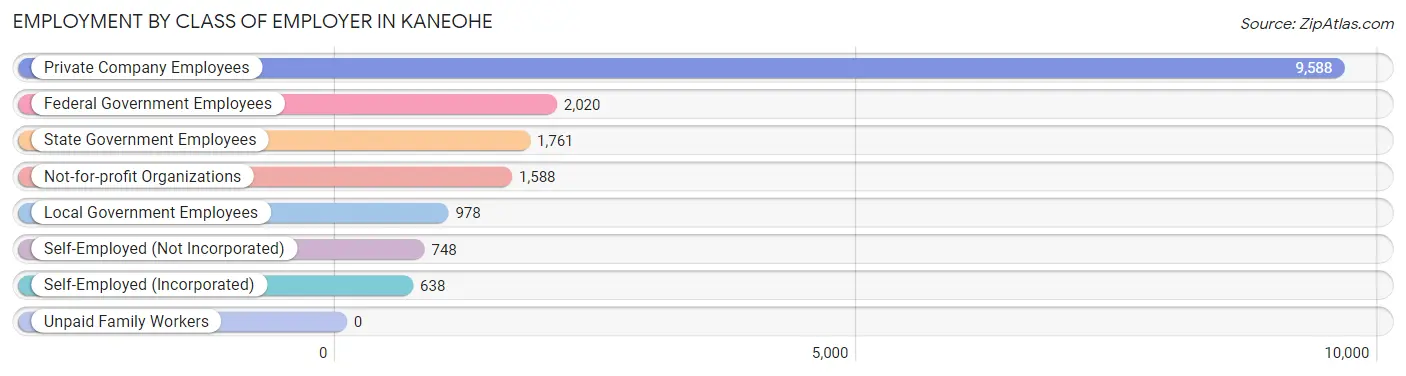
| Employer Class | # Employees | % Employees |
| Private Company Employees | 9,588 | 55.3% |
| Self-Employed (Incorporated) | 638 | 3.7% |
| Self-Employed (Not Incorporated) | 748 | 4.3% |
| Not-for-profit Organizations | 1,588 | 9.2% |
| Local Government Employees | 978 | 5.7% |
| State Government Employees | 1,761 | 10.2% |
| Federal Government Employees | 2,020 | 11.7% |
| Unpaid Family Workers | 0 | 0.0% |
| Total | 17,321 | 100.0% |
Employment Status by Age in Kaneohe
According to the labor force statistics for Kaneohe, out of the total population over 16 years of age (29,925), 62.2% or 18,613 individuals are in the labor force, with 4.5% or 838 of them unemployed. The age group with the highest labor force participation rate is 30 to 34 years, with 87.6% or 2,155 individuals in the labor force. Within the labor force, the 20 to 24 years age range has the highest percentage of unemployed individuals, with 9.0% or 88 of them being unemployed.
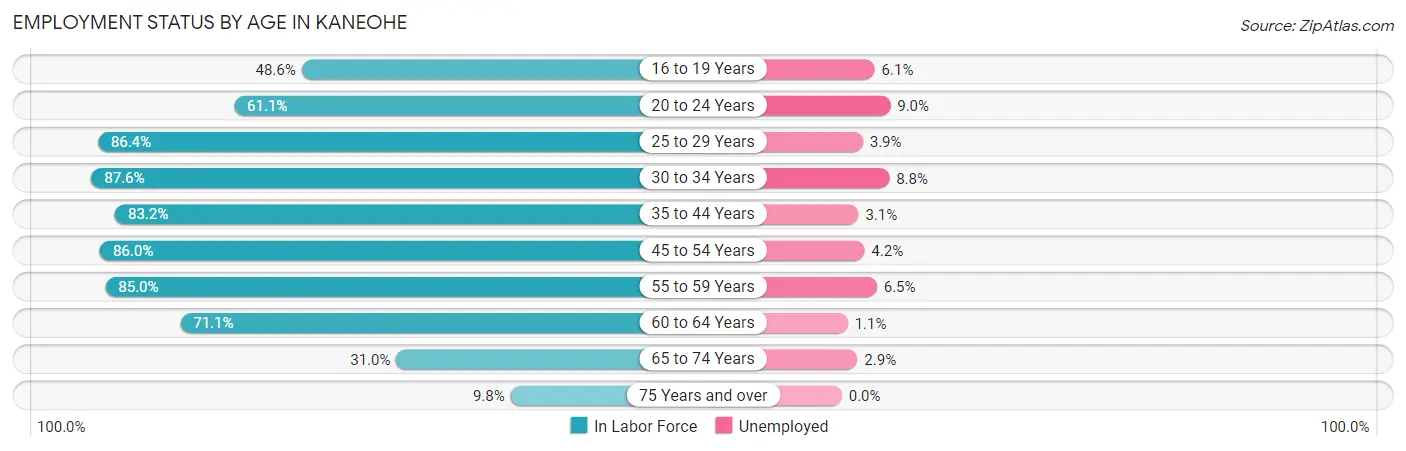
| Age Bracket | In Labor Force | Unemployed |
| 16 to 19 Years | 639 (48.6%) | 39 (6.1%) |
| 20 to 24 Years | 973 (61.1%) | 88 (9.0%) |
| 25 to 29 Years | 2,304 (86.4%) | 90 (3.9%) |
| 30 to 34 Years | 2,155 (87.6%) | 190 (8.8%) |
| 35 to 44 Years | 3,413 (83.2%) | 106 (3.1%) |
| 45 to 54 Years | 3,340 (86.0%) | 140 (4.2%) |
| 55 to 59 Years | 1,875 (85.0%) | 122 (6.5%) |
| 60 to 64 Years | 2,211 (71.1%) | 24 (1.1%) |
| 65 to 74 Years | 1,276 (31.0%) | 37 (2.9%) |
| 75 Years and over | 438 (9.8%) | 0 (0.0%) |
| Total | 18,613 (62.2%) | 838 (4.5%) |
Employment Status by Educational Attainment in Kaneohe
According to labor force statistics for Kaneohe, 83.0% of individuals (15,296) out of the total population between 25 and 64 years of age (18,429) are in the labor force, with 4.4% or 673 of them being unemployed. The group with the highest labor force participation rate are those with the educational attainment of bachelor's degree or higher, with 91.7% or 6,541 individuals in the labor force. Within the labor force, individuals with high school diploma education have the highest percentage of unemployment, with 8.3% or 286 of them being unemployed.
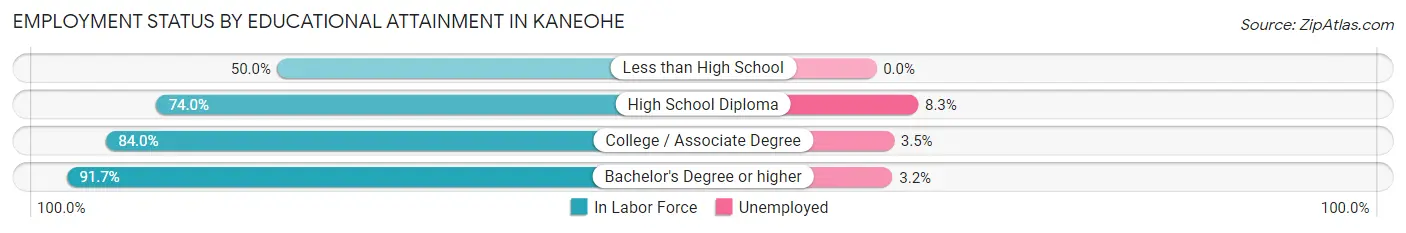
| Educational Attainment | In Labor Force | Unemployed |
| Less than High School | 384 (50.0%) | 0 (0.0%) |
| High School Diploma | 3,442 (74.0%) | 386 (8.3%) |
| College / Associate Degree | 4,936 (84.0%) | 206 (3.5%) |
| Bachelor's Degree or higher | 6,541 (91.7%) | 228 (3.2%) |
| Total | 15,296 (83.0%) | 811 (4.4%) |
Employment Occupations by Sex in Kaneohe
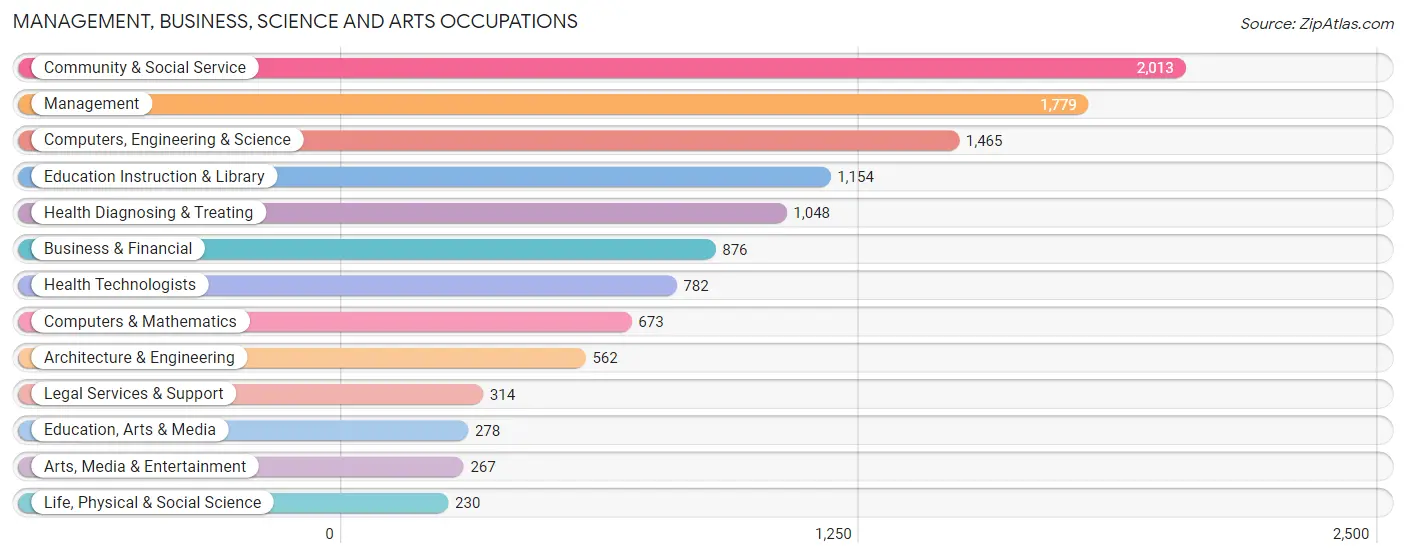
Management, Business, Science and Arts Occupations
The most common Management, Business, Science and Arts occupations in Kaneohe are Community & Social Service (2,013 | 11.7%), Management (1,779 | 10.4%), Computers, Engineering & Science (1,465 | 8.6%), Education Instruction & Library (1,154 | 6.7%), and Health Diagnosing & Treating (1,048 | 6.1%).
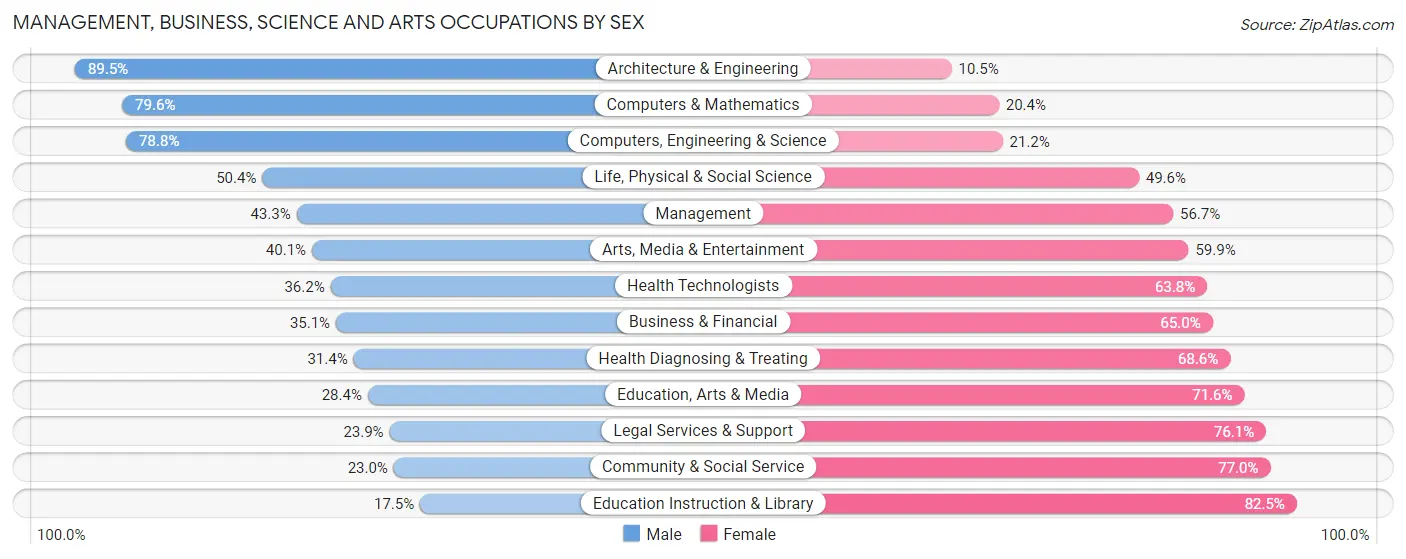
Management, Business, Science and Arts Occupations by Sex
Within the Management, Business, Science and Arts occupations in Kaneohe, the most male-oriented occupations are Architecture & Engineering (89.5%), Computers & Mathematics (79.6%), and Computers, Engineering & Science (78.8%), while the most female-oriented occupations are Education Instruction & Library (82.5%), Community & Social Service (77.0%), and Legal Services & Support (76.1%).
| Occupation | Male | Female |
| Management | 770 (43.3%) | 1,009 (56.7%) |
| Business & Financial | 307 (35.0%) | 569 (64.9%) |
| Computers, Engineering & Science | 1,155 (78.8%) | 310 (21.2%) |
| Computers & Mathematics | 536 (79.6%) | 137 (20.4%) |
| Architecture & Engineering | 503 (89.5%) | 59 (10.5%) |
| Life, Physical & Social Science | 116 (50.4%) | 114 (49.6%) |
| Community & Social Service | 463 (23.0%) | 1,550 (77.0%) |
| Education, Arts & Media | 79 (28.4%) | 199 (71.6%) |
| Legal Services & Support | 75 (23.9%) | 239 (76.1%) |
| Education Instruction & Library | 202 (17.5%) | 952 (82.5%) |
| Arts, Media & Entertainment | 107 (40.1%) | 160 (59.9%) |
| Health Diagnosing & Treating | 329 (31.4%) | 719 (68.6%) |
| Health Technologists | 283 (36.2%) | 499 (63.8%) |
| Total (Category) | 3,024 (42.1%) | 4,157 (57.9%) |
| Total (Overall) | 8,740 (51.0%) | 8,402 (49.0%) |
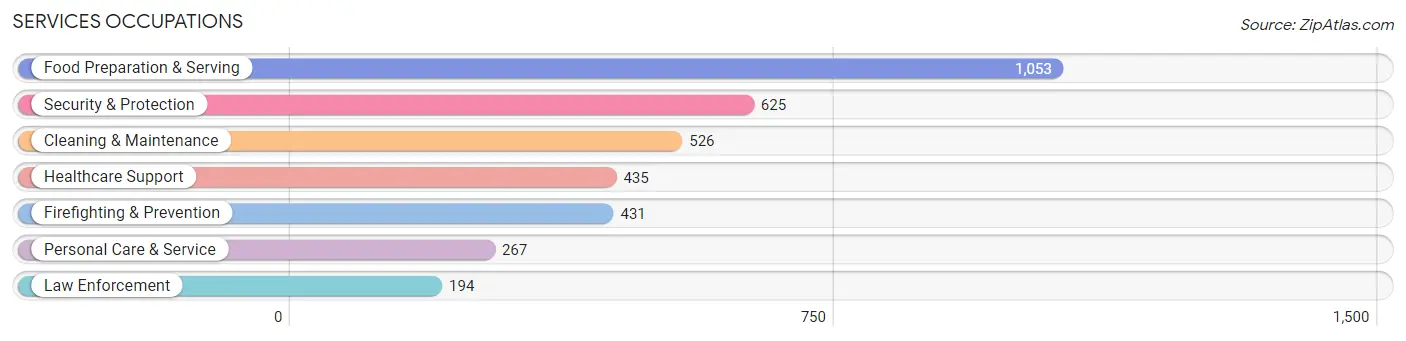
Services Occupations
The most common Services occupations in Kaneohe are Food Preparation & Serving (1,053 | 6.1%), Security & Protection (625 | 3.6%), Cleaning & Maintenance (526 | 3.1%), Healthcare Support (435 | 2.5%), and Firefighting & Prevention (431 | 2.5%).
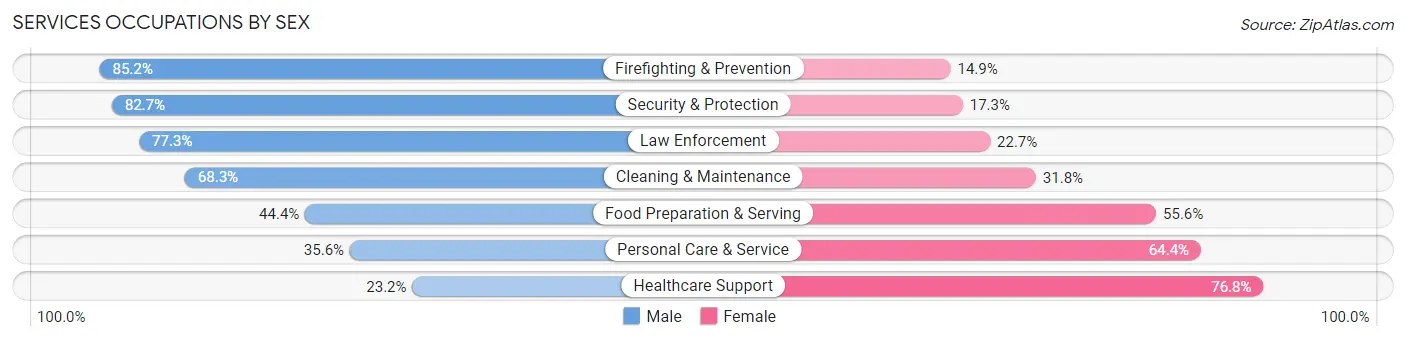
Services Occupations by Sex
Within the Services occupations in Kaneohe, the most male-oriented occupations are Firefighting & Prevention (85.2%), Security & Protection (82.7%), and Law Enforcement (77.3%), while the most female-oriented occupations are Healthcare Support (76.8%), Personal Care & Service (64.4%), and Food Preparation & Serving (55.6%).
| Occupation | Male | Female |
| Healthcare Support | 101 (23.2%) | 334 (76.8%) |
| Security & Protection | 517 (82.7%) | 108 (17.3%) |
| Firefighting & Prevention | 367 (85.2%) | 64 (14.8%) |
| Law Enforcement | 150 (77.3%) | 44 (22.7%) |
| Food Preparation & Serving | 468 (44.4%) | 585 (55.6%) |
| Cleaning & Maintenance | 359 (68.2%) | 167 (31.8%) |
| Personal Care & Service | 95 (35.6%) | 172 (64.4%) |
| Total (Category) | 1,540 (53.0%) | 1,366 (47.0%) |
| Total (Overall) | 8,740 (51.0%) | 8,402 (49.0%) |
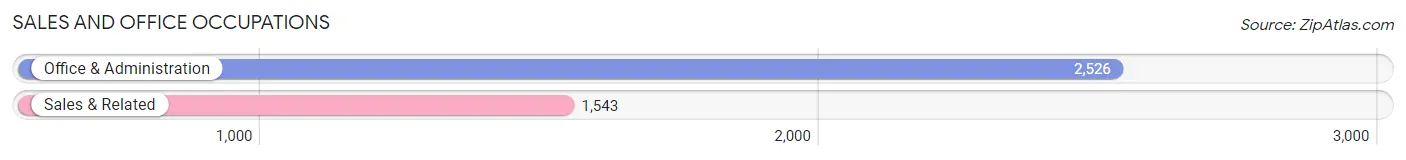
Sales and Office Occupations
The most common Sales and Office occupations in Kaneohe are Office & Administration (2,526 | 14.7%), and Sales & Related (1,543 | 9.0%).
Sales and Office Occupations by Sex
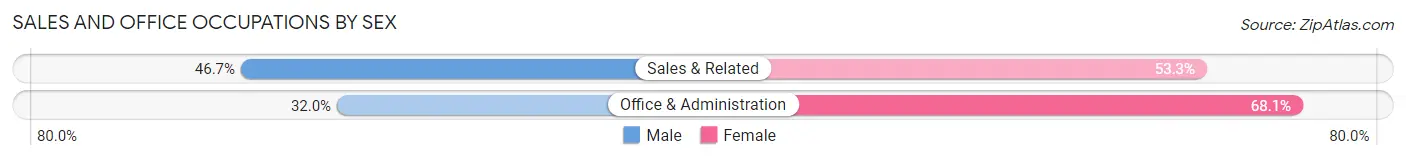
| Occupation | Male | Female |
| Sales & Related | 721 (46.7%) | 822 (53.3%) |
| Office & Administration | 807 (32.0%) | 1,719 (68.0%) |
| Total (Category) | 1,528 (37.6%) | 2,541 (62.5%) |
| Total (Overall) | 8,740 (51.0%) | 8,402 (49.0%) |
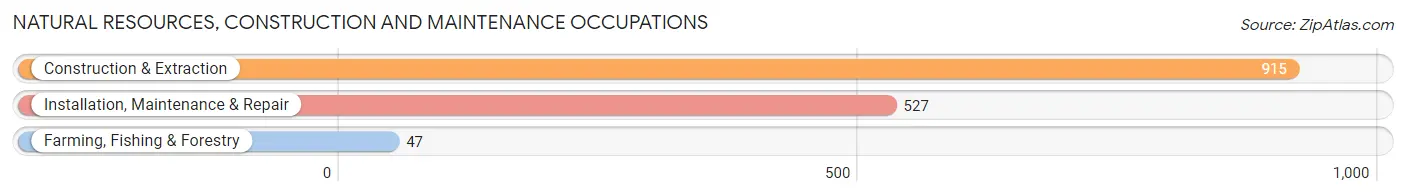
Natural Resources, Construction and Maintenance Occupations
The most common Natural Resources, Construction and Maintenance occupations in Kaneohe are Construction & Extraction (915 | 5.3%), Installation, Maintenance & Repair (527 | 3.1%), and Farming, Fishing & Forestry (47 | 0.3%).
Natural Resources, Construction and Maintenance Occupations by Sex
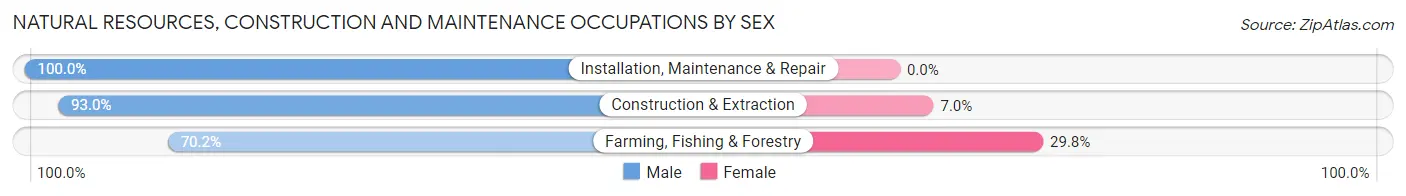
| Occupation | Male | Female |
| Farming, Fishing & Forestry | 33 (70.2%) | 14 (29.8%) |
| Construction & Extraction | 851 (93.0%) | 64 (7.0%) |
| Installation, Maintenance & Repair | 527 (100.0%) | 0 (0.0%) |
| Total (Category) | 1,411 (94.8%) | 78 (5.2%) |
| Total (Overall) | 8,740 (51.0%) | 8,402 (49.0%) |
Production, Transportation and Moving Occupations
The most common Production, Transportation and Moving occupations in Kaneohe are Transportation (696 | 4.1%), Material Moving (455 | 2.6%), and Production (346 | 2.0%).
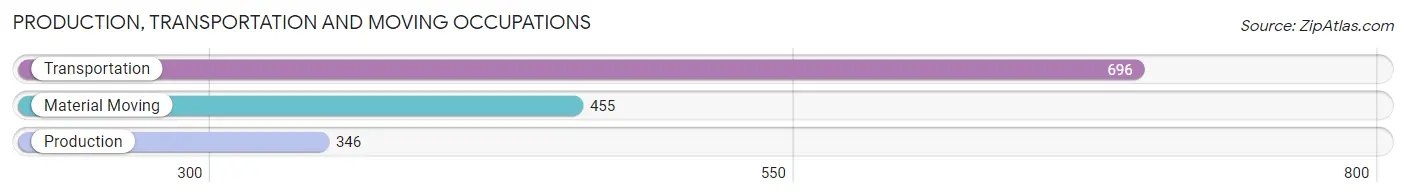
Production, Transportation and Moving Occupations by Sex
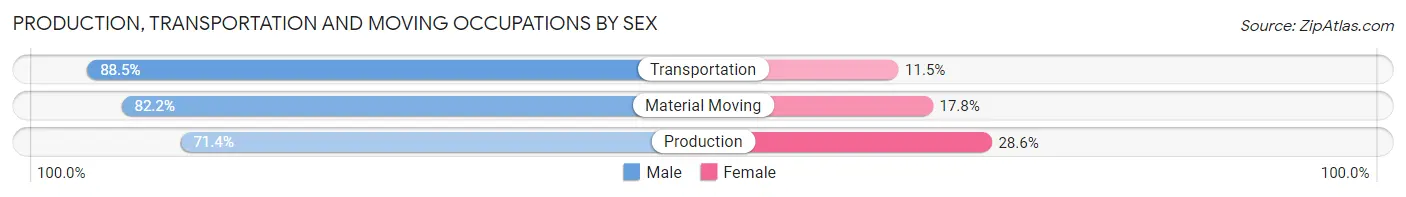
| Occupation | Male | Female |
| Production | 247 (71.4%) | 99 (28.6%) |
| Transportation | 616 (88.5%) | 80 (11.5%) |
| Material Moving | 374 (82.2%) | 81 (17.8%) |
| Total (Category) | 1,237 (82.6%) | 260 (17.4%) |
| Total (Overall) | 8,740 (51.0%) | 8,402 (49.0%) |
Employment Industries by Sex in Kaneohe
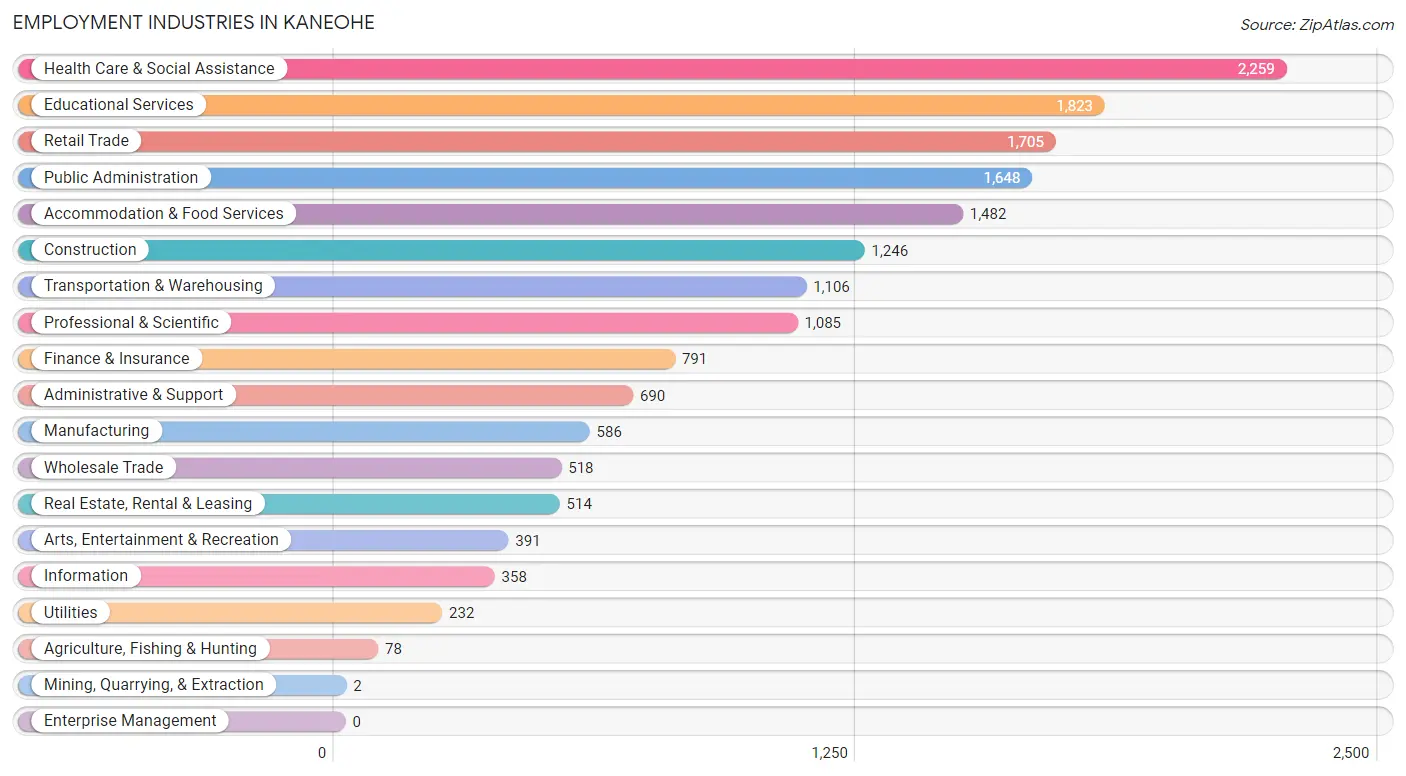
Employment Industries in Kaneohe
The major employment industries in Kaneohe include Health Care & Social Assistance (2,259 | 13.2%), Educational Services (1,823 | 10.6%), Retail Trade (1,705 | 10.0%), Public Administration (1,648 | 9.6%), and Accommodation & Food Services (1,482 | 8.6%).
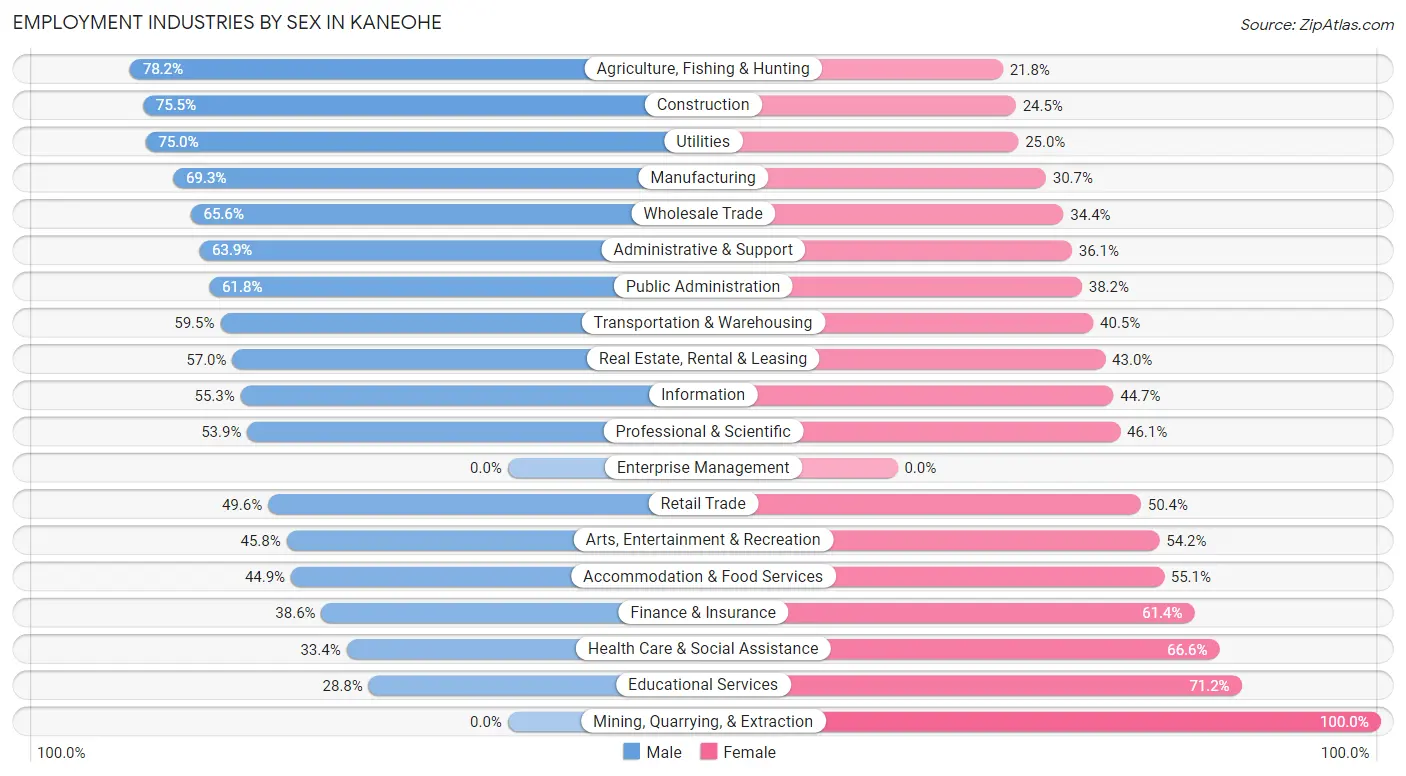
Employment Industries by Sex in Kaneohe
The Kaneohe industries that see more men than women are Agriculture, Fishing & Hunting (78.2%), Construction (75.5%), and Utilities (75.0%), whereas the industries that tend to have a higher number of women are Mining, Quarrying, & Extraction (100.0%), Educational Services (71.2%), and Health Care & Social Assistance (66.6%).
| Industry | Male | Female |
| Agriculture, Fishing & Hunting | 61 (78.2%) | 17 (21.8%) |
| Mining, Quarrying, & Extraction | 0 (0.0%) | 2 (100.0%) |
| Construction | 941 (75.5%) | 305 (24.5%) |
| Manufacturing | 406 (69.3%) | 180 (30.7%) |
| Wholesale Trade | 340 (65.6%) | 178 (34.4%) |
| Retail Trade | 846 (49.6%) | 859 (50.4%) |
| Transportation & Warehousing | 658 (59.5%) | 448 (40.5%) |
| Utilities | 174 (75.0%) | 58 (25.0%) |
| Information | 198 (55.3%) | 160 (44.7%) |
| Finance & Insurance | 305 (38.6%) | 486 (61.4%) |
| Real Estate, Rental & Leasing | 293 (57.0%) | 221 (43.0%) |
| Professional & Scientific | 585 (53.9%) | 500 (46.1%) |
| Enterprise Management | 0 (0.0%) | 0 (0.0%) |
| Administrative & Support | 441 (63.9%) | 249 (36.1%) |
| Educational Services | 525 (28.8%) | 1,298 (71.2%) |
| Health Care & Social Assistance | 754 (33.4%) | 1,505 (66.6%) |
| Arts, Entertainment & Recreation | 179 (45.8%) | 212 (54.2%) |
| Accommodation & Food Services | 665 (44.9%) | 817 (55.1%) |
| Public Administration | 1,019 (61.8%) | 629 (38.2%) |
| Total | 8,740 (51.0%) | 8,402 (49.0%) |
Education in Kaneohe
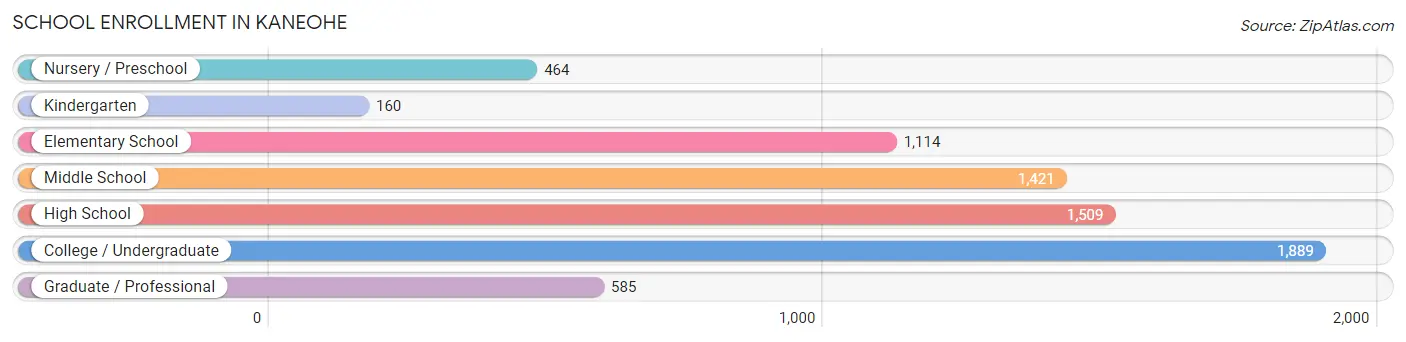
School Enrollment in Kaneohe
The most common levels of schooling among the 7,142 students in Kaneohe are college / undergraduate (1,889 | 26.5%), high school (1,509 | 21.1%), and middle school (1,421 | 19.9%).
| School Level | # Students | % Students |
| Nursery / Preschool | 464 | 6.5% |
| Kindergarten | 160 | 2.2% |
| Elementary School | 1,114 | 15.6% |
| Middle School | 1,421 | 19.9% |
| High School | 1,509 | 21.1% |
| College / Undergraduate | 1,889 | 26.5% |
| Graduate / Professional | 585 | 8.2% |
| Total | 7,142 | 100.0% |
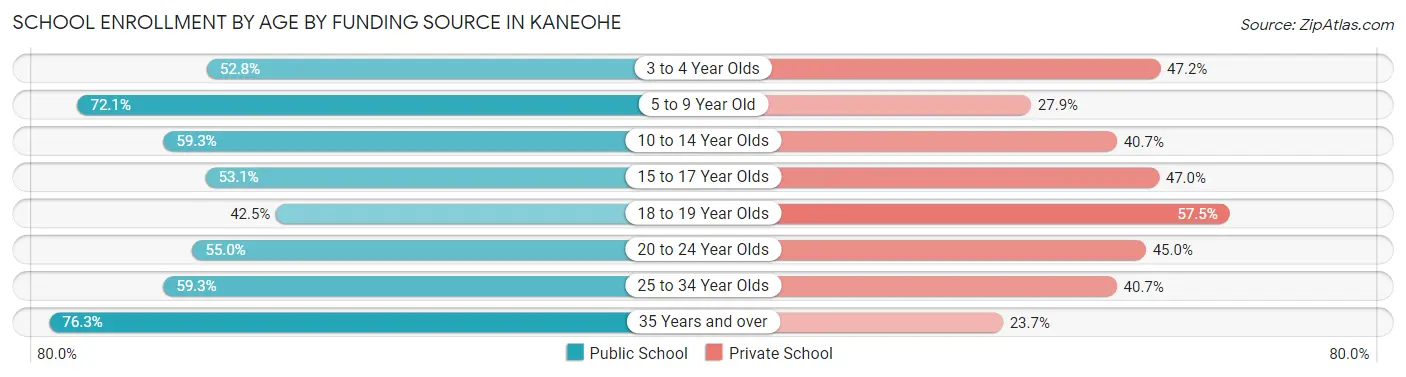
School Enrollment by Age by Funding Source in Kaneohe
Out of a total of 7,142 students who are enrolled in schools in Kaneohe, 2,821 (39.5%) attend a private institution, while the remaining 4,321 (60.5%) are enrolled in public schools. The age group of 18 to 19 year olds has the highest likelihood of being enrolled in private schools, with 334 (57.5% in the age bracket) enrolled. Conversely, the age group of 35 years and over has the lowest likelihood of being enrolled in a private school, with 618 (76.3% in the age bracket) attending a public institution.
| Age Bracket | Public School | Private School |
| 3 to 4 Year Olds | 177 (52.8%) | 158 (47.2%) |
| 5 to 9 Year Old | 956 (72.1%) | 370 (27.9%) |
| 10 to 14 Year Olds | 1,016 (59.3%) | 697 (40.7%) |
| 15 to 17 Year Olds | 540 (53.0%) | 478 (46.9%) |
| 18 to 19 Year Olds | 247 (42.5%) | 334 (57.5%) |
| 20 to 24 Year Olds | 485 (55.0%) | 397 (45.0%) |
| 25 to 34 Year Olds | 283 (59.3%) | 194 (40.7%) |
| 35 Years and over | 618 (76.3%) | 192 (23.7%) |
| Total | 4,321 (60.5%) | 2,821 (39.5%) |
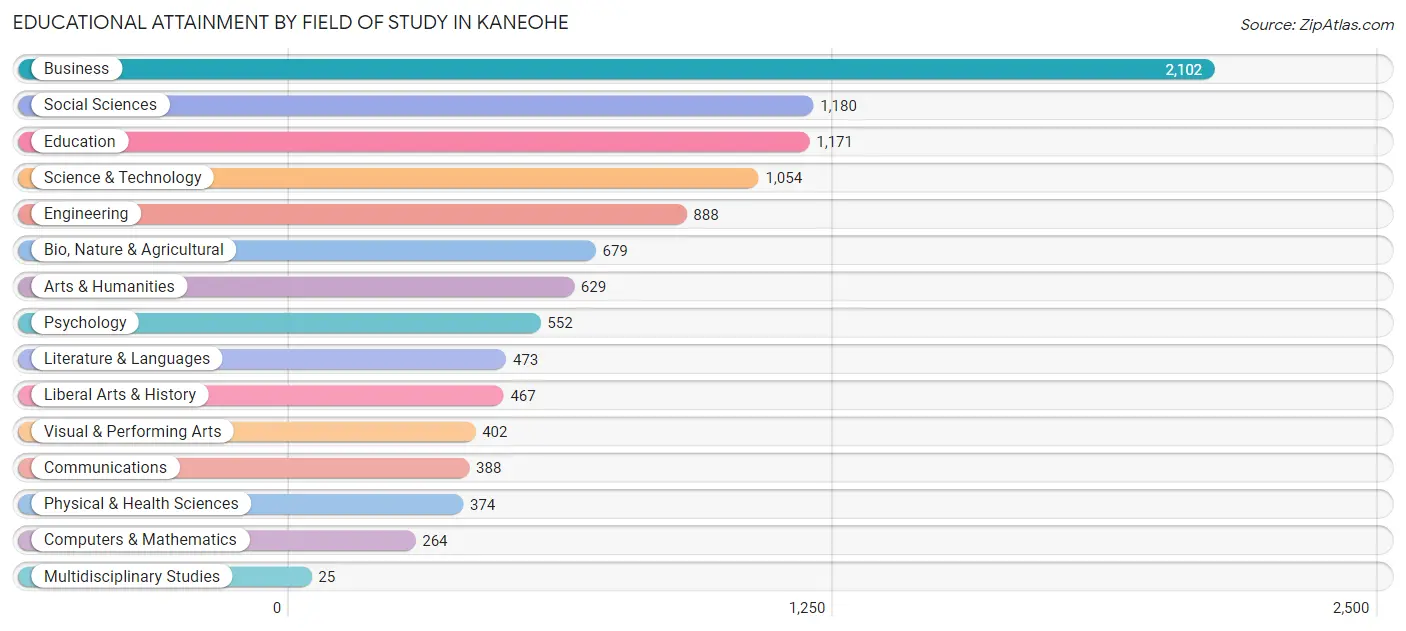
Educational Attainment by Field of Study in Kaneohe
Business (2,102 | 19.7%), social sciences (1,180 | 11.1%), education (1,171 | 11.0%), science & technology (1,054 | 9.9%), and engineering (888 | 8.3%) are the most common fields of study among 10,648 individuals in Kaneohe who have obtained a bachelor's degree or higher.
| Field of Study | # Graduates | % Graduates |
| Computers & Mathematics | 264 | 2.5% |
| Bio, Nature & Agricultural | 679 | 6.4% |
| Physical & Health Sciences | 374 | 3.5% |
| Psychology | 552 | 5.2% |
| Social Sciences | 1,180 | 11.1% |
| Engineering | 888 | 8.3% |
| Multidisciplinary Studies | 25 | 0.2% |
| Science & Technology | 1,054 | 9.9% |
| Business | 2,102 | 19.7% |
| Education | 1,171 | 11.0% |
| Literature & Languages | 473 | 4.4% |
| Liberal Arts & History | 467 | 4.4% |
| Visual & Performing Arts | 402 | 3.8% |
| Communications | 388 | 3.6% |
| Arts & Humanities | 629 | 5.9% |
| Total | 10,648 | 100.0% |
Transportation & Commute in Kaneohe
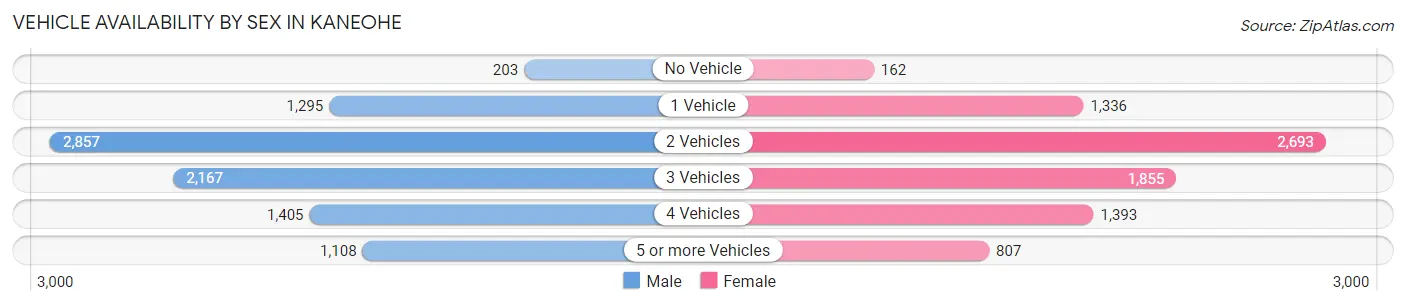
Vehicle Availability by Sex in Kaneohe
The most prevalent vehicle ownership categories in Kaneohe are males with 2 vehicles (2,857, accounting for 31.6%) and females with 2 vehicles (2,693, making up 34.6%).
| Vehicles Available | Male | Female |
| No Vehicle | 203 (2.2%) | 162 (2.0%) |
| 1 Vehicle | 1,295 (14.3%) | 1,336 (16.2%) |
| 2 Vehicles | 2,857 (31.6%) | 2,693 (32.7%) |
| 3 Vehicles | 2,167 (24.0%) | 1,855 (22.5%) |
| 4 Vehicles | 1,405 (15.5%) | 1,393 (16.9%) |
| 5 or more Vehicles | 1,108 (12.3%) | 807 (9.8%) |
| Total | 9,035 (100.0%) | 8,246 (100.0%) |
Commute Time in Kaneohe
The most frequently occuring commute durations in Kaneohe are 30 to 34 minutes (3,586 commuters, 22.8%), 20 to 24 minutes (2,824 commuters, 17.9%), and 45 to 59 minutes (1,628 commuters, 10.3%).
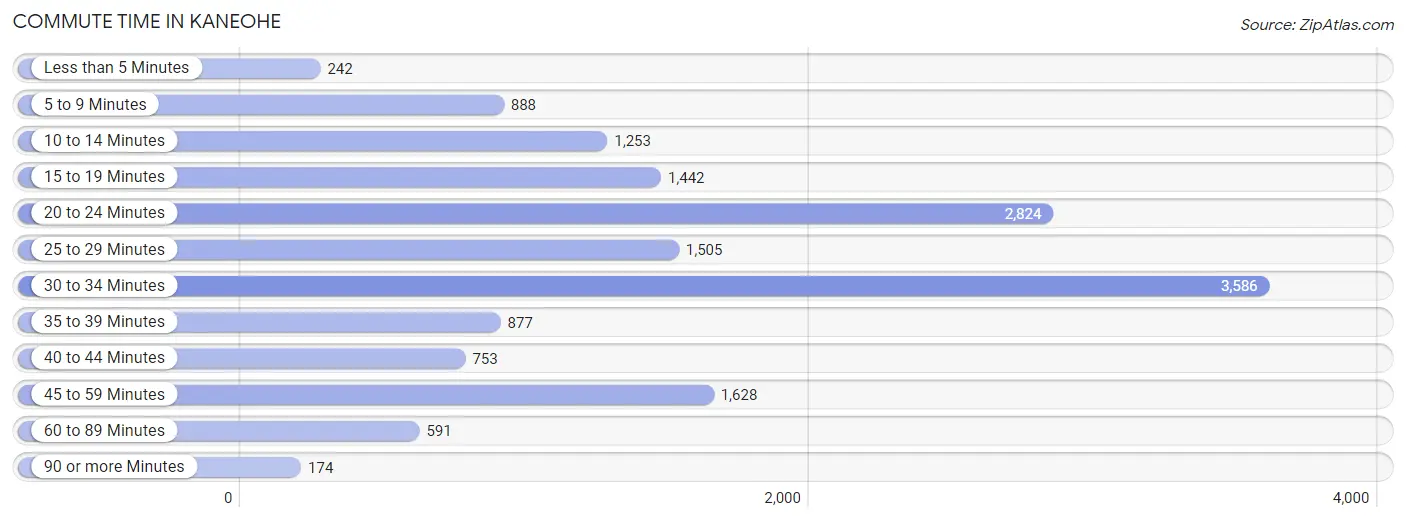
| Commute Time | # Commuters | % Commuters |
| Less than 5 Minutes | 242 | 1.5% |
| 5 to 9 Minutes | 888 | 5.6% |
| 10 to 14 Minutes | 1,253 | 8.0% |
| 15 to 19 Minutes | 1,442 | 9.1% |
| 20 to 24 Minutes | 2,824 | 17.9% |
| 25 to 29 Minutes | 1,505 | 9.6% |
| 30 to 34 Minutes | 3,586 | 22.8% |
| 35 to 39 Minutes | 877 | 5.6% |
| 40 to 44 Minutes | 753 | 4.8% |
| 45 to 59 Minutes | 1,628 | 10.3% |
| 60 to 89 Minutes | 591 | 3.7% |
| 90 or more Minutes | 174 | 1.1% |
Commute Time by Sex in Kaneohe
The most common commute times in Kaneohe are 30 to 34 minutes (2,081 commuters, 24.7%) for males and 30 to 34 minutes (1,505 commuters, 20.5%) for females.
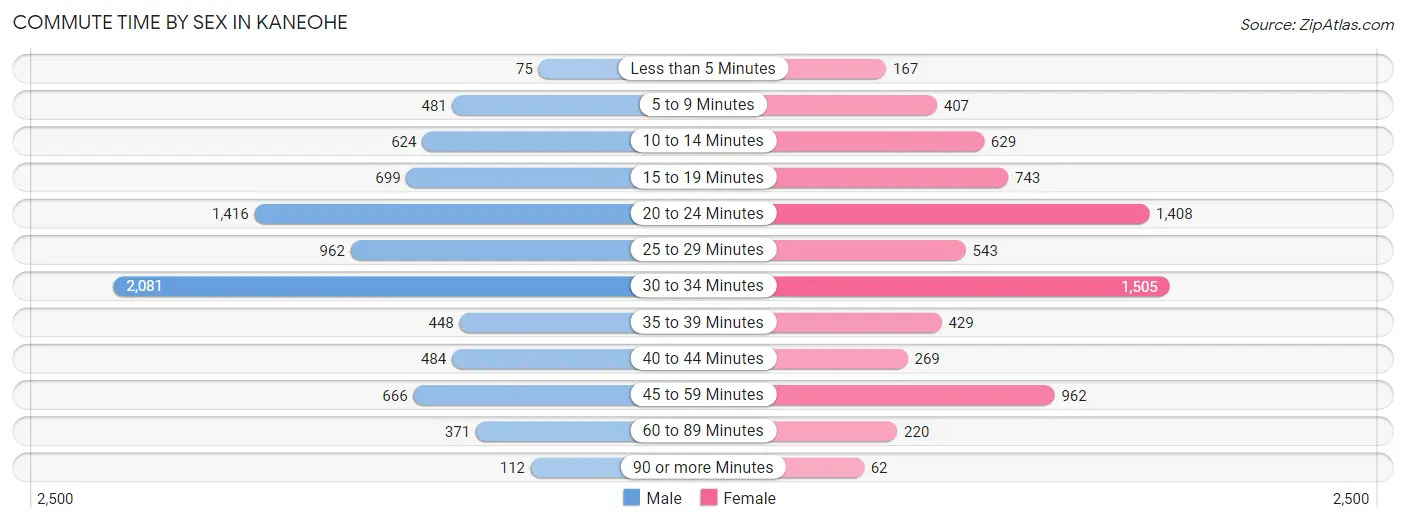
| Commute Time | Male | Female |
| Less than 5 Minutes | 75 (0.9%) | 167 (2.3%) |
| 5 to 9 Minutes | 481 (5.7%) | 407 (5.5%) |
| 10 to 14 Minutes | 624 (7.4%) | 629 (8.6%) |
| 15 to 19 Minutes | 699 (8.3%) | 743 (10.1%) |
| 20 to 24 Minutes | 1,416 (16.8%) | 1,408 (19.2%) |
| 25 to 29 Minutes | 962 (11.4%) | 543 (7.4%) |
| 30 to 34 Minutes | 2,081 (24.7%) | 1,505 (20.5%) |
| 35 to 39 Minutes | 448 (5.3%) | 429 (5.8%) |
| 40 to 44 Minutes | 484 (5.8%) | 269 (3.7%) |
| 45 to 59 Minutes | 666 (7.9%) | 962 (13.1%) |
| 60 to 89 Minutes | 371 (4.4%) | 220 (3.0%) |
| 90 or more Minutes | 112 (1.3%) | 62 (0.8%) |
Time of Departure to Work by Sex in Kaneohe
The most frequent times of departure to work in Kaneohe are 7:00 AM to 7:29 AM (1,526, 18.1%) for males and 7:00 AM to 7:29 AM (1,530, 20.8%) for females.
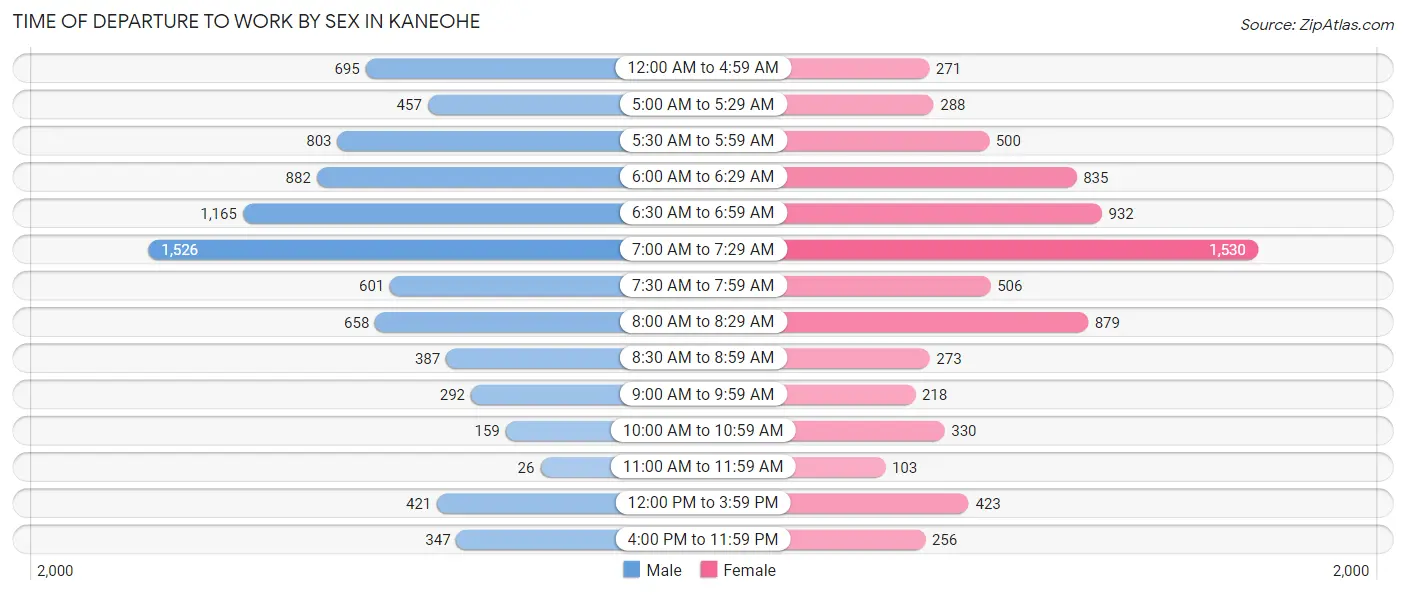
| Time of Departure | Male | Female |
| 12:00 AM to 4:59 AM | 695 (8.3%) | 271 (3.7%) |
| 5:00 AM to 5:29 AM | 457 (5.4%) | 288 (3.9%) |
| 5:30 AM to 5:59 AM | 803 (9.5%) | 500 (6.8%) |
| 6:00 AM to 6:29 AM | 882 (10.5%) | 835 (11.4%) |
| 6:30 AM to 6:59 AM | 1,165 (13.8%) | 932 (12.7%) |
| 7:00 AM to 7:29 AM | 1,526 (18.1%) | 1,530 (20.8%) |
| 7:30 AM to 7:59 AM | 601 (7.1%) | 506 (6.9%) |
| 8:00 AM to 8:29 AM | 658 (7.8%) | 879 (12.0%) |
| 8:30 AM to 8:59 AM | 387 (4.6%) | 273 (3.7%) |
| 9:00 AM to 9:59 AM | 292 (3.5%) | 218 (3.0%) |
| 10:00 AM to 10:59 AM | 159 (1.9%) | 330 (4.5%) |
| 11:00 AM to 11:59 AM | 26 (0.3%) | 103 (1.4%) |
| 12:00 PM to 3:59 PM | 421 (5.0%) | 423 (5.8%) |
| 4:00 PM to 11:59 PM | 347 (4.1%) | 256 (3.5%) |
| Total | 8,419 (100.0%) | 7,344 (100.0%) |
Housing Occupancy in Kaneohe
Occupancy by Ownership in Kaneohe
Of the total 11,285 dwellings in Kaneohe, owner-occupied units account for 8,461 (75.0%), while renter-occupied units make up 2,824 (25.0%).
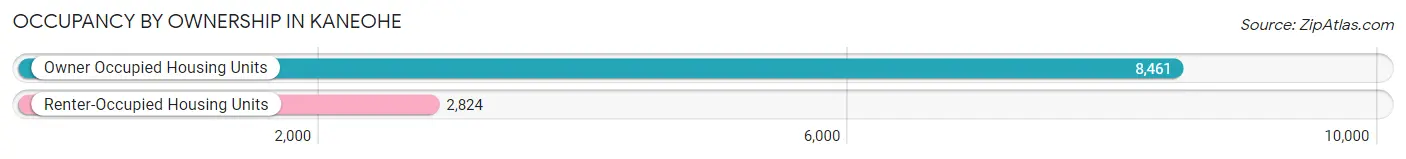
| Occupancy | # Housing Units | % Housing Units |
| Owner Occupied Housing Units | 8,461 | 75.0% |
| Renter-Occupied Housing Units | 2,824 | 25.0% |
| Total Occupied Housing Units | 11,285 | 100.0% |
Occupancy by Household Size in Kaneohe
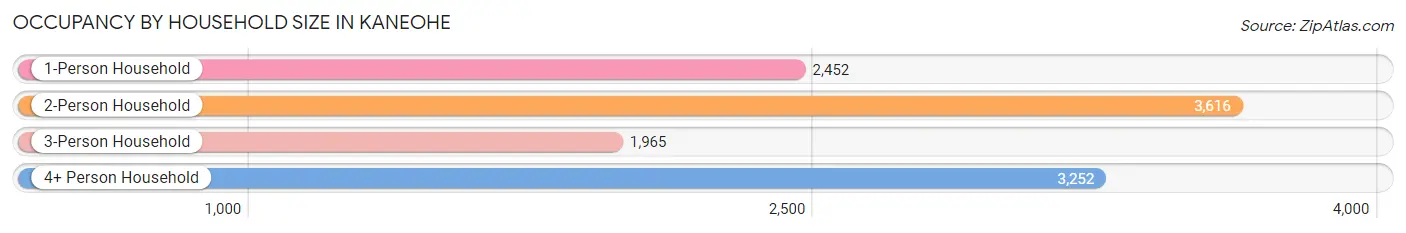
| Household Size | # Housing Units | % Housing Units |
| 1-Person Household | 2,452 | 21.7% |
| 2-Person Household | 3,616 | 32.0% |
| 3-Person Household | 1,965 | 17.4% |
| 4+ Person Household | 3,252 | 28.8% |
| Total Housing Units | 11,285 | 100.0% |
Occupancy by Ownership by Household Size in Kaneohe
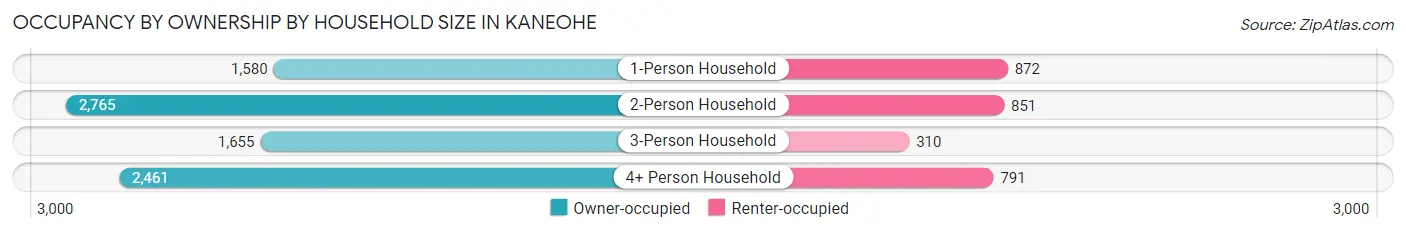
| Household Size | Owner-occupied | Renter-occupied |
| 1-Person Household | 1,580 (64.4%) | 872 (35.6%) |
| 2-Person Household | 2,765 (76.5%) | 851 (23.5%) |
| 3-Person Household | 1,655 (84.2%) | 310 (15.8%) |
| 4+ Person Household | 2,461 (75.7%) | 791 (24.3%) |
| Total Housing Units | 8,461 (75.0%) | 2,824 (25.0%) |
Occupancy by Educational Attainment in Kaneohe
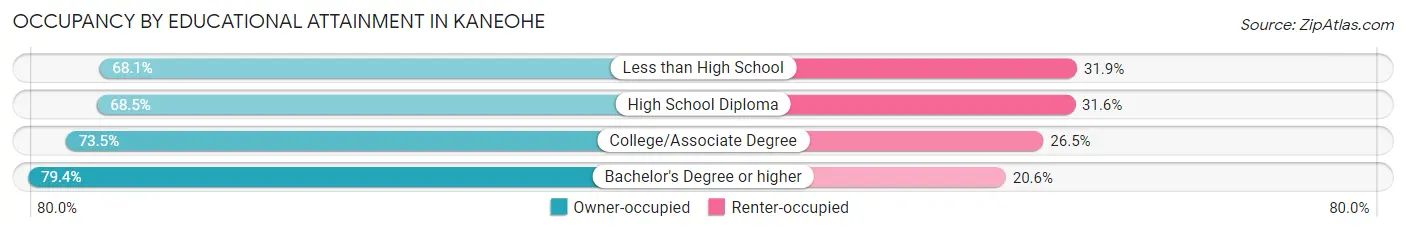
| Household Size | Owner-occupied | Renter-occupied |
| Less than High School | 278 (68.1%) | 130 (31.9%) |
| High School Diploma | 1,538 (68.4%) | 709 (31.6%) |
| College/Associate Degree | 2,589 (73.5%) | 935 (26.5%) |
| Bachelor's Degree or higher | 4,056 (79.4%) | 1,050 (20.6%) |
Occupancy by Age of Householder in Kaneohe
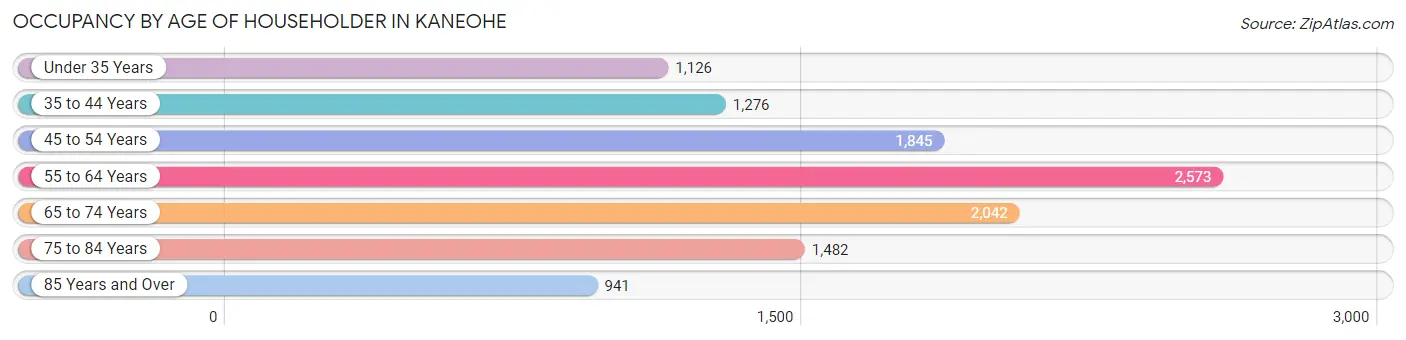
| Age Bracket | # Households | % Households |
| Under 35 Years | 1,126 | 10.0% |
| 35 to 44 Years | 1,276 | 11.3% |
| 45 to 54 Years | 1,845 | 16.4% |
| 55 to 64 Years | 2,573 | 22.8% |
| 65 to 74 Years | 2,042 | 18.1% |
| 75 to 84 Years | 1,482 | 13.1% |
| 85 Years and Over | 941 | 8.3% |
| Total | 11,285 | 100.0% |
Housing Finances in Kaneohe
Median Income by Occupancy in Kaneohe
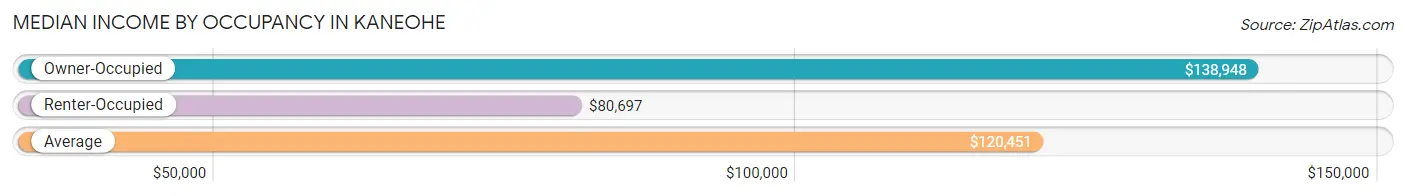
| Occupancy Type | # Households | Median Income |
| Owner-Occupied | 8,461 (75.0%) | $138,948 |
| Renter-Occupied | 2,824 (25.0%) | $80,697 |
| Average | 11,285 (100.0%) | $120,451 |
Occupancy by Householder Income Bracket in Kaneohe
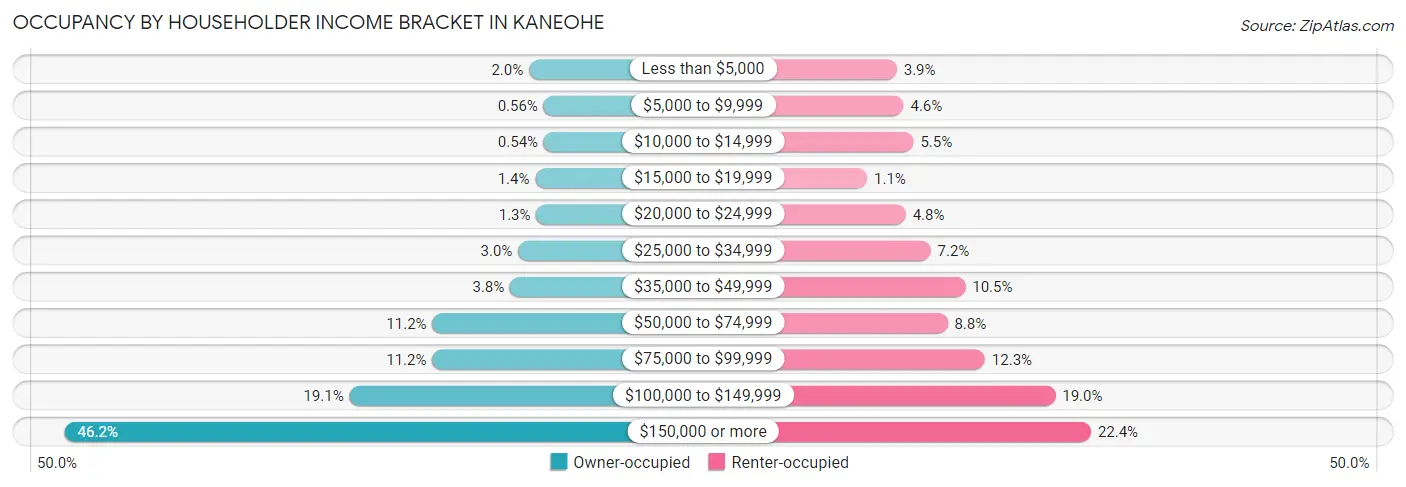
| Income Bracket | Owner-occupied | Renter-occupied |
| Less than $5,000 | 166 (2.0%) | 111 (3.9%) |
| $5,000 to $9,999 | 47 (0.6%) | 129 (4.6%) |
| $10,000 to $14,999 | 46 (0.5%) | 156 (5.5%) |
| $15,000 to $19,999 | 115 (1.4%) | 31 (1.1%) |
| $20,000 to $24,999 | 107 (1.3%) | 135 (4.8%) |
| $25,000 to $34,999 | 253 (3.0%) | 202 (7.1%) |
| $35,000 to $49,999 | 318 (3.8%) | 295 (10.4%) |
| $50,000 to $74,999 | 944 (11.2%) | 247 (8.7%) |
| $75,000 to $99,999 | 945 (11.2%) | 348 (12.3%) |
| $100,000 to $149,999 | 1,613 (19.1%) | 537 (19.0%) |
| $150,000 or more | 3,907 (46.2%) | 633 (22.4%) |
| Total | 8,461 (100.0%) | 2,824 (100.0%) |
Monthly Housing Cost Tiers in Kaneohe
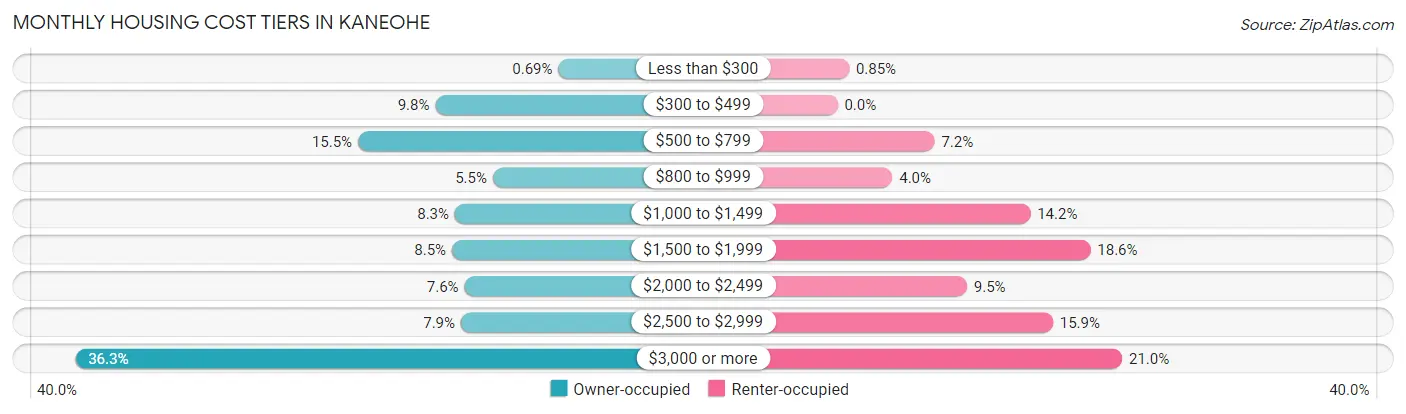
| Monthly Cost | Owner-occupied | Renter-occupied |
| Less than $300 | 58 (0.7%) | 24 (0.9%) |
| $300 to $499 | 825 (9.8%) | 0 (0.0%) |
| $500 to $799 | 1,307 (15.4%) | 202 (7.1%) |
| $800 to $999 | 467 (5.5%) | 114 (4.0%) |
| $1,000 to $1,499 | 703 (8.3%) | 401 (14.2%) |
| $1,500 to $1,999 | 722 (8.5%) | 526 (18.6%) |
| $2,000 to $2,499 | 644 (7.6%) | 269 (9.5%) |
| $2,500 to $2,999 | 666 (7.9%) | 448 (15.9%) |
| $3,000 or more | 3,069 (36.3%) | 592 (21.0%) |
| Total | 8,461 (100.0%) | 2,824 (100.0%) |
Physical Housing Characteristics in Kaneohe
Housing Structures in Kaneohe
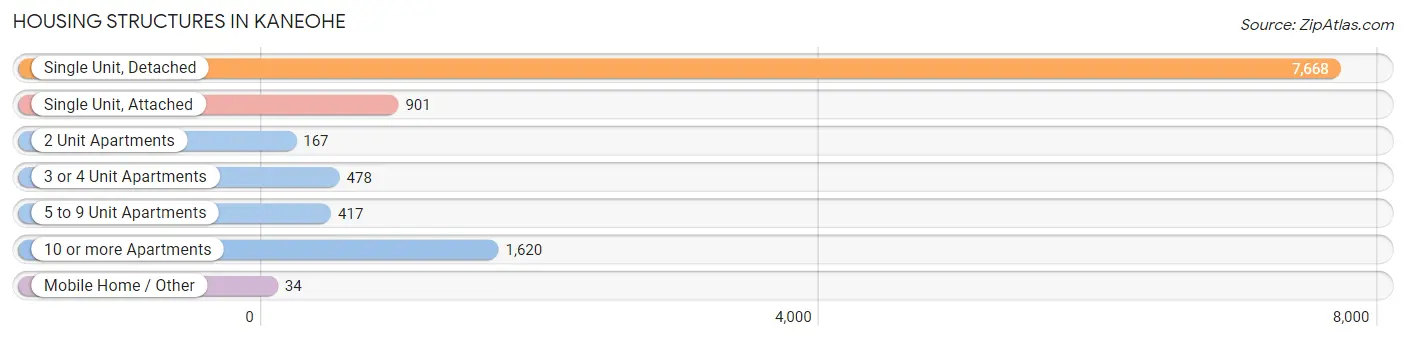
| Structure Type | # Housing Units | % Housing Units |
| Single Unit, Detached | 7,668 | 67.9% |
| Single Unit, Attached | 901 | 8.0% |
| 2 Unit Apartments | 167 | 1.5% |
| 3 or 4 Unit Apartments | 478 | 4.2% |
| 5 to 9 Unit Apartments | 417 | 3.7% |
| 10 or more Apartments | 1,620 | 14.4% |
| Mobile Home / Other | 34 | 0.3% |
| Total | 11,285 | 100.0% |
Housing Structures by Occupancy in Kaneohe
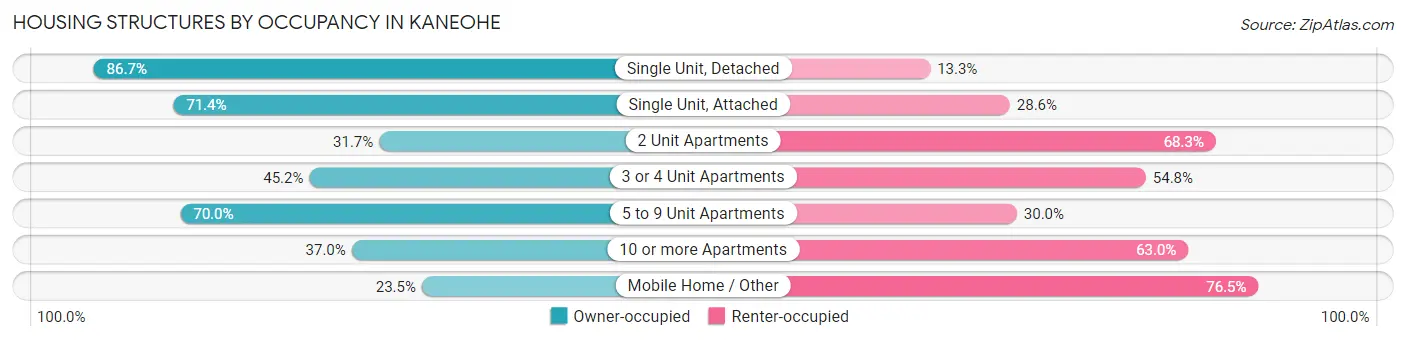
| Structure Type | Owner-occupied | Renter-occupied |
| Single Unit, Detached | 6,649 (86.7%) | 1,019 (13.3%) |
| Single Unit, Attached | 643 (71.4%) | 258 (28.6%) |
| 2 Unit Apartments | 53 (31.7%) | 114 (68.3%) |
| 3 or 4 Unit Apartments | 216 (45.2%) | 262 (54.8%) |
| 5 to 9 Unit Apartments | 292 (70.0%) | 125 (30.0%) |
| 10 or more Apartments | 600 (37.0%) | 1,020 (63.0%) |
| Mobile Home / Other | 8 (23.5%) | 26 (76.5%) |
| Total | 8,461 (75.0%) | 2,824 (25.0%) |
Housing Structures by Number of Rooms in Kaneohe
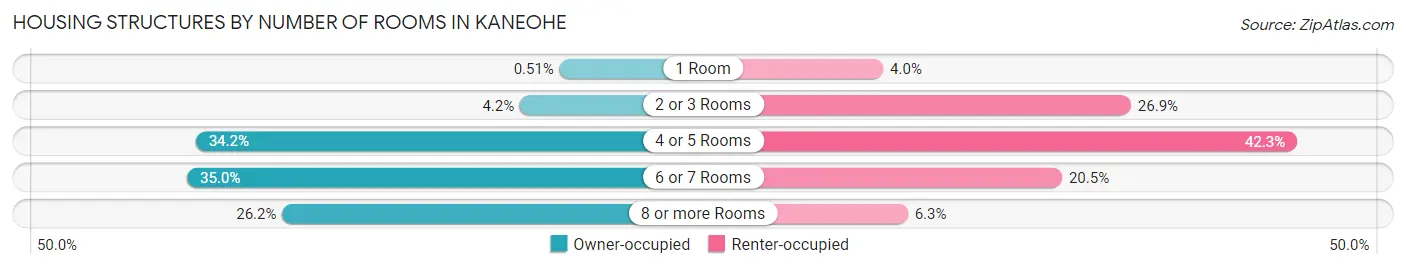
| Number of Rooms | Owner-occupied | Renter-occupied |
| 1 Room | 43 (0.5%) | 113 (4.0%) |
| 2 or 3 Rooms | 354 (4.2%) | 760 (26.9%) |
| 4 or 5 Rooms | 2,891 (34.2%) | 1,194 (42.3%) |
| 6 or 7 Rooms | 2,959 (35.0%) | 580 (20.5%) |
| 8 or more Rooms | 2,214 (26.2%) | 177 (6.3%) |
| Total | 8,461 (100.0%) | 2,824 (100.0%) |
Housing Structure by Heating Type in Kaneohe
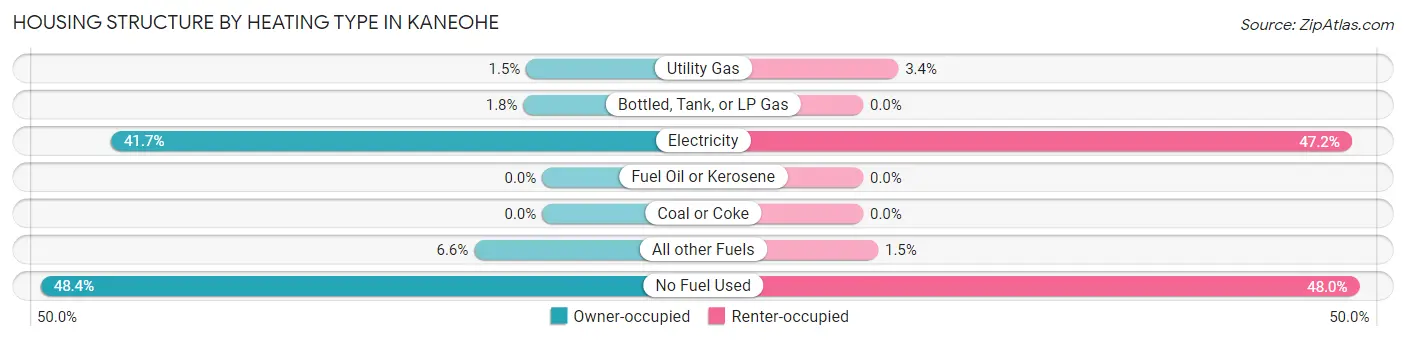
| Heating Type | Owner-occupied | Renter-occupied |
| Utility Gas | 130 (1.5%) | 96 (3.4%) |
| Bottled, Tank, or LP Gas | 153 (1.8%) | 0 (0.0%) |
| Electricity | 3,524 (41.6%) | 1,333 (47.2%) |
| Fuel Oil or Kerosene | 0 (0.0%) | 0 (0.0%) |
| Coal or Coke | 0 (0.0%) | 0 (0.0%) |
| All other Fuels | 556 (6.6%) | 41 (1.5%) |
| No Fuel Used | 4,098 (48.4%) | 1,354 (47.9%) |
| Total | 8,461 (100.0%) | 2,824 (100.0%) |
Household Vehicle Usage in Kaneohe
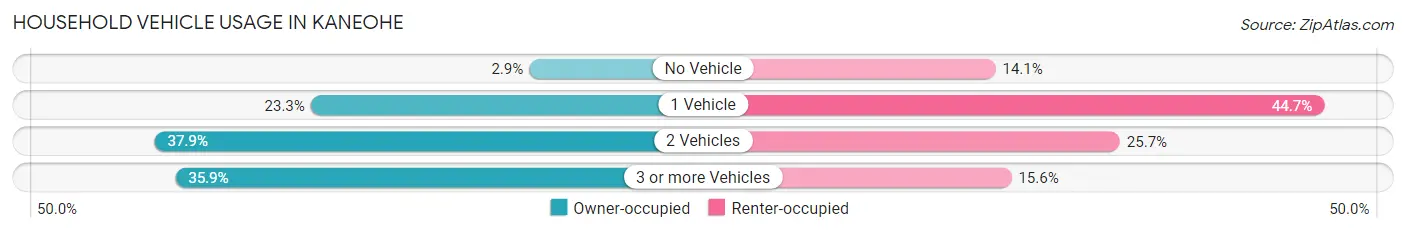
| Vehicles per Household | Owner-occupied | Renter-occupied |
| No Vehicle | 246 (2.9%) | 397 (14.1%) |
| 1 Vehicle | 1,971 (23.3%) | 1,263 (44.7%) |
| 2 Vehicles | 3,204 (37.9%) | 725 (25.7%) |
| 3 or more Vehicles | 3,040 (35.9%) | 439 (15.5%) |
| Total | 8,461 (100.0%) | 2,824 (100.0%) |
Real Estate & Mortgages in Kaneohe
Real Estate and Mortgage Overview in Kaneohe
| Characteristic | Without Mortgage | With Mortgage |
| Housing Units | 3,065 | 5,396 |
| Median Property Value | $896,700 | $975,600 |
| Median Household Income | $97,374 | $2,919 |
| Monthly Housing Costs | $648 | $3,069 |
| Real Estate Taxes | $2,553 | $179 |
Property Value by Mortgage Status in Kaneohe
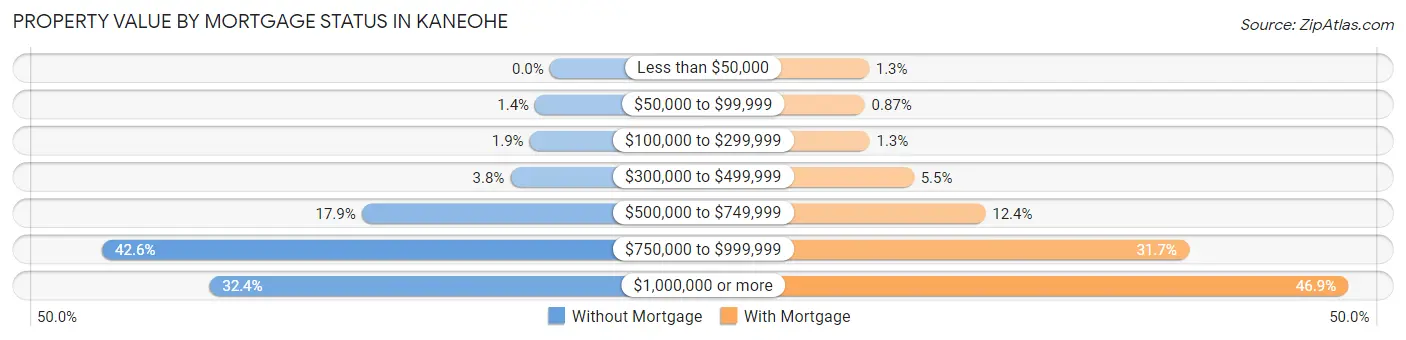
| Property Value | Without Mortgage | With Mortgage |
| Less than $50,000 | 0 (0.0%) | 68 (1.3%) |
| $50,000 to $99,999 | 43 (1.4%) | 47 (0.9%) |
| $100,000 to $299,999 | 59 (1.9%) | 72 (1.3%) |
| $300,000 to $499,999 | 115 (3.7%) | 299 (5.5%) |
| $500,000 to $749,999 | 549 (17.9%) | 667 (12.4%) |
| $750,000 to $999,999 | 1,306 (42.6%) | 1,712 (31.7%) |
| $1,000,000 or more | 993 (32.4%) | 2,531 (46.9%) |
| Total | 3,065 (100.0%) | 5,396 (100.0%) |
Household Income by Mortgage Status in Kaneohe
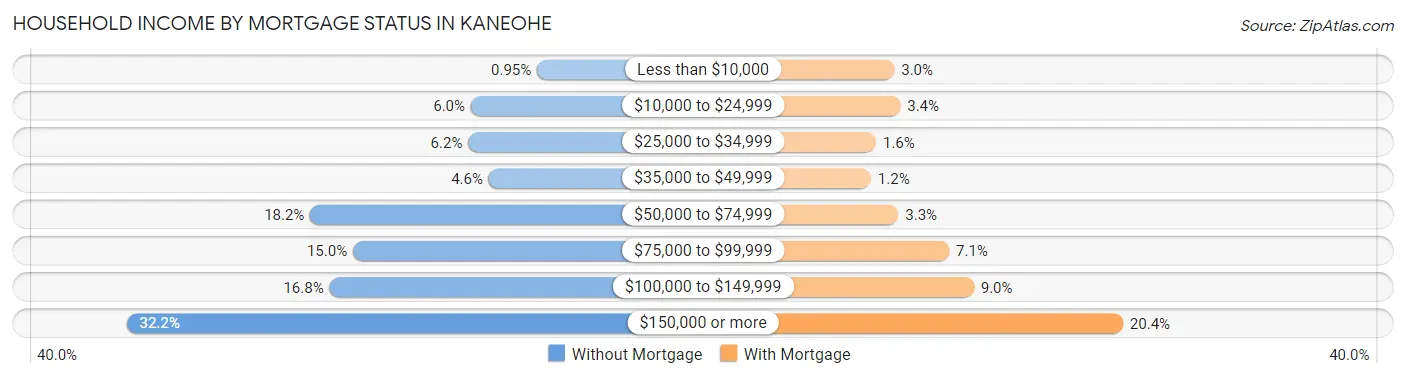
| Household Income | Without Mortgage | With Mortgage |
| Less than $10,000 | 29 (0.9%) | 159 (2.9%) |
| $10,000 to $24,999 | 184 (6.0%) | 184 (3.4%) |
| $25,000 to $34,999 | 190 (6.2%) | 84 (1.6%) |
| $35,000 to $49,999 | 142 (4.6%) | 63 (1.2%) |
| $50,000 to $74,999 | 559 (18.2%) | 176 (3.3%) |
| $75,000 to $99,999 | 459 (15.0%) | 385 (7.1%) |
| $100,000 to $149,999 | 514 (16.8%) | 486 (9.0%) |
| $150,000 or more | 988 (32.2%) | 1,099 (20.4%) |
| Total | 3,065 (100.0%) | 5,396 (100.0%) |
Property Value to Household Income Ratio in Kaneohe
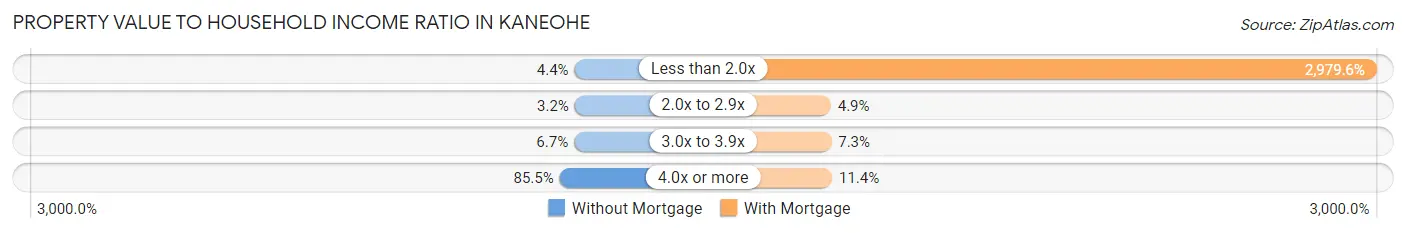
| Value-to-Income Ratio | Without Mortgage | With Mortgage |
| Less than 2.0x | 134 (4.4%) | 160,779 (2,979.6%) |
| 2.0x to 2.9x | 97 (3.2%) | 263 (4.9%) |
| 3.0x to 3.9x | 204 (6.7%) | 395 (7.3%) |
| 4.0x or more | 2,621 (85.5%) | 616 (11.4%) |
| Total | 3,065 (100.0%) | 5,396 (100.0%) |
Real Estate Taxes by Mortgage Status in Kaneohe
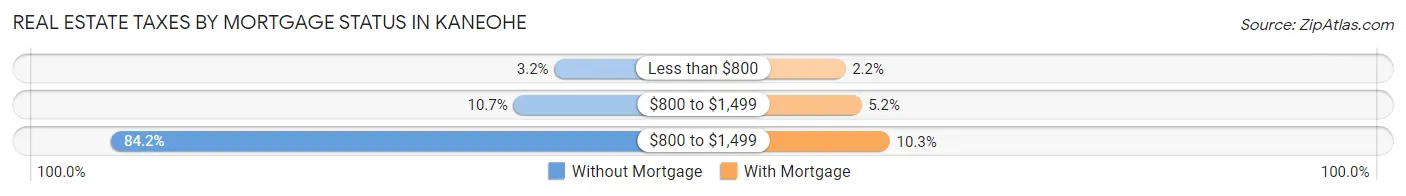
| Property Taxes | Without Mortgage | With Mortgage |
| Less than $800 | 99 (3.2%) | 120 (2.2%) |
| $800 to $1,499 | 328 (10.7%) | 278 (5.1%) |
| $800 to $1,499 | 2,580 (84.2%) | 557 (10.3%) |
| Total | 3,065 (100.0%) | 5,396 (100.0%) |
Health & Disability in Kaneohe
Health Insurance Coverage by Age in Kaneohe
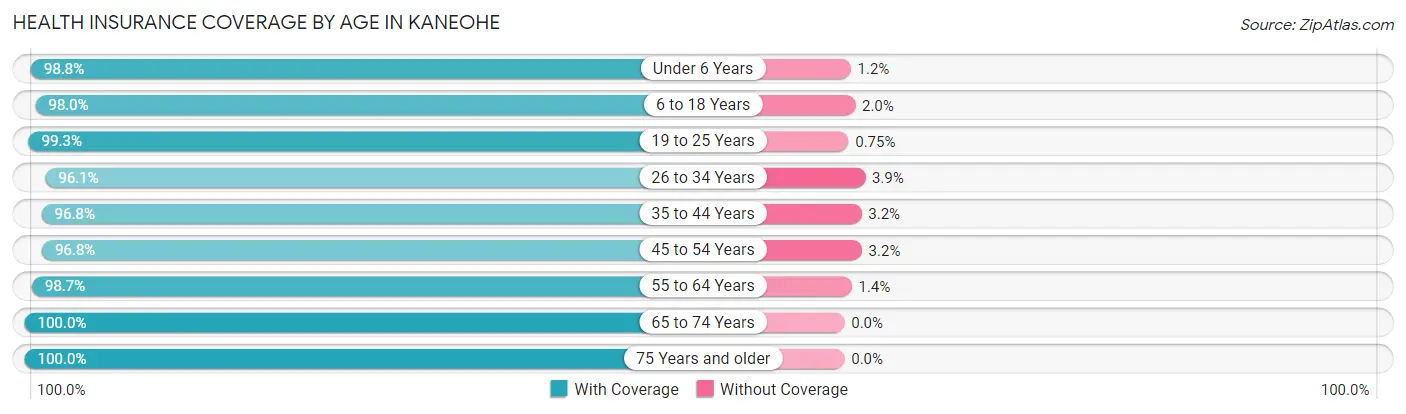
| Age Bracket | With Coverage | Without Coverage |
| Under 6 Years | 2,185 (98.8%) | 26 (1.2%) |
| 6 to 18 Years | 4,210 (98.0%) | 86 (2.0%) |
| 19 to 25 Years | 2,515 (99.3%) | 19 (0.7%) |
| 26 to 34 Years | 3,839 (96.1%) | 154 (3.9%) |
| 35 to 44 Years | 3,836 (96.8%) | 126 (3.2%) |
| 45 to 54 Years | 3,649 (96.8%) | 122 (3.2%) |
| 55 to 64 Years | 5,187 (98.7%) | 71 (1.3%) |
| 65 to 74 Years | 4,015 (100.0%) | 0 (0.0%) |
| 75 Years and older | 4,165 (100.0%) | 0 (0.0%) |
| Total | 33,601 (98.2%) | 604 (1.8%) |
Health Insurance Coverage by Citizenship Status in Kaneohe
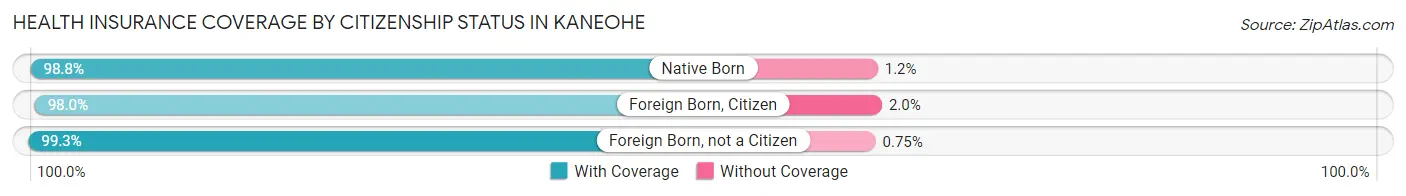
| Citizenship Status | With Coverage | Without Coverage |
| Native Born | 2,185 (98.8%) | 26 (1.2%) |
| Foreign Born, Citizen | 4,210 (98.0%) | 86 (2.0%) |
| Foreign Born, not a Citizen | 2,515 (99.3%) | 19 (0.7%) |
Health Insurance Coverage by Household Income in Kaneohe
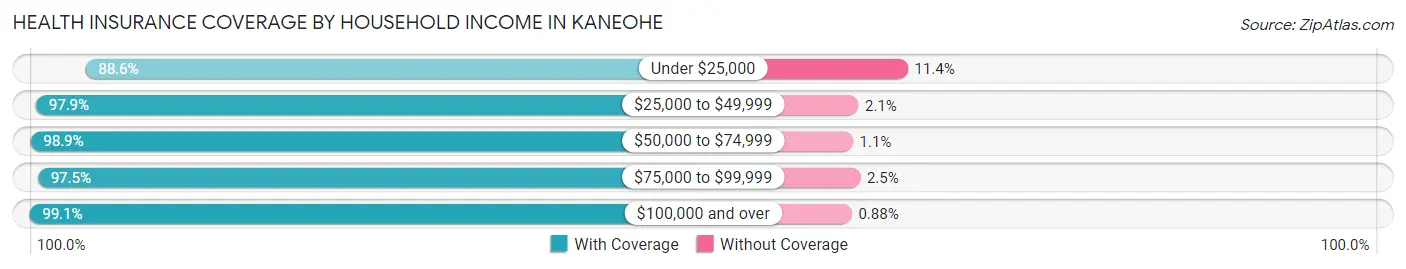
| Household Income | With Coverage | Without Coverage |
| Under $25,000 | 1,604 (88.6%) | 206 (11.4%) |
| $25,000 to $49,999 | 1,893 (97.9%) | 41 (2.1%) |
| $50,000 to $74,999 | 2,660 (98.9%) | 29 (1.1%) |
| $75,000 to $99,999 | 3,234 (97.5%) | 82 (2.5%) |
| $100,000 and over | 23,553 (99.1%) | 208 (0.9%) |
Public vs Private Health Insurance Coverage by Age in Kaneohe
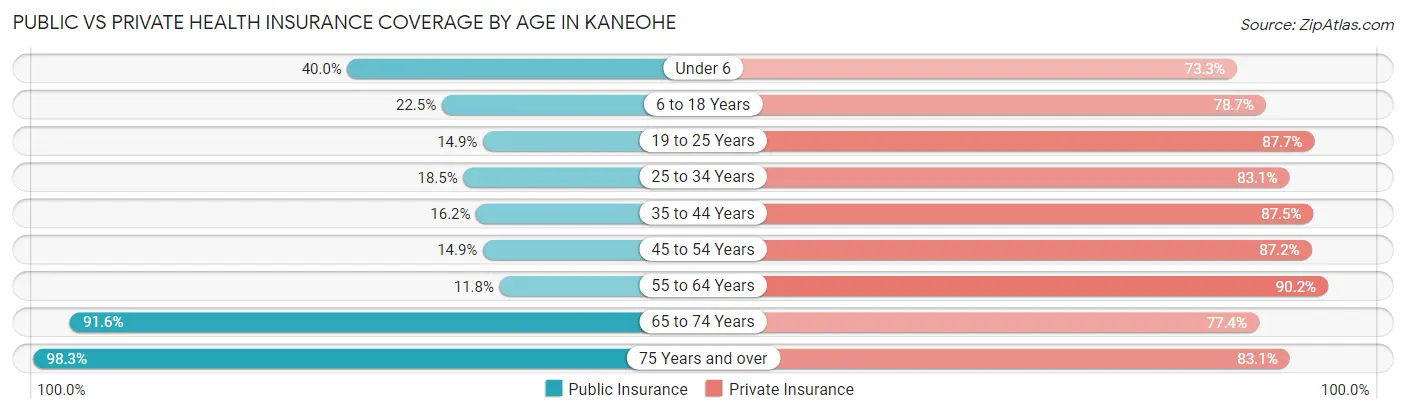
| Age Bracket | Public Insurance | Private Insurance |
| Under 6 | 885 (40.0%) | 1,621 (73.3%) |
| 6 to 18 Years | 967 (22.5%) | 3,381 (78.7%) |
| 19 to 25 Years | 377 (14.9%) | 2,222 (87.7%) |
| 25 to 34 Years | 740 (18.5%) | 3,316 (83.1%) |
| 35 to 44 Years | 640 (16.2%) | 3,467 (87.5%) |
| 45 to 54 Years | 561 (14.9%) | 3,287 (87.2%) |
| 55 to 64 Years | 620 (11.8%) | 4,744 (90.2%) |
| 65 to 74 Years | 3,676 (91.6%) | 3,108 (77.4%) |
| 75 Years and over | 4,095 (98.3%) | 3,461 (83.1%) |
| Total | 12,561 (36.7%) | 28,607 (83.6%) |
Disability Status by Sex by Age in Kaneohe
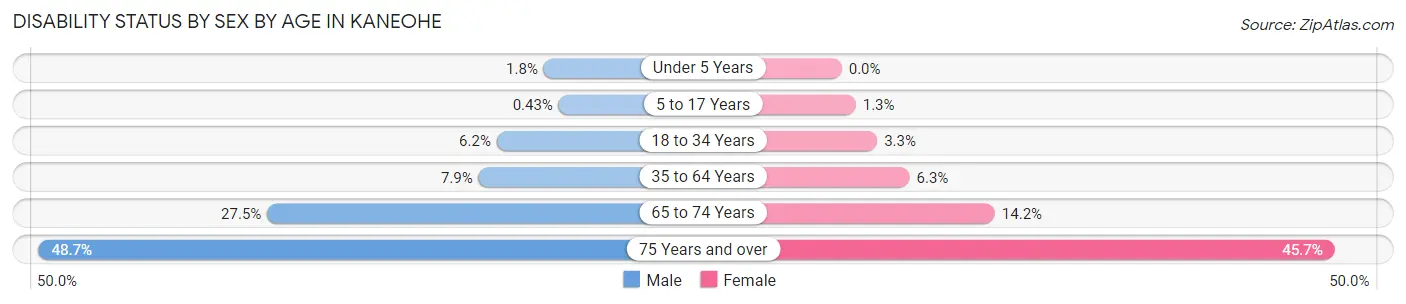
| Age Bracket | Male | Female |
| Under 5 Years | 18 (1.8%) | 0 (0.0%) |
| 5 to 17 Years | 9 (0.4%) | 29 (1.3%) |
| 18 to 34 Years | 227 (6.2%) | 104 (3.3%) |
| 35 to 64 Years | 507 (7.9%) | 412 (6.3%) |
| 65 to 74 Years | 558 (27.5%) | 282 (14.2%) |
| 75 Years and over | 744 (48.7%) | 1,206 (45.7%) |
Disability Class by Sex by Age in Kaneohe
Disability Class: Hearing Difficulty
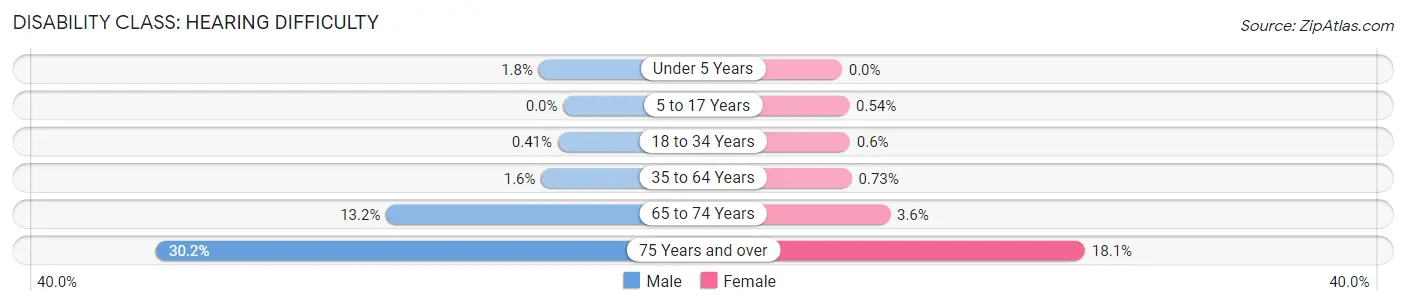
| Age Bracket | Male | Female |
| Under 5 Years | 18 (1.8%) | 0 (0.0%) |
| 5 to 17 Years | 0 (0.0%) | 12 (0.5%) |
| 18 to 34 Years | 15 (0.4%) | 19 (0.6%) |
| 35 to 64 Years | 105 (1.6%) | 48 (0.7%) |
| 65 to 74 Years | 267 (13.2%) | 71 (3.6%) |
| 75 Years and over | 462 (30.2%) | 476 (18.0%) |
Disability Class: Vision Difficulty
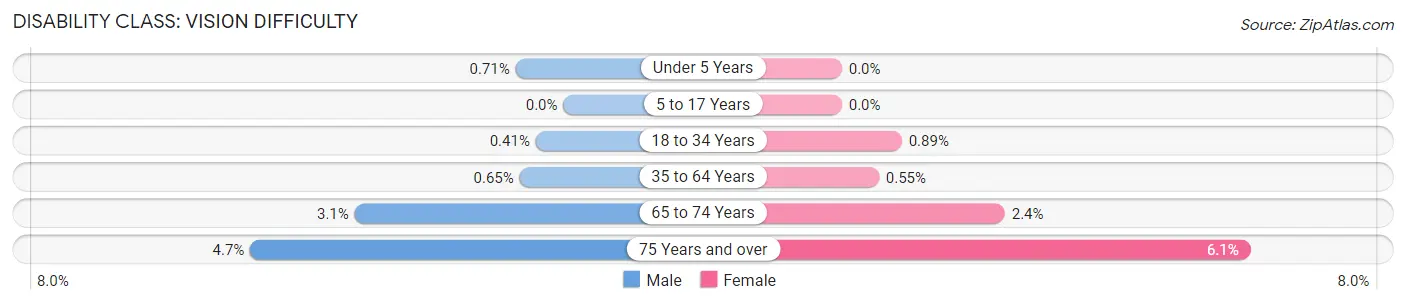
| Age Bracket | Male | Female |
| Under 5 Years | 7 (0.7%) | 0 (0.0%) |
| 5 to 17 Years | 0 (0.0%) | 0 (0.0%) |
| 18 to 34 Years | 15 (0.4%) | 28 (0.9%) |
| 35 to 64 Years | 42 (0.6%) | 36 (0.5%) |
| 65 to 74 Years | 63 (3.1%) | 48 (2.4%) |
| 75 Years and over | 71 (4.6%) | 160 (6.1%) |
Disability Class: Cognitive Difficulty
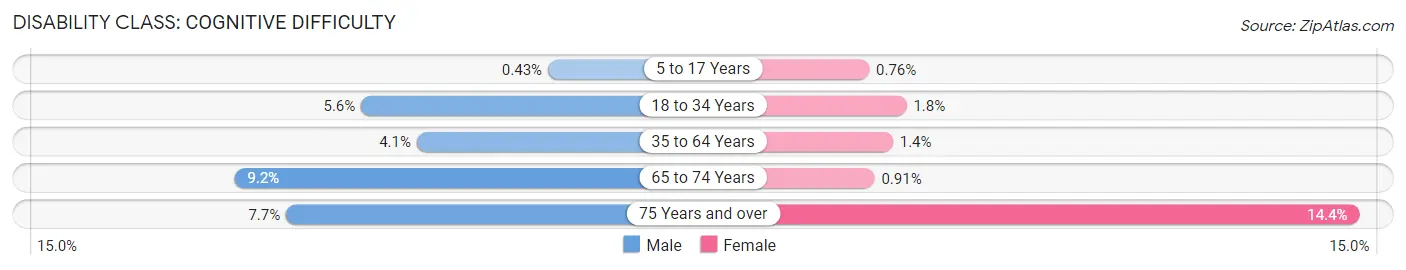
| Age Bracket | Male | Female |
| 5 to 17 Years | 9 (0.4%) | 17 (0.8%) |
| 18 to 34 Years | 207 (5.6%) | 57 (1.8%) |
| 35 to 64 Years | 263 (4.1%) | 93 (1.4%) |
| 65 to 74 Years | 186 (9.2%) | 18 (0.9%) |
| 75 Years and over | 118 (7.7%) | 380 (14.4%) |
Disability Class: Ambulatory Difficulty
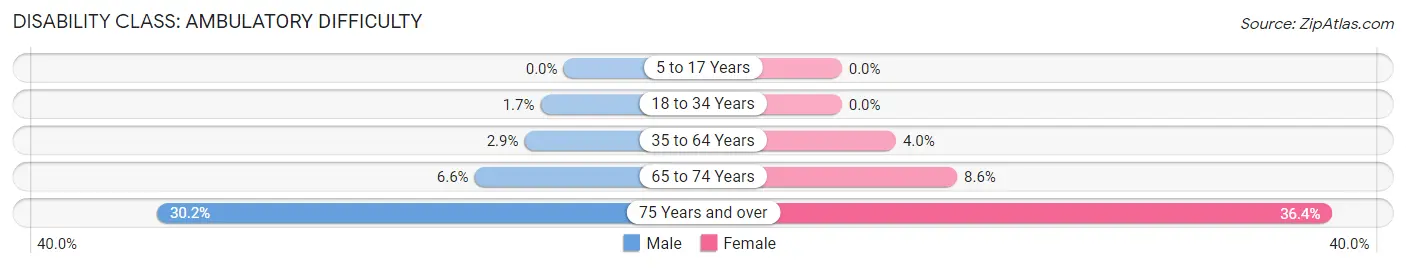
| Age Bracket | Male | Female |
| 5 to 17 Years | 0 (0.0%) | 0 (0.0%) |
| 18 to 34 Years | 63 (1.7%) | 0 (0.0%) |
| 35 to 64 Years | 187 (2.9%) | 263 (4.0%) |
| 65 to 74 Years | 134 (6.6%) | 170 (8.6%) |
| 75 Years and over | 461 (30.2%) | 960 (36.4%) |
Disability Class: Self-Care Difficulty
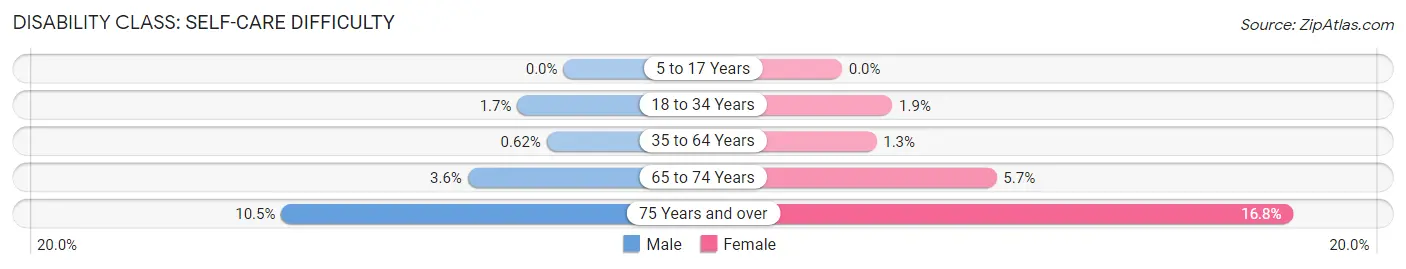
| Age Bracket | Male | Female |
| 5 to 17 Years | 0 (0.0%) | 0 (0.0%) |
| 18 to 34 Years | 63 (1.7%) | 59 (1.9%) |
| 35 to 64 Years | 40 (0.6%) | 84 (1.3%) |
| 65 to 74 Years | 72 (3.5%) | 114 (5.7%) |
| 75 Years and over | 160 (10.5%) | 442 (16.8%) |
Technology Access in Kaneohe
Computing Device Access in Kaneohe
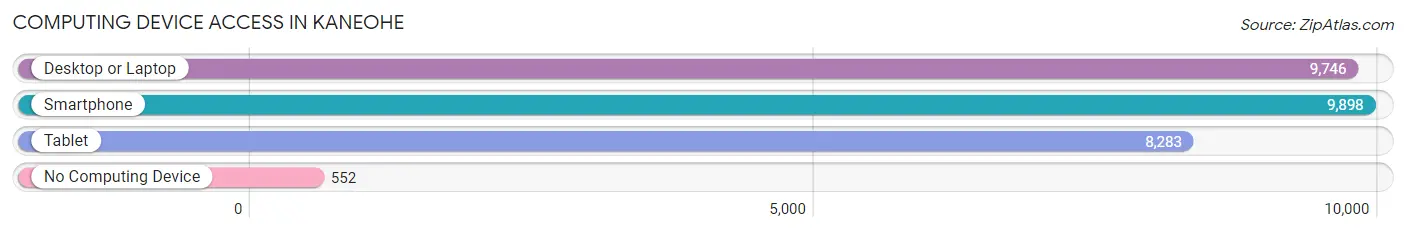
| Device Type | # Households | % Households |
| Desktop or Laptop | 9,746 | 86.4% |
| Smartphone | 9,898 | 87.7% |
| Tablet | 8,283 | 73.4% |
| No Computing Device | 552 | 4.9% |
| Total | 11,285 | 100.0% |
Internet Access in Kaneohe
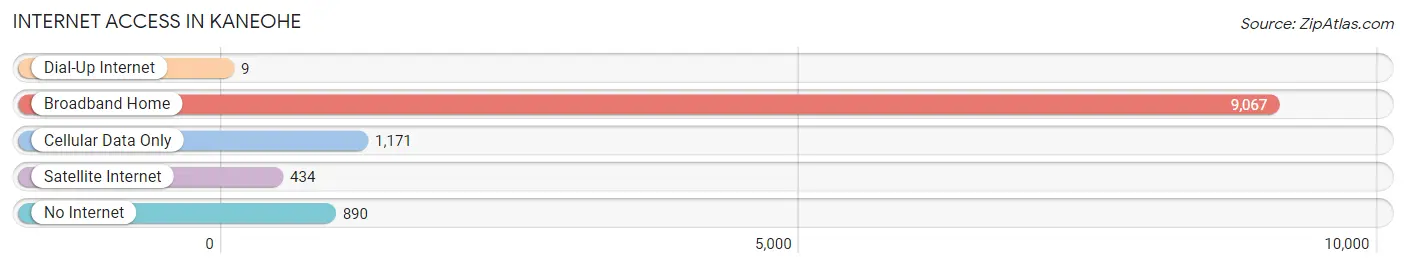
| Internet Type | # Households | % Households |
| Dial-Up Internet | 9 | 0.1% |
| Broadband Home | 9,067 | 80.3% |
| Cellular Data Only | 1,171 | 10.4% |
| Satellite Internet | 434 | 3.8% |
| No Internet | 890 | 7.9% |
| Total | 11,285 | 100.0% |
Kaneohe Summary
Kaneohe is a census-designated place (CDP) located in the City and County of Honolulu, Hawaii, United States. It is located on the windward side of the island of Oahu, approximately 12 miles (19 km) northeast of Honolulu. As of the 2010 Census, the CDP had a population of 34,597.
History
Kaneohe is believed to have been inhabited by the ancient Hawaiians since the 12th century. The area was first visited by Europeans in 1779, when Captain James King of the HMS Resolution and HMS Discovery, under the command of Captain James Cook, sailed into the bay. The area was later developed by the American missionary Hiram Bingham, who established a mission in the area in 1837.
The area was originally known as Waiāhole, which means “water of the hole” in Hawaiian. The name was later changed to Kaneohe, which means “bamboo man” in Hawaiian. The area was once a major pineapple plantation, and the town was known as the “Pineapple Capital of the World”.
Geography
Kaneohe is located on the windward side of the island of Oahu, approximately 12 miles (19 km) northeast of Honolulu. The area is bordered by the Ko’olau Mountains to the east and the Wai’anae Mountains to the west. The Kaneohe Bay is located to the north of the town, and the Koolaupoko District is located to the south.
The town is located at 21°27'N 157°45'W, and has an elevation of 11 feet (3.4 m). The total area of the CDP is 8.5 square miles (22 km2), of which 8.3 square miles (21 km2) is land and 0.2 square miles (0.52 km2) is water.
Economy
Kaneohe is home to several major employers, including the Marine Corps Base Hawaii, the Kaneohe Bay Naval Air Station, and the Hawaii State Hospital. The town is also home to several shopping centers, including Windward Mall, Windward City Shopping Center, and Kaneohe Bay Shopping Center.
The town is also home to several educational institutions, including the University of Hawaii at Manoa, Hawaii Pacific University, and Chaminade University.
Demographics
As of the 2010 Census, there were 34,597 people, 11,945 households, and 8,845 families residing in the CDP. The population density was 4,093.3 people per square mile (1,579.2/km2). There were 12,845 housing units at an average density of 1,527.3 per square mile (589.3/km2). The racial makeup of the CDP was 44.2% White, 8.3% African American, 0.3% Native American, 24.3% Asian, 8.2% Pacific Islander, 0.7% from other races, and 14.2% from two or more races. Hispanic or Latino of any race were 8.7% of the population.
There were 11,945 households, out of which 33.2% had children under the age of 18 living with them, 54.2% were married couples living together, 11.7% had a female householder with no husband present, and 28.7% were non-families. 22.2% of all households were made up of individuals, and 7.2% had someone living alone who was 65 years of age or older. The average household size was 2.86 and the average family size was 3.36.
In the CDP, the population was spread out, with 24.2% under the age of 18, 8.2% from 18 to 24, 28.2% from 25 to 44, 25.7% from 45 to 64, and 13.7% who were 65 years of age or older. The median age was 38 years. For every 100 females, there were 97.2 males. For every 100 females age 18 and over, there were 94.7 males.
The median income for a household in the CDP was $63,945, and the median income for a family was $71,818. Males had a median income of $45,945 versus $37,818 for females. The per capita income for the CDP was $25,945. About 4.2% of families and 6.2% of the population were below the poverty line, including 7.2% of those under age 18 and 5.2% of those age 65 or over.
Common Questions
What is Per Capita Income in Kaneohe?
Per Capita income in Kaneohe is $48,696.
What is the Median Family Income in Kaneohe?
Median Family Income in Kaneohe is $142,582.
What is the Median Household income in Kaneohe?
Median Household Income in Kaneohe is $120,451.
What is Income or Wage Gap in Kaneohe?
Income or Wage Gap in Kaneohe is 16.9%.
Women in Kaneohe earn 83.1 cents for every dollar earned by a man.
What is Family Income Deficit in Kaneohe?
Family Income Deficit in Kaneohe is $15,838.
Families that are below poverty line in Kaneohe earn $15,838 less on average than the poverty threshold level.
What is Inequality or Gini Index in Kaneohe?
Inequality or Gini Index in Kaneohe is 0.42.
What is the Total Population of Kaneohe?
Total Population of Kaneohe is 35,493.
What is the Total Male Population of Kaneohe?
Total Male Population of Kaneohe is 17,635.
What is the Total Female Population of Kaneohe?
Total Female Population of Kaneohe is 17,858.
What is the Ratio of Males per 100 Females in Kaneohe?
There are 98.75 Males per 100 Females in Kaneohe.
What is the Ratio of Females per 100 Males in Kaneohe?
There are 101.26 Females per 100 Males in Kaneohe.
What is the Median Population Age in Kaneohe?
Median Population Age in Kaneohe is 45.1 Years.
What is the Average Family Size in Kaneohe
Average Family Size in Kaneohe is 3.5 People.
What is the Average Household Size in Kaneohe
Average Household Size in Kaneohe is 3.0 People.
How Large is the Labor Force in Kaneohe?
There are 18,613 People in the Labor Forcein in Kaneohe.
What is the Percentage of People in the Labor Force in Kaneohe?
62.2% of People are in the Labor Force in Kaneohe.
What is the Unemployment Rate in Kaneohe?
Unemployment Rate in Kaneohe is 4.5%.