Pine Hills, FL Map & Demographics
Pine Hills Map
Pine Hills Overview
$19,766
PER CAPITA INCOME
$50,006
AVG FAMILY INCOME
$49,474
AVG HOUSEHOLD INCOME
16.1%
WAGE / INCOME GAP [ % ]
83.9¢/ $1
WAGE / INCOME GAP [ $ ]
$12,106
FAMILY INCOME DEFICIT
0.43
INEQUALITY / GINI INDEX
83,221
TOTAL POPULATION
40,137
MALE POPULATION
43,084
FEMALE POPULATION
93.16
MALES / 100 FEMALES
107.34
FEMALES / 100 MALES
32.9
MEDIAN AGE
4.0
AVG FAMILY SIZE
3.6
AVG HOUSEHOLD SIZE
42,409
LABOR FORCE [ PEOPLE ]
68.5%
PERCENT IN LABOR FORCE
12.7%
UNEMPLOYMENT RATE
Income in Pine Hills
Income Overview in Pine Hills
Per Capita Income in Pine Hills is $19,766, while median incomes of families and households are $50,006 and $49,474 respectively.
| Characteristic | Number | Measure |
| Per Capita Income | 83,221 | $19,766 |
| Median Family Income | 17,790 | $50,006 |
| Mean Family Income | 17,790 | $64,333 |
| Median Household Income | 23,083 | $49,474 |
| Mean Household Income | 23,083 | $62,737 |
| Income Deficit | 17,790 | $12,106 |
| Wage / Income Gap (%) | 83,221 | 16.11% |
| Wage / Income Gap ($) | 83,221 | 83.89¢ per $1 |
| Gini / Inequality Index | 83,221 | 0.43 |
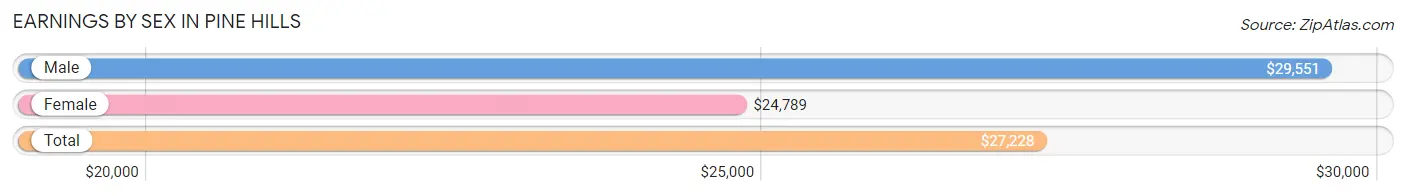
Earnings by Sex in Pine Hills
Average Earnings in Pine Hills are $27,228, $29,551 for men and $24,789 for women, a difference of 16.1%.
| Sex | Number | Average Earnings |
| Male | 19,711 (46.8%) | $29,551 |
| Female | 22,370 (53.2%) | $24,789 |
| Total | 42,081 (100.0%) | $27,228 |
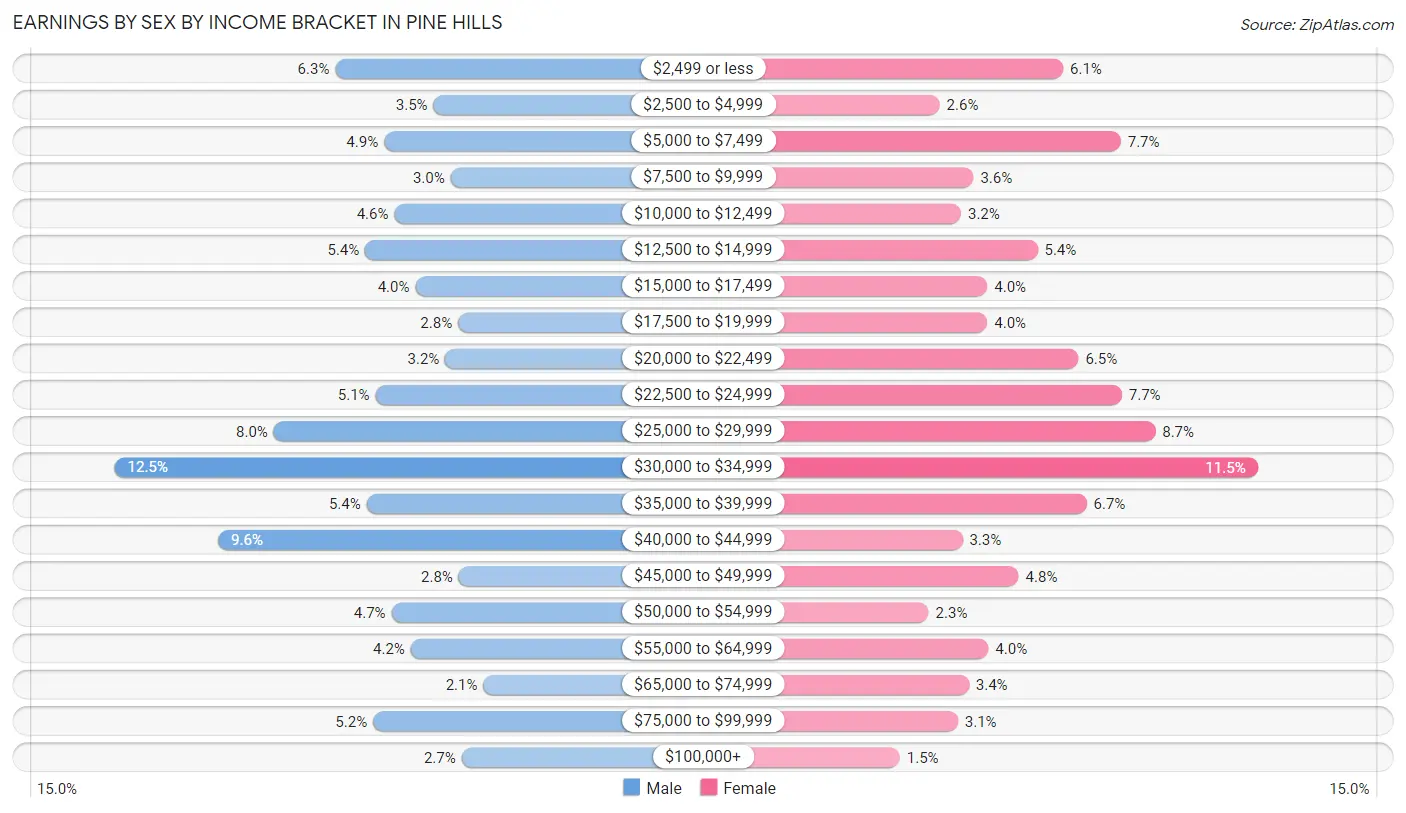
Earnings by Sex by Income Bracket in Pine Hills
The most common earnings brackets in Pine Hills are $30,000 to $34,999 for men (2,457 | 12.5%) and $30,000 to $34,999 for women (2,581 | 11.5%).
| Income | Male | Female |
| $2,499 or less | 1,236 (6.3%) | 1,359 (6.1%) |
| $2,500 to $4,999 | 692 (3.5%) | 583 (2.6%) |
| $5,000 to $7,499 | 965 (4.9%) | 1,723 (7.7%) |
| $7,500 to $9,999 | 598 (3.0%) | 796 (3.6%) |
| $10,000 to $12,499 | 909 (4.6%) | 718 (3.2%) |
| $12,500 to $14,999 | 1,071 (5.4%) | 1,198 (5.4%) |
| $15,000 to $17,499 | 792 (4.0%) | 884 (4.0%) |
| $17,500 to $19,999 | 555 (2.8%) | 884 (4.0%) |
| $20,000 to $22,499 | 627 (3.2%) | 1,456 (6.5%) |
| $22,500 to $24,999 | 1,013 (5.1%) | 1,730 (7.7%) |
| $25,000 to $29,999 | 1,577 (8.0%) | 1,939 (8.7%) |
| $30,000 to $34,999 | 2,457 (12.5%) | 2,581 (11.5%) |
| $35,000 to $39,999 | 1,063 (5.4%) | 1,508 (6.7%) |
| $40,000 to $44,999 | 1,884 (9.6%) | 727 (3.3%) |
| $45,000 to $49,999 | 552 (2.8%) | 1,081 (4.8%) |
| $50,000 to $54,999 | 924 (4.7%) | 515 (2.3%) |
| $55,000 to $64,999 | 818 (4.2%) | 890 (4.0%) |
| $65,000 to $74,999 | 415 (2.1%) | 767 (3.4%) |
| $75,000 to $99,999 | 1,026 (5.2%) | 697 (3.1%) |
| $100,000+ | 537 (2.7%) | 334 (1.5%) |
| Total | 19,711 (100.0%) | 22,370 (100.0%) |
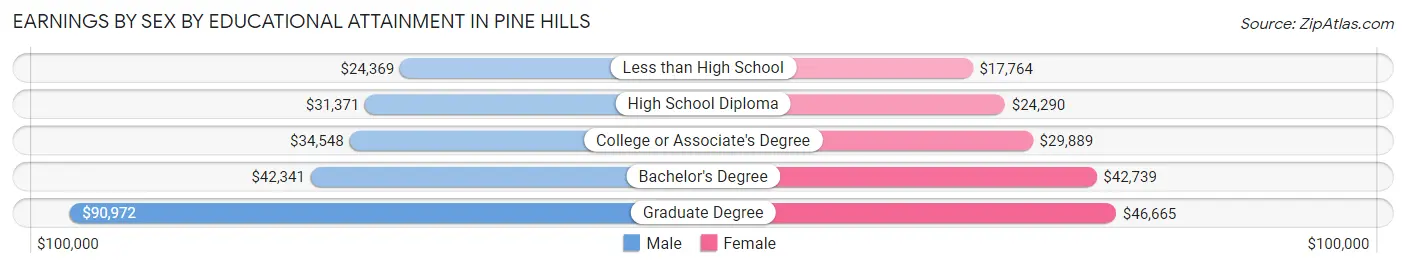
Earnings by Sex by Educational Attainment in Pine Hills
Average earnings in Pine Hills are $32,493 for men and $27,621 for women, a difference of 15.0%. Men with an educational attainment of graduate degree enjoy the highest average annual earnings of $90,972, while those with less than high school education earn the least with $24,369. Women with an educational attainment of graduate degree earn the most with the average annual earnings of $46,665, while those with less than high school education have the smallest earnings of $17,764.
| Educational Attainment | Male Income | Female Income |
| Less than High School | $24,369 | $17,764 |
| High School Diploma | $31,371 | $24,290 |
| College or Associate's Degree | $34,548 | $29,889 |
| Bachelor's Degree | $42,341 | $42,739 |
| Graduate Degree | $90,972 | $46,665 |
| Total | $32,493 | $27,621 |
Family Income in Pine Hills
Family Income Brackets in Pine Hills
According to the Pine Hills family income data, there are 3,540 families falling into the $50,000 to $74,999 income range, which is the most common income bracket and makes up 19.9% of all families. Conversely, the $10,000 to $14,999 income bracket is the least frequent group with only 427 families (2.4%) belonging to this category.
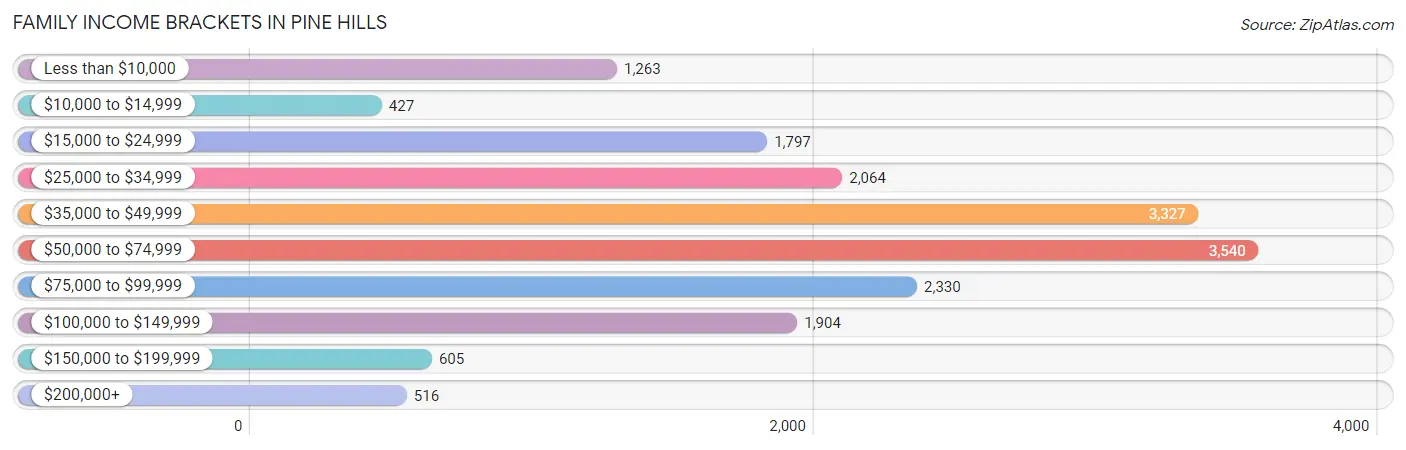
| Income Bracket | # Families | % Families |
| Less than $10,000 | 1,263 | 7.1% |
| $10,000 to $14,999 | 427 | 2.4% |
| $15,000 to $24,999 | 1,797 | 10.1% |
| $25,000 to $34,999 | 2,064 | 11.6% |
| $35,000 to $49,999 | 3,327 | 18.7% |
| $50,000 to $74,999 | 3,540 | 19.9% |
| $75,000 to $99,999 | 2,330 | 13.1% |
| $100,000 to $149,999 | 1,904 | 10.7% |
| $150,000 to $199,999 | 605 | 3.4% |
| $200,000+ | 516 | 2.9% |
Family Income by Famaliy Size in Pine Hills
6-person families (447 | 2.5%) account for the highest median family income in Pine Hills with $102,049 per family, while 2-person families (6,106 | 34.3%) have the highest median income of $21,432 per family member.
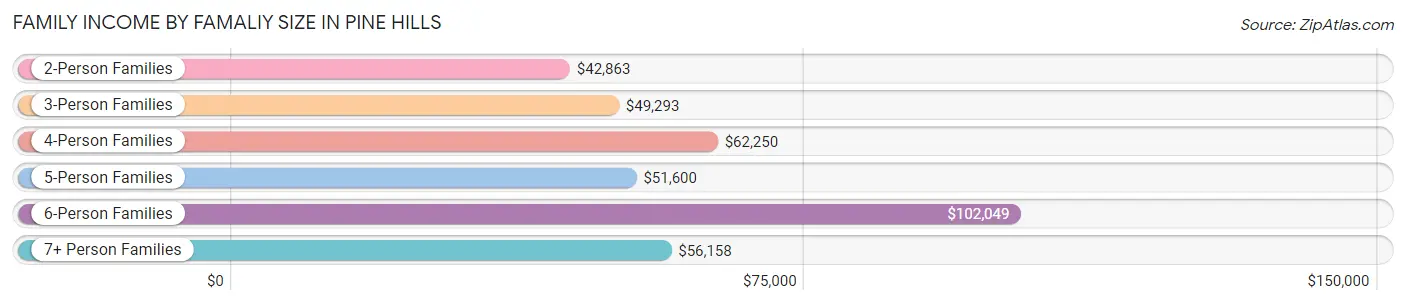
| Income Bracket | # Families | Median Income |
| 2-Person Families | 6,106 (34.3%) | $42,863 |
| 3-Person Families | 4,973 (28.0%) | $49,293 |
| 4-Person Families | 3,324 (18.7%) | $62,250 |
| 5-Person Families | 2,012 (11.3%) | $51,600 |
| 6-Person Families | 447 (2.5%) | $102,049 |
| 7+ Person Families | 928 (5.2%) | $56,158 |
| Total | 17,790 (100.0%) | $50,006 |
Family Income by Number of Earners in Pine Hills
The median family income in Pine Hills is $50,006, with families comprising 3+ earners (3,081) having the highest median family income of $96,791, while families with no earners (2,108) have the lowest median family income of $22,806, accounting for 17.3% and 11.8% of families, respectively.
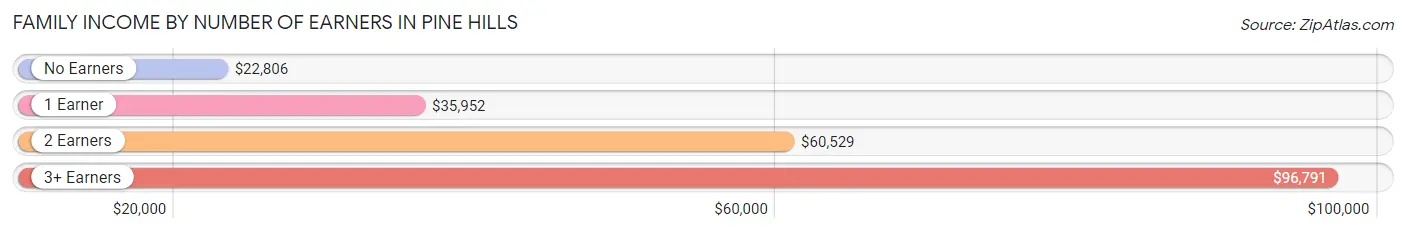
| Number of Earners | # Families | Median Income |
| No Earners | 2,108 (11.8%) | $22,806 |
| 1 Earner | 6,647 (37.4%) | $35,952 |
| 2 Earners | 5,954 (33.5%) | $60,529 |
| 3+ Earners | 3,081 (17.3%) | $96,791 |
| Total | 17,790 (100.0%) | $50,006 |
Household Income in Pine Hills
Household Income Brackets in Pine Hills
With 4,801 households falling in the category, the $50,000 to $74,999 income range is the most frequent in Pine Hills, accounting for 20.8% of all households. In contrast, only 600 households (2.6%) fall into the $200,000+ income bracket, making it the least populous group.
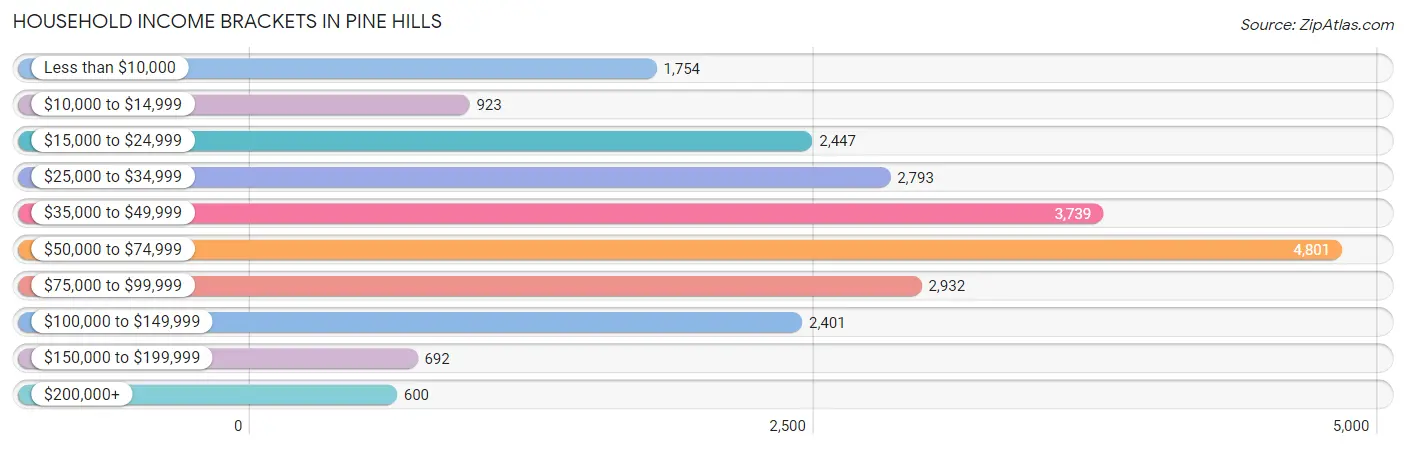
| Income Bracket | # Households | % Households |
| Less than $10,000 | 1,754 | 7.6% |
| $10,000 to $14,999 | 923 | 4.0% |
| $15,000 to $24,999 | 2,447 | 10.6% |
| $25,000 to $34,999 | 2,793 | 12.1% |
| $35,000 to $49,999 | 3,739 | 16.2% |
| $50,000 to $74,999 | 4,801 | 20.8% |
| $75,000 to $99,999 | 2,932 | 12.7% |
| $100,000 to $149,999 | 2,401 | 10.4% |
| $150,000 to $199,999 | 692 | 3.0% |
| $200,000+ | 600 | 2.6% |
Household Income by Householder Age in Pine Hills
The median household income in Pine Hills is $49,474, with the highest median household income of $58,944 found in the 15 to 24 years age bracket for the primary householder. A total of 734 households (3.2%) fall into this category. Meanwhile, the 65+ years age bracket for the primary householder has the lowest median household income of $45,210, with 5,233 households (22.7%) in this group.
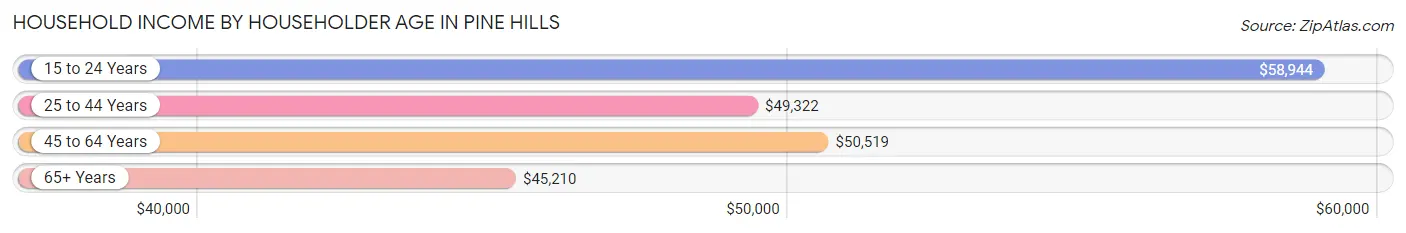
| Income Bracket | # Households | Median Income |
| 15 to 24 Years | 734 (3.2%) | $58,944 |
| 25 to 44 Years | 7,984 (34.6%) | $49,322 |
| 45 to 64 Years | 9,132 (39.6%) | $50,519 |
| 65+ Years | 5,233 (22.7%) | $45,210 |
| Total | 23,083 (100.0%) | $49,474 |
Poverty in Pine Hills
Income Below Poverty by Sex and Age in Pine Hills
With 23.5% poverty level for males and 23.6% for females among the residents of Pine Hills, under 5 year old males and 5 year old females are the most vulnerable to poverty, with 1,672 males (50.8%) and 243 females (44.5%) in their respective age groups living below the poverty level.
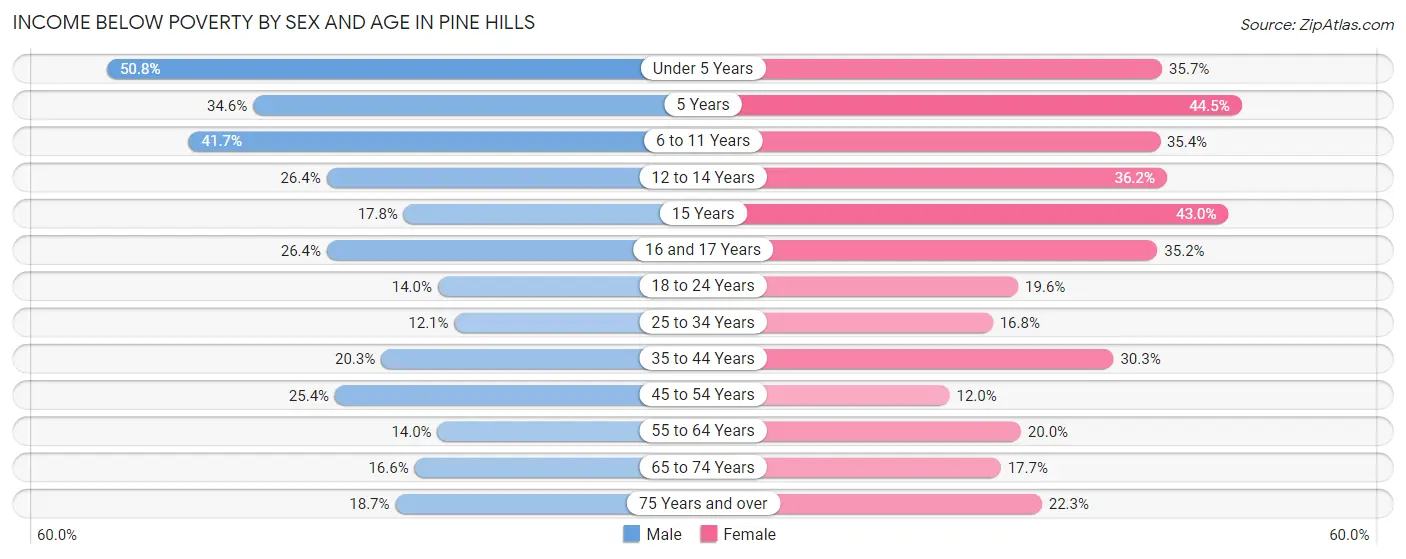
| Age Bracket | Male | Female |
| Under 5 Years | 1,672 (50.8%) | 1,071 (35.7%) |
| 5 Years | 169 (34.6%) | 243 (44.5%) |
| 6 to 11 Years | 1,622 (41.7%) | 1,304 (35.4%) |
| 12 to 14 Years | 631 (26.4%) | 519 (36.2%) |
| 15 Years | 195 (17.8%) | 300 (43.0%) |
| 16 and 17 Years | 352 (26.4%) | 348 (35.1%) |
| 18 to 24 Years | 609 (14.0%) | 801 (19.6%) |
| 25 to 34 Years | 596 (12.1%) | 1,073 (16.8%) |
| 35 to 44 Years | 978 (20.3%) | 1,796 (30.3%) |
| 45 to 54 Years | 1,180 (25.4%) | 791 (12.0%) |
| 55 to 64 Years | 620 (14.0%) | 847 (20.0%) |
| 65 to 74 Years | 444 (16.6%) | 532 (17.7%) |
| 75 Years and over | 262 (18.7%) | 439 (22.3%) |
| Total | 9,330 (23.5%) | 10,064 (23.6%) |
Income Above Poverty by Sex and Age in Pine Hills
According to the poverty statistics in Pine Hills, males aged 25 to 34 years and females aged 45 to 54 years are the age groups that are most secure financially, with 87.9% of males and 88.0% of females in these age groups living above the poverty line.
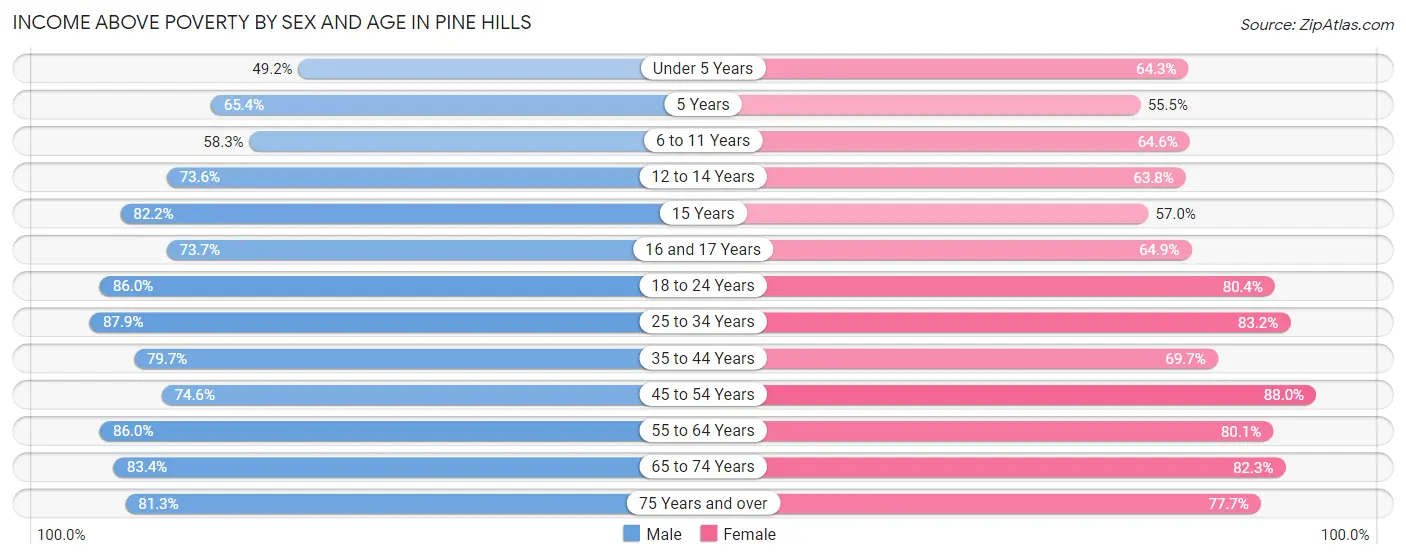
| Age Bracket | Male | Female |
| Under 5 Years | 1,618 (49.2%) | 1,931 (64.3%) |
| 5 Years | 320 (65.4%) | 303 (55.5%) |
| 6 to 11 Years | 2,265 (58.3%) | 2,376 (64.6%) |
| 12 to 14 Years | 1,761 (73.6%) | 915 (63.8%) |
| 15 Years | 902 (82.2%) | 397 (57.0%) |
| 16 and 17 Years | 984 (73.7%) | 642 (64.8%) |
| 18 to 24 Years | 3,746 (86.0%) | 3,277 (80.4%) |
| 25 to 34 Years | 4,315 (87.9%) | 5,312 (83.2%) |
| 35 to 44 Years | 3,839 (79.7%) | 4,140 (69.7%) |
| 45 to 54 Years | 3,459 (74.6%) | 5,800 (88.0%) |
| 55 to 64 Years | 3,803 (86.0%) | 3,399 (80.0%) |
| 65 to 74 Years | 2,234 (83.4%) | 2,473 (82.3%) |
| 75 Years and over | 1,138 (81.3%) | 1,532 (77.7%) |
| Total | 30,384 (76.5%) | 32,497 (76.3%) |
Income Below Poverty Among Married-Couple Families in Pine Hills
The poverty statistics for married-couple families in Pine Hills show that 13.8% or 1,260 of the total 9,128 families live below the poverty line. Families with 5 or more children have the highest poverty rate of 70.1%, comprising of 143 families. On the other hand, families with no children have the lowest poverty rate of 8.8%, which includes 468 families.
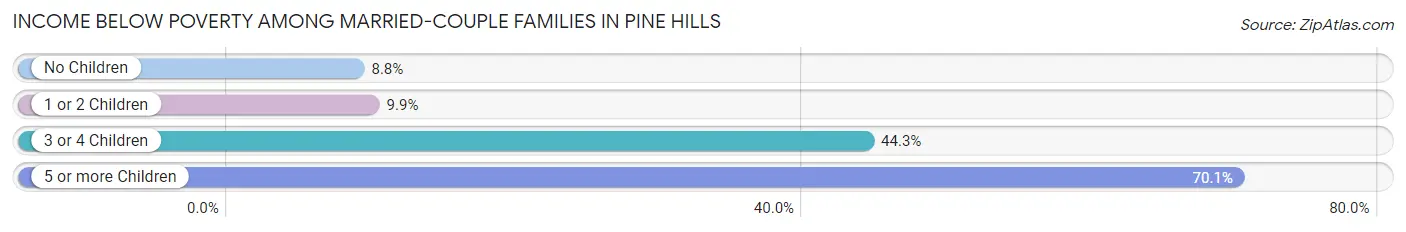
| Children | Above Poverty | Below Poverty |
| No Children | 4,847 (91.2%) | 468 (8.8%) |
| 1 or 2 Children | 2,486 (90.1%) | 272 (9.9%) |
| 3 or 4 Children | 474 (55.7%) | 377 (44.3%) |
| 5 or more Children | 61 (29.9%) | 143 (70.1%) |
| Total | 7,868 (86.2%) | 1,260 (13.8%) |
Income Below Poverty Among Single-Parent Households in Pine Hills
According to the poverty data in Pine Hills, 16.7% or 350 single-father households and 29.9% or 1,962 single-mother households are living below the poverty line. Among single-father households, those with 5 or more children have the highest poverty rate, with 40 households (100.0%) experiencing poverty. Likewise, among single-mother households, those with 3 or 4 children have the highest poverty rate, with 661 households (67.4%) falling below the poverty line.
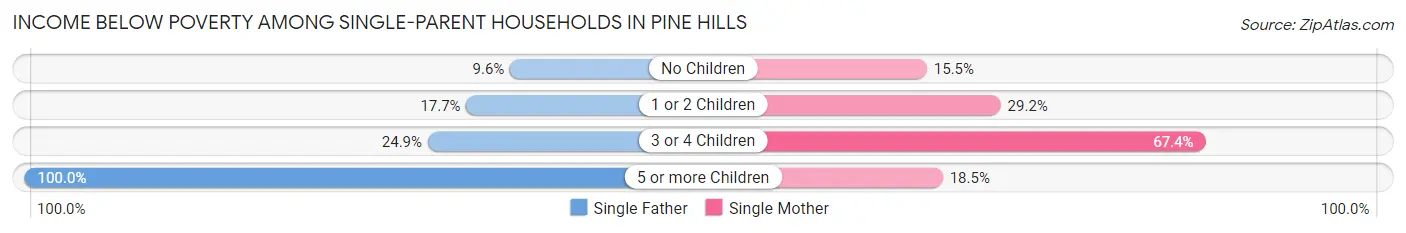
| Children | Single Father | Single Mother |
| No Children | 82 (9.6%) | 355 (15.5%) |
| 1 or 2 Children | 171 (17.7%) | 915 (29.2%) |
| 3 or 4 Children | 57 (24.9%) | 661 (67.4%) |
| 5 or more Children | 40 (100.0%) | 31 (18.4%) |
| Total | 350 (16.7%) | 1,962 (29.9%) |
Income Below Poverty Among Married-Couple vs Single-Parent Households in Pine Hills
The poverty data for Pine Hills shows that 1,260 of the married-couple family households (13.8%) and 2,312 of the single-parent households (26.7%) are living below the poverty level. Within the married-couple family households, those with 5 or more children have the highest poverty rate, with 143 households (70.1%) falling below the poverty line. Among the single-parent households, those with 3 or 4 children have the highest poverty rate, with 718 household (59.3%) living below poverty.
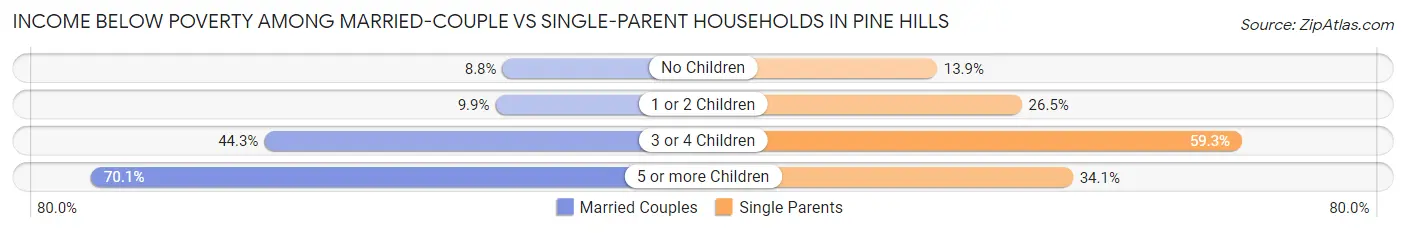
| Children | Married-Couple Families | Single-Parent Households |
| No Children | 468 (8.8%) | 437 (13.9%) |
| 1 or 2 Children | 272 (9.9%) | 1,086 (26.5%) |
| 3 or 4 Children | 377 (44.3%) | 718 (59.3%) |
| 5 or more Children | 143 (70.1%) | 71 (34.1%) |
| Total | 1,260 (13.8%) | 2,312 (26.7%) |
Race in Pine Hills
The most populous races in Pine Hills are Black / African American (61,427 | 73.8%), Hispanic or Latino (11,353 | 13.6%), and White / Caucasian (10,465 | 12.6%).
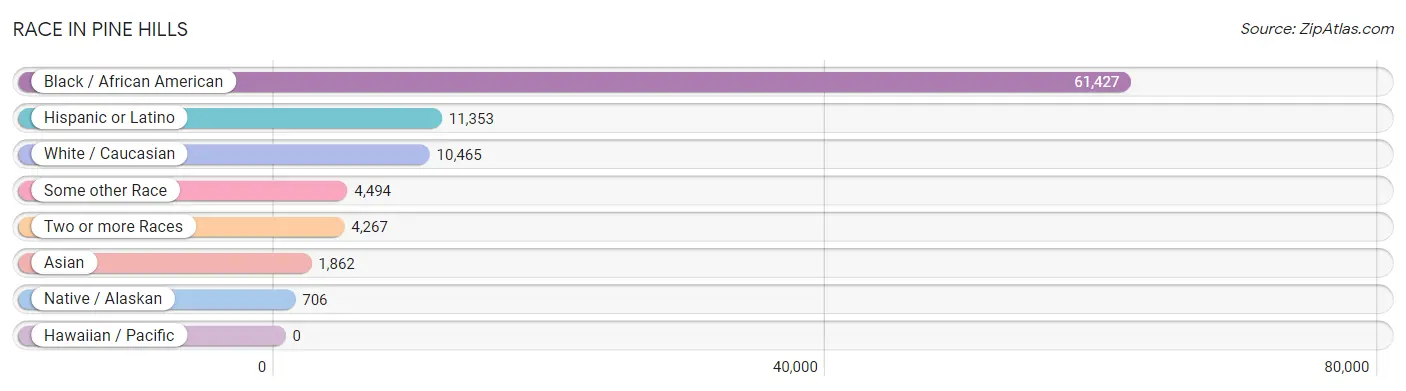
| Race | # Population | % Population |
| Asian | 1,862 | 2.2% |
| Black / African American | 61,427 | 73.8% |
| Hawaiian / Pacific | 0 | 0.0% |
| Hispanic or Latino | 11,353 | 13.6% |
| Native / Alaskan | 706 | 0.9% |
| White / Caucasian | 10,465 | 12.6% |
| Two or more Races | 4,267 | 5.1% |
| Some other Race | 4,494 | 5.4% |
| Total | 83,221 | 100.0% |
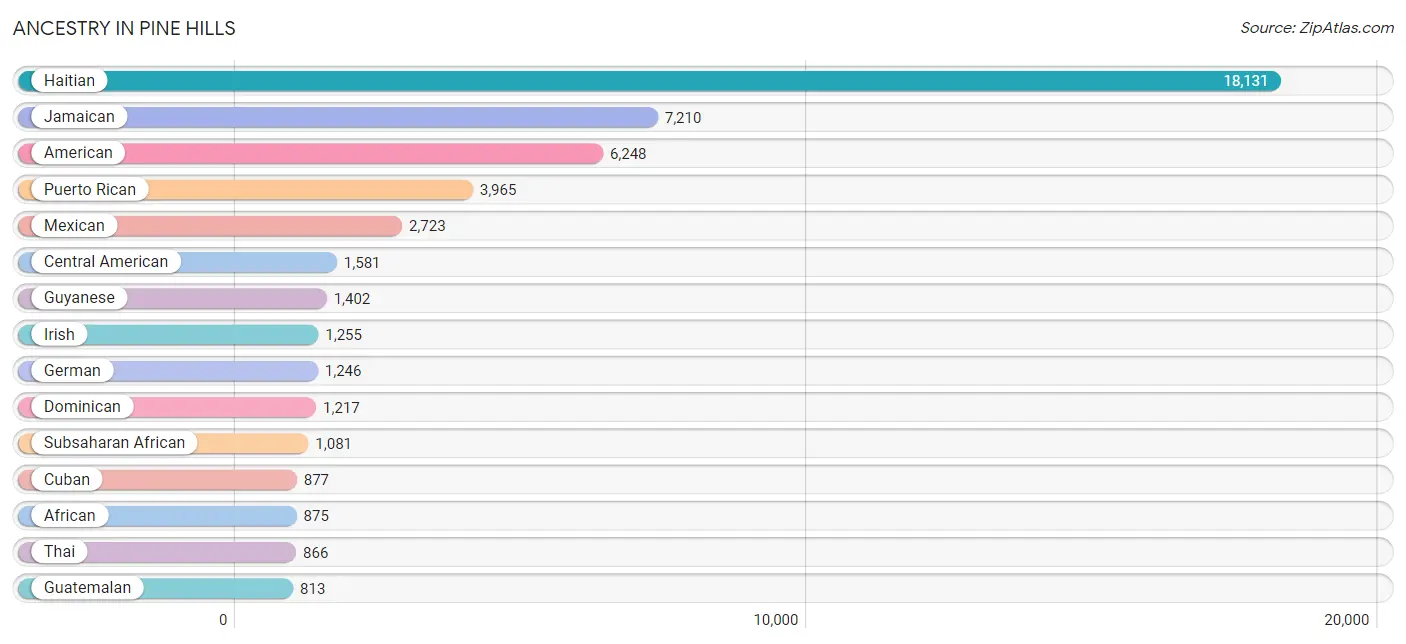
Ancestry in Pine Hills
The most populous ancestries reported in Pine Hills are Haitian (18,131 | 21.8%), Jamaican (7,210 | 8.7%), American (6,248 | 7.5%), Puerto Rican (3,965 | 4.8%), and Mexican (2,723 | 3.3%), together accounting for 46.0% of all Pine Hills residents.
| Ancestry | # Population | % Population |
| African | 875 | 1.1% |
| American | 6,248 | 7.5% |
| Arab | 113 | 0.1% |
| Argentinean | 1 | 0.0% |
| Australian | 11 | 0.0% |
| Austrian | 77 | 0.1% |
| Bahamian | 111 | 0.1% |
| Barbadian | 49 | 0.1% |
| Bhutanese | 27 | 0.0% |
| Brazilian | 174 | 0.2% |
| British | 66 | 0.1% |
| British West Indian | 676 | 0.8% |
| Canadian | 38 | 0.1% |
| Cape Verdean | 22 | 0.0% |
| Celtic | 17 | 0.0% |
| Central American | 1,581 | 1.9% |
| Central American Indian | 706 | 0.9% |
| Cherokee | 130 | 0.2% |
| Colombian | 241 | 0.3% |
| Crow | 8 | 0.0% |
| Cuban | 877 | 1.1% |
| Czech | 17 | 0.0% |
| Danish | 17 | 0.0% |
| Dominican | 1,217 | 1.5% |
| Dutch | 146 | 0.2% |
| Eastern European | 24 | 0.0% |
| Ecuadorian | 130 | 0.2% |
| English | 702 | 0.8% |
| European | 308 | 0.4% |
| Filipino | 56 | 0.1% |
| Finnish | 85 | 0.1% |
| French | 403 | 0.5% |
| French Canadian | 39 | 0.1% |
| German | 1,246 | 1.5% |
| Greek | 4 | 0.0% |
| Guatemalan | 813 | 1.0% |
| Guyanese | 1,402 | 1.7% |
| Haitian | 18,131 | 21.8% |
| Honduran | 293 | 0.4% |
| Hungarian | 4 | 0.0% |
| Indian (Asian) | 218 | 0.3% |
| Irish | 1,255 | 1.5% |
| Italian | 736 | 0.9% |
| Jamaican | 7,210 | 8.7% |
| Korean | 26 | 0.0% |
| Laotian | 45 | 0.1% |
| Lebanese | 41 | 0.1% |
| Mexican | 2,723 | 3.3% |
| Native Hawaiian | 2 | 0.0% |
| Nicaraguan | 167 | 0.2% |
| Nigerian | 184 | 0.2% |
| Norwegian | 5 | 0.0% |
| Panamanian | 31 | 0.0% |
| Peruvian | 24 | 0.0% |
| Polish | 199 | 0.2% |
| Portuguese | 97 | 0.1% |
| Puerto Rican | 3,965 | 4.8% |
| Romanian | 226 | 0.3% |
| Russian | 55 | 0.1% |
| Salvadoran | 277 | 0.3% |
| Scandinavian | 105 | 0.1% |
| Scotch-Irish | 131 | 0.2% |
| Scottish | 169 | 0.2% |
| Seminole | 106 | 0.1% |
| Serbian | 42 | 0.1% |
| Slovak | 32 | 0.0% |
| South American | 481 | 0.6% |
| Spanish | 8 | 0.0% |
| Sri Lankan | 784 | 0.9% |
| Subsaharan African | 1,081 | 1.3% |
| Swedish | 86 | 0.1% |
| Swiss | 8 | 0.0% |
| Thai | 866 | 1.0% |
| Trinidadian and Tobagonian | 217 | 0.3% |
| U.S. Virgin Islander | 12 | 0.0% |
| Venezuelan | 85 | 0.1% |
| Welsh | 5 | 0.0% |
| West Indian | 499 | 0.6% | View All 78 Rows |
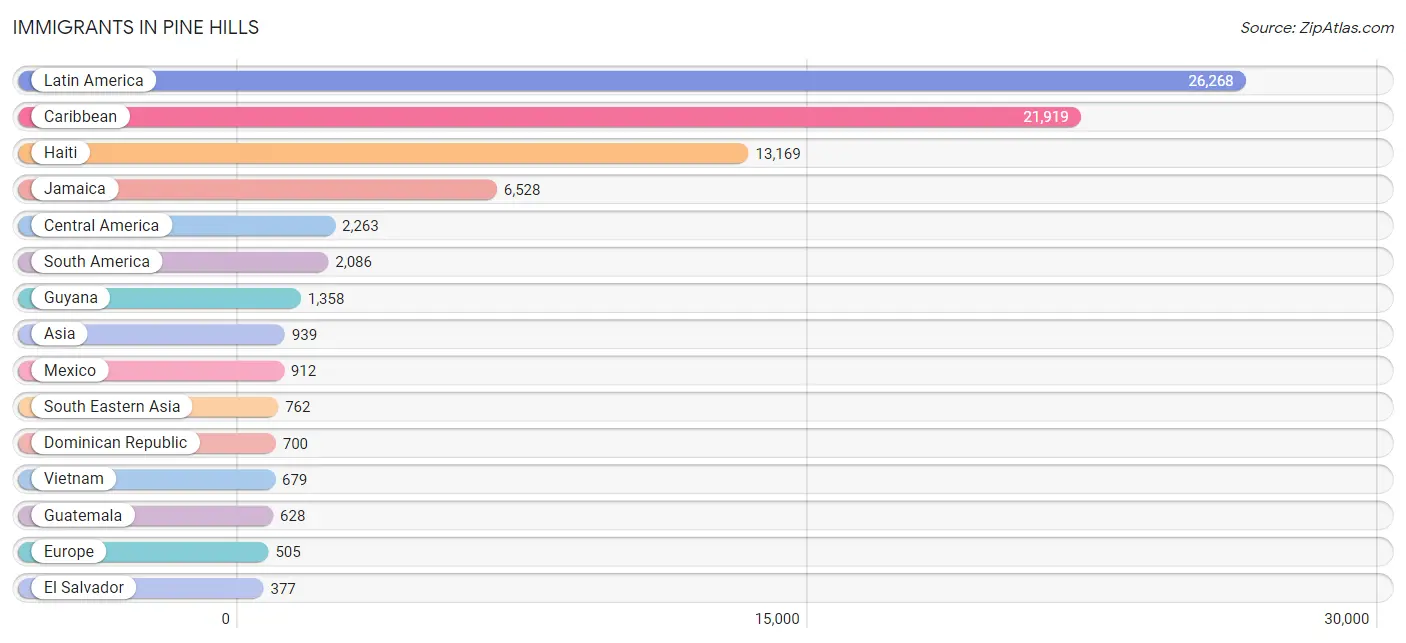
Immigrants in Pine Hills
The most numerous immigrant groups reported in Pine Hills came from Latin America (26,268 | 31.6%), Caribbean (21,919 | 26.3%), Haiti (13,169 | 15.8%), Jamaica (6,528 | 7.8%), and Central America (2,263 | 2.7%), together accounting for 84.3% of all Pine Hills residents.
| Immigration Origin | # Population | % Population |
| Africa | 42 | 0.1% |
| Asia | 939 | 1.1% |
| Australia | 11 | 0.0% |
| Bahamas | 180 | 0.2% |
| Brazil | 83 | 0.1% |
| Canada | 209 | 0.3% |
| Caribbean | 21,919 | 26.3% |
| Central America | 2,263 | 2.7% |
| China | 80 | 0.1% |
| Colombia | 165 | 0.2% |
| Cuba | 299 | 0.4% |
| Dominica | 52 | 0.1% |
| Dominican Republic | 700 | 0.8% |
| Eastern Asia | 80 | 0.1% |
| Eastern Europe | 95 | 0.1% |
| Ecuador | 84 | 0.1% |
| El Salvador | 377 | 0.4% |
| England | 24 | 0.0% |
| Europe | 505 | 0.6% |
| Germany | 45 | 0.1% |
| Greece | 4 | 0.0% |
| Grenada | 64 | 0.1% |
| Guatemala | 628 | 0.7% |
| Guyana | 1,358 | 1.6% |
| Haiti | 13,169 | 15.8% |
| Honduras | 192 | 0.2% |
| Hong Kong | 8 | 0.0% |
| India | 12 | 0.0% |
| Indonesia | 45 | 0.1% |
| Italy | 84 | 0.1% |
| Jamaica | 6,528 | 7.8% |
| Latin America | 26,268 | 31.6% |
| Mexico | 912 | 1.1% |
| Nicaragua | 139 | 0.2% |
| Nigeria | 42 | 0.1% |
| Northern Europe | 277 | 0.3% |
| Oceania | 11 | 0.0% |
| Panama | 15 | 0.0% |
| Peru | 66 | 0.1% |
| Philippines | 38 | 0.1% |
| Romania | 94 | 0.1% |
| Russia | 1 | 0.0% |
| South America | 2,086 | 2.5% |
| South Central Asia | 86 | 0.1% |
| South Eastern Asia | 762 | 0.9% |
| Southern Europe | 88 | 0.1% |
| Sri Lanka | 74 | 0.1% |
| St. Vincent and the Grenadines | 64 | 0.1% |
| Sweden | 16 | 0.0% |
| Taiwan | 35 | 0.0% |
| Trinidad and Tobago | 278 | 0.3% |
| Venezuela | 46 | 0.1% |
| Vietnam | 679 | 0.8% |
| West Indies | 37 | 0.0% |
| Western Africa | 42 | 0.1% |
| Western Asia | 11 | 0.0% |
| Western Europe | 45 | 0.1% | View All 57 Rows |
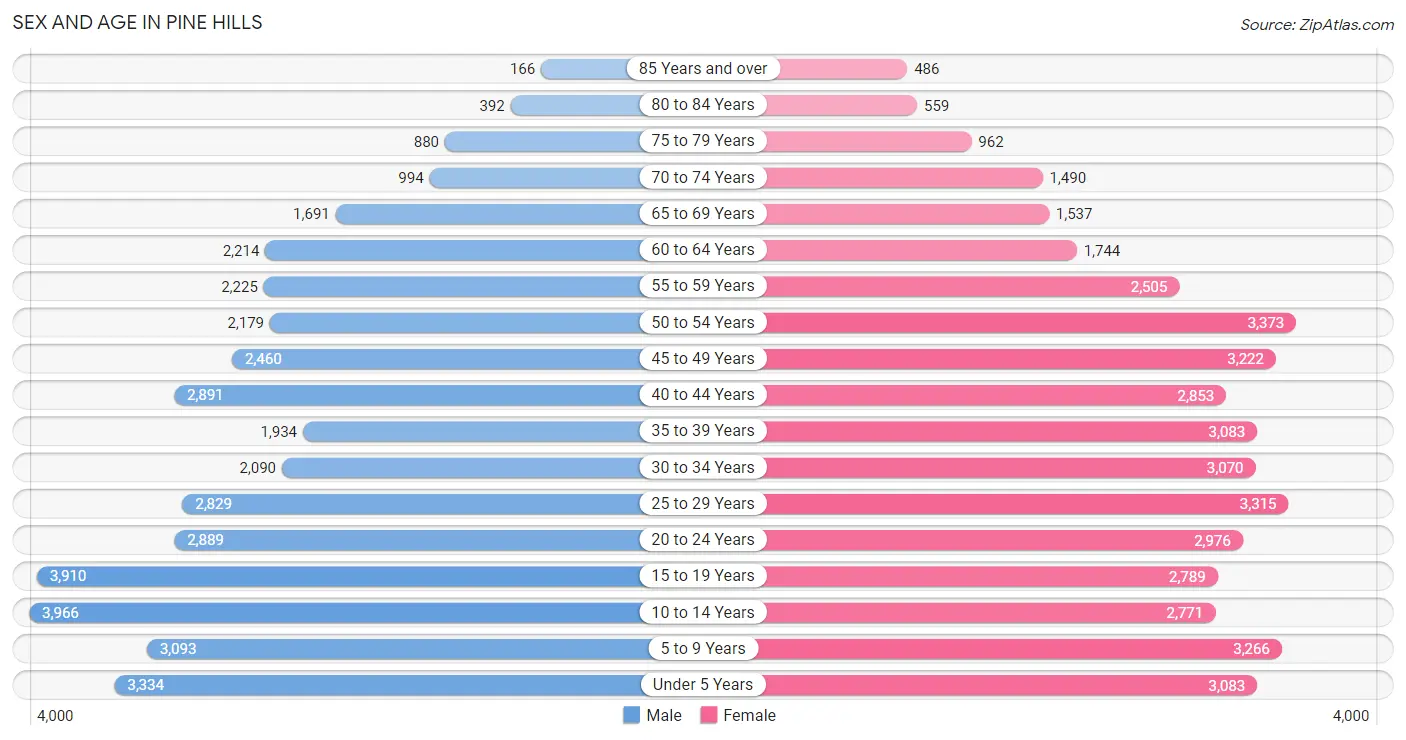
Sex and Age in Pine Hills
Sex and Age in Pine Hills
The most populous age groups in Pine Hills are 10 to 14 Years (3,966 | 9.9%) for men and 50 to 54 Years (3,373 | 7.8%) for women.
| Age Bracket | Male | Female |
| Under 5 Years | 3,334 (8.3%) | 3,083 (7.2%) |
| 5 to 9 Years | 3,093 (7.7%) | 3,266 (7.6%) |
| 10 to 14 Years | 3,966 (9.9%) | 2,771 (6.4%) |
| 15 to 19 Years | 3,910 (9.7%) | 2,789 (6.5%) |
| 20 to 24 Years | 2,889 (7.2%) | 2,976 (6.9%) |
| 25 to 29 Years | 2,829 (7.0%) | 3,315 (7.7%) |
| 30 to 34 Years | 2,090 (5.2%) | 3,070 (7.1%) |
| 35 to 39 Years | 1,934 (4.8%) | 3,083 (7.2%) |
| 40 to 44 Years | 2,891 (7.2%) | 2,853 (6.6%) |
| 45 to 49 Years | 2,460 (6.1%) | 3,222 (7.5%) |
| 50 to 54 Years | 2,179 (5.4%) | 3,373 (7.8%) |
| 55 to 59 Years | 2,225 (5.5%) | 2,505 (5.8%) |
| 60 to 64 Years | 2,214 (5.5%) | 1,744 (4.1%) |
| 65 to 69 Years | 1,691 (4.2%) | 1,537 (3.6%) |
| 70 to 74 Years | 994 (2.5%) | 1,490 (3.5%) |
| 75 to 79 Years | 880 (2.2%) | 962 (2.2%) |
| 80 to 84 Years | 392 (1.0%) | 559 (1.3%) |
| 85 Years and over | 166 (0.4%) | 486 (1.1%) |
| Total | 40,137 (100.0%) | 43,084 (100.0%) |
Families and Households in Pine Hills
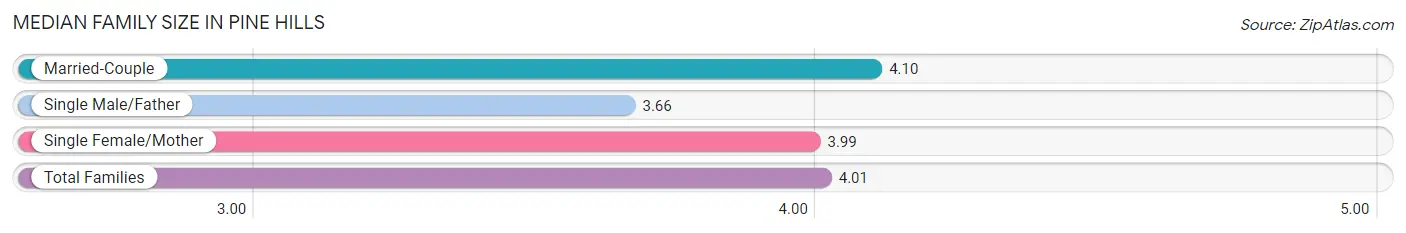
Median Family Size in Pine Hills
The median family size in Pine Hills is 4.01 persons per family, with married-couple families (9,128 | 51.3%) accounting for the largest median family size of 4.1 persons per family. On the other hand, single male/father families (2,094 | 11.8%) represent the smallest median family size with 3.66 persons per family.
| Family Type | # Families | Family Size |
| Married-Couple | 9,128 (51.3%) | 4.10 |
| Single Male/Father | 2,094 (11.8%) | 3.66 |
| Single Female/Mother | 6,568 (36.9%) | 3.99 |
| Total Families | 17,790 (100.0%) | 4.01 |
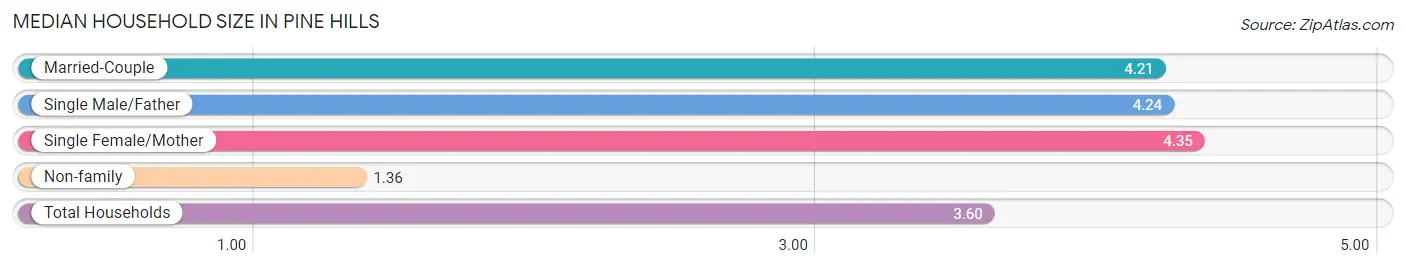
Median Household Size in Pine Hills
The median household size in Pine Hills is 3.60 persons per household, with single female/mother households (6,568 | 28.4%) accounting for the largest median household size of 4.35 persons per household. non-family households (5,293 | 22.9%) represent the smallest median household size with 1.36 persons per household.
| Household Type | # Households | Household Size |
| Married-Couple | 9,128 (39.5%) | 4.21 |
| Single Male/Father | 2,094 (9.1%) | 4.24 |
| Single Female/Mother | 6,568 (28.4%) | 4.35 |
| Non-family | 5,293 (22.9%) | 1.36 |
| Total Households | 23,083 (100.0%) | 3.60 |
Household Size by Marriage Status in Pine Hills
Out of a total of 23,083 households in Pine Hills, 17,790 (77.1%) are family households, while 5,293 (22.9%) are nonfamily households. The most numerous type of family households are 3-person households, comprising 5,141, and the most common type of nonfamily households are 1-person households, comprising 4,309.
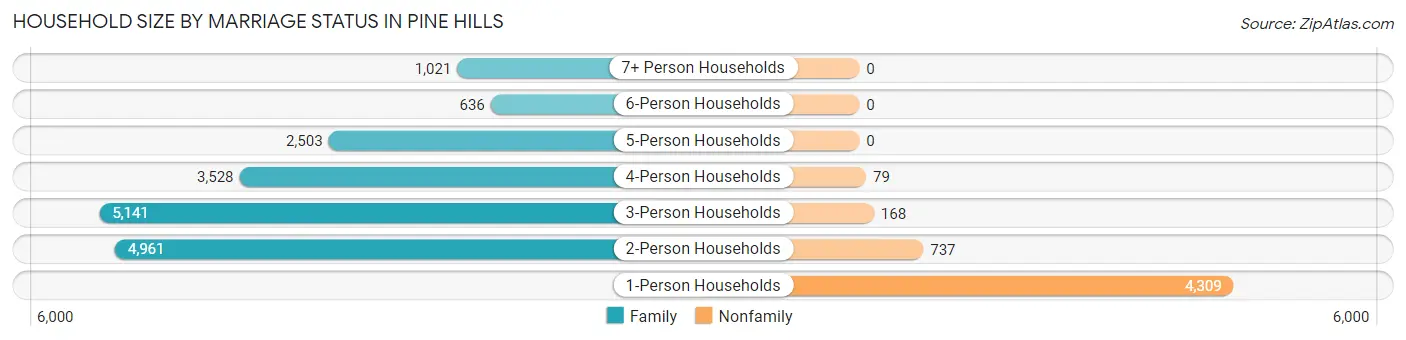
| Household Size | Family Households | Nonfamily Households |
| 1-Person Households | - | 4,309 (18.7%) |
| 2-Person Households | 4,961 (21.5%) | 737 (3.2%) |
| 3-Person Households | 5,141 (22.3%) | 168 (0.7%) |
| 4-Person Households | 3,528 (15.3%) | 79 (0.3%) |
| 5-Person Households | 2,503 (10.8%) | 0 (0.0%) |
| 6-Person Households | 636 (2.8%) | 0 (0.0%) |
| 7+ Person Households | 1,021 (4.4%) | 0 (0.0%) |
| Total | 17,790 (77.1%) | 5,293 (22.9%) |
Female Fertility in Pine Hills
Fertility by Age in Pine Hills
Average fertility rate in Pine Hills is 110.0 births per 1,000 women. Women in the age bracket of 20 to 34 years have the highest fertility rate with 149.0 births per 1,000 women. Women in the age bracket of 20 to 34 years acount for 58.3% of all women with births.
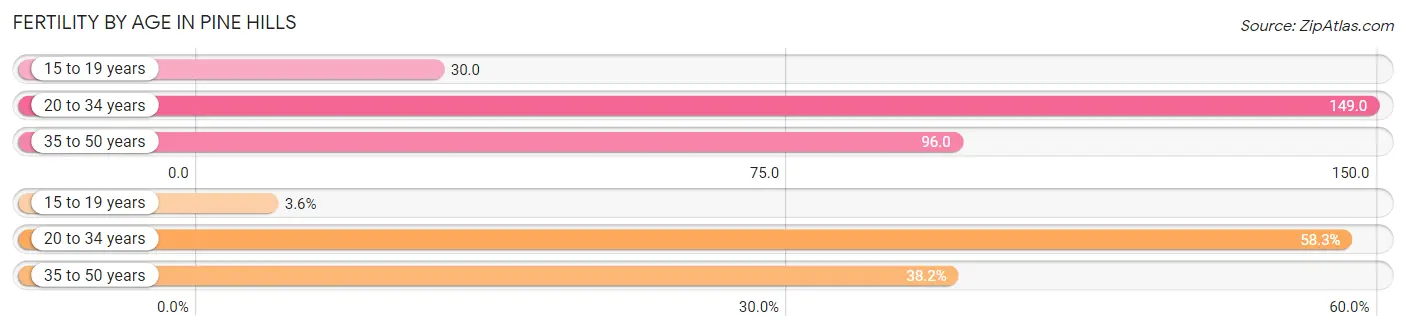
| Age Bracket | Women with Births | Births / 1,000 Women |
| 15 to 19 years | 85 (3.5%) | 30.0 |
| 20 to 34 years | 1,395 (58.3%) | 149.0 |
| 35 to 50 years | 915 (38.2%) | 96.0 |
| Total | 2,395 (100.0%) | 110.0 |
Fertility by Age by Marriage Status in Pine Hills
50.9% of women with births (2,395) in Pine Hills are married. The highest percentage of unmarried women with births falls into 15 to 19 years age bracket with 100.0% of them unmarried at the time of birth, while the lowest percentage of unmarried women with births belong to 35 to 50 years age bracket with 6.0% of them unmarried.
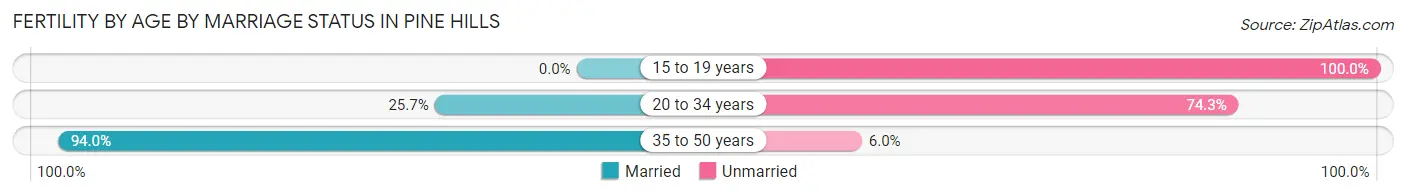
| Age Bracket | Married | Unmarried |
| 15 to 19 years | 0 (0.0%) | 85 (100.0%) |
| 20 to 34 years | 359 (25.7%) | 1,036 (74.3%) |
| 35 to 50 years | 860 (94.0%) | 55 (6.0%) |
| Total | 1,219 (50.9%) | 1,176 (49.1%) |
Fertility by Education in Pine Hills
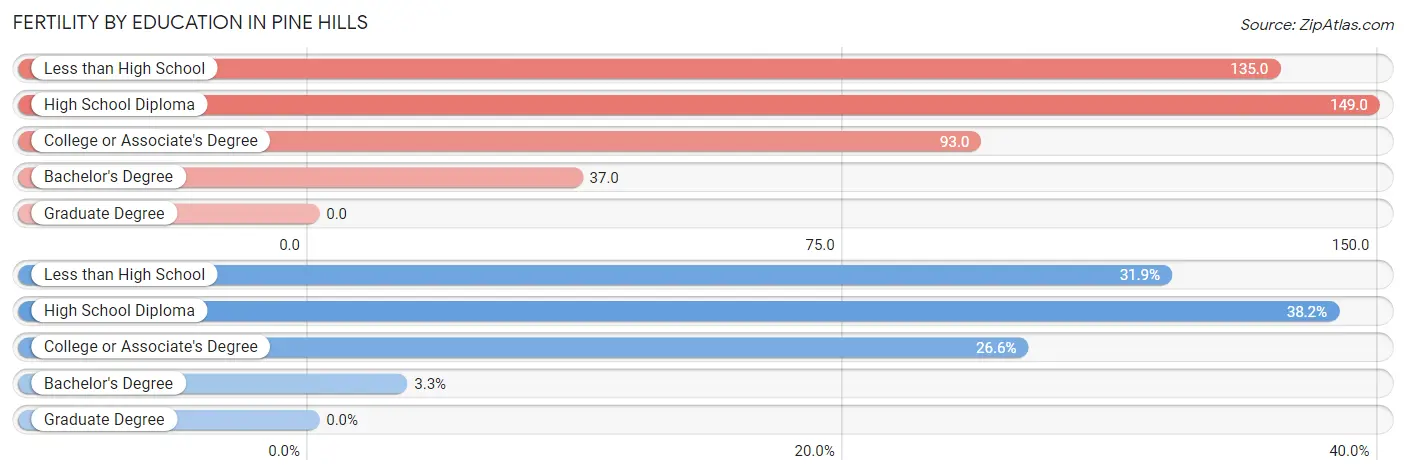
| Educational Attainment | Women with Births | Births / 1,000 Women |
| Less than High School | 765 (31.9%) | 135.0 |
| High School Diploma | 915 (38.2%) | 149.0 |
| College or Associate's Degree | 636 (26.6%) | 93.0 |
| Bachelor's Degree | 79 (3.3%) | 37.0 |
| Graduate Degree | 0 (0.0%) | 0.0 |
| Total | 2,395 (100.0%) | 110.0 |
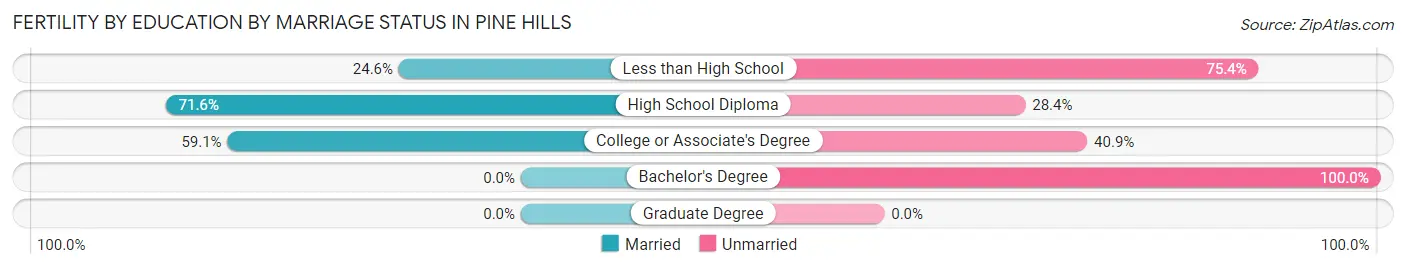
Fertility by Education by Marriage Status in Pine Hills
49.1% of women with births in Pine Hills are unmarried. Women with the educational attainment of high school diploma are most likely to be married with 71.6% of them married at childbirth, while women with the educational attainment of bachelor's degree are least likely to be married with 100.0% of them unmarried at childbirth.
| Educational Attainment | Married | Unmarried |
| Less than High School | 188 (24.6%) | 577 (75.4%) |
| High School Diploma | 655 (71.6%) | 260 (28.4%) |
| College or Associate's Degree | 376 (59.1%) | 260 (40.9%) |
| Bachelor's Degree | 0 (0.0%) | 79 (100.0%) |
| Graduate Degree | 0 (0.0%) | 0 (0.0%) |
| Total | 1,219 (50.9%) | 1,176 (49.1%) |
Employment Characteristics in Pine Hills
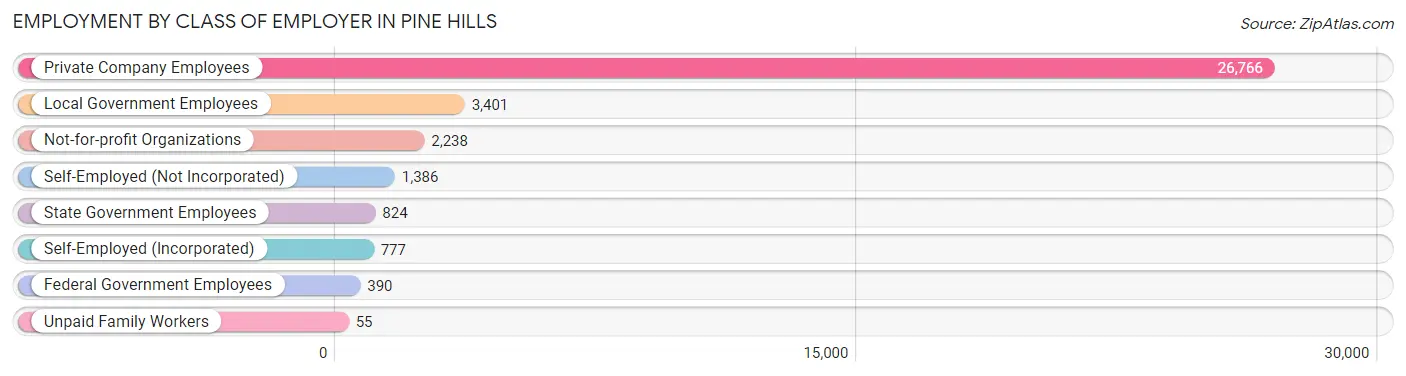
Employment by Class of Employer in Pine Hills
Among the 35,837 employed individuals in Pine Hills, private company employees (26,766 | 74.7%), local government employees (3,401 | 9.5%), and not-for-profit organizations (2,238 | 6.2%) make up the most common classes of employment.
| Employer Class | # Employees | % Employees |
| Private Company Employees | 26,766 | 74.7% |
| Self-Employed (Incorporated) | 777 | 2.2% |
| Self-Employed (Not Incorporated) | 1,386 | 3.9% |
| Not-for-profit Organizations | 2,238 | 6.2% |
| Local Government Employees | 3,401 | 9.5% |
| State Government Employees | 824 | 2.3% |
| Federal Government Employees | 390 | 1.1% |
| Unpaid Family Workers | 55 | 0.2% |
| Total | 35,837 | 100.0% |
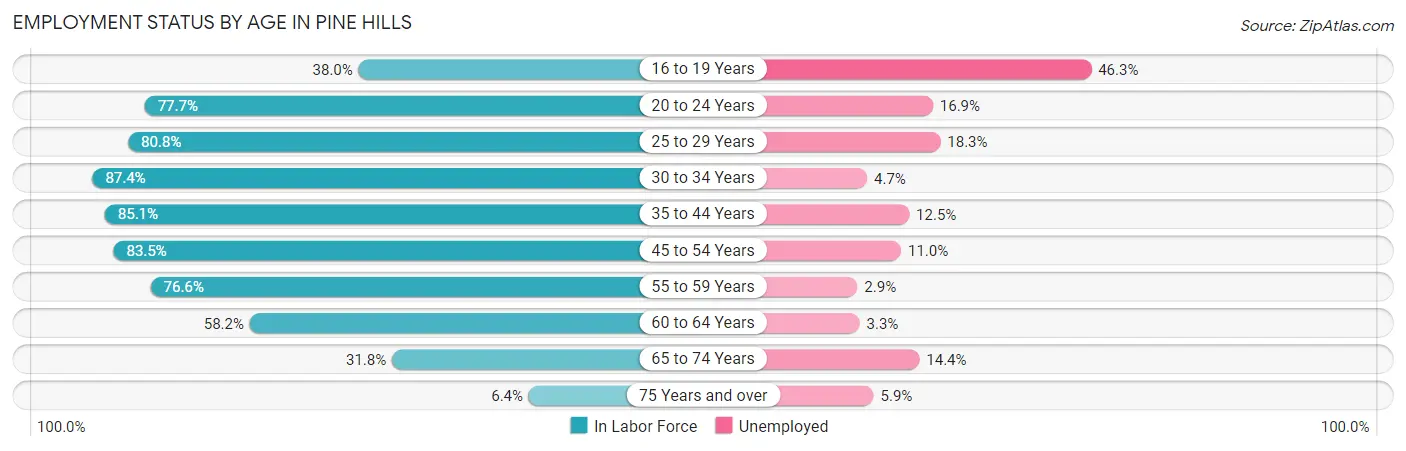
Employment Status by Age in Pine Hills
According to the labor force statistics for Pine Hills, out of the total population over 16 years of age (61,911), 68.5% or 42,409 individuals are in the labor force, with 12.7% or 5,386 of them unemployed. The age group with the highest labor force participation rate is 30 to 34 years, with 87.4% or 4,510 individuals in the labor force. Within the labor force, the 16 to 19 years age range has the highest percentage of unemployed individuals, with 46.3% or 863 of them being unemployed.
| Age Bracket | In Labor Force | Unemployed |
| 16 to 19 Years | 1,863 (38.0%) | 863 (46.3%) |
| 20 to 24 Years | 4,557 (77.7%) | 770 (16.9%) |
| 25 to 29 Years | 4,964 (80.8%) | 908 (18.3%) |
| 30 to 34 Years | 4,510 (87.4%) | 212 (4.7%) |
| 35 to 44 Years | 9,158 (85.1%) | 1,145 (12.5%) |
| 45 to 54 Years | 9,380 (83.5%) | 1,032 (11.0%) |
| 55 to 59 Years | 3,623 (76.6%) | 105 (2.9%) |
| 60 to 64 Years | 2,304 (58.2%) | 76 (3.3%) |
| 65 to 74 Years | 1,816 (31.8%) | 262 (14.4%) |
| 75 Years and over | 220 (6.4%) | 13 (5.9%) |
| Total | 42,409 (68.5%) | 5,386 (12.7%) |
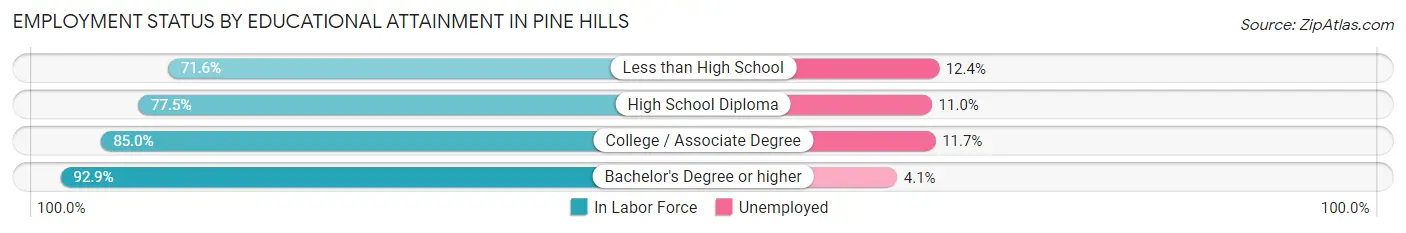
Employment Status by Educational Attainment in Pine Hills
According to labor force statistics for Pine Hills, 80.9% of individuals (33,967) out of the total population between 25 and 64 years of age (41,987) are in the labor force, with 10.3% or 3,499 of them being unemployed. The group with the highest labor force participation rate are those with the educational attainment of bachelor's degree or higher, with 92.9% or 6,072 individuals in the labor force. Within the labor force, individuals with less than high school education have the highest percentage of unemployment, with 12.4% or 800 of them being unemployed.
| Educational Attainment | In Labor Force | Unemployed |
| Less than High School | 6,450 (71.6%) | 1,117 (12.4%) |
| High School Diploma | 10,765 (77.5%) | 1,528 (11.0%) |
| College / Associate Degree | 10,669 (85.0%) | 1,469 (11.7%) |
| Bachelor's Degree or higher | 6,072 (92.9%) | 268 (4.1%) |
| Total | 33,967 (80.9%) | 4,325 (10.3%) |
Employment Occupations by Sex in Pine Hills
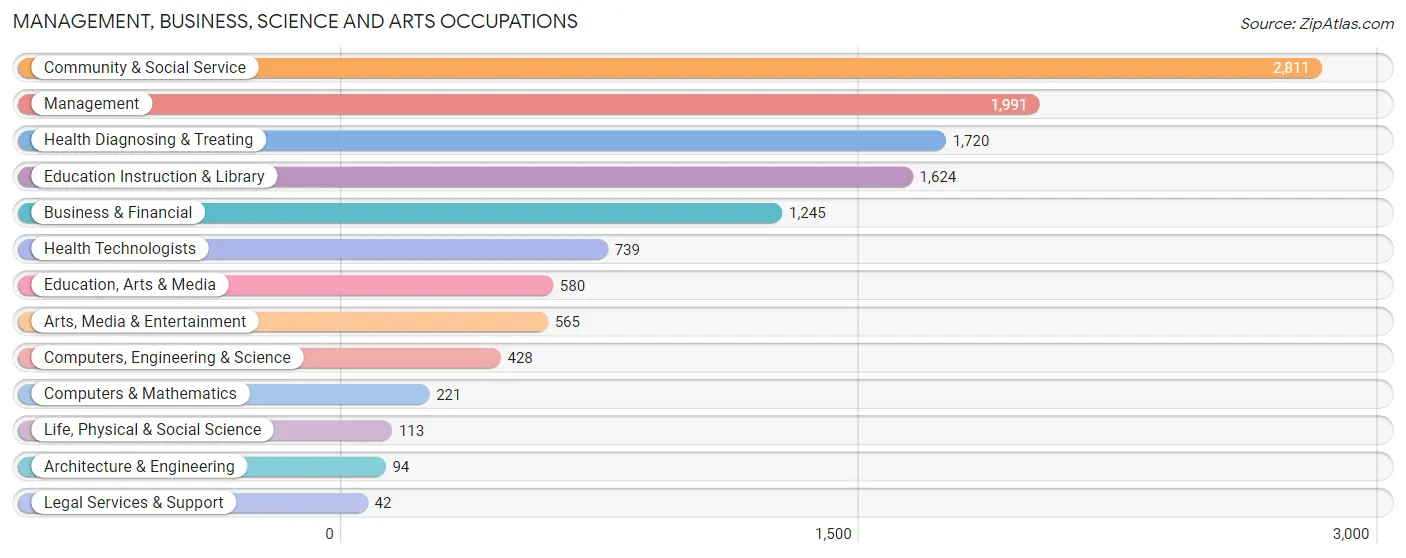
Management, Business, Science and Arts Occupations
The most common Management, Business, Science and Arts occupations in Pine Hills are Community & Social Service (2,811 | 7.6%), Management (1,991 | 5.4%), Health Diagnosing & Treating (1,720 | 4.6%), Education Instruction & Library (1,624 | 4.4%), and Business & Financial (1,245 | 3.4%).
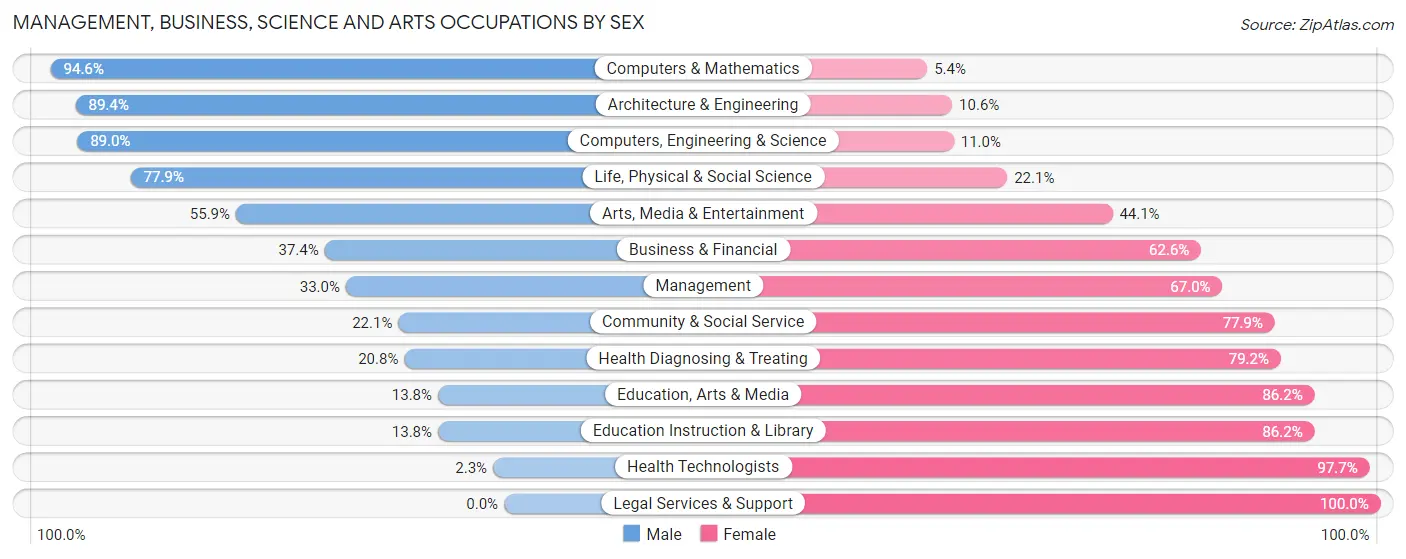
Management, Business, Science and Arts Occupations by Sex
Within the Management, Business, Science and Arts occupations in Pine Hills, the most male-oriented occupations are Computers & Mathematics (94.6%), Architecture & Engineering (89.4%), and Computers, Engineering & Science (89.0%), while the most female-oriented occupations are Legal Services & Support (100.0%), Health Technologists (97.7%), and Education, Arts & Media (86.2%).
| Occupation | Male | Female |
| Management | 657 (33.0%) | 1,334 (67.0%) |
| Business & Financial | 466 (37.4%) | 779 (62.6%) |
| Computers, Engineering & Science | 381 (89.0%) | 47 (11.0%) |
| Computers & Mathematics | 209 (94.6%) | 12 (5.4%) |
| Architecture & Engineering | 84 (89.4%) | 10 (10.6%) |
| Life, Physical & Social Science | 88 (77.9%) | 25 (22.1%) |
| Community & Social Service | 620 (22.1%) | 2,191 (77.9%) |
| Education, Arts & Media | 80 (13.8%) | 500 (86.2%) |
| Legal Services & Support | 0 (0.0%) | 42 (100.0%) |
| Education Instruction & Library | 224 (13.8%) | 1,400 (86.2%) |
| Arts, Media & Entertainment | 316 (55.9%) | 249 (44.1%) |
| Health Diagnosing & Treating | 358 (20.8%) | 1,362 (79.2%) |
| Health Technologists | 17 (2.3%) | 722 (97.7%) |
| Total (Category) | 2,482 (30.3%) | 5,713 (69.7%) |
| Total (Overall) | 17,082 (46.2%) | 19,935 (53.8%) |
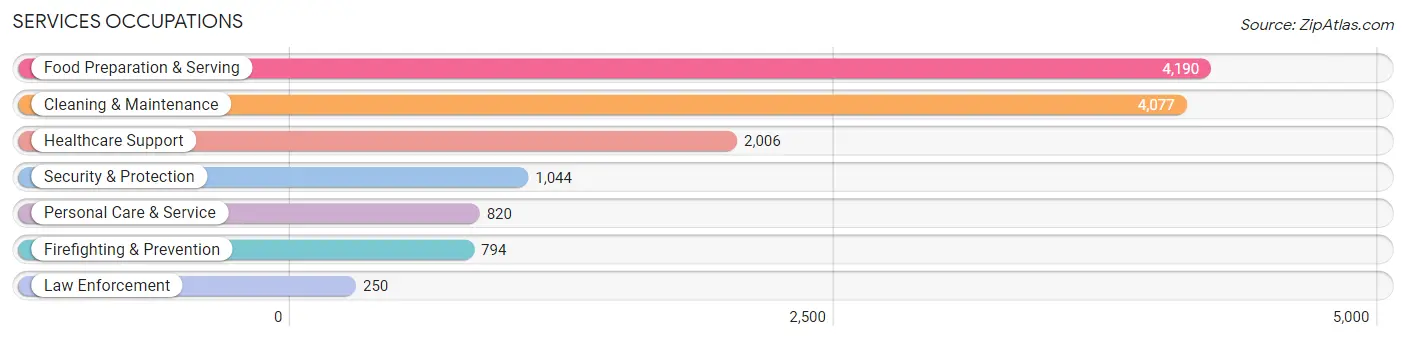
Services Occupations
The most common Services occupations in Pine Hills are Food Preparation & Serving (4,190 | 11.3%), Cleaning & Maintenance (4,077 | 11.0%), Healthcare Support (2,006 | 5.4%), Security & Protection (1,044 | 2.8%), and Personal Care & Service (820 | 2.2%).
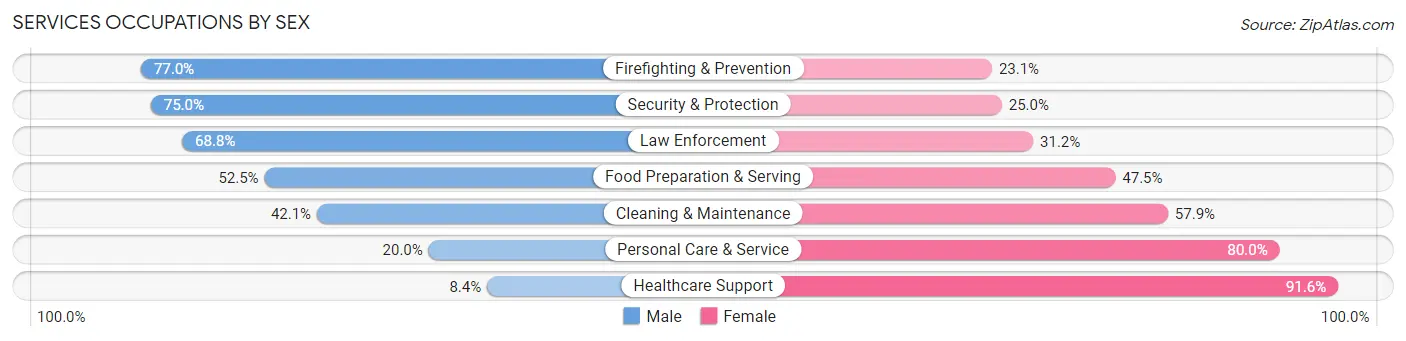
Services Occupations by Sex
Within the Services occupations in Pine Hills, the most male-oriented occupations are Firefighting & Prevention (76.9%), Security & Protection (75.0%), and Law Enforcement (68.8%), while the most female-oriented occupations are Healthcare Support (91.6%), Personal Care & Service (80.0%), and Cleaning & Maintenance (57.9%).
| Occupation | Male | Female |
| Healthcare Support | 169 (8.4%) | 1,837 (91.6%) |
| Security & Protection | 783 (75.0%) | 261 (25.0%) |
| Firefighting & Prevention | 611 (76.9%) | 183 (23.1%) |
| Law Enforcement | 172 (68.8%) | 78 (31.2%) |
| Food Preparation & Serving | 2,200 (52.5%) | 1,990 (47.5%) |
| Cleaning & Maintenance | 1,717 (42.1%) | 2,360 (57.9%) |
| Personal Care & Service | 164 (20.0%) | 656 (80.0%) |
| Total (Category) | 5,033 (41.5%) | 7,104 (58.5%) |
| Total (Overall) | 17,082 (46.2%) | 19,935 (53.8%) |
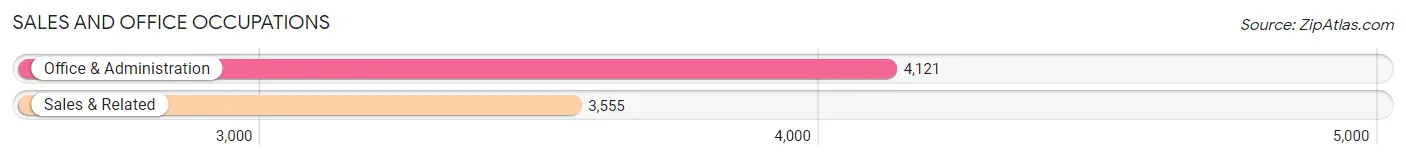
Sales and Office Occupations
The most common Sales and Office occupations in Pine Hills are Office & Administration (4,121 | 11.1%), and Sales & Related (3,555 | 9.6%).
Sales and Office Occupations by Sex
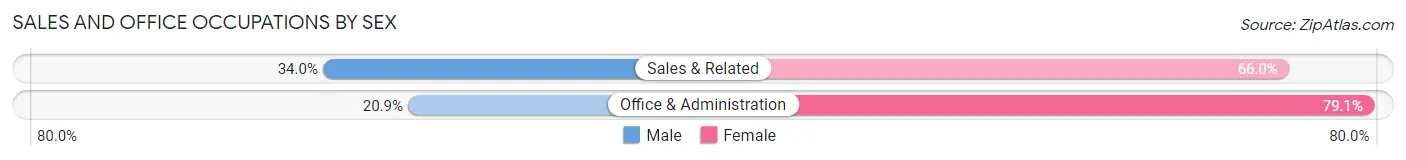
| Occupation | Male | Female |
| Sales & Related | 1,208 (34.0%) | 2,347 (66.0%) |
| Office & Administration | 861 (20.9%) | 3,260 (79.1%) |
| Total (Category) | 2,069 (27.0%) | 5,607 (73.1%) |
| Total (Overall) | 17,082 (46.2%) | 19,935 (53.8%) |
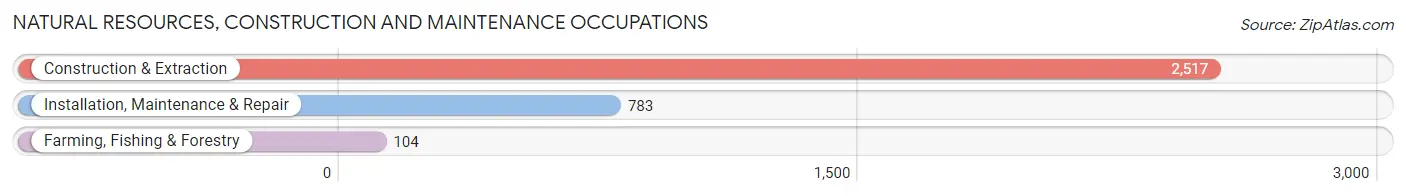
Natural Resources, Construction and Maintenance Occupations
The most common Natural Resources, Construction and Maintenance occupations in Pine Hills are Construction & Extraction (2,517 | 6.8%), Installation, Maintenance & Repair (783 | 2.1%), and Farming, Fishing & Forestry (104 | 0.3%).
Natural Resources, Construction and Maintenance Occupations by Sex
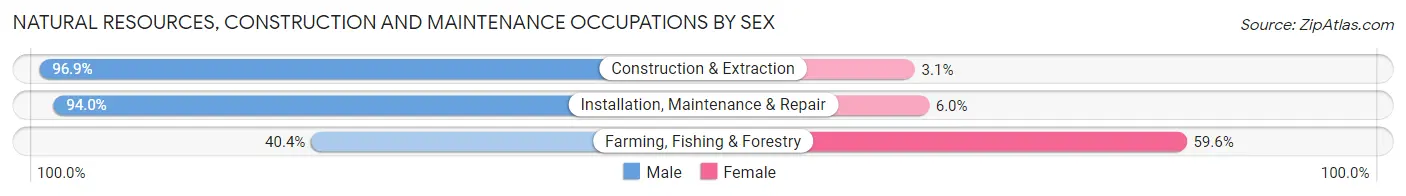
| Occupation | Male | Female |
| Farming, Fishing & Forestry | 42 (40.4%) | 62 (59.6%) |
| Construction & Extraction | 2,440 (96.9%) | 77 (3.1%) |
| Installation, Maintenance & Repair | 736 (94.0%) | 47 (6.0%) |
| Total (Category) | 3,218 (94.5%) | 186 (5.5%) |
| Total (Overall) | 17,082 (46.2%) | 19,935 (53.8%) |
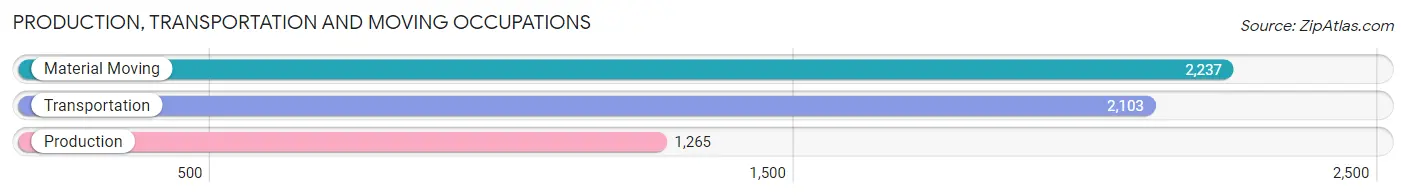
Production, Transportation and Moving Occupations
The most common Production, Transportation and Moving occupations in Pine Hills are Material Moving (2,237 | 6.0%), Transportation (2,103 | 5.7%), and Production (1,265 | 3.4%).
Production, Transportation and Moving Occupations by Sex
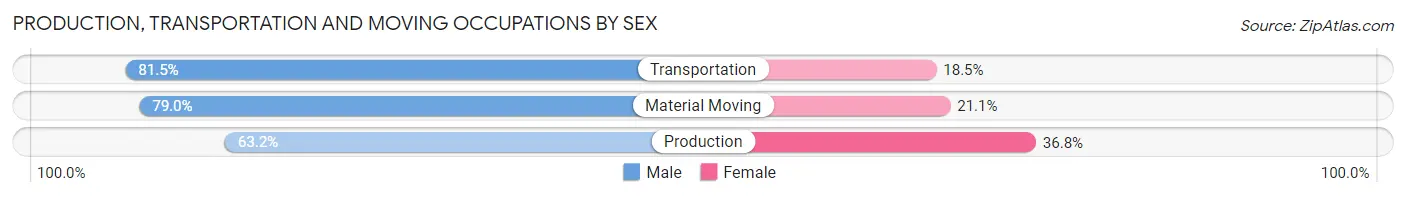
| Occupation | Male | Female |
| Production | 800 (63.2%) | 465 (36.8%) |
| Transportation | 1,714 (81.5%) | 389 (18.5%) |
| Material Moving | 1,766 (78.9%) | 471 (21.0%) |
| Total (Category) | 4,280 (76.4%) | 1,325 (23.6%) |
| Total (Overall) | 17,082 (46.2%) | 19,935 (53.8%) |
Employment Industries by Sex in Pine Hills
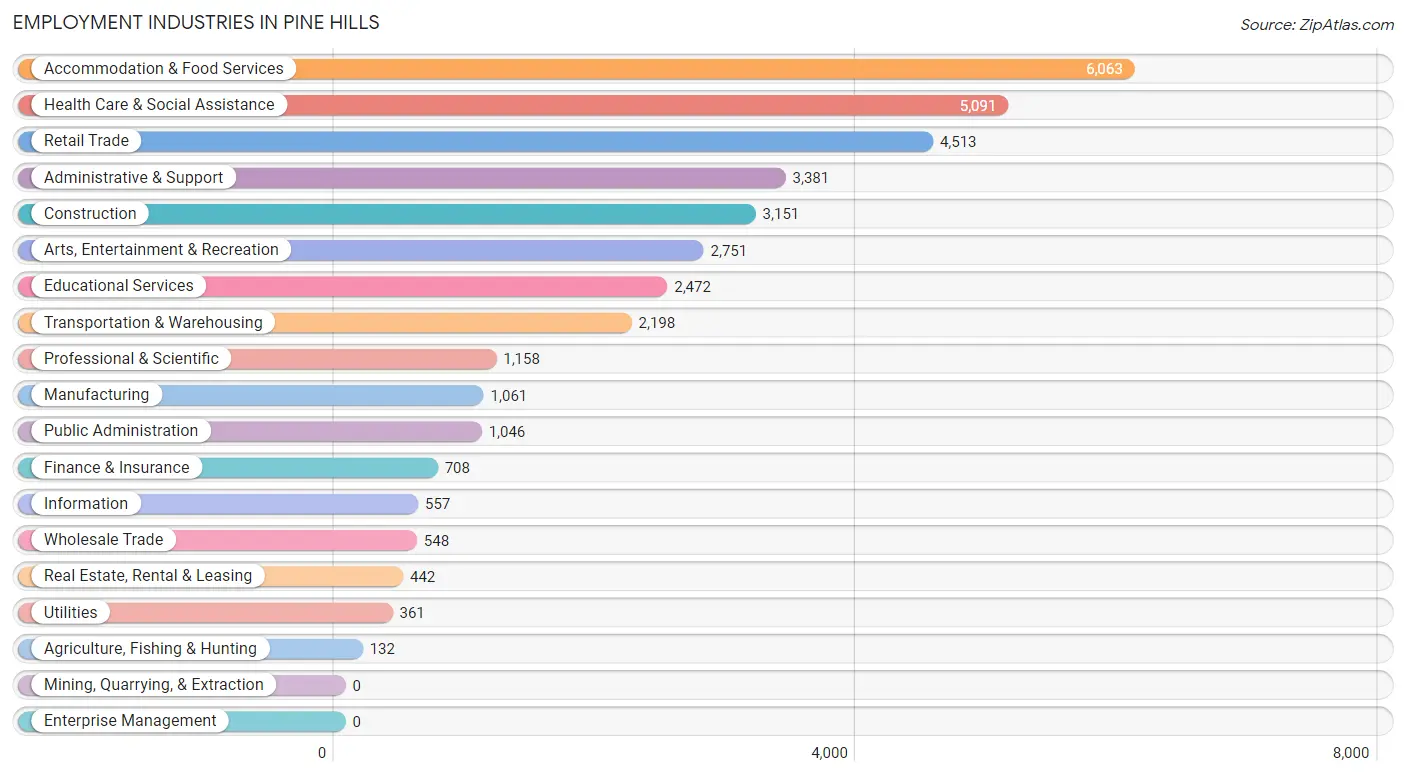
Employment Industries in Pine Hills
The major employment industries in Pine Hills include Accommodation & Food Services (6,063 | 16.4%), Health Care & Social Assistance (5,091 | 13.8%), Retail Trade (4,513 | 12.2%), Administrative & Support (3,381 | 9.1%), and Construction (3,151 | 8.5%).
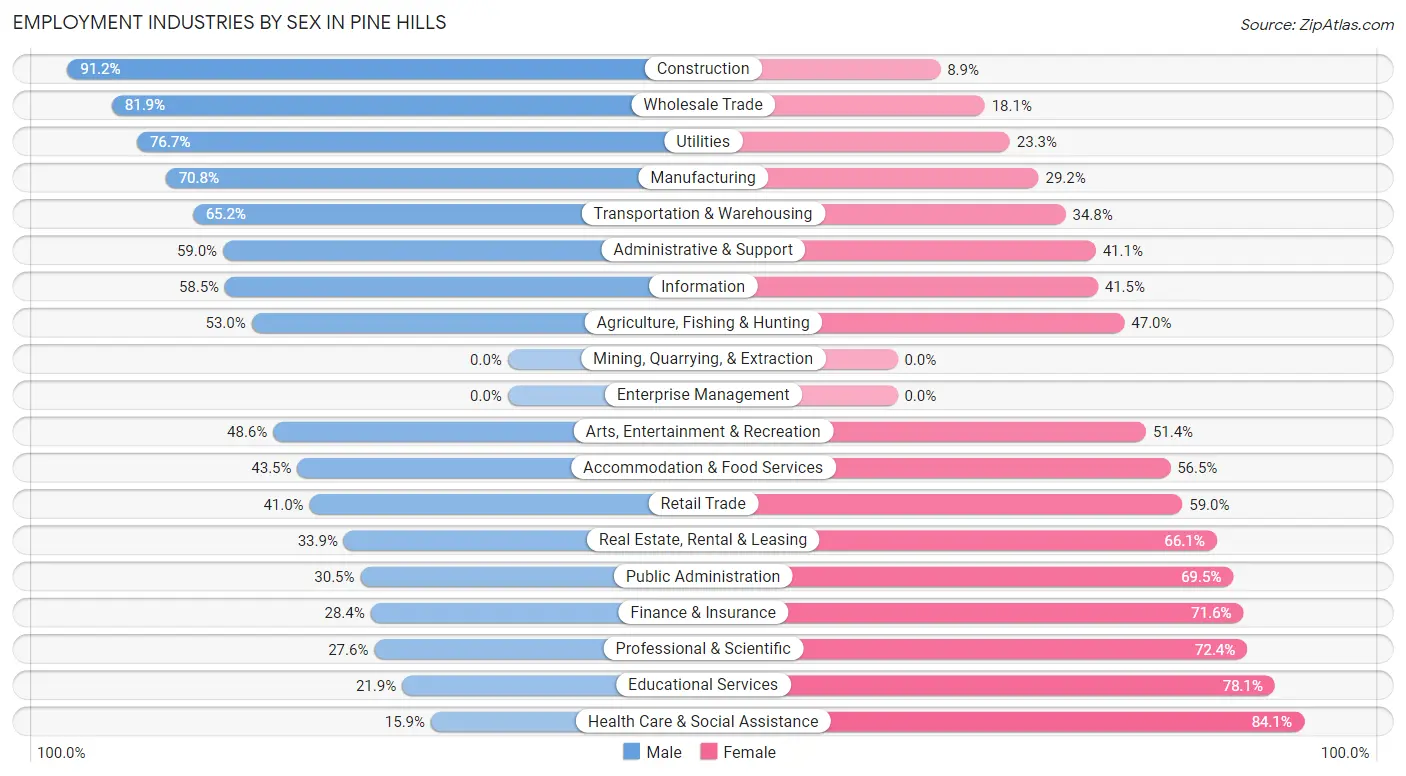
Employment Industries by Sex in Pine Hills
The Pine Hills industries that see more men than women are Construction (91.1%), Wholesale Trade (81.9%), and Utilities (76.7%), whereas the industries that tend to have a higher number of women are Health Care & Social Assistance (84.1%), Educational Services (78.1%), and Professional & Scientific (72.4%).
| Industry | Male | Female |
| Agriculture, Fishing & Hunting | 70 (53.0%) | 62 (47.0%) |
| Mining, Quarrying, & Extraction | 0 (0.0%) | 0 (0.0%) |
| Construction | 2,872 (91.1%) | 279 (8.8%) |
| Manufacturing | 751 (70.8%) | 310 (29.2%) |
| Wholesale Trade | 449 (81.9%) | 99 (18.1%) |
| Retail Trade | 1,852 (41.0%) | 2,661 (59.0%) |
| Transportation & Warehousing | 1,433 (65.2%) | 765 (34.8%) |
| Utilities | 277 (76.7%) | 84 (23.3%) |
| Information | 326 (58.5%) | 231 (41.5%) |
| Finance & Insurance | 201 (28.4%) | 507 (71.6%) |
| Real Estate, Rental & Leasing | 150 (33.9%) | 292 (66.1%) |
| Professional & Scientific | 320 (27.6%) | 838 (72.4%) |
| Enterprise Management | 0 (0.0%) | 0 (0.0%) |
| Administrative & Support | 1,993 (59.0%) | 1,388 (41.0%) |
| Educational Services | 541 (21.9%) | 1,931 (78.1%) |
| Health Care & Social Assistance | 810 (15.9%) | 4,281 (84.1%) |
| Arts, Entertainment & Recreation | 1,336 (48.6%) | 1,415 (51.4%) |
| Accommodation & Food Services | 2,640 (43.5%) | 3,423 (56.5%) |
| Public Administration | 319 (30.5%) | 727 (69.5%) |
| Total | 17,082 (46.2%) | 19,935 (53.8%) |
Education in Pine Hills
School Enrollment in Pine Hills
The most common levels of schooling among the 25,232 students in Pine Hills are high school (5,839 | 23.1%), elementary school (5,492 | 21.8%), and middle school (5,235 | 20.7%).
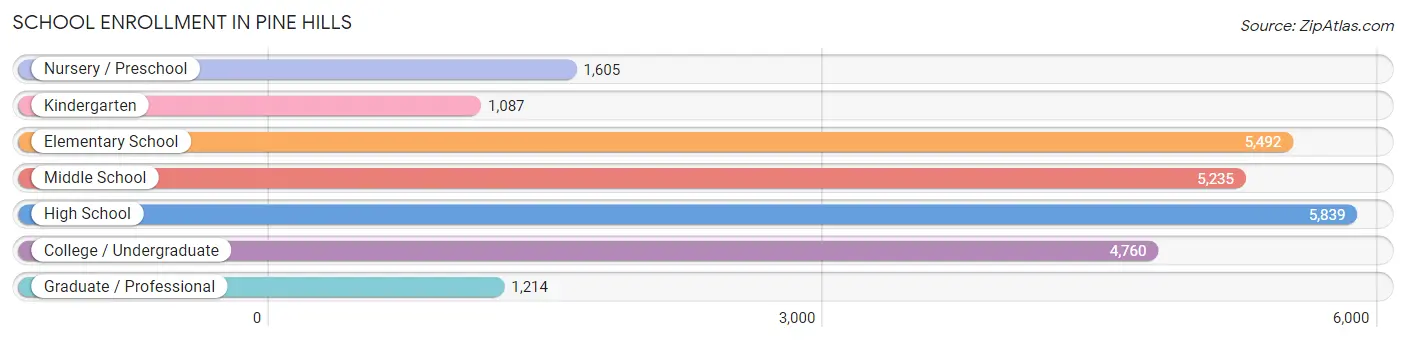
| School Level | # Students | % Students |
| Nursery / Preschool | 1,605 | 6.4% |
| Kindergarten | 1,087 | 4.3% |
| Elementary School | 5,492 | 21.8% |
| Middle School | 5,235 | 20.7% |
| High School | 5,839 | 23.1% |
| College / Undergraduate | 4,760 | 18.9% |
| Graduate / Professional | 1,214 | 4.8% |
| Total | 25,232 | 100.0% |
School Enrollment by Age by Funding Source in Pine Hills
Out of a total of 25,232 students who are enrolled in schools in Pine Hills, 5,173 (20.5%) attend a private institution, while the remaining 20,059 (79.5%) are enrolled in public schools. The age group of 35 years and over has the highest likelihood of being enrolled in private schools, with 1,015 (46.2% in the age bracket) enrolled. Conversely, the age group of 18 to 19 year olds has the lowest likelihood of being enrolled in a private school, with 1,825 (95.5% in the age bracket) attending a public institution.
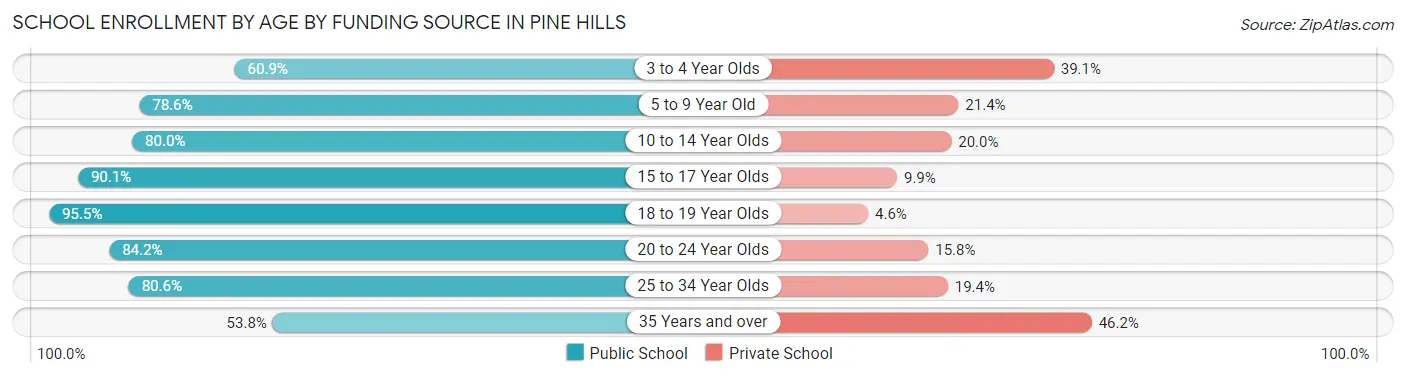
| Age Bracket | Public School | Private School |
| 3 to 4 Year Olds | 812 (60.9%) | 522 (39.1%) |
| 5 to 9 Year Old | 4,815 (78.6%) | 1,309 (21.4%) |
| 10 to 14 Year Olds | 5,252 (80.0%) | 1,316 (20.0%) |
| 15 to 17 Year Olds | 3,608 (90.1%) | 398 (9.9%) |
| 18 to 19 Year Olds | 1,825 (95.5%) | 87 (4.5%) |
| 20 to 24 Year Olds | 1,588 (84.2%) | 297 (15.8%) |
| 25 to 34 Year Olds | 972 (80.6%) | 234 (19.4%) |
| 35 Years and over | 1,182 (53.8%) | 1,015 (46.2%) |
| Total | 20,059 (79.5%) | 5,173 (20.5%) |
Educational Attainment by Field of Study in Pine Hills
Science & technology (1,554 | 18.5%), business (1,518 | 18.1%), education (1,092 | 13.0%), arts & humanities (839 | 10.0%), and psychology (572 | 6.8%) are the most common fields of study among 8,394 individuals in Pine Hills who have obtained a bachelor's degree or higher.
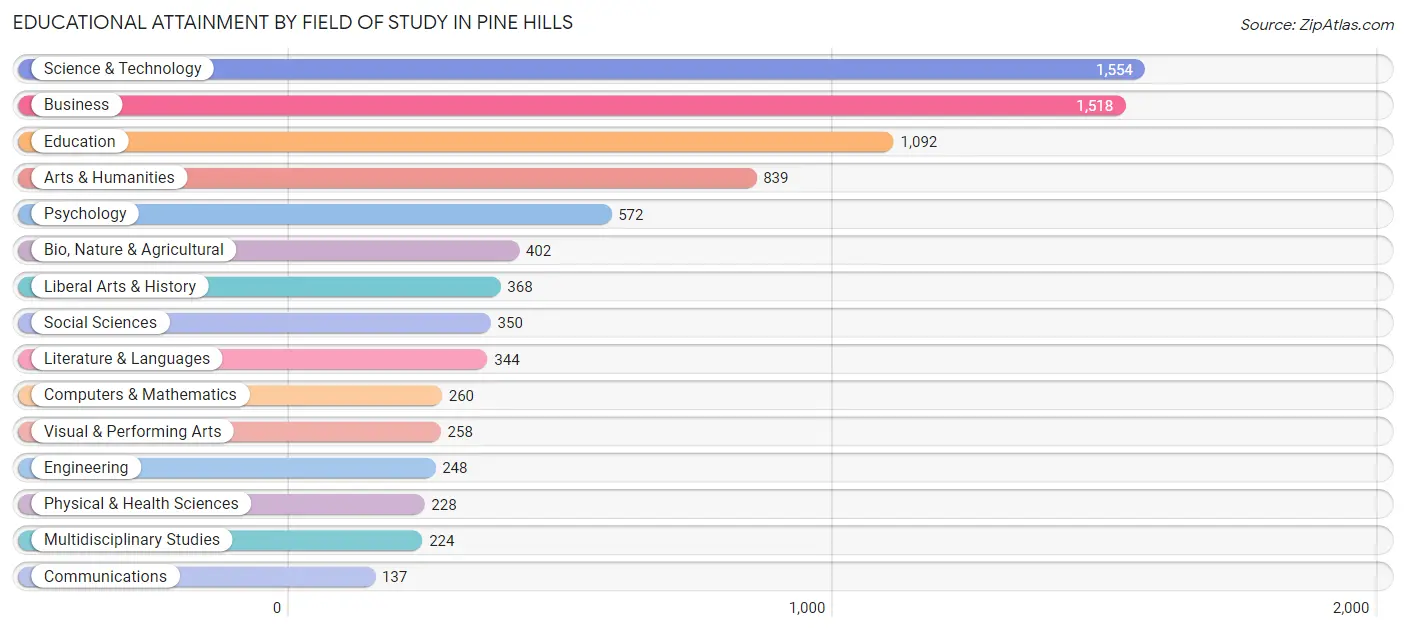
| Field of Study | # Graduates | % Graduates |
| Computers & Mathematics | 260 | 3.1% |
| Bio, Nature & Agricultural | 402 | 4.8% |
| Physical & Health Sciences | 228 | 2.7% |
| Psychology | 572 | 6.8% |
| Social Sciences | 350 | 4.2% |
| Engineering | 248 | 2.9% |
| Multidisciplinary Studies | 224 | 2.7% |
| Science & Technology | 1,554 | 18.5% |
| Business | 1,518 | 18.1% |
| Education | 1,092 | 13.0% |
| Literature & Languages | 344 | 4.1% |
| Liberal Arts & History | 368 | 4.4% |
| Visual & Performing Arts | 258 | 3.1% |
| Communications | 137 | 1.6% |
| Arts & Humanities | 839 | 10.0% |
| Total | 8,394 | 100.0% |
Transportation & Commute in Pine Hills
Vehicle Availability by Sex in Pine Hills
The most prevalent vehicle ownership categories in Pine Hills are males with 2 vehicles (6,439, accounting for 38.2%) and females with 2 vehicles (6,865, making up 34.0%).
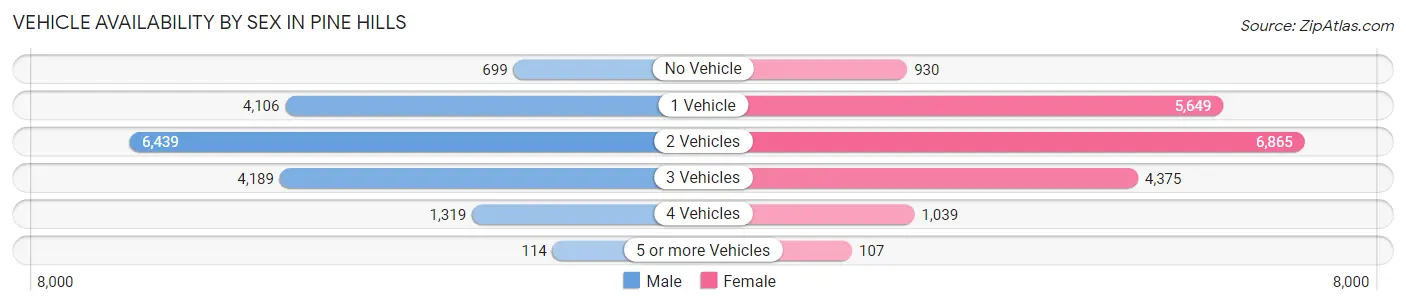
| Vehicles Available | Male | Female |
| No Vehicle | 699 (4.1%) | 930 (4.9%) |
| 1 Vehicle | 4,106 (24.3%) | 5,649 (29.8%) |
| 2 Vehicles | 6,439 (38.2%) | 6,865 (36.2%) |
| 3 Vehicles | 4,189 (24.8%) | 4,375 (23.1%) |
| 4 Vehicles | 1,319 (7.8%) | 1,039 (5.5%) |
| 5 or more Vehicles | 114 (0.7%) | 107 (0.6%) |
| Total | 16,866 (100.0%) | 18,965 (100.0%) |
Commute Time in Pine Hills
The most frequently occuring commute durations in Pine Hills are 30 to 34 minutes (6,355 commuters, 19.4%), 20 to 24 minutes (5,156 commuters, 15.7%), and 45 to 59 minutes (5,074 commuters, 15.5%).
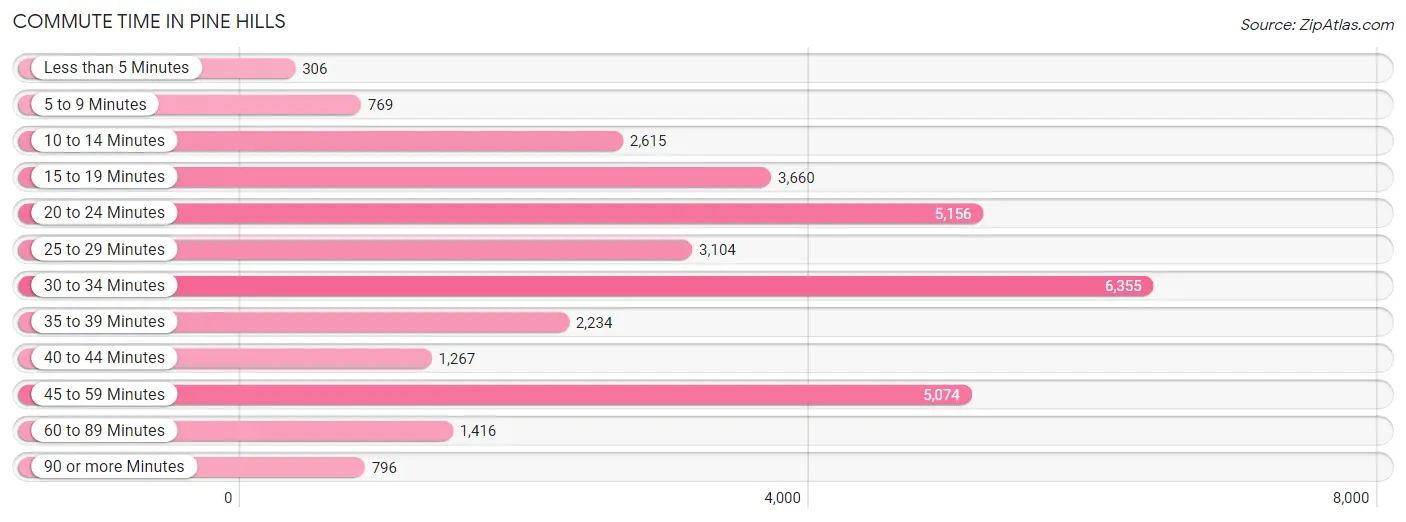
| Commute Time | # Commuters | % Commuters |
| Less than 5 Minutes | 306 | 0.9% |
| 5 to 9 Minutes | 769 | 2.4% |
| 10 to 14 Minutes | 2,615 | 8.0% |
| 15 to 19 Minutes | 3,660 | 11.2% |
| 20 to 24 Minutes | 5,156 | 15.7% |
| 25 to 29 Minutes | 3,104 | 9.5% |
| 30 to 34 Minutes | 6,355 | 19.4% |
| 35 to 39 Minutes | 2,234 | 6.8% |
| 40 to 44 Minutes | 1,267 | 3.9% |
| 45 to 59 Minutes | 5,074 | 15.5% |
| 60 to 89 Minutes | 1,416 | 4.3% |
| 90 or more Minutes | 796 | 2.4% |
Commute Time by Sex in Pine Hills
The most common commute times in Pine Hills are 30 to 34 minutes (3,721 commuters, 23.0%) for males and 20 to 24 minutes (2,724 commuters, 16.5%) for females.
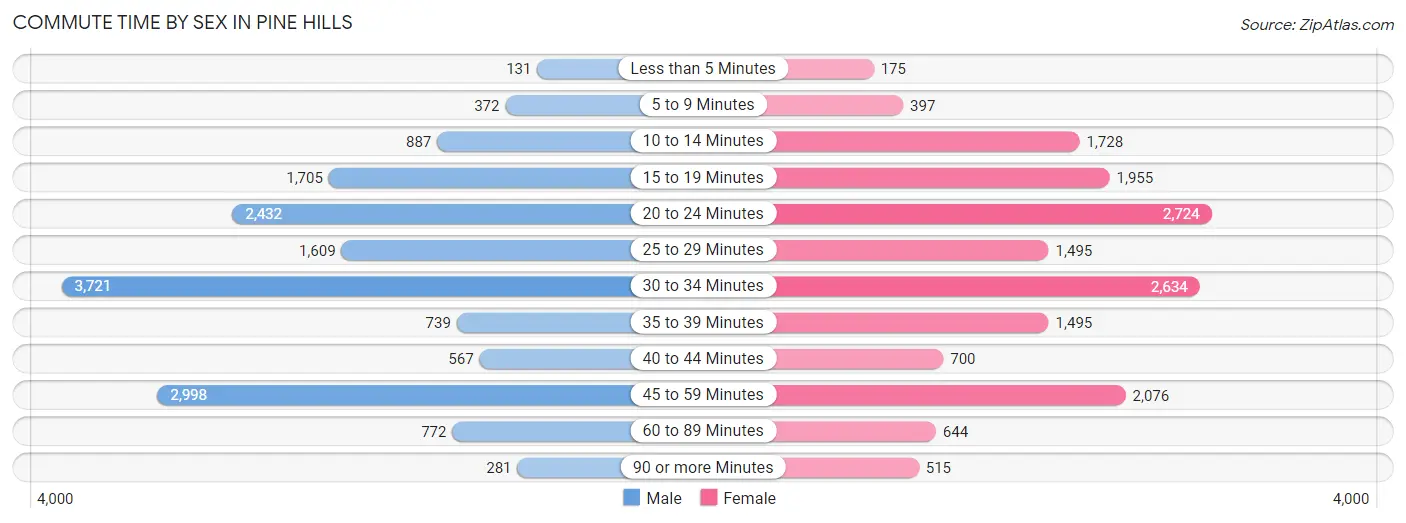
| Commute Time | Male | Female |
| Less than 5 Minutes | 131 (0.8%) | 175 (1.1%) |
| 5 to 9 Minutes | 372 (2.3%) | 397 (2.4%) |
| 10 to 14 Minutes | 887 (5.5%) | 1,728 (10.4%) |
| 15 to 19 Minutes | 1,705 (10.5%) | 1,955 (11.8%) |
| 20 to 24 Minutes | 2,432 (15.0%) | 2,724 (16.5%) |
| 25 to 29 Minutes | 1,609 (9.9%) | 1,495 (9.0%) |
| 30 to 34 Minutes | 3,721 (23.0%) | 2,634 (15.9%) |
| 35 to 39 Minutes | 739 (4.6%) | 1,495 (9.0%) |
| 40 to 44 Minutes | 567 (3.5%) | 700 (4.2%) |
| 45 to 59 Minutes | 2,998 (18.5%) | 2,076 (12.6%) |
| 60 to 89 Minutes | 772 (4.8%) | 644 (3.9%) |
| 90 or more Minutes | 281 (1.7%) | 515 (3.1%) |
Time of Departure to Work by Sex in Pine Hills
The most frequent times of departure to work in Pine Hills are 4:00 PM to 11:59 PM (2,419, 14.9%) for males and 7:00 AM to 7:29 AM (2,466, 14.9%) for females.
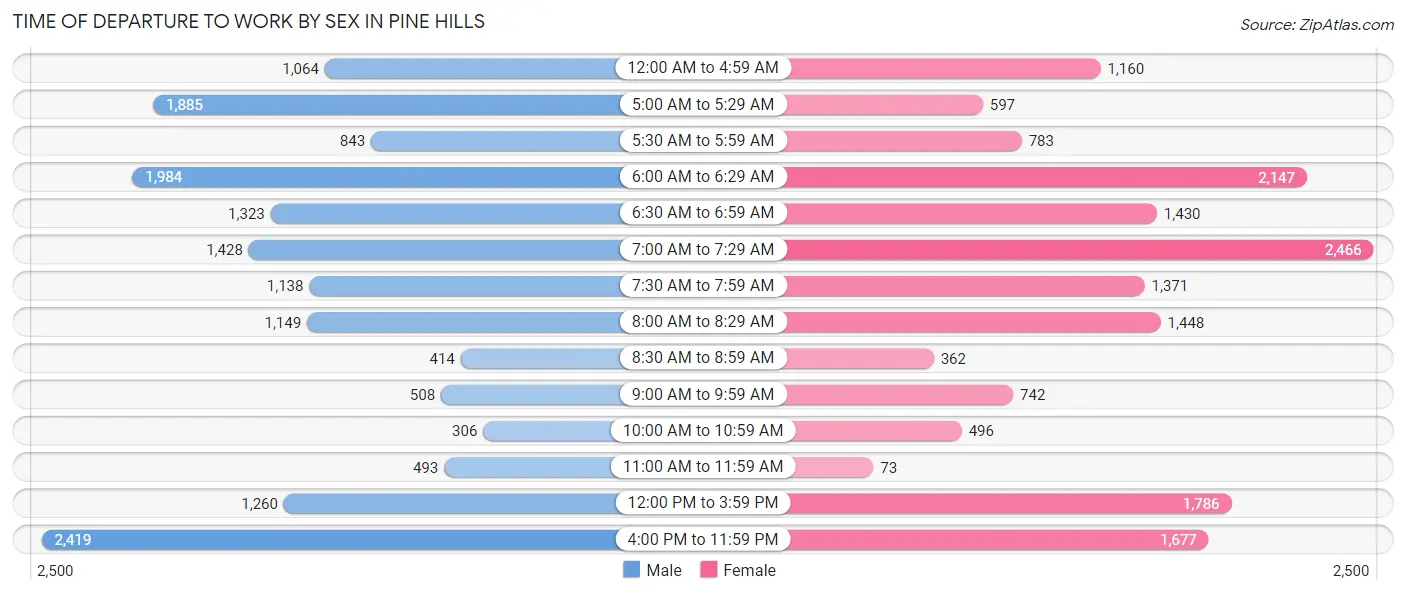
| Time of Departure | Male | Female |
| 12:00 AM to 4:59 AM | 1,064 (6.6%) | 1,160 (7.0%) |
| 5:00 AM to 5:29 AM | 1,885 (11.6%) | 597 (3.6%) |
| 5:30 AM to 5:59 AM | 843 (5.2%) | 783 (4.7%) |
| 6:00 AM to 6:29 AM | 1,984 (12.2%) | 2,147 (13.0%) |
| 6:30 AM to 6:59 AM | 1,323 (8.2%) | 1,430 (8.6%) |
| 7:00 AM to 7:29 AM | 1,428 (8.8%) | 2,466 (14.9%) |
| 7:30 AM to 7:59 AM | 1,138 (7.0%) | 1,371 (8.3%) |
| 8:00 AM to 8:29 AM | 1,149 (7.1%) | 1,448 (8.8%) |
| 8:30 AM to 8:59 AM | 414 (2.5%) | 362 (2.2%) |
| 9:00 AM to 9:59 AM | 508 (3.1%) | 742 (4.5%) |
| 10:00 AM to 10:59 AM | 306 (1.9%) | 496 (3.0%) |
| 11:00 AM to 11:59 AM | 493 (3.0%) | 73 (0.4%) |
| 12:00 PM to 3:59 PM | 1,260 (7.8%) | 1,786 (10.8%) |
| 4:00 PM to 11:59 PM | 2,419 (14.9%) | 1,677 (10.1%) |
| Total | 16,214 (100.0%) | 16,538 (100.0%) |
Housing Occupancy in Pine Hills
Occupancy by Ownership in Pine Hills
Of the total 23,083 dwellings in Pine Hills, owner-occupied units account for 12,490 (54.1%), while renter-occupied units make up 10,593 (45.9%).
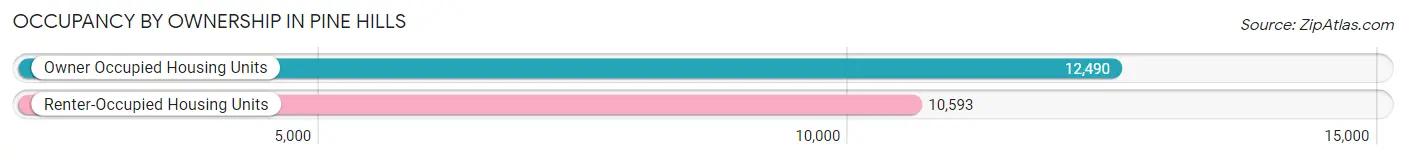
| Occupancy | # Housing Units | % Housing Units |
| Owner Occupied Housing Units | 12,490 | 54.1% |
| Renter-Occupied Housing Units | 10,593 | 45.9% |
| Total Occupied Housing Units | 23,083 | 100.0% |
Occupancy by Household Size in Pine Hills
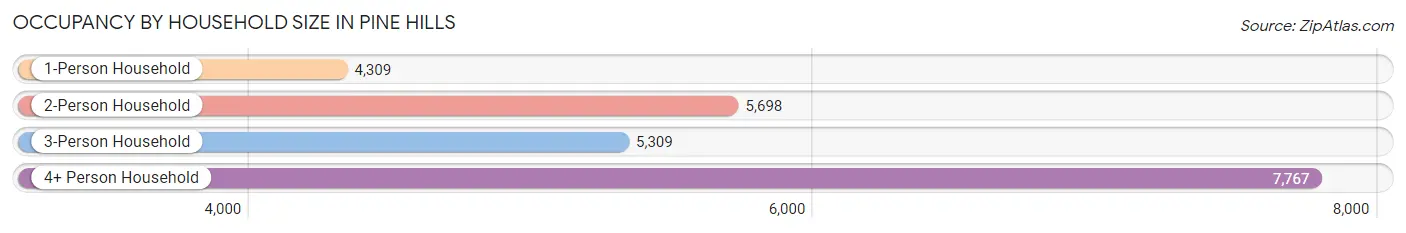
| Household Size | # Housing Units | % Housing Units |
| 1-Person Household | 4,309 | 18.7% |
| 2-Person Household | 5,698 | 24.7% |
| 3-Person Household | 5,309 | 23.0% |
| 4+ Person Household | 7,767 | 33.7% |
| Total Housing Units | 23,083 | 100.0% |
Occupancy by Ownership by Household Size in Pine Hills
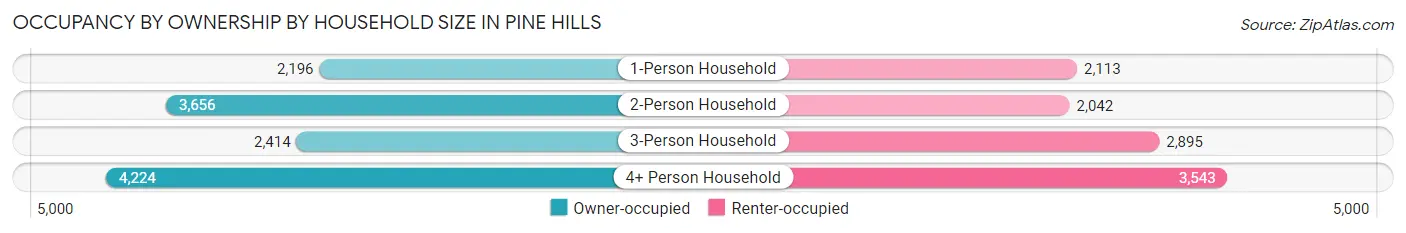
| Household Size | Owner-occupied | Renter-occupied |
| 1-Person Household | 2,196 (51.0%) | 2,113 (49.0%) |
| 2-Person Household | 3,656 (64.2%) | 2,042 (35.8%) |
| 3-Person Household | 2,414 (45.5%) | 2,895 (54.5%) |
| 4+ Person Household | 4,224 (54.4%) | 3,543 (45.6%) |
| Total Housing Units | 12,490 (54.1%) | 10,593 (45.9%) |
Occupancy by Educational Attainment in Pine Hills
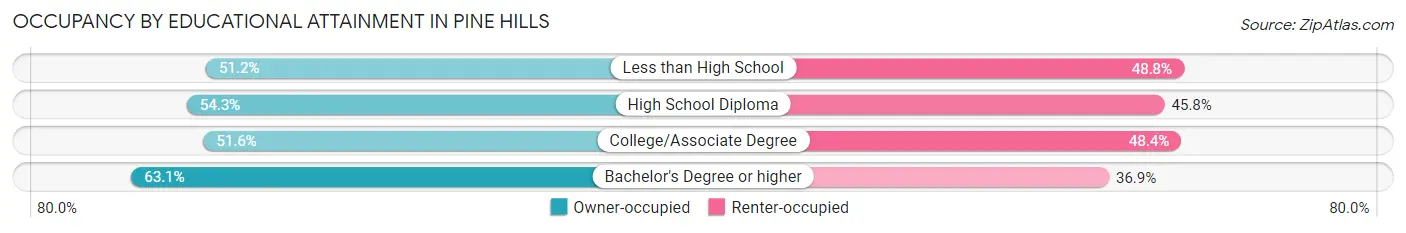
| Household Size | Owner-occupied | Renter-occupied |
| Less than High School | 2,496 (51.2%) | 2,379 (48.8%) |
| High School Diploma | 3,988 (54.2%) | 3,363 (45.8%) |
| College/Associate Degree | 3,797 (51.6%) | 3,557 (48.4%) |
| Bachelor's Degree or higher | 2,209 (63.1%) | 1,294 (36.9%) |
Occupancy by Age of Householder in Pine Hills
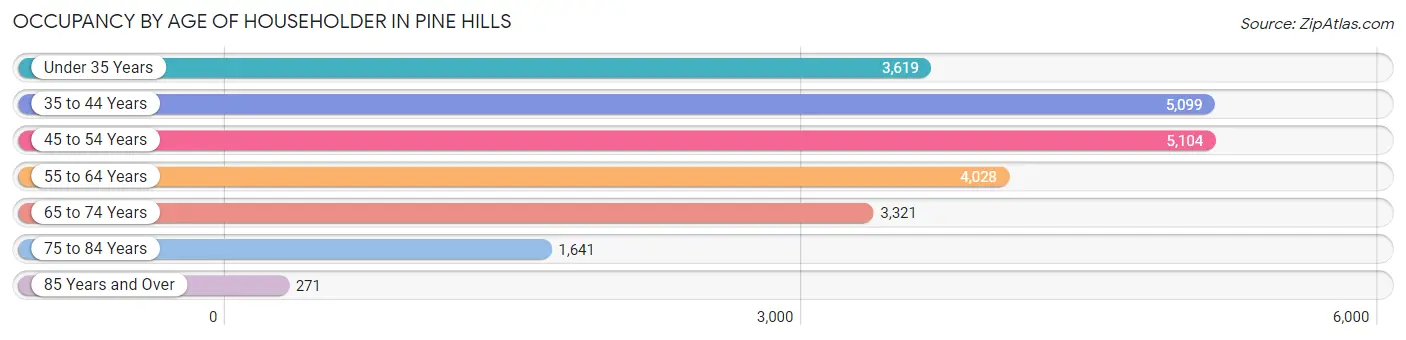
| Age Bracket | # Households | % Households |
| Under 35 Years | 3,619 | 15.7% |
| 35 to 44 Years | 5,099 | 22.1% |
| 45 to 54 Years | 5,104 | 22.1% |
| 55 to 64 Years | 4,028 | 17.4% |
| 65 to 74 Years | 3,321 | 14.4% |
| 75 to 84 Years | 1,641 | 7.1% |
| 85 Years and Over | 271 | 1.2% |
| Total | 23,083 | 100.0% |
Housing Finances in Pine Hills
Median Income by Occupancy in Pine Hills
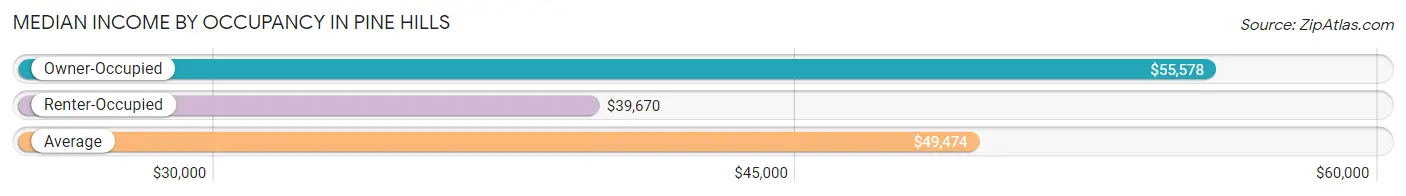
| Occupancy Type | # Households | Median Income |
| Owner-Occupied | 12,490 (54.1%) | $55,578 |
| Renter-Occupied | 10,593 (45.9%) | $39,670 |
| Average | 23,083 (100.0%) | $49,474 |
Occupancy by Householder Income Bracket in Pine Hills
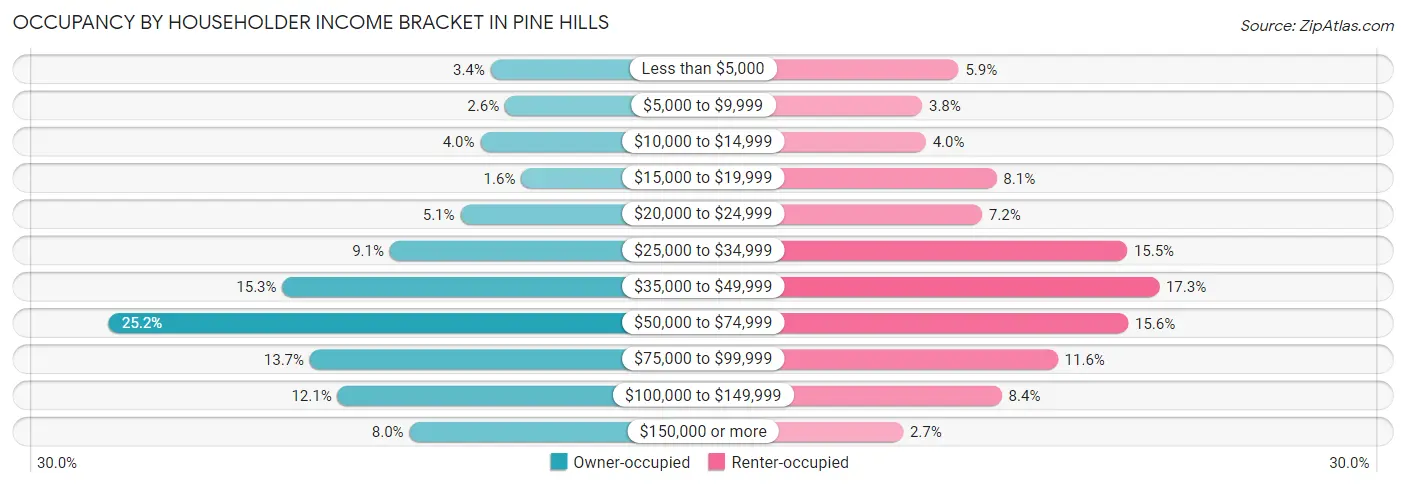
| Income Bracket | Owner-occupied | Renter-occupied |
| Less than $5,000 | 421 (3.4%) | 623 (5.9%) |
| $5,000 to $9,999 | 318 (2.5%) | 403 (3.8%) |
| $10,000 to $14,999 | 494 (4.0%) | 425 (4.0%) |
| $15,000 to $19,999 | 202 (1.6%) | 853 (8.1%) |
| $20,000 to $24,999 | 637 (5.1%) | 765 (7.2%) |
| $25,000 to $34,999 | 1,140 (9.1%) | 1,643 (15.5%) |
| $35,000 to $49,999 | 1,907 (15.3%) | 1,837 (17.3%) |
| $50,000 to $74,999 | 3,145 (25.2%) | 1,649 (15.6%) |
| $75,000 to $99,999 | 1,711 (13.7%) | 1,223 (11.6%) |
| $100,000 to $149,999 | 1,514 (12.1%) | 885 (8.4%) |
| $150,000 or more | 1,001 (8.0%) | 287 (2.7%) |
| Total | 12,490 (100.0%) | 10,593 (100.0%) |
Monthly Housing Cost Tiers in Pine Hills
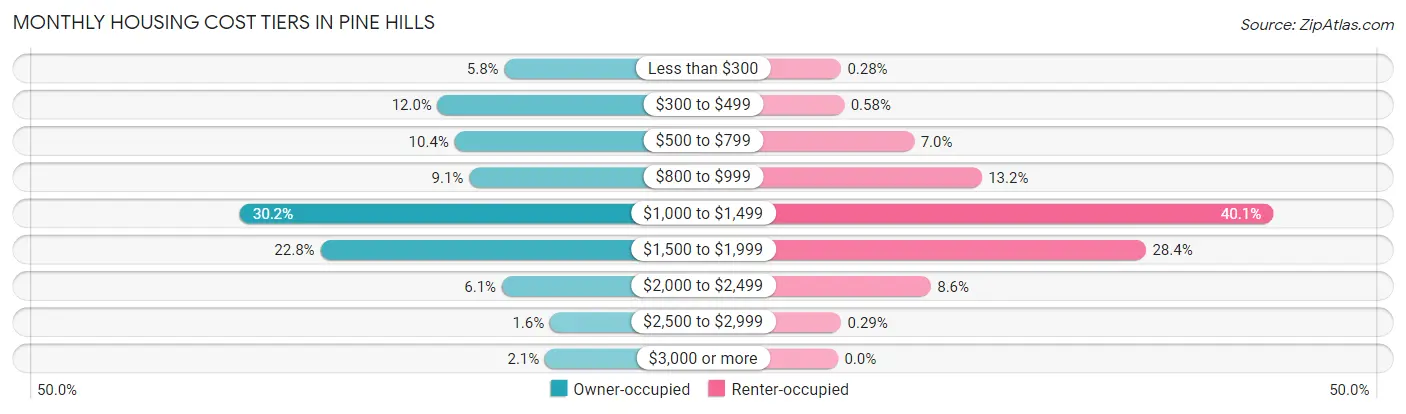
| Monthly Cost | Owner-occupied | Renter-occupied |
| Less than $300 | 728 (5.8%) | 30 (0.3%) |
| $300 to $499 | 1,495 (12.0%) | 61 (0.6%) |
| $500 to $799 | 1,300 (10.4%) | 744 (7.0%) |
| $800 to $999 | 1,133 (9.1%) | 1,402 (13.2%) |
| $1,000 to $1,499 | 3,770 (30.2%) | 4,248 (40.1%) |
| $1,500 to $1,999 | 2,844 (22.8%) | 3,004 (28.4%) |
| $2,000 to $2,499 | 757 (6.1%) | 906 (8.6%) |
| $2,500 to $2,999 | 203 (1.6%) | 31 (0.3%) |
| $3,000 or more | 260 (2.1%) | 0 (0.0%) |
| Total | 12,490 (100.0%) | 10,593 (100.0%) |
Physical Housing Characteristics in Pine Hills
Housing Structures in Pine Hills
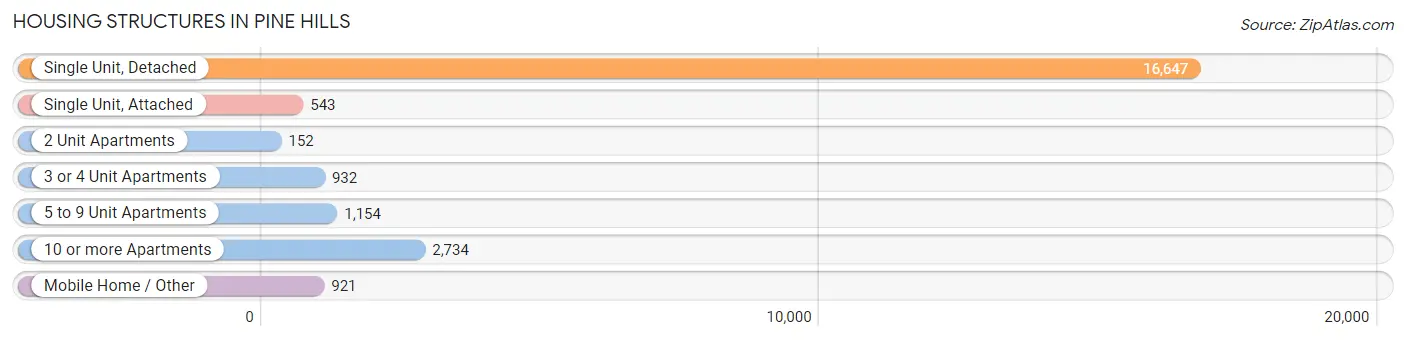
| Structure Type | # Housing Units | % Housing Units |
| Single Unit, Detached | 16,647 | 72.1% |
| Single Unit, Attached | 543 | 2.4% |
| 2 Unit Apartments | 152 | 0.7% |
| 3 or 4 Unit Apartments | 932 | 4.0% |
| 5 to 9 Unit Apartments | 1,154 | 5.0% |
| 10 or more Apartments | 2,734 | 11.8% |
| Mobile Home / Other | 921 | 4.0% |
| Total | 23,083 | 100.0% |
Housing Structures by Occupancy in Pine Hills
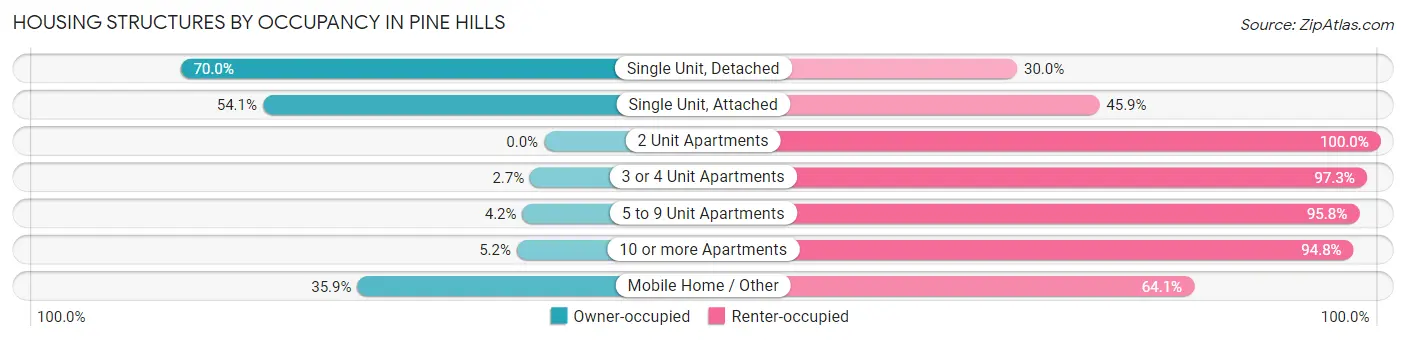
| Structure Type | Owner-occupied | Renter-occupied |
| Single Unit, Detached | 11,649 (70.0%) | 4,998 (30.0%) |
| Single Unit, Attached | 294 (54.1%) | 249 (45.9%) |
| 2 Unit Apartments | 0 (0.0%) | 152 (100.0%) |
| 3 or 4 Unit Apartments | 25 (2.7%) | 907 (97.3%) |
| 5 to 9 Unit Apartments | 48 (4.2%) | 1,106 (95.8%) |
| 10 or more Apartments | 143 (5.2%) | 2,591 (94.8%) |
| Mobile Home / Other | 331 (35.9%) | 590 (64.1%) |
| Total | 12,490 (54.1%) | 10,593 (45.9%) |
Housing Structures by Number of Rooms in Pine Hills
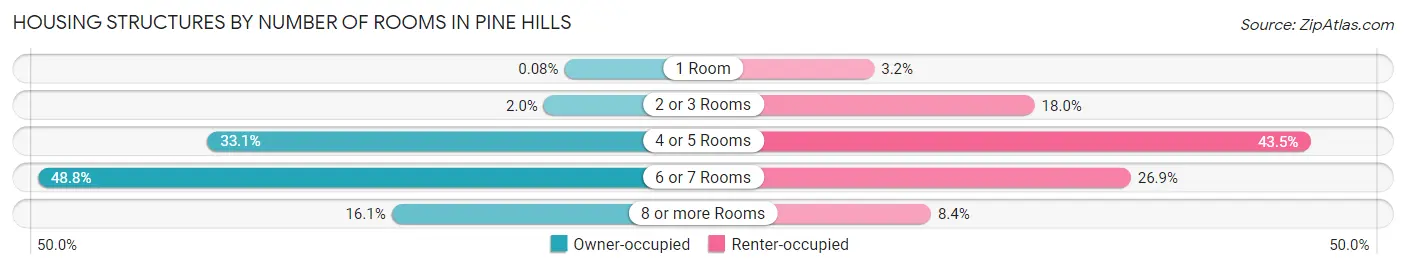
| Number of Rooms | Owner-occupied | Renter-occupied |
| 1 Room | 10 (0.1%) | 337 (3.2%) |
| 2 or 3 Rooms | 249 (2.0%) | 1,908 (18.0%) |
| 4 or 5 Rooms | 4,134 (33.1%) | 4,607 (43.5%) |
| 6 or 7 Rooms | 6,090 (48.8%) | 2,849 (26.9%) |
| 8 or more Rooms | 2,007 (16.1%) | 892 (8.4%) |
| Total | 12,490 (100.0%) | 10,593 (100.0%) |
Housing Structure by Heating Type in Pine Hills
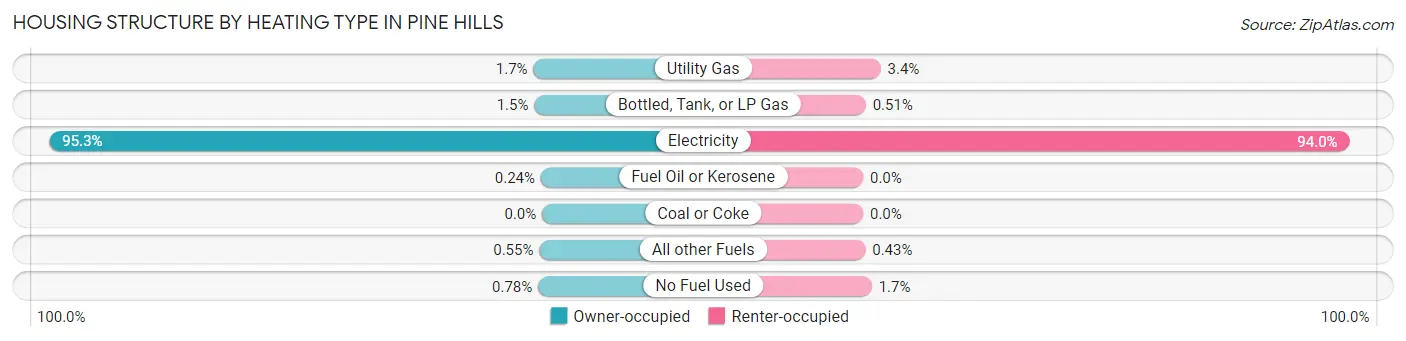
| Heating Type | Owner-occupied | Renter-occupied |
| Utility Gas | 209 (1.7%) | 360 (3.4%) |
| Bottled, Tank, or LP Gas | 188 (1.5%) | 54 (0.5%) |
| Electricity | 11,897 (95.3%) | 9,955 (94.0%) |
| Fuel Oil or Kerosene | 30 (0.2%) | 0 (0.0%) |
| Coal or Coke | 0 (0.0%) | 0 (0.0%) |
| All other Fuels | 69 (0.5%) | 46 (0.4%) |
| No Fuel Used | 97 (0.8%) | 178 (1.7%) |
| Total | 12,490 (100.0%) | 10,593 (100.0%) |
Household Vehicle Usage in Pine Hills
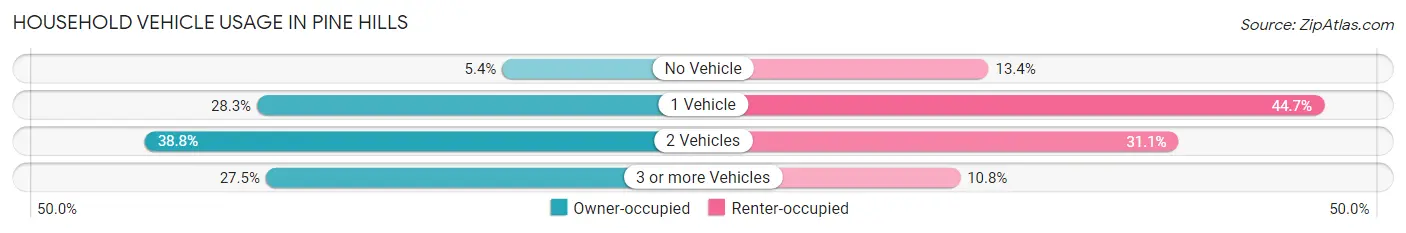
| Vehicles per Household | Owner-occupied | Renter-occupied |
| No Vehicle | 677 (5.4%) | 1,420 (13.4%) |
| 1 Vehicle | 3,536 (28.3%) | 4,735 (44.7%) |
| 2 Vehicles | 4,843 (38.8%) | 3,298 (31.1%) |
| 3 or more Vehicles | 3,434 (27.5%) | 1,140 (10.8%) |
| Total | 12,490 (100.0%) | 10,593 (100.0%) |
Real Estate & Mortgages in Pine Hills
Real Estate and Mortgage Overview in Pine Hills
| Characteristic | Without Mortgage | With Mortgage |
| Housing Units | 3,320 | 9,170 |
| Median Property Value | $179,900 | $223,300 |
| Median Household Income | $49,111 | $770 |
| Monthly Housing Costs | $443 | $236 |
| Real Estate Taxes | $1,136 | $411 |
Property Value by Mortgage Status in Pine Hills
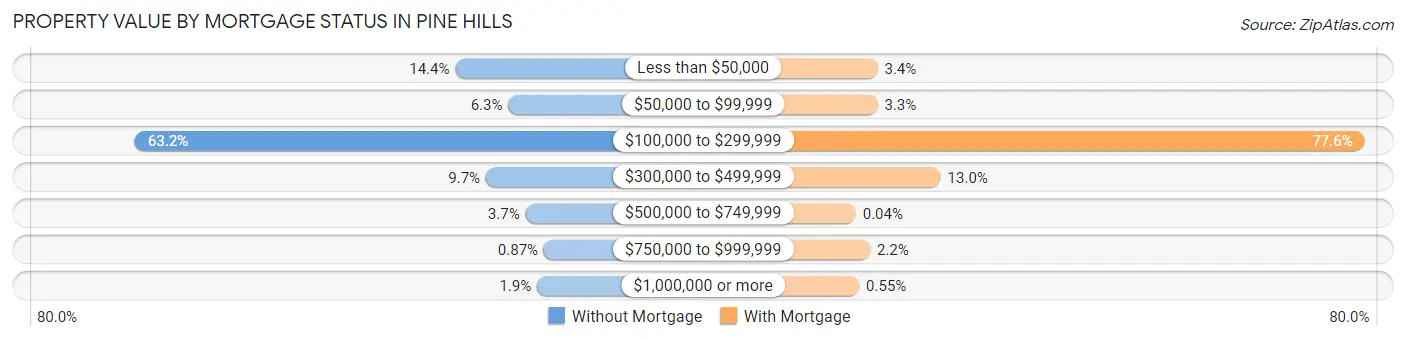
| Property Value | Without Mortgage | With Mortgage |
| Less than $50,000 | 477 (14.4%) | 307 (3.4%) |
| $50,000 to $99,999 | 209 (6.3%) | 306 (3.3%) |
| $100,000 to $299,999 | 2,098 (63.2%) | 7,111 (77.5%) |
| $300,000 to $499,999 | 322 (9.7%) | 1,189 (13.0%) |
| $500,000 to $749,999 | 122 (3.7%) | 4 (0.0%) |
| $750,000 to $999,999 | 29 (0.9%) | 203 (2.2%) |
| $1,000,000 or more | 63 (1.9%) | 50 (0.5%) |
| Total | 3,320 (100.0%) | 9,170 (100.0%) |
Household Income by Mortgage Status in Pine Hills
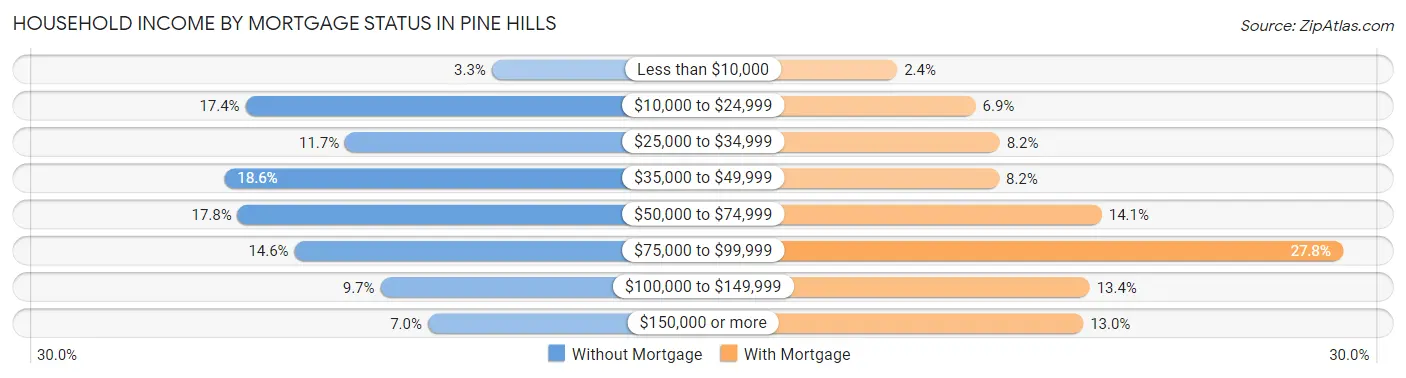
| Household Income | Without Mortgage | With Mortgage |
| Less than $10,000 | 110 (3.3%) | 218 (2.4%) |
| $10,000 to $24,999 | 577 (17.4%) | 629 (6.9%) |
| $25,000 to $34,999 | 388 (11.7%) | 756 (8.2%) |
| $35,000 to $49,999 | 617 (18.6%) | 752 (8.2%) |
| $50,000 to $74,999 | 592 (17.8%) | 1,290 (14.1%) |
| $75,000 to $99,999 | 484 (14.6%) | 2,553 (27.8%) |
| $100,000 to $149,999 | 321 (9.7%) | 1,227 (13.4%) |
| $150,000 or more | 231 (7.0%) | 1,193 (13.0%) |
| Total | 3,320 (100.0%) | 9,170 (100.0%) |
Property Value to Household Income Ratio in Pine Hills
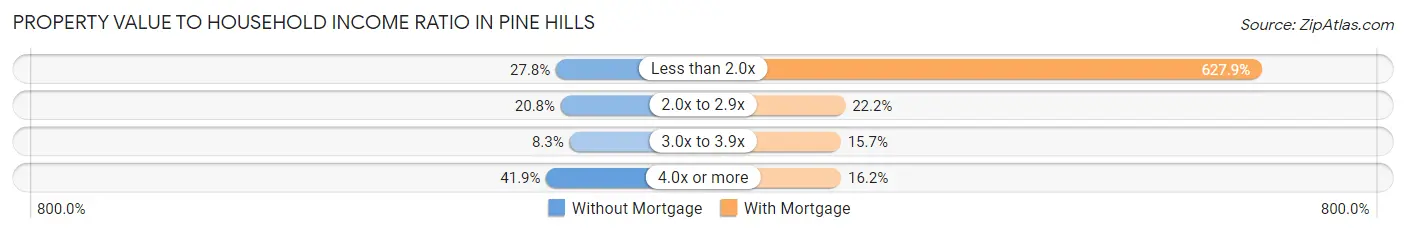
| Value-to-Income Ratio | Without Mortgage | With Mortgage |
| Less than 2.0x | 922 (27.8%) | 57,577 (627.9%) |
| 2.0x to 2.9x | 692 (20.8%) | 2,033 (22.2%) |
| 3.0x to 3.9x | 275 (8.3%) | 1,440 (15.7%) |
| 4.0x or more | 1,392 (41.9%) | 1,481 (16.2%) |
| Total | 3,320 (100.0%) | 9,170 (100.0%) |
Real Estate Taxes by Mortgage Status in Pine Hills
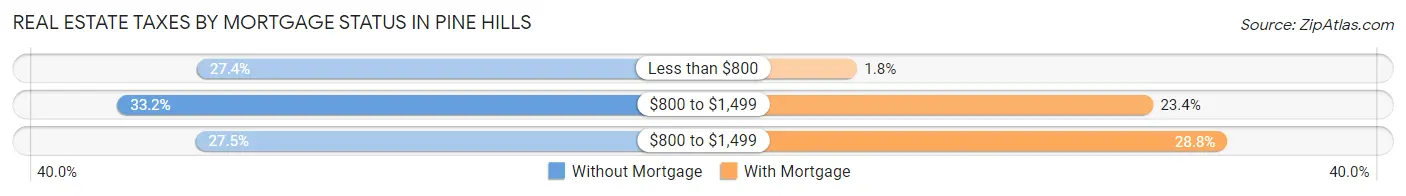
| Property Taxes | Without Mortgage | With Mortgage |
| Less than $800 | 910 (27.4%) | 163 (1.8%) |
| $800 to $1,499 | 1,103 (33.2%) | 2,147 (23.4%) |
| $800 to $1,499 | 913 (27.5%) | 2,640 (28.8%) |
| Total | 3,320 (100.0%) | 9,170 (100.0%) |
Health & Disability in Pine Hills
Health Insurance Coverage by Age in Pine Hills
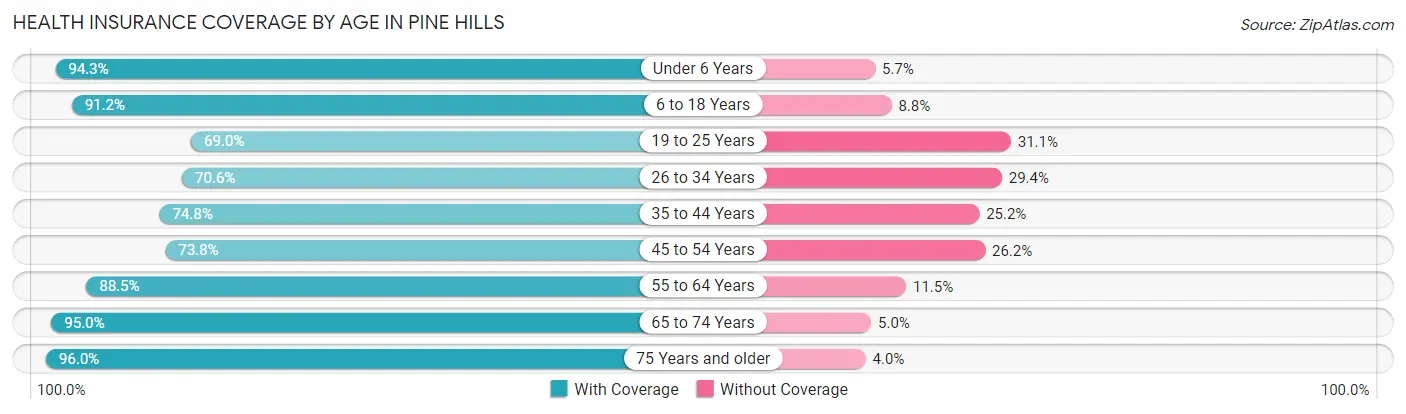
| Age Bracket | With Coverage | Without Coverage |
| Under 6 Years | 7,062 (94.3%) | 429 (5.7%) |
| 6 to 18 Years | 15,856 (91.2%) | 1,528 (8.8%) |
| 19 to 25 Years | 5,894 (69.0%) | 2,654 (31.0%) |
| 26 to 34 Years | 7,013 (70.6%) | 2,916 (29.4%) |
| 35 to 44 Years | 8,048 (74.8%) | 2,705 (25.2%) |
| 45 to 54 Years | 8,283 (73.8%) | 2,947 (26.2%) |
| 55 to 64 Years | 7,670 (88.5%) | 999 (11.5%) |
| 65 to 74 Years | 5,399 (95.0%) | 284 (5.0%) |
| 75 Years and older | 3,237 (96.0%) | 134 (4.0%) |
| Total | 68,462 (82.4%) | 14,596 (17.6%) |
Health Insurance Coverage by Citizenship Status in Pine Hills
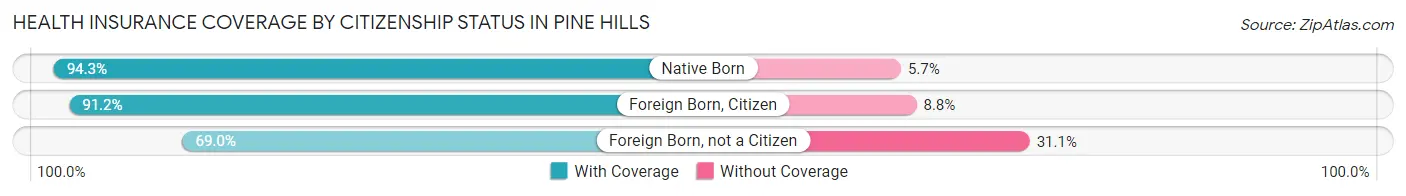
| Citizenship Status | With Coverage | Without Coverage |
| Native Born | 7,062 (94.3%) | 429 (5.7%) |
| Foreign Born, Citizen | 15,856 (91.2%) | 1,528 (8.8%) |
| Foreign Born, not a Citizen | 5,894 (69.0%) | 2,654 (31.0%) |
Health Insurance Coverage by Household Income in Pine Hills
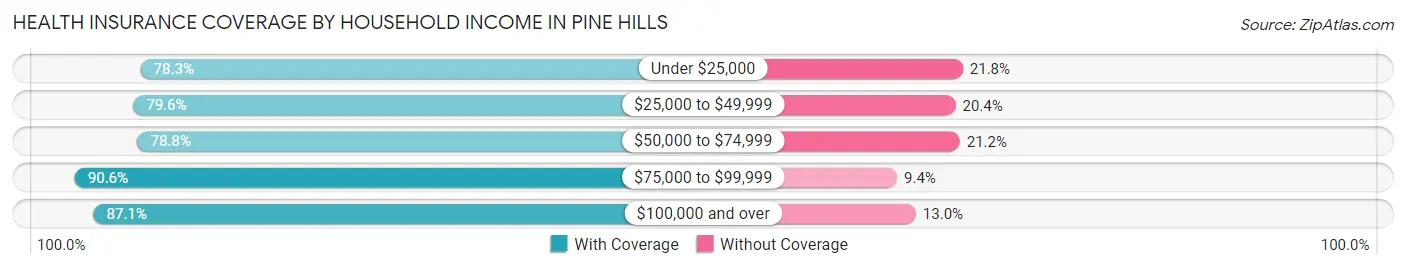
| Household Income | With Coverage | Without Coverage |
| Under $25,000 | 10,844 (78.2%) | 3,015 (21.7%) |
| $25,000 to $49,999 | 16,039 (79.6%) | 4,102 (20.4%) |
| $50,000 to $74,999 | 15,026 (78.8%) | 4,036 (21.2%) |
| $75,000 to $99,999 | 11,519 (90.6%) | 1,198 (9.4%) |
| $100,000 and over | 14,992 (87.1%) | 2,231 (13.0%) |
Public vs Private Health Insurance Coverage by Age in Pine Hills
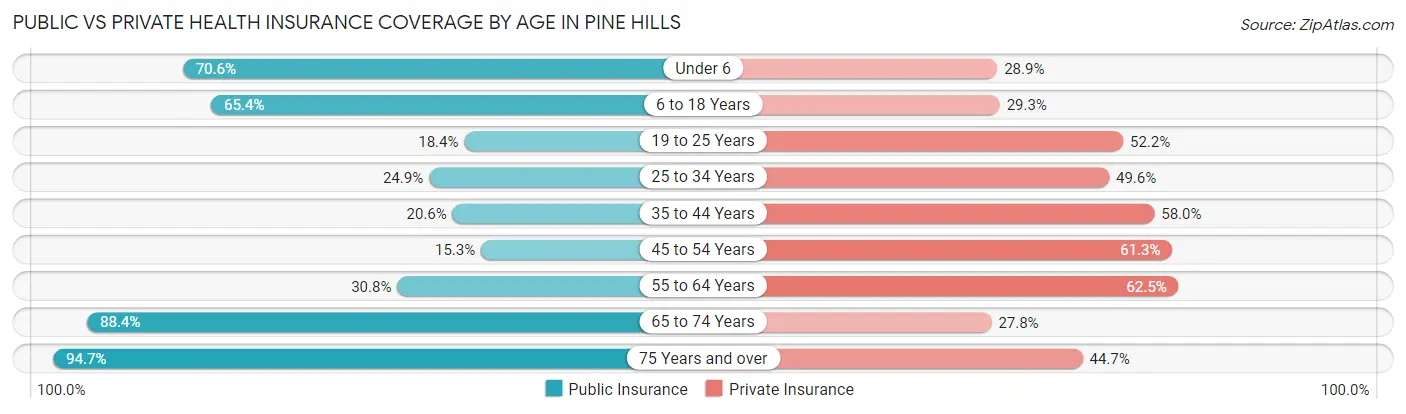
| Age Bracket | Public Insurance | Private Insurance |
| Under 6 | 5,292 (70.6%) | 2,161 (28.8%) |
| 6 to 18 Years | 11,368 (65.4%) | 5,095 (29.3%) |
| 19 to 25 Years | 1,572 (18.4%) | 4,462 (52.2%) |
| 25 to 34 Years | 2,476 (24.9%) | 4,926 (49.6%) |
| 35 to 44 Years | 2,211 (20.6%) | 6,238 (58.0%) |
| 45 to 54 Years | 1,715 (15.3%) | 6,889 (61.3%) |
| 55 to 64 Years | 2,673 (30.8%) | 5,420 (62.5%) |
| 65 to 74 Years | 5,023 (88.4%) | 1,579 (27.8%) |
| 75 Years and over | 3,192 (94.7%) | 1,507 (44.7%) |
| Total | 35,522 (42.8%) | 38,277 (46.1%) |
Disability Status by Sex by Age in Pine Hills
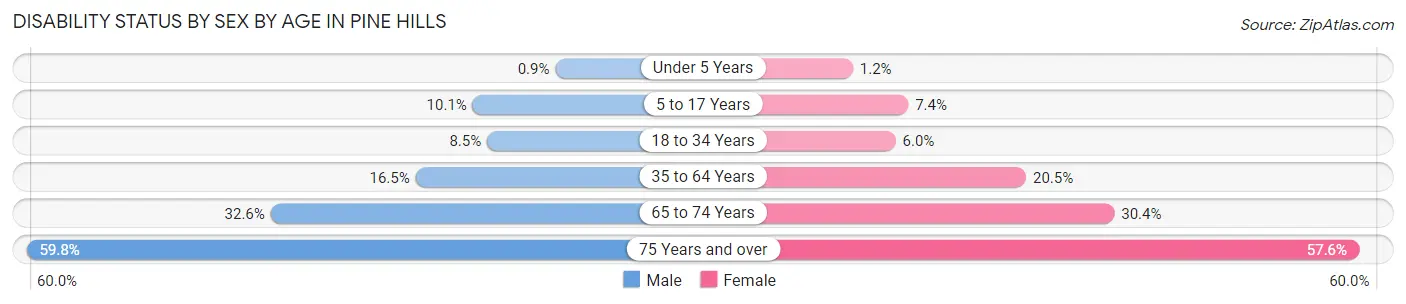
| Age Bracket | Male | Female |
| Under 5 Years | 30 (0.9%) | 38 (1.2%) |
| 5 to 17 Years | 958 (10.1%) | 571 (7.4%) |
| 18 to 34 Years | 788 (8.5%) | 627 (6.0%) |
| 35 to 64 Years | 2,285 (16.5%) | 3,442 (20.5%) |
| 65 to 74 Years | 873 (32.6%) | 912 (30.3%) |
| 75 Years and over | 837 (59.8%) | 1,135 (57.6%) |
Disability Class by Sex by Age in Pine Hills
Disability Class: Hearing Difficulty
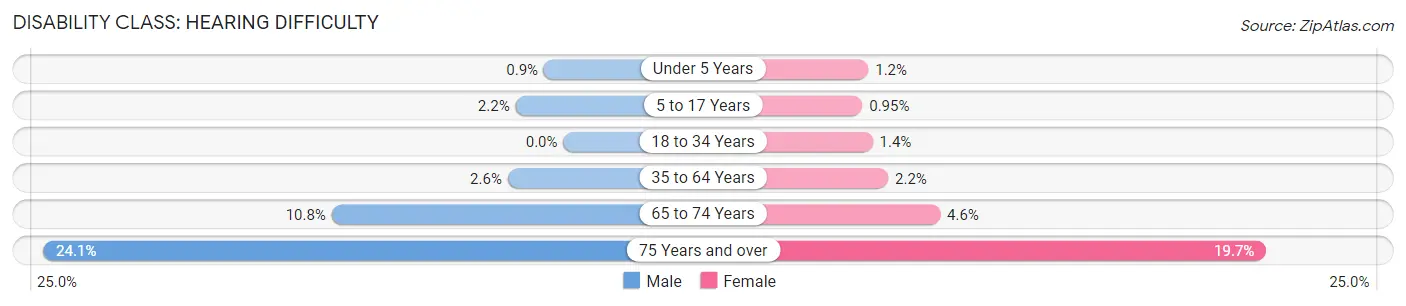
| Age Bracket | Male | Female |
| Under 5 Years | 30 (0.9%) | 38 (1.2%) |
| 5 to 17 Years | 211 (2.2%) | 73 (0.9%) |
| 18 to 34 Years | 0 (0.0%) | 150 (1.4%) |
| 35 to 64 Years | 358 (2.6%) | 361 (2.1%) |
| 65 to 74 Years | 288 (10.7%) | 137 (4.6%) |
| 75 Years and over | 338 (24.1%) | 388 (19.7%) |
Disability Class: Vision Difficulty
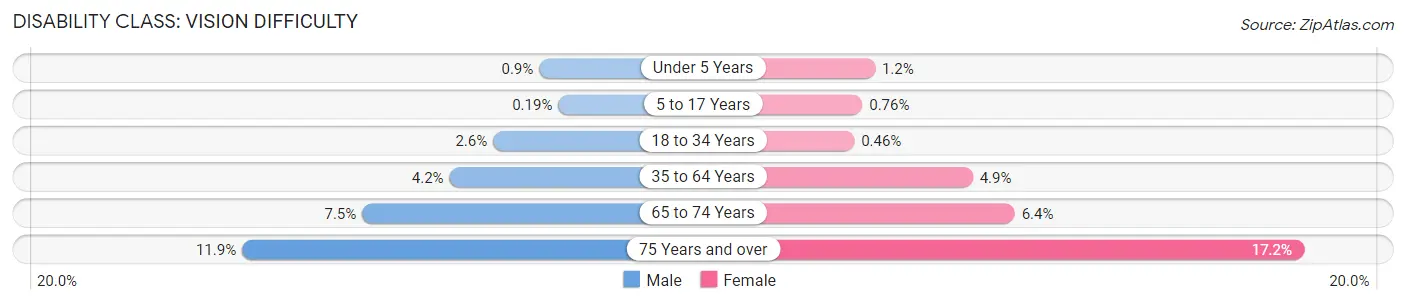
| Age Bracket | Male | Female |
| Under 5 Years | 30 (0.9%) | 38 (1.2%) |
| 5 to 17 Years | 18 (0.2%) | 59 (0.8%) |
| 18 to 34 Years | 242 (2.6%) | 48 (0.5%) |
| 35 to 64 Years | 587 (4.2%) | 815 (4.9%) |
| 65 to 74 Years | 200 (7.5%) | 193 (6.4%) |
| 75 Years and over | 167 (11.9%) | 338 (17.2%) |
Disability Class: Cognitive Difficulty
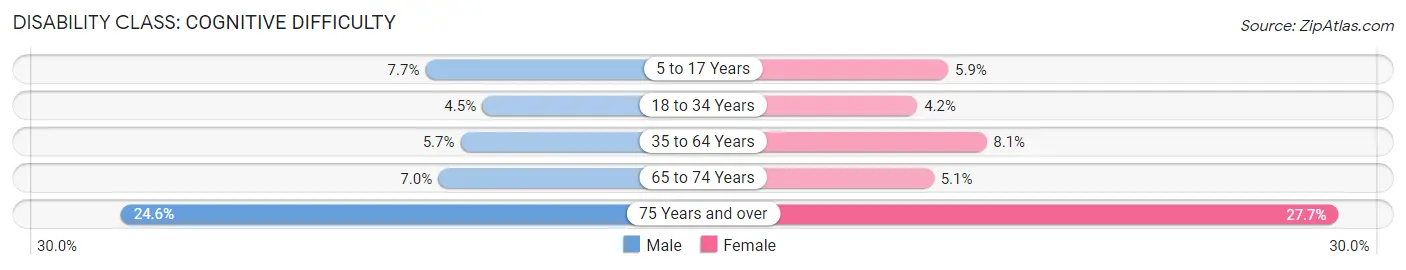
| Age Bracket | Male | Female |
| 5 to 17 Years | 730 (7.7%) | 457 (5.9%) |
| 18 to 34 Years | 420 (4.5%) | 439 (4.2%) |
| 35 to 64 Years | 796 (5.7%) | 1,350 (8.1%) |
| 65 to 74 Years | 187 (7.0%) | 154 (5.1%) |
| 75 Years and over | 345 (24.6%) | 545 (27.7%) |
Disability Class: Ambulatory Difficulty
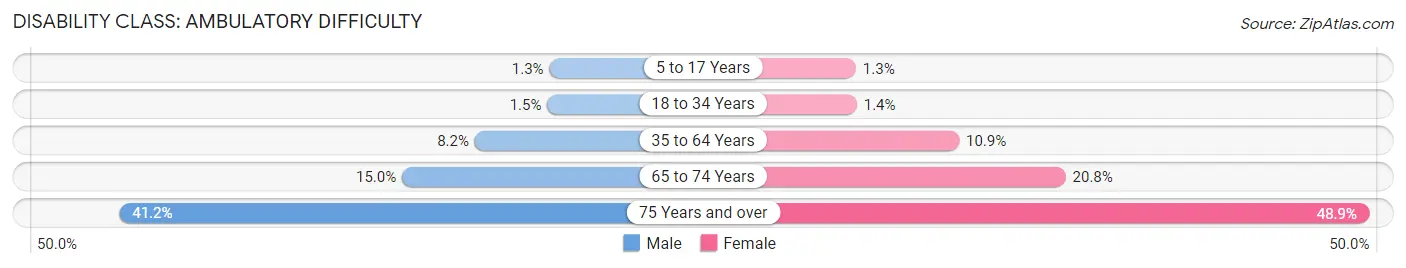
| Age Bracket | Male | Female |
| 5 to 17 Years | 122 (1.3%) | 101 (1.3%) |
| 18 to 34 Years | 138 (1.5%) | 145 (1.4%) |
| 35 to 64 Years | 1,141 (8.2%) | 1,825 (10.9%) |
| 65 to 74 Years | 401 (15.0%) | 624 (20.8%) |
| 75 Years and over | 577 (41.2%) | 964 (48.9%) |
Disability Class: Self-Care Difficulty
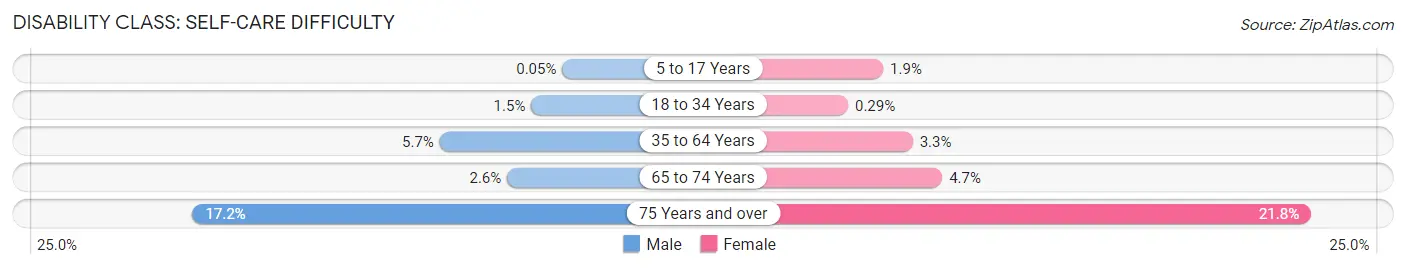
| Age Bracket | Male | Female |
| 5 to 17 Years | 5 (0.1%) | 148 (1.9%) |
| 18 to 34 Years | 138 (1.5%) | 30 (0.3%) |
| 35 to 64 Years | 796 (5.7%) | 551 (3.3%) |
| 65 to 74 Years | 70 (2.6%) | 140 (4.7%) |
| 75 Years and over | 241 (17.2%) | 429 (21.8%) |
Technology Access in Pine Hills
Computing Device Access in Pine Hills
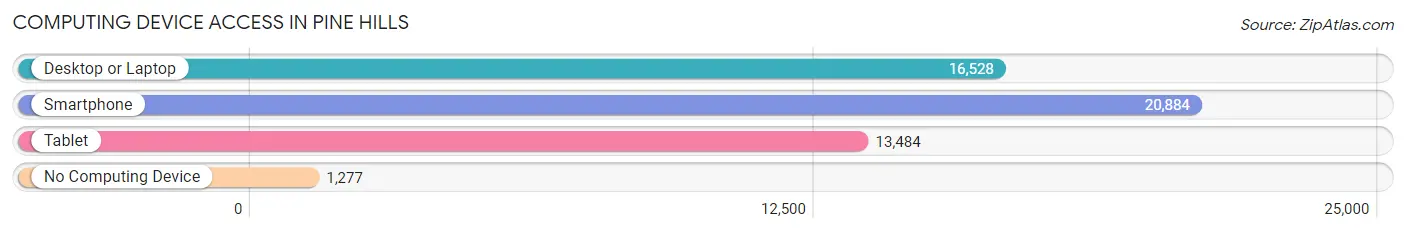
| Device Type | # Households | % Households |
| Desktop or Laptop | 16,528 | 71.6% |
| Smartphone | 20,884 | 90.5% |
| Tablet | 13,484 | 58.4% |
| No Computing Device | 1,277 | 5.5% |
| Total | 23,083 | 100.0% |
Internet Access in Pine Hills
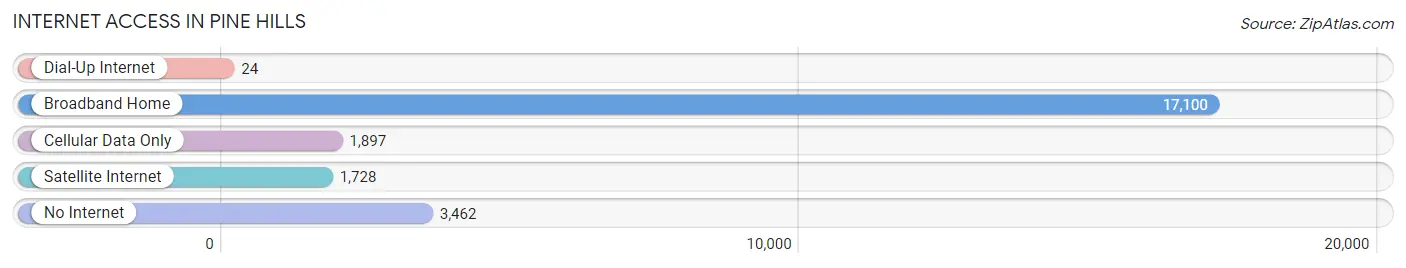
| Internet Type | # Households | % Households |
| Dial-Up Internet | 24 | 0.1% |
| Broadband Home | 17,100 | 74.1% |
| Cellular Data Only | 1,897 | 8.2% |
| Satellite Internet | 1,728 | 7.5% |
| No Internet | 3,462 | 15.0% |
| Total | 23,083 | 100.0% |
Pine Hills Summary
Pine Hills is an unincorporated census-designated place in Orange County, Florida, United States. It is located approximately 8 miles northwest of downtown Orlando. The population was 63,173 at the 2010 census.
History
Pine Hills was originally developed in the 1950s as a residential community for Orlando's growing population. The area was originally known as Pine Hill Estates, and was developed by the Pine Hill Development Company. The area was designed to be a suburban community with a mix of single-family homes, apartments, and townhomes.
The area was annexed by the City of Orlando in the late 1960s, and the name was changed to Pine Hills. The area has since grown to become one of the largest unincorporated communities in the United States.
Geography
Pine Hills is located at 28 33 25 North 81 30 17 West 28 556944 81 504722
According to the United States Census Bureau, the CDP has a total area of 8.3 square miles (21.5 km2), of which 8.2 square miles (21.3 km2) is land and 0.1 square miles (0.2 km2) (1.17%) is water.
Economy
Pine Hills is home to a variety of businesses, including retail stores, restaurants, and professional services. The area is also home to several large employers, including the Orange County Public Schools, the University of Central Florida, and the Orlando Health System.
Demographics
As of the census of 2000, there were 63,173 people, 22,845 households, and 15,845 families residing in the CDP. The population density was 7,637.3 people per square mile (2,945.2/km2). There were 24,845 housing units at an average density of 3,019.2/sq mi (1,167.2/km2). The racial makeup of the CDP was 32.2% White, 43.3% African American, 0.4% Native American, 2.2% Asian, 0.1% Pacific Islander, 19.2% from other races, and 2.7% from two or more races. Hispanic or Latino of any race were 37.2% of the population.
There were 22,845 households, out of which 37.2% had children under the age of 18 living with them, 41.2% were married couples living together, 20.7% had a female householder with no husband present, and 31.2% were non-families. 24.2% of all households were made up of individuals, and 7.2% had someone living alone who was 65 years of age or older. The average household size was 2.75 and the average family size was 3.30.
In the CDP, the population was spread out, with 28.7% under the age of 18, 10.7% from 18 to 24, 30.3% from 25 to 44, 19.9% from 45 to 64, and 10.4% who were 65 years of age or older. The median age was 32 years. For every 100 females, there were 93.2 males. For every 100 females age 18 and over, there were 89.2 males.
The median income for a household in the CDP was $30,945, and the median income for a family was $34,945. Males had a median income of $27,845 versus $23,845 for females. The per capita income for the CDP was $14,845. About 17.2% of families and 20.7% of the population were below the poverty line, including 28.2% of those under age 18 and 11.7% of those age 65 or over.
Common Questions
What is Per Capita Income in Pine Hills?
Per Capita income in Pine Hills is $19,766.
What is the Median Family Income in Pine Hills?
Median Family Income in Pine Hills is $50,006.
What is the Median Household income in Pine Hills?
Median Household Income in Pine Hills is $49,474.
What is Income or Wage Gap in Pine Hills?
Income or Wage Gap in Pine Hills is 16.1%.
Women in Pine Hills earn 83.9 cents for every dollar earned by a man.
What is Family Income Deficit in Pine Hills?
Family Income Deficit in Pine Hills is $12,106.
Families that are below poverty line in Pine Hills earn $12,106 less on average than the poverty threshold level.
What is Inequality or Gini Index in Pine Hills?
Inequality or Gini Index in Pine Hills is 0.43.
What is the Total Population of Pine Hills?
Total Population of Pine Hills is 83,221.
What is the Total Male Population of Pine Hills?
Total Male Population of Pine Hills is 40,137.
What is the Total Female Population of Pine Hills?
Total Female Population of Pine Hills is 43,084.
What is the Ratio of Males per 100 Females in Pine Hills?
There are 93.16 Males per 100 Females in Pine Hills.
What is the Ratio of Females per 100 Males in Pine Hills?
There are 107.34 Females per 100 Males in Pine Hills.
What is the Median Population Age in Pine Hills?
Median Population Age in Pine Hills is 32.9 Years.
What is the Average Family Size in Pine Hills
Average Family Size in Pine Hills is 4.0 People.
What is the Average Household Size in Pine Hills
Average Household Size in Pine Hills is 3.6 People.
How Large is the Labor Force in Pine Hills?
There are 42,409 People in the Labor Forcein in Pine Hills.
What is the Percentage of People in the Labor Force in Pine Hills?
68.5% of People are in the Labor Force in Pine Hills.
What is the Unemployment Rate in Pine Hills?
Unemployment Rate in Pine Hills is 12.7%.