Ojus, FL Map & Demographics
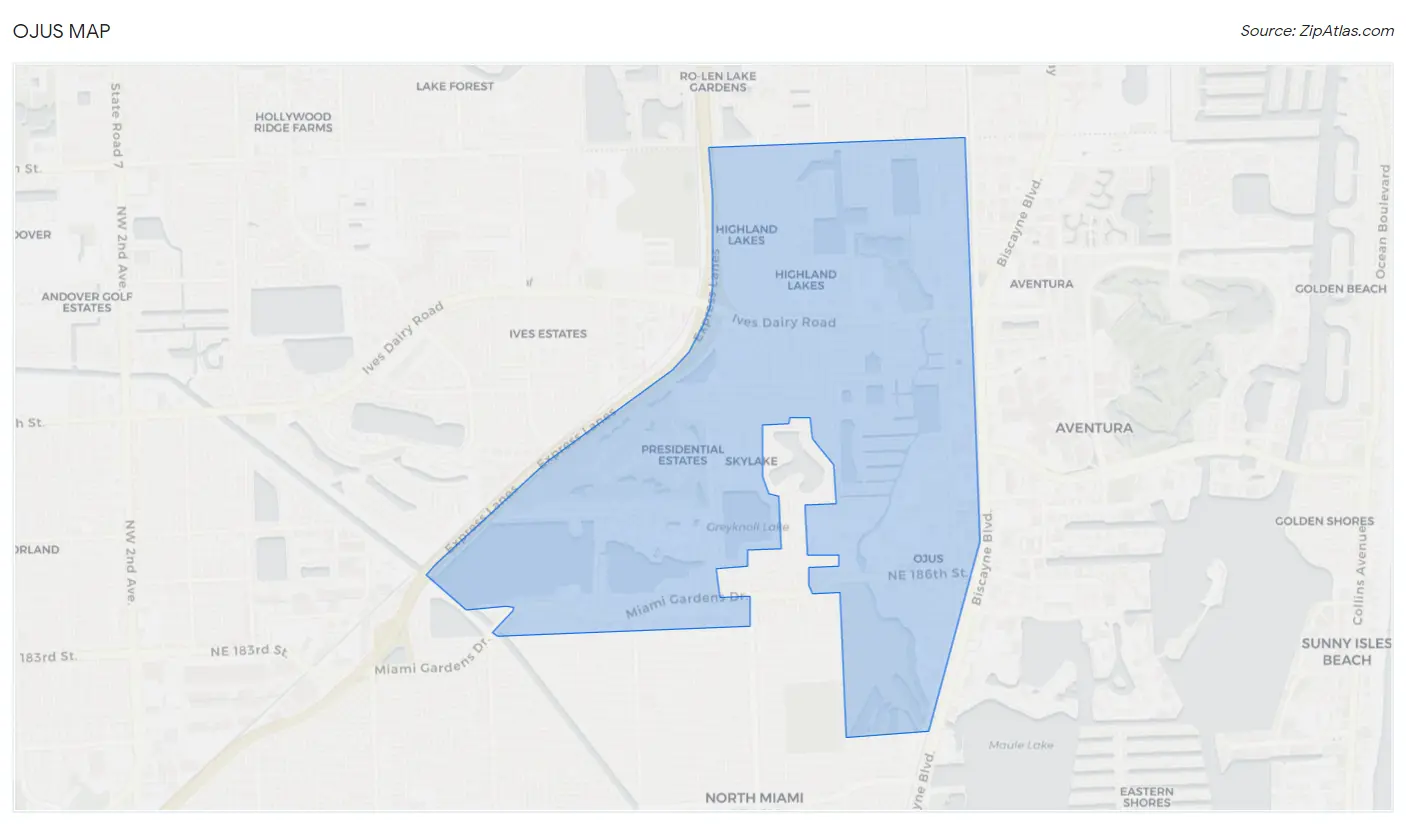
Ojus Map
Ojus Overview
$42,421
PER CAPITA INCOME
$70,658
AVG FAMILY INCOME
$58,750
AVG HOUSEHOLD INCOME
15.3%
WAGE / INCOME GAP [ % ]
84.7¢/ $1
WAGE / INCOME GAP [ $ ]
0.55
INEQUALITY / GINI INDEX
16,450
TOTAL POPULATION
8,167
MALE POPULATION
8,283
FEMALE POPULATION
98.60
MALES / 100 FEMALES
101.42
FEMALES / 100 MALES
44.4
MEDIAN AGE
3.0
AVG FAMILY SIZE
2.4
AVG HOUSEHOLD SIZE
9,184
LABOR FORCE [ PEOPLE ]
65.9%
PERCENT IN LABOR FORCE
4.9%
UNEMPLOYMENT RATE
Ojus Area Codes
Income in Ojus
Income Overview in Ojus
Per Capita Income in Ojus is $42,421, while median incomes of families and households are $70,658 and $58,750 respectively.
| Characteristic | Number | Measure |
| Per Capita Income | 16,450 | $42,421 |
| Median Family Income | 4,354 | $70,658 |
| Mean Family Income | 4,354 | $118,396 |
| Median Household Income | 6,846 | $58,750 |
| Mean Household Income | 6,846 | $97,799 |
| Income Deficit | 4,354 | $0 |
| Wage / Income Gap (%) | 16,450 | 15.33% |
| Wage / Income Gap ($) | 16,450 | 84.67¢ per $1 |
| Gini / Inequality Index | 16,450 | 0.55 |
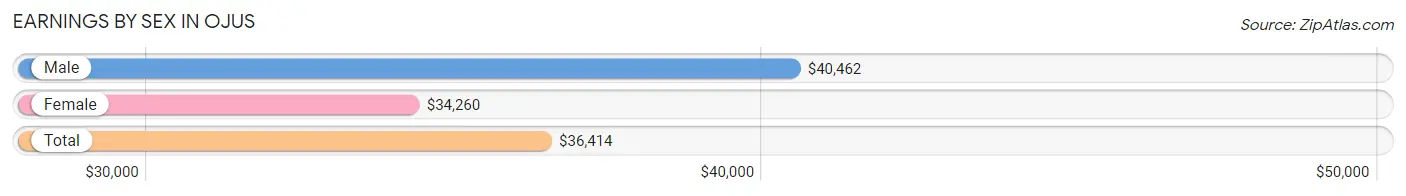
Earnings by Sex in Ojus
Average Earnings in Ojus are $36,414, $40,462 for men and $34,260 for women, a difference of 15.3%.
| Sex | Number | Average Earnings |
| Male | 4,908 (51.7%) | $40,462 |
| Female | 4,588 (48.3%) | $34,260 |
| Total | 9,496 (100.0%) | $36,414 |
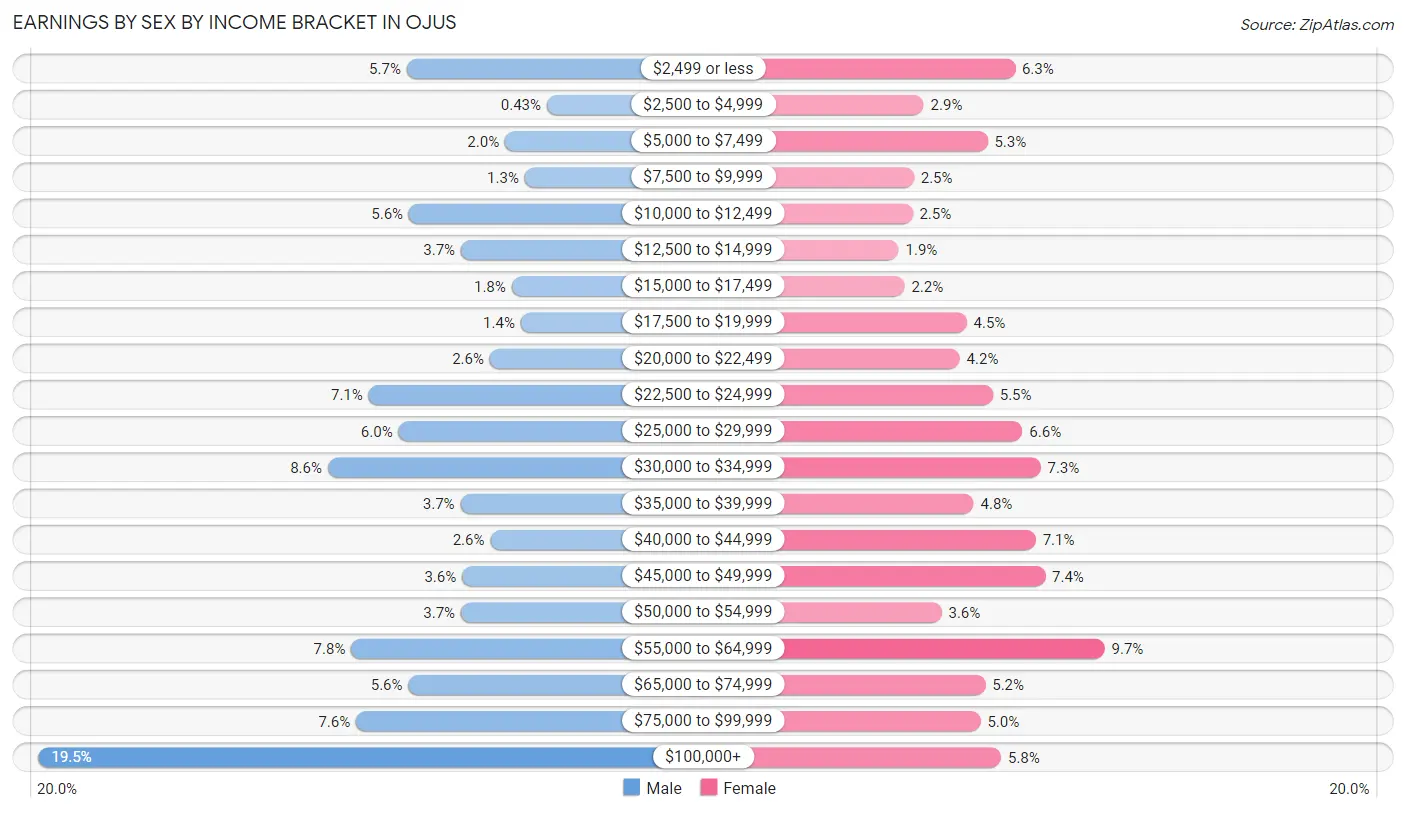
Earnings by Sex by Income Bracket in Ojus
The most common earnings brackets in Ojus are $100,000+ for men (956 | 19.5%) and $55,000 to $64,999 for women (443 | 9.7%).
| Income | Male | Female |
| $2,499 or less | 279 (5.7%) | 289 (6.3%) |
| $2,500 to $4,999 | 21 (0.4%) | 132 (2.9%) |
| $5,000 to $7,499 | 98 (2.0%) | 242 (5.3%) |
| $7,500 to $9,999 | 62 (1.3%) | 115 (2.5%) |
| $10,000 to $12,499 | 275 (5.6%) | 113 (2.5%) |
| $12,500 to $14,999 | 179 (3.6%) | 89 (1.9%) |
| $15,000 to $17,499 | 86 (1.8%) | 99 (2.2%) |
| $17,500 to $19,999 | 69 (1.4%) | 206 (4.5%) |
| $20,000 to $22,499 | 126 (2.6%) | 194 (4.2%) |
| $22,500 to $24,999 | 349 (7.1%) | 251 (5.5%) |
| $25,000 to $29,999 | 294 (6.0%) | 302 (6.6%) |
| $30,000 to $34,999 | 424 (8.6%) | 333 (7.3%) |
| $35,000 to $39,999 | 180 (3.7%) | 218 (4.8%) |
| $40,000 to $44,999 | 125 (2.5%) | 325 (7.1%) |
| $45,000 to $49,999 | 177 (3.6%) | 341 (7.4%) |
| $50,000 to $54,999 | 179 (3.6%) | 163 (3.5%) |
| $55,000 to $64,999 | 381 (7.8%) | 443 (9.7%) |
| $65,000 to $74,999 | 276 (5.6%) | 238 (5.2%) |
| $75,000 to $99,999 | 372 (7.6%) | 230 (5.0%) |
| $100,000+ | 956 (19.5%) | 265 (5.8%) |
| Total | 4,908 (100.0%) | 4,588 (100.0%) |
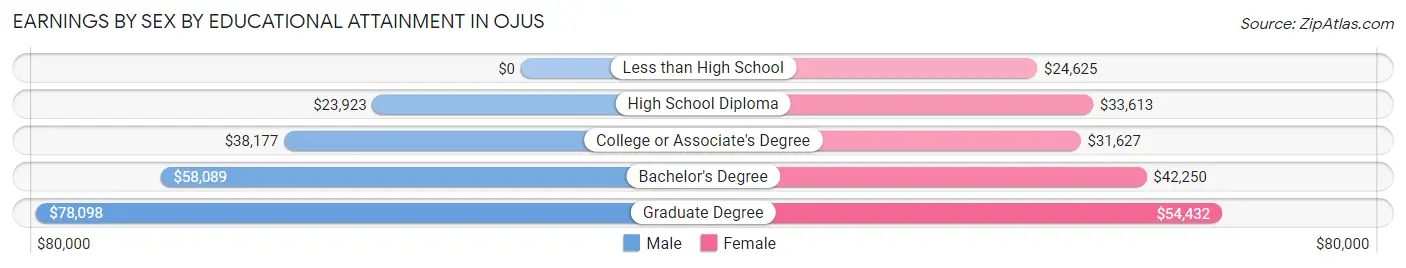
Earnings by Sex by Educational Attainment in Ojus
Average earnings in Ojus are $47,436 for men and $36,741 for women, a difference of 22.6%. Men with an educational attainment of graduate degree enjoy the highest average annual earnings of $78,098, while those with high school diploma education earn the least with $23,923. Women with an educational attainment of graduate degree earn the most with the average annual earnings of $54,432, while those with less than high school education have the smallest earnings of $24,625.
| Educational Attainment | Male Income | Female Income |
| Less than High School | - | - |
| High School Diploma | $23,923 | $33,613 |
| College or Associate's Degree | $38,177 | $31,627 |
| Bachelor's Degree | $58,089 | $42,250 |
| Graduate Degree | $78,098 | $54,432 |
| Total | $47,436 | $36,741 |
Family Income in Ojus
Family Income Brackets in Ojus
According to the Ojus family income data, there are 705 families falling into the $200,000+ income range, which is the most common income bracket and makes up 16.2% of all families. Conversely, the less than $10,000 income bracket is the least frequent group with only 109 families (2.5%) belonging to this category.
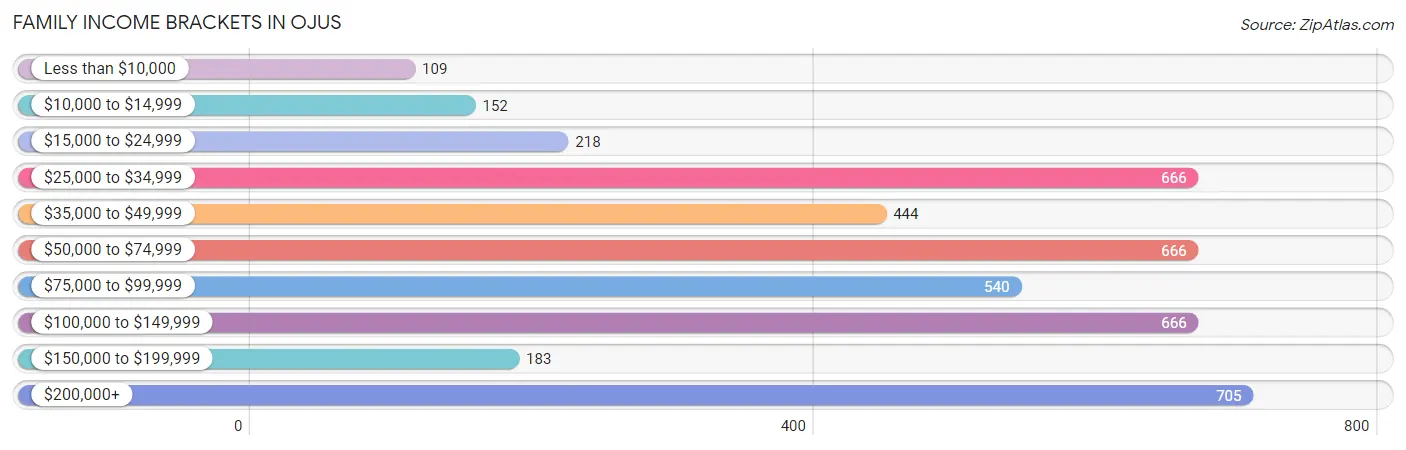
| Income Bracket | # Families | % Families |
| Less than $10,000 | 109 | 2.5% |
| $10,000 to $14,999 | 152 | 3.5% |
| $15,000 to $24,999 | 218 | 5.0% |
| $25,000 to $34,999 | 666 | 15.3% |
| $35,000 to $49,999 | 444 | 10.2% |
| $50,000 to $74,999 | 666 | 15.3% |
| $75,000 to $99,999 | 540 | 12.4% |
| $100,000 to $149,999 | 666 | 15.3% |
| $150,000 to $199,999 | 183 | 4.2% |
| $200,000+ | 705 | 16.2% |
Family Income by Famaliy Size in Ojus
5-person families (266 | 6.1%) account for the highest median family income in Ojus with $143,250 per family, while 4-person families (798 | 18.3%) have the highest median income of $29,610 per family member.
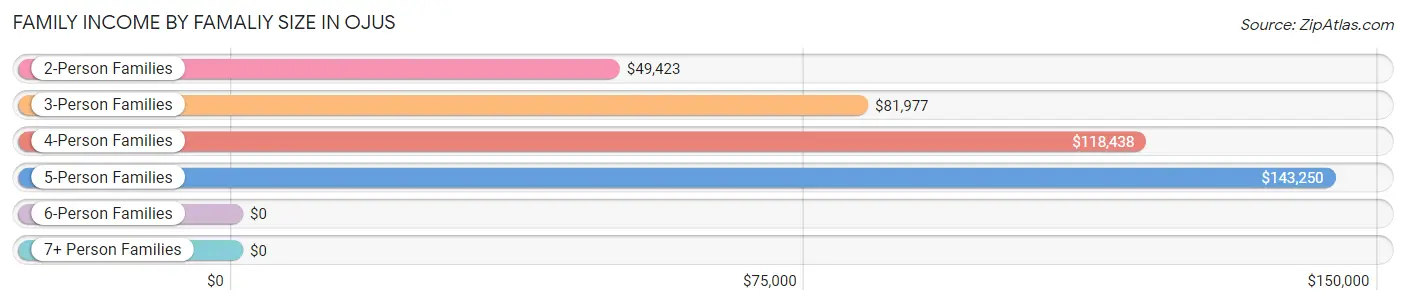
| Income Bracket | # Families | Median Income |
| 2-Person Families | 2,406 (55.3%) | $49,423 |
| 3-Person Families | 817 (18.8%) | $81,977 |
| 4-Person Families | 798 (18.3%) | $118,438 |
| 5-Person Families | 266 (6.1%) | $143,250 |
| 6-Person Families | 24 (0.5%) | $0 |
| 7+ Person Families | 43 (1.0%) | $0 |
| Total | 4,354 (100.0%) | $70,658 |
Family Income by Number of Earners in Ojus
The median family income in Ojus is $70,658, with families comprising 3+ earners (556) having the highest median family income of $119,579, while families with no earners (490) have the lowest median family income of $27,727, accounting for 12.8% and 11.3% of families, respectively.
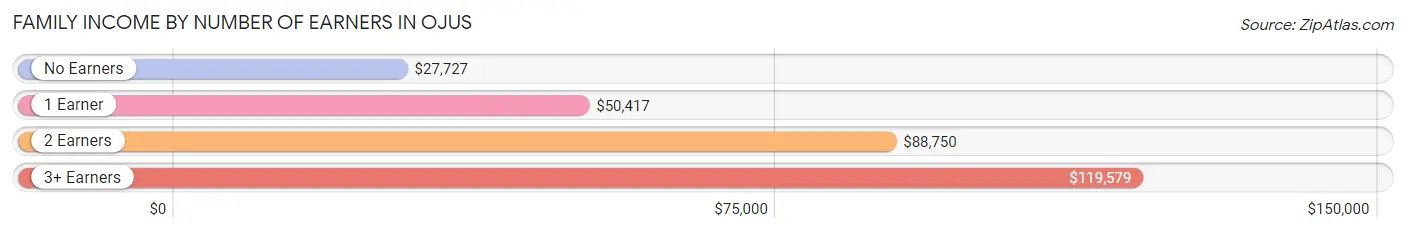
| Number of Earners | # Families | Median Income |
| No Earners | 490 (11.3%) | $27,727 |
| 1 Earner | 1,640 (37.7%) | $50,417 |
| 2 Earners | 1,668 (38.3%) | $88,750 |
| 3+ Earners | 556 (12.8%) | $119,579 |
| Total | 4,354 (100.0%) | $70,658 |
Household Income in Ojus
Household Income Brackets in Ojus
With 1,068 households falling in the category, the $50,000 to $74,999 income range is the most frequent in Ojus, accounting for 15.6% of all households. In contrast, only 377 households (5.5%) fall into the $150,000 to $199,999 income bracket, making it the least populous group.
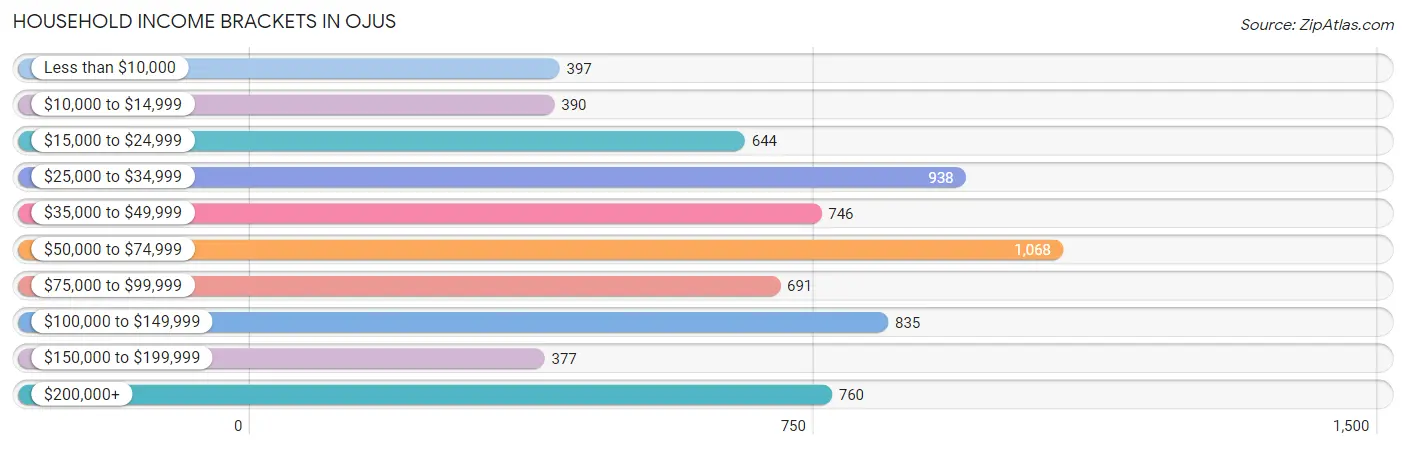
| Income Bracket | # Households | % Households |
| Less than $10,000 | 397 | 5.8% |
| $10,000 to $14,999 | 390 | 5.7% |
| $15,000 to $24,999 | 644 | 9.4% |
| $25,000 to $34,999 | 938 | 13.7% |
| $35,000 to $49,999 | 746 | 10.9% |
| $50,000 to $74,999 | 1,068 | 15.6% |
| $75,000 to $99,999 | 691 | 10.1% |
| $100,000 to $149,999 | 835 | 12.2% |
| $150,000 to $199,999 | 377 | 5.5% |
| $200,000+ | 760 | 11.1% |
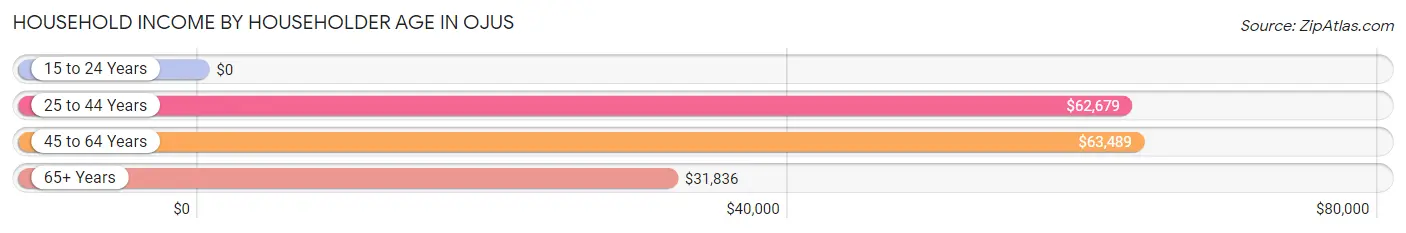
Household Income by Householder Age in Ojus
The median household income in Ojus is $58,750, with the highest median household income of $63,489 found in the 45 to 64 years age bracket for the primary householder. A total of 2,715 households (39.7%) fall into this category. Meanwhile, the 15 to 24 years age bracket for the primary householder has the lowest median household income of $0, with 161 households (2.4%) in this group.
| Income Bracket | # Households | Median Income |
| 15 to 24 Years | 161 (2.4%) | $0 |
| 25 to 44 Years | 1,970 (28.8%) | $62,679 |
| 45 to 64 Years | 2,715 (39.7%) | $63,489 |
| 65+ Years | 2,000 (29.2%) | $31,836 |
| Total | 6,846 (100.0%) | $58,750 |
Poverty in Ojus
Income Below Poverty by Sex and Age in Ojus
With 11.5% poverty level for males and 10.5% for females among the residents of Ojus, 75 year old and over males and 75 year old and over females are the most vulnerable to poverty, with 163 males (29.5%) and 286 females (38.6%) in their respective age groups living below the poverty level.
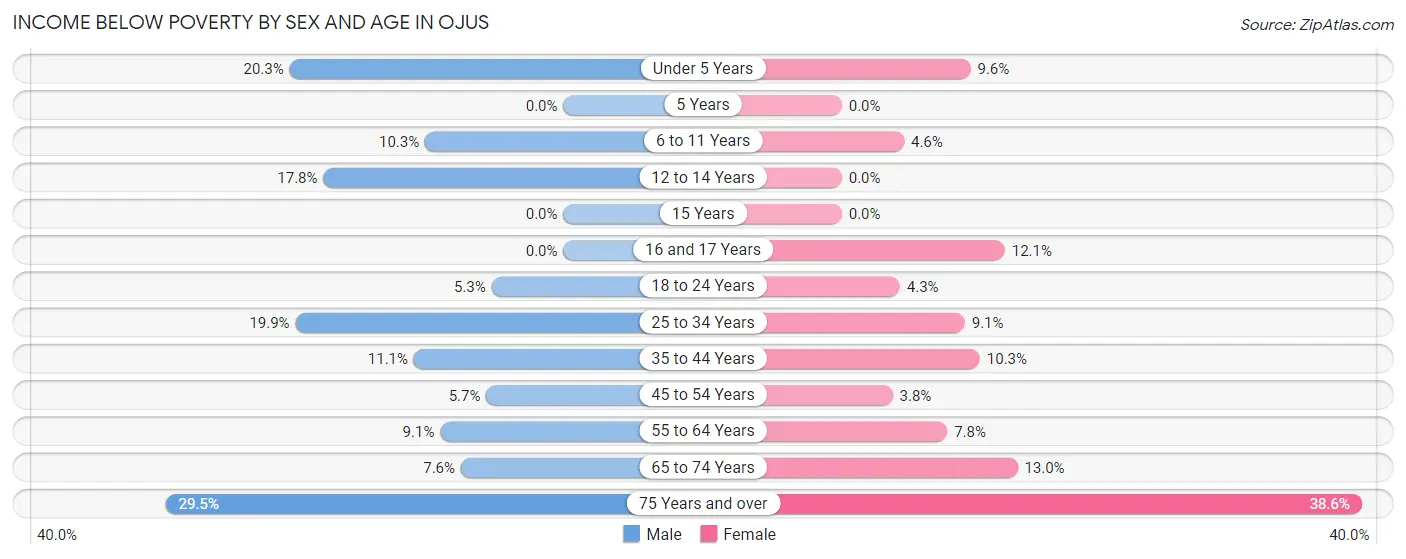
| Age Bracket | Male | Female |
| Under 5 Years | 75 (20.3%) | 39 (9.6%) |
| 5 Years | 0 (0.0%) | 0 (0.0%) |
| 6 to 11 Years | 53 (10.3%) | 19 (4.6%) |
| 12 to 14 Years | 36 (17.8%) | 0 (0.0%) |
| 15 Years | 0 (0.0%) | 0 (0.0%) |
| 16 and 17 Years | 0 (0.0%) | 15 (12.1%) |
| 18 to 24 Years | 35 (5.3%) | 20 (4.3%) |
| 25 to 34 Years | 208 (19.9%) | 101 (9.1%) |
| 35 to 44 Years | 127 (11.1%) | 96 (10.2%) |
| 45 to 54 Years | 51 (5.7%) | 45 (3.8%) |
| 55 to 64 Years | 120 (9.1%) | 104 (7.8%) |
| 65 to 74 Years | 66 (7.6%) | 138 (13.0%) |
| 75 Years and over | 163 (29.5%) | 286 (38.6%) |
| Total | 934 (11.5%) | 863 (10.5%) |
Income Above Poverty by Sex and Age in Ojus
According to the poverty statistics in Ojus, males aged 5 years and females aged 5 years are the age groups that are most secure financially, with 100.0% of males and 100.0% of females in these age groups living above the poverty line.
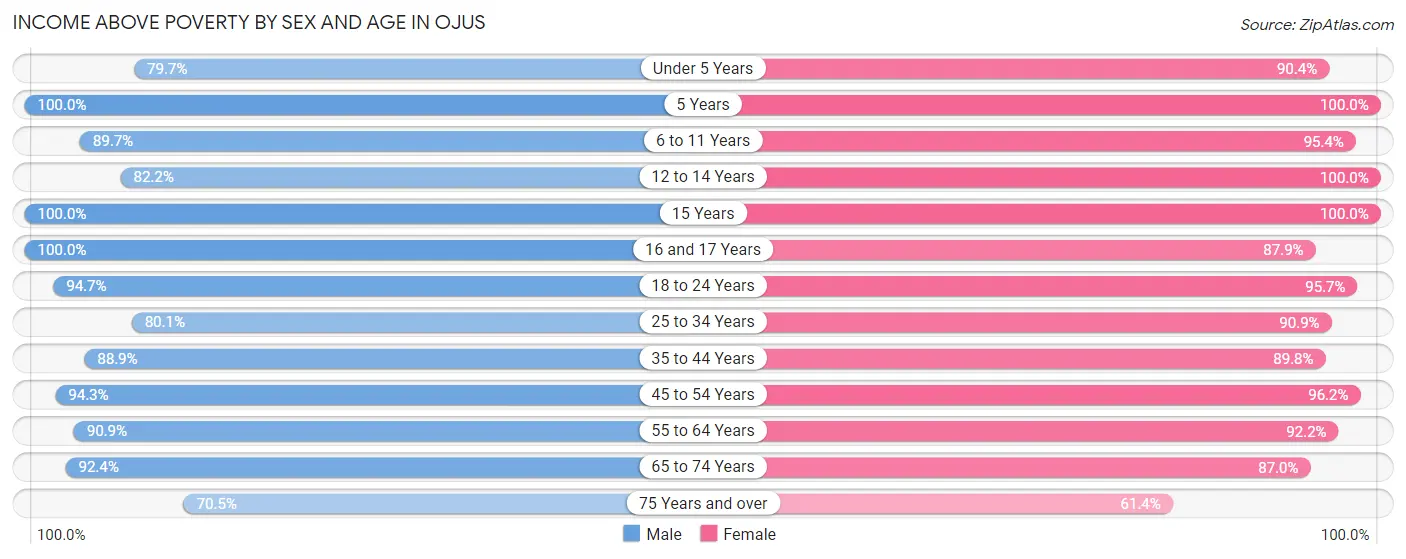
| Age Bracket | Male | Female |
| Under 5 Years | 294 (79.7%) | 369 (90.4%) |
| 5 Years | 108 (100.0%) | 65 (100.0%) |
| 6 to 11 Years | 463 (89.7%) | 392 (95.4%) |
| 12 to 14 Years | 166 (82.2%) | 269 (100.0%) |
| 15 Years | 65 (100.0%) | 101 (100.0%) |
| 16 and 17 Years | 374 (100.0%) | 109 (87.9%) |
| 18 to 24 Years | 622 (94.7%) | 444 (95.7%) |
| 25 to 34 Years | 838 (80.1%) | 1,005 (90.9%) |
| 35 to 44 Years | 1,017 (88.9%) | 841 (89.7%) |
| 45 to 54 Years | 841 (94.3%) | 1,148 (96.2%) |
| 55 to 64 Years | 1,193 (90.9%) | 1,224 (92.2%) |
| 65 to 74 Years | 801 (92.4%) | 920 (87.0%) |
| 75 Years and over | 389 (70.5%) | 455 (61.4%) |
| Total | 7,171 (88.5%) | 7,342 (89.5%) |
Income Below Poverty Among Married-Couple Families in Ojus
The poverty statistics for married-couple families in Ojus show that 8.4% or 266 of the total 3,154 families live below the poverty line. Families with no children have the highest poverty rate of 10.3%, comprising of 231 families. On the other hand, families with 5 or more children have the lowest poverty rate of 0.0%, which includes 0 families.
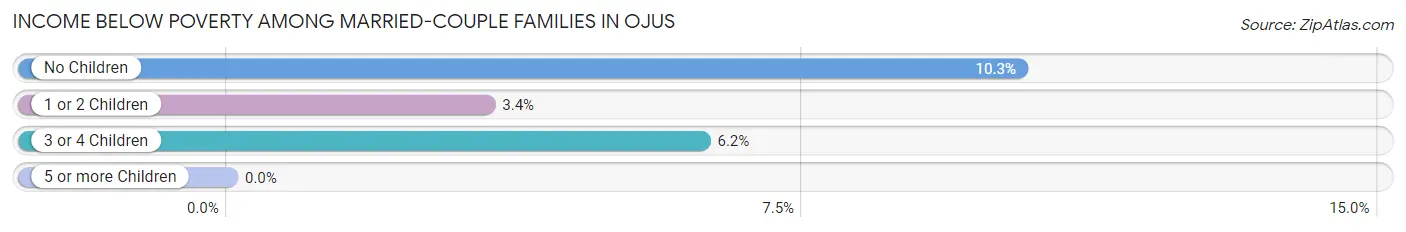
| Children | Above Poverty | Below Poverty |
| No Children | 2,009 (89.7%) | 231 (10.3%) |
| 1 or 2 Children | 720 (96.6%) | 25 (3.4%) |
| 3 or 4 Children | 152 (93.8%) | 10 (6.2%) |
| 5 or more Children | 7 (100.0%) | 0 (0.0%) |
| Total | 2,888 (91.6%) | 266 (8.4%) |
Income Below Poverty Among Single-Parent Households in Ojus
According to the poverty data in Ojus, 12.4% or 37 single-father households and 13.0% or 117 single-mother households are living below the poverty line. Among single-father households, those with 1 or 2 children have the highest poverty rate, with 37 households (19.7%) experiencing poverty. Likewise, among single-mother households, those with 1 or 2 children have the highest poverty rate, with 63 households (15.9%) falling below the poverty line.
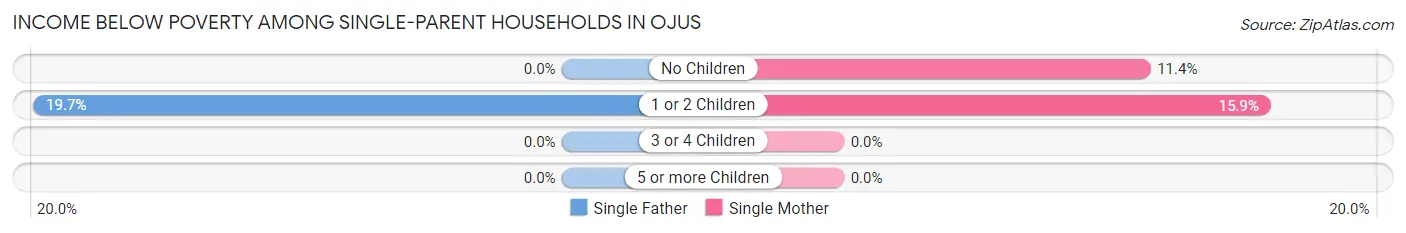
| Children | Single Father | Single Mother |
| No Children | 0 (0.0%) | 54 (11.4%) |
| 1 or 2 Children | 37 (19.7%) | 63 (15.9%) |
| 3 or 4 Children | 0 (0.0%) | 0 (0.0%) |
| 5 or more Children | 0 (0.0%) | 0 (0.0%) |
| Total | 37 (12.4%) | 117 (13.0%) |
Income Below Poverty Among Married-Couple vs Single-Parent Households in Ojus
The poverty data for Ojus shows that 266 of the married-couple family households (8.4%) and 154 of the single-parent households (12.8%) are living below the poverty level. Within the married-couple family households, those with no children have the highest poverty rate, with 231 households (10.3%) falling below the poverty line. Among the single-parent households, those with 1 or 2 children have the highest poverty rate, with 100 household (17.1%) living below poverty.
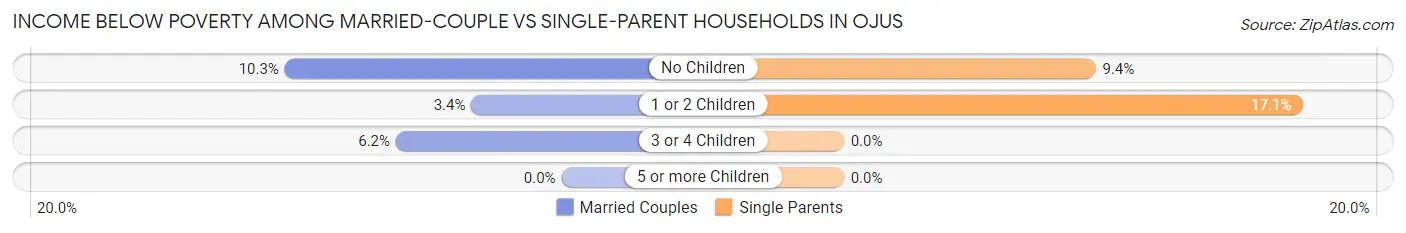
| Children | Married-Couple Families | Single-Parent Households |
| No Children | 231 (10.3%) | 54 (9.4%) |
| 1 or 2 Children | 25 (3.4%) | 100 (17.1%) |
| 3 or 4 Children | 10 (6.2%) | 0 (0.0%) |
| 5 or more Children | 0 (0.0%) | 0 (0.0%) |
| Total | 266 (8.4%) | 154 (12.8%) |
Race in Ojus
The most populous races in Ojus are White / Caucasian (9,850 | 59.9%), Hispanic or Latino (8,564 | 52.1%), and Two or more Races (2,912 | 17.7%).
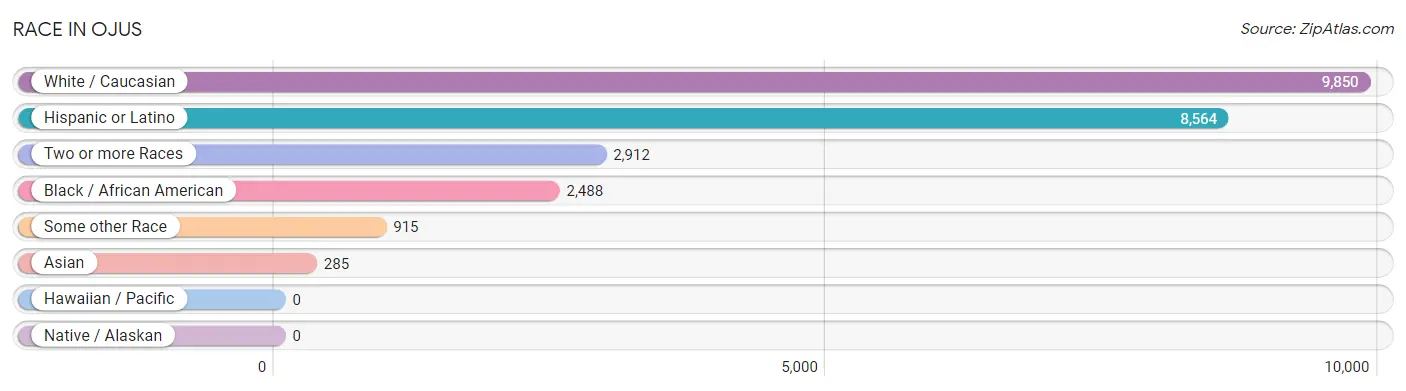
| Race | # Population | % Population |
| Asian | 285 | 1.7% |
| Black / African American | 2,488 | 15.1% |
| Hawaiian / Pacific | 0 | 0.0% |
| Hispanic or Latino | 8,564 | 52.1% |
| Native / Alaskan | 0 | 0.0% |
| White / Caucasian | 9,850 | 59.9% |
| Two or more Races | 2,912 | 17.7% |
| Some other Race | 915 | 5.6% |
| Total | 16,450 | 100.0% |
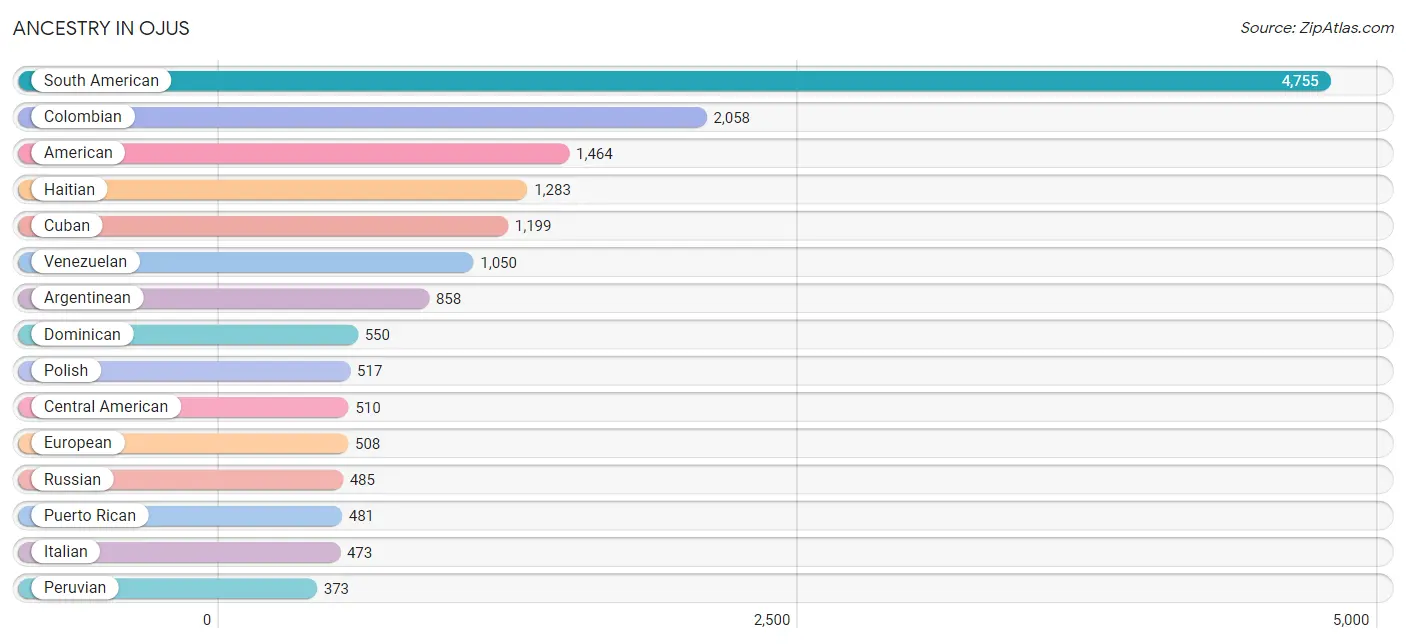
Ancestry in Ojus
The most populous ancestries reported in Ojus are South American (4,755 | 28.9%), Colombian (2,058 | 12.5%), American (1,464 | 8.9%), Haitian (1,283 | 7.8%), and Cuban (1,199 | 7.3%), together accounting for 65.4% of all Ojus residents.
| Ancestry | # Population | % Population |
| African | 77 | 0.5% |
| American | 1,464 | 8.9% |
| Arab | 164 | 1.0% |
| Argentinean | 858 | 5.2% |
| Armenian | 9 | 0.1% |
| Austrian | 7 | 0.0% |
| Bolivian | 8 | 0.1% |
| Brazilian | 95 | 0.6% |
| British | 4 | 0.0% |
| Burmese | 34 | 0.2% |
| Canadian | 39 | 0.2% |
| Central American | 510 | 3.1% |
| Chilean | 42 | 0.3% |
| Colombian | 2,058 | 12.5% |
| Cuban | 1,199 | 7.3% |
| Czech | 12 | 0.1% |
| Czechoslovakian | 14 | 0.1% |
| Danish | 8 | 0.1% |
| Dominican | 550 | 3.3% |
| Dutch | 23 | 0.1% |
| Dutch West Indian | 28 | 0.2% |
| Eastern European | 343 | 2.1% |
| Ecuadorian | 333 | 2.0% |
| Egyptian | 21 | 0.1% |
| English | 236 | 1.4% |
| European | 508 | 3.1% |
| Finnish | 19 | 0.1% |
| French | 186 | 1.1% |
| French Canadian | 15 | 0.1% |
| German | 313 | 1.9% |
| Greek | 56 | 0.3% |
| Guatemalan | 9 | 0.1% |
| Haitian | 1,283 | 7.8% |
| Honduran | 279 | 1.7% |
| Hungarian | 111 | 0.7% |
| Indian (Asian) | 160 | 1.0% |
| Iranian | 72 | 0.4% |
| Iraqi | 9 | 0.1% |
| Irish | 66 | 0.4% |
| Israeli | 199 | 1.2% |
| Italian | 473 | 2.9% |
| Jamaican | 252 | 1.5% |
| Korean | 157 | 0.9% |
| Lebanese | 66 | 0.4% |
| Lithuanian | 42 | 0.3% |
| Maltese | 29 | 0.2% |
| Mexican | 147 | 0.9% |
| Moroccan | 28 | 0.2% |
| Nicaraguan | 63 | 0.4% |
| Norwegian | 18 | 0.1% |
| Palestinian | 10 | 0.1% |
| Panamanian | 136 | 0.8% |
| Peruvian | 373 | 2.3% |
| Polish | 517 | 3.1% |
| Portuguese | 57 | 0.4% |
| Puerto Rican | 481 | 2.9% |
| Romanian | 209 | 1.3% |
| Russian | 485 | 2.9% |
| Salvadoran | 23 | 0.1% |
| Scandinavian | 12 | 0.1% |
| Scottish | 29 | 0.2% |
| Slovak | 31 | 0.2% |
| South American | 4,755 | 28.9% |
| Spaniard | 187 | 1.1% |
| Spanish | 64 | 0.4% |
| Subsaharan African | 77 | 0.5% |
| Swedish | 39 | 0.2% |
| Swiss | 9 | 0.1% |
| Syrian | 7 | 0.0% |
| Trinidadian and Tobagonian | 46 | 0.3% |
| Turkish | 133 | 0.8% |
| Ukrainian | 158 | 1.0% |
| Uruguayan | 33 | 0.2% |
| Venezuelan | 1,050 | 6.4% |
| West Indian | 26 | 0.2% | View All 75 Rows |
Immigrants in Ojus
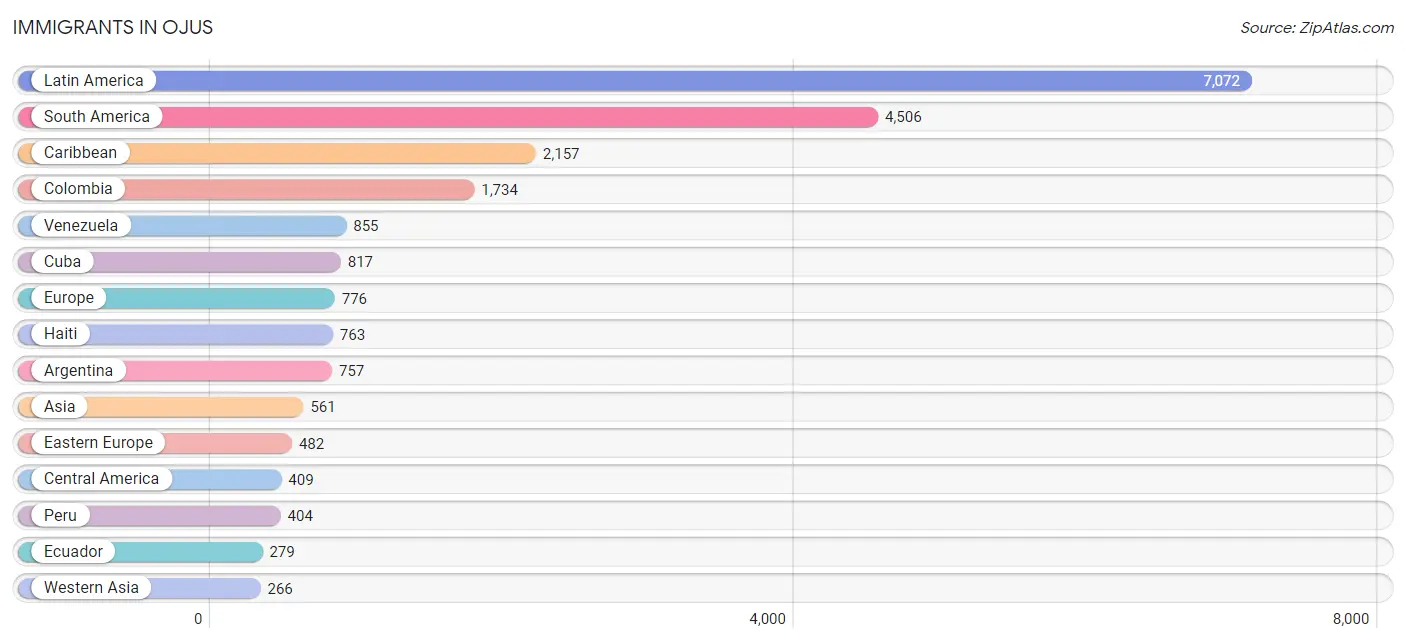
The most numerous immigrant groups reported in Ojus came from Latin America (7,072 | 43.0%), South America (4,506 | 27.4%), Caribbean (2,157 | 13.1%), Colombia (1,734 | 10.5%), and Venezuela (855 | 5.2%), together accounting for 99.2% of all Ojus residents.
| Immigration Origin | # Population | % Population |
| Africa | 130 | 0.8% |
| Albania | 37 | 0.2% |
| Argentina | 757 | 4.6% |
| Asia | 561 | 3.4% |
| Austria | 18 | 0.1% |
| Bahamas | 61 | 0.4% |
| Belarus | 16 | 0.1% |
| Bolivia | 8 | 0.1% |
| Brazil | 216 | 1.3% |
| Canada | 79 | 0.5% |
| Caribbean | 2,157 | 13.1% |
| Central America | 409 | 2.5% |
| Chile | 4 | 0.0% |
| China | 107 | 0.6% |
| Colombia | 1,734 | 10.5% |
| Cuba | 817 | 5.0% |
| Czechoslovakia | 19 | 0.1% |
| Denmark | 8 | 0.1% |
| Dominican Republic | 250 | 1.5% |
| Eastern Asia | 128 | 0.8% |
| Eastern Europe | 482 | 2.9% |
| Ecuador | 279 | 1.7% |
| Egypt | 19 | 0.1% |
| El Salvador | 14 | 0.1% |
| Europe | 776 | 4.7% |
| France | 82 | 0.5% |
| Germany | 51 | 0.3% |
| Guyana | 26 | 0.2% |
| Haiti | 763 | 4.6% |
| Honduras | 218 | 1.3% |
| Hungary | 69 | 0.4% |
| Israel | 114 | 0.7% |
| Jamaica | 180 | 1.1% |
| Korea | 21 | 0.1% |
| Kuwait | 5 | 0.0% |
| Latin America | 7,072 | 43.0% |
| Latvia | 11 | 0.1% |
| Lebanon | 21 | 0.1% |
| Mexico | 7 | 0.0% |
| Middle Africa | 72 | 0.4% |
| Morocco | 11 | 0.1% |
| Nicaragua | 42 | 0.3% |
| Northern Africa | 30 | 0.2% |
| Northern Europe | 84 | 0.5% |
| Panama | 128 | 0.8% |
| Peru | 404 | 2.5% |
| Philippines | 137 | 0.8% |
| Poland | 31 | 0.2% |
| Portugal | 5 | 0.0% |
| Romania | 44 | 0.3% |
| Russia | 159 | 1.0% |
| Saudi Arabia | 21 | 0.1% |
| South Africa | 28 | 0.2% |
| South America | 4,506 | 27.4% |
| South Central Asia | 30 | 0.2% |
| South Eastern Asia | 137 | 0.8% |
| Southern Europe | 50 | 0.3% |
| Spain | 45 | 0.3% |
| Sweden | 55 | 0.3% |
| Switzerland | 9 | 0.1% |
| Trinidad and Tobago | 58 | 0.4% |
| Turkey | 105 | 0.6% |
| Ukraine | 96 | 0.6% |
| Uruguay | 173 | 1.1% |
| Uzbekistan | 30 | 0.2% |
| Venezuela | 855 | 5.2% |
| Western Asia | 266 | 1.6% |
| Western Europe | 160 | 1.0% | View All 68 Rows |
Sex and Age in Ojus
Sex and Age in Ojus
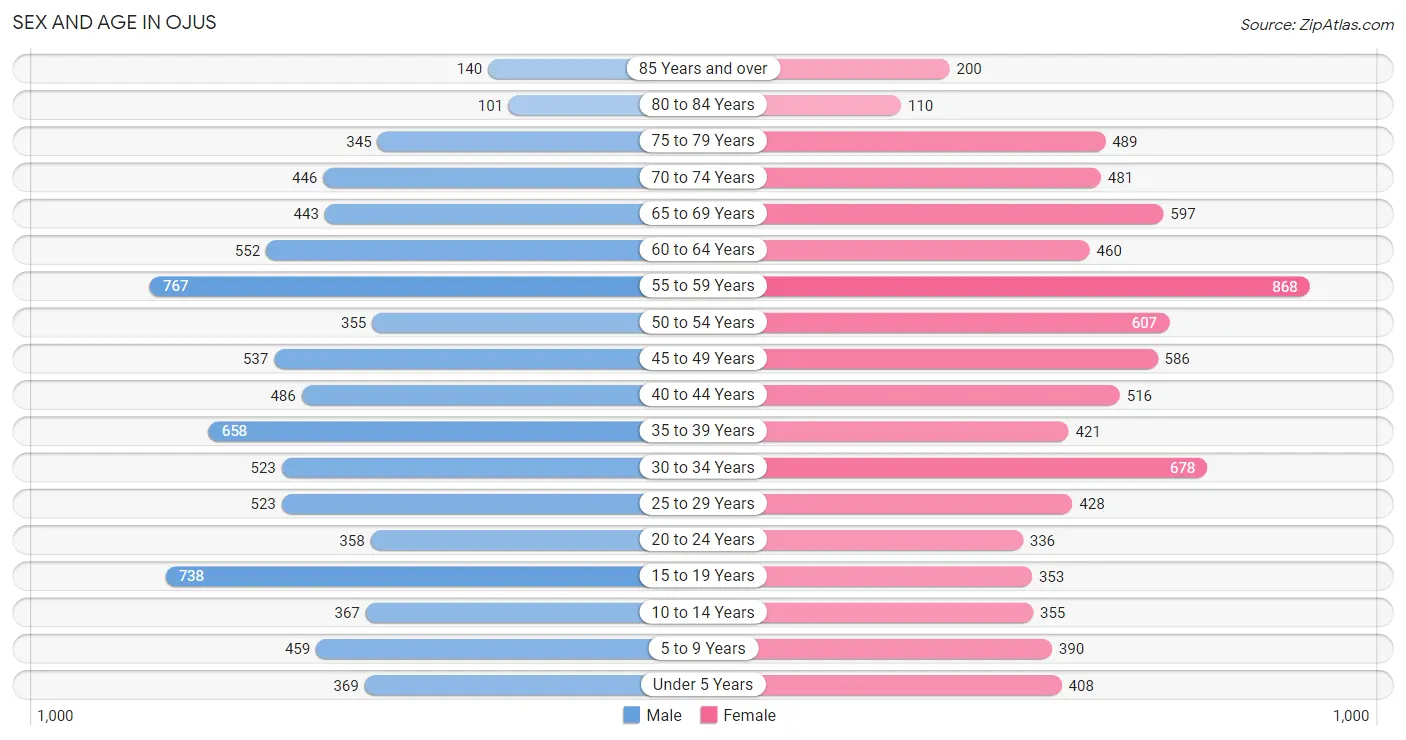
The most populous age groups in Ojus are 55 to 59 Years (767 | 9.4%) for men and 55 to 59 Years (868 | 10.5%) for women.
| Age Bracket | Male | Female |
| Under 5 Years | 369 (4.5%) | 408 (4.9%) |
| 5 to 9 Years | 459 (5.6%) | 390 (4.7%) |
| 10 to 14 Years | 367 (4.5%) | 355 (4.3%) |
| 15 to 19 Years | 738 (9.0%) | 353 (4.3%) |
| 20 to 24 Years | 358 (4.4%) | 336 (4.1%) |
| 25 to 29 Years | 523 (6.4%) | 428 (5.2%) |
| 30 to 34 Years | 523 (6.4%) | 678 (8.2%) |
| 35 to 39 Years | 658 (8.1%) | 421 (5.1%) |
| 40 to 44 Years | 486 (5.9%) | 516 (6.2%) |
| 45 to 49 Years | 537 (6.6%) | 586 (7.1%) |
| 50 to 54 Years | 355 (4.3%) | 607 (7.3%) |
| 55 to 59 Years | 767 (9.4%) | 868 (10.5%) |
| 60 to 64 Years | 552 (6.8%) | 460 (5.6%) |
| 65 to 69 Years | 443 (5.4%) | 597 (7.2%) |
| 70 to 74 Years | 446 (5.5%) | 481 (5.8%) |
| 75 to 79 Years | 345 (4.2%) | 489 (5.9%) |
| 80 to 84 Years | 101 (1.2%) | 110 (1.3%) |
| 85 Years and over | 140 (1.7%) | 200 (2.4%) |
| Total | 8,167 (100.0%) | 8,283 (100.0%) |
Families and Households in Ojus
Median Family Size in Ojus
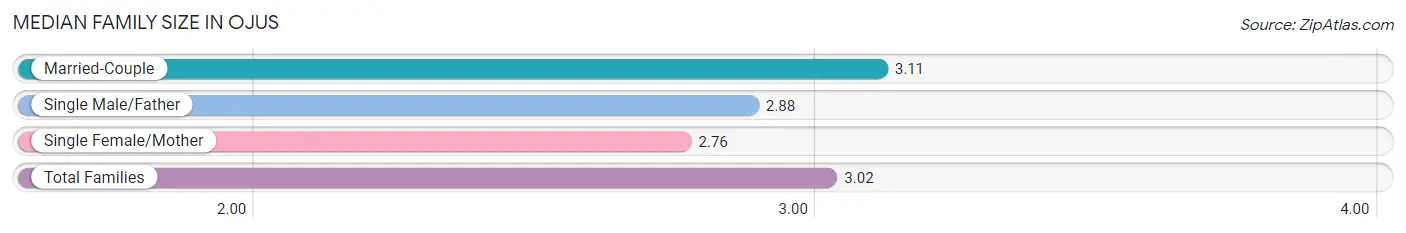
The median family size in Ojus is 3.02 persons per family, with married-couple families (3,154 | 72.4%) accounting for the largest median family size of 3.11 persons per family. On the other hand, single female/mother families (901 | 20.7%) represent the smallest median family size with 2.76 persons per family.
| Family Type | # Families | Family Size |
| Married-Couple | 3,154 (72.4%) | 3.11 |
| Single Male/Father | 299 (6.9%) | 2.88 |
| Single Female/Mother | 901 (20.7%) | 2.76 |
| Total Families | 4,354 (100.0%) | 3.02 |
Median Household Size in Ojus
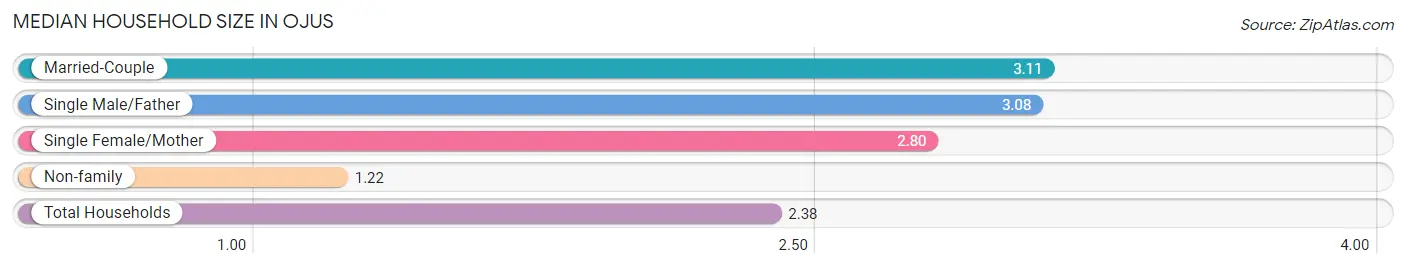
The median household size in Ojus is 2.38 persons per household, with married-couple households (3,154 | 46.1%) accounting for the largest median household size of 3.11 persons per household. non-family households (2,492 | 36.4%) represent the smallest median household size with 1.22 persons per household.
| Household Type | # Households | Household Size |
| Married-Couple | 3,154 (46.1%) | 3.11 |
| Single Male/Father | 299 (4.4%) | 3.08 |
| Single Female/Mother | 901 (13.2%) | 2.80 |
| Non-family | 2,492 (36.4%) | 1.22 |
| Total Households | 6,846 (100.0%) | 2.38 |
Household Size by Marriage Status in Ojus
Out of a total of 6,846 households in Ojus, 4,354 (63.6%) are family households, while 2,492 (36.4%) are nonfamily households. The most numerous type of family households are 2-person households, comprising 2,349, and the most common type of nonfamily households are 1-person households, comprising 2,029.
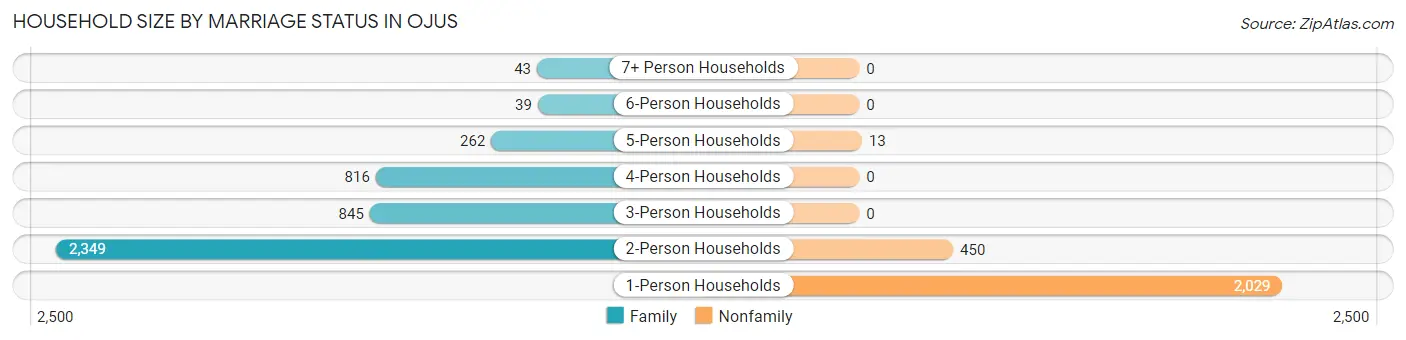
| Household Size | Family Households | Nonfamily Households |
| 1-Person Households | - | 2,029 (29.6%) |
| 2-Person Households | 2,349 (34.3%) | 450 (6.6%) |
| 3-Person Households | 845 (12.3%) | 0 (0.0%) |
| 4-Person Households | 816 (11.9%) | 0 (0.0%) |
| 5-Person Households | 262 (3.8%) | 13 (0.2%) |
| 6-Person Households | 39 (0.6%) | 0 (0.0%) |
| 7+ Person Households | 43 (0.6%) | 0 (0.0%) |
| Total | 4,354 (63.6%) | 2,492 (36.4%) |
Female Fertility in Ojus
Fertility by Age in Ojus
Average fertility rate in Ojus is 44.0 births per 1,000 women. Women in the age bracket of 20 to 34 years have the highest fertility rate with 51.0 births per 1,000 women. Women in the age bracket of 20 to 34 years acount for 50.0% of all women with births.
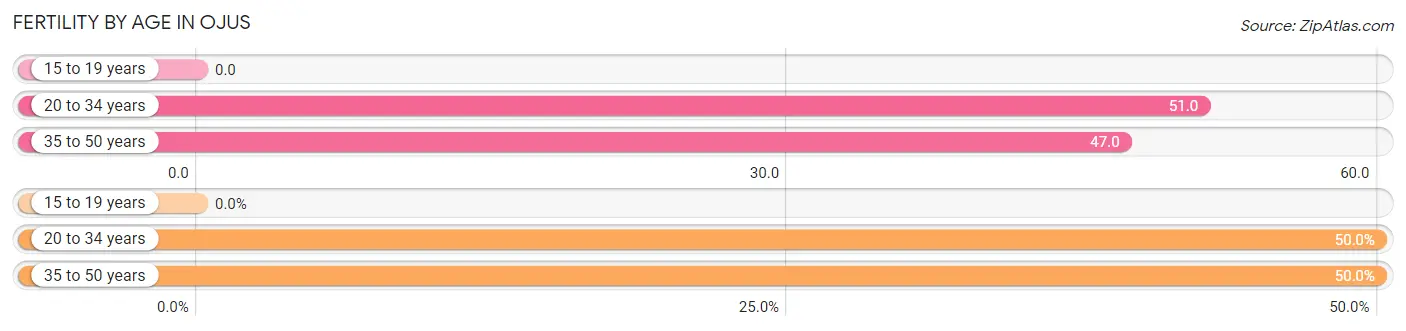
| Age Bracket | Women with Births | Births / 1,000 Women |
| 15 to 19 years | 0 (0.0%) | 0.0 |
| 20 to 34 years | 74 (50.0%) | 51.0 |
| 35 to 50 years | 74 (50.0%) | 47.0 |
| Total | 148 (100.0%) | 44.0 |
Fertility by Age by Marriage Status in Ojus
56.1% of women with births (148) in Ojus are married. The highest percentage of unmarried women with births falls into 35 to 50 years age bracket with 44.6% of them unmarried at the time of birth, while the lowest percentage of unmarried women with births belong to 20 to 34 years age bracket with 43.2% of them unmarried.
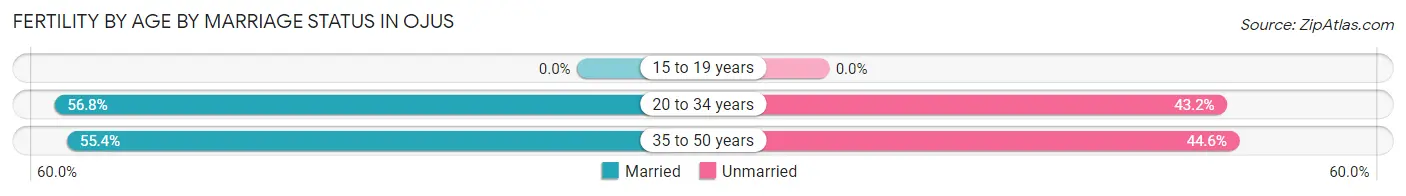
| Age Bracket | Married | Unmarried |
| 15 to 19 years | 0 (0.0%) | 0 (0.0%) |
| 20 to 34 years | 42 (56.8%) | 32 (43.2%) |
| 35 to 50 years | 41 (55.4%) | 33 (44.6%) |
| Total | 83 (56.1%) | 65 (43.9%) |
Fertility by Education in Ojus
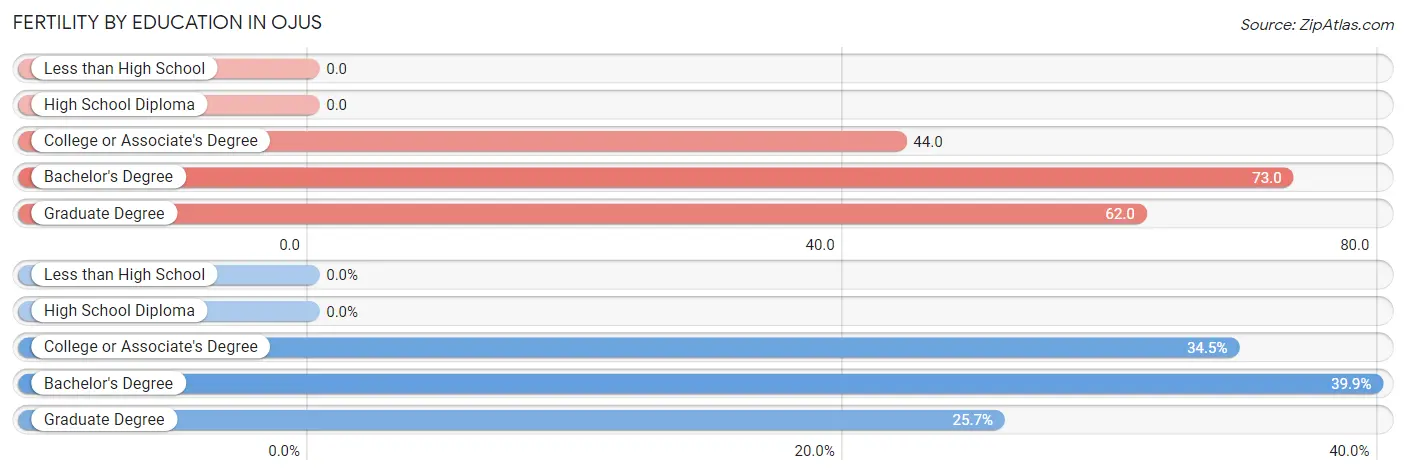
| Educational Attainment | Women with Births | Births / 1,000 Women |
| Less than High School | 0 (0.0%) | 0.0 |
| High School Diploma | 0 (0.0%) | 0.0 |
| College or Associate's Degree | 51 (34.5%) | 44.0 |
| Bachelor's Degree | 59 (39.9%) | 73.0 |
| Graduate Degree | 38 (25.7%) | 62.0 |
| Total | 148 (100.0%) | 44.0 |
Fertility by Education by Marriage Status in Ojus
43.9% of women with births in Ojus are unmarried. Women with the educational attainment of graduate degree are most likely to be married with 100.0% of them married at childbirth, while women with the educational attainment of college or associate's degree are least likely to be married with 100.0% of them unmarried at childbirth.
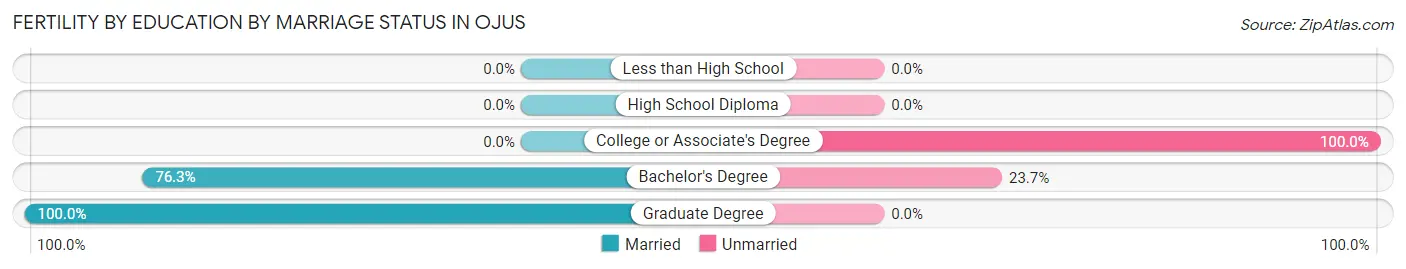
| Educational Attainment | Married | Unmarried |
| Less than High School | 0 (0.0%) | 0 (0.0%) |
| High School Diploma | 0 (0.0%) | 0 (0.0%) |
| College or Associate's Degree | 0 (0.0%) | 51 (100.0%) |
| Bachelor's Degree | 45 (76.3%) | 14 (23.7%) |
| Graduate Degree | 38 (100.0%) | 0 (0.0%) |
| Total | 83 (56.1%) | 65 (43.9%) |
Employment Characteristics in Ojus
Employment by Class of Employer in Ojus
Among the 8,567 employed individuals in Ojus, private company employees (5,229 | 61.0%), self-employed (incorporated) (1,004 | 11.7%), and self-employed (not incorporated) (868 | 10.1%) make up the most common classes of employment.
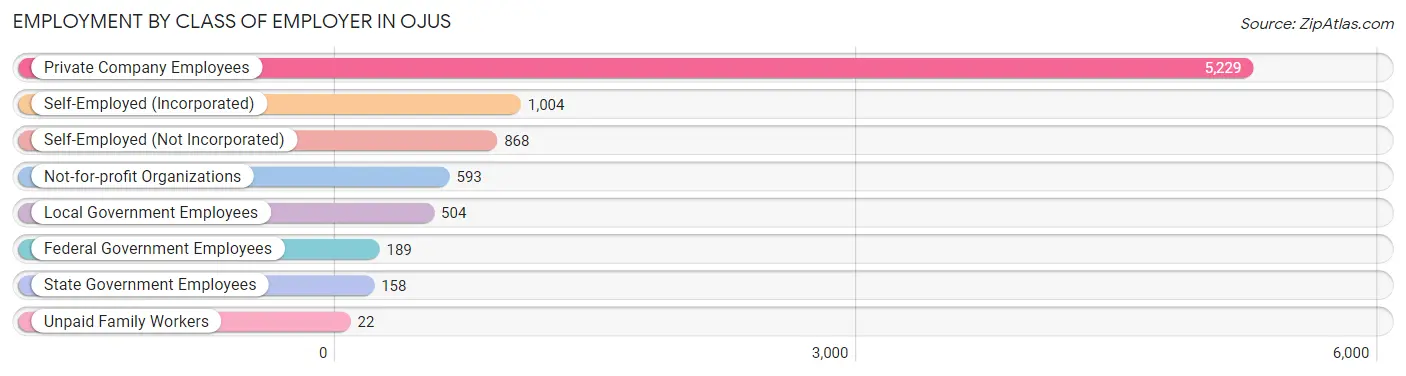
| Employer Class | # Employees | % Employees |
| Private Company Employees | 5,229 | 61.0% |
| Self-Employed (Incorporated) | 1,004 | 11.7% |
| Self-Employed (Not Incorporated) | 868 | 10.1% |
| Not-for-profit Organizations | 593 | 6.9% |
| Local Government Employees | 504 | 5.9% |
| State Government Employees | 158 | 1.8% |
| Federal Government Employees | 189 | 2.2% |
| Unpaid Family Workers | 22 | 0.3% |
| Total | 8,567 | 100.0% |
Employment Status by Age in Ojus
According to the labor force statistics for Ojus, out of the total population over 16 years of age (13,936), 65.9% or 9,184 individuals are in the labor force, with 4.9% or 450 of them unemployed. The age group with the highest labor force participation rate is 25 to 29 years, with 98.5% or 937 individuals in the labor force. Within the labor force, the 16 to 19 years age range has the highest percentage of unemployed individuals, with 15.2% or 37 of them being unemployed.
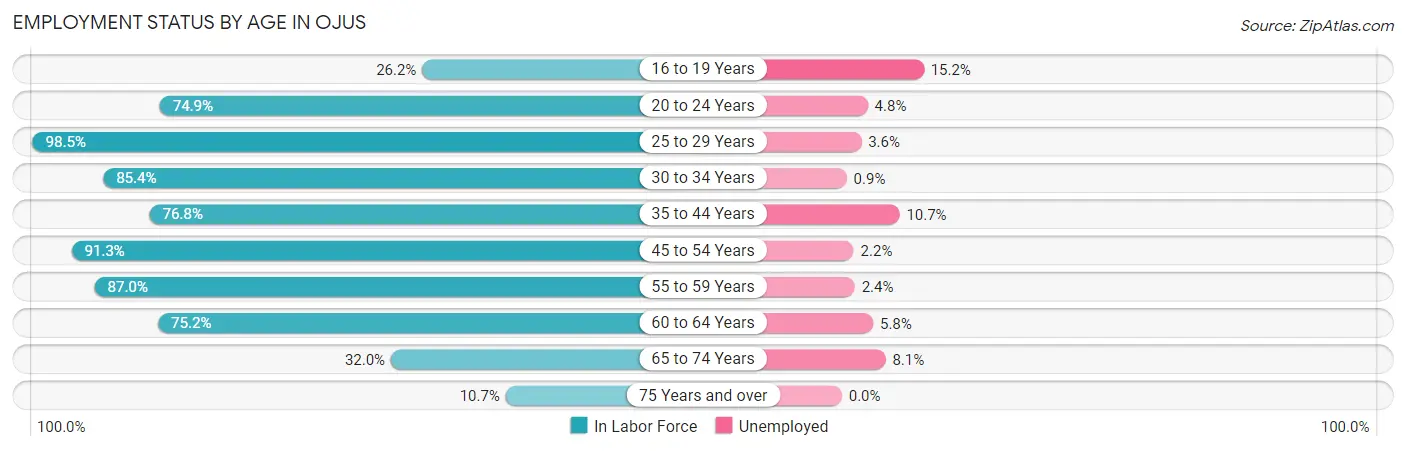
| Age Bracket | In Labor Force | Unemployed |
| 16 to 19 Years | 242 (26.2%) | 37 (15.2%) |
| 20 to 24 Years | 520 (74.9%) | 25 (4.8%) |
| 25 to 29 Years | 937 (98.5%) | 34 (3.6%) |
| 30 to 34 Years | 1,026 (85.4%) | 9 (0.9%) |
| 35 to 44 Years | 1,598 (76.8%) | 171 (10.7%) |
| 45 to 54 Years | 1,904 (91.3%) | 42 (2.2%) |
| 55 to 59 Years | 1,422 (87.0%) | 34 (2.4%) |
| 60 to 64 Years | 761 (75.2%) | 44 (5.8%) |
| 65 to 74 Years | 629 (32.0%) | 51 (8.1%) |
| 75 Years and over | 148 (10.7%) | 0 (0.0%) |
| Total | 9,184 (65.9%) | 450 (4.9%) |
Employment Status by Educational Attainment in Ojus
According to labor force statistics for Ojus, 85.3% of individuals (7,647) out of the total population between 25 and 64 years of age (8,965) are in the labor force, with 4.4% or 336 of them being unemployed. The group with the highest labor force participation rate are those with the educational attainment of college / associate degree, with 89.4% or 2,547 individuals in the labor force. Within the labor force, individuals with college / associate degree education have the highest percentage of unemployment, with 5.6% or 143 of them being unemployed.
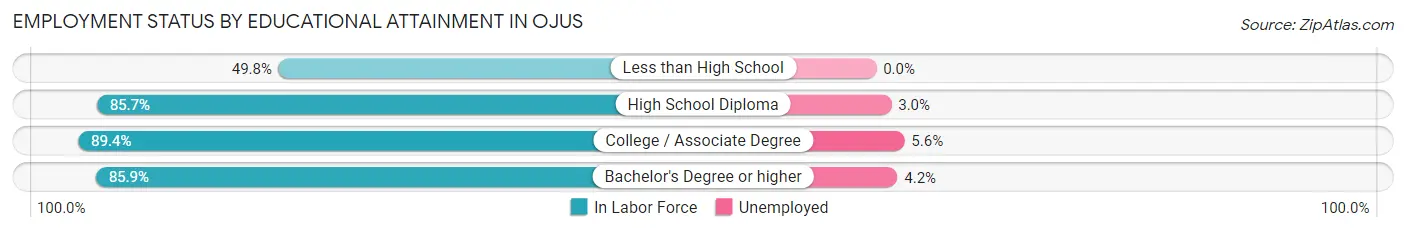
| Educational Attainment | In Labor Force | Unemployed |
| Less than High School | 207 (49.8%) | 0 (0.0%) |
| High School Diploma | 1,359 (85.7%) | 48 (3.0%) |
| College / Associate Degree | 2,547 (89.4%) | 160 (5.6%) |
| Bachelor's Degree or higher | 3,534 (85.9%) | 173 (4.2%) |
| Total | 7,647 (85.3%) | 394 (4.4%) |
Employment Occupations by Sex in Ojus
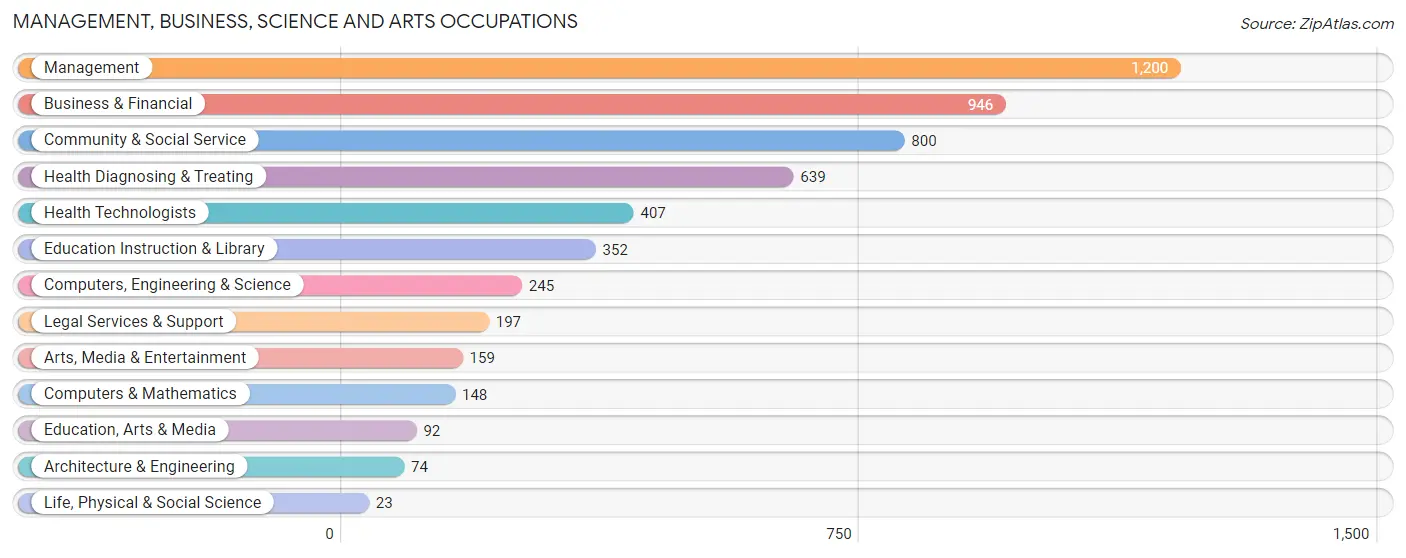
Management, Business, Science and Arts Occupations
The most common Management, Business, Science and Arts occupations in Ojus are Management (1,200 | 13.7%), Business & Financial (946 | 10.8%), Community & Social Service (800 | 9.2%), Health Diagnosing & Treating (639 | 7.3%), and Health Technologists (407 | 4.7%).
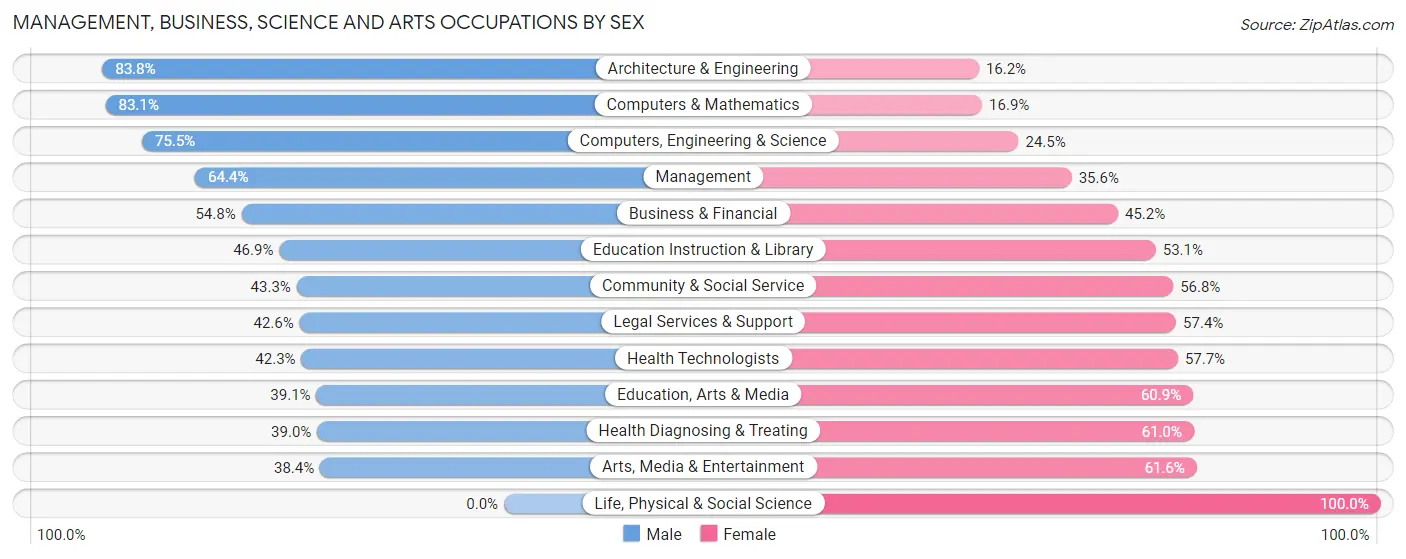
Management, Business, Science and Arts Occupations by Sex
Within the Management, Business, Science and Arts occupations in Ojus, the most male-oriented occupations are Architecture & Engineering (83.8%), Computers & Mathematics (83.1%), and Computers, Engineering & Science (75.5%), while the most female-oriented occupations are Life, Physical & Social Science (100.0%), Arts, Media & Entertainment (61.6%), and Health Diagnosing & Treating (61.0%).
| Occupation | Male | Female |
| Management | 773 (64.4%) | 427 (35.6%) |
| Business & Financial | 518 (54.8%) | 428 (45.2%) |
| Computers, Engineering & Science | 185 (75.5%) | 60 (24.5%) |
| Computers & Mathematics | 123 (83.1%) | 25 (16.9%) |
| Architecture & Engineering | 62 (83.8%) | 12 (16.2%) |
| Life, Physical & Social Science | 0 (0.0%) | 23 (100.0%) |
| Community & Social Service | 346 (43.2%) | 454 (56.8%) |
| Education, Arts & Media | 36 (39.1%) | 56 (60.9%) |
| Legal Services & Support | 84 (42.6%) | 113 (57.4%) |
| Education Instruction & Library | 165 (46.9%) | 187 (53.1%) |
| Arts, Media & Entertainment | 61 (38.4%) | 98 (61.6%) |
| Health Diagnosing & Treating | 249 (39.0%) | 390 (61.0%) |
| Health Technologists | 172 (42.3%) | 235 (57.7%) |
| Total (Category) | 2,071 (54.1%) | 1,759 (45.9%) |
| Total (Overall) | 4,556 (52.1%) | 4,181 (47.8%) |
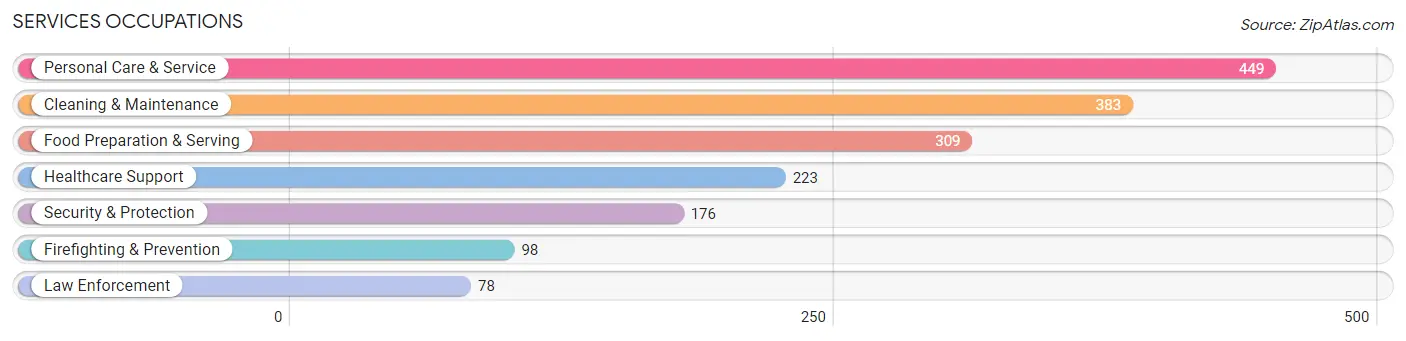
Services Occupations
The most common Services occupations in Ojus are Personal Care & Service (449 | 5.1%), Cleaning & Maintenance (383 | 4.4%), Food Preparation & Serving (309 | 3.5%), Healthcare Support (223 | 2.5%), and Security & Protection (176 | 2.0%).
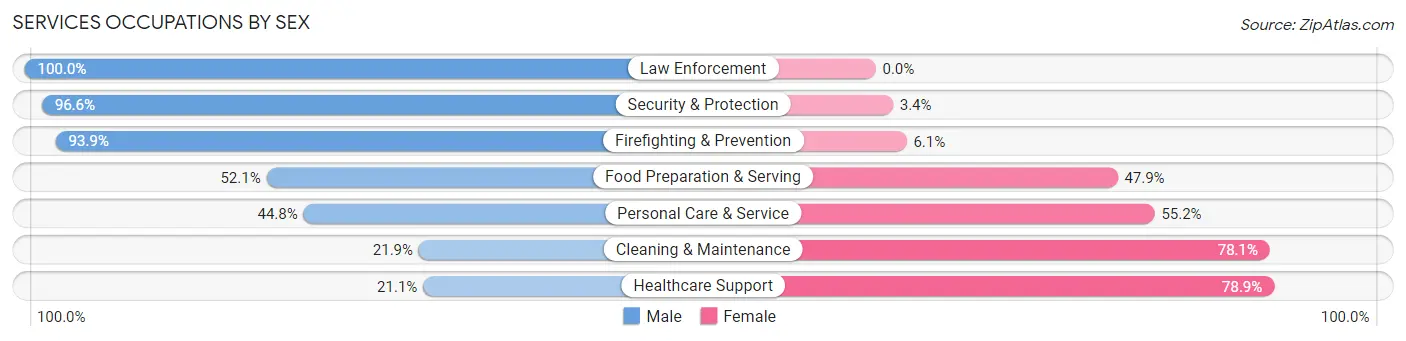
Services Occupations by Sex
Within the Services occupations in Ojus, the most male-oriented occupations are Law Enforcement (100.0%), Security & Protection (96.6%), and Firefighting & Prevention (93.9%), while the most female-oriented occupations are Healthcare Support (78.9%), Cleaning & Maintenance (78.1%), and Personal Care & Service (55.2%).
| Occupation | Male | Female |
| Healthcare Support | 47 (21.1%) | 176 (78.9%) |
| Security & Protection | 170 (96.6%) | 6 (3.4%) |
| Firefighting & Prevention | 92 (93.9%) | 6 (6.1%) |
| Law Enforcement | 78 (100.0%) | 0 (0.0%) |
| Food Preparation & Serving | 161 (52.1%) | 148 (47.9%) |
| Cleaning & Maintenance | 84 (21.9%) | 299 (78.1%) |
| Personal Care & Service | 201 (44.8%) | 248 (55.2%) |
| Total (Category) | 663 (43.0%) | 877 (57.0%) |
| Total (Overall) | 4,556 (52.1%) | 4,181 (47.8%) |
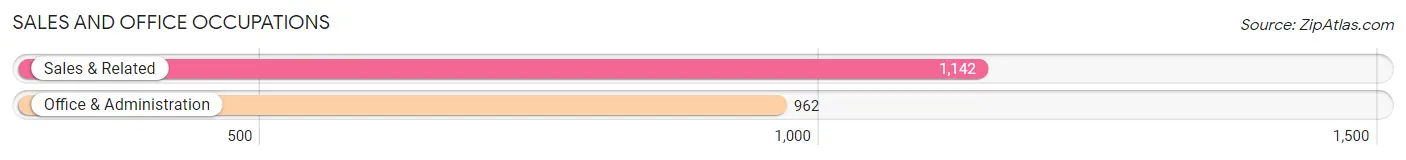
Sales and Office Occupations
The most common Sales and Office occupations in Ojus are Sales & Related (1,142 | 13.1%), and Office & Administration (962 | 11.0%).
Sales and Office Occupations by Sex
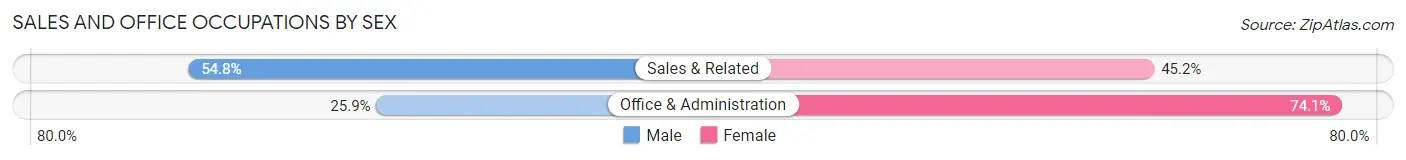
| Occupation | Male | Female |
| Sales & Related | 626 (54.8%) | 516 (45.2%) |
| Office & Administration | 249 (25.9%) | 713 (74.1%) |
| Total (Category) | 875 (41.6%) | 1,229 (58.4%) |
| Total (Overall) | 4,556 (52.1%) | 4,181 (47.8%) |
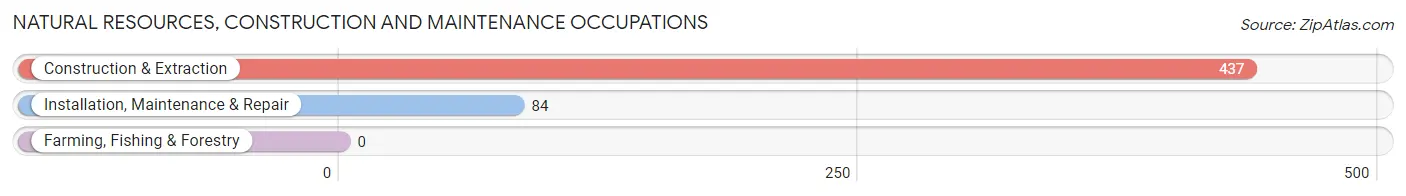
Natural Resources, Construction and Maintenance Occupations
The most common Natural Resources, Construction and Maintenance occupations in Ojus are Construction & Extraction (437 | 5.0%), and Installation, Maintenance & Repair (84 | 1.0%).
Natural Resources, Construction and Maintenance Occupations by Sex
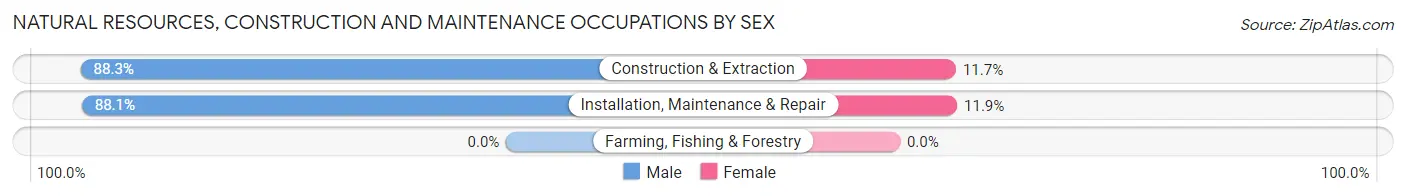
| Occupation | Male | Female |
| Farming, Fishing & Forestry | 0 (0.0%) | 0 (0.0%) |
| Construction & Extraction | 386 (88.3%) | 51 (11.7%) |
| Installation, Maintenance & Repair | 74 (88.1%) | 10 (11.9%) |
| Total (Category) | 460 (88.3%) | 61 (11.7%) |
| Total (Overall) | 4,556 (52.1%) | 4,181 (47.8%) |
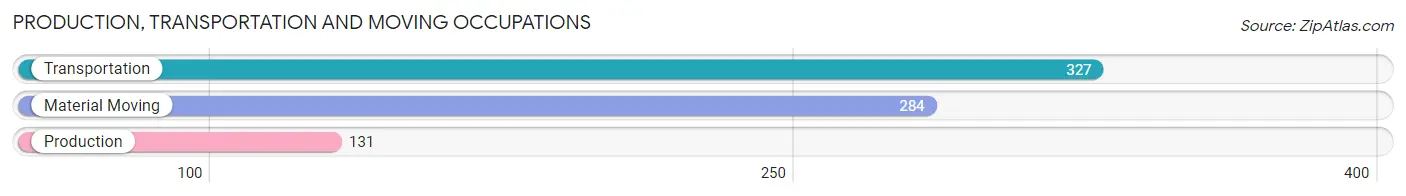
Production, Transportation and Moving Occupations
The most common Production, Transportation and Moving occupations in Ojus are Transportation (327 | 3.7%), Material Moving (284 | 3.3%), and Production (131 | 1.5%).
Production, Transportation and Moving Occupations by Sex
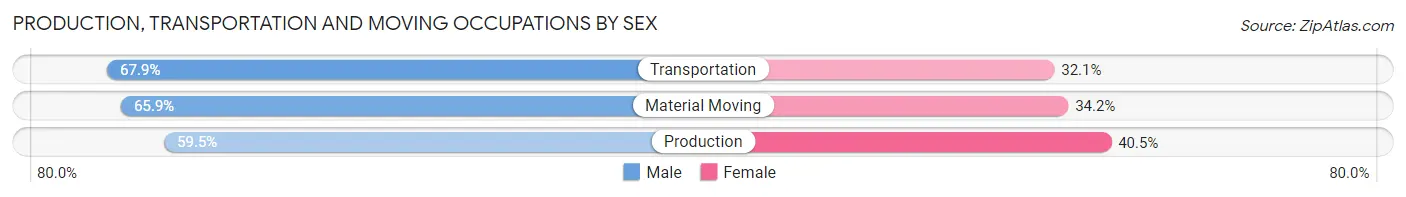
| Occupation | Male | Female |
| Production | 78 (59.5%) | 53 (40.5%) |
| Transportation | 222 (67.9%) | 105 (32.1%) |
| Material Moving | 187 (65.8%) | 97 (34.2%) |
| Total (Category) | 487 (65.6%) | 255 (34.4%) |
| Total (Overall) | 4,556 (52.1%) | 4,181 (47.8%) |
Employment Industries by Sex in Ojus
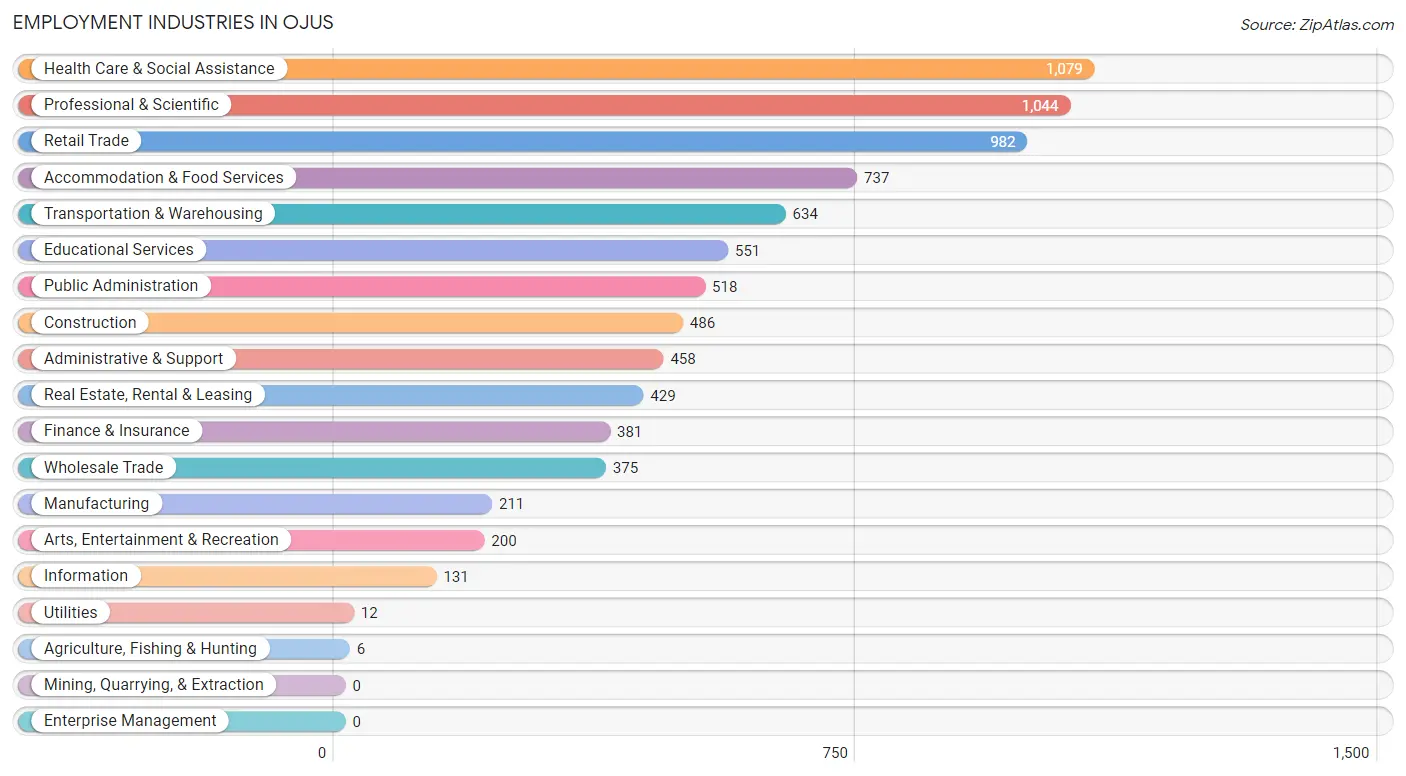
Employment Industries in Ojus
The major employment industries in Ojus include Health Care & Social Assistance (1,079 | 12.3%), Professional & Scientific (1,044 | 11.9%), Retail Trade (982 | 11.2%), Accommodation & Food Services (737 | 8.4%), and Transportation & Warehousing (634 | 7.3%).
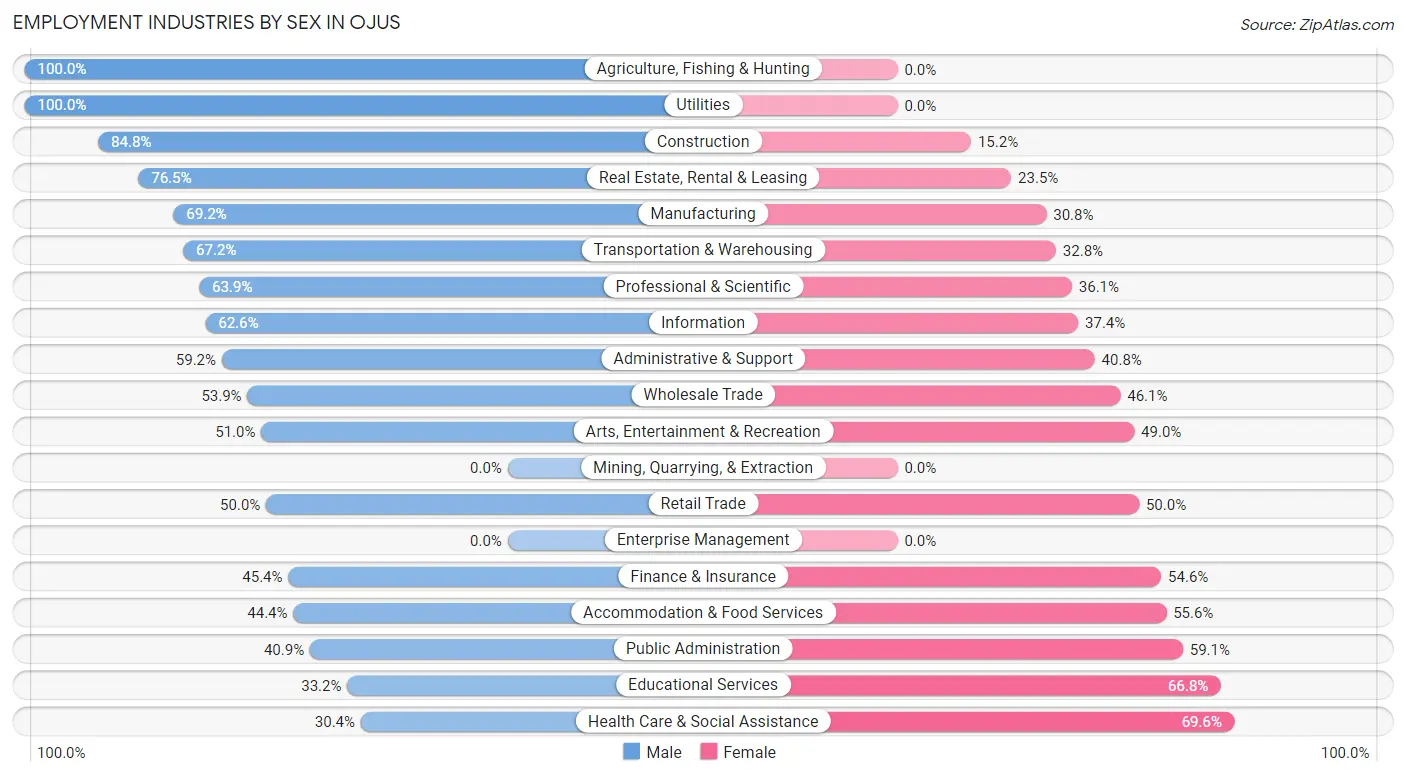
Employment Industries by Sex in Ojus
The Ojus industries that see more men than women are Agriculture, Fishing & Hunting (100.0%), Utilities (100.0%), and Construction (84.8%), whereas the industries that tend to have a higher number of women are Health Care & Social Assistance (69.6%), Educational Services (66.8%), and Public Administration (59.1%).
| Industry | Male | Female |
| Agriculture, Fishing & Hunting | 6 (100.0%) | 0 (0.0%) |
| Mining, Quarrying, & Extraction | 0 (0.0%) | 0 (0.0%) |
| Construction | 412 (84.8%) | 74 (15.2%) |
| Manufacturing | 146 (69.2%) | 65 (30.8%) |
| Wholesale Trade | 202 (53.9%) | 173 (46.1%) |
| Retail Trade | 491 (50.0%) | 491 (50.0%) |
| Transportation & Warehousing | 426 (67.2%) | 208 (32.8%) |
| Utilities | 12 (100.0%) | 0 (0.0%) |
| Information | 82 (62.6%) | 49 (37.4%) |
| Finance & Insurance | 173 (45.4%) | 208 (54.6%) |
| Real Estate, Rental & Leasing | 328 (76.5%) | 101 (23.5%) |
| Professional & Scientific | 667 (63.9%) | 377 (36.1%) |
| Enterprise Management | 0 (0.0%) | 0 (0.0%) |
| Administrative & Support | 271 (59.2%) | 187 (40.8%) |
| Educational Services | 183 (33.2%) | 368 (66.8%) |
| Health Care & Social Assistance | 328 (30.4%) | 751 (69.6%) |
| Arts, Entertainment & Recreation | 102 (51.0%) | 98 (49.0%) |
| Accommodation & Food Services | 327 (44.4%) | 410 (55.6%) |
| Public Administration | 212 (40.9%) | 306 (59.1%) |
| Total | 4,556 (52.1%) | 4,181 (47.8%) |
Education in Ojus
School Enrollment in Ojus
The most common levels of schooling among the 3,459 students in Ojus are high school (955 | 27.6%), college / undergraduate (703 | 20.3%), and elementary school (604 | 17.5%).
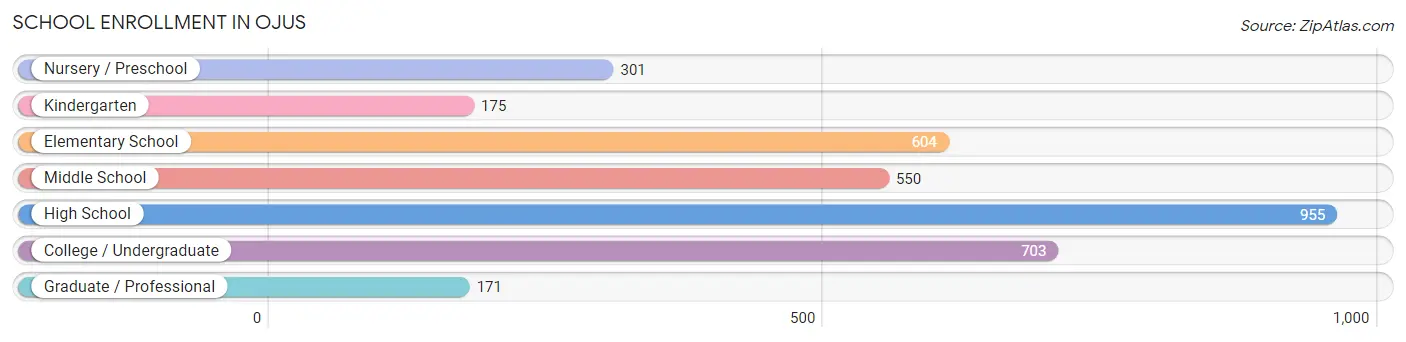
| School Level | # Students | % Students |
| Nursery / Preschool | 301 | 8.7% |
| Kindergarten | 175 | 5.1% |
| Elementary School | 604 | 17.5% |
| Middle School | 550 | 15.9% |
| High School | 955 | 27.6% |
| College / Undergraduate | 703 | 20.3% |
| Graduate / Professional | 171 | 4.9% |
| Total | 3,459 | 100.0% |
School Enrollment by Age by Funding Source in Ojus
Out of a total of 3,459 students who are enrolled in schools in Ojus, 1,235 (35.7%) attend a private institution, while the remaining 2,224 (64.3%) are enrolled in public schools. The age group of 3 to 4 year olds has the highest likelihood of being enrolled in private schools, with 215 (90.0% in the age bracket) enrolled. Conversely, the age group of 18 to 19 year olds has the lowest likelihood of being enrolled in a private school, with 335 (89.3% in the age bracket) attending a public institution.
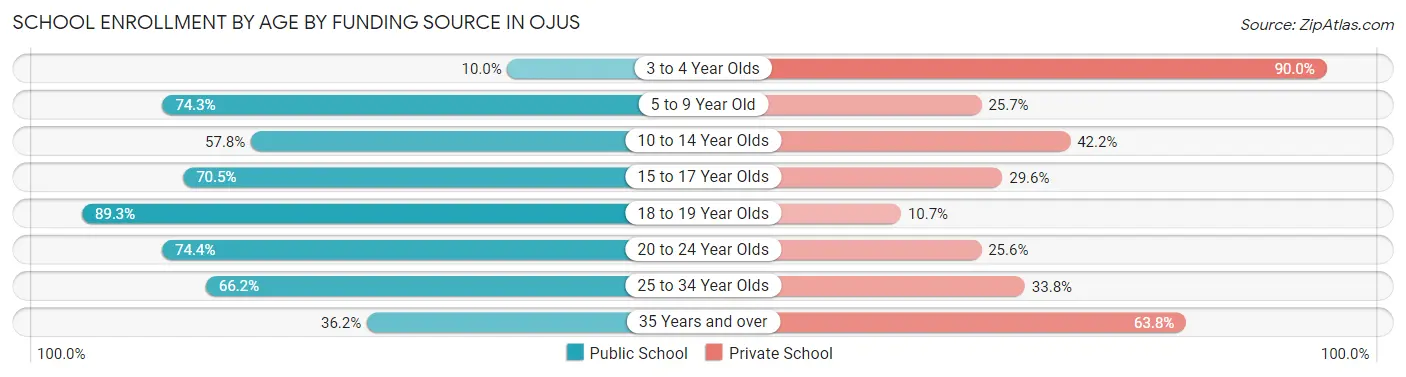
| Age Bracket | Public School | Private School |
| 3 to 4 Year Olds | 24 (10.0%) | 215 (90.0%) |
| 5 to 9 Year Old | 591 (74.3%) | 204 (25.7%) |
| 10 to 14 Year Olds | 396 (57.8%) | 289 (42.2%) |
| 15 to 17 Year Olds | 453 (70.5%) | 190 (29.5%) |
| 18 to 19 Year Olds | 335 (89.3%) | 40 (10.7%) |
| 20 to 24 Year Olds | 180 (74.4%) | 62 (25.6%) |
| 25 to 34 Year Olds | 157 (66.2%) | 80 (33.8%) |
| 35 Years and over | 88 (36.2%) | 155 (63.8%) |
| Total | 2,224 (64.3%) | 1,235 (35.7%) |
Educational Attainment by Field of Study in Ojus
Business (1,712 | 32.1%), science & technology (501 | 9.4%), engineering (429 | 8.0%), education (394 | 7.4%), and social sciences (378 | 7.1%) are the most common fields of study among 5,335 individuals in Ojus who have obtained a bachelor's degree or higher.
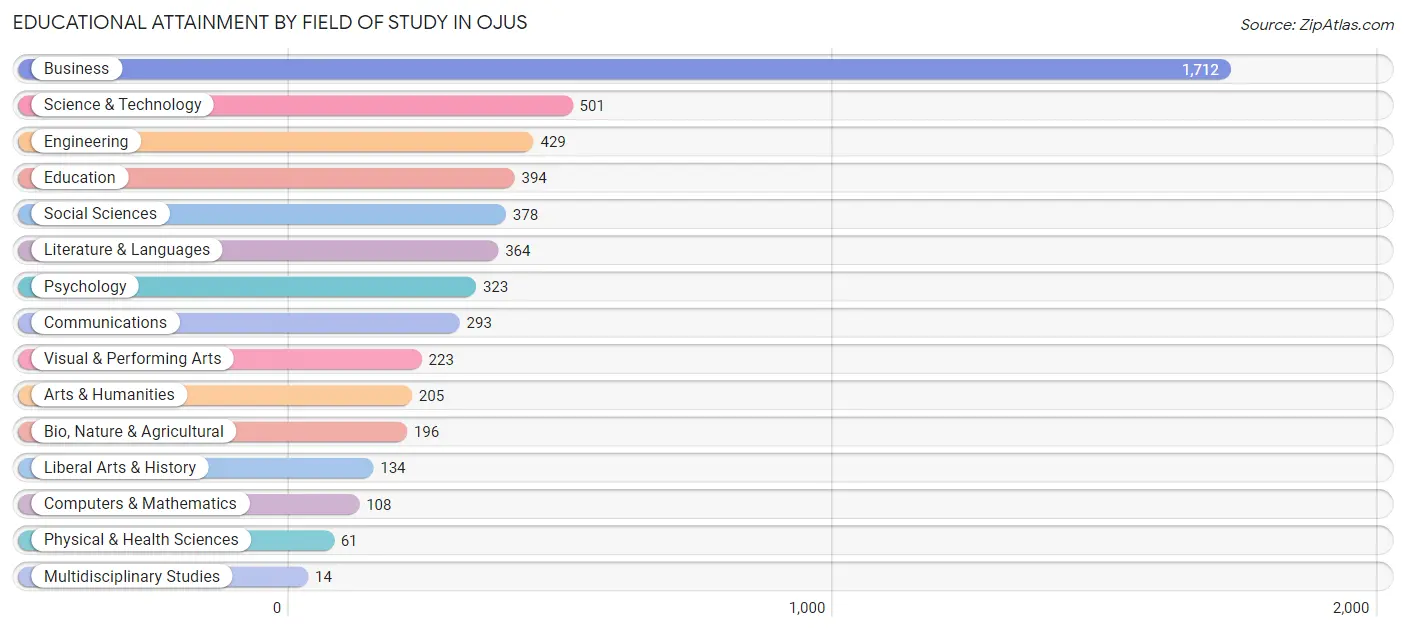
| Field of Study | # Graduates | % Graduates |
| Computers & Mathematics | 108 | 2.0% |
| Bio, Nature & Agricultural | 196 | 3.7% |
| Physical & Health Sciences | 61 | 1.1% |
| Psychology | 323 | 6.0% |
| Social Sciences | 378 | 7.1% |
| Engineering | 429 | 8.0% |
| Multidisciplinary Studies | 14 | 0.3% |
| Science & Technology | 501 | 9.4% |
| Business | 1,712 | 32.1% |
| Education | 394 | 7.4% |
| Literature & Languages | 364 | 6.8% |
| Liberal Arts & History | 134 | 2.5% |
| Visual & Performing Arts | 223 | 4.2% |
| Communications | 293 | 5.5% |
| Arts & Humanities | 205 | 3.8% |
| Total | 5,335 | 100.0% |
Transportation & Commute in Ojus
Vehicle Availability by Sex in Ojus
The most prevalent vehicle ownership categories in Ojus are males with 2 vehicles (2,163, accounting for 48.7%) and females with 2 vehicles (1,763, making up 52.5%).
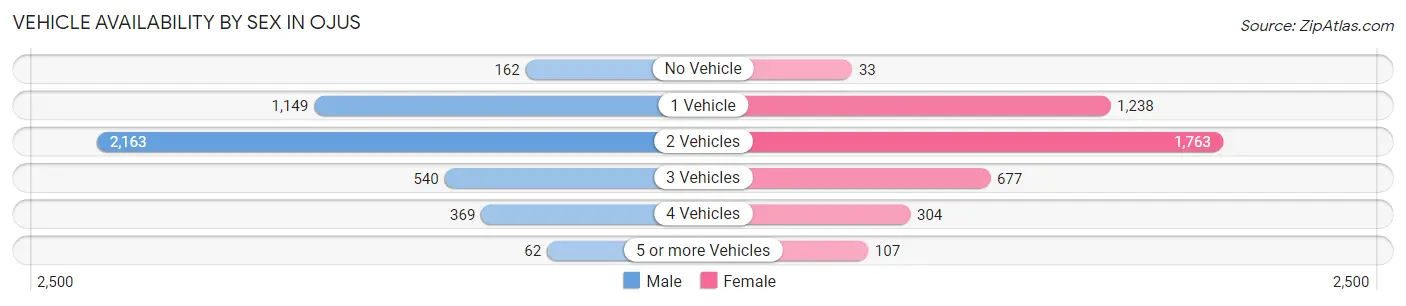
| Vehicles Available | Male | Female |
| No Vehicle | 162 (3.6%) | 33 (0.8%) |
| 1 Vehicle | 1,149 (25.9%) | 1,238 (30.0%) |
| 2 Vehicles | 2,163 (48.7%) | 1,763 (42.8%) |
| 3 Vehicles | 540 (12.1%) | 677 (16.4%) |
| 4 Vehicles | 369 (8.3%) | 304 (7.4%) |
| 5 or more Vehicles | 62 (1.4%) | 107 (2.6%) |
| Total | 4,445 (100.0%) | 4,122 (100.0%) |
Commute Time in Ojus
The most frequently occuring commute durations in Ojus are 30 to 34 minutes (1,667 commuters, 21.0%), 15 to 19 minutes (1,166 commuters, 14.7%), and 45 to 59 minutes (1,056 commuters, 13.3%).
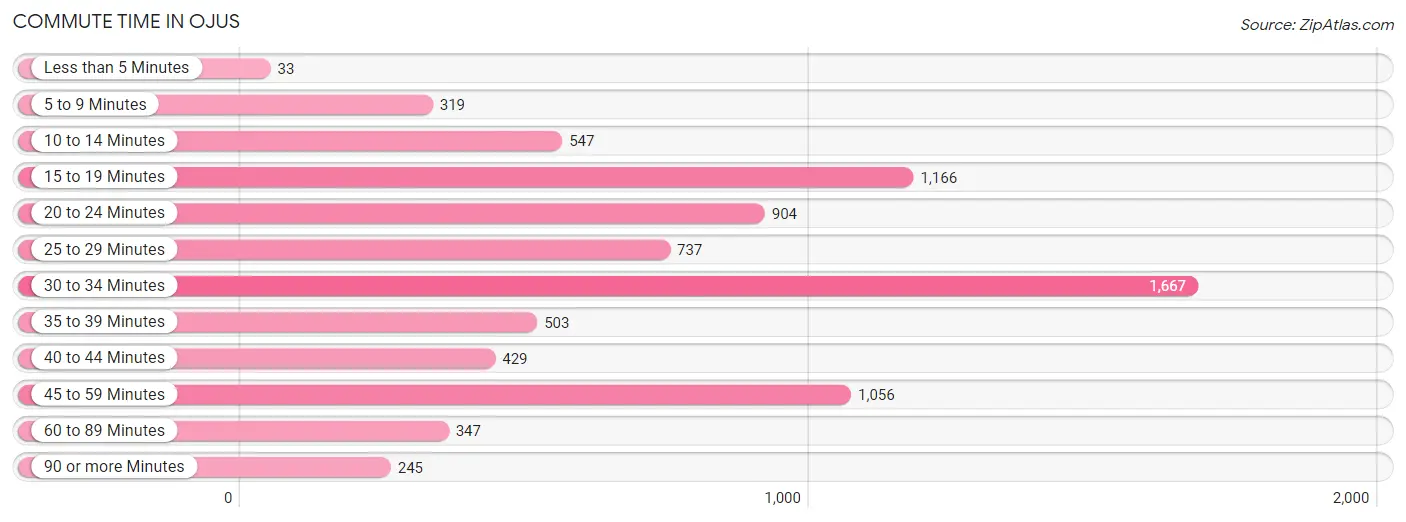
| Commute Time | # Commuters | % Commuters |
| Less than 5 Minutes | 33 | 0.4% |
| 5 to 9 Minutes | 319 | 4.0% |
| 10 to 14 Minutes | 547 | 6.9% |
| 15 to 19 Minutes | 1,166 | 14.7% |
| 20 to 24 Minutes | 904 | 11.4% |
| 25 to 29 Minutes | 737 | 9.3% |
| 30 to 34 Minutes | 1,667 | 21.0% |
| 35 to 39 Minutes | 503 | 6.3% |
| 40 to 44 Minutes | 429 | 5.4% |
| 45 to 59 Minutes | 1,056 | 13.3% |
| 60 to 89 Minutes | 347 | 4.4% |
| 90 or more Minutes | 245 | 3.1% |
Commute Time by Sex in Ojus
The most common commute times in Ojus are 30 to 34 minutes (948 commuters, 23.3%) for males and 30 to 34 minutes (719 commuters, 18.5%) for females.
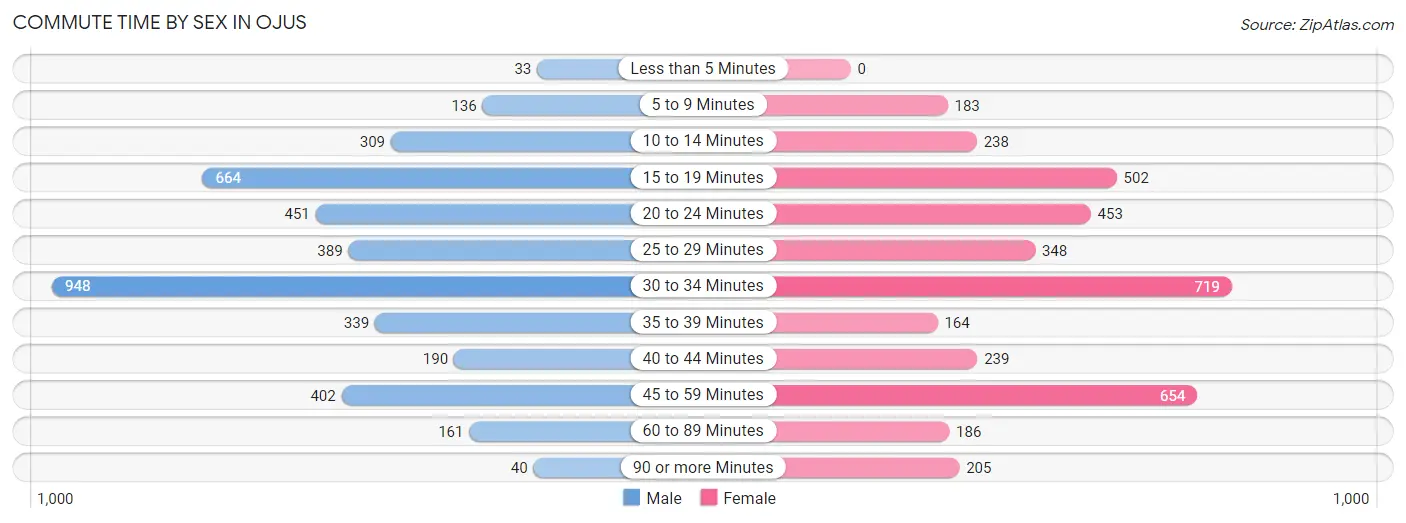
| Commute Time | Male | Female |
| Less than 5 Minutes | 33 (0.8%) | 0 (0.0%) |
| 5 to 9 Minutes | 136 (3.4%) | 183 (4.7%) |
| 10 to 14 Minutes | 309 (7.6%) | 238 (6.1%) |
| 15 to 19 Minutes | 664 (16.4%) | 502 (12.9%) |
| 20 to 24 Minutes | 451 (11.1%) | 453 (11.6%) |
| 25 to 29 Minutes | 389 (9.6%) | 348 (8.9%) |
| 30 to 34 Minutes | 948 (23.3%) | 719 (18.5%) |
| 35 to 39 Minutes | 339 (8.4%) | 164 (4.2%) |
| 40 to 44 Minutes | 190 (4.7%) | 239 (6.1%) |
| 45 to 59 Minutes | 402 (9.9%) | 654 (16.8%) |
| 60 to 89 Minutes | 161 (4.0%) | 186 (4.8%) |
| 90 or more Minutes | 40 (1.0%) | 205 (5.3%) |
Time of Departure to Work by Sex in Ojus
The most frequent times of departure to work in Ojus are 8:00 AM to 8:29 AM (671, 16.5%) for males and 7:00 AM to 7:29 AM (766, 19.7%) for females.
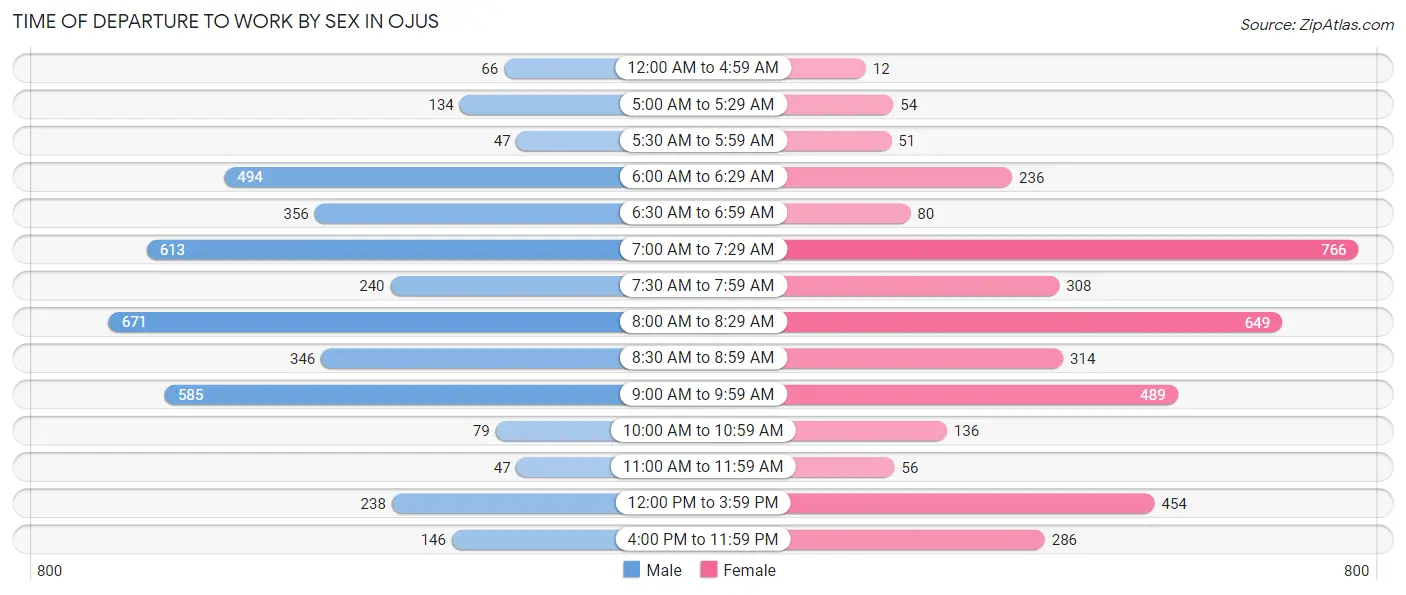
| Time of Departure | Male | Female |
| 12:00 AM to 4:59 AM | 66 (1.6%) | 12 (0.3%) |
| 5:00 AM to 5:29 AM | 134 (3.3%) | 54 (1.4%) |
| 5:30 AM to 5:59 AM | 47 (1.2%) | 51 (1.3%) |
| 6:00 AM to 6:29 AM | 494 (12.2%) | 236 (6.1%) |
| 6:30 AM to 6:59 AM | 356 (8.8%) | 80 (2.1%) |
| 7:00 AM to 7:29 AM | 613 (15.1%) | 766 (19.7%) |
| 7:30 AM to 7:59 AM | 240 (5.9%) | 308 (7.9%) |
| 8:00 AM to 8:29 AM | 671 (16.5%) | 649 (16.7%) |
| 8:30 AM to 8:59 AM | 346 (8.5%) | 314 (8.1%) |
| 9:00 AM to 9:59 AM | 585 (14.4%) | 489 (12.6%) |
| 10:00 AM to 10:59 AM | 79 (1.9%) | 136 (3.5%) |
| 11:00 AM to 11:59 AM | 47 (1.2%) | 56 (1.4%) |
| 12:00 PM to 3:59 PM | 238 (5.9%) | 454 (11.7%) |
| 4:00 PM to 11:59 PM | 146 (3.6%) | 286 (7.3%) |
| Total | 4,062 (100.0%) | 3,891 (100.0%) |
Housing Occupancy in Ojus
Occupancy by Ownership in Ojus
Of the total 6,846 dwellings in Ojus, owner-occupied units account for 4,694 (68.6%), while renter-occupied units make up 2,152 (31.4%).
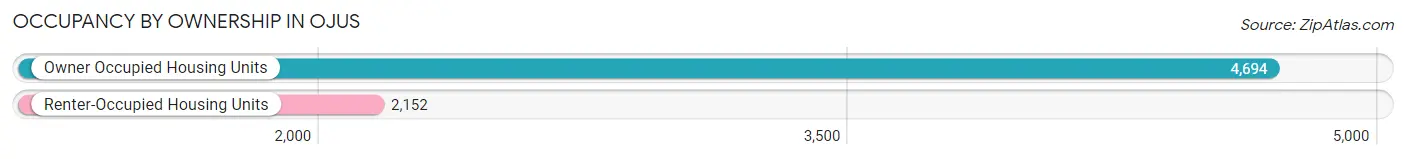
| Occupancy | # Housing Units | % Housing Units |
| Owner Occupied Housing Units | 4,694 | 68.6% |
| Renter-Occupied Housing Units | 2,152 | 31.4% |
| Total Occupied Housing Units | 6,846 | 100.0% |
Occupancy by Household Size in Ojus
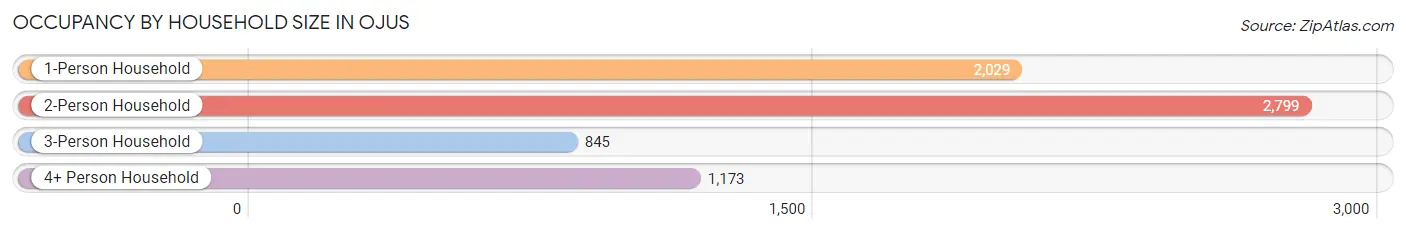
| Household Size | # Housing Units | % Housing Units |
| 1-Person Household | 2,029 | 29.6% |
| 2-Person Household | 2,799 | 40.9% |
| 3-Person Household | 845 | 12.3% |
| 4+ Person Household | 1,173 | 17.1% |
| Total Housing Units | 6,846 | 100.0% |
Occupancy by Ownership by Household Size in Ojus
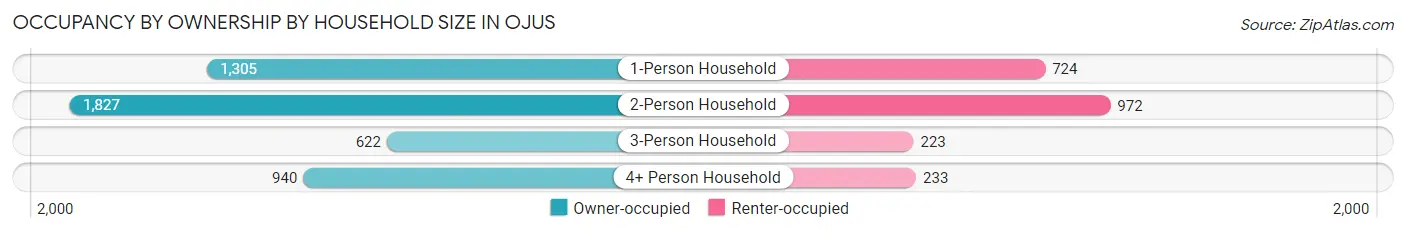
| Household Size | Owner-occupied | Renter-occupied |
| 1-Person Household | 1,305 (64.3%) | 724 (35.7%) |
| 2-Person Household | 1,827 (65.3%) | 972 (34.7%) |
| 3-Person Household | 622 (73.6%) | 223 (26.4%) |
| 4+ Person Household | 940 (80.1%) | 233 (19.9%) |
| Total Housing Units | 4,694 (68.6%) | 2,152 (31.4%) |
Occupancy by Educational Attainment in Ojus
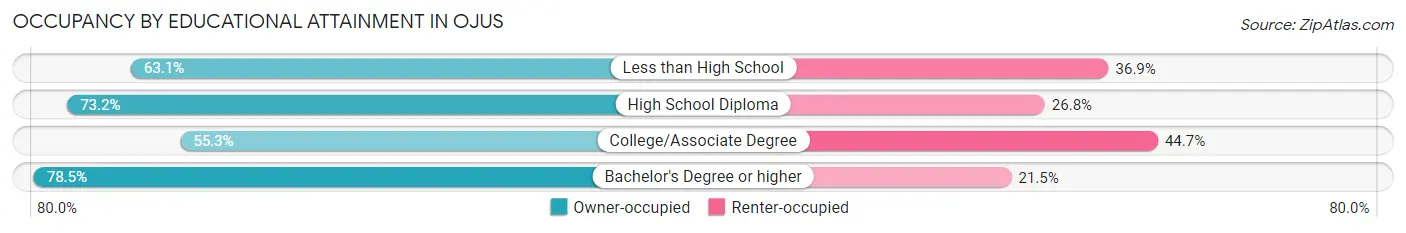
| Household Size | Owner-occupied | Renter-occupied |
| Less than High School | 529 (63.1%) | 309 (36.9%) |
| High School Diploma | 917 (73.2%) | 335 (26.8%) |
| College/Associate Degree | 1,159 (55.3%) | 937 (44.7%) |
| Bachelor's Degree or higher | 2,089 (78.5%) | 571 (21.5%) |
Occupancy by Age of Householder in Ojus
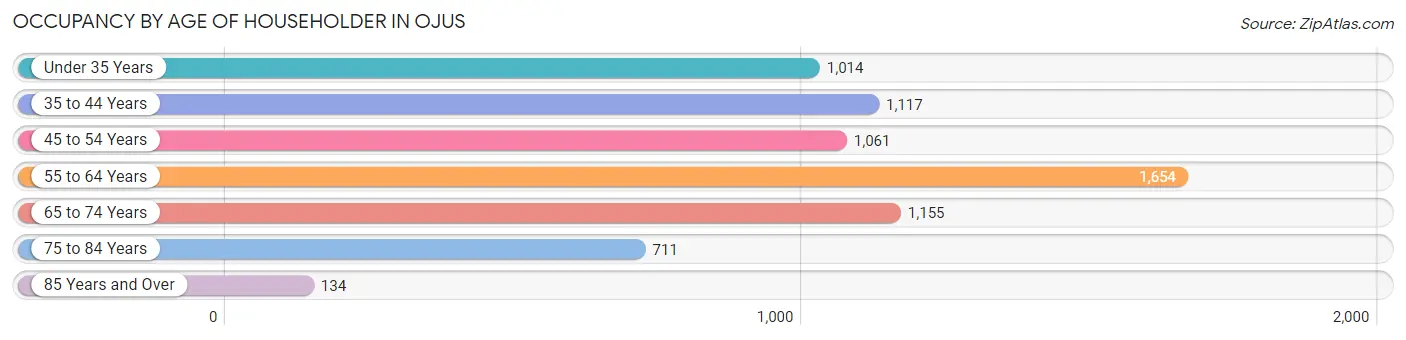
| Age Bracket | # Households | % Households |
| Under 35 Years | 1,014 | 14.8% |
| 35 to 44 Years | 1,117 | 16.3% |
| 45 to 54 Years | 1,061 | 15.5% |
| 55 to 64 Years | 1,654 | 24.2% |
| 65 to 74 Years | 1,155 | 16.9% |
| 75 to 84 Years | 711 | 10.4% |
| 85 Years and Over | 134 | 2.0% |
| Total | 6,846 | 100.0% |
Housing Finances in Ojus
Median Income by Occupancy in Ojus
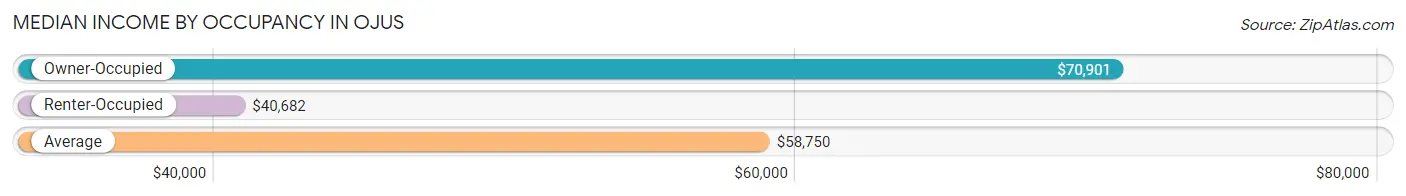
| Occupancy Type | # Households | Median Income |
| Owner-Occupied | 4,694 (68.6%) | $70,901 |
| Renter-Occupied | 2,152 (31.4%) | $40,682 |
| Average | 6,846 (100.0%) | $58,750 |
Occupancy by Householder Income Bracket in Ojus
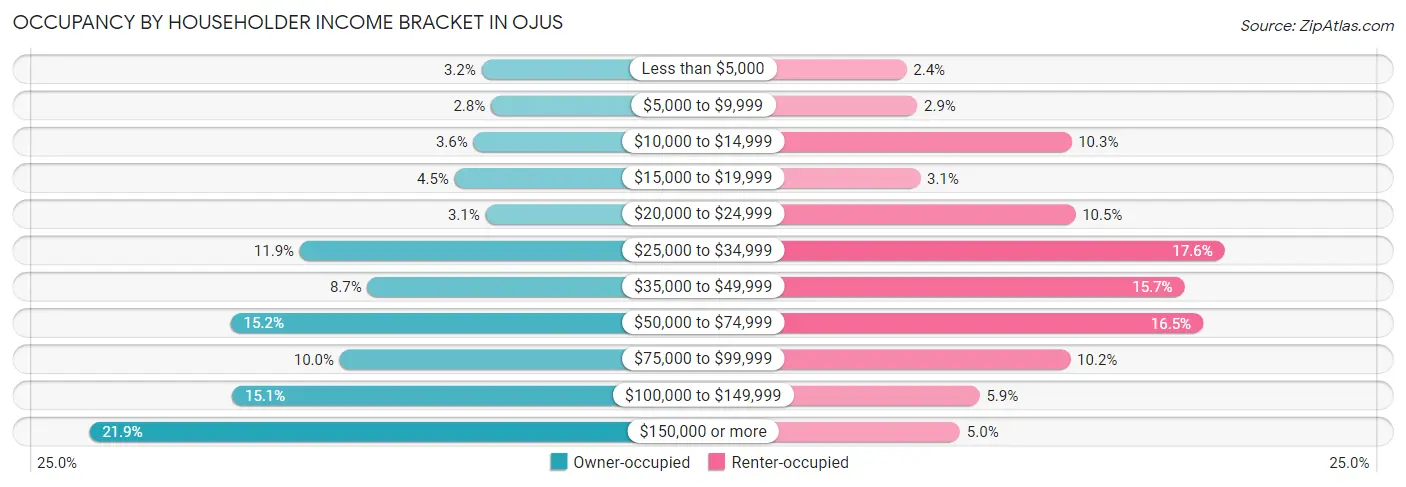
| Income Bracket | Owner-occupied | Renter-occupied |
| Less than $5,000 | 152 (3.2%) | 52 (2.4%) |
| $5,000 to $9,999 | 131 (2.8%) | 63 (2.9%) |
| $10,000 to $14,999 | 170 (3.6%) | 221 (10.3%) |
| $15,000 to $19,999 | 212 (4.5%) | 66 (3.1%) |
| $20,000 to $24,999 | 143 (3.0%) | 225 (10.5%) |
| $25,000 to $34,999 | 558 (11.9%) | 378 (17.6%) |
| $35,000 to $49,999 | 407 (8.7%) | 337 (15.7%) |
| $50,000 to $74,999 | 713 (15.2%) | 356 (16.5%) |
| $75,000 to $99,999 | 469 (10.0%) | 220 (10.2%) |
| $100,000 to $149,999 | 710 (15.1%) | 127 (5.9%) |
| $150,000 or more | 1,029 (21.9%) | 107 (5.0%) |
| Total | 4,694 (100.0%) | 2,152 (100.0%) |
Monthly Housing Cost Tiers in Ojus
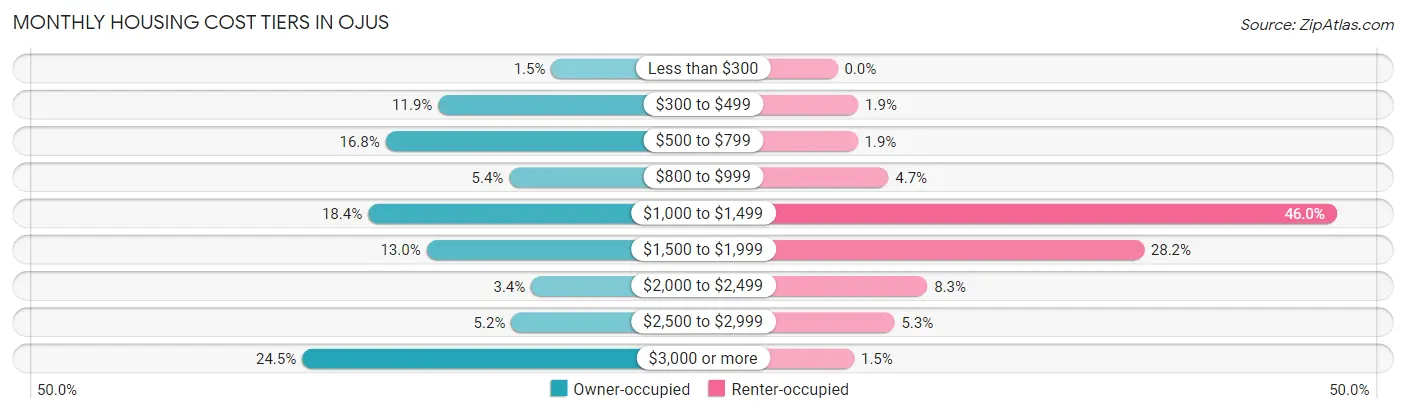
| Monthly Cost | Owner-occupied | Renter-occupied |
| Less than $300 | 71 (1.5%) | 0 (0.0%) |
| $300 to $499 | 560 (11.9%) | 41 (1.9%) |
| $500 to $799 | 787 (16.8%) | 40 (1.9%) |
| $800 to $999 | 253 (5.4%) | 101 (4.7%) |
| $1,000 to $1,499 | 863 (18.4%) | 989 (46.0%) |
| $1,500 to $1,999 | 610 (13.0%) | 607 (28.2%) |
| $2,000 to $2,499 | 158 (3.4%) | 178 (8.3%) |
| $2,500 to $2,999 | 244 (5.2%) | 113 (5.2%) |
| $3,000 or more | 1,148 (24.5%) | 33 (1.5%) |
| Total | 4,694 (100.0%) | 2,152 (100.0%) |
Physical Housing Characteristics in Ojus
Housing Structures in Ojus
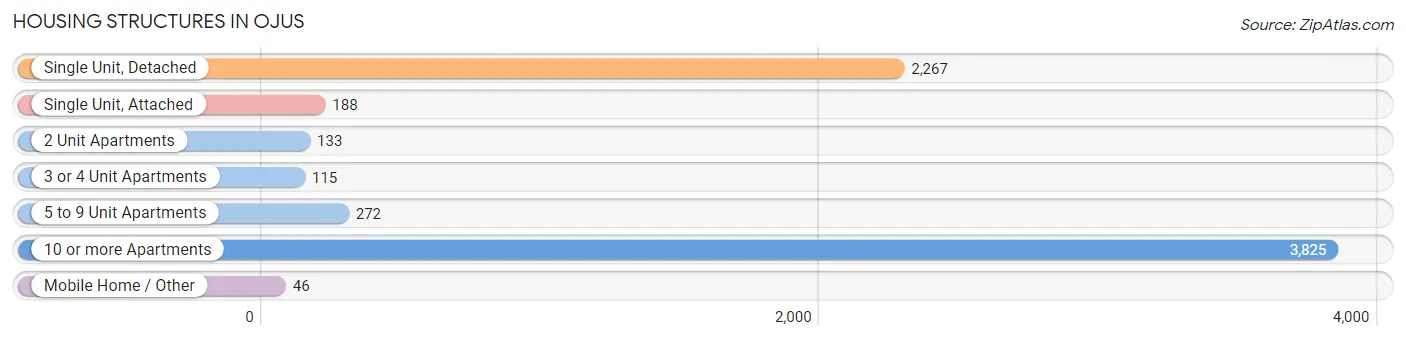
| Structure Type | # Housing Units | % Housing Units |
| Single Unit, Detached | 2,267 | 33.1% |
| Single Unit, Attached | 188 | 2.8% |
| 2 Unit Apartments | 133 | 1.9% |
| 3 or 4 Unit Apartments | 115 | 1.7% |
| 5 to 9 Unit Apartments | 272 | 4.0% |
| 10 or more Apartments | 3,825 | 55.9% |
| Mobile Home / Other | 46 | 0.7% |
| Total | 6,846 | 100.0% |
Housing Structures by Occupancy in Ojus
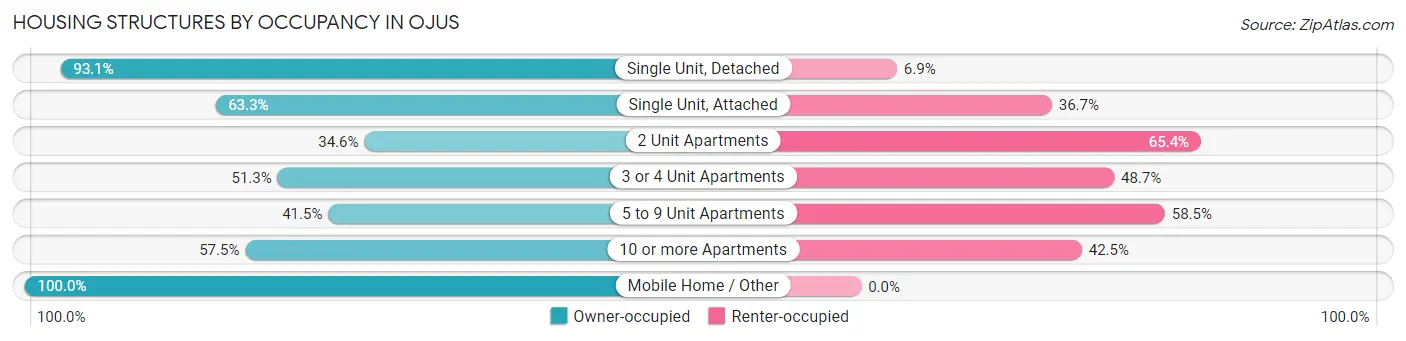
| Structure Type | Owner-occupied | Renter-occupied |
| Single Unit, Detached | 2,111 (93.1%) | 156 (6.9%) |
| Single Unit, Attached | 119 (63.3%) | 69 (36.7%) |
| 2 Unit Apartments | 46 (34.6%) | 87 (65.4%) |
| 3 or 4 Unit Apartments | 59 (51.3%) | 56 (48.7%) |
| 5 to 9 Unit Apartments | 113 (41.5%) | 159 (58.5%) |
| 10 or more Apartments | 2,200 (57.5%) | 1,625 (42.5%) |
| Mobile Home / Other | 46 (100.0%) | 0 (0.0%) |
| Total | 4,694 (68.6%) | 2,152 (31.4%) |
Housing Structures by Number of Rooms in Ojus
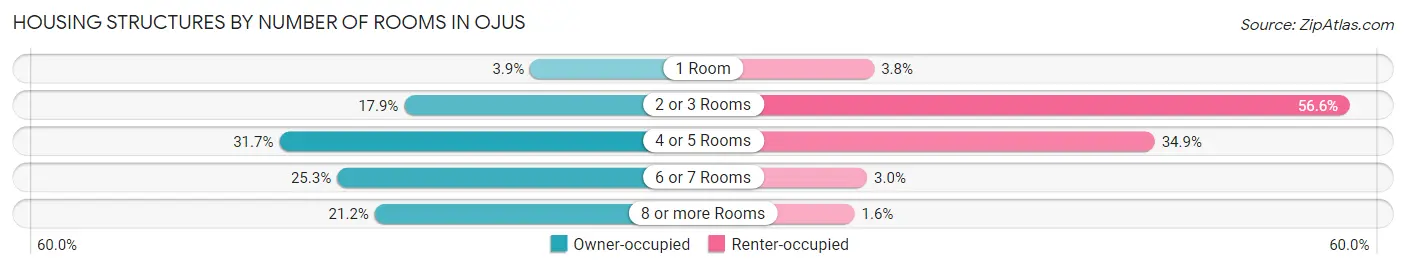
| Number of Rooms | Owner-occupied | Renter-occupied |
| 1 Room | 183 (3.9%) | 82 (3.8%) |
| 2 or 3 Rooms | 839 (17.9%) | 1,218 (56.6%) |
| 4 or 5 Rooms | 1,490 (31.7%) | 752 (34.9%) |
| 6 or 7 Rooms | 1,189 (25.3%) | 65 (3.0%) |
| 8 or more Rooms | 993 (21.1%) | 35 (1.6%) |
| Total | 4,694 (100.0%) | 2,152 (100.0%) |
Housing Structure by Heating Type in Ojus
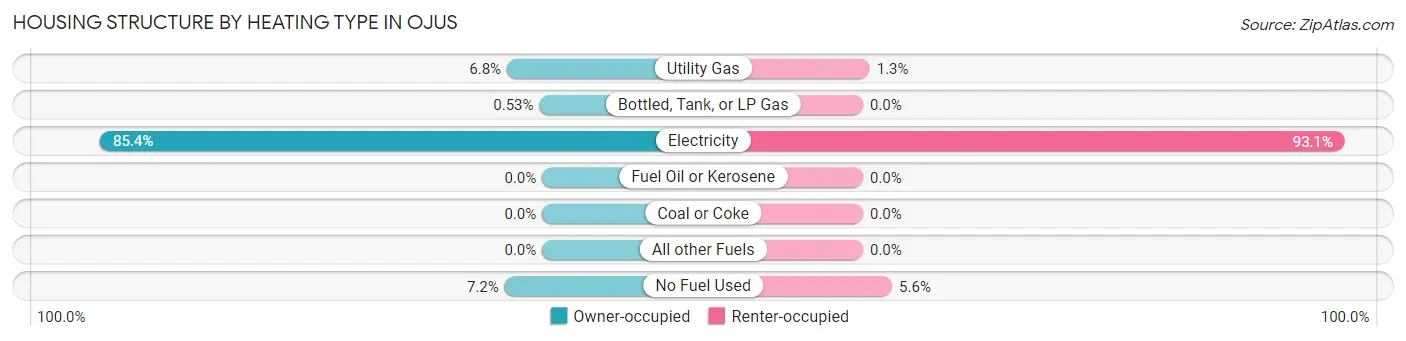
| Heating Type | Owner-occupied | Renter-occupied |
| Utility Gas | 319 (6.8%) | 28 (1.3%) |
| Bottled, Tank, or LP Gas | 25 (0.5%) | 0 (0.0%) |
| Electricity | 4,010 (85.4%) | 2,003 (93.1%) |
| Fuel Oil or Kerosene | 0 (0.0%) | 0 (0.0%) |
| Coal or Coke | 0 (0.0%) | 0 (0.0%) |
| All other Fuels | 0 (0.0%) | 0 (0.0%) |
| No Fuel Used | 340 (7.2%) | 121 (5.6%) |
| Total | 4,694 (100.0%) | 2,152 (100.0%) |
Household Vehicle Usage in Ojus
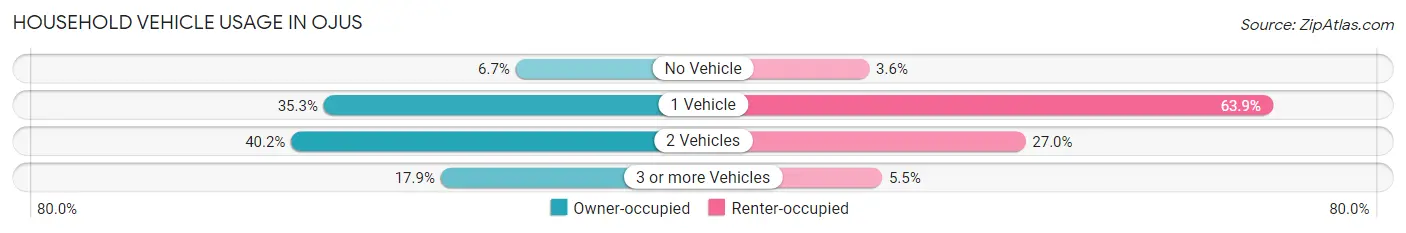
| Vehicles per Household | Owner-occupied | Renter-occupied |
| No Vehicle | 312 (6.7%) | 78 (3.6%) |
| 1 Vehicle | 1,658 (35.3%) | 1,375 (63.9%) |
| 2 Vehicles | 1,886 (40.2%) | 580 (27.0%) |
| 3 or more Vehicles | 838 (17.8%) | 119 (5.5%) |
| Total | 4,694 (100.0%) | 2,152 (100.0%) |
Real Estate & Mortgages in Ojus
Real Estate and Mortgage Overview in Ojus
| Characteristic | Without Mortgage | With Mortgage |
| Housing Units | 1,817 | 2,877 |
| Median Property Value | $176,400 | $435,000 |
| Median Household Income | $51,723 | $742 |
| Monthly Housing Costs | $588 | $1,065 |
| Real Estate Taxes | $1,224 | $61 |
Property Value by Mortgage Status in Ojus
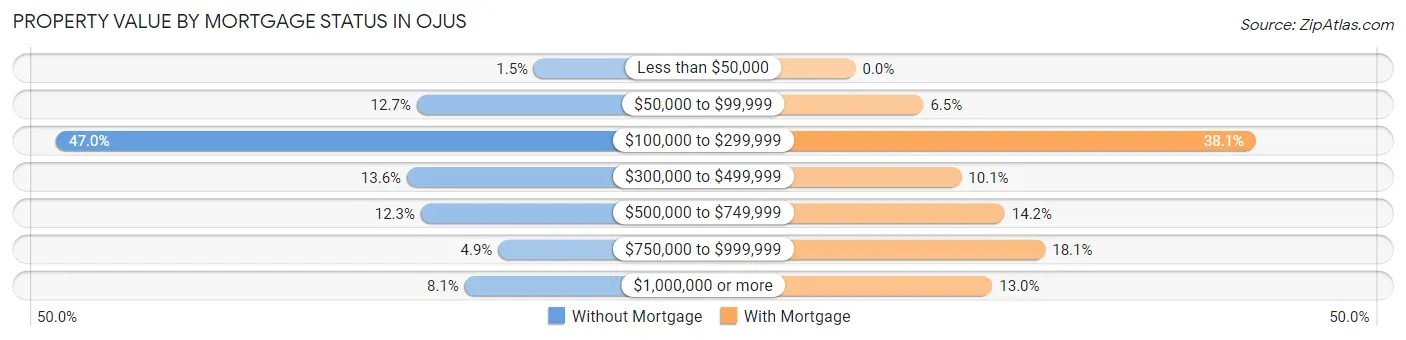
| Property Value | Without Mortgage | With Mortgage |
| Less than $50,000 | 27 (1.5%) | 0 (0.0%) |
| $50,000 to $99,999 | 230 (12.7%) | 186 (6.5%) |
| $100,000 to $299,999 | 854 (47.0%) | 1,097 (38.1%) |
| $300,000 to $499,999 | 247 (13.6%) | 290 (10.1%) |
| $500,000 to $749,999 | 223 (12.3%) | 409 (14.2%) |
| $750,000 to $999,999 | 89 (4.9%) | 520 (18.1%) |
| $1,000,000 or more | 147 (8.1%) | 375 (13.0%) |
| Total | 1,817 (100.0%) | 2,877 (100.0%) |
Household Income by Mortgage Status in Ojus
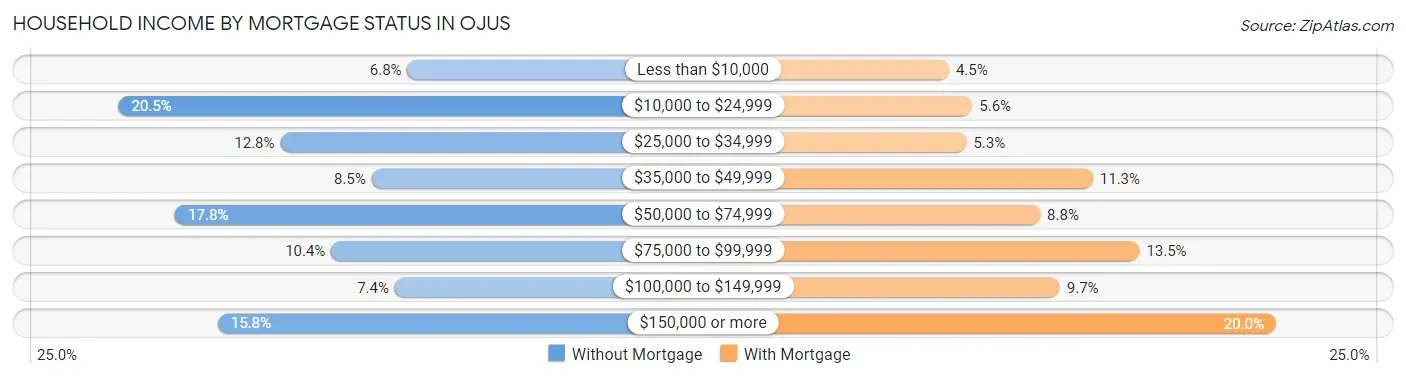
| Household Income | Without Mortgage | With Mortgage |
| Less than $10,000 | 123 (6.8%) | 128 (4.4%) |
| $10,000 to $24,999 | 373 (20.5%) | 160 (5.6%) |
| $25,000 to $34,999 | 233 (12.8%) | 152 (5.3%) |
| $35,000 to $49,999 | 154 (8.5%) | 325 (11.3%) |
| $50,000 to $74,999 | 324 (17.8%) | 253 (8.8%) |
| $75,000 to $99,999 | 189 (10.4%) | 389 (13.5%) |
| $100,000 to $149,999 | 134 (7.4%) | 280 (9.7%) |
| $150,000 or more | 287 (15.8%) | 576 (20.0%) |
| Total | 1,817 (100.0%) | 2,877 (100.0%) |
Property Value to Household Income Ratio in Ojus
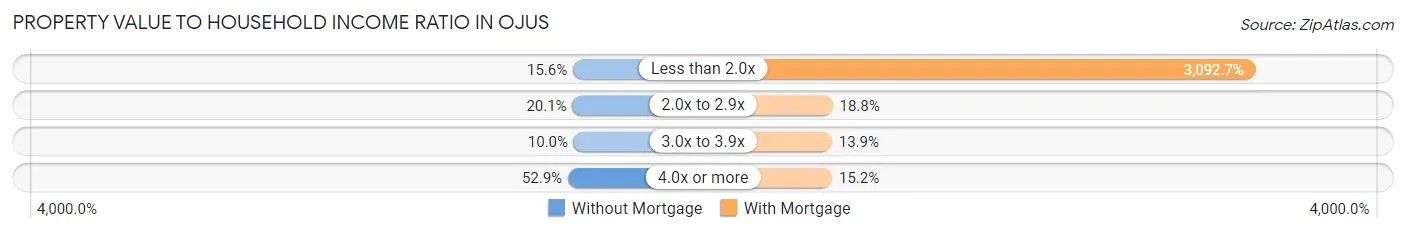
| Value-to-Income Ratio | Without Mortgage | With Mortgage |
| Less than 2.0x | 284 (15.6%) | 88,977 (3,092.7%) |
| 2.0x to 2.9x | 366 (20.1%) | 542 (18.8%) |
| 3.0x to 3.9x | 182 (10.0%) | 400 (13.9%) |
| 4.0x or more | 961 (52.9%) | 437 (15.2%) |
| Total | 1,817 (100.0%) | 2,877 (100.0%) |
Real Estate Taxes by Mortgage Status in Ojus
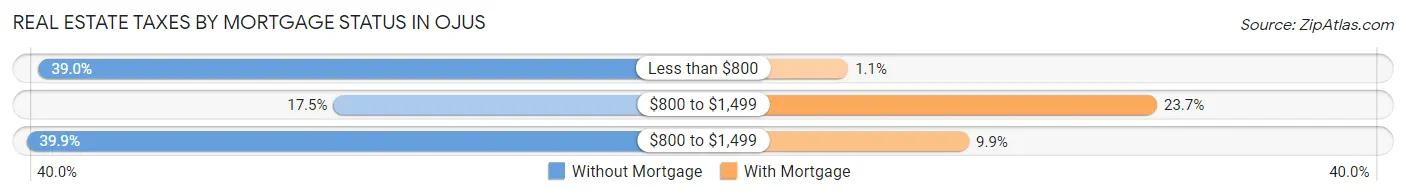
| Property Taxes | Without Mortgage | With Mortgage |
| Less than $800 | 708 (39.0%) | 32 (1.1%) |
| $800 to $1,499 | 317 (17.4%) | 681 (23.7%) |
| $800 to $1,499 | 724 (39.9%) | 286 (9.9%) |
| Total | 1,817 (100.0%) | 2,877 (100.0%) |
Health & Disability in Ojus
Health Insurance Coverage by Age in Ojus
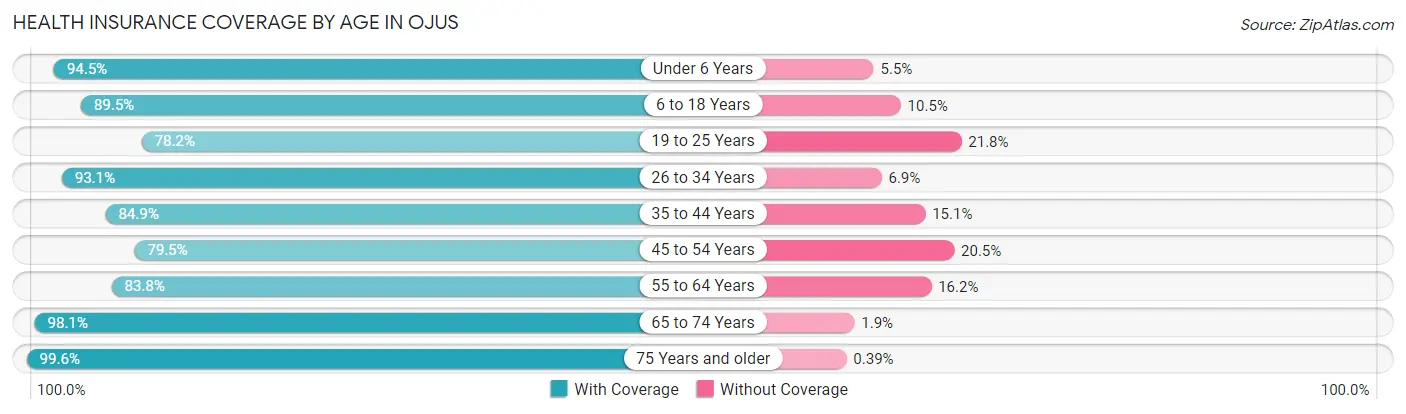
| Age Bracket | With Coverage | Without Coverage |
| Under 6 Years | 898 (94.5%) | 52 (5.5%) |
| 6 to 18 Years | 2,053 (89.5%) | 241 (10.5%) |
| 19 to 25 Years | 784 (78.2%) | 219 (21.8%) |
| 26 to 34 Years | 1,892 (93.1%) | 141 (6.9%) |
| 35 to 44 Years | 1,767 (84.9%) | 314 (15.1%) |
| 45 to 54 Years | 1,658 (79.5%) | 427 (20.5%) |
| 55 to 64 Years | 2,213 (83.8%) | 428 (16.2%) |
| 65 to 74 Years | 1,889 (98.1%) | 36 (1.9%) |
| 75 Years and older | 1,288 (99.6%) | 5 (0.4%) |
| Total | 14,442 (88.6%) | 1,863 (11.4%) |
Health Insurance Coverage by Citizenship Status in Ojus
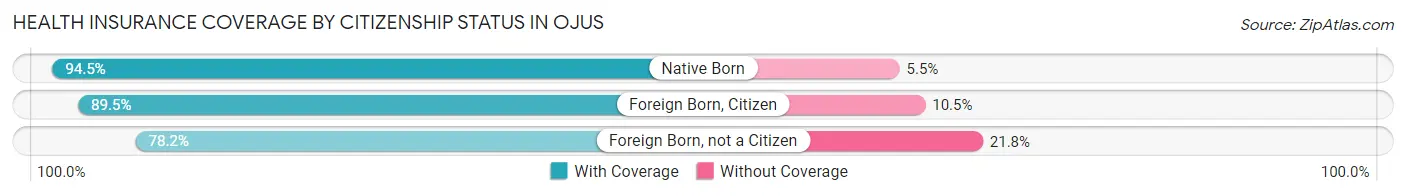
| Citizenship Status | With Coverage | Without Coverage |
| Native Born | 898 (94.5%) | 52 (5.5%) |
| Foreign Born, Citizen | 2,053 (89.5%) | 241 (10.5%) |
| Foreign Born, not a Citizen | 784 (78.2%) | 219 (21.8%) |
Health Insurance Coverage by Household Income in Ojus
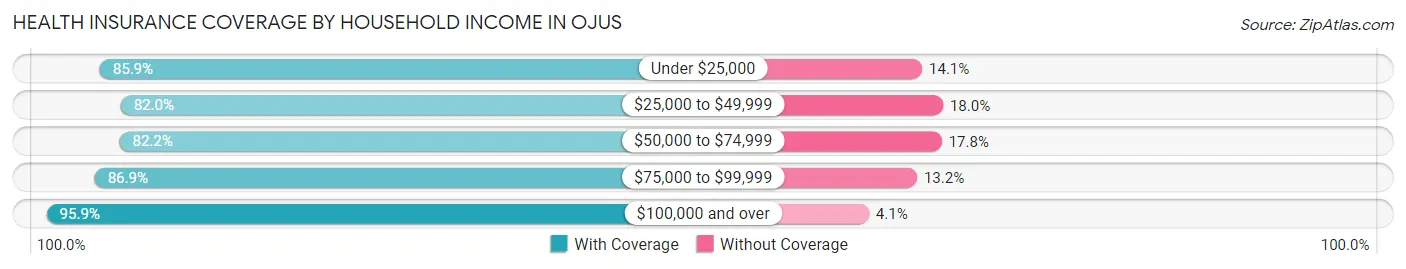
| Household Income | With Coverage | Without Coverage |
| Under $25,000 | 1,741 (85.9%) | 286 (14.1%) |
| $25,000 to $49,999 | 2,725 (82.0%) | 599 (18.0%) |
| $50,000 to $74,999 | 2,098 (82.2%) | 454 (17.8%) |
| $75,000 to $99,999 | 1,698 (86.9%) | 257 (13.2%) |
| $100,000 and over | 6,180 (95.9%) | 267 (4.1%) |
Public vs Private Health Insurance Coverage by Age in Ojus
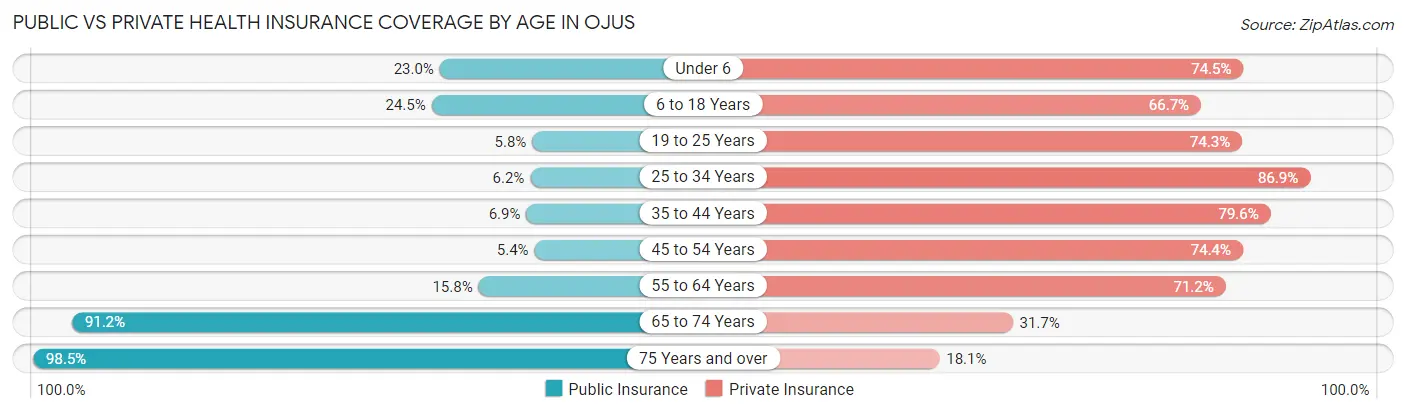
| Age Bracket | Public Insurance | Private Insurance |
| Under 6 | 218 (23.0%) | 708 (74.5%) |
| 6 to 18 Years | 561 (24.5%) | 1,529 (66.6%) |
| 19 to 25 Years | 58 (5.8%) | 745 (74.3%) |
| 25 to 34 Years | 125 (6.1%) | 1,767 (86.9%) |
| 35 to 44 Years | 143 (6.9%) | 1,656 (79.6%) |
| 45 to 54 Years | 112 (5.4%) | 1,552 (74.4%) |
| 55 to 64 Years | 416 (15.8%) | 1,881 (71.2%) |
| 65 to 74 Years | 1,756 (91.2%) | 610 (31.7%) |
| 75 Years and over | 1,273 (98.5%) | 234 (18.1%) |
| Total | 4,662 (28.6%) | 10,682 (65.5%) |
Disability Status by Sex by Age in Ojus
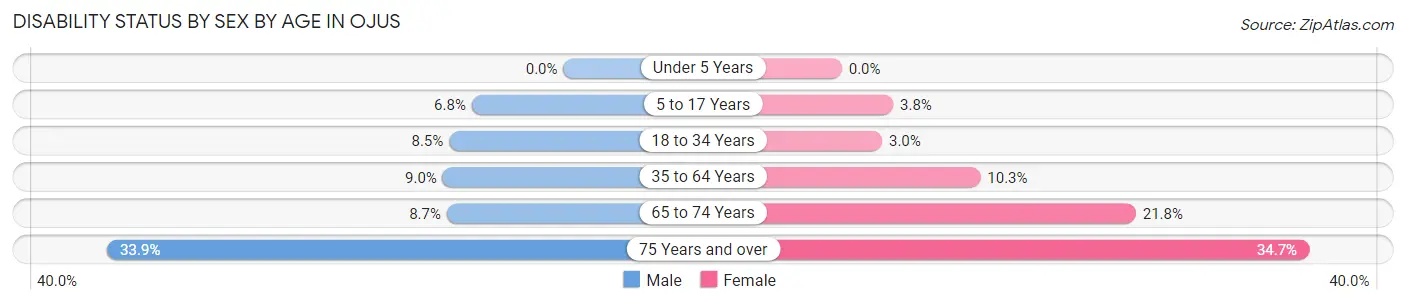
| Age Bracket | Male | Female |
| Under 5 Years | 0 (0.0%) | 0 (0.0%) |
| 5 to 17 Years | 86 (6.8%) | 37 (3.8%) |
| 18 to 34 Years | 144 (8.5%) | 47 (3.0%) |
| 35 to 64 Years | 300 (9.0%) | 356 (10.3%) |
| 65 to 74 Years | 75 (8.6%) | 231 (21.8%) |
| 75 Years and over | 187 (33.9%) | 257 (34.7%) |
Disability Class by Sex by Age in Ojus
Disability Class: Hearing Difficulty
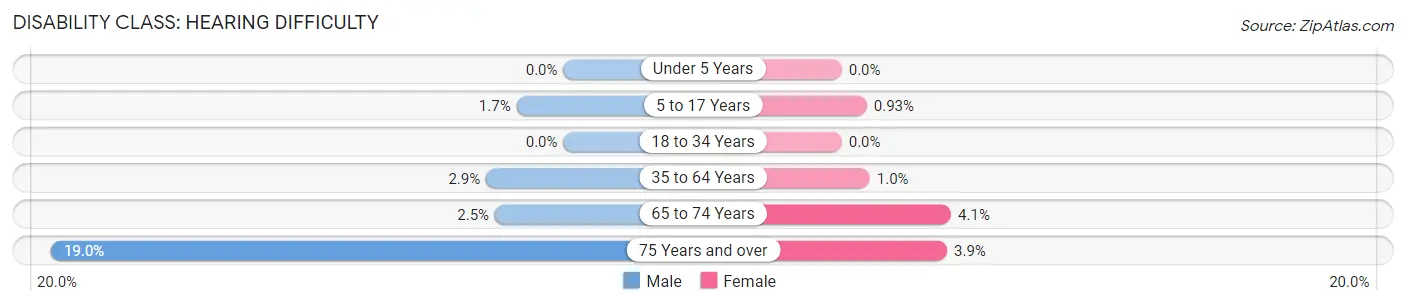
| Age Bracket | Male | Female |
| Under 5 Years | 0 (0.0%) | 0 (0.0%) |
| 5 to 17 Years | 22 (1.7%) | 9 (0.9%) |
| 18 to 34 Years | 0 (0.0%) | 0 (0.0%) |
| 35 to 64 Years | 96 (2.9%) | 36 (1.0%) |
| 65 to 74 Years | 22 (2.5%) | 43 (4.1%) |
| 75 Years and over | 105 (19.0%) | 29 (3.9%) |
Disability Class: Vision Difficulty
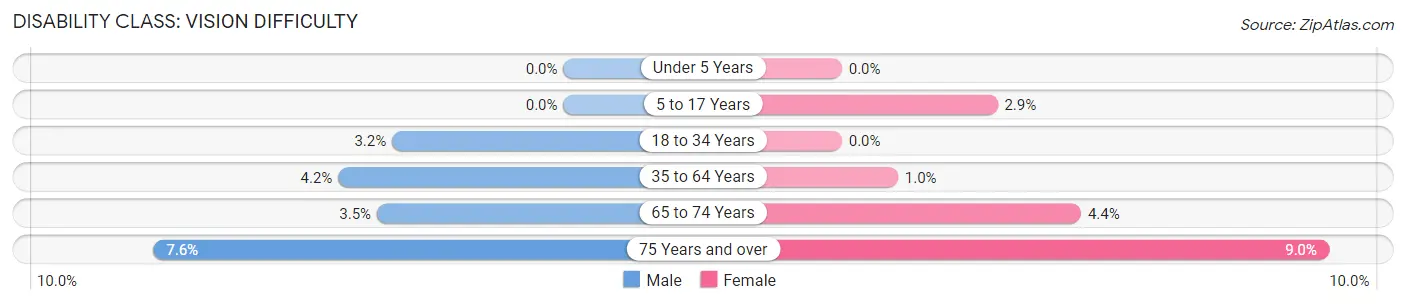
| Age Bracket | Male | Female |
| Under 5 Years | 0 (0.0%) | 0 (0.0%) |
| 5 to 17 Years | 0 (0.0%) | 28 (2.9%) |
| 18 to 34 Years | 54 (3.2%) | 0 (0.0%) |
| 35 to 64 Years | 140 (4.2%) | 36 (1.0%) |
| 65 to 74 Years | 30 (3.5%) | 47 (4.4%) |
| 75 Years and over | 42 (7.6%) | 67 (9.0%) |
Disability Class: Cognitive Difficulty
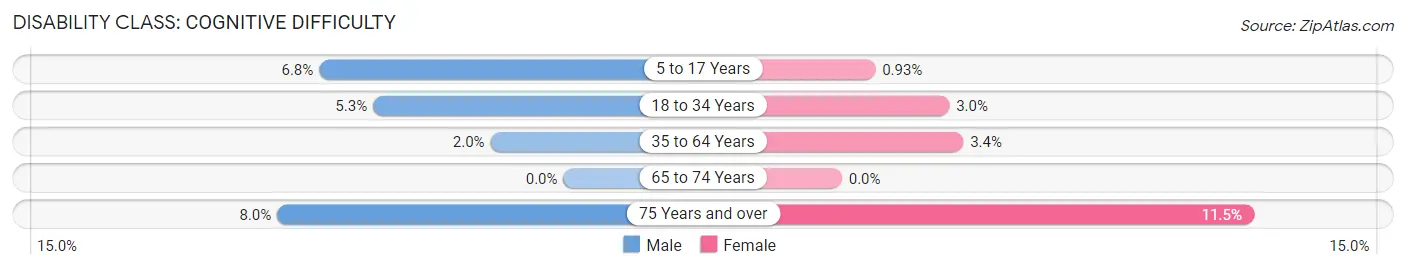
| Age Bracket | Male | Female |
| 5 to 17 Years | 86 (6.8%) | 9 (0.9%) |
| 18 to 34 Years | 90 (5.3%) | 47 (3.0%) |
| 35 to 64 Years | 68 (2.0%) | 117 (3.4%) |
| 65 to 74 Years | 0 (0.0%) | 0 (0.0%) |
| 75 Years and over | 44 (8.0%) | 85 (11.5%) |
Disability Class: Ambulatory Difficulty
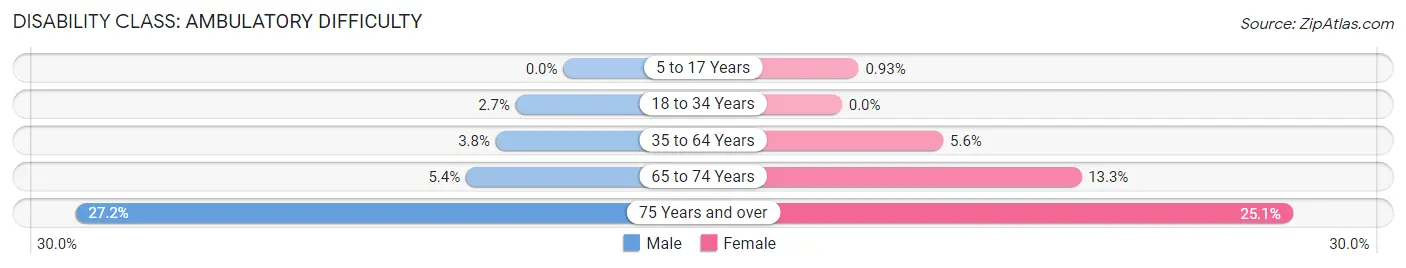
| Age Bracket | Male | Female |
| 5 to 17 Years | 0 (0.0%) | 9 (0.9%) |
| 18 to 34 Years | 45 (2.6%) | 0 (0.0%) |
| 35 to 64 Years | 126 (3.8%) | 195 (5.6%) |
| 65 to 74 Years | 47 (5.4%) | 141 (13.3%) |
| 75 Years and over | 150 (27.2%) | 186 (25.1%) |
Disability Class: Self-Care Difficulty
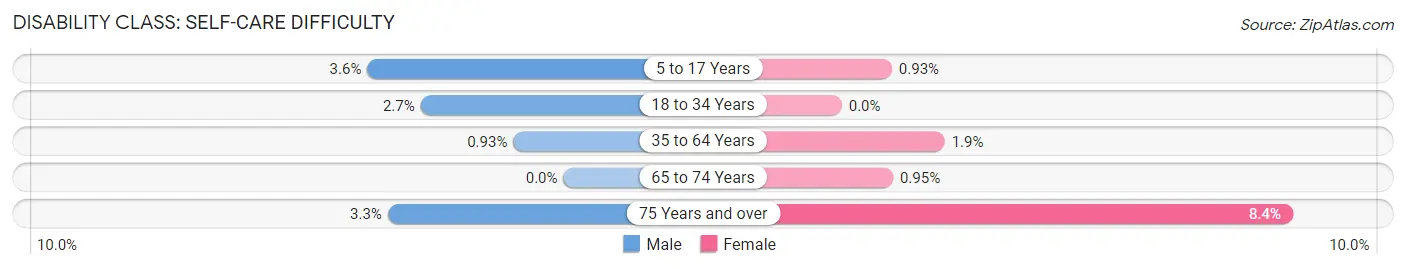
| Age Bracket | Male | Female |
| 5 to 17 Years | 46 (3.6%) | 9 (0.9%) |
| 18 to 34 Years | 45 (2.6%) | 0 (0.0%) |
| 35 to 64 Years | 31 (0.9%) | 66 (1.9%) |
| 65 to 74 Years | 0 (0.0%) | 10 (0.9%) |
| 75 Years and over | 18 (3.3%) | 62 (8.4%) |
Technology Access in Ojus
Computing Device Access in Ojus
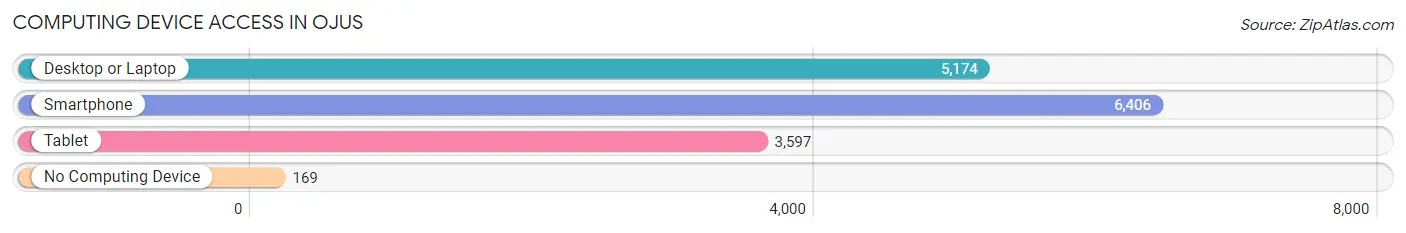
| Device Type | # Households | % Households |
| Desktop or Laptop | 5,174 | 75.6% |
| Smartphone | 6,406 | 93.6% |
| Tablet | 3,597 | 52.5% |
| No Computing Device | 169 | 2.5% |
| Total | 6,846 | 100.0% |
Internet Access in Ojus
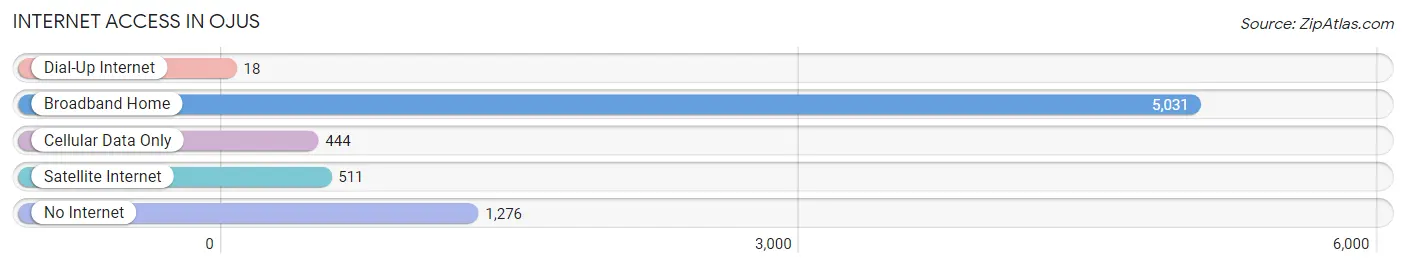
| Internet Type | # Households | % Households |
| Dial-Up Internet | 18 | 0.3% |
| Broadband Home | 5,031 | 73.5% |
| Cellular Data Only | 444 | 6.5% |
| Satellite Internet | 511 | 7.5% |
| No Internet | 1,276 | 18.6% |
| Total | 6,846 | 100.0% |
Ojus Summary
Ojus is a census-designated place (CDP) located in Miami-Dade County, Florida, United States. The population was 8,845 at the 2010 census. It is part of the Miami metropolitan area, which was home to an estimated 6,012,331 people in 2015.
History
Ojus was originally inhabited by the Tequesta Indians, who were the first Native American tribe to inhabit the area. The Tequesta Indians were a peaceful tribe that lived off the land and the ocean. They were known for their fishing and hunting skills. The Tequesta Indians were eventually displaced by the Seminole Indians, who were forced to move to the area after the Seminole Wars.
The area was first settled by non-Native Americans in the late 19th century. The first settlers were farmers who grew citrus, vegetables, and other crops. The area was known as "Ojus Farms" and was home to a few small stores and a post office.
In the early 20th century, the area began to grow as more people moved to the area. The population increased from just a few hundred people in the early 1900s to over 8,000 people by the year 2000.
Geography
Ojus is located at 25°57'25" North, 80°11'17" West (25.957, -80.188). It is located in the northern part of Miami-Dade County, just south of the Broward County line. It is bordered by North Miami Beach to the south, Aventura to the east, and Sunny Isles Beach to the north.
The area is mostly flat, with an elevation of just 6 feet (1.8 m) above sea level. The area is located on the Atlantic Coastal Ridge, which is a low-lying ridge that runs along the eastern coast of Florida.
Economy
Ojus is primarily a residential community, with most of the population employed in the service industry. The area is home to several large businesses, including a Walmart Supercenter, a Publix Supermarket, and a Home Depot.
The area is also home to several medical facilities, including Aventura Hospital and Medical Center, North Shore Medical Center, and Mount Sinai Medical Center.
Demographics
As of the 2010 census, there were 8,845 people, 3,717 households, and 2,541 families residing in the CDP. The population density was 4,845.3 people per square mile (1,872.2/km2). There were 4,072 housing units at an average density of 2,223.3 per square mile (857.2/km2). The racial makeup of the CDP was 68.2% White (non-Hispanic), 16.2% African American, 0.3% Native American, 8.2% Asian, 0.1% Pacific Islander, 4.2% from other races, and 2.9% from two or more races. Hispanic or Latino of any race were 33.2% of the population.
There were 3,717 households, out of which 24.2% had children under the age of 18 living with them, 51.2% were married couples living together, 12.2% had a female householder with no husband present, and 32.2% were non-families. 25.7% of all households were made up of individuals, and 10.2% had someone living alone who was 65 years of age or older. The average household size was 2.38 and the average family size was 2.86.
In the CDP, the population was spread out, with 19.7% under the age of 18, 7.2% from 18 to 24, 28.2% from 25 to 44, 27.2% from 45 to 64, and 17.7% who were 65 years of age or older. The median age was 41 years. For every 100 females, there were 91.2 males. For every 100 females age 18 and over, there were 88.3 males.
The median income for a household in the CDP was $45,945, and the median income for a family was $51,945. Males had a median income of $37,945 versus $30,945 for females. The per capita income for the CDP was $25,945. About 8.2% of families and 10.2% of the population were below the poverty line, including 14.2% of those under age 18 and 8.2% of those age 65 or over.
Common Questions
What is Per Capita Income in Ojus?
Per Capita income in Ojus is $42,421.
What is the Median Family Income in Ojus?
Median Family Income in Ojus is $70,658.
What is the Median Household income in Ojus?
Median Household Income in Ojus is $58,750.
What is Income or Wage Gap in Ojus?
Income or Wage Gap in Ojus is 15.3%.
Women in Ojus earn 84.7 cents for every dollar earned by a man.
What is Inequality or Gini Index in Ojus?
Inequality or Gini Index in Ojus is 0.55.
What is the Total Population of Ojus?
Total Population of Ojus is 16,450.
What is the Total Male Population of Ojus?
Total Male Population of Ojus is 8,167.
What is the Total Female Population of Ojus?
Total Female Population of Ojus is 8,283.
What is the Ratio of Males per 100 Females in Ojus?
There are 98.60 Males per 100 Females in Ojus.
What is the Ratio of Females per 100 Males in Ojus?
There are 101.42 Females per 100 Males in Ojus.
What is the Median Population Age in Ojus?
Median Population Age in Ojus is 44.4 Years.
What is the Average Family Size in Ojus
Average Family Size in Ojus is 3.0 People.
What is the Average Household Size in Ojus
Average Household Size in Ojus is 2.4 People.
How Large is the Labor Force in Ojus?
There are 9,184 People in the Labor Forcein in Ojus.
What is the Percentage of People in the Labor Force in Ojus?
65.9% of People are in the Labor Force in Ojus.
What is the Unemployment Rate in Ojus?
Unemployment Rate in Ojus is 4.9%.