Lehigh Acres, FL Map & Demographics
Lehigh Acres Map
Lehigh Acres Overview
$23,079
PER CAPITA INCOME
$63,680
AVG FAMILY INCOME
$59,733
AVG HOUSEHOLD INCOME
29.0%
WAGE / INCOME GAP [ % ]
71.0¢/ $1
WAGE / INCOME GAP [ $ ]
$11,359
FAMILY INCOME DEFICIT
0.40
INEQUALITY / GINI INDEX
124,440
TOTAL POPULATION
60,895
MALE POPULATION
63,545
FEMALE POPULATION
95.83
MALES / 100 FEMALES
104.35
FEMALES / 100 MALES
34.3
MEDIAN AGE
3.8
AVG FAMILY SIZE
3.3
AVG HOUSEHOLD SIZE
59,488
LABOR FORCE [ PEOPLE ]
63.0%
PERCENT IN LABOR FORCE
5.5%
UNEMPLOYMENT RATE
Income in Lehigh Acres
Income Overview in Lehigh Acres
Per Capita Income in Lehigh Acres is $23,079, while median incomes of families and households are $63,680 and $59,733 respectively.
| Characteristic | Number | Measure |
| Per Capita Income | 124,440 | $23,079 |
| Median Family Income | 28,327 | $63,680 |
| Mean Family Income | 28,327 | $73,336 |
| Median Household Income | 37,538 | $59,733 |
| Mean Household Income | 37,538 | $69,695 |
| Income Deficit | 28,327 | $11,359 |
| Wage / Income Gap (%) | 124,440 | 28.98% |
| Wage / Income Gap ($) | 124,440 | 71.02¢ per $1 |
| Gini / Inequality Index | 124,440 | 0.40 |
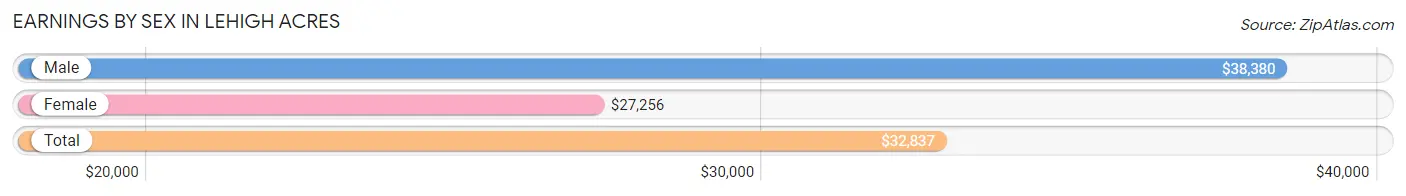
Earnings by Sex in Lehigh Acres
Average Earnings in Lehigh Acres are $32,837, $38,380 for men and $27,256 for women, a difference of 29.0%.
| Sex | Number | Average Earnings |
| Male | 31,544 (52.3%) | $38,380 |
| Female | 28,795 (47.7%) | $27,256 |
| Total | 60,339 (100.0%) | $32,837 |
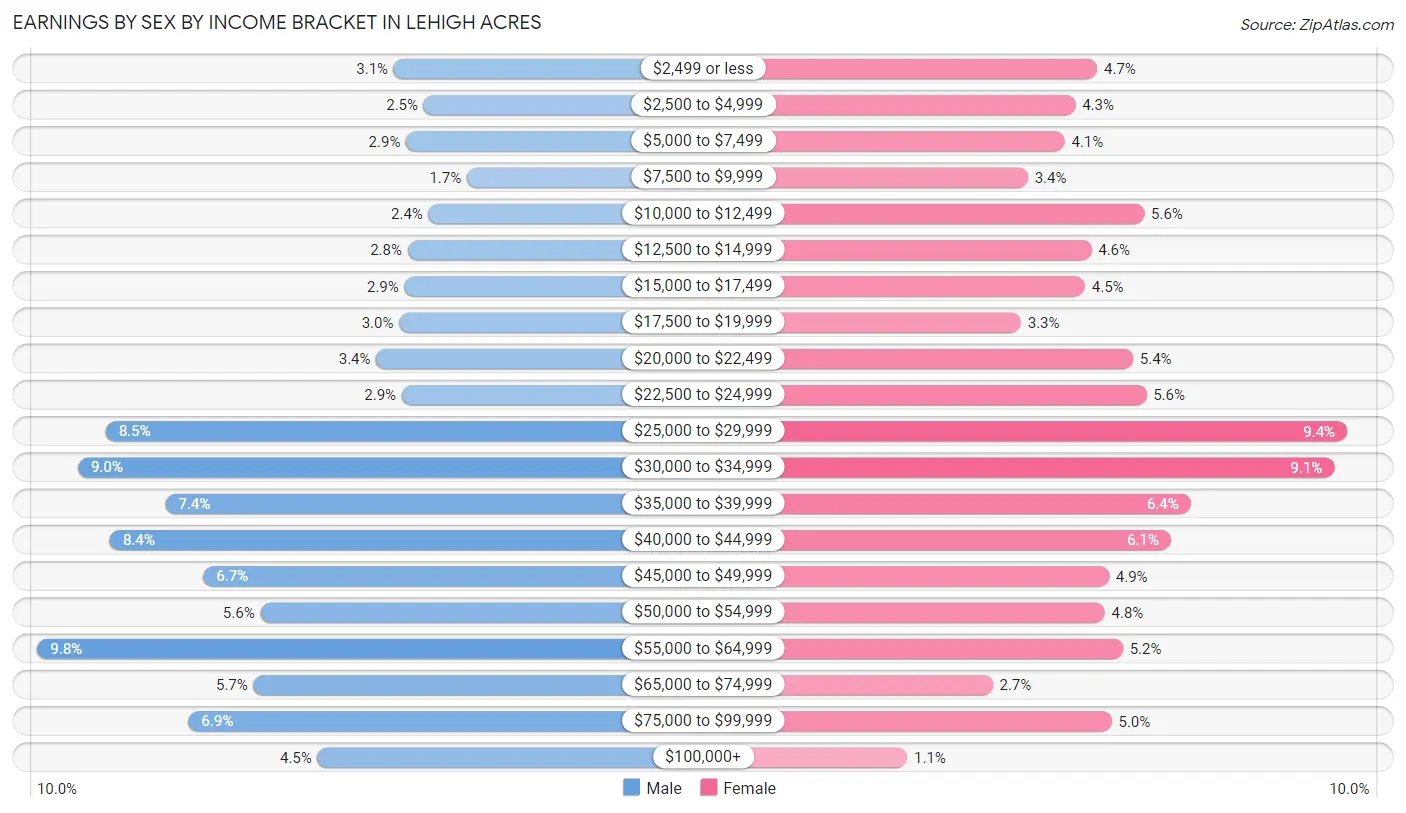
Earnings by Sex by Income Bracket in Lehigh Acres
The most common earnings brackets in Lehigh Acres are $55,000 to $64,999 for men (3,079 | 9.8%) and $25,000 to $29,999 for women (2,698 | 9.4%).
| Income | Male | Female |
| $2,499 or less | 973 (3.1%) | 1,351 (4.7%) |
| $2,500 to $4,999 | 794 (2.5%) | 1,233 (4.3%) |
| $5,000 to $7,499 | 899 (2.9%) | 1,175 (4.1%) |
| $7,500 to $9,999 | 538 (1.7%) | 976 (3.4%) |
| $10,000 to $12,499 | 765 (2.4%) | 1,603 (5.6%) |
| $12,500 to $14,999 | 888 (2.8%) | 1,318 (4.6%) |
| $15,000 to $17,499 | 909 (2.9%) | 1,284 (4.5%) |
| $17,500 to $19,999 | 940 (3.0%) | 938 (3.3%) |
| $20,000 to $22,499 | 1,076 (3.4%) | 1,542 (5.4%) |
| $22,500 to $24,999 | 924 (2.9%) | 1,616 (5.6%) |
| $25,000 to $29,999 | 2,676 (8.5%) | 2,698 (9.4%) |
| $30,000 to $34,999 | 2,839 (9.0%) | 2,628 (9.1%) |
| $35,000 to $39,999 | 2,323 (7.4%) | 1,855 (6.4%) |
| $40,000 to $44,999 | 2,651 (8.4%) | 1,747 (6.1%) |
| $45,000 to $49,999 | 2,097 (6.7%) | 1,414 (4.9%) |
| $50,000 to $54,999 | 1,761 (5.6%) | 1,391 (4.8%) |
| $55,000 to $64,999 | 3,079 (9.8%) | 1,490 (5.2%) |
| $65,000 to $74,999 | 1,802 (5.7%) | 785 (2.7%) |
| $75,000 to $99,999 | 2,186 (6.9%) | 1,427 (5.0%) |
| $100,000+ | 1,424 (4.5%) | 324 (1.1%) |
| Total | 31,544 (100.0%) | 28,795 (100.0%) |
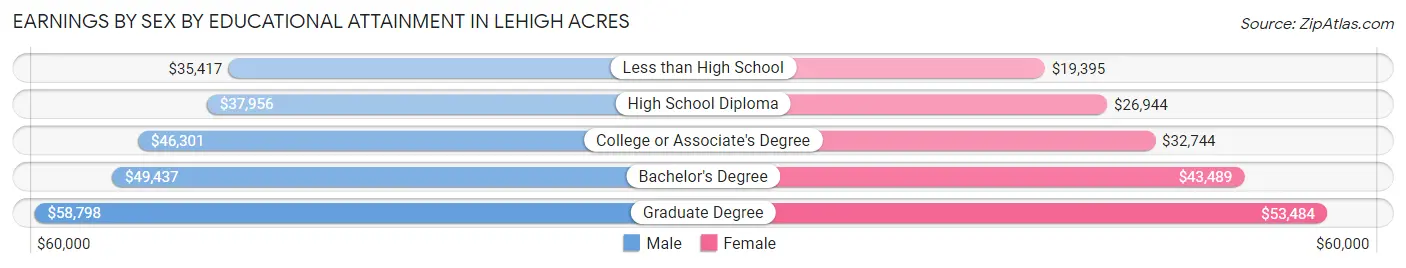
Earnings by Sex by Educational Attainment in Lehigh Acres
Average earnings in Lehigh Acres are $41,711 for men and $30,965 for women, a difference of 25.8%. Men with an educational attainment of graduate degree enjoy the highest average annual earnings of $58,798, while those with less than high school education earn the least with $35,417. Women with an educational attainment of graduate degree earn the most with the average annual earnings of $53,484, while those with less than high school education have the smallest earnings of $19,395.
| Educational Attainment | Male Income | Female Income |
| Less than High School | $35,417 | $19,395 |
| High School Diploma | $37,956 | $26,944 |
| College or Associate's Degree | $46,301 | $32,744 |
| Bachelor's Degree | $49,437 | $43,489 |
| Graduate Degree | $58,798 | $53,484 |
| Total | $41,711 | $30,965 |
Family Income in Lehigh Acres
Family Income Brackets in Lehigh Acres
According to the Lehigh Acres family income data, there are 6,883 families falling into the $50,000 to $74,999 income range, which is the most common income bracket and makes up 24.3% of all families. Conversely, the $200,000+ income bracket is the least frequent group with only 708 families (2.5%) belonging to this category.
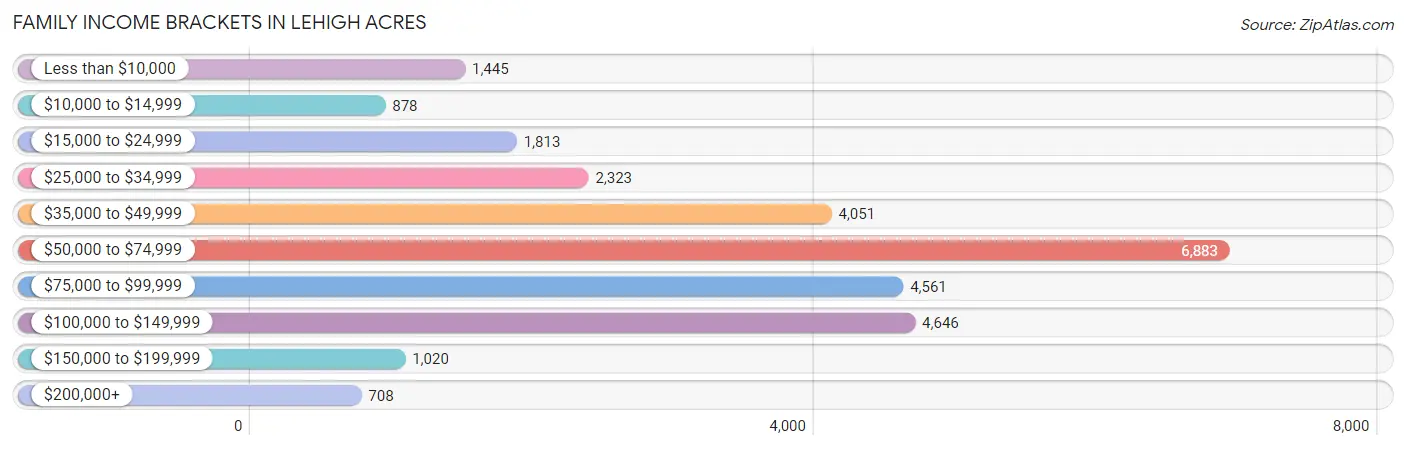
| Income Bracket | # Families | % Families |
| Less than $10,000 | 1,445 | 5.1% |
| $10,000 to $14,999 | 878 | 3.1% |
| $15,000 to $24,999 | 1,813 | 6.4% |
| $25,000 to $34,999 | 2,323 | 8.2% |
| $35,000 to $49,999 | 4,051 | 14.3% |
| $50,000 to $74,999 | 6,883 | 24.3% |
| $75,000 to $99,999 | 4,561 | 16.1% |
| $100,000 to $149,999 | 4,646 | 16.4% |
| $150,000 to $199,999 | 1,020 | 3.6% |
| $200,000+ | 708 | 2.5% |
Family Income by Famaliy Size in Lehigh Acres
7+ person families (635 | 2.2%) account for the highest median family income in Lehigh Acres with $85,655 per family, while 2-person families (10,838 | 38.3%) have the highest median income of $29,604 per family member.
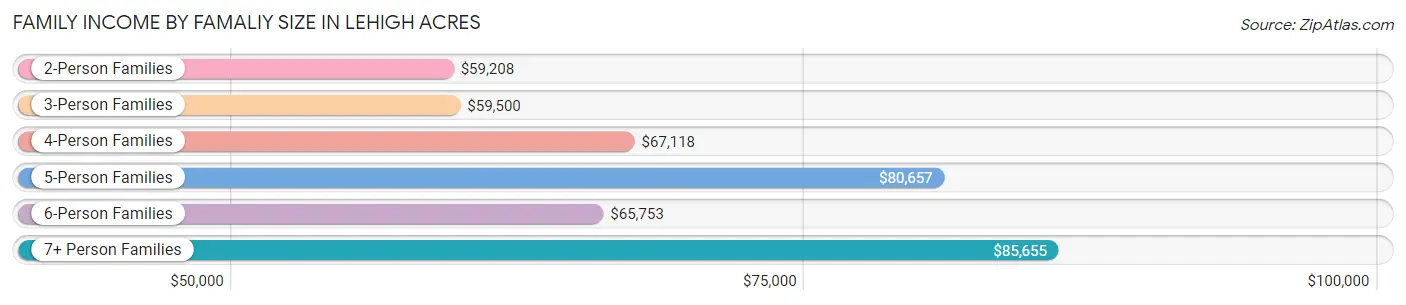
| Income Bracket | # Families | Median Income |
| 2-Person Families | 10,838 (38.3%) | $59,208 |
| 3-Person Families | 6,410 (22.6%) | $59,500 |
| 4-Person Families | 5,786 (20.4%) | $67,118 |
| 5-Person Families | 3,093 (10.9%) | $80,657 |
| 6-Person Families | 1,565 (5.5%) | $65,753 |
| 7+ Person Families | 635 (2.2%) | $85,655 |
| Total | 28,327 (100.0%) | $63,680 |
Family Income by Number of Earners in Lehigh Acres
The median family income in Lehigh Acres is $63,680, with families comprising 3+ earners (3,712) having the highest median family income of $98,556, while families with no earners (4,212) have the lowest median family income of $30,583, accounting for 13.1% and 14.9% of families, respectively.
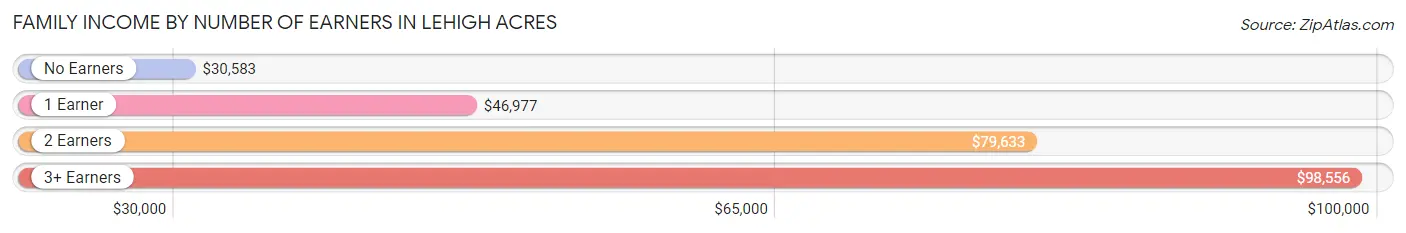
| Number of Earners | # Families | Median Income |
| No Earners | 4,212 (14.9%) | $30,583 |
| 1 Earner | 9,950 (35.1%) | $46,977 |
| 2 Earners | 10,453 (36.9%) | $79,633 |
| 3+ Earners | 3,712 (13.1%) | $98,556 |
| Total | 28,327 (100.0%) | $63,680 |
Household Income in Lehigh Acres
Household Income Brackets in Lehigh Acres
With 8,446 households falling in the category, the $50,000 to $74,999 income range is the most frequent in Lehigh Acres, accounting for 22.5% of all households. In contrast, only 863 households (2.3%) fall into the $200,000+ income bracket, making it the least populous group.
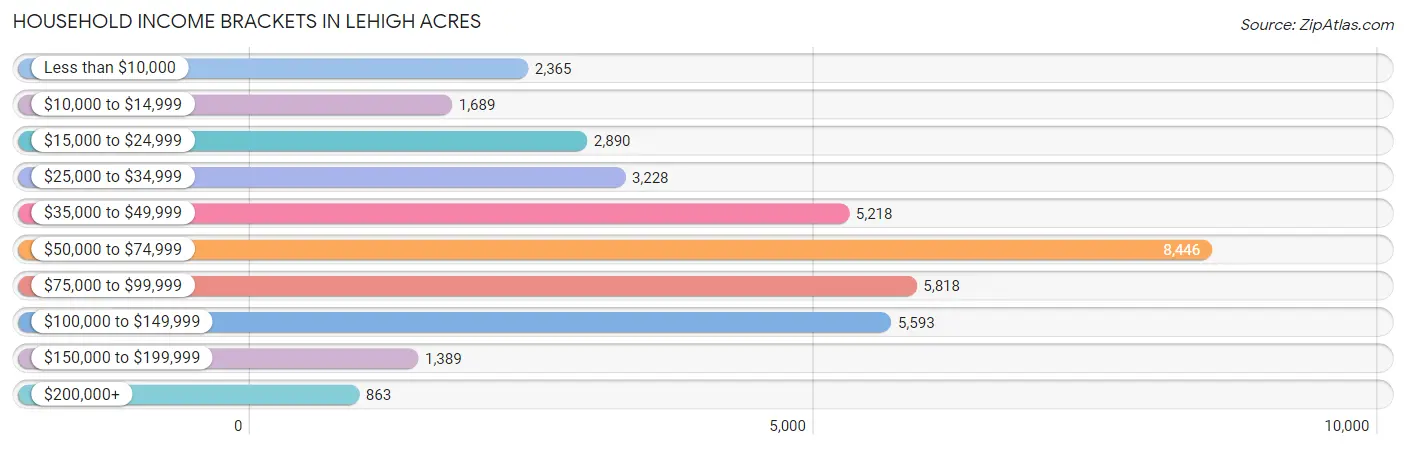
| Income Bracket | # Households | % Households |
| Less than $10,000 | 2,365 | 6.3% |
| $10,000 to $14,999 | 1,689 | 4.5% |
| $15,000 to $24,999 | 2,890 | 7.7% |
| $25,000 to $34,999 | 3,228 | 8.6% |
| $35,000 to $49,999 | 5,218 | 13.9% |
| $50,000 to $74,999 | 8,446 | 22.5% |
| $75,000 to $99,999 | 5,818 | 15.5% |
| $100,000 to $149,999 | 5,593 | 14.9% |
| $150,000 to $199,999 | 1,389 | 3.7% |
| $200,000+ | 863 | 2.3% |
Household Income by Householder Age in Lehigh Acres
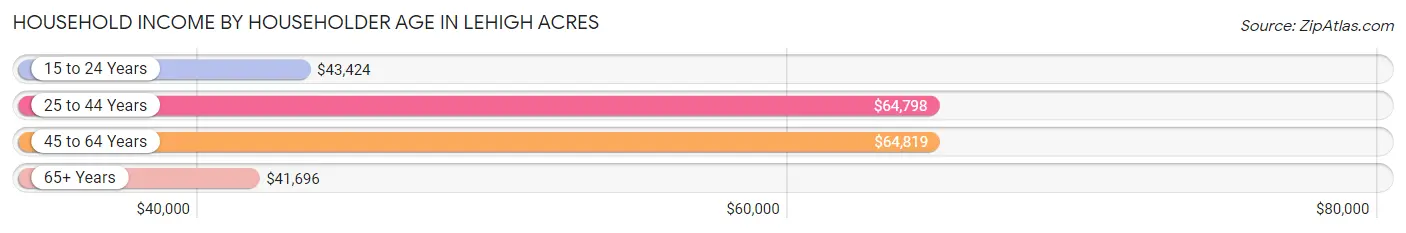
The median household income in Lehigh Acres is $59,733, with the highest median household income of $64,819 found in the 45 to 64 years age bracket for the primary householder. A total of 14,418 households (38.4%) fall into this category. Meanwhile, the 65+ years age bracket for the primary householder has the lowest median household income of $41,696, with 8,336 households (22.2%) in this group.
| Income Bracket | # Households | Median Income |
| 15 to 24 Years | 799 (2.1%) | $43,424 |
| 25 to 44 Years | 13,985 (37.3%) | $64,798 |
| 45 to 64 Years | 14,418 (38.4%) | $64,819 |
| 65+ Years | 8,336 (22.2%) | $41,696 |
| Total | 37,538 (100.0%) | $59,733 |
Poverty in Lehigh Acres
Income Below Poverty by Sex and Age in Lehigh Acres
With 14.6% poverty level for males and 19.0% for females among the residents of Lehigh Acres, under 5 year old males and under 5 year old females are the most vulnerable to poverty, with 1,095 males (27.8%) and 1,160 females (26.2%) in their respective age groups living below the poverty level.
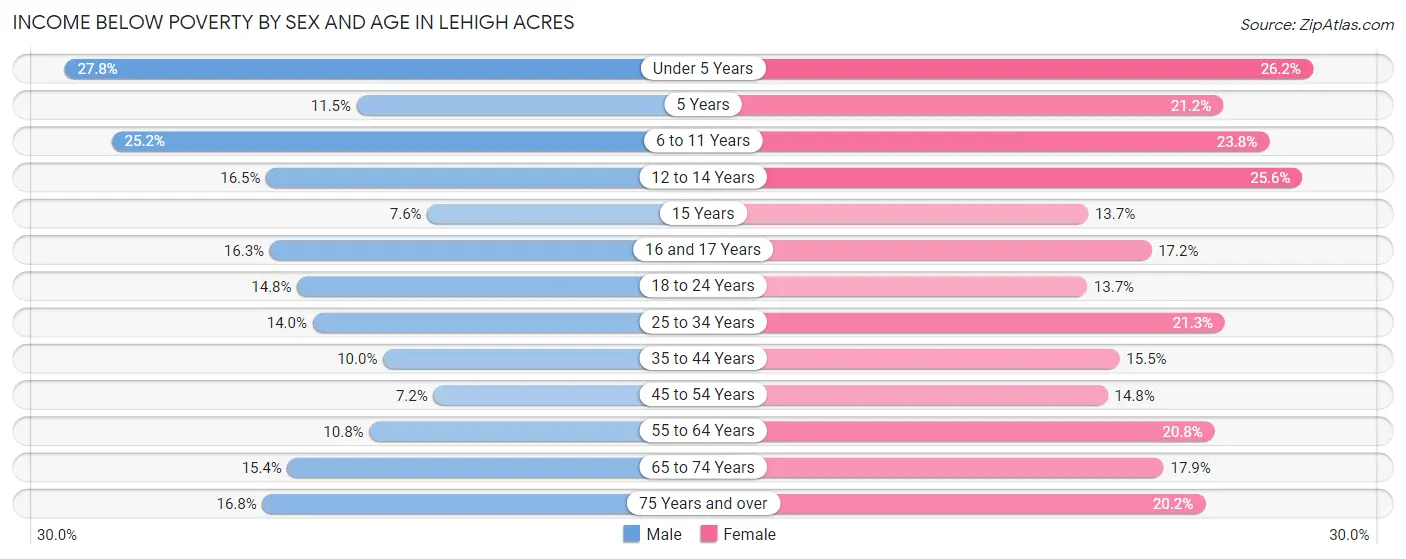
| Age Bracket | Male | Female |
| Under 5 Years | 1,095 (27.8%) | 1,160 (26.2%) |
| 5 Years | 102 (11.5%) | 172 (21.2%) |
| 6 to 11 Years | 1,350 (25.2%) | 1,350 (23.8%) |
| 12 to 14 Years | 673 (16.5%) | 732 (25.6%) |
| 15 Years | 68 (7.6%) | 120 (13.7%) |
| 16 and 17 Years | 274 (16.3%) | 420 (17.2%) |
| 18 to 24 Years | 864 (14.8%) | 844 (13.7%) |
| 25 to 34 Years | 1,227 (14.0%) | 1,839 (21.3%) |
| 35 to 44 Years | 766 (10.0%) | 1,233 (15.5%) |
| 45 to 54 Years | 554 (7.2%) | 1,295 (14.8%) |
| 55 to 64 Years | 715 (10.8%) | 1,242 (20.8%) |
| 65 to 74 Years | 624 (15.3%) | 900 (17.9%) |
| 75 Years and over | 542 (16.8%) | 769 (20.2%) |
| Total | 8,854 (14.6%) | 12,076 (19.0%) |
Income Above Poverty by Sex and Age in Lehigh Acres
According to the poverty statistics in Lehigh Acres, males aged 45 to 54 years and females aged 18 to 24 years are the age groups that are most secure financially, with 92.8% of males and 86.4% of females in these age groups living above the poverty line.
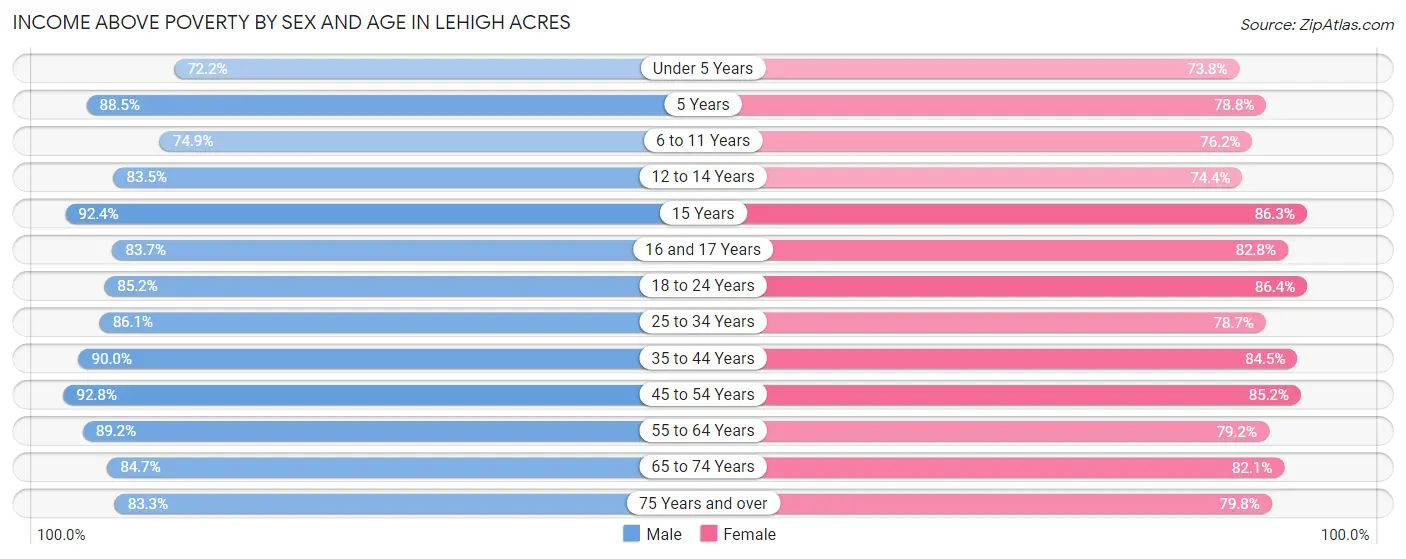
| Age Bracket | Male | Female |
| Under 5 Years | 2,847 (72.2%) | 3,264 (73.8%) |
| 5 Years | 785 (88.5%) | 638 (78.8%) |
| 6 to 11 Years | 4,017 (74.9%) | 4,324 (76.2%) |
| 12 to 14 Years | 3,396 (83.5%) | 2,123 (74.4%) |
| 15 Years | 830 (92.4%) | 755 (86.3%) |
| 16 and 17 Years | 1,403 (83.7%) | 2,018 (82.8%) |
| 18 to 24 Years | 4,968 (85.2%) | 5,337 (86.4%) |
| 25 to 34 Years | 7,567 (86.1%) | 6,782 (78.7%) |
| 35 to 44 Years | 6,873 (90.0%) | 6,743 (84.5%) |
| 45 to 54 Years | 7,106 (92.8%) | 7,454 (85.2%) |
| 55 to 64 Years | 5,904 (89.2%) | 4,740 (79.2%) |
| 65 to 74 Years | 3,441 (84.7%) | 4,123 (82.1%) |
| 75 Years and over | 2,693 (83.3%) | 3,033 (79.8%) |
| Total | 51,830 (85.4%) | 51,334 (81.0%) |
Income Below Poverty Among Married-Couple Families in Lehigh Acres
The poverty statistics for married-couple families in Lehigh Acres show that 8.2% or 1,497 of the total 18,276 families live below the poverty line. Families with 5 or more children have the highest poverty rate of 19.0%, comprising of 47 families. On the other hand, families with 1 or 2 children have the lowest poverty rate of 7.1%, which includes 477 families.
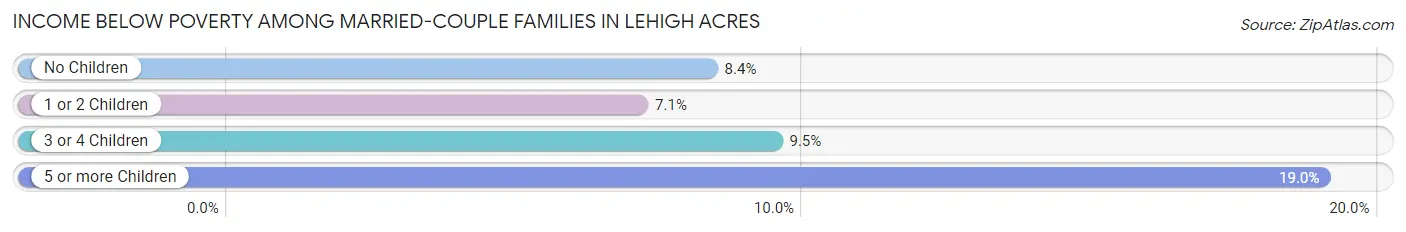
| Children | Above Poverty | Below Poverty |
| No Children | 8,394 (91.6%) | 765 (8.4%) |
| 1 or 2 Children | 6,200 (92.9%) | 477 (7.1%) |
| 3 or 4 Children | 1,985 (90.5%) | 208 (9.5%) |
| 5 or more Children | 200 (81.0%) | 47 (19.0%) |
| Total | 16,779 (91.8%) | 1,497 (8.2%) |
Income Below Poverty Among Single-Parent Households in Lehigh Acres
According to the poverty data in Lehigh Acres, 11.2% or 311 single-father households and 31.9% or 2,321 single-mother households are living below the poverty line. Among single-father households, those with 5 or more children have the highest poverty rate, with 8 households (100.0%) experiencing poverty. Likewise, among single-mother households, those with 3 or 4 children have the highest poverty rate, with 725 households (61.5%) falling below the poverty line.
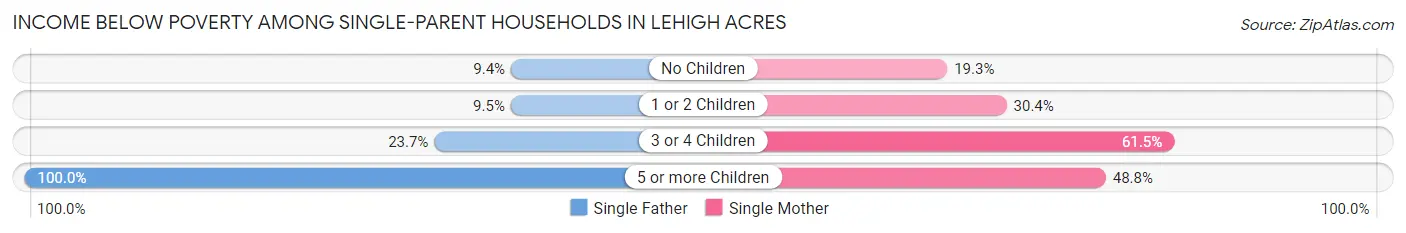
| Children | Single Father | Single Mother |
| No Children | 126 (9.4%) | 482 (19.3%) |
| 1 or 2 Children | 108 (9.5%) | 1,052 (30.3%) |
| 3 or 4 Children | 69 (23.7%) | 725 (61.5%) |
| 5 or more Children | 8 (100.0%) | 62 (48.8%) |
| Total | 311 (11.2%) | 2,321 (31.9%) |
Income Below Poverty Among Married-Couple vs Single-Parent Households in Lehigh Acres
The poverty data for Lehigh Acres shows that 1,497 of the married-couple family households (8.2%) and 2,632 of the single-parent households (26.2%) are living below the poverty level. Within the married-couple family households, those with 5 or more children have the highest poverty rate, with 47 households (19.0%) falling below the poverty line. Among the single-parent households, those with 3 or 4 children have the highest poverty rate, with 794 household (54.0%) living below poverty.
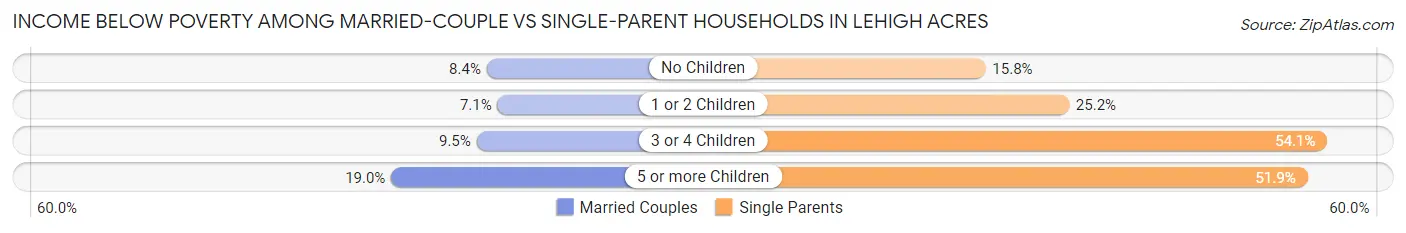
| Children | Married-Couple Families | Single-Parent Households |
| No Children | 765 (8.4%) | 608 (15.8%) |
| 1 or 2 Children | 477 (7.1%) | 1,160 (25.2%) |
| 3 or 4 Children | 208 (9.5%) | 794 (54.0%) |
| 5 or more Children | 47 (19.0%) | 70 (51.8%) |
| Total | 1,497 (8.2%) | 2,632 (26.2%) |
Race in Lehigh Acres
The most populous races in Lehigh Acres are White / Caucasian (67,495 | 54.2%), Hispanic or Latino (57,051 | 45.9%), and Black / African American (23,963 | 19.3%).
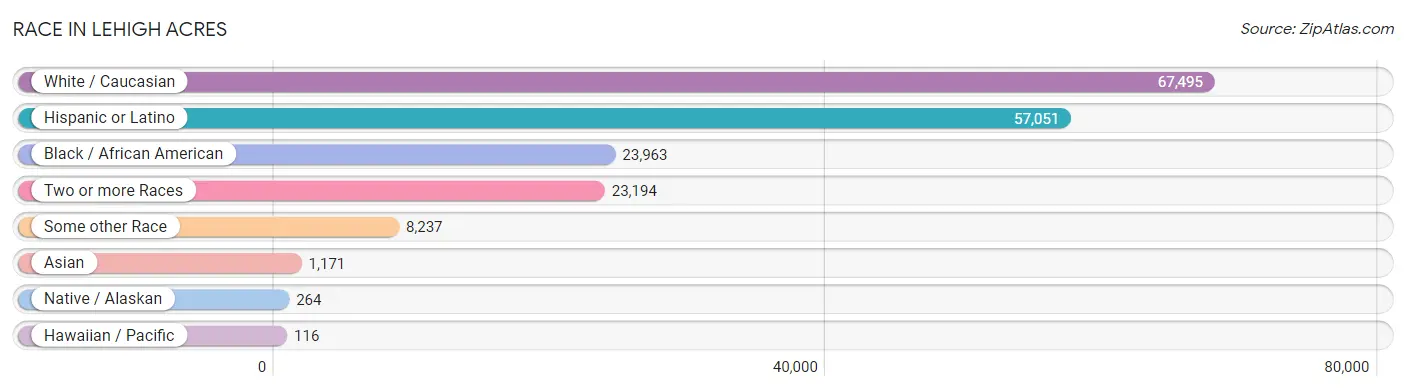
| Race | # Population | % Population |
| Asian | 1,171 | 0.9% |
| Black / African American | 23,963 | 19.3% |
| Hawaiian / Pacific | 116 | 0.1% |
| Hispanic or Latino | 57,051 | 45.9% |
| Native / Alaskan | 264 | 0.2% |
| White / Caucasian | 67,495 | 54.2% |
| Two or more Races | 23,194 | 18.6% |
| Some other Race | 8,237 | 6.6% |
| Total | 124,440 | 100.0% |
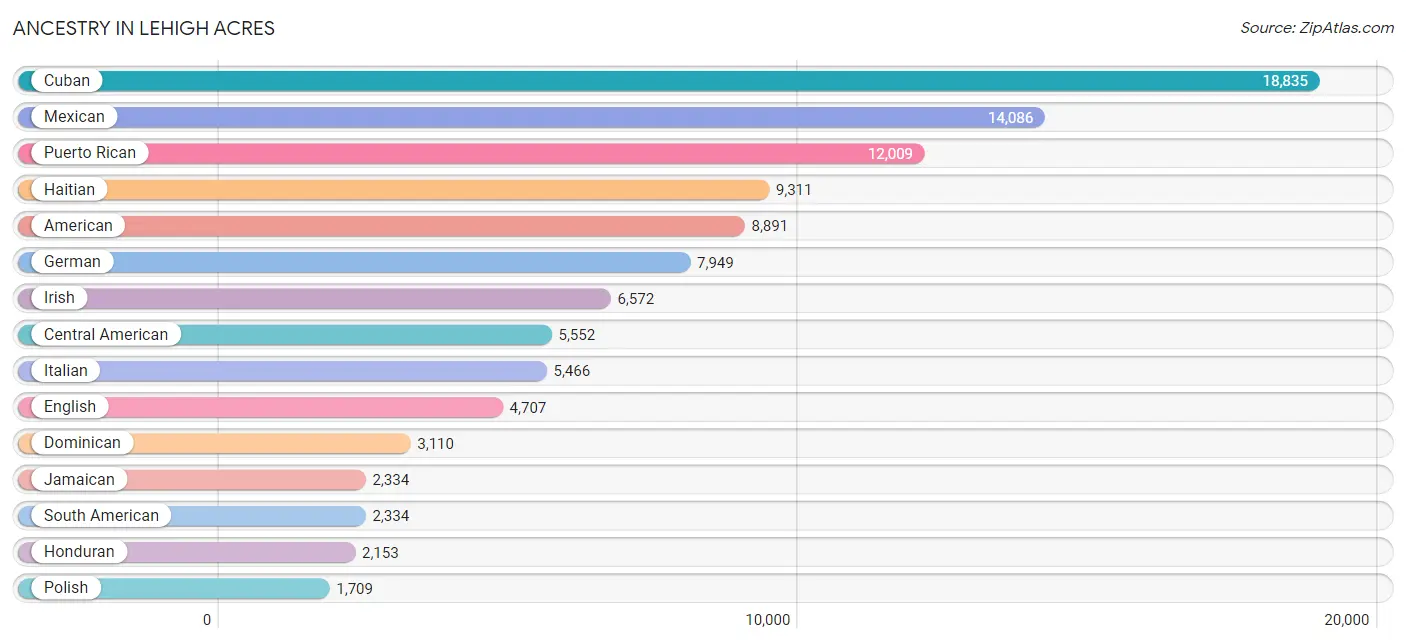
Ancestry in Lehigh Acres
The most populous ancestries reported in Lehigh Acres are Cuban (18,835 | 15.1%), Mexican (14,086 | 11.3%), Puerto Rican (12,009 | 9.7%), Haitian (9,311 | 7.5%), and American (8,891 | 7.1%), together accounting for 50.7% of all Lehigh Acres residents.
| Ancestry | # Population | % Population |
| African | 647 | 0.5% |
| Alaska Native | 30 | 0.0% |
| Albanian | 16 | 0.0% |
| American | 8,891 | 7.1% |
| Arab | 335 | 0.3% |
| Argentinean | 41 | 0.0% |
| Armenian | 99 | 0.1% |
| Austrian | 252 | 0.2% |
| Bahamian | 134 | 0.1% |
| Barbadian | 243 | 0.2% |
| Belgian | 95 | 0.1% |
| Belizean | 16 | 0.0% |
| Bermudan | 13 | 0.0% |
| Bhutanese | 43 | 0.0% |
| Blackfeet | 98 | 0.1% |
| Bolivian | 57 | 0.1% |
| Brazilian | 543 | 0.4% |
| British | 313 | 0.3% |
| British West Indian | 39 | 0.0% |
| Bulgarian | 11 | 0.0% |
| Burmese | 131 | 0.1% |
| Canadian | 380 | 0.3% |
| Central American | 5,552 | 4.5% |
| Central American Indian | 178 | 0.1% |
| Cherokee | 251 | 0.2% |
| Chilean | 70 | 0.1% |
| Chippewa | 8 | 0.0% |
| Choctaw | 75 | 0.1% |
| Colombian | 1,035 | 0.8% |
| Costa Rican | 158 | 0.1% |
| Croatian | 27 | 0.0% |
| Cuban | 18,835 | 15.1% |
| Czech | 289 | 0.2% |
| Czechoslovakian | 37 | 0.0% |
| Danish | 85 | 0.1% |
| Dominican | 3,110 | 2.5% |
| Dutch | 640 | 0.5% |
| Dutch West Indian | 39 | 0.0% |
| Eastern European | 89 | 0.1% |
| Ecuadorian | 221 | 0.2% |
| Egyptian | 57 | 0.1% |
| English | 4,707 | 3.8% |
| European | 869 | 0.7% |
| Finnish | 57 | 0.1% |
| French | 1,273 | 1.0% |
| French Canadian | 234 | 0.2% |
| German | 7,949 | 6.4% |
| Greek | 454 | 0.4% |
| Guamanian / Chamorro | 15 | 0.0% |
| Guatemalan | 1,526 | 1.2% |
| Guyanese | 237 | 0.2% |
| Haitian | 9,311 | 7.5% |
| Honduran | 2,153 | 1.7% |
| Hungarian | 403 | 0.3% |
| Indian (Asian) | 307 | 0.3% |
| Iranian | 26 | 0.0% |
| Irish | 6,572 | 5.3% |
| Iroquois | 41 | 0.0% |
| Italian | 5,466 | 4.4% |
| Jamaican | 2,334 | 1.9% |
| Japanese | 7 | 0.0% |
| Korean | 582 | 0.5% |
| Lebanese | 87 | 0.1% |
| Lithuanian | 99 | 0.1% |
| Malaysian | 44 | 0.0% |
| Mexican | 14,086 | 11.3% |
| Mexican American Indian | 206 | 0.2% |
| Moroccan | 48 | 0.0% |
| Native Hawaiian | 14 | 0.0% |
| Navajo | 19 | 0.0% |
| Nicaraguan | 855 | 0.7% |
| Nigerian | 26 | 0.0% |
| Northern European | 51 | 0.0% |
| Norwegian | 631 | 0.5% |
| Pakistani | 53 | 0.0% |
| Panamanian | 230 | 0.2% |
| Pennsylvania German | 21 | 0.0% |
| Peruvian | 317 | 0.3% |
| Polish | 1,709 | 1.4% |
| Portuguese | 449 | 0.4% |
| Puerto Rican | 12,009 | 9.7% |
| Romanian | 55 | 0.0% |
| Russian | 182 | 0.2% |
| Salvadoran | 630 | 0.5% |
| Samoan | 52 | 0.0% |
| Scandinavian | 224 | 0.2% |
| Scotch-Irish | 576 | 0.5% |
| Scottish | 881 | 0.7% |
| Seminole | 70 | 0.1% |
| Slavic | 222 | 0.2% |
| Slovak | 77 | 0.1% |
| Slovene | 40 | 0.0% |
| South African | 27 | 0.0% |
| South American | 2,334 | 1.9% |
| South American Indian | 44 | 0.0% |
| Spaniard | 100 | 0.1% |
| Spanish | 223 | 0.2% |
| Sri Lankan | 135 | 0.1% |
| Subsaharan African | 712 | 0.6% |
| Swedish | 529 | 0.4% |
| Swiss | 179 | 0.1% |
| Syrian | 10 | 0.0% |
| Thai | 483 | 0.4% |
| Tongan | 25 | 0.0% |
| Trinidadian and Tobagonian | 208 | 0.2% |
| Turkish | 11 | 0.0% |
| Ukrainian | 84 | 0.1% |
| Uruguayan | 160 | 0.1% |
| Venezuelan | 409 | 0.3% |
| Welsh | 447 | 0.4% |
| West Indian | 147 | 0.1% |
| Zimbabwean | 12 | 0.0% | View All 112 Rows |
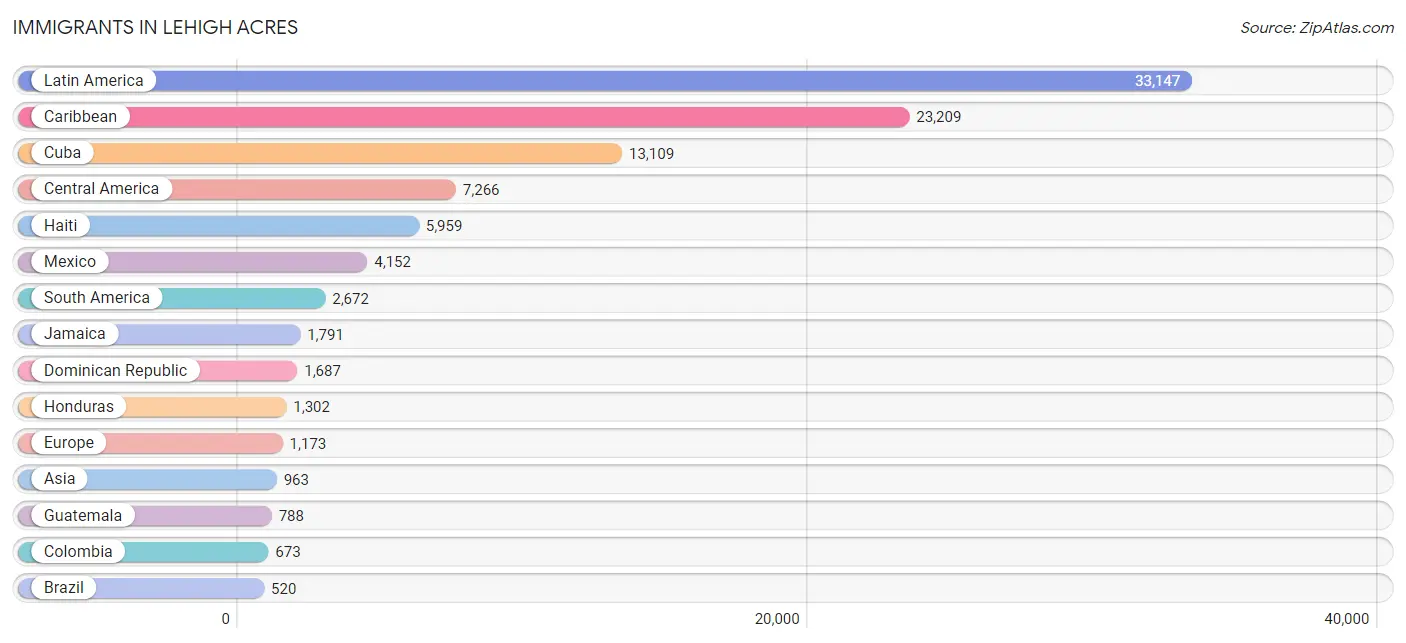
Immigrants in Lehigh Acres
The most numerous immigrant groups reported in Lehigh Acres came from Latin America (33,147 | 26.6%), Caribbean (23,209 | 18.6%), Cuba (13,109 | 10.5%), Central America (7,266 | 5.8%), and Haiti (5,959 | 4.8%), together accounting for 66.5% of all Lehigh Acres residents.
| Immigration Origin | # Population | % Population |
| Africa | 219 | 0.2% |
| Argentina | 41 | 0.0% |
| Asia | 963 | 0.8% |
| Austria | 65 | 0.1% |
| Bahamas | 100 | 0.1% |
| Bangladesh | 14 | 0.0% |
| Barbados | 239 | 0.2% |
| Belarus | 21 | 0.0% |
| Belize | 10 | 0.0% |
| Bolivia | 50 | 0.0% |
| Brazil | 520 | 0.4% |
| Bulgaria | 11 | 0.0% |
| Cambodia | 6 | 0.0% |
| Canada | 341 | 0.3% |
| Caribbean | 23,209 | 18.6% |
| Central America | 7,266 | 5.8% |
| Chile | 51 | 0.0% |
| China | 107 | 0.1% |
| Colombia | 673 | 0.5% |
| Costa Rica | 100 | 0.1% |
| Cuba | 13,109 | 10.5% |
| Czechoslovakia | 20 | 0.0% |
| Dominica | 19 | 0.0% |
| Dominican Republic | 1,687 | 1.4% |
| Eastern Africa | 43 | 0.0% |
| Eastern Asia | 149 | 0.1% |
| Eastern Europe | 274 | 0.2% |
| Ecuador | 288 | 0.2% |
| Egypt | 32 | 0.0% |
| El Salvador | 491 | 0.4% |
| England | 182 | 0.2% |
| Europe | 1,173 | 0.9% |
| Germany | 326 | 0.3% |
| Greece | 6 | 0.0% |
| Guatemala | 788 | 0.6% |
| Guyana | 245 | 0.2% |
| Haiti | 5,959 | 4.8% |
| Honduras | 1,302 | 1.1% |
| Hong Kong | 60 | 0.1% |
| Hungary | 67 | 0.1% |
| India | 190 | 0.2% |
| Iran | 89 | 0.1% |
| Ireland | 21 | 0.0% |
| Italy | 64 | 0.1% |
| Jamaica | 1,791 | 1.4% |
| Korea | 42 | 0.0% |
| Laos | 27 | 0.0% |
| Latin America | 33,147 | 26.6% |
| Lebanon | 4 | 0.0% |
| Lithuania | 13 | 0.0% |
| Mexico | 4,152 | 3.3% |
| Middle Africa | 22 | 0.0% |
| Morocco | 23 | 0.0% |
| Netherlands | 20 | 0.0% |
| Nicaragua | 326 | 0.3% |
| Northern Africa | 55 | 0.0% |
| Northern Europe | 339 | 0.3% |
| Oceania | 8 | 0.0% |
| Panama | 97 | 0.1% |
| Peru | 208 | 0.2% |
| Philippines | 286 | 0.2% |
| Poland | 57 | 0.1% |
| Portugal | 22 | 0.0% |
| Romania | 12 | 0.0% |
| Russia | 30 | 0.0% |
| Scotland | 41 | 0.0% |
| Sierra Leone | 5 | 0.0% |
| South Africa | 29 | 0.0% |
| South America | 2,672 | 2.1% |
| South Central Asia | 293 | 0.2% |
| South Eastern Asia | 495 | 0.4% |
| Southern Europe | 119 | 0.1% |
| Spain | 27 | 0.0% |
| St. Vincent and the Grenadines | 17 | 0.0% |
| Sweden | 34 | 0.0% |
| Switzerland | 30 | 0.0% |
| Taiwan | 5 | 0.0% |
| Thailand | 60 | 0.1% |
| Trinidad and Tobago | 110 | 0.1% |
| Turkey | 22 | 0.0% |
| Uruguay | 147 | 0.1% |
| Venezuela | 431 | 0.4% |
| Vietnam | 116 | 0.1% |
| Western Africa | 70 | 0.1% |
| Western Asia | 26 | 0.0% |
| Western Europe | 441 | 0.4% |
| Zimbabwe | 12 | 0.0% | View All 87 Rows |
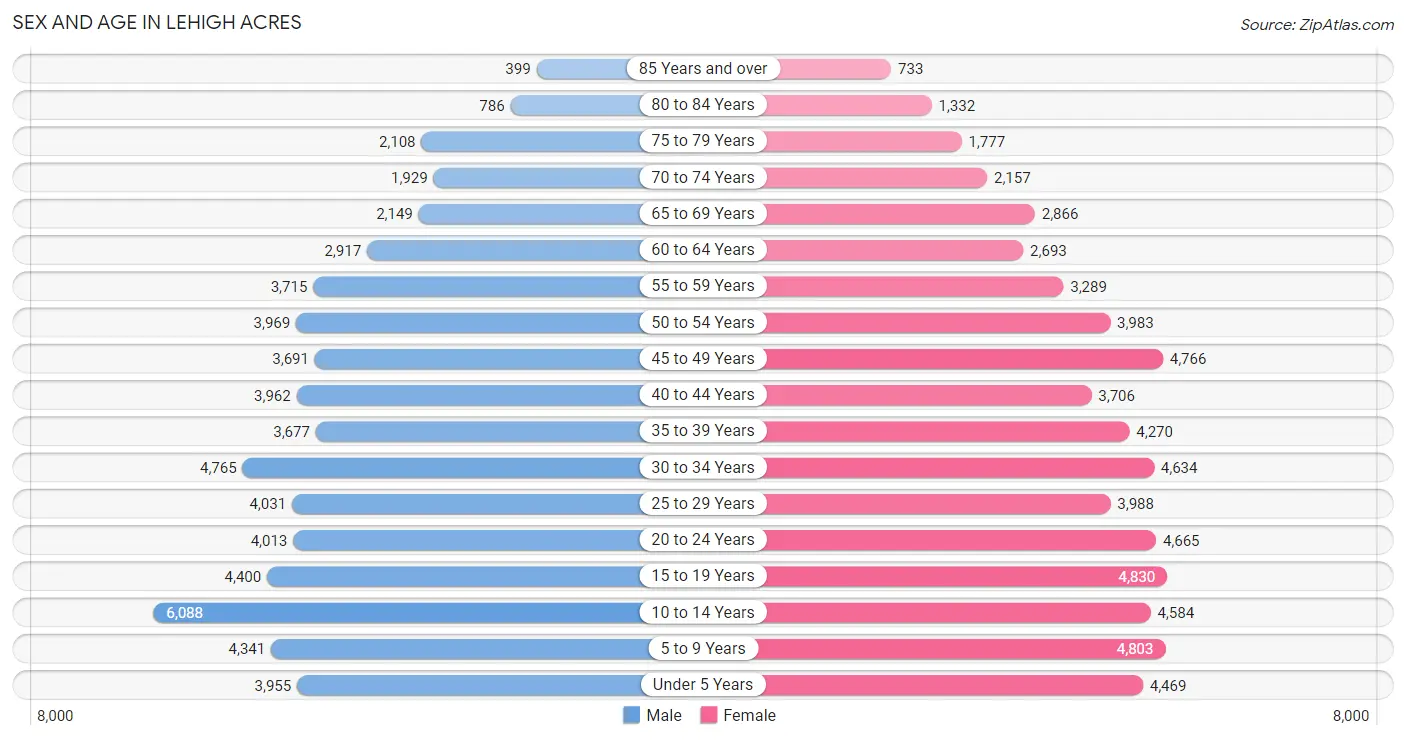
Sex and Age in Lehigh Acres
Sex and Age in Lehigh Acres
The most populous age groups in Lehigh Acres are 10 to 14 Years (6,088 | 10.0%) for men and 15 to 19 Years (4,830 | 7.6%) for women.
| Age Bracket | Male | Female |
| Under 5 Years | 3,955 (6.5%) | 4,469 (7.0%) |
| 5 to 9 Years | 4,341 (7.1%) | 4,803 (7.6%) |
| 10 to 14 Years | 6,088 (10.0%) | 4,584 (7.2%) |
| 15 to 19 Years | 4,400 (7.2%) | 4,830 (7.6%) |
| 20 to 24 Years | 4,013 (6.6%) | 4,665 (7.3%) |
| 25 to 29 Years | 4,031 (6.6%) | 3,988 (6.3%) |
| 30 to 34 Years | 4,765 (7.8%) | 4,634 (7.3%) |
| 35 to 39 Years | 3,677 (6.0%) | 4,270 (6.7%) |
| 40 to 44 Years | 3,962 (6.5%) | 3,706 (5.8%) |
| 45 to 49 Years | 3,691 (6.1%) | 4,766 (7.5%) |
| 50 to 54 Years | 3,969 (6.5%) | 3,983 (6.3%) |
| 55 to 59 Years | 3,715 (6.1%) | 3,289 (5.2%) |
| 60 to 64 Years | 2,917 (4.8%) | 2,693 (4.2%) |
| 65 to 69 Years | 2,149 (3.5%) | 2,866 (4.5%) |
| 70 to 74 Years | 1,929 (3.2%) | 2,157 (3.4%) |
| 75 to 79 Years | 2,108 (3.5%) | 1,777 (2.8%) |
| 80 to 84 Years | 786 (1.3%) | 1,332 (2.1%) |
| 85 Years and over | 399 (0.7%) | 733 (1.1%) |
| Total | 60,895 (100.0%) | 63,545 (100.0%) |
Families and Households in Lehigh Acres
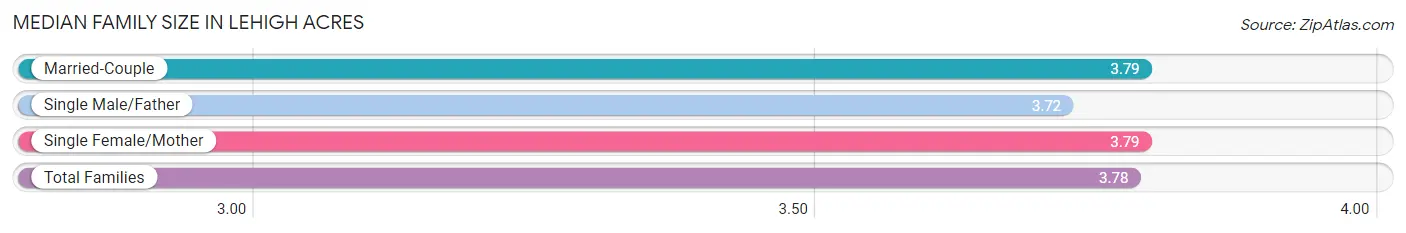
Median Family Size in Lehigh Acres
The median family size in Lehigh Acres is 3.78 persons per family, with married-couple families (18,276 | 64.5%) accounting for the largest median family size of 3.79 persons per family. On the other hand, single male/father families (2,781 | 9.8%) represent the smallest median family size with 3.72 persons per family.
| Family Type | # Families | Family Size |
| Married-Couple | 18,276 (64.5%) | 3.79 |
| Single Male/Father | 2,781 (9.8%) | 3.72 |
| Single Female/Mother | 7,270 (25.7%) | 3.79 |
| Total Families | 28,327 (100.0%) | 3.78 |
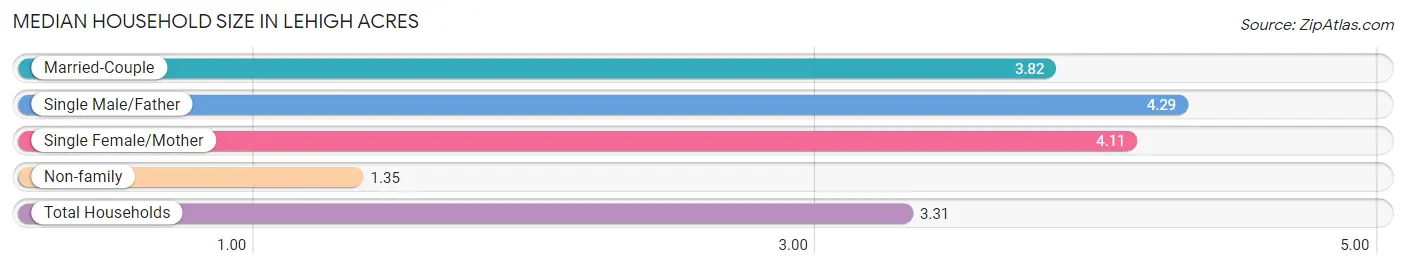
Median Household Size in Lehigh Acres
The median household size in Lehigh Acres is 3.31 persons per household, with single male/father households (2,781 | 7.4%) accounting for the largest median household size of 4.29 persons per household. non-family households (9,211 | 24.5%) represent the smallest median household size with 1.35 persons per household.
| Household Type | # Households | Household Size |
| Married-Couple | 18,276 (48.7%) | 3.82 |
| Single Male/Father | 2,781 (7.4%) | 4.29 |
| Single Female/Mother | 7,270 (19.4%) | 4.11 |
| Non-family | 9,211 (24.5%) | 1.35 |
| Total Households | 37,538 (100.0%) | 3.31 |
Household Size by Marriage Status in Lehigh Acres
Out of a total of 37,538 households in Lehigh Acres, 28,327 (75.5%) are family households, while 9,211 (24.5%) are nonfamily households. The most numerous type of family households are 2-person households, comprising 9,719, and the most common type of nonfamily households are 1-person households, comprising 7,028.
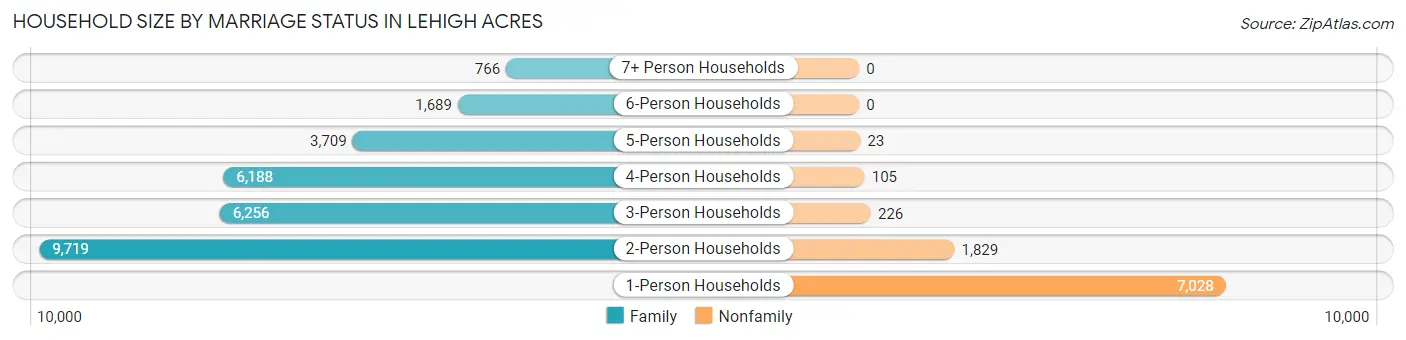
| Household Size | Family Households | Nonfamily Households |
| 1-Person Households | - | 7,028 (18.7%) |
| 2-Person Households | 9,719 (25.9%) | 1,829 (4.9%) |
| 3-Person Households | 6,256 (16.7%) | 226 (0.6%) |
| 4-Person Households | 6,188 (16.5%) | 105 (0.3%) |
| 5-Person Households | 3,709 (9.9%) | 23 (0.1%) |
| 6-Person Households | 1,689 (4.5%) | 0 (0.0%) |
| 7+ Person Households | 766 (2.0%) | 0 (0.0%) |
| Total | 28,327 (75.5%) | 9,211 (24.5%) |
Female Fertility in Lehigh Acres
Fertility by Age in Lehigh Acres
Average fertility rate in Lehigh Acres is 57.0 births per 1,000 women. Women in the age bracket of 20 to 34 years have the highest fertility rate with 112.0 births per 1,000 women. Women in the age bracket of 20 to 34 years acount for 81.8% of all women with births.
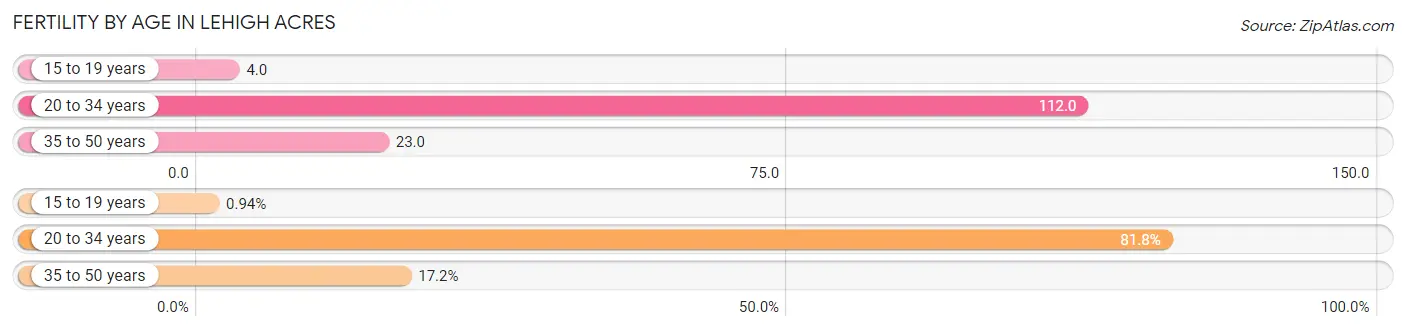
| Age Bracket | Women with Births | Births / 1,000 Women |
| 15 to 19 years | 17 (0.9%) | 4.0 |
| 20 to 34 years | 1,486 (81.8%) | 112.0 |
| 35 to 50 years | 313 (17.2%) | 23.0 |
| Total | 1,816 (100.0%) | 57.0 |
Fertility by Age by Marriage Status in Lehigh Acres
49.5% of women with births (1,816) in Lehigh Acres are married. The highest percentage of unmarried women with births falls into 15 to 19 years age bracket with 100.0% of them unmarried at the time of birth, while the lowest percentage of unmarried women with births belong to 35 to 50 years age bracket with 34.2% of them unmarried.
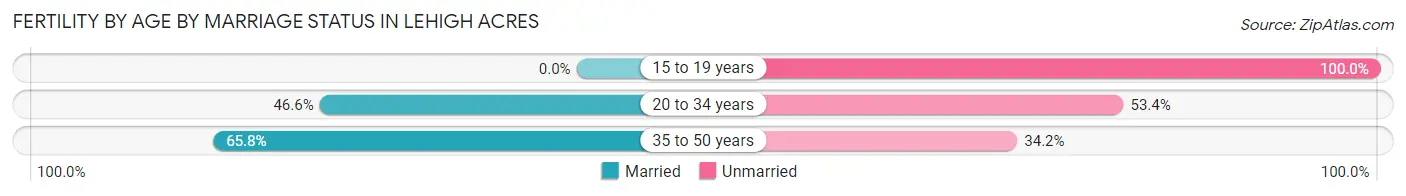
| Age Bracket | Married | Unmarried |
| 15 to 19 years | 0 (0.0%) | 17 (100.0%) |
| 20 to 34 years | 692 (46.6%) | 794 (53.4%) |
| 35 to 50 years | 206 (65.8%) | 107 (34.2%) |
| Total | 899 (49.5%) | 917 (50.5%) |
Fertility by Education in Lehigh Acres
Average fertility rate in Lehigh Acres is 57.0 births per 1,000 women. Women with the education attainment of high school diploma have the highest fertility rate of 70.0 births per 1,000 women, while women with the education attainment of graduate degree have the lowest fertility at 34.0 births per 1,000 women. Women with the education attainment of high school diploma represent 37.1% of all women with births.
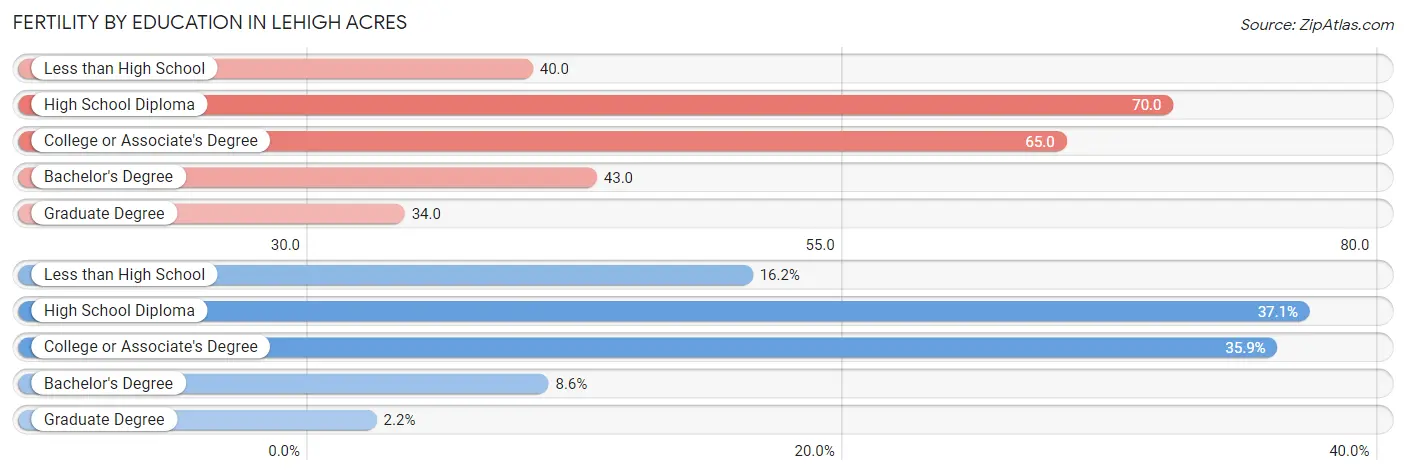
| Educational Attainment | Women with Births | Births / 1,000 Women |
| Less than High School | 295 (16.2%) | 40.0 |
| High School Diploma | 674 (37.1%) | 70.0 |
| College or Associate's Degree | 652 (35.9%) | 65.0 |
| Bachelor's Degree | 156 (8.6%) | 43.0 |
| Graduate Degree | 39 (2.1%) | 34.0 |
| Total | 1,816 (100.0%) | 57.0 |
Fertility by Education by Marriage Status in Lehigh Acres
50.5% of women with births in Lehigh Acres are unmarried. Women with the educational attainment of graduate degree are most likely to be married with 100.0% of them married at childbirth, while women with the educational attainment of college or associate's degree are least likely to be married with 62.9% of them unmarried at childbirth.
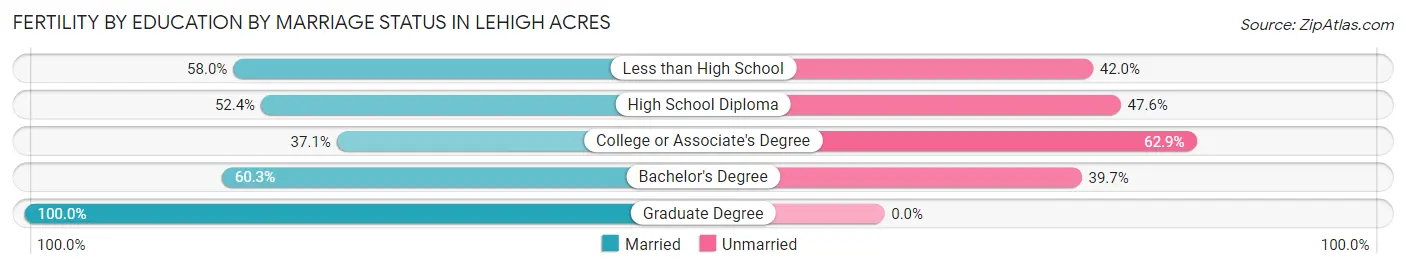
| Educational Attainment | Married | Unmarried |
| Less than High School | 171 (58.0%) | 124 (42.0%) |
| High School Diploma | 353 (52.4%) | 321 (47.6%) |
| College or Associate's Degree | 242 (37.1%) | 410 (62.9%) |
| Bachelor's Degree | 94 (60.3%) | 62 (39.7%) |
| Graduate Degree | 39 (100.0%) | 0 (0.0%) |
| Total | 899 (49.5%) | 917 (50.5%) |
Employment Characteristics in Lehigh Acres
Employment by Class of Employer in Lehigh Acres
Among the 54,900 employed individuals in Lehigh Acres, private company employees (40,772 | 74.3%), local government employees (3,448 | 6.3%), and self-employed (not incorporated) (3,349 | 6.1%) make up the most common classes of employment.
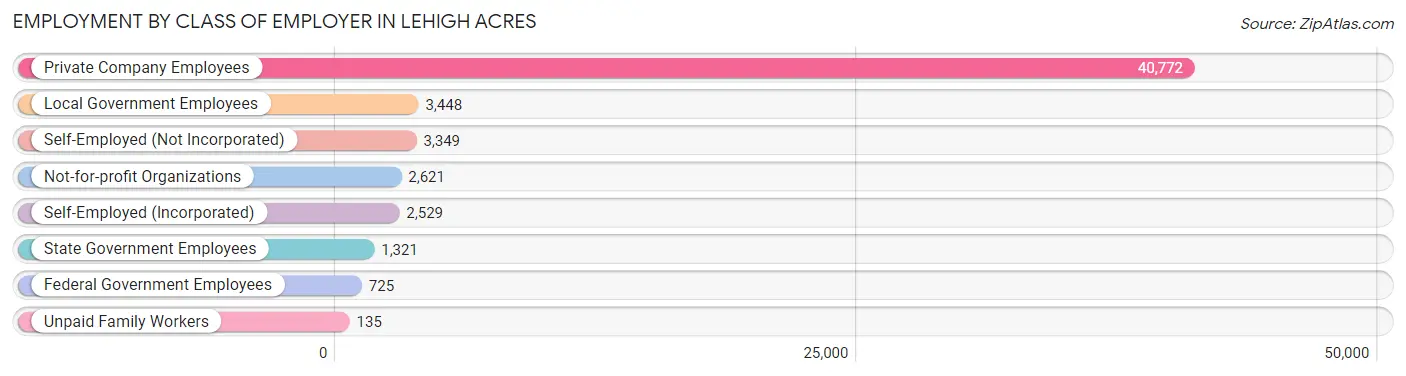
| Employer Class | # Employees | % Employees |
| Private Company Employees | 40,772 | 74.3% |
| Self-Employed (Incorporated) | 2,529 | 4.6% |
| Self-Employed (Not Incorporated) | 3,349 | 6.1% |
| Not-for-profit Organizations | 2,621 | 4.8% |
| Local Government Employees | 3,448 | 6.3% |
| State Government Employees | 1,321 | 2.4% |
| Federal Government Employees | 725 | 1.3% |
| Unpaid Family Workers | 135 | 0.3% |
| Total | 54,900 | 100.0% |
Employment Status by Age in Lehigh Acres
According to the labor force statistics for Lehigh Acres, out of the total population over 16 years of age (94,426), 63.0% or 59,488 individuals are in the labor force, with 5.5% or 3,272 of them unemployed. The age group with the highest labor force participation rate is 35 to 44 years, with 85.0% or 13,273 individuals in the labor force. Within the labor force, the 16 to 19 years age range has the highest percentage of unemployed individuals, with 18.5% or 440 of them being unemployed.
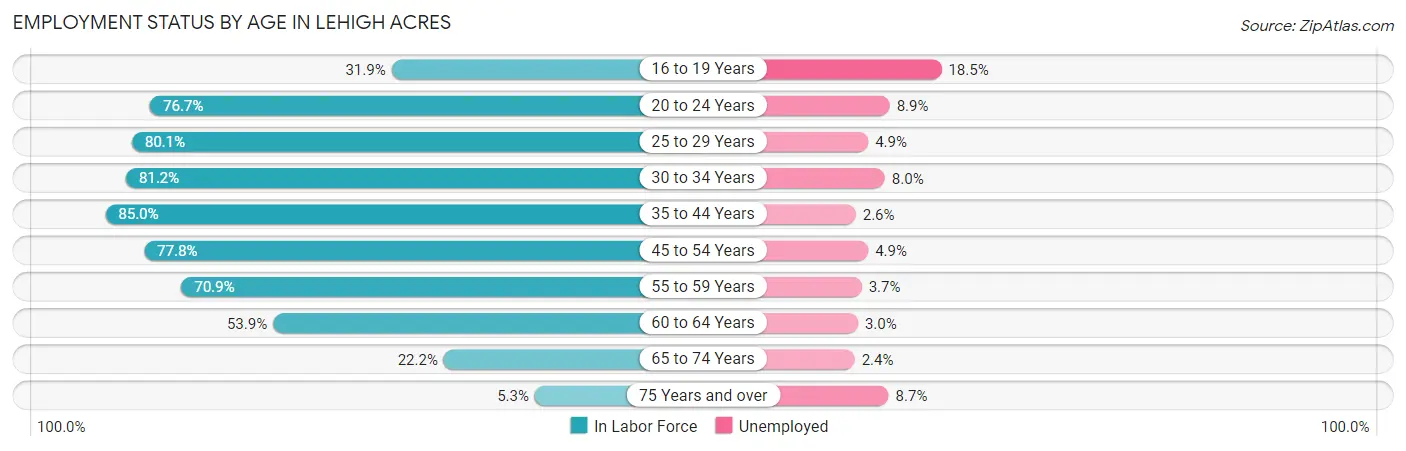
| Age Bracket | In Labor Force | Unemployed |
| 16 to 19 Years | 2,378 (31.9%) | 440 (18.5%) |
| 20 to 24 Years | 6,656 (76.7%) | 592 (8.9%) |
| 25 to 29 Years | 6,423 (80.1%) | 315 (4.9%) |
| 30 to 34 Years | 7,632 (81.2%) | 611 (8.0%) |
| 35 to 44 Years | 13,273 (85.0%) | 345 (2.6%) |
| 45 to 54 Years | 12,766 (77.8%) | 626 (4.9%) |
| 55 to 59 Years | 4,966 (70.9%) | 184 (3.7%) |
| 60 to 64 Years | 3,024 (53.9%) | 91 (3.0%) |
| 65 to 74 Years | 2,020 (22.2%) | 48 (2.4%) |
| 75 Years and over | 378 (5.3%) | 33 (8.7%) |
| Total | 59,488 (63.0%) | 3,272 (5.5%) |
Employment Status by Educational Attainment in Lehigh Acres
According to labor force statistics for Lehigh Acres, 77.5% of individuals (48,093) out of the total population between 25 and 64 years of age (62,056) are in the labor force, with 4.5% or 2,164 of them being unemployed. The group with the highest labor force participation rate are those with the educational attainment of bachelor's degree or higher, with 84.7% or 8,279 individuals in the labor force. Within the labor force, individuals with less than high school education have the highest percentage of unemployment, with 6.0% or 405 of them being unemployed.
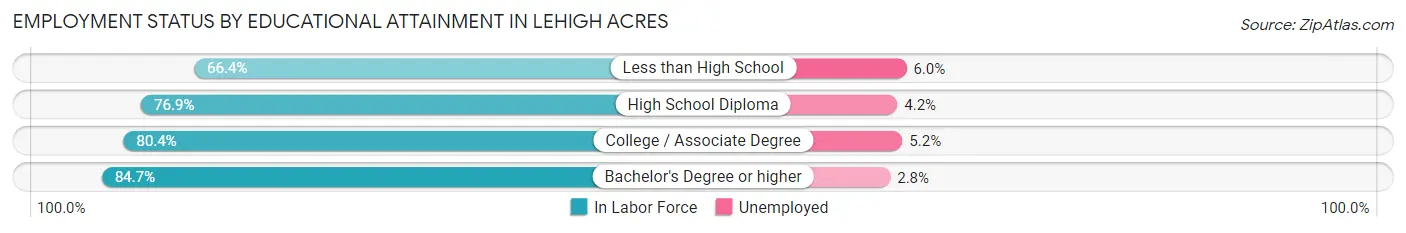
| Educational Attainment | In Labor Force | Unemployed |
| Less than High School | 6,746 (66.4%) | 610 (6.0%) |
| High School Diploma | 17,625 (76.9%) | 963 (4.2%) |
| College / Associate Degree | 15,438 (80.4%) | 999 (5.2%) |
| Bachelor's Degree or higher | 8,279 (84.7%) | 274 (2.8%) |
| Total | 48,093 (77.5%) | 2,793 (4.5%) |
Employment Occupations by Sex in Lehigh Acres
Management, Business, Science and Arts Occupations
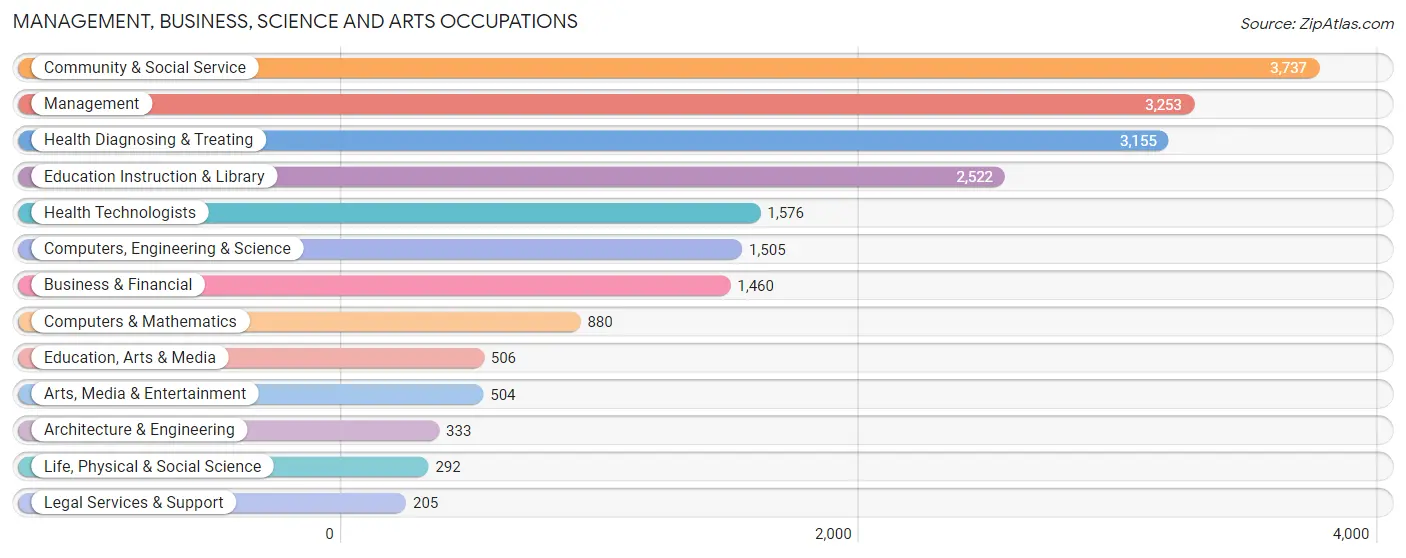
The most common Management, Business, Science and Arts occupations in Lehigh Acres are Community & Social Service (3,737 | 6.7%), Management (3,253 | 5.8%), Health Diagnosing & Treating (3,155 | 5.6%), Education Instruction & Library (2,522 | 4.5%), and Health Technologists (1,576 | 2.8%).
Management, Business, Science and Arts Occupations by Sex
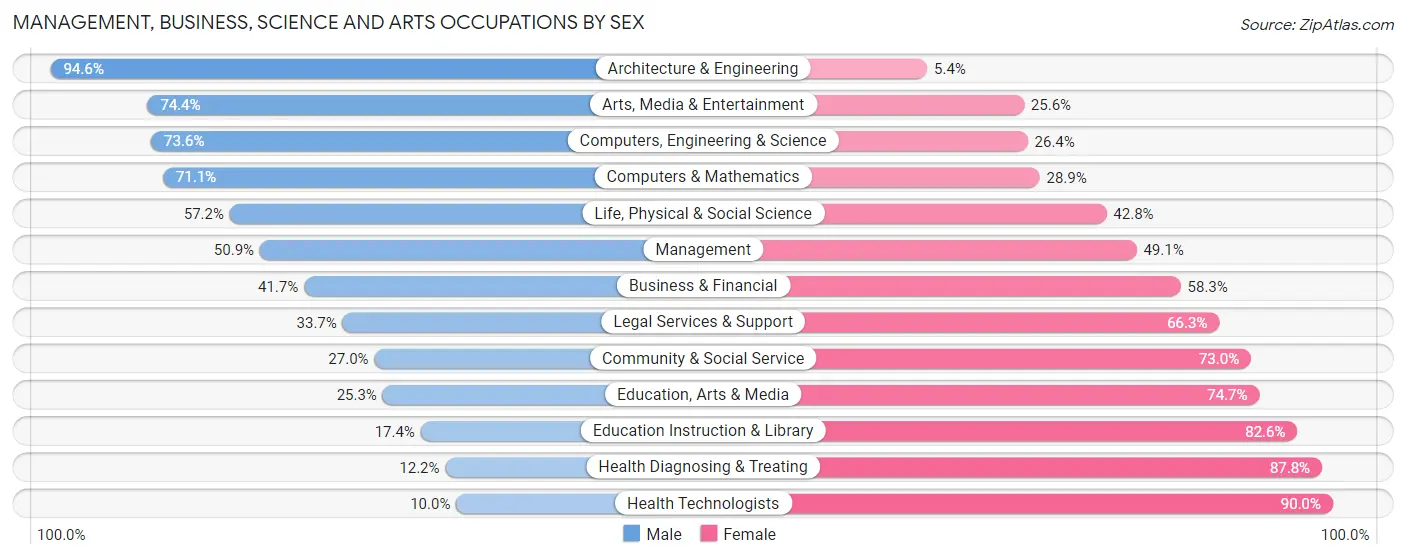
Within the Management, Business, Science and Arts occupations in Lehigh Acres, the most male-oriented occupations are Architecture & Engineering (94.6%), Arts, Media & Entertainment (74.4%), and Computers, Engineering & Science (73.6%), while the most female-oriented occupations are Health Technologists (90.0%), Health Diagnosing & Treating (87.8%), and Education Instruction & Library (82.6%).
| Occupation | Male | Female |
| Management | 1,656 (50.9%) | 1,597 (49.1%) |
| Business & Financial | 609 (41.7%) | 851 (58.3%) |
| Computers, Engineering & Science | 1,108 (73.6%) | 397 (26.4%) |
| Computers & Mathematics | 626 (71.1%) | 254 (28.9%) |
| Architecture & Engineering | 315 (94.6%) | 18 (5.4%) |
| Life, Physical & Social Science | 167 (57.2%) | 125 (42.8%) |
| Community & Social Service | 1,010 (27.0%) | 2,727 (73.0%) |
| Education, Arts & Media | 128 (25.3%) | 378 (74.7%) |
| Legal Services & Support | 69 (33.7%) | 136 (66.3%) |
| Education Instruction & Library | 438 (17.4%) | 2,084 (82.6%) |
| Arts, Media & Entertainment | 375 (74.4%) | 129 (25.6%) |
| Health Diagnosing & Treating | 386 (12.2%) | 2,769 (87.8%) |
| Health Technologists | 157 (10.0%) | 1,419 (90.0%) |
| Total (Category) | 4,769 (36.4%) | 8,341 (63.6%) |
| Total (Overall) | 29,696 (52.8%) | 26,517 (47.2%) |
Services Occupations
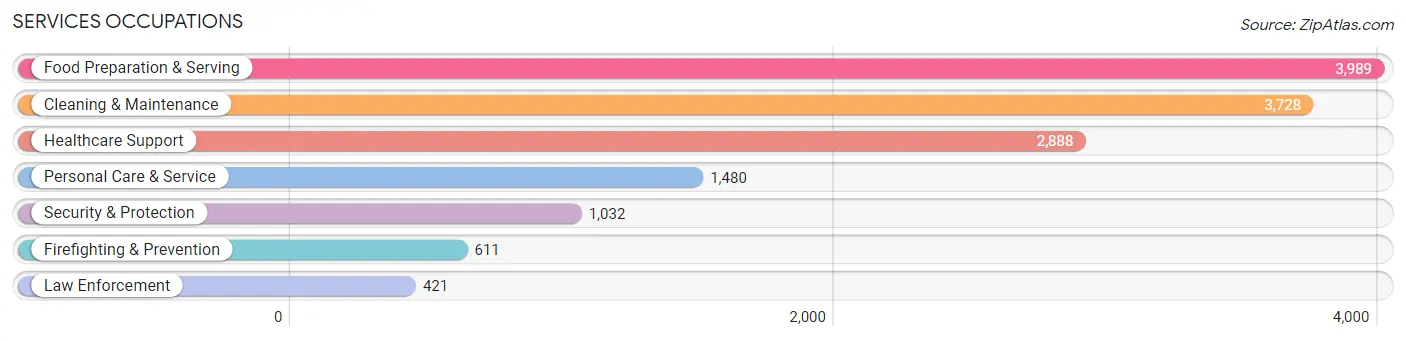
The most common Services occupations in Lehigh Acres are Food Preparation & Serving (3,989 | 7.1%), Cleaning & Maintenance (3,728 | 6.6%), Healthcare Support (2,888 | 5.1%), Personal Care & Service (1,480 | 2.6%), and Security & Protection (1,032 | 1.8%).
Services Occupations by Sex
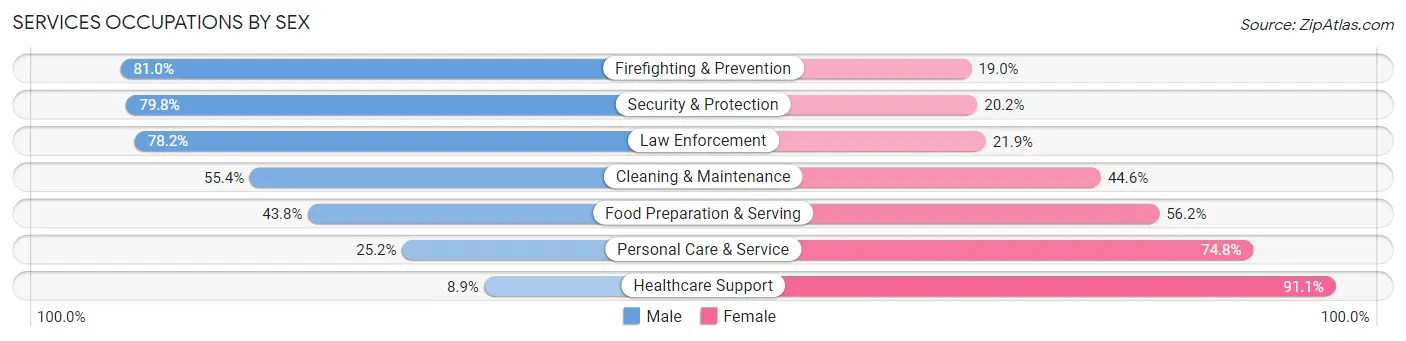
Within the Services occupations in Lehigh Acres, the most male-oriented occupations are Firefighting & Prevention (81.0%), Security & Protection (79.8%), and Law Enforcement (78.1%), while the most female-oriented occupations are Healthcare Support (91.1%), Personal Care & Service (74.8%), and Food Preparation & Serving (56.2%).
| Occupation | Male | Female |
| Healthcare Support | 257 (8.9%) | 2,631 (91.1%) |
| Security & Protection | 824 (79.8%) | 208 (20.2%) |
| Firefighting & Prevention | 495 (81.0%) | 116 (19.0%) |
| Law Enforcement | 329 (78.1%) | 92 (21.8%) |
| Food Preparation & Serving | 1,748 (43.8%) | 2,241 (56.2%) |
| Cleaning & Maintenance | 2,064 (55.4%) | 1,664 (44.6%) |
| Personal Care & Service | 373 (25.2%) | 1,107 (74.8%) |
| Total (Category) | 5,266 (40.2%) | 7,851 (59.9%) |
| Total (Overall) | 29,696 (52.8%) | 26,517 (47.2%) |
Sales and Office Occupations
The most common Sales and Office occupations in Lehigh Acres are Sales & Related (6,508 | 11.6%), and Office & Administration (5,909 | 10.5%).
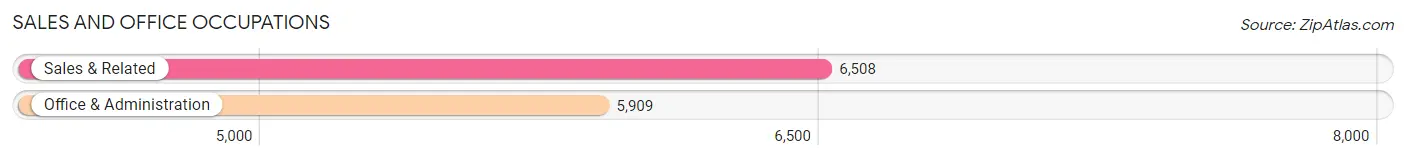
Sales and Office Occupations by Sex
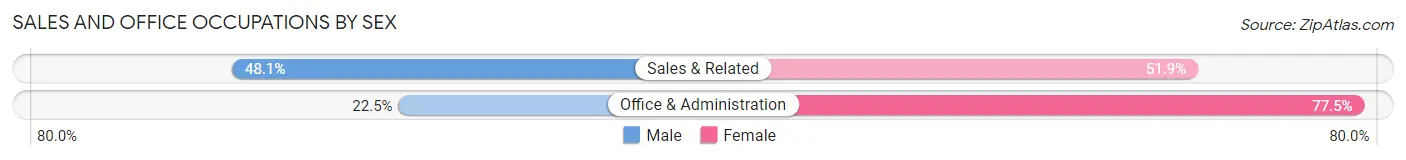
| Occupation | Male | Female |
| Sales & Related | 3,129 (48.1%) | 3,379 (51.9%) |
| Office & Administration | 1,329 (22.5%) | 4,580 (77.5%) |
| Total (Category) | 4,458 (35.9%) | 7,959 (64.1%) |
| Total (Overall) | 29,696 (52.8%) | 26,517 (47.2%) |
Natural Resources, Construction and Maintenance Occupations
The most common Natural Resources, Construction and Maintenance occupations in Lehigh Acres are Construction & Extraction (6,289 | 11.2%), Installation, Maintenance & Repair (2,572 | 4.6%), and Farming, Fishing & Forestry (236 | 0.4%).
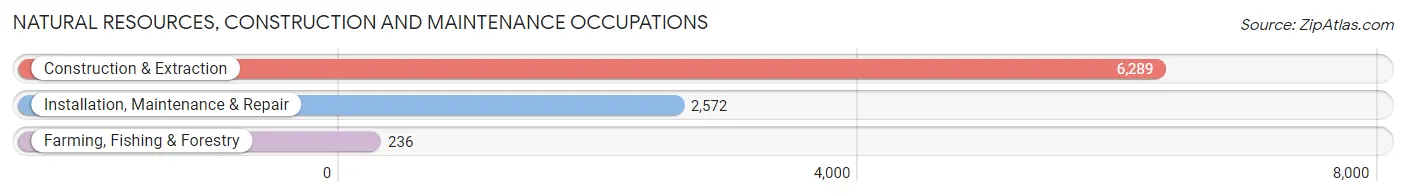
Natural Resources, Construction and Maintenance Occupations by Sex
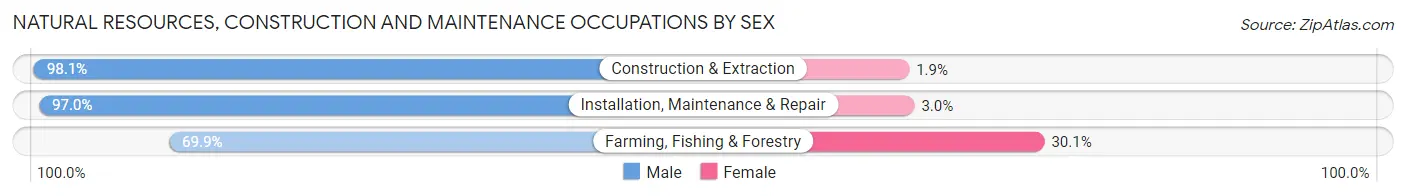
| Occupation | Male | Female |
| Farming, Fishing & Forestry | 165 (69.9%) | 71 (30.1%) |
| Construction & Extraction | 6,167 (98.1%) | 122 (1.9%) |
| Installation, Maintenance & Repair | 2,494 (97.0%) | 78 (3.0%) |
| Total (Category) | 8,826 (97.0%) | 271 (3.0%) |
| Total (Overall) | 29,696 (52.8%) | 26,517 (47.2%) |
Production, Transportation and Moving Occupations
The most common Production, Transportation and Moving occupations in Lehigh Acres are Transportation (4,079 | 7.3%), Material Moving (2,772 | 4.9%), and Production (1,621 | 2.9%).
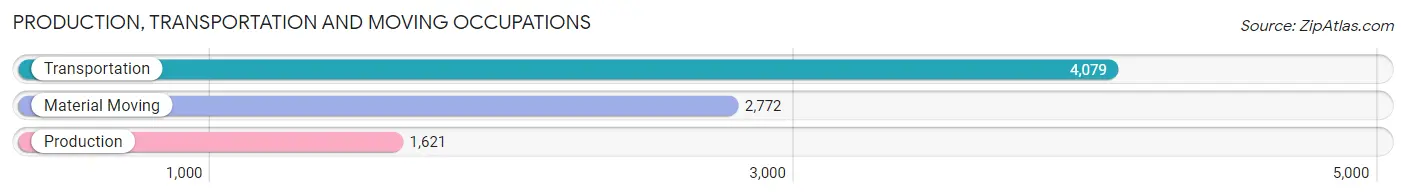
Production, Transportation and Moving Occupations by Sex
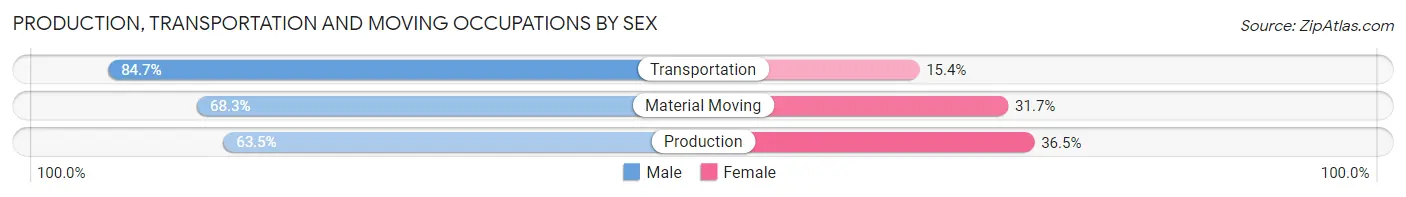
| Occupation | Male | Female |
| Production | 1,030 (63.5%) | 591 (36.5%) |
| Transportation | 3,453 (84.7%) | 626 (15.3%) |
| Material Moving | 1,894 (68.3%) | 878 (31.7%) |
| Total (Category) | 6,377 (75.3%) | 2,095 (24.7%) |
| Total (Overall) | 29,696 (52.8%) | 26,517 (47.2%) |
Employment Industries by Sex in Lehigh Acres
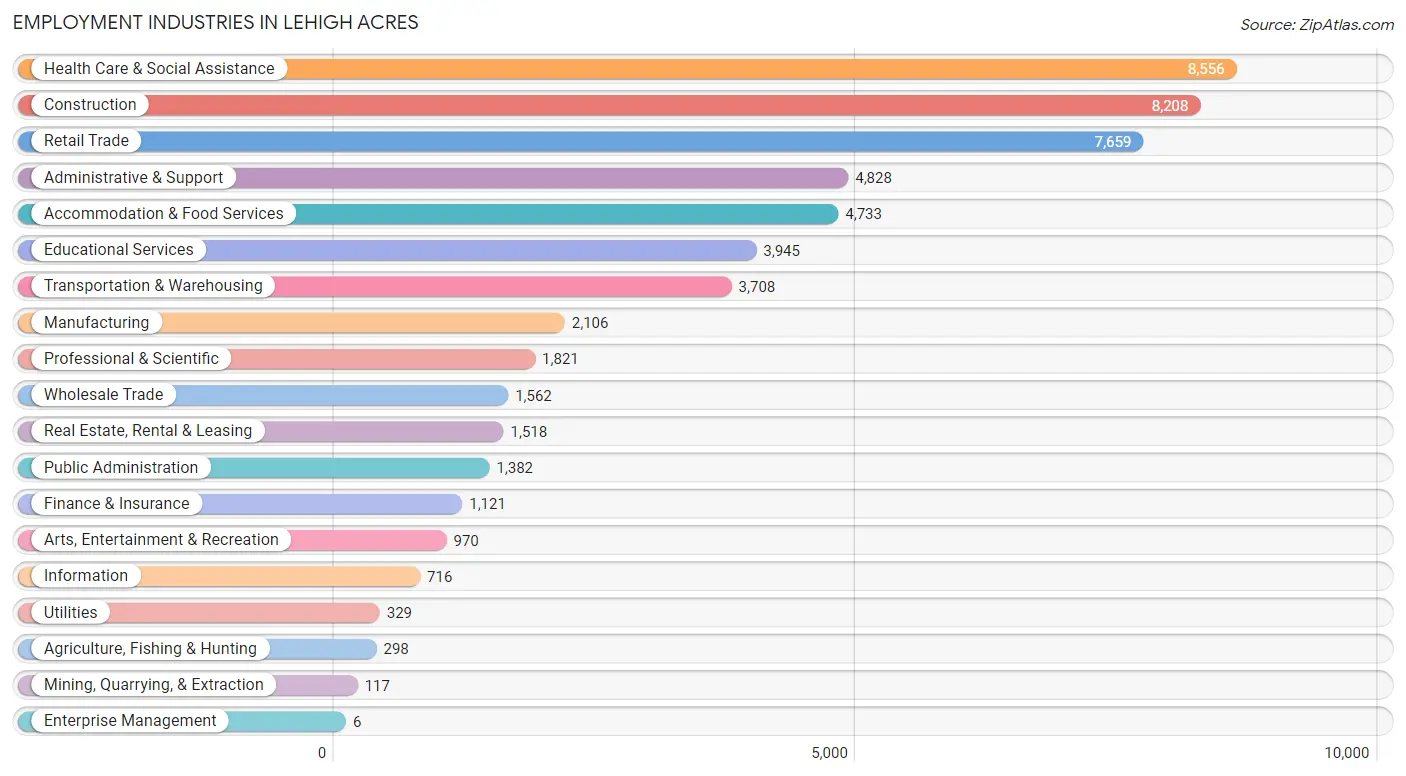
Employment Industries in Lehigh Acres
The major employment industries in Lehigh Acres include Health Care & Social Assistance (8,556 | 15.2%), Construction (8,208 | 14.6%), Retail Trade (7,659 | 13.6%), Administrative & Support (4,828 | 8.6%), and Accommodation & Food Services (4,733 | 8.4%).
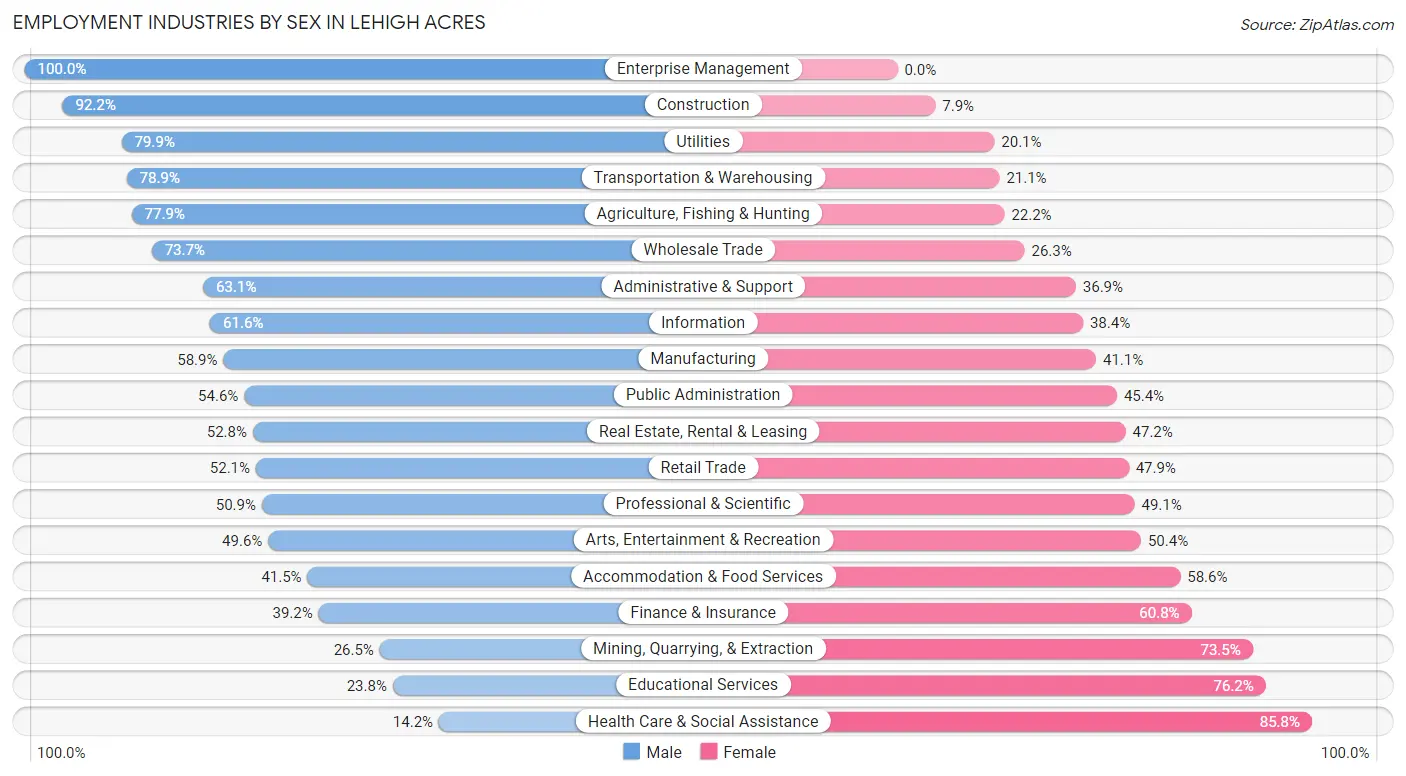
Employment Industries by Sex in Lehigh Acres
The Lehigh Acres industries that see more men than women are Enterprise Management (100.0%), Construction (92.1%), and Utilities (79.9%), whereas the industries that tend to have a higher number of women are Health Care & Social Assistance (85.8%), Educational Services (76.2%), and Mining, Quarrying, & Extraction (73.5%).
| Industry | Male | Female |
| Agriculture, Fishing & Hunting | 232 (77.8%) | 66 (22.2%) |
| Mining, Quarrying, & Extraction | 31 (26.5%) | 86 (73.5%) |
| Construction | 7,564 (92.1%) | 644 (7.9%) |
| Manufacturing | 1,240 (58.9%) | 866 (41.1%) |
| Wholesale Trade | 1,151 (73.7%) | 411 (26.3%) |
| Retail Trade | 3,993 (52.1%) | 3,666 (47.9%) |
| Transportation & Warehousing | 2,925 (78.9%) | 783 (21.1%) |
| Utilities | 263 (79.9%) | 66 (20.1%) |
| Information | 441 (61.6%) | 275 (38.4%) |
| Finance & Insurance | 439 (39.2%) | 682 (60.8%) |
| Real Estate, Rental & Leasing | 801 (52.8%) | 717 (47.2%) |
| Professional & Scientific | 927 (50.9%) | 894 (49.1%) |
| Enterprise Management | 6 (100.0%) | 0 (0.0%) |
| Administrative & Support | 3,045 (63.1%) | 1,783 (36.9%) |
| Educational Services | 939 (23.8%) | 3,006 (76.2%) |
| Health Care & Social Assistance | 1,218 (14.2%) | 7,338 (85.8%) |
| Arts, Entertainment & Recreation | 481 (49.6%) | 489 (50.4%) |
| Accommodation & Food Services | 1,962 (41.4%) | 2,771 (58.6%) |
| Public Administration | 754 (54.6%) | 628 (45.4%) |
| Total | 29,696 (52.8%) | 26,517 (47.2%) |
Education in Lehigh Acres
School Enrollment in Lehigh Acres
The most common levels of schooling among the 34,153 students in Lehigh Acres are high school (8,411 | 24.6%), middle school (8,320 | 24.4%), and elementary school (7,798 | 22.8%).
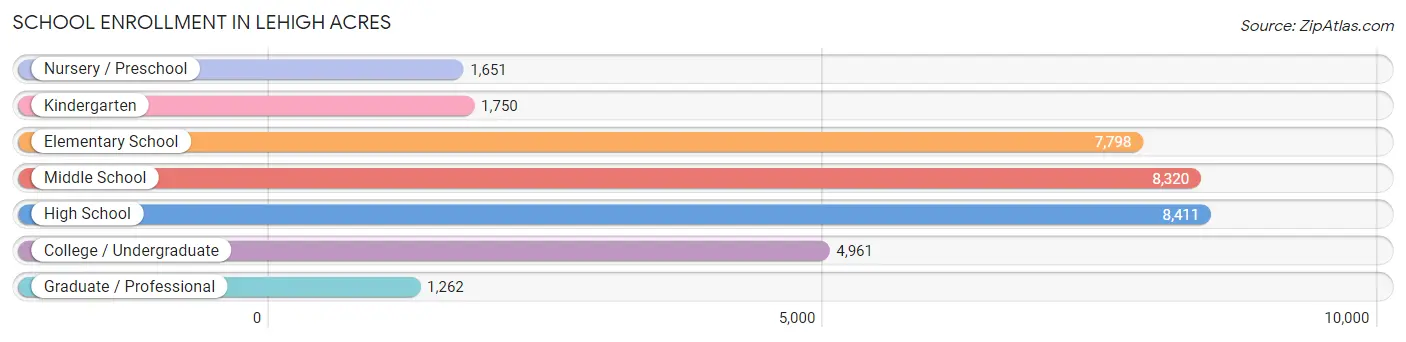
| School Level | # Students | % Students |
| Nursery / Preschool | 1,651 | 4.8% |
| Kindergarten | 1,750 | 5.1% |
| Elementary School | 7,798 | 22.8% |
| Middle School | 8,320 | 24.4% |
| High School | 8,411 | 24.6% |
| College / Undergraduate | 4,961 | 14.5% |
| Graduate / Professional | 1,262 | 3.7% |
| Total | 34,153 | 100.0% |
School Enrollment by Age by Funding Source in Lehigh Acres
Out of a total of 34,153 students who are enrolled in schools in Lehigh Acres, 3,552 (10.4%) attend a private institution, while the remaining 30,601 (89.6%) are enrolled in public schools. The age group of 35 years and over has the highest likelihood of being enrolled in private schools, with 597 (36.5% in the age bracket) enrolled. Conversely, the age group of 15 to 17 year olds has the lowest likelihood of being enrolled in a private school, with 5,619 (97.5% in the age bracket) attending a public institution.
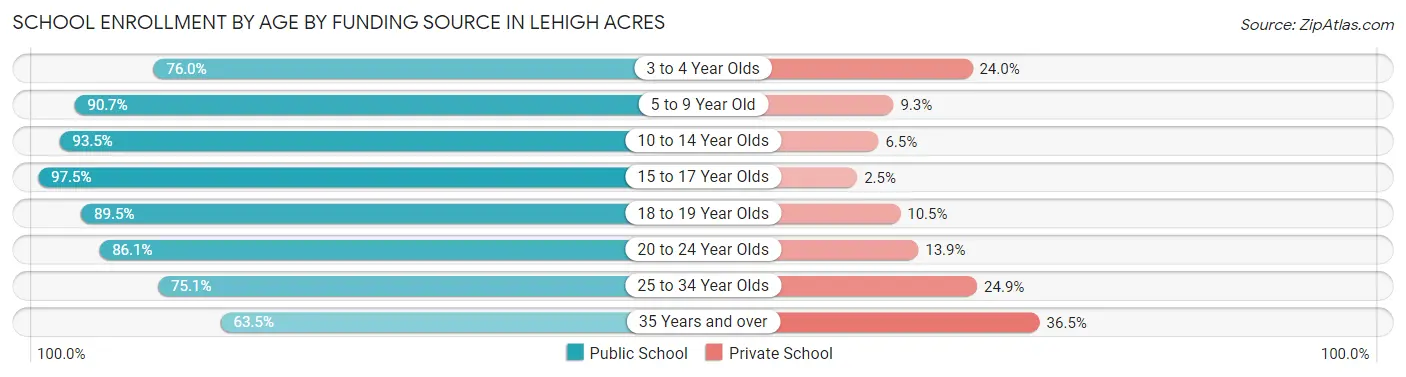
| Age Bracket | Public School | Private School |
| 3 to 4 Year Olds | 1,017 (76.0%) | 321 (24.0%) |
| 5 to 9 Year Old | 7,817 (90.7%) | 799 (9.3%) |
| 10 to 14 Year Olds | 9,713 (93.5%) | 674 (6.5%) |
| 15 to 17 Year Olds | 5,619 (97.5%) | 145 (2.5%) |
| 18 to 19 Year Olds | 1,859 (89.5%) | 219 (10.5%) |
| 20 to 24 Year Olds | 2,150 (86.1%) | 347 (13.9%) |
| 25 to 34 Year Olds | 1,381 (75.1%) | 457 (24.9%) |
| 35 Years and over | 1,038 (63.5%) | 597 (36.5%) |
| Total | 30,601 (89.6%) | 3,552 (10.4%) |
Educational Attainment by Field of Study in Lehigh Acres
Business (2,950 | 22.7%), education (2,227 | 17.1%), science & technology (1,616 | 12.4%), arts & humanities (722 | 5.6%), and engineering (702 | 5.4%) are the most common fields of study among 13,017 individuals in Lehigh Acres who have obtained a bachelor's degree or higher.
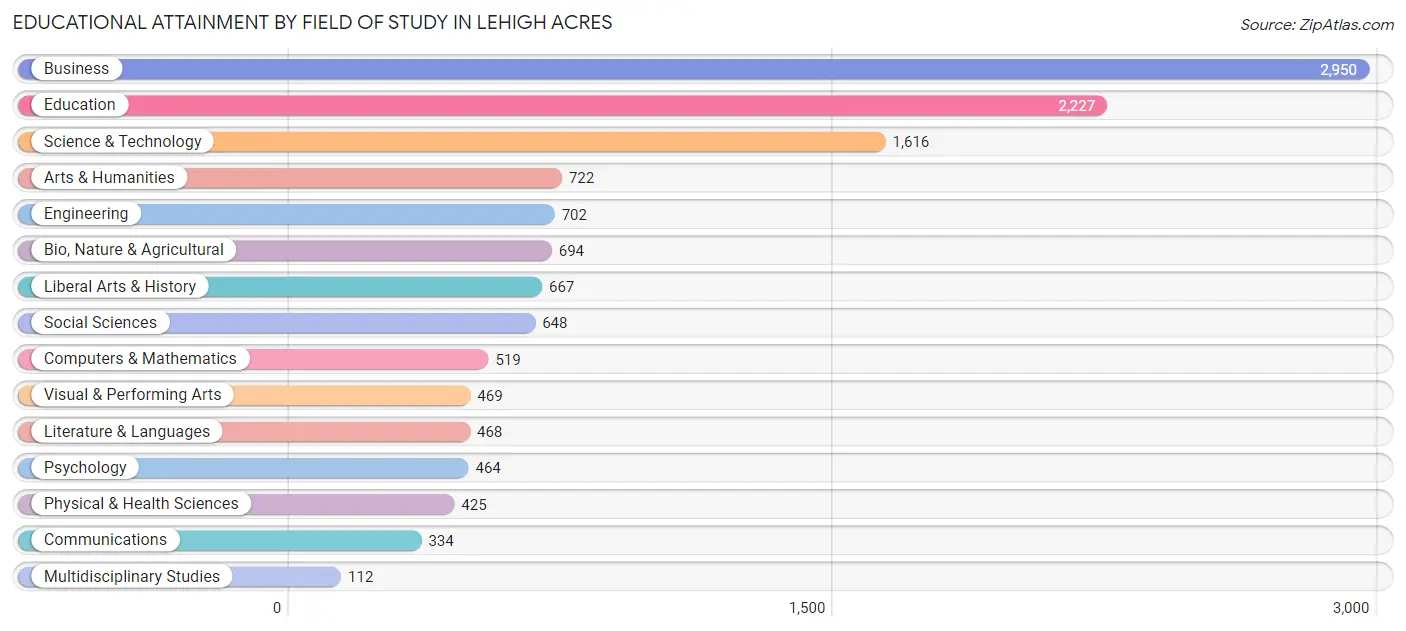
| Field of Study | # Graduates | % Graduates |
| Computers & Mathematics | 519 | 4.0% |
| Bio, Nature & Agricultural | 694 | 5.3% |
| Physical & Health Sciences | 425 | 3.3% |
| Psychology | 464 | 3.6% |
| Social Sciences | 648 | 5.0% |
| Engineering | 702 | 5.4% |
| Multidisciplinary Studies | 112 | 0.9% |
| Science & Technology | 1,616 | 12.4% |
| Business | 2,950 | 22.7% |
| Education | 2,227 | 17.1% |
| Literature & Languages | 468 | 3.6% |
| Liberal Arts & History | 667 | 5.1% |
| Visual & Performing Arts | 469 | 3.6% |
| Communications | 334 | 2.6% |
| Arts & Humanities | 722 | 5.6% |
| Total | 13,017 | 100.0% |
Transportation & Commute in Lehigh Acres
Vehicle Availability by Sex in Lehigh Acres
The most prevalent vehicle ownership categories in Lehigh Acres are males with 2 vehicles (12,751, accounting for 43.9%) and females with 2 vehicles (10,640, making up 49.3%).
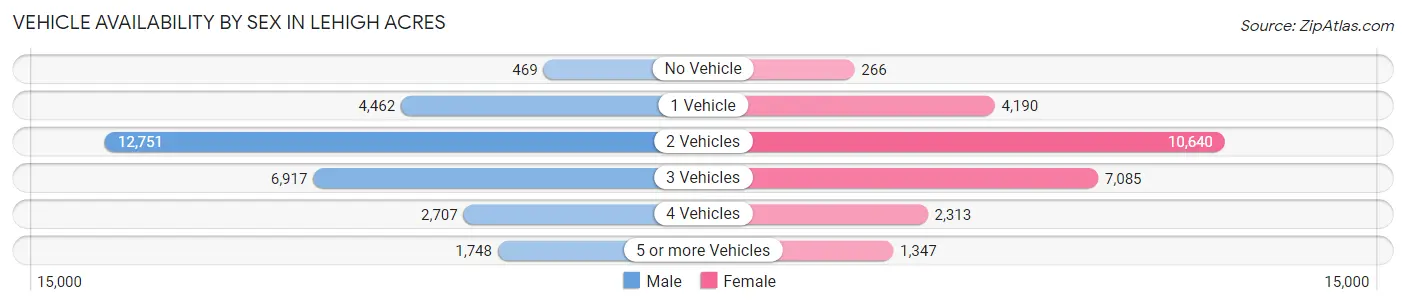
| Vehicles Available | Male | Female |
| No Vehicle | 469 (1.6%) | 266 (1.0%) |
| 1 Vehicle | 4,462 (15.4%) | 4,190 (16.2%) |
| 2 Vehicles | 12,751 (43.9%) | 10,640 (41.2%) |
| 3 Vehicles | 6,917 (23.8%) | 7,085 (27.4%) |
| 4 Vehicles | 2,707 (9.3%) | 2,313 (8.9%) |
| 5 or more Vehicles | 1,748 (6.0%) | 1,347 (5.2%) |
| Total | 29,054 (100.0%) | 25,841 (100.0%) |
Commute Time in Lehigh Acres
The most frequently occuring commute durations in Lehigh Acres are 30 to 34 minutes (10,354 commuters, 20.2%), 45 to 59 minutes (9,091 commuters, 17.7%), and 60 to 89 minutes (6,839 commuters, 13.3%).
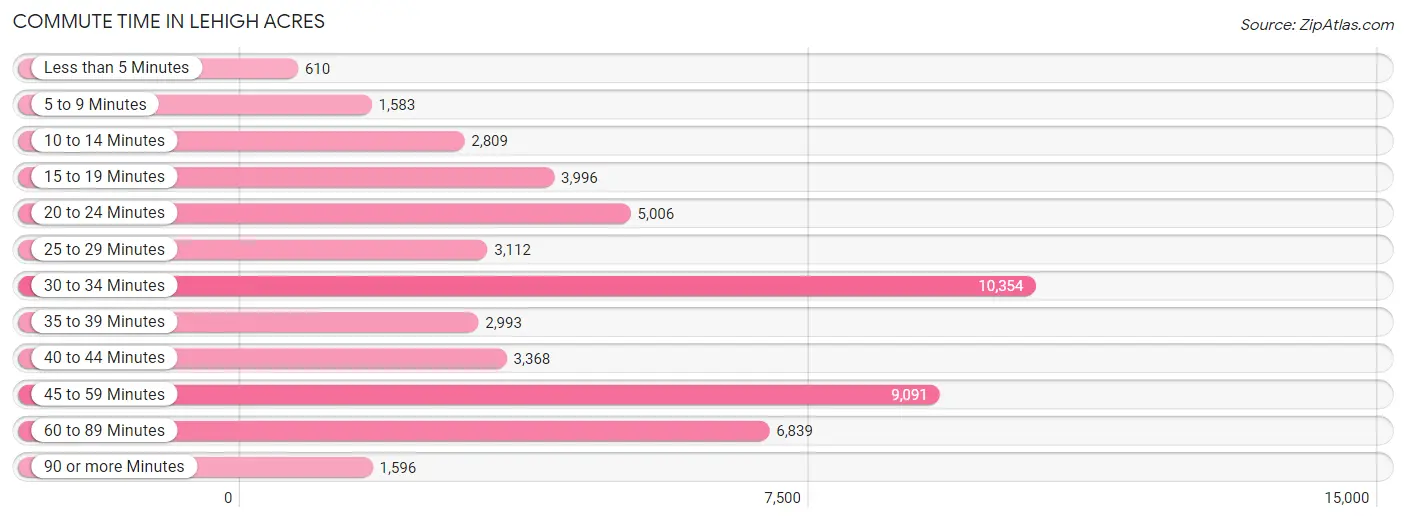
| Commute Time | # Commuters | % Commuters |
| Less than 5 Minutes | 610 | 1.2% |
| 5 to 9 Minutes | 1,583 | 3.1% |
| 10 to 14 Minutes | 2,809 | 5.5% |
| 15 to 19 Minutes | 3,996 | 7.8% |
| 20 to 24 Minutes | 5,006 | 9.8% |
| 25 to 29 Minutes | 3,112 | 6.1% |
| 30 to 34 Minutes | 10,354 | 20.2% |
| 35 to 39 Minutes | 2,993 | 5.8% |
| 40 to 44 Minutes | 3,368 | 6.6% |
| 45 to 59 Minutes | 9,091 | 17.7% |
| 60 to 89 Minutes | 6,839 | 13.3% |
| 90 or more Minutes | 1,596 | 3.1% |
Commute Time by Sex in Lehigh Acres
The most common commute times in Lehigh Acres are 30 to 34 minutes (5,556 commuters, 20.3%) for males and 30 to 34 minutes (4,798 commuters, 20.0%) for females.
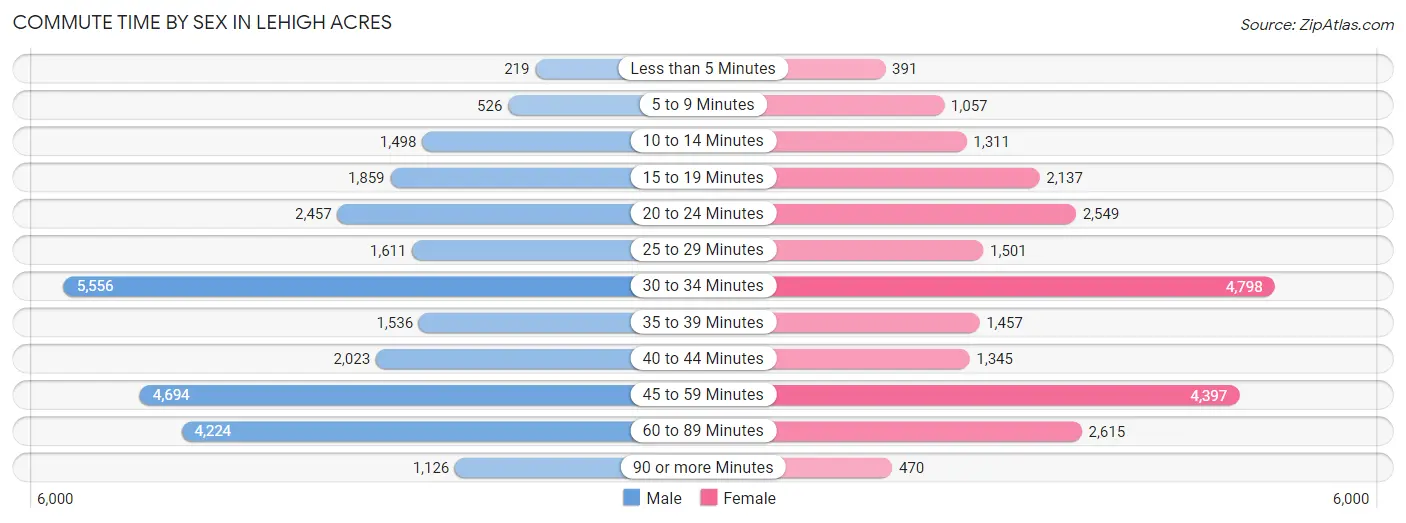
| Commute Time | Male | Female |
| Less than 5 Minutes | 219 (0.8%) | 391 (1.6%) |
| 5 to 9 Minutes | 526 (1.9%) | 1,057 (4.4%) |
| 10 to 14 Minutes | 1,498 (5.5%) | 1,311 (5.5%) |
| 15 to 19 Minutes | 1,859 (6.8%) | 2,137 (8.9%) |
| 20 to 24 Minutes | 2,457 (9.0%) | 2,549 (10.6%) |
| 25 to 29 Minutes | 1,611 (5.9%) | 1,501 (6.2%) |
| 30 to 34 Minutes | 5,556 (20.3%) | 4,798 (20.0%) |
| 35 to 39 Minutes | 1,536 (5.6%) | 1,457 (6.1%) |
| 40 to 44 Minutes | 2,023 (7.4%) | 1,345 (5.6%) |
| 45 to 59 Minutes | 4,694 (17.2%) | 4,397 (18.3%) |
| 60 to 89 Minutes | 4,224 (15.5%) | 2,615 (10.9%) |
| 90 or more Minutes | 1,126 (4.1%) | 470 (2.0%) |
Time of Departure to Work by Sex in Lehigh Acres
The most frequent times of departure to work in Lehigh Acres are 6:00 AM to 6:29 AM (5,053, 18.5%) for males and 7:00 AM to 7:29 AM (3,676, 15.3%) for females.
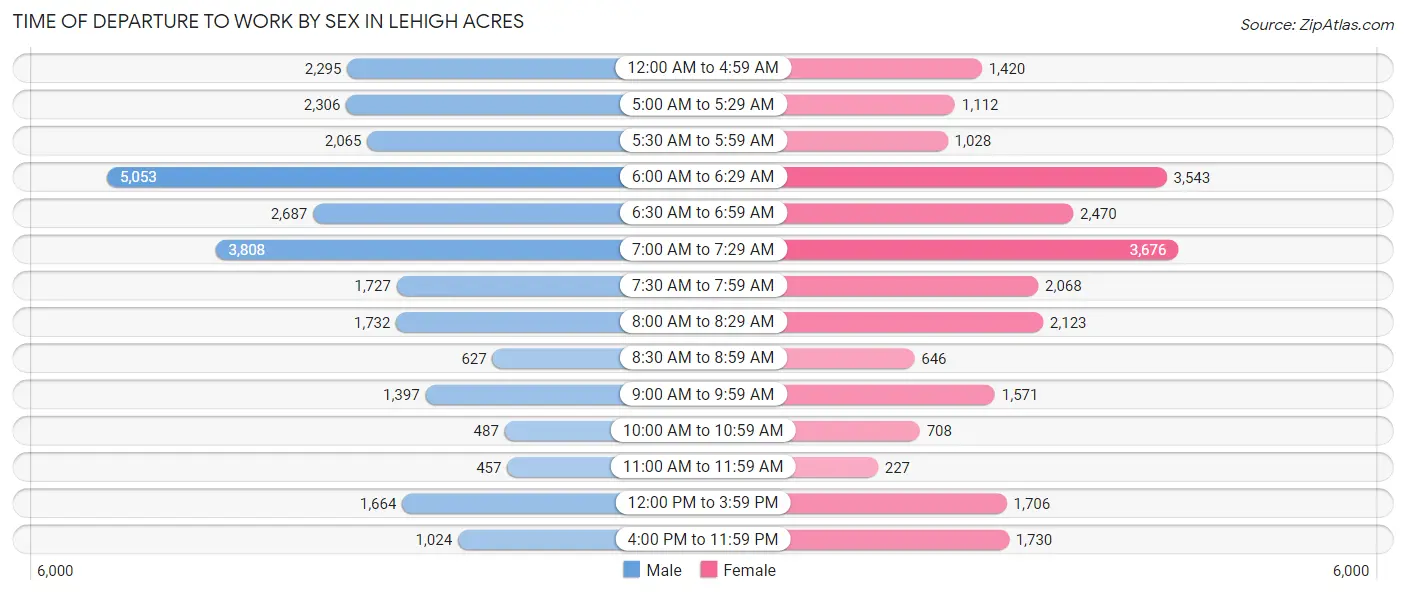
| Time of Departure | Male | Female |
| 12:00 AM to 4:59 AM | 2,295 (8.4%) | 1,420 (5.9%) |
| 5:00 AM to 5:29 AM | 2,306 (8.4%) | 1,112 (4.6%) |
| 5:30 AM to 5:59 AM | 2,065 (7.6%) | 1,028 (4.3%) |
| 6:00 AM to 6:29 AM | 5,053 (18.5%) | 3,543 (14.7%) |
| 6:30 AM to 6:59 AM | 2,687 (9.8%) | 2,470 (10.3%) |
| 7:00 AM to 7:29 AM | 3,808 (13.9%) | 3,676 (15.3%) |
| 7:30 AM to 7:59 AM | 1,727 (6.3%) | 2,068 (8.6%) |
| 8:00 AM to 8:29 AM | 1,732 (6.3%) | 2,123 (8.8%) |
| 8:30 AM to 8:59 AM | 627 (2.3%) | 646 (2.7%) |
| 9:00 AM to 9:59 AM | 1,397 (5.1%) | 1,571 (6.5%) |
| 10:00 AM to 10:59 AM | 487 (1.8%) | 708 (2.9%) |
| 11:00 AM to 11:59 AM | 457 (1.7%) | 227 (0.9%) |
| 12:00 PM to 3:59 PM | 1,664 (6.1%) | 1,706 (7.1%) |
| 4:00 PM to 11:59 PM | 1,024 (3.7%) | 1,730 (7.2%) |
| Total | 27,329 (100.0%) | 24,028 (100.0%) |
Housing Occupancy in Lehigh Acres
Occupancy by Ownership in Lehigh Acres
Of the total 37,538 dwellings in Lehigh Acres, owner-occupied units account for 25,157 (67.0%), while renter-occupied units make up 12,381 (33.0%).
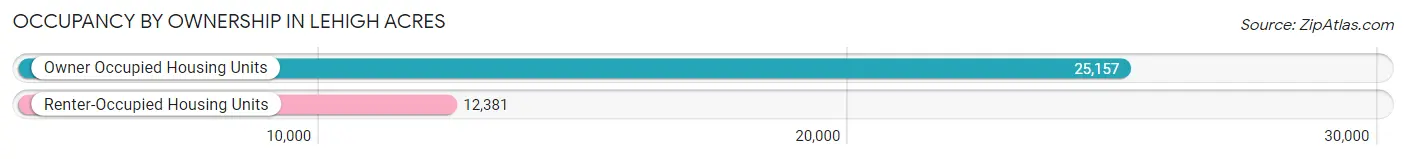
| Occupancy | # Housing Units | % Housing Units |
| Owner Occupied Housing Units | 25,157 | 67.0% |
| Renter-Occupied Housing Units | 12,381 | 33.0% |
| Total Occupied Housing Units | 37,538 | 100.0% |
Occupancy by Household Size in Lehigh Acres
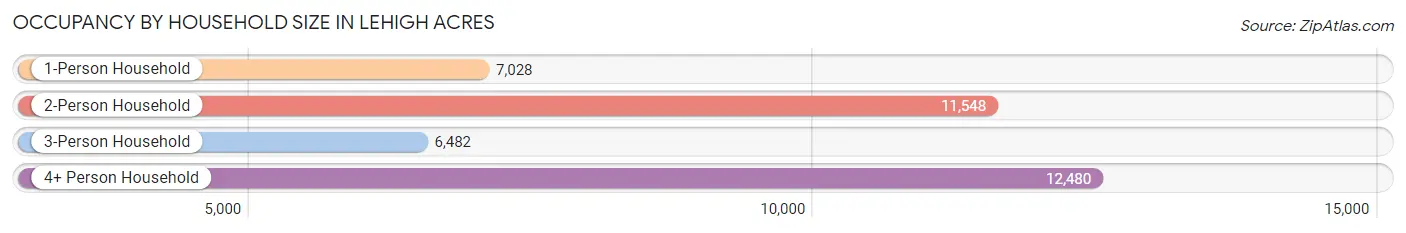
| Household Size | # Housing Units | % Housing Units |
| 1-Person Household | 7,028 | 18.7% |
| 2-Person Household | 11,548 | 30.8% |
| 3-Person Household | 6,482 | 17.3% |
| 4+ Person Household | 12,480 | 33.3% |
| Total Housing Units | 37,538 | 100.0% |
Occupancy by Ownership by Household Size in Lehigh Acres
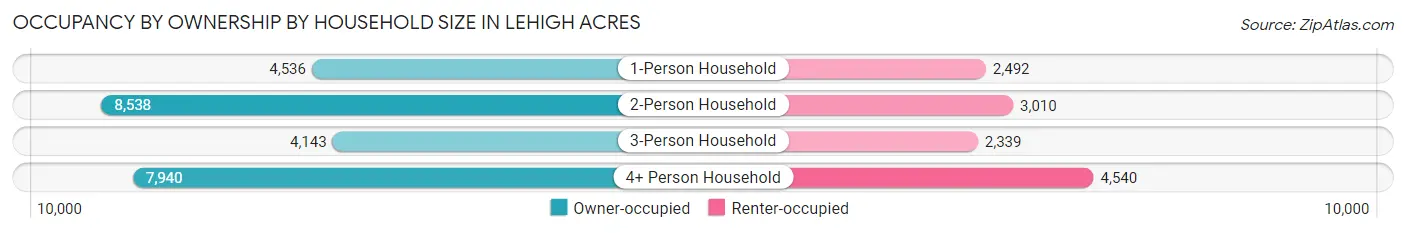
| Household Size | Owner-occupied | Renter-occupied |
| 1-Person Household | 4,536 (64.5%) | 2,492 (35.5%) |
| 2-Person Household | 8,538 (73.9%) | 3,010 (26.1%) |
| 3-Person Household | 4,143 (63.9%) | 2,339 (36.1%) |
| 4+ Person Household | 7,940 (63.6%) | 4,540 (36.4%) |
| Total Housing Units | 25,157 (67.0%) | 12,381 (33.0%) |
Occupancy by Educational Attainment in Lehigh Acres
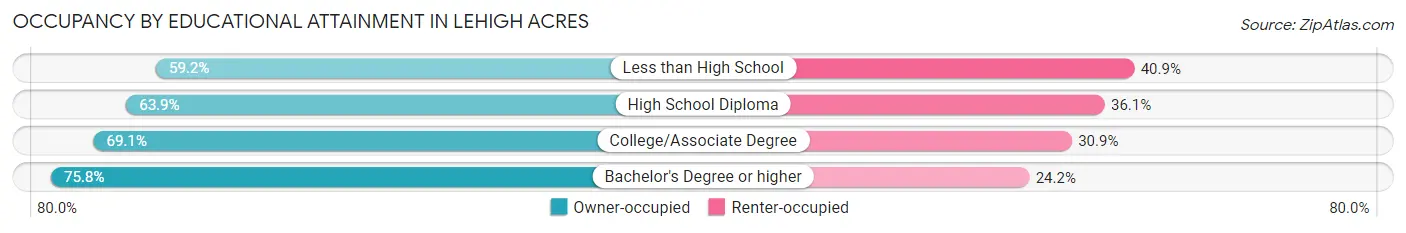
| Household Size | Owner-occupied | Renter-occupied |
| Less than High School | 3,311 (59.2%) | 2,287 (40.8%) |
| High School Diploma | 8,045 (63.9%) | 4,552 (36.1%) |
| College/Associate Degree | 8,829 (69.1%) | 3,955 (30.9%) |
| Bachelor's Degree or higher | 4,972 (75.8%) | 1,587 (24.2%) |
Occupancy by Age of Householder in Lehigh Acres
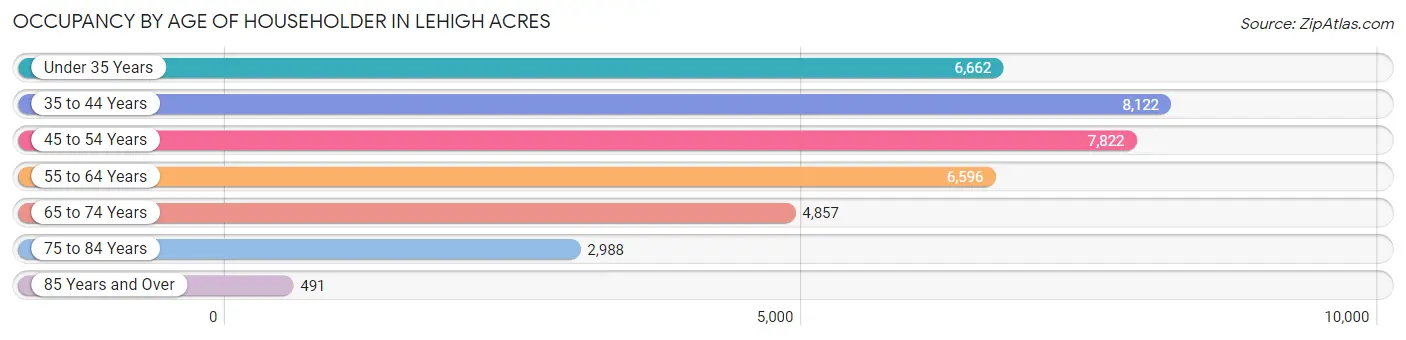
| Age Bracket | # Households | % Households |
| Under 35 Years | 6,662 | 17.7% |
| 35 to 44 Years | 8,122 | 21.6% |
| 45 to 54 Years | 7,822 | 20.8% |
| 55 to 64 Years | 6,596 | 17.6% |
| 65 to 74 Years | 4,857 | 12.9% |
| 75 to 84 Years | 2,988 | 8.0% |
| 85 Years and Over | 491 | 1.3% |
| Total | 37,538 | 100.0% |
Housing Finances in Lehigh Acres
Median Income by Occupancy in Lehigh Acres
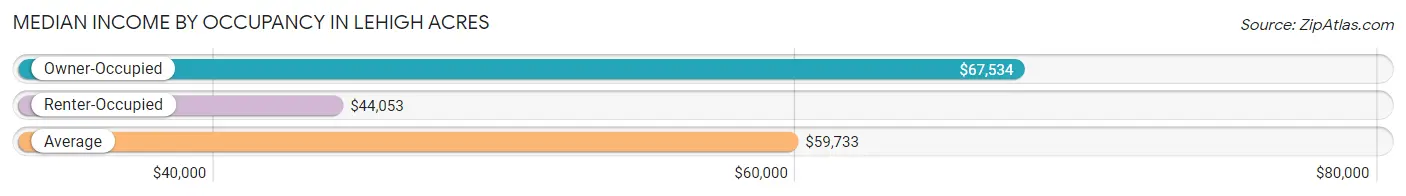
| Occupancy Type | # Households | Median Income |
| Owner-Occupied | 25,157 (67.0%) | $67,534 |
| Renter-Occupied | 12,381 (33.0%) | $44,053 |
| Average | 37,538 (100.0%) | $59,733 |
Occupancy by Householder Income Bracket in Lehigh Acres
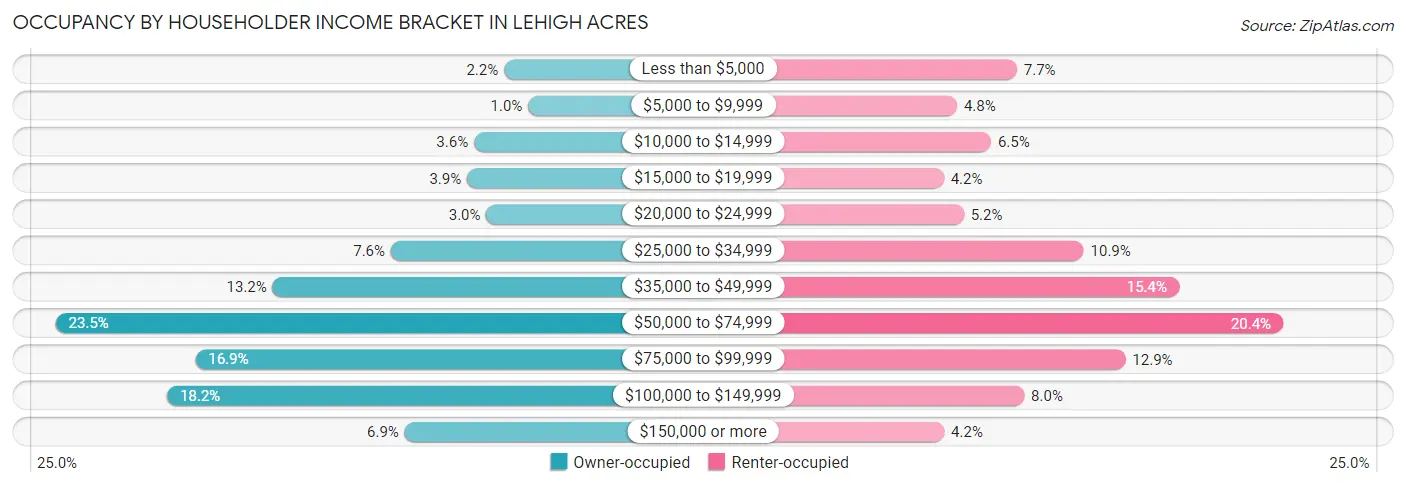
| Income Bracket | Owner-occupied | Renter-occupied |
| Less than $5,000 | 547 (2.2%) | 951 (7.7%) |
| $5,000 to $9,999 | 256 (1.0%) | 598 (4.8%) |
| $10,000 to $14,999 | 906 (3.6%) | 798 (6.5%) |
| $15,000 to $19,999 | 988 (3.9%) | 520 (4.2%) |
| $20,000 to $24,999 | 758 (3.0%) | 638 (5.1%) |
| $25,000 to $34,999 | 1,901 (7.6%) | 1,345 (10.9%) |
| $35,000 to $49,999 | 3,318 (13.2%) | 1,905 (15.4%) |
| $50,000 to $74,999 | 5,919 (23.5%) | 2,519 (20.3%) |
| $75,000 to $99,999 | 4,245 (16.9%) | 1,591 (12.9%) |
| $100,000 to $149,999 | 4,583 (18.2%) | 994 (8.0%) |
| $150,000 or more | 1,736 (6.9%) | 522 (4.2%) |
| Total | 25,157 (100.0%) | 12,381 (100.0%) |
Monthly Housing Cost Tiers in Lehigh Acres
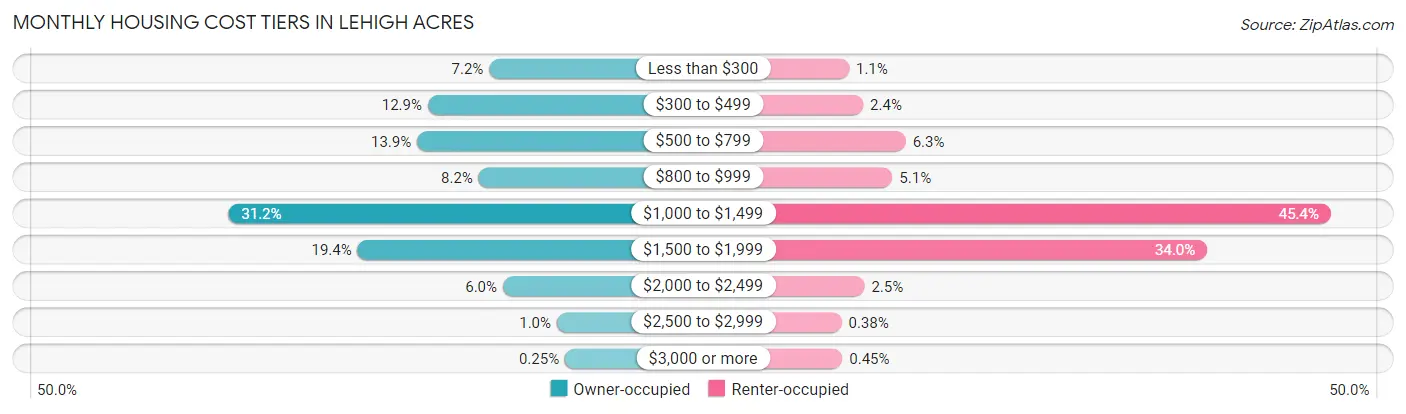
| Monthly Cost | Owner-occupied | Renter-occupied |
| Less than $300 | 1,819 (7.2%) | 133 (1.1%) |
| $300 to $499 | 3,240 (12.9%) | 293 (2.4%) |
| $500 to $799 | 3,490 (13.9%) | 779 (6.3%) |
| $800 to $999 | 2,062 (8.2%) | 626 (5.1%) |
| $1,000 to $1,499 | 7,859 (31.2%) | 5,623 (45.4%) |
| $1,500 to $1,999 | 4,869 (19.4%) | 4,213 (34.0%) |
| $2,000 to $2,499 | 1,503 (6.0%) | 308 (2.5%) |
| $2,500 to $2,999 | 252 (1.0%) | 47 (0.4%) |
| $3,000 or more | 63 (0.3%) | 56 (0.4%) |
| Total | 25,157 (100.0%) | 12,381 (100.0%) |
Physical Housing Characteristics in Lehigh Acres
Housing Structures in Lehigh Acres
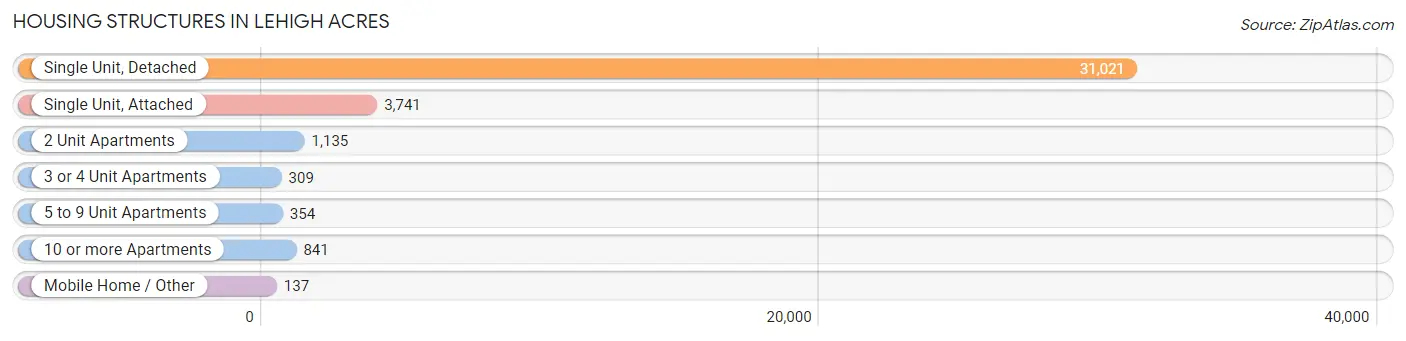
| Structure Type | # Housing Units | % Housing Units |
| Single Unit, Detached | 31,021 | 82.6% |
| Single Unit, Attached | 3,741 | 10.0% |
| 2 Unit Apartments | 1,135 | 3.0% |
| 3 or 4 Unit Apartments | 309 | 0.8% |
| 5 to 9 Unit Apartments | 354 | 0.9% |
| 10 or more Apartments | 841 | 2.2% |
| Mobile Home / Other | 137 | 0.4% |
| Total | 37,538 | 100.0% |
Housing Structures by Occupancy in Lehigh Acres
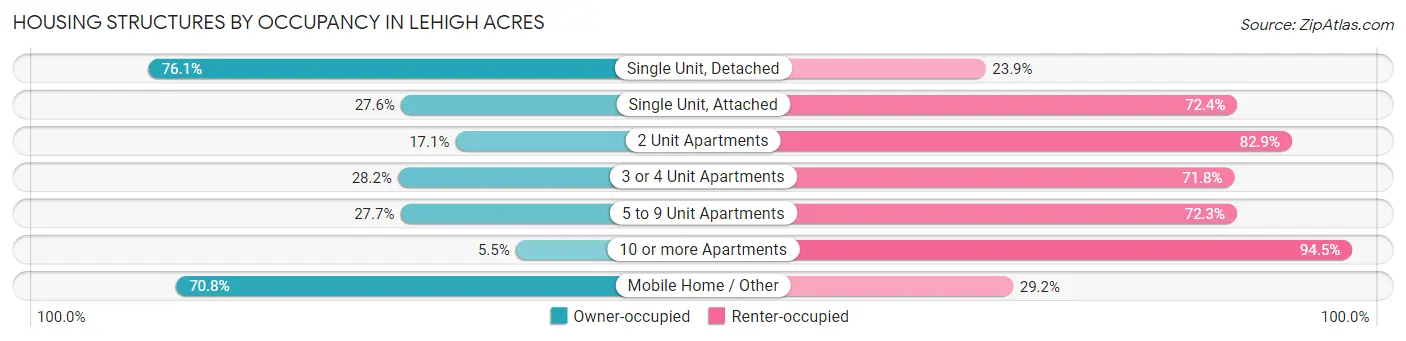
| Structure Type | Owner-occupied | Renter-occupied |
| Single Unit, Detached | 23,603 (76.1%) | 7,418 (23.9%) |
| Single Unit, Attached | 1,032 (27.6%) | 2,709 (72.4%) |
| 2 Unit Apartments | 194 (17.1%) | 941 (82.9%) |
| 3 or 4 Unit Apartments | 87 (28.2%) | 222 (71.8%) |
| 5 to 9 Unit Apartments | 98 (27.7%) | 256 (72.3%) |
| 10 or more Apartments | 46 (5.5%) | 795 (94.5%) |
| Mobile Home / Other | 97 (70.8%) | 40 (29.2%) |
| Total | 25,157 (67.0%) | 12,381 (33.0%) |
Housing Structures by Number of Rooms in Lehigh Acres
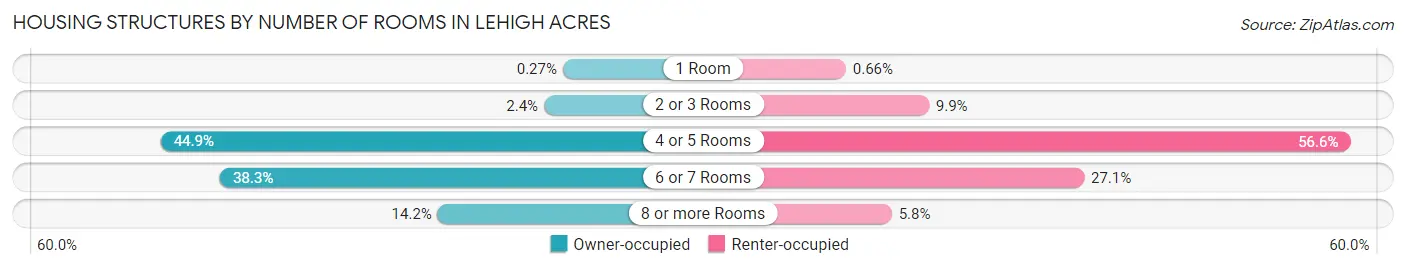
| Number of Rooms | Owner-occupied | Renter-occupied |
| 1 Room | 69 (0.3%) | 82 (0.7%) |
| 2 or 3 Rooms | 594 (2.4%) | 1,222 (9.9%) |
| 4 or 5 Rooms | 11,294 (44.9%) | 7,011 (56.6%) |
| 6 or 7 Rooms | 9,637 (38.3%) | 3,354 (27.1%) |
| 8 or more Rooms | 3,563 (14.2%) | 712 (5.8%) |
| Total | 25,157 (100.0%) | 12,381 (100.0%) |
Housing Structure by Heating Type in Lehigh Acres
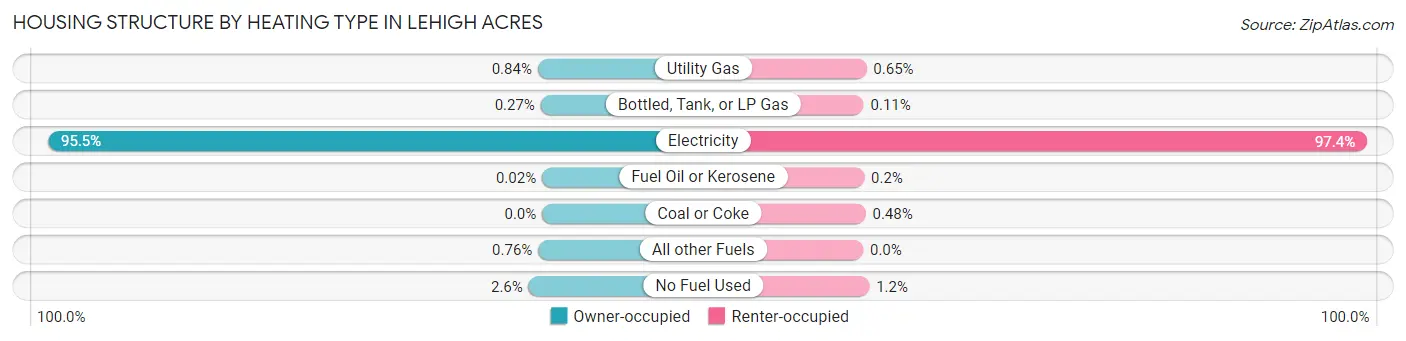
| Heating Type | Owner-occupied | Renter-occupied |
| Utility Gas | 211 (0.8%) | 81 (0.6%) |
| Bottled, Tank, or LP Gas | 67 (0.3%) | 14 (0.1%) |
| Electricity | 24,024 (95.5%) | 12,055 (97.4%) |
| Fuel Oil or Kerosene | 6 (0.0%) | 25 (0.2%) |
| Coal or Coke | 0 (0.0%) | 59 (0.5%) |
| All other Fuels | 192 (0.8%) | 0 (0.0%) |
| No Fuel Used | 657 (2.6%) | 147 (1.2%) |
| Total | 25,157 (100.0%) | 12,381 (100.0%) |
Household Vehicle Usage in Lehigh Acres
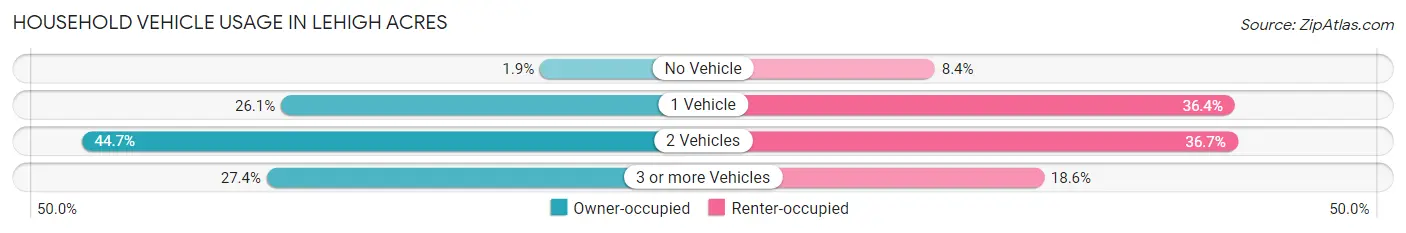
| Vehicles per Household | Owner-occupied | Renter-occupied |
| No Vehicle | 475 (1.9%) | 1,039 (8.4%) |
| 1 Vehicle | 6,555 (26.1%) | 4,505 (36.4%) |
| 2 Vehicles | 11,237 (44.7%) | 4,538 (36.6%) |
| 3 or more Vehicles | 6,890 (27.4%) | 2,299 (18.6%) |
| Total | 25,157 (100.0%) | 12,381 (100.0%) |
Real Estate & Mortgages in Lehigh Acres
Real Estate and Mortgage Overview in Lehigh Acres
| Characteristic | Without Mortgage | With Mortgage |
| Housing Units | 7,530 | 17,627 |
| Median Property Value | $215,800 | $237,900 |
| Median Household Income | $53,353 | $1,301 |
| Monthly Housing Costs | $419 | $63 |
| Real Estate Taxes | $1,475 | $344 |
Property Value by Mortgage Status in Lehigh Acres
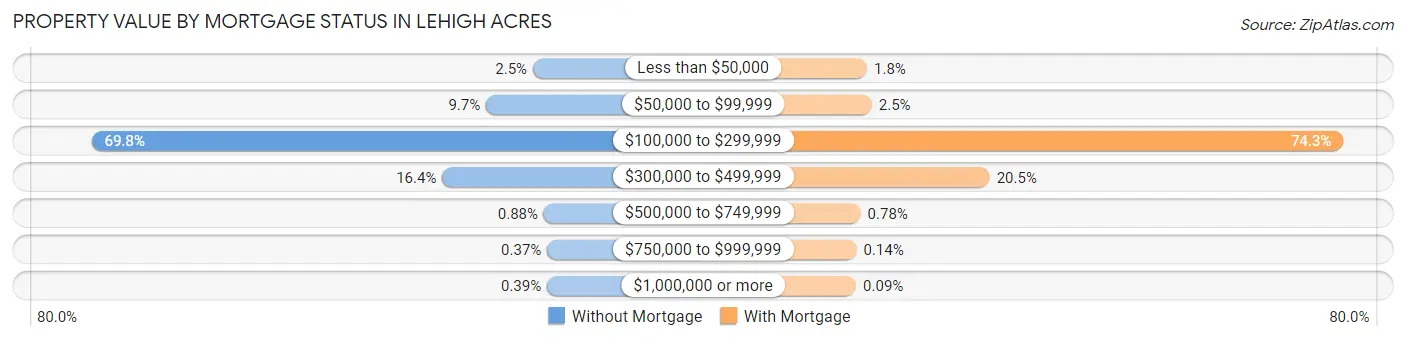
| Property Value | Without Mortgage | With Mortgage |
| Less than $50,000 | 191 (2.5%) | 310 (1.8%) |
| $50,000 to $99,999 | 729 (9.7%) | 438 (2.5%) |
| $100,000 to $299,999 | 5,255 (69.8%) | 13,098 (74.3%) |
| $300,000 to $499,999 | 1,232 (16.4%) | 3,604 (20.4%) |
| $500,000 to $749,999 | 66 (0.9%) | 138 (0.8%) |
| $750,000 to $999,999 | 28 (0.4%) | 24 (0.1%) |
| $1,000,000 or more | 29 (0.4%) | 15 (0.1%) |
| Total | 7,530 (100.0%) | 17,627 (100.0%) |
Household Income by Mortgage Status in Lehigh Acres
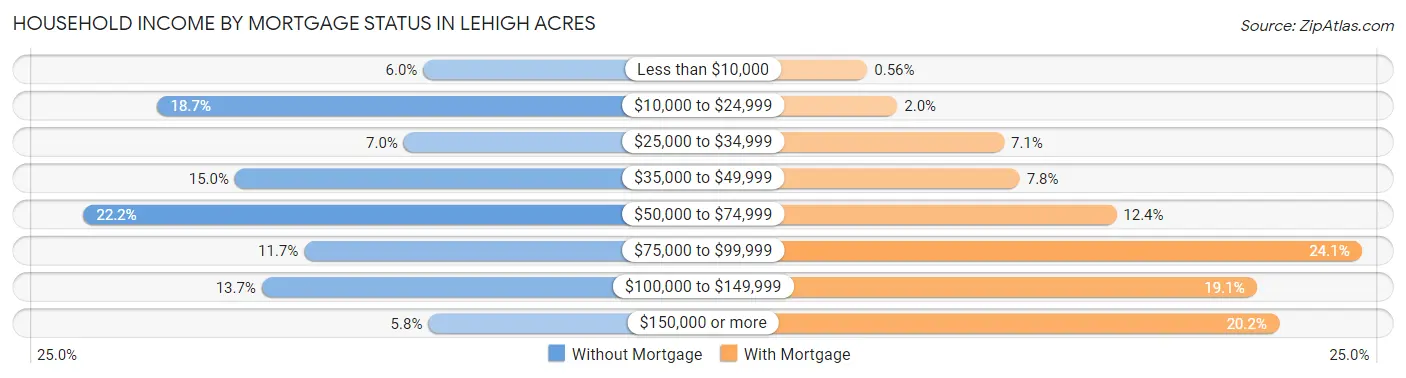
| Household Income | Without Mortgage | With Mortgage |
| Less than $10,000 | 453 (6.0%) | 99 (0.6%) |
| $10,000 to $24,999 | 1,406 (18.7%) | 350 (2.0%) |
| $25,000 to $34,999 | 523 (7.0%) | 1,246 (7.1%) |
| $35,000 to $49,999 | 1,129 (15.0%) | 1,378 (7.8%) |
| $50,000 to $74,999 | 1,672 (22.2%) | 2,189 (12.4%) |
| $75,000 to $99,999 | 880 (11.7%) | 4,247 (24.1%) |
| $100,000 to $149,999 | 1,032 (13.7%) | 3,365 (19.1%) |
| $150,000 or more | 435 (5.8%) | 3,551 (20.2%) |
| Total | 7,530 (100.0%) | 17,627 (100.0%) |
Property Value to Household Income Ratio in Lehigh Acres
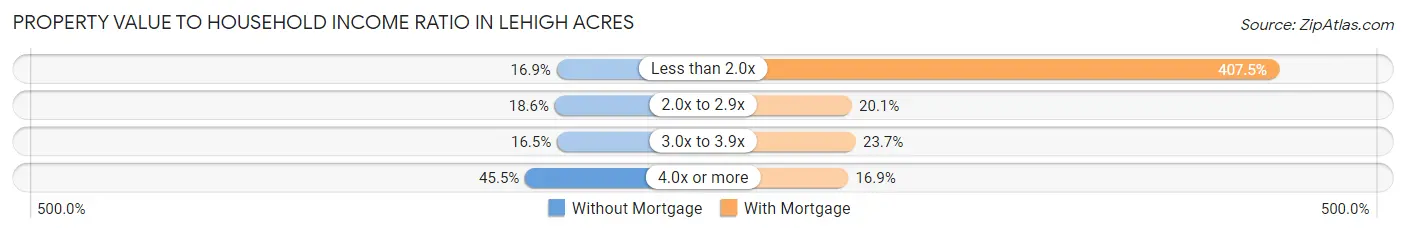
| Value-to-Income Ratio | Without Mortgage | With Mortgage |
| Less than 2.0x | 1,269 (16.9%) | 71,832 (407.5%) |
| 2.0x to 2.9x | 1,397 (18.5%) | 3,550 (20.1%) |
| 3.0x to 3.9x | 1,241 (16.5%) | 4,185 (23.7%) |
| 4.0x or more | 3,425 (45.5%) | 2,973 (16.9%) |
| Total | 7,530 (100.0%) | 17,627 (100.0%) |
Real Estate Taxes by Mortgage Status in Lehigh Acres
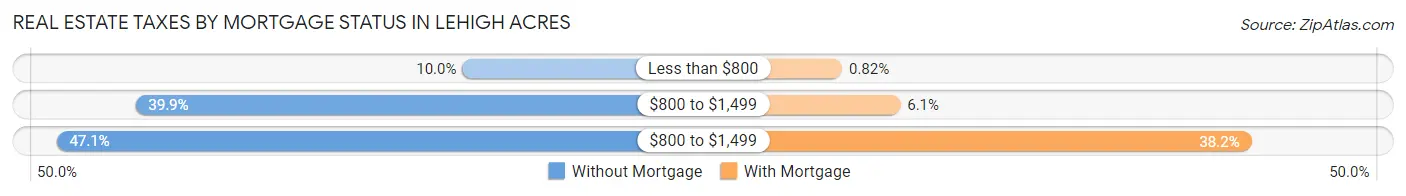
| Property Taxes | Without Mortgage | With Mortgage |
| Less than $800 | 755 (10.0%) | 145 (0.8%) |
| $800 to $1,499 | 3,003 (39.9%) | 1,083 (6.1%) |
| $800 to $1,499 | 3,546 (47.1%) | 6,736 (38.2%) |
| Total | 7,530 (100.0%) | 17,627 (100.0%) |
Health & Disability in Lehigh Acres
Health Insurance Coverage by Age in Lehigh Acres
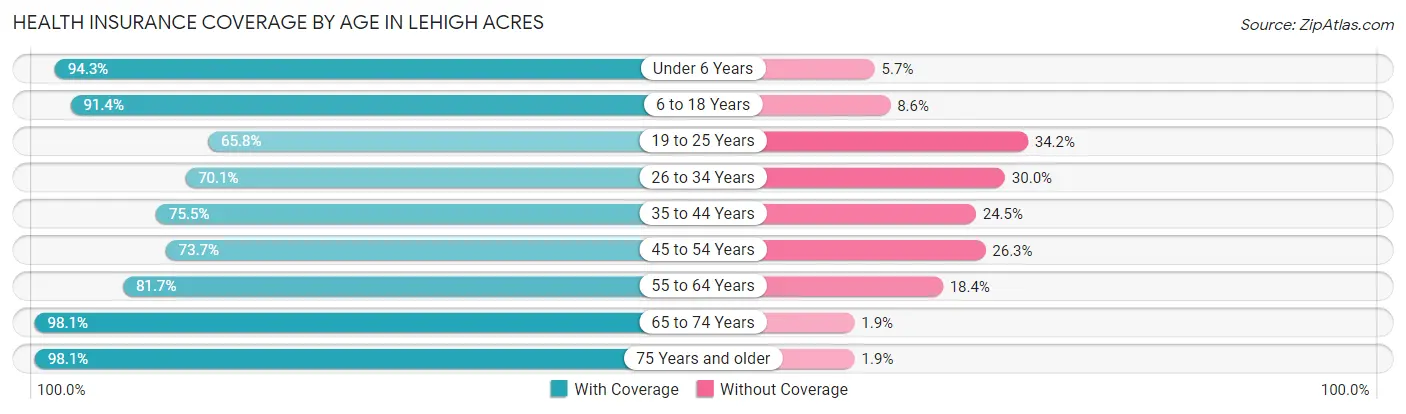
| Age Bracket | With Coverage | Without Coverage |
| Under 6 Years | 9,566 (94.3%) | 574 (5.7%) |
| 6 to 18 Years | 23,385 (91.4%) | 2,189 (8.6%) |
| 19 to 25 Years | 7,895 (65.8%) | 4,108 (34.2%) |
| 26 to 34 Years | 11,091 (70.1%) | 4,743 (29.9%) |
| 35 to 44 Years | 11,784 (75.5%) | 3,831 (24.5%) |
| 45 to 54 Years | 12,079 (73.7%) | 4,313 (26.3%) |
| 55 to 64 Years | 10,289 (81.7%) | 2,312 (18.3%) |
| 65 to 74 Years | 8,917 (98.1%) | 171 (1.9%) |
| 75 Years and older | 6,901 (98.1%) | 136 (1.9%) |
| Total | 101,907 (82.0%) | 22,377 (18.0%) |
Health Insurance Coverage by Citizenship Status in Lehigh Acres
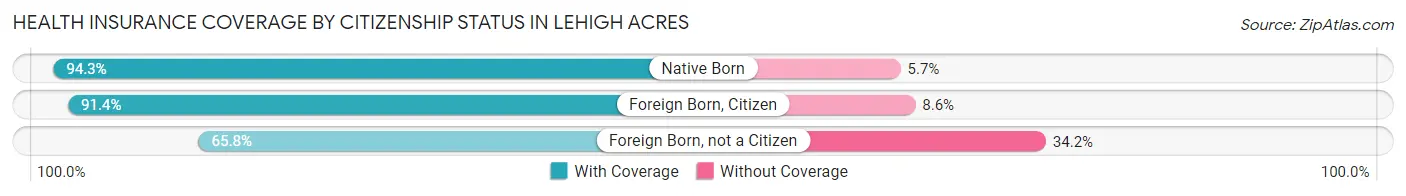
| Citizenship Status | With Coverage | Without Coverage |
| Native Born | 9,566 (94.3%) | 574 (5.7%) |
| Foreign Born, Citizen | 23,385 (91.4%) | 2,189 (8.6%) |
| Foreign Born, not a Citizen | 7,895 (65.8%) | 4,108 (34.2%) |
Health Insurance Coverage by Household Income in Lehigh Acres
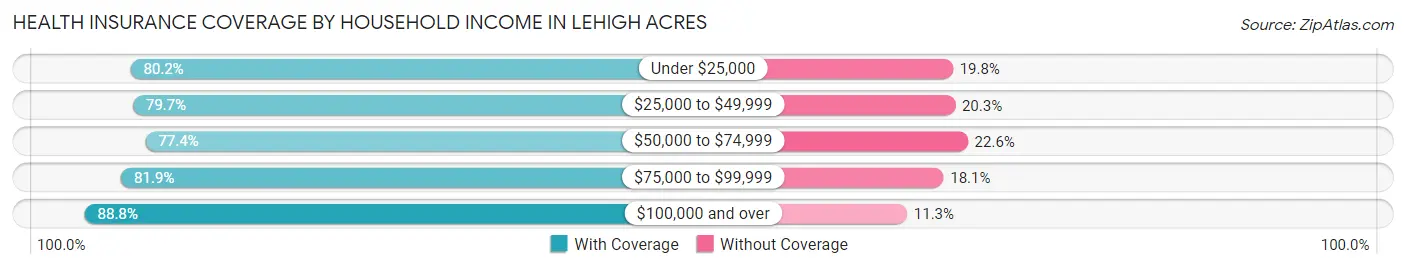
| Household Income | With Coverage | Without Coverage |
| Under $25,000 | 12,621 (80.2%) | 3,124 (19.8%) |
| $25,000 to $49,999 | 20,023 (79.7%) | 5,091 (20.3%) |
| $50,000 to $74,999 | 22,401 (77.4%) | 6,556 (22.6%) |
| $75,000 to $99,999 | 17,842 (81.9%) | 3,938 (18.1%) |
| $100,000 and over | 28,898 (88.7%) | 3,662 (11.3%) |
Public vs Private Health Insurance Coverage by Age in Lehigh Acres
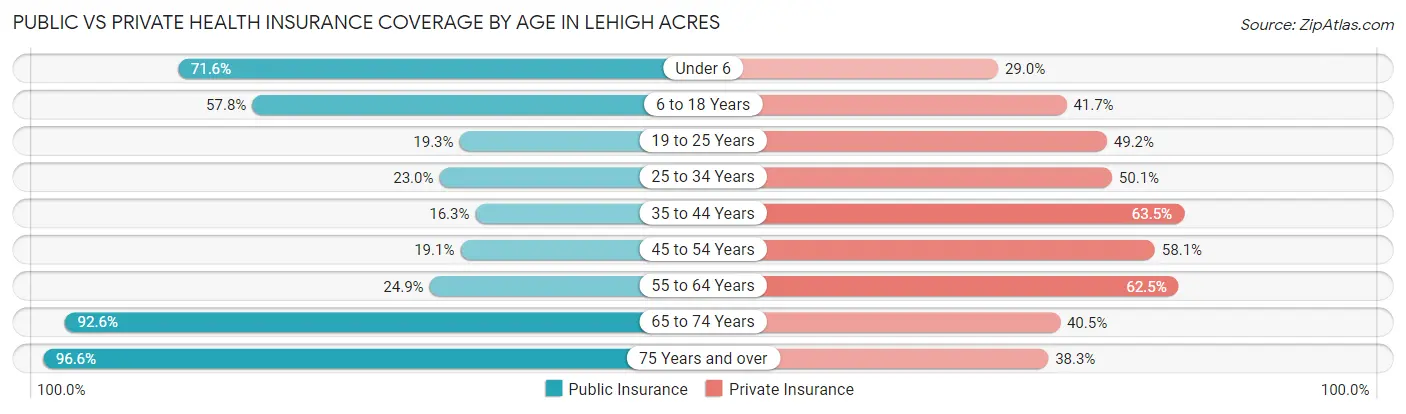
| Age Bracket | Public Insurance | Private Insurance |
| Under 6 | 7,255 (71.6%) | 2,940 (29.0%) |
| 6 to 18 Years | 14,771 (57.8%) | 10,665 (41.7%) |
| 19 to 25 Years | 2,316 (19.3%) | 5,906 (49.2%) |
| 25 to 34 Years | 3,647 (23.0%) | 7,939 (50.1%) |
| 35 to 44 Years | 2,551 (16.3%) | 9,914 (63.5%) |
| 45 to 54 Years | 3,138 (19.1%) | 9,527 (58.1%) |
| 55 to 64 Years | 3,132 (24.9%) | 7,876 (62.5%) |
| 65 to 74 Years | 8,412 (92.6%) | 3,681 (40.5%) |
| 75 Years and over | 6,798 (96.6%) | 2,696 (38.3%) |
| Total | 52,020 (41.9%) | 61,144 (49.2%) |
Disability Status by Sex by Age in Lehigh Acres
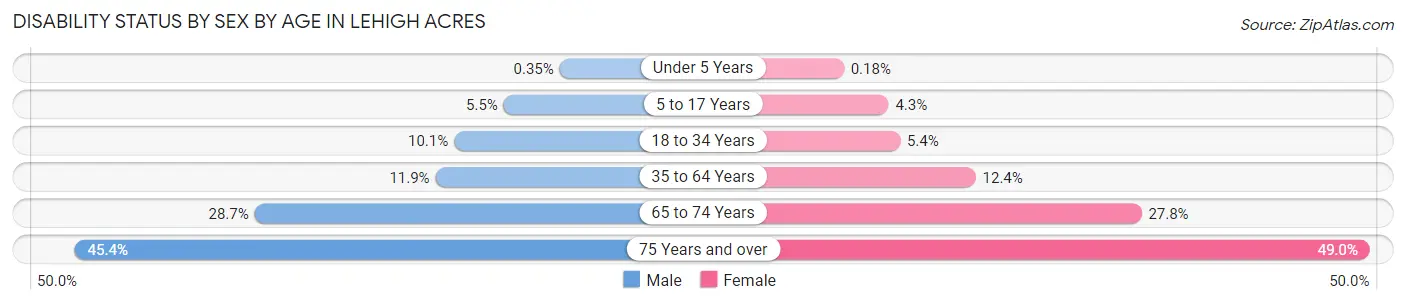
| Age Bracket | Male | Female |
| Under 5 Years | 14 (0.4%) | 8 (0.2%) |
| 5 to 17 Years | 721 (5.5%) | 550 (4.3%) |
| 18 to 34 Years | 1,482 (10.1%) | 800 (5.4%) |
| 35 to 64 Years | 2,600 (11.9%) | 2,820 (12.4%) |
| 65 to 74 Years | 1,165 (28.7%) | 1,397 (27.8%) |
| 75 Years and over | 1,467 (45.4%) | 1,863 (49.0%) |
Disability Class by Sex by Age in Lehigh Acres
Disability Class: Hearing Difficulty
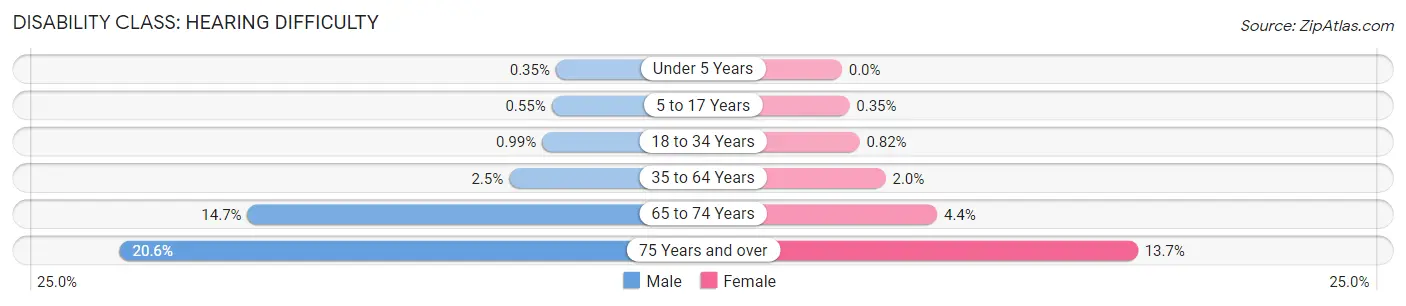
| Age Bracket | Male | Female |
| Under 5 Years | 14 (0.4%) | 0 (0.0%) |
| 5 to 17 Years | 71 (0.5%) | 45 (0.4%) |
| 18 to 34 Years | 145 (1.0%) | 122 (0.8%) |
| 35 to 64 Years | 553 (2.5%) | 460 (2.0%) |
| 65 to 74 Years | 596 (14.7%) | 222 (4.4%) |
| 75 Years and over | 666 (20.6%) | 522 (13.7%) |
Disability Class: Vision Difficulty
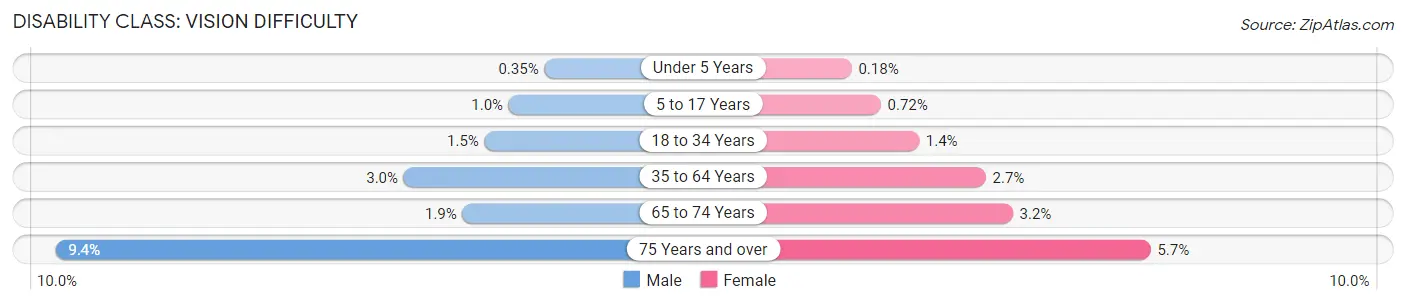
| Age Bracket | Male | Female |
| Under 5 Years | 14 (0.4%) | 8 (0.2%) |
| 5 to 17 Years | 131 (1.0%) | 92 (0.7%) |
| 18 to 34 Years | 213 (1.5%) | 211 (1.4%) |
| 35 to 64 Years | 649 (3.0%) | 607 (2.7%) |
| 65 to 74 Years | 76 (1.9%) | 159 (3.2%) |
| 75 Years and over | 305 (9.4%) | 218 (5.7%) |
Disability Class: Cognitive Difficulty
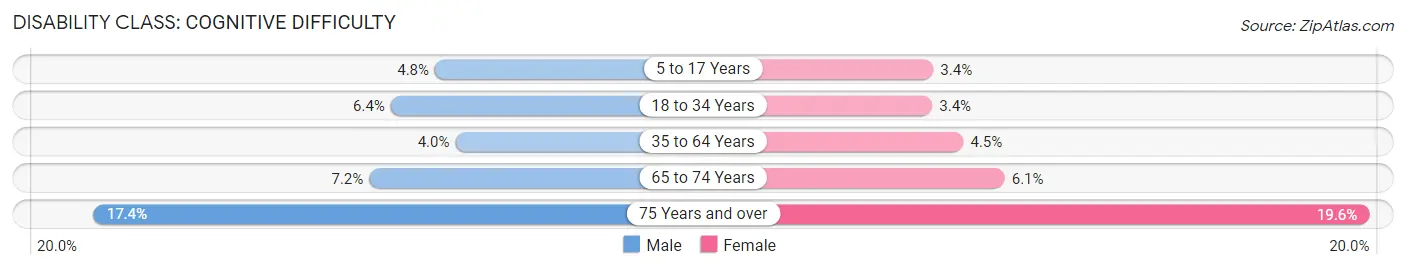
| Age Bracket | Male | Female |
| 5 to 17 Years | 620 (4.8%) | 432 (3.4%) |
| 18 to 34 Years | 938 (6.4%) | 497 (3.4%) |
| 35 to 64 Years | 878 (4.0%) | 1,026 (4.5%) |
| 65 to 74 Years | 293 (7.2%) | 304 (6.0%) |
| 75 Years and over | 564 (17.4%) | 744 (19.6%) |
Disability Class: Ambulatory Difficulty
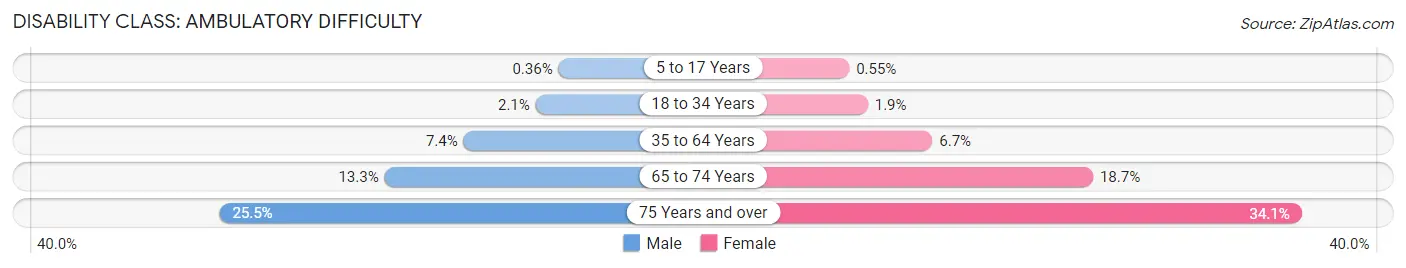
| Age Bracket | Male | Female |
| 5 to 17 Years | 47 (0.4%) | 70 (0.5%) |
| 18 to 34 Years | 301 (2.1%) | 286 (1.9%) |
| 35 to 64 Years | 1,623 (7.4%) | 1,526 (6.7%) |
| 65 to 74 Years | 540 (13.3%) | 937 (18.6%) |
| 75 Years and over | 826 (25.5%) | 1,298 (34.1%) |
Disability Class: Self-Care Difficulty
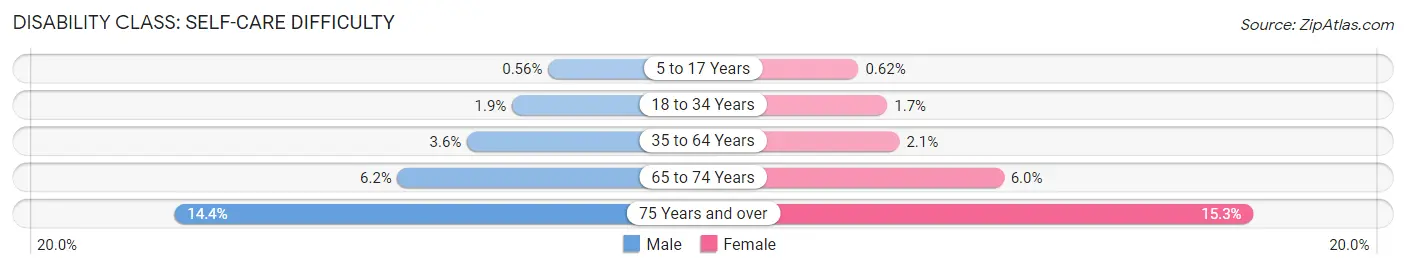
| Age Bracket | Male | Female |
| 5 to 17 Years | 73 (0.6%) | 79 (0.6%) |
| 18 to 34 Years | 278 (1.9%) | 250 (1.7%) |
| 35 to 64 Years | 781 (3.6%) | 487 (2.1%) |
| 65 to 74 Years | 250 (6.1%) | 302 (6.0%) |
| 75 Years and over | 467 (14.4%) | 581 (15.3%) |
Technology Access in Lehigh Acres
Computing Device Access in Lehigh Acres
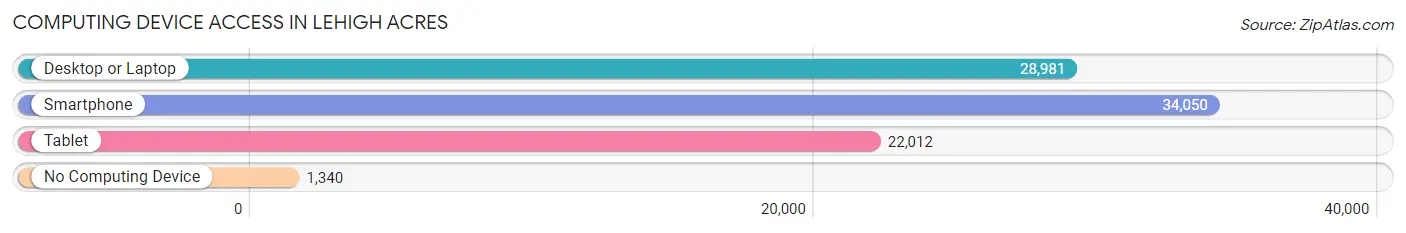
| Device Type | # Households | % Households |
| Desktop or Laptop | 28,981 | 77.2% |
| Smartphone | 34,050 | 90.7% |
| Tablet | 22,012 | 58.6% |
| No Computing Device | 1,340 | 3.6% |
| Total | 37,538 | 100.0% |
Internet Access in Lehigh Acres
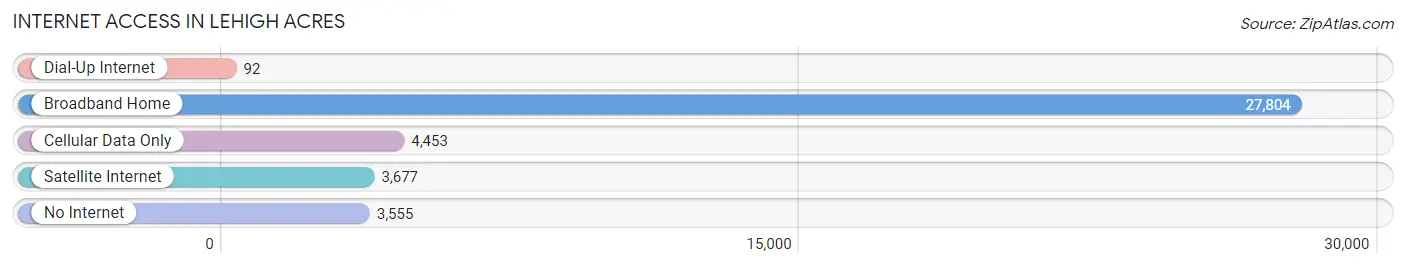
| Internet Type | # Households | % Households |
| Dial-Up Internet | 92 | 0.3% |
| Broadband Home | 27,804 | 74.1% |
| Cellular Data Only | 4,453 | 11.9% |
| Satellite Internet | 3,677 | 9.8% |
| No Internet | 3,555 | 9.5% |
| Total | 37,538 | 100.0% |
Lehigh Acres Summary
Lehigh Acres is a census-designated place (CDP) located in Lee County, Florida, United States. It is part of the Cape Coral-Fort Myers Metropolitan Statistical Area. The population was 31,300 at the 2000 census.
History
Lehigh Acres was founded in the 1950s by Chicago businessman Lee Ratner. Ratner purchased thousands of acres of land in the area and began to develop it as a planned community. He named the area after his hometown of Lehigh, Pennsylvania. Ratner's plan was to create a community of small farms and ranches, but the area quickly developed into a residential community.
Geography
Lehigh Acres is located at 26°37'25" North, 81°37'45" West (26.623750, -81.629167). According to the United States Census Bureau, the CDP has a total area of 33.3 square miles (86.2 km²), of which, 33.2 square miles (86.0 km²) of it is land and 0.1 square miles (0.2 km²) of it (0.30%) is water.
Economy
Lehigh Acres is a largely residential community, with a few small businesses. The main industries in the area are construction, retail, and health care. The area is also home to several golf courses and country clubs.
Demographics
As of the census of 2000, there were 31,300 people, 10,945 households, and 8,717 families residing in the CDP. The population density was 941.2 people per square mile (363.3/km²). There were 11,845 housing units at an average density of 355.7/sq mi (137.4/km²). The racial makeup of the CDP was 79.2% White, 11.2% African American, 0.3% Native American, 0.7% Asian, 0.1% Pacific Islander, 6.2% from other races, and 2.3% from two or more races. Hispanic or Latino of any race were 17.2% of the population.
There were 10,945 households out of which 37.2% had children under the age of 18 living with them, 58.2% were married couples living together, 12.7% had a female householder with no husband present, and 24.2% were non-families. 19.2% of all households were made up of individuals and 8.2% had someone living alone who was 65 years of age or older. The average household size was 2.83 and the average family size was 3.23.
In the CDP, the population was spread out with 27.2% under the age of 18, 8.7% from 18 to 24, 28.2% from 25 to 44, 22.2% from 45 to 64, and 13.7% who were 65 years of age or older. The median age was 36 years. For every 100 females, there were 95.2 males. For every 100 females age 18 and over, there were 91.2 males.
The median income for a household in the CDP was $37,845, and the median income for a family was $41,945. Males had a median income of $30,945 versus $22,857 for females. The per capita income for the CDP was $17,845. About 9.2% of families and 11.2% of the population were below the poverty line, including 15.2% of those under age 18 and 8.2% of those age 65 or over.
Common Questions
What is Per Capita Income in Lehigh Acres?
Per Capita income in Lehigh Acres is $23,079.
What is the Median Family Income in Lehigh Acres?
Median Family Income in Lehigh Acres is $63,680.
What is the Median Household income in Lehigh Acres?
Median Household Income in Lehigh Acres is $59,733.
What is Income or Wage Gap in Lehigh Acres?
Income or Wage Gap in Lehigh Acres is 29.0%.
Women in Lehigh Acres earn 71.0 cents for every dollar earned by a man.
What is Family Income Deficit in Lehigh Acres?
Family Income Deficit in Lehigh Acres is $11,359.
Families that are below poverty line in Lehigh Acres earn $11,359 less on average than the poverty threshold level.
What is Inequality or Gini Index in Lehigh Acres?
Inequality or Gini Index in Lehigh Acres is 0.40.
What is the Total Population of Lehigh Acres?
Total Population of Lehigh Acres is 124,440.
What is the Total Male Population of Lehigh Acres?
Total Male Population of Lehigh Acres is 60,895.
What is the Total Female Population of Lehigh Acres?
Total Female Population of Lehigh Acres is 63,545.
What is the Ratio of Males per 100 Females in Lehigh Acres?
There are 95.83 Males per 100 Females in Lehigh Acres.
What is the Ratio of Females per 100 Males in Lehigh Acres?
There are 104.35 Females per 100 Males in Lehigh Acres.
What is the Median Population Age in Lehigh Acres?
Median Population Age in Lehigh Acres is 34.3 Years.
What is the Average Family Size in Lehigh Acres
Average Family Size in Lehigh Acres is 3.8 People.
What is the Average Household Size in Lehigh Acres
Average Household Size in Lehigh Acres is 3.3 People.
How Large is the Labor Force in Lehigh Acres?
There are 59,488 People in the Labor Forcein in Lehigh Acres.
What is the Percentage of People in the Labor Force in Lehigh Acres?
63.0% of People are in the Labor Force in Lehigh Acres.
What is the Unemployment Rate in Lehigh Acres?
Unemployment Rate in Lehigh Acres is 5.5%.