Golden Glades, FL Map & Demographics
Golden Glades Map
Golden Glades Overview
$23,587
PER CAPITA INCOME
$58,402
AVG FAMILY INCOME
$51,075
AVG HOUSEHOLD INCOME
12.1%
WAGE / INCOME GAP [ % ]
87.9¢/ $1
WAGE / INCOME GAP [ $ ]
0.47
INEQUALITY / GINI INDEX
34,725
TOTAL POPULATION
17,437
MALE POPULATION
17,288
FEMALE POPULATION
100.86
MALES / 100 FEMALES
99.15
FEMALES / 100 MALES
38.2
MEDIAN AGE
3.7
AVG FAMILY SIZE
3.1
AVG HOUSEHOLD SIZE
16,954
LABOR FORCE [ PEOPLE ]
62.0%
PERCENT IN LABOR FORCE
8.2%
UNEMPLOYMENT RATE
Income in Golden Glades
Income Overview in Golden Glades
Per Capita Income in Golden Glades is $23,587, while median incomes of families and households are $58,402 and $51,075 respectively.
| Characteristic | Number | Measure |
| Per Capita Income | 34,725 | $23,587 |
| Median Family Income | 7,913 | $58,402 |
| Mean Family Income | 7,913 | $77,060 |
| Median Household Income | 10,979 | $51,075 |
| Mean Household Income | 10,979 | $69,088 |
| Income Deficit | 7,913 | $0 |
| Wage / Income Gap (%) | 34,725 | 12.09% |
| Wage / Income Gap ($) | 34,725 | 87.91¢ per $1 |
| Gini / Inequality Index | 34,725 | 0.47 |
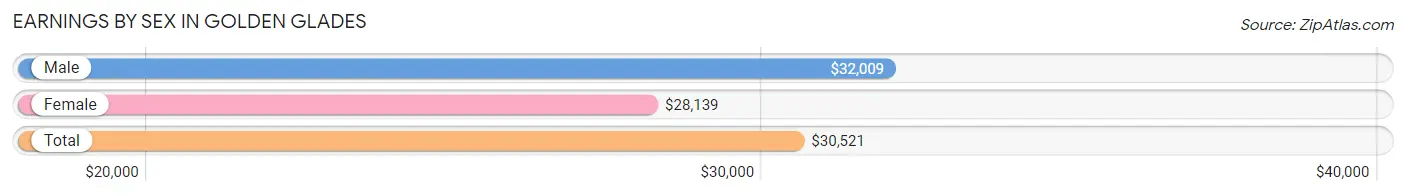
Earnings by Sex in Golden Glades
Average Earnings in Golden Glades are $30,521, $32,009 for men and $28,139 for women, a difference of 12.1%.
| Sex | Number | Average Earnings |
| Male | 9,268 (55.1%) | $32,009 |
| Female | 7,541 (44.9%) | $28,139 |
| Total | 16,809 (100.0%) | $30,521 |
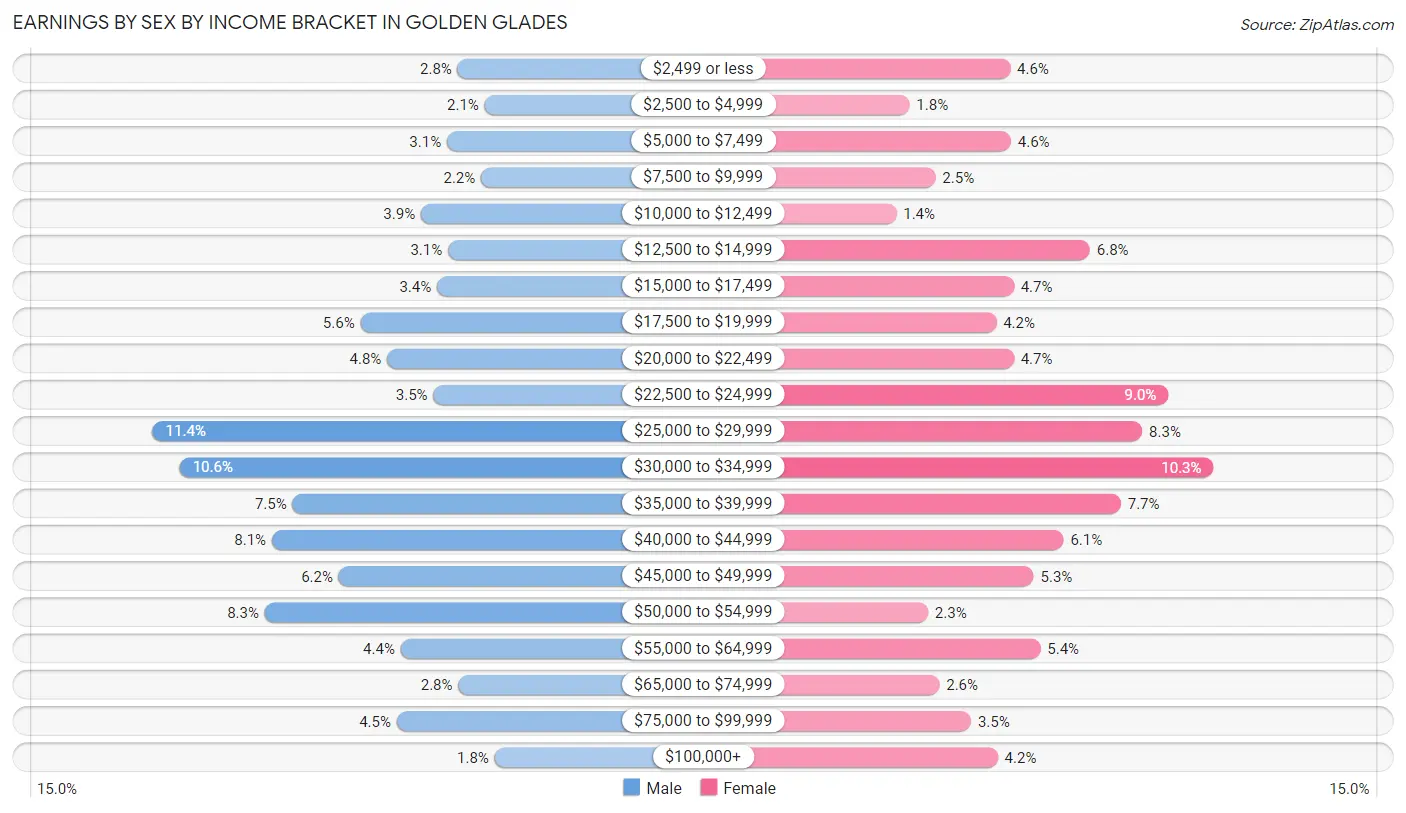
Earnings by Sex by Income Bracket in Golden Glades
The most common earnings brackets in Golden Glades are $25,000 to $29,999 for men (1,057 | 11.4%) and $30,000 to $34,999 for women (777 | 10.3%).
| Income | Male | Female |
| $2,499 or less | 262 (2.8%) | 346 (4.6%) |
| $2,500 to $4,999 | 192 (2.1%) | 133 (1.8%) |
| $5,000 to $7,499 | 290 (3.1%) | 348 (4.6%) |
| $7,500 to $9,999 | 201 (2.2%) | 188 (2.5%) |
| $10,000 to $12,499 | 358 (3.9%) | 105 (1.4%) |
| $12,500 to $14,999 | 287 (3.1%) | 515 (6.8%) |
| $15,000 to $17,499 | 316 (3.4%) | 354 (4.7%) |
| $17,500 to $19,999 | 515 (5.6%) | 317 (4.2%) |
| $20,000 to $22,499 | 446 (4.8%) | 354 (4.7%) |
| $22,500 to $24,999 | 325 (3.5%) | 681 (9.0%) |
| $25,000 to $29,999 | 1,057 (11.4%) | 626 (8.3%) |
| $30,000 to $34,999 | 986 (10.6%) | 777 (10.3%) |
| $35,000 to $39,999 | 692 (7.5%) | 581 (7.7%) |
| $40,000 to $44,999 | 746 (8.1%) | 459 (6.1%) |
| $45,000 to $49,999 | 572 (6.2%) | 396 (5.2%) |
| $50,000 to $54,999 | 765 (8.3%) | 172 (2.3%) |
| $55,000 to $64,999 | 411 (4.4%) | 410 (5.4%) |
| $65,000 to $74,999 | 260 (2.8%) | 196 (2.6%) |
| $75,000 to $99,999 | 421 (4.5%) | 263 (3.5%) |
| $100,000+ | 166 (1.8%) | 320 (4.2%) |
| Total | 9,268 (100.0%) | 7,541 (100.0%) |
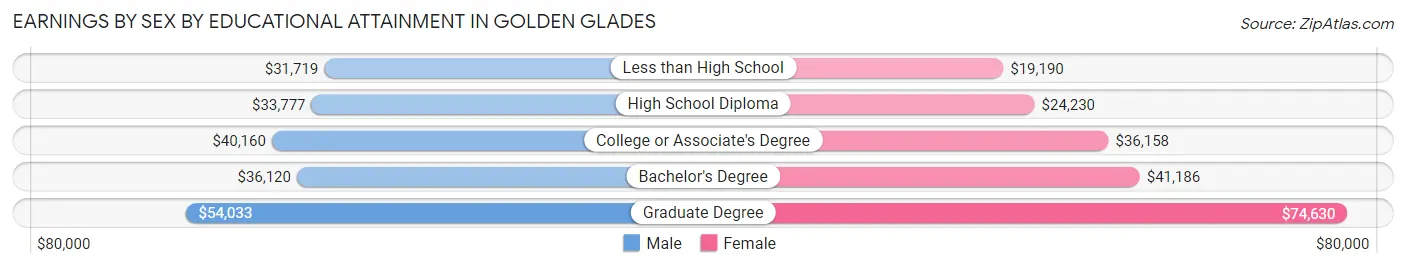
Earnings by Sex by Educational Attainment in Golden Glades
Average earnings in Golden Glades are $35,032 for men and $30,472 for women, a difference of 13.0%. Men with an educational attainment of graduate degree enjoy the highest average annual earnings of $54,033, while those with less than high school education earn the least with $31,719. Women with an educational attainment of graduate degree earn the most with the average annual earnings of $74,630, while those with less than high school education have the smallest earnings of $19,190.
| Educational Attainment | Male Income | Female Income |
| Less than High School | $31,719 | $19,190 |
| High School Diploma | $33,777 | $24,230 |
| College or Associate's Degree | $40,160 | $36,158 |
| Bachelor's Degree | $36,120 | $41,186 |
| Graduate Degree | $54,033 | $74,630 |
| Total | $35,032 | $30,472 |
Family Income in Golden Glades
Family Income Brackets in Golden Glades
According to the Golden Glades family income data, there are 2,010 families falling into the $50,000 to $74,999 income range, which is the most common income bracket and makes up 25.4% of all families. Conversely, the $10,000 to $14,999 income bracket is the least frequent group with only 47 families (0.6%) belonging to this category.
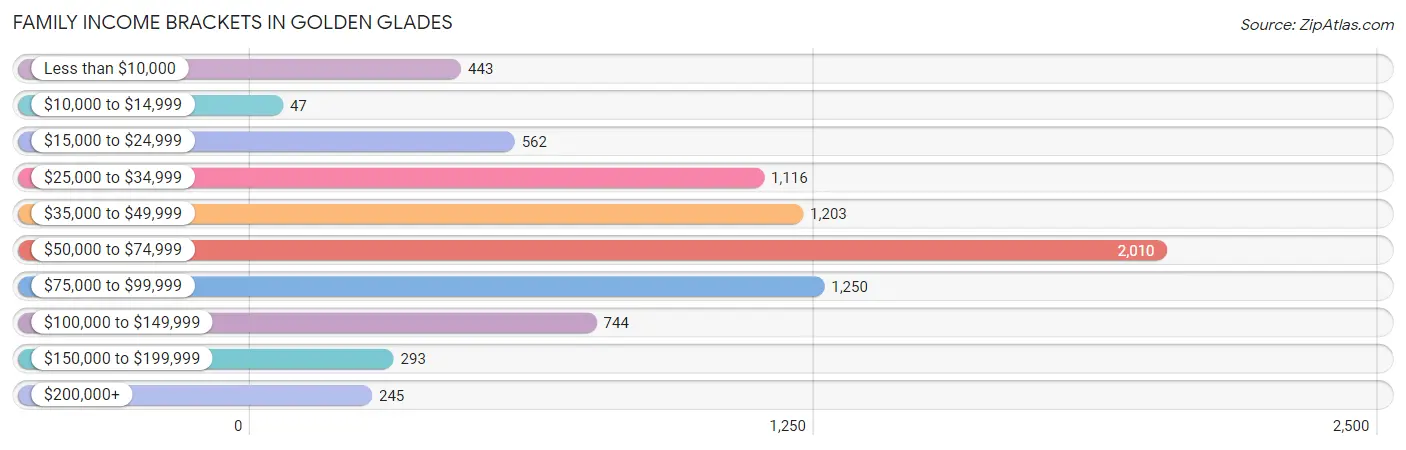
| Income Bracket | # Families | % Families |
| Less than $10,000 | 443 | 5.6% |
| $10,000 to $14,999 | 47 | 0.6% |
| $15,000 to $24,999 | 562 | 7.1% |
| $25,000 to $34,999 | 1,116 | 14.1% |
| $35,000 to $49,999 | 1,203 | 15.2% |
| $50,000 to $74,999 | 2,010 | 25.4% |
| $75,000 to $99,999 | 1,250 | 15.8% |
| $100,000 to $149,999 | 744 | 9.4% |
| $150,000 to $199,999 | 293 | 3.7% |
| $200,000+ | 245 | 3.1% |
Family Income by Famaliy Size in Golden Glades
7+ person families (200 | 2.5%) account for the highest median family income in Golden Glades with $82,361 per family, while 2-person families (2,714 | 34.3%) have the highest median income of $25,344 per family member.
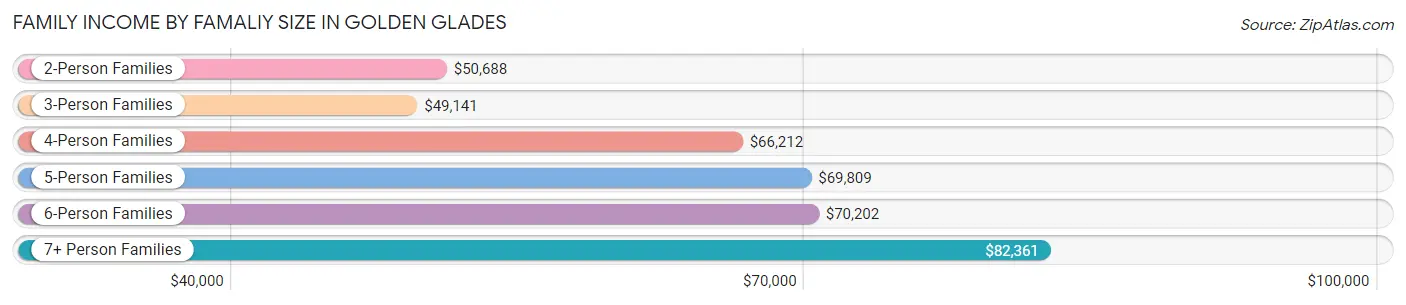
| Income Bracket | # Families | Median Income |
| 2-Person Families | 2,714 (34.3%) | $50,688 |
| 3-Person Families | 2,424 (30.6%) | $49,141 |
| 4-Person Families | 1,269 (16.0%) | $66,212 |
| 5-Person Families | 988 (12.5%) | $69,809 |
| 6-Person Families | 318 (4.0%) | $70,202 |
| 7+ Person Families | 200 (2.5%) | $82,361 |
| Total | 7,913 (100.0%) | $58,402 |
Family Income by Number of Earners in Golden Glades
The median family income in Golden Glades is $58,402, with families comprising 3+ earners (1,205) having the highest median family income of $89,551, while families with no earners (953) have the lowest median family income of $26,051, accounting for 15.2% and 12.0% of families, respectively.
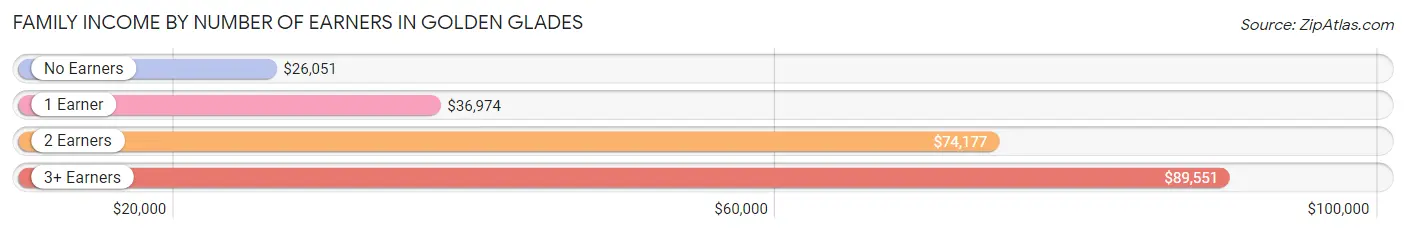
| Number of Earners | # Families | Median Income |
| No Earners | 953 (12.0%) | $26,051 |
| 1 Earner | 3,034 (38.3%) | $36,974 |
| 2 Earners | 2,721 (34.4%) | $74,177 |
| 3+ Earners | 1,205 (15.2%) | $89,551 |
| Total | 7,913 (100.0%) | $58,402 |
Household Income in Golden Glades
Household Income Brackets in Golden Glades
With 2,382 households falling in the category, the $50,000 to $74,999 income range is the most frequent in Golden Glades, accounting for 21.7% of all households. In contrast, only 274 households (2.5%) fall into the $200,000+ income bracket, making it the least populous group.
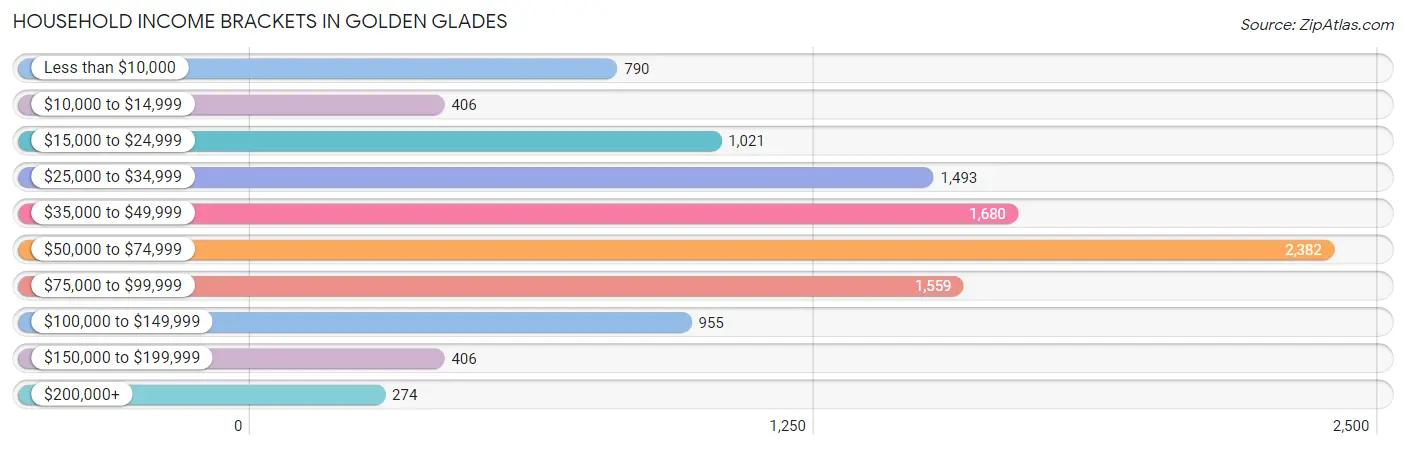
| Income Bracket | # Households | % Households |
| Less than $10,000 | 790 | 7.2% |
| $10,000 to $14,999 | 406 | 3.7% |
| $15,000 to $24,999 | 1,021 | 9.3% |
| $25,000 to $34,999 | 1,493 | 13.6% |
| $35,000 to $49,999 | 1,680 | 15.3% |
| $50,000 to $74,999 | 2,382 | 21.7% |
| $75,000 to $99,999 | 1,559 | 14.2% |
| $100,000 to $149,999 | 955 | 8.7% |
| $150,000 to $199,999 | 406 | 3.7% |
| $200,000+ | 274 | 2.5% |
Household Income by Householder Age in Golden Glades
The median household income in Golden Glades is $51,075, with the highest median household income of $60,922 found in the 45 to 64 years age bracket for the primary householder. A total of 4,442 households (40.5%) fall into this category. Meanwhile, the 15 to 24 years age bracket for the primary householder has the lowest median household income of $27,103, with 275 households (2.5%) in this group.
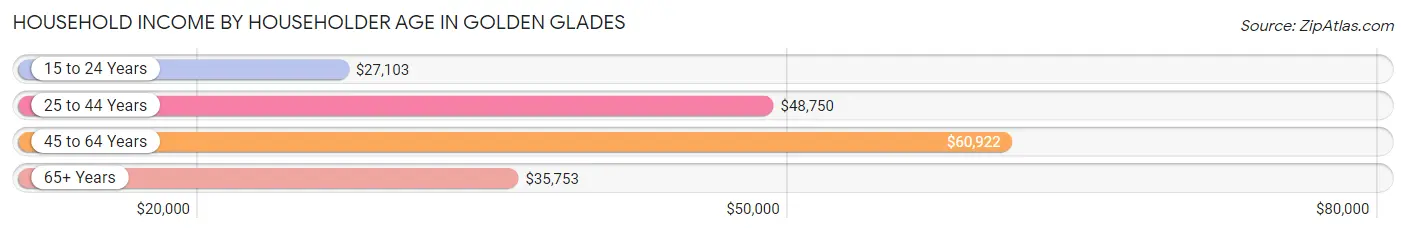
| Income Bracket | # Households | Median Income |
| 15 to 24 Years | 275 (2.5%) | $27,103 |
| 25 to 44 Years | 3,536 (32.2%) | $48,750 |
| 45 to 64 Years | 4,442 (40.5%) | $60,922 |
| 65+ Years | 2,726 (24.8%) | $35,753 |
| Total | 10,979 (100.0%) | $51,075 |
Poverty in Golden Glades
Income Below Poverty by Sex and Age in Golden Glades
With 18.0% poverty level for males and 18.8% for females among the residents of Golden Glades, 75 year old and over males and 12 to 14 year old females are the most vulnerable to poverty, with 315 males (43.6%) and 204 females (32.0%) in their respective age groups living below the poverty level.
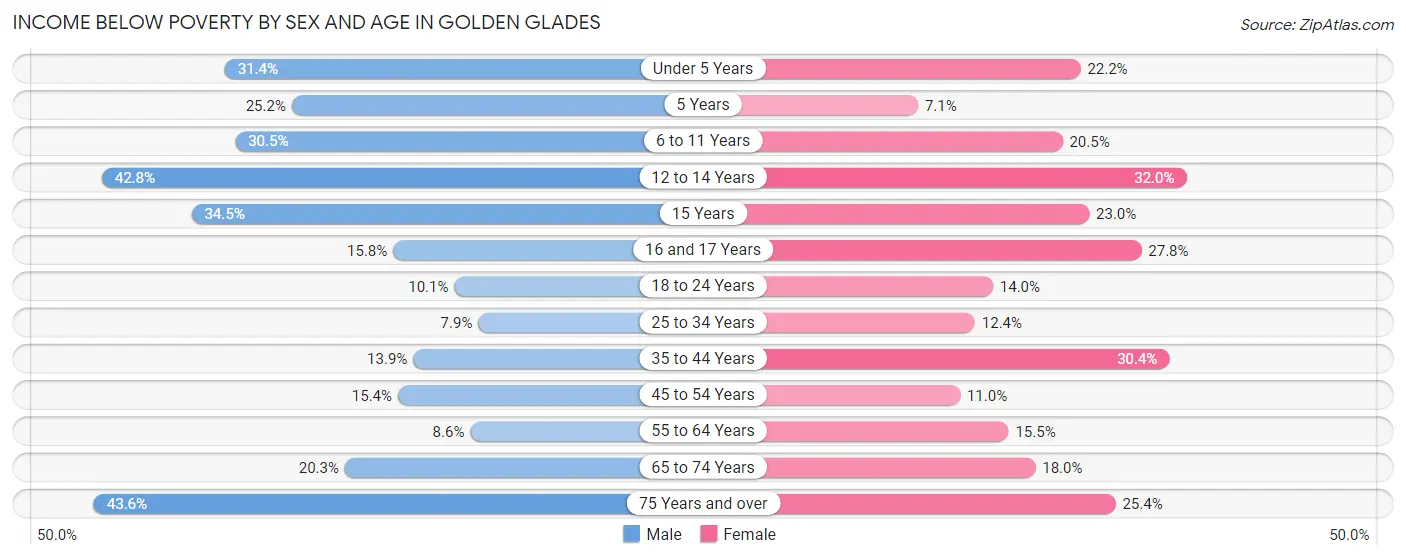
| Age Bracket | Male | Female |
| Under 5 Years | 438 (31.4%) | 181 (22.2%) |
| 5 Years | 59 (25.2%) | 7 (7.1%) |
| 6 to 11 Years | 402 (30.4%) | 325 (20.5%) |
| 12 to 14 Years | 209 (42.8%) | 204 (32.0%) |
| 15 Years | 117 (34.5%) | 67 (23.0%) |
| 16 and 17 Years | 76 (15.8%) | 72 (27.8%) |
| 18 to 24 Years | 212 (10.1%) | 218 (14.0%) |
| 25 to 34 Years | 194 (7.9%) | 252 (12.3%) |
| 35 to 44 Years | 325 (13.9%) | 608 (30.4%) |
| 45 to 54 Years | 267 (15.4%) | 253 (11.0%) |
| 55 to 64 Years | 181 (8.6%) | 387 (15.5%) |
| 65 to 74 Years | 305 (20.3%) | 271 (18.0%) |
| 75 Years and over | 315 (43.6%) | 319 (25.4%) |
| Total | 3,100 (18.0%) | 3,164 (18.8%) |
Income Above Poverty by Sex and Age in Golden Glades
According to the poverty statistics in Golden Glades, males aged 25 to 34 years and females aged 5 years are the age groups that are most secure financially, with 92.1% of males and 92.9% of females in these age groups living above the poverty line.
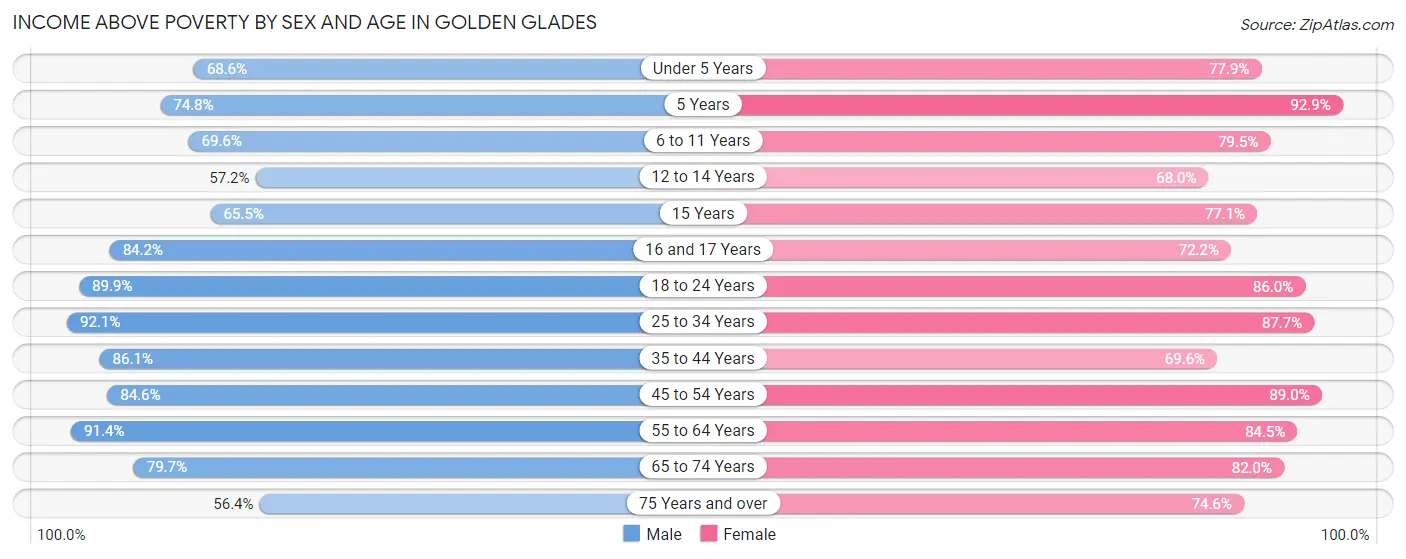
| Age Bracket | Male | Female |
| Under 5 Years | 956 (68.6%) | 636 (77.8%) |
| 5 Years | 175 (74.8%) | 92 (92.9%) |
| 6 to 11 Years | 918 (69.6%) | 1,262 (79.5%) |
| 12 to 14 Years | 279 (57.2%) | 434 (68.0%) |
| 15 Years | 222 (65.5%) | 225 (77.0%) |
| 16 and 17 Years | 405 (84.2%) | 187 (72.2%) |
| 18 to 24 Years | 1,883 (89.9%) | 1,337 (86.0%) |
| 25 to 34 Years | 2,262 (92.1%) | 1,789 (87.6%) |
| 35 to 44 Years | 2,007 (86.1%) | 1,393 (69.6%) |
| 45 to 54 Years | 1,471 (84.6%) | 2,053 (89.0%) |
| 55 to 64 Years | 1,915 (91.4%) | 2,115 (84.5%) |
| 65 to 74 Years | 1,199 (79.7%) | 1,238 (82.0%) |
| 75 Years and over | 408 (56.4%) | 937 (74.6%) |
| Total | 14,100 (82.0%) | 13,698 (81.2%) |
Income Below Poverty Among Married-Couple Families in Golden Glades
The poverty statistics for married-couple families in Golden Glades show that 12.5% or 539 of the total 4,326 families live below the poverty line. Families with 3 or 4 children have the highest poverty rate of 27.5%, comprising of 92 families. On the other hand, families with 5 or more children have the lowest poverty rate of 0.0%, which includes 0 families.
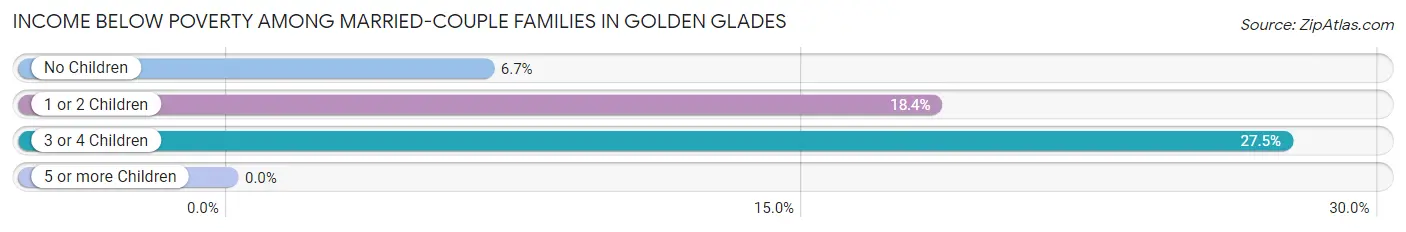
| Children | Above Poverty | Below Poverty |
| No Children | 2,234 (93.3%) | 160 (6.7%) |
| 1 or 2 Children | 1,274 (81.6%) | 287 (18.4%) |
| 3 or 4 Children | 242 (72.5%) | 92 (27.5%) |
| 5 or more Children | 37 (100.0%) | 0 (0.0%) |
| Total | 3,787 (87.5%) | 539 (12.5%) |
Income Below Poverty Among Single-Parent Households in Golden Glades
According to the poverty data in Golden Glades, 6.8% or 53 single-father households and 20.9% or 588 single-mother households are living below the poverty line. Among single-father households, those with 3 or 4 children have the highest poverty rate, with 25 households (31.7%) experiencing poverty. Likewise, among single-mother households, those with 5 or more children have the highest poverty rate, with 68 households (100.0%) falling below the poverty line.
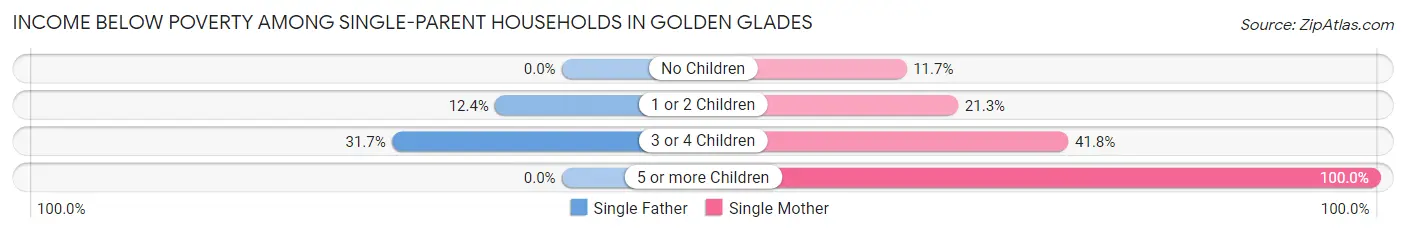
| Children | Single Father | Single Mother |
| No Children | 0 (0.0%) | 120 (11.7%) |
| 1 or 2 Children | 28 (12.4%) | 326 (21.3%) |
| 3 or 4 Children | 25 (31.7%) | 74 (41.8%) |
| 5 or more Children | 0 (0.0%) | 68 (100.0%) |
| Total | 53 (6.8%) | 588 (20.9%) |
Income Below Poverty Among Married-Couple vs Single-Parent Households in Golden Glades
The poverty data for Golden Glades shows that 539 of the married-couple family households (12.5%) and 641 of the single-parent households (17.9%) are living below the poverty level. Within the married-couple family households, those with 3 or 4 children have the highest poverty rate, with 92 households (27.5%) falling below the poverty line. Among the single-parent households, those with 5 or more children have the highest poverty rate, with 68 household (100.0%) living below poverty.
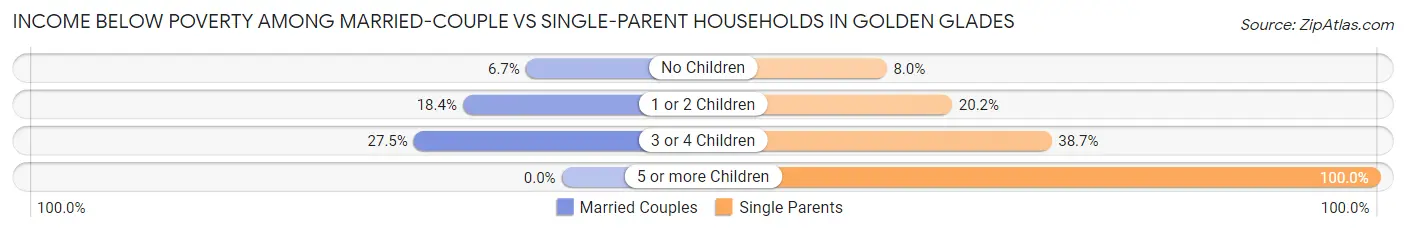
| Children | Married-Couple Families | Single-Parent Households |
| No Children | 160 (6.7%) | 120 (8.0%) |
| 1 or 2 Children | 287 (18.4%) | 354 (20.2%) |
| 3 or 4 Children | 92 (27.5%) | 99 (38.7%) |
| 5 or more Children | 0 (0.0%) | 68 (100.0%) |
| Total | 539 (12.5%) | 641 (17.9%) |
Race in Golden Glades
The most populous races in Golden Glades are Black / African American (24,598 | 70.8%), Hispanic or Latino (7,738 | 22.3%), and White / Caucasian (4,592 | 13.2%).
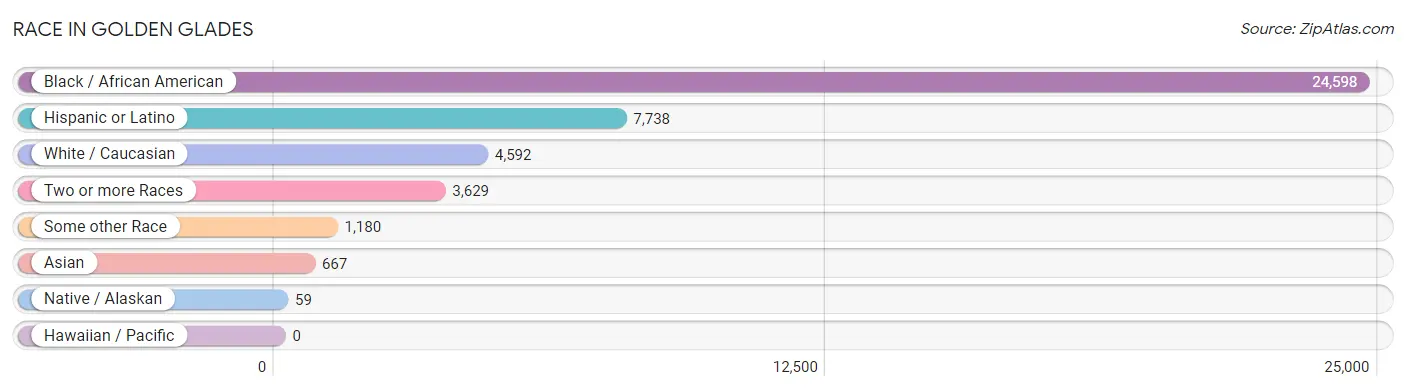
| Race | # Population | % Population |
| Asian | 667 | 1.9% |
| Black / African American | 24,598 | 70.8% |
| Hawaiian / Pacific | 0 | 0.0% |
| Hispanic or Latino | 7,738 | 22.3% |
| Native / Alaskan | 59 | 0.2% |
| White / Caucasian | 4,592 | 13.2% |
| Two or more Races | 3,629 | 10.4% |
| Some other Race | 1,180 | 3.4% |
| Total | 34,725 | 100.0% |
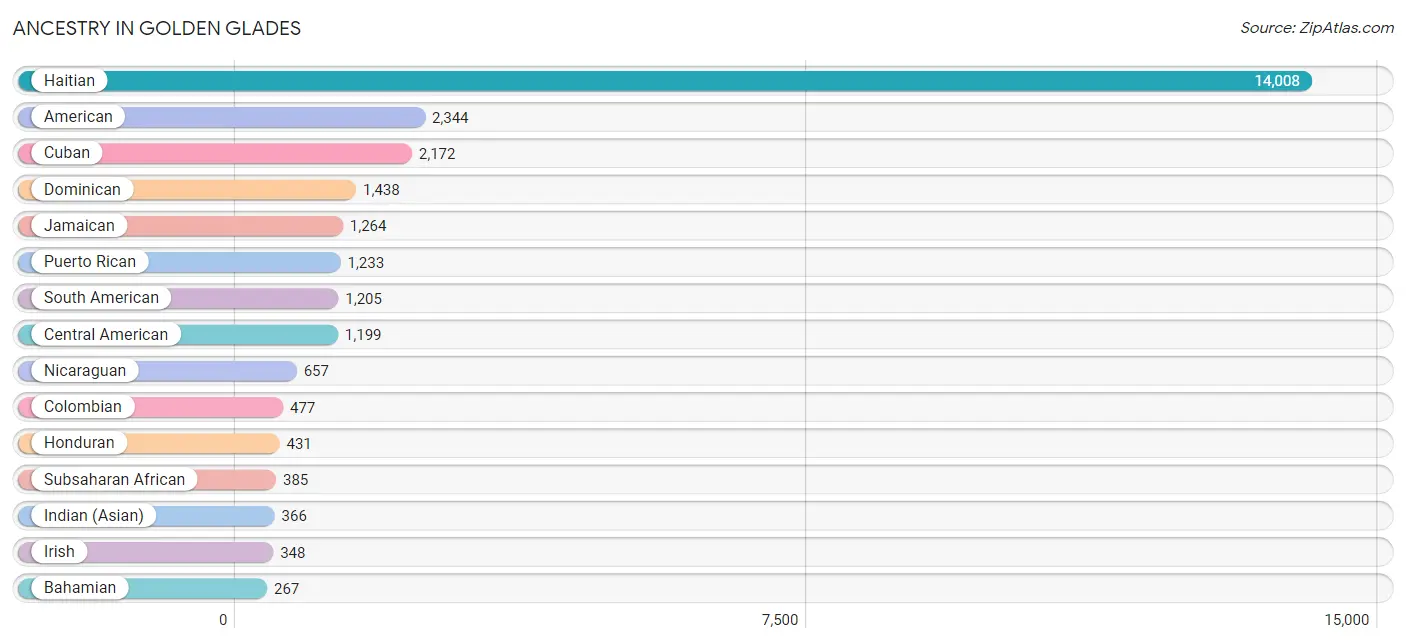
Ancestry in Golden Glades
The most populous ancestries reported in Golden Glades are Haitian (14,008 | 40.3%), American (2,344 | 6.8%), Cuban (2,172 | 6.2%), Dominican (1,438 | 4.1%), and Jamaican (1,264 | 3.6%), together accounting for 61.1% of all Golden Glades residents.
| Ancestry | # Population | % Population |
| African | 148 | 0.4% |
| American | 2,344 | 6.8% |
| Arab | 37 | 0.1% |
| Argentinean | 250 | 0.7% |
| Austrian | 7 | 0.0% |
| Bahamian | 267 | 0.8% |
| Barbadian | 48 | 0.1% |
| Bhutanese | 53 | 0.2% |
| Blackfeet | 12 | 0.0% |
| Bolivian | 49 | 0.1% |
| Brazilian | 18 | 0.1% |
| British | 14 | 0.0% |
| British West Indian | 38 | 0.1% |
| Bulgarian | 12 | 0.0% |
| Burmese | 13 | 0.0% |
| Canadian | 54 | 0.2% |
| Central American | 1,199 | 3.5% |
| Cherokee | 68 | 0.2% |
| Colombian | 477 | 1.4% |
| Costa Rican | 9 | 0.0% |
| Cuban | 2,172 | 6.2% |
| Dominican | 1,438 | 4.1% |
| Ecuadorian | 143 | 0.4% |
| English | 254 | 0.7% |
| European | 101 | 0.3% |
| French | 31 | 0.1% |
| German | 253 | 0.7% |
| Greek | 9 | 0.0% |
| Guatemalan | 97 | 0.3% |
| Guyanese | 12 | 0.0% |
| Haitian | 14,008 | 40.3% |
| Honduran | 431 | 1.2% |
| Hungarian | 9 | 0.0% |
| Indian (Asian) | 366 | 1.1% |
| Irish | 348 | 1.0% |
| Italian | 122 | 0.4% |
| Jamaican | 1,264 | 3.6% |
| Korean | 154 | 0.4% |
| Mexican | 109 | 0.3% |
| Mongolian | 4 | 0.0% |
| Moroccan | 37 | 0.1% |
| Nicaraguan | 657 | 1.9% |
| Nigerian | 237 | 0.7% |
| Norwegian | 49 | 0.1% |
| Peruvian | 38 | 0.1% |
| Polish | 119 | 0.3% |
| Portuguese | 32 | 0.1% |
| Puerto Rican | 1,233 | 3.5% |
| Romanian | 5 | 0.0% |
| Russian | 7 | 0.0% |
| Salvadoran | 5 | 0.0% |
| Scandinavian | 12 | 0.0% |
| Scotch-Irish | 10 | 0.0% |
| Scottish | 64 | 0.2% |
| Sioux | 7 | 0.0% |
| South American | 1,205 | 3.5% |
| Spaniard | 32 | 0.1% |
| Spanish | 38 | 0.1% |
| Sri Lankan | 9 | 0.0% |
| Subsaharan African | 385 | 1.1% |
| Swedish | 7 | 0.0% |
| Thai | 170 | 0.5% |
| Trinidadian and Tobagonian | 78 | 0.2% |
| Venezuelan | 248 | 0.7% |
| West Indian | 17 | 0.1% | View All 65 Rows |
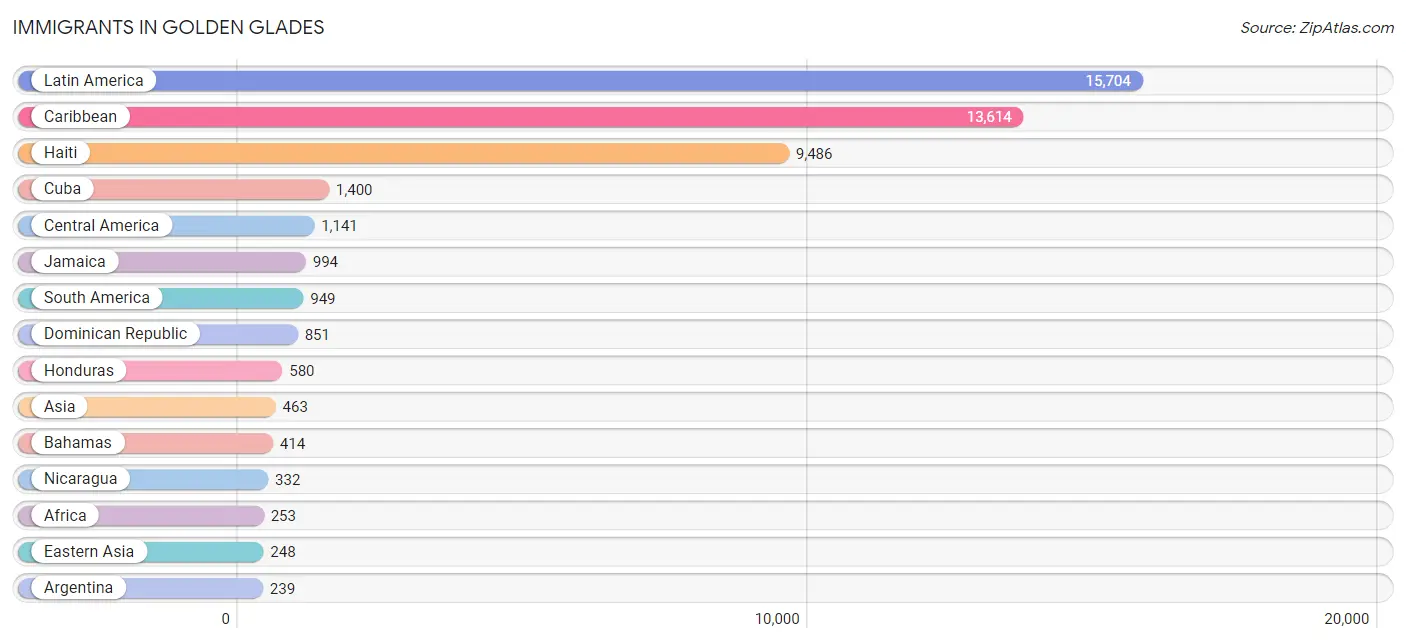
Immigrants in Golden Glades
The most numerous immigrant groups reported in Golden Glades came from Latin America (15,704 | 45.2%), Caribbean (13,614 | 39.2%), Haiti (9,486 | 27.3%), Cuba (1,400 | 4.0%), and Central America (1,141 | 3.3%), together accounting for 119.1% of all Golden Glades residents.
| Immigration Origin | # Population | % Population |
| Africa | 253 | 0.7% |
| Argentina | 239 | 0.7% |
| Asia | 463 | 1.3% |
| Bahamas | 414 | 1.2% |
| Bangladesh | 50 | 0.1% |
| Barbados | 20 | 0.1% |
| Bolivia | 76 | 0.2% |
| Brazil | 30 | 0.1% |
| Bulgaria | 12 | 0.0% |
| Cameroon | 94 | 0.3% |
| Canada | 67 | 0.2% |
| Caribbean | 13,614 | 39.2% |
| Central America | 1,141 | 3.3% |
| China | 208 | 0.6% |
| Colombia | 196 | 0.6% |
| Costa Rica | 9 | 0.0% |
| Cuba | 1,400 | 4.0% |
| Dominica | 194 | 0.6% |
| Dominican Republic | 851 | 2.5% |
| Eastern Asia | 248 | 0.7% |
| Eastern Europe | 27 | 0.1% |
| Ecuador | 123 | 0.4% |
| El Salvador | 15 | 0.0% |
| England | 149 | 0.4% |
| Europe | 224 | 0.6% |
| Germany | 14 | 0.0% |
| Grenada | 17 | 0.1% |
| Guatemala | 133 | 0.4% |
| Guyana | 31 | 0.1% |
| Haiti | 9,486 | 27.3% |
| Honduras | 580 | 1.7% |
| Hungary | 9 | 0.0% |
| India | 32 | 0.1% |
| Jamaica | 994 | 2.9% |
| Japan | 27 | 0.1% |
| Korea | 13 | 0.0% |
| Latin America | 15,704 | 45.2% |
| Malaysia | 4 | 0.0% |
| Mexico | 72 | 0.2% |
| Middle Africa | 94 | 0.3% |
| Nicaragua | 332 | 1.0% |
| Nigeria | 159 | 0.5% |
| Northern Europe | 149 | 0.4% |
| Peru | 80 | 0.2% |
| Philippines | 84 | 0.2% |
| Romania | 6 | 0.0% |
| South America | 949 | 2.7% |
| South Central Asia | 82 | 0.2% |
| South Eastern Asia | 133 | 0.4% |
| Southern Europe | 34 | 0.1% |
| Spain | 34 | 0.1% |
| Thailand | 16 | 0.1% |
| Trinidad and Tobago | 109 | 0.3% |
| Venezuela | 174 | 0.5% |
| Vietnam | 18 | 0.1% |
| Western Africa | 159 | 0.5% |
| Western Europe | 14 | 0.0% | View All 57 Rows |
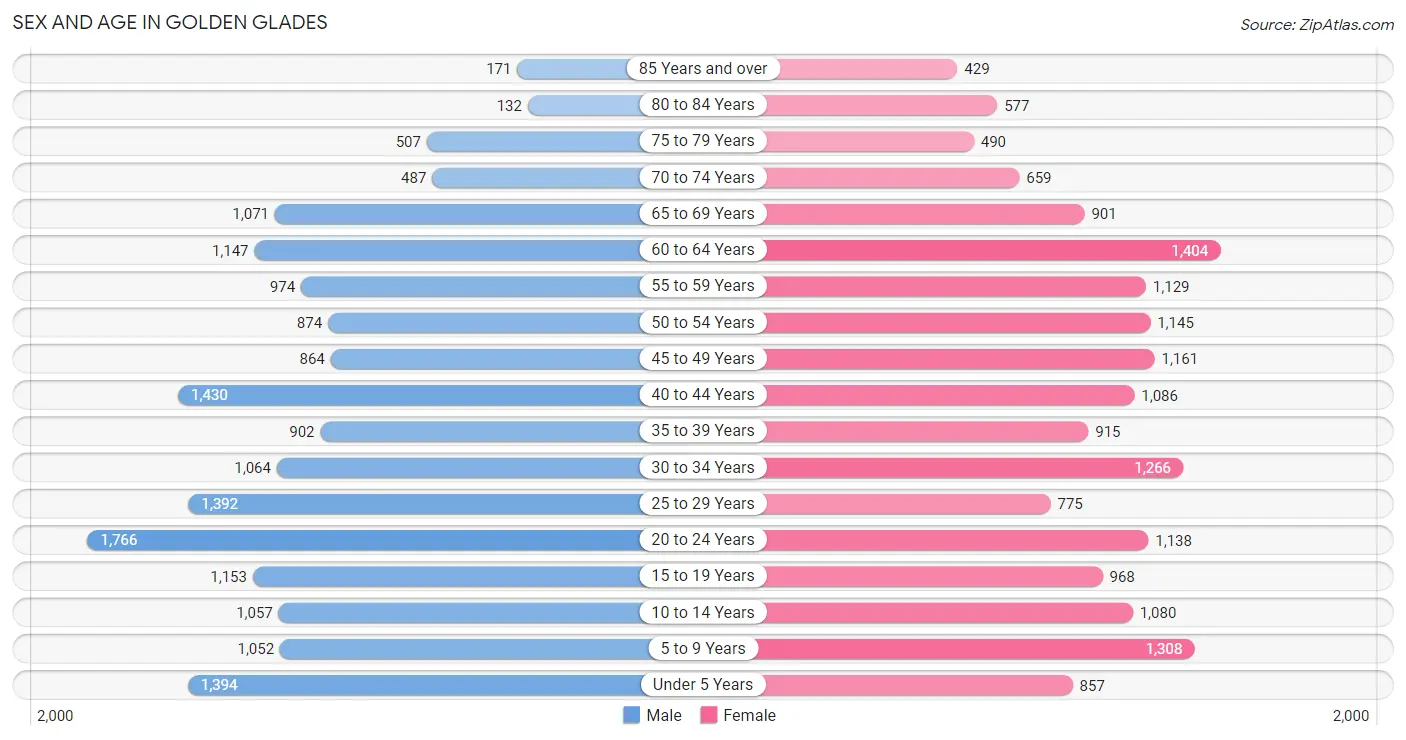
Sex and Age in Golden Glades
Sex and Age in Golden Glades
The most populous age groups in Golden Glades are 20 to 24 Years (1,766 | 10.1%) for men and 60 to 64 Years (1,404 | 8.1%) for women.
| Age Bracket | Male | Female |
| Under 5 Years | 1,394 (8.0%) | 857 (5.0%) |
| 5 to 9 Years | 1,052 (6.0%) | 1,308 (7.6%) |
| 10 to 14 Years | 1,057 (6.1%) | 1,080 (6.2%) |
| 15 to 19 Years | 1,153 (6.6%) | 968 (5.6%) |
| 20 to 24 Years | 1,766 (10.1%) | 1,138 (6.6%) |
| 25 to 29 Years | 1,392 (8.0%) | 775 (4.5%) |
| 30 to 34 Years | 1,064 (6.1%) | 1,266 (7.3%) |
| 35 to 39 Years | 902 (5.2%) | 915 (5.3%) |
| 40 to 44 Years | 1,430 (8.2%) | 1,086 (6.3%) |
| 45 to 49 Years | 864 (5.0%) | 1,161 (6.7%) |
| 50 to 54 Years | 874 (5.0%) | 1,145 (6.6%) |
| 55 to 59 Years | 974 (5.6%) | 1,129 (6.5%) |
| 60 to 64 Years | 1,147 (6.6%) | 1,404 (8.1%) |
| 65 to 69 Years | 1,071 (6.1%) | 901 (5.2%) |
| 70 to 74 Years | 487 (2.8%) | 659 (3.8%) |
| 75 to 79 Years | 507 (2.9%) | 490 (2.8%) |
| 80 to 84 Years | 132 (0.8%) | 577 (3.3%) |
| 85 Years and over | 171 (1.0%) | 429 (2.5%) |
| Total | 17,437 (100.0%) | 17,288 (100.0%) |
Families and Households in Golden Glades
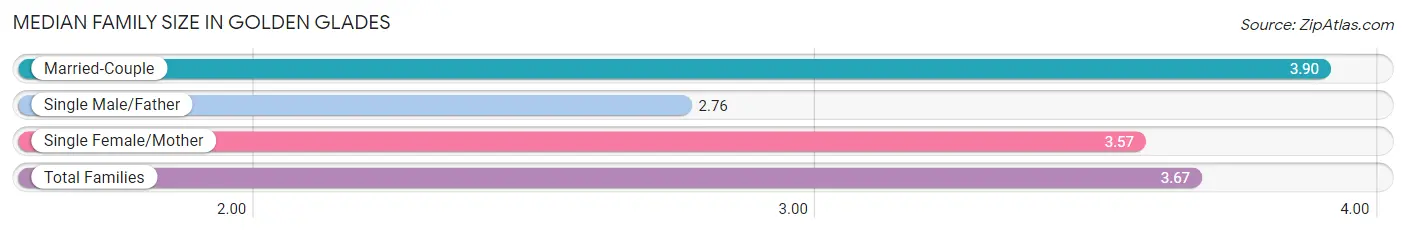
Median Family Size in Golden Glades
The median family size in Golden Glades is 3.67 persons per family, with married-couple families (4,326 | 54.7%) accounting for the largest median family size of 3.9 persons per family. On the other hand, single male/father families (780 | 9.9%) represent the smallest median family size with 2.76 persons per family.
| Family Type | # Families | Family Size |
| Married-Couple | 4,326 (54.7%) | 3.90 |
| Single Male/Father | 780 (9.9%) | 2.76 |
| Single Female/Mother | 2,807 (35.5%) | 3.57 |
| Total Families | 7,913 (100.0%) | 3.67 |
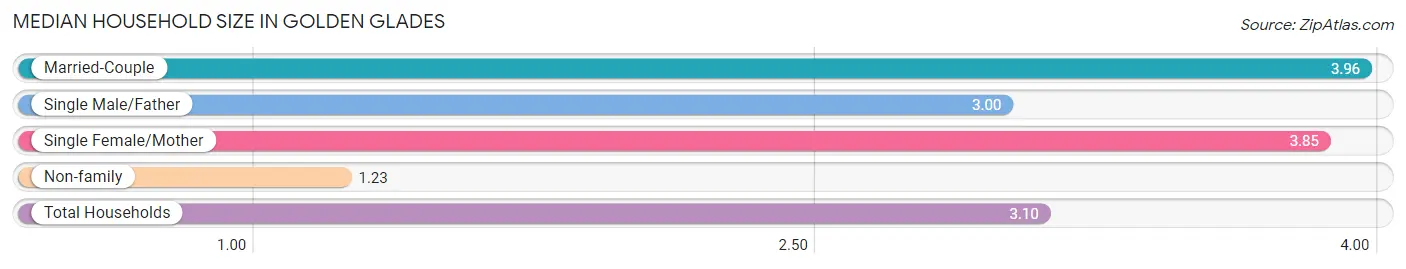
Median Household Size in Golden Glades
The median household size in Golden Glades is 3.10 persons per household, with married-couple households (4,326 | 39.4%) accounting for the largest median household size of 3.96 persons per household. non-family households (3,066 | 27.9%) represent the smallest median household size with 1.23 persons per household.
| Household Type | # Households | Household Size |
| Married-Couple | 4,326 (39.4%) | 3.96 |
| Single Male/Father | 780 (7.1%) | 3.00 |
| Single Female/Mother | 2,807 (25.6%) | 3.85 |
| Non-family | 3,066 (27.9%) | 1.23 |
| Total Households | 10,979 (100.0%) | 3.10 |
Household Size by Marriage Status in Golden Glades
Out of a total of 10,979 households in Golden Glades, 7,913 (72.1%) are family households, while 3,066 (27.9%) are nonfamily households. The most numerous type of family households are 2-person households, comprising 2,421, and the most common type of nonfamily households are 1-person households, comprising 2,561.
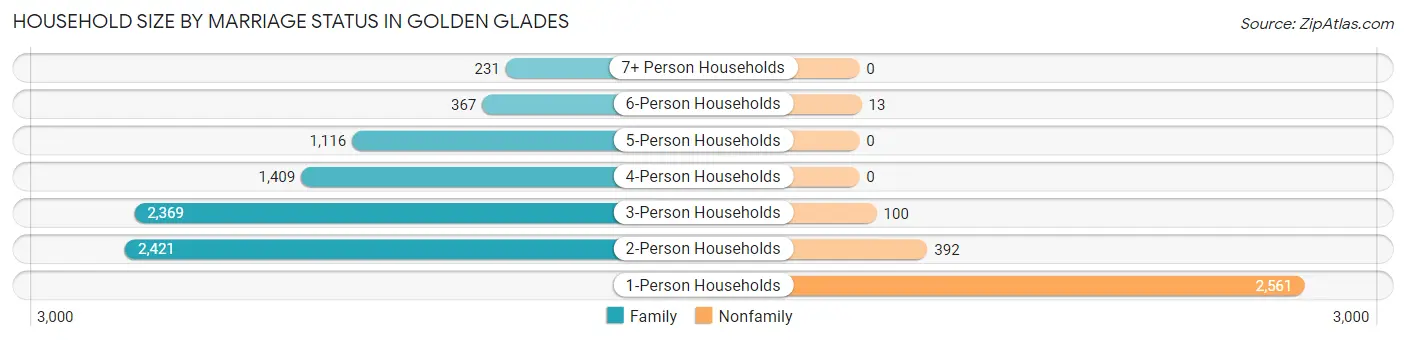
| Household Size | Family Households | Nonfamily Households |
| 1-Person Households | - | 2,561 (23.3%) |
| 2-Person Households | 2,421 (22.1%) | 392 (3.6%) |
| 3-Person Households | 2,369 (21.6%) | 100 (0.9%) |
| 4-Person Households | 1,409 (12.8%) | 0 (0.0%) |
| 5-Person Households | 1,116 (10.2%) | 0 (0.0%) |
| 6-Person Households | 367 (3.3%) | 13 (0.1%) |
| 7+ Person Households | 231 (2.1%) | 0 (0.0%) |
| Total | 7,913 (72.1%) | 3,066 (27.9%) |
Female Fertility in Golden Glades
Fertility by Age in Golden Glades
Average fertility rate in Golden Glades is 64.0 births per 1,000 women. Women in the age bracket of 20 to 34 years have the highest fertility rate with 95.0 births per 1,000 women. Women in the age bracket of 20 to 34 years acount for 62.7% of all women with births.
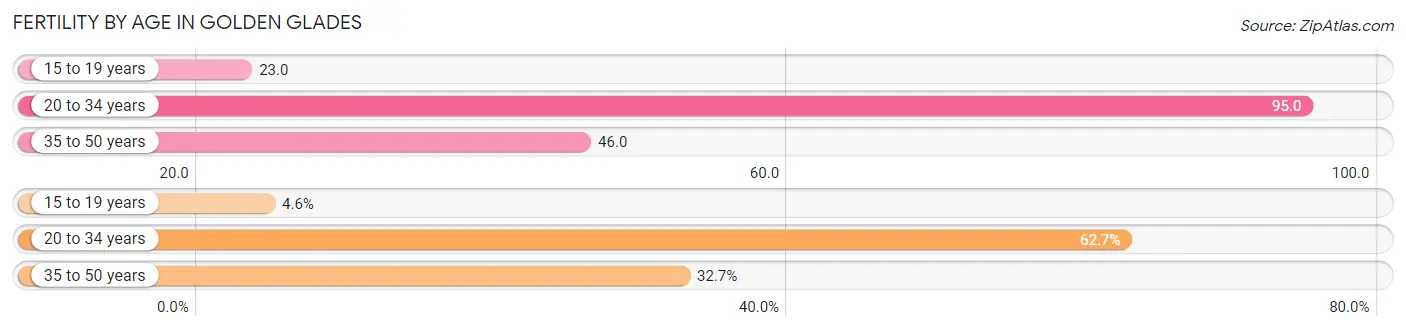
| Age Bracket | Women with Births | Births / 1,000 Women |
| 15 to 19 years | 22 (4.5%) | 23.0 |
| 20 to 34 years | 303 (62.7%) | 95.0 |
| 35 to 50 years | 158 (32.7%) | 46.0 |
| Total | 483 (100.0%) | 64.0 |
Fertility by Age by Marriage Status in Golden Glades
40.6% of women with births (483) in Golden Glades are married. The highest percentage of unmarried women with births falls into 35 to 50 years age bracket with 67.1% of them unmarried at the time of birth, while the lowest percentage of unmarried women with births belong to 15 to 19 years age bracket with 0.0% of them unmarried.
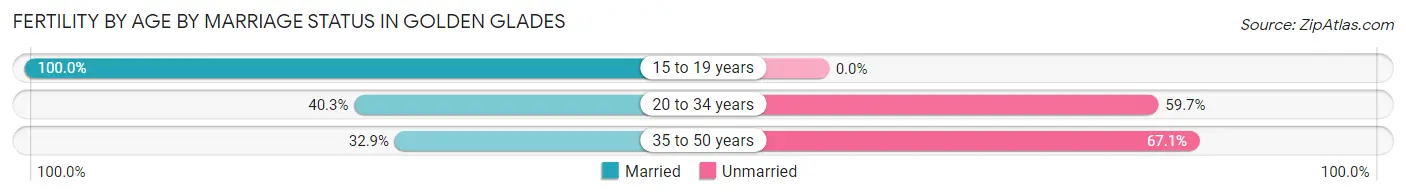
| Age Bracket | Married | Unmarried |
| 15 to 19 years | 22 (100.0%) | 0 (0.0%) |
| 20 to 34 years | 122 (40.3%) | 181 (59.7%) |
| 35 to 50 years | 52 (32.9%) | 106 (67.1%) |
| Total | 196 (40.6%) | 287 (59.4%) |
Fertility by Education in Golden Glades
Average fertility rate in Golden Glades is 64.0 births per 1,000 women. Women with the education attainment of bachelor's degree have the highest fertility rate of 90.0 births per 1,000 women, while women with the education attainment of less than high school have the lowest fertility at 36.0 births per 1,000 women. Women with the education attainment of college or associate's degree represent 40.6% of all women with births.
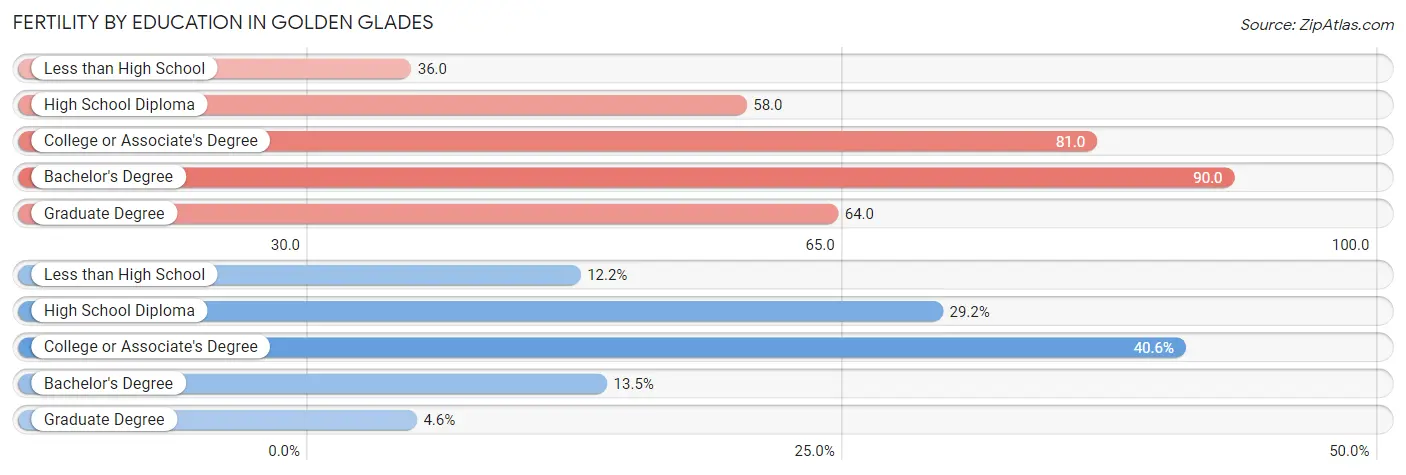
| Educational Attainment | Women with Births | Births / 1,000 Women |
| Less than High School | 59 (12.2%) | 36.0 |
| High School Diploma | 141 (29.2%) | 58.0 |
| College or Associate's Degree | 196 (40.6%) | 81.0 |
| Bachelor's Degree | 65 (13.5%) | 90.0 |
| Graduate Degree | 22 (4.5%) | 64.0 |
| Total | 483 (100.0%) | 64.0 |
Fertility by Education by Marriage Status in Golden Glades
59.4% of women with births in Golden Glades are unmarried. Women with the educational attainment of less than high school are most likely to be married with 78.0% of them married at childbirth, while women with the educational attainment of bachelor's degree are least likely to be married with 100.0% of them unmarried at childbirth.
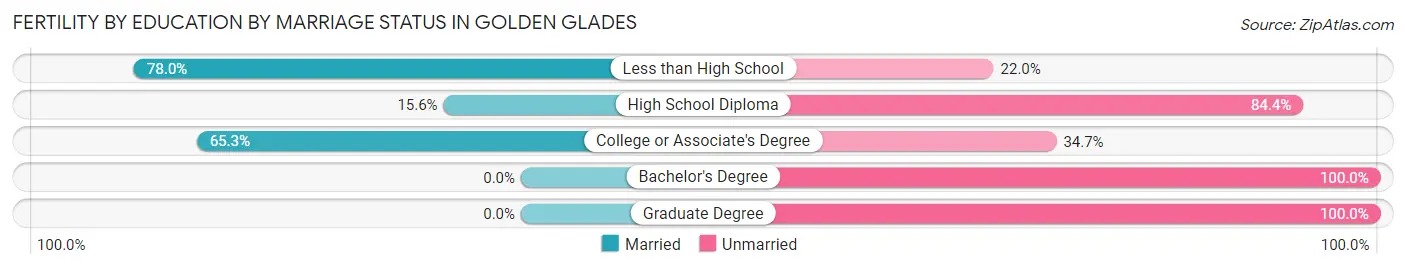
| Educational Attainment | Married | Unmarried |
| Less than High School | 46 (78.0%) | 13 (22.0%) |
| High School Diploma | 22 (15.6%) | 119 (84.4%) |
| College or Associate's Degree | 128 (65.3%) | 68 (34.7%) |
| Bachelor's Degree | 0 (0.0%) | 65 (100.0%) |
| Graduate Degree | 0 (0.0%) | 22 (100.0%) |
| Total | 196 (40.6%) | 287 (59.4%) |
Employment Characteristics in Golden Glades
Employment by Class of Employer in Golden Glades
Among the 15,331 employed individuals in Golden Glades, private company employees (10,497 | 68.5%), local government employees (1,502 | 9.8%), and self-employed (not incorporated) (1,251 | 8.2%) make up the most common classes of employment.
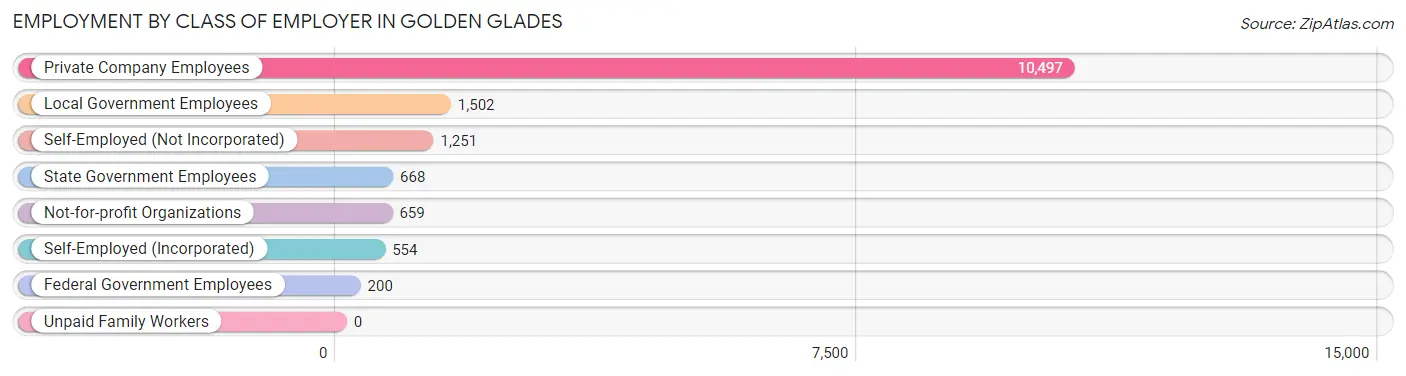
| Employer Class | # Employees | % Employees |
| Private Company Employees | 10,497 | 68.5% |
| Self-Employed (Incorporated) | 554 | 3.6% |
| Self-Employed (Not Incorporated) | 1,251 | 8.2% |
| Not-for-profit Organizations | 659 | 4.3% |
| Local Government Employees | 1,502 | 9.8% |
| State Government Employees | 668 | 4.4% |
| Federal Government Employees | 200 | 1.3% |
| Unpaid Family Workers | 0 | 0.0% |
| Total | 15,331 | 100.0% |
Employment Status by Age in Golden Glades
According to the labor force statistics for Golden Glades, out of the total population over 16 years of age (27,345), 62.0% or 16,954 individuals are in the labor force, with 8.2% or 1,390 of them unemployed. The age group with the highest labor force participation rate is 30 to 34 years, with 86.9% or 2,025 individuals in the labor force. Within the labor force, the 75 years and over age range has the highest percentage of unemployed individuals, with 19.6% or 10 of them being unemployed.
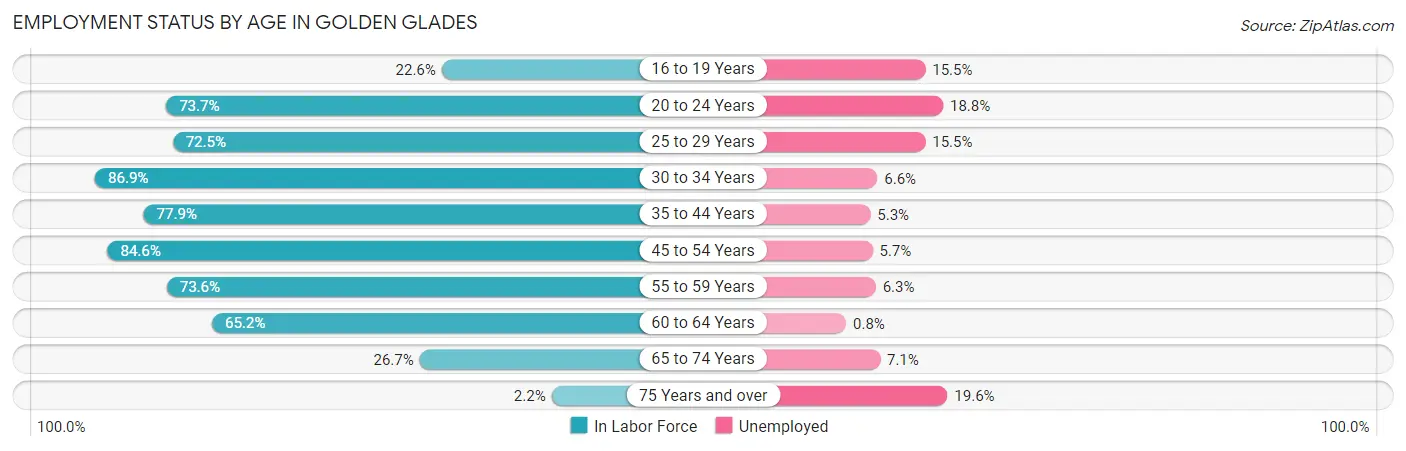
| Age Bracket | In Labor Force | Unemployed |
| 16 to 19 Years | 337 (22.6%) | 52 (15.5%) |
| 20 to 24 Years | 2,140 (73.7%) | 402 (18.8%) |
| 25 to 29 Years | 1,571 (72.5%) | 244 (15.5%) |
| 30 to 34 Years | 2,025 (86.9%) | 134 (6.6%) |
| 35 to 44 Years | 3,375 (77.9%) | 179 (5.3%) |
| 45 to 54 Years | 3,421 (84.6%) | 195 (5.7%) |
| 55 to 59 Years | 1,548 (73.6%) | 98 (6.3%) |
| 60 to 64 Years | 1,663 (65.2%) | 13 (0.8%) |
| 65 to 74 Years | 833 (26.7%) | 59 (7.1%) |
| 75 Years and over | 51 (2.2%) | 10 (19.6%) |
| Total | 16,954 (62.0%) | 1,390 (8.2%) |
Employment Status by Educational Attainment in Golden Glades
According to labor force statistics for Golden Glades, 77.6% of individuals (13,602) out of the total population between 25 and 64 years of age (17,528) are in the labor force, with 6.3% or 857 of them being unemployed. The group with the highest labor force participation rate are those with the educational attainment of bachelor's degree or higher, with 87.8% or 2,752 individuals in the labor force. Within the labor force, individuals with bachelor's degree or higher education have the highest percentage of unemployment, with 8.3% or 228 of them being unemployed.
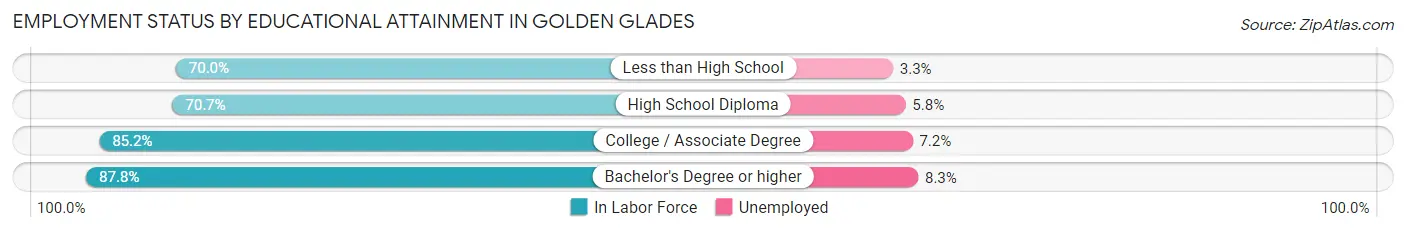
| Educational Attainment | In Labor Force | Unemployed |
| Less than High School | 2,124 (70.0%) | 100 (3.3%) |
| High School Diploma | 4,612 (70.7%) | 378 (5.8%) |
| College / Associate Degree | 4,120 (85.2%) | 348 (7.2%) |
| Bachelor's Degree or higher | 2,752 (87.8%) | 260 (8.3%) |
| Total | 13,602 (77.6%) | 1,104 (6.3%) |
Employment Occupations by Sex in Golden Glades
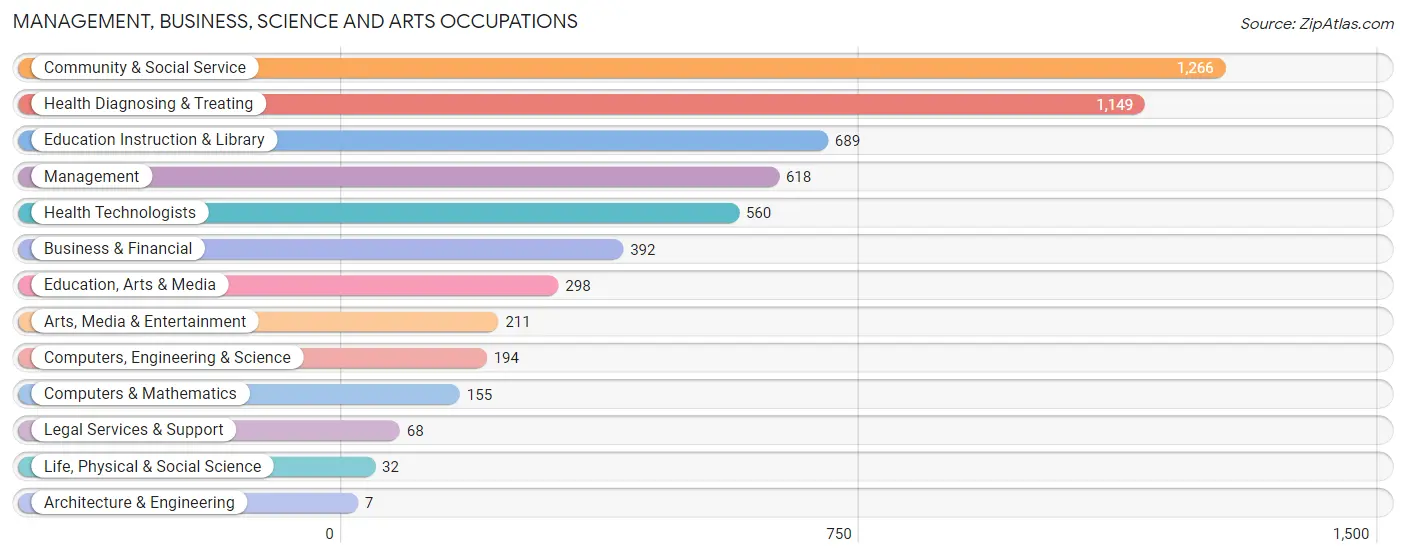
Management, Business, Science and Arts Occupations
The most common Management, Business, Science and Arts occupations in Golden Glades are Community & Social Service (1,266 | 8.1%), Health Diagnosing & Treating (1,149 | 7.4%), Education Instruction & Library (689 | 4.4%), Management (618 | 4.0%), and Health Technologists (560 | 3.6%).
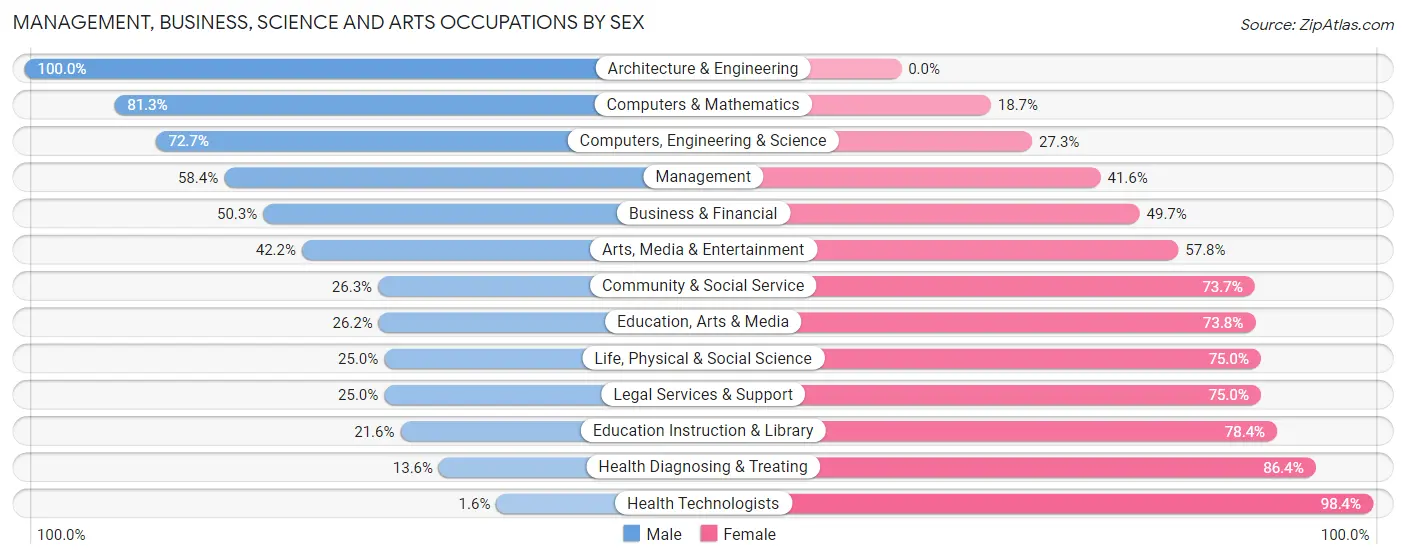
Management, Business, Science and Arts Occupations by Sex
Within the Management, Business, Science and Arts occupations in Golden Glades, the most male-oriented occupations are Architecture & Engineering (100.0%), Computers & Mathematics (81.3%), and Computers, Engineering & Science (72.7%), while the most female-oriented occupations are Health Technologists (98.4%), Health Diagnosing & Treating (86.4%), and Education Instruction & Library (78.4%).
| Occupation | Male | Female |
| Management | 361 (58.4%) | 257 (41.6%) |
| Business & Financial | 197 (50.3%) | 195 (49.7%) |
| Computers, Engineering & Science | 141 (72.7%) | 53 (27.3%) |
| Computers & Mathematics | 126 (81.3%) | 29 (18.7%) |
| Architecture & Engineering | 7 (100.0%) | 0 (0.0%) |
| Life, Physical & Social Science | 8 (25.0%) | 24 (75.0%) |
| Community & Social Service | 333 (26.3%) | 933 (73.7%) |
| Education, Arts & Media | 78 (26.2%) | 220 (73.8%) |
| Legal Services & Support | 17 (25.0%) | 51 (75.0%) |
| Education Instruction & Library | 149 (21.6%) | 540 (78.4%) |
| Arts, Media & Entertainment | 89 (42.2%) | 122 (57.8%) |
| Health Diagnosing & Treating | 156 (13.6%) | 993 (86.4%) |
| Health Technologists | 9 (1.6%) | 551 (98.4%) |
| Total (Category) | 1,188 (32.8%) | 2,431 (67.2%) |
| Total (Overall) | 8,309 (53.4%) | 7,249 (46.6%) |
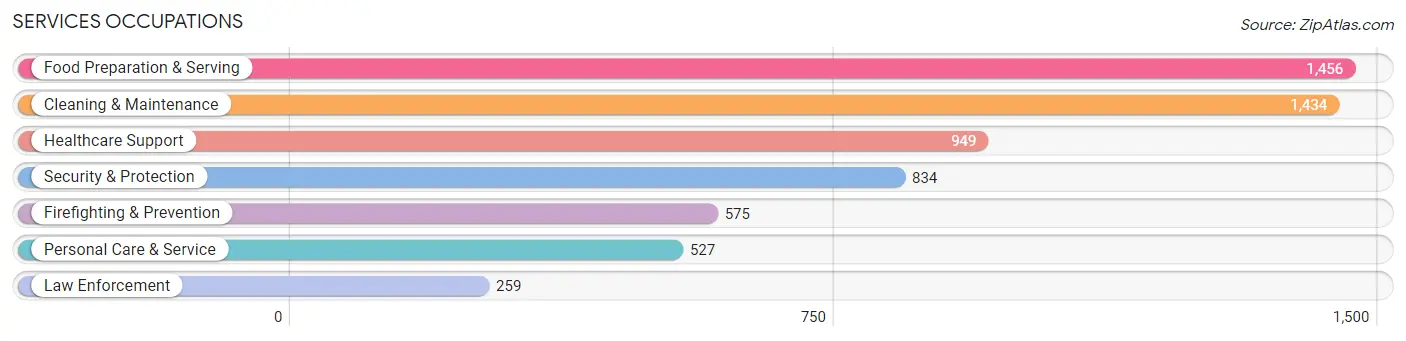
Services Occupations
The most common Services occupations in Golden Glades are Food Preparation & Serving (1,456 | 9.4%), Cleaning & Maintenance (1,434 | 9.2%), Healthcare Support (949 | 6.1%), Security & Protection (834 | 5.4%), and Firefighting & Prevention (575 | 3.7%).
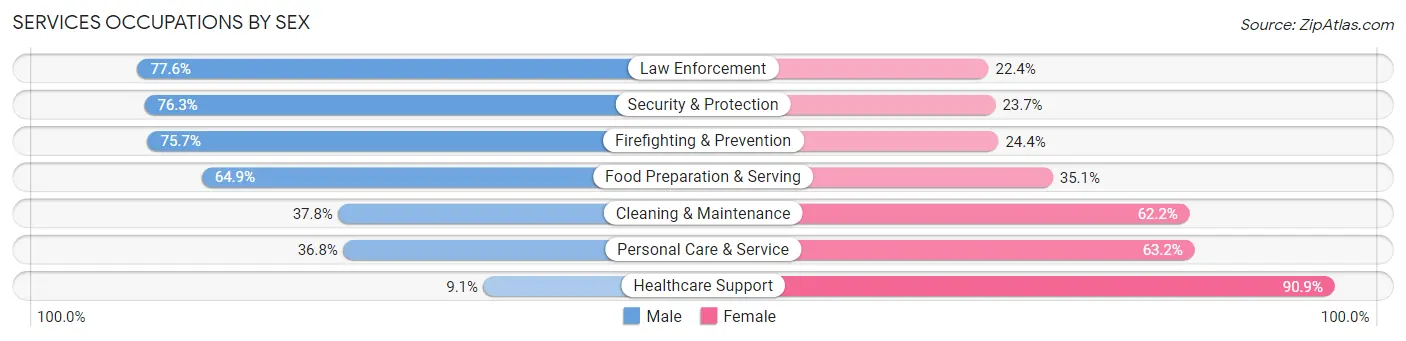
Services Occupations by Sex
Within the Services occupations in Golden Glades, the most male-oriented occupations are Law Enforcement (77.6%), Security & Protection (76.3%), and Firefighting & Prevention (75.6%), while the most female-oriented occupations are Healthcare Support (90.9%), Personal Care & Service (63.2%), and Cleaning & Maintenance (62.2%).
| Occupation | Male | Female |
| Healthcare Support | 86 (9.1%) | 863 (90.9%) |
| Security & Protection | 636 (76.3%) | 198 (23.7%) |
| Firefighting & Prevention | 435 (75.6%) | 140 (24.3%) |
| Law Enforcement | 201 (77.6%) | 58 (22.4%) |
| Food Preparation & Serving | 945 (64.9%) | 511 (35.1%) |
| Cleaning & Maintenance | 542 (37.8%) | 892 (62.2%) |
| Personal Care & Service | 194 (36.8%) | 333 (63.2%) |
| Total (Category) | 2,403 (46.2%) | 2,797 (53.8%) |
| Total (Overall) | 8,309 (53.4%) | 7,249 (46.6%) |
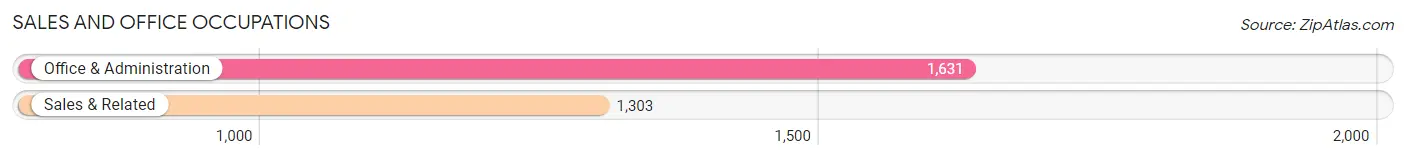
Sales and Office Occupations
The most common Sales and Office occupations in Golden Glades are Office & Administration (1,631 | 10.5%), and Sales & Related (1,303 | 8.4%).
Sales and Office Occupations by Sex
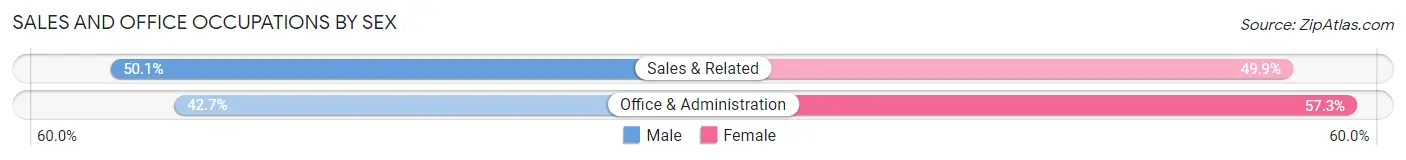
| Occupation | Male | Female |
| Sales & Related | 653 (50.1%) | 650 (49.9%) |
| Office & Administration | 697 (42.7%) | 934 (57.3%) |
| Total (Category) | 1,350 (46.0%) | 1,584 (54.0%) |
| Total (Overall) | 8,309 (53.4%) | 7,249 (46.6%) |
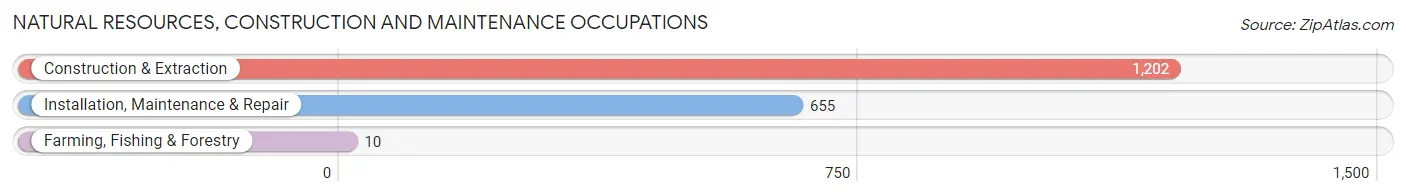
Natural Resources, Construction and Maintenance Occupations
The most common Natural Resources, Construction and Maintenance occupations in Golden Glades are Construction & Extraction (1,202 | 7.7%), Installation, Maintenance & Repair (655 | 4.2%), and Farming, Fishing & Forestry (10 | 0.1%).
Natural Resources, Construction and Maintenance Occupations by Sex
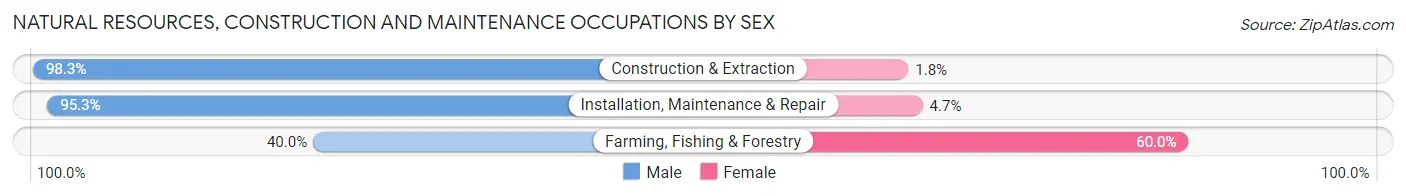
| Occupation | Male | Female |
| Farming, Fishing & Forestry | 4 (40.0%) | 6 (60.0%) |
| Construction & Extraction | 1,181 (98.3%) | 21 (1.8%) |
| Installation, Maintenance & Repair | 624 (95.3%) | 31 (4.7%) |
| Total (Category) | 1,809 (96.9%) | 58 (3.1%) |
| Total (Overall) | 8,309 (53.4%) | 7,249 (46.6%) |
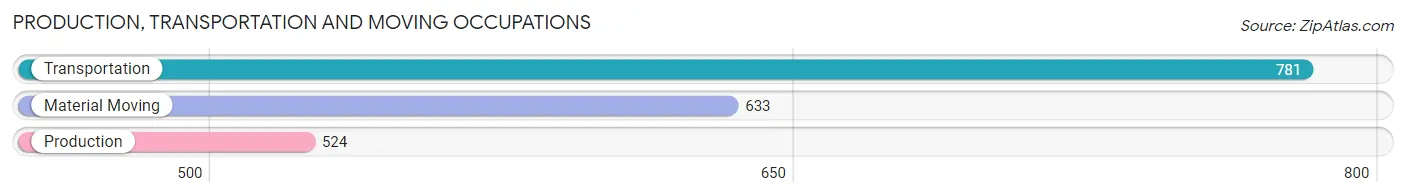
Production, Transportation and Moving Occupations
The most common Production, Transportation and Moving occupations in Golden Glades are Transportation (781 | 5.0%), Material Moving (633 | 4.1%), and Production (524 | 3.4%).
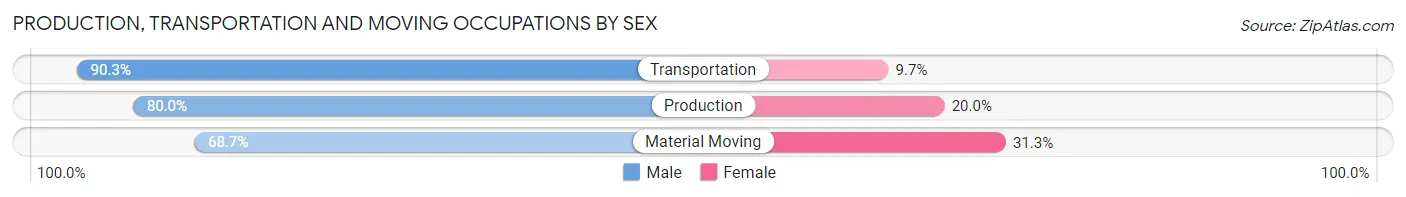
Production, Transportation and Moving Occupations by Sex
| Occupation | Male | Female |
| Production | 419 (80.0%) | 105 (20.0%) |
| Transportation | 705 (90.3%) | 76 (9.7%) |
| Material Moving | 435 (68.7%) | 198 (31.3%) |
| Total (Category) | 1,559 (80.4%) | 379 (19.6%) |
| Total (Overall) | 8,309 (53.4%) | 7,249 (46.6%) |
Employment Industries by Sex in Golden Glades
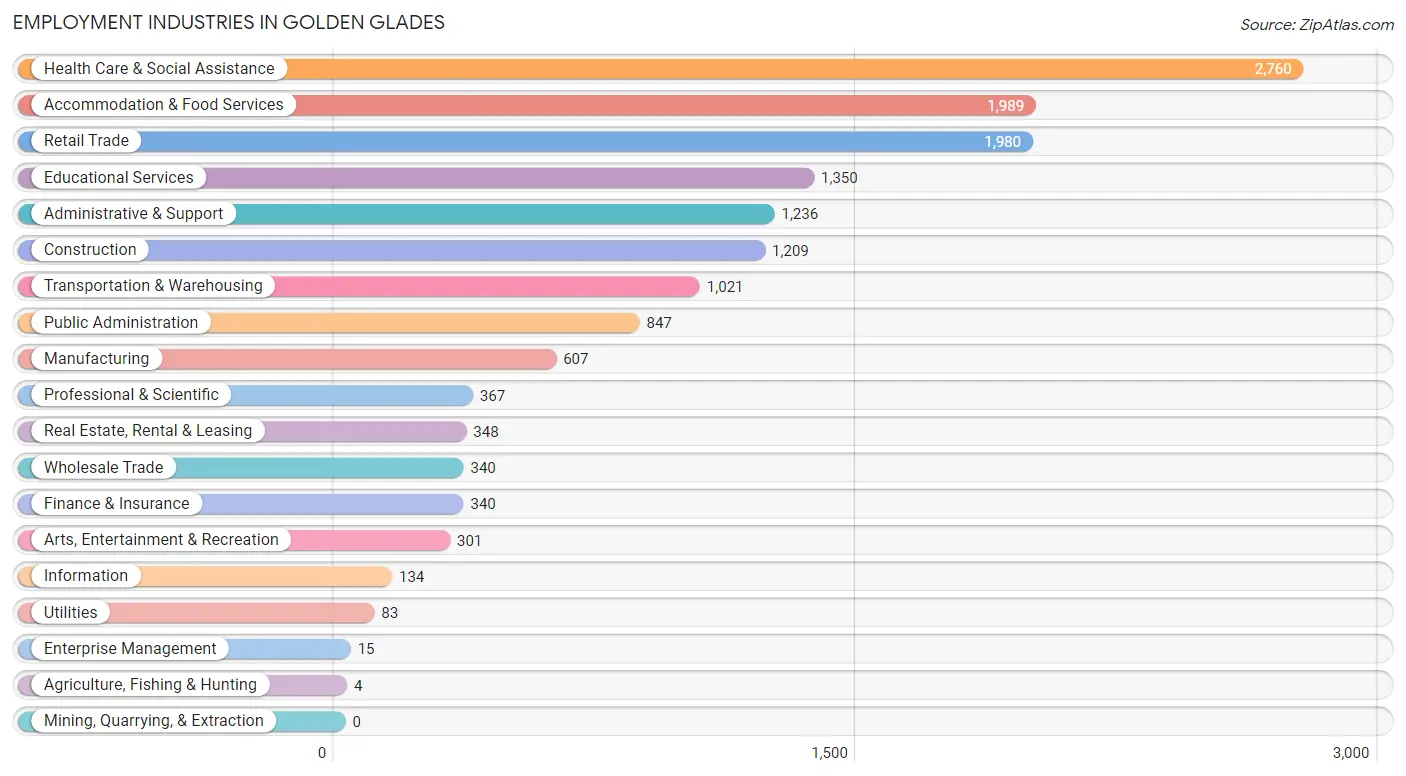
Employment Industries in Golden Glades
The major employment industries in Golden Glades include Health Care & Social Assistance (2,760 | 17.7%), Accommodation & Food Services (1,989 | 12.8%), Retail Trade (1,980 | 12.7%), Educational Services (1,350 | 8.7%), and Administrative & Support (1,236 | 7.9%).
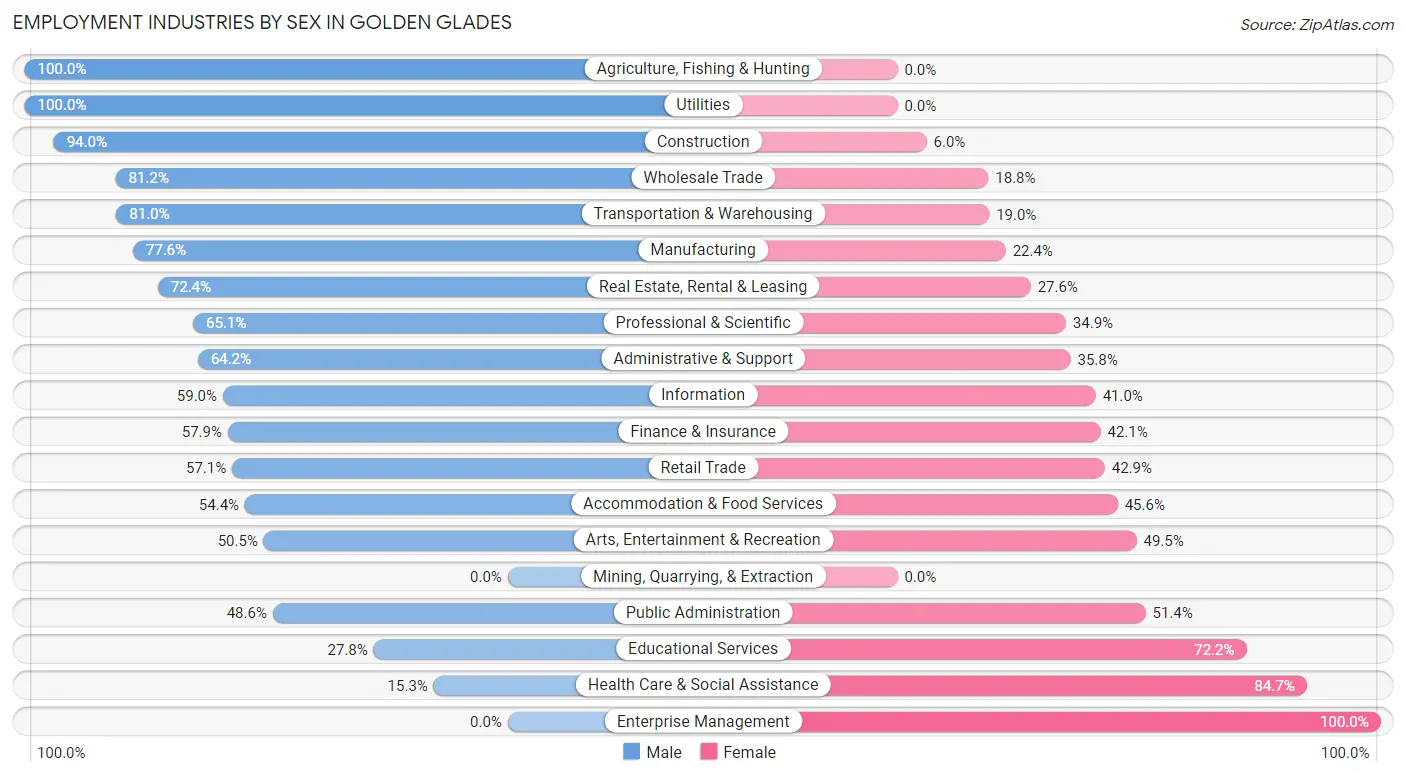
Employment Industries by Sex in Golden Glades
The Golden Glades industries that see more men than women are Agriculture, Fishing & Hunting (100.0%), Utilities (100.0%), and Construction (94.0%), whereas the industries that tend to have a higher number of women are Enterprise Management (100.0%), Health Care & Social Assistance (84.7%), and Educational Services (72.2%).
| Industry | Male | Female |
| Agriculture, Fishing & Hunting | 4 (100.0%) | 0 (0.0%) |
| Mining, Quarrying, & Extraction | 0 (0.0%) | 0 (0.0%) |
| Construction | 1,136 (94.0%) | 73 (6.0%) |
| Manufacturing | 471 (77.6%) | 136 (22.4%) |
| Wholesale Trade | 276 (81.2%) | 64 (18.8%) |
| Retail Trade | 1,130 (57.1%) | 850 (42.9%) |
| Transportation & Warehousing | 827 (81.0%) | 194 (19.0%) |
| Utilities | 83 (100.0%) | 0 (0.0%) |
| Information | 79 (59.0%) | 55 (41.0%) |
| Finance & Insurance | 197 (57.9%) | 143 (42.1%) |
| Real Estate, Rental & Leasing | 252 (72.4%) | 96 (27.6%) |
| Professional & Scientific | 239 (65.1%) | 128 (34.9%) |
| Enterprise Management | 0 (0.0%) | 15 (100.0%) |
| Administrative & Support | 793 (64.2%) | 443 (35.8%) |
| Educational Services | 375 (27.8%) | 975 (72.2%) |
| Health Care & Social Assistance | 423 (15.3%) | 2,337 (84.7%) |
| Arts, Entertainment & Recreation | 152 (50.5%) | 149 (49.5%) |
| Accommodation & Food Services | 1,082 (54.4%) | 907 (45.6%) |
| Public Administration | 412 (48.6%) | 435 (51.4%) |
| Total | 8,309 (53.4%) | 7,249 (46.6%) |
Education in Golden Glades
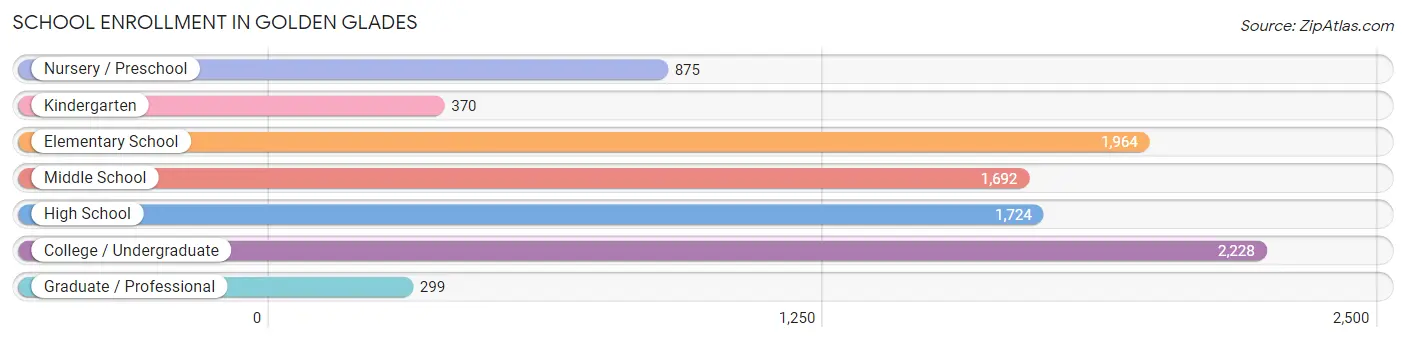
School Enrollment in Golden Glades
The most common levels of schooling among the 9,152 students in Golden Glades are college / undergraduate (2,228 | 24.3%), elementary school (1,964 | 21.5%), and high school (1,724 | 18.8%).
| School Level | # Students | % Students |
| Nursery / Preschool | 875 | 9.6% |
| Kindergarten | 370 | 4.0% |
| Elementary School | 1,964 | 21.5% |
| Middle School | 1,692 | 18.5% |
| High School | 1,724 | 18.8% |
| College / Undergraduate | 2,228 | 24.3% |
| Graduate / Professional | 299 | 3.3% |
| Total | 9,152 | 100.0% |
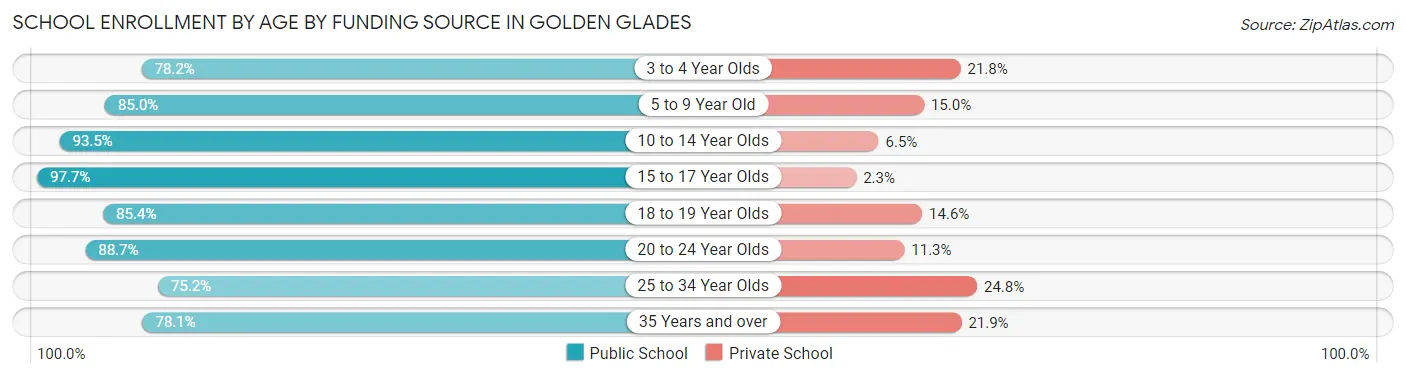
School Enrollment by Age by Funding Source in Golden Glades
Out of a total of 9,152 students who are enrolled in schools in Golden Glades, 1,098 (12.0%) attend a private institution, while the remaining 8,054 (88.0%) are enrolled in public schools. The age group of 25 to 34 year olds has the highest likelihood of being enrolled in private schools, with 79 (24.8% in the age bracket) enrolled. Conversely, the age group of 15 to 17 year olds has the lowest likelihood of being enrolled in a private school, with 1,341 (97.7% in the age bracket) attending a public institution.
| Age Bracket | Public School | Private School |
| 3 to 4 Year Olds | 575 (78.2%) | 160 (21.8%) |
| 5 to 9 Year Old | 1,905 (85.0%) | 335 (15.0%) |
| 10 to 14 Year Olds | 1,913 (93.5%) | 133 (6.5%) |
| 15 to 17 Year Olds | 1,341 (97.7%) | 32 (2.3%) |
| 18 to 19 Year Olds | 555 (85.4%) | 95 (14.6%) |
| 20 to 24 Year Olds | 1,066 (88.7%) | 136 (11.3%) |
| 25 to 34 Year Olds | 239 (75.2%) | 79 (24.8%) |
| 35 Years and over | 459 (78.1%) | 129 (21.9%) |
| Total | 8,054 (88.0%) | 1,098 (12.0%) |
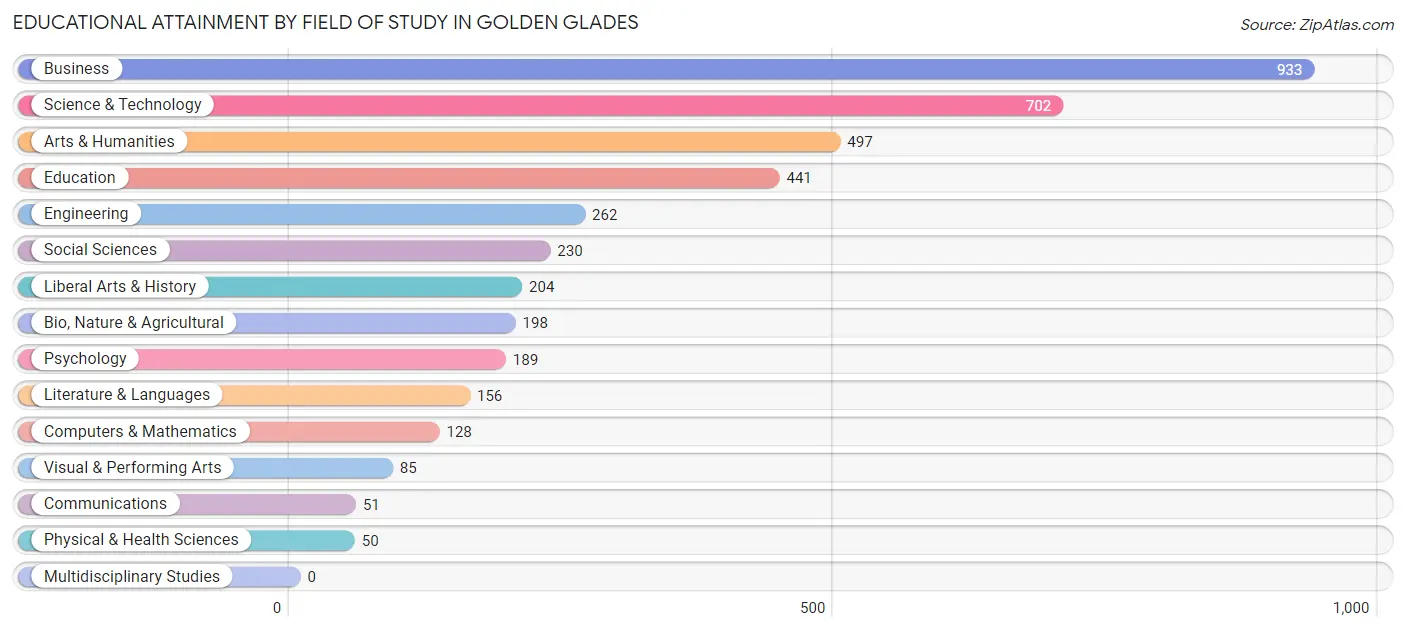
Educational Attainment by Field of Study in Golden Glades
Business (933 | 22.6%), science & technology (702 | 17.0%), arts & humanities (497 | 12.0%), education (441 | 10.7%), and engineering (262 | 6.4%) are the most common fields of study among 4,126 individuals in Golden Glades who have obtained a bachelor's degree or higher.
| Field of Study | # Graduates | % Graduates |
| Computers & Mathematics | 128 | 3.1% |
| Bio, Nature & Agricultural | 198 | 4.8% |
| Physical & Health Sciences | 50 | 1.2% |
| Psychology | 189 | 4.6% |
| Social Sciences | 230 | 5.6% |
| Engineering | 262 | 6.4% |
| Multidisciplinary Studies | 0 | 0.0% |
| Science & Technology | 702 | 17.0% |
| Business | 933 | 22.6% |
| Education | 441 | 10.7% |
| Literature & Languages | 156 | 3.8% |
| Liberal Arts & History | 204 | 4.9% |
| Visual & Performing Arts | 85 | 2.1% |
| Communications | 51 | 1.2% |
| Arts & Humanities | 497 | 12.0% |
| Total | 4,126 | 100.0% |
Transportation & Commute in Golden Glades
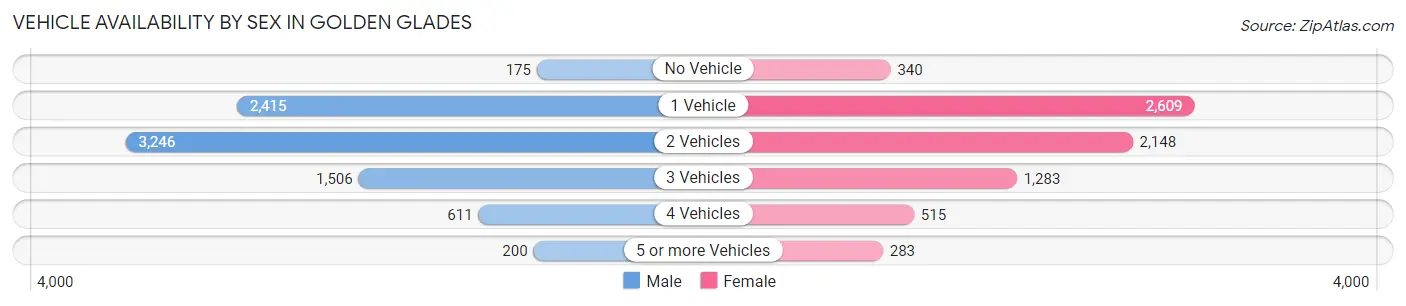
Vehicle Availability by Sex in Golden Glades
The most prevalent vehicle ownership categories in Golden Glades are males with 2 vehicles (3,246, accounting for 39.8%) and females with 2 vehicles (2,148, making up 45.2%).
| Vehicles Available | Male | Female |
| No Vehicle | 175 (2.1%) | 340 (4.7%) |
| 1 Vehicle | 2,415 (29.6%) | 2,609 (36.3%) |
| 2 Vehicles | 3,246 (39.8%) | 2,148 (29.9%) |
| 3 Vehicles | 1,506 (18.5%) | 1,283 (17.9%) |
| 4 Vehicles | 611 (7.5%) | 515 (7.2%) |
| 5 or more Vehicles | 200 (2.5%) | 283 (3.9%) |
| Total | 8,153 (100.0%) | 7,178 (100.0%) |
Commute Time in Golden Glades
The most frequently occuring commute durations in Golden Glades are 30 to 34 minutes (3,250 commuters, 22.9%), 20 to 24 minutes (2,203 commuters, 15.5%), and 45 to 59 minutes (1,589 commuters, 11.2%).
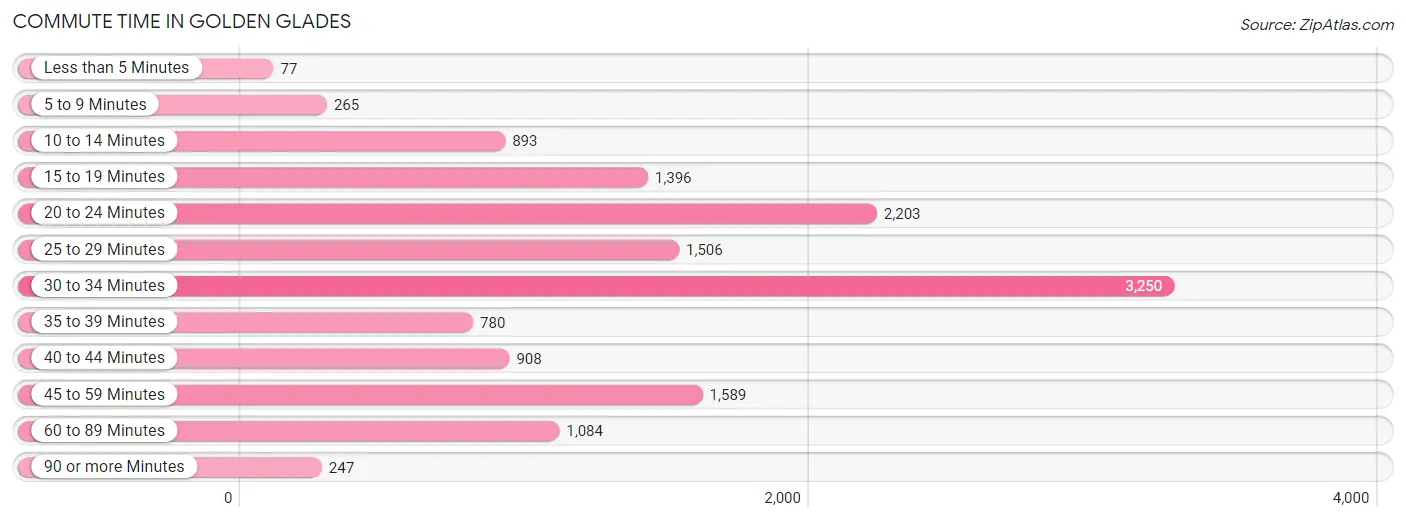
| Commute Time | # Commuters | % Commuters |
| Less than 5 Minutes | 77 | 0.5% |
| 5 to 9 Minutes | 265 | 1.9% |
| 10 to 14 Minutes | 893 | 6.3% |
| 15 to 19 Minutes | 1,396 | 9.8% |
| 20 to 24 Minutes | 2,203 | 15.5% |
| 25 to 29 Minutes | 1,506 | 10.6% |
| 30 to 34 Minutes | 3,250 | 22.9% |
| 35 to 39 Minutes | 780 | 5.5% |
| 40 to 44 Minutes | 908 | 6.4% |
| 45 to 59 Minutes | 1,589 | 11.2% |
| 60 to 89 Minutes | 1,084 | 7.6% |
| 90 or more Minutes | 247 | 1.7% |
Commute Time by Sex in Golden Glades
The most common commute times in Golden Glades are 30 to 34 minutes (2,069 commuters, 27.2%) for males and 30 to 34 minutes (1,181 commuters, 17.9%) for females.
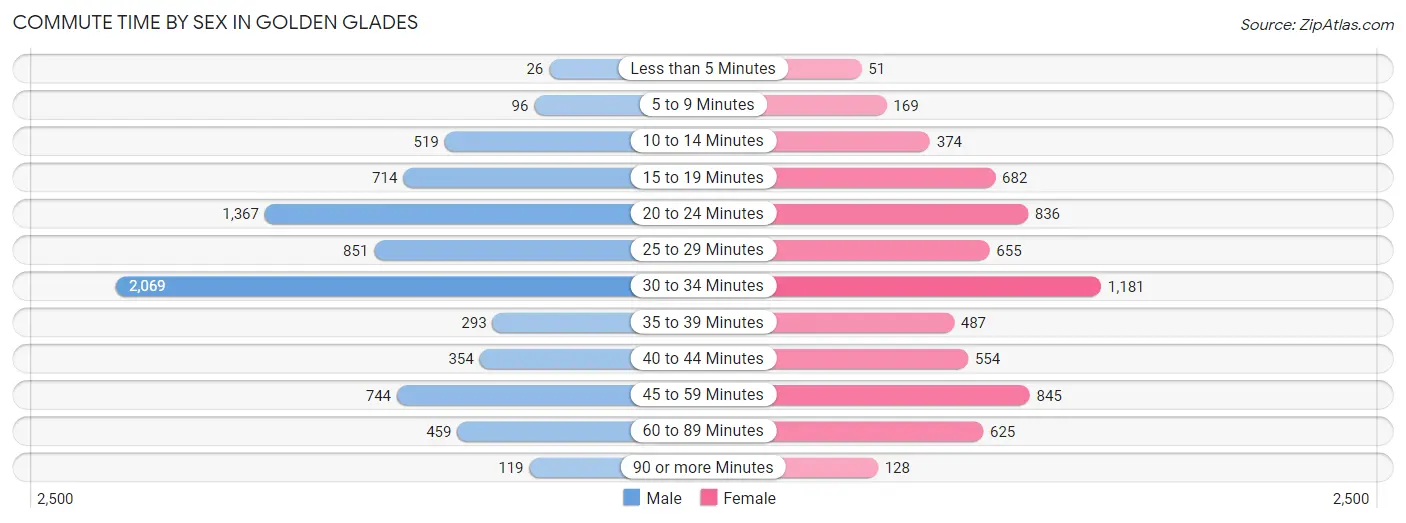
| Commute Time | Male | Female |
| Less than 5 Minutes | 26 (0.3%) | 51 (0.8%) |
| 5 to 9 Minutes | 96 (1.3%) | 169 (2.6%) |
| 10 to 14 Minutes | 519 (6.8%) | 374 (5.7%) |
| 15 to 19 Minutes | 714 (9.4%) | 682 (10.3%) |
| 20 to 24 Minutes | 1,367 (18.0%) | 836 (12.7%) |
| 25 to 29 Minutes | 851 (11.2%) | 655 (9.9%) |
| 30 to 34 Minutes | 2,069 (27.2%) | 1,181 (17.9%) |
| 35 to 39 Minutes | 293 (3.8%) | 487 (7.4%) |
| 40 to 44 Minutes | 354 (4.6%) | 554 (8.4%) |
| 45 to 59 Minutes | 744 (9.8%) | 845 (12.8%) |
| 60 to 89 Minutes | 459 (6.0%) | 625 (9.5%) |
| 90 or more Minutes | 119 (1.6%) | 128 (1.9%) |
Time of Departure to Work by Sex in Golden Glades
The most frequent times of departure to work in Golden Glades are 7:00 AM to 7:29 AM (1,273, 16.7%) for males and 7:00 AM to 7:29 AM (1,740, 26.4%) for females.
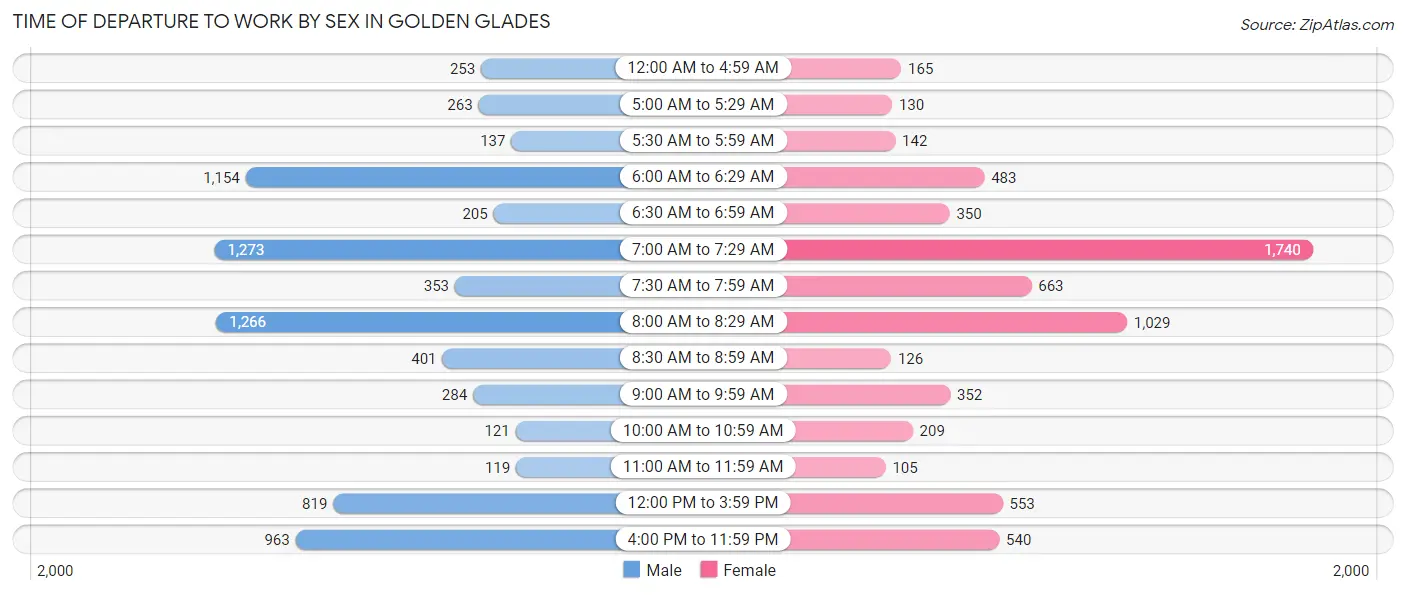
| Time of Departure | Male | Female |
| 12:00 AM to 4:59 AM | 253 (3.3%) | 165 (2.5%) |
| 5:00 AM to 5:29 AM | 263 (3.5%) | 130 (2.0%) |
| 5:30 AM to 5:59 AM | 137 (1.8%) | 142 (2.2%) |
| 6:00 AM to 6:29 AM | 1,154 (15.2%) | 483 (7.3%) |
| 6:30 AM to 6:59 AM | 205 (2.7%) | 350 (5.3%) |
| 7:00 AM to 7:29 AM | 1,273 (16.7%) | 1,740 (26.4%) |
| 7:30 AM to 7:59 AM | 353 (4.6%) | 663 (10.1%) |
| 8:00 AM to 8:29 AM | 1,266 (16.6%) | 1,029 (15.6%) |
| 8:30 AM to 8:59 AM | 401 (5.3%) | 126 (1.9%) |
| 9:00 AM to 9:59 AM | 284 (3.7%) | 352 (5.3%) |
| 10:00 AM to 10:59 AM | 121 (1.6%) | 209 (3.2%) |
| 11:00 AM to 11:59 AM | 119 (1.6%) | 105 (1.6%) |
| 12:00 PM to 3:59 PM | 819 (10.8%) | 553 (8.4%) |
| 4:00 PM to 11:59 PM | 963 (12.7%) | 540 (8.2%) |
| Total | 7,611 (100.0%) | 6,587 (100.0%) |
Housing Occupancy in Golden Glades
Occupancy by Ownership in Golden Glades
Of the total 10,979 dwellings in Golden Glades, owner-occupied units account for 5,713 (52.0%), while renter-occupied units make up 5,266 (48.0%).
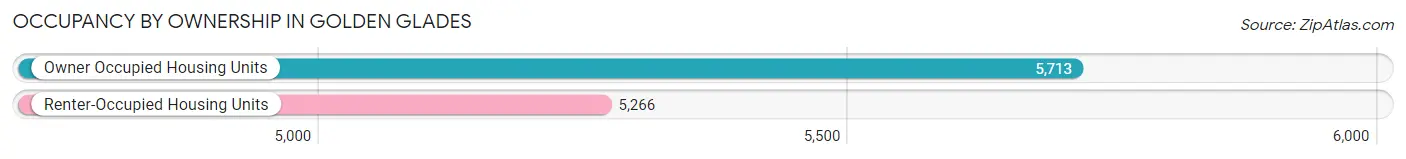
| Occupancy | # Housing Units | % Housing Units |
| Owner Occupied Housing Units | 5,713 | 52.0% |
| Renter-Occupied Housing Units | 5,266 | 48.0% |
| Total Occupied Housing Units | 10,979 | 100.0% |
Occupancy by Household Size in Golden Glades
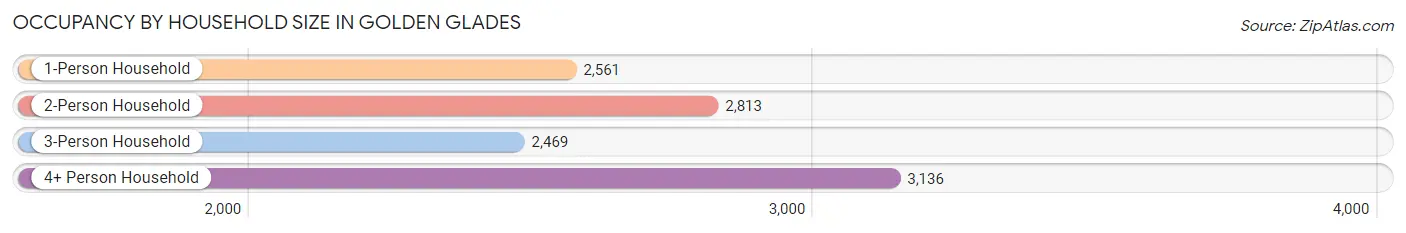
| Household Size | # Housing Units | % Housing Units |
| 1-Person Household | 2,561 | 23.3% |
| 2-Person Household | 2,813 | 25.6% |
| 3-Person Household | 2,469 | 22.5% |
| 4+ Person Household | 3,136 | 28.6% |
| Total Housing Units | 10,979 | 100.0% |
Occupancy by Ownership by Household Size in Golden Glades
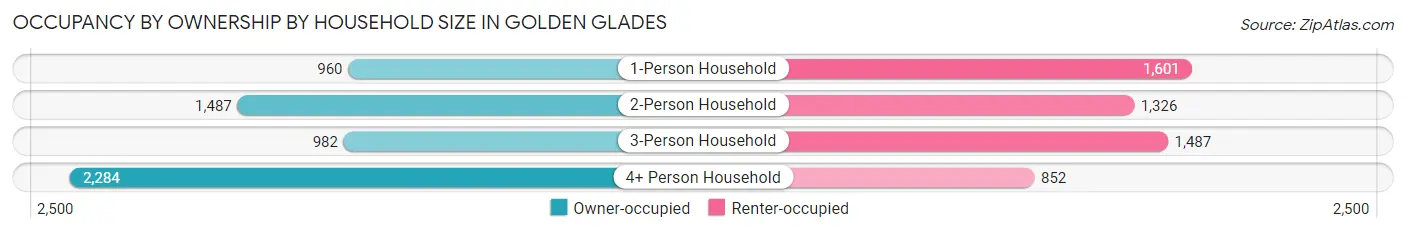
| Household Size | Owner-occupied | Renter-occupied |
| 1-Person Household | 960 (37.5%) | 1,601 (62.5%) |
| 2-Person Household | 1,487 (52.9%) | 1,326 (47.1%) |
| 3-Person Household | 982 (39.8%) | 1,487 (60.2%) |
| 4+ Person Household | 2,284 (72.8%) | 852 (27.2%) |
| Total Housing Units | 5,713 (52.0%) | 5,266 (48.0%) |
Occupancy by Educational Attainment in Golden Glades
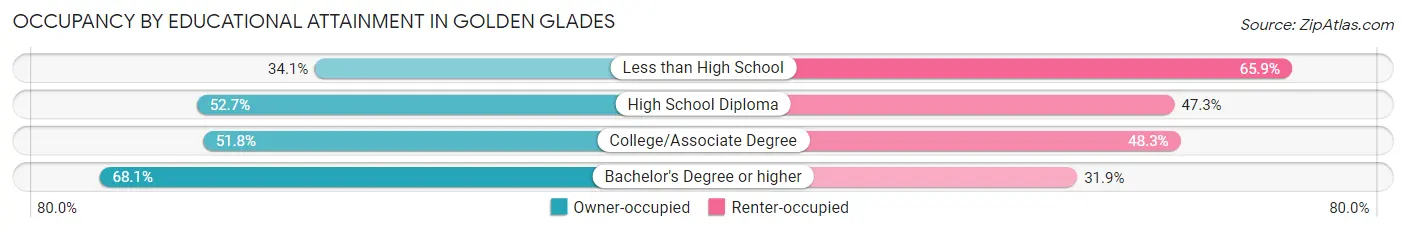
| Household Size | Owner-occupied | Renter-occupied |
| Less than High School | 641 (34.1%) | 1,240 (65.9%) |
| High School Diploma | 2,153 (52.7%) | 1,933 (47.3%) |
| College/Associate Degree | 1,565 (51.7%) | 1,459 (48.2%) |
| Bachelor's Degree or higher | 1,354 (68.1%) | 634 (31.9%) |
Occupancy by Age of Householder in Golden Glades
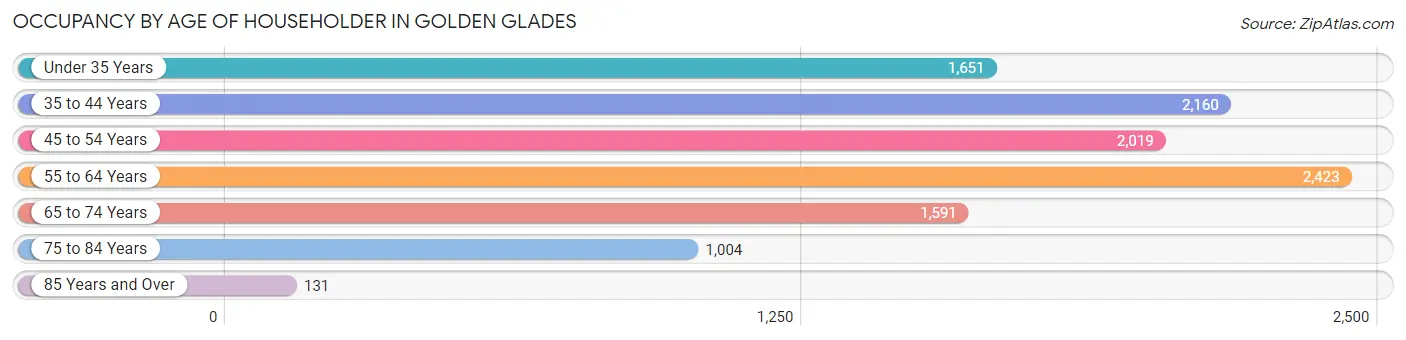
| Age Bracket | # Households | % Households |
| Under 35 Years | 1,651 | 15.0% |
| 35 to 44 Years | 2,160 | 19.7% |
| 45 to 54 Years | 2,019 | 18.4% |
| 55 to 64 Years | 2,423 | 22.1% |
| 65 to 74 Years | 1,591 | 14.5% |
| 75 to 84 Years | 1,004 | 9.1% |
| 85 Years and Over | 131 | 1.2% |
| Total | 10,979 | 100.0% |
Housing Finances in Golden Glades
Median Income by Occupancy in Golden Glades
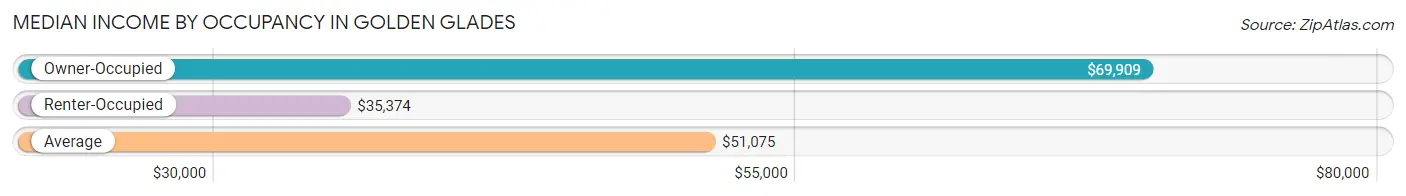
| Occupancy Type | # Households | Median Income |
| Owner-Occupied | 5,713 (52.0%) | $69,909 |
| Renter-Occupied | 5,266 (48.0%) | $35,374 |
| Average | 10,979 (100.0%) | $51,075 |
Occupancy by Householder Income Bracket in Golden Glades
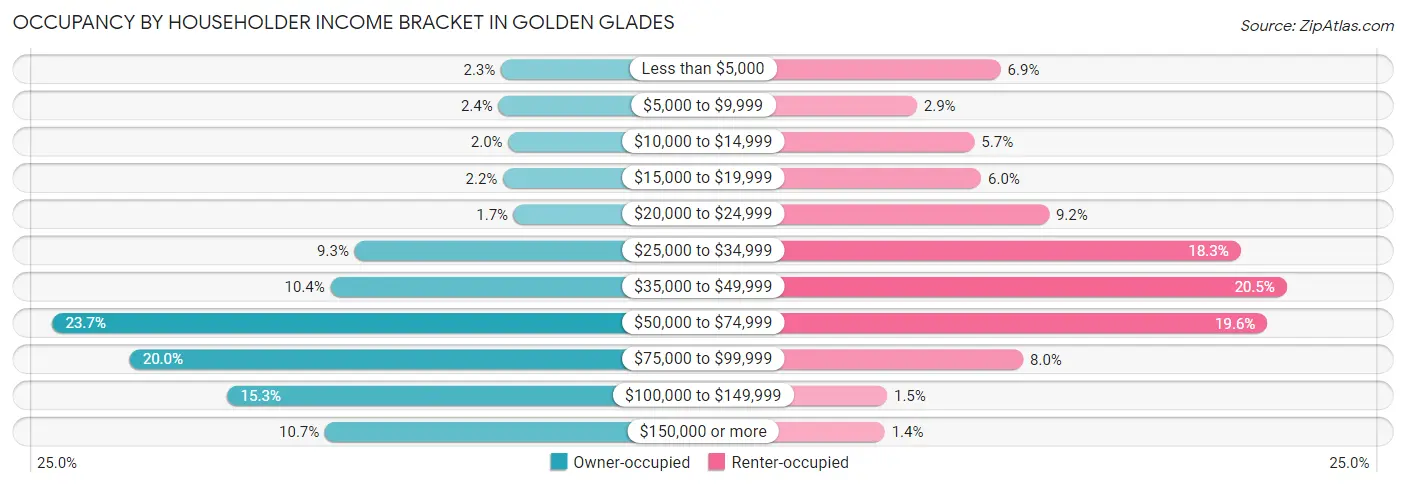
| Income Bracket | Owner-occupied | Renter-occupied |
| Less than $5,000 | 132 (2.3%) | 364 (6.9%) |
| $5,000 to $9,999 | 139 (2.4%) | 154 (2.9%) |
| $10,000 to $14,999 | 112 (2.0%) | 298 (5.7%) |
| $15,000 to $19,999 | 126 (2.2%) | 315 (6.0%) |
| $20,000 to $24,999 | 97 (1.7%) | 485 (9.2%) |
| $25,000 to $34,999 | 530 (9.3%) | 965 (18.3%) |
| $35,000 to $49,999 | 596 (10.4%) | 1,081 (20.5%) |
| $50,000 to $74,999 | 1,352 (23.7%) | 1,032 (19.6%) |
| $75,000 to $99,999 | 1,142 (20.0%) | 420 (8.0%) |
| $100,000 to $149,999 | 876 (15.3%) | 79 (1.5%) |
| $150,000 or more | 611 (10.7%) | 73 (1.4%) |
| Total | 5,713 (100.0%) | 5,266 (100.0%) |
Monthly Housing Cost Tiers in Golden Glades
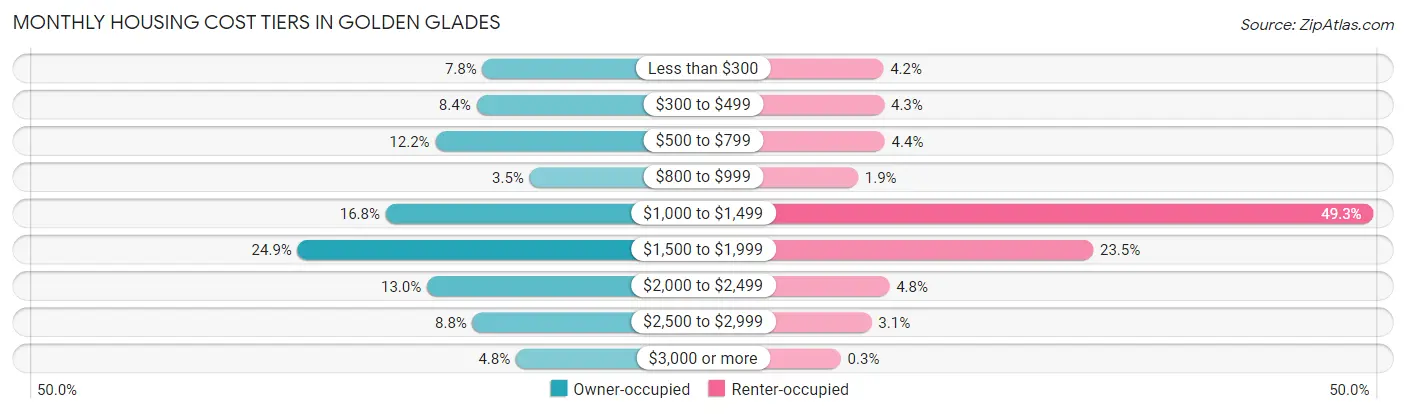
| Monthly Cost | Owner-occupied | Renter-occupied |
| Less than $300 | 448 (7.8%) | 222 (4.2%) |
| $300 to $499 | 480 (8.4%) | 226 (4.3%) |
| $500 to $799 | 696 (12.2%) | 229 (4.3%) |
| $800 to $999 | 200 (3.5%) | 99 (1.9%) |
| $1,000 to $1,499 | 957 (16.8%) | 2,598 (49.3%) |
| $1,500 to $1,999 | 1,420 (24.9%) | 1,239 (23.5%) |
| $2,000 to $2,499 | 740 (13.0%) | 251 (4.8%) |
| $2,500 to $2,999 | 500 (8.7%) | 165 (3.1%) |
| $3,000 or more | 272 (4.8%) | 16 (0.3%) |
| Total | 5,713 (100.0%) | 5,266 (100.0%) |
Physical Housing Characteristics in Golden Glades
Housing Structures in Golden Glades
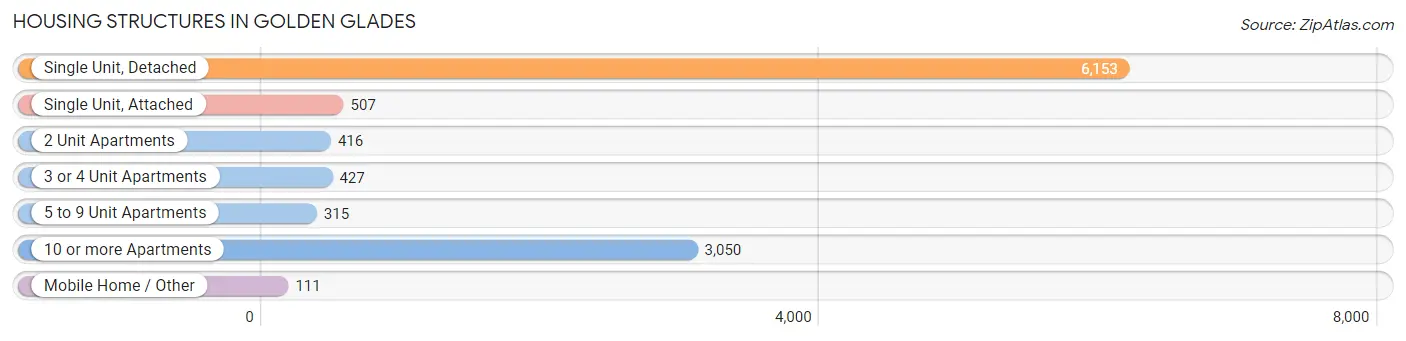
| Structure Type | # Housing Units | % Housing Units |
| Single Unit, Detached | 6,153 | 56.0% |
| Single Unit, Attached | 507 | 4.6% |
| 2 Unit Apartments | 416 | 3.8% |
| 3 or 4 Unit Apartments | 427 | 3.9% |
| 5 to 9 Unit Apartments | 315 | 2.9% |
| 10 or more Apartments | 3,050 | 27.8% |
| Mobile Home / Other | 111 | 1.0% |
| Total | 10,979 | 100.0% |
Housing Structures by Occupancy in Golden Glades
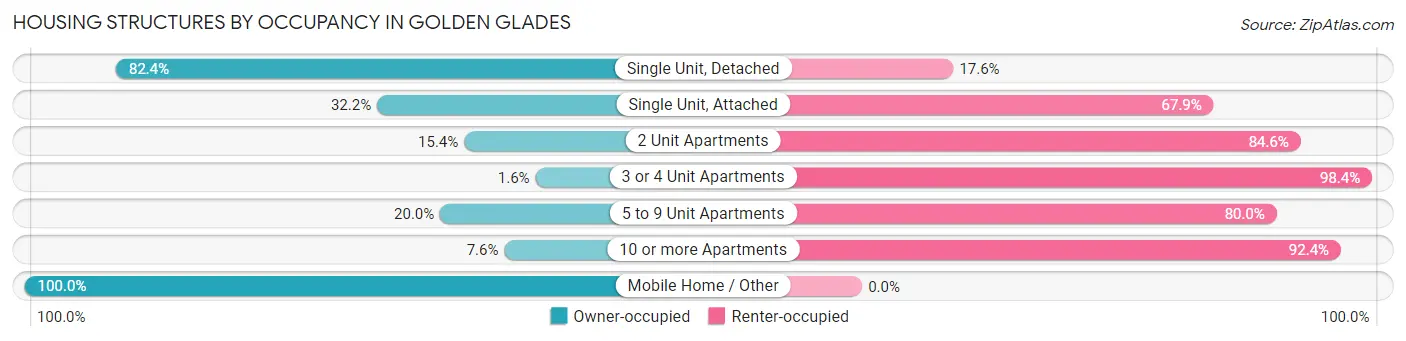
| Structure Type | Owner-occupied | Renter-occupied |
| Single Unit, Detached | 5,072 (82.4%) | 1,081 (17.6%) |
| Single Unit, Attached | 163 (32.2%) | 344 (67.8%) |
| 2 Unit Apartments | 64 (15.4%) | 352 (84.6%) |
| 3 or 4 Unit Apartments | 7 (1.6%) | 420 (98.4%) |
| 5 to 9 Unit Apartments | 63 (20.0%) | 252 (80.0%) |
| 10 or more Apartments | 233 (7.6%) | 2,817 (92.4%) |
| Mobile Home / Other | 111 (100.0%) | 0 (0.0%) |
| Total | 5,713 (52.0%) | 5,266 (48.0%) |
Housing Structures by Number of Rooms in Golden Glades
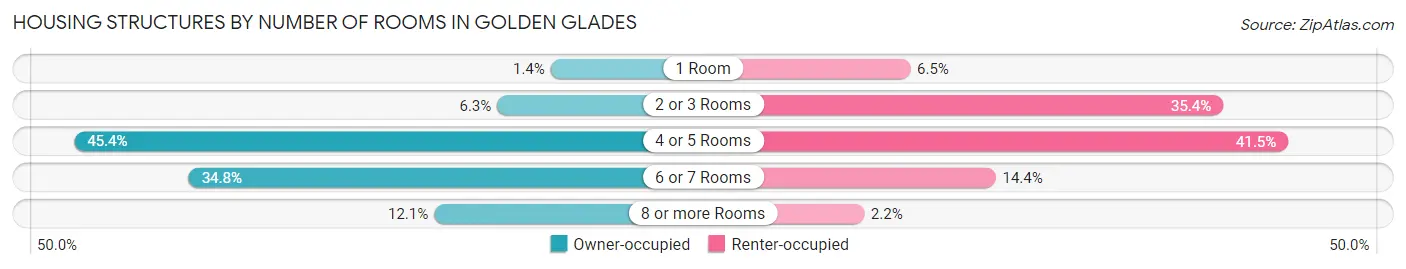
| Number of Rooms | Owner-occupied | Renter-occupied |
| 1 Room | 77 (1.3%) | 342 (6.5%) |
| 2 or 3 Rooms | 360 (6.3%) | 1,866 (35.4%) |
| 4 or 5 Rooms | 2,594 (45.4%) | 2,183 (41.4%) |
| 6 or 7 Rooms | 1,989 (34.8%) | 758 (14.4%) |
| 8 or more Rooms | 693 (12.1%) | 117 (2.2%) |
| Total | 5,713 (100.0%) | 5,266 (100.0%) |
Housing Structure by Heating Type in Golden Glades
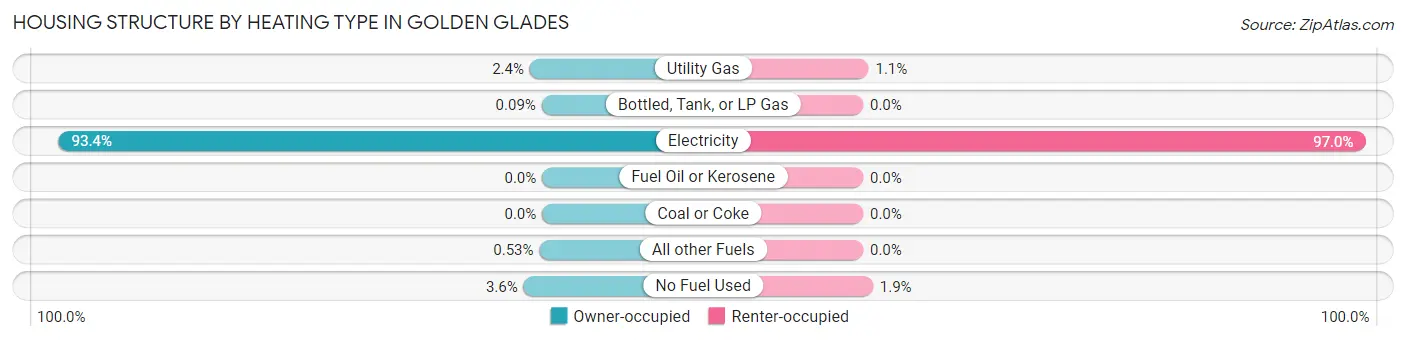
| Heating Type | Owner-occupied | Renter-occupied |
| Utility Gas | 136 (2.4%) | 56 (1.1%) |
| Bottled, Tank, or LP Gas | 5 (0.1%) | 0 (0.0%) |
| Electricity | 5,337 (93.4%) | 5,110 (97.0%) |
| Fuel Oil or Kerosene | 0 (0.0%) | 0 (0.0%) |
| Coal or Coke | 0 (0.0%) | 0 (0.0%) |
| All other Fuels | 30 (0.5%) | 0 (0.0%) |
| No Fuel Used | 205 (3.6%) | 100 (1.9%) |
| Total | 5,713 (100.0%) | 5,266 (100.0%) |
Household Vehicle Usage in Golden Glades
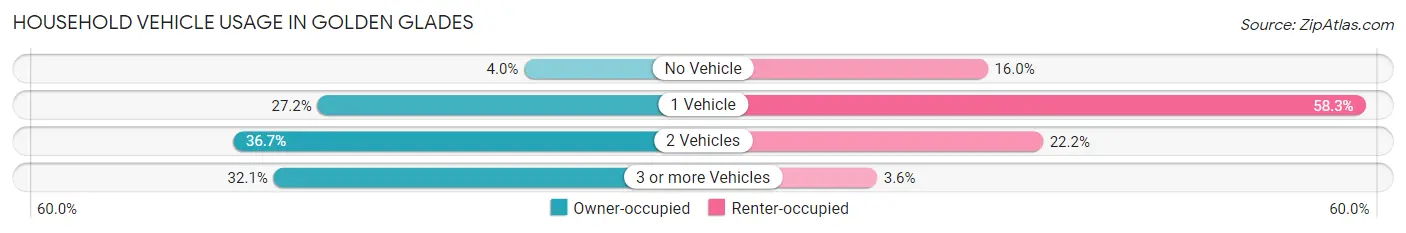
| Vehicles per Household | Owner-occupied | Renter-occupied |
| No Vehicle | 231 (4.0%) | 841 (16.0%) |
| 1 Vehicle | 1,553 (27.2%) | 3,070 (58.3%) |
| 2 Vehicles | 2,095 (36.7%) | 1,167 (22.2%) |
| 3 or more Vehicles | 1,834 (32.1%) | 188 (3.6%) |
| Total | 5,713 (100.0%) | 5,266 (100.0%) |
Real Estate & Mortgages in Golden Glades
Real Estate and Mortgage Overview in Golden Glades
| Characteristic | Without Mortgage | With Mortgage |
| Housing Units | 1,796 | 3,917 |
| Median Property Value | $279,600 | $328,100 |
| Median Household Income | $47,454 | $491 |
| Monthly Housing Costs | $492 | $272 |
| Real Estate Taxes | $1,678 | $284 |
Property Value by Mortgage Status in Golden Glades
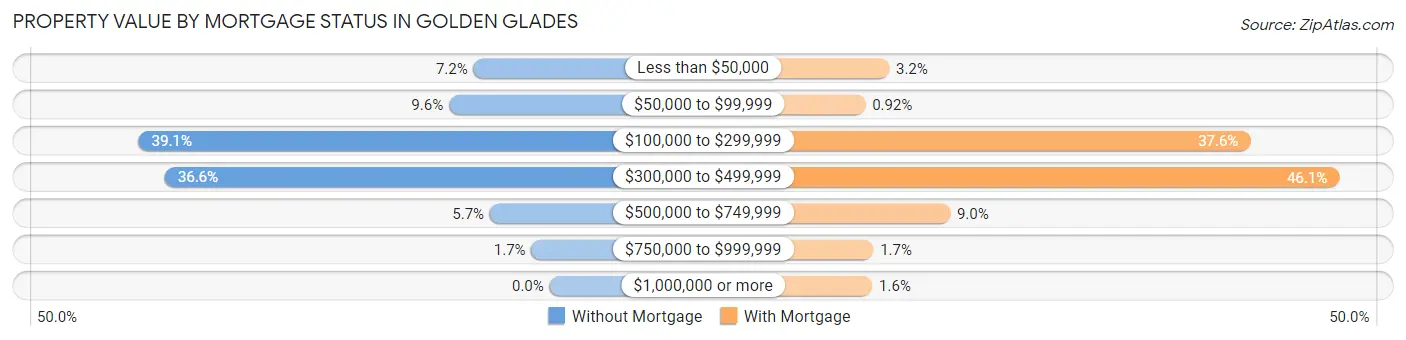
| Property Value | Without Mortgage | With Mortgage |
| Less than $50,000 | 130 (7.2%) | 125 (3.2%) |
| $50,000 to $99,999 | 172 (9.6%) | 36 (0.9%) |
| $100,000 to $299,999 | 703 (39.1%) | 1,472 (37.6%) |
| $300,000 to $499,999 | 658 (36.6%) | 1,804 (46.1%) |
| $500,000 to $749,999 | 102 (5.7%) | 352 (9.0%) |
| $750,000 to $999,999 | 31 (1.7%) | 66 (1.7%) |
| $1,000,000 or more | 0 (0.0%) | 62 (1.6%) |
| Total | 1,796 (100.0%) | 3,917 (100.0%) |
Household Income by Mortgage Status in Golden Glades
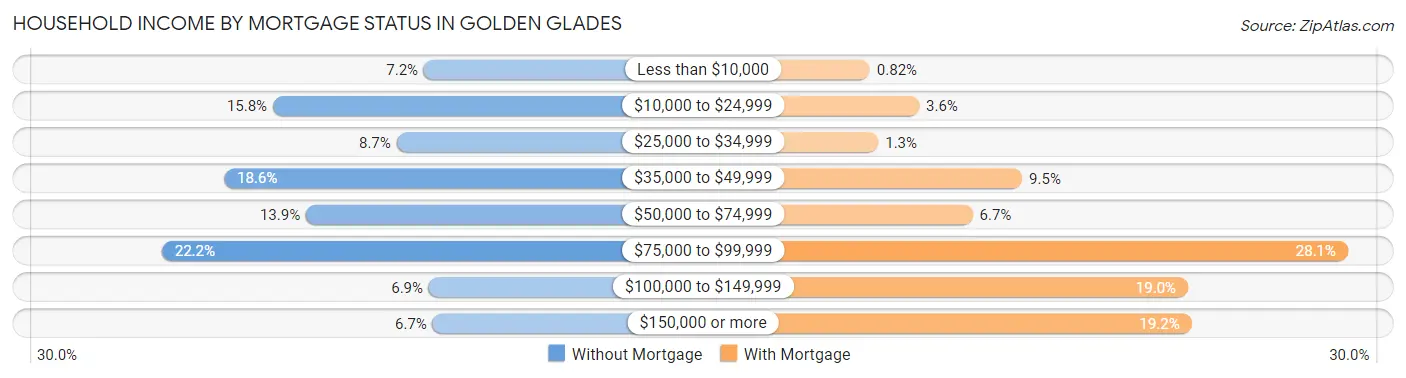
| Household Income | Without Mortgage | With Mortgage |
| Less than $10,000 | 129 (7.2%) | 32 (0.8%) |
| $10,000 to $24,999 | 284 (15.8%) | 142 (3.6%) |
| $25,000 to $34,999 | 157 (8.7%) | 51 (1.3%) |
| $35,000 to $49,999 | 334 (18.6%) | 373 (9.5%) |
| $50,000 to $74,999 | 250 (13.9%) | 262 (6.7%) |
| $75,000 to $99,999 | 398 (22.2%) | 1,102 (28.1%) |
| $100,000 to $149,999 | 124 (6.9%) | 744 (19.0%) |
| $150,000 or more | 120 (6.7%) | 752 (19.2%) |
| Total | 1,796 (100.0%) | 3,917 (100.0%) |
Property Value to Household Income Ratio in Golden Glades
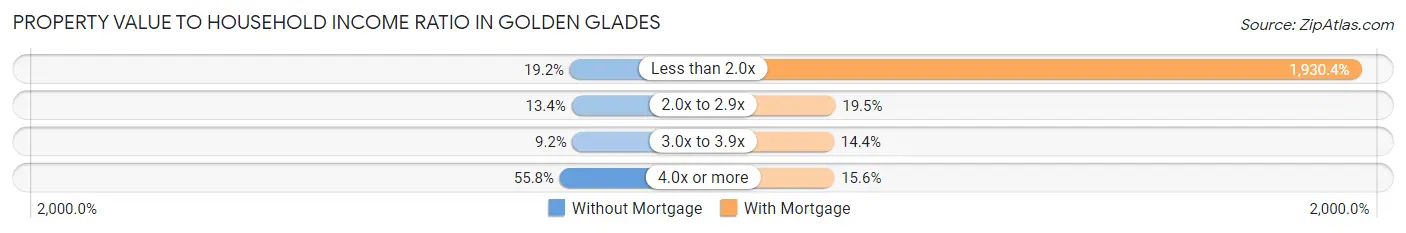
| Value-to-Income Ratio | Without Mortgage | With Mortgage |
| Less than 2.0x | 345 (19.2%) | 75,614 (1,930.4%) |
| 2.0x to 2.9x | 241 (13.4%) | 765 (19.5%) |
| 3.0x to 3.9x | 166 (9.2%) | 563 (14.4%) |
| 4.0x or more | 1,002 (55.8%) | 612 (15.6%) |
| Total | 1,796 (100.0%) | 3,917 (100.0%) |
Real Estate Taxes by Mortgage Status in Golden Glades
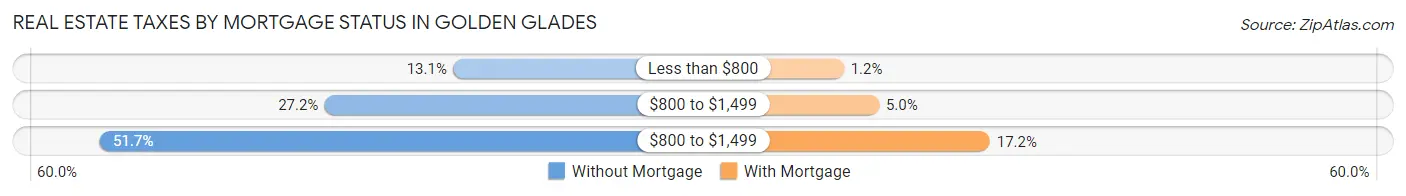
| Property Taxes | Without Mortgage | With Mortgage |
| Less than $800 | 235 (13.1%) | 46 (1.2%) |
| $800 to $1,499 | 488 (27.2%) | 197 (5.0%) |
| $800 to $1,499 | 929 (51.7%) | 673 (17.2%) |
| Total | 1,796 (100.0%) | 3,917 (100.0%) |
Health & Disability in Golden Glades
Health Insurance Coverage by Age in Golden Glades
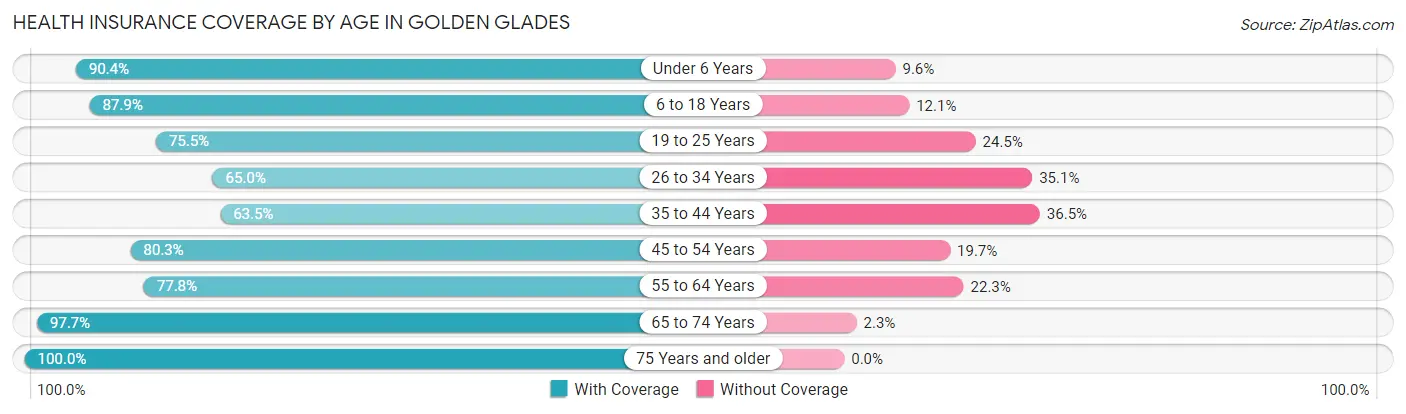
| Age Bracket | With Coverage | Without Coverage |
| Under 6 Years | 2,337 (90.4%) | 247 (9.6%) |
| 6 to 18 Years | 5,131 (87.9%) | 707 (12.1%) |
| 19 to 25 Years | 2,919 (75.5%) | 947 (24.5%) |
| 26 to 34 Years | 2,583 (64.9%) | 1,394 (35.0%) |
| 35 to 44 Years | 2,737 (63.5%) | 1,572 (36.5%) |
| 45 to 54 Years | 3,246 (80.3%) | 798 (19.7%) |
| 55 to 64 Years | 3,575 (77.7%) | 1,023 (22.3%) |
| 65 to 74 Years | 2,944 (97.7%) | 69 (2.3%) |
| 75 Years and older | 1,979 (100.0%) | 0 (0.0%) |
| Total | 27,451 (80.2%) | 6,757 (19.8%) |
Health Insurance Coverage by Citizenship Status in Golden Glades
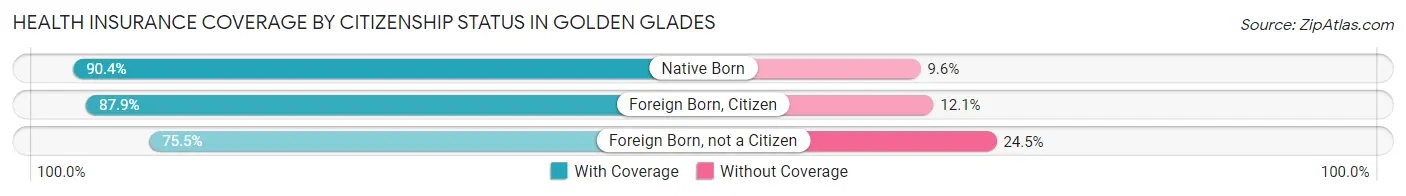
| Citizenship Status | With Coverage | Without Coverage |
| Native Born | 2,337 (90.4%) | 247 (9.6%) |
| Foreign Born, Citizen | 5,131 (87.9%) | 707 (12.1%) |
| Foreign Born, not a Citizen | 2,919 (75.5%) | 947 (24.5%) |
Health Insurance Coverage by Household Income in Golden Glades
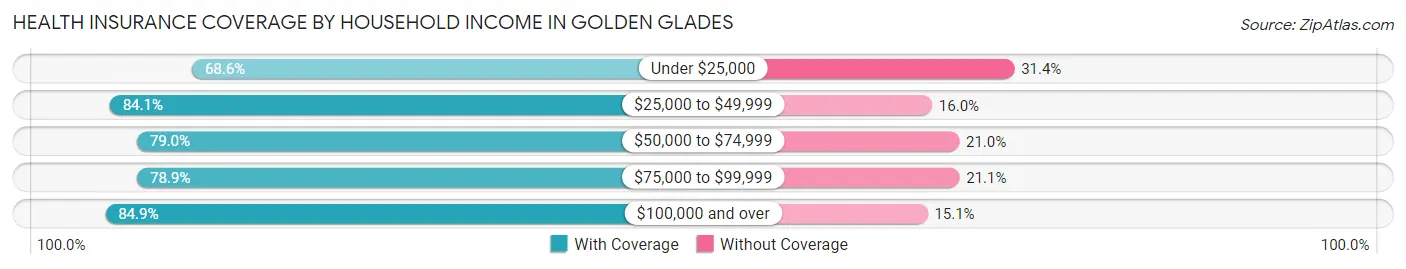
| Household Income | With Coverage | Without Coverage |
| Under $25,000 | 2,929 (68.6%) | 1,338 (31.4%) |
| $25,000 to $49,999 | 7,321 (84.1%) | 1,389 (16.0%) |
| $50,000 to $74,999 | 6,550 (79.0%) | 1,744 (21.0%) |
| $75,000 to $99,999 | 4,650 (78.9%) | 1,242 (21.1%) |
| $100,000 and over | 5,825 (84.9%) | 1,037 (15.1%) |
Public vs Private Health Insurance Coverage by Age in Golden Glades
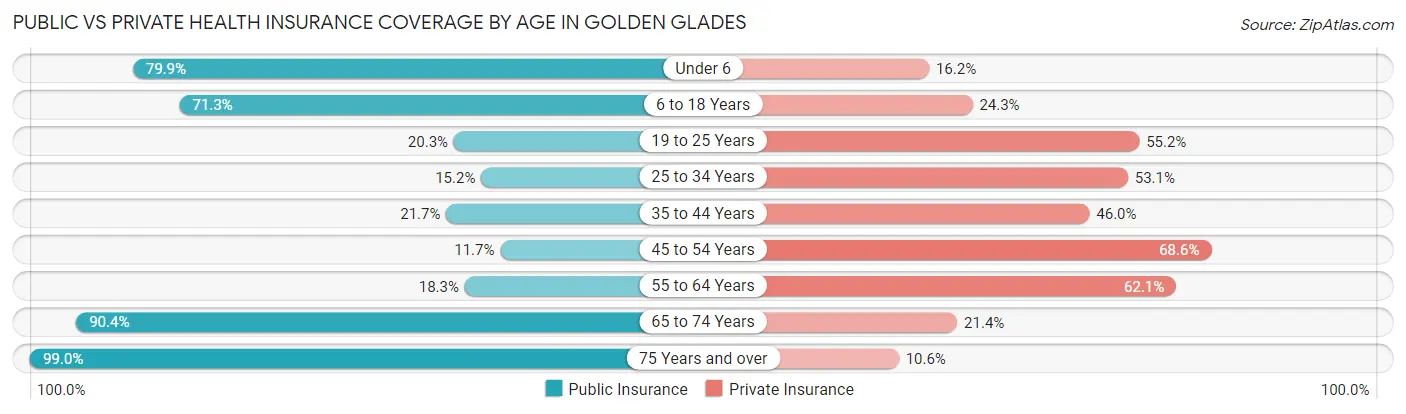
| Age Bracket | Public Insurance | Private Insurance |
| Under 6 | 2,065 (79.9%) | 418 (16.2%) |
| 6 to 18 Years | 4,160 (71.3%) | 1,416 (24.2%) |
| 19 to 25 Years | 785 (20.3%) | 2,134 (55.2%) |
| 25 to 34 Years | 606 (15.2%) | 2,111 (53.1%) |
| 35 to 44 Years | 936 (21.7%) | 1,980 (46.0%) |
| 45 to 54 Years | 473 (11.7%) | 2,773 (68.6%) |
| 55 to 64 Years | 841 (18.3%) | 2,853 (62.1%) |
| 65 to 74 Years | 2,724 (90.4%) | 645 (21.4%) |
| 75 Years and over | 1,959 (99.0%) | 209 (10.6%) |
| Total | 14,549 (42.5%) | 14,539 (42.5%) |
Disability Status by Sex by Age in Golden Glades
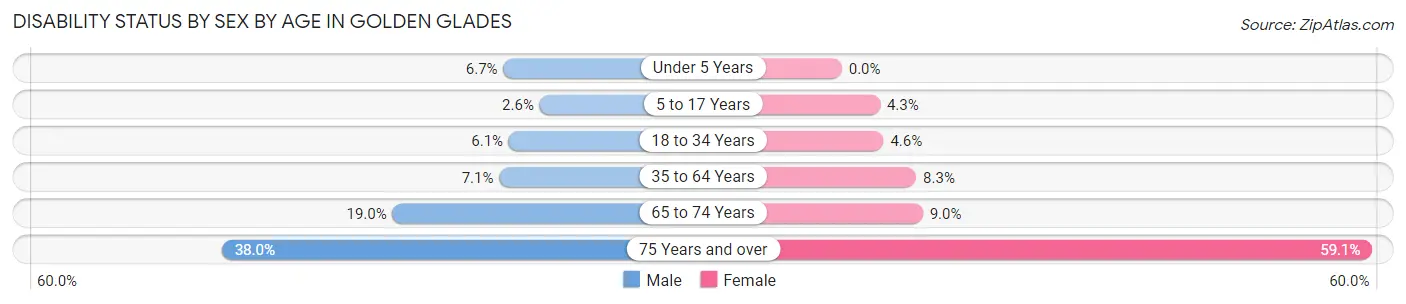
| Age Bracket | Male | Female |
| Under 5 Years | 93 (6.7%) | 0 (0.0%) |
| 5 to 17 Years | 77 (2.6%) | 125 (4.3%) |
| 18 to 34 Years | 276 (6.1%) | 167 (4.6%) |
| 35 to 64 Years | 438 (7.1%) | 564 (8.3%) |
| 65 to 74 Years | 286 (19.0%) | 136 (9.0%) |
| 75 Years and over | 275 (38.0%) | 742 (59.1%) |
Disability Class by Sex by Age in Golden Glades
Disability Class: Hearing Difficulty
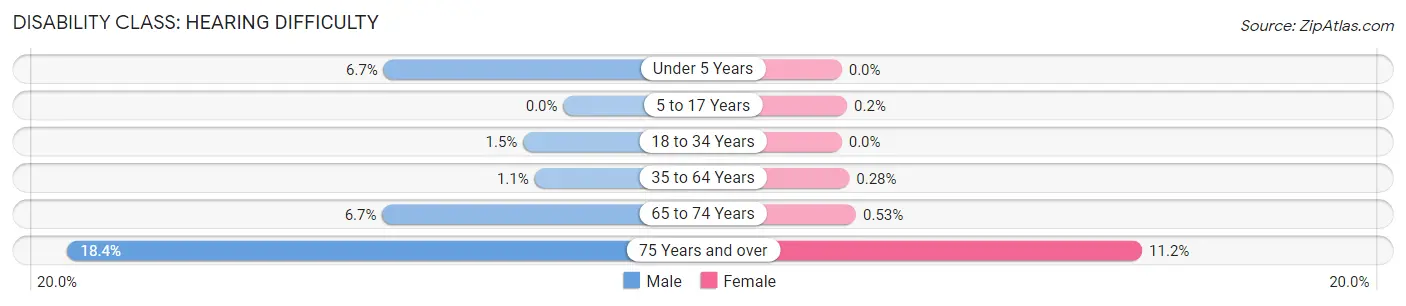
| Age Bracket | Male | Female |
| Under 5 Years | 93 (6.7%) | 0 (0.0%) |
| 5 to 17 Years | 0 (0.0%) | 6 (0.2%) |
| 18 to 34 Years | 68 (1.5%) | 0 (0.0%) |
| 35 to 64 Years | 66 (1.1%) | 19 (0.3%) |
| 65 to 74 Years | 101 (6.7%) | 8 (0.5%) |
| 75 Years and over | 133 (18.4%) | 140 (11.2%) |
Disability Class: Vision Difficulty
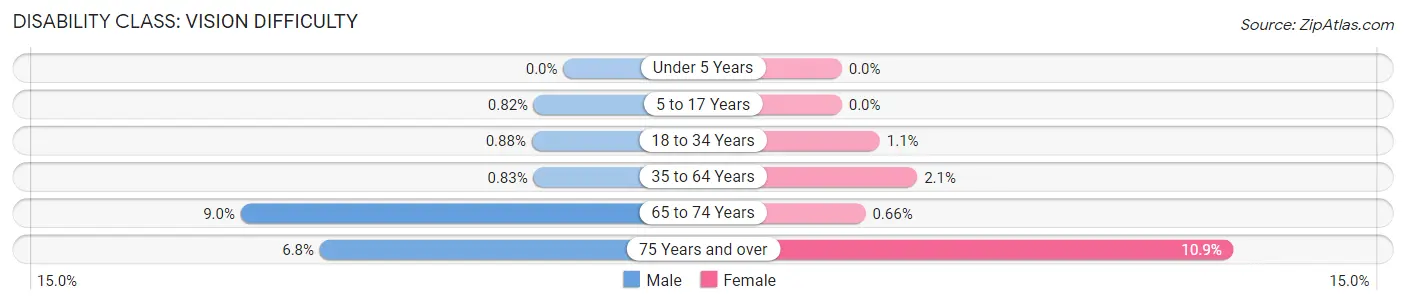
| Age Bracket | Male | Female |
| Under 5 Years | 0 (0.0%) | 0 (0.0%) |
| 5 to 17 Years | 24 (0.8%) | 0 (0.0%) |
| 18 to 34 Years | 40 (0.9%) | 38 (1.1%) |
| 35 to 64 Years | 51 (0.8%) | 143 (2.1%) |
| 65 to 74 Years | 135 (9.0%) | 10 (0.7%) |
| 75 Years and over | 49 (6.8%) | 137 (10.9%) |
Disability Class: Cognitive Difficulty
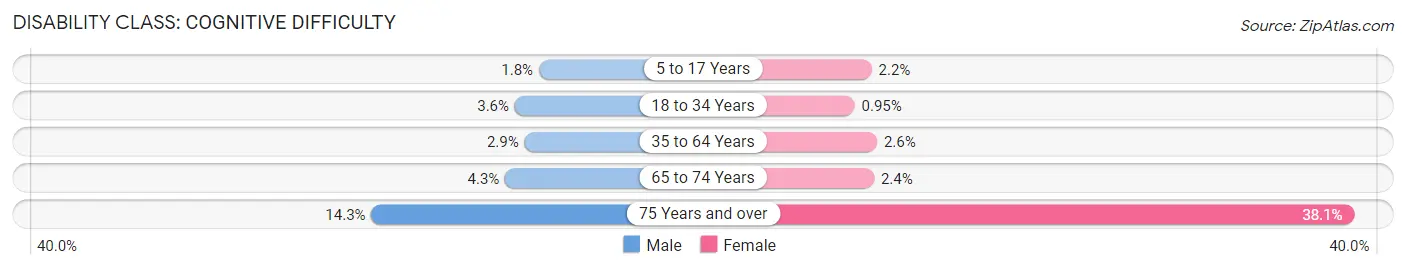
| Age Bracket | Male | Female |
| 5 to 17 Years | 53 (1.8%) | 65 (2.2%) |
| 18 to 34 Years | 164 (3.6%) | 34 (0.9%) |
| 35 to 64 Years | 177 (2.9%) | 178 (2.6%) |
| 65 to 74 Years | 65 (4.3%) | 36 (2.4%) |
| 75 Years and over | 103 (14.2%) | 478 (38.1%) |
Disability Class: Ambulatory Difficulty
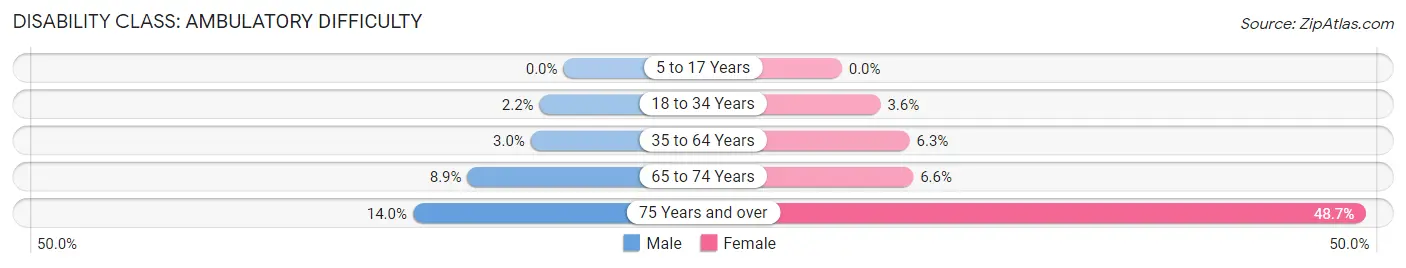
| Age Bracket | Male | Female |
| 5 to 17 Years | 0 (0.0%) | 0 (0.0%) |
| 18 to 34 Years | 101 (2.2%) | 129 (3.6%) |
| 35 to 64 Years | 186 (3.0%) | 428 (6.3%) |
| 65 to 74 Years | 134 (8.9%) | 100 (6.6%) |
| 75 Years and over | 101 (14.0%) | 611 (48.6%) |
Disability Class: Self-Care Difficulty
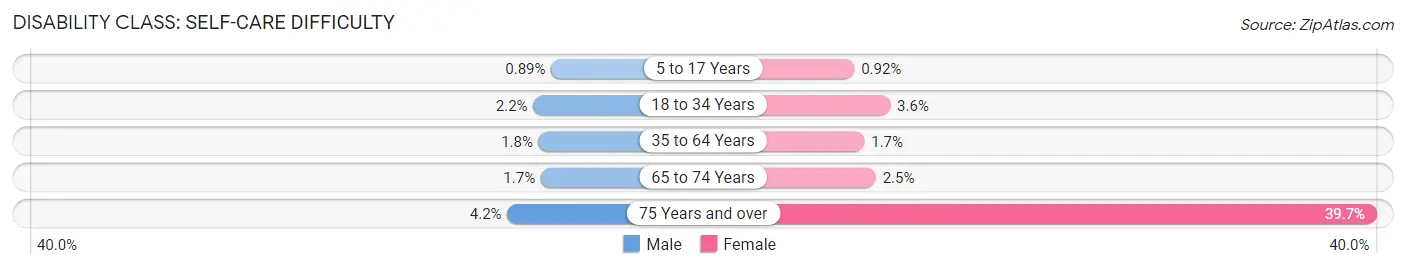
| Age Bracket | Male | Female |
| 5 to 17 Years | 26 (0.9%) | 27 (0.9%) |
| 18 to 34 Years | 101 (2.2%) | 129 (3.6%) |
| 35 to 64 Years | 112 (1.8%) | 114 (1.7%) |
| 65 to 74 Years | 25 (1.7%) | 38 (2.5%) |
| 75 Years and over | 30 (4.2%) | 499 (39.7%) |
Technology Access in Golden Glades
Computing Device Access in Golden Glades
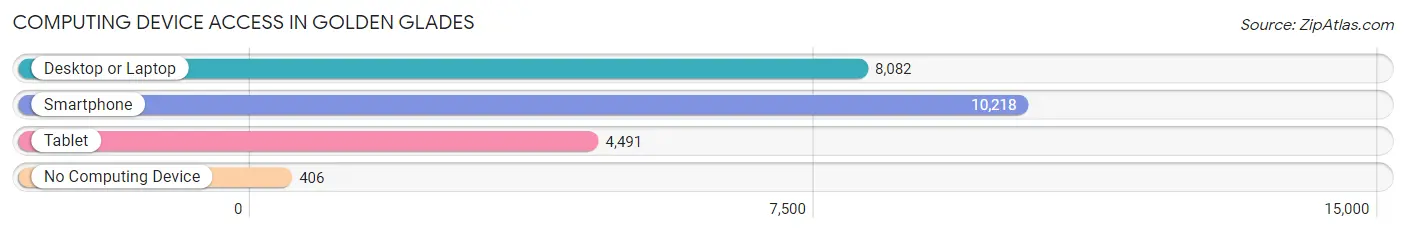
| Device Type | # Households | % Households |
| Desktop or Laptop | 8,082 | 73.6% |
| Smartphone | 10,218 | 93.1% |
| Tablet | 4,491 | 40.9% |
| No Computing Device | 406 | 3.7% |
| Total | 10,979 | 100.0% |
Internet Access in Golden Glades
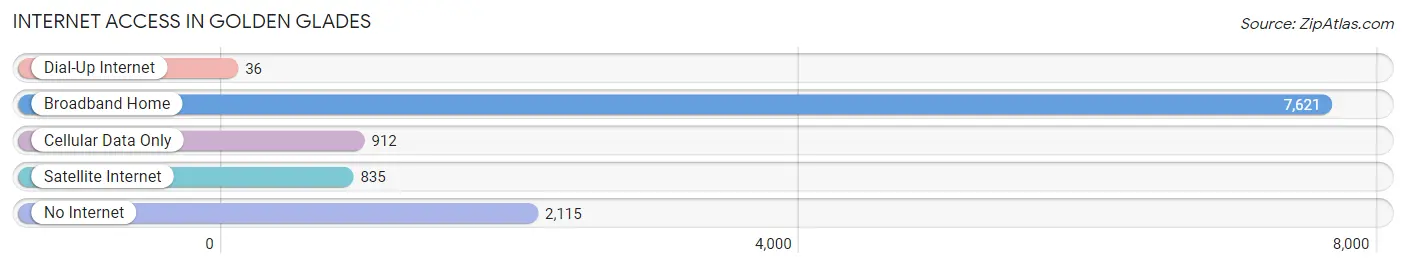
| Internet Type | # Households | % Households |
| Dial-Up Internet | 36 | 0.3% |
| Broadband Home | 7,621 | 69.4% |
| Cellular Data Only | 912 | 8.3% |
| Satellite Internet | 835 | 7.6% |
| No Internet | 2,115 | 19.3% |
| Total | 10,979 | 100.0% |
Golden Glades Summary
Golden Glades is a census-designated place (CDP) located in Miami-Dade County, Florida. It is situated in the northern part of the county, just south of the city of Miami. The population of Golden Glades was 8,945 at the 2010 census.
History
The area now known as Golden Glades was originally inhabited by the Tequesta Indians, who were the first Native American tribe to inhabit the area. The Tequesta Indians were a peaceful tribe that lived off the land and were known for their fishing and hunting skills. The Tequesta Indians were eventually displaced by the Seminole Indians, who were forced to move to the area after being driven out of their original homelands in Georgia and Alabama.
The area was first settled by European settlers in the late 19th century. The first settlers were mostly farmers and ranchers who were attracted to the area due to its fertile soil and abundant wildlife. The area was known as “Golden Glades” due to the golden hue of the grasses that grew in the area.
In the early 20th century, the area began to experience rapid growth due to the development of the Florida East Coast Railway. The railway provided easy access to the area, which allowed for the development of new businesses and industries. The area also experienced a population boom as people from all over the world moved to the area in search of a better life.
Geography
Golden Glades is located in the northern part of Miami-Dade County, just south of the city of Miami. It is bordered by the cities of Miami Gardens to the north, North Miami Beach to the east, and Miami Lakes to the south. The area is mostly flat, with an elevation of just 6 feet above sea level.
The area is home to several lakes, including Lake Lucerne, Lake Okeechobee, and Lake Osceola. The area is also home to several parks, including the Golden Glades Park, which is a popular spot for picnics and outdoor activities.
Economy
The economy of Golden Glades is largely based on tourism and service industries. The area is home to several hotels, restaurants, and other businesses that cater to tourists. The area is also home to several shopping centers, including the Golden Glades Shopping Center, which is one of the largest shopping centers in the area.
The area is also home to several industrial parks, which are home to a variety of businesses, including manufacturing, warehousing, and distribution. The area is also home to several medical centers, including the Miami-Dade County Medical Center, which is one of the largest medical centers in the area.
Demographics
As of the 2010 census, the population of Golden Glades was 8,945. The population is largely composed of African Americans, who make up the majority of the population at 63.3%. The next largest group is Hispanics, who make up 28.3% of the population. The remaining 8.4% of the population is composed of other races.
The median household income in Golden Glades is $37,845, which is slightly lower than the median household income for Miami-Dade County as a whole. The median home value in Golden Glades is $179,400, which is slightly higher than the median home value for Miami-Dade County as a whole. The area is largely composed of renters, with only 37.3% of the population owning their own homes.
Common Questions
What is Per Capita Income in Golden Glades?
Per Capita income in Golden Glades is $23,587.
What is the Median Family Income in Golden Glades?
Median Family Income in Golden Glades is $58,402.
What is the Median Household income in Golden Glades?
Median Household Income in Golden Glades is $51,075.
What is Income or Wage Gap in Golden Glades?
Income or Wage Gap in Golden Glades is 12.1%.
Women in Golden Glades earn 87.9 cents for every dollar earned by a man.
What is Inequality or Gini Index in Golden Glades?
Inequality or Gini Index in Golden Glades is 0.47.
What is the Total Population of Golden Glades?
Total Population of Golden Glades is 34,725.
What is the Total Male Population of Golden Glades?
Total Male Population of Golden Glades is 17,437.
What is the Total Female Population of Golden Glades?
Total Female Population of Golden Glades is 17,288.
What is the Ratio of Males per 100 Females in Golden Glades?
There are 100.86 Males per 100 Females in Golden Glades.
What is the Ratio of Females per 100 Males in Golden Glades?
There are 99.15 Females per 100 Males in Golden Glades.
What is the Median Population Age in Golden Glades?
Median Population Age in Golden Glades is 38.2 Years.
What is the Average Family Size in Golden Glades
Average Family Size in Golden Glades is 3.7 People.
What is the Average Household Size in Golden Glades
Average Household Size in Golden Glades is 3.1 People.
How Large is the Labor Force in Golden Glades?
There are 16,954 People in the Labor Forcein in Golden Glades.
What is the Percentage of People in the Labor Force in Golden Glades?
62.0% of People are in the Labor Force in Golden Glades.
What is the Unemployment Rate in Golden Glades?
Unemployment Rate in Golden Glades is 8.2%.