Palm Springs, FL Map & Demographics
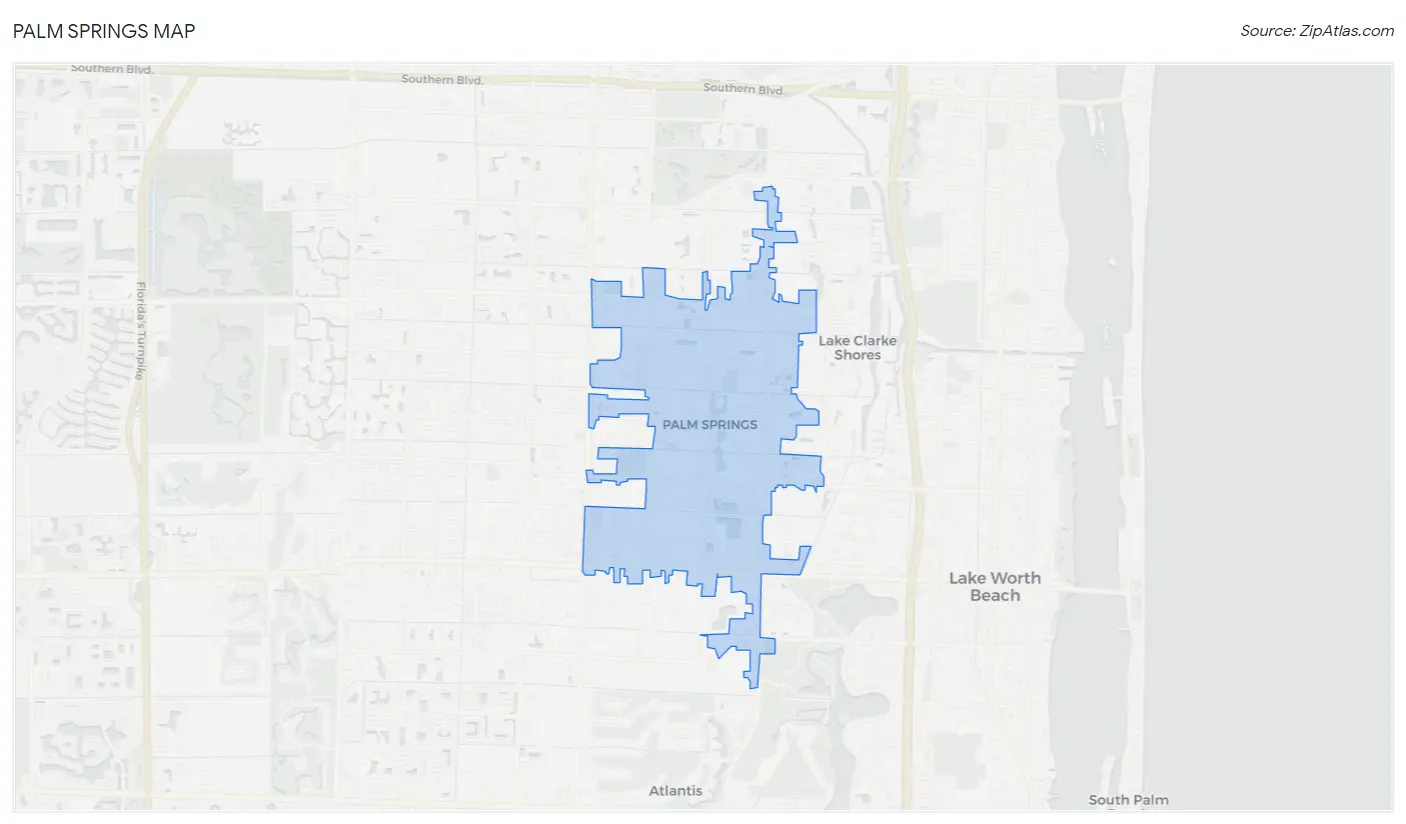
Palm Springs Map
Palm Springs Overview
$26,734
PER CAPITA INCOME
$60,108
AVG FAMILY INCOME
$55,254
AVG HOUSEHOLD INCOME
29.1%
WAGE / INCOME GAP [ % ]
70.9¢/ $1
WAGE / INCOME GAP [ $ ]
$9,952
FAMILY INCOME DEFICIT
0.41
INEQUALITY / GINI INDEX
26,692
TOTAL POPULATION
13,678
MALE POPULATION
13,014
FEMALE POPULATION
105.10
MALES / 100 FEMALES
95.15
FEMALES / 100 MALES
36.2
MEDIAN AGE
3.5
AVG FAMILY SIZE
3.0
AVG HOUSEHOLD SIZE
14,814
LABOR FORCE [ PEOPLE ]
70.7%
PERCENT IN LABOR FORCE
6.9%
UNEMPLOYMENT RATE
Palm Springs Area Codes
Income in Palm Springs
Income Overview in Palm Springs
Per Capita Income in Palm Springs is $26,734, while median incomes of families and households are $60,108 and $55,254 respectively.
| Characteristic | Number | Measure |
| Per Capita Income | 26,692 | $26,734 |
| Median Family Income | 6,174 | $60,108 |
| Mean Family Income | 6,174 | $76,867 |
| Median Household Income | 8,800 | $55,254 |
| Mean Household Income | 8,800 | $70,544 |
| Income Deficit | 6,174 | $9,952 |
| Wage / Income Gap (%) | 26,692 | 29.08% |
| Wage / Income Gap ($) | 26,692 | 70.92¢ per $1 |
| Gini / Inequality Index | 26,692 | 0.41 |
Earnings by Sex in Palm Springs
Average Earnings in Palm Springs are $31,589, $36,215 for men and $25,682 for women, a difference of 29.1%.
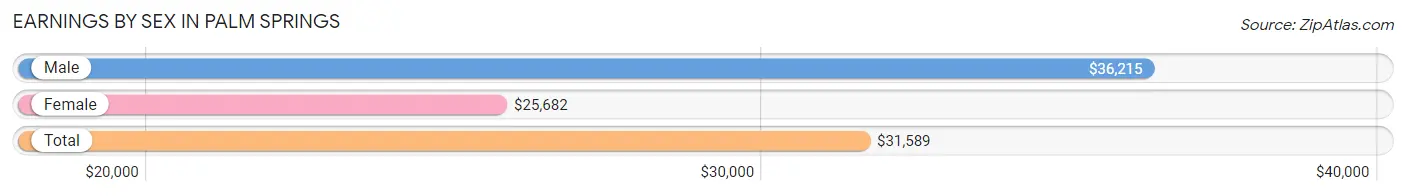
| Sex | Number | Average Earnings |
| Male | 8,574 (56.0%) | $36,215 |
| Female | 6,745 (44.0%) | $25,682 |
| Total | 15,319 (100.0%) | $31,589 |
Earnings by Sex by Income Bracket in Palm Springs
The most common earnings brackets in Palm Springs are $35,000 to $39,999 for men (997 | 11.6%) and $25,000 to $29,999 for women (698 | 10.3%).
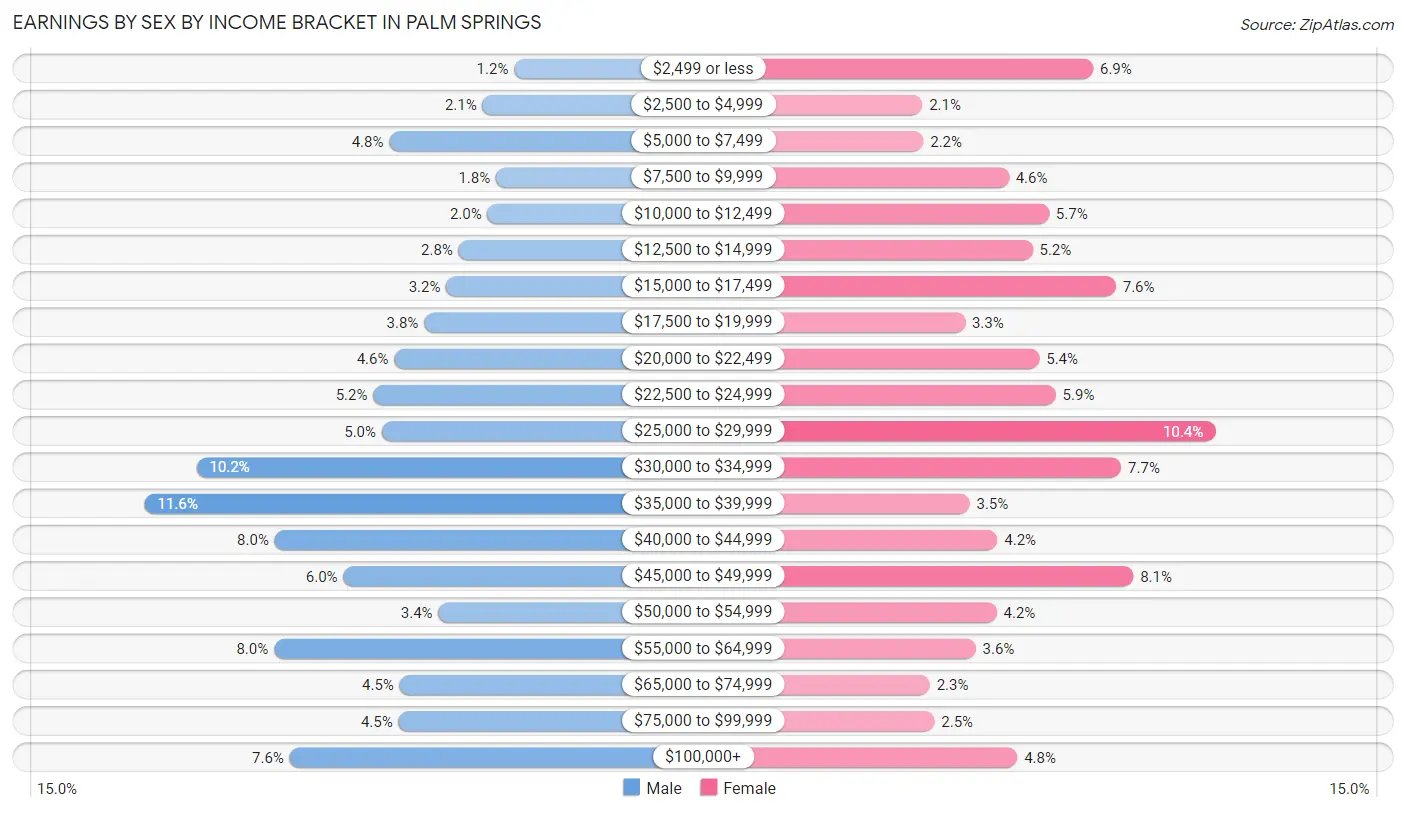
| Income | Male | Female |
| $2,499 or less | 106 (1.2%) | 467 (6.9%) |
| $2,500 to $4,999 | 183 (2.1%) | 143 (2.1%) |
| $5,000 to $7,499 | 407 (4.8%) | 145 (2.1%) |
| $7,500 to $9,999 | 150 (1.8%) | 307 (4.5%) |
| $10,000 to $12,499 | 171 (2.0%) | 383 (5.7%) |
| $12,500 to $14,999 | 240 (2.8%) | 352 (5.2%) |
| $15,000 to $17,499 | 270 (3.2%) | 510 (7.6%) |
| $17,500 to $19,999 | 323 (3.8%) | 224 (3.3%) |
| $20,000 to $22,499 | 395 (4.6%) | 365 (5.4%) |
| $22,500 to $24,999 | 446 (5.2%) | 396 (5.9%) |
| $25,000 to $29,999 | 425 (5.0%) | 698 (10.3%) |
| $30,000 to $34,999 | 872 (10.2%) | 520 (7.7%) |
| $35,000 to $39,999 | 997 (11.6%) | 233 (3.5%) |
| $40,000 to $44,999 | 683 (8.0%) | 285 (4.2%) |
| $45,000 to $49,999 | 518 (6.0%) | 543 (8.1%) |
| $50,000 to $54,999 | 289 (3.4%) | 284 (4.2%) |
| $55,000 to $64,999 | 685 (8.0%) | 244 (3.6%) |
| $65,000 to $74,999 | 382 (4.5%) | 157 (2.3%) |
| $75,000 to $99,999 | 385 (4.5%) | 166 (2.5%) |
| $100,000+ | 647 (7.5%) | 323 (4.8%) |
| Total | 8,574 (100.0%) | 6,745 (100.0%) |
Earnings by Sex by Educational Attainment in Palm Springs
Average earnings in Palm Springs are $37,719 for men and $28,892 for women, a difference of 23.4%. Men with an educational attainment of bachelor's degree enjoy the highest average annual earnings of $55,350, while those with less than high school education earn the least with $35,399. Women with an educational attainment of graduate degree earn the most with the average annual earnings of $50,500, while those with less than high school education have the smallest earnings of $15,177.
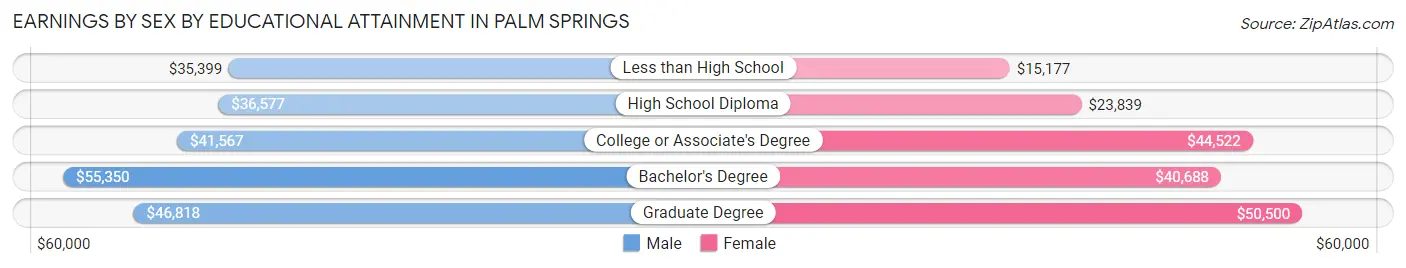
| Educational Attainment | Male Income | Female Income |
| Less than High School | $35,399 | $15,177 |
| High School Diploma | $36,577 | $23,839 |
| College or Associate's Degree | $41,567 | $44,522 |
| Bachelor's Degree | $55,350 | $40,688 |
| Graduate Degree | $46,818 | $50,500 |
| Total | $37,719 | $28,892 |
Family Income in Palm Springs
Family Income Brackets in Palm Springs
According to the Palm Springs family income data, there are 1,463 families falling into the $50,000 to $74,999 income range, which is the most common income bracket and makes up 23.7% of all families. Conversely, the $10,000 to $14,999 income bracket is the least frequent group with only 105 families (1.7%) belonging to this category.
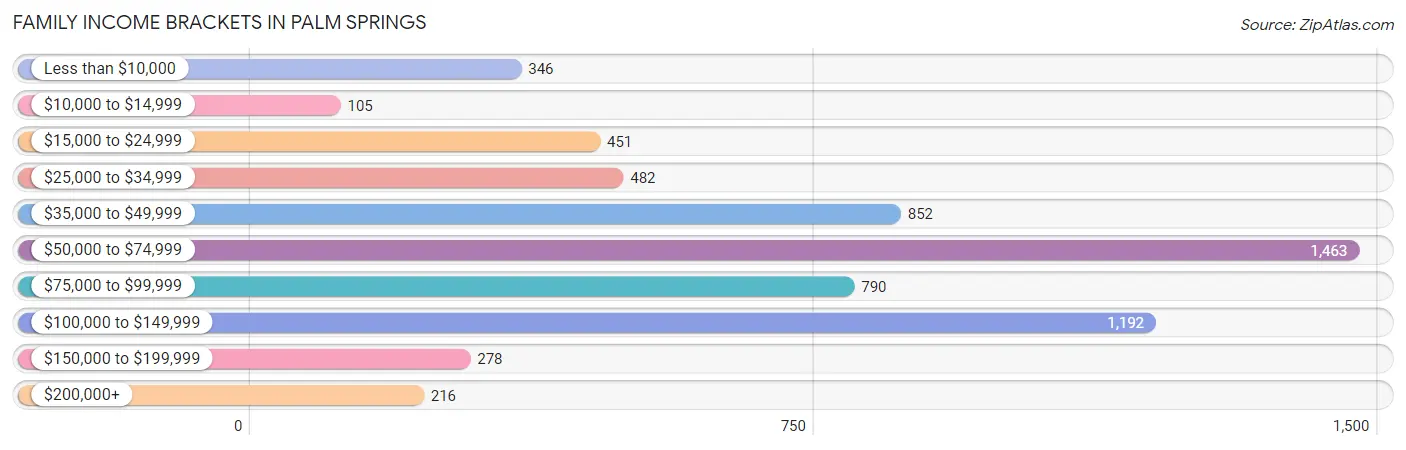
| Income Bracket | # Families | % Families |
| Less than $10,000 | 346 | 5.6% |
| $10,000 to $14,999 | 105 | 1.7% |
| $15,000 to $24,999 | 451 | 7.3% |
| $25,000 to $34,999 | 482 | 7.8% |
| $35,000 to $49,999 | 852 | 13.8% |
| $50,000 to $74,999 | 1,463 | 23.7% |
| $75,000 to $99,999 | 790 | 12.8% |
| $100,000 to $149,999 | 1,192 | 19.3% |
| $150,000 to $199,999 | 278 | 4.5% |
| $200,000+ | 216 | 3.5% |
Family Income by Famaliy Size in Palm Springs
6-person families (221 | 3.6%) account for the highest median family income in Palm Springs with $100,458 per family, while 2-person families (2,456 | 39.8%) have the highest median income of $28,073 per family member.
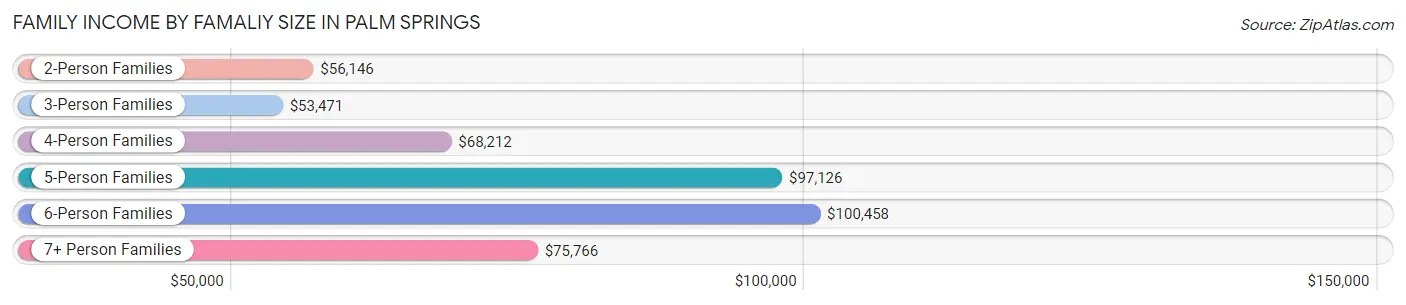
| Income Bracket | # Families | Median Income |
| 2-Person Families | 2,456 (39.8%) | $56,146 |
| 3-Person Families | 1,512 (24.5%) | $53,471 |
| 4-Person Families | 1,153 (18.7%) | $68,212 |
| 5-Person Families | 627 (10.2%) | $97,126 |
| 6-Person Families | 221 (3.6%) | $100,458 |
| 7+ Person Families | 205 (3.3%) | $75,766 |
| Total | 6,174 (100.0%) | $60,108 |
Family Income by Number of Earners in Palm Springs
The median family income in Palm Springs is $60,108, with families comprising 3+ earners (1,085) having the highest median family income of $98,813, while families with no earners (470) have the lowest median family income of $31,771, accounting for 17.6% and 7.6% of families, respectively.
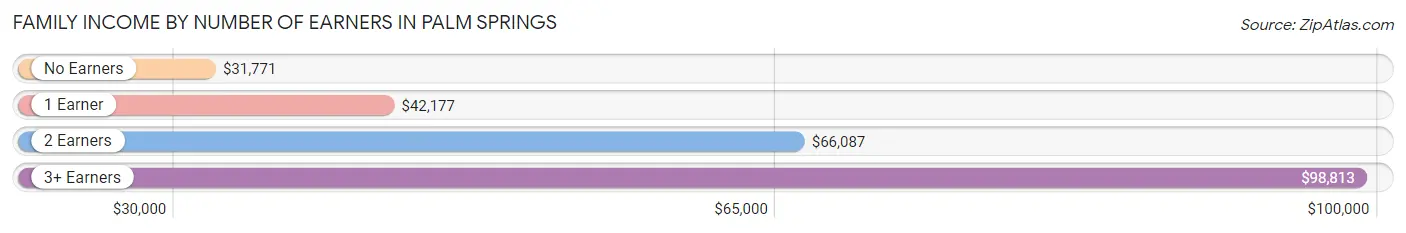
| Number of Earners | # Families | Median Income |
| No Earners | 470 (7.6%) | $31,771 |
| 1 Earner | 2,283 (37.0%) | $42,177 |
| 2 Earners | 2,336 (37.8%) | $66,087 |
| 3+ Earners | 1,085 (17.6%) | $98,813 |
| Total | 6,174 (100.0%) | $60,108 |
Household Income in Palm Springs
Household Income Brackets in Palm Springs
With 1,751 households falling in the category, the $50,000 to $74,999 income range is the most frequent in Palm Springs, accounting for 19.9% of all households. In contrast, only 246 households (2.8%) fall into the $200,000+ income bracket, making it the least populous group.
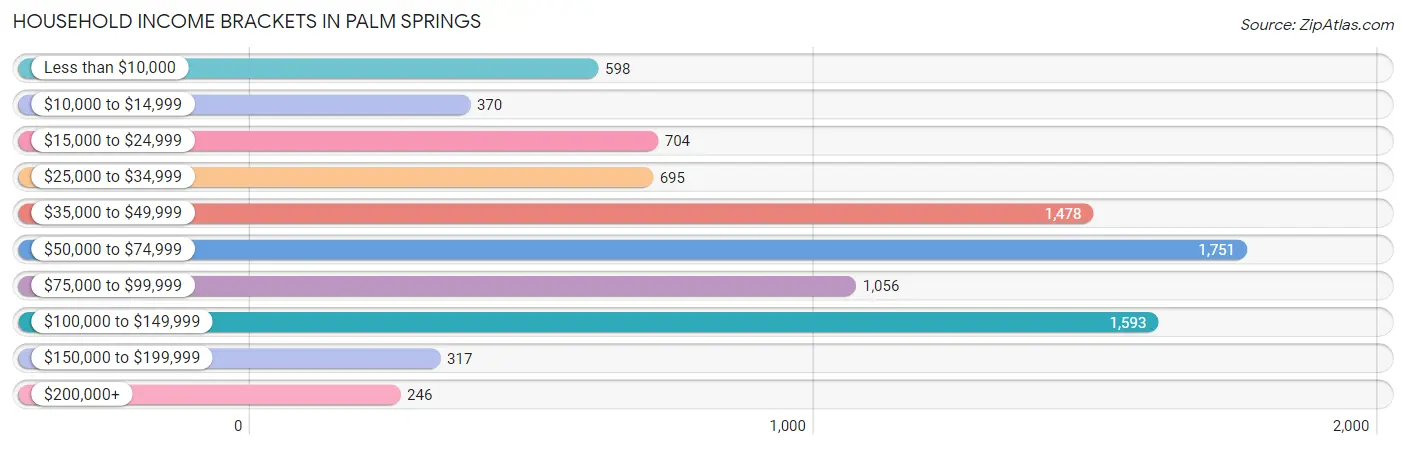
| Income Bracket | # Households | % Households |
| Less than $10,000 | 598 | 6.8% |
| $10,000 to $14,999 | 370 | 4.2% |
| $15,000 to $24,999 | 704 | 8.0% |
| $25,000 to $34,999 | 695 | 7.9% |
| $35,000 to $49,999 | 1,478 | 16.8% |
| $50,000 to $74,999 | 1,751 | 19.9% |
| $75,000 to $99,999 | 1,056 | 12.0% |
| $100,000 to $149,999 | 1,593 | 18.1% |
| $150,000 to $199,999 | 317 | 3.6% |
| $200,000+ | 246 | 2.8% |
Household Income by Householder Age in Palm Springs
The median household income in Palm Springs is $55,254, with the highest median household income of $59,840 found in the 45 to 64 years age bracket for the primary householder. A total of 3,053 households (34.7%) fall into this category. Meanwhile, the 15 to 24 years age bracket for the primary householder has the lowest median household income of $20,729, with 229 households (2.6%) in this group.
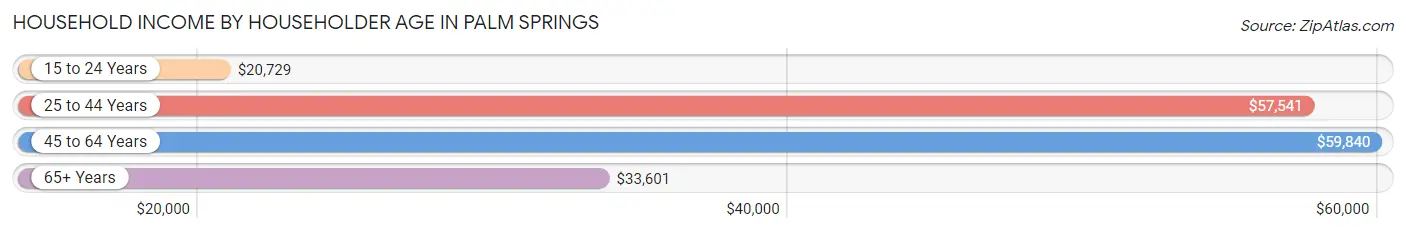
| Income Bracket | # Households | Median Income |
| 15 to 24 Years | 229 (2.6%) | $20,729 |
| 25 to 44 Years | 3,619 (41.1%) | $57,541 |
| 45 to 64 Years | 3,053 (34.7%) | $59,840 |
| 65+ Years | 1,899 (21.6%) | $33,601 |
| Total | 8,800 (100.0%) | $55,254 |
Poverty in Palm Springs
Income Below Poverty by Sex and Age in Palm Springs
With 12.6% poverty level for males and 15.1% for females among the residents of Palm Springs, 12 to 14 year old males and 65 to 74 year old females are the most vulnerable to poverty, with 351 males (45.4%) and 307 females (28.6%) in their respective age groups living below the poverty level.
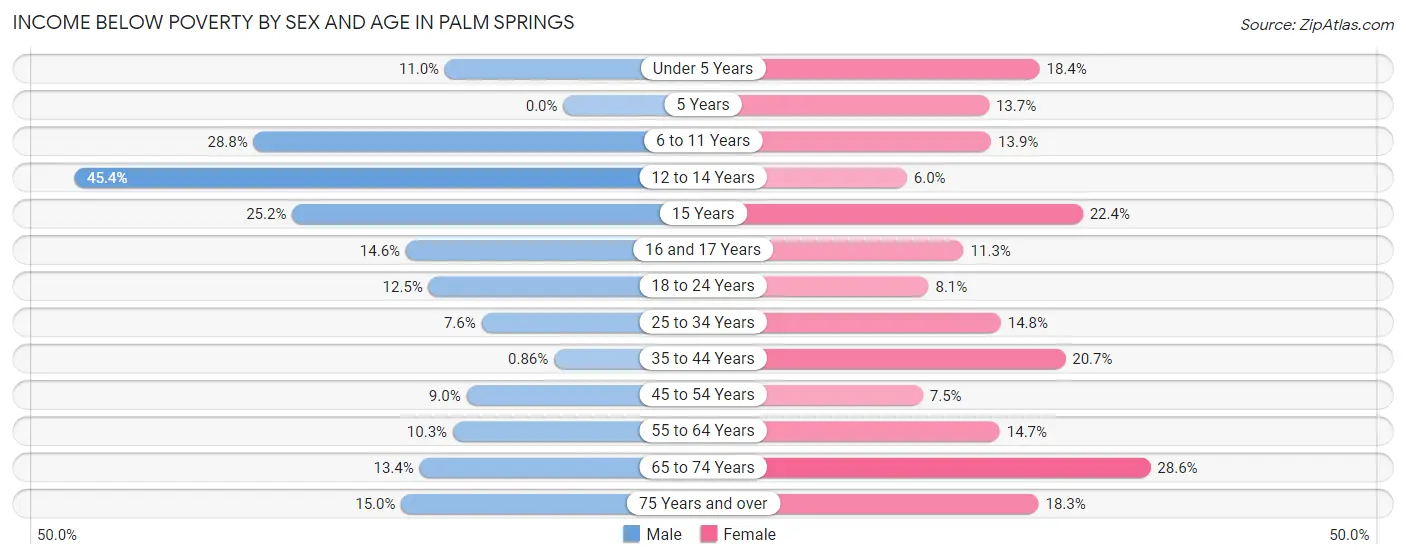
| Age Bracket | Male | Female |
| Under 5 Years | 94 (11.0%) | 160 (18.3%) |
| 5 Years | 0 (0.0%) | 25 (13.7%) |
| 6 to 11 Years | 307 (28.7%) | 139 (13.9%) |
| 12 to 14 Years | 351 (45.4%) | 33 (6.0%) |
| 15 Years | 39 (25.2%) | 36 (22.4%) |
| 16 and 17 Years | 39 (14.6%) | 31 (11.3%) |
| 18 to 24 Years | 165 (12.5%) | 107 (8.1%) |
| 25 to 34 Years | 160 (7.6%) | 283 (14.8%) |
| 35 to 44 Years | 17 (0.9%) | 413 (20.7%) |
| 45 to 54 Years | 174 (9.0%) | 133 (7.5%) |
| 55 to 64 Years | 164 (10.2%) | 164 (14.7%) |
| 65 to 74 Years | 108 (13.4%) | 307 (28.6%) |
| 75 Years and over | 102 (15.0%) | 126 (18.3%) |
| Total | 1,720 (12.6%) | 1,957 (15.1%) |
Income Above Poverty by Sex and Age in Palm Springs
According to the poverty statistics in Palm Springs, males aged 5 years and females aged 12 to 14 years are the age groups that are most secure financially, with 100.0% of males and 94.0% of females in these age groups living above the poverty line.
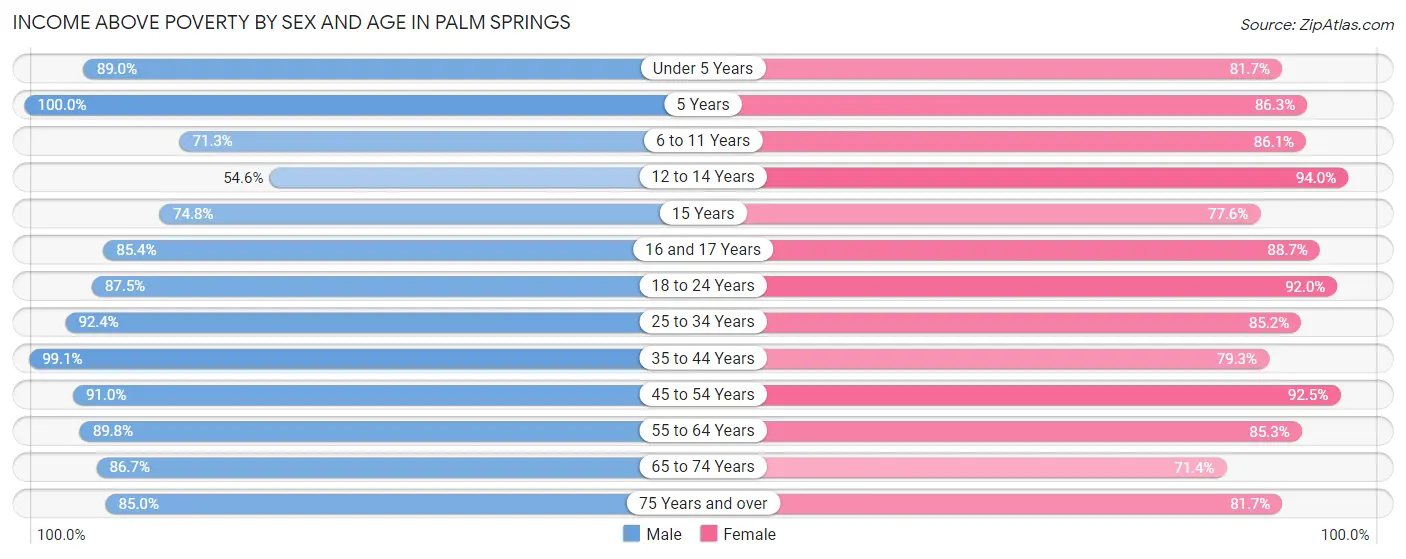
| Age Bracket | Male | Female |
| Under 5 Years | 761 (89.0%) | 712 (81.7%) |
| 5 Years | 67 (100.0%) | 158 (86.3%) |
| 6 to 11 Years | 761 (71.3%) | 864 (86.1%) |
| 12 to 14 Years | 422 (54.6%) | 513 (94.0%) |
| 15 Years | 116 (74.8%) | 125 (77.6%) |
| 16 and 17 Years | 228 (85.4%) | 243 (88.7%) |
| 18 to 24 Years | 1,155 (87.5%) | 1,223 (91.9%) |
| 25 to 34 Years | 1,948 (92.4%) | 1,634 (85.2%) |
| 35 to 44 Years | 1,968 (99.1%) | 1,578 (79.3%) |
| 45 to 54 Years | 1,762 (91.0%) | 1,635 (92.5%) |
| 55 to 64 Years | 1,436 (89.7%) | 954 (85.3%) |
| 65 to 74 Years | 701 (86.7%) | 765 (71.4%) |
| 75 Years and over | 576 (85.0%) | 564 (81.7%) |
| Total | 11,901 (87.4%) | 10,968 (84.9%) |
Income Below Poverty Among Married-Couple Families in Palm Springs
The poverty statistics for married-couple families in Palm Springs show that 8.0% or 273 of the total 3,399 families live below the poverty line. Families with 3 or 4 children have the highest poverty rate of 23.4%, comprising of 68 families. On the other hand, families with 5 or more children have the lowest poverty rate of 0.0%, which includes 0 families.
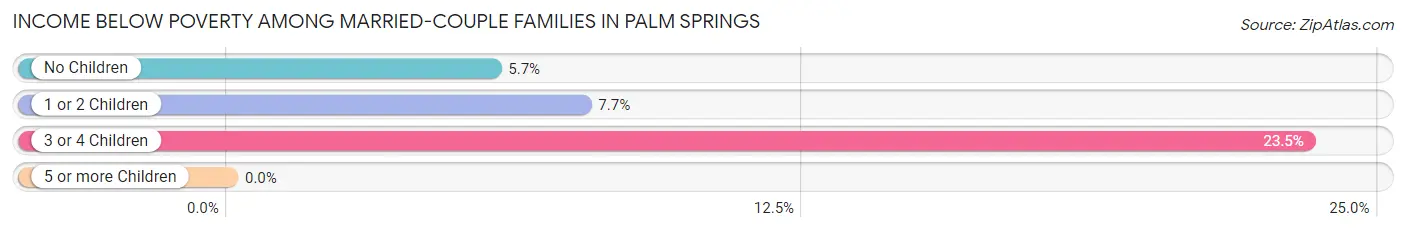
| Children | Above Poverty | Below Poverty |
| No Children | 1,630 (94.3%) | 99 (5.7%) |
| 1 or 2 Children | 1,273 (92.3%) | 106 (7.7%) |
| 3 or 4 Children | 222 (76.5%) | 68 (23.4%) |
| 5 or more Children | 1 (100.0%) | 0 (0.0%) |
| Total | 3,126 (92.0%) | 273 (8.0%) |
Income Below Poverty Among Single-Parent Households in Palm Springs
According to the poverty data in Palm Springs, 11.2% or 100 single-father households and 21.4% or 403 single-mother households are living below the poverty line. Among single-father households, those with 3 or 4 children have the highest poverty rate, with 6 households (15.0%) experiencing poverty. Likewise, among single-mother households, those with 3 or 4 children have the highest poverty rate, with 53 households (34.2%) falling below the poverty line.
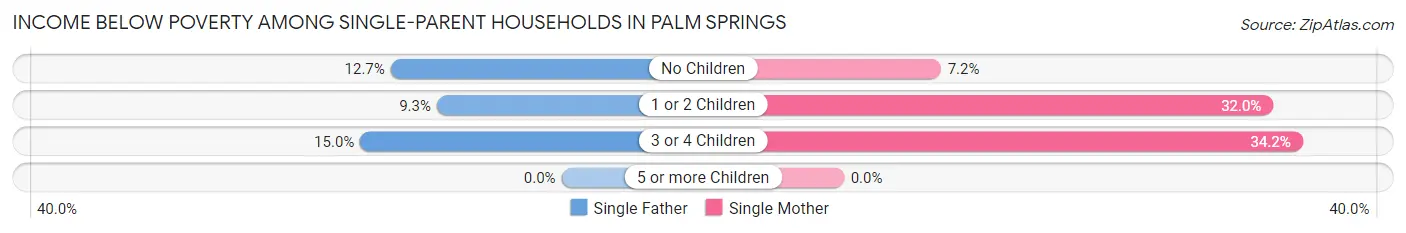
| Children | Single Father | Single Mother |
| No Children | 55 (12.7%) | 53 (7.2%) |
| 1 or 2 Children | 39 (9.3%) | 297 (32.0%) |
| 3 or 4 Children | 6 (15.0%) | 53 (34.2%) |
| 5 or more Children | 0 (0.0%) | 0 (0.0%) |
| Total | 100 (11.2%) | 403 (21.4%) |
Income Below Poverty Among Married-Couple vs Single-Parent Households in Palm Springs
The poverty data for Palm Springs shows that 273 of the married-couple family households (8.0%) and 503 of the single-parent households (18.1%) are living below the poverty level. Within the married-couple family households, those with 3 or 4 children have the highest poverty rate, with 68 households (23.4%) falling below the poverty line. Among the single-parent households, those with 3 or 4 children have the highest poverty rate, with 59 household (30.3%) living below poverty.
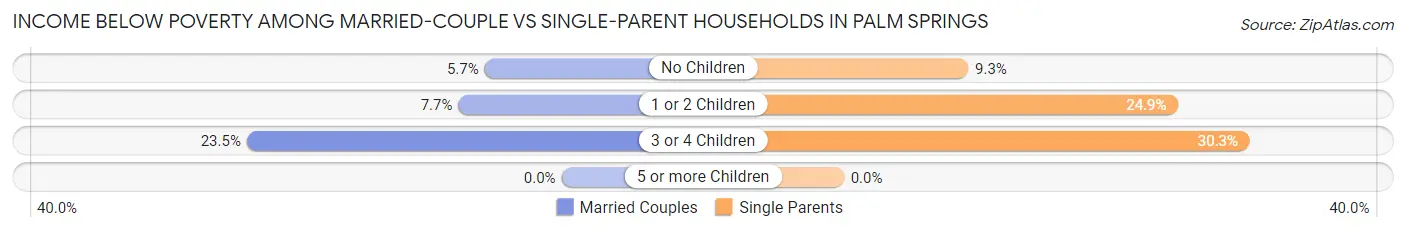
| Children | Married-Couple Families | Single-Parent Households |
| No Children | 99 (5.7%) | 108 (9.3%) |
| 1 or 2 Children | 106 (7.7%) | 336 (24.9%) |
| 3 or 4 Children | 68 (23.4%) | 59 (30.3%) |
| 5 or more Children | 0 (0.0%) | 0 (0.0%) |
| Total | 273 (8.0%) | 503 (18.1%) |
Race in Palm Springs
The most populous races in Palm Springs are Hispanic or Latino (16,358 | 61.3%), White / Caucasian (11,124 | 41.7%), and Two or more Races (5,531 | 20.7%).
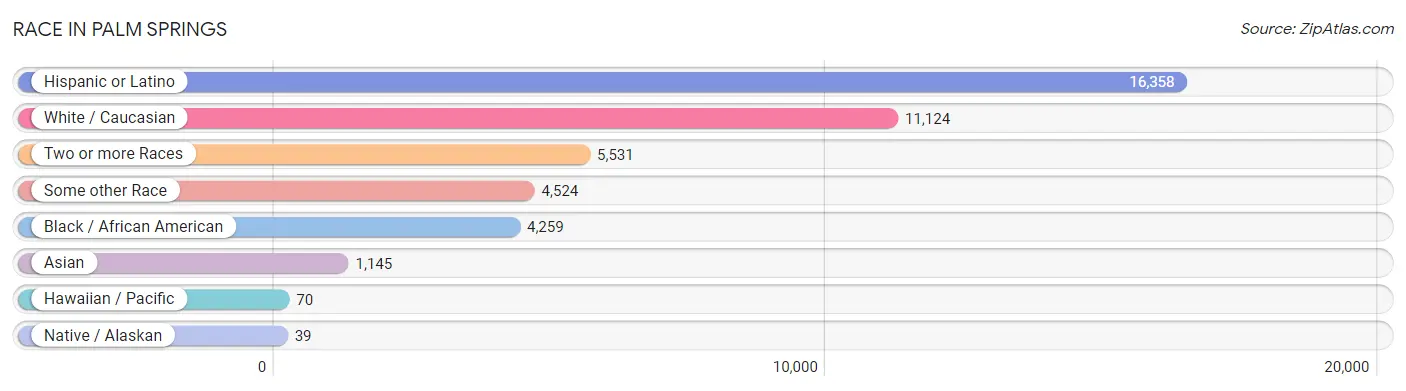
| Race | # Population | % Population |
| Asian | 1,145 | 4.3% |
| Black / African American | 4,259 | 16.0% |
| Hawaiian / Pacific | 70 | 0.3% |
| Hispanic or Latino | 16,358 | 61.3% |
| Native / Alaskan | 39 | 0.2% |
| White / Caucasian | 11,124 | 41.7% |
| Two or more Races | 5,531 | 20.7% |
| Some other Race | 4,524 | 17.0% |
| Total | 26,692 | 100.0% |
Ancestry in Palm Springs
The most populous ancestries reported in Palm Springs are Cuban (5,032 | 18.9%), Central American (3,924 | 14.7%), Mexican (2,424 | 9.1%), Haitian (2,206 | 8.3%), and South American (1,590 | 6.0%), together accounting for 56.9% of all Palm Springs residents.
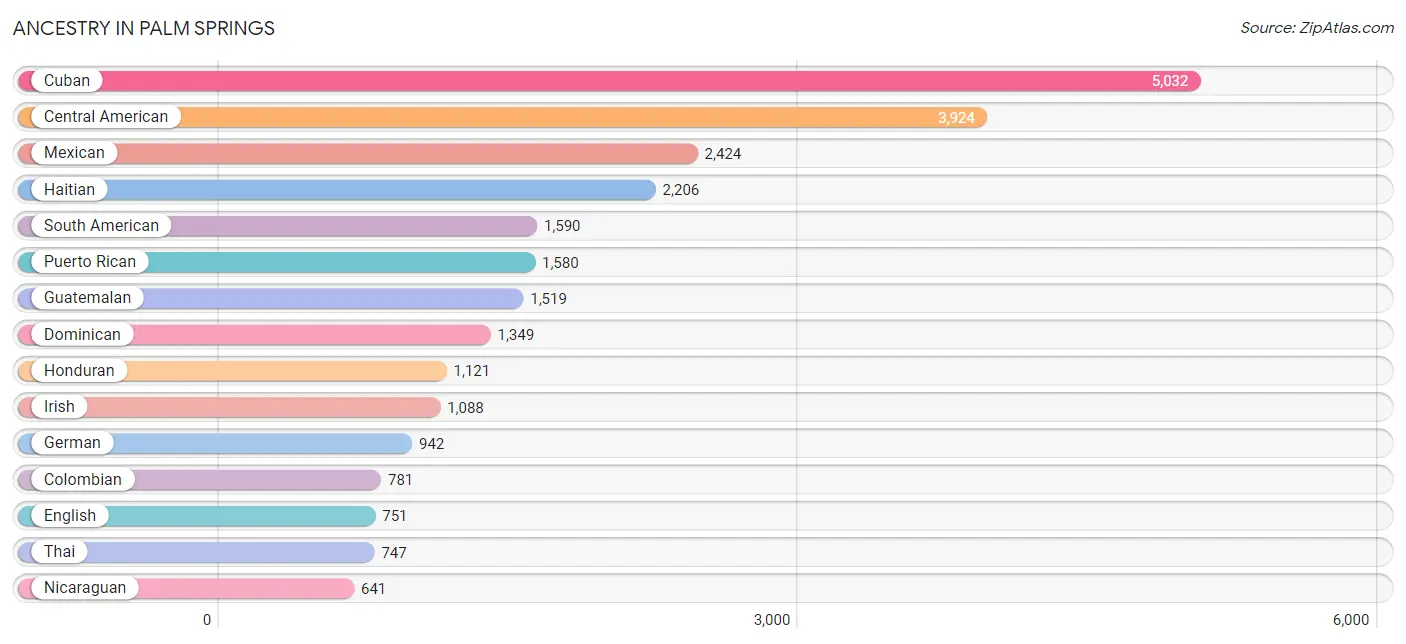
| Ancestry | # Population | % Population |
| African | 134 | 0.5% |
| American | 507 | 1.9% |
| Arab | 324 | 1.2% |
| Argentinean | 94 | 0.4% |
| Armenian | 27 | 0.1% |
| Austrian | 5 | 0.0% |
| Bahamian | 12 | 0.0% |
| Belgian | 16 | 0.1% |
| Blackfeet | 5 | 0.0% |
| Brazilian | 61 | 0.2% |
| British | 5 | 0.0% |
| British West Indian | 255 | 1.0% |
| Central American | 3,924 | 14.7% |
| Central American Indian | 114 | 0.4% |
| Cherokee | 55 | 0.2% |
| Chilean | 62 | 0.2% |
| Chinese | 17 | 0.1% |
| Colombian | 781 | 2.9% |
| Costa Rican | 128 | 0.5% |
| Croatian | 9 | 0.0% |
| Cuban | 5,032 | 18.9% |
| Czech | 22 | 0.1% |
| Dominican | 1,349 | 5.1% |
| Dutch | 37 | 0.1% |
| Eastern European | 12 | 0.0% |
| Ecuadorian | 265 | 1.0% |
| Egyptian | 307 | 1.1% |
| English | 751 | 2.8% |
| European | 89 | 0.3% |
| Finnish | 58 | 0.2% |
| French | 195 | 0.7% |
| French Canadian | 29 | 0.1% |
| German | 942 | 3.5% |
| Guamanian / Chamorro | 70 | 0.3% |
| Guatemalan | 1,519 | 5.7% |
| Guyanese | 8 | 0.0% |
| Haitian | 2,206 | 8.3% |
| Honduran | 1,121 | 4.2% |
| Hungarian | 13 | 0.1% |
| Indian (Asian) | 154 | 0.6% |
| Iranian | 20 | 0.1% |
| Irish | 1,088 | 4.1% |
| Italian | 603 | 2.3% |
| Jamaican | 149 | 0.6% |
| Korean | 107 | 0.4% |
| Laotian | 9 | 0.0% |
| Lithuanian | 24 | 0.1% |
| Macedonian | 6 | 0.0% |
| Mexican | 2,424 | 9.1% |
| Mexican American Indian | 15 | 0.1% |
| Native Hawaiian | 22 | 0.1% |
| Nicaraguan | 641 | 2.4% |
| Nigerian | 9 | 0.0% |
| Norwegian | 10 | 0.0% |
| Peruvian | 246 | 0.9% |
| Polish | 336 | 1.3% |
| Portuguese | 45 | 0.2% |
| Puerto Rican | 1,580 | 5.9% |
| Romanian | 18 | 0.1% |
| Russian | 85 | 0.3% |
| Salvadoran | 515 | 1.9% |
| Scandinavian | 5 | 0.0% |
| Scotch-Irish | 21 | 0.1% |
| Scottish | 56 | 0.2% |
| Serbian | 7 | 0.0% |
| Slovak | 26 | 0.1% |
| South American | 1,590 | 6.0% |
| Spaniard | 159 | 0.6% |
| Spanish | 19 | 0.1% |
| Sri Lankan | 140 | 0.5% |
| Subsaharan African | 143 | 0.5% |
| Swedish | 65 | 0.2% |
| Thai | 747 | 2.8% |
| Trinidadian and Tobagonian | 74 | 0.3% |
| Ukrainian | 15 | 0.1% |
| Uruguayan | 83 | 0.3% |
| Venezuelan | 59 | 0.2% |
| Vietnamese | 8 | 0.0% |
| Welsh | 23 | 0.1% |
| West Indian | 121 | 0.4% |
| Yugoslavian | 24 | 0.1% | View All 81 Rows |
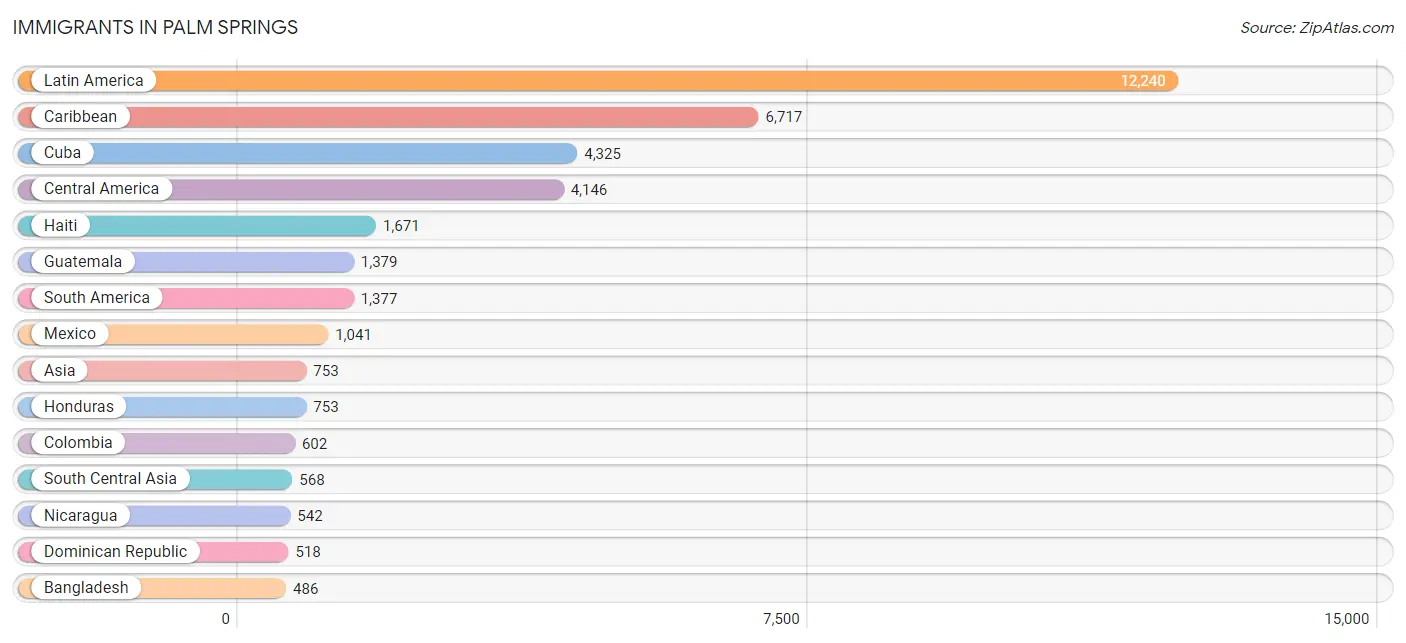
Immigrants in Palm Springs
The most numerous immigrant groups reported in Palm Springs came from Latin America (12,240 | 45.9%), Caribbean (6,717 | 25.2%), Cuba (4,325 | 16.2%), Central America (4,146 | 15.5%), and Haiti (1,671 | 6.3%), together accounting for 109.0% of all Palm Springs residents.
| Immigration Origin | # Population | % Population |
| Africa | 197 | 0.7% |
| Argentina | 60 | 0.2% |
| Asia | 753 | 2.8% |
| Austria | 19 | 0.1% |
| Bangladesh | 486 | 1.8% |
| Brazil | 64 | 0.2% |
| Canada | 10 | 0.0% |
| Caribbean | 6,717 | 25.2% |
| Central America | 4,146 | 15.5% |
| Chile | 62 | 0.2% |
| Colombia | 602 | 2.3% |
| Costa Rica | 73 | 0.3% |
| Cuba | 4,325 | 16.2% |
| Czechoslovakia | 9 | 0.0% |
| Dominica | 9 | 0.0% |
| Dominican Republic | 518 | 1.9% |
| Eastern Europe | 48 | 0.2% |
| Ecuador | 202 | 0.8% |
| Egypt | 175 | 0.7% |
| El Salvador | 358 | 1.3% |
| England | 1 | 0.0% |
| Europe | 209 | 0.8% |
| France | 12 | 0.0% |
| Germany | 25 | 0.1% |
| Guatemala | 1,379 | 5.2% |
| Guyana | 8 | 0.0% |
| Haiti | 1,671 | 6.3% |
| Honduras | 753 | 2.8% |
| Hungary | 15 | 0.1% |
| Indonesia | 7 | 0.0% |
| Iran | 8 | 0.0% |
| Italy | 36 | 0.1% |
| Jamaica | 79 | 0.3% |
| Latin America | 12,240 | 45.9% |
| Mexico | 1,041 | 3.9% |
| Nicaragua | 542 | 2.0% |
| Nigeria | 9 | 0.0% |
| North Macedonia | 6 | 0.0% |
| Northern Africa | 188 | 0.7% |
| Northern Europe | 20 | 0.1% |
| Pakistan | 61 | 0.2% |
| Peru | 282 | 1.1% |
| Philippines | 75 | 0.3% |
| Portugal | 41 | 0.2% |
| Romania | 18 | 0.1% |
| Scotland | 6 | 0.0% |
| South America | 1,377 | 5.2% |
| South Central Asia | 568 | 2.1% |
| South Eastern Asia | 167 | 0.6% |
| Southern Europe | 85 | 0.3% |
| Spain | 8 | 0.0% |
| Sri Lanka | 13 | 0.1% |
| Trinidad and Tobago | 29 | 0.1% |
| Uruguay | 54 | 0.2% |
| Venezuela | 34 | 0.1% |
| Vietnam | 85 | 0.3% |
| Western Africa | 9 | 0.0% |
| Western Asia | 18 | 0.1% |
| Western Europe | 56 | 0.2% | View All 59 Rows |
Sex and Age in Palm Springs
Sex and Age in Palm Springs
The most populous age groups in Palm Springs are 40 to 44 Years (1,182 | 8.6%) for men and 45 to 49 Years (1,115 | 8.6%) for women.
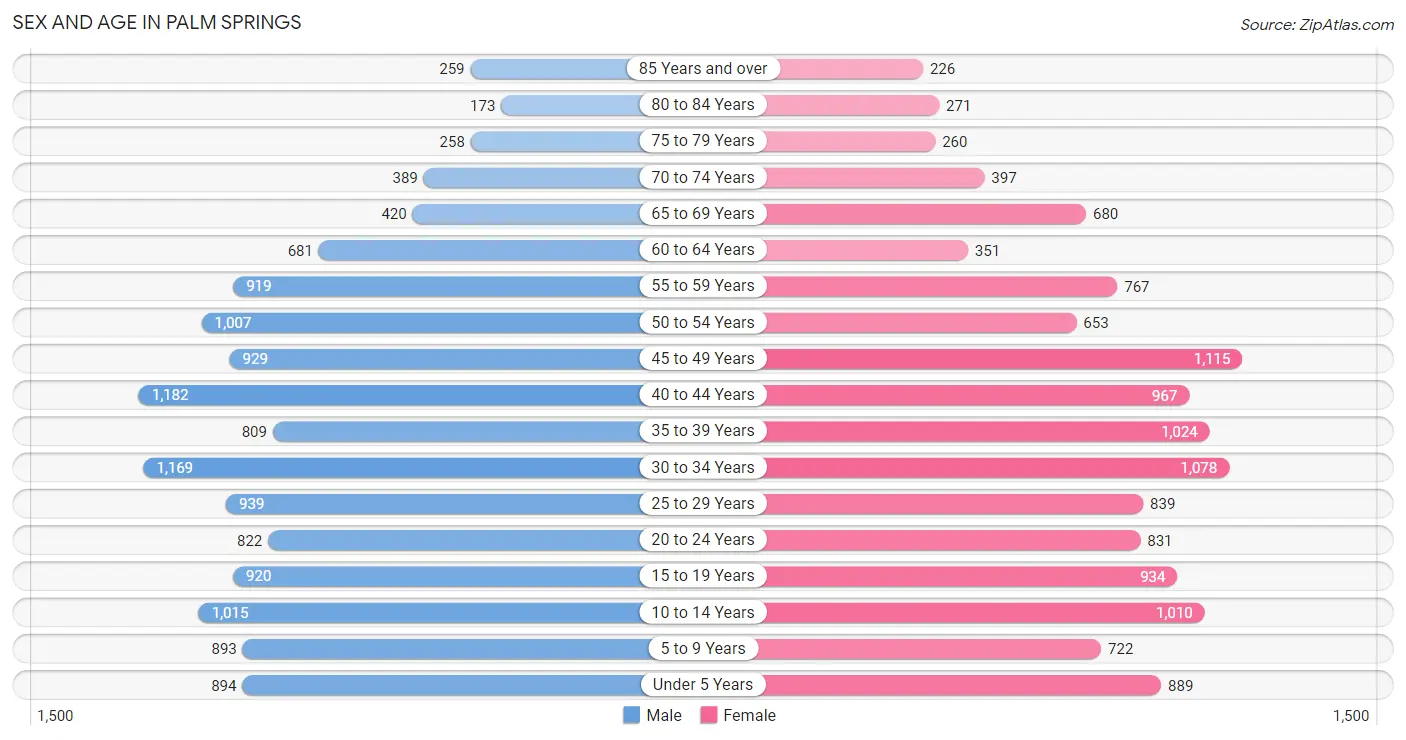
| Age Bracket | Male | Female |
| Under 5 Years | 894 (6.5%) | 889 (6.8%) |
| 5 to 9 Years | 893 (6.5%) | 722 (5.6%) |
| 10 to 14 Years | 1,015 (7.4%) | 1,010 (7.8%) |
| 15 to 19 Years | 920 (6.7%) | 934 (7.2%) |
| 20 to 24 Years | 822 (6.0%) | 831 (6.4%) |
| 25 to 29 Years | 939 (6.9%) | 839 (6.5%) |
| 30 to 34 Years | 1,169 (8.6%) | 1,078 (8.3%) |
| 35 to 39 Years | 809 (5.9%) | 1,024 (7.9%) |
| 40 to 44 Years | 1,182 (8.6%) | 967 (7.4%) |
| 45 to 49 Years | 929 (6.8%) | 1,115 (8.6%) |
| 50 to 54 Years | 1,007 (7.4%) | 653 (5.0%) |
| 55 to 59 Years | 919 (6.7%) | 767 (5.9%) |
| 60 to 64 Years | 681 (5.0%) | 351 (2.7%) |
| 65 to 69 Years | 420 (3.1%) | 680 (5.2%) |
| 70 to 74 Years | 389 (2.8%) | 397 (3.0%) |
| 75 to 79 Years | 258 (1.9%) | 260 (2.0%) |
| 80 to 84 Years | 173 (1.3%) | 271 (2.1%) |
| 85 Years and over | 259 (1.9%) | 226 (1.7%) |
| Total | 13,678 (100.0%) | 13,014 (100.0%) |
Families and Households in Palm Springs
Median Family Size in Palm Springs
The median family size in Palm Springs is 3.53 persons per family, with married-couple families (3,399 | 55.0%) accounting for the largest median family size of 3.76 persons per family. On the other hand, single male/father families (892 | 14.4%) represent the smallest median family size with 3.16 persons per family.
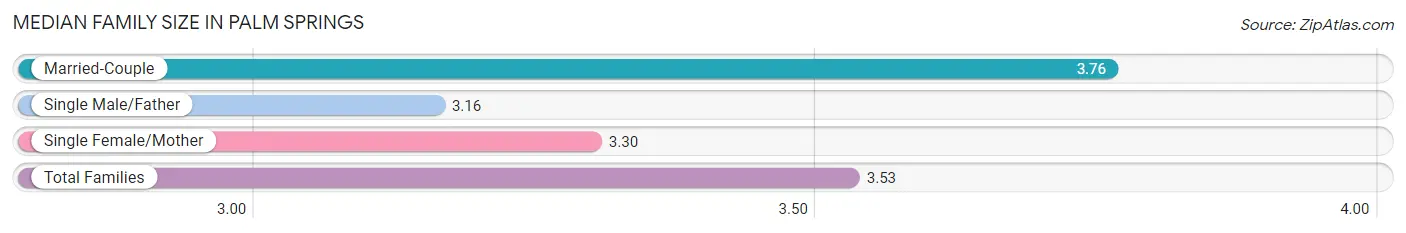
| Family Type | # Families | Family Size |
| Married-Couple | 3,399 (55.0%) | 3.76 |
| Single Male/Father | 892 (14.4%) | 3.16 |
| Single Female/Mother | 1,883 (30.5%) | 3.30 |
| Total Families | 6,174 (100.0%) | 3.53 |
Median Household Size in Palm Springs
The median household size in Palm Springs is 3.02 persons per household, with married-couple households (3,399 | 38.6%) accounting for the largest median household size of 3.76 persons per household. non-family households (2,626 | 29.8%) represent the smallest median household size with 1.45 persons per household.
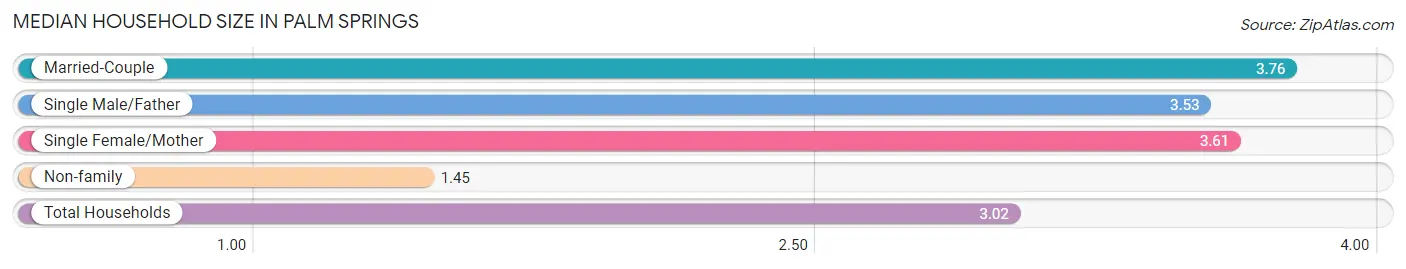
| Household Type | # Households | Household Size |
| Married-Couple | 3,399 (38.6%) | 3.76 |
| Single Male/Father | 892 (10.1%) | 3.53 |
| Single Female/Mother | 1,883 (21.4%) | 3.61 |
| Non-family | 2,626 (29.8%) | 1.45 |
| Total Households | 8,800 (100.0%) | 3.02 |
Household Size by Marriage Status in Palm Springs
Out of a total of 8,800 households in Palm Springs, 6,174 (70.2%) are family households, while 2,626 (29.8%) are nonfamily households. The most numerous type of family households are 2-person households, comprising 2,164, and the most common type of nonfamily households are 1-person households, comprising 1,863.
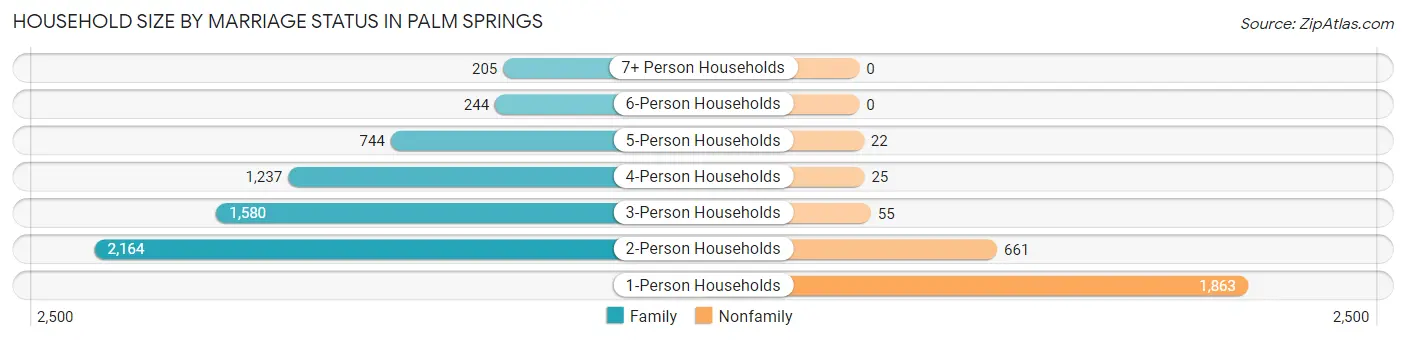
| Household Size | Family Households | Nonfamily Households |
| 1-Person Households | - | 1,863 (21.2%) |
| 2-Person Households | 2,164 (24.6%) | 661 (7.5%) |
| 3-Person Households | 1,580 (17.9%) | 55 (0.6%) |
| 4-Person Households | 1,237 (14.1%) | 25 (0.3%) |
| 5-Person Households | 744 (8.5%) | 22 (0.3%) |
| 6-Person Households | 244 (2.8%) | 0 (0.0%) |
| 7+ Person Households | 205 (2.3%) | 0 (0.0%) |
| Total | 6,174 (70.2%) | 2,626 (29.8%) |
Female Fertility in Palm Springs
Fertility by Age in Palm Springs
Average fertility rate in Palm Springs is 86.0 births per 1,000 women. Women in the age bracket of 35 to 50 years have the highest fertility rate with 112.0 births per 1,000 women. Women in the age bracket of 35 to 50 years acount for 60.8% of all women with births.
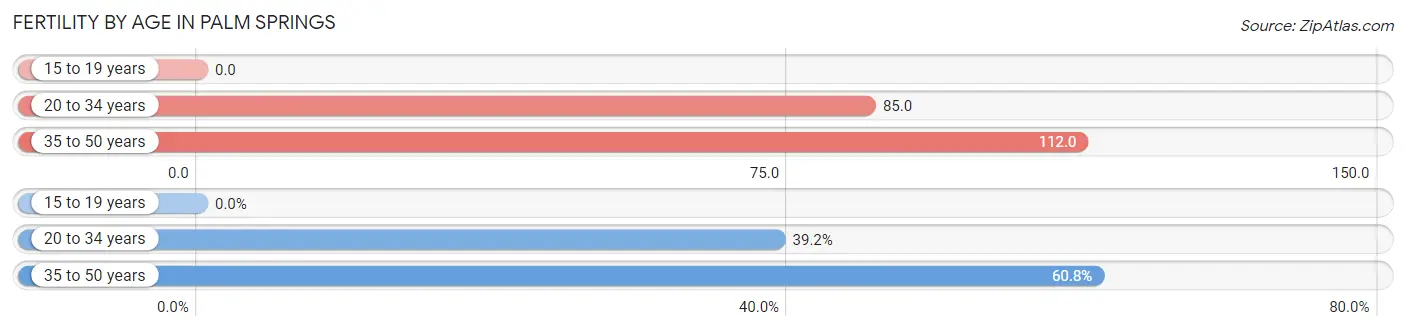
| Age Bracket | Women with Births | Births / 1,000 Women |
| 15 to 19 years | 0 (0.0%) | 0.0 |
| 20 to 34 years | 234 (39.2%) | 85.0 |
| 35 to 50 years | 363 (60.8%) | 112.0 |
| Total | 597 (100.0%) | 86.0 |
Fertility by Age by Marriage Status in Palm Springs
69.0% of women with births (597) in Palm Springs are married. The highest percentage of unmarried women with births falls into 20 to 34 years age bracket with 46.6% of them unmarried at the time of birth, while the lowest percentage of unmarried women with births belong to 35 to 50 years age bracket with 20.9% of them unmarried.
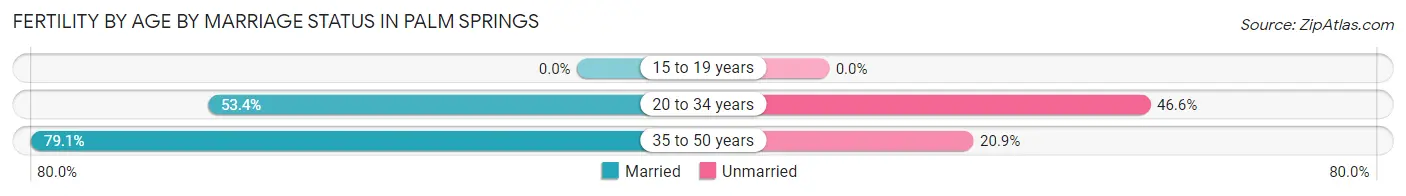
| Age Bracket | Married | Unmarried |
| 15 to 19 years | 0 (0.0%) | 0 (0.0%) |
| 20 to 34 years | 125 (53.4%) | 109 (46.6%) |
| 35 to 50 years | 287 (79.1%) | 76 (20.9%) |
| Total | 412 (69.0%) | 185 (31.0%) |
Fertility by Education in Palm Springs
Average fertility rate in Palm Springs is 86.0 births per 1,000 women. Women with the education attainment of college or associate's degree have the highest fertility rate of 165.0 births per 1,000 women, while women with the education attainment of high school diploma have the lowest fertility at 24.0 births per 1,000 women. Women with the education attainment of college or associate's degree represent 56.3% of all women with births.
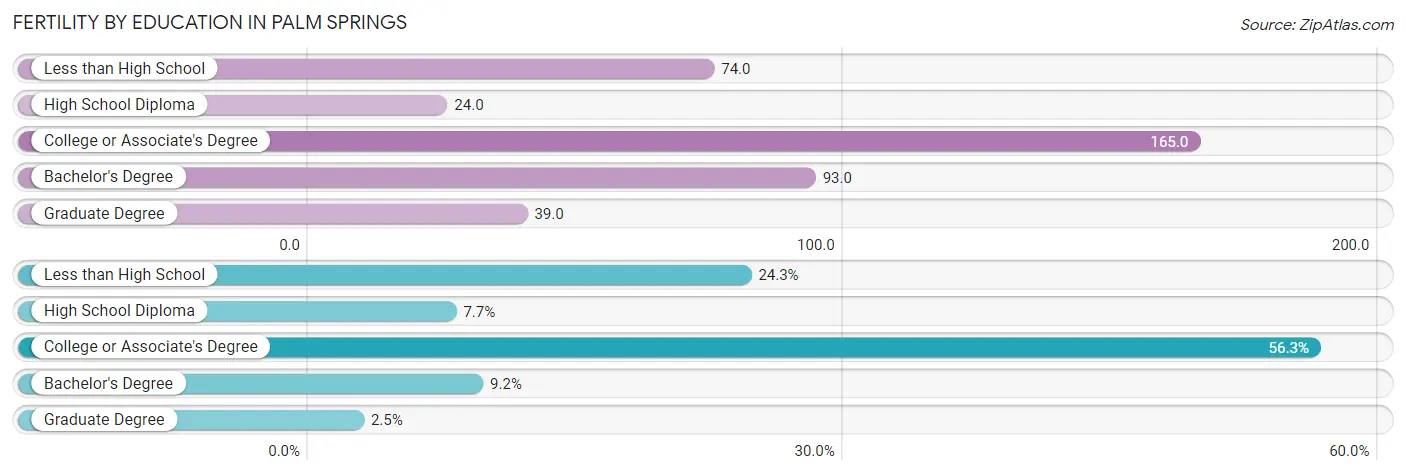
| Educational Attainment | Women with Births | Births / 1,000 Women |
| Less than High School | 145 (24.3%) | 74.0 |
| High School Diploma | 46 (7.7%) | 24.0 |
| College or Associate's Degree | 336 (56.3%) | 165.0 |
| Bachelor's Degree | 55 (9.2%) | 93.0 |
| Graduate Degree | 15 (2.5%) | 39.0 |
| Total | 597 (100.0%) | 86.0 |
Fertility by Education by Marriage Status in Palm Springs
31.0% of women with births in Palm Springs are unmarried. Women with the educational attainment of graduate degree are most likely to be married with 100.0% of them married at childbirth, while women with the educational attainment of high school diploma are least likely to be married with 56.5% of them unmarried at childbirth.
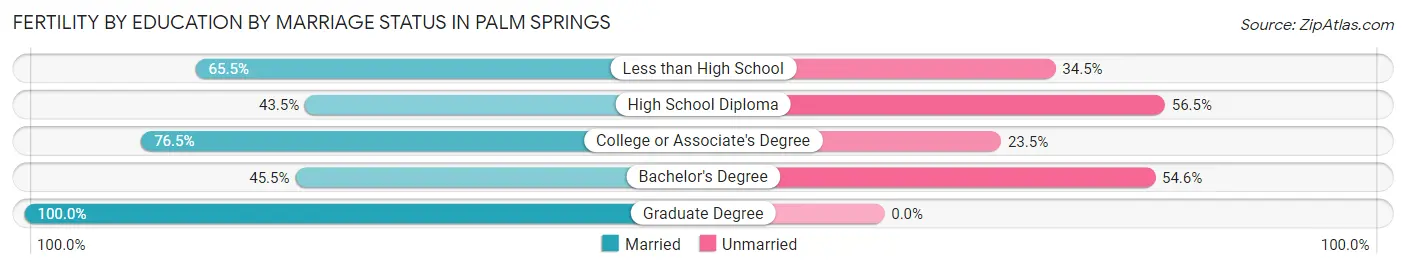
| Educational Attainment | Married | Unmarried |
| Less than High School | 95 (65.5%) | 50 (34.5%) |
| High School Diploma | 20 (43.5%) | 26 (56.5%) |
| College or Associate's Degree | 257 (76.5%) | 79 (23.5%) |
| Bachelor's Degree | 25 (45.5%) | 30 (54.5%) |
| Graduate Degree | 15 (100.0%) | 0 (0.0%) |
| Total | 412 (69.0%) | 185 (31.0%) |
Employment Characteristics in Palm Springs
Employment by Class of Employer in Palm Springs
Among the 13,571 employed individuals in Palm Springs, private company employees (10,078 | 74.3%), self-employed (not incorporated) (1,175 | 8.7%), and self-employed (incorporated) (870 | 6.4%) make up the most common classes of employment.
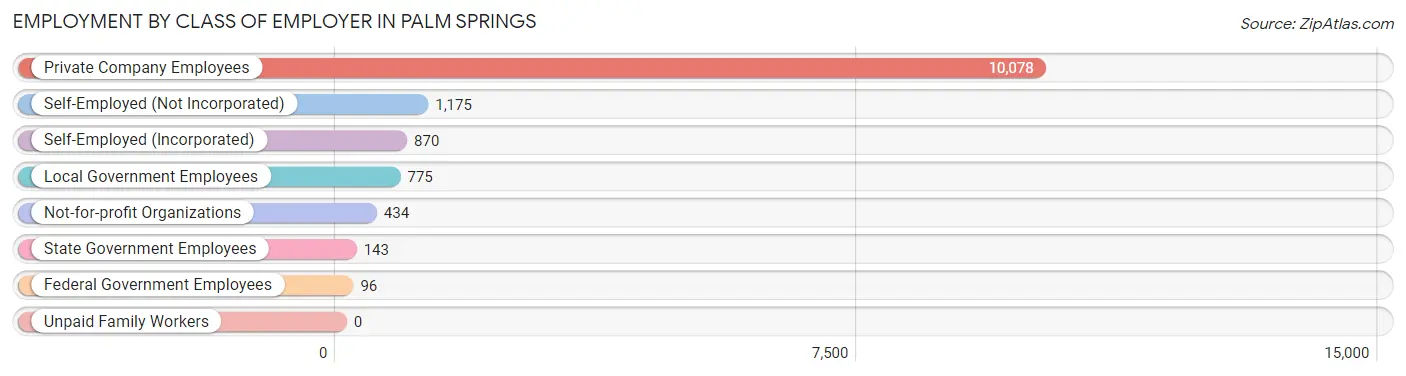
| Employer Class | # Employees | % Employees |
| Private Company Employees | 10,078 | 74.3% |
| Self-Employed (Incorporated) | 870 | 6.4% |
| Self-Employed (Not Incorporated) | 1,175 | 8.7% |
| Not-for-profit Organizations | 434 | 3.2% |
| Local Government Employees | 775 | 5.7% |
| State Government Employees | 143 | 1.1% |
| Federal Government Employees | 96 | 0.7% |
| Unpaid Family Workers | 0 | 0.0% |
| Total | 13,571 | 100.0% |
Employment Status by Age in Palm Springs
According to the labor force statistics for Palm Springs, out of the total population over 16 years of age (20,953), 70.7% or 14,814 individuals are in the labor force, with 6.9% or 1,022 of them unemployed. The age group with the highest labor force participation rate is 55 to 59 years, with 92.2% or 1,554 individuals in the labor force. Within the labor force, the 16 to 19 years age range has the highest percentage of unemployed individuals, with 16.2% or 69 of them being unemployed.
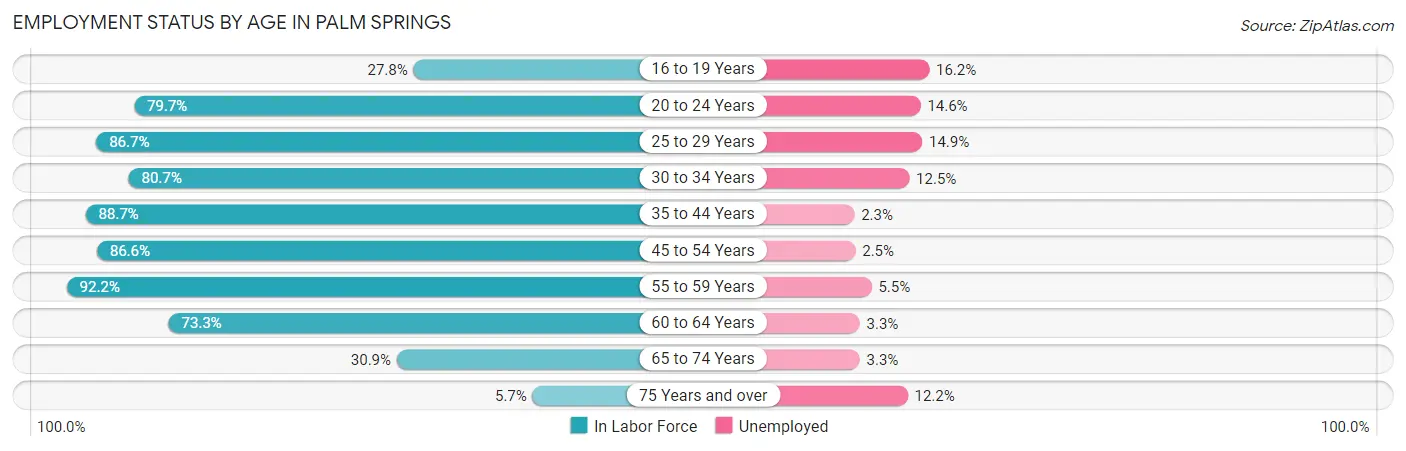
| Age Bracket | In Labor Force | Unemployed |
| 16 to 19 Years | 428 (27.8%) | 69 (16.2%) |
| 20 to 24 Years | 1,317 (79.7%) | 192 (14.6%) |
| 25 to 29 Years | 1,542 (86.7%) | 230 (14.9%) |
| 30 to 34 Years | 1,813 (80.7%) | 227 (12.5%) |
| 35 to 44 Years | 3,532 (88.7%) | 81 (2.3%) |
| 45 to 54 Years | 3,208 (86.6%) | 80 (2.5%) |
| 55 to 59 Years | 1,554 (92.2%) | 85 (5.5%) |
| 60 to 64 Years | 756 (73.3%) | 25 (3.3%) |
| 65 to 74 Years | 583 (30.9%) | 19 (3.3%) |
| 75 Years and over | 82 (5.7%) | 10 (12.2%) |
| Total | 14,814 (70.7%) | 1,022 (6.9%) |
Employment Status by Educational Attainment in Palm Springs
According to labor force statistics for Palm Springs, 86.0% of individuals (12,409) out of the total population between 25 and 64 years of age (14,429) are in the labor force, with 5.9% or 732 of them being unemployed. The group with the highest labor force participation rate are those with the educational attainment of college / associate degree, with 92.0% or 3,419 individuals in the labor force. Within the labor force, individuals with high school diploma education have the highest percentage of unemployment, with 9.8% or 396 of them being unemployed.
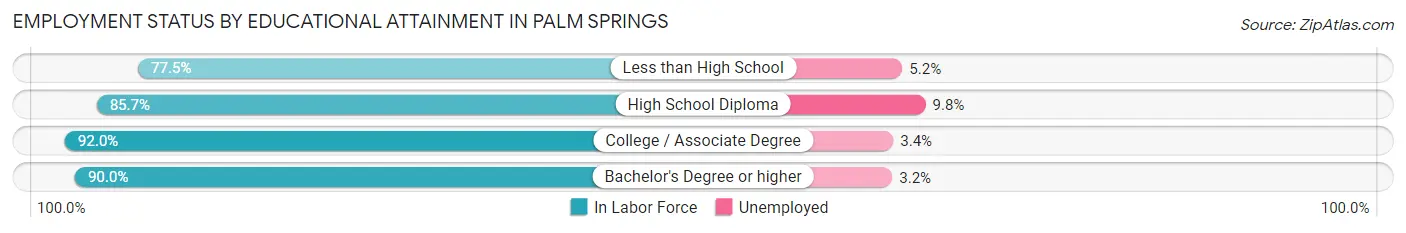
| Educational Attainment | In Labor Force | Unemployed |
| Less than High School | 2,795 (77.5%) | 188 (5.2%) |
| High School Diploma | 4,036 (85.7%) | 462 (9.8%) |
| College / Associate Degree | 3,419 (92.0%) | 126 (3.4%) |
| Bachelor's Degree or higher | 2,156 (90.0%) | 77 (3.2%) |
| Total | 12,409 (86.0%) | 851 (5.9%) |
Employment Occupations by Sex in Palm Springs
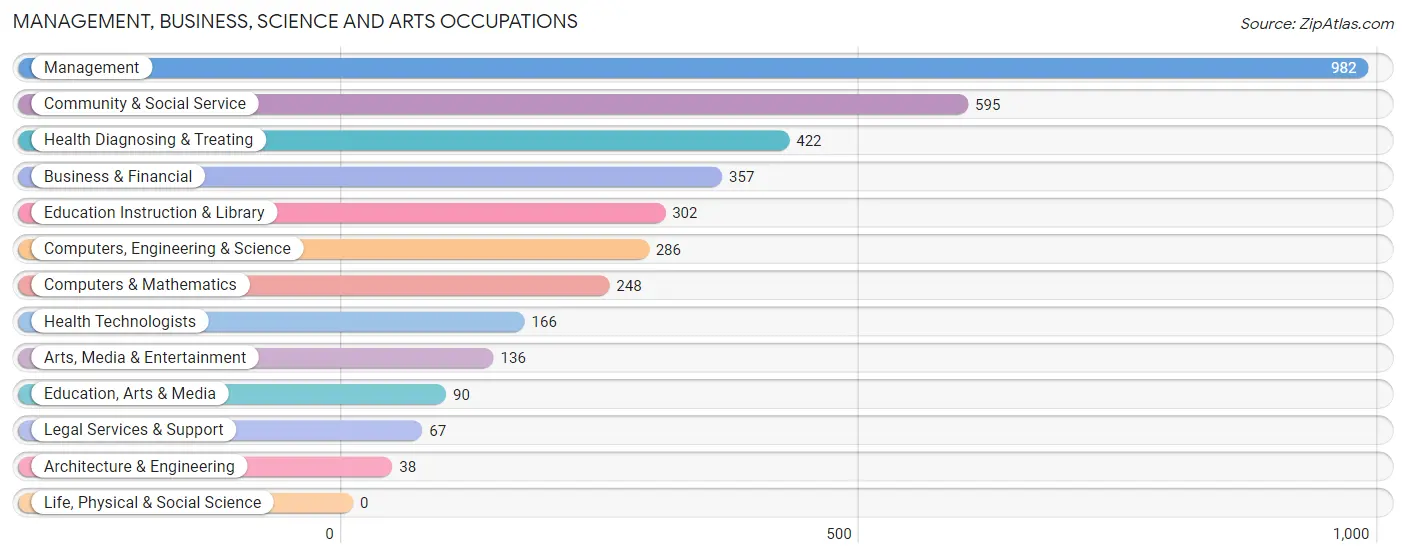
Management, Business, Science and Arts Occupations
The most common Management, Business, Science and Arts occupations in Palm Springs are Management (982 | 7.1%), Community & Social Service (595 | 4.3%), Health Diagnosing & Treating (422 | 3.1%), Business & Financial (357 | 2.6%), and Education Instruction & Library (302 | 2.2%).
Management, Business, Science and Arts Occupations by Sex
Within the Management, Business, Science and Arts occupations in Palm Springs, the most male-oriented occupations are Architecture & Engineering (100.0%), Computers, Engineering & Science (71.3%), and Education, Arts & Media (67.8%), while the most female-oriented occupations are Legal Services & Support (100.0%), Health Diagnosing & Treating (89.6%), and Health Technologists (87.4%).
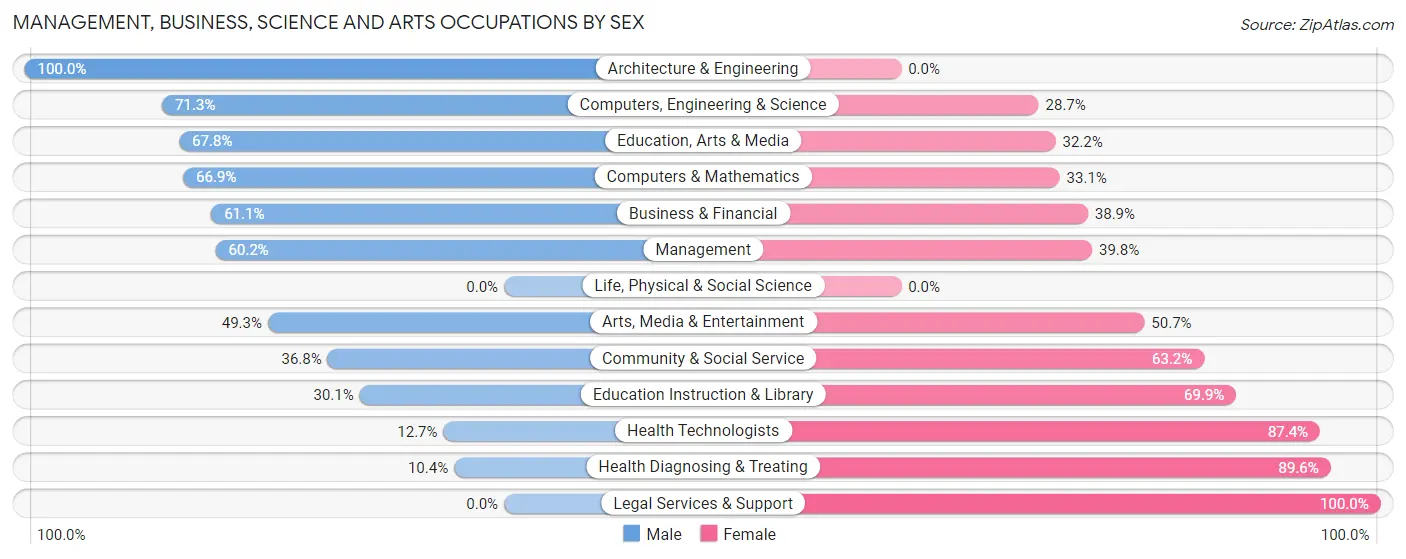
| Occupation | Male | Female |
| Management | 591 (60.2%) | 391 (39.8%) |
| Business & Financial | 218 (61.1%) | 139 (38.9%) |
| Computers, Engineering & Science | 204 (71.3%) | 82 (28.7%) |
| Computers & Mathematics | 166 (66.9%) | 82 (33.1%) |
| Architecture & Engineering | 38 (100.0%) | 0 (0.0%) |
| Life, Physical & Social Science | 0 (0.0%) | 0 (0.0%) |
| Community & Social Service | 219 (36.8%) | 376 (63.2%) |
| Education, Arts & Media | 61 (67.8%) | 29 (32.2%) |
| Legal Services & Support | 0 (0.0%) | 67 (100.0%) |
| Education Instruction & Library | 91 (30.1%) | 211 (69.9%) |
| Arts, Media & Entertainment | 67 (49.3%) | 69 (50.7%) |
| Health Diagnosing & Treating | 44 (10.4%) | 378 (89.6%) |
| Health Technologists | 21 (12.7%) | 145 (87.4%) |
| Total (Category) | 1,276 (48.3%) | 1,366 (51.7%) |
| Total (Overall) | 8,008 (58.0%) | 5,789 (42.0%) |
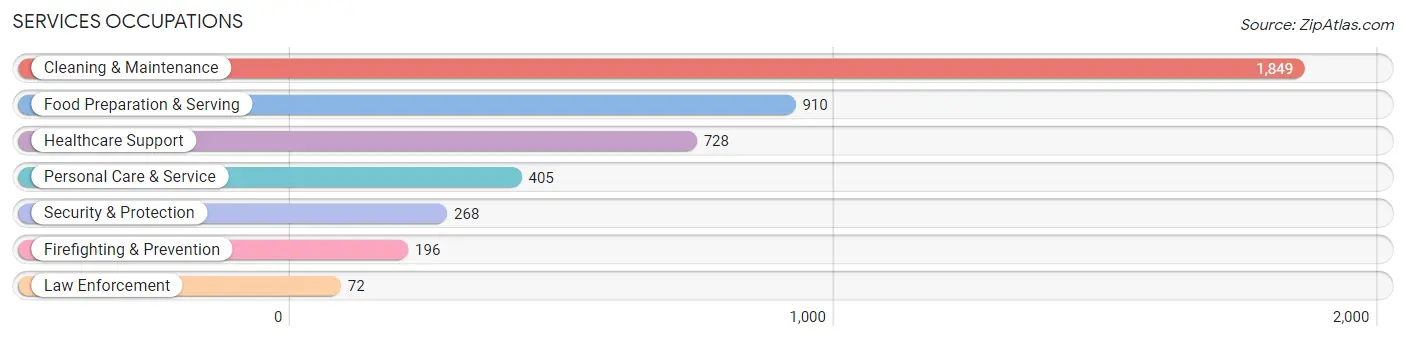
Services Occupations
The most common Services occupations in Palm Springs are Cleaning & Maintenance (1,849 | 13.4%), Food Preparation & Serving (910 | 6.6%), Healthcare Support (728 | 5.3%), Personal Care & Service (405 | 2.9%), and Security & Protection (268 | 1.9%).
Services Occupations by Sex
Within the Services occupations in Palm Springs, the most male-oriented occupations are Law Enforcement (100.0%), Security & Protection (79.1%), and Firefighting & Prevention (71.4%), while the most female-oriented occupations are Healthcare Support (89.1%), Food Preparation & Serving (53.8%), and Personal Care & Service (48.4%).
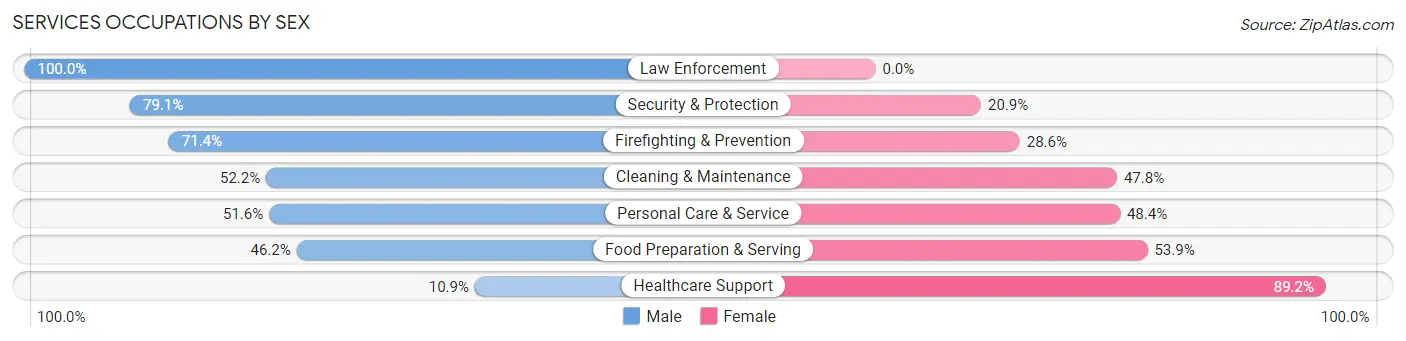
| Occupation | Male | Female |
| Healthcare Support | 79 (10.8%) | 649 (89.1%) |
| Security & Protection | 212 (79.1%) | 56 (20.9%) |
| Firefighting & Prevention | 140 (71.4%) | 56 (28.6%) |
| Law Enforcement | 72 (100.0%) | 0 (0.0%) |
| Food Preparation & Serving | 420 (46.2%) | 490 (53.8%) |
| Cleaning & Maintenance | 965 (52.2%) | 884 (47.8%) |
| Personal Care & Service | 209 (51.6%) | 196 (48.4%) |
| Total (Category) | 1,885 (45.3%) | 2,275 (54.7%) |
| Total (Overall) | 8,008 (58.0%) | 5,789 (42.0%) |
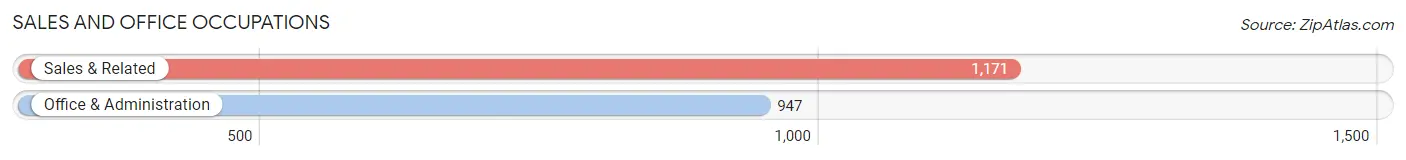
Sales and Office Occupations
The most common Sales and Office occupations in Palm Springs are Sales & Related (1,171 | 8.5%), and Office & Administration (947 | 6.9%).
Sales and Office Occupations by Sex
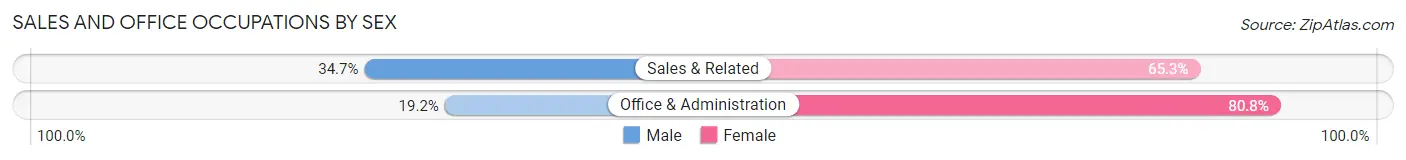
| Occupation | Male | Female |
| Sales & Related | 406 (34.7%) | 765 (65.3%) |
| Office & Administration | 182 (19.2%) | 765 (80.8%) |
| Total (Category) | 588 (27.8%) | 1,530 (72.2%) |
| Total (Overall) | 8,008 (58.0%) | 5,789 (42.0%) |
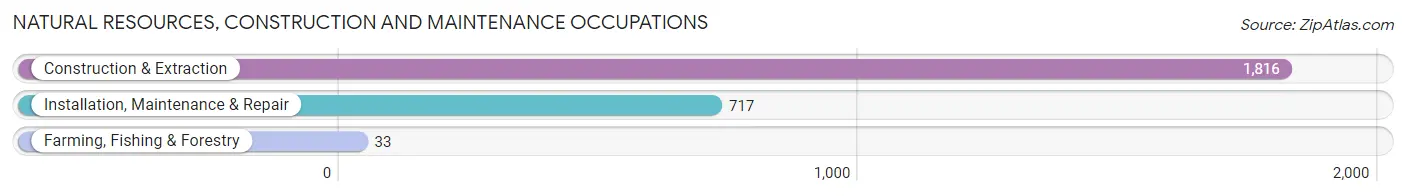
Natural Resources, Construction and Maintenance Occupations
The most common Natural Resources, Construction and Maintenance occupations in Palm Springs are Construction & Extraction (1,816 | 13.2%), Installation, Maintenance & Repair (717 | 5.2%), and Farming, Fishing & Forestry (33 | 0.2%).
Natural Resources, Construction and Maintenance Occupations by Sex
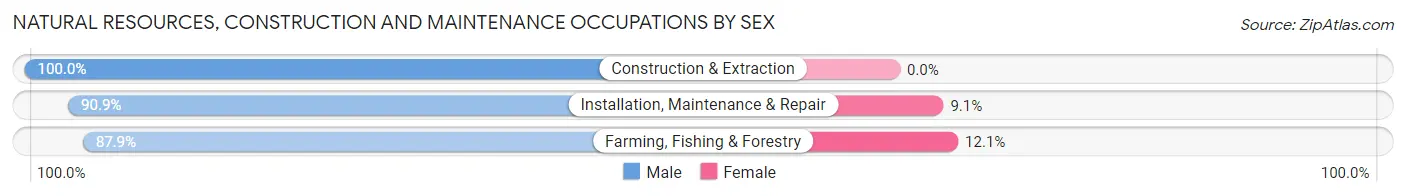
| Occupation | Male | Female |
| Farming, Fishing & Forestry | 29 (87.9%) | 4 (12.1%) |
| Construction & Extraction | 1,816 (100.0%) | 0 (0.0%) |
| Installation, Maintenance & Repair | 652 (90.9%) | 65 (9.1%) |
| Total (Category) | 2,497 (97.3%) | 69 (2.7%) |
| Total (Overall) | 8,008 (58.0%) | 5,789 (42.0%) |
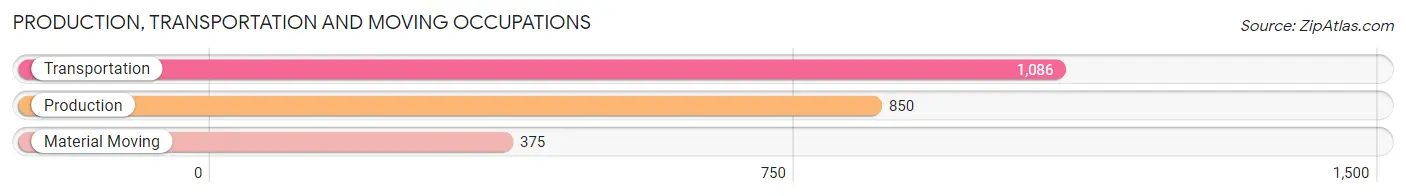
Production, Transportation and Moving Occupations
The most common Production, Transportation and Moving occupations in Palm Springs are Transportation (1,086 | 7.9%), Production (850 | 6.2%), and Material Moving (375 | 2.7%).
Production, Transportation and Moving Occupations by Sex
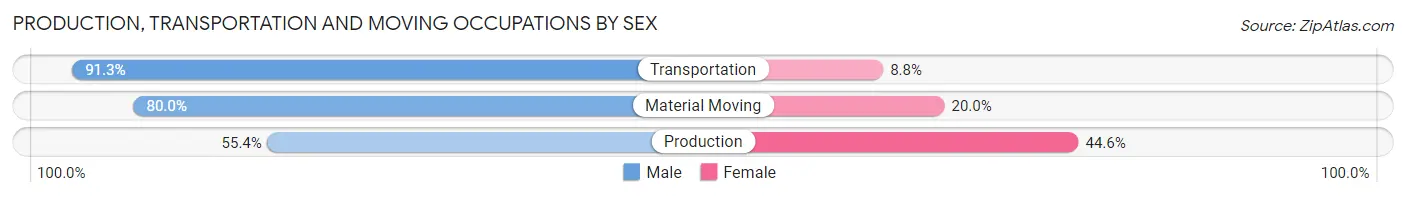
| Occupation | Male | Female |
| Production | 471 (55.4%) | 379 (44.6%) |
| Transportation | 991 (91.2%) | 95 (8.7%) |
| Material Moving | 300 (80.0%) | 75 (20.0%) |
| Total (Category) | 1,762 (76.2%) | 549 (23.8%) |
| Total (Overall) | 8,008 (58.0%) | 5,789 (42.0%) |
Employment Industries by Sex in Palm Springs
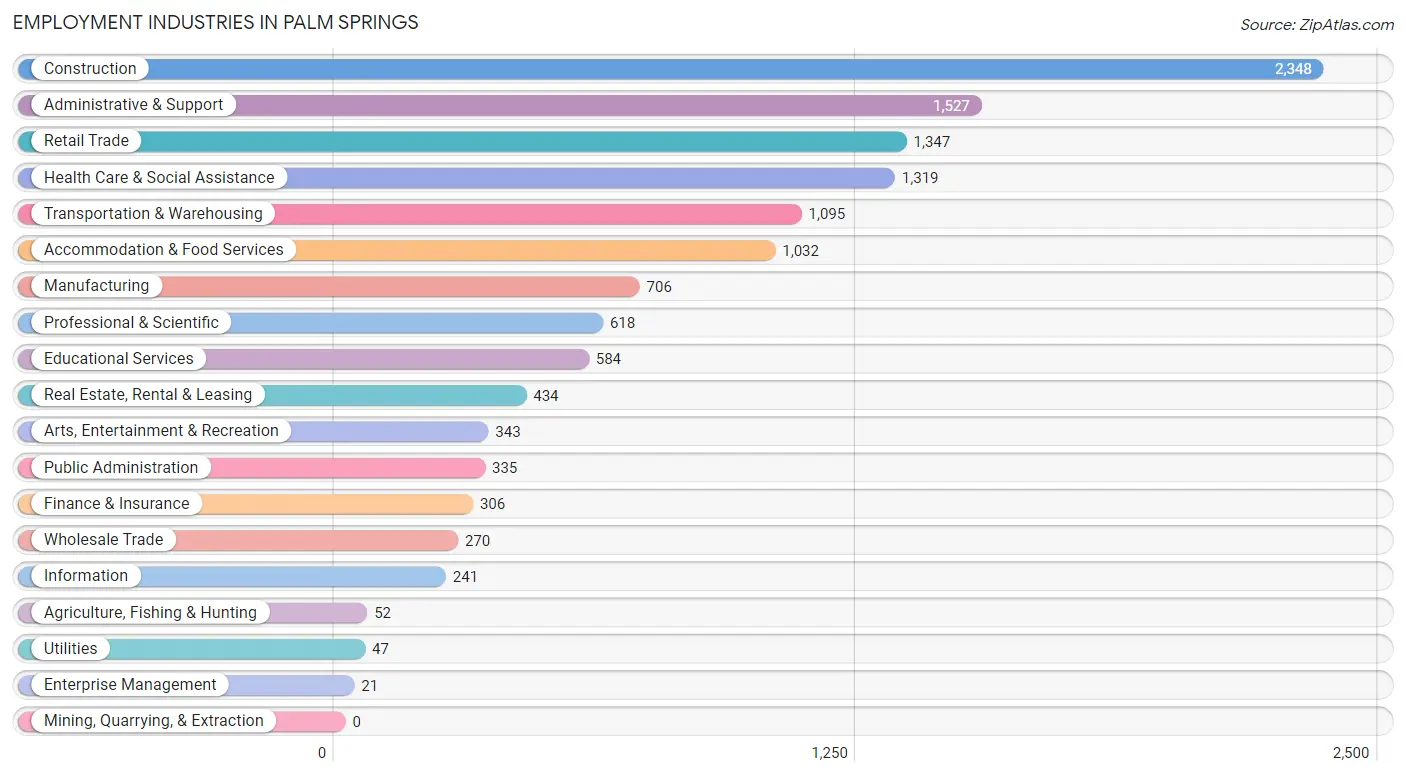
Employment Industries in Palm Springs
The major employment industries in Palm Springs include Construction (2,348 | 17.0%), Administrative & Support (1,527 | 11.1%), Retail Trade (1,347 | 9.8%), Health Care & Social Assistance (1,319 | 9.6%), and Transportation & Warehousing (1,095 | 7.9%).
Employment Industries by Sex in Palm Springs
The Palm Springs industries that see more men than women are Construction (97.4%), Agriculture, Fishing & Hunting (92.3%), and Real Estate, Rental & Leasing (82.0%), whereas the industries that tend to have a higher number of women are Enterprise Management (100.0%), Health Care & Social Assistance (86.7%), and Professional & Scientific (74.9%).
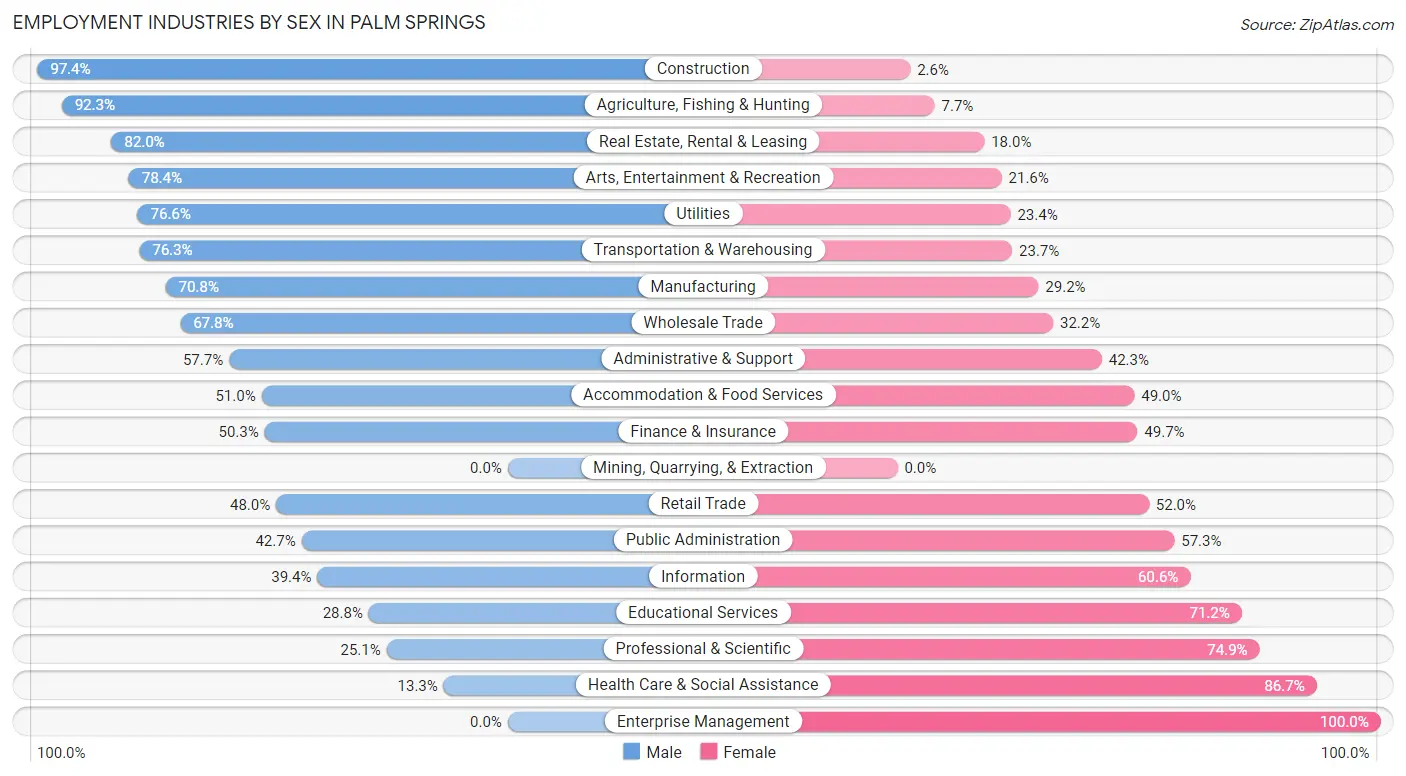
| Industry | Male | Female |
| Agriculture, Fishing & Hunting | 48 (92.3%) | 4 (7.7%) |
| Mining, Quarrying, & Extraction | 0 (0.0%) | 0 (0.0%) |
| Construction | 2,286 (97.4%) | 62 (2.6%) |
| Manufacturing | 500 (70.8%) | 206 (29.2%) |
| Wholesale Trade | 183 (67.8%) | 87 (32.2%) |
| Retail Trade | 646 (48.0%) | 701 (52.0%) |
| Transportation & Warehousing | 835 (76.3%) | 260 (23.7%) |
| Utilities | 36 (76.6%) | 11 (23.4%) |
| Information | 95 (39.4%) | 146 (60.6%) |
| Finance & Insurance | 154 (50.3%) | 152 (49.7%) |
| Real Estate, Rental & Leasing | 356 (82.0%) | 78 (18.0%) |
| Professional & Scientific | 155 (25.1%) | 463 (74.9%) |
| Enterprise Management | 0 (0.0%) | 21 (100.0%) |
| Administrative & Support | 881 (57.7%) | 646 (42.3%) |
| Educational Services | 168 (28.8%) | 416 (71.2%) |
| Health Care & Social Assistance | 175 (13.3%) | 1,144 (86.7%) |
| Arts, Entertainment & Recreation | 269 (78.4%) | 74 (21.6%) |
| Accommodation & Food Services | 526 (51.0%) | 506 (49.0%) |
| Public Administration | 143 (42.7%) | 192 (57.3%) |
| Total | 8,008 (58.0%) | 5,789 (42.0%) |
Education in Palm Springs
School Enrollment in Palm Springs
The most common levels of schooling among the 6,736 students in Palm Springs are middle school (1,623 | 24.1%), high school (1,491 | 22.1%), and college / undergraduate (1,476 | 21.9%).
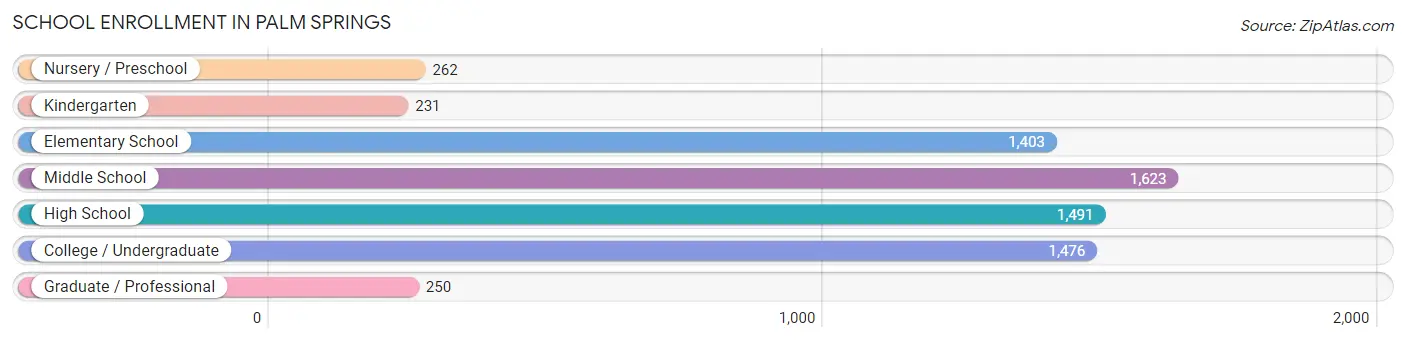
| School Level | # Students | % Students |
| Nursery / Preschool | 262 | 3.9% |
| Kindergarten | 231 | 3.4% |
| Elementary School | 1,403 | 20.8% |
| Middle School | 1,623 | 24.1% |
| High School | 1,491 | 22.1% |
| College / Undergraduate | 1,476 | 21.9% |
| Graduate / Professional | 250 | 3.7% |
| Total | 6,736 | 100.0% |
School Enrollment by Age by Funding Source in Palm Springs
Out of a total of 6,736 students who are enrolled in schools in Palm Springs, 862 (12.8%) attend a private institution, while the remaining 5,874 (87.2%) are enrolled in public schools. The age group of 3 to 4 year olds has the highest likelihood of being enrolled in private schools, with 110 (54.7% in the age bracket) enrolled. Conversely, the age group of 18 to 19 year olds has the lowest likelihood of being enrolled in a private school, with 775 (97.2% in the age bracket) attending a public institution.
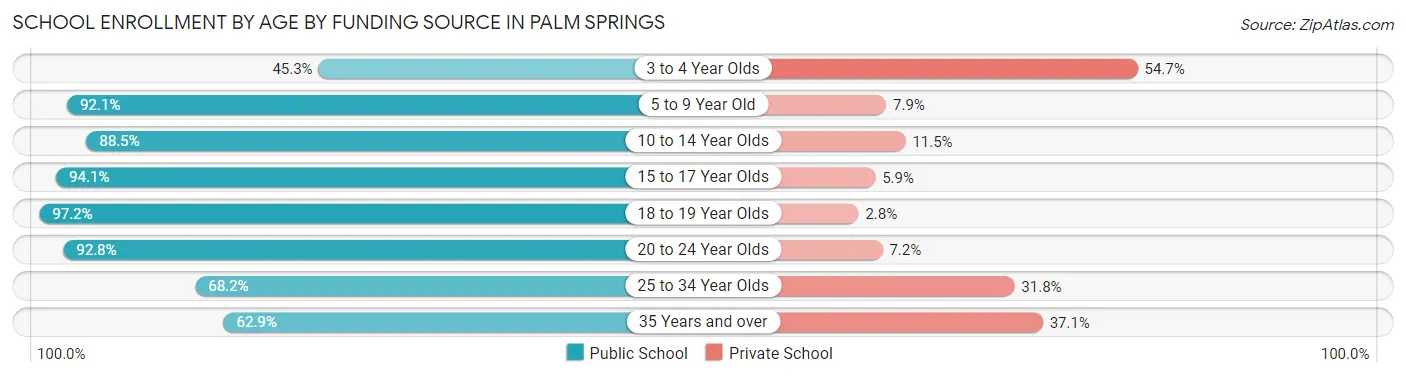
| Age Bracket | Public School | Private School |
| 3 to 4 Year Olds | 91 (45.3%) | 110 (54.7%) |
| 5 to 9 Year Old | 1,433 (92.1%) | 123 (7.9%) |
| 10 to 14 Year Olds | 1,776 (88.5%) | 231 (11.5%) |
| 15 to 17 Year Olds | 784 (94.1%) | 49 (5.9%) |
| 18 to 19 Year Olds | 775 (97.2%) | 22 (2.8%) |
| 20 to 24 Year Olds | 462 (92.8%) | 36 (7.2%) |
| 25 to 34 Year Olds | 296 (68.2%) | 138 (31.8%) |
| 35 Years and over | 258 (62.9%) | 152 (37.1%) |
| Total | 5,874 (87.2%) | 862 (12.8%) |
Educational Attainment by Field of Study in Palm Springs
Business (624 | 20.6%), science & technology (391 | 12.9%), education (294 | 9.7%), social sciences (262 | 8.7%), and bio, nature & agricultural (212 | 7.0%) are the most common fields of study among 3,024 individuals in Palm Springs who have obtained a bachelor's degree or higher.
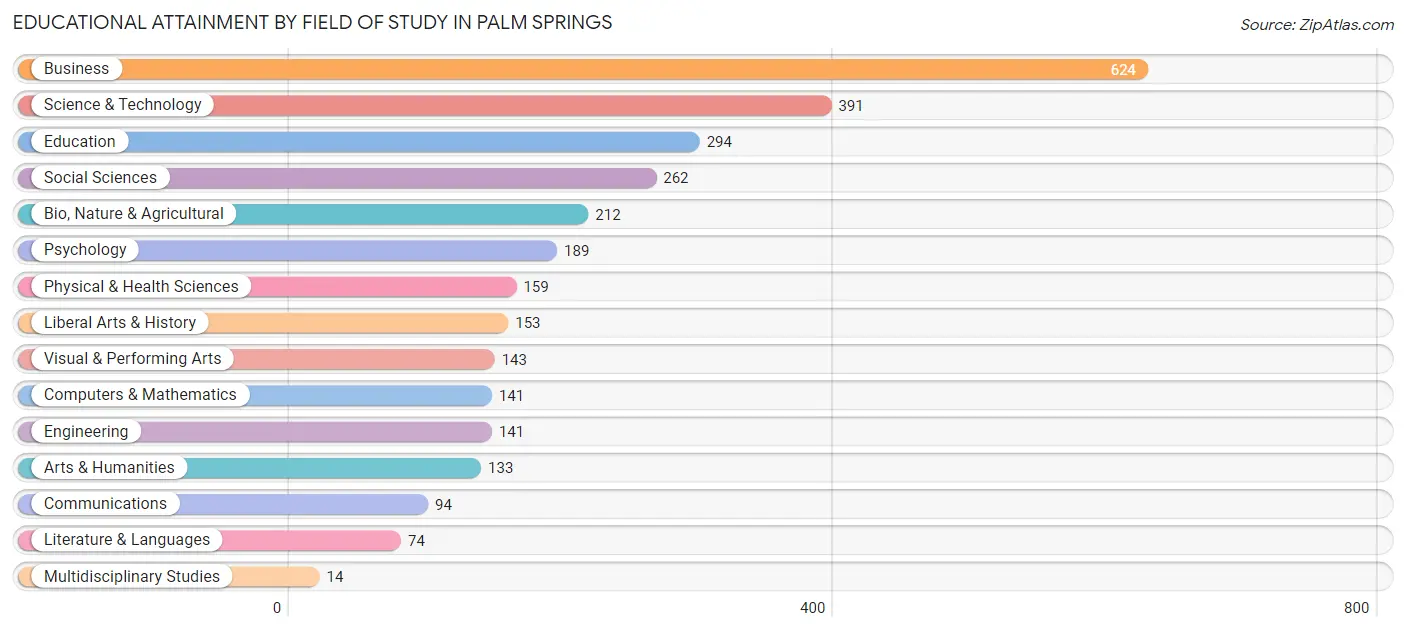
| Field of Study | # Graduates | % Graduates |
| Computers & Mathematics | 141 | 4.7% |
| Bio, Nature & Agricultural | 212 | 7.0% |
| Physical & Health Sciences | 159 | 5.3% |
| Psychology | 189 | 6.2% |
| Social Sciences | 262 | 8.7% |
| Engineering | 141 | 4.7% |
| Multidisciplinary Studies | 14 | 0.5% |
| Science & Technology | 391 | 12.9% |
| Business | 624 | 20.6% |
| Education | 294 | 9.7% |
| Literature & Languages | 74 | 2.5% |
| Liberal Arts & History | 153 | 5.1% |
| Visual & Performing Arts | 143 | 4.7% |
| Communications | 94 | 3.1% |
| Arts & Humanities | 133 | 4.4% |
| Total | 3,024 | 100.0% |
Transportation & Commute in Palm Springs
Vehicle Availability by Sex in Palm Springs
The most prevalent vehicle ownership categories in Palm Springs are males with 2 vehicles (3,769, accounting for 47.9%) and females with 2 vehicles (2,679, making up 66.1%).
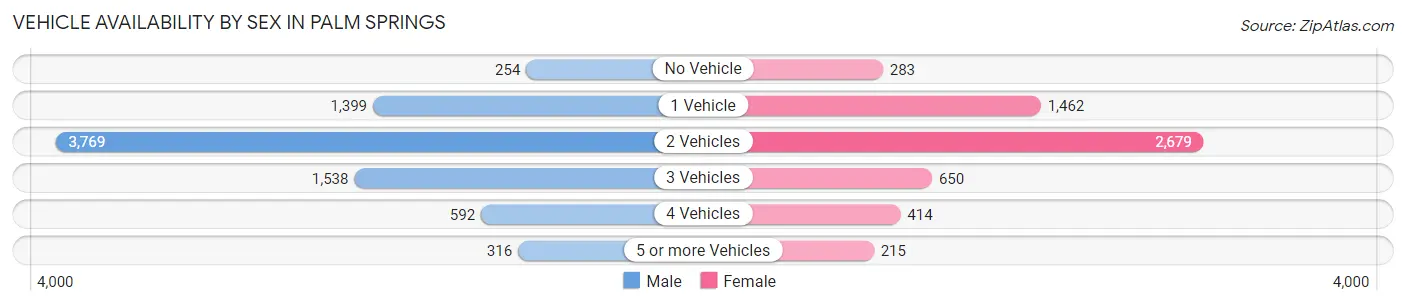
| Vehicles Available | Male | Female |
| No Vehicle | 254 (3.2%) | 283 (5.0%) |
| 1 Vehicle | 1,399 (17.8%) | 1,462 (25.6%) |
| 2 Vehicles | 3,769 (47.9%) | 2,679 (47.0%) |
| 3 Vehicles | 1,538 (19.6%) | 650 (11.4%) |
| 4 Vehicles | 592 (7.5%) | 414 (7.3%) |
| 5 or more Vehicles | 316 (4.0%) | 215 (3.8%) |
| Total | 7,868 (100.0%) | 5,703 (100.0%) |
Commute Time in Palm Springs
The most frequently occuring commute durations in Palm Springs are 30 to 34 minutes (2,544 commuters, 19.6%), 20 to 24 minutes (2,132 commuters, 16.4%), and 15 to 19 minutes (2,008 commuters, 15.5%).
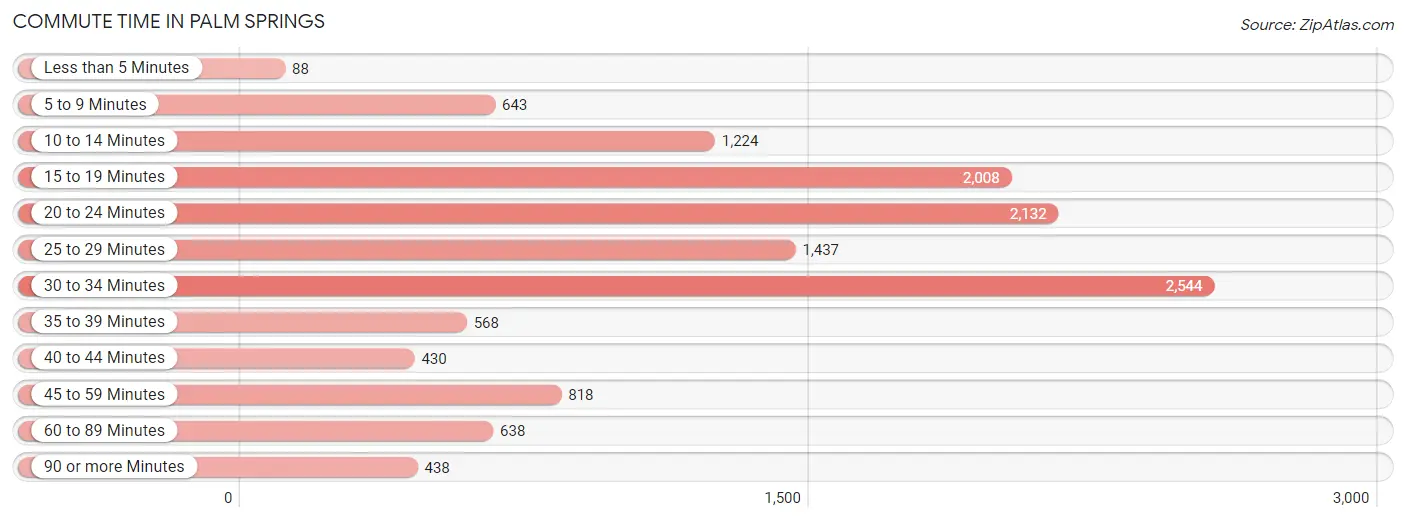
| Commute Time | # Commuters | % Commuters |
| Less than 5 Minutes | 88 | 0.7% |
| 5 to 9 Minutes | 643 | 5.0% |
| 10 to 14 Minutes | 1,224 | 9.4% |
| 15 to 19 Minutes | 2,008 | 15.5% |
| 20 to 24 Minutes | 2,132 | 16.4% |
| 25 to 29 Minutes | 1,437 | 11.1% |
| 30 to 34 Minutes | 2,544 | 19.6% |
| 35 to 39 Minutes | 568 | 4.4% |
| 40 to 44 Minutes | 430 | 3.3% |
| 45 to 59 Minutes | 818 | 6.3% |
| 60 to 89 Minutes | 638 | 4.9% |
| 90 or more Minutes | 438 | 3.4% |
Commute Time by Sex in Palm Springs
The most common commute times in Palm Springs are 30 to 34 minutes (1,613 commuters, 21.0%) for males and 20 to 24 minutes (1,156 commuters, 21.9%) for females.
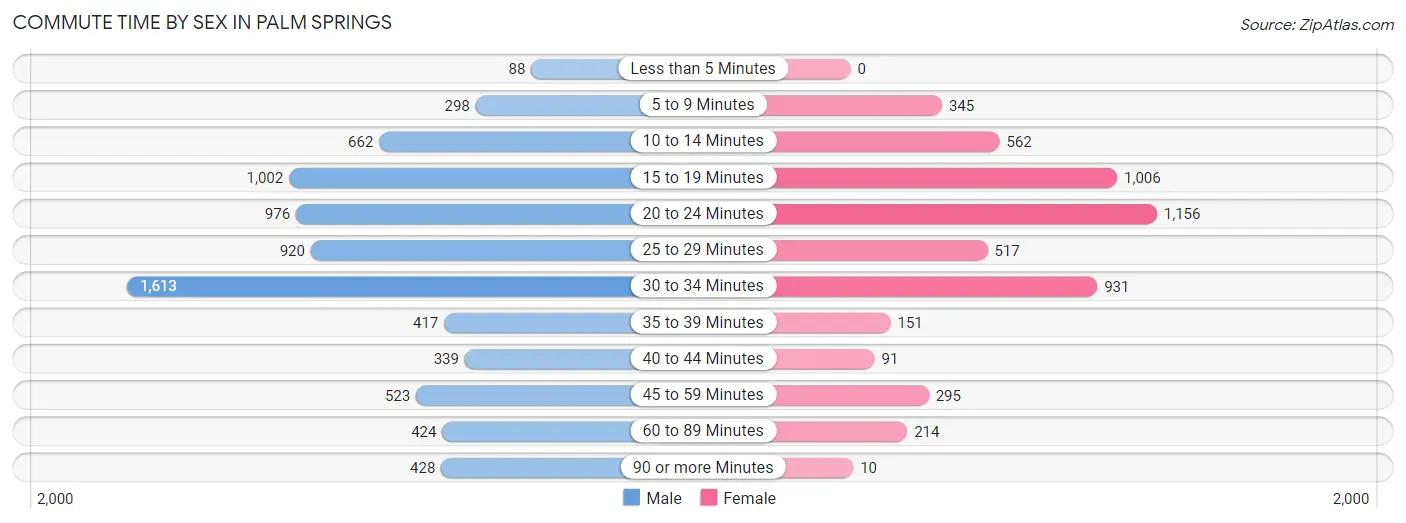
| Commute Time | Male | Female |
| Less than 5 Minutes | 88 (1.1%) | 0 (0.0%) |
| 5 to 9 Minutes | 298 (3.9%) | 345 (6.5%) |
| 10 to 14 Minutes | 662 (8.6%) | 562 (10.6%) |
| 15 to 19 Minutes | 1,002 (13.0%) | 1,006 (19.1%) |
| 20 to 24 Minutes | 976 (12.7%) | 1,156 (21.9%) |
| 25 to 29 Minutes | 920 (12.0%) | 517 (9.8%) |
| 30 to 34 Minutes | 1,613 (21.0%) | 931 (17.6%) |
| 35 to 39 Minutes | 417 (5.4%) | 151 (2.9%) |
| 40 to 44 Minutes | 339 (4.4%) | 91 (1.7%) |
| 45 to 59 Minutes | 523 (6.8%) | 295 (5.6%) |
| 60 to 89 Minutes | 424 (5.5%) | 214 (4.1%) |
| 90 or more Minutes | 428 (5.6%) | 10 (0.2%) |
Time of Departure to Work by Sex in Palm Springs
The most frequent times of departure to work in Palm Springs are 7:00 AM to 7:29 AM (1,586, 20.6%) for males and 7:00 AM to 7:29 AM (1,235, 23.4%) for females.
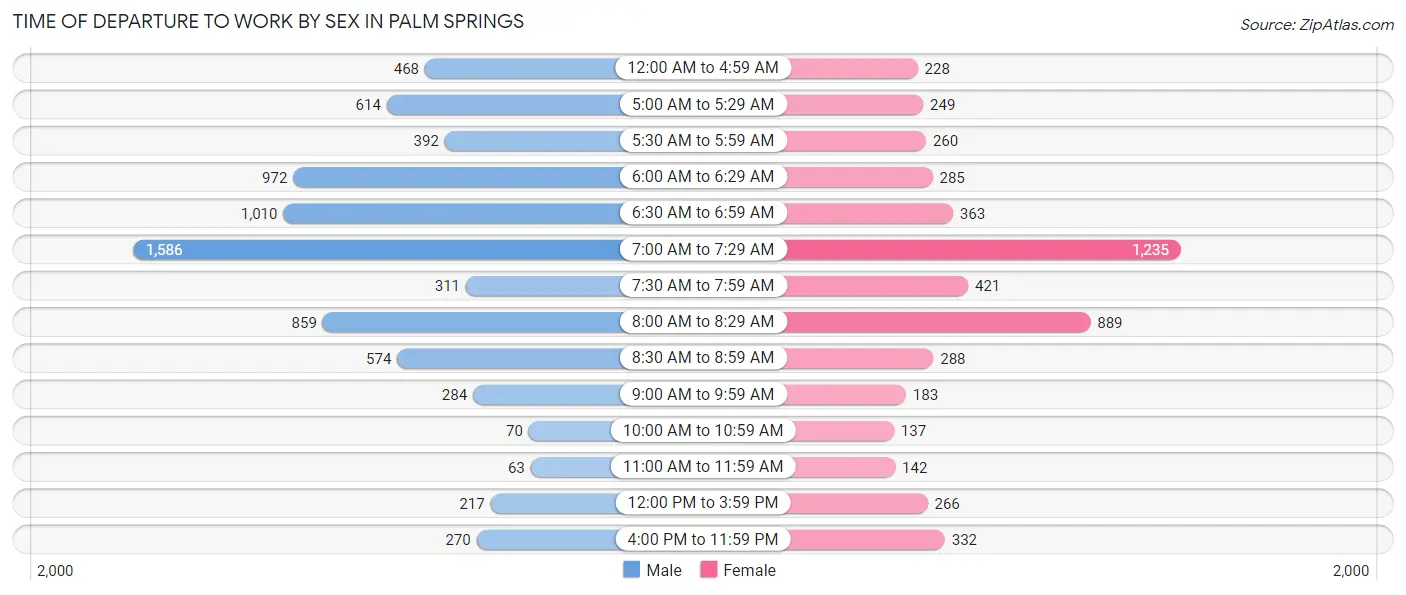
| Time of Departure | Male | Female |
| 12:00 AM to 4:59 AM | 468 (6.1%) | 228 (4.3%) |
| 5:00 AM to 5:29 AM | 614 (8.0%) | 249 (4.7%) |
| 5:30 AM to 5:59 AM | 392 (5.1%) | 260 (4.9%) |
| 6:00 AM to 6:29 AM | 972 (12.6%) | 285 (5.4%) |
| 6:30 AM to 6:59 AM | 1,010 (13.1%) | 363 (6.9%) |
| 7:00 AM to 7:29 AM | 1,586 (20.6%) | 1,235 (23.4%) |
| 7:30 AM to 7:59 AM | 311 (4.0%) | 421 (8.0%) |
| 8:00 AM to 8:29 AM | 859 (11.2%) | 889 (16.8%) |
| 8:30 AM to 8:59 AM | 574 (7.5%) | 288 (5.5%) |
| 9:00 AM to 9:59 AM | 284 (3.7%) | 183 (3.5%) |
| 10:00 AM to 10:59 AM | 70 (0.9%) | 137 (2.6%) |
| 11:00 AM to 11:59 AM | 63 (0.8%) | 142 (2.7%) |
| 12:00 PM to 3:59 PM | 217 (2.8%) | 266 (5.0%) |
| 4:00 PM to 11:59 PM | 270 (3.5%) | 332 (6.3%) |
| Total | 7,690 (100.0%) | 5,278 (100.0%) |
Housing Occupancy in Palm Springs
Occupancy by Ownership in Palm Springs
Of the total 8,800 dwellings in Palm Springs, owner-occupied units account for 3,948 (44.9%), while renter-occupied units make up 4,852 (55.1%).
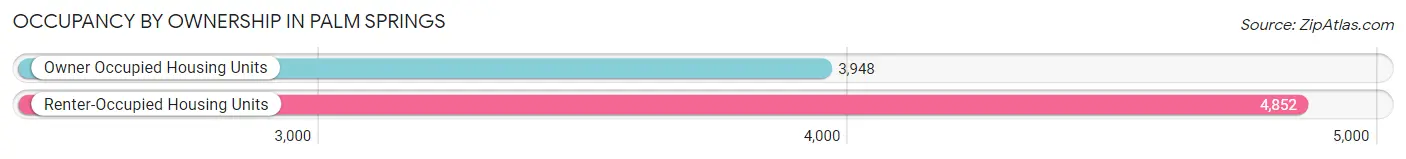
| Occupancy | # Housing Units | % Housing Units |
| Owner Occupied Housing Units | 3,948 | 44.9% |
| Renter-Occupied Housing Units | 4,852 | 55.1% |
| Total Occupied Housing Units | 8,800 | 100.0% |
Occupancy by Household Size in Palm Springs
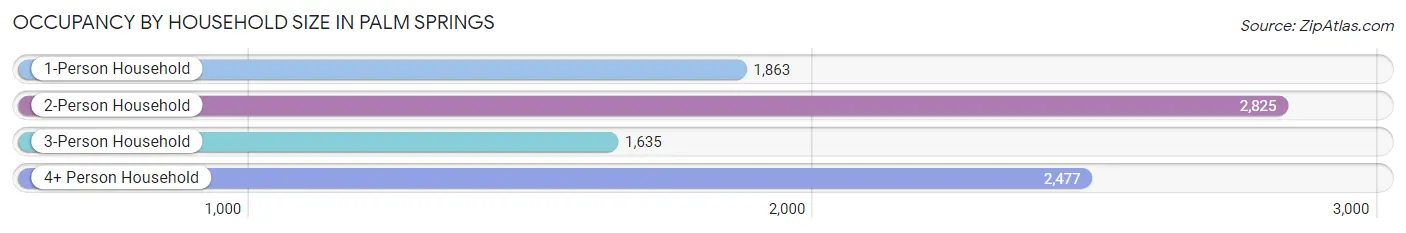
| Household Size | # Housing Units | % Housing Units |
| 1-Person Household | 1,863 | 21.2% |
| 2-Person Household | 2,825 | 32.1% |
| 3-Person Household | 1,635 | 18.6% |
| 4+ Person Household | 2,477 | 28.1% |
| Total Housing Units | 8,800 | 100.0% |
Occupancy by Ownership by Household Size in Palm Springs
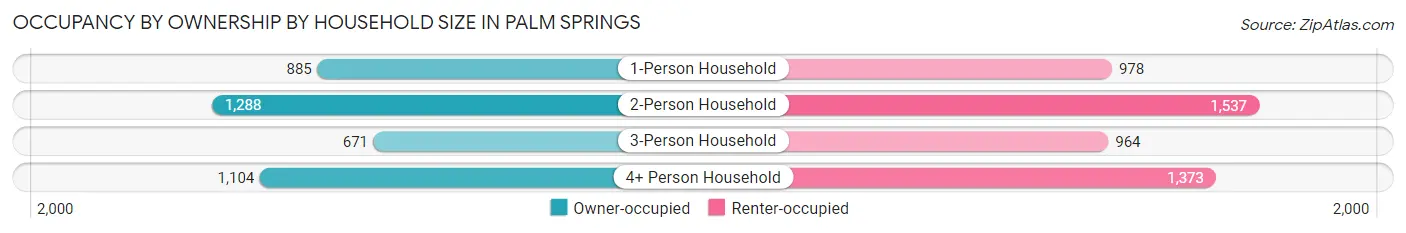
| Household Size | Owner-occupied | Renter-occupied |
| 1-Person Household | 885 (47.5%) | 978 (52.5%) |
| 2-Person Household | 1,288 (45.6%) | 1,537 (54.4%) |
| 3-Person Household | 671 (41.0%) | 964 (59.0%) |
| 4+ Person Household | 1,104 (44.6%) | 1,373 (55.4%) |
| Total Housing Units | 3,948 (44.9%) | 4,852 (55.1%) |
Occupancy by Educational Attainment in Palm Springs
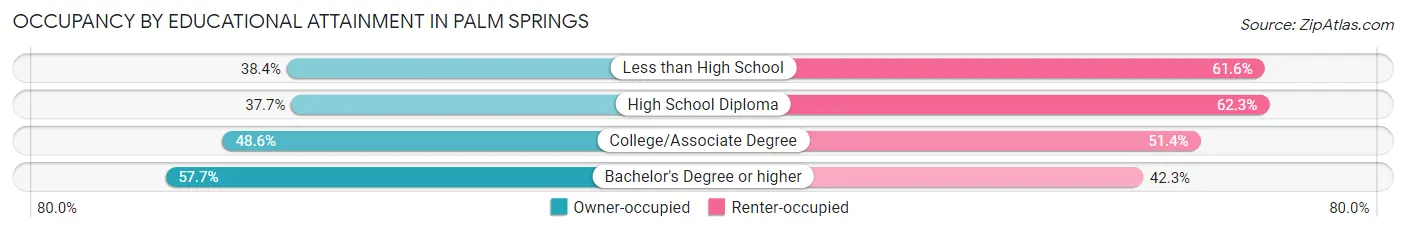
| Household Size | Owner-occupied | Renter-occupied |
| Less than High School | 807 (38.4%) | 1,294 (61.6%) |
| High School Diploma | 947 (37.7%) | 1,565 (62.3%) |
| College/Associate Degree | 1,181 (48.6%) | 1,250 (51.4%) |
| Bachelor's Degree or higher | 1,013 (57.7%) | 743 (42.3%) |
Occupancy by Age of Householder in Palm Springs
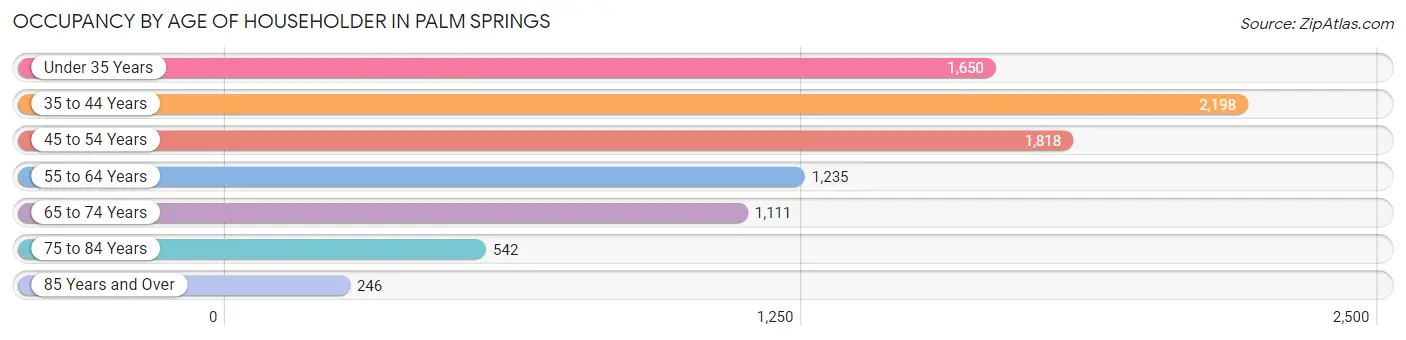
| Age Bracket | # Households | % Households |
| Under 35 Years | 1,650 | 18.8% |
| 35 to 44 Years | 2,198 | 25.0% |
| 45 to 54 Years | 1,818 | 20.7% |
| 55 to 64 Years | 1,235 | 14.0% |
| 65 to 74 Years | 1,111 | 12.6% |
| 75 to 84 Years | 542 | 6.2% |
| 85 Years and Over | 246 | 2.8% |
| Total | 8,800 | 100.0% |
Housing Finances in Palm Springs
Median Income by Occupancy in Palm Springs
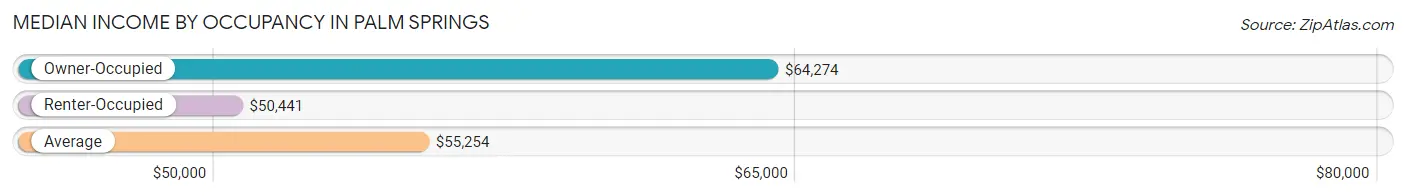
| Occupancy Type | # Households | Median Income |
| Owner-Occupied | 3,948 (44.9%) | $64,274 |
| Renter-Occupied | 4,852 (55.1%) | $50,441 |
| Average | 8,800 (100.0%) | $55,254 |
Occupancy by Householder Income Bracket in Palm Springs
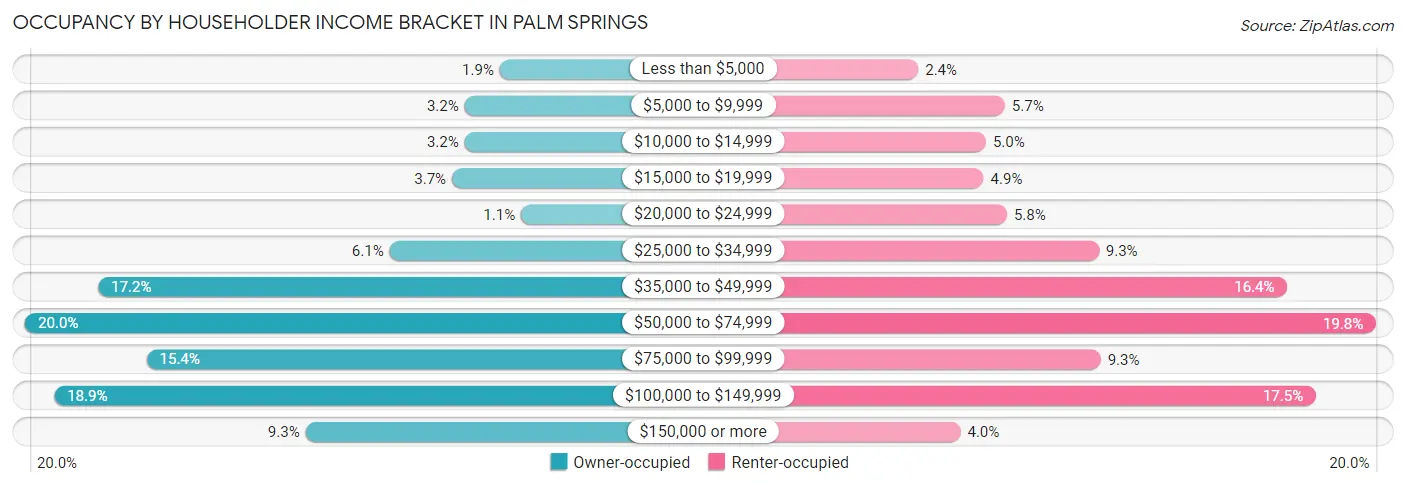
| Income Bracket | Owner-occupied | Renter-occupied |
| Less than $5,000 | 75 (1.9%) | 116 (2.4%) |
| $5,000 to $9,999 | 128 (3.2%) | 276 (5.7%) |
| $10,000 to $14,999 | 128 (3.2%) | 241 (5.0%) |
| $15,000 to $19,999 | 147 (3.7%) | 237 (4.9%) |
| $20,000 to $24,999 | 43 (1.1%) | 280 (5.8%) |
| $25,000 to $34,999 | 241 (6.1%) | 450 (9.3%) |
| $35,000 to $49,999 | 679 (17.2%) | 796 (16.4%) |
| $50,000 to $74,999 | 789 (20.0%) | 960 (19.8%) |
| $75,000 to $99,999 | 606 (15.3%) | 453 (9.3%) |
| $100,000 to $149,999 | 745 (18.9%) | 849 (17.5%) |
| $150,000 or more | 367 (9.3%) | 194 (4.0%) |
| Total | 3,948 (100.0%) | 4,852 (100.0%) |
Monthly Housing Cost Tiers in Palm Springs
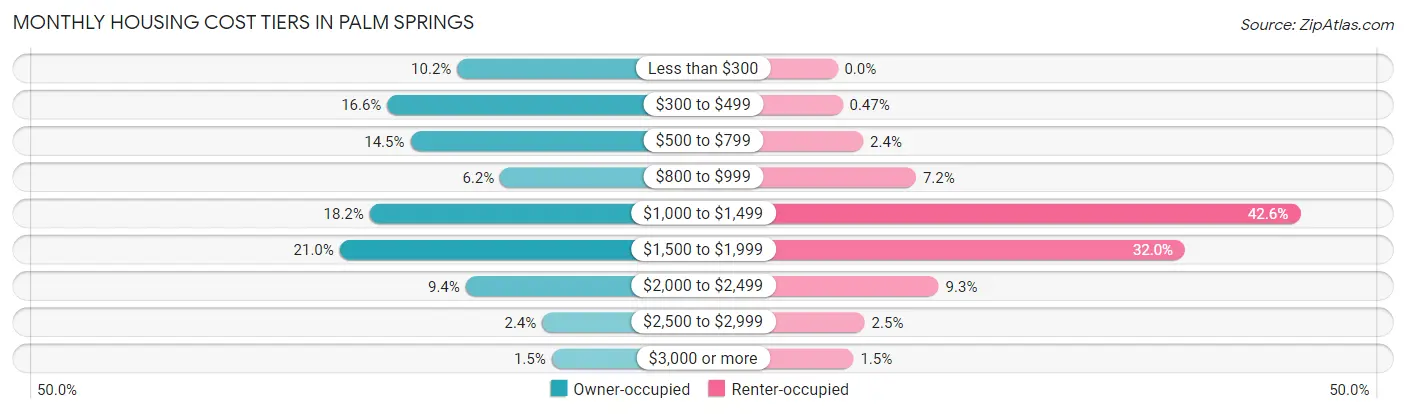
| Monthly Cost | Owner-occupied | Renter-occupied |
| Less than $300 | 402 (10.2%) | 0 (0.0%) |
| $300 to $499 | 656 (16.6%) | 23 (0.5%) |
| $500 to $799 | 572 (14.5%) | 115 (2.4%) |
| $800 to $999 | 246 (6.2%) | 351 (7.2%) |
| $1,000 to $1,499 | 720 (18.2%) | 2,066 (42.6%) |
| $1,500 to $1,999 | 829 (21.0%) | 1,552 (32.0%) |
| $2,000 to $2,499 | 371 (9.4%) | 452 (9.3%) |
| $2,500 to $2,999 | 93 (2.4%) | 122 (2.5%) |
| $3,000 or more | 59 (1.5%) | 72 (1.5%) |
| Total | 3,948 (100.0%) | 4,852 (100.0%) |
Physical Housing Characteristics in Palm Springs
Housing Structures in Palm Springs
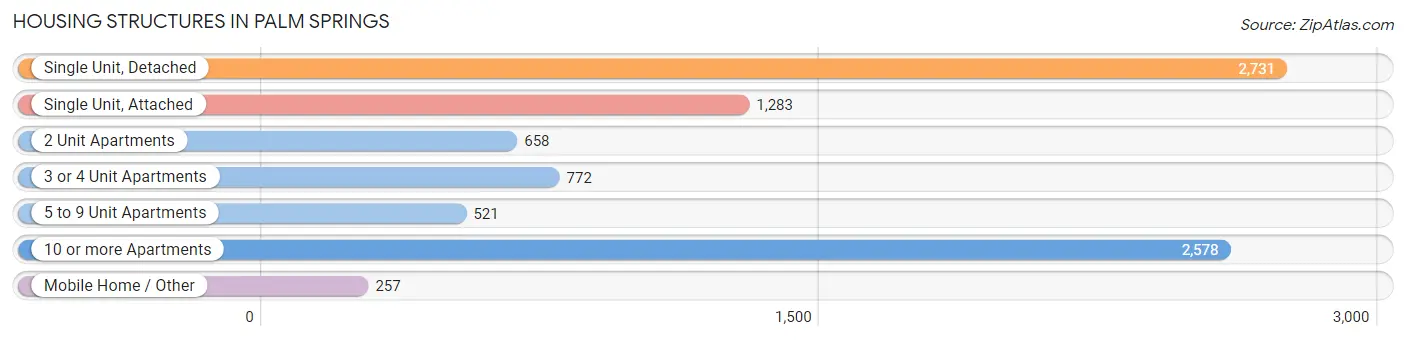
| Structure Type | # Housing Units | % Housing Units |
| Single Unit, Detached | 2,731 | 31.0% |
| Single Unit, Attached | 1,283 | 14.6% |
| 2 Unit Apartments | 658 | 7.5% |
| 3 or 4 Unit Apartments | 772 | 8.8% |
| 5 to 9 Unit Apartments | 521 | 5.9% |
| 10 or more Apartments | 2,578 | 29.3% |
| Mobile Home / Other | 257 | 2.9% |
| Total | 8,800 | 100.0% |
Housing Structures by Occupancy in Palm Springs
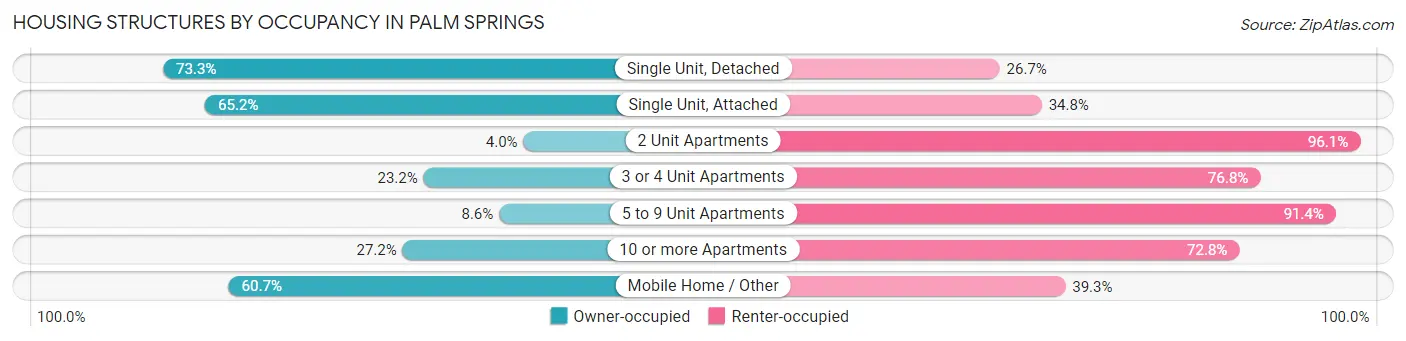
| Structure Type | Owner-occupied | Renter-occupied |
| Single Unit, Detached | 2,003 (73.3%) | 728 (26.7%) |
| Single Unit, Attached | 837 (65.2%) | 446 (34.8%) |
| 2 Unit Apartments | 26 (4.0%) | 632 (96.1%) |
| 3 or 4 Unit Apartments | 179 (23.2%) | 593 (76.8%) |
| 5 to 9 Unit Apartments | 45 (8.6%) | 476 (91.4%) |
| 10 or more Apartments | 702 (27.2%) | 1,876 (72.8%) |
| Mobile Home / Other | 156 (60.7%) | 101 (39.3%) |
| Total | 3,948 (44.9%) | 4,852 (55.1%) |
Housing Structures by Number of Rooms in Palm Springs
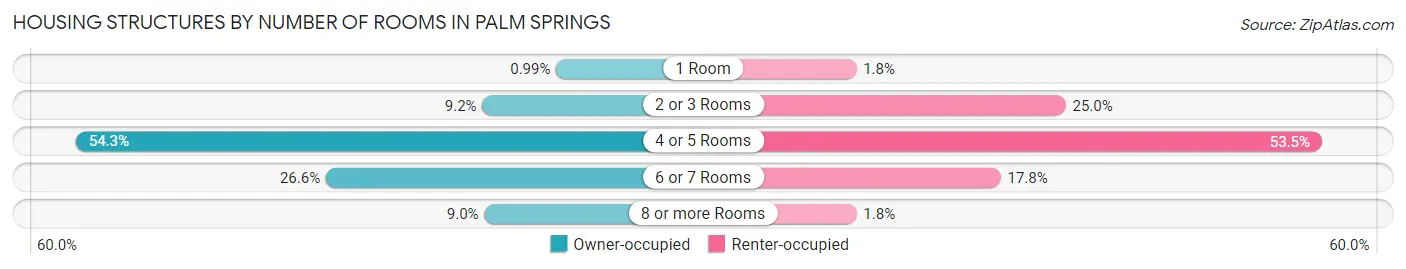
| Number of Rooms | Owner-occupied | Renter-occupied |
| 1 Room | 39 (1.0%) | 88 (1.8%) |
| 2 or 3 Rooms | 363 (9.2%) | 1,215 (25.0%) |
| 4 or 5 Rooms | 2,144 (54.3%) | 2,595 (53.5%) |
| 6 or 7 Rooms | 1,048 (26.6%) | 865 (17.8%) |
| 8 or more Rooms | 354 (9.0%) | 89 (1.8%) |
| Total | 3,948 (100.0%) | 4,852 (100.0%) |
Housing Structure by Heating Type in Palm Springs
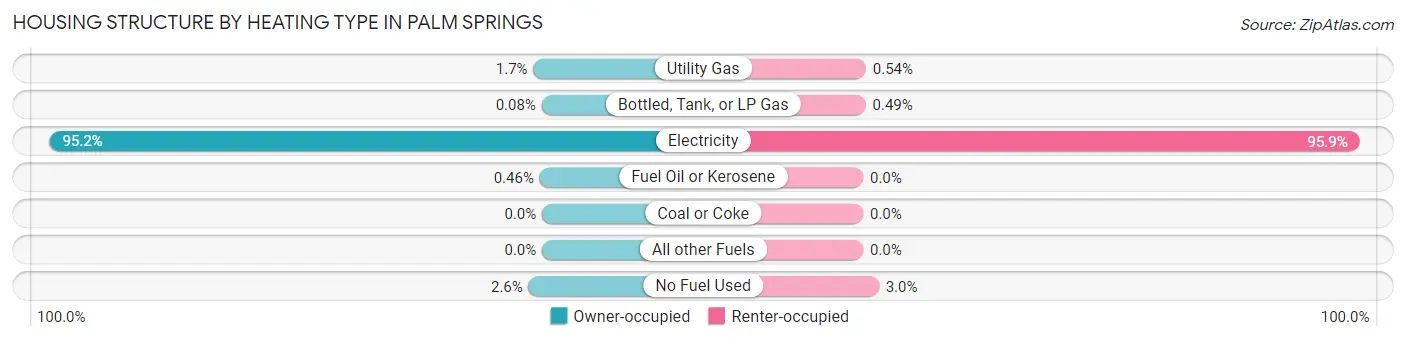
| Heating Type | Owner-occupied | Renter-occupied |
| Utility Gas | 66 (1.7%) | 26 (0.5%) |
| Bottled, Tank, or LP Gas | 3 (0.1%) | 24 (0.5%) |
| Electricity | 3,758 (95.2%) | 4,655 (95.9%) |
| Fuel Oil or Kerosene | 18 (0.5%) | 0 (0.0%) |
| Coal or Coke | 0 (0.0%) | 0 (0.0%) |
| All other Fuels | 0 (0.0%) | 0 (0.0%) |
| No Fuel Used | 103 (2.6%) | 147 (3.0%) |
| Total | 3,948 (100.0%) | 4,852 (100.0%) |
Household Vehicle Usage in Palm Springs
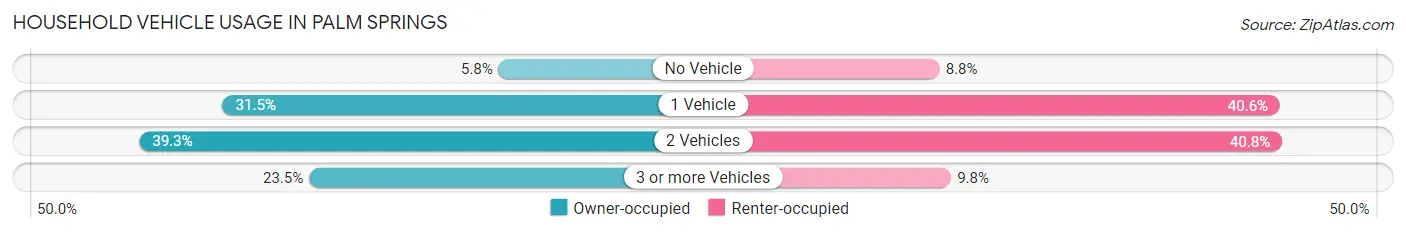
| Vehicles per Household | Owner-occupied | Renter-occupied |
| No Vehicle | 227 (5.8%) | 425 (8.8%) |
| 1 Vehicle | 1,244 (31.5%) | 1,970 (40.6%) |
| 2 Vehicles | 1,551 (39.3%) | 1,980 (40.8%) |
| 3 or more Vehicles | 926 (23.4%) | 477 (9.8%) |
| Total | 3,948 (100.0%) | 4,852 (100.0%) |
Real Estate & Mortgages in Palm Springs
Real Estate and Mortgage Overview in Palm Springs
| Characteristic | Without Mortgage | With Mortgage |
| Housing Units | 1,533 | 2,415 |
| Median Property Value | $153,200 | $242,900 |
| Median Household Income | $43,818 | $266 |
| Monthly Housing Costs | $460 | $59 |
| Real Estate Taxes | $1,157 | $68 |
Property Value by Mortgage Status in Palm Springs
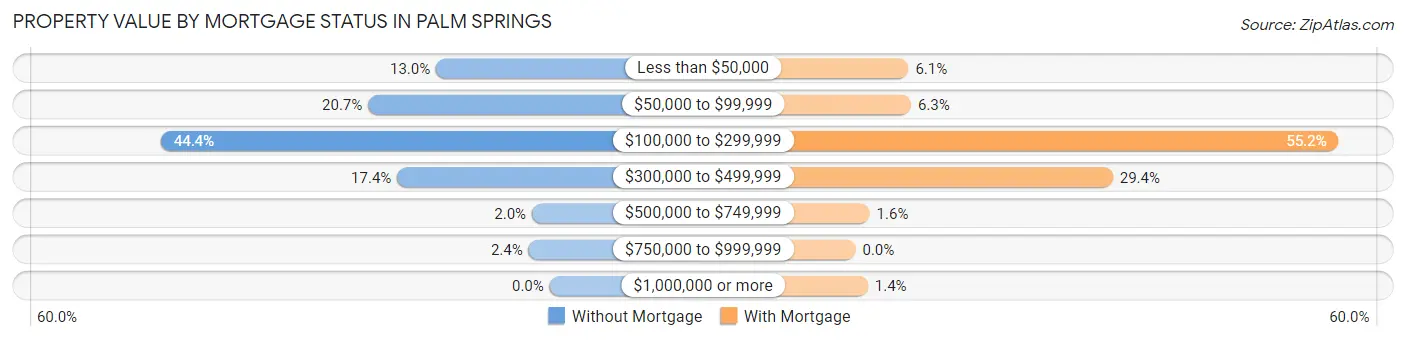
| Property Value | Without Mortgage | With Mortgage |
| Less than $50,000 | 199 (13.0%) | 146 (6.0%) |
| $50,000 to $99,999 | 318 (20.7%) | 153 (6.3%) |
| $100,000 to $299,999 | 681 (44.4%) | 1,333 (55.2%) |
| $300,000 to $499,999 | 267 (17.4%) | 710 (29.4%) |
| $500,000 to $749,999 | 31 (2.0%) | 39 (1.6%) |
| $750,000 to $999,999 | 37 (2.4%) | 0 (0.0%) |
| $1,000,000 or more | 0 (0.0%) | 34 (1.4%) |
| Total | 1,533 (100.0%) | 2,415 (100.0%) |
Household Income by Mortgage Status in Palm Springs
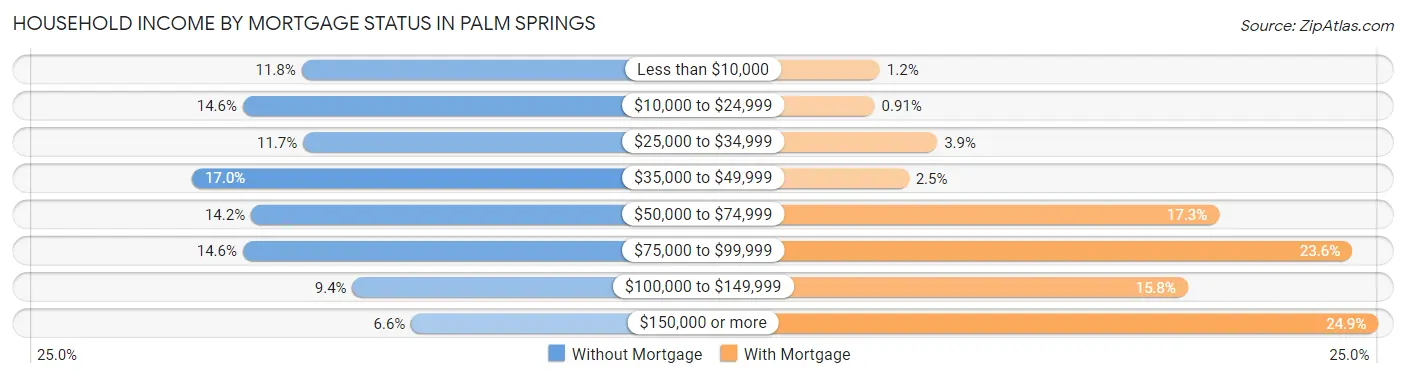
| Household Income | Without Mortgage | With Mortgage |
| Less than $10,000 | 181 (11.8%) | 28 (1.2%) |
| $10,000 to $24,999 | 224 (14.6%) | 22 (0.9%) |
| $25,000 to $34,999 | 180 (11.7%) | 94 (3.9%) |
| $35,000 to $49,999 | 261 (17.0%) | 61 (2.5%) |
| $50,000 to $74,999 | 218 (14.2%) | 418 (17.3%) |
| $75,000 to $99,999 | 224 (14.6%) | 571 (23.6%) |
| $100,000 to $149,999 | 144 (9.4%) | 382 (15.8%) |
| $150,000 or more | 101 (6.6%) | 601 (24.9%) |
| Total | 1,533 (100.0%) | 2,415 (100.0%) |
Property Value to Household Income Ratio in Palm Springs
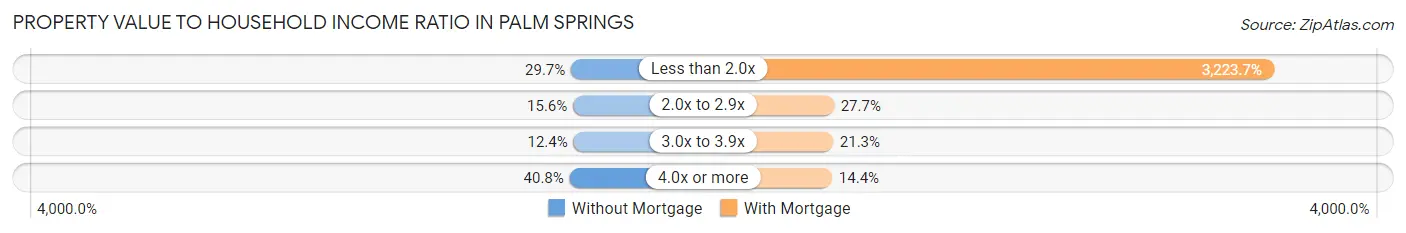
| Value-to-Income Ratio | Without Mortgage | With Mortgage |
| Less than 2.0x | 455 (29.7%) | 77,852 (3,223.7%) |
| 2.0x to 2.9x | 239 (15.6%) | 669 (27.7%) |
| 3.0x to 3.9x | 190 (12.4%) | 514 (21.3%) |
| 4.0x or more | 625 (40.8%) | 348 (14.4%) |
| Total | 1,533 (100.0%) | 2,415 (100.0%) |
Real Estate Taxes by Mortgage Status in Palm Springs
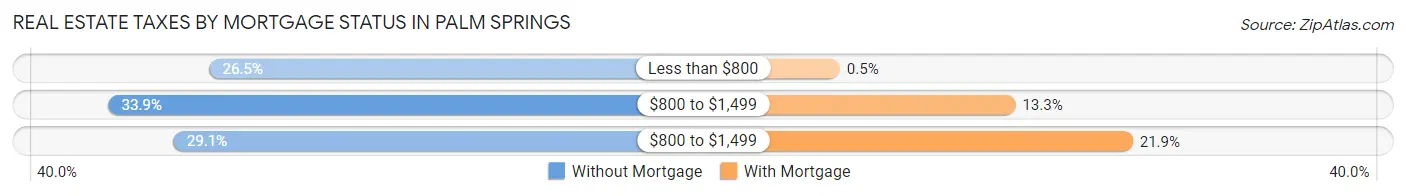
| Property Taxes | Without Mortgage | With Mortgage |
| Less than $800 | 406 (26.5%) | 12 (0.5%) |
| $800 to $1,499 | 519 (33.9%) | 322 (13.3%) |
| $800 to $1,499 | 446 (29.1%) | 529 (21.9%) |
| Total | 1,533 (100.0%) | 2,415 (100.0%) |
Health & Disability in Palm Springs
Health Insurance Coverage by Age in Palm Springs
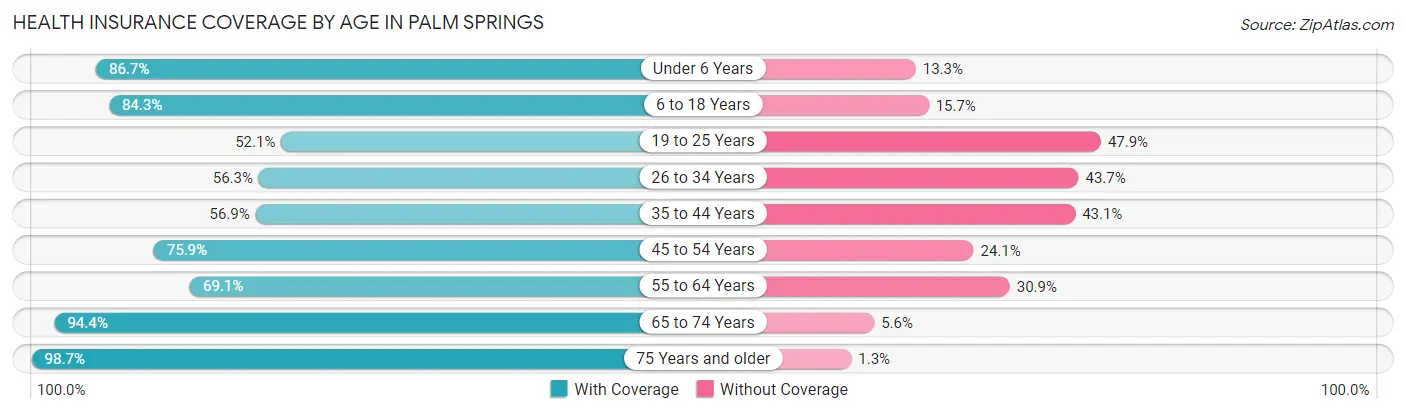
| Age Bracket | With Coverage | Without Coverage |
| Under 6 Years | 1,762 (86.7%) | 271 (13.3%) |
| 6 to 18 Years | 3,807 (84.3%) | 711 (15.7%) |
| 19 to 25 Years | 1,428 (52.1%) | 1,311 (47.9%) |
| 26 to 34 Years | 2,064 (56.3%) | 1,601 (43.7%) |
| 35 to 44 Years | 2,264 (56.9%) | 1,712 (43.1%) |
| 45 to 54 Years | 2,811 (75.9%) | 893 (24.1%) |
| 55 to 64 Years | 1,879 (69.1%) | 839 (30.9%) |
| 65 to 74 Years | 1,776 (94.4%) | 105 (5.6%) |
| 75 Years and older | 1,350 (98.7%) | 18 (1.3%) |
| Total | 19,141 (72.0%) | 7,461 (28.1%) |
Health Insurance Coverage by Citizenship Status in Palm Springs
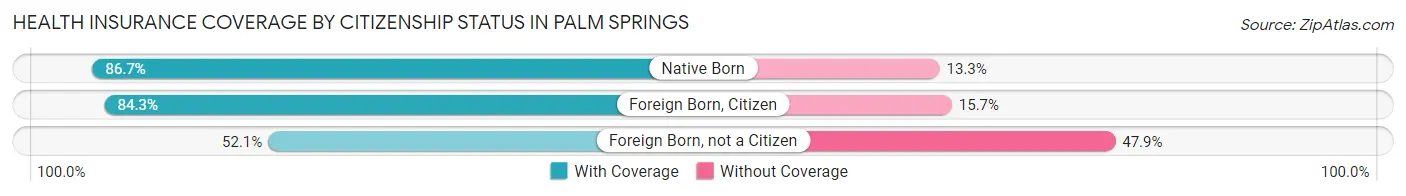
| Citizenship Status | With Coverage | Without Coverage |
| Native Born | 1,762 (86.7%) | 271 (13.3%) |
| Foreign Born, Citizen | 3,807 (84.3%) | 711 (15.7%) |
| Foreign Born, not a Citizen | 1,428 (52.1%) | 1,311 (47.9%) |
Health Insurance Coverage by Household Income in Palm Springs
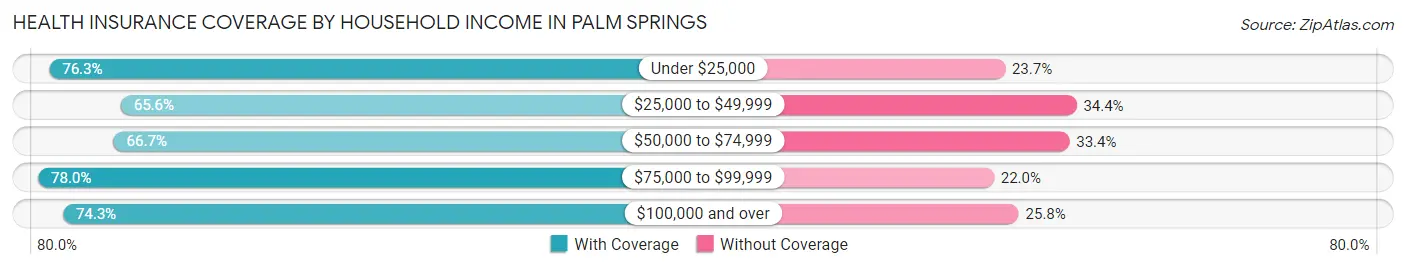
| Household Income | With Coverage | Without Coverage |
| Under $25,000 | 2,567 (76.3%) | 798 (23.7%) |
| $25,000 to $49,999 | 3,552 (65.6%) | 1,864 (34.4%) |
| $50,000 to $74,999 | 3,368 (66.6%) | 1,685 (33.4%) |
| $75,000 to $99,999 | 3,316 (78.0%) | 937 (22.0%) |
| $100,000 and over | 6,276 (74.3%) | 2,177 (25.8%) |
Public vs Private Health Insurance Coverage by Age in Palm Springs
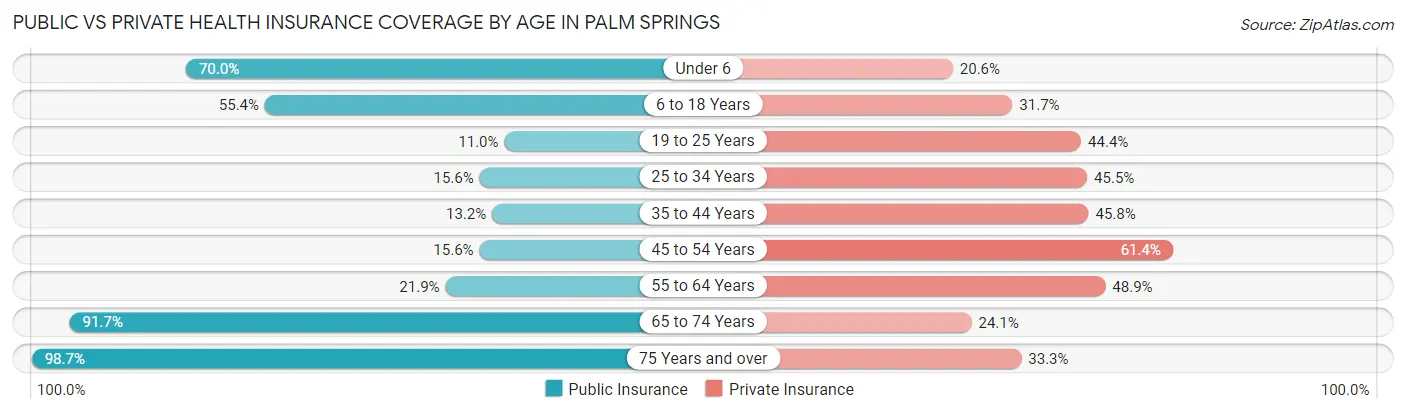
| Age Bracket | Public Insurance | Private Insurance |
| Under 6 | 1,424 (70.0%) | 419 (20.6%) |
| 6 to 18 Years | 2,503 (55.4%) | 1,431 (31.7%) |
| 19 to 25 Years | 300 (11.0%) | 1,217 (44.4%) |
| 25 to 34 Years | 570 (15.5%) | 1,669 (45.5%) |
| 35 to 44 Years | 526 (13.2%) | 1,821 (45.8%) |
| 45 to 54 Years | 577 (15.6%) | 2,275 (61.4%) |
| 55 to 64 Years | 595 (21.9%) | 1,330 (48.9%) |
| 65 to 74 Years | 1,724 (91.6%) | 453 (24.1%) |
| 75 Years and over | 1,350 (98.7%) | 456 (33.3%) |
| Total | 9,569 (36.0%) | 11,071 (41.6%) |
Disability Status by Sex by Age in Palm Springs
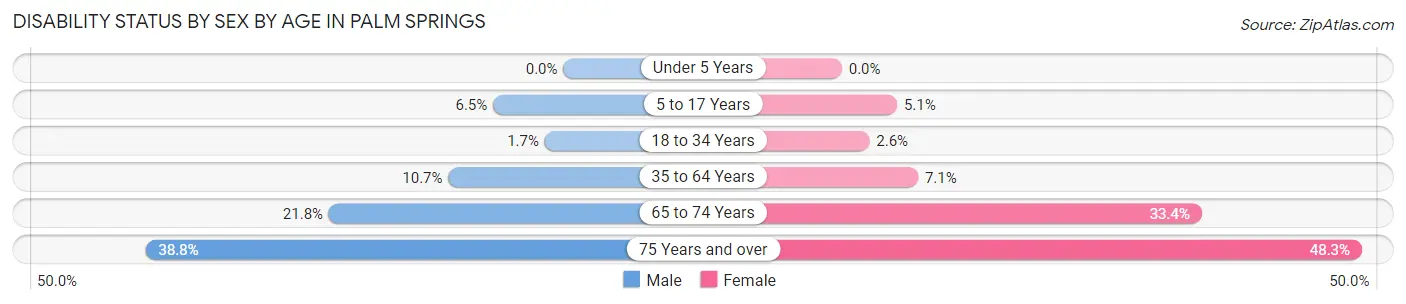
| Age Bracket | Male | Female |
| Under 5 Years | 0 (0.0%) | 0 (0.0%) |
| 5 to 17 Years | 152 (6.5%) | 111 (5.1%) |
| 18 to 34 Years | 59 (1.7%) | 83 (2.6%) |
| 35 to 64 Years | 589 (10.7%) | 345 (7.1%) |
| 65 to 74 Years | 176 (21.8%) | 358 (33.4%) |
| 75 Years and over | 263 (38.8%) | 333 (48.3%) |
Disability Class by Sex by Age in Palm Springs
Disability Class: Hearing Difficulty
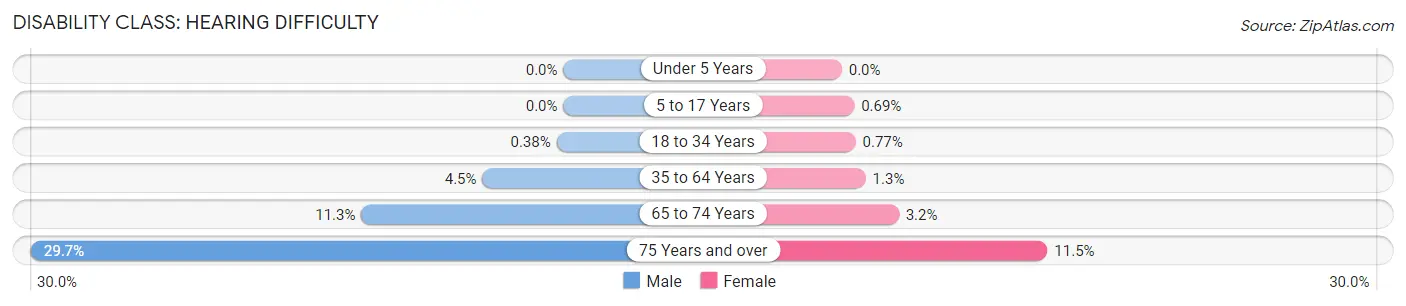
| Age Bracket | Male | Female |
| Under 5 Years | 0 (0.0%) | 0 (0.0%) |
| 5 to 17 Years | 0 (0.0%) | 15 (0.7%) |
| 18 to 34 Years | 13 (0.4%) | 25 (0.8%) |
| 35 to 64 Years | 249 (4.5%) | 65 (1.3%) |
| 65 to 74 Years | 91 (11.3%) | 34 (3.2%) |
| 75 Years and over | 201 (29.6%) | 79 (11.5%) |
Disability Class: Vision Difficulty
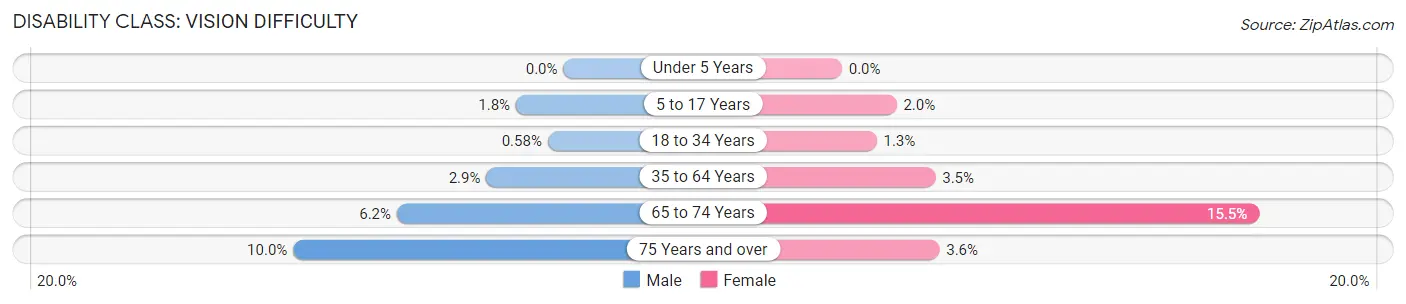
| Age Bracket | Male | Female |
| Under 5 Years | 0 (0.0%) | 0 (0.0%) |
| 5 to 17 Years | 41 (1.8%) | 44 (2.0%) |
| 18 to 34 Years | 20 (0.6%) | 42 (1.3%) |
| 35 to 64 Years | 158 (2.9%) | 169 (3.5%) |
| 65 to 74 Years | 50 (6.2%) | 166 (15.5%) |
| 75 Years and over | 68 (10.0%) | 25 (3.6%) |
Disability Class: Cognitive Difficulty
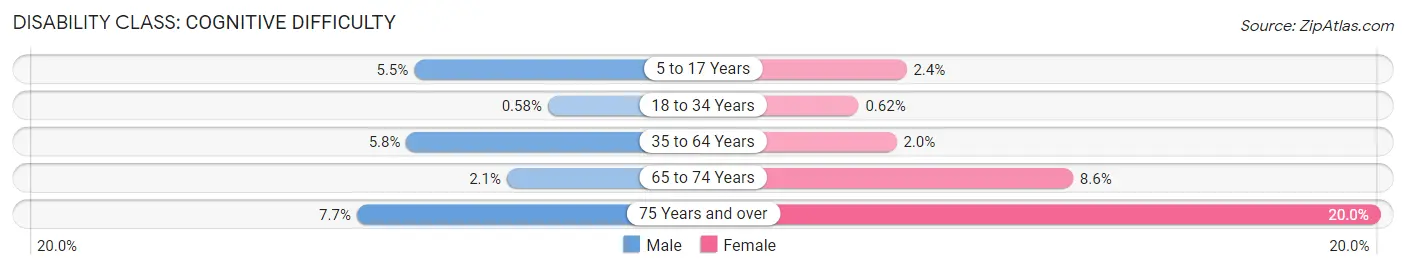
| Age Bracket | Male | Female |
| 5 to 17 Years | 129 (5.5%) | 52 (2.4%) |
| 18 to 34 Years | 20 (0.6%) | 20 (0.6%) |
| 35 to 64 Years | 322 (5.8%) | 99 (2.0%) |
| 65 to 74 Years | 17 (2.1%) | 92 (8.6%) |
| 75 Years and over | 52 (7.7%) | 138 (20.0%) |
Disability Class: Ambulatory Difficulty
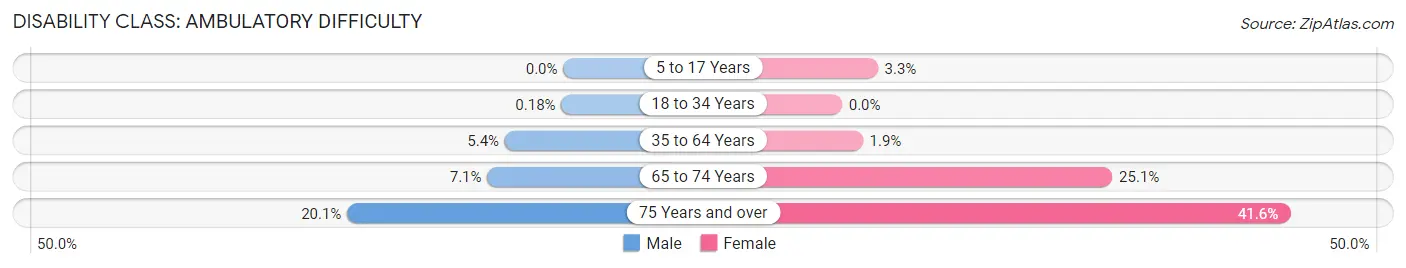
| Age Bracket | Male | Female |
| 5 to 17 Years | 0 (0.0%) | 72 (3.3%) |
| 18 to 34 Years | 6 (0.2%) | 0 (0.0%) |
| 35 to 64 Years | 299 (5.4%) | 94 (1.9%) |
| 65 to 74 Years | 57 (7.0%) | 269 (25.1%) |
| 75 Years and over | 136 (20.1%) | 287 (41.6%) |
Disability Class: Self-Care Difficulty
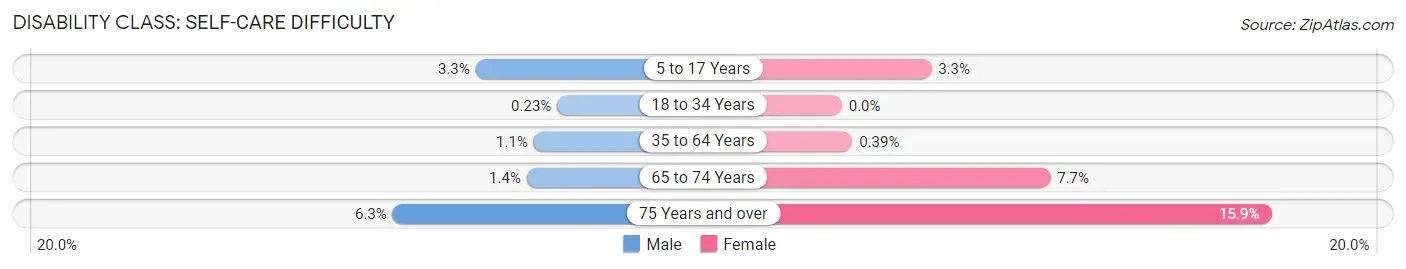
| Age Bracket | Male | Female |
| 5 to 17 Years | 76 (3.3%) | 72 (3.3%) |
| 18 to 34 Years | 8 (0.2%) | 0 (0.0%) |
| 35 to 64 Years | 61 (1.1%) | 19 (0.4%) |
| 65 to 74 Years | 11 (1.4%) | 83 (7.7%) |
| 75 Years and over | 43 (6.3%) | 110 (15.9%) |
Technology Access in Palm Springs
Computing Device Access in Palm Springs
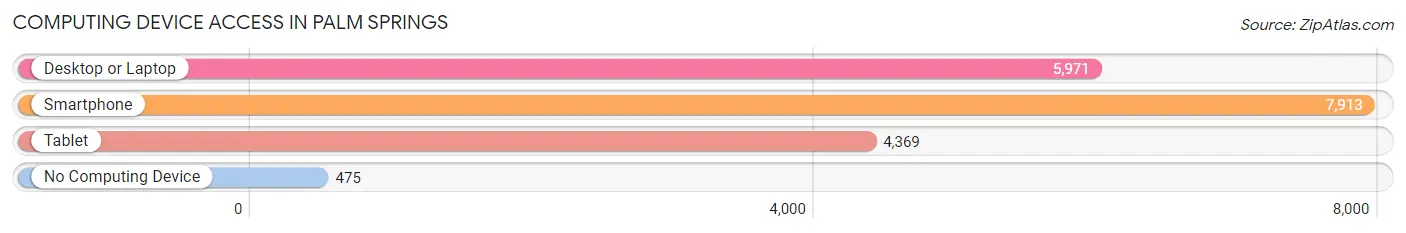
| Device Type | # Households | % Households |
| Desktop or Laptop | 5,971 | 67.8% |
| Smartphone | 7,913 | 89.9% |
| Tablet | 4,369 | 49.6% |
| No Computing Device | 475 | 5.4% |
| Total | 8,800 | 100.0% |
Internet Access in Palm Springs
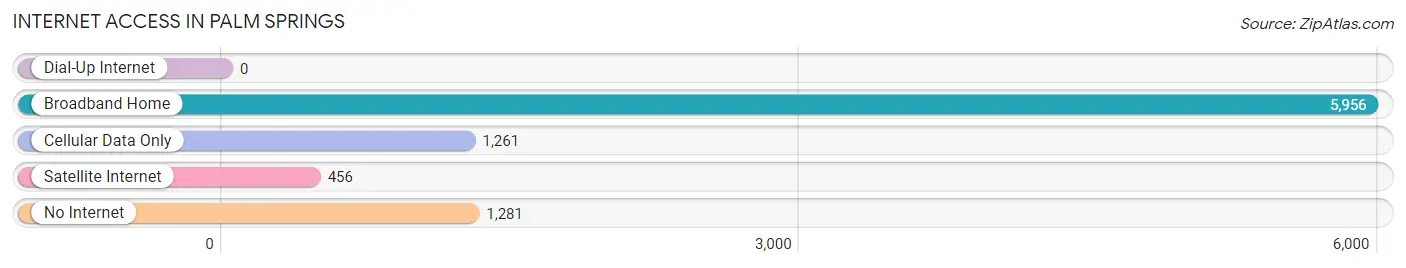
| Internet Type | # Households | % Households |
| Dial-Up Internet | 0 | 0.0% |
| Broadband Home | 5,956 | 67.7% |
| Cellular Data Only | 1,261 | 14.3% |
| Satellite Internet | 456 | 5.2% |
| No Internet | 1,281 | 14.6% |
| Total | 8,800 | 100.0% |
Palm Springs Summary
Palm Springs is a small city located in Palm Beach County, Florida. It is situated between the cities of West Palm Beach and Lake Worth, and is part of the Miami metropolitan area. The city has a population of approximately 21,000 people, and is known for its small-town charm and its proximity to the beaches of the Atlantic Ocean.
Geography
Palm Springs is located in southeastern Florida, in Palm Beach County. It is situated between the cities of West Palm Beach and Lake Worth, and is part of the Miami metropolitan area. The city is bordered by the cities of Lake Clarke Shores to the north, Lake Worth to the east, and Greenacres to the south. The city is located on the western shore of Lake Osborne, and is approximately 10 miles from the Atlantic Ocean.
The city has a total area of 4.2 square miles, of which 4.1 square miles is land and 0.1 square miles is water. The terrain is mostly flat, with some areas of low hills. The climate is subtropical, with hot, humid summers and mild winters.
History
Palm Springs was founded in the early 1950s by a group of developers who wanted to create a small, suburban community. The city was incorporated in 1957, and the population grew rapidly in the following decades. By the 2000 census, the population had reached 21,000.
The city has a long history of agriculture, with many of the original settlers being farmers. The city is also home to a number of historic sites, including the Palm Springs Historical Museum, which houses artifacts from the city’s past.
Economy
Palm Springs is a primarily residential community, and the economy is largely based on the service industry. The city is home to a number of retail stores, restaurants, and other businesses. The city is also home to a number of corporate offices, including those of the Florida Power & Light Company and the Palm Beach County School Board.
The city is also home to a number of parks and recreational facilities, including the Palm Springs Community Center, which offers a variety of activities for residents. The city is also home to a number of golf courses, including the Palm Springs Country Club.
Demographics
As of the 2010 census, the population of Palm Springs was 21,000. The racial makeup of the city was 79.3% White, 11.2% African American, 0.3% Native American, 2.2% Asian, 0.1% Pacific Islander, 4.2% from other races, and 2.9% from two or more races. Hispanic or Latino of any race were 11.7% of the population.
The median income for a household in the city was $41,945, and the median income for a family was $50,945. The per capita income for the city was $21,945. About 8.3% of families and 10.2% of the population were below the poverty line, including 14.2% of those under age 18 and 6.2% of those age 65 or over.
Palm Springs is a small city with a rich history and a diverse population. The city is home to a number of businesses and recreational facilities, and is a popular destination for tourists and residents alike. The city is also home to a number of historic sites, and is a great place to live and work.
Common Questions
What is Per Capita Income in Palm Springs?
Per Capita income in Palm Springs is $26,734.
What is the Median Family Income in Palm Springs?
Median Family Income in Palm Springs is $60,108.
What is the Median Household income in Palm Springs?
Median Household Income in Palm Springs is $55,254.
What is Income or Wage Gap in Palm Springs?
Income or Wage Gap in Palm Springs is 29.1%.
Women in Palm Springs earn 70.9 cents for every dollar earned by a man.
What is Family Income Deficit in Palm Springs?
Family Income Deficit in Palm Springs is $9,952.
Families that are below poverty line in Palm Springs earn $9,952 less on average than the poverty threshold level.
What is Inequality or Gini Index in Palm Springs?
Inequality or Gini Index in Palm Springs is 0.41.
What is the Total Population of Palm Springs?
Total Population of Palm Springs is 26,692.
What is the Total Male Population of Palm Springs?
Total Male Population of Palm Springs is 13,678.
What is the Total Female Population of Palm Springs?
Total Female Population of Palm Springs is 13,014.
What is the Ratio of Males per 100 Females in Palm Springs?
There are 105.10 Males per 100 Females in Palm Springs.
What is the Ratio of Females per 100 Males in Palm Springs?
There are 95.15 Females per 100 Males in Palm Springs.
What is the Median Population Age in Palm Springs?
Median Population Age in Palm Springs is 36.2 Years.
What is the Average Family Size in Palm Springs
Average Family Size in Palm Springs is 3.5 People.
What is the Average Household Size in Palm Springs
Average Household Size in Palm Springs is 3.0 People.
How Large is the Labor Force in Palm Springs?
There are 14,814 People in the Labor Forcein in Palm Springs.
What is the Percentage of People in the Labor Force in Palm Springs?
70.7% of People are in the Labor Force in Palm Springs.
What is the Unemployment Rate in Palm Springs?
Unemployment Rate in Palm Springs is 6.9%.