Poinciana, FL Map & Demographics
Poinciana Map
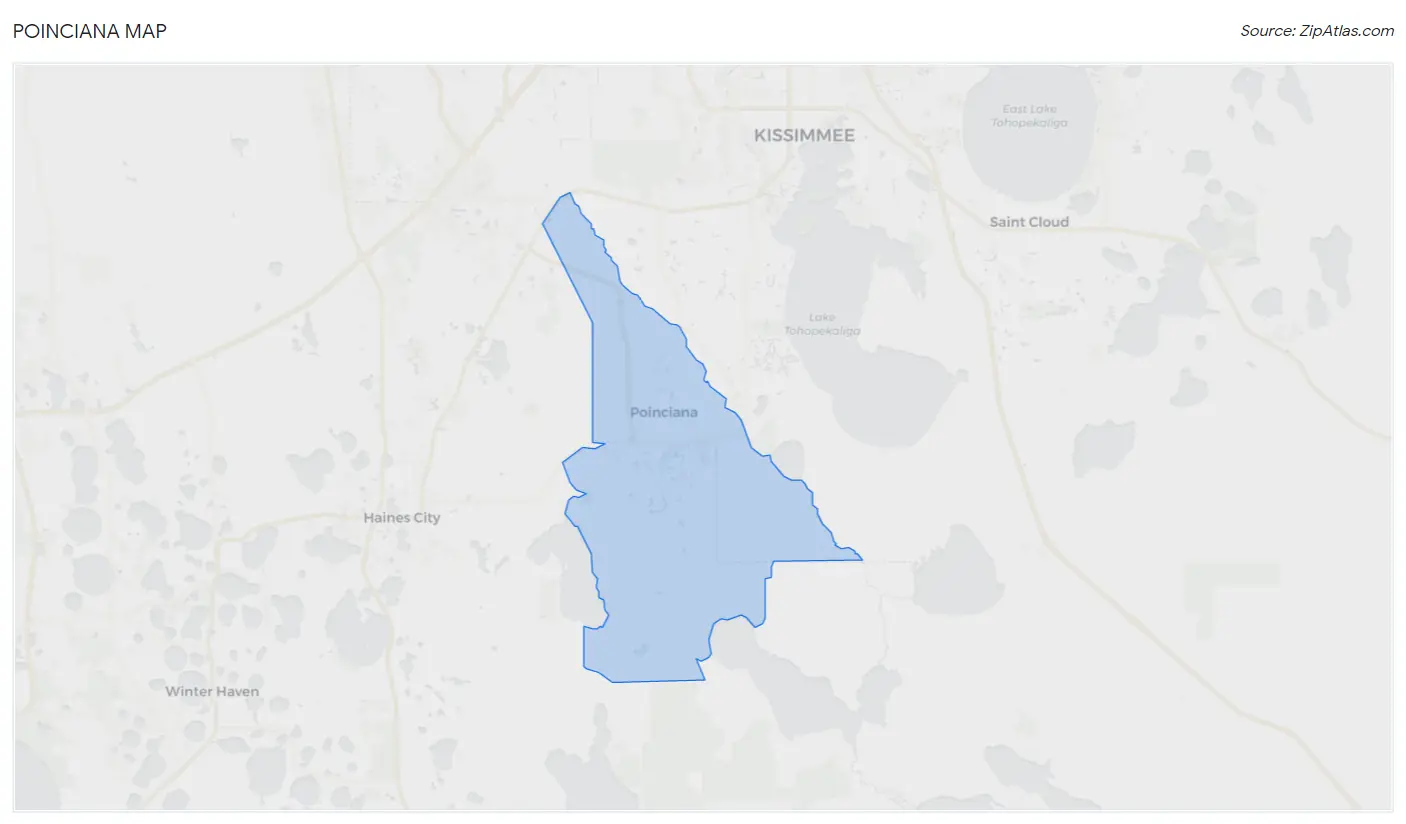
Poinciana Overview
$28,091
PER CAPITA INCOME
$63,021
AVG FAMILY INCOME
$60,928
AVG HOUSEHOLD INCOME
11.4%
WAGE / INCOME GAP [ % ]
88.6¢/ $1
WAGE / INCOME GAP [ $ ]
$9,860
FAMILY INCOME DEFICIT
0.41
INEQUALITY / GINI INDEX
69,311
TOTAL POPULATION
34,114
MALE POPULATION
35,197
FEMALE POPULATION
96.92
MALES / 100 FEMALES
103.17
FEMALES / 100 MALES
38.7
MEDIAN AGE
3.6
AVG FAMILY SIZE
3.2
AVG HOUSEHOLD SIZE
31,461
LABOR FORCE [ PEOPLE ]
56.9%
PERCENT IN LABOR FORCE
4.5%
UNEMPLOYMENT RATE
Poinciana Area Codes
Income in Poinciana
Income Overview in Poinciana
Per Capita Income in Poinciana is $28,091, while median incomes of families and households are $63,021 and $60,928 respectively.
| Characteristic | Number | Measure |
| Per Capita Income | 69,311 | $28,091 |
| Median Family Income | 17,011 | $63,021 |
| Mean Family Income | 17,011 | $79,794 |
| Median Household Income | 21,284 | $60,928 |
| Mean Household Income | 21,284 | $76,363 |
| Income Deficit | 17,011 | $9,860 |
| Wage / Income Gap (%) | 69,311 | 11.35% |
| Wage / Income Gap ($) | 69,311 | 88.65¢ per $1 |
| Gini / Inequality Index | 69,311 | 0.41 |
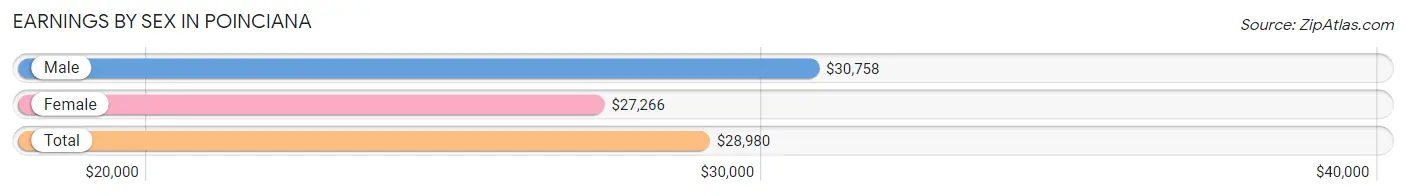
Earnings by Sex in Poinciana
Average Earnings in Poinciana are $28,980, $30,758 for men and $27,266 for women, a difference of 11.4%.
| Sex | Number | Average Earnings |
| Male | 16,470 (51.4%) | $30,758 |
| Female | 15,583 (48.6%) | $27,266 |
| Total | 32,053 (100.0%) | $28,980 |
Earnings by Sex by Income Bracket in Poinciana
The most common earnings brackets in Poinciana are $25,000 to $29,999 for men (1,995 | 12.1%) and $30,000 to $34,999 for women (1,792 | 11.5%).
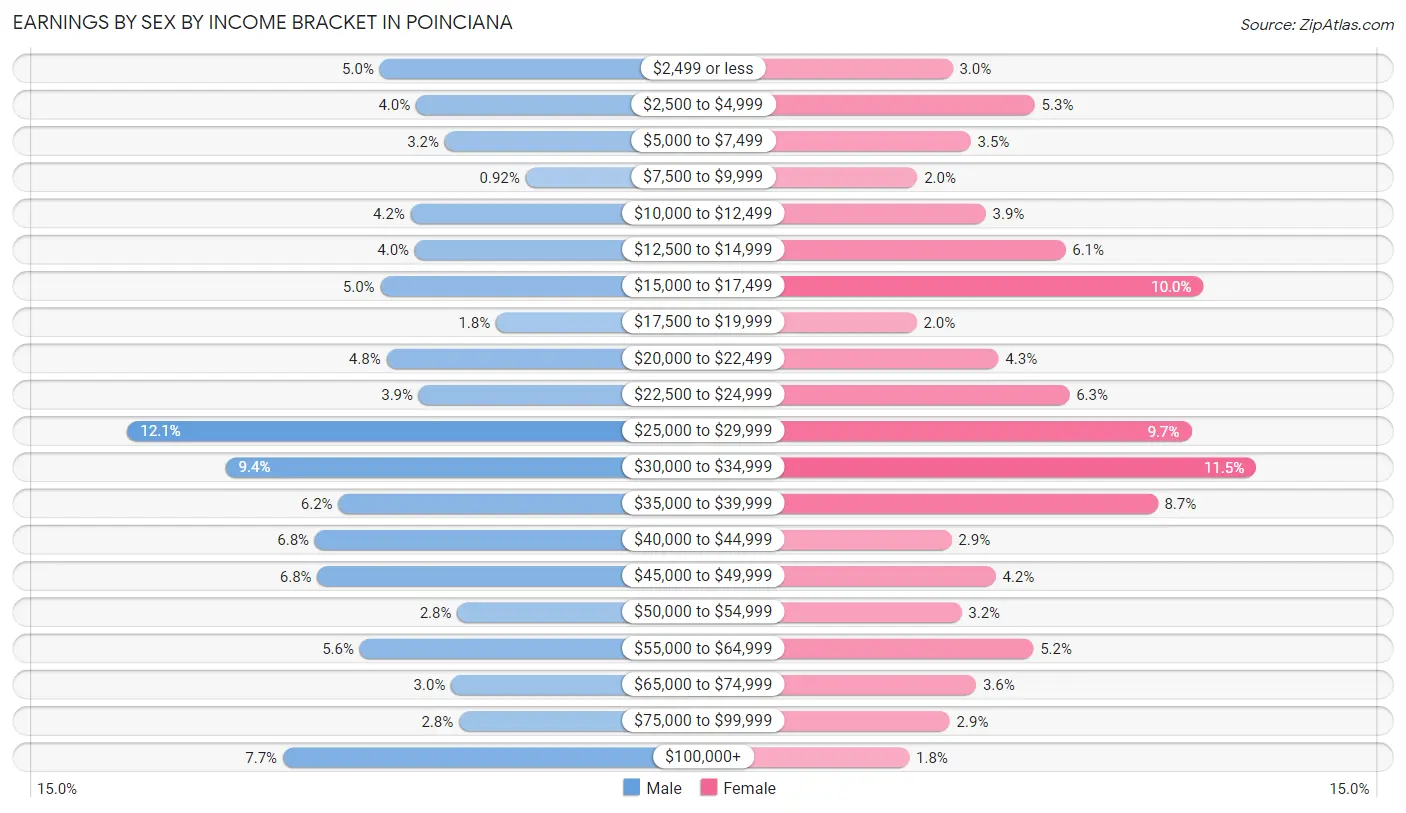
| Income | Male | Female |
| $2,499 or less | 827 (5.0%) | 463 (3.0%) |
| $2,500 to $4,999 | 658 (4.0%) | 823 (5.3%) |
| $5,000 to $7,499 | 526 (3.2%) | 542 (3.5%) |
| $7,500 to $9,999 | 151 (0.9%) | 309 (2.0%) |
| $10,000 to $12,499 | 683 (4.2%) | 607 (3.9%) |
| $12,500 to $14,999 | 663 (4.0%) | 957 (6.1%) |
| $15,000 to $17,499 | 823 (5.0%) | 1,562 (10.0%) |
| $17,500 to $19,999 | 288 (1.8%) | 305 (2.0%) |
| $20,000 to $22,499 | 795 (4.8%) | 664 (4.3%) |
| $22,500 to $24,999 | 646 (3.9%) | 974 (6.2%) |
| $25,000 to $29,999 | 1,995 (12.1%) | 1,508 (9.7%) |
| $30,000 to $34,999 | 1,540 (9.3%) | 1,792 (11.5%) |
| $35,000 to $39,999 | 1,018 (6.2%) | 1,360 (8.7%) |
| $40,000 to $44,999 | 1,126 (6.8%) | 458 (2.9%) |
| $45,000 to $49,999 | 1,115 (6.8%) | 651 (4.2%) |
| $50,000 to $54,999 | 468 (2.8%) | 501 (3.2%) |
| $55,000 to $64,999 | 919 (5.6%) | 817 (5.2%) |
| $65,000 to $74,999 | 495 (3.0%) | 566 (3.6%) |
| $75,000 to $99,999 | 460 (2.8%) | 451 (2.9%) |
| $100,000+ | 1,274 (7.7%) | 273 (1.8%) |
| Total | 16,470 (100.0%) | 15,583 (100.0%) |
Earnings by Sex by Educational Attainment in Poinciana
Average earnings in Poinciana are $33,501 for men and $31,089 for women, a difference of 7.2%. Men with an educational attainment of graduate degree enjoy the highest average annual earnings of $50,353, while those with high school diploma education earn the least with $27,337. Women with an educational attainment of bachelor's degree earn the most with the average annual earnings of $39,091, while those with less than high school education have the smallest earnings of $17,433.
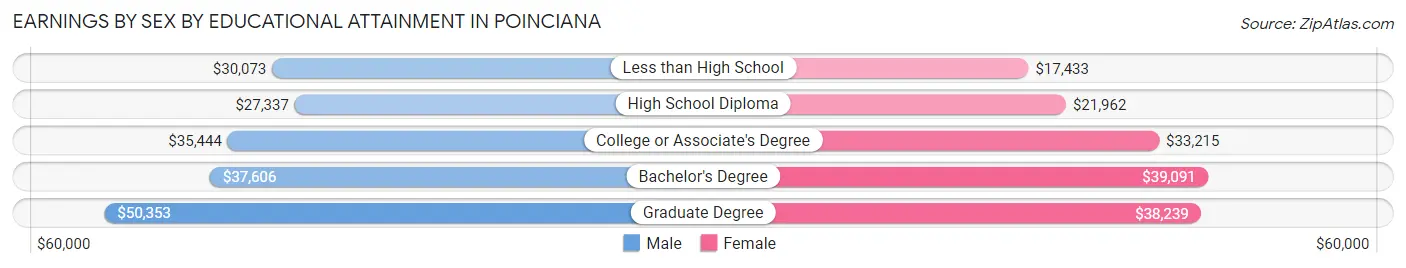
| Educational Attainment | Male Income | Female Income |
| Less than High School | $30,073 | $17,433 |
| High School Diploma | $27,337 | $21,962 |
| College or Associate's Degree | $35,444 | $33,215 |
| Bachelor's Degree | $37,606 | $39,091 |
| Graduate Degree | $50,353 | $38,239 |
| Total | $33,501 | $31,089 |
Family Income in Poinciana
Family Income Brackets in Poinciana
According to the Poinciana family income data, there are 4,321 families falling into the $50,000 to $74,999 income range, which is the most common income bracket and makes up 25.4% of all families. Conversely, the $10,000 to $14,999 income bracket is the least frequent group with only 340 families (2.0%) belonging to this category.
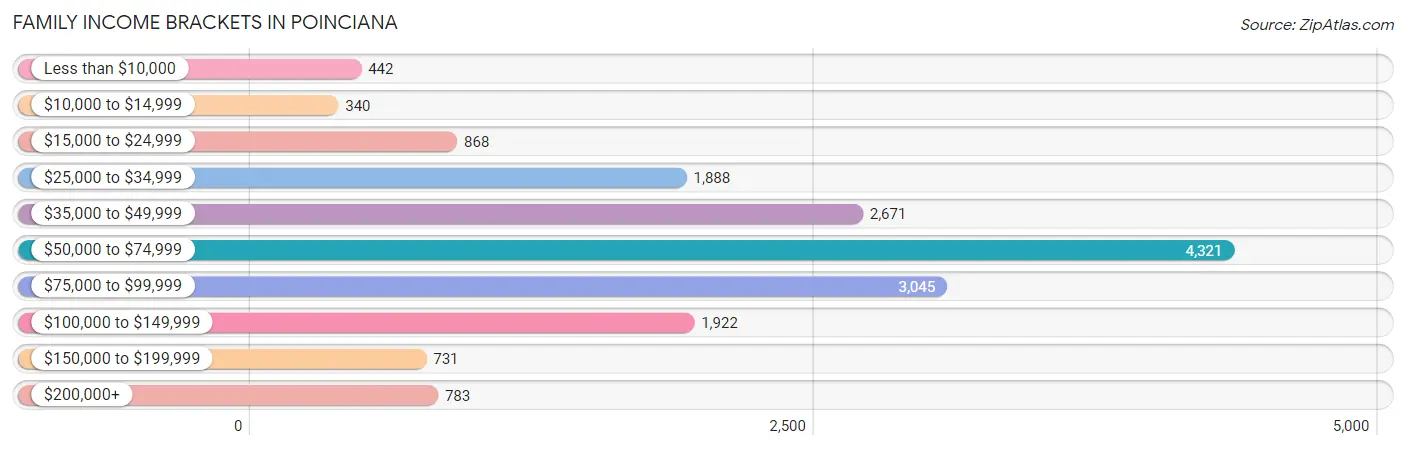
| Income Bracket | # Families | % Families |
| Less than $10,000 | 442 | 2.6% |
| $10,000 to $14,999 | 340 | 2.0% |
| $15,000 to $24,999 | 868 | 5.1% |
| $25,000 to $34,999 | 1,888 | 11.1% |
| $35,000 to $49,999 | 2,671 | 15.7% |
| $50,000 to $74,999 | 4,321 | 25.4% |
| $75,000 to $99,999 | 3,045 | 17.9% |
| $100,000 to $149,999 | 1,922 | 11.3% |
| $150,000 to $199,999 | 731 | 4.3% |
| $200,000+ | 783 | 4.6% |
Family Income by Famaliy Size in Poinciana
7+ person families (607 | 3.6%) account for the highest median family income in Poinciana with $79,278 per family, while 2-person families (8,097 | 47.6%) have the highest median income of $30,006 per family member.
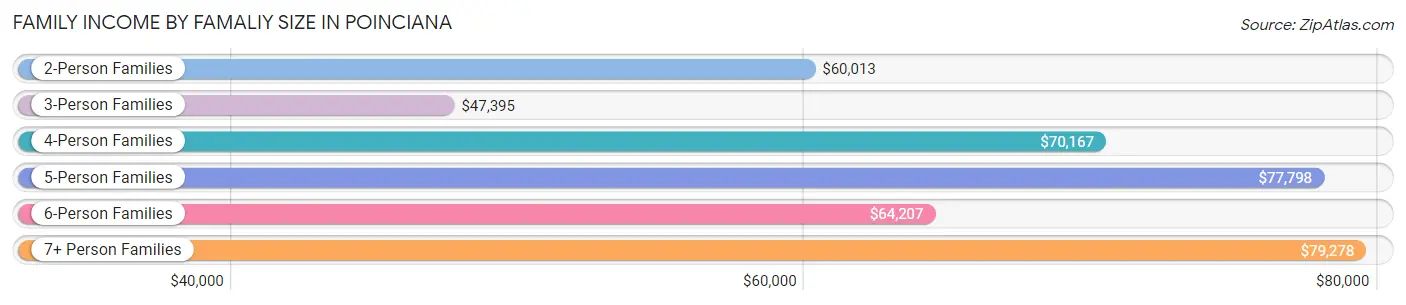
| Income Bracket | # Families | Median Income |
| 2-Person Families | 8,097 (47.6%) | $60,013 |
| 3-Person Families | 3,185 (18.7%) | $47,395 |
| 4-Person Families | 3,062 (18.0%) | $70,167 |
| 5-Person Families | 1,497 (8.8%) | $77,798 |
| 6-Person Families | 563 (3.3%) | $64,207 |
| 7+ Person Families | 607 (3.6%) | $79,278 |
| Total | 17,011 (100.0%) | $63,021 |
Family Income by Number of Earners in Poinciana
The median family income in Poinciana is $63,021, with families comprising 3+ earners (1,893) having the highest median family income of $102,946, while families with 1 earner (5,413) have the lowest median family income of $46,453, accounting for 11.1% and 31.8% of families, respectively.
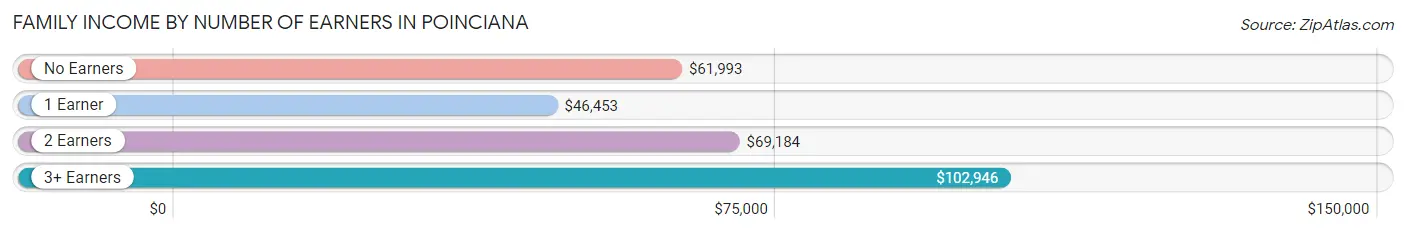
| Number of Earners | # Families | Median Income |
| No Earners | 3,895 (22.9%) | $61,993 |
| 1 Earner | 5,413 (31.8%) | $46,453 |
| 2 Earners | 5,810 (34.2%) | $69,184 |
| 3+ Earners | 1,893 (11.1%) | $102,946 |
| Total | 17,011 (100.0%) | $63,021 |
Household Income in Poinciana
Household Income Brackets in Poinciana
With 4,895 households falling in the category, the $50,000 to $74,999 income range is the most frequent in Poinciana, accounting for 23.0% of all households. In contrast, only 490 households (2.3%) fall into the $10,000 to $14,999 income bracket, making it the least populous group.
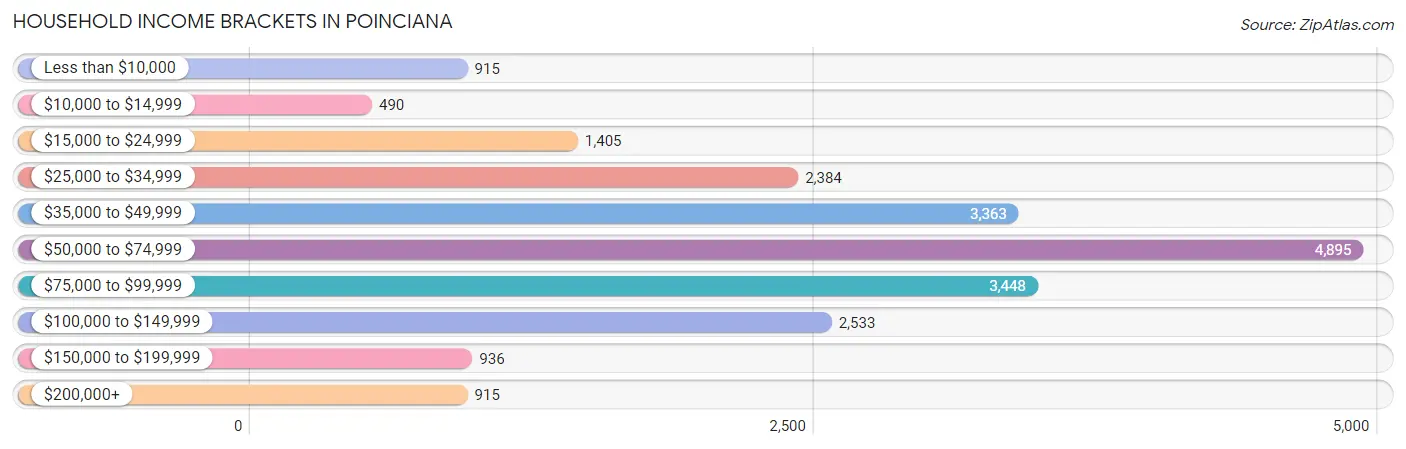
| Income Bracket | # Households | % Households |
| Less than $10,000 | 915 | 4.3% |
| $10,000 to $14,999 | 490 | 2.3% |
| $15,000 to $24,999 | 1,405 | 6.6% |
| $25,000 to $34,999 | 2,384 | 11.2% |
| $35,000 to $49,999 | 3,363 | 15.8% |
| $50,000 to $74,999 | 4,895 | 23.0% |
| $75,000 to $99,999 | 3,448 | 16.2% |
| $100,000 to $149,999 | 2,533 | 11.9% |
| $150,000 to $199,999 | 936 | 4.4% |
| $200,000+ | 915 | 4.3% |
Household Income by Householder Age in Poinciana
The median household income in Poinciana is $60,928, with the highest median household income of $64,034 found in the 45 to 64 years age bracket for the primary householder. A total of 7,110 households (33.4%) fall into this category. Meanwhile, the 15 to 24 years age bracket for the primary householder has the lowest median household income of $0, with 275 households (1.3%) in this group.
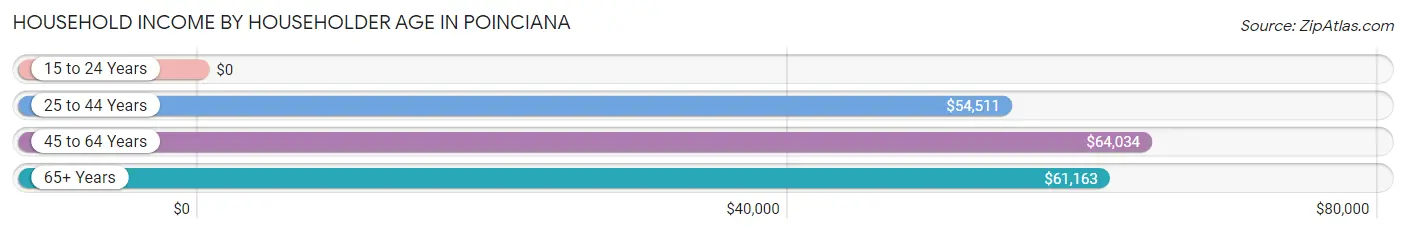
| Income Bracket | # Households | Median Income |
| 15 to 24 Years | 275 (1.3%) | $0 |
| 25 to 44 Years | 6,856 (32.2%) | $54,511 |
| 45 to 64 Years | 7,110 (33.4%) | $64,034 |
| 65+ Years | 7,043 (33.1%) | $61,163 |
| Total | 21,284 (100.0%) | $60,928 |
Poverty in Poinciana
Income Below Poverty by Sex and Age in Poinciana
With 11.1% poverty level for males and 13.8% for females among the residents of Poinciana, 6 to 11 year old males and 5 year old females are the most vulnerable to poverty, with 543 males (20.0%) and 286 females (68.4%) in their respective age groups living below the poverty level.
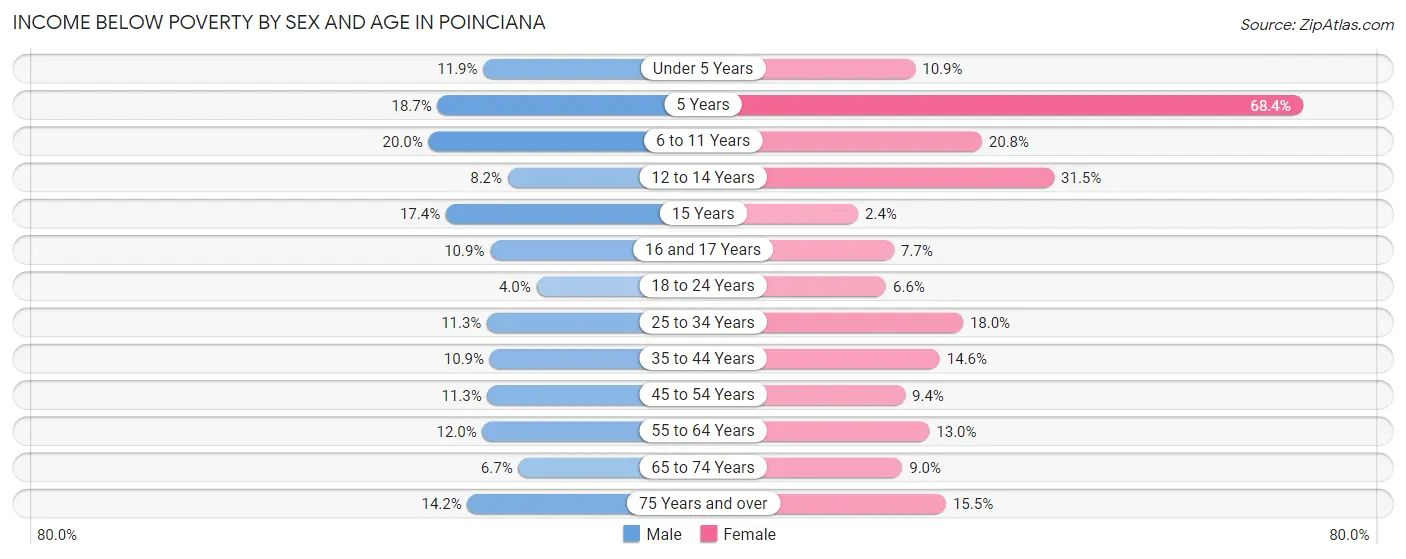
| Age Bracket | Male | Female |
| Under 5 Years | 239 (11.9%) | 183 (10.9%) |
| 5 Years | 113 (18.7%) | 286 (68.4%) |
| 6 to 11 Years | 543 (20.0%) | 559 (20.8%) |
| 12 to 14 Years | 98 (8.2%) | 367 (31.5%) |
| 15 Years | 65 (17.4%) | 18 (2.4%) |
| 16 and 17 Years | 156 (10.9%) | 84 (7.7%) |
| 18 to 24 Years | 137 (4.0%) | 224 (6.6%) |
| 25 to 34 Years | 441 (11.3%) | 773 (18.0%) |
| 35 to 44 Years | 535 (10.9%) | 642 (14.6%) |
| 45 to 54 Years | 449 (11.3%) | 390 (9.4%) |
| 55 to 64 Years | 404 (12.0%) | 434 (13.0%) |
| 65 to 74 Years | 233 (6.7%) | 440 (9.0%) |
| 75 Years and over | 345 (14.2%) | 422 (15.5%) |
| Total | 3,758 (11.1%) | 4,822 (13.8%) |
Income Above Poverty by Sex and Age in Poinciana
According to the poverty statistics in Poinciana, males aged 18 to 24 years and females aged 15 years are the age groups that are most secure financially, with 96.0% of males and 97.6% of females in these age groups living above the poverty line.
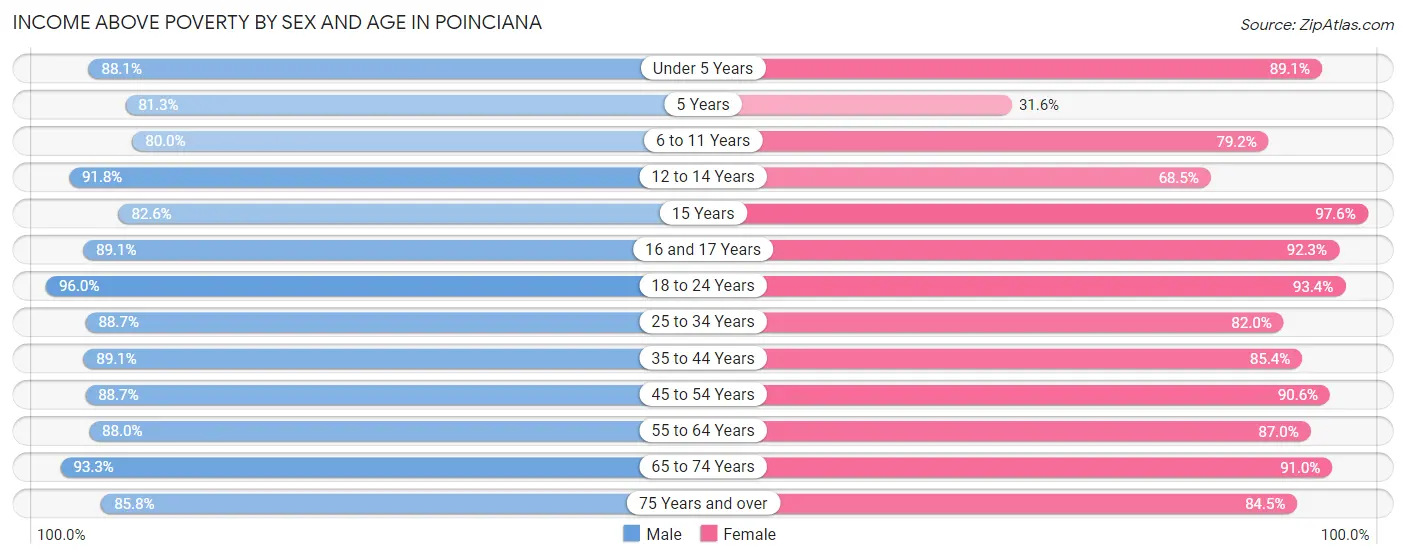
| Age Bracket | Male | Female |
| Under 5 Years | 1,773 (88.1%) | 1,494 (89.1%) |
| 5 Years | 492 (81.3%) | 132 (31.6%) |
| 6 to 11 Years | 2,171 (80.0%) | 2,128 (79.2%) |
| 12 to 14 Years | 1,092 (91.8%) | 797 (68.5%) |
| 15 Years | 308 (82.6%) | 727 (97.6%) |
| 16 and 17 Years | 1,280 (89.1%) | 1,001 (92.3%) |
| 18 to 24 Years | 3,305 (96.0%) | 3,182 (93.4%) |
| 25 to 34 Years | 3,459 (88.7%) | 3,525 (82.0%) |
| 35 to 44 Years | 4,368 (89.1%) | 3,768 (85.4%) |
| 45 to 54 Years | 3,539 (88.7%) | 3,760 (90.6%) |
| 55 to 64 Years | 2,966 (88.0%) | 2,904 (87.0%) |
| 65 to 74 Years | 3,266 (93.3%) | 4,459 (91.0%) |
| 75 Years and over | 2,079 (85.8%) | 2,306 (84.5%) |
| Total | 30,098 (88.9%) | 30,183 (86.2%) |
Income Below Poverty Among Married-Couple Families in Poinciana
The poverty statistics for married-couple families in Poinciana show that 7.5% or 856 of the total 11,410 families live below the poverty line. Families with 5 or more children have the highest poverty rate of 55.6%, comprising of 70 families. On the other hand, families with no children have the lowest poverty rate of 5.9%, which includes 420 families.
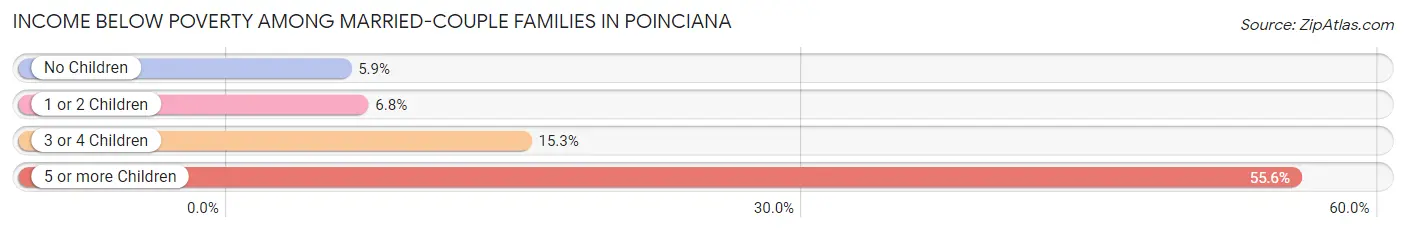
| Children | Above Poverty | Below Poverty |
| No Children | 6,689 (94.1%) | 420 (5.9%) |
| 1 or 2 Children | 2,997 (93.2%) | 219 (6.8%) |
| 3 or 4 Children | 812 (84.7%) | 147 (15.3%) |
| 5 or more Children | 56 (44.4%) | 70 (55.6%) |
| Total | 10,554 (92.5%) | 856 (7.5%) |
Income Below Poverty Among Single-Parent Households in Poinciana
According to the poverty data in Poinciana, 10.3% or 177 single-father households and 17.4% or 675 single-mother households are living below the poverty line. Among single-father households, those with 3 or 4 children have the highest poverty rate, with 17 households (19.8%) experiencing poverty. Likewise, among single-mother households, those with 3 or 4 children have the highest poverty rate, with 271 households (77.6%) falling below the poverty line.
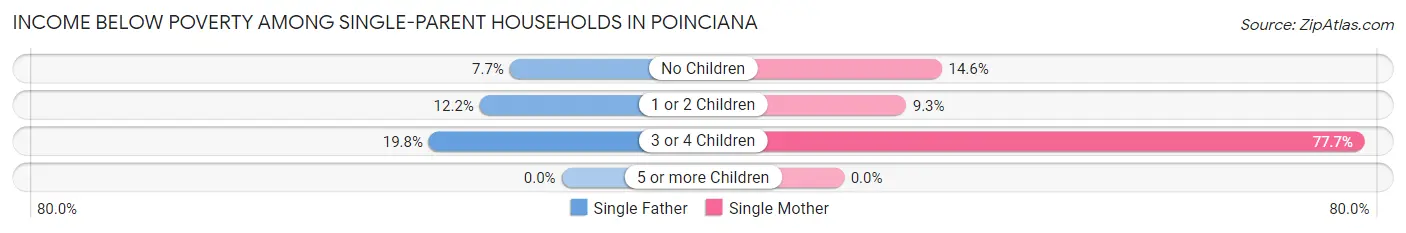
| Children | Single Father | Single Mother |
| No Children | 67 (7.7%) | 233 (14.6%) |
| 1 or 2 Children | 93 (12.2%) | 171 (9.3%) |
| 3 or 4 Children | 17 (19.8%) | 271 (77.6%) |
| 5 or more Children | 0 (0.0%) | 0 (0.0%) |
| Total | 177 (10.3%) | 675 (17.4%) |
Income Below Poverty Among Married-Couple vs Single-Parent Households in Poinciana
The poverty data for Poinciana shows that 856 of the married-couple family households (7.5%) and 852 of the single-parent households (15.2%) are living below the poverty level. Within the married-couple family households, those with 5 or more children have the highest poverty rate, with 70 households (55.6%) falling below the poverty line. Among the single-parent households, those with 3 or 4 children have the highest poverty rate, with 288 household (66.2%) living below poverty.
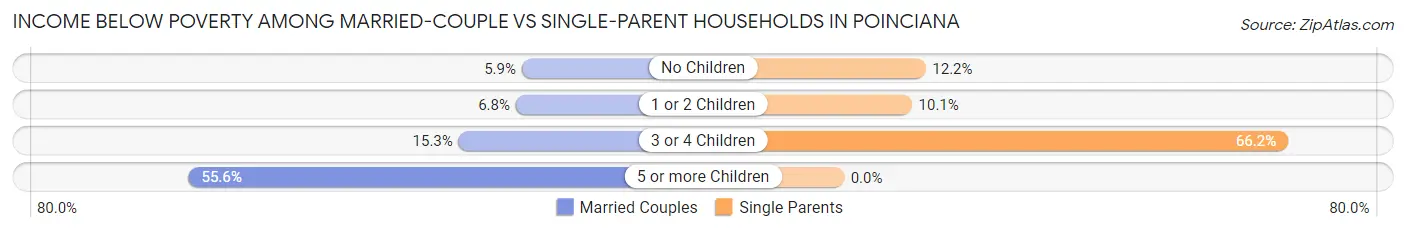
| Children | Married-Couple Families | Single-Parent Households |
| No Children | 420 (5.9%) | 300 (12.2%) |
| 1 or 2 Children | 219 (6.8%) | 264 (10.1%) |
| 3 or 4 Children | 147 (15.3%) | 288 (66.2%) |
| 5 or more Children | 70 (55.6%) | 0 (0.0%) |
| Total | 856 (7.5%) | 852 (15.2%) |
Race in Poinciana
The most populous races in Poinciana are Hispanic or Latino (40,013 | 57.7%), White / Caucasian (30,908 | 44.6%), and Black / African American (15,843 | 22.9%).
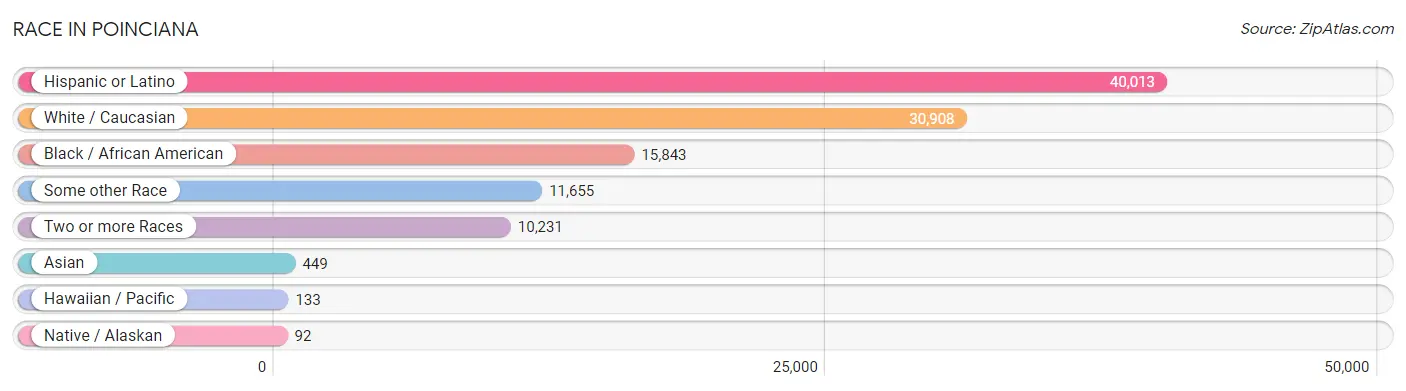
| Race | # Population | % Population |
| Asian | 449 | 0.6% |
| Black / African American | 15,843 | 22.9% |
| Hawaiian / Pacific | 133 | 0.2% |
| Hispanic or Latino | 40,013 | 57.7% |
| Native / Alaskan | 92 | 0.1% |
| White / Caucasian | 30,908 | 44.6% |
| Two or more Races | 10,231 | 14.8% |
| Some other Race | 11,655 | 16.8% |
| Total | 69,311 | 100.0% |
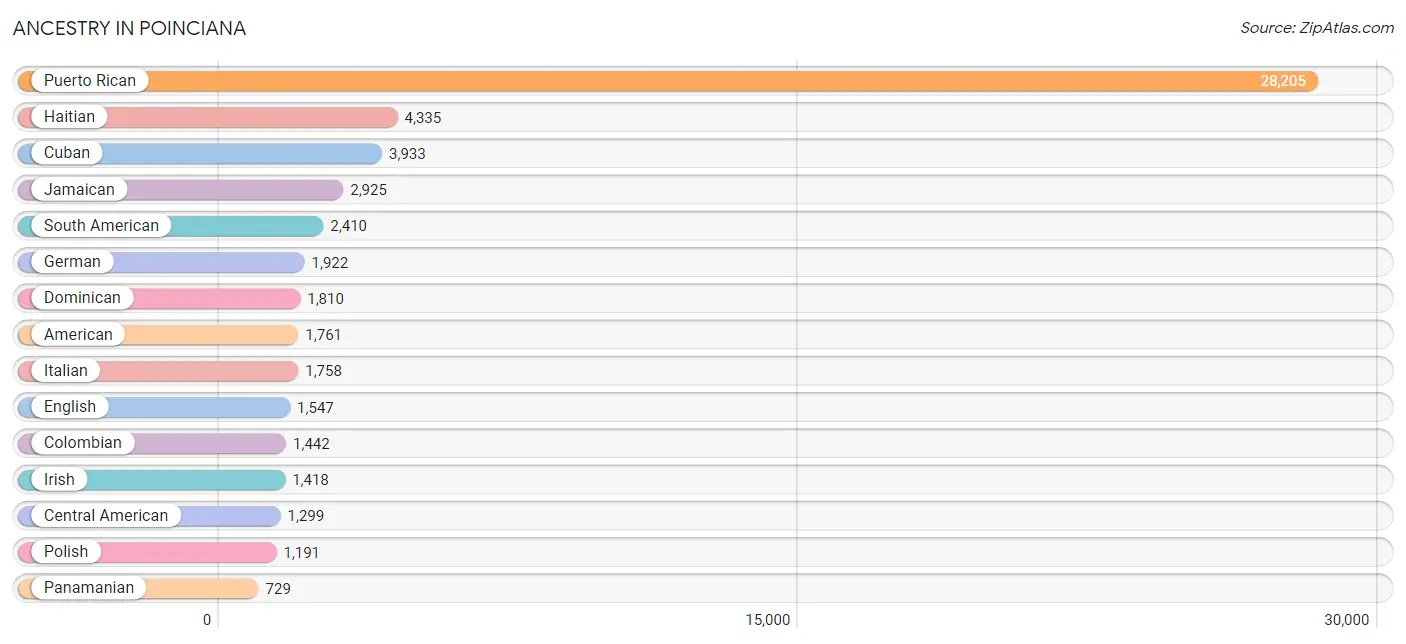
Ancestry in Poinciana
The most populous ancestries reported in Poinciana are Puerto Rican (28,205 | 40.7%), Haitian (4,335 | 6.2%), Cuban (3,933 | 5.7%), Jamaican (2,925 | 4.2%), and South American (2,410 | 3.5%), together accounting for 60.3% of all Poinciana residents.
| Ancestry | # Population | % Population |
| African | 626 | 0.9% |
| American | 1,761 | 2.5% |
| Arab | 216 | 0.3% |
| Armenian | 6 | 0.0% |
| Austrian | 46 | 0.1% |
| Barbadian | 7 | 0.0% |
| Belgian | 19 | 0.0% |
| Bhutanese | 74 | 0.1% |
| Blackfeet | 73 | 0.1% |
| Brazilian | 235 | 0.3% |
| British | 47 | 0.1% |
| British West Indian | 23 | 0.0% |
| Burmese | 45 | 0.1% |
| Canadian | 113 | 0.2% |
| Carpatho Rusyn | 14 | 0.0% |
| Central American | 1,299 | 1.9% |
| Central American Indian | 242 | 0.4% |
| Cherokee | 5 | 0.0% |
| Chilean | 115 | 0.2% |
| Colombian | 1,442 | 2.1% |
| Costa Rican | 22 | 0.0% |
| Croatian | 58 | 0.1% |
| Cuban | 3,933 | 5.7% |
| Czech | 59 | 0.1% |
| Czechoslovakian | 136 | 0.2% |
| Danish | 27 | 0.0% |
| Dominican | 1,810 | 2.6% |
| Dutch | 126 | 0.2% |
| Eastern European | 13 | 0.0% |
| Ecuadorian | 339 | 0.5% |
| English | 1,547 | 2.2% |
| European | 190 | 0.3% |
| French | 473 | 0.7% |
| French American Indian | 44 | 0.1% |
| French Canadian | 257 | 0.4% |
| German | 1,922 | 2.8% |
| Ghanaian | 62 | 0.1% |
| Greek | 135 | 0.2% |
| Guatemalan | 14 | 0.0% |
| Guyanese | 82 | 0.1% |
| Haitian | 4,335 | 6.2% |
| Honduran | 277 | 0.4% |
| Hungarian | 44 | 0.1% |
| Indian (Asian) | 209 | 0.3% |
| Irish | 1,418 | 2.1% |
| Italian | 1,758 | 2.5% |
| Jamaican | 2,925 | 4.2% |
| Kenyan | 12 | 0.0% |
| Korean | 279 | 0.4% |
| Lebanese | 49 | 0.1% |
| Lithuanian | 78 | 0.1% |
| Malaysian | 716 | 1.0% |
| Mexican | 721 | 1.0% |
| Mexican American Indian | 75 | 0.1% |
| Nicaraguan | 172 | 0.3% |
| Nigerian | 6 | 0.0% |
| Northern European | 15 | 0.0% |
| Norwegian | 138 | 0.2% |
| Pakistani | 24 | 0.0% |
| Panamanian | 729 | 1.1% |
| Peruvian | 224 | 0.3% |
| Polish | 1,191 | 1.7% |
| Portuguese | 393 | 0.6% |
| Puerto Rican | 28,205 | 40.7% |
| Romanian | 5 | 0.0% |
| Russian | 609 | 0.9% |
| Salvadoran | 85 | 0.1% |
| Scandinavian | 75 | 0.1% |
| Scotch-Irish | 102 | 0.2% |
| Scottish | 329 | 0.5% |
| Sioux | 15 | 0.0% |
| Slovak | 70 | 0.1% |
| South American | 2,410 | 3.5% |
| Spaniard | 270 | 0.4% |
| Spanish | 92 | 0.1% |
| Subsaharan African | 644 | 0.9% |
| Swedish | 64 | 0.1% |
| Swiss | 62 | 0.1% |
| Thai | 124 | 0.2% |
| Trinidadian and Tobagonian | 56 | 0.1% |
| Ukrainian | 15 | 0.0% |
| Venezuelan | 270 | 0.4% |
| Welsh | 50 | 0.1% |
| West Indian | 588 | 0.9% | View All 84 Rows |
Immigrants in Poinciana
The most numerous immigrant groups reported in Poinciana came from Latin America (11,605 | 16.7%), Caribbean (7,986 | 11.5%), Haiti (2,956 | 4.3%), South America (2,698 | 3.9%), and Jamaica (2,306 | 3.3%), together accounting for 39.7% of all Poinciana residents.
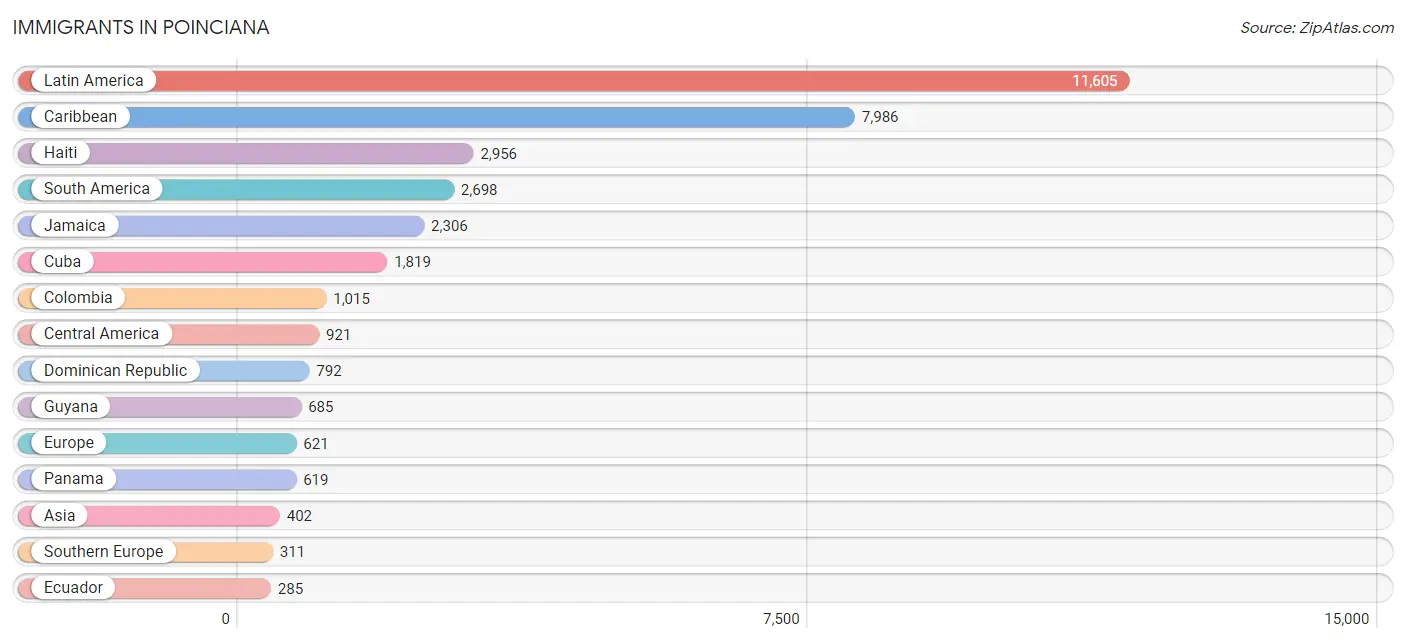
| Immigration Origin | # Population | % Population |
| Africa | 74 | 0.1% |
| Argentina | 17 | 0.0% |
| Asia | 402 | 0.6% |
| Bahamas | 69 | 0.1% |
| Barbados | 7 | 0.0% |
| Brazil | 113 | 0.2% |
| Canada | 146 | 0.2% |
| Caribbean | 7,986 | 11.5% |
| Central America | 921 | 1.3% |
| Chile | 99 | 0.1% |
| Colombia | 1,015 | 1.5% |
| Cuba | 1,819 | 2.6% |
| Dominican Republic | 792 | 1.1% |
| Eastern Africa | 12 | 0.0% |
| Eastern Asia | 86 | 0.1% |
| Eastern Europe | 144 | 0.2% |
| Ecuador | 285 | 0.4% |
| El Salvador | 42 | 0.1% |
| England | 15 | 0.0% |
| Europe | 621 | 0.9% |
| France | 45 | 0.1% |
| Germany | 83 | 0.1% |
| Ghana | 62 | 0.1% |
| Greece | 41 | 0.1% |
| Guatemala | 14 | 0.0% |
| Guyana | 685 | 1.0% |
| Haiti | 2,956 | 4.3% |
| Honduras | 91 | 0.1% |
| Iran | 12 | 0.0% |
| Ireland | 23 | 0.0% |
| Italy | 50 | 0.1% |
| Jamaica | 2,306 | 3.3% |
| Japan | 41 | 0.1% |
| Jordan | 80 | 0.1% |
| Kenya | 12 | 0.0% |
| Korea | 45 | 0.1% |
| Laos | 163 | 0.2% |
| Latin America | 11,605 | 16.7% |
| Mexico | 123 | 0.2% |
| Nicaragua | 32 | 0.1% |
| Northern Europe | 38 | 0.1% |
| Panama | 619 | 0.9% |
| Peru | 173 | 0.3% |
| Philippines | 61 | 0.1% |
| Poland | 114 | 0.2% |
| Portugal | 220 | 0.3% |
| Romania | 30 | 0.0% |
| South America | 2,698 | 3.9% |
| South Central Asia | 12 | 0.0% |
| South Eastern Asia | 224 | 0.3% |
| Southern Europe | 311 | 0.4% |
| Trinidad and Tobago | 36 | 0.1% |
| Venezuela | 206 | 0.3% |
| Western Africa | 62 | 0.1% |
| Western Asia | 80 | 0.1% |
| Western Europe | 128 | 0.2% | View All 56 Rows |
Sex and Age in Poinciana
Sex and Age in Poinciana
The most populous age groups in Poinciana are 15 to 19 Years (3,057 | 9.0%) for men and 40 to 44 Years (2,755 | 7.8%) for women.
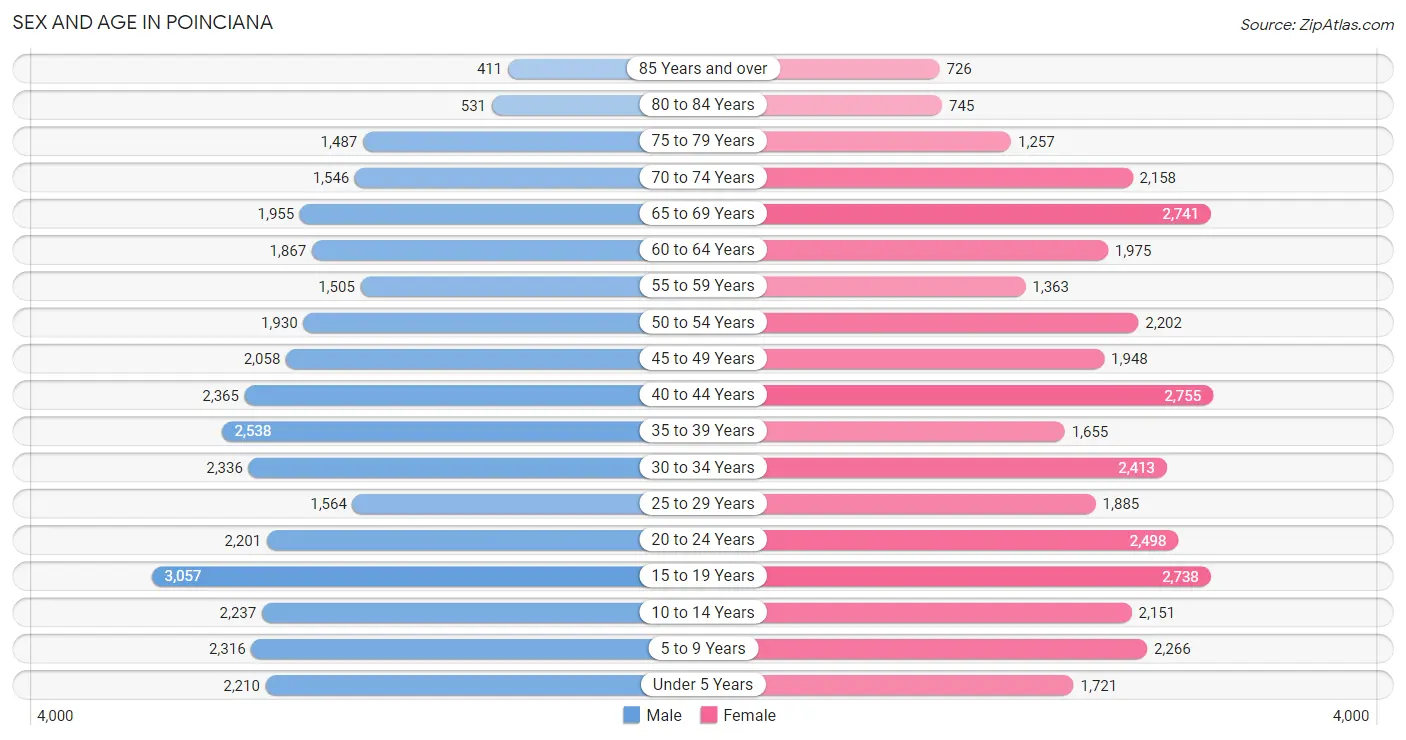
| Age Bracket | Male | Female |
| Under 5 Years | 2,210 (6.5%) | 1,721 (4.9%) |
| 5 to 9 Years | 2,316 (6.8%) | 2,266 (6.4%) |
| 10 to 14 Years | 2,237 (6.6%) | 2,151 (6.1%) |
| 15 to 19 Years | 3,057 (9.0%) | 2,738 (7.8%) |
| 20 to 24 Years | 2,201 (6.5%) | 2,498 (7.1%) |
| 25 to 29 Years | 1,564 (4.6%) | 1,885 (5.4%) |
| 30 to 34 Years | 2,336 (6.9%) | 2,413 (6.9%) |
| 35 to 39 Years | 2,538 (7.4%) | 1,655 (4.7%) |
| 40 to 44 Years | 2,365 (6.9%) | 2,755 (7.8%) |
| 45 to 49 Years | 2,058 (6.0%) | 1,948 (5.5%) |
| 50 to 54 Years | 1,930 (5.7%) | 2,202 (6.3%) |
| 55 to 59 Years | 1,505 (4.4%) | 1,363 (3.9%) |
| 60 to 64 Years | 1,867 (5.5%) | 1,975 (5.6%) |
| 65 to 69 Years | 1,955 (5.7%) | 2,741 (7.8%) |
| 70 to 74 Years | 1,546 (4.5%) | 2,158 (6.1%) |
| 75 to 79 Years | 1,487 (4.4%) | 1,257 (3.6%) |
| 80 to 84 Years | 531 (1.6%) | 745 (2.1%) |
| 85 Years and over | 411 (1.2%) | 726 (2.1%) |
| Total | 34,114 (100.0%) | 35,197 (100.0%) |
Families and Households in Poinciana
Median Family Size in Poinciana
The median family size in Poinciana is 3.60 persons per family, with married-couple families (11,410 | 67.1%) accounting for the largest median family size of 3.67 persons per family. On the other hand, single male/father families (1,717 | 10.1%) represent the smallest median family size with 2.96 persons per family.
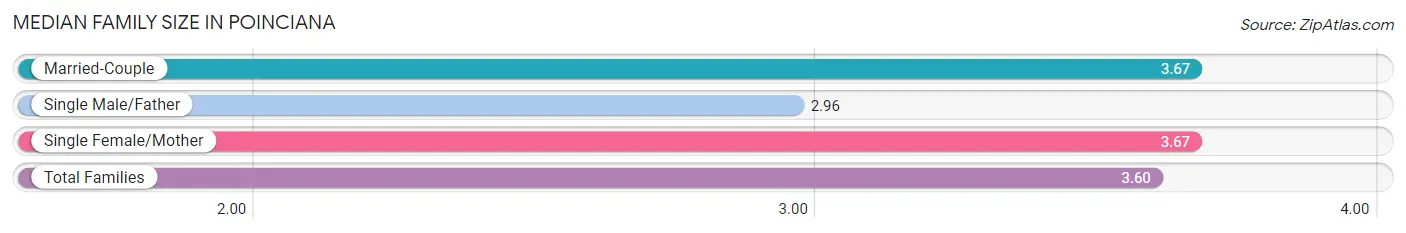
| Family Type | # Families | Family Size |
| Married-Couple | 11,410 (67.1%) | 3.67 |
| Single Male/Father | 1,717 (10.1%) | 2.96 |
| Single Female/Mother | 3,884 (22.8%) | 3.67 |
| Total Families | 17,011 (100.0%) | 3.60 |
Median Household Size in Poinciana
The median household size in Poinciana is 3.25 persons per household, with single female/mother households (3,884 | 18.2%) accounting for the largest median household size of 3.93 persons per household. non-family households (4,273 | 20.1%) represent the smallest median household size with 1.22 persons per household.
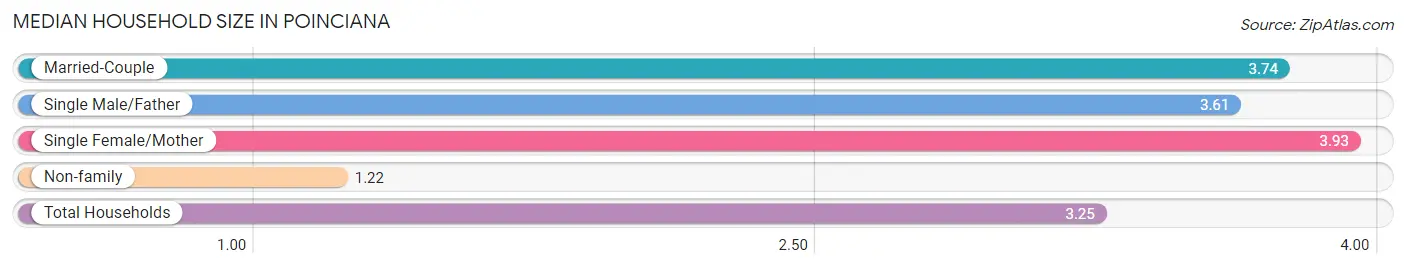
| Household Type | # Households | Household Size |
| Married-Couple | 11,410 (53.6%) | 3.74 |
| Single Male/Father | 1,717 (8.1%) | 3.61 |
| Single Female/Mother | 3,884 (18.2%) | 3.93 |
| Non-family | 4,273 (20.1%) | 1.22 |
| Total Households | 21,284 (100.0%) | 3.25 |
Household Size by Marriage Status in Poinciana
Out of a total of 21,284 households in Poinciana, 17,011 (79.9%) are family households, while 4,273 (20.1%) are nonfamily households. The most numerous type of family households are 2-person households, comprising 7,573, and the most common type of nonfamily households are 1-person households, comprising 3,627.
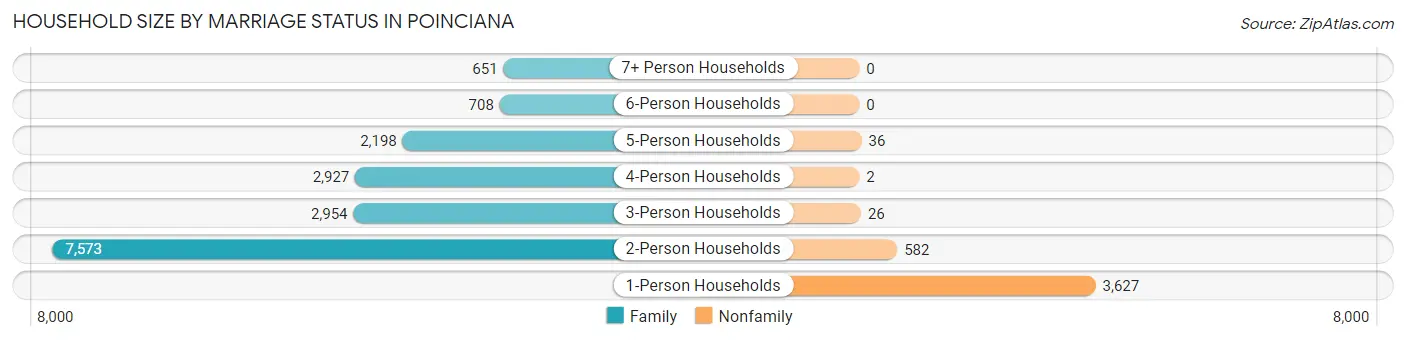
| Household Size | Family Households | Nonfamily Households |
| 1-Person Households | - | 3,627 (17.0%) |
| 2-Person Households | 7,573 (35.6%) | 582 (2.7%) |
| 3-Person Households | 2,954 (13.9%) | 26 (0.1%) |
| 4-Person Households | 2,927 (13.8%) | 2 (0.0%) |
| 5-Person Households | 2,198 (10.3%) | 36 (0.2%) |
| 6-Person Households | 708 (3.3%) | 0 (0.0%) |
| 7+ Person Households | 651 (3.1%) | 0 (0.0%) |
| Total | 17,011 (79.9%) | 4,273 (20.1%) |
Female Fertility in Poinciana
Fertility by Age in Poinciana
Average fertility rate in Poinciana is 36.0 births per 1,000 women. Women in the age bracket of 20 to 34 years have the highest fertility rate with 75.0 births per 1,000 women. Women in the age bracket of 20 to 34 years acount for 84.9% of all women with births.
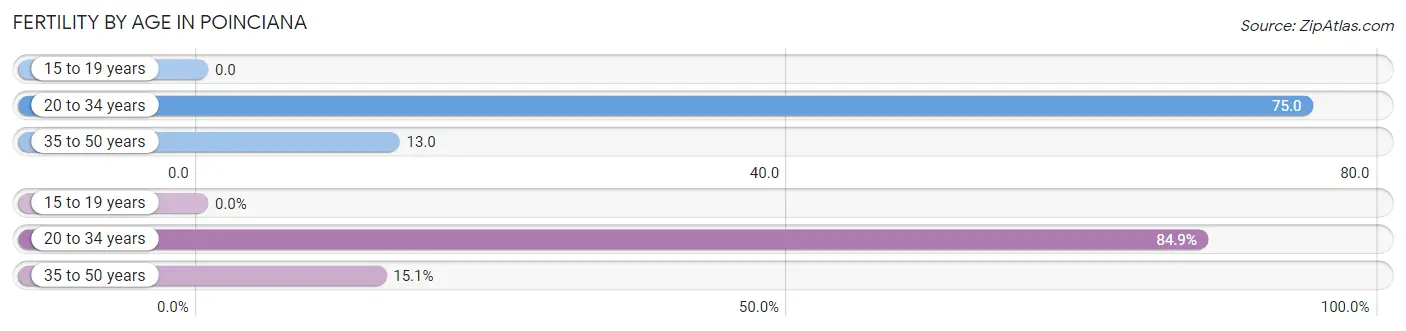
| Age Bracket | Women with Births | Births / 1,000 Women |
| 15 to 19 years | 0 (0.0%) | 0.0 |
| 20 to 34 years | 511 (84.9%) | 75.0 |
| 35 to 50 years | 91 (15.1%) | 13.0 |
| Total | 602 (100.0%) | 36.0 |
Fertility by Age by Marriage Status in Poinciana
59.6% of women with births (602) in Poinciana are married. The highest percentage of unmarried women with births falls into 20 to 34 years age bracket with 45.2% of them unmarried at the time of birth, while the lowest percentage of unmarried women with births belong to 35 to 50 years age bracket with 13.2% of them unmarried.
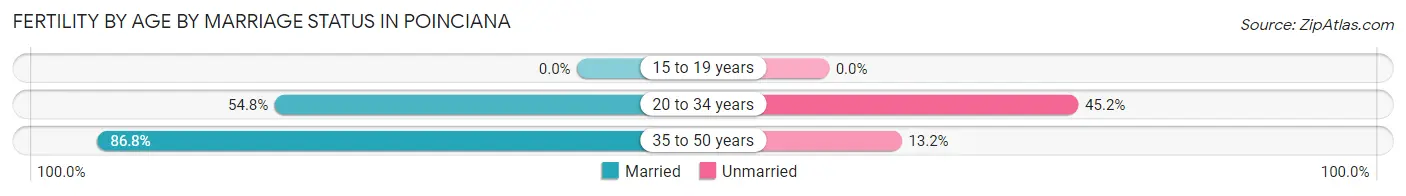
| Age Bracket | Married | Unmarried |
| 15 to 19 years | 0 (0.0%) | 0 (0.0%) |
| 20 to 34 years | 280 (54.8%) | 231 (45.2%) |
| 35 to 50 years | 79 (86.8%) | 12 (13.2%) |
| Total | 359 (59.6%) | 243 (40.4%) |
Fertility by Education in Poinciana
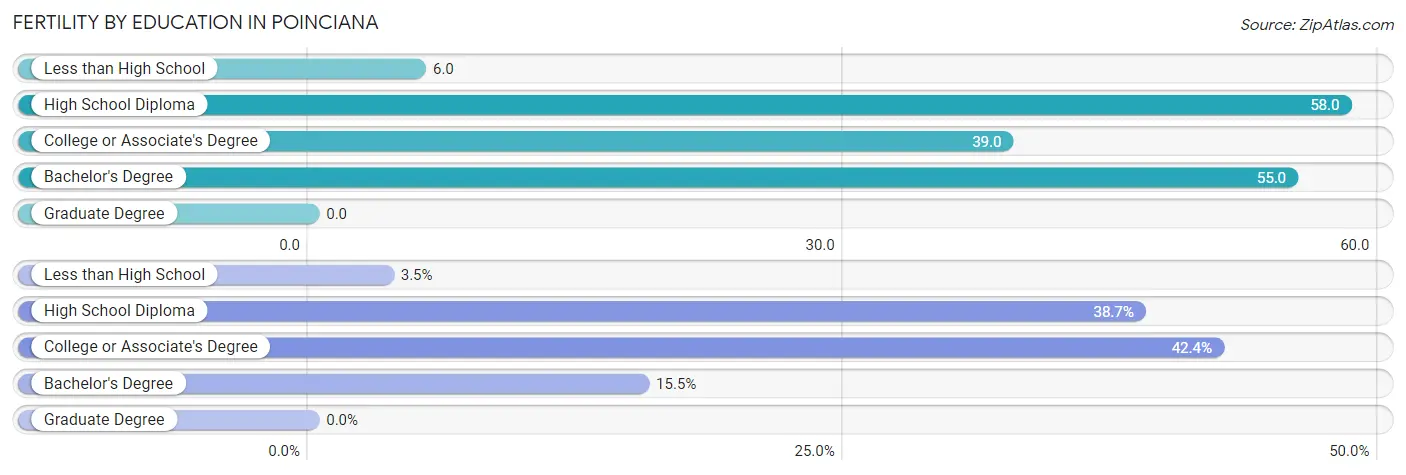
| Educational Attainment | Women with Births | Births / 1,000 Women |
| Less than High School | 21 (3.5%) | 6.0 |
| High School Diploma | 233 (38.7%) | 58.0 |
| College or Associate's Degree | 255 (42.4%) | 39.0 |
| Bachelor's Degree | 93 (15.4%) | 55.0 |
| Graduate Degree | 0 (0.0%) | 0.0 |
| Total | 602 (100.0%) | 36.0 |
Fertility by Education by Marriage Status in Poinciana
40.4% of women with births in Poinciana are unmarried. Women with the educational attainment of less than high school are most likely to be married with 100.0% of them married at childbirth, while women with the educational attainment of high school diploma are least likely to be married with 83.3% of them unmarried at childbirth.
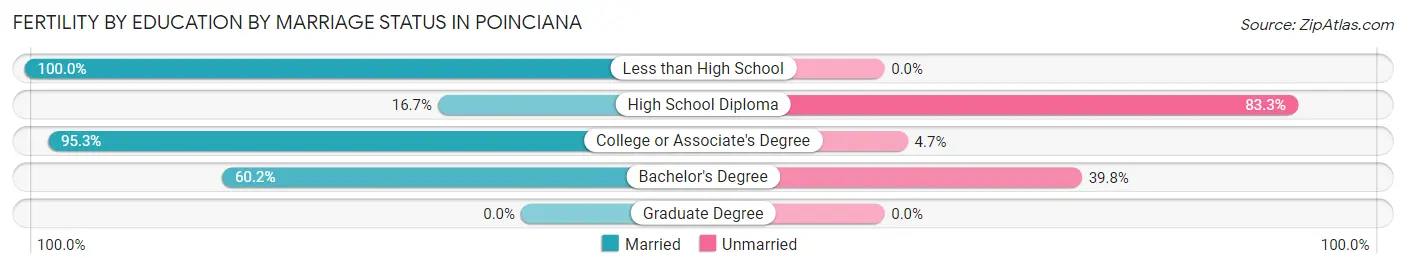
| Educational Attainment | Married | Unmarried |
| Less than High School | 21 (100.0%) | 0 (0.0%) |
| High School Diploma | 39 (16.7%) | 194 (83.3%) |
| College or Associate's Degree | 243 (95.3%) | 12 (4.7%) |
| Bachelor's Degree | 56 (60.2%) | 37 (39.8%) |
| Graduate Degree | 0 (0.0%) | 0 (0.0%) |
| Total | 359 (59.6%) | 243 (40.4%) |
Employment Characteristics in Poinciana
Employment by Class of Employer in Poinciana
Among the 28,922 employed individuals in Poinciana, private company employees (22,762 | 78.7%), local government employees (1,527 | 5.3%), and self-employed (not incorporated) (1,423 | 4.9%) make up the most common classes of employment.
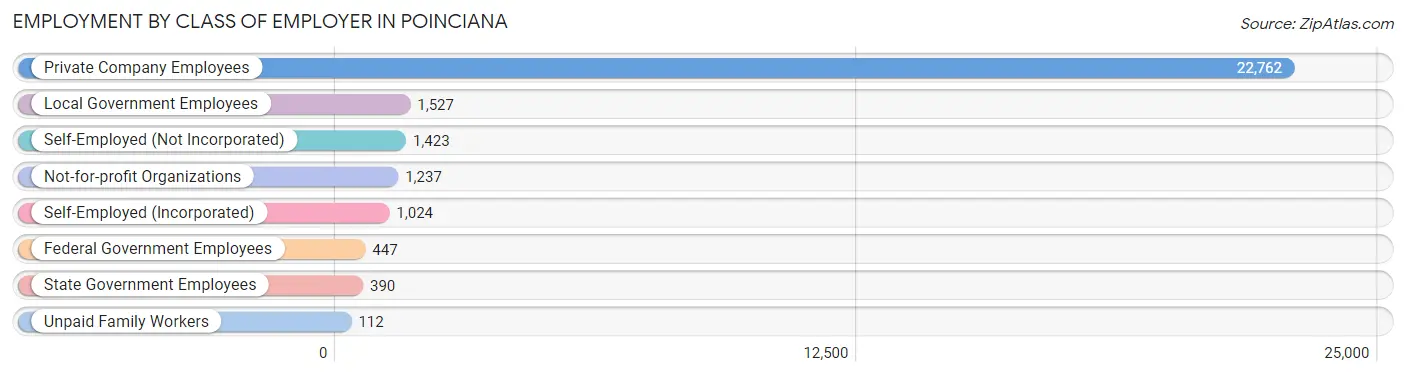
| Employer Class | # Employees | % Employees |
| Private Company Employees | 22,762 | 78.7% |
| Self-Employed (Incorporated) | 1,024 | 3.5% |
| Self-Employed (Not Incorporated) | 1,423 | 4.9% |
| Not-for-profit Organizations | 1,237 | 4.3% |
| Local Government Employees | 1,527 | 5.3% |
| State Government Employees | 390 | 1.3% |
| Federal Government Employees | 447 | 1.5% |
| Unpaid Family Workers | 112 | 0.4% |
| Total | 28,922 | 100.0% |
Employment Status by Age in Poinciana
According to the labor force statistics for Poinciana, out of the total population over 16 years of age (55,292), 56.9% or 31,461 individuals are in the labor force, with 4.5% or 1,416 of them unemployed. The age group with the highest labor force participation rate is 25 to 29 years, with 89.7% or 3,094 individuals in the labor force. Within the labor force, the 75 years and over age range has the highest percentage of unemployed individuals, with 18.4% or 76 of them being unemployed.
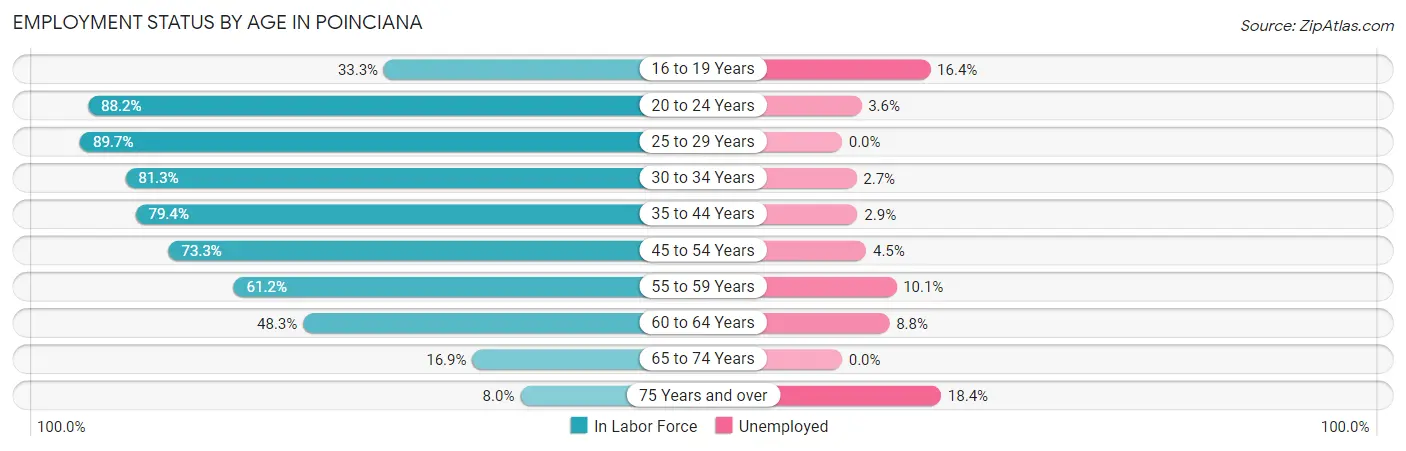
| Age Bracket | In Labor Force | Unemployed |
| 16 to 19 Years | 1,557 (33.3%) | 255 (16.4%) |
| 20 to 24 Years | 4,145 (88.2%) | 149 (3.6%) |
| 25 to 29 Years | 3,094 (89.7%) | 0 (0.0%) |
| 30 to 34 Years | 3,861 (81.3%) | 104 (2.7%) |
| 35 to 44 Years | 7,395 (79.4%) | 214 (2.9%) |
| 45 to 54 Years | 5,965 (73.3%) | 268 (4.5%) |
| 55 to 59 Years | 1,755 (61.2%) | 177 (10.1%) |
| 60 to 64 Years | 1,856 (48.3%) | 163 (8.8%) |
| 65 to 74 Years | 1,420 (16.9%) | 0 (0.0%) |
| 75 Years and over | 413 (8.0%) | 76 (18.4%) |
| Total | 31,461 (56.9%) | 1,416 (4.5%) |
Employment Status by Educational Attainment in Poinciana
According to labor force statistics for Poinciana, 74.0% of individuals (23,946) out of the total population between 25 and 64 years of age (32,359) are in the labor force, with 3.9% or 934 of them being unemployed. The group with the highest labor force participation rate are those with the educational attainment of high school diploma, with 78.2% or 8,135 individuals in the labor force. Within the labor force, individuals with less than high school education have the highest percentage of unemployment, with 8.9% or 237 of them being unemployed.
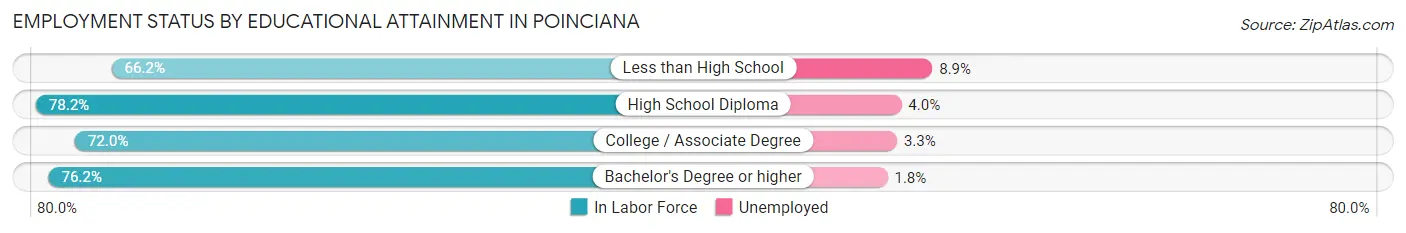
| Educational Attainment | In Labor Force | Unemployed |
| Less than High School | 2,658 (66.2%) | 357 (8.9%) |
| High School Diploma | 8,135 (78.2%) | 416 (4.0%) |
| College / Associate Degree | 8,983 (72.0%) | 412 (3.3%) |
| Bachelor's Degree or higher | 4,164 (76.2%) | 98 (1.8%) |
| Total | 23,946 (74.0%) | 1,262 (3.9%) |
Employment Occupations by Sex in Poinciana
Management, Business, Science and Arts Occupations
The most common Management, Business, Science and Arts occupations in Poinciana are Community & Social Service (2,024 | 6.7%), Management (1,947 | 6.5%), Health Diagnosing & Treating (1,233 | 4.1%), Education Instruction & Library (1,196 | 4.0%), and Business & Financial (765 | 2.5%).
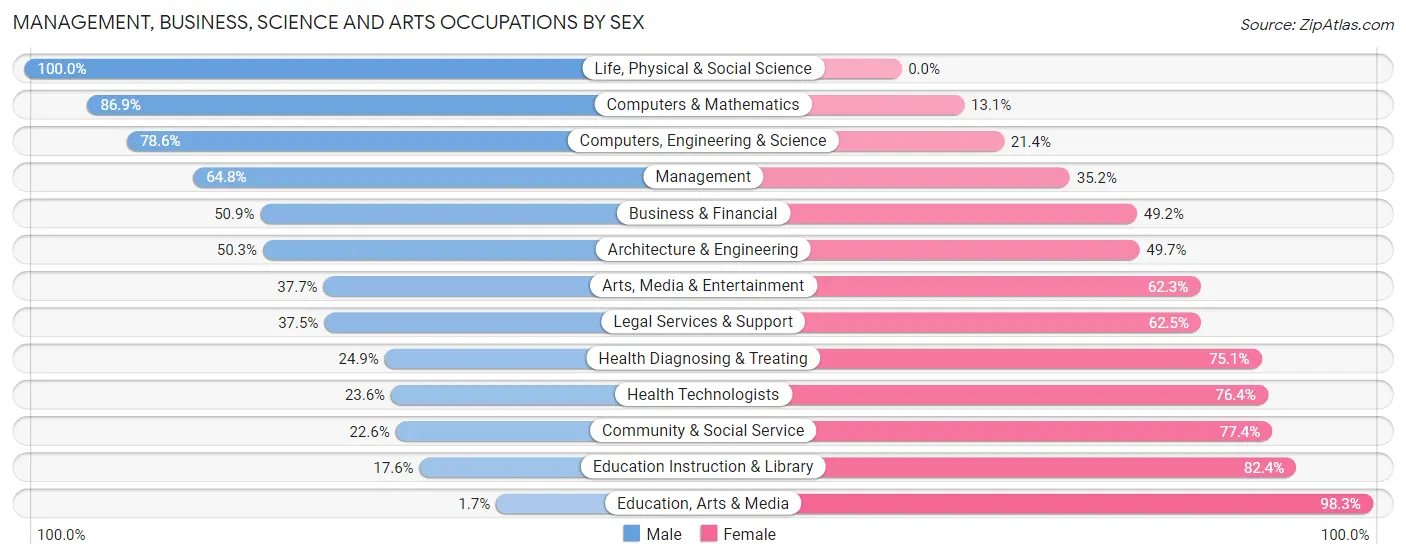
Management, Business, Science and Arts Occupations by Sex
Within the Management, Business, Science and Arts occupations in Poinciana, the most male-oriented occupations are Life, Physical & Social Science (100.0%), Computers & Mathematics (86.9%), and Computers, Engineering & Science (78.6%), while the most female-oriented occupations are Education, Arts & Media (98.3%), Education Instruction & Library (82.4%), and Community & Social Service (77.4%).
| Occupation | Male | Female |
| Management | 1,262 (64.8%) | 685 (35.2%) |
| Business & Financial | 389 (50.8%) | 376 (49.1%) |
| Computers, Engineering & Science | 536 (78.6%) | 146 (21.4%) |
| Computers & Mathematics | 430 (86.9%) | 65 (13.1%) |
| Architecture & Engineering | 82 (50.3%) | 81 (49.7%) |
| Life, Physical & Social Science | 24 (100.0%) | 0 (0.0%) |
| Community & Social Service | 458 (22.6%) | 1,566 (77.4%) |
| Education, Arts & Media | 3 (1.7%) | 177 (98.3%) |
| Legal Services & Support | 18 (37.5%) | 30 (62.5%) |
| Education Instruction & Library | 211 (17.6%) | 985 (82.4%) |
| Arts, Media & Entertainment | 226 (37.7%) | 374 (62.3%) |
| Health Diagnosing & Treating | 307 (24.9%) | 926 (75.1%) |
| Health Technologists | 149 (23.6%) | 483 (76.4%) |
| Total (Category) | 2,952 (44.4%) | 3,699 (55.6%) |
| Total (Overall) | 15,449 (51.4%) | 14,607 (48.6%) |
Services Occupations
The most common Services occupations in Poinciana are Food Preparation & Serving (2,724 | 9.1%), Cleaning & Maintenance (2,516 | 8.4%), Healthcare Support (1,481 | 4.9%), Personal Care & Service (1,017 | 3.4%), and Security & Protection (843 | 2.8%).
Services Occupations by Sex
Within the Services occupations in Poinciana, the most male-oriented occupations are Firefighting & Prevention (63.8%), Security & Protection (62.3%), and Law Enforcement (53.2%), while the most female-oriented occupations are Healthcare Support (99.5%), Personal Care & Service (64.6%), and Food Preparation & Serving (54.7%).
| Occupation | Male | Female |
| Healthcare Support | 8 (0.5%) | 1,473 (99.5%) |
| Security & Protection | 525 (62.3%) | 318 (37.7%) |
| Firefighting & Prevention | 459 (63.8%) | 260 (36.2%) |
| Law Enforcement | 66 (53.2%) | 58 (46.8%) |
| Food Preparation & Serving | 1,233 (45.3%) | 1,491 (54.7%) |
| Cleaning & Maintenance | 1,163 (46.2%) | 1,353 (53.8%) |
| Personal Care & Service | 360 (35.4%) | 657 (64.6%) |
| Total (Category) | 3,289 (38.3%) | 5,292 (61.7%) |
| Total (Overall) | 15,449 (51.4%) | 14,607 (48.6%) |
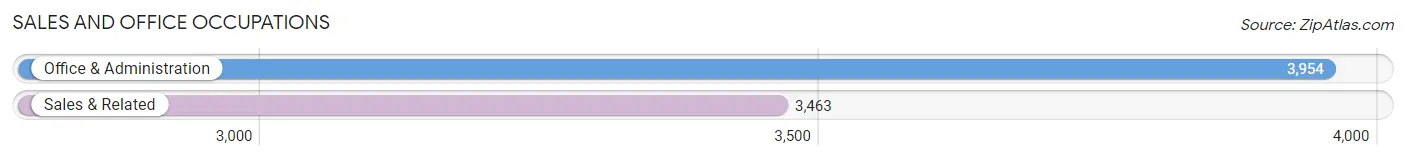
Sales and Office Occupations
The most common Sales and Office occupations in Poinciana are Office & Administration (3,954 | 13.2%), and Sales & Related (3,463 | 11.5%).
Sales and Office Occupations by Sex
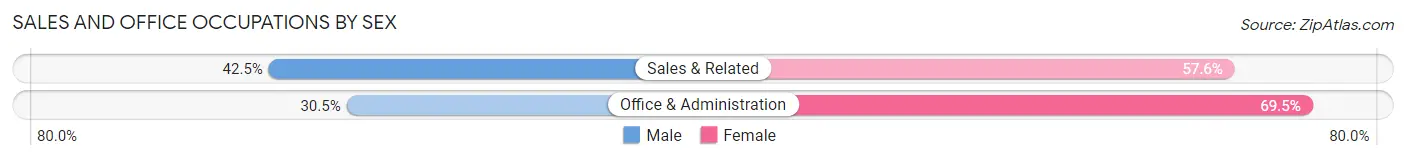
| Occupation | Male | Female |
| Sales & Related | 1,470 (42.4%) | 1,993 (57.6%) |
| Office & Administration | 1,205 (30.5%) | 2,749 (69.5%) |
| Total (Category) | 2,675 (36.1%) | 4,742 (63.9%) |
| Total (Overall) | 15,449 (51.4%) | 14,607 (48.6%) |
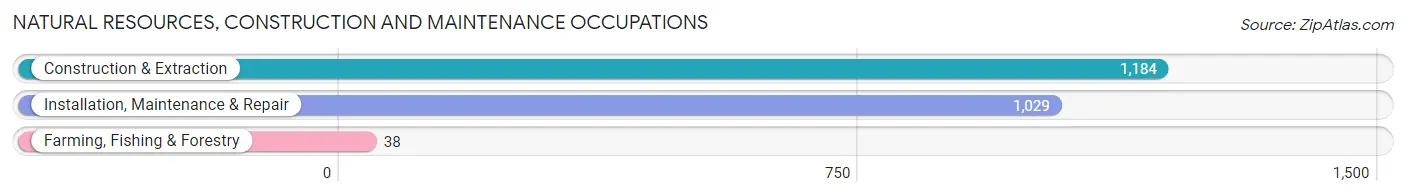
Natural Resources, Construction and Maintenance Occupations
The most common Natural Resources, Construction and Maintenance occupations in Poinciana are Construction & Extraction (1,184 | 3.9%), Installation, Maintenance & Repair (1,029 | 3.4%), and Farming, Fishing & Forestry (38 | 0.1%).
Natural Resources, Construction and Maintenance Occupations by Sex
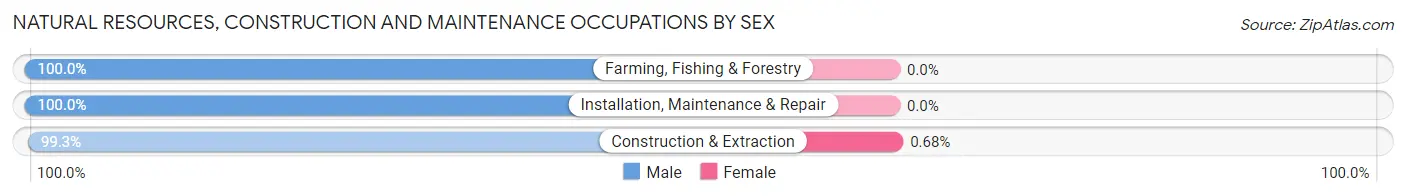
| Occupation | Male | Female |
| Farming, Fishing & Forestry | 38 (100.0%) | 0 (0.0%) |
| Construction & Extraction | 1,176 (99.3%) | 8 (0.7%) |
| Installation, Maintenance & Repair | 1,029 (100.0%) | 0 (0.0%) |
| Total (Category) | 2,243 (99.6%) | 8 (0.4%) |
| Total (Overall) | 15,449 (51.4%) | 14,607 (48.6%) |
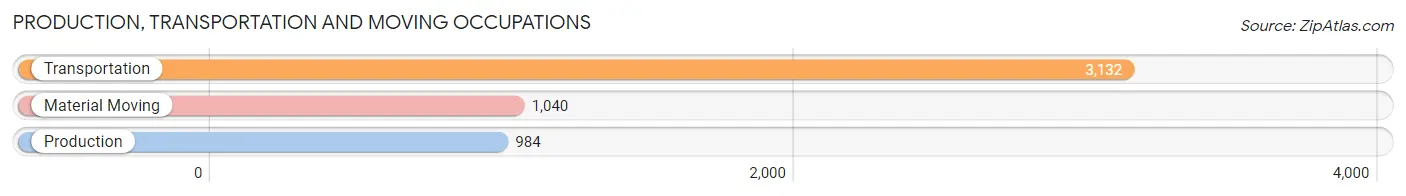
Production, Transportation and Moving Occupations
The most common Production, Transportation and Moving occupations in Poinciana are Transportation (3,132 | 10.4%), Material Moving (1,040 | 3.5%), and Production (984 | 3.3%).
Production, Transportation and Moving Occupations by Sex
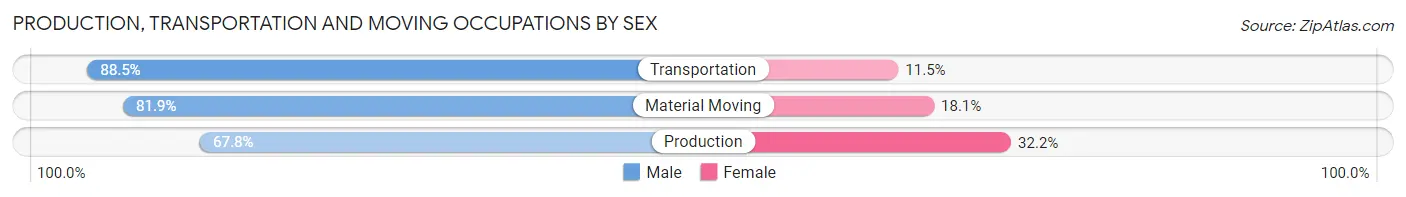
| Occupation | Male | Female |
| Production | 667 (67.8%) | 317 (32.2%) |
| Transportation | 2,771 (88.5%) | 361 (11.5%) |
| Material Moving | 852 (81.9%) | 188 (18.1%) |
| Total (Category) | 4,290 (83.2%) | 866 (16.8%) |
| Total (Overall) | 15,449 (51.4%) | 14,607 (48.6%) |
Employment Industries by Sex in Poinciana
Employment Industries in Poinciana
The major employment industries in Poinciana include Retail Trade (4,632 | 15.4%), Accommodation & Food Services (4,183 | 13.9%), Transportation & Warehousing (3,723 | 12.4%), Health Care & Social Assistance (3,664 | 12.2%), and Administrative & Support (2,105 | 7.0%).
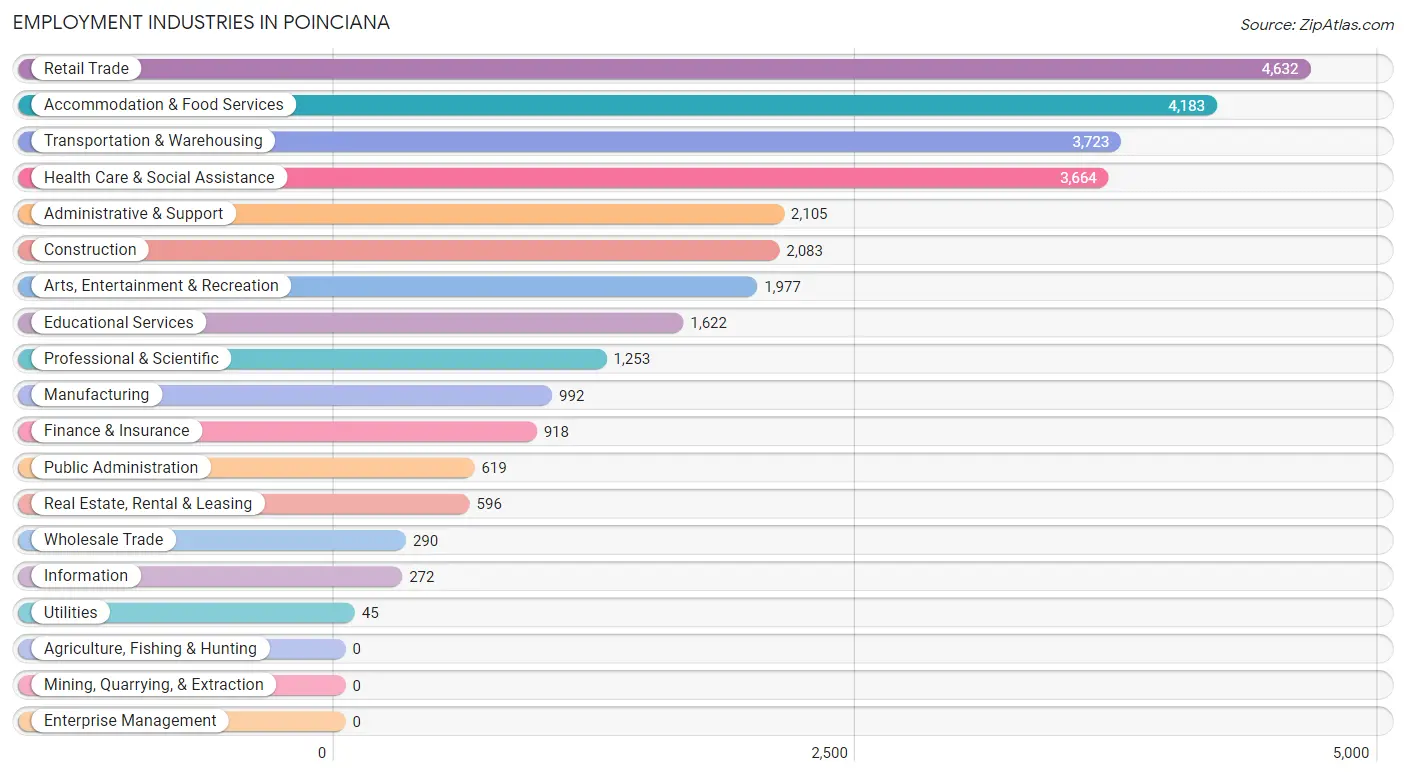
Employment Industries by Sex in Poinciana
The Poinciana industries that see more men than women are Utilities (100.0%), Construction (86.3%), and Transportation & Warehousing (83.8%), whereas the industries that tend to have a higher number of women are Health Care & Social Assistance (90.9%), Educational Services (80.5%), and Professional & Scientific (68.2%).
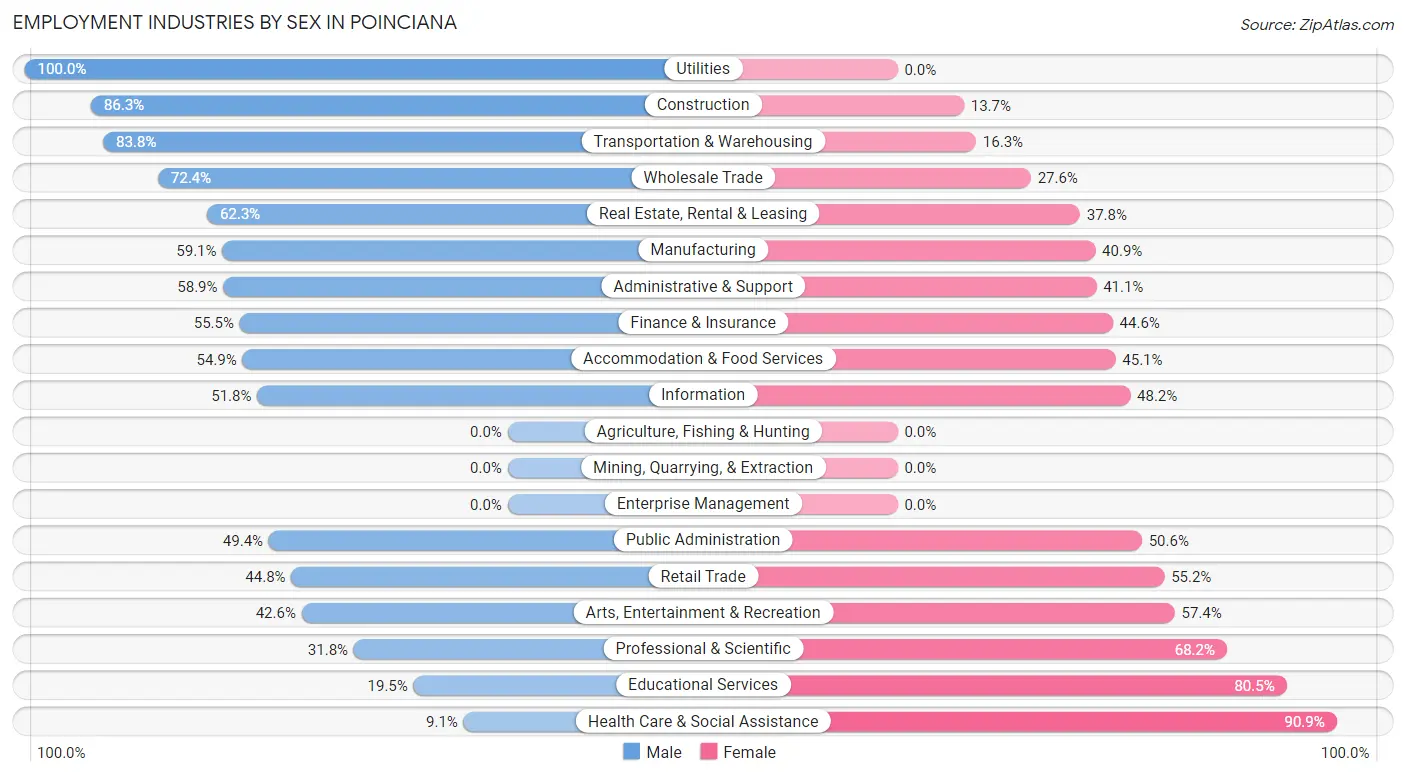
| Industry | Male | Female |
| Agriculture, Fishing & Hunting | 0 (0.0%) | 0 (0.0%) |
| Mining, Quarrying, & Extraction | 0 (0.0%) | 0 (0.0%) |
| Construction | 1,797 (86.3%) | 286 (13.7%) |
| Manufacturing | 586 (59.1%) | 406 (40.9%) |
| Wholesale Trade | 210 (72.4%) | 80 (27.6%) |
| Retail Trade | 2,074 (44.8%) | 2,558 (55.2%) |
| Transportation & Warehousing | 3,118 (83.8%) | 605 (16.3%) |
| Utilities | 45 (100.0%) | 0 (0.0%) |
| Information | 141 (51.8%) | 131 (48.2%) |
| Finance & Insurance | 509 (55.4%) | 409 (44.6%) |
| Real Estate, Rental & Leasing | 371 (62.3%) | 225 (37.8%) |
| Professional & Scientific | 399 (31.8%) | 854 (68.2%) |
| Enterprise Management | 0 (0.0%) | 0 (0.0%) |
| Administrative & Support | 1,239 (58.9%) | 866 (41.1%) |
| Educational Services | 316 (19.5%) | 1,306 (80.5%) |
| Health Care & Social Assistance | 334 (9.1%) | 3,330 (90.9%) |
| Arts, Entertainment & Recreation | 843 (42.6%) | 1,134 (57.4%) |
| Accommodation & Food Services | 2,296 (54.9%) | 1,887 (45.1%) |
| Public Administration | 306 (49.4%) | 313 (50.6%) |
| Total | 15,449 (51.4%) | 14,607 (48.6%) |
Education in Poinciana
School Enrollment in Poinciana
The most common levels of schooling among the 16,612 students in Poinciana are high school (4,467 | 26.9%), middle school (3,790 | 22.8%), and elementary school (3,275 | 19.7%).
| School Level | # Students | % Students |
| Nursery / Preschool | 588 | 3.5% |
| Kindergarten | 881 | 5.3% |
| Elementary School | 3,275 | 19.7% |
| Middle School | 3,790 | 22.8% |
| High School | 4,467 | 26.9% |
| College / Undergraduate | 3,258 | 19.6% |
| Graduate / Professional | 353 | 2.1% |
| Total | 16,612 | 100.0% |
School Enrollment by Age by Funding Source in Poinciana
Out of a total of 16,612 students who are enrolled in schools in Poinciana, 2,259 (13.6%) attend a private institution, while the remaining 14,353 (86.4%) are enrolled in public schools. The age group of 35 years and over has the highest likelihood of being enrolled in private schools, with 200 (36.3% in the age bracket) enrolled. Conversely, the age group of 25 to 34 year olds has the lowest likelihood of being enrolled in a private school, with 775 (98.0% in the age bracket) attending a public institution.
| Age Bracket | Public School | Private School |
| 3 to 4 Year Olds | 215 (64.9%) | 116 (35.0%) |
| 5 to 9 Year Old | 3,475 (85.0%) | 612 (15.0%) |
| 10 to 14 Year Olds | 3,790 (89.0%) | 470 (11.0%) |
| 15 to 17 Year Olds | 3,164 (89.2%) | 381 (10.7%) |
| 18 to 19 Year Olds | 1,176 (86.8%) | 179 (13.2%) |
| 20 to 24 Year Olds | 1,409 (83.3%) | 283 (16.7%) |
| 25 to 34 Year Olds | 775 (98.0%) | 16 (2.0%) |
| 35 Years and over | 351 (63.7%) | 200 (36.3%) |
| Total | 14,353 (86.4%) | 2,259 (13.6%) |
Educational Attainment by Field of Study in Poinciana
Business (1,973 | 19.9%), education (1,454 | 14.7%), science & technology (1,035 | 10.4%), social sciences (956 | 9.7%), and psychology (792 | 8.0%) are the most common fields of study among 9,906 individuals in Poinciana who have obtained a bachelor's degree or higher.
| Field of Study | # Graduates | % Graduates |
| Computers & Mathematics | 491 | 5.0% |
| Bio, Nature & Agricultural | 256 | 2.6% |
| Physical & Health Sciences | 506 | 5.1% |
| Psychology | 792 | 8.0% |
| Social Sciences | 956 | 9.7% |
| Engineering | 667 | 6.7% |
| Multidisciplinary Studies | 88 | 0.9% |
| Science & Technology | 1,035 | 10.4% |
| Business | 1,973 | 19.9% |
| Education | 1,454 | 14.7% |
| Literature & Languages | 158 | 1.6% |
| Liberal Arts & History | 188 | 1.9% |
| Visual & Performing Arts | 461 | 4.6% |
| Communications | 234 | 2.4% |
| Arts & Humanities | 647 | 6.5% |
| Total | 9,906 | 100.0% |
Transportation & Commute in Poinciana
Vehicle Availability by Sex in Poinciana
The most prevalent vehicle ownership categories in Poinciana are males with 2 vehicles (6,405, accounting for 43.1%) and females with 2 vehicles (5,634, making up 45.6%).
| Vehicles Available | Male | Female |
| No Vehicle | 217 (1.5%) | 132 (0.9%) |
| 1 Vehicle | 2,114 (14.2%) | 3,136 (22.3%) |
| 2 Vehicles | 6,405 (43.1%) | 5,634 (40.1%) |
| 3 Vehicles | 3,880 (26.1%) | 3,001 (21.3%) |
| 4 Vehicles | 1,571 (10.6%) | 1,439 (10.2%) |
| 5 or more Vehicles | 670 (4.5%) | 721 (5.1%) |
| Total | 14,857 (100.0%) | 14,063 (100.0%) |
Commute Time in Poinciana
The most frequently occuring commute durations in Poinciana are 60 to 89 minutes (6,078 commuters, 22.3%), 45 to 59 minutes (3,990 commuters, 14.6%), and 30 to 34 minutes (2,939 commuters, 10.8%).
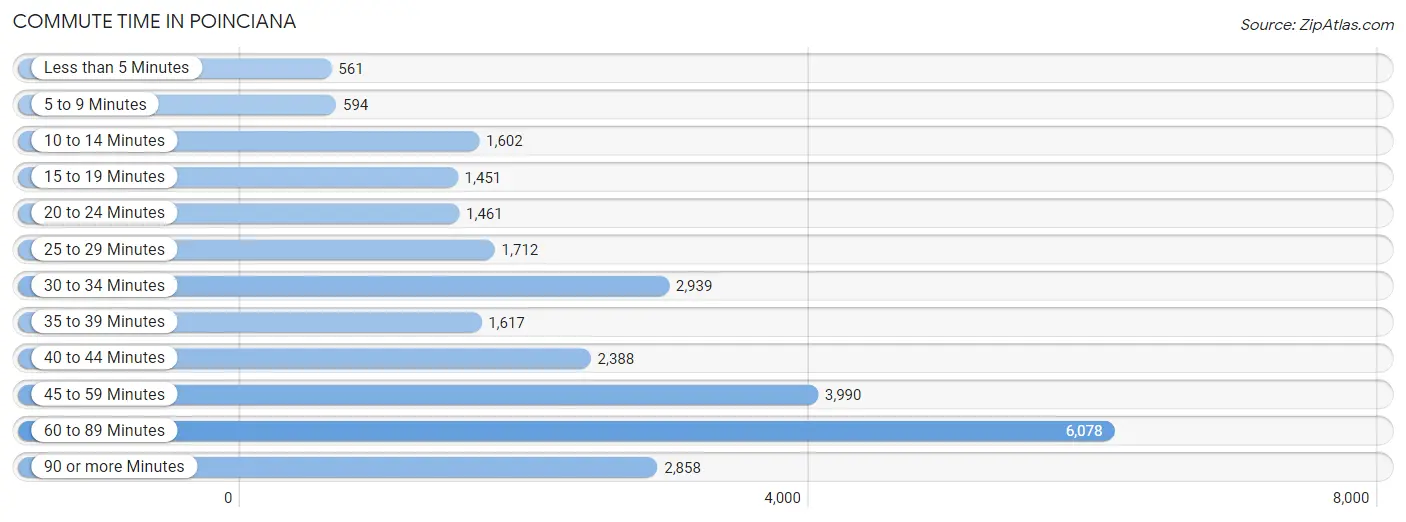
| Commute Time | # Commuters | % Commuters |
| Less than 5 Minutes | 561 | 2.1% |
| 5 to 9 Minutes | 594 | 2.2% |
| 10 to 14 Minutes | 1,602 | 5.9% |
| 15 to 19 Minutes | 1,451 | 5.3% |
| 20 to 24 Minutes | 1,461 | 5.4% |
| 25 to 29 Minutes | 1,712 | 6.3% |
| 30 to 34 Minutes | 2,939 | 10.8% |
| 35 to 39 Minutes | 1,617 | 5.9% |
| 40 to 44 Minutes | 2,388 | 8.8% |
| 45 to 59 Minutes | 3,990 | 14.6% |
| 60 to 89 Minutes | 6,078 | 22.3% |
| 90 or more Minutes | 2,858 | 10.5% |
Commute Time by Sex in Poinciana
The most common commute times in Poinciana are 60 to 89 minutes (3,221 commuters, 22.6%) for males and 60 to 89 minutes (2,857 commuters, 22.0%) for females.
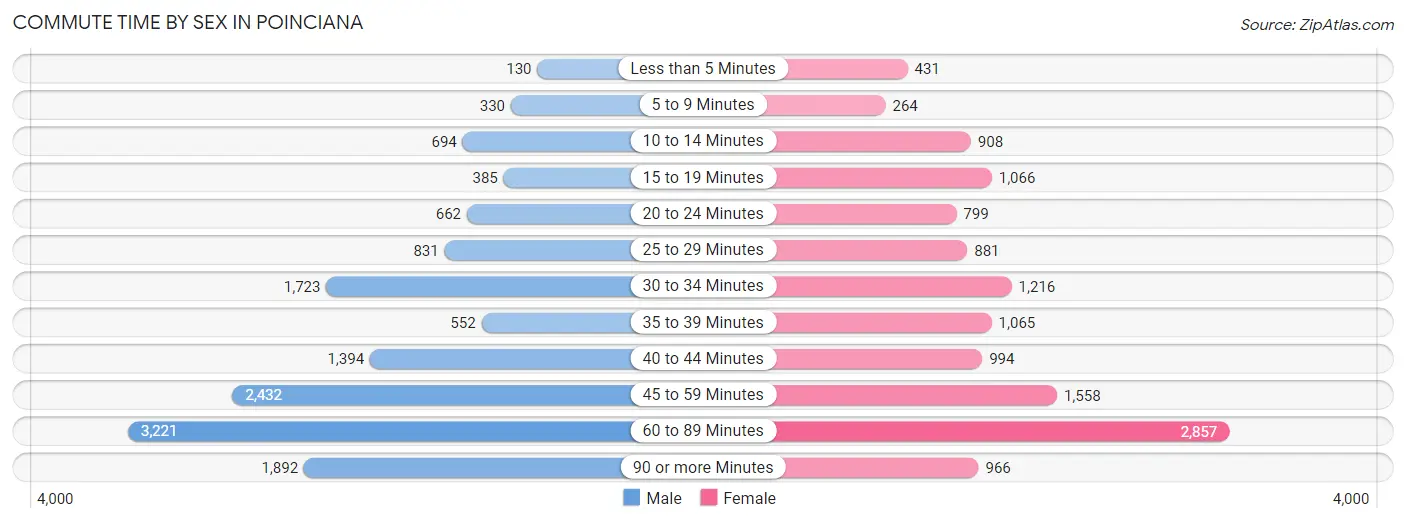
| Commute Time | Male | Female |
| Less than 5 Minutes | 130 (0.9%) | 431 (3.3%) |
| 5 to 9 Minutes | 330 (2.3%) | 264 (2.0%) |
| 10 to 14 Minutes | 694 (4.9%) | 908 (7.0%) |
| 15 to 19 Minutes | 385 (2.7%) | 1,066 (8.2%) |
| 20 to 24 Minutes | 662 (4.6%) | 799 (6.1%) |
| 25 to 29 Minutes | 831 (5.8%) | 881 (6.8%) |
| 30 to 34 Minutes | 1,723 (12.1%) | 1,216 (9.3%) |
| 35 to 39 Minutes | 552 (3.9%) | 1,065 (8.2%) |
| 40 to 44 Minutes | 1,394 (9.8%) | 994 (7.6%) |
| 45 to 59 Minutes | 2,432 (17.1%) | 1,558 (12.0%) |
| 60 to 89 Minutes | 3,221 (22.6%) | 2,857 (22.0%) |
| 90 or more Minutes | 1,892 (13.3%) | 966 (7.4%) |
Time of Departure to Work by Sex in Poinciana
The most frequent times of departure to work in Poinciana are 6:00 AM to 6:29 AM (1,952, 13.7%) for males and 7:00 AM to 7:29 AM (2,175, 16.7%) for females.
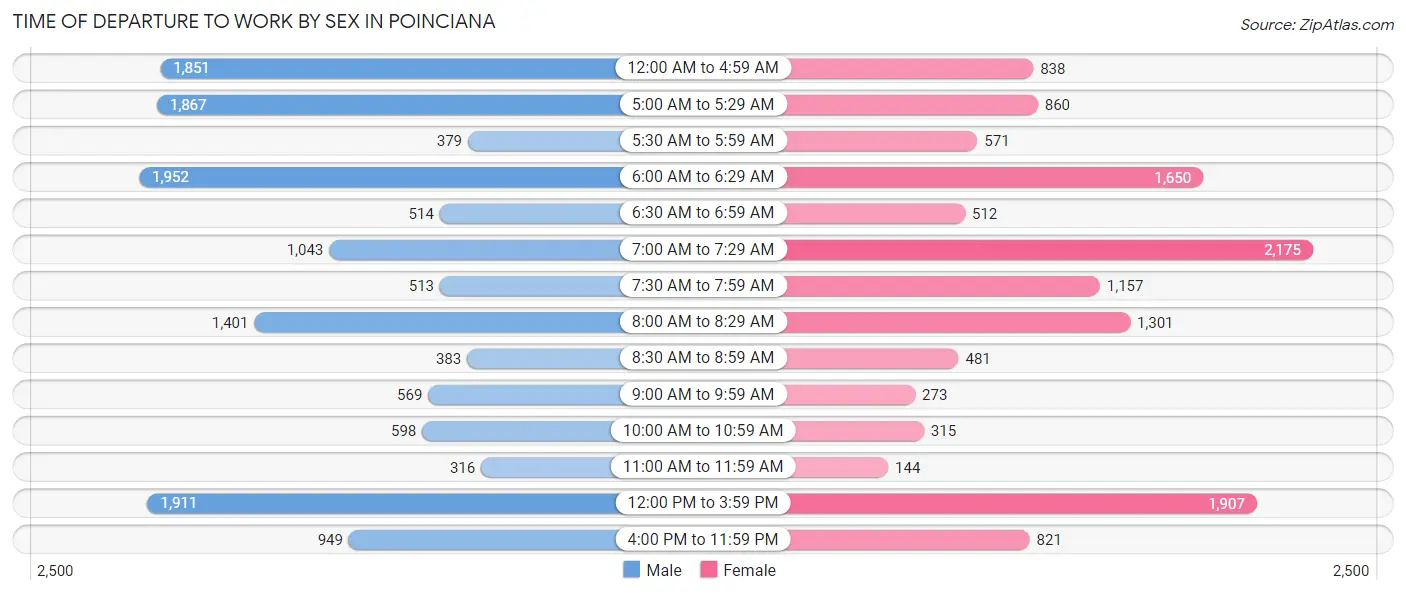
| Time of Departure | Male | Female |
| 12:00 AM to 4:59 AM | 1,851 (13.0%) | 838 (6.4%) |
| 5:00 AM to 5:29 AM | 1,867 (13.1%) | 860 (6.6%) |
| 5:30 AM to 5:59 AM | 379 (2.7%) | 571 (4.4%) |
| 6:00 AM to 6:29 AM | 1,952 (13.7%) | 1,650 (12.7%) |
| 6:30 AM to 6:59 AM | 514 (3.6%) | 512 (3.9%) |
| 7:00 AM to 7:29 AM | 1,043 (7.3%) | 2,175 (16.7%) |
| 7:30 AM to 7:59 AM | 513 (3.6%) | 1,157 (8.9%) |
| 8:00 AM to 8:29 AM | 1,401 (9.8%) | 1,301 (10.0%) |
| 8:30 AM to 8:59 AM | 383 (2.7%) | 481 (3.7%) |
| 9:00 AM to 9:59 AM | 569 (4.0%) | 273 (2.1%) |
| 10:00 AM to 10:59 AM | 598 (4.2%) | 315 (2.4%) |
| 11:00 AM to 11:59 AM | 316 (2.2%) | 144 (1.1%) |
| 12:00 PM to 3:59 PM | 1,911 (13.4%) | 1,907 (14.7%) |
| 4:00 PM to 11:59 PM | 949 (6.7%) | 821 (6.3%) |
| Total | 14,246 (100.0%) | 13,005 (100.0%) |
Housing Occupancy in Poinciana
Occupancy by Ownership in Poinciana
Of the total 21,284 dwellings in Poinciana, owner-occupied units account for 16,081 (75.5%), while renter-occupied units make up 5,203 (24.4%).
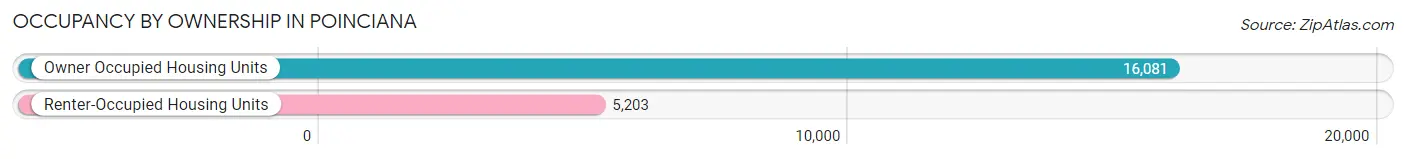
| Occupancy | # Housing Units | % Housing Units |
| Owner Occupied Housing Units | 16,081 | 75.5% |
| Renter-Occupied Housing Units | 5,203 | 24.4% |
| Total Occupied Housing Units | 21,284 | 100.0% |
Occupancy by Household Size in Poinciana
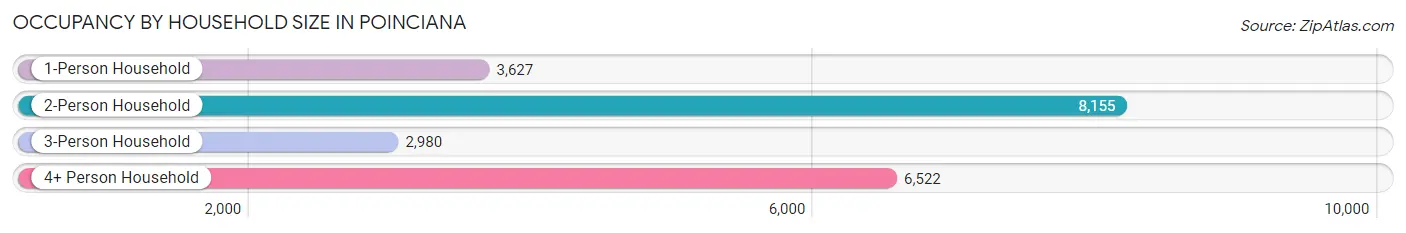
| Household Size | # Housing Units | % Housing Units |
| 1-Person Household | 3,627 | 17.0% |
| 2-Person Household | 8,155 | 38.3% |
| 3-Person Household | 2,980 | 14.0% |
| 4+ Person Household | 6,522 | 30.6% |
| Total Housing Units | 21,284 | 100.0% |
Occupancy by Ownership by Household Size in Poinciana
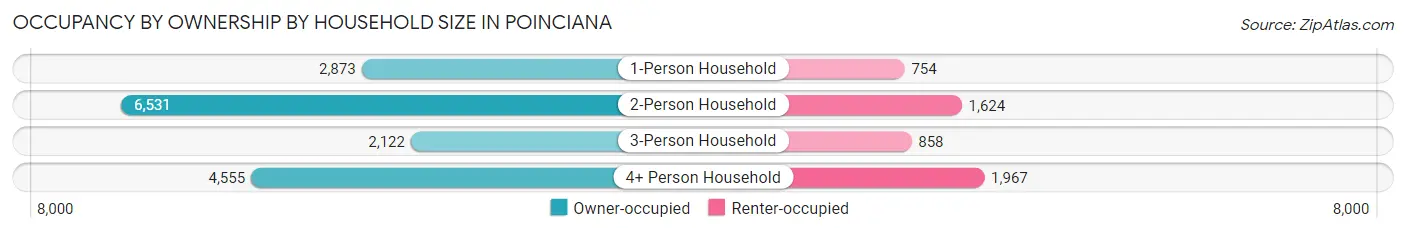
| Household Size | Owner-occupied | Renter-occupied |
| 1-Person Household | 2,873 (79.2%) | 754 (20.8%) |
| 2-Person Household | 6,531 (80.1%) | 1,624 (19.9%) |
| 3-Person Household | 2,122 (71.2%) | 858 (28.8%) |
| 4+ Person Household | 4,555 (69.8%) | 1,967 (30.2%) |
| Total Housing Units | 16,081 (75.5%) | 5,203 (24.4%) |
Occupancy by Educational Attainment in Poinciana
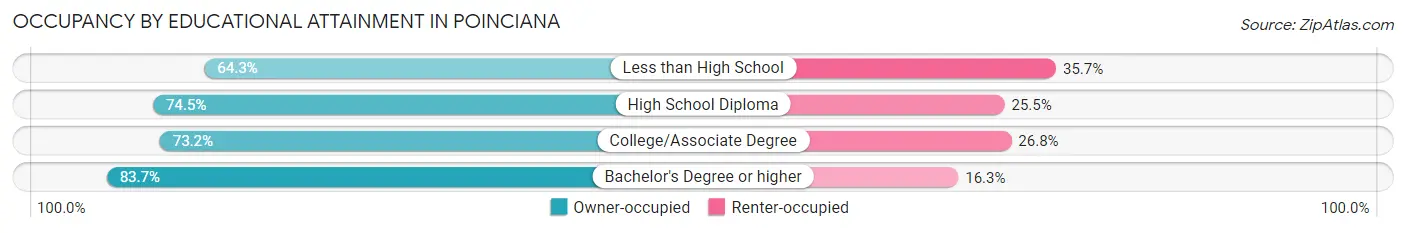
| Household Size | Owner-occupied | Renter-occupied |
| Less than High School | 1,447 (64.3%) | 802 (35.7%) |
| High School Diploma | 4,137 (74.5%) | 1,413 (25.5%) |
| College/Associate Degree | 5,509 (73.2%) | 2,018 (26.8%) |
| Bachelor's Degree or higher | 4,988 (83.7%) | 970 (16.3%) |
Occupancy by Age of Householder in Poinciana
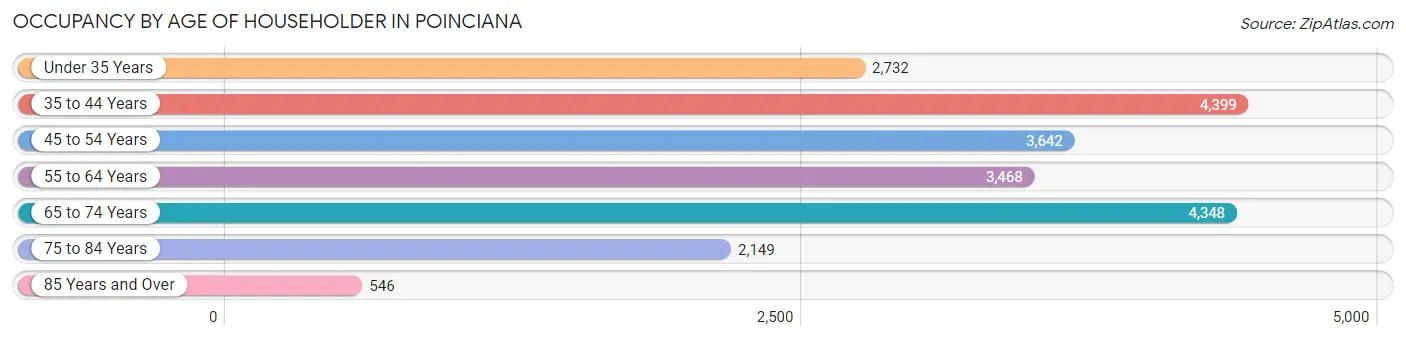
| Age Bracket | # Households | % Households |
| Under 35 Years | 2,732 | 12.8% |
| 35 to 44 Years | 4,399 | 20.7% |
| 45 to 54 Years | 3,642 | 17.1% |
| 55 to 64 Years | 3,468 | 16.3% |
| 65 to 74 Years | 4,348 | 20.4% |
| 75 to 84 Years | 2,149 | 10.1% |
| 85 Years and Over | 546 | 2.6% |
| Total | 21,284 | 100.0% |
Housing Finances in Poinciana
Median Income by Occupancy in Poinciana
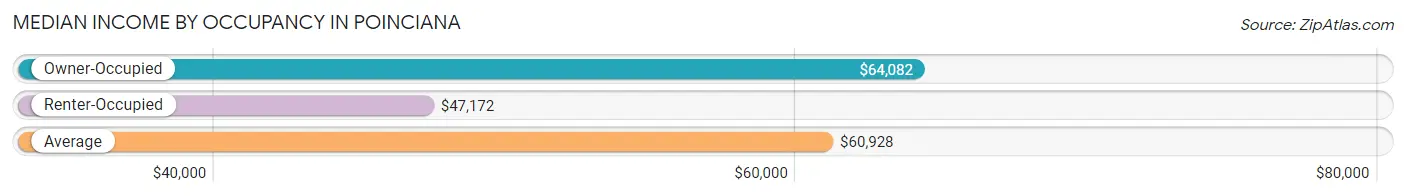
| Occupancy Type | # Households | Median Income |
| Owner-Occupied | 16,081 (75.5%) | $64,082 |
| Renter-Occupied | 5,203 (24.4%) | $47,172 |
| Average | 21,284 (100.0%) | $60,928 |
Occupancy by Householder Income Bracket in Poinciana
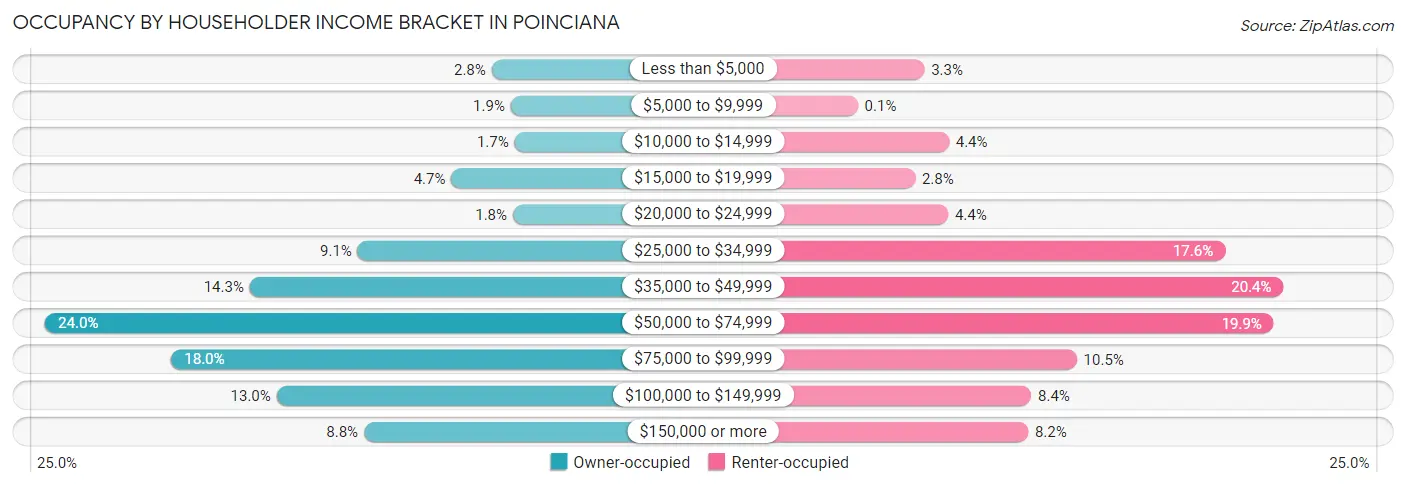
| Income Bracket | Owner-occupied | Renter-occupied |
| Less than $5,000 | 444 (2.8%) | 170 (3.3%) |
| $5,000 to $9,999 | 297 (1.8%) | 5 (0.1%) |
| $10,000 to $14,999 | 268 (1.7%) | 231 (4.4%) |
| $15,000 to $19,999 | 753 (4.7%) | 147 (2.8%) |
| $20,000 to $24,999 | 282 (1.8%) | 229 (4.4%) |
| $25,000 to $34,999 | 1,469 (9.1%) | 915 (17.6%) |
| $35,000 to $49,999 | 2,297 (14.3%) | 1,060 (20.4%) |
| $50,000 to $74,999 | 3,863 (24.0%) | 1,036 (19.9%) |
| $75,000 to $99,999 | 2,896 (18.0%) | 548 (10.5%) |
| $100,000 to $149,999 | 2,091 (13.0%) | 435 (8.4%) |
| $150,000 or more | 1,421 (8.8%) | 427 (8.2%) |
| Total | 16,081 (100.0%) | 5,203 (100.0%) |
Monthly Housing Cost Tiers in Poinciana
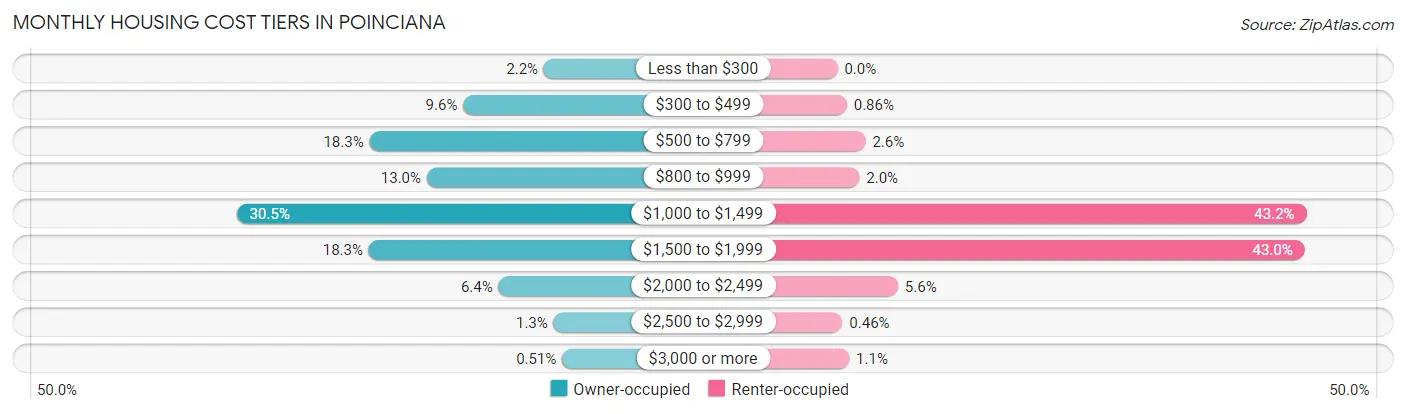
| Monthly Cost | Owner-occupied | Renter-occupied |
| Less than $300 | 352 (2.2%) | 0 (0.0%) |
| $300 to $499 | 1,547 (9.6%) | 45 (0.9%) |
| $500 to $799 | 2,935 (18.2%) | 134 (2.6%) |
| $800 to $999 | 2,085 (13.0%) | 105 (2.0%) |
| $1,000 to $1,499 | 4,903 (30.5%) | 2,246 (43.2%) |
| $1,500 to $1,999 | 2,944 (18.3%) | 2,238 (43.0%) |
| $2,000 to $2,499 | 1,024 (6.4%) | 290 (5.6%) |
| $2,500 to $2,999 | 209 (1.3%) | 24 (0.5%) |
| $3,000 or more | 82 (0.5%) | 56 (1.1%) |
| Total | 16,081 (100.0%) | 5,203 (100.0%) |
Physical Housing Characteristics in Poinciana
Housing Structures in Poinciana
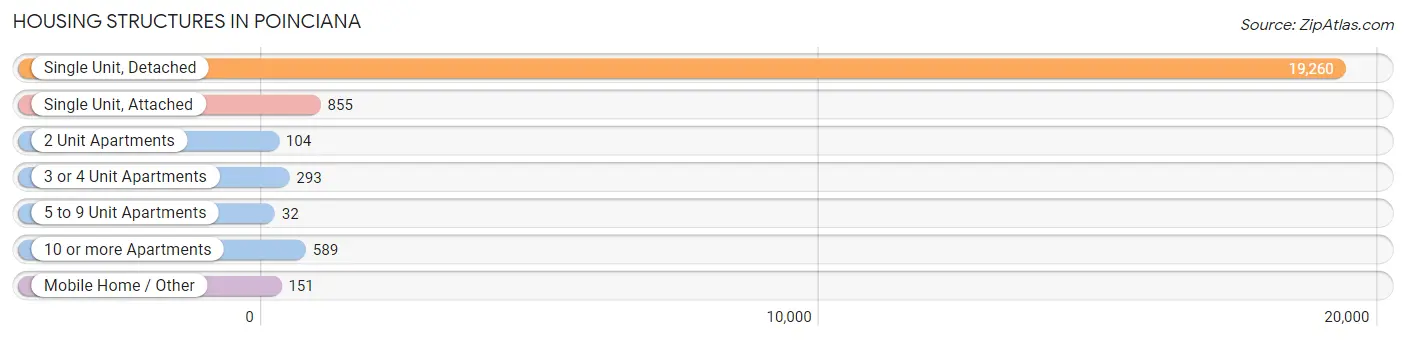
| Structure Type | # Housing Units | % Housing Units |
| Single Unit, Detached | 19,260 | 90.5% |
| Single Unit, Attached | 855 | 4.0% |
| 2 Unit Apartments | 104 | 0.5% |
| 3 or 4 Unit Apartments | 293 | 1.4% |
| 5 to 9 Unit Apartments | 32 | 0.2% |
| 10 or more Apartments | 589 | 2.8% |
| Mobile Home / Other | 151 | 0.7% |
| Total | 21,284 | 100.0% |
Housing Structures by Occupancy in Poinciana
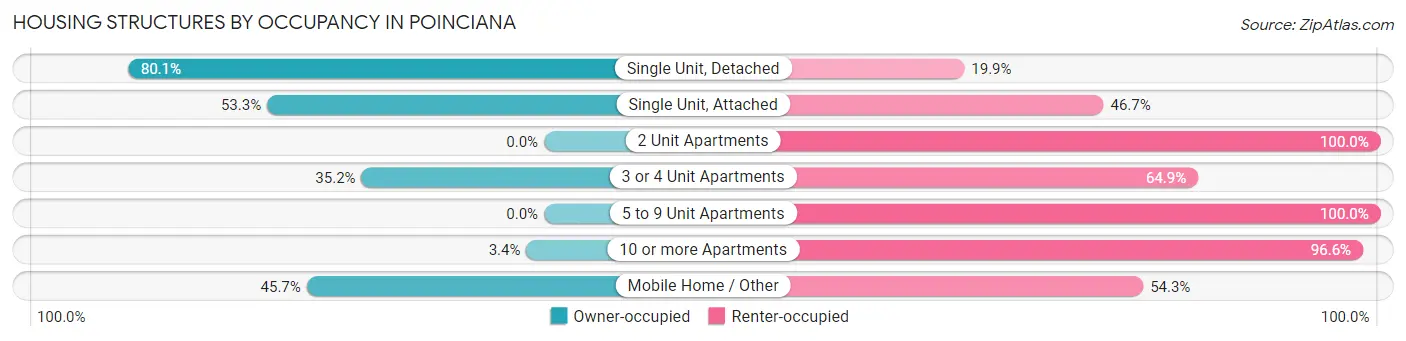
| Structure Type | Owner-occupied | Renter-occupied |
| Single Unit, Detached | 15,433 (80.1%) | 3,827 (19.9%) |
| Single Unit, Attached | 456 (53.3%) | 399 (46.7%) |
| 2 Unit Apartments | 0 (0.0%) | 104 (100.0%) |
| 3 or 4 Unit Apartments | 103 (35.1%) | 190 (64.8%) |
| 5 to 9 Unit Apartments | 0 (0.0%) | 32 (100.0%) |
| 10 or more Apartments | 20 (3.4%) | 569 (96.6%) |
| Mobile Home / Other | 69 (45.7%) | 82 (54.3%) |
| Total | 16,081 (75.5%) | 5,203 (24.4%) |
Housing Structures by Number of Rooms in Poinciana
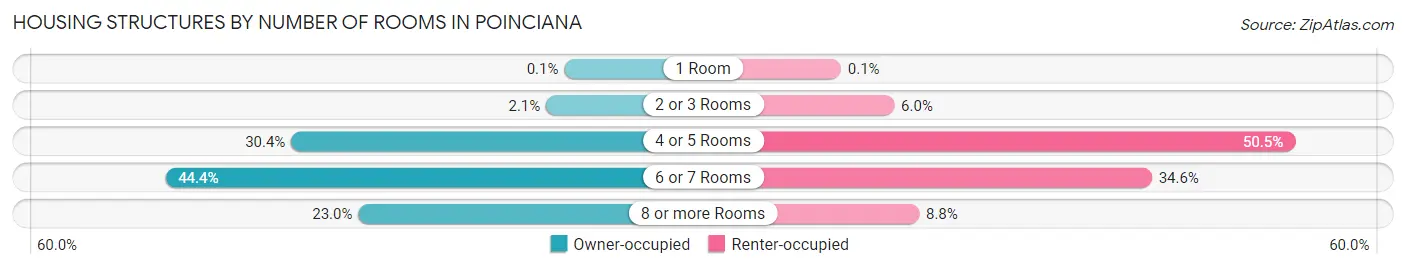
| Number of Rooms | Owner-occupied | Renter-occupied |
| 1 Room | 16 (0.1%) | 5 (0.1%) |
| 2 or 3 Rooms | 341 (2.1%) | 313 (6.0%) |
| 4 or 5 Rooms | 4,891 (30.4%) | 2,628 (50.5%) |
| 6 or 7 Rooms | 7,139 (44.4%) | 1,800 (34.6%) |
| 8 or more Rooms | 3,694 (23.0%) | 457 (8.8%) |
| Total | 16,081 (100.0%) | 5,203 (100.0%) |
Housing Structure by Heating Type in Poinciana
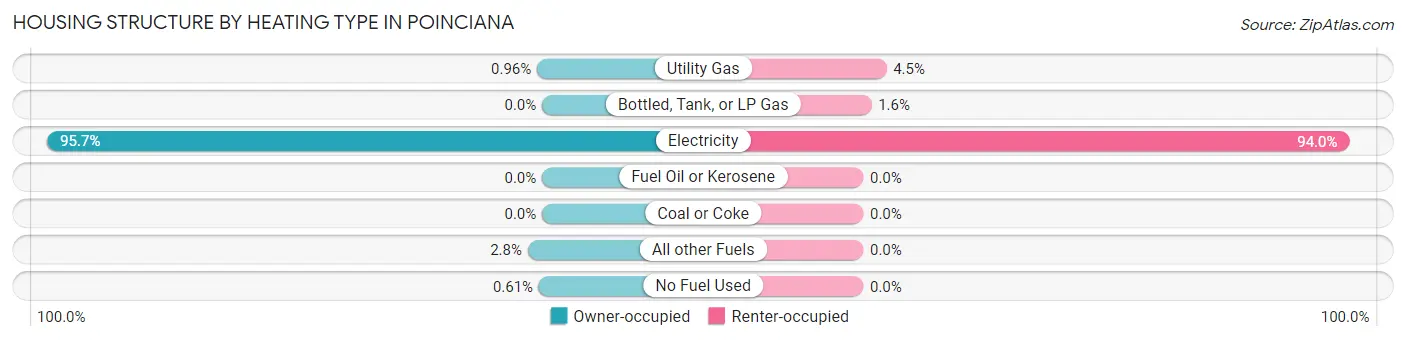
| Heating Type | Owner-occupied | Renter-occupied |
| Utility Gas | 155 (1.0%) | 233 (4.5%) |
| Bottled, Tank, or LP Gas | 0 (0.0%) | 82 (1.6%) |
| Electricity | 15,384 (95.7%) | 4,888 (94.0%) |
| Fuel Oil or Kerosene | 0 (0.0%) | 0 (0.0%) |
| Coal or Coke | 0 (0.0%) | 0 (0.0%) |
| All other Fuels | 444 (2.8%) | 0 (0.0%) |
| No Fuel Used | 98 (0.6%) | 0 (0.0%) |
| Total | 16,081 (100.0%) | 5,203 (100.0%) |
Household Vehicle Usage in Poinciana
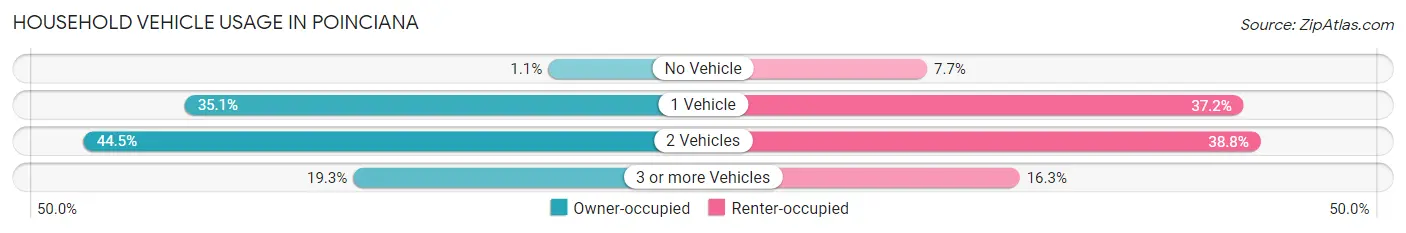
| Vehicles per Household | Owner-occupied | Renter-occupied |
| No Vehicle | 183 (1.1%) | 399 (7.7%) |
| 1 Vehicle | 5,637 (35.0%) | 1,936 (37.2%) |
| 2 Vehicles | 7,151 (44.5%) | 2,019 (38.8%) |
| 3 or more Vehicles | 3,110 (19.3%) | 849 (16.3%) |
| Total | 16,081 (100.0%) | 5,203 (100.0%) |
Real Estate & Mortgages in Poinciana
Real Estate and Mortgage Overview in Poinciana
| Characteristic | Without Mortgage | With Mortgage |
| Housing Units | 5,312 | 10,769 |
| Median Property Value | $259,400 | $234,700 |
| Median Household Income | $63,732 | $563 |
| Monthly Housing Costs | $570 | $82 |
| Real Estate Taxes | $2,391 | $541 |
Property Value by Mortgage Status in Poinciana
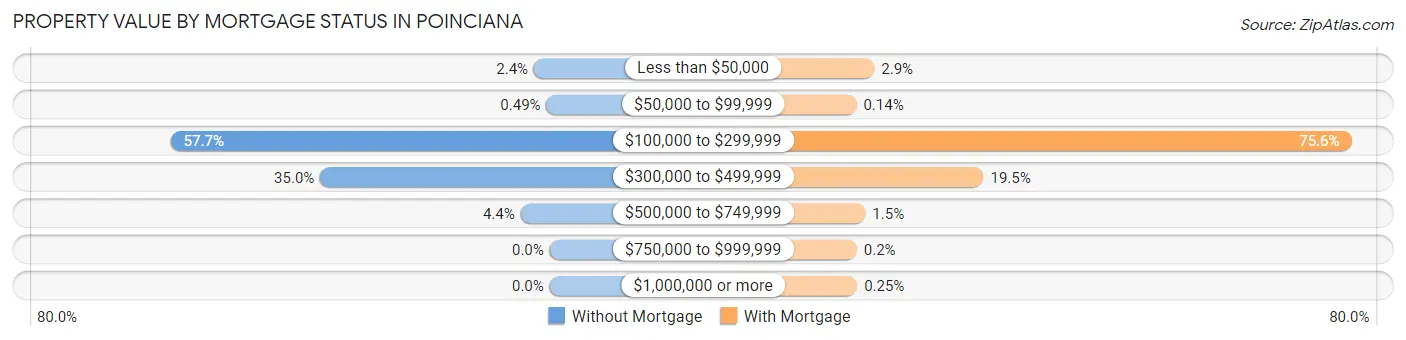
| Property Value | Without Mortgage | With Mortgage |
| Less than $50,000 | 127 (2.4%) | 309 (2.9%) |
| $50,000 to $99,999 | 26 (0.5%) | 15 (0.1%) |
| $100,000 to $299,999 | 3,067 (57.7%) | 8,136 (75.5%) |
| $300,000 to $499,999 | 1,857 (35.0%) | 2,100 (19.5%) |
| $500,000 to $749,999 | 235 (4.4%) | 161 (1.5%) |
| $750,000 to $999,999 | 0 (0.0%) | 21 (0.2%) |
| $1,000,000 or more | 0 (0.0%) | 27 (0.3%) |
| Total | 5,312 (100.0%) | 10,769 (100.0%) |
Household Income by Mortgage Status in Poinciana
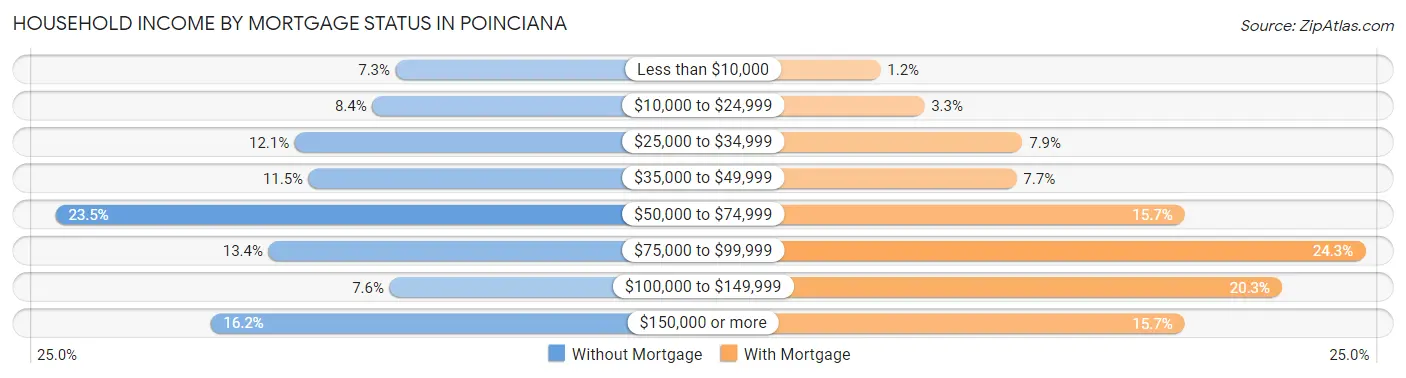
| Household Income | Without Mortgage | With Mortgage |
| Less than $10,000 | 389 (7.3%) | 127 (1.2%) |
| $10,000 to $24,999 | 448 (8.4%) | 352 (3.3%) |
| $25,000 to $34,999 | 644 (12.1%) | 855 (7.9%) |
| $35,000 to $49,999 | 609 (11.5%) | 825 (7.7%) |
| $50,000 to $74,999 | 1,250 (23.5%) | 1,688 (15.7%) |
| $75,000 to $99,999 | 710 (13.4%) | 2,613 (24.3%) |
| $100,000 to $149,999 | 404 (7.6%) | 2,186 (20.3%) |
| $150,000 or more | 858 (16.2%) | 1,687 (15.7%) |
| Total | 5,312 (100.0%) | 10,769 (100.0%) |
Property Value to Household Income Ratio in Poinciana
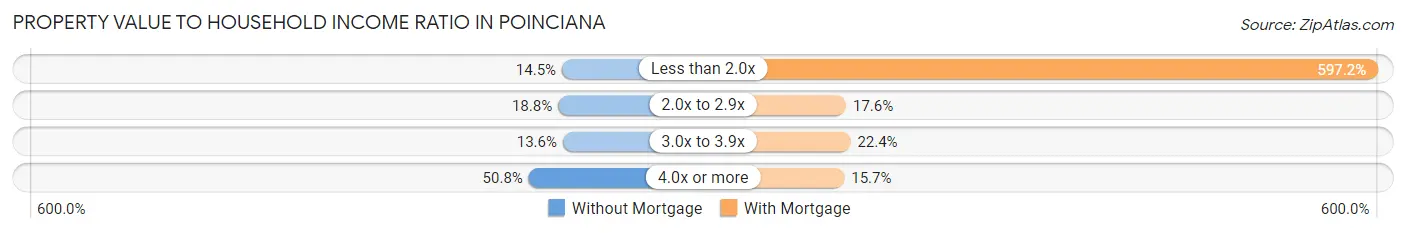
| Value-to-Income Ratio | Without Mortgage | With Mortgage |
| Less than 2.0x | 771 (14.5%) | 64,310 (597.2%) |
| 2.0x to 2.9x | 999 (18.8%) | 1,898 (17.6%) |
| 3.0x to 3.9x | 721 (13.6%) | 2,410 (22.4%) |
| 4.0x or more | 2,696 (50.7%) | 1,688 (15.7%) |
| Total | 5,312 (100.0%) | 10,769 (100.0%) |
Real Estate Taxes by Mortgage Status in Poinciana
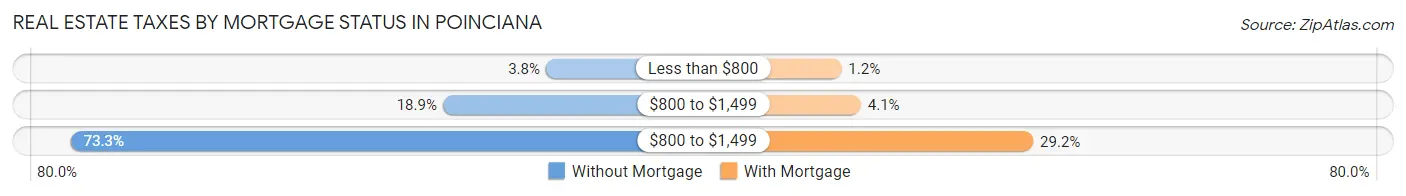
| Property Taxes | Without Mortgage | With Mortgage |
| Less than $800 | 204 (3.8%) | 131 (1.2%) |
| $800 to $1,499 | 1,004 (18.9%) | 437 (4.1%) |
| $800 to $1,499 | 3,892 (73.3%) | 3,149 (29.2%) |
| Total | 5,312 (100.0%) | 10,769 (100.0%) |
Health & Disability in Poinciana
Health Insurance Coverage by Age in Poinciana
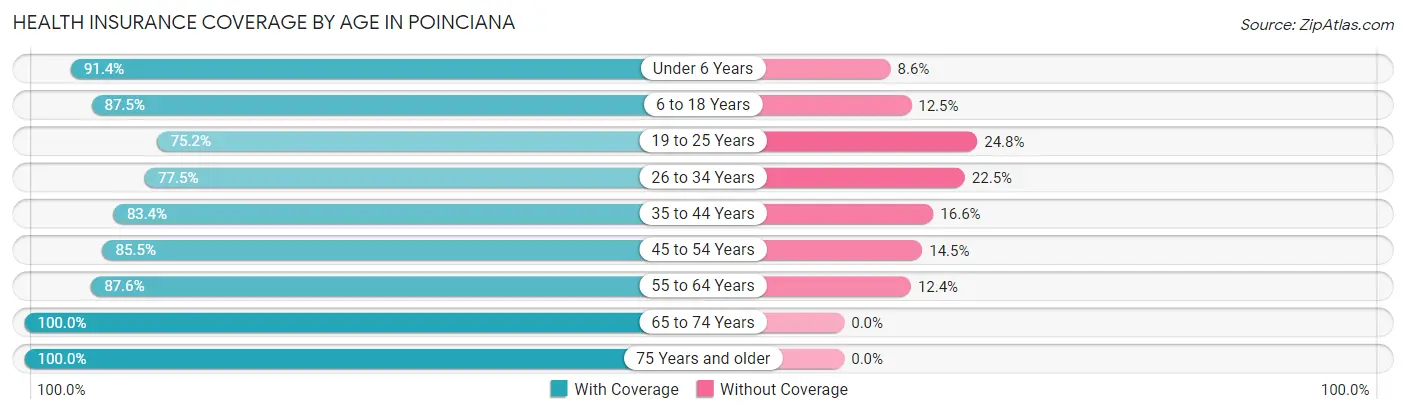
| Age Bracket | With Coverage | Without Coverage |
| Under 6 Years | 4,526 (91.4%) | 428 (8.6%) |
| 6 to 18 Years | 11,047 (87.5%) | 1,577 (12.5%) |
| 19 to 25 Years | 4,659 (75.2%) | 1,537 (24.8%) |
| 26 to 34 Years | 6,059 (77.5%) | 1,758 (22.5%) |
| 35 to 44 Years | 7,765 (83.4%) | 1,548 (16.6%) |
| 45 to 54 Years | 6,955 (85.5%) | 1,183 (14.5%) |
| 55 to 64 Years | 5,874 (87.6%) | 834 (12.4%) |
| 65 to 74 Years | 8,398 (100.0%) | 0 (0.0%) |
| 75 Years and older | 5,152 (100.0%) | 0 (0.0%) |
| Total | 60,435 (87.2%) | 8,865 (12.8%) |
Health Insurance Coverage by Citizenship Status in Poinciana
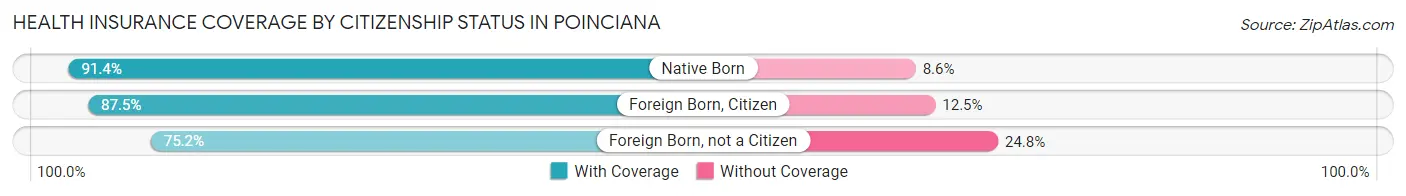
| Citizenship Status | With Coverage | Without Coverage |
| Native Born | 4,526 (91.4%) | 428 (8.6%) |
| Foreign Born, Citizen | 11,047 (87.5%) | 1,577 (12.5%) |
| Foreign Born, not a Citizen | 4,659 (75.2%) | 1,537 (24.8%) |
Health Insurance Coverage by Household Income in Poinciana
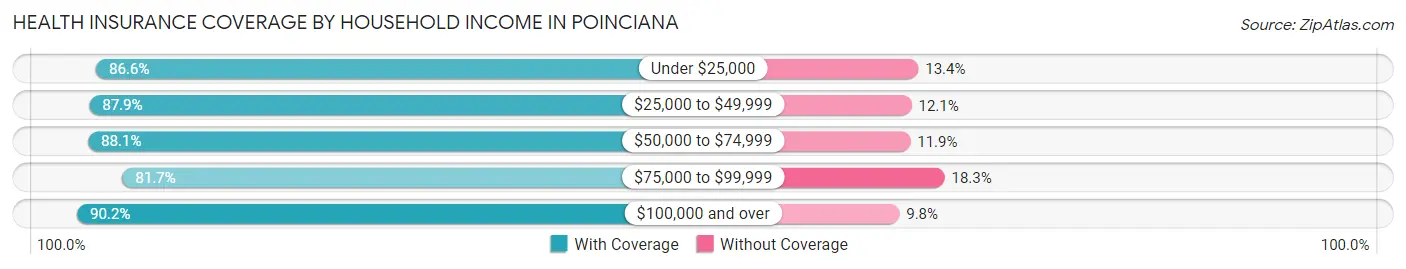
| Household Income | With Coverage | Without Coverage |
| Under $25,000 | 5,528 (86.6%) | 855 (13.4%) |
| $25,000 to $49,999 | 13,265 (87.9%) | 1,831 (12.1%) |
| $50,000 to $74,999 | 16,006 (88.1%) | 2,159 (11.9%) |
| $75,000 to $99,999 | 10,633 (81.7%) | 2,385 (18.3%) |
| $100,000 and over | 14,979 (90.2%) | 1,633 (9.8%) |
Public vs Private Health Insurance Coverage by Age in Poinciana
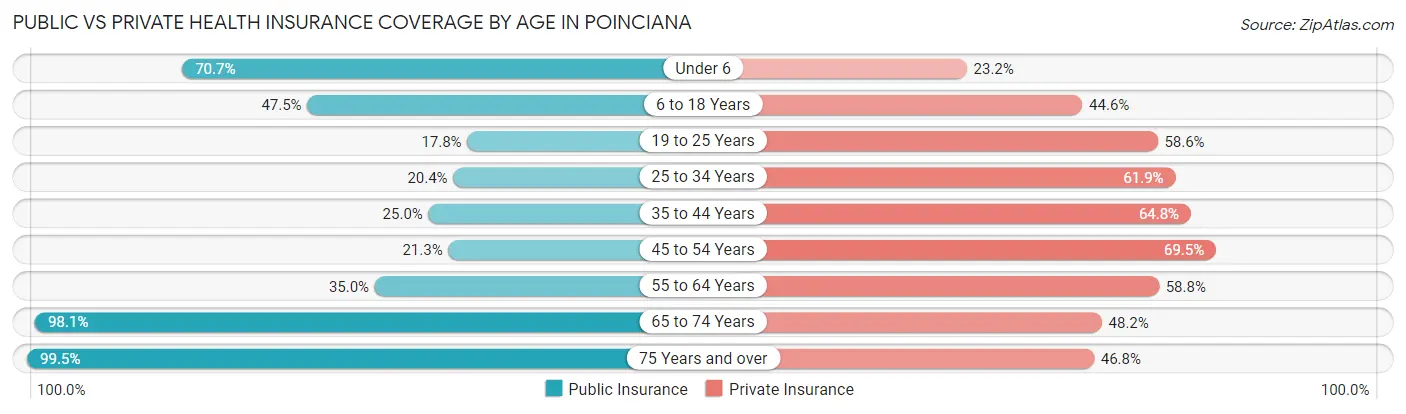
| Age Bracket | Public Insurance | Private Insurance |
| Under 6 | 3,504 (70.7%) | 1,148 (23.2%) |
| 6 to 18 Years | 5,997 (47.5%) | 5,633 (44.6%) |
| 19 to 25 Years | 1,103 (17.8%) | 3,630 (58.6%) |
| 25 to 34 Years | 1,595 (20.4%) | 4,840 (61.9%) |
| 35 to 44 Years | 2,328 (25.0%) | 6,035 (64.8%) |
| 45 to 54 Years | 1,735 (21.3%) | 5,653 (69.5%) |
| 55 to 64 Years | 2,346 (35.0%) | 3,946 (58.8%) |
| 65 to 74 Years | 8,236 (98.1%) | 4,050 (48.2%) |
| 75 Years and over | 5,128 (99.5%) | 2,410 (46.8%) |
| Total | 31,972 (46.1%) | 37,345 (53.9%) |
Disability Status by Sex by Age in Poinciana
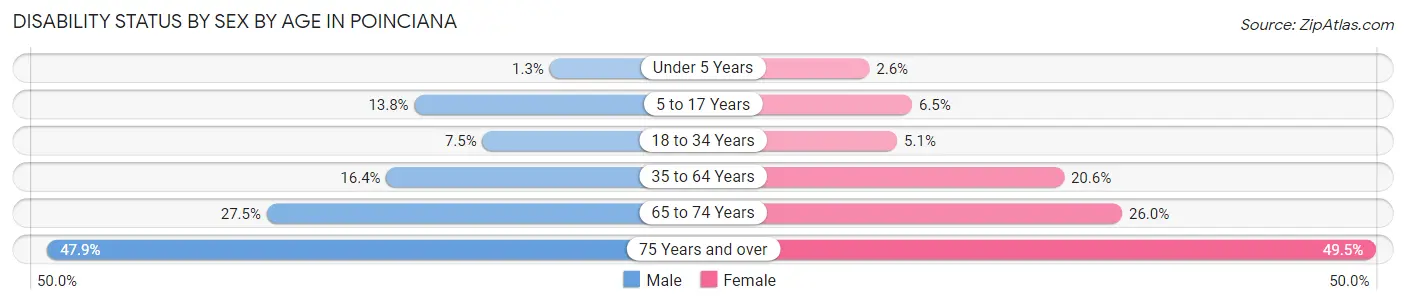
| Age Bracket | Male | Female |
| Under 5 Years | 28 (1.3%) | 44 (2.6%) |
| 5 to 17 Years | 879 (13.8%) | 407 (6.5%) |
| 18 to 34 Years | 551 (7.5%) | 396 (5.1%) |
| 35 to 64 Years | 2,013 (16.4%) | 2,453 (20.6%) |
| 65 to 74 Years | 963 (27.5%) | 1,274 (26.0%) |
| 75 Years and over | 1,161 (47.9%) | 1,350 (49.5%) |
Disability Class by Sex by Age in Poinciana
Disability Class: Hearing Difficulty
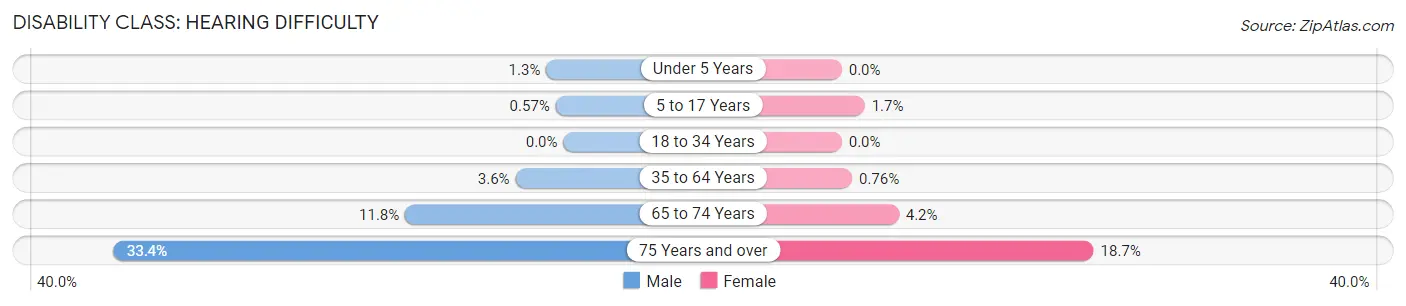
| Age Bracket | Male | Female |
| Under 5 Years | 28 (1.3%) | 0 (0.0%) |
| 5 to 17 Years | 36 (0.6%) | 106 (1.7%) |
| 18 to 34 Years | 0 (0.0%) | 0 (0.0%) |
| 35 to 64 Years | 436 (3.6%) | 90 (0.8%) |
| 65 to 74 Years | 411 (11.7%) | 207 (4.2%) |
| 75 Years and over | 809 (33.4%) | 510 (18.7%) |
Disability Class: Vision Difficulty
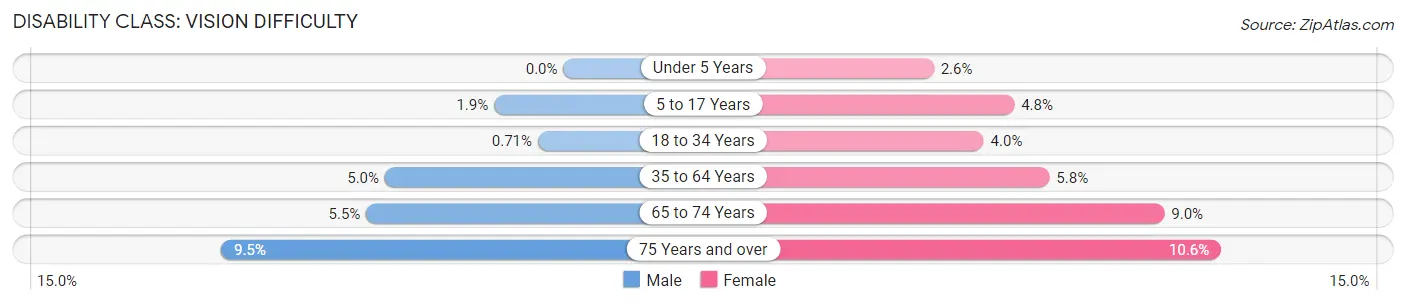
| Age Bracket | Male | Female |
| Under 5 Years | 0 (0.0%) | 44 (2.6%) |
| 5 to 17 Years | 123 (1.9%) | 300 (4.8%) |
| 18 to 34 Years | 52 (0.7%) | 304 (4.0%) |
| 35 to 64 Years | 609 (5.0%) | 688 (5.8%) |
| 65 to 74 Years | 192 (5.5%) | 440 (9.0%) |
| 75 Years and over | 231 (9.5%) | 288 (10.6%) |
Disability Class: Cognitive Difficulty
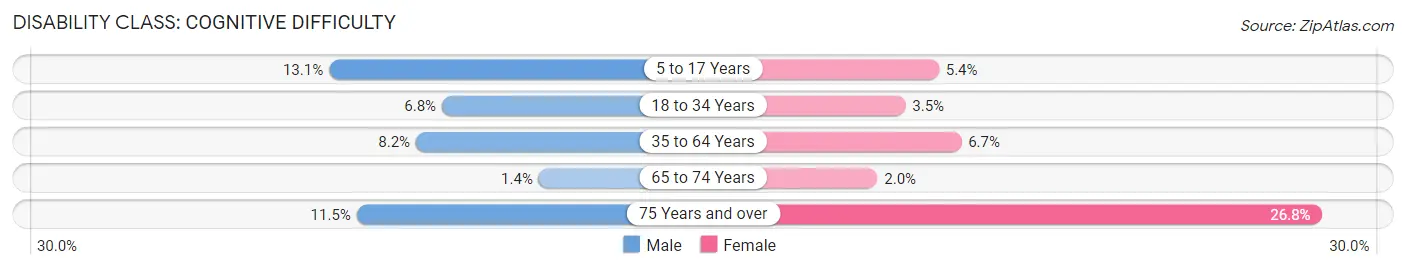
| Age Bracket | Male | Female |
| 5 to 17 Years | 830 (13.1%) | 337 (5.4%) |
| 18 to 34 Years | 497 (6.8%) | 273 (3.5%) |
| 35 to 64 Years | 1,007 (8.2%) | 791 (6.7%) |
| 65 to 74 Years | 48 (1.4%) | 97 (2.0%) |
| 75 Years and over | 279 (11.5%) | 730 (26.8%) |
Disability Class: Ambulatory Difficulty
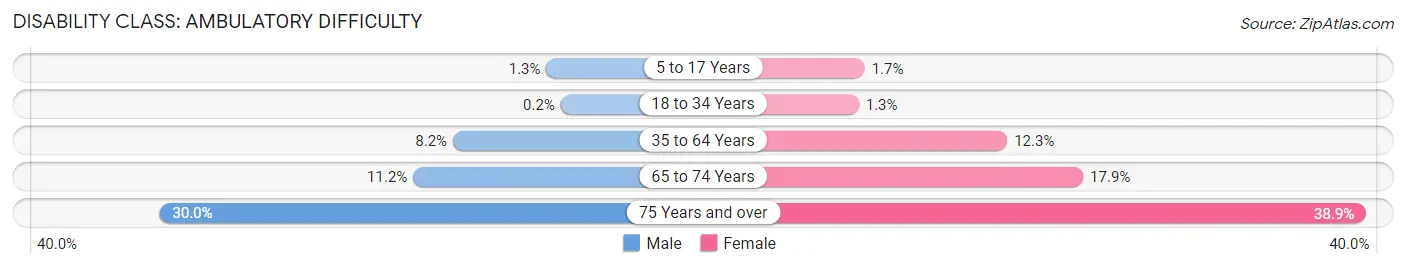
| Age Bracket | Male | Female |
| 5 to 17 Years | 80 (1.3%) | 106 (1.7%) |
| 18 to 34 Years | 15 (0.2%) | 97 (1.3%) |
| 35 to 64 Years | 1,005 (8.2%) | 1,461 (12.3%) |
| 65 to 74 Years | 390 (11.2%) | 878 (17.9%) |
| 75 Years and over | 727 (30.0%) | 1,062 (38.9%) |
Disability Class: Self-Care Difficulty
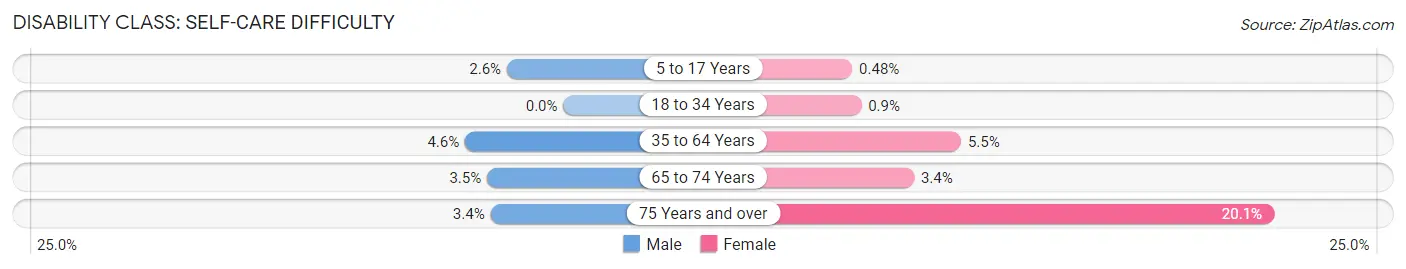
| Age Bracket | Male | Female |
| 5 to 17 Years | 167 (2.6%) | 30 (0.5%) |
| 18 to 34 Years | 0 (0.0%) | 69 (0.9%) |
| 35 to 64 Years | 559 (4.6%) | 658 (5.5%) |
| 65 to 74 Years | 124 (3.5%) | 164 (3.4%) |
| 75 Years and over | 82 (3.4%) | 547 (20.1%) |
Technology Access in Poinciana
Computing Device Access in Poinciana
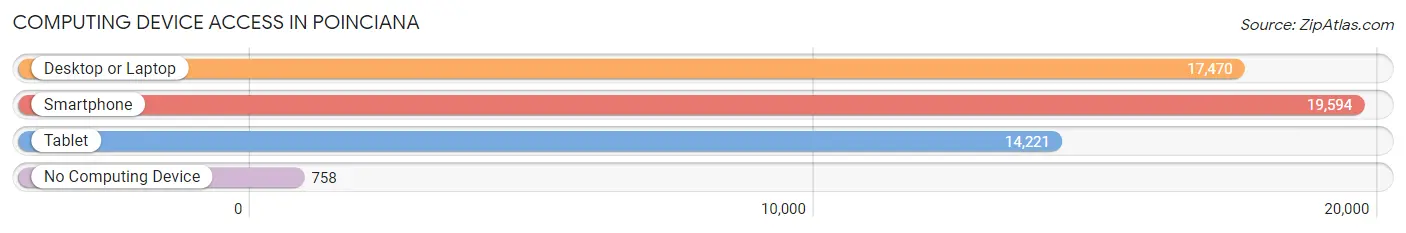
| Device Type | # Households | % Households |
| Desktop or Laptop | 17,470 | 82.1% |
| Smartphone | 19,594 | 92.1% |
| Tablet | 14,221 | 66.8% |
| No Computing Device | 758 | 3.6% |
| Total | 21,284 | 100.0% |
Internet Access in Poinciana
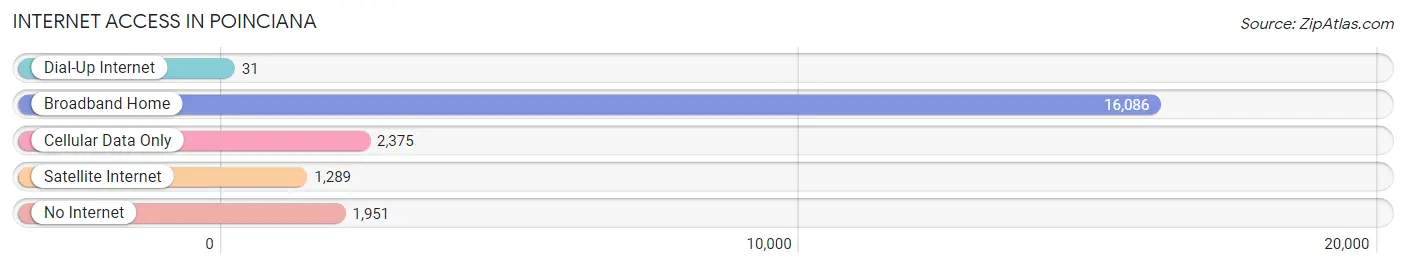
| Internet Type | # Households | % Households |
| Dial-Up Internet | 31 | 0.2% |
| Broadband Home | 16,086 | 75.6% |
| Cellular Data Only | 2,375 | 11.2% |
| Satellite Internet | 1,289 | 6.1% |
| No Internet | 1,951 | 9.2% |
| Total | 21,284 | 100.0% |
Poinciana Summary
Poinciana, FL is a census-designated place (CDP) located in Osceola and Polk counties in the state of Florida. It is part of the Orlando-Kissimmee-Sanford Metropolitan Statistical Area. As of the 2010 census, the population of Poinciana was 53,193.
History
The area that is now Poinciana was originally inhabited by the Timucua Indians. The first European settlers arrived in the area in the late 19th century. The area was originally known as Pleasant Hill, and was later renamed Poinciana after the Poinciana tree, which is native to the area.
In the early 20th century, the area was developed as a citrus grove. In the 1950s, the area was developed as a planned community by the Avco Community Developers. The first homes were built in the late 1960s, and the community was officially incorporated in 1989.
Geography
Poinciana is located at 28°10'25" North, 81°14'45" West (28.173611, -81.245833). It is situated in the central part of Florida, approximately 25 miles south of Orlando and 40 miles east of Tampa.
The total area of Poinciana is approximately 40 square miles, of which 36.7 square miles is land and 3.3 square miles is water. The terrain is mostly flat, with some rolling hills. The area is mostly rural, with some residential and commercial development.
Economy
The economy of Poinciana is largely based on tourism and agriculture. The area is home to several tourist attractions, including Walt Disney World, Universal Studios, and SeaWorld. Agriculture is also an important part of the local economy, with citrus, vegetables, and cattle being the main products.
Demographics
As of the 2010 census, there were 53,193 people, 17,845 households, and 14,845 families residing in Poinciana. The population density was 1,444.3 people per square mile. The racial makeup of the CDP was 64.2% White, 16.3% African American, 0.5% Native American, 1.3% Asian, 0.1% Pacific Islander, 14.7% from other races, and 2.9% from two or more races. Hispanic or Latino of any race were 33.2% of the population.
The median income for a household in Poinciana was $41,945, and the median income for a family was $45,945. The per capita income for the CDP was $17,945. About 17.2% of families and 20.3% of the population were below the poverty line, including 28.3% of those under age 18 and 11.2% of those age 65 or over.
Common Questions
What is Per Capita Income in Poinciana?
Per Capita income in Poinciana is $28,091.
What is the Median Family Income in Poinciana?
Median Family Income in Poinciana is $63,021.
What is the Median Household income in Poinciana?
Median Household Income in Poinciana is $60,928.
What is Income or Wage Gap in Poinciana?
Income or Wage Gap in Poinciana is 11.4%.
Women in Poinciana earn 88.6 cents for every dollar earned by a man.
What is Family Income Deficit in Poinciana?
Family Income Deficit in Poinciana is $9,860.
Families that are below poverty line in Poinciana earn $9,860 less on average than the poverty threshold level.
What is Inequality or Gini Index in Poinciana?
Inequality or Gini Index in Poinciana is 0.41.
What is the Total Population of Poinciana?
Total Population of Poinciana is 69,311.
What is the Total Male Population of Poinciana?
Total Male Population of Poinciana is 34,114.
What is the Total Female Population of Poinciana?
Total Female Population of Poinciana is 35,197.
What is the Ratio of Males per 100 Females in Poinciana?
There are 96.92 Males per 100 Females in Poinciana.
What is the Ratio of Females per 100 Males in Poinciana?
There are 103.17 Females per 100 Males in Poinciana.
What is the Median Population Age in Poinciana?
Median Population Age in Poinciana is 38.7 Years.
What is the Average Family Size in Poinciana
Average Family Size in Poinciana is 3.6 People.
What is the Average Household Size in Poinciana
Average Household Size in Poinciana is 3.2 People.
How Large is the Labor Force in Poinciana?
There are 31,461 People in the Labor Forcein in Poinciana.
What is the Percentage of People in the Labor Force in Poinciana?
56.9% of People are in the Labor Force in Poinciana.
What is the Unemployment Rate in Poinciana?
Unemployment Rate in Poinciana is 4.5%.