Oak Ridge, FL Map & Demographics
Oak Ridge Map
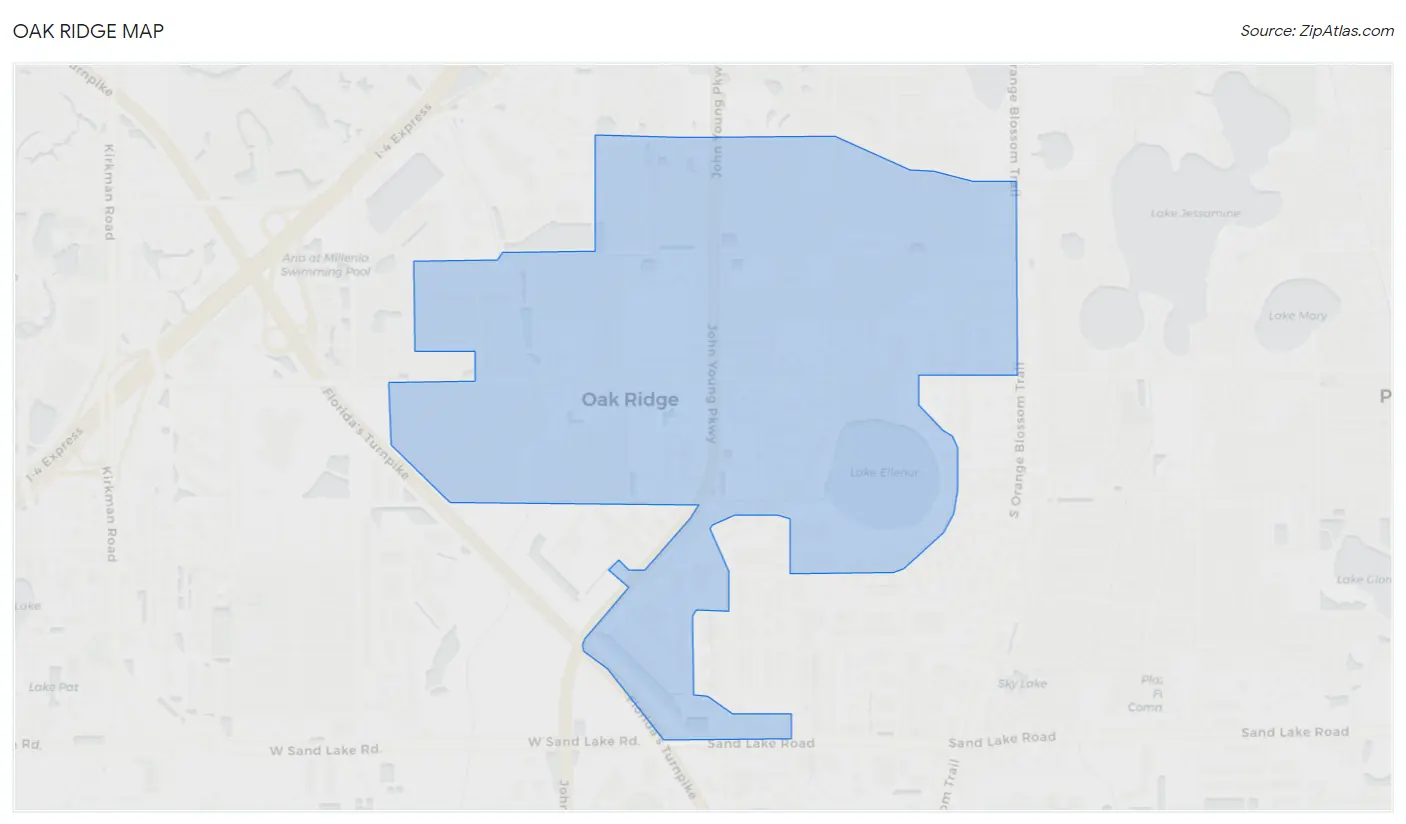
Oak Ridge Overview
$19,189
PER CAPITA INCOME
$46,772
AVG FAMILY INCOME
$50,322
AVG HOUSEHOLD INCOME
7.7%
WAGE / INCOME GAP [ % ]
92.3¢/ $1
WAGE / INCOME GAP [ $ ]
$5,580
FAMILY INCOME DEFICIT
0.35
INEQUALITY / GINI INDEX
24,476
TOTAL POPULATION
13,487
MALE POPULATION
10,989
FEMALE POPULATION
122.73
MALES / 100 FEMALES
81.48
FEMALES / 100 MALES
33.5
MEDIAN AGE
4.2
AVG FAMILY SIZE
3.5
AVG HOUSEHOLD SIZE
13,302
LABOR FORCE [ PEOPLE ]
68.7%
PERCENT IN LABOR FORCE
6.2%
UNEMPLOYMENT RATE
Income in Oak Ridge
Income Overview in Oak Ridge
Per Capita Income in Oak Ridge is $19,189, while median incomes of families and households are $46,772 and $50,322 respectively.
| Characteristic | Number | Measure |
| Per Capita Income | 24,476 | $19,189 |
| Median Family Income | 4,467 | $46,772 |
| Mean Family Income | 4,467 | $58,806 |
| Median Household Income | 7,036 | $50,322 |
| Mean Household Income | 7,036 | $58,550 |
| Income Deficit | 4,467 | $5,580 |
| Wage / Income Gap (%) | 24,476 | 7.69% |
| Wage / Income Gap ($) | 24,476 | 92.31¢ per $1 |
| Gini / Inequality Index | 24,476 | 0.35 |
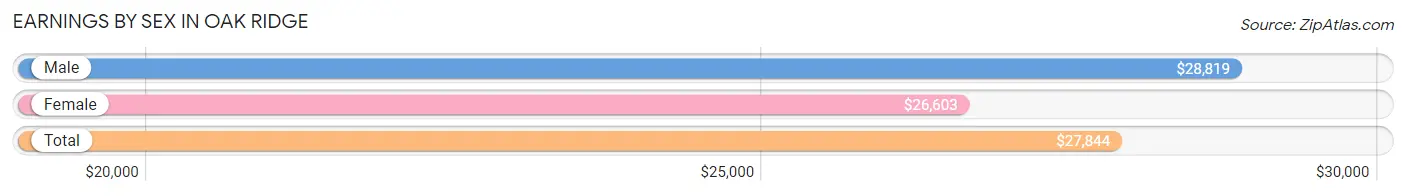
Earnings by Sex in Oak Ridge
Average Earnings in Oak Ridge are $27,844, $28,819 for men and $26,603 for women, a difference of 7.7%.
| Sex | Number | Average Earnings |
| Male | 7,851 (57.3%) | $28,819 |
| Female | 5,850 (42.7%) | $26,603 |
| Total | 13,701 (100.0%) | $27,844 |
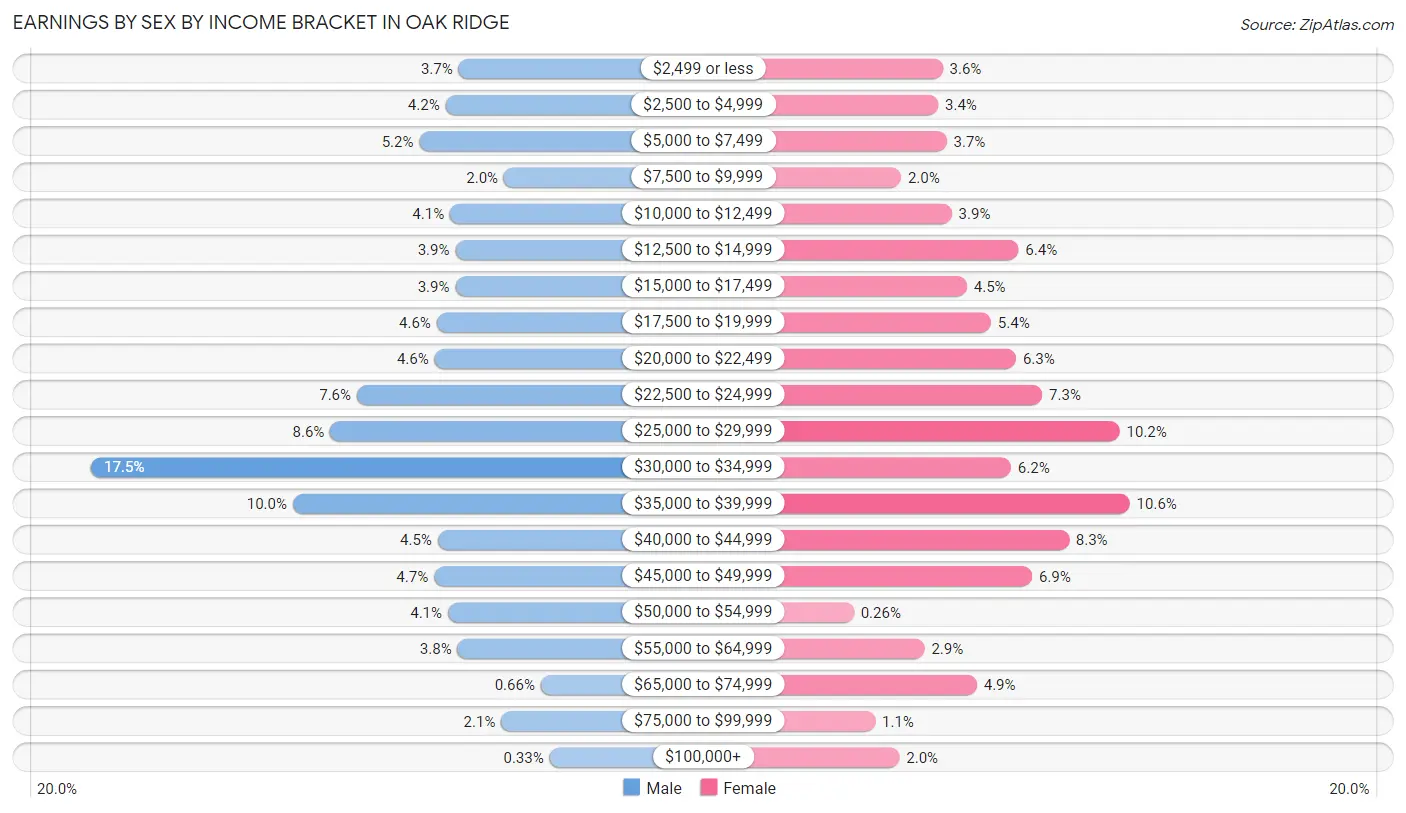
Earnings by Sex by Income Bracket in Oak Ridge
The most common earnings brackets in Oak Ridge are $30,000 to $34,999 for men (1,375 | 17.5%) and $35,000 to $39,999 for women (620 | 10.6%).
| Income | Male | Female |
| $2,499 or less | 294 (3.7%) | 210 (3.6%) |
| $2,500 to $4,999 | 332 (4.2%) | 200 (3.4%) |
| $5,000 to $7,499 | 409 (5.2%) | 219 (3.7%) |
| $7,500 to $9,999 | 160 (2.0%) | 119 (2.0%) |
| $10,000 to $12,499 | 319 (4.1%) | 230 (3.9%) |
| $12,500 to $14,999 | 303 (3.9%) | 376 (6.4%) |
| $15,000 to $17,499 | 303 (3.9%) | 263 (4.5%) |
| $17,500 to $19,999 | 358 (4.6%) | 316 (5.4%) |
| $20,000 to $22,499 | 364 (4.6%) | 371 (6.3%) |
| $22,500 to $24,999 | 593 (7.5%) | 428 (7.3%) |
| $25,000 to $29,999 | 671 (8.6%) | 598 (10.2%) |
| $30,000 to $34,999 | 1,375 (17.5%) | 360 (6.1%) |
| $35,000 to $39,999 | 781 (10.0%) | 620 (10.6%) |
| $40,000 to $44,999 | 355 (4.5%) | 487 (8.3%) |
| $45,000 to $49,999 | 366 (4.7%) | 406 (6.9%) |
| $50,000 to $54,999 | 325 (4.1%) | 15 (0.3%) |
| $55,000 to $64,999 | 297 (3.8%) | 170 (2.9%) |
| $65,000 to $74,999 | 52 (0.7%) | 285 (4.9%) |
| $75,000 to $99,999 | 168 (2.1%) | 62 (1.1%) |
| $100,000+ | 26 (0.3%) | 115 (2.0%) |
| Total | 7,851 (100.0%) | 5,850 (100.0%) |
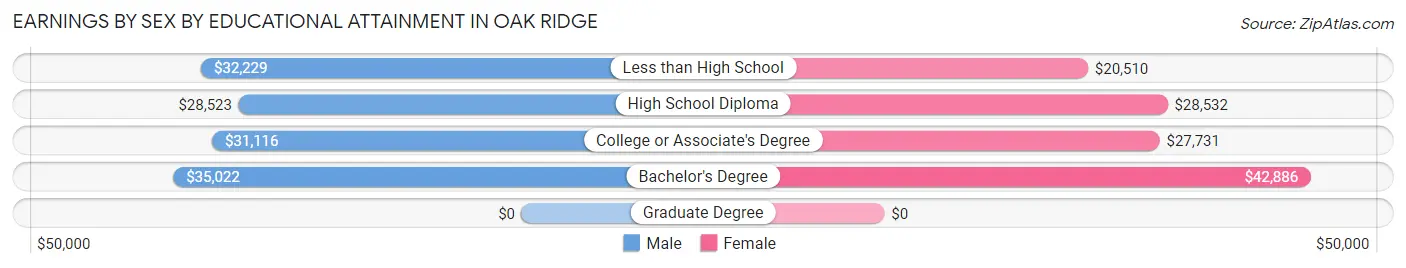
Earnings by Sex by Educational Attainment in Oak Ridge
Average earnings in Oak Ridge are $30,879 for men and $27,542 for women, a difference of 10.8%. Men with an educational attainment of bachelor's degree enjoy the highest average annual earnings of $35,022, while those with high school diploma education earn the least with $28,523. Women with an educational attainment of bachelor's degree earn the most with the average annual earnings of $42,886, while those with less than high school education have the smallest earnings of $20,510.
| Educational Attainment | Male Income | Female Income |
| Less than High School | $32,229 | $20,510 |
| High School Diploma | $28,523 | $28,532 |
| College or Associate's Degree | $31,116 | $27,731 |
| Bachelor's Degree | $35,022 | $42,886 |
| Graduate Degree | - | - |
| Total | $30,879 | $27,542 |
Family Income in Oak Ridge
Family Income Brackets in Oak Ridge
According to the Oak Ridge family income data, there are 1,036 families falling into the $50,000 to $74,999 income range, which is the most common income bracket and makes up 23.2% of all families. Conversely, the $200,000+ income bracket is the least frequent group with only 18 families (0.4%) belonging to this category.
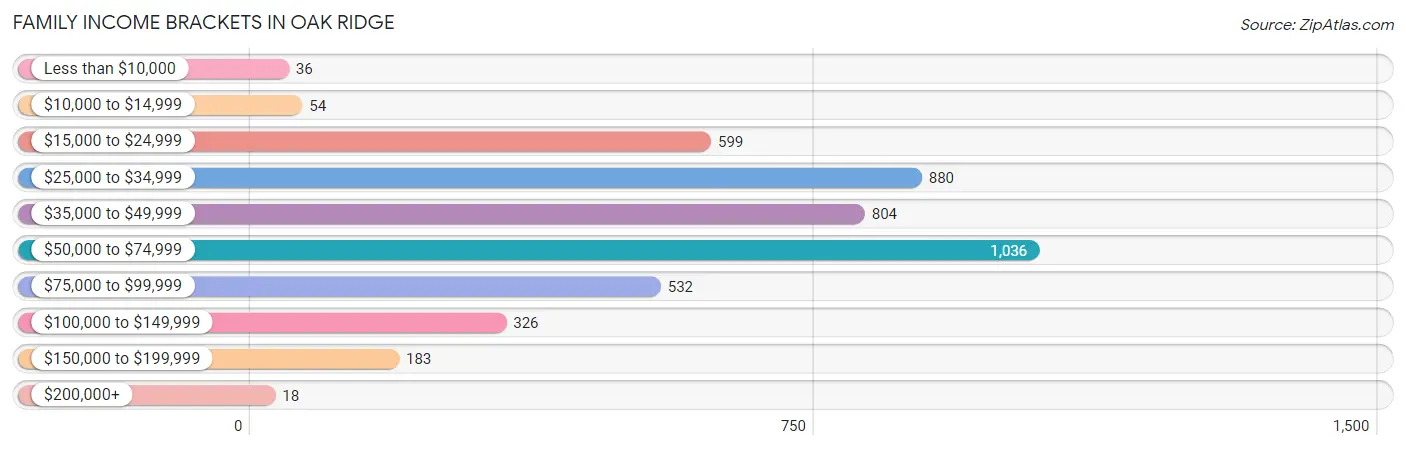
| Income Bracket | # Families | % Families |
| Less than $10,000 | 36 | 0.8% |
| $10,000 to $14,999 | 54 | 1.2% |
| $15,000 to $24,999 | 599 | 13.4% |
| $25,000 to $34,999 | 880 | 19.7% |
| $35,000 to $49,999 | 804 | 18.0% |
| $50,000 to $74,999 | 1,036 | 23.2% |
| $75,000 to $99,999 | 532 | 11.9% |
| $100,000 to $149,999 | 326 | 7.3% |
| $150,000 to $199,999 | 183 | 4.1% |
| $200,000+ | 18 | 0.4% |
Family Income by Famaliy Size in Oak Ridge
6-person families (148 | 3.3%) account for the highest median family income in Oak Ridge with $96,130 per family, while 2-person families (1,544 | 34.6%) have the highest median income of $20,459 per family member.
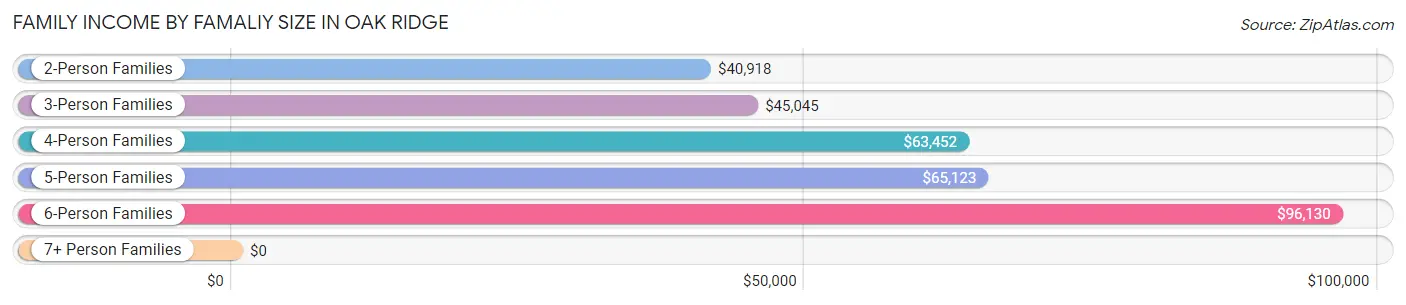
| Income Bracket | # Families | Median Income |
| 2-Person Families | 1,544 (34.6%) | $40,918 |
| 3-Person Families | 926 (20.7%) | $45,045 |
| 4-Person Families | 984 (22.0%) | $63,452 |
| 5-Person Families | 629 (14.1%) | $65,123 |
| 6-Person Families | 148 (3.3%) | $96,130 |
| 7+ Person Families | 236 (5.3%) | $0 |
| Total | 4,467 (100.0%) | $46,772 |
Family Income by Number of Earners in Oak Ridge
The median family income in Oak Ridge is $46,772, with families comprising 3+ earners (906) having the highest median family income of $95,240, while families with no earners (390) have the lowest median family income of $25,938, accounting for 20.3% and 8.7% of families, respectively.
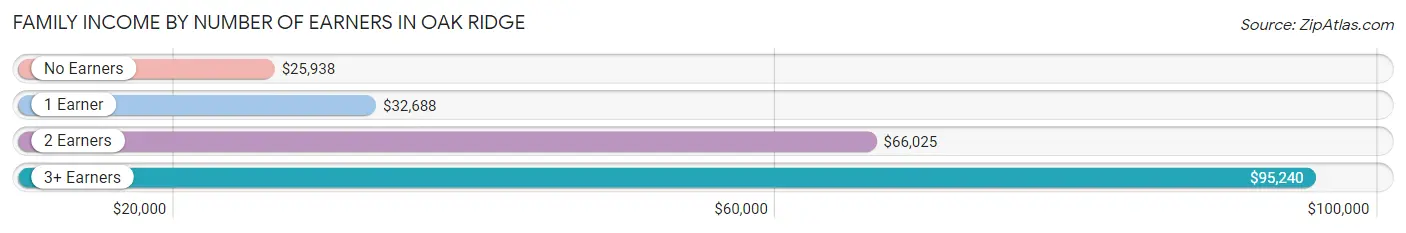
| Number of Earners | # Families | Median Income |
| No Earners | 390 (8.7%) | $25,938 |
| 1 Earner | 1,654 (37.0%) | $32,688 |
| 2 Earners | 1,517 (34.0%) | $66,025 |
| 3+ Earners | 906 (20.3%) | $95,240 |
| Total | 4,467 (100.0%) | $46,772 |
Household Income in Oak Ridge
Household Income Brackets in Oak Ridge
With 1,696 households falling in the category, the $50,000 to $74,999 income range is the most frequent in Oak Ridge, accounting for 24.1% of all households. In contrast, only 14 households (0.2%) fall into the $200,000+ income bracket, making it the least populous group.
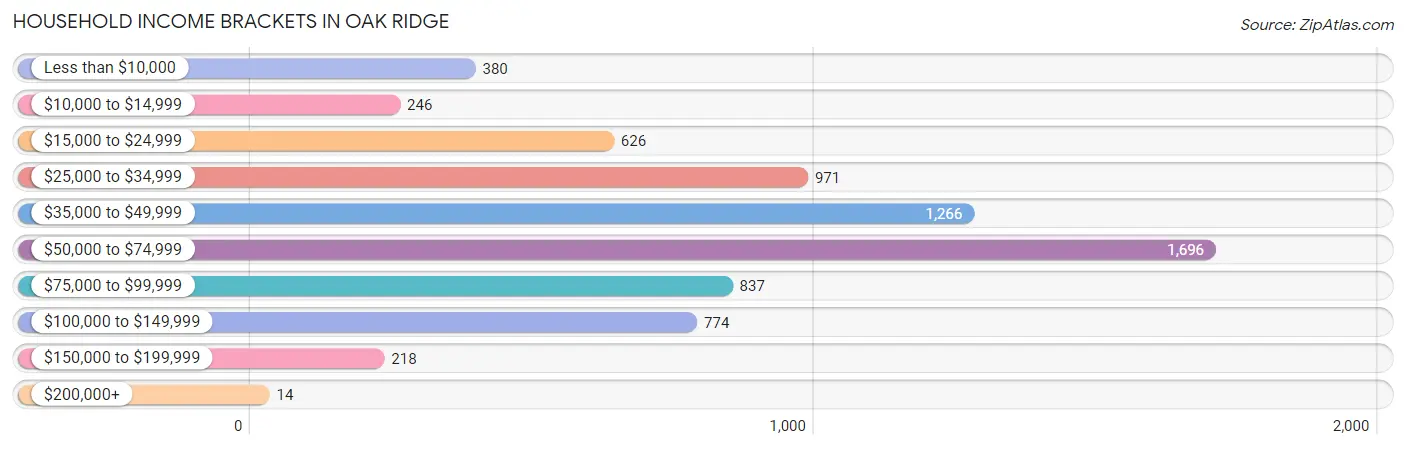
| Income Bracket | # Households | % Households |
| Less than $10,000 | 380 | 5.4% |
| $10,000 to $14,999 | 246 | 3.5% |
| $15,000 to $24,999 | 626 | 8.9% |
| $25,000 to $34,999 | 971 | 13.8% |
| $35,000 to $49,999 | 1,266 | 18.0% |
| $50,000 to $74,999 | 1,696 | 24.1% |
| $75,000 to $99,999 | 837 | 11.9% |
| $100,000 to $149,999 | 774 | 11.0% |
| $150,000 to $199,999 | 218 | 3.1% |
| $200,000+ | 14 | 0.2% |
Household Income by Householder Age in Oak Ridge
The median household income in Oak Ridge is $50,322, with the highest median household income of $61,918 found in the 45 to 64 years age bracket for the primary householder. A total of 2,615 households (37.2%) fall into this category. Meanwhile, the 15 to 24 years age bracket for the primary householder has the lowest median household income of $26,681, with 348 households (5.0%) in this group.
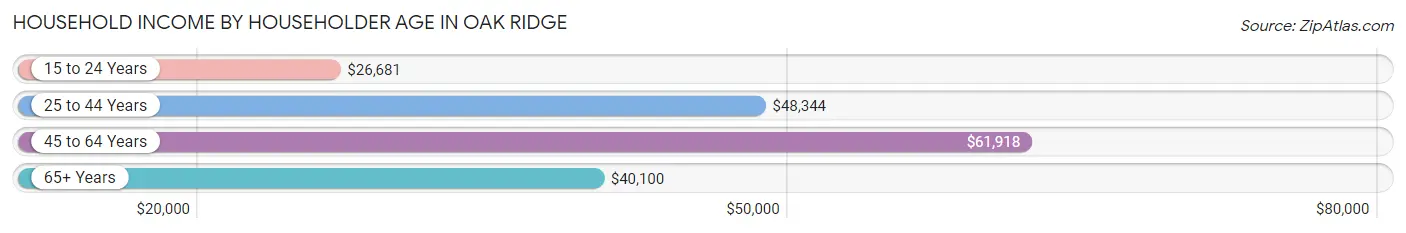
| Income Bracket | # Households | Median Income |
| 15 to 24 Years | 348 (5.0%) | $26,681 |
| 25 to 44 Years | 2,715 (38.6%) | $48,344 |
| 45 to 64 Years | 2,615 (37.2%) | $61,918 |
| 65+ Years | 1,358 (19.3%) | $40,100 |
| Total | 7,036 (100.0%) | $50,322 |
Poverty in Oak Ridge
Income Below Poverty by Sex and Age in Oak Ridge
With 26.1% poverty level for males and 28.5% for females among the residents of Oak Ridge, 6 to 11 year old males and 5 year old females are the most vulnerable to poverty, with 872 males (63.5%) and 59 females (65.6%) in their respective age groups living below the poverty level.
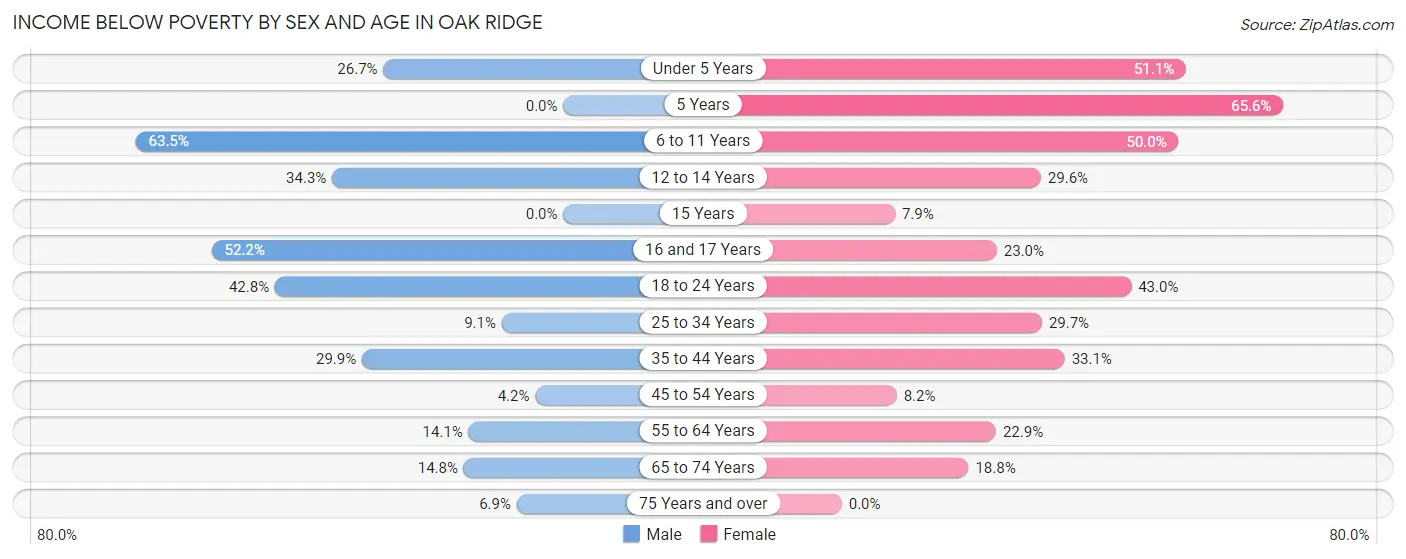
| Age Bracket | Male | Female |
| Under 5 Years | 128 (26.7%) | 316 (51.1%) |
| 5 Years | 0 (0.0%) | 59 (65.6%) |
| 6 to 11 Years | 872 (63.5%) | 386 (50.0%) |
| 12 to 14 Years | 346 (34.3%) | 131 (29.6%) |
| 15 Years | 0 (0.0%) | 3 (7.9%) |
| 16 and 17 Years | 258 (52.2%) | 70 (23.0%) |
| 18 to 24 Years | 695 (42.8%) | 548 (43.0%) |
| 25 to 34 Years | 234 (9.1%) | 535 (29.7%) |
| 35 to 44 Years | 594 (29.9%) | 513 (33.1%) |
| 45 to 54 Years | 58 (4.2%) | 129 (8.2%) |
| 55 to 64 Years | 159 (14.1%) | 278 (22.9%) |
| 65 to 74 Years | 115 (14.8%) | 145 (18.8%) |
| 75 Years and over | 30 (6.9%) | 0 (0.0%) |
| Total | 3,489 (26.1%) | 3,113 (28.5%) |
Income Above Poverty by Sex and Age in Oak Ridge
According to the poverty statistics in Oak Ridge, males aged 5 years and females aged 75 years and over are the age groups that are most secure financially, with 100.0% of males and 100.0% of females in these age groups living above the poverty line.
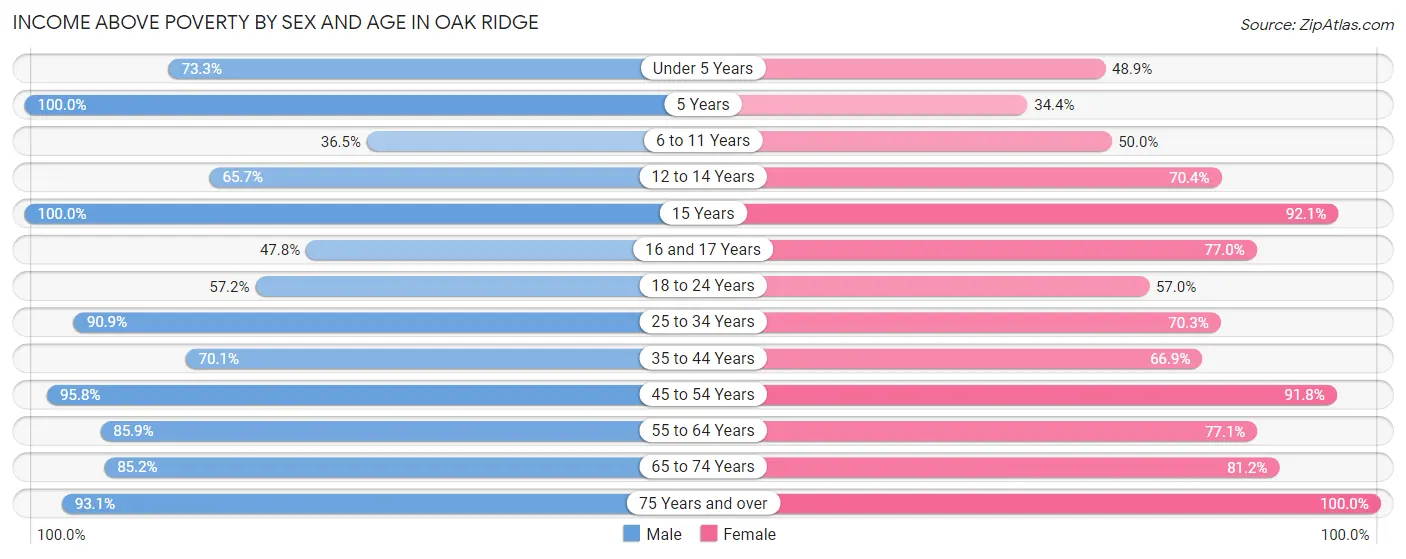
| Age Bracket | Male | Female |
| Under 5 Years | 351 (73.3%) | 302 (48.9%) |
| 5 Years | 53 (100.0%) | 31 (34.4%) |
| 6 to 11 Years | 501 (36.5%) | 386 (50.0%) |
| 12 to 14 Years | 662 (65.7%) | 312 (70.4%) |
| 15 Years | 41 (100.0%) | 35 (92.1%) |
| 16 and 17 Years | 236 (47.8%) | 234 (77.0%) |
| 18 to 24 Years | 928 (57.2%) | 727 (57.0%) |
| 25 to 34 Years | 2,327 (90.9%) | 1,265 (70.3%) |
| 35 to 44 Years | 1,393 (70.1%) | 1,037 (66.9%) |
| 45 to 54 Years | 1,336 (95.8%) | 1,452 (91.8%) |
| 55 to 64 Years | 972 (85.9%) | 936 (77.1%) |
| 65 to 74 Years | 663 (85.2%) | 626 (81.2%) |
| 75 Years and over | 404 (93.1%) | 465 (100.0%) |
| Total | 9,867 (73.9%) | 7,808 (71.5%) |
Income Below Poverty Among Married-Couple Families in Oak Ridge
The poverty statistics for married-couple families in Oak Ridge show that 11.6% or 255 of the total 2,197 families live below the poverty line. Families with 5 or more children have the highest poverty rate of 87.9%, comprising of 87 families. On the other hand, families with no children have the lowest poverty rate of 3.1%, which includes 31 families.
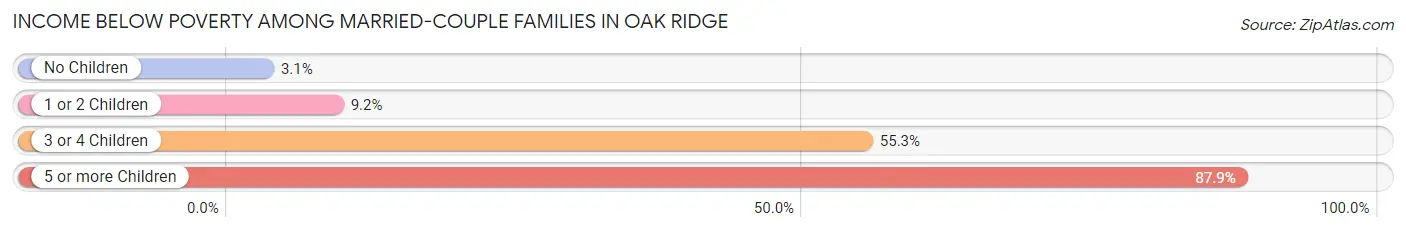
| Children | Above Poverty | Below Poverty |
| No Children | 958 (96.9%) | 31 (3.1%) |
| 1 or 2 Children | 938 (90.8%) | 95 (9.2%) |
| 3 or 4 Children | 34 (44.7%) | 42 (55.3%) |
| 5 or more Children | 12 (12.1%) | 87 (87.9%) |
| Total | 1,942 (88.4%) | 255 (11.6%) |
Income Below Poverty Among Single-Parent Households in Oak Ridge
According to the poverty data in Oak Ridge, 23.0% or 150 single-father households and 30.4% or 492 single-mother households are living below the poverty line. Among single-father households, those with 3 or 4 children have the highest poverty rate, with 32 households (59.3%) experiencing poverty. Likewise, among single-mother households, those with 5 or more children have the highest poverty rate, with 35 households (100.0%) falling below the poverty line.
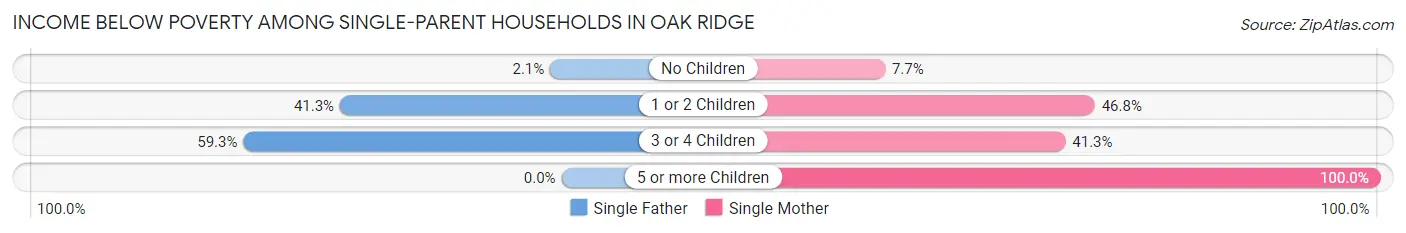
| Children | Single Father | Single Mother |
| No Children | 7 (2.1%) | 54 (7.7%) |
| 1 or 2 Children | 111 (41.3%) | 339 (46.8%) |
| 3 or 4 Children | 32 (59.3%) | 64 (41.3%) |
| 5 or more Children | 0 (0.0%) | 35 (100.0%) |
| Total | 150 (23.0%) | 492 (30.4%) |
Income Below Poverty Among Married-Couple vs Single-Parent Households in Oak Ridge
The poverty data for Oak Ridge shows that 255 of the married-couple family households (11.6%) and 642 of the single-parent households (28.3%) are living below the poverty level. Within the married-couple family households, those with 5 or more children have the highest poverty rate, with 87 households (87.9%) falling below the poverty line. Among the single-parent households, those with 5 or more children have the highest poverty rate, with 35 household (100.0%) living below poverty.
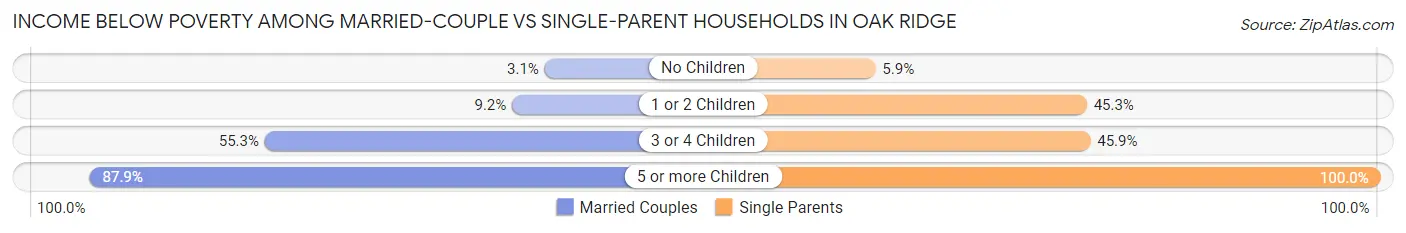
| Children | Married-Couple Families | Single-Parent Households |
| No Children | 31 (3.1%) | 61 (5.9%) |
| 1 or 2 Children | 95 (9.2%) | 450 (45.3%) |
| 3 or 4 Children | 42 (55.3%) | 96 (45.9%) |
| 5 or more Children | 87 (87.9%) | 35 (100.0%) |
| Total | 255 (11.6%) | 642 (28.3%) |
Race in Oak Ridge
The most populous races in Oak Ridge are Hispanic or Latino (12,677 | 51.8%), Black / African American (8,779 | 35.9%), and White / Caucasian (6,993 | 28.6%).
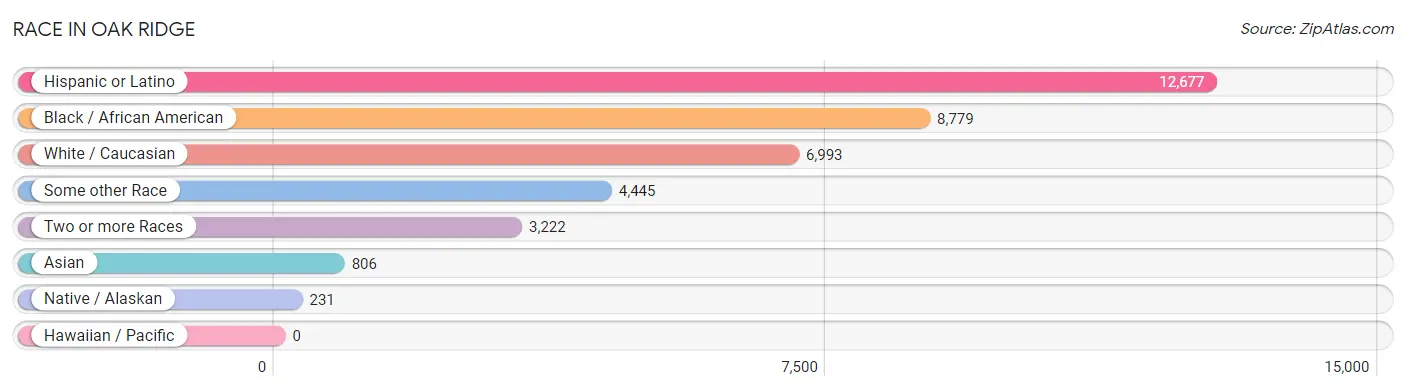
| Race | # Population | % Population |
| Asian | 806 | 3.3% |
| Black / African American | 8,779 | 35.9% |
| Hawaiian / Pacific | 0 | 0.0% |
| Hispanic or Latino | 12,677 | 51.8% |
| Native / Alaskan | 231 | 0.9% |
| White / Caucasian | 6,993 | 28.6% |
| Two or more Races | 3,222 | 13.2% |
| Some other Race | 4,445 | 18.2% |
| Total | 24,476 | 100.0% |
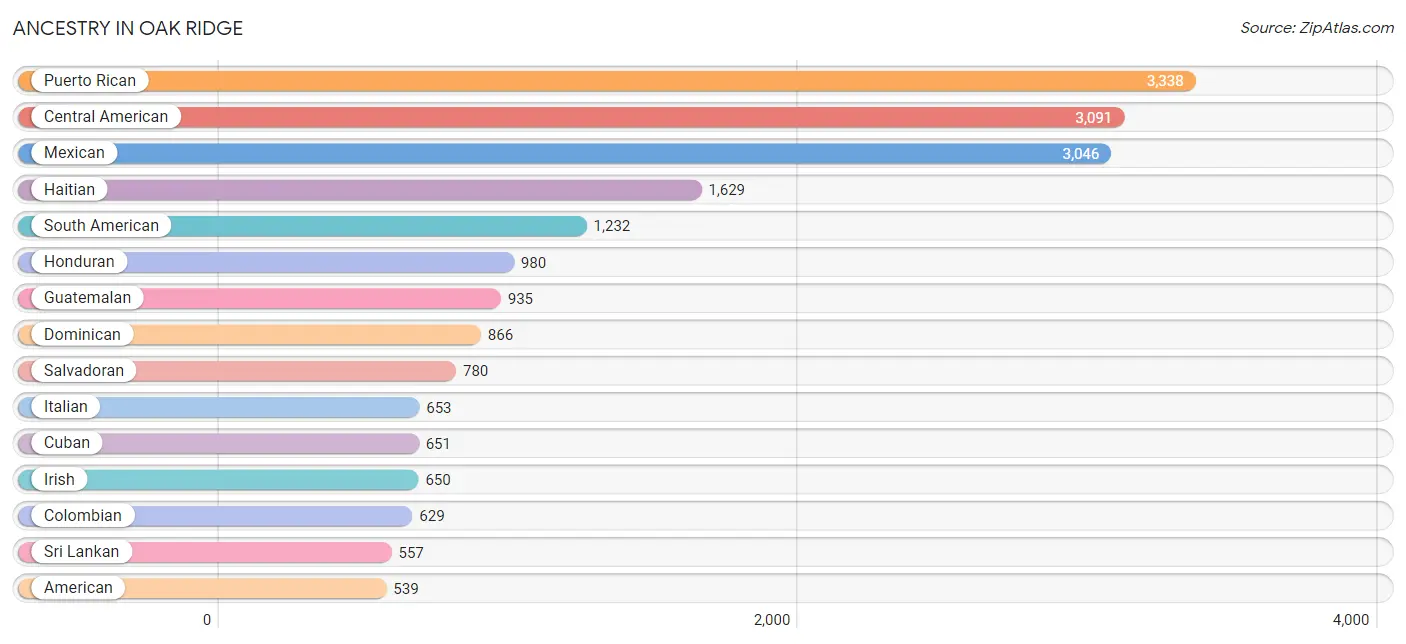
Ancestry in Oak Ridge
The most populous ancestries reported in Oak Ridge are Puerto Rican (3,338 | 13.6%), Central American (3,091 | 12.6%), Mexican (3,046 | 12.4%), Haitian (1,629 | 6.7%), and South American (1,232 | 5.0%), together accounting for 50.4% of all Oak Ridge residents.
| Ancestry | # Population | % Population |
| African | 204 | 0.8% |
| American | 539 | 2.2% |
| Arab | 76 | 0.3% |
| Austrian | 15 | 0.1% |
| Bahamian | 253 | 1.0% |
| Barbadian | 21 | 0.1% |
| Brazilian | 212 | 0.9% |
| British | 78 | 0.3% |
| British West Indian | 8 | 0.0% |
| Central American | 3,091 | 12.6% |
| Central American Indian | 26 | 0.1% |
| Chilean | 14 | 0.1% |
| Chippewa | 16 | 0.1% |
| Choctaw | 42 | 0.2% |
| Colombian | 629 | 2.6% |
| Costa Rican | 14 | 0.1% |
| Cuban | 651 | 2.7% |
| Dominican | 866 | 3.5% |
| Ecuadorian | 236 | 1.0% |
| English | 257 | 1.1% |
| Estonian | 9 | 0.0% |
| European | 21 | 0.1% |
| German | 428 | 1.8% |
| Guamanian / Chamorro | 73 | 0.3% |
| Guatemalan | 935 | 3.8% |
| Guyanese | 91 | 0.4% |
| Haitian | 1,629 | 6.7% |
| Honduran | 980 | 4.0% |
| Hungarian | 11 | 0.0% |
| Irish | 650 | 2.7% |
| Italian | 653 | 2.7% |
| Jamaican | 88 | 0.4% |
| Japanese | 22 | 0.1% |
| Korean | 124 | 0.5% |
| Malaysian | 51 | 0.2% |
| Mexican | 3,046 | 12.4% |
| Mexican American Indian | 167 | 0.7% |
| Moroccan | 76 | 0.3% |
| Nicaraguan | 340 | 1.4% |
| Norwegian | 8 | 0.0% |
| Panamanian | 42 | 0.2% |
| Peruvian | 114 | 0.5% |
| Polish | 126 | 0.5% |
| Portuguese | 34 | 0.1% |
| Puerto Rican | 3,338 | 13.6% |
| Russian | 39 | 0.2% |
| Salvadoran | 780 | 3.2% |
| Scottish | 4 | 0.0% |
| Slovak | 9 | 0.0% |
| South American | 1,232 | 5.0% |
| South American Indian | 28 | 0.1% |
| Sri Lankan | 557 | 2.3% |
| Subsaharan African | 369 | 1.5% |
| Thai | 151 | 0.6% |
| Trinidadian and Tobagonian | 57 | 0.2% |
| U.S. Virgin Islander | 128 | 0.5% |
| Venezuelan | 239 | 1.0% |
| West Indian | 89 | 0.4% | View All 58 Rows |
Immigrants in Oak Ridge
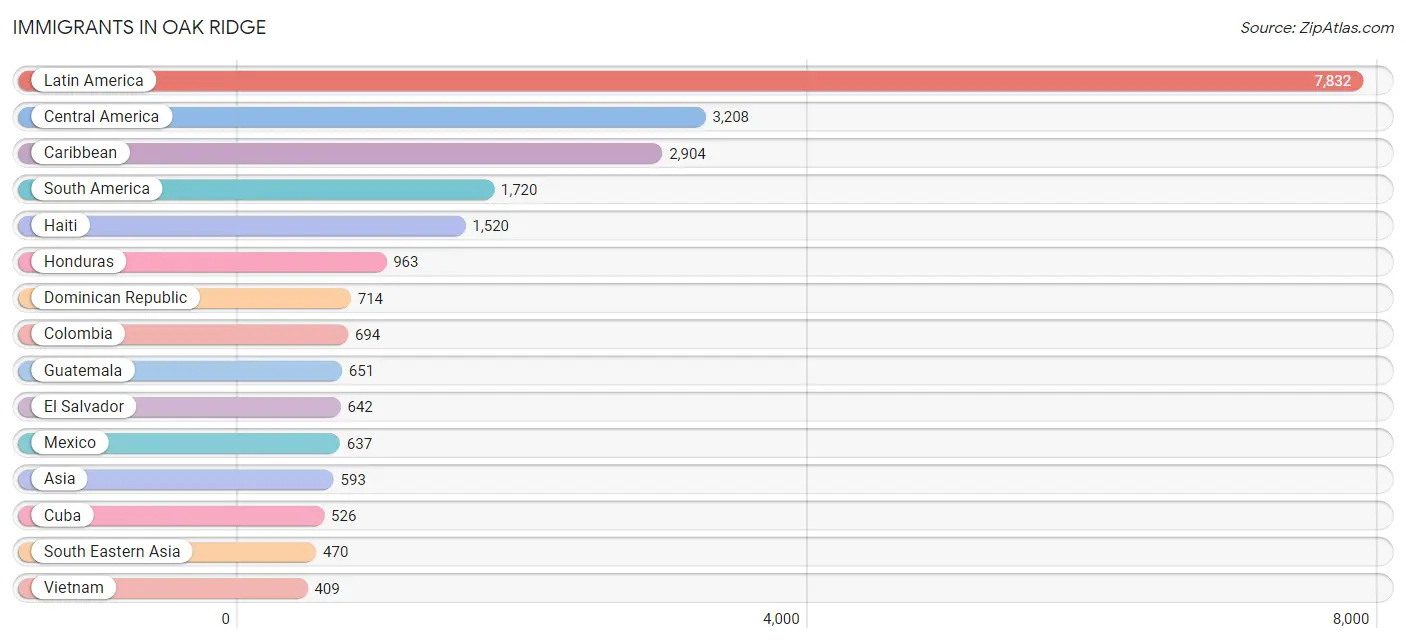
The most numerous immigrant groups reported in Oak Ridge came from Latin America (7,832 | 32.0%), Central America (3,208 | 13.1%), Caribbean (2,904 | 11.9%), South America (1,720 | 7.0%), and Haiti (1,520 | 6.2%), together accounting for 70.2% of all Oak Ridge residents.
| Immigration Origin | # Population | % Population |
| Africa | 327 | 1.3% |
| Argentina | 54 | 0.2% |
| Asia | 593 | 2.4% |
| Azores | 19 | 0.1% |
| Bahamas | 48 | 0.2% |
| Bangladesh | 34 | 0.1% |
| Brazil | 113 | 0.5% |
| Canada | 37 | 0.2% |
| Caribbean | 2,904 | 11.9% |
| Central America | 3,208 | 13.1% |
| Chile | 14 | 0.1% |
| Colombia | 694 | 2.8% |
| Costa Rica | 14 | 0.1% |
| Cuba | 526 | 2.1% |
| Dominican Republic | 714 | 2.9% |
| Eastern Africa | 150 | 0.6% |
| Eastern Europe | 46 | 0.2% |
| Ecuador | 212 | 0.9% |
| El Salvador | 642 | 2.6% |
| Europe | 65 | 0.3% |
| Guatemala | 651 | 2.7% |
| Guyana | 229 | 0.9% |
| Haiti | 1,520 | 6.2% |
| Honduras | 963 | 3.9% |
| India | 26 | 0.1% |
| Jamaica | 88 | 0.4% |
| Latin America | 7,832 | 32.0% |
| Lebanon | 12 | 0.1% |
| Mexico | 637 | 2.6% |
| Middle Africa | 93 | 0.4% |
| Morocco | 69 | 0.3% |
| Nicaragua | 270 | 1.1% |
| Northern Africa | 69 | 0.3% |
| Panama | 31 | 0.1% |
| Peru | 114 | 0.5% |
| Philippines | 61 | 0.3% |
| Portugal | 19 | 0.1% |
| Russia | 46 | 0.2% |
| South America | 1,720 | 7.0% |
| South Central Asia | 60 | 0.3% |
| South Eastern Asia | 470 | 1.9% |
| Southern Europe | 19 | 0.1% |
| Venezuela | 290 | 1.2% |
| Vietnam | 409 | 1.7% |
| Western Africa | 15 | 0.1% |
| Western Asia | 12 | 0.1% |
| Zaire | 93 | 0.4% | View All 47 Rows |
Sex and Age in Oak Ridge
Sex and Age in Oak Ridge
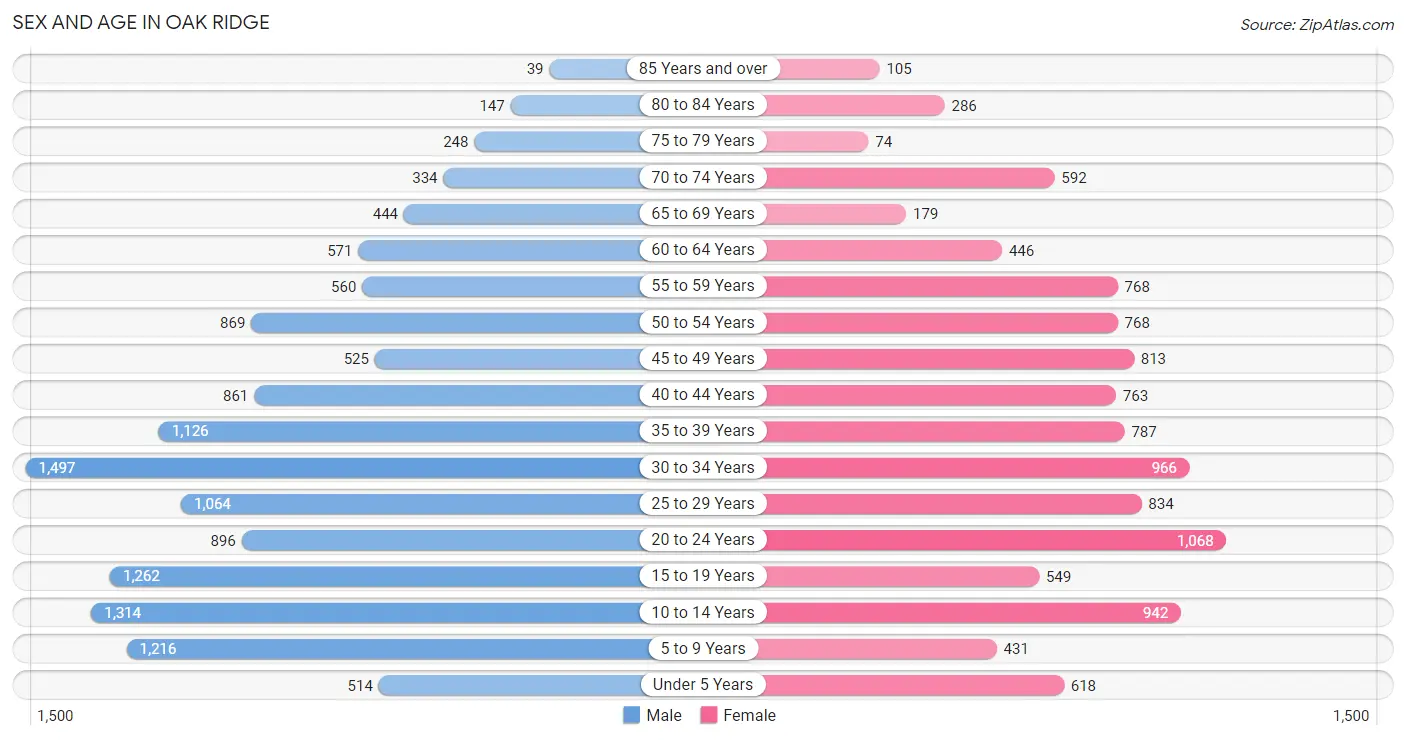
The most populous age groups in Oak Ridge are 30 to 34 Years (1,497 | 11.1%) for men and 20 to 24 Years (1,068 | 9.7%) for women.
| Age Bracket | Male | Female |
| Under 5 Years | 514 (3.8%) | 618 (5.6%) |
| 5 to 9 Years | 1,216 (9.0%) | 431 (3.9%) |
| 10 to 14 Years | 1,314 (9.7%) | 942 (8.6%) |
| 15 to 19 Years | 1,262 (9.4%) | 549 (5.0%) |
| 20 to 24 Years | 896 (6.6%) | 1,068 (9.7%) |
| 25 to 29 Years | 1,064 (7.9%) | 834 (7.6%) |
| 30 to 34 Years | 1,497 (11.1%) | 966 (8.8%) |
| 35 to 39 Years | 1,126 (8.4%) | 787 (7.2%) |
| 40 to 44 Years | 861 (6.4%) | 763 (6.9%) |
| 45 to 49 Years | 525 (3.9%) | 813 (7.4%) |
| 50 to 54 Years | 869 (6.4%) | 768 (7.0%) |
| 55 to 59 Years | 560 (4.2%) | 768 (7.0%) |
| 60 to 64 Years | 571 (4.2%) | 446 (4.1%) |
| 65 to 69 Years | 444 (3.3%) | 179 (1.6%) |
| 70 to 74 Years | 334 (2.5%) | 592 (5.4%) |
| 75 to 79 Years | 248 (1.8%) | 74 (0.7%) |
| 80 to 84 Years | 147 (1.1%) | 286 (2.6%) |
| 85 Years and over | 39 (0.3%) | 105 (1.0%) |
| Total | 13,487 (100.0%) | 10,989 (100.0%) |
Families and Households in Oak Ridge
Median Family Size in Oak Ridge
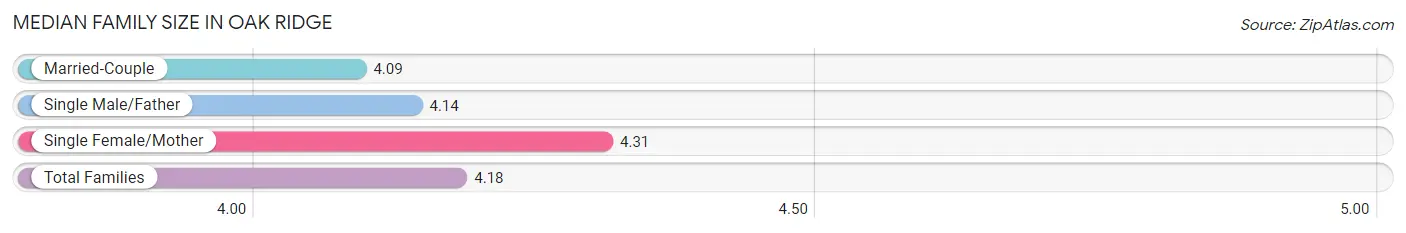
The median family size in Oak Ridge is 4.18 persons per family, with single female/mother families (1,617 | 36.2%) accounting for the largest median family size of 4.31 persons per family. On the other hand, married-couple families (2,197 | 49.2%) represent the smallest median family size with 4.09 persons per family.
| Family Type | # Families | Family Size |
| Married-Couple | 2,197 (49.2%) | 4.09 |
| Single Male/Father | 653 (14.6%) | 4.14 |
| Single Female/Mother | 1,617 (36.2%) | 4.31 |
| Total Families | 4,467 (100.0%) | 4.18 |
Median Household Size in Oak Ridge
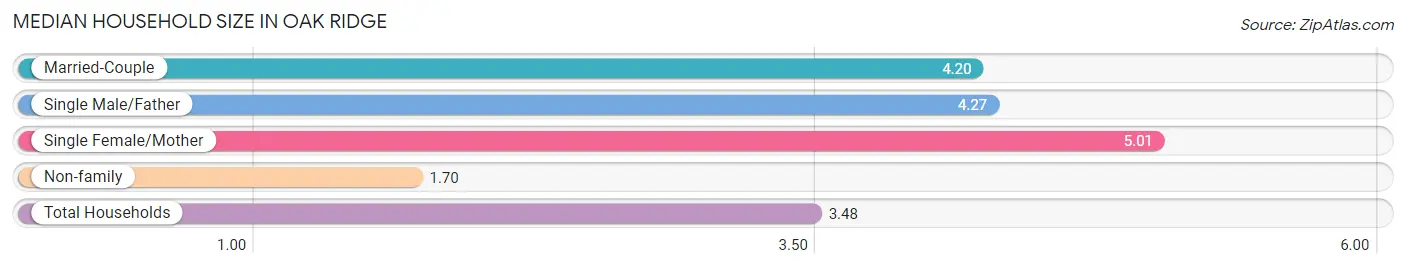
The median household size in Oak Ridge is 3.48 persons per household, with single female/mother households (1,617 | 23.0%) accounting for the largest median household size of 5.01 persons per household. non-family households (2,569 | 36.5%) represent the smallest median household size with 1.70 persons per household.
| Household Type | # Households | Household Size |
| Married-Couple | 2,197 (31.2%) | 4.20 |
| Single Male/Father | 653 (9.3%) | 4.27 |
| Single Female/Mother | 1,617 (23.0%) | 5.01 |
| Non-family | 2,569 (36.5%) | 1.70 |
| Total Households | 7,036 (100.0%) | 3.48 |
Household Size by Marriage Status in Oak Ridge
Out of a total of 7,036 households in Oak Ridge, 4,467 (63.5%) are family households, while 2,569 (36.5%) are nonfamily households. The most numerous type of family households are 2-person households, comprising 1,301, and the most common type of nonfamily households are 1-person households, comprising 1,682.
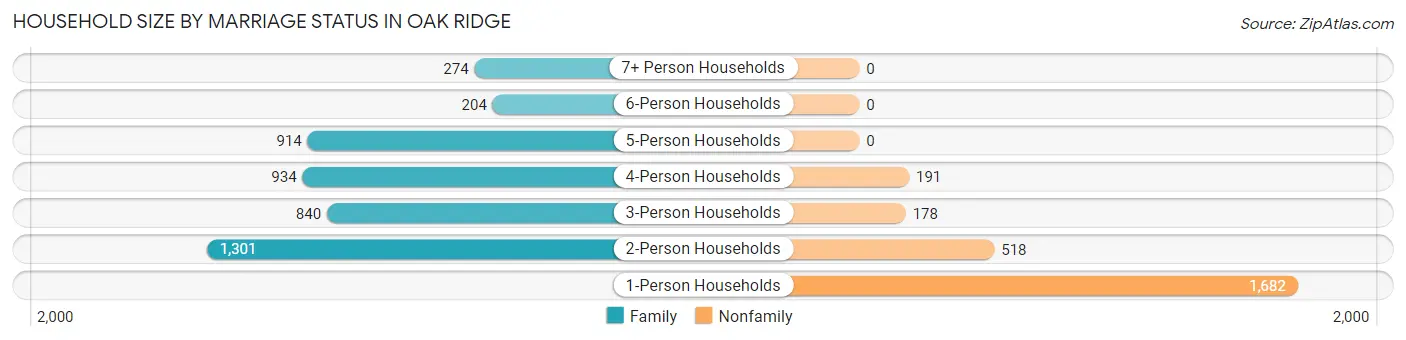
| Household Size | Family Households | Nonfamily Households |
| 1-Person Households | - | 1,682 (23.9%) |
| 2-Person Households | 1,301 (18.5%) | 518 (7.4%) |
| 3-Person Households | 840 (11.9%) | 178 (2.5%) |
| 4-Person Households | 934 (13.3%) | 191 (2.7%) |
| 5-Person Households | 914 (13.0%) | 0 (0.0%) |
| 6-Person Households | 204 (2.9%) | 0 (0.0%) |
| 7+ Person Households | 274 (3.9%) | 0 (0.0%) |
| Total | 4,467 (63.5%) | 2,569 (36.5%) |
Female Fertility in Oak Ridge
Fertility by Age in Oak Ridge
Average fertility rate in Oak Ridge is 50.0 births per 1,000 women. Women in the age bracket of 20 to 34 years have the highest fertility rate with 77.0 births per 1,000 women. Women in the age bracket of 20 to 34 years acount for 75.3% of all women with births.
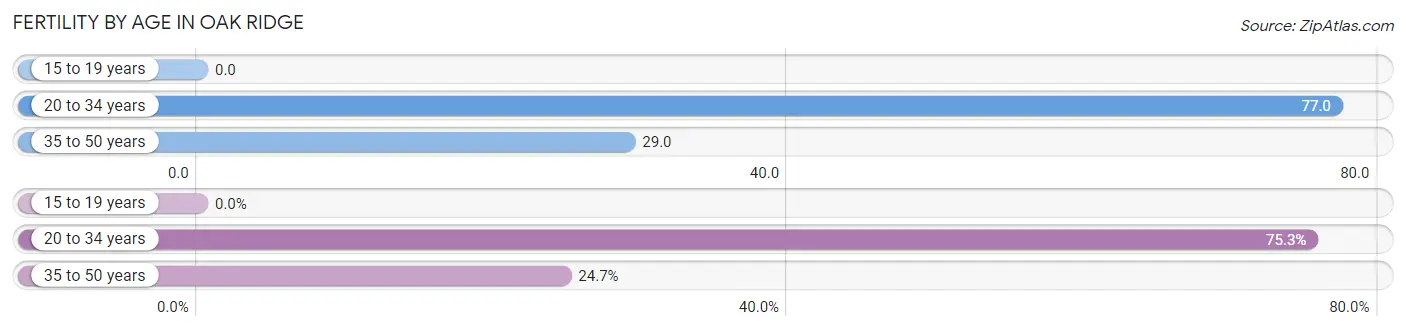
| Age Bracket | Women with Births | Births / 1,000 Women |
| 15 to 19 years | 0 (0.0%) | 0.0 |
| 20 to 34 years | 220 (75.3%) | 77.0 |
| 35 to 50 years | 72 (24.7%) | 29.0 |
| Total | 292 (100.0%) | 50.0 |
Fertility by Age by Marriage Status in Oak Ridge
55.8% of women with births (292) in Oak Ridge are married. The highest percentage of unmarried women with births falls into 35 to 50 years age bracket with 59.7% of them unmarried at the time of birth, while the lowest percentage of unmarried women with births belong to 20 to 34 years age bracket with 39.1% of them unmarried.
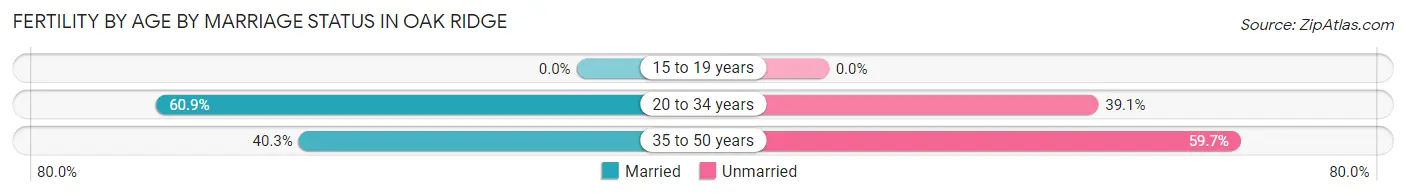
| Age Bracket | Married | Unmarried |
| 15 to 19 years | 0 (0.0%) | 0 (0.0%) |
| 20 to 34 years | 134 (60.9%) | 86 (39.1%) |
| 35 to 50 years | 29 (40.3%) | 43 (59.7%) |
| Total | 163 (55.8%) | 129 (44.2%) |
Fertility by Education in Oak Ridge
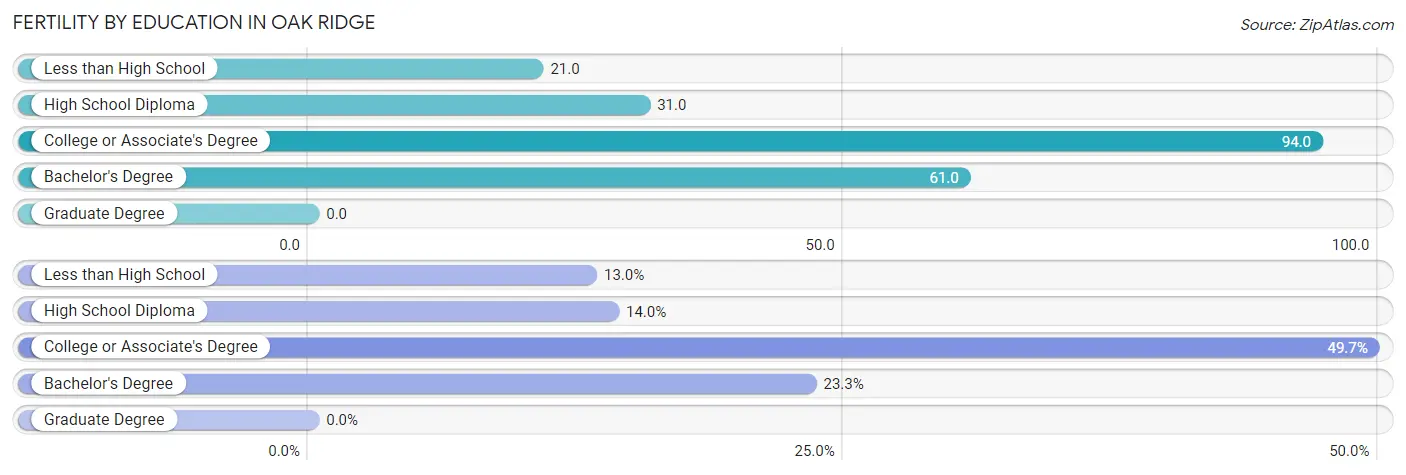
| Educational Attainment | Women with Births | Births / 1,000 Women |
| Less than High School | 38 (13.0%) | 21.0 |
| High School Diploma | 41 (14.0%) | 31.0 |
| College or Associate's Degree | 145 (49.7%) | 94.0 |
| Bachelor's Degree | 68 (23.3%) | 61.0 |
| Graduate Degree | 0 (0.0%) | 0.0 |
| Total | 292 (100.0%) | 50.0 |
Fertility by Education by Marriage Status in Oak Ridge
44.2% of women with births in Oak Ridge are unmarried. Women with the educational attainment of bachelor's degree are most likely to be married with 100.0% of them married at childbirth, while women with the educational attainment of college or associate's degree are least likely to be married with 70.3% of them unmarried at childbirth.
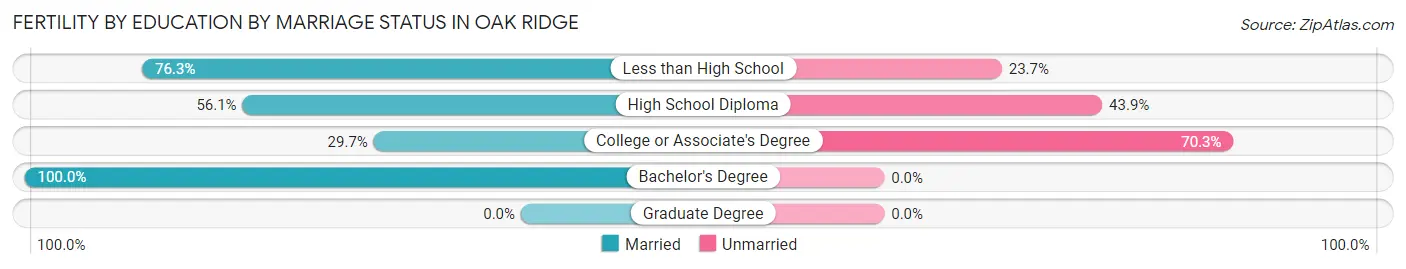
| Educational Attainment | Married | Unmarried |
| Less than High School | 29 (76.3%) | 9 (23.7%) |
| High School Diploma | 23 (56.1%) | 18 (43.9%) |
| College or Associate's Degree | 43 (29.7%) | 102 (70.3%) |
| Bachelor's Degree | 68 (100.0%) | 0 (0.0%) |
| Graduate Degree | 0 (0.0%) | 0 (0.0%) |
| Total | 163 (55.8%) | 129 (44.2%) |
Employment Characteristics in Oak Ridge
Employment by Class of Employer in Oak Ridge
Among the 12,145 employed individuals in Oak Ridge, private company employees (9,433 | 77.7%), not-for-profit organizations (987 | 8.1%), and self-employed (not incorporated) (756 | 6.2%) make up the most common classes of employment.
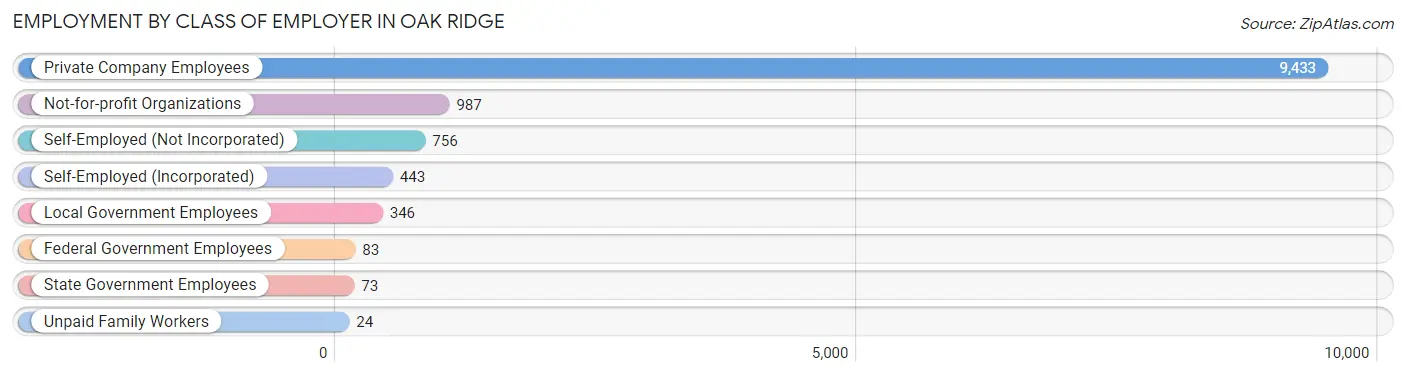
| Employer Class | # Employees | % Employees |
| Private Company Employees | 9,433 | 77.7% |
| Self-Employed (Incorporated) | 443 | 3.6% |
| Self-Employed (Not Incorporated) | 756 | 6.2% |
| Not-for-profit Organizations | 987 | 8.1% |
| Local Government Employees | 346 | 2.9% |
| State Government Employees | 73 | 0.6% |
| Federal Government Employees | 83 | 0.7% |
| Unpaid Family Workers | 24 | 0.2% |
| Total | 12,145 | 100.0% |
Employment Status by Age in Oak Ridge
According to the labor force statistics for Oak Ridge, out of the total population over 16 years of age (19,362), 68.7% or 13,302 individuals are in the labor force, with 6.2% or 825 of them unemployed. The age group with the highest labor force participation rate is 30 to 34 years, with 89.6% or 2,207 individuals in the labor force. Within the labor force, the 20 to 24 years age range has the highest percentage of unemployed individuals, with 12.0% or 170 of them being unemployed.
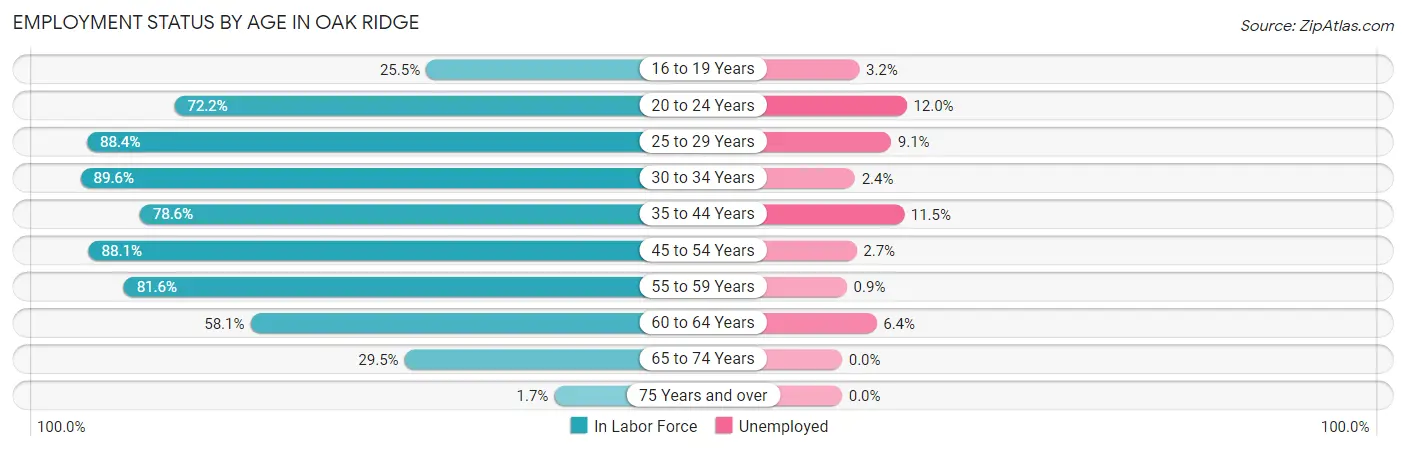
| Age Bracket | In Labor Force | Unemployed |
| 16 to 19 Years | 442 (25.5%) | 14 (3.2%) |
| 20 to 24 Years | 1,418 (72.2%) | 170 (12.0%) |
| 25 to 29 Years | 1,678 (88.4%) | 153 (9.1%) |
| 30 to 34 Years | 2,207 (89.6%) | 53 (2.4%) |
| 35 to 44 Years | 2,780 (78.6%) | 320 (11.5%) |
| 45 to 54 Years | 2,621 (88.1%) | 71 (2.7%) |
| 55 to 59 Years | 1,084 (81.6%) | 10 (0.9%) |
| 60 to 64 Years | 591 (58.1%) | 38 (6.4%) |
| 65 to 74 Years | 457 (29.5%) | 0 (0.0%) |
| 75 Years and over | 15 (1.7%) | 0 (0.0%) |
| Total | 13,302 (68.7%) | 825 (6.2%) |
Employment Status by Educational Attainment in Oak Ridge
According to labor force statistics for Oak Ridge, 82.9% of individuals (10,958) out of the total population between 25 and 64 years of age (13,218) are in the labor force, with 5.9% or 647 of them being unemployed. The group with the highest labor force participation rate are those with the educational attainment of college / associate degree, with 85.8% or 2,929 individuals in the labor force. Within the labor force, individuals with college / associate degree education have the highest percentage of unemployment, with 8.1% or 237 of them being unemployed.
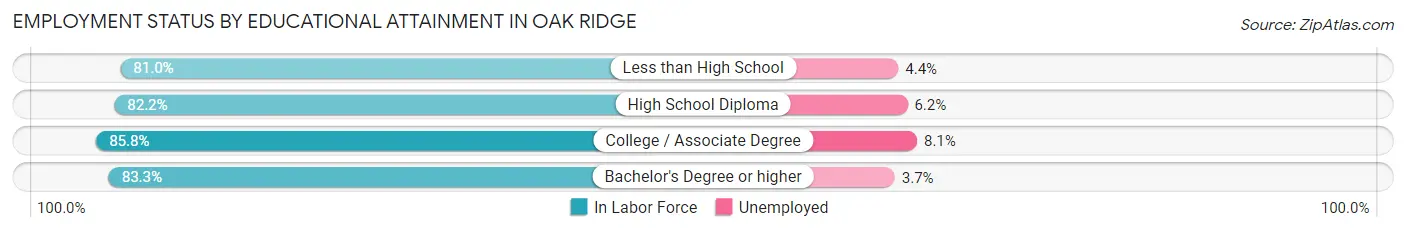
| Educational Attainment | In Labor Force | Unemployed |
| Less than High School | 2,956 (81.0%) | 161 (4.4%) |
| High School Diploma | 3,534 (82.2%) | 267 (6.2%) |
| College / Associate Degree | 2,929 (85.8%) | 277 (8.1%) |
| Bachelor's Degree or higher | 1,545 (83.3%) | 69 (3.7%) |
| Total | 10,958 (82.9%) | 780 (5.9%) |
Employment Occupations by Sex in Oak Ridge
Management, Business, Science and Arts Occupations
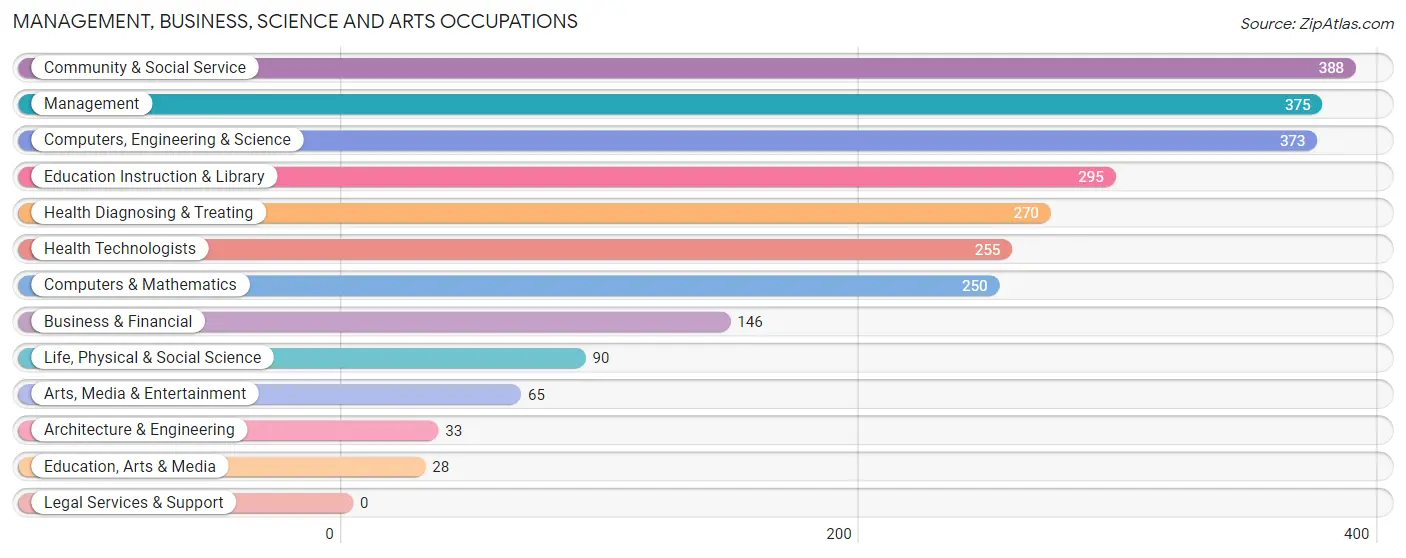
The most common Management, Business, Science and Arts occupations in Oak Ridge are Community & Social Service (388 | 3.1%), Management (375 | 3.0%), Computers, Engineering & Science (373 | 3.0%), Education Instruction & Library (295 | 2.4%), and Health Diagnosing & Treating (270 | 2.2%).
Management, Business, Science and Arts Occupations by Sex
Within the Management, Business, Science and Arts occupations in Oak Ridge, the most male-oriented occupations are Architecture & Engineering (100.0%), Arts, Media & Entertainment (86.2%), and Life, Physical & Social Science (74.4%), while the most female-oriented occupations are Education, Arts & Media (100.0%), Health Technologists (93.7%), and Education Instruction & Library (92.2%).
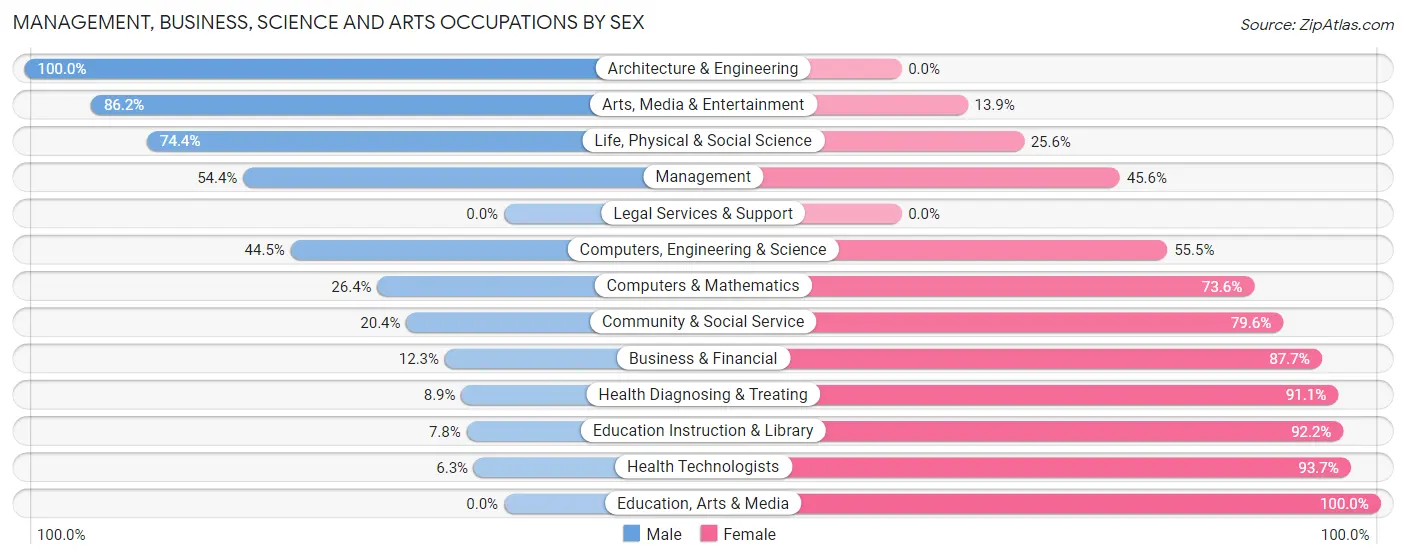
| Occupation | Male | Female |
| Management | 204 (54.4%) | 171 (45.6%) |
| Business & Financial | 18 (12.3%) | 128 (87.7%) |
| Computers, Engineering & Science | 166 (44.5%) | 207 (55.5%) |
| Computers & Mathematics | 66 (26.4%) | 184 (73.6%) |
| Architecture & Engineering | 33 (100.0%) | 0 (0.0%) |
| Life, Physical & Social Science | 67 (74.4%) | 23 (25.6%) |
| Community & Social Service | 79 (20.4%) | 309 (79.6%) |
| Education, Arts & Media | 0 (0.0%) | 28 (100.0%) |
| Legal Services & Support | 0 (0.0%) | 0 (0.0%) |
| Education Instruction & Library | 23 (7.8%) | 272 (92.2%) |
| Arts, Media & Entertainment | 56 (86.2%) | 9 (13.9%) |
| Health Diagnosing & Treating | 24 (8.9%) | 246 (91.1%) |
| Health Technologists | 16 (6.3%) | 239 (93.7%) |
| Total (Category) | 491 (31.6%) | 1,061 (68.4%) |
| Total (Overall) | 7,378 (59.2%) | 5,087 (40.8%) |
Services Occupations
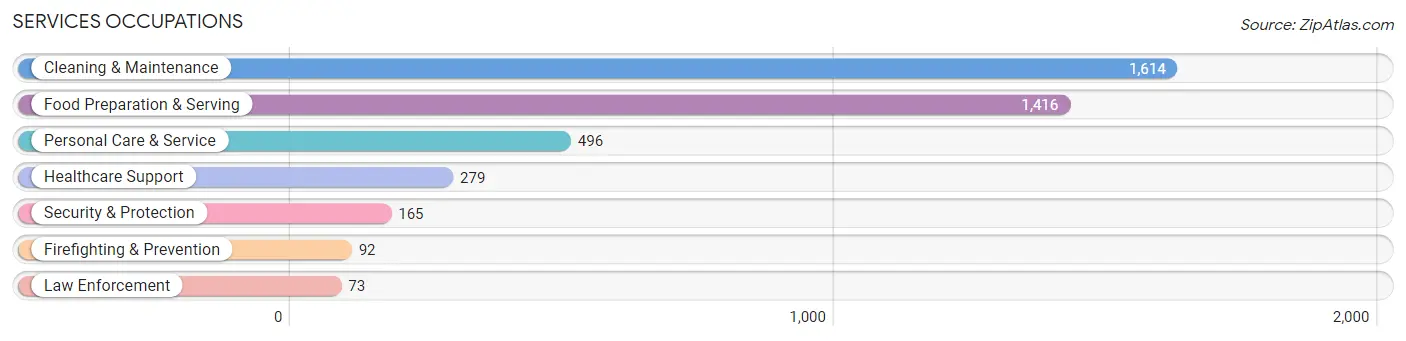
The most common Services occupations in Oak Ridge are Cleaning & Maintenance (1,614 | 13.0%), Food Preparation & Serving (1,416 | 11.4%), Personal Care & Service (496 | 4.0%), Healthcare Support (279 | 2.2%), and Security & Protection (165 | 1.3%).
Services Occupations by Sex
Within the Services occupations in Oak Ridge, the most male-oriented occupations are Security & Protection (100.0%), Firefighting & Prevention (100.0%), and Law Enforcement (100.0%), while the most female-oriented occupations are Personal Care & Service (89.5%), Healthcare Support (69.2%), and Cleaning & Maintenance (48.6%).
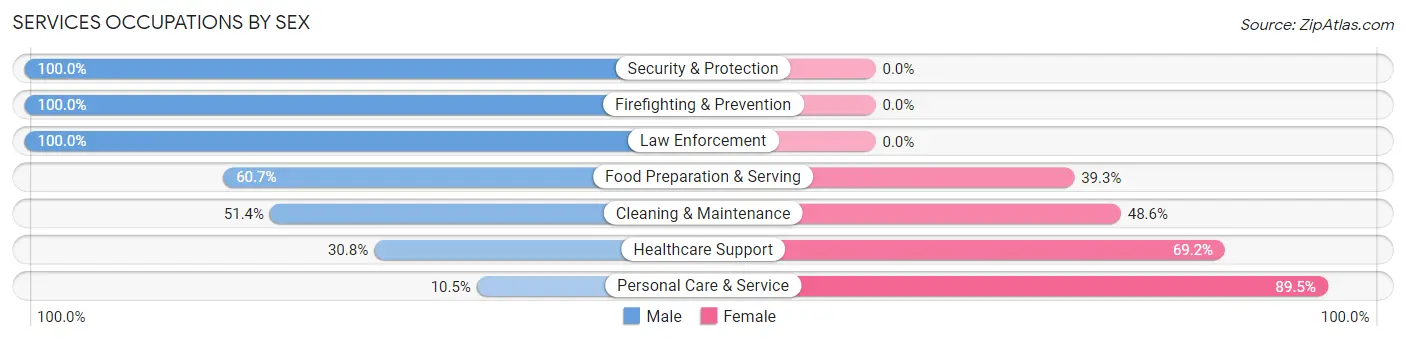
| Occupation | Male | Female |
| Healthcare Support | 86 (30.8%) | 193 (69.2%) |
| Security & Protection | 165 (100.0%) | 0 (0.0%) |
| Firefighting & Prevention | 92 (100.0%) | 0 (0.0%) |
| Law Enforcement | 73 (100.0%) | 0 (0.0%) |
| Food Preparation & Serving | 859 (60.7%) | 557 (39.3%) |
| Cleaning & Maintenance | 830 (51.4%) | 784 (48.6%) |
| Personal Care & Service | 52 (10.5%) | 444 (89.5%) |
| Total (Category) | 1,992 (50.2%) | 1,978 (49.8%) |
| Total (Overall) | 7,378 (59.2%) | 5,087 (40.8%) |
Sales and Office Occupations
The most common Sales and Office occupations in Oak Ridge are Sales & Related (1,335 | 10.7%), and Office & Administration (1,122 | 9.0%).

Sales and Office Occupations by Sex

| Occupation | Male | Female |
| Sales & Related | 641 (48.0%) | 694 (52.0%) |
| Office & Administration | 340 (30.3%) | 782 (69.7%) |
| Total (Category) | 981 (39.9%) | 1,476 (60.1%) |
| Total (Overall) | 7,378 (59.2%) | 5,087 (40.8%) |
Natural Resources, Construction and Maintenance Occupations
The most common Natural Resources, Construction and Maintenance occupations in Oak Ridge are Construction & Extraction (1,753 | 14.1%), Installation, Maintenance & Repair (766 | 6.1%), and Farming, Fishing & Forestry (149 | 1.2%).
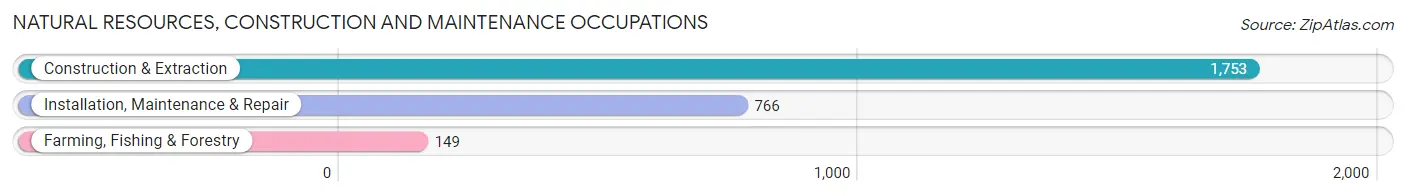
Natural Resources, Construction and Maintenance Occupations by Sex

| Occupation | Male | Female |
| Farming, Fishing & Forestry | 149 (100.0%) | 0 (0.0%) |
| Construction & Extraction | 1,649 (94.1%) | 104 (5.9%) |
| Installation, Maintenance & Repair | 766 (100.0%) | 0 (0.0%) |
| Total (Category) | 2,564 (96.1%) | 104 (3.9%) |
| Total (Overall) | 7,378 (59.2%) | 5,087 (40.8%) |
Production, Transportation and Moving Occupations
The most common Production, Transportation and Moving occupations in Oak Ridge are Material Moving (844 | 6.8%), Transportation (558 | 4.5%), and Production (416 | 3.3%).
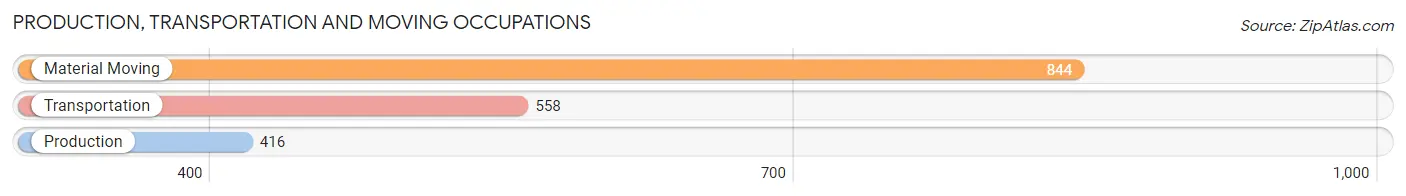
Production, Transportation and Moving Occupations by Sex
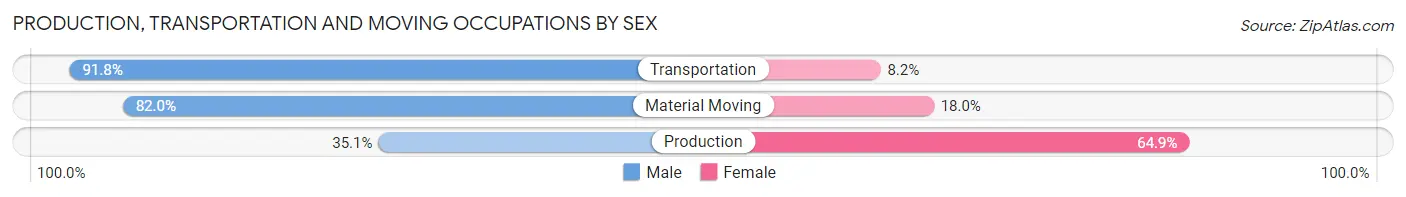
| Occupation | Male | Female |
| Production | 146 (35.1%) | 270 (64.9%) |
| Transportation | 512 (91.8%) | 46 (8.2%) |
| Material Moving | 692 (82.0%) | 152 (18.0%) |
| Total (Category) | 1,350 (74.3%) | 468 (25.7%) |
| Total (Overall) | 7,378 (59.2%) | 5,087 (40.8%) |
Employment Industries by Sex in Oak Ridge
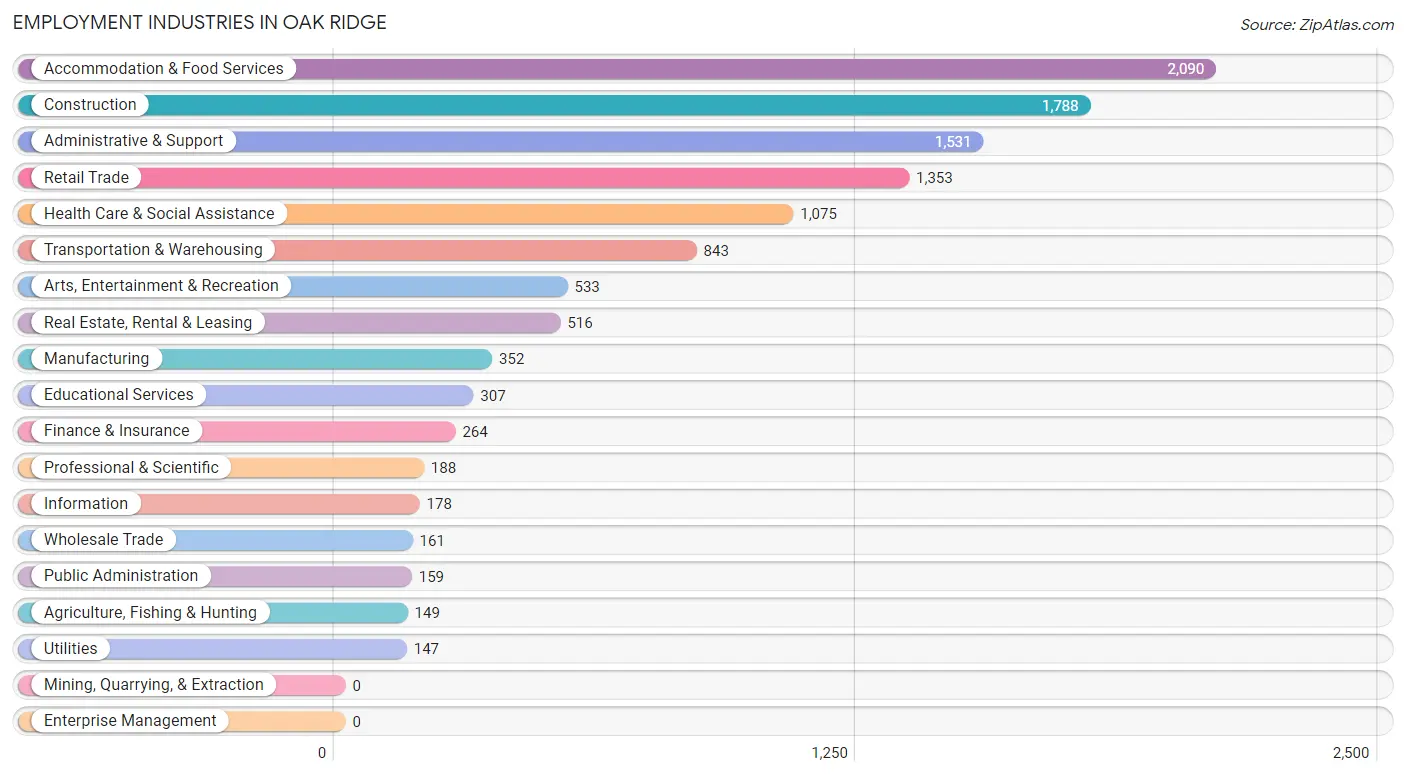
Employment Industries in Oak Ridge
The major employment industries in Oak Ridge include Accommodation & Food Services (2,090 | 16.8%), Construction (1,788 | 14.3%), Administrative & Support (1,531 | 12.3%), Retail Trade (1,353 | 10.8%), and Health Care & Social Assistance (1,075 | 8.6%).
Employment Industries by Sex in Oak Ridge
The Oak Ridge industries that see more men than women are Agriculture, Fishing & Hunting (100.0%), Wholesale Trade (100.0%), and Construction (93.1%), whereas the industries that tend to have a higher number of women are Educational Services (84.0%), Finance & Insurance (75.8%), and Health Care & Social Assistance (63.7%).
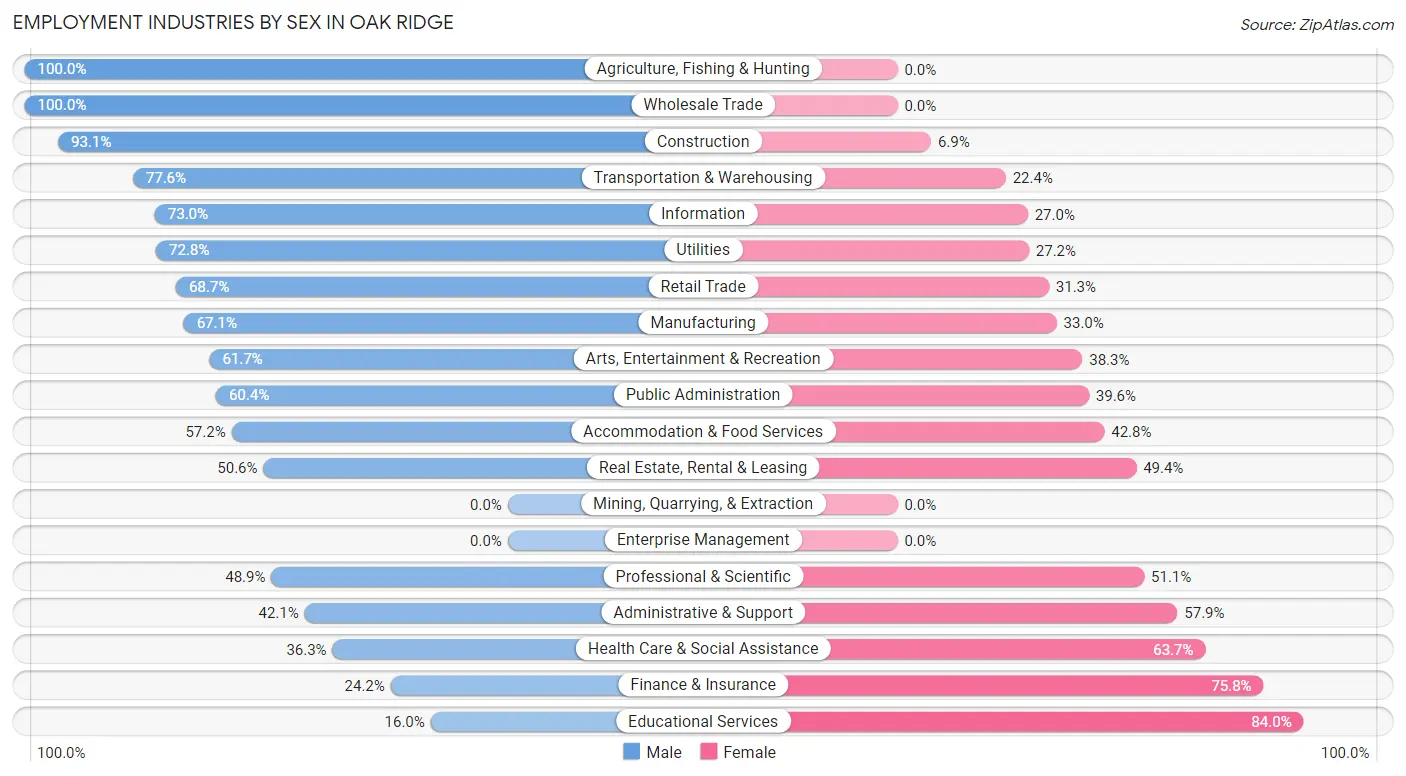
| Industry | Male | Female |
| Agriculture, Fishing & Hunting | 149 (100.0%) | 0 (0.0%) |
| Mining, Quarrying, & Extraction | 0 (0.0%) | 0 (0.0%) |
| Construction | 1,664 (93.1%) | 124 (6.9%) |
| Manufacturing | 236 (67.0%) | 116 (33.0%) |
| Wholesale Trade | 161 (100.0%) | 0 (0.0%) |
| Retail Trade | 929 (68.7%) | 424 (31.3%) |
| Transportation & Warehousing | 654 (77.6%) | 189 (22.4%) |
| Utilities | 107 (72.8%) | 40 (27.2%) |
| Information | 130 (73.0%) | 48 (27.0%) |
| Finance & Insurance | 64 (24.2%) | 200 (75.8%) |
| Real Estate, Rental & Leasing | 261 (50.6%) | 255 (49.4%) |
| Professional & Scientific | 92 (48.9%) | 96 (51.1%) |
| Enterprise Management | 0 (0.0%) | 0 (0.0%) |
| Administrative & Support | 644 (42.1%) | 887 (57.9%) |
| Educational Services | 49 (16.0%) | 258 (84.0%) |
| Health Care & Social Assistance | 390 (36.3%) | 685 (63.7%) |
| Arts, Entertainment & Recreation | 329 (61.7%) | 204 (38.3%) |
| Accommodation & Food Services | 1,195 (57.2%) | 895 (42.8%) |
| Public Administration | 96 (60.4%) | 63 (39.6%) |
| Total | 7,378 (59.2%) | 5,087 (40.8%) |
Education in Oak Ridge
School Enrollment in Oak Ridge
The most common levels of schooling among the 7,134 students in Oak Ridge are middle school (1,841 | 25.8%), high school (1,590 | 22.3%), and elementary school (1,431 | 20.1%).
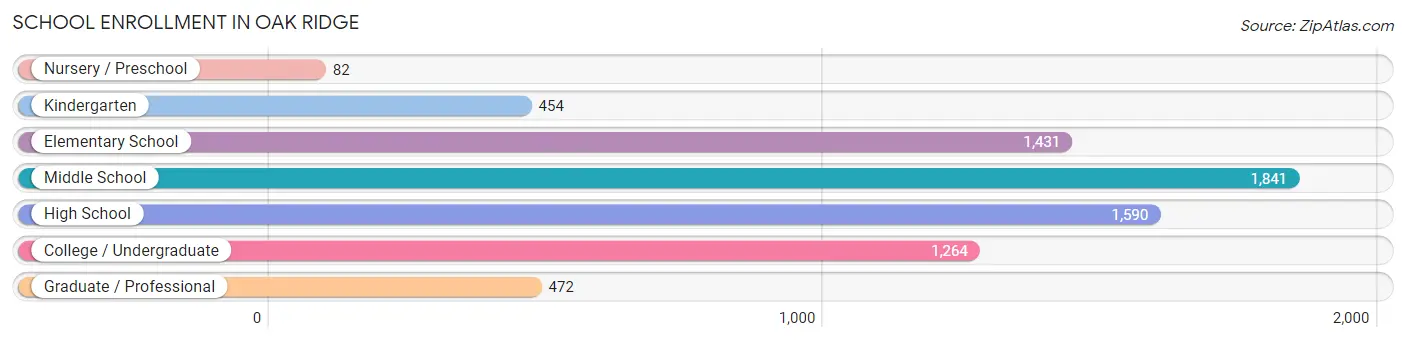
| School Level | # Students | % Students |
| Nursery / Preschool | 82 | 1.1% |
| Kindergarten | 454 | 6.4% |
| Elementary School | 1,431 | 20.1% |
| Middle School | 1,841 | 25.8% |
| High School | 1,590 | 22.3% |
| College / Undergraduate | 1,264 | 17.7% |
| Graduate / Professional | 472 | 6.6% |
| Total | 7,134 | 100.0% |
School Enrollment by Age by Funding Source in Oak Ridge
Out of a total of 7,134 students who are enrolled in schools in Oak Ridge, 1,199 (16.8%) attend a private institution, while the remaining 5,935 (83.2%) are enrolled in public schools. The age group of 20 to 24 year olds has the highest likelihood of being enrolled in private schools, with 445 (54.4% in the age bracket) enrolled. Conversely, the age group of 3 to 4 year olds has the lowest likelihood of being enrolled in a private school, with 174 (100.0% in the age bracket) attending a public institution.
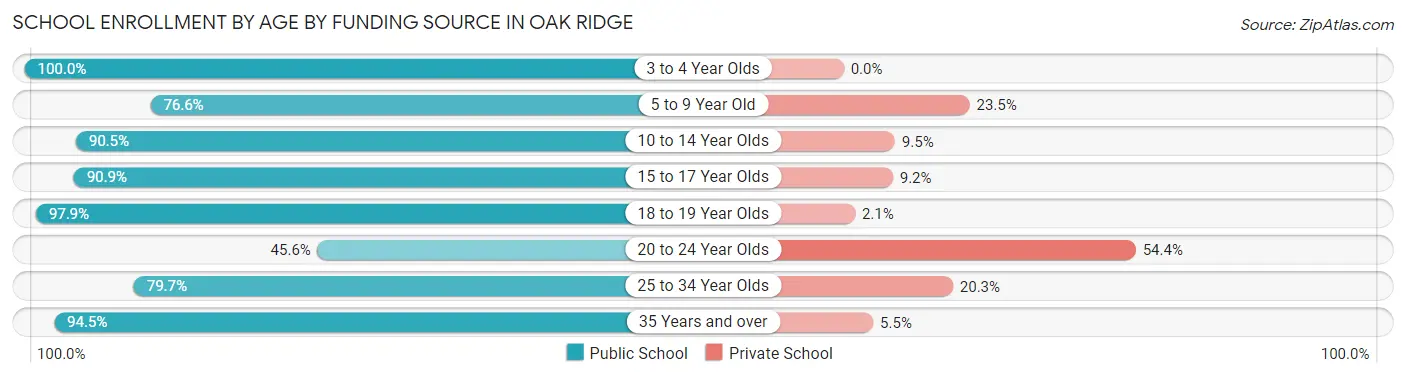
| Age Bracket | Public School | Private School |
| 3 to 4 Year Olds | 174 (100.0%) | 0 (0.0%) |
| 5 to 9 Year Old | 1,250 (76.5%) | 383 (23.4%) |
| 10 to 14 Year Olds | 2,010 (90.5%) | 212 (9.5%) |
| 15 to 17 Year Olds | 725 (90.8%) | 73 (9.1%) |
| 18 to 19 Year Olds | 696 (97.9%) | 15 (2.1%) |
| 20 to 24 Year Olds | 373 (45.6%) | 445 (54.4%) |
| 25 to 34 Year Olds | 141 (79.7%) | 36 (20.3%) |
| 35 Years and over | 568 (94.5%) | 33 (5.5%) |
| Total | 5,935 (83.2%) | 1,199 (16.8%) |
Educational Attainment by Field of Study in Oak Ridge
Business (629 | 26.5%), education (347 | 14.6%), arts & humanities (200 | 8.4%), bio, nature & agricultural (192 | 8.1%), and science & technology (168 | 7.1%) are the most common fields of study among 2,372 individuals in Oak Ridge who have obtained a bachelor's degree or higher.
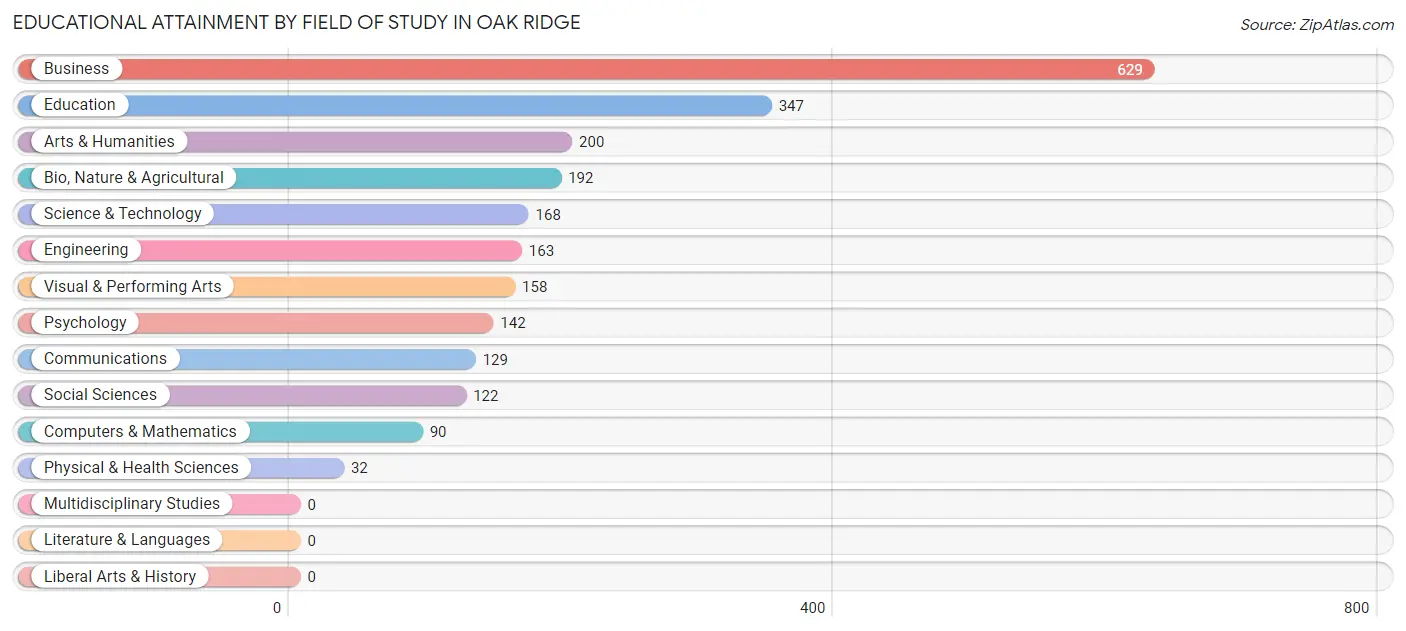
| Field of Study | # Graduates | % Graduates |
| Computers & Mathematics | 90 | 3.8% |
| Bio, Nature & Agricultural | 192 | 8.1% |
| Physical & Health Sciences | 32 | 1.3% |
| Psychology | 142 | 6.0% |
| Social Sciences | 122 | 5.1% |
| Engineering | 163 | 6.9% |
| Multidisciplinary Studies | 0 | 0.0% |
| Science & Technology | 168 | 7.1% |
| Business | 629 | 26.5% |
| Education | 347 | 14.6% |
| Literature & Languages | 0 | 0.0% |
| Liberal Arts & History | 0 | 0.0% |
| Visual & Performing Arts | 158 | 6.7% |
| Communications | 129 | 5.4% |
| Arts & Humanities | 200 | 8.4% |
| Total | 2,372 | 100.0% |
Transportation & Commute in Oak Ridge
Vehicle Availability by Sex in Oak Ridge
The most prevalent vehicle ownership categories in Oak Ridge are males with 1 vehicle (2,321, accounting for 32.5%) and females with 1 vehicle (1,252, making up 46.4%).
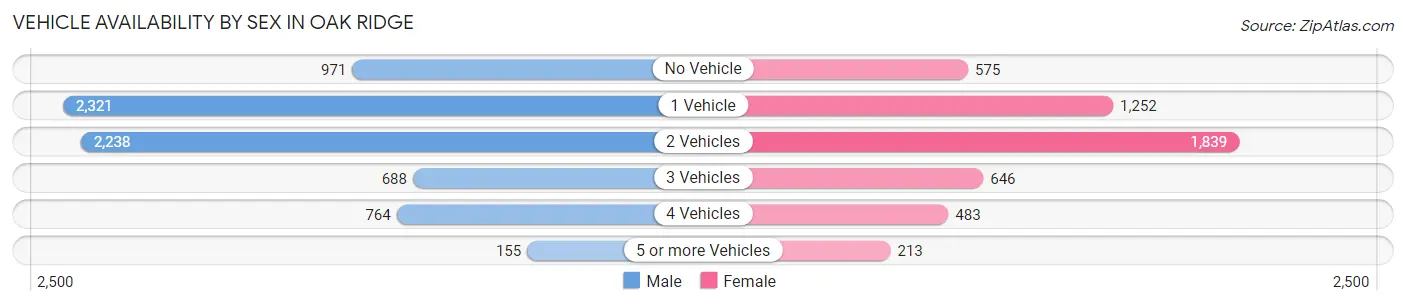
| Vehicles Available | Male | Female |
| No Vehicle | 971 (13.6%) | 575 (11.5%) |
| 1 Vehicle | 2,321 (32.5%) | 1,252 (25.0%) |
| 2 Vehicles | 2,238 (31.4%) | 1,839 (36.7%) |
| 3 Vehicles | 688 (9.6%) | 646 (12.9%) |
| 4 Vehicles | 764 (10.7%) | 483 (9.6%) |
| 5 or more Vehicles | 155 (2.2%) | 213 (4.3%) |
| Total | 7,137 (100.0%) | 5,008 (100.0%) |
Commute Time in Oak Ridge
The most frequently occuring commute durations in Oak Ridge are 30 to 34 minutes (2,663 commuters, 23.2%), 15 to 19 minutes (2,151 commuters, 18.7%), and 20 to 24 minutes (1,798 commuters, 15.7%).
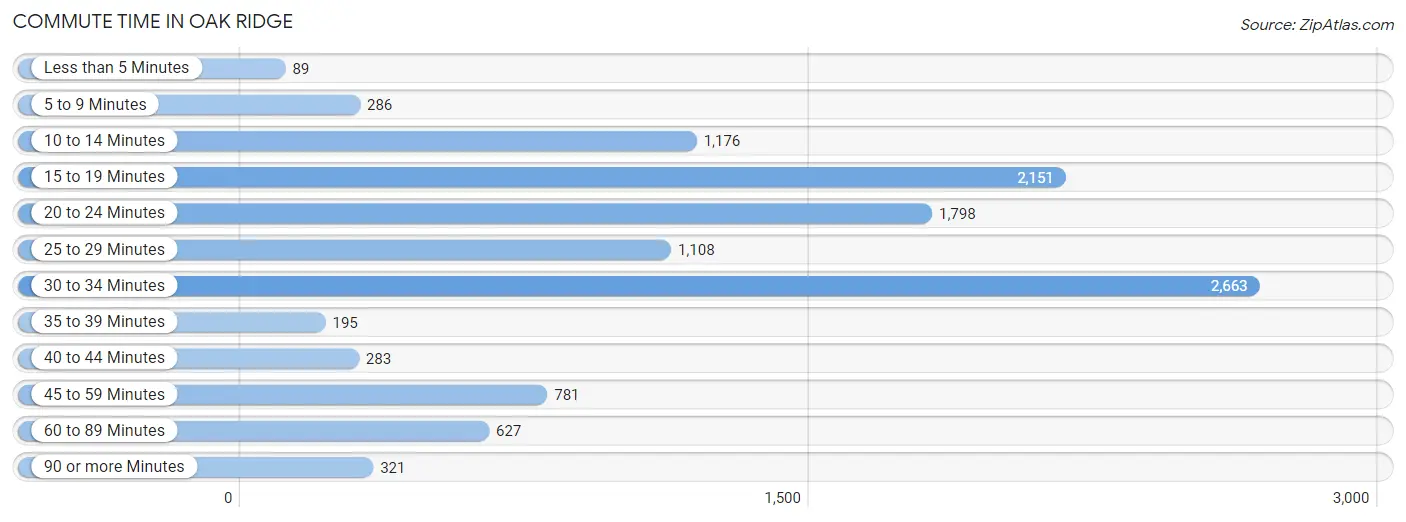
| Commute Time | # Commuters | % Commuters |
| Less than 5 Minutes | 89 | 0.8% |
| 5 to 9 Minutes | 286 | 2.5% |
| 10 to 14 Minutes | 1,176 | 10.2% |
| 15 to 19 Minutes | 2,151 | 18.7% |
| 20 to 24 Minutes | 1,798 | 15.7% |
| 25 to 29 Minutes | 1,108 | 9.7% |
| 30 to 34 Minutes | 2,663 | 23.2% |
| 35 to 39 Minutes | 195 | 1.7% |
| 40 to 44 Minutes | 283 | 2.5% |
| 45 to 59 Minutes | 781 | 6.8% |
| 60 to 89 Minutes | 627 | 5.5% |
| 90 or more Minutes | 321 | 2.8% |
Commute Time by Sex in Oak Ridge
The most common commute times in Oak Ridge are 15 to 19 minutes (1,273 commuters, 18.7%) for males and 30 to 34 minutes (1,450 commuters, 31.1%) for females.
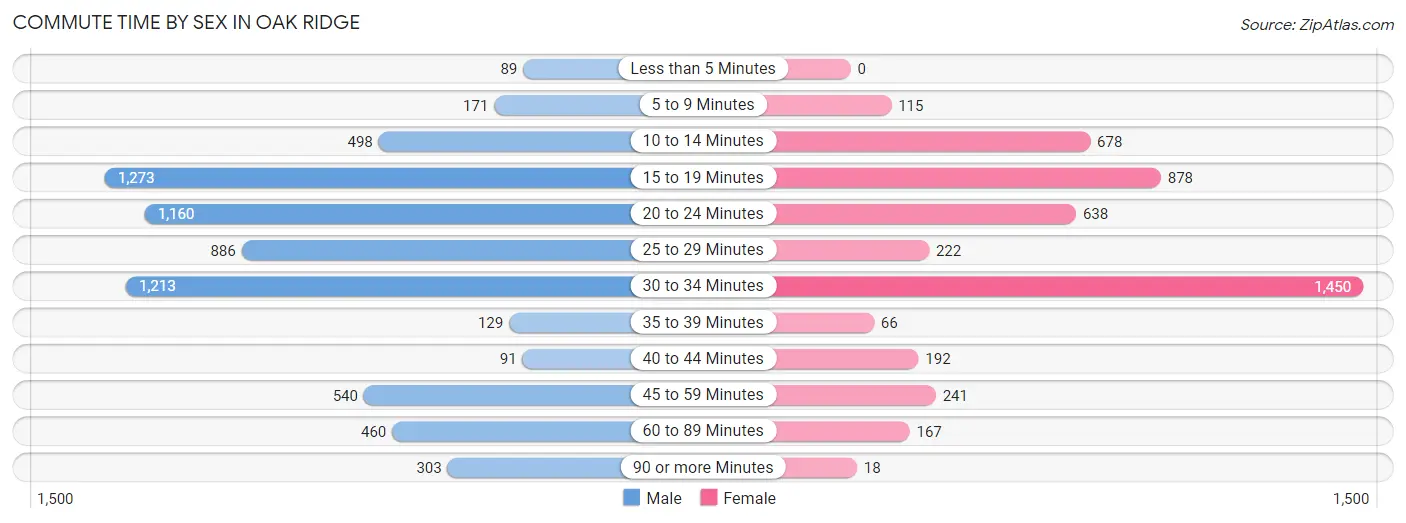
| Commute Time | Male | Female |
| Less than 5 Minutes | 89 (1.3%) | 0 (0.0%) |
| 5 to 9 Minutes | 171 (2.5%) | 115 (2.5%) |
| 10 to 14 Minutes | 498 (7.3%) | 678 (14.5%) |
| 15 to 19 Minutes | 1,273 (18.7%) | 878 (18.8%) |
| 20 to 24 Minutes | 1,160 (17.0%) | 638 (13.7%) |
| 25 to 29 Minutes | 886 (13.0%) | 222 (4.8%) |
| 30 to 34 Minutes | 1,213 (17.8%) | 1,450 (31.1%) |
| 35 to 39 Minutes | 129 (1.9%) | 66 (1.4%) |
| 40 to 44 Minutes | 91 (1.3%) | 192 (4.1%) |
| 45 to 59 Minutes | 540 (7.9%) | 241 (5.2%) |
| 60 to 89 Minutes | 460 (6.8%) | 167 (3.6%) |
| 90 or more Minutes | 303 (4.4%) | 18 (0.4%) |
Time of Departure to Work by Sex in Oak Ridge
The most frequent times of departure to work in Oak Ridge are 6:00 AM to 6:29 AM (1,768, 26.0%) for males and 8:00 AM to 8:29 AM (891, 19.1%) for females.
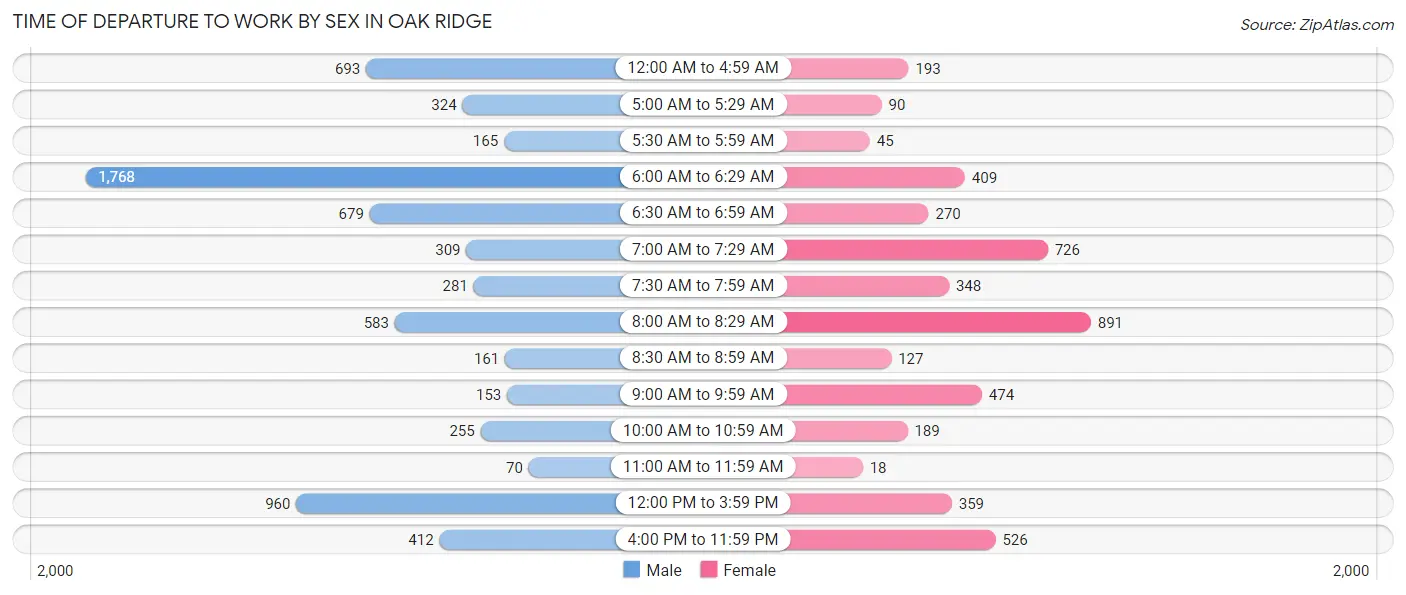
| Time of Departure | Male | Female |
| 12:00 AM to 4:59 AM | 693 (10.2%) | 193 (4.1%) |
| 5:00 AM to 5:29 AM | 324 (4.8%) | 90 (1.9%) |
| 5:30 AM to 5:59 AM | 165 (2.4%) | 45 (1.0%) |
| 6:00 AM to 6:29 AM | 1,768 (26.0%) | 409 (8.8%) |
| 6:30 AM to 6:59 AM | 679 (10.0%) | 270 (5.8%) |
| 7:00 AM to 7:29 AM | 309 (4.5%) | 726 (15.6%) |
| 7:30 AM to 7:59 AM | 281 (4.1%) | 348 (7.5%) |
| 8:00 AM to 8:29 AM | 583 (8.6%) | 891 (19.1%) |
| 8:30 AM to 8:59 AM | 161 (2.4%) | 127 (2.7%) |
| 9:00 AM to 9:59 AM | 153 (2.2%) | 474 (10.2%) |
| 10:00 AM to 10:59 AM | 255 (3.7%) | 189 (4.1%) |
| 11:00 AM to 11:59 AM | 70 (1.0%) | 18 (0.4%) |
| 12:00 PM to 3:59 PM | 960 (14.1%) | 359 (7.7%) |
| 4:00 PM to 11:59 PM | 412 (6.0%) | 526 (11.3%) |
| Total | 6,813 (100.0%) | 4,665 (100.0%) |
Housing Occupancy in Oak Ridge
Occupancy by Ownership in Oak Ridge
Of the total 7,036 dwellings in Oak Ridge, owner-occupied units account for 2,478 (35.2%), while renter-occupied units make up 4,558 (64.8%).
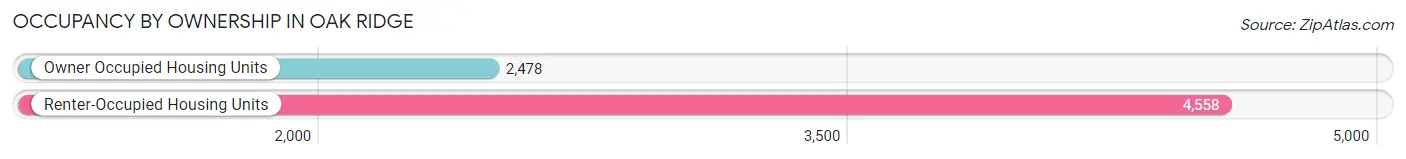
| Occupancy | # Housing Units | % Housing Units |
| Owner Occupied Housing Units | 2,478 | 35.2% |
| Renter-Occupied Housing Units | 4,558 | 64.8% |
| Total Occupied Housing Units | 7,036 | 100.0% |
Occupancy by Household Size in Oak Ridge
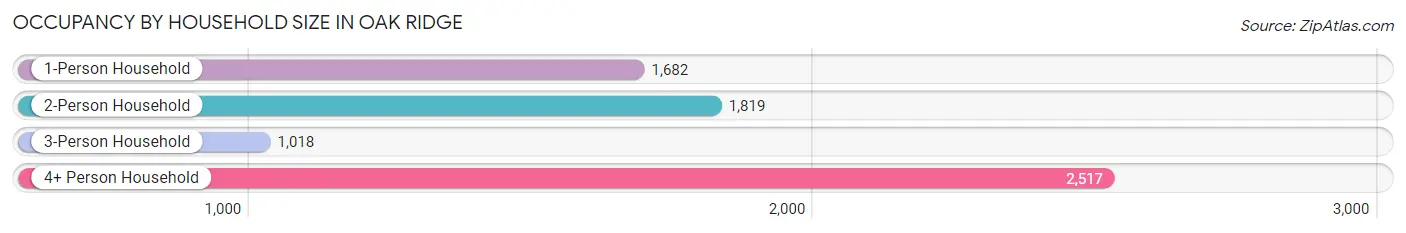
| Household Size | # Housing Units | % Housing Units |
| 1-Person Household | 1,682 | 23.9% |
| 2-Person Household | 1,819 | 25.9% |
| 3-Person Household | 1,018 | 14.5% |
| 4+ Person Household | 2,517 | 35.8% |
| Total Housing Units | 7,036 | 100.0% |
Occupancy by Ownership by Household Size in Oak Ridge
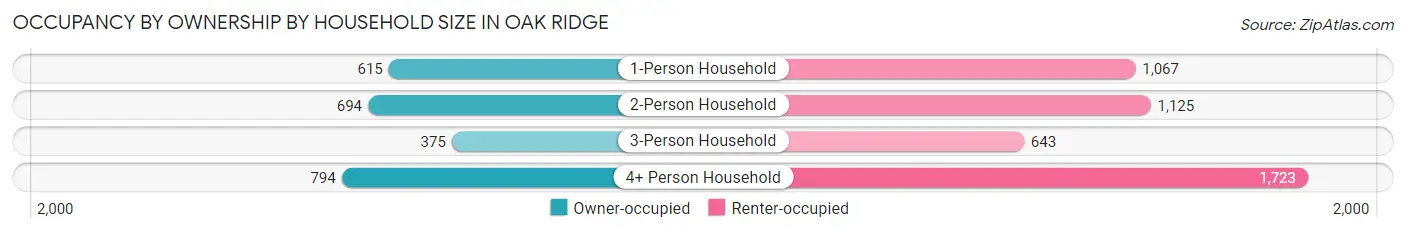
| Household Size | Owner-occupied | Renter-occupied |
| 1-Person Household | 615 (36.6%) | 1,067 (63.4%) |
| 2-Person Household | 694 (38.2%) | 1,125 (61.9%) |
| 3-Person Household | 375 (36.8%) | 643 (63.2%) |
| 4+ Person Household | 794 (31.6%) | 1,723 (68.4%) |
| Total Housing Units | 2,478 (35.2%) | 4,558 (64.8%) |
Occupancy by Educational Attainment in Oak Ridge
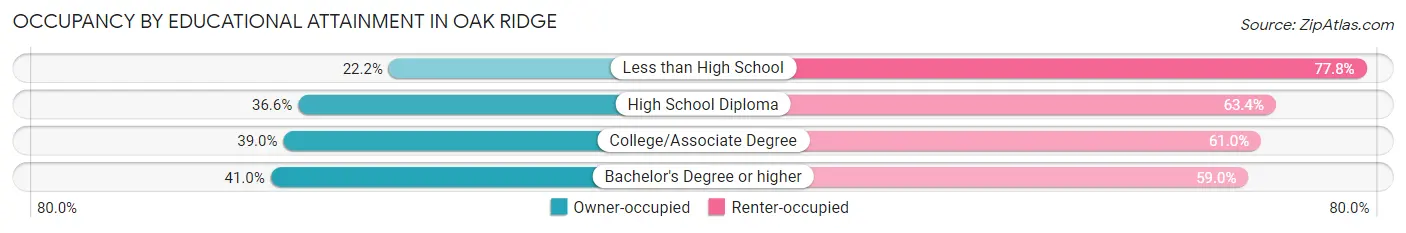
| Household Size | Owner-occupied | Renter-occupied |
| Less than High School | 302 (22.2%) | 1,056 (77.8%) |
| High School Diploma | 907 (36.6%) | 1,569 (63.4%) |
| College/Associate Degree | 837 (39.0%) | 1,311 (61.0%) |
| Bachelor's Degree or higher | 432 (41.0%) | 622 (59.0%) |
Occupancy by Age of Householder in Oak Ridge
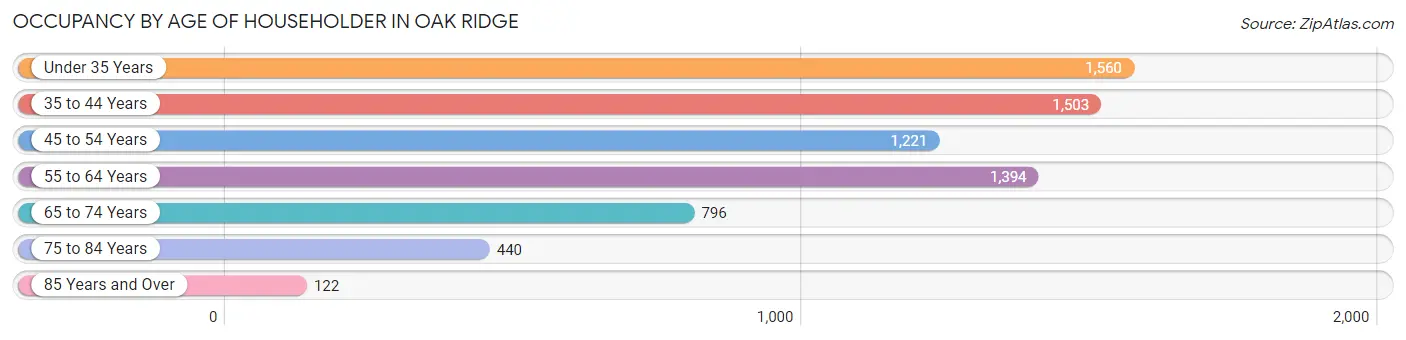
| Age Bracket | # Households | % Households |
| Under 35 Years | 1,560 | 22.2% |
| 35 to 44 Years | 1,503 | 21.4% |
| 45 to 54 Years | 1,221 | 17.3% |
| 55 to 64 Years | 1,394 | 19.8% |
| 65 to 74 Years | 796 | 11.3% |
| 75 to 84 Years | 440 | 6.2% |
| 85 Years and Over | 122 | 1.7% |
| Total | 7,036 | 100.0% |
Housing Finances in Oak Ridge
Median Income by Occupancy in Oak Ridge
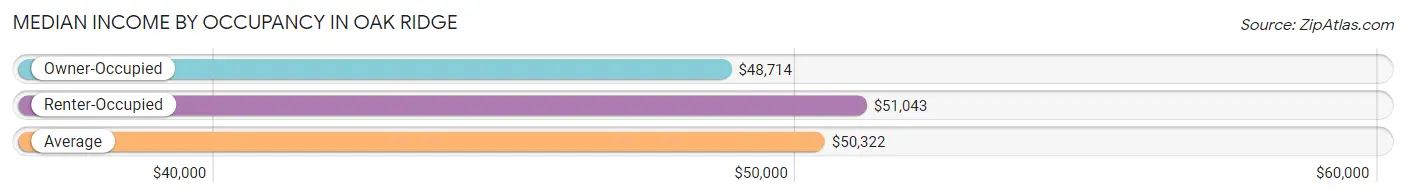
| Occupancy Type | # Households | Median Income |
| Owner-Occupied | 2,478 (35.2%) | $48,714 |
| Renter-Occupied | 4,558 (64.8%) | $51,043 |
| Average | 7,036 (100.0%) | $50,322 |
Occupancy by Householder Income Bracket in Oak Ridge
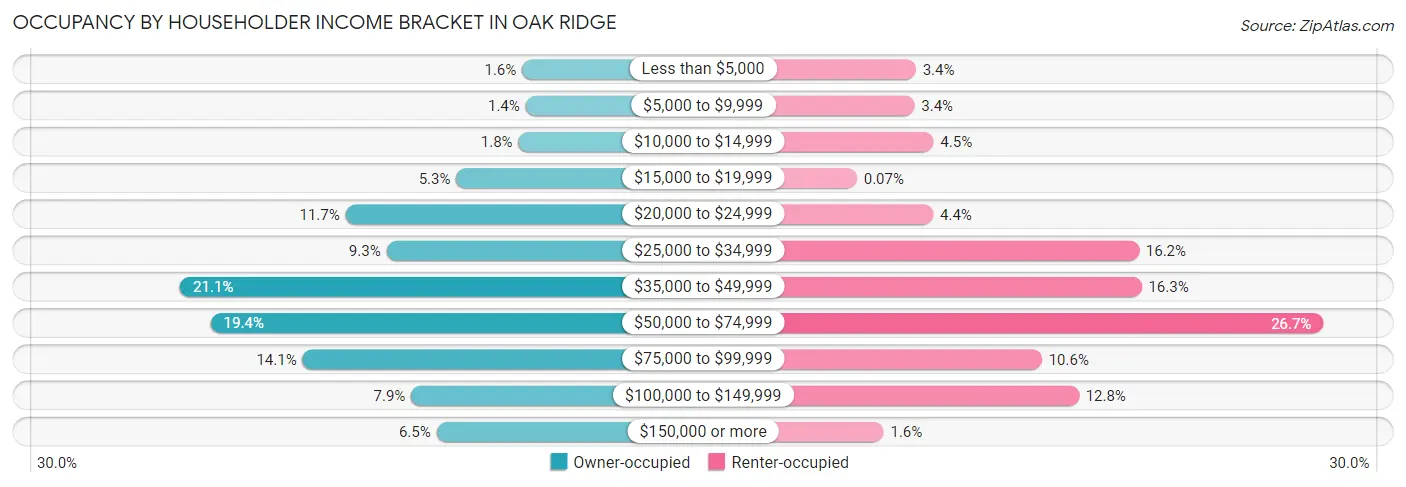
| Income Bracket | Owner-occupied | Renter-occupied |
| Less than $5,000 | 39 (1.6%) | 157 (3.4%) |
| $5,000 to $9,999 | 34 (1.4%) | 153 (3.4%) |
| $10,000 to $14,999 | 44 (1.8%) | 203 (4.4%) |
| $15,000 to $19,999 | 132 (5.3%) | 3 (0.1%) |
| $20,000 to $24,999 | 289 (11.7%) | 202 (4.4%) |
| $25,000 to $34,999 | 231 (9.3%) | 738 (16.2%) |
| $35,000 to $49,999 | 523 (21.1%) | 745 (16.3%) |
| $50,000 to $74,999 | 480 (19.4%) | 1,218 (26.7%) |
| $75,000 to $99,999 | 350 (14.1%) | 485 (10.6%) |
| $100,000 to $149,999 | 196 (7.9%) | 581 (12.8%) |
| $150,000 or more | 160 (6.5%) | 73 (1.6%) |
| Total | 2,478 (100.0%) | 4,558 (100.0%) |
Monthly Housing Cost Tiers in Oak Ridge
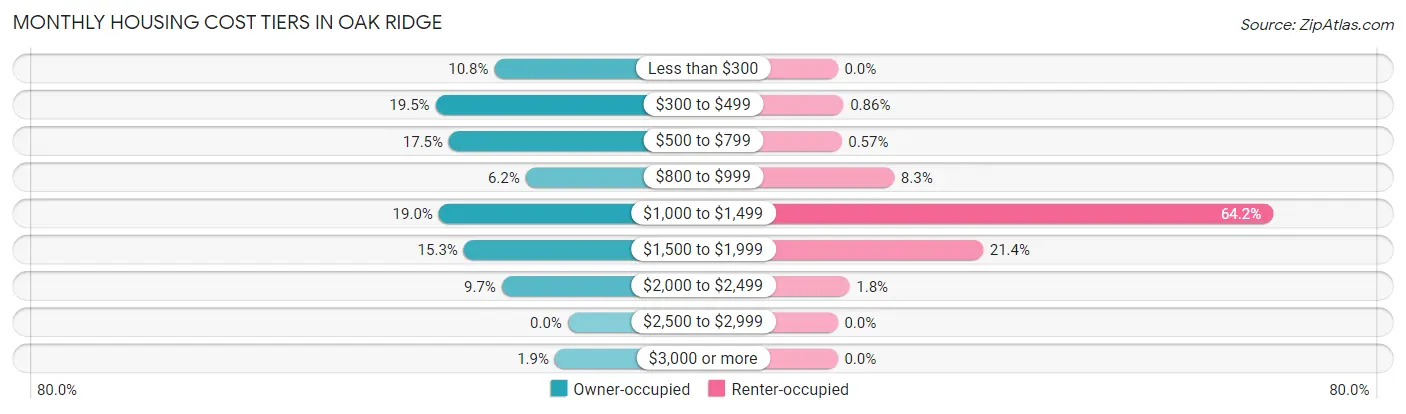
| Monthly Cost | Owner-occupied | Renter-occupied |
| Less than $300 | 268 (10.8%) | 0 (0.0%) |
| $300 to $499 | 483 (19.5%) | 39 (0.9%) |
| $500 to $799 | 434 (17.5%) | 26 (0.6%) |
| $800 to $999 | 154 (6.2%) | 379 (8.3%) |
| $1,000 to $1,499 | 471 (19.0%) | 2,924 (64.1%) |
| $1,500 to $1,999 | 380 (15.3%) | 976 (21.4%) |
| $2,000 to $2,499 | 241 (9.7%) | 80 (1.8%) |
| $2,500 to $2,999 | 0 (0.0%) | 0 (0.0%) |
| $3,000 or more | 47 (1.9%) | 0 (0.0%) |
| Total | 2,478 (100.0%) | 4,558 (100.0%) |
Physical Housing Characteristics in Oak Ridge
Housing Structures in Oak Ridge
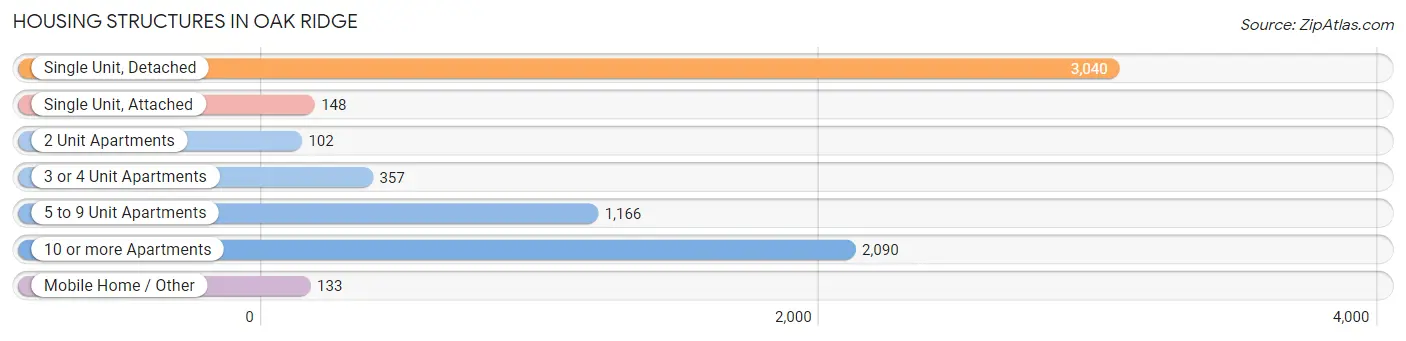
| Structure Type | # Housing Units | % Housing Units |
| Single Unit, Detached | 3,040 | 43.2% |
| Single Unit, Attached | 148 | 2.1% |
| 2 Unit Apartments | 102 | 1.5% |
| 3 or 4 Unit Apartments | 357 | 5.1% |
| 5 to 9 Unit Apartments | 1,166 | 16.6% |
| 10 or more Apartments | 2,090 | 29.7% |
| Mobile Home / Other | 133 | 1.9% |
| Total | 7,036 | 100.0% |
Housing Structures by Occupancy in Oak Ridge
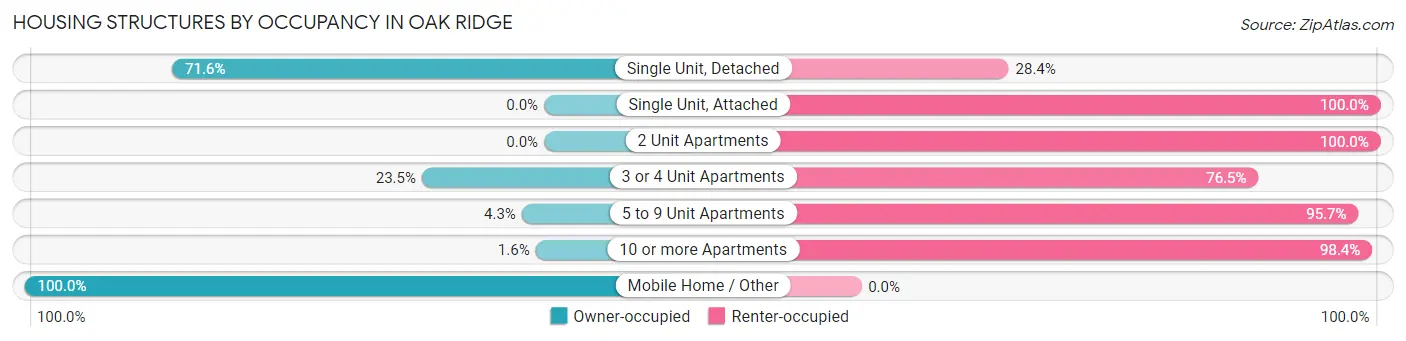
| Structure Type | Owner-occupied | Renter-occupied |
| Single Unit, Detached | 2,177 (71.6%) | 863 (28.4%) |
| Single Unit, Attached | 0 (0.0%) | 148 (100.0%) |
| 2 Unit Apartments | 0 (0.0%) | 102 (100.0%) |
| 3 or 4 Unit Apartments | 84 (23.5%) | 273 (76.5%) |
| 5 to 9 Unit Apartments | 50 (4.3%) | 1,116 (95.7%) |
| 10 or more Apartments | 34 (1.6%) | 2,056 (98.4%) |
| Mobile Home / Other | 133 (100.0%) | 0 (0.0%) |
| Total | 2,478 (35.2%) | 4,558 (64.8%) |
Housing Structures by Number of Rooms in Oak Ridge
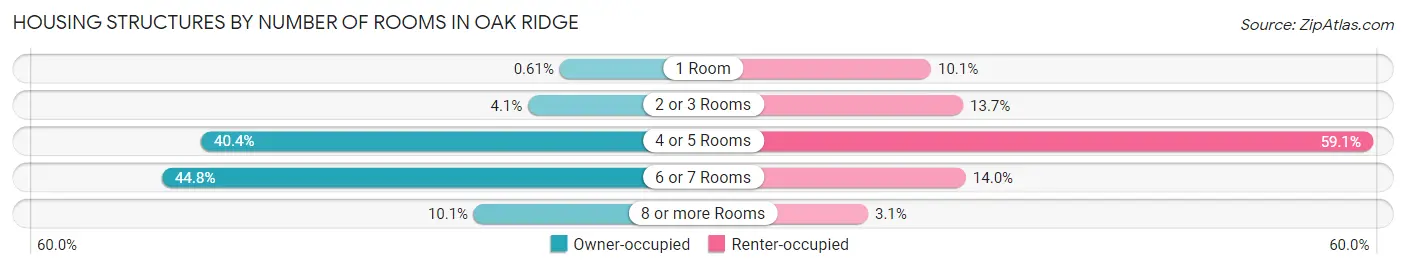
| Number of Rooms | Owner-occupied | Renter-occupied |
| 1 Room | 15 (0.6%) | 461 (10.1%) |
| 2 or 3 Rooms | 102 (4.1%) | 623 (13.7%) |
| 4 or 5 Rooms | 1,001 (40.4%) | 2,695 (59.1%) |
| 6 or 7 Rooms | 1,109 (44.8%) | 637 (14.0%) |
| 8 or more Rooms | 251 (10.1%) | 142 (3.1%) |
| Total | 2,478 (100.0%) | 4,558 (100.0%) |
Housing Structure by Heating Type in Oak Ridge
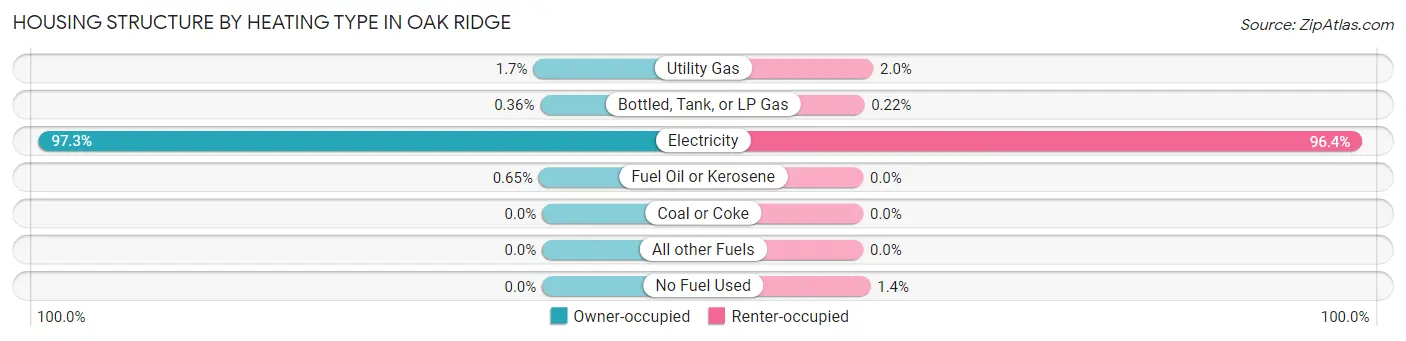
| Heating Type | Owner-occupied | Renter-occupied |
| Utility Gas | 42 (1.7%) | 89 (1.9%) |
| Bottled, Tank, or LP Gas | 9 (0.4%) | 10 (0.2%) |
| Electricity | 2,411 (97.3%) | 4,395 (96.4%) |
| Fuel Oil or Kerosene | 16 (0.6%) | 0 (0.0%) |
| Coal or Coke | 0 (0.0%) | 0 (0.0%) |
| All other Fuels | 0 (0.0%) | 0 (0.0%) |
| No Fuel Used | 0 (0.0%) | 64 (1.4%) |
| Total | 2,478 (100.0%) | 4,558 (100.0%) |
Household Vehicle Usage in Oak Ridge
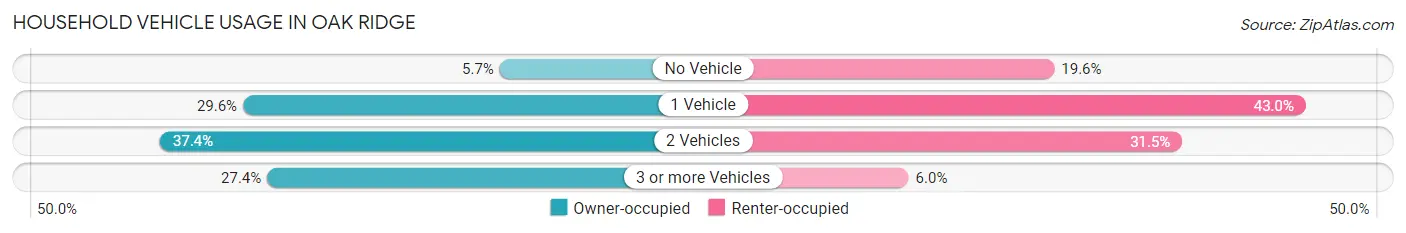
| Vehicles per Household | Owner-occupied | Renter-occupied |
| No Vehicle | 140 (5.7%) | 891 (19.6%) |
| 1 Vehicle | 734 (29.6%) | 1,961 (43.0%) |
| 2 Vehicles | 926 (37.4%) | 1,435 (31.5%) |
| 3 or more Vehicles | 678 (27.4%) | 271 (5.9%) |
| Total | 2,478 (100.0%) | 4,558 (100.0%) |
Real Estate & Mortgages in Oak Ridge
Real Estate and Mortgage Overview in Oak Ridge
| Characteristic | Without Mortgage | With Mortgage |
| Housing Units | 1,171 | 1,307 |
| Median Property Value | $162,600 | $226,100 |
| Median Household Income | $47,083 | $106 |
| Monthly Housing Costs | $392 | $13 |
| Real Estate Taxes | $1,241 | $7 |
Property Value by Mortgage Status in Oak Ridge
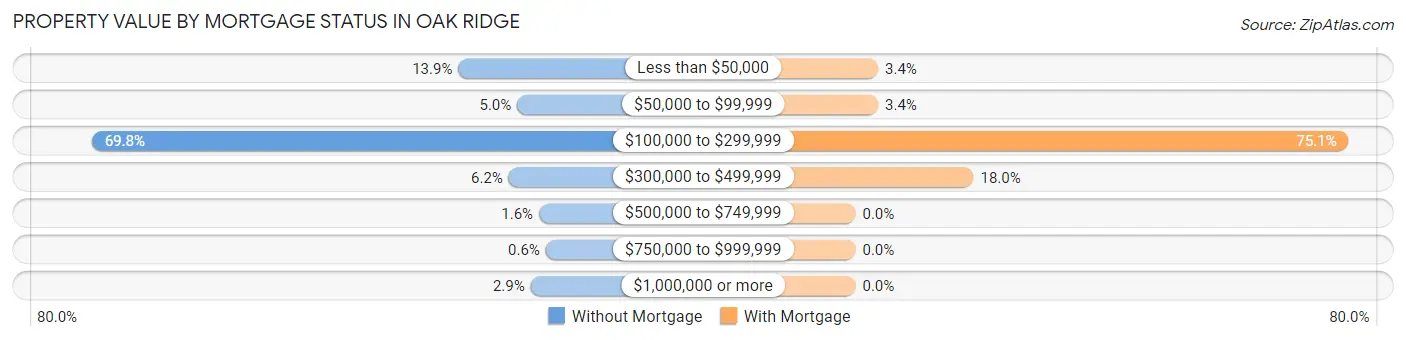
| Property Value | Without Mortgage | With Mortgage |
| Less than $50,000 | 163 (13.9%) | 45 (3.4%) |
| $50,000 to $99,999 | 58 (5.0%) | 45 (3.4%) |
| $100,000 to $299,999 | 817 (69.8%) | 982 (75.1%) |
| $300,000 to $499,999 | 73 (6.2%) | 235 (18.0%) |
| $500,000 to $749,999 | 19 (1.6%) | 0 (0.0%) |
| $750,000 to $999,999 | 7 (0.6%) | 0 (0.0%) |
| $1,000,000 or more | 34 (2.9%) | 0 (0.0%) |
| Total | 1,171 (100.0%) | 1,307 (100.0%) |
Household Income by Mortgage Status in Oak Ridge
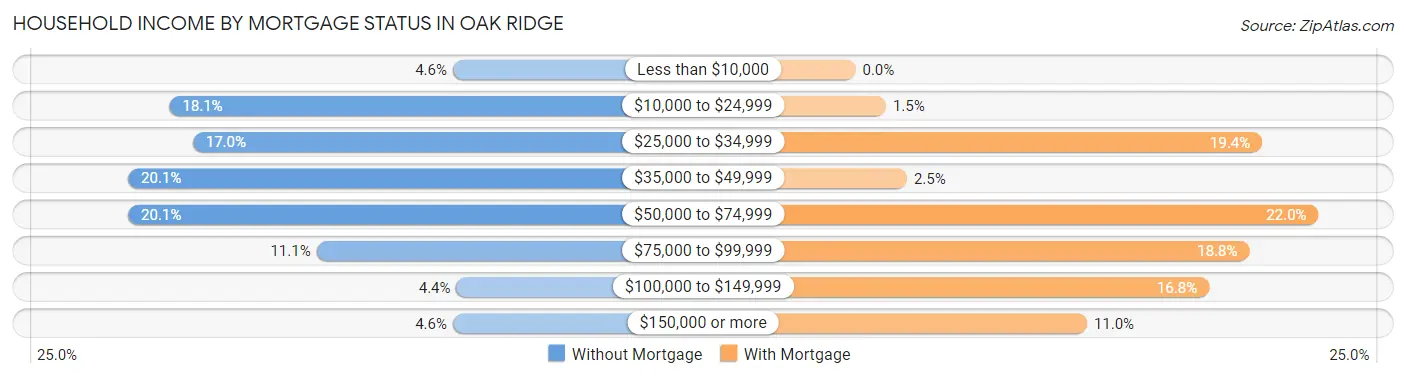
| Household Income | Without Mortgage | With Mortgage |
| Less than $10,000 | 54 (4.6%) | 0 (0.0%) |
| $10,000 to $24,999 | 212 (18.1%) | 19 (1.5%) |
| $25,000 to $34,999 | 199 (17.0%) | 253 (19.4%) |
| $35,000 to $49,999 | 235 (20.1%) | 32 (2.5%) |
| $50,000 to $74,999 | 235 (20.1%) | 288 (22.0%) |
| $75,000 to $99,999 | 130 (11.1%) | 245 (18.8%) |
| $100,000 to $149,999 | 52 (4.4%) | 220 (16.8%) |
| $150,000 or more | 54 (4.6%) | 144 (11.0%) |
| Total | 1,171 (100.0%) | 1,307 (100.0%) |
Property Value to Household Income Ratio in Oak Ridge
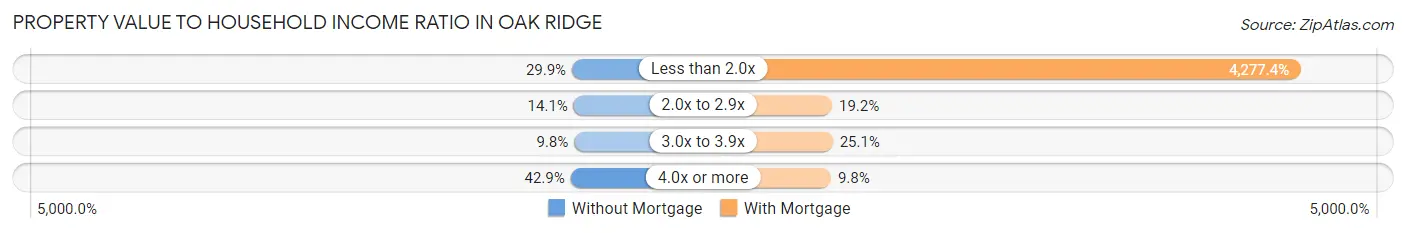
| Value-to-Income Ratio | Without Mortgage | With Mortgage |
| Less than 2.0x | 350 (29.9%) | 55,905 (4,277.3%) |
| 2.0x to 2.9x | 165 (14.1%) | 251 (19.2%) |
| 3.0x to 3.9x | 115 (9.8%) | 328 (25.1%) |
| 4.0x or more | 502 (42.9%) | 128 (9.8%) |
| Total | 1,171 (100.0%) | 1,307 (100.0%) |
Real Estate Taxes by Mortgage Status in Oak Ridge
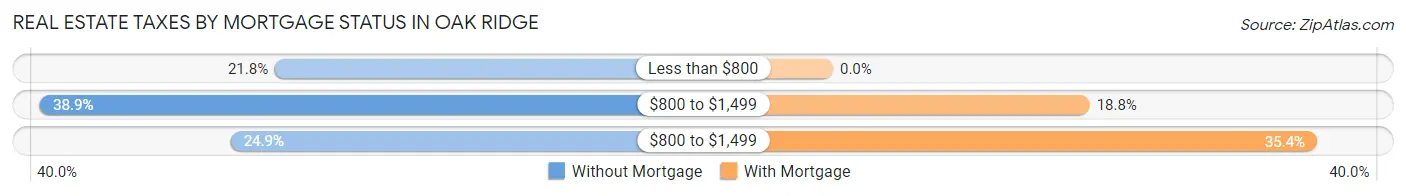
| Property Taxes | Without Mortgage | With Mortgage |
| Less than $800 | 255 (21.8%) | 0 (0.0%) |
| $800 to $1,499 | 455 (38.9%) | 245 (18.8%) |
| $800 to $1,499 | 292 (24.9%) | 462 (35.3%) |
| Total | 1,171 (100.0%) | 1,307 (100.0%) |
Health & Disability in Oak Ridge
Health Insurance Coverage by Age in Oak Ridge
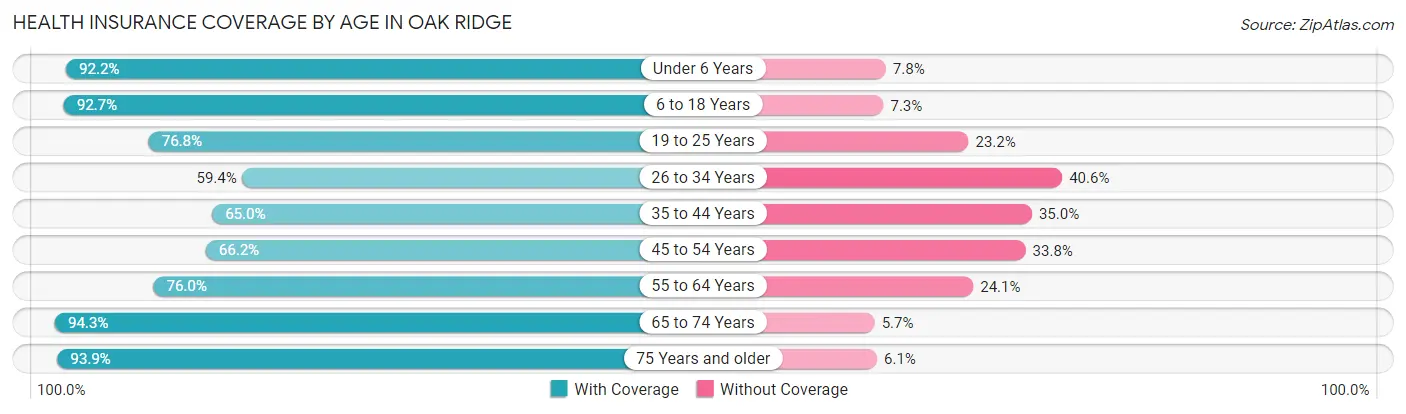
| Age Bracket | With Coverage | Without Coverage |
| Under 6 Years | 1,176 (92.2%) | 99 (7.8%) |
| 6 to 18 Years | 4,914 (92.7%) | 388 (7.3%) |
| 19 to 25 Years | 1,983 (76.8%) | 598 (23.2%) |
| 26 to 34 Years | 2,382 (59.4%) | 1,631 (40.6%) |
| 35 to 44 Years | 2,299 (65.0%) | 1,238 (35.0%) |
| 45 to 54 Years | 1,969 (66.2%) | 1,006 (33.8%) |
| 55 to 64 Years | 1,781 (75.9%) | 564 (24.0%) |
| 65 to 74 Years | 1,461 (94.3%) | 88 (5.7%) |
| 75 Years and older | 844 (93.9%) | 55 (6.1%) |
| Total | 18,809 (76.8%) | 5,667 (23.2%) |
Health Insurance Coverage by Citizenship Status in Oak Ridge
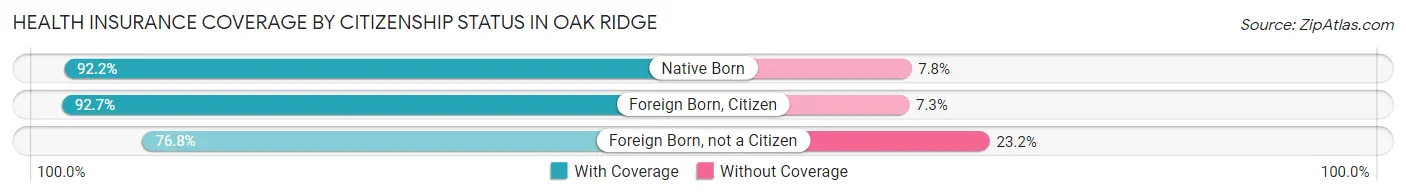
| Citizenship Status | With Coverage | Without Coverage |
| Native Born | 1,176 (92.2%) | 99 (7.8%) |
| Foreign Born, Citizen | 4,914 (92.7%) | 388 (7.3%) |
| Foreign Born, not a Citizen | 1,983 (76.8%) | 598 (23.2%) |
Health Insurance Coverage by Household Income in Oak Ridge
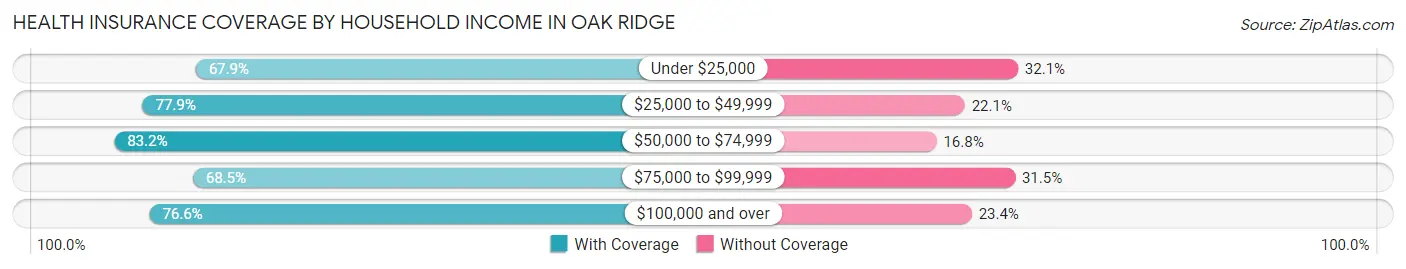
| Household Income | With Coverage | Without Coverage |
| Under $25,000 | 1,793 (67.9%) | 846 (32.1%) |
| $25,000 to $49,999 | 5,011 (77.9%) | 1,422 (22.1%) |
| $50,000 to $74,999 | 6,119 (83.2%) | 1,236 (16.8%) |
| $75,000 to $99,999 | 2,358 (68.5%) | 1,085 (31.5%) |
| $100,000 and over | 3,528 (76.6%) | 1,078 (23.4%) |
Public vs Private Health Insurance Coverage by Age in Oak Ridge
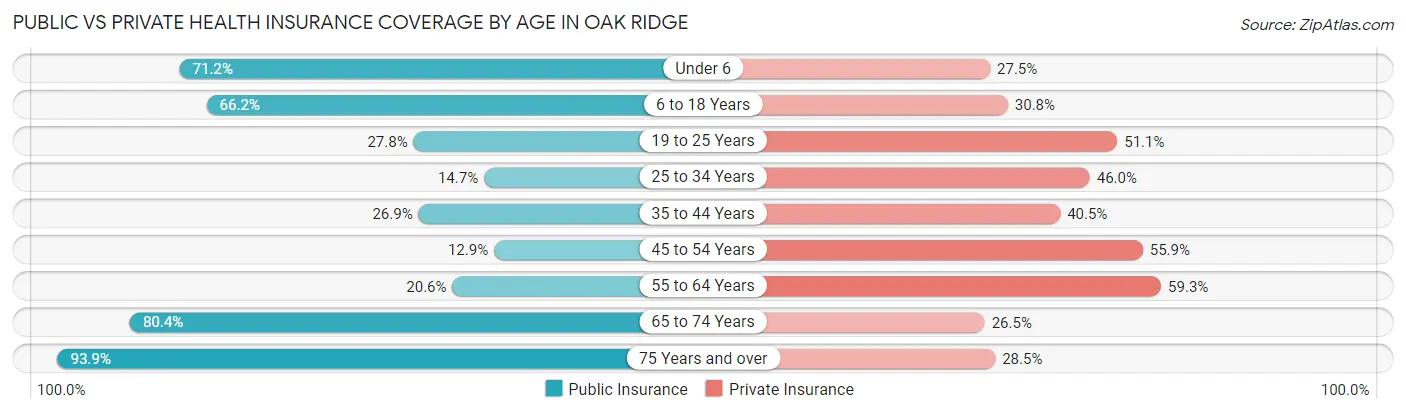
| Age Bracket | Public Insurance | Private Insurance |
| Under 6 | 908 (71.2%) | 351 (27.5%) |
| 6 to 18 Years | 3,510 (66.2%) | 1,634 (30.8%) |
| 19 to 25 Years | 718 (27.8%) | 1,320 (51.1%) |
| 25 to 34 Years | 591 (14.7%) | 1,847 (46.0%) |
| 35 to 44 Years | 951 (26.9%) | 1,434 (40.5%) |
| 45 to 54 Years | 383 (12.9%) | 1,662 (55.9%) |
| 55 to 64 Years | 483 (20.6%) | 1,390 (59.3%) |
| 65 to 74 Years | 1,246 (80.4%) | 411 (26.5%) |
| 75 Years and over | 844 (93.9%) | 256 (28.5%) |
| Total | 9,634 (39.4%) | 10,305 (42.1%) |
Disability Status by Sex by Age in Oak Ridge
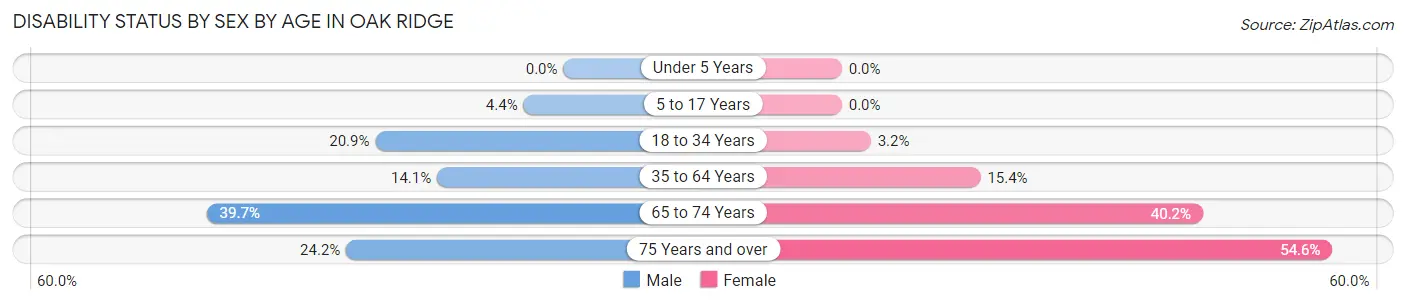
| Age Bracket | Male | Female |
| Under 5 Years | 0 (0.0%) | 0 (0.0%) |
| 5 to 17 Years | 136 (4.4%) | 0 (0.0%) |
| 18 to 34 Years | 876 (20.9%) | 99 (3.2%) |
| 35 to 64 Years | 635 (14.1%) | 671 (15.4%) |
| 65 to 74 Years | 309 (39.7%) | 310 (40.2%) |
| 75 Years and over | 105 (24.2%) | 254 (54.6%) |
Disability Class by Sex by Age in Oak Ridge
Disability Class: Hearing Difficulty
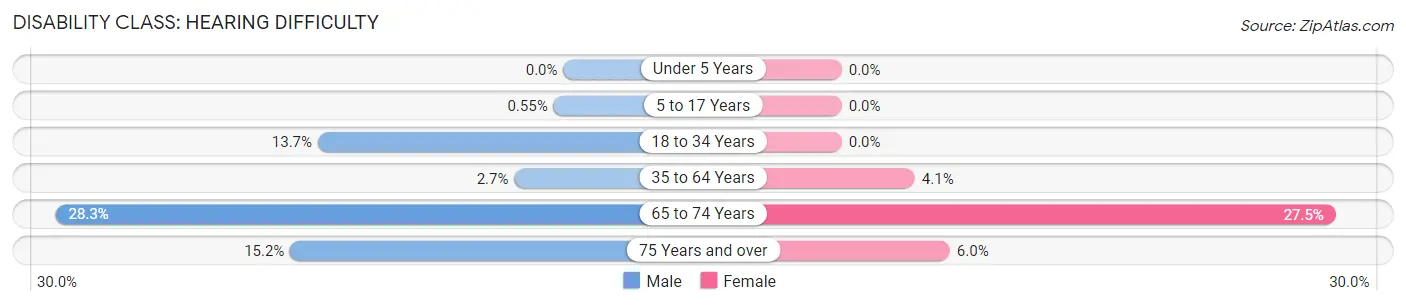
| Age Bracket | Male | Female |
| Under 5 Years | 0 (0.0%) | 0 (0.0%) |
| 5 to 17 Years | 17 (0.5%) | 0 (0.0%) |
| 18 to 34 Years | 572 (13.7%) | 0 (0.0%) |
| 35 to 64 Years | 123 (2.7%) | 177 (4.1%) |
| 65 to 74 Years | 220 (28.3%) | 212 (27.5%) |
| 75 Years and over | 66 (15.2%) | 28 (6.0%) |
Disability Class: Vision Difficulty
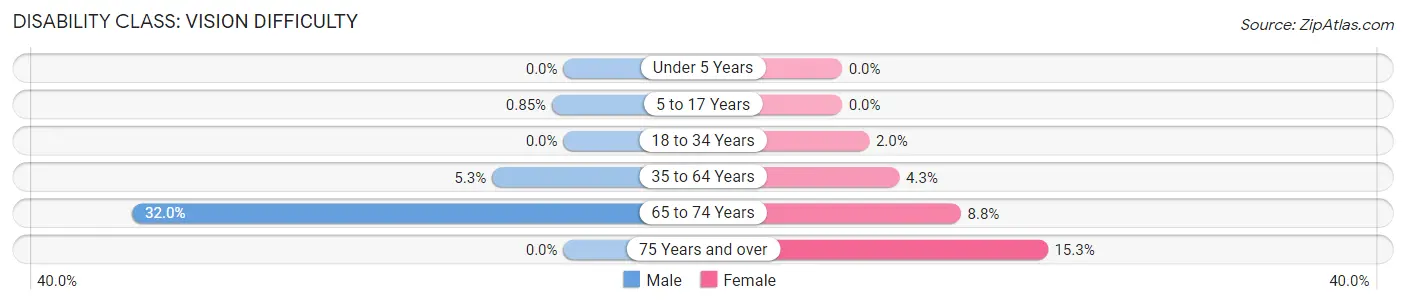
| Age Bracket | Male | Female |
| Under 5 Years | 0 (0.0%) | 0 (0.0%) |
| 5 to 17 Years | 26 (0.9%) | 0 (0.0%) |
| 18 to 34 Years | 0 (0.0%) | 62 (2.0%) |
| 35 to 64 Years | 239 (5.3%) | 185 (4.3%) |
| 65 to 74 Years | 249 (32.0%) | 68 (8.8%) |
| 75 Years and over | 0 (0.0%) | 71 (15.3%) |
Disability Class: Cognitive Difficulty
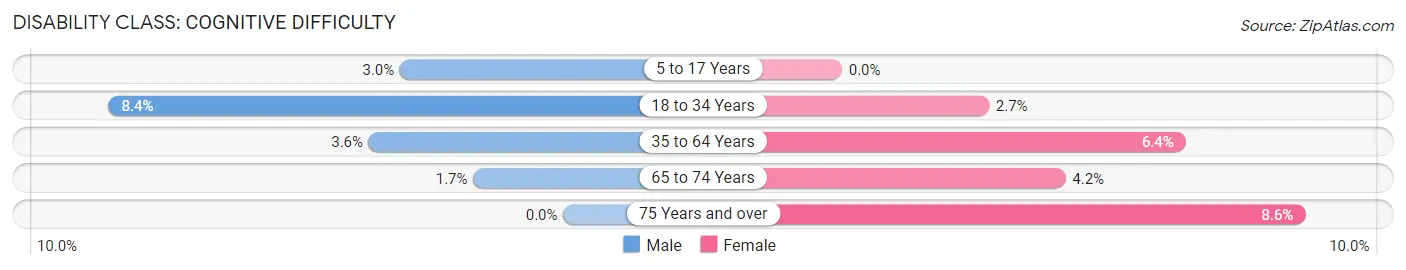
| Age Bracket | Male | Female |
| 5 to 17 Years | 93 (3.0%) | 0 (0.0%) |
| 18 to 34 Years | 353 (8.4%) | 84 (2.7%) |
| 35 to 64 Years | 163 (3.6%) | 277 (6.4%) |
| 65 to 74 Years | 13 (1.7%) | 32 (4.2%) |
| 75 Years and over | 0 (0.0%) | 40 (8.6%) |
Disability Class: Ambulatory Difficulty
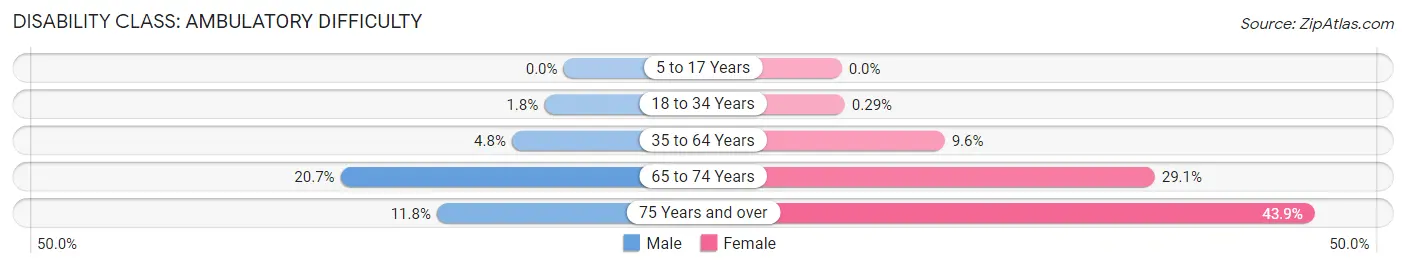
| Age Bracket | Male | Female |
| 5 to 17 Years | 0 (0.0%) | 0 (0.0%) |
| 18 to 34 Years | 75 (1.8%) | 9 (0.3%) |
| 35 to 64 Years | 216 (4.8%) | 415 (9.6%) |
| 65 to 74 Years | 161 (20.7%) | 224 (29.0%) |
| 75 Years and over | 51 (11.7%) | 204 (43.9%) |
Disability Class: Self-Care Difficulty
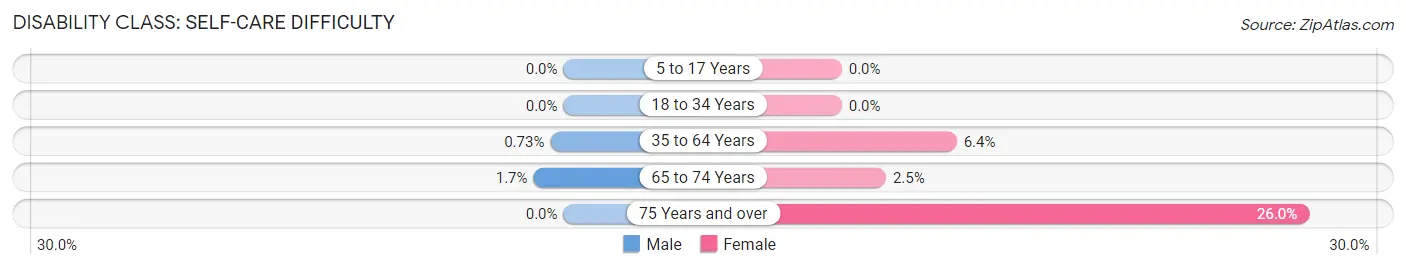
| Age Bracket | Male | Female |
| 5 to 17 Years | 0 (0.0%) | 0 (0.0%) |
| 18 to 34 Years | 0 (0.0%) | 0 (0.0%) |
| 35 to 64 Years | 33 (0.7%) | 278 (6.4%) |
| 65 to 74 Years | 13 (1.7%) | 19 (2.5%) |
| 75 Years and over | 0 (0.0%) | 121 (26.0%) |
Technology Access in Oak Ridge
Computing Device Access in Oak Ridge
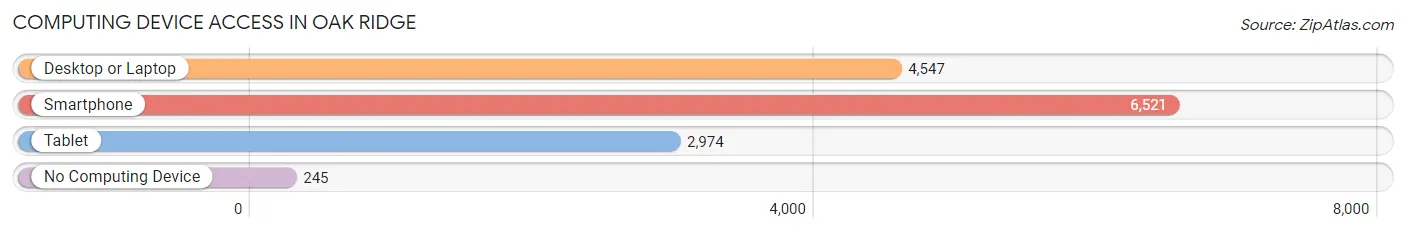
| Device Type | # Households | % Households |
| Desktop or Laptop | 4,547 | 64.6% |
| Smartphone | 6,521 | 92.7% |
| Tablet | 2,974 | 42.3% |
| No Computing Device | 245 | 3.5% |
| Total | 7,036 | 100.0% |
Internet Access in Oak Ridge
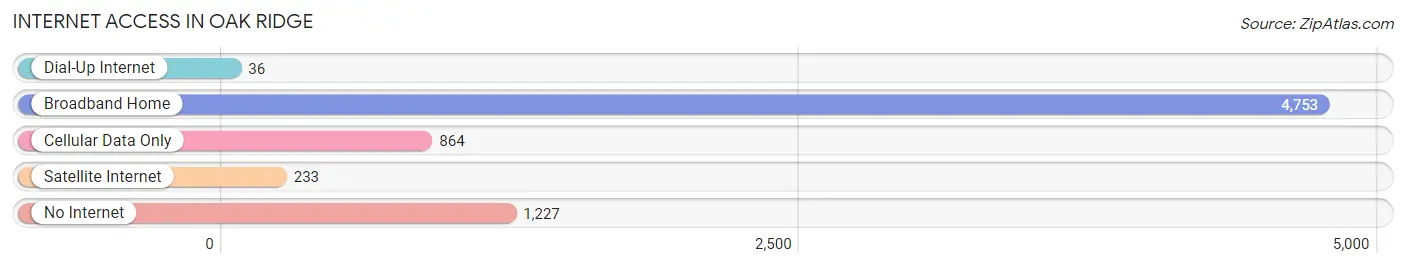
| Internet Type | # Households | % Households |
| Dial-Up Internet | 36 | 0.5% |
| Broadband Home | 4,753 | 67.5% |
| Cellular Data Only | 864 | 12.3% |
| Satellite Internet | 233 | 3.3% |
| No Internet | 1,227 | 17.4% |
| Total | 7,036 | 100.0% |
Oak Ridge Summary
History
Oak Ridge is a small unincorporated community located in Orange County, Florida. It is situated in the northwest corner of the county, just south of the city of Orlando. The area was first settled in the late 1800s by a group of settlers from the nearby town of Winter Garden. The settlers named the area Oak Ridge due to the abundance of oak trees in the area.
The area remained largely rural until the 1950s when the population began to grow rapidly. This growth was due to the construction of the nearby Orlando International Airport and the development of the nearby Walt Disney World Resort. The population of Oak Ridge continued to grow throughout the 1960s and 1970s, and by the 1980s the area had become a popular residential area for families.
In the 1990s, Oak Ridge experienced a period of rapid growth and development. This was due to the construction of the nearby Universal Studios Florida theme park and the expansion of the nearby Orlando International Airport. The population of Oak Ridge continued to grow throughout the 2000s and 2010s, and as of 2020, the population is estimated to be around 8,000.
Geography
Oak Ridge is located in the northwest corner of Orange County, Florida. It is situated just south of the city of Orlando and is bordered by the cities of Winter Garden and Ocoee to the west, and the city of Apopka to the north. The area is mostly flat and is characterized by sandy soils and oak trees. The area is also home to several small lakes, including Lake Apopka, Lake Butler, and Lake Holden.
The climate in Oak Ridge is classified as humid subtropical, with hot, humid summers and mild winters. The average temperature in the summer is around 90°F (32°C), and the average temperature in the winter is around 60°F (15°C). The area receives an average of 54 inches (137 cm) of rain per year.
Economy
Oak Ridge is primarily a residential area, with most of the population employed in the nearby cities of Orlando and Winter Garden. The area is also home to several small businesses, including restaurants, retail stores, and professional services.
The area is also home to several large employers, including the Orlando International Airport, Universal Studios Florida, and the Walt Disney World Resort. These employers provide thousands of jobs to the local economy.
Demographics
As of 2020, the population of Oak Ridge is estimated to be around 8,000. The population is primarily white (77.3%), followed by African American (14.2%), Hispanic (4.7%), and Asian (3.8%). The median household income is $50,000, and the median home value is $200,000. The area is served by the Orange County Public Schools system.
Common Questions
What is Per Capita Income in Oak Ridge?
Per Capita income in Oak Ridge is $19,189.
What is the Median Family Income in Oak Ridge?
Median Family Income in Oak Ridge is $46,772.
What is the Median Household income in Oak Ridge?
Median Household Income in Oak Ridge is $50,322.
What is Income or Wage Gap in Oak Ridge?
Income or Wage Gap in Oak Ridge is 7.7%.
Women in Oak Ridge earn 92.3 cents for every dollar earned by a man.
What is Family Income Deficit in Oak Ridge?
Family Income Deficit in Oak Ridge is $5,580.
Families that are below poverty line in Oak Ridge earn $5,580 less on average than the poverty threshold level.
What is Inequality or Gini Index in Oak Ridge?
Inequality or Gini Index in Oak Ridge is 0.35.
What is the Total Population of Oak Ridge?
Total Population of Oak Ridge is 24,476.
What is the Total Male Population of Oak Ridge?
Total Male Population of Oak Ridge is 13,487.
What is the Total Female Population of Oak Ridge?
Total Female Population of Oak Ridge is 10,989.
What is the Ratio of Males per 100 Females in Oak Ridge?
There are 122.73 Males per 100 Females in Oak Ridge.
What is the Ratio of Females per 100 Males in Oak Ridge?
There are 81.48 Females per 100 Males in Oak Ridge.
What is the Median Population Age in Oak Ridge?
Median Population Age in Oak Ridge is 33.5 Years.
What is the Average Family Size in Oak Ridge
Average Family Size in Oak Ridge is 4.2 People.
What is the Average Household Size in Oak Ridge
Average Household Size in Oak Ridge is 3.5 People.
How Large is the Labor Force in Oak Ridge?
There are 13,302 People in the Labor Forcein in Oak Ridge.
What is the Percentage of People in the Labor Force in Oak Ridge?
68.7% of People are in the Labor Force in Oak Ridge.
What is the Unemployment Rate in Oak Ridge?
Unemployment Rate in Oak Ridge is 6.2%.