Lantana, FL Map & Demographics
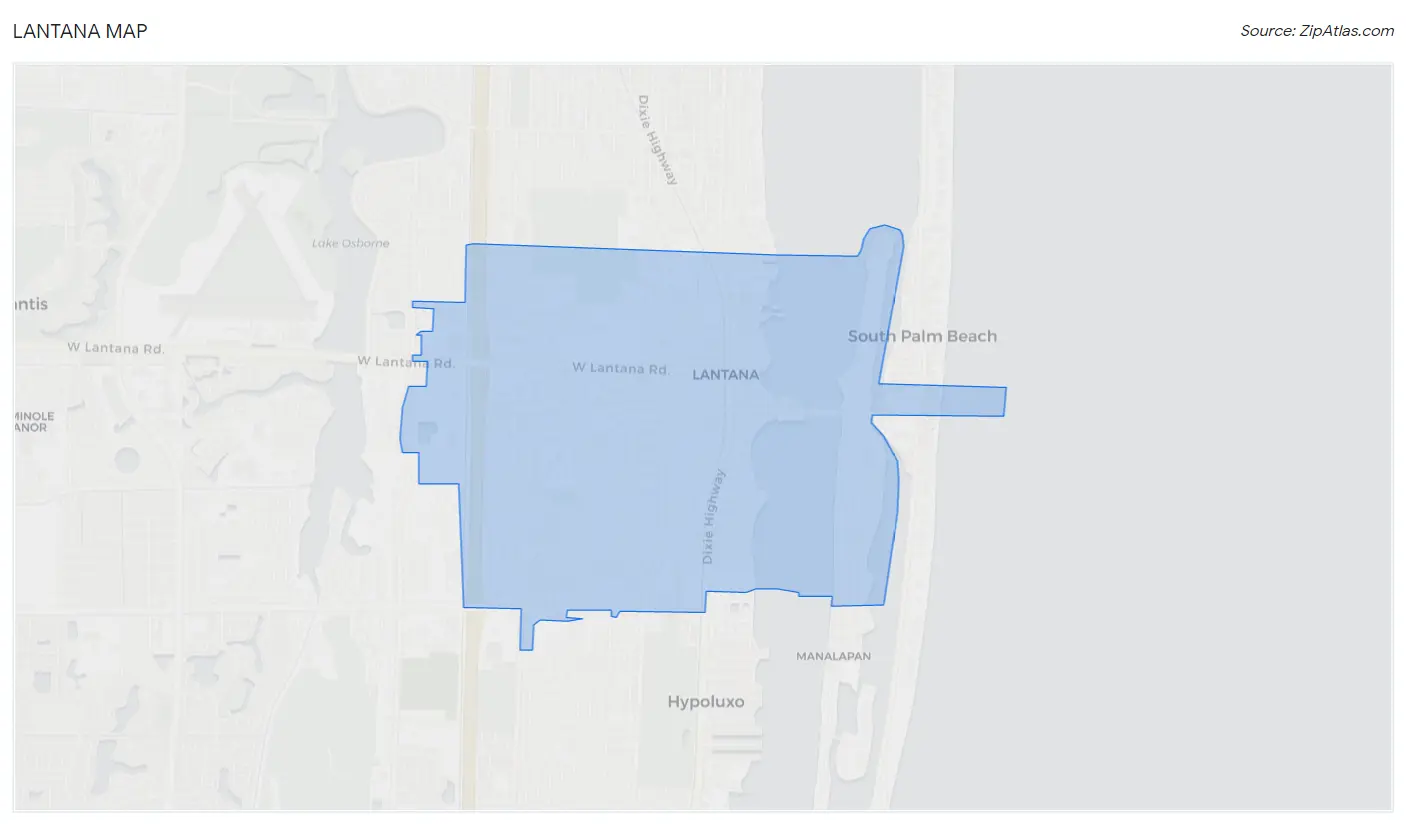
Lantana Map
Lantana Overview
$42,097
PER CAPITA INCOME
$94,103
AVG FAMILY INCOME
$67,009
AVG HOUSEHOLD INCOME
4.6%
WAGE / INCOME GAP [ % ]
95.4¢/ $1
WAGE / INCOME GAP [ $ ]
0.51
INEQUALITY / GINI INDEX
11,703
TOTAL POPULATION
6,459
MALE POPULATION
5,244
FEMALE POPULATION
123.17
MALES / 100 FEMALES
81.19
FEMALES / 100 MALES
41.1
MEDIAN AGE
3.2
AVG FAMILY SIZE
2.4
AVG HOUSEHOLD SIZE
6,809
LABOR FORCE [ PEOPLE ]
65.9%
PERCENT IN LABOR FORCE
9.3%
UNEMPLOYMENT RATE
Lantana Area Codes
Income in Lantana
Income Overview in Lantana
Per Capita Income in Lantana is $42,097, while median incomes of families and households are $94,103 and $67,009 respectively.
| Characteristic | Number | Measure |
| Per Capita Income | 11,703 | $42,097 |
| Median Family Income | 2,773 | $94,103 |
| Mean Family Income | 2,773 | $127,297 |
| Median Household Income | 4,734 | $67,009 |
| Mean Household Income | 4,734 | $99,328 |
| Income Deficit | 2,773 | $0 |
| Wage / Income Gap (%) | 11,703 | 4.61% |
| Wage / Income Gap ($) | 11,703 | 95.39¢ per $1 |
| Gini / Inequality Index | 11,703 | 0.51 |
Earnings by Sex in Lantana
Average Earnings in Lantana are $38,472, $39,984 for men and $38,139 for women, a difference of 4.6%.
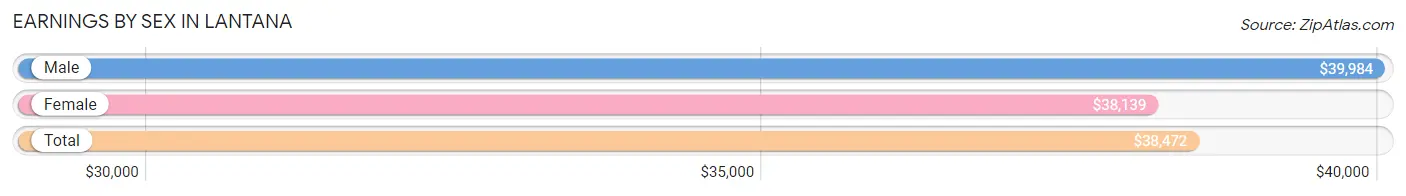
| Sex | Number | Average Earnings |
| Male | 3,689 (52.9%) | $39,984 |
| Female | 3,279 (47.1%) | $38,139 |
| Total | 6,968 (100.0%) | $38,472 |
Earnings by Sex by Income Bracket in Lantana
The most common earnings brackets in Lantana are $100,000+ for men (522 | 14.1%) and $35,000 to $39,999 for women (507 | 15.5%).
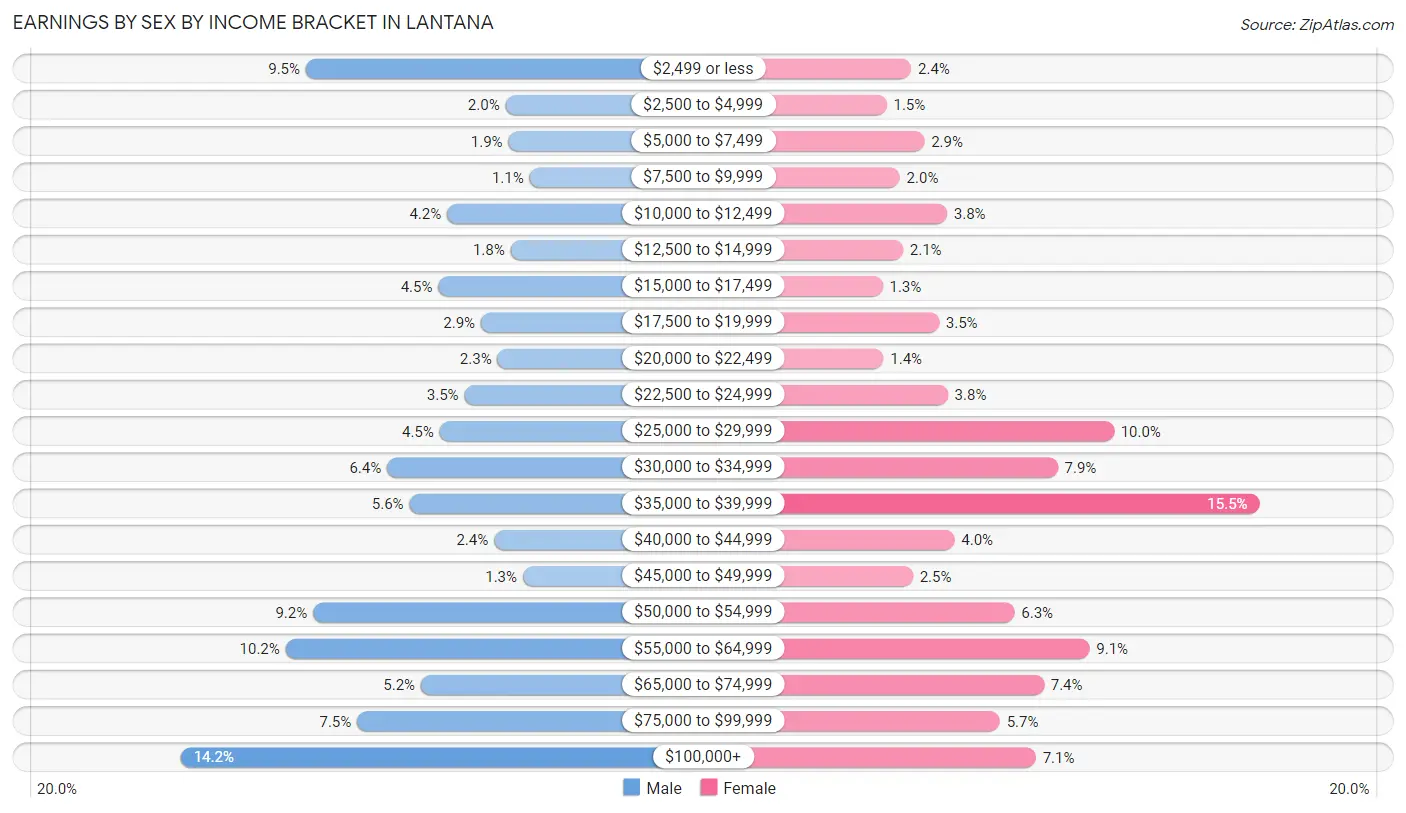
| Income | Male | Female |
| $2,499 or less | 349 (9.5%) | 79 (2.4%) |
| $2,500 to $4,999 | 73 (2.0%) | 49 (1.5%) |
| $5,000 to $7,499 | 69 (1.9%) | 95 (2.9%) |
| $7,500 to $9,999 | 40 (1.1%) | 65 (2.0%) |
| $10,000 to $12,499 | 154 (4.2%) | 123 (3.7%) |
| $12,500 to $14,999 | 66 (1.8%) | 69 (2.1%) |
| $15,000 to $17,499 | 166 (4.5%) | 44 (1.3%) |
| $17,500 to $19,999 | 107 (2.9%) | 113 (3.5%) |
| $20,000 to $22,499 | 84 (2.3%) | 45 (1.4%) |
| $22,500 to $24,999 | 130 (3.5%) | 124 (3.8%) |
| $25,000 to $29,999 | 164 (4.4%) | 328 (10.0%) |
| $30,000 to $34,999 | 237 (6.4%) | 259 (7.9%) |
| $35,000 to $39,999 | 206 (5.6%) | 507 (15.5%) |
| $40,000 to $44,999 | 89 (2.4%) | 132 (4.0%) |
| $45,000 to $49,999 | 49 (1.3%) | 81 (2.5%) |
| $50,000 to $54,999 | 339 (9.2%) | 206 (6.3%) |
| $55,000 to $64,999 | 377 (10.2%) | 298 (9.1%) |
| $65,000 to $74,999 | 190 (5.1%) | 242 (7.4%) |
| $75,000 to $99,999 | 278 (7.5%) | 188 (5.7%) |
| $100,000+ | 522 (14.1%) | 232 (7.1%) |
| Total | 3,689 (100.0%) | 3,279 (100.0%) |
Earnings by Sex by Educational Attainment in Lantana
Average earnings in Lantana are $50,120 for men and $38,786 for women, a difference of 22.6%. Men with an educational attainment of graduate degree enjoy the highest average annual earnings of $60,714, while those with high school diploma education earn the least with $35,663. Women with an educational attainment of graduate degree earn the most with the average annual earnings of $70,086, while those with high school diploma education have the smallest earnings of $28,301.
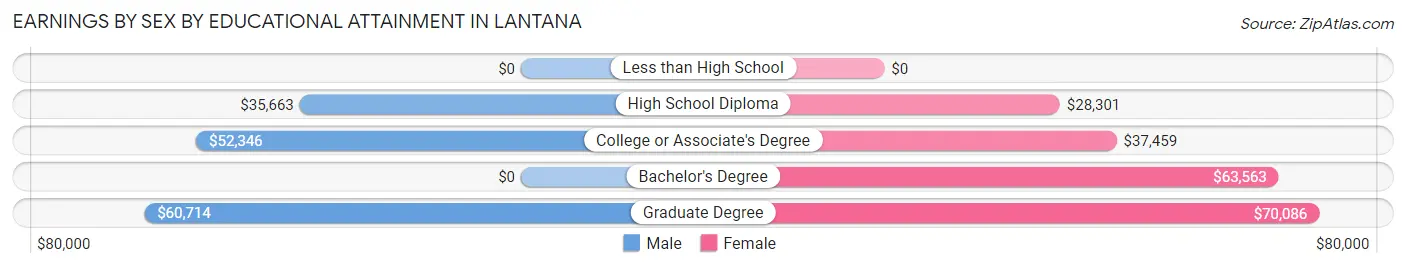
| Educational Attainment | Male Income | Female Income |
| Less than High School | - | - |
| High School Diploma | $35,663 | $28,301 |
| College or Associate's Degree | $52,346 | $37,459 |
| Bachelor's Degree | - | - |
| Graduate Degree | $60,714 | $70,086 |
| Total | $50,120 | $38,786 |
Family Income in Lantana
Family Income Brackets in Lantana
According to the Lantana family income data, there are 663 families falling into the $100,000 to $149,999 income range, which is the most common income bracket and makes up 23.9% of all families. Conversely, the $10,000 to $14,999 income bracket is the least frequent group with only 58 families (2.1%) belonging to this category.
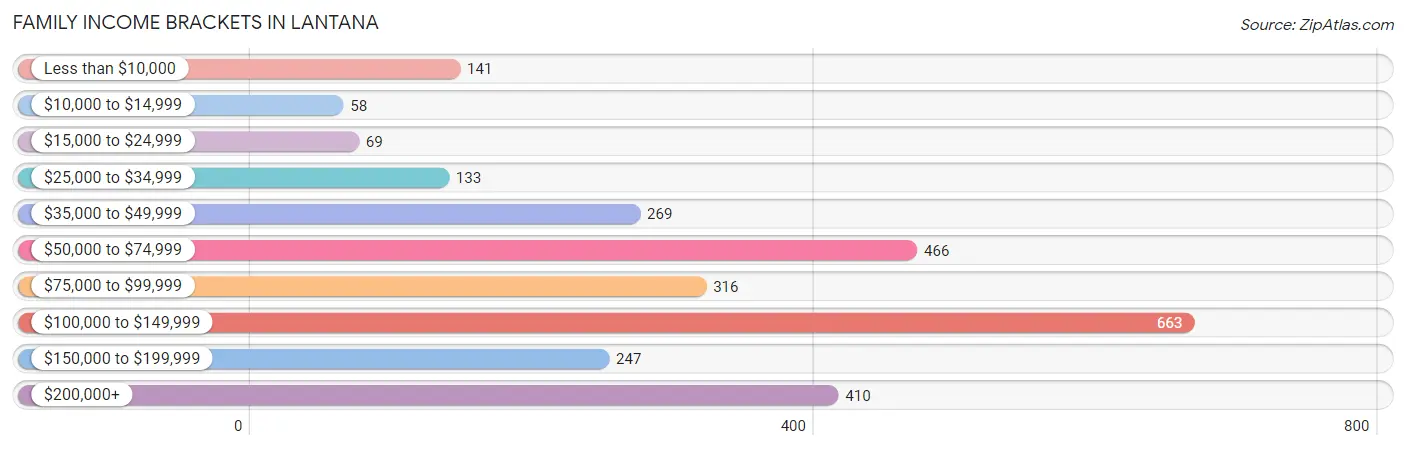
| Income Bracket | # Families | % Families |
| Less than $10,000 | 141 | 5.1% |
| $10,000 to $14,999 | 58 | 2.1% |
| $15,000 to $24,999 | 69 | 2.5% |
| $25,000 to $34,999 | 133 | 4.8% |
| $35,000 to $49,999 | 269 | 9.7% |
| $50,000 to $74,999 | 466 | 16.8% |
| $75,000 to $99,999 | 316 | 11.4% |
| $100,000 to $149,999 | 663 | 23.9% |
| $150,000 to $199,999 | 247 | 8.9% |
| $200,000+ | 410 | 14.8% |
Family Income by Famaliy Size in Lantana
4-person families (366 | 13.2%) account for the highest median family income in Lantana with $123,594 per family, while 2-person families (1,486 | 53.6%) have the highest median income of $37,954 per family member.
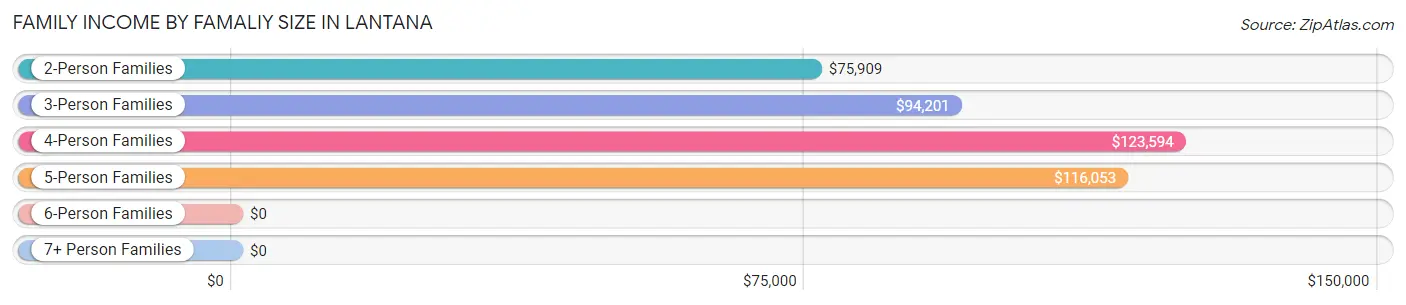
| Income Bracket | # Families | Median Income |
| 2-Person Families | 1,486 (53.6%) | $75,909 |
| 3-Person Families | 635 (22.9%) | $94,201 |
| 4-Person Families | 366 (13.2%) | $123,594 |
| 5-Person Families | 96 (3.5%) | $116,053 |
| 6-Person Families | 158 (5.7%) | $0 |
| 7+ Person Families | 32 (1.1%) | $0 |
| Total | 2,773 (100.0%) | $94,103 |
Family Income by Number of Earners in Lantana
The median family income in Lantana is $94,103, with families comprising 3+ earners (402) having the highest median family income of $138,625, while families with no earners (356) have the lowest median family income of $41,196, accounting for 14.5% and 12.8% of families, respectively.
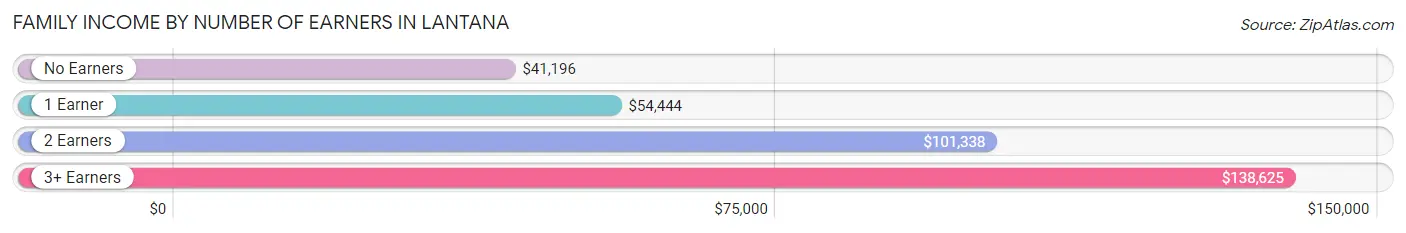
| Number of Earners | # Families | Median Income |
| No Earners | 356 (12.8%) | $41,196 |
| 1 Earner | 616 (22.2%) | $54,444 |
| 2 Earners | 1,399 (50.4%) | $101,338 |
| 3+ Earners | 402 (14.5%) | $138,625 |
| Total | 2,773 (100.0%) | $94,103 |
Household Income in Lantana
Household Income Brackets in Lantana
With 956 households falling in the category, the $100,000 to $149,999 income range is the most frequent in Lantana, accounting for 20.2% of all households. In contrast, only 151 households (3.2%) fall into the $10,000 to $14,999 income bracket, making it the least populous group.
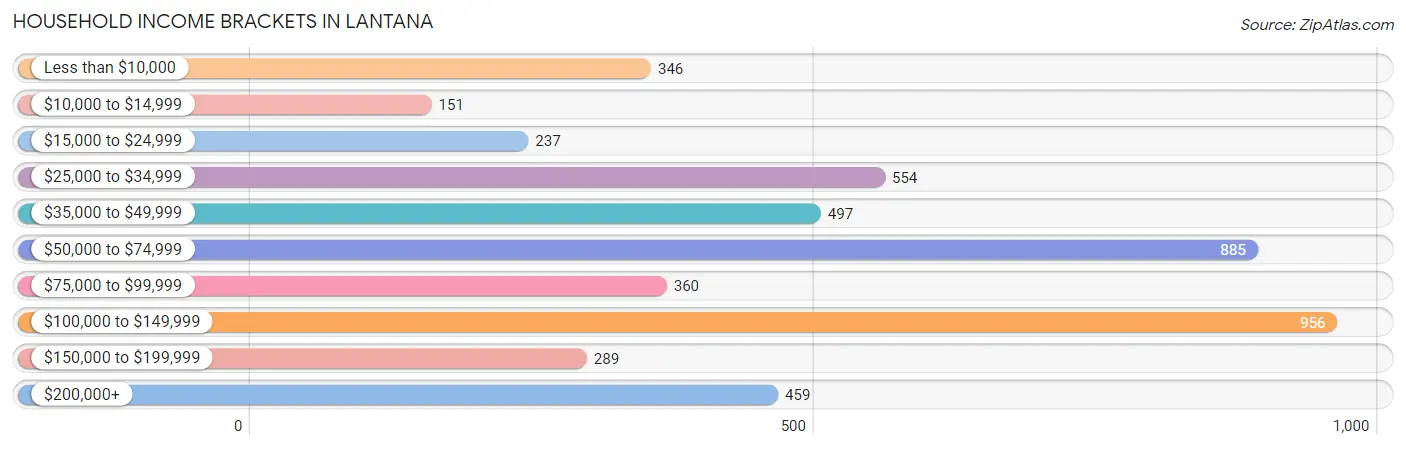
| Income Bracket | # Households | % Households |
| Less than $10,000 | 346 | 7.3% |
| $10,000 to $14,999 | 151 | 3.2% |
| $15,000 to $24,999 | 237 | 5.0% |
| $25,000 to $34,999 | 554 | 11.7% |
| $35,000 to $49,999 | 497 | 10.5% |
| $50,000 to $74,999 | 885 | 18.7% |
| $75,000 to $99,999 | 360 | 7.6% |
| $100,000 to $149,999 | 956 | 20.2% |
| $150,000 to $199,999 | 289 | 6.1% |
| $200,000+ | 459 | 9.7% |
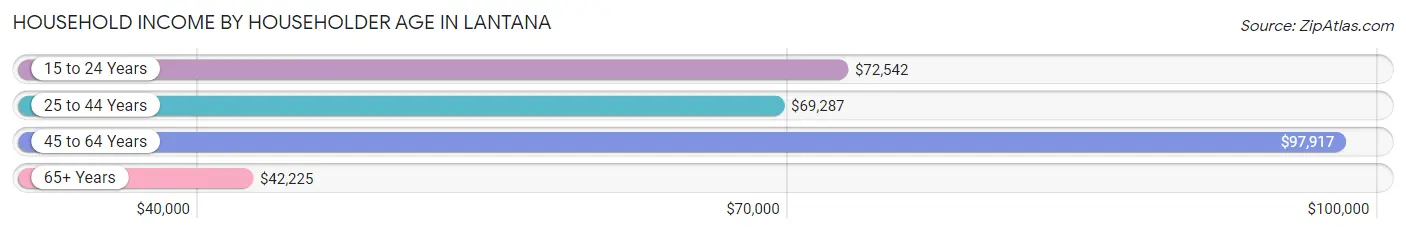
Household Income by Householder Age in Lantana
The median household income in Lantana is $67,009, with the highest median household income of $97,917 found in the 45 to 64 years age bracket for the primary householder. A total of 1,657 households (35.0%) fall into this category. Meanwhile, the 65+ years age bracket for the primary householder has the lowest median household income of $42,225, with 1,477 households (31.2%) in this group.
| Income Bracket | # Households | Median Income |
| 15 to 24 Years | 151 (3.2%) | $72,542 |
| 25 to 44 Years | 1,449 (30.6%) | $69,287 |
| 45 to 64 Years | 1,657 (35.0%) | $97,917 |
| 65+ Years | 1,477 (31.2%) | $42,225 |
| Total | 4,734 (100.0%) | $67,009 |
Poverty in Lantana
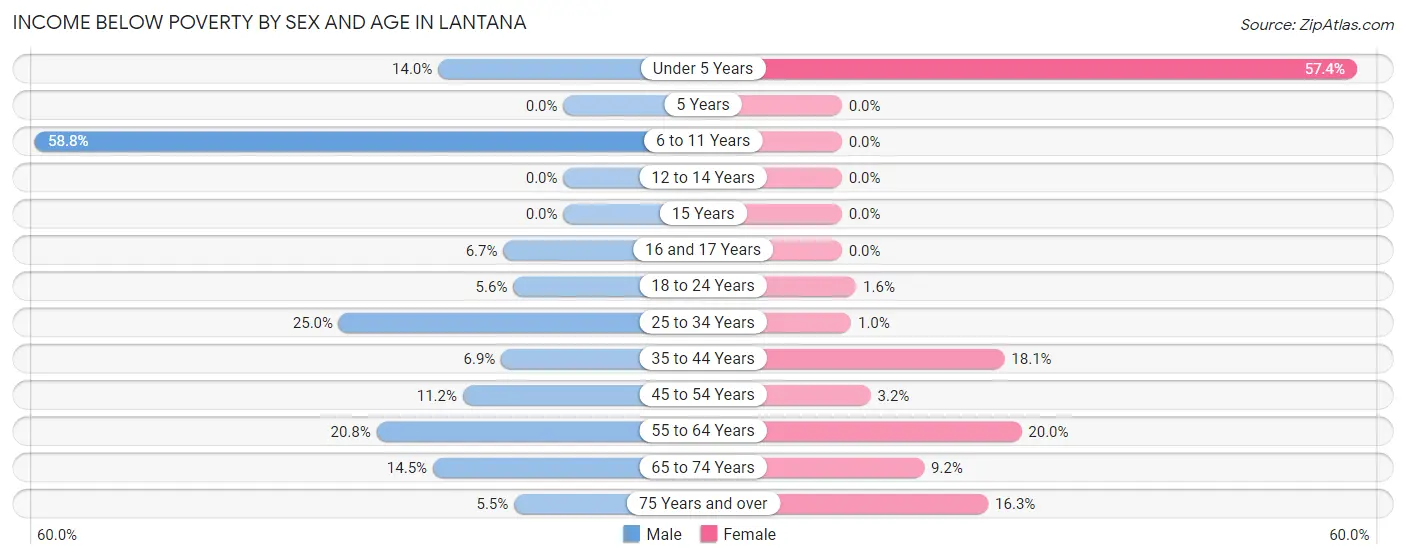
Income Below Poverty by Sex and Age in Lantana
With 13.2% poverty level for males and 9.5% for females among the residents of Lantana, 6 to 11 year old males and under 5 year old females are the most vulnerable to poverty, with 10 males (58.8%) and 39 females (57.4%) in their respective age groups living below the poverty level.
| Age Bracket | Male | Female |
| Under 5 Years | 60 (14.0%) | 39 (57.4%) |
| 5 Years | 0 (0.0%) | 0 (0.0%) |
| 6 to 11 Years | 10 (58.8%) | 0 (0.0%) |
| 12 to 14 Years | 0 (0.0%) | 0 (0.0%) |
| 15 Years | 0 (0.0%) | 0 (0.0%) |
| 16 and 17 Years | 21 (6.7%) | 0 (0.0%) |
| 18 to 24 Years | 24 (5.6%) | 6 (1.6%) |
| 25 to 34 Years | 284 (25.0%) | 11 (1.0%) |
| 35 to 44 Years | 53 (6.9%) | 146 (18.1%) |
| 45 to 54 Years | 86 (11.2%) | 27 (3.2%) |
| 55 to 64 Years | 202 (20.8%) | 137 (20.0%) |
| 65 to 74 Years | 76 (14.5%) | 43 (9.2%) |
| 75 Years and over | 28 (5.5%) | 82 (16.3%) |
| Total | 844 (13.2%) | 491 (9.5%) |
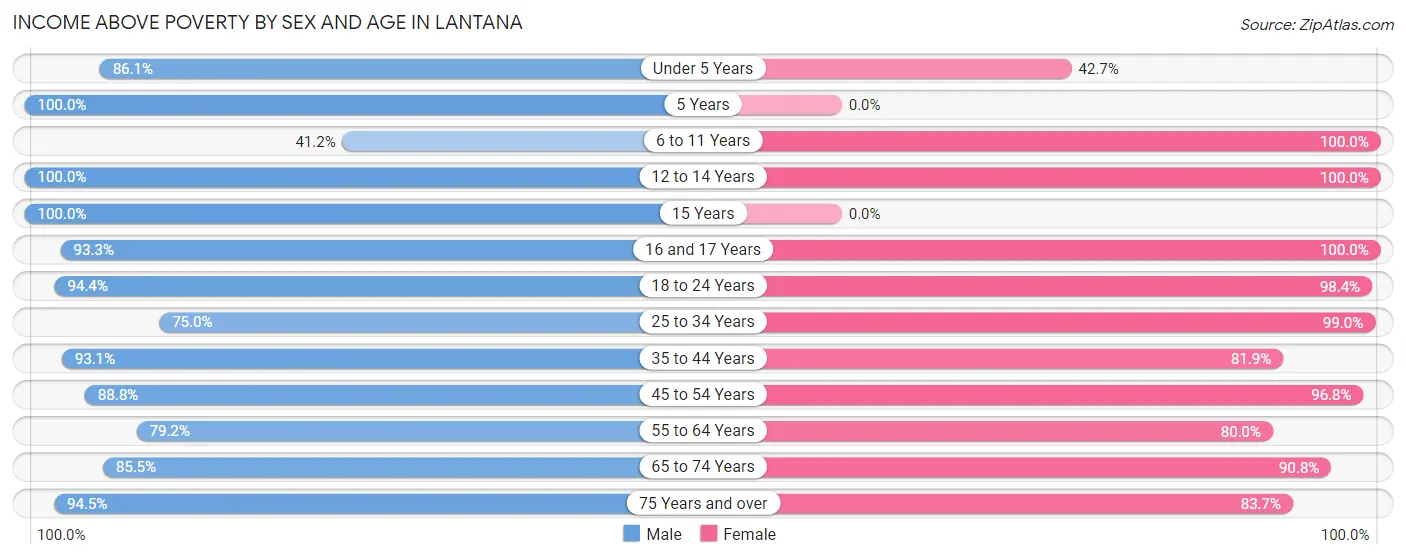
Income Above Poverty by Sex and Age in Lantana
According to the poverty statistics in Lantana, males aged 5 years and females aged 6 to 11 years are the age groups that are most secure financially, with 100.0% of males and 100.0% of females in these age groups living above the poverty line.
| Age Bracket | Male | Female |
| Under 5 Years | 370 (86.1%) | 29 (42.6%) |
| 5 Years | 44 (100.0%) | 0 (0.0%) |
| 6 to 11 Years | 7 (41.2%) | 203 (100.0%) |
| 12 to 14 Years | 451 (100.0%) | 101 (100.0%) |
| 15 Years | 38 (100.0%) | 0 (0.0%) |
| 16 and 17 Years | 293 (93.3%) | 60 (100.0%) |
| 18 to 24 Years | 406 (94.4%) | 370 (98.4%) |
| 25 to 34 Years | 852 (75.0%) | 1,060 (99.0%) |
| 35 to 44 Years | 713 (93.1%) | 660 (81.9%) |
| 45 to 54 Years | 682 (88.8%) | 813 (96.8%) |
| 55 to 64 Years | 769 (79.2%) | 548 (80.0%) |
| 65 to 74 Years | 447 (85.5%) | 426 (90.8%) |
| 75 Years and over | 483 (94.5%) | 421 (83.7%) |
| Total | 5,555 (86.8%) | 4,691 (90.5%) |
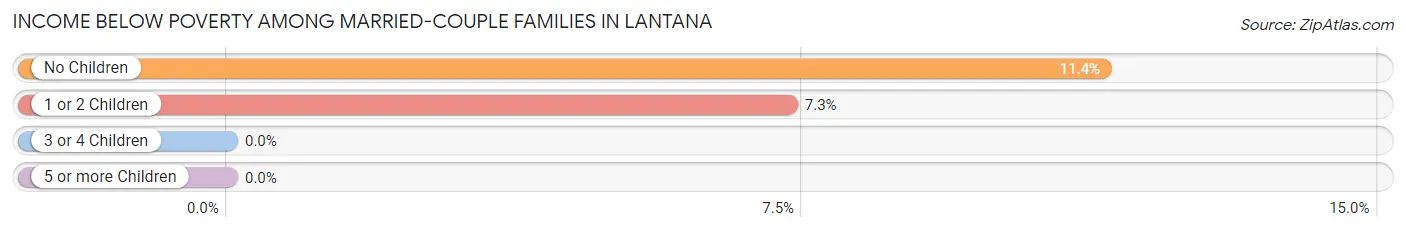
Income Below Poverty Among Married-Couple Families in Lantana
The poverty statistics for married-couple families in Lantana show that 9.8% or 184 of the total 1,876 families live below the poverty line. Families with no children have the highest poverty rate of 11.4%, comprising of 137 families. On the other hand, families with 3 or 4 children have the lowest poverty rate of 0.0%, which includes 0 families.
| Children | Above Poverty | Below Poverty |
| No Children | 1,064 (88.6%) | 137 (11.4%) |
| 1 or 2 Children | 596 (92.7%) | 47 (7.3%) |
| 3 or 4 Children | 32 (100.0%) | 0 (0.0%) |
| 5 or more Children | 0 (0.0%) | 0 (0.0%) |
| Total | 1,692 (90.2%) | 184 (9.8%) |
Income Below Poverty Among Single-Parent Households in Lantana
According to the poverty data in Lantana, 8.1% or 32 single-father households and 5.4% or 27 single-mother households are living below the poverty line. Among single-father households, those with 1 or 2 children have the highest poverty rate, with 21 households (24.4%) experiencing poverty. Likewise, among single-mother households, those with no children have the highest poverty rate, with 18 households (7.3%) falling below the poverty line.
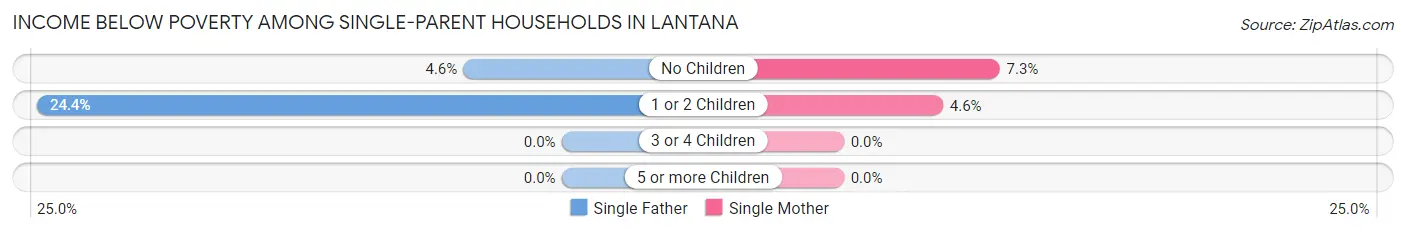
| Children | Single Father | Single Mother |
| No Children | 11 (4.6%) | 18 (7.3%) |
| 1 or 2 Children | 21 (24.4%) | 9 (4.6%) |
| 3 or 4 Children | 0 (0.0%) | 0 (0.0%) |
| 5 or more Children | 0 (0.0%) | 0 (0.0%) |
| Total | 32 (8.1%) | 27 (5.4%) |
Income Below Poverty Among Married-Couple vs Single-Parent Households in Lantana
The poverty data for Lantana shows that 184 of the married-couple family households (9.8%) and 59 of the single-parent households (6.6%) are living below the poverty level. Within the married-couple family households, those with no children have the highest poverty rate, with 137 households (11.4%) falling below the poverty line. Among the single-parent households, those with 1 or 2 children have the highest poverty rate, with 30 household (10.7%) living below poverty.
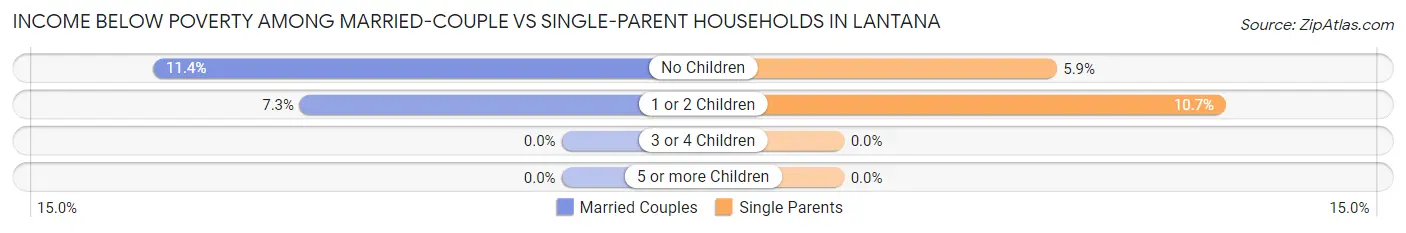
| Children | Married-Couple Families | Single-Parent Households |
| No Children | 137 (11.4%) | 29 (5.9%) |
| 1 or 2 Children | 47 (7.3%) | 30 (10.7%) |
| 3 or 4 Children | 0 (0.0%) | 0 (0.0%) |
| 5 or more Children | 0 (0.0%) | 0 (0.0%) |
| Total | 184 (9.8%) | 59 (6.6%) |
Race in Lantana
The most populous races in Lantana are White / Caucasian (6,428 | 54.9%), Black / African American (3,550 | 30.3%), and Hispanic or Latino (2,122 | 18.1%).
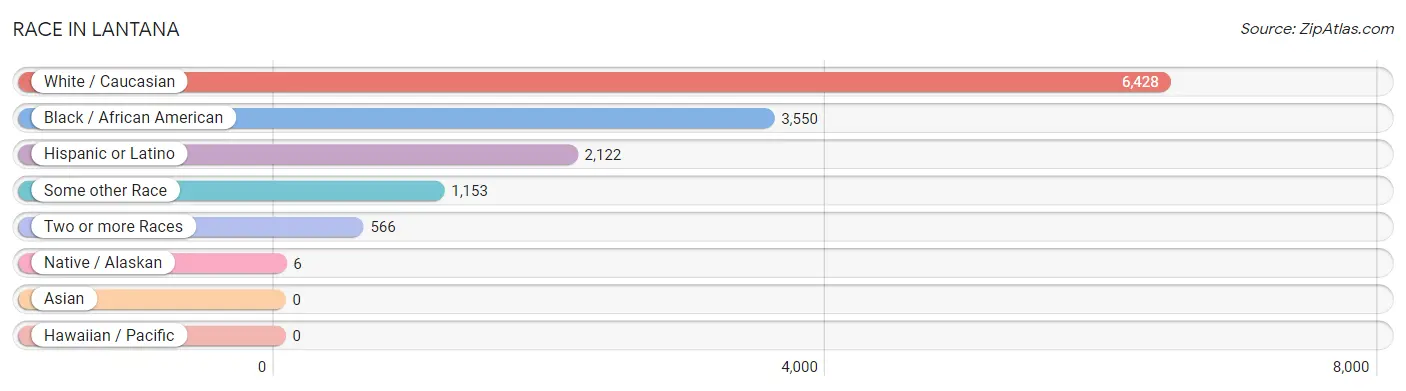
| Race | # Population | % Population |
| Asian | 0 | 0.0% |
| Black / African American | 3,550 | 30.3% |
| Hawaiian / Pacific | 0 | 0.0% |
| Hispanic or Latino | 2,122 | 18.1% |
| Native / Alaskan | 6 | 0.1% |
| White / Caucasian | 6,428 | 54.9% |
| Two or more Races | 566 | 4.8% |
| Some other Race | 1,153 | 9.9% |
| Total | 11,703 | 100.0% |
Ancestry in Lantana
The most populous ancestries reported in Lantana are Haitian (1,469 | 12.6%), German (986 | 8.4%), Irish (970 | 8.3%), English (917 | 7.8%), and Italian (891 | 7.6%), together accounting for 44.7% of all Lantana residents.
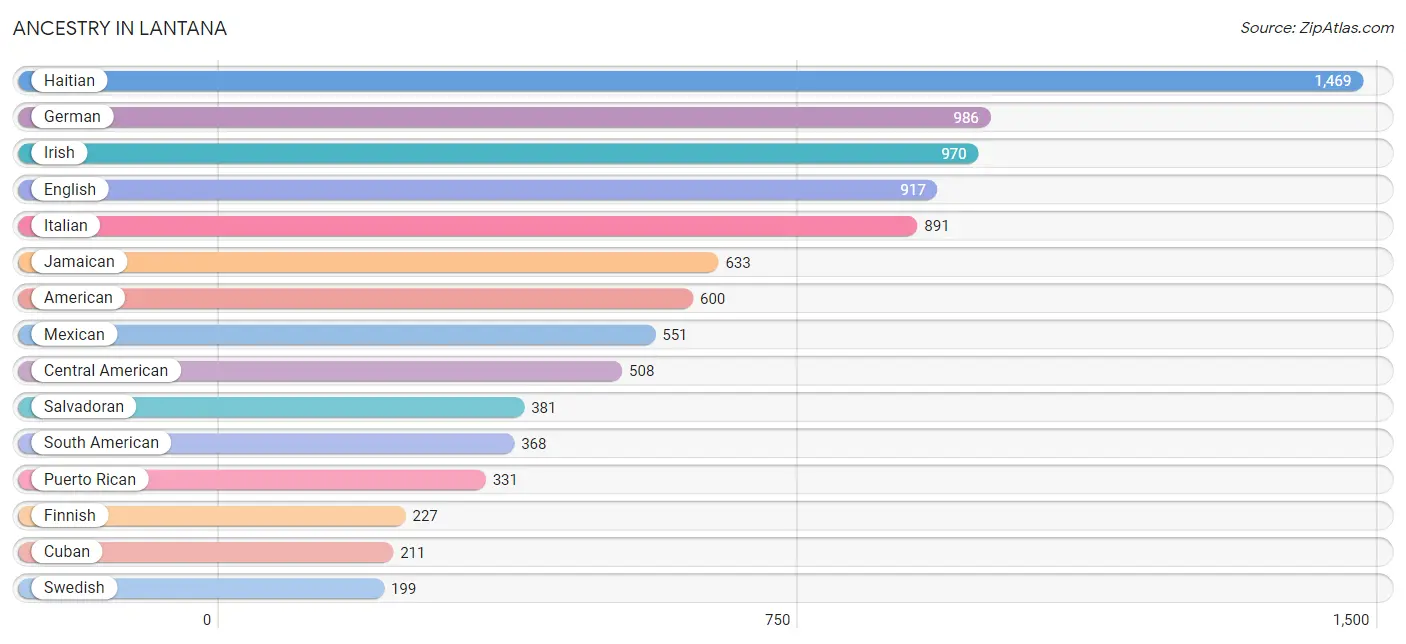
| Ancestry | # Population | % Population |
| African | 127 | 1.1% |
| Alsatian | 22 | 0.2% |
| American | 600 | 5.1% |
| Argentinean | 162 | 1.4% |
| Armenian | 12 | 0.1% |
| Bahamian | 15 | 0.1% |
| Belgian | 92 | 0.8% |
| Bolivian | 15 | 0.1% |
| Brazilian | 149 | 1.3% |
| British | 34 | 0.3% |
| Cajun | 30 | 0.3% |
| Central American | 508 | 4.3% |
| Cherokee | 19 | 0.2% |
| Chilean | 17 | 0.2% |
| Colombian | 89 | 0.8% |
| Costa Rican | 39 | 0.3% |
| Croatian | 28 | 0.2% |
| Cuban | 211 | 1.8% |
| Czech | 57 | 0.5% |
| Danish | 41 | 0.4% |
| Dominican | 106 | 0.9% |
| Dutch | 80 | 0.7% |
| Eastern European | 5 | 0.0% |
| English | 917 | 7.8% |
| European | 98 | 0.8% |
| Finnish | 227 | 1.9% |
| French | 65 | 0.6% |
| German | 986 | 8.4% |
| Greek | 29 | 0.3% |
| Guatemalan | 63 | 0.5% |
| Haitian | 1,469 | 12.6% |
| Honduran | 8 | 0.1% |
| Hungarian | 17 | 0.2% |
| Irish | 970 | 8.3% |
| Israeli | 30 | 0.3% |
| Italian | 891 | 7.6% |
| Jamaican | 633 | 5.4% |
| Korean | 24 | 0.2% |
| Lithuanian | 9 | 0.1% |
| Maltese | 14 | 0.1% |
| Mexican | 551 | 4.7% |
| Nicaraguan | 17 | 0.2% |
| Norwegian | 20 | 0.2% |
| Peruvian | 9 | 0.1% |
| Polish | 193 | 1.7% |
| Portuguese | 18 | 0.2% |
| Puerto Rican | 331 | 2.8% |
| Romanian | 42 | 0.4% |
| Russian | 192 | 1.6% |
| Salvadoran | 381 | 3.3% |
| Scandinavian | 6 | 0.1% |
| Scotch-Irish | 108 | 0.9% |
| Scottish | 65 | 0.6% |
| Serbian | 38 | 0.3% |
| Slovak | 10 | 0.1% |
| South American | 368 | 3.1% |
| Spaniard | 11 | 0.1% |
| Spanish | 27 | 0.2% |
| Subsaharan African | 127 | 1.1% |
| Swedish | 199 | 1.7% |
| Swiss | 30 | 0.3% |
| Turkish | 4 | 0.0% |
| Ukrainian | 98 | 0.8% |
| Venezuelan | 76 | 0.6% |
| Welsh | 76 | 0.6% | View All 65 Rows |
Immigrants in Lantana
The most numerous immigrant groups reported in Lantana came from Latin America (2,767 | 23.6%), Caribbean (2,049 | 17.5%), Haiti (1,490 | 12.7%), Europe (394 | 3.4%), and Central America (391 | 3.3%), together accounting for 60.6% of all Lantana residents.
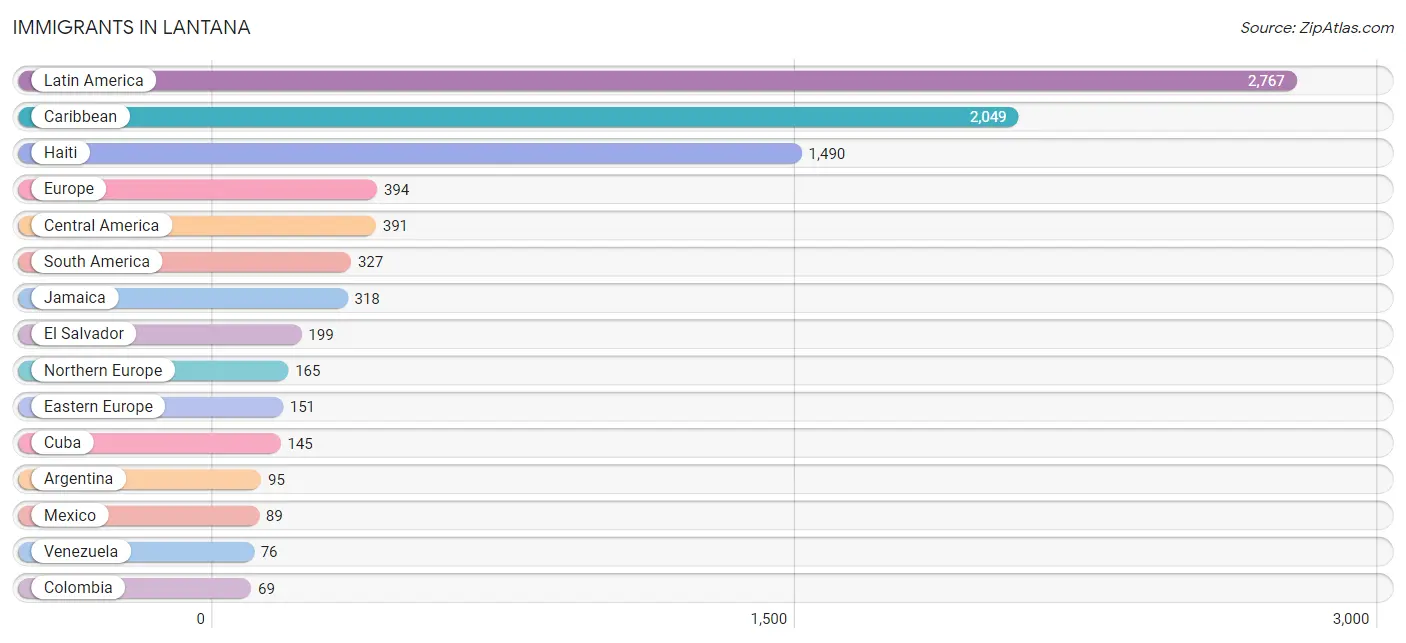
| Immigration Origin | # Population | % Population |
| Argentina | 95 | 0.8% |
| Asia | 56 | 0.5% |
| Australia | 9 | 0.1% |
| Bahamas | 15 | 0.1% |
| Belgium | 35 | 0.3% |
| Bolivia | 15 | 0.1% |
| Canada | 29 | 0.3% |
| Caribbean | 2,049 | 17.5% |
| Central America | 391 | 3.3% |
| China | 26 | 0.2% |
| Colombia | 69 | 0.6% |
| Costa Rica | 39 | 0.3% |
| Cuba | 145 | 1.2% |
| Czechoslovakia | 7 | 0.1% |
| Dominican Republic | 62 | 0.5% |
| Eastern Asia | 26 | 0.2% |
| Eastern Europe | 151 | 1.3% |
| El Salvador | 199 | 1.7% |
| Europe | 394 | 3.4% |
| Germany | 32 | 0.3% |
| Guatemala | 39 | 0.3% |
| Guyana | 60 | 0.5% |
| Haiti | 1,490 | 12.7% |
| Honduras | 8 | 0.1% |
| Israel | 30 | 0.3% |
| Italy | 11 | 0.1% |
| Jamaica | 318 | 2.7% |
| Latin America | 2,767 | 23.6% |
| Mexico | 89 | 0.8% |
| Nicaragua | 17 | 0.2% |
| Northern Europe | 165 | 1.4% |
| Oceania | 9 | 0.1% |
| Peru | 12 | 0.1% |
| Poland | 20 | 0.2% |
| Romania | 18 | 0.2% |
| Russia | 20 | 0.2% |
| Serbia | 38 | 0.3% |
| South America | 327 | 2.8% |
| Southern Europe | 11 | 0.1% |
| Ukraine | 48 | 0.4% |
| Venezuela | 76 | 0.6% |
| West Indies | 19 | 0.2% |
| Western Asia | 30 | 0.3% |
| Western Europe | 67 | 0.6% | View All 44 Rows |
Sex and Age in Lantana
Sex and Age in Lantana
The most populous age groups in Lantana are 25 to 29 Years (655 | 10.1%) for men and 25 to 29 Years (549 | 10.5%) for women.
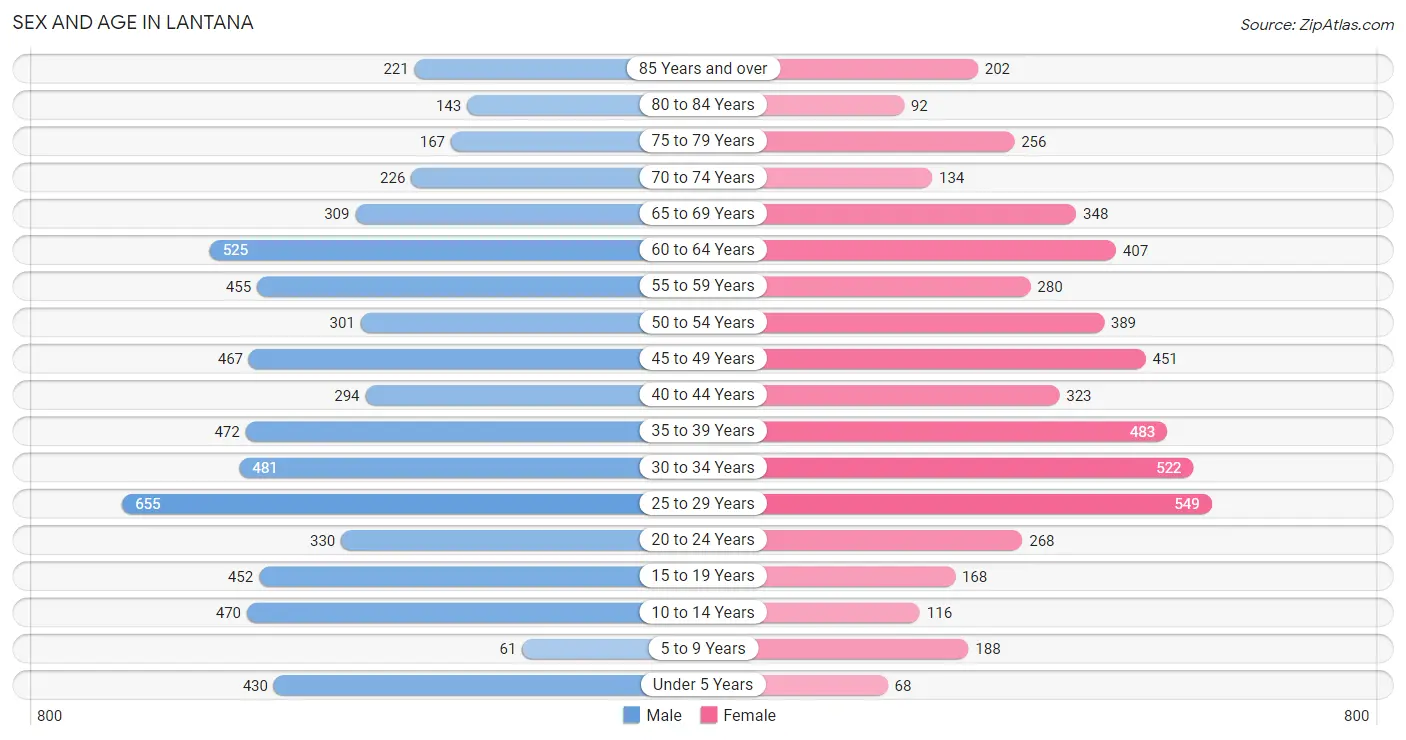
| Age Bracket | Male | Female |
| Under 5 Years | 430 (6.7%) | 68 (1.3%) |
| 5 to 9 Years | 61 (0.9%) | 188 (3.6%) |
| 10 to 14 Years | 470 (7.3%) | 116 (2.2%) |
| 15 to 19 Years | 452 (7.0%) | 168 (3.2%) |
| 20 to 24 Years | 330 (5.1%) | 268 (5.1%) |
| 25 to 29 Years | 655 (10.1%) | 549 (10.5%) |
| 30 to 34 Years | 481 (7.4%) | 522 (10.0%) |
| 35 to 39 Years | 472 (7.3%) | 483 (9.2%) |
| 40 to 44 Years | 294 (4.5%) | 323 (6.2%) |
| 45 to 49 Years | 467 (7.2%) | 451 (8.6%) |
| 50 to 54 Years | 301 (4.7%) | 389 (7.4%) |
| 55 to 59 Years | 455 (7.0%) | 280 (5.3%) |
| 60 to 64 Years | 525 (8.1%) | 407 (7.8%) |
| 65 to 69 Years | 309 (4.8%) | 348 (6.6%) |
| 70 to 74 Years | 226 (3.5%) | 134 (2.6%) |
| 75 to 79 Years | 167 (2.6%) | 256 (4.9%) |
| 80 to 84 Years | 143 (2.2%) | 92 (1.8%) |
| 85 Years and over | 221 (3.4%) | 202 (3.8%) |
| Total | 6,459 (100.0%) | 5,244 (100.0%) |
Families and Households in Lantana
Median Family Size in Lantana
The median family size in Lantana is 3.18 persons per family, with single male/father families (394 | 14.2%) accounting for the largest median family size of 3.59 persons per family. On the other hand, married-couple families (1,876 | 67.6%) represent the smallest median family size with 3.00 persons per family.
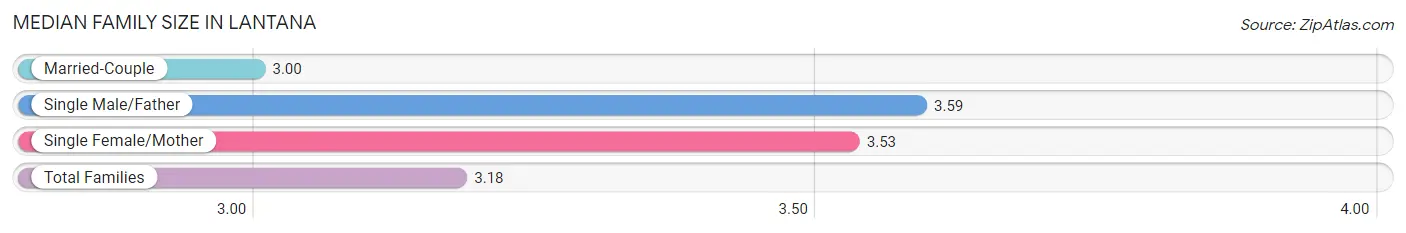
| Family Type | # Families | Family Size |
| Married-Couple | 1,876 (67.6%) | 3.00 |
| Single Male/Father | 394 (14.2%) | 3.59 |
| Single Female/Mother | 503 (18.1%) | 3.53 |
| Total Families | 2,773 (100.0%) | 3.18 |
Median Household Size in Lantana
The median household size in Lantana is 2.43 persons per household, with single male/father households (394 | 8.3%) accounting for the largest median household size of 3.87 persons per household. non-family households (1,961 | 41.4%) represent the smallest median household size with 1.22 persons per household.
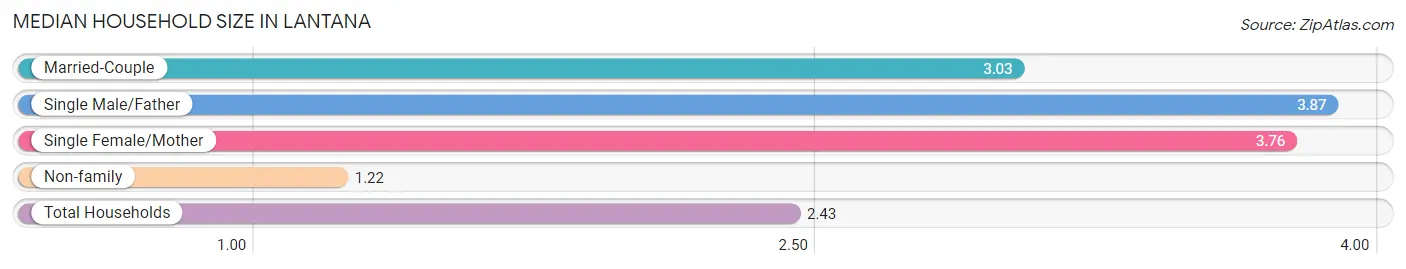
| Household Type | # Households | Household Size |
| Married-Couple | 1,876 (39.6%) | 3.03 |
| Single Male/Father | 394 (8.3%) | 3.87 |
| Single Female/Mother | 503 (10.6%) | 3.76 |
| Non-family | 1,961 (41.4%) | 1.22 |
| Total Households | 4,734 (100.0%) | 2.43 |
Household Size by Marriage Status in Lantana
Out of a total of 4,734 households in Lantana, 2,773 (58.6%) are family households, while 1,961 (41.4%) are nonfamily households. The most numerous type of family households are 2-person households, comprising 1,415, and the most common type of nonfamily households are 1-person households, comprising 1,569.
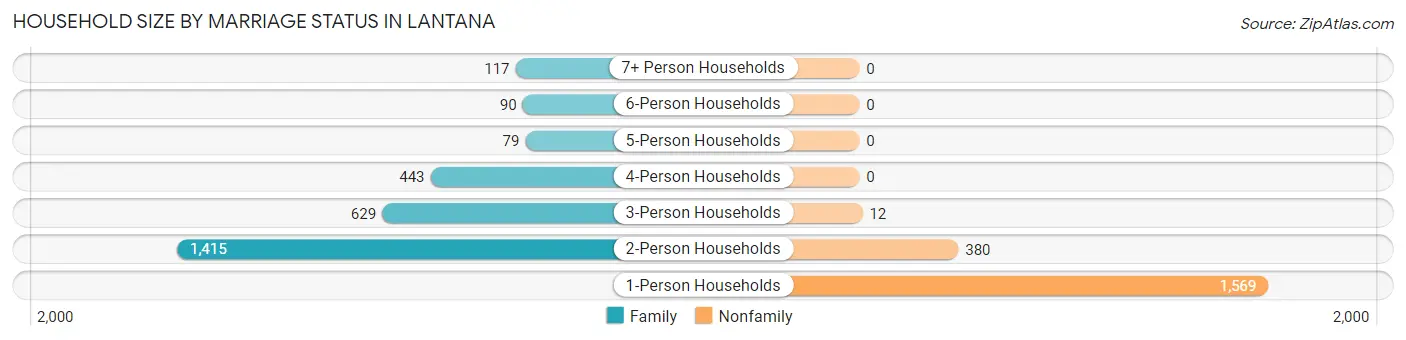
| Household Size | Family Households | Nonfamily Households |
| 1-Person Households | - | 1,569 (33.1%) |
| 2-Person Households | 1,415 (29.9%) | 380 (8.0%) |
| 3-Person Households | 629 (13.3%) | 12 (0.3%) |
| 4-Person Households | 443 (9.4%) | 0 (0.0%) |
| 5-Person Households | 79 (1.7%) | 0 (0.0%) |
| 6-Person Households | 90 (1.9%) | 0 (0.0%) |
| 7+ Person Households | 117 (2.5%) | 0 (0.0%) |
| Total | 2,773 (58.6%) | 1,961 (41.4%) |
Female Fertility in Lantana
Fertility by Age in Lantana
Average fertility rate in Lantana is 30.0 births per 1,000 women. Women in the age bracket of 20 to 34 years have the highest fertility rate with 63.0 births per 1,000 women. Women in the age bracket of 20 to 34 years acount for 100.0% of all women with births.
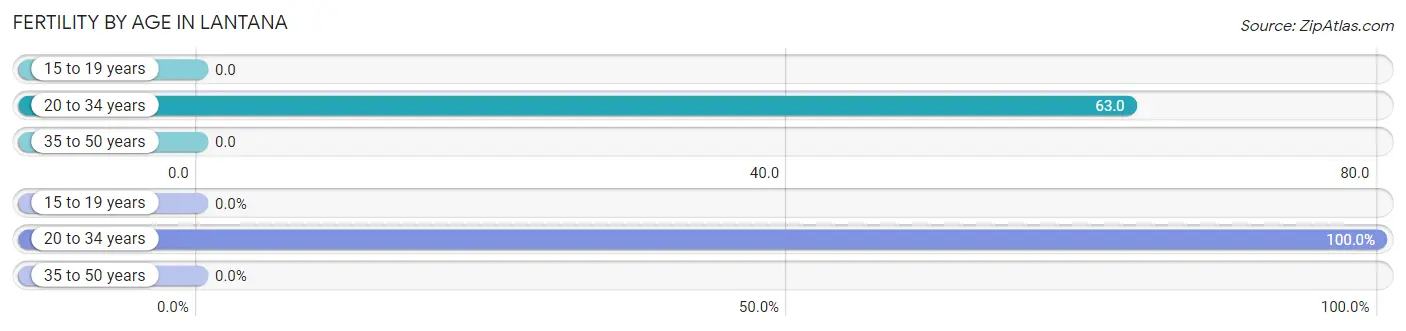
| Age Bracket | Women with Births | Births / 1,000 Women |
| 15 to 19 years | 0 (0.0%) | 0.0 |
| 20 to 34 years | 84 (100.0%) | 63.0 |
| 35 to 50 years | 0 (0.0%) | 0.0 |
| Total | 84 (100.0%) | 30.0 |
Fertility by Age by Marriage Status in Lantana
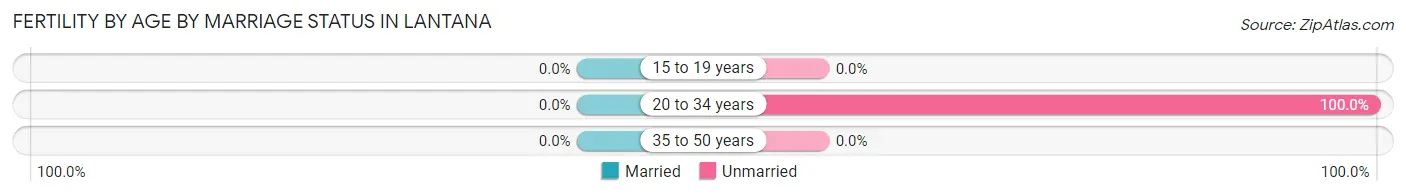
| Age Bracket | Married | Unmarried |
| 15 to 19 years | 0 (0.0%) | 0 (0.0%) |
| 20 to 34 years | 0 (0.0%) | 84 (100.0%) |
| 35 to 50 years | 0 (0.0%) | 0 (0.0%) |
| Total | 0 (0.0%) | 84 (100.0%) |
Fertility by Education in Lantana
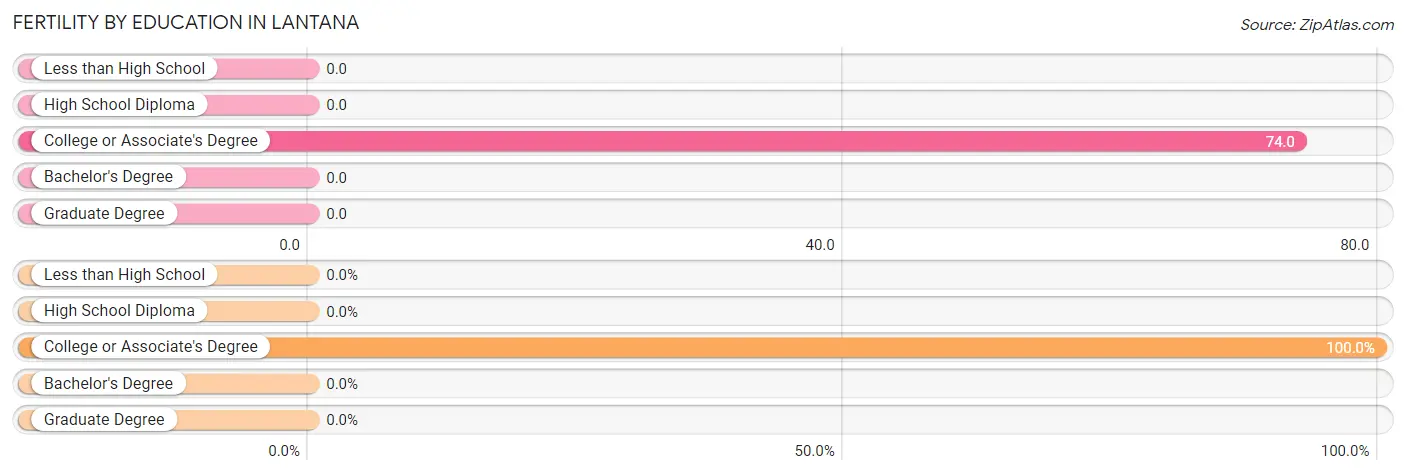
| Educational Attainment | Women with Births | Births / 1,000 Women |
| Less than High School | 0 (0.0%) | 0.0 |
| High School Diploma | 0 (0.0%) | 0.0 |
| College or Associate's Degree | 84 (100.0%) | 74.0 |
| Bachelor's Degree | 0 (0.0%) | 0.0 |
| Graduate Degree | 0 (0.0%) | 0.0 |
| Total | 84 (100.0%) | 30.0 |
Fertility by Education by Marriage Status in Lantana
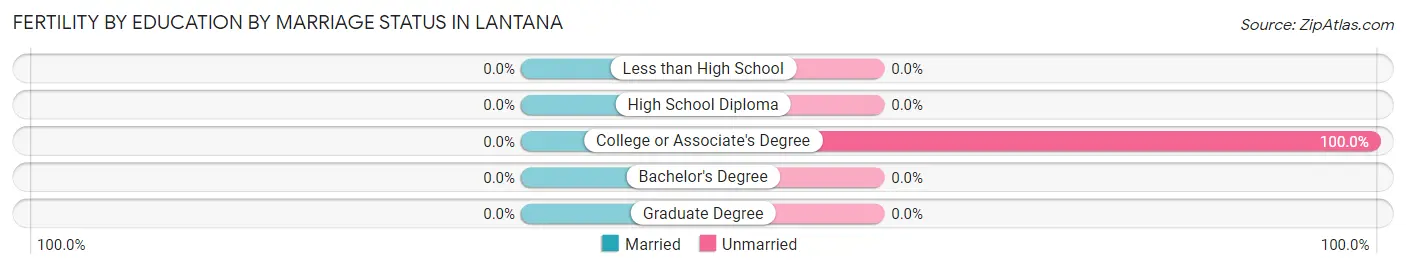
| Educational Attainment | Married | Unmarried |
| Less than High School | 0 (0.0%) | 0 (0.0%) |
| High School Diploma | 0 (0.0%) | 0 (0.0%) |
| College or Associate's Degree | 0 (0.0%) | 84 (100.0%) |
| Bachelor's Degree | 0 (0.0%) | 0 (0.0%) |
| Graduate Degree | 0 (0.0%) | 0 (0.0%) |
| Total | 0 (0.0%) | 84 (100.0%) |
Employment Characteristics in Lantana
Employment by Class of Employer in Lantana
Among the 6,020 employed individuals in Lantana, private company employees (4,094 | 68.0%), local government employees (510 | 8.5%), and self-employed (incorporated) (430 | 7.1%) make up the most common classes of employment.
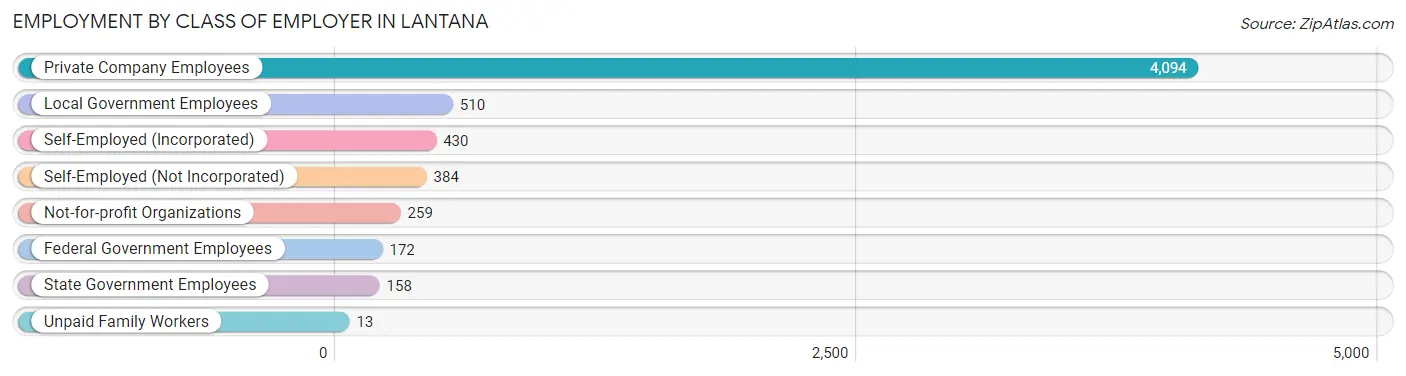
| Employer Class | # Employees | % Employees |
| Private Company Employees | 4,094 | 68.0% |
| Self-Employed (Incorporated) | 430 | 7.1% |
| Self-Employed (Not Incorporated) | 384 | 6.4% |
| Not-for-profit Organizations | 259 | 4.3% |
| Local Government Employees | 510 | 8.5% |
| State Government Employees | 158 | 2.6% |
| Federal Government Employees | 172 | 2.9% |
| Unpaid Family Workers | 13 | 0.2% |
| Total | 6,020 | 100.0% |
Employment Status by Age in Lantana
According to the labor force statistics for Lantana, out of the total population over 16 years of age (10,332), 65.9% or 6,809 individuals are in the labor force, with 9.3% or 633 of them unemployed. The age group with the highest labor force participation rate is 30 to 34 years, with 97.1% or 974 individuals in the labor force. Within the labor force, the 16 to 19 years age range has the highest percentage of unemployed individuals, with 49.7% or 85 of them being unemployed.
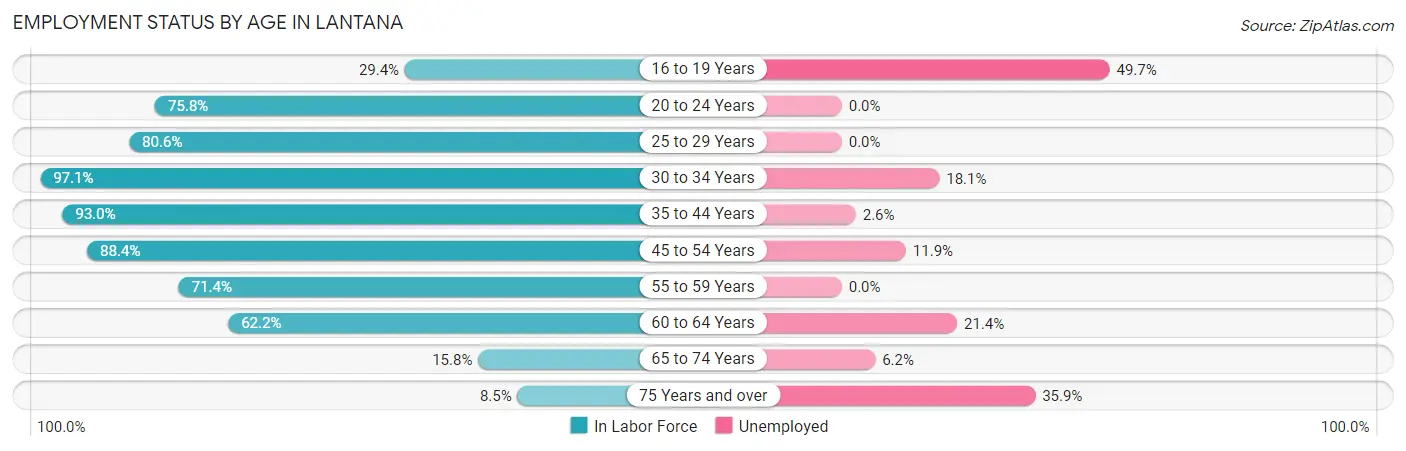
| Age Bracket | In Labor Force | Unemployed |
| 16 to 19 Years | 171 (29.4%) | 85 (49.7%) |
| 20 to 24 Years | 453 (75.8%) | 0 (0.0%) |
| 25 to 29 Years | 970 (80.6%) | 0 (0.0%) |
| 30 to 34 Years | 974 (97.1%) | 176 (18.1%) |
| 35 to 44 Years | 1,462 (93.0%) | 38 (2.6%) |
| 45 to 54 Years | 1,421 (88.4%) | 169 (11.9%) |
| 55 to 59 Years | 525 (71.4%) | 0 (0.0%) |
| 60 to 64 Years | 580 (62.2%) | 124 (21.4%) |
| 65 to 74 Years | 161 (15.8%) | 10 (6.2%) |
| 75 Years and over | 92 (8.5%) | 33 (35.9%) |
| Total | 6,809 (65.9%) | 633 (9.3%) |
Employment Status by Educational Attainment in Lantana
According to labor force statistics for Lantana, 84.1% of individuals (5,932) out of the total population between 25 and 64 years of age (7,054) are in the labor force, with 8.5% or 504 of them being unemployed. The group with the highest labor force participation rate are those with the educational attainment of bachelor's degree or higher, with 92.5% or 1,444 individuals in the labor force. Within the labor force, individuals with college / associate degree education have the highest percentage of unemployment, with 15.1% or 260 of them being unemployed.
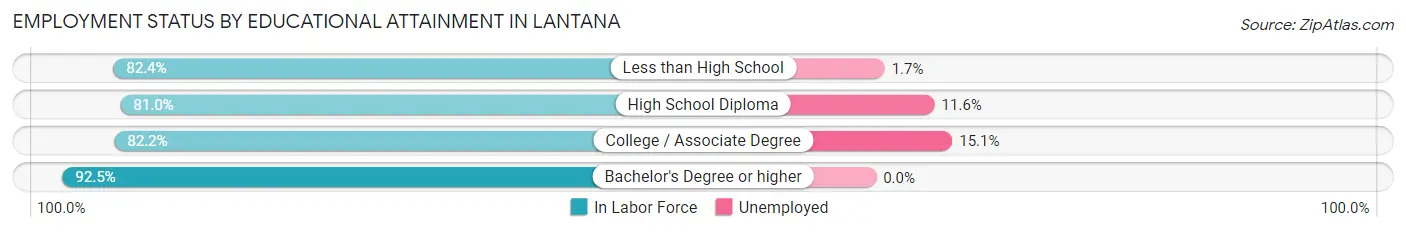
| Educational Attainment | In Labor Force | Unemployed |
| Less than High School | 750 (82.4%) | 15 (1.7%) |
| High School Diploma | 2,012 (81.0%) | 288 (11.6%) |
| College / Associate Degree | 1,725 (82.2%) | 317 (15.1%) |
| Bachelor's Degree or higher | 1,444 (92.5%) | 0 (0.0%) |
| Total | 5,932 (84.1%) | 600 (8.5%) |
Employment Occupations by Sex in Lantana
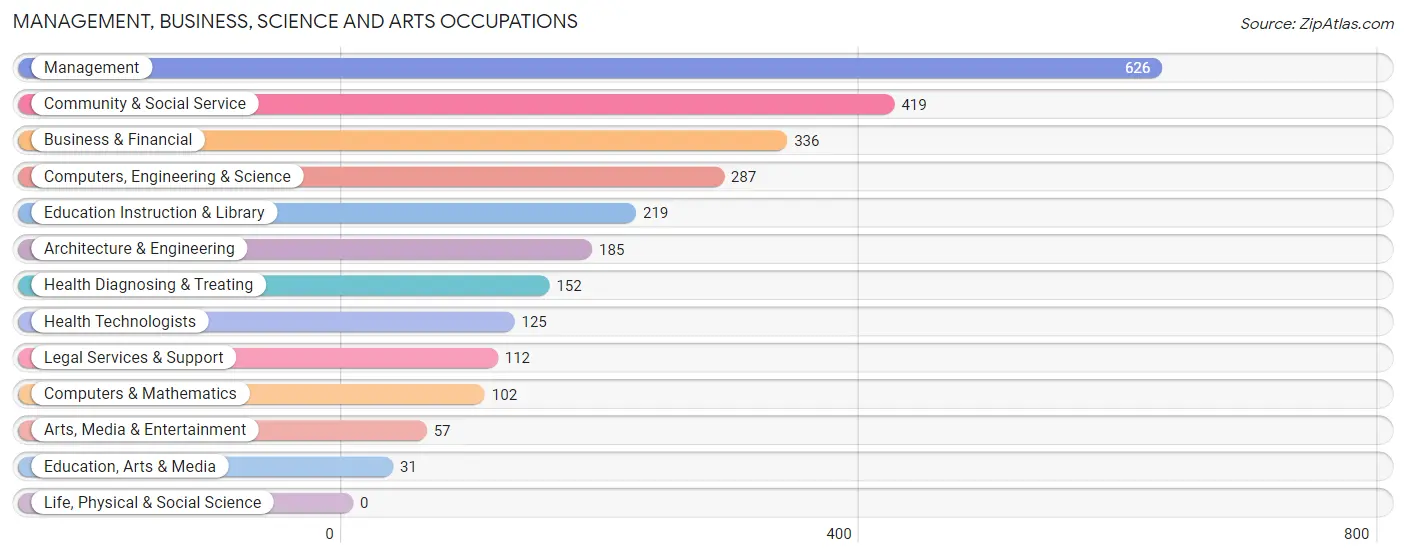
Management, Business, Science and Arts Occupations
The most common Management, Business, Science and Arts occupations in Lantana are Management (626 | 10.1%), Community & Social Service (419 | 6.8%), Business & Financial (336 | 5.4%), Computers, Engineering & Science (287 | 4.6%), and Education Instruction & Library (219 | 3.5%).
Management, Business, Science and Arts Occupations by Sex
Within the Management, Business, Science and Arts occupations in Lantana, the most male-oriented occupations are Architecture & Engineering (81.1%), Management (61.2%), and Computers, Engineering & Science (59.2%), while the most female-oriented occupations are Education, Arts & Media (100.0%), Education Instruction & Library (90.4%), and Business & Financial (83.3%).

| Occupation | Male | Female |
| Management | 383 (61.2%) | 243 (38.8%) |
| Business & Financial | 56 (16.7%) | 280 (83.3%) |
| Computers, Engineering & Science | 170 (59.2%) | 117 (40.8%) |
| Computers & Mathematics | 20 (19.6%) | 82 (80.4%) |
| Architecture & Engineering | 150 (81.1%) | 35 (18.9%) |
| Life, Physical & Social Science | 0 (0.0%) | 0 (0.0%) |
| Community & Social Service | 104 (24.8%) | 315 (75.2%) |
| Education, Arts & Media | 0 (0.0%) | 31 (100.0%) |
| Legal Services & Support | 60 (53.6%) | 52 (46.4%) |
| Education Instruction & Library | 21 (9.6%) | 198 (90.4%) |
| Arts, Media & Entertainment | 23 (40.4%) | 34 (59.7%) |
| Health Diagnosing & Treating | 34 (22.4%) | 118 (77.6%) |
| Health Technologists | 30 (24.0%) | 95 (76.0%) |
| Total (Category) | 747 (41.0%) | 1,073 (59.0%) |
| Total (Overall) | 2,971 (48.1%) | 3,203 (51.9%) |
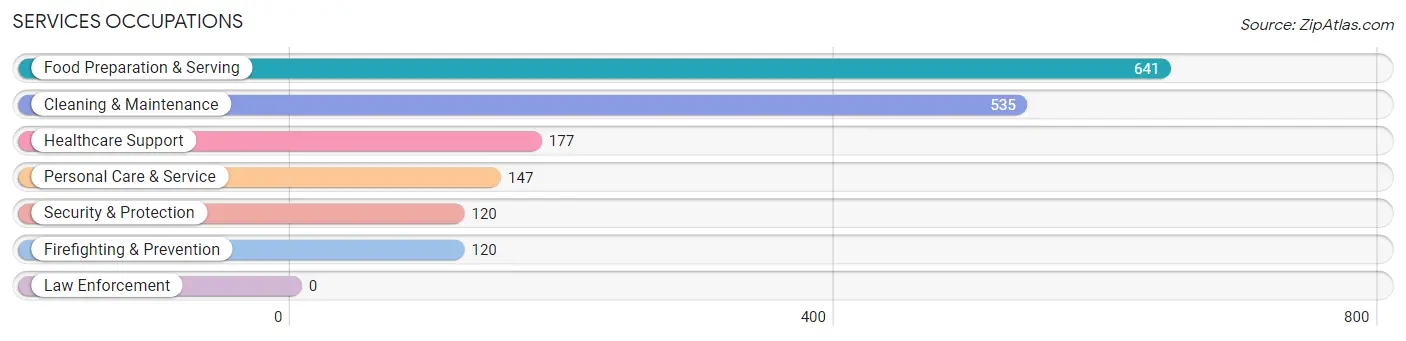
Services Occupations
The most common Services occupations in Lantana are Food Preparation & Serving (641 | 10.4%), Cleaning & Maintenance (535 | 8.7%), Healthcare Support (177 | 2.9%), Personal Care & Service (147 | 2.4%), and Security & Protection (120 | 1.9%).
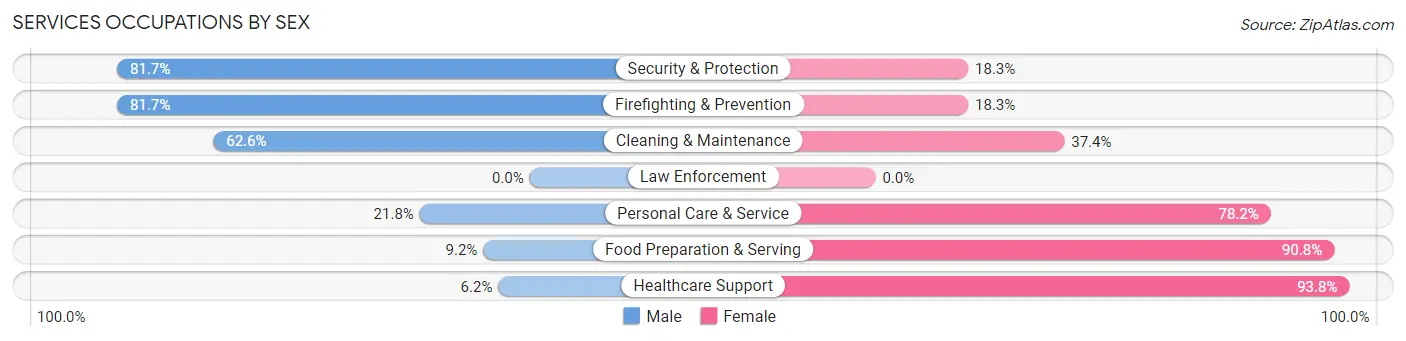
Services Occupations by Sex
Within the Services occupations in Lantana, the most male-oriented occupations are Security & Protection (81.7%), Firefighting & Prevention (81.7%), and Cleaning & Maintenance (62.6%), while the most female-oriented occupations are Healthcare Support (93.8%), Food Preparation & Serving (90.8%), and Personal Care & Service (78.2%).
| Occupation | Male | Female |
| Healthcare Support | 11 (6.2%) | 166 (93.8%) |
| Security & Protection | 98 (81.7%) | 22 (18.3%) |
| Firefighting & Prevention | 98 (81.7%) | 22 (18.3%) |
| Law Enforcement | 0 (0.0%) | 0 (0.0%) |
| Food Preparation & Serving | 59 (9.2%) | 582 (90.8%) |
| Cleaning & Maintenance | 335 (62.6%) | 200 (37.4%) |
| Personal Care & Service | 32 (21.8%) | 115 (78.2%) |
| Total (Category) | 535 (33.0%) | 1,085 (67.0%) |
| Total (Overall) | 2,971 (48.1%) | 3,203 (51.9%) |
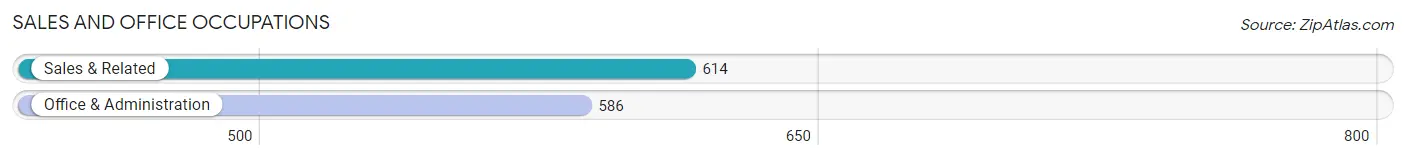
Sales and Office Occupations
The most common Sales and Office occupations in Lantana are Sales & Related (614 | 9.9%), and Office & Administration (586 | 9.5%).
Sales and Office Occupations by Sex
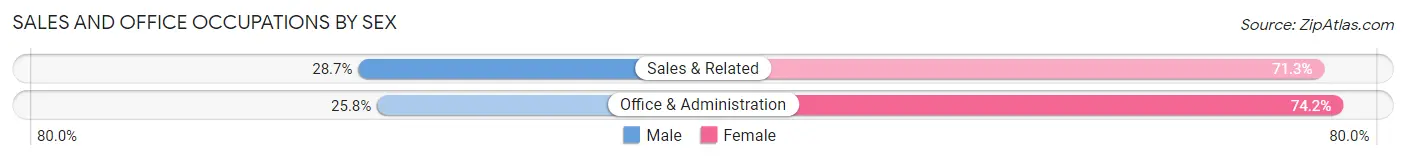
| Occupation | Male | Female |
| Sales & Related | 176 (28.7%) | 438 (71.3%) |
| Office & Administration | 151 (25.8%) | 435 (74.2%) |
| Total (Category) | 327 (27.3%) | 873 (72.8%) |
| Total (Overall) | 2,971 (48.1%) | 3,203 (51.9%) |
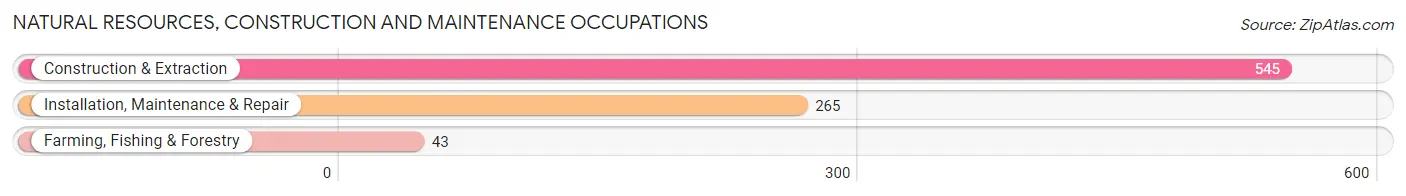
Natural Resources, Construction and Maintenance Occupations
The most common Natural Resources, Construction and Maintenance occupations in Lantana are Construction & Extraction (545 | 8.8%), Installation, Maintenance & Repair (265 | 4.3%), and Farming, Fishing & Forestry (43 | 0.7%).
Natural Resources, Construction and Maintenance Occupations by Sex
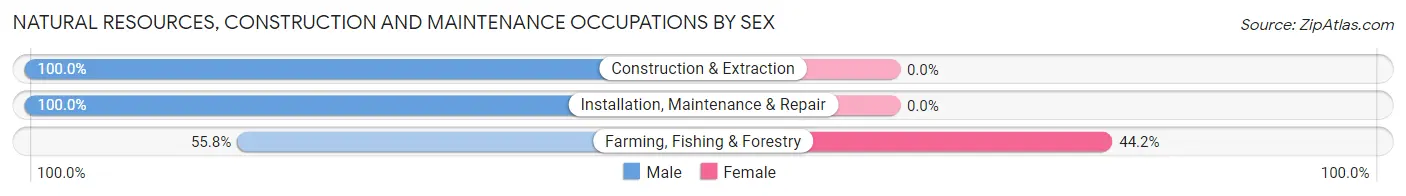
| Occupation | Male | Female |
| Farming, Fishing & Forestry | 24 (55.8%) | 19 (44.2%) |
| Construction & Extraction | 545 (100.0%) | 0 (0.0%) |
| Installation, Maintenance & Repair | 265 (100.0%) | 0 (0.0%) |
| Total (Category) | 834 (97.8%) | 19 (2.2%) |
| Total (Overall) | 2,971 (48.1%) | 3,203 (51.9%) |
Production, Transportation and Moving Occupations
The most common Production, Transportation and Moving occupations in Lantana are Transportation (333 | 5.4%), Production (183 | 3.0%), and Material Moving (165 | 2.7%).
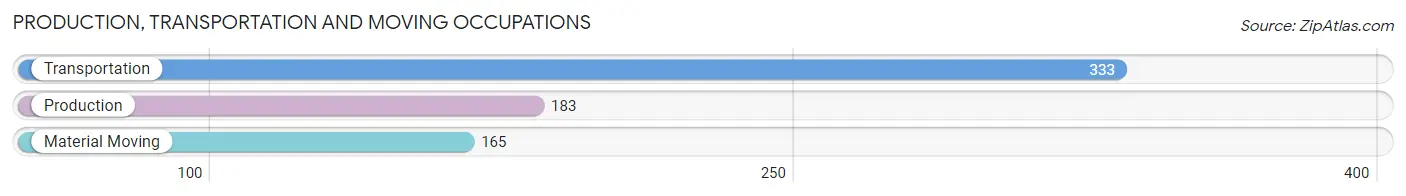
Production, Transportation and Moving Occupations by Sex
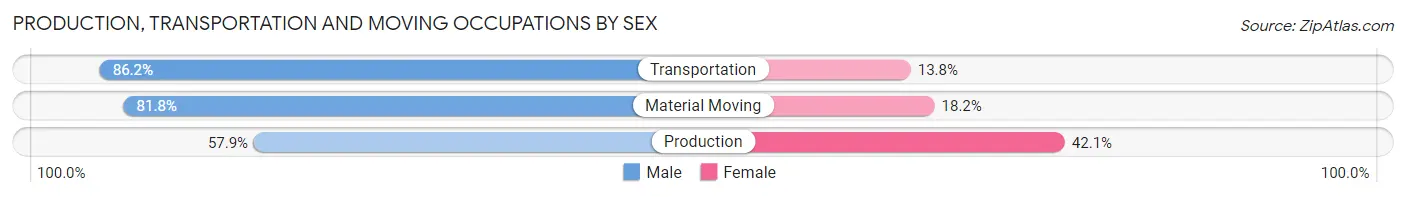
| Occupation | Male | Female |
| Production | 106 (57.9%) | 77 (42.1%) |
| Transportation | 287 (86.2%) | 46 (13.8%) |
| Material Moving | 135 (81.8%) | 30 (18.2%) |
| Total (Category) | 528 (77.5%) | 153 (22.5%) |
| Total (Overall) | 2,971 (48.1%) | 3,203 (51.9%) |
Employment Industries by Sex in Lantana
Employment Industries in Lantana
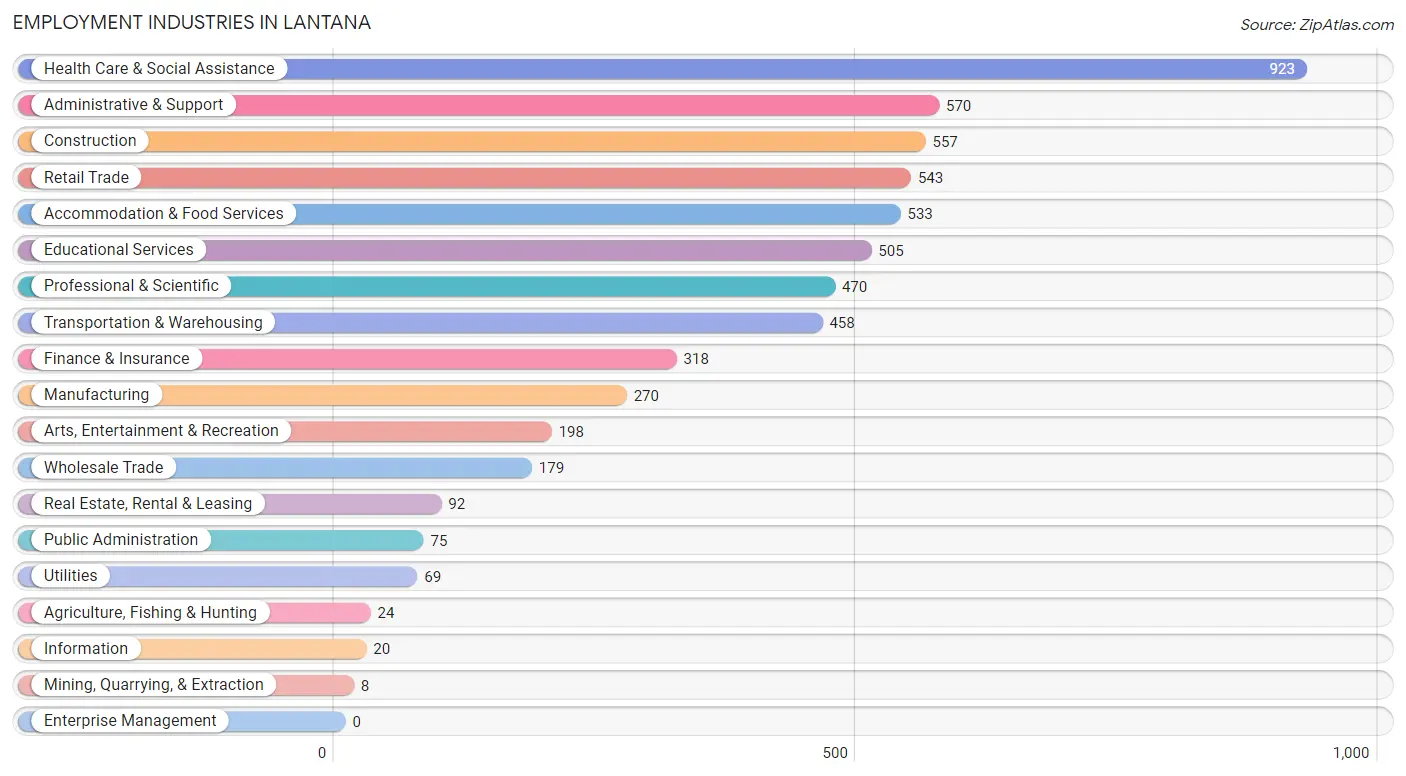
The major employment industries in Lantana include Health Care & Social Assistance (923 | 14.9%), Administrative & Support (570 | 9.2%), Construction (557 | 9.0%), Retail Trade (543 | 8.8%), and Accommodation & Food Services (533 | 8.6%).
Employment Industries by Sex in Lantana
The Lantana industries that see more men than women are Agriculture, Fishing & Hunting (100.0%), Information (100.0%), and Construction (97.5%), whereas the industries that tend to have a higher number of women are Mining, Quarrying, & Extraction (100.0%), Finance & Insurance (88.0%), and Health Care & Social Assistance (83.9%).
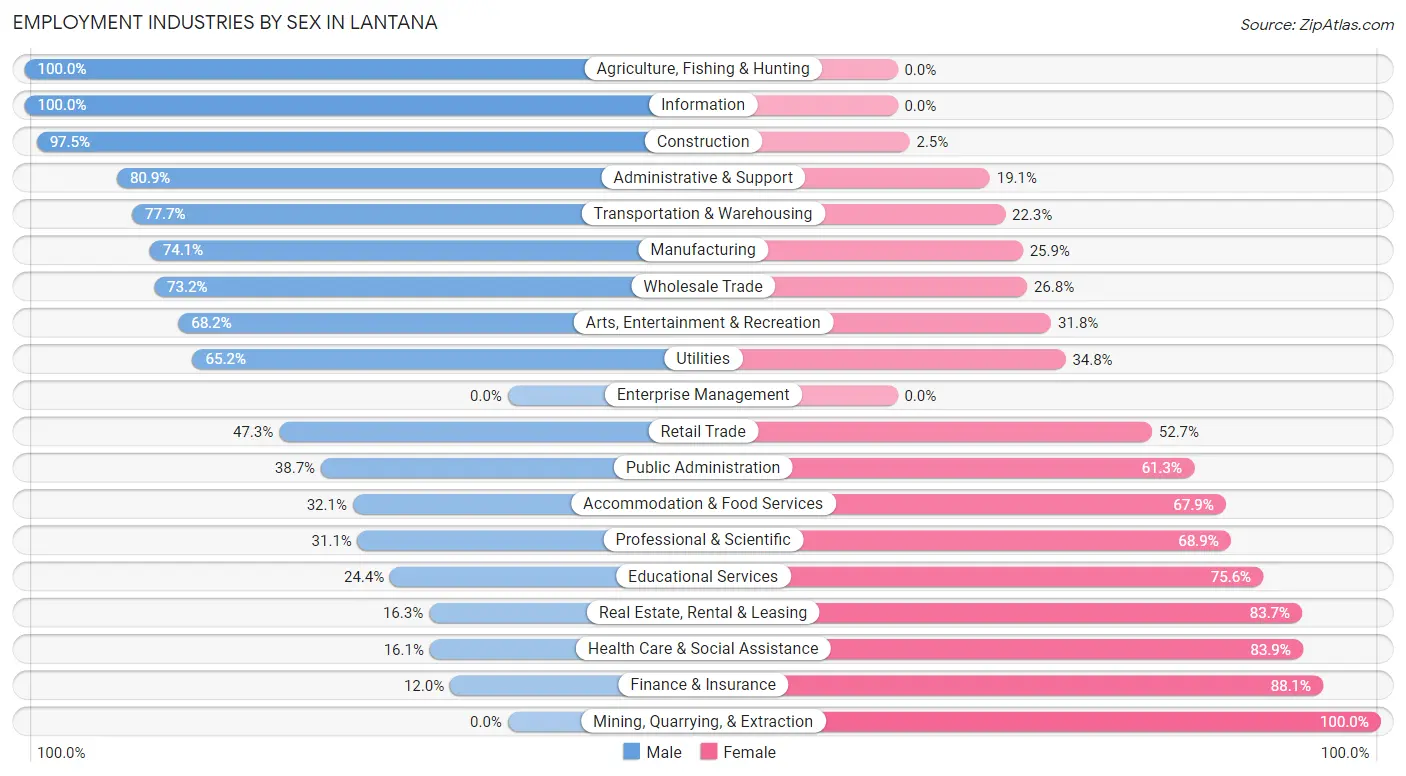
| Industry | Male | Female |
| Agriculture, Fishing & Hunting | 24 (100.0%) | 0 (0.0%) |
| Mining, Quarrying, & Extraction | 0 (0.0%) | 8 (100.0%) |
| Construction | 543 (97.5%) | 14 (2.5%) |
| Manufacturing | 200 (74.1%) | 70 (25.9%) |
| Wholesale Trade | 131 (73.2%) | 48 (26.8%) |
| Retail Trade | 257 (47.3%) | 286 (52.7%) |
| Transportation & Warehousing | 356 (77.7%) | 102 (22.3%) |
| Utilities | 45 (65.2%) | 24 (34.8%) |
| Information | 20 (100.0%) | 0 (0.0%) |
| Finance & Insurance | 38 (11.9%) | 280 (88.0%) |
| Real Estate, Rental & Leasing | 15 (16.3%) | 77 (83.7%) |
| Professional & Scientific | 146 (31.1%) | 324 (68.9%) |
| Enterprise Management | 0 (0.0%) | 0 (0.0%) |
| Administrative & Support | 461 (80.9%) | 109 (19.1%) |
| Educational Services | 123 (24.4%) | 382 (75.6%) |
| Health Care & Social Assistance | 149 (16.1%) | 774 (83.9%) |
| Arts, Entertainment & Recreation | 135 (68.2%) | 63 (31.8%) |
| Accommodation & Food Services | 171 (32.1%) | 362 (67.9%) |
| Public Administration | 29 (38.7%) | 46 (61.3%) |
| Total | 2,971 (48.1%) | 3,203 (51.9%) |
Education in Lantana
School Enrollment in Lantana
The most common levels of schooling among the 2,063 students in Lantana are middle school (520 | 25.2%), high school (507 | 24.6%), and college / undergraduate (480 | 23.3%).
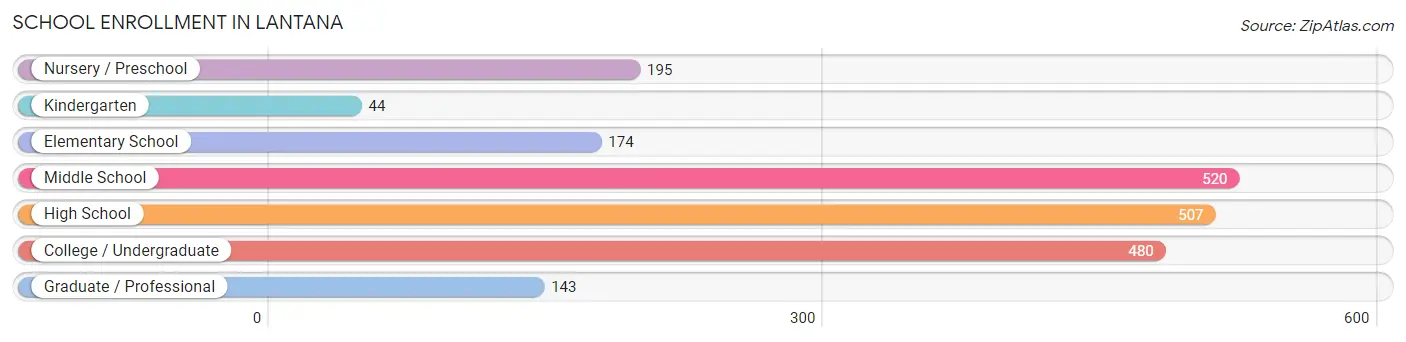
| School Level | # Students | % Students |
| Nursery / Preschool | 195 | 9.5% |
| Kindergarten | 44 | 2.1% |
| Elementary School | 174 | 8.4% |
| Middle School | 520 | 25.2% |
| High School | 507 | 24.6% |
| College / Undergraduate | 480 | 23.3% |
| Graduate / Professional | 143 | 6.9% |
| Total | 2,063 | 100.0% |
School Enrollment by Age by Funding Source in Lantana
Out of a total of 2,063 students who are enrolled in schools in Lantana, 293 (14.2%) attend a private institution, while the remaining 1,770 (85.8%) are enrolled in public schools. The age group of 3 to 4 year olds has the highest likelihood of being enrolled in private schools, with 93 (47.7% in the age bracket) enrolled. Conversely, the age group of 5 to 9 year old has the lowest likelihood of being enrolled in a private school, with 244 (100.0% in the age bracket) attending a public institution.
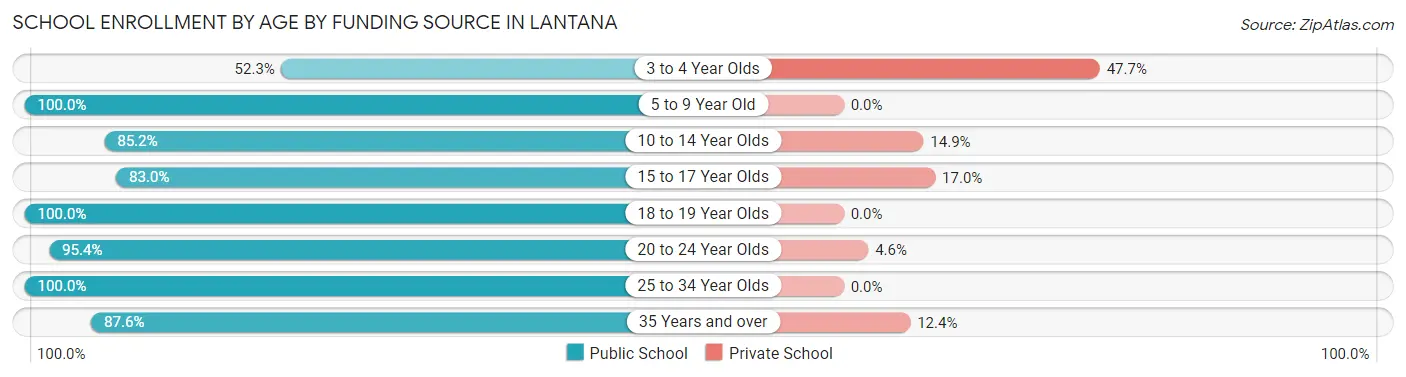
| Age Bracket | Public School | Private School |
| 3 to 4 Year Olds | 102 (52.3%) | 93 (47.7%) |
| 5 to 9 Year Old | 244 (100.0%) | 0 (0.0%) |
| 10 to 14 Year Olds | 499 (85.2%) | 87 (14.8%) |
| 15 to 17 Year Olds | 331 (83.0%) | 68 (17.0%) |
| 18 to 19 Year Olds | 88 (100.0%) | 0 (0.0%) |
| 20 to 24 Year Olds | 250 (95.4%) | 12 (4.6%) |
| 25 to 34 Year Olds | 31 (100.0%) | 0 (0.0%) |
| 35 Years and over | 226 (87.6%) | 32 (12.4%) |
| Total | 1,770 (85.8%) | 293 (14.2%) |
Educational Attainment by Field of Study in Lantana
Business (481 | 21.5%), education (406 | 18.1%), science & technology (240 | 10.7%), literature & languages (208 | 9.3%), and social sciences (176 | 7.9%) are the most common fields of study among 2,239 individuals in Lantana who have obtained a bachelor's degree or higher.
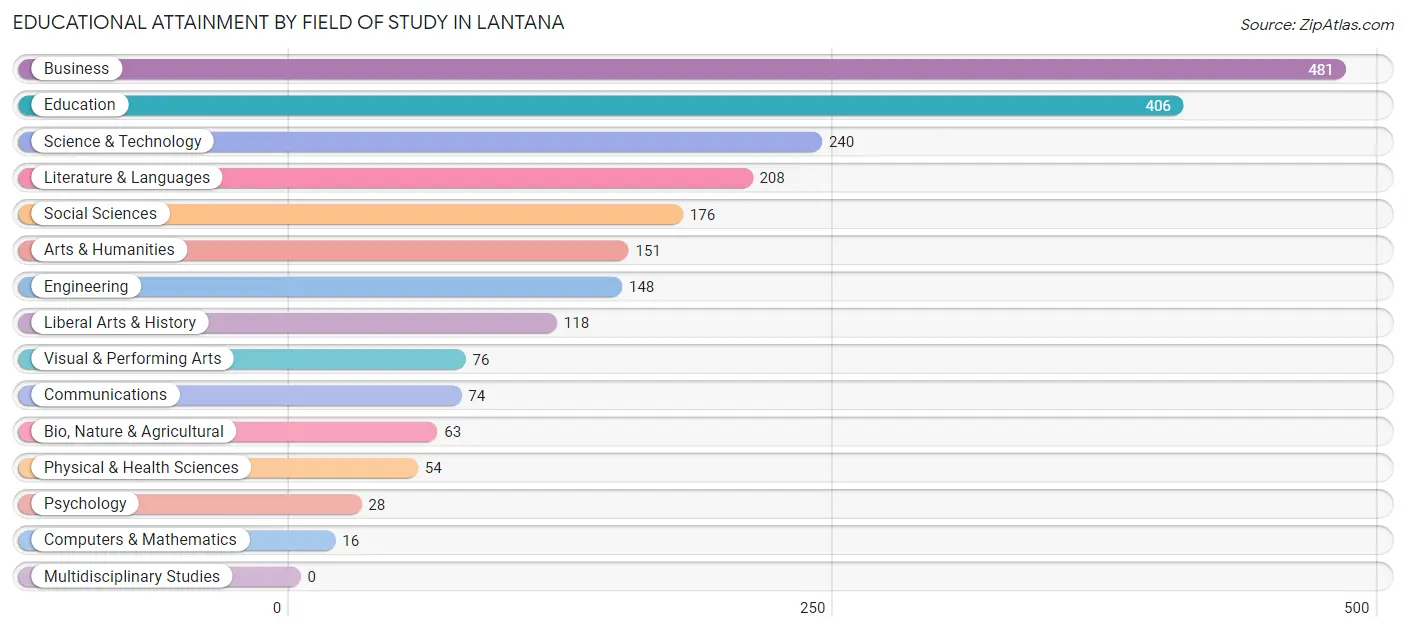
| Field of Study | # Graduates | % Graduates |
| Computers & Mathematics | 16 | 0.7% |
| Bio, Nature & Agricultural | 63 | 2.8% |
| Physical & Health Sciences | 54 | 2.4% |
| Psychology | 28 | 1.3% |
| Social Sciences | 176 | 7.9% |
| Engineering | 148 | 6.6% |
| Multidisciplinary Studies | 0 | 0.0% |
| Science & Technology | 240 | 10.7% |
| Business | 481 | 21.5% |
| Education | 406 | 18.1% |
| Literature & Languages | 208 | 9.3% |
| Liberal Arts & History | 118 | 5.3% |
| Visual & Performing Arts | 76 | 3.4% |
| Communications | 74 | 3.3% |
| Arts & Humanities | 151 | 6.7% |
| Total | 2,239 | 100.0% |
Transportation & Commute in Lantana
Vehicle Availability by Sex in Lantana
The most prevalent vehicle ownership categories in Lantana are males with 2 vehicles (1,201, accounting for 42.3%) and females with 2 vehicles (1,210, making up 37.8%).
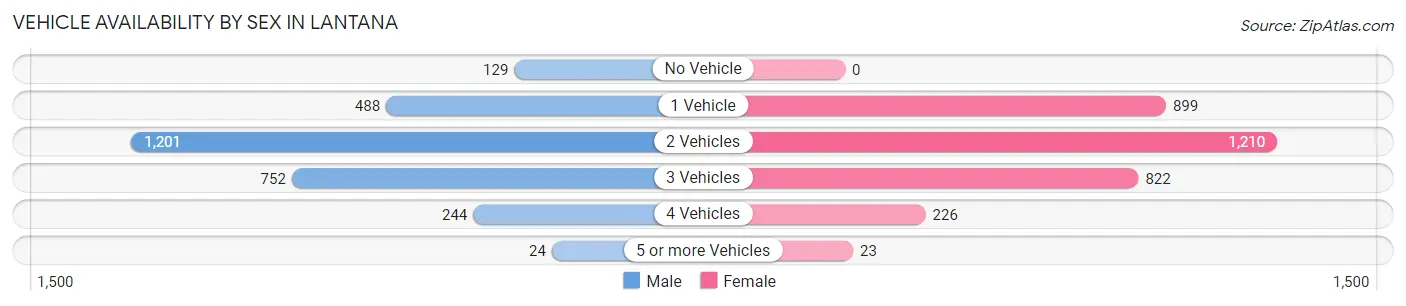
| Vehicles Available | Male | Female |
| No Vehicle | 129 (4.5%) | 0 (0.0%) |
| 1 Vehicle | 488 (17.2%) | 899 (28.3%) |
| 2 Vehicles | 1,201 (42.3%) | 1,210 (38.1%) |
| 3 Vehicles | 752 (26.5%) | 822 (25.9%) |
| 4 Vehicles | 244 (8.6%) | 226 (7.1%) |
| 5 or more Vehicles | 24 (0.9%) | 23 (0.7%) |
| Total | 2,838 (100.0%) | 3,180 (100.0%) |
Commute Time in Lantana
The most frequently occuring commute durations in Lantana are 15 to 19 minutes (1,067 commuters, 18.9%), 20 to 24 minutes (975 commuters, 17.3%), and 30 to 34 minutes (804 commuters, 14.2%).
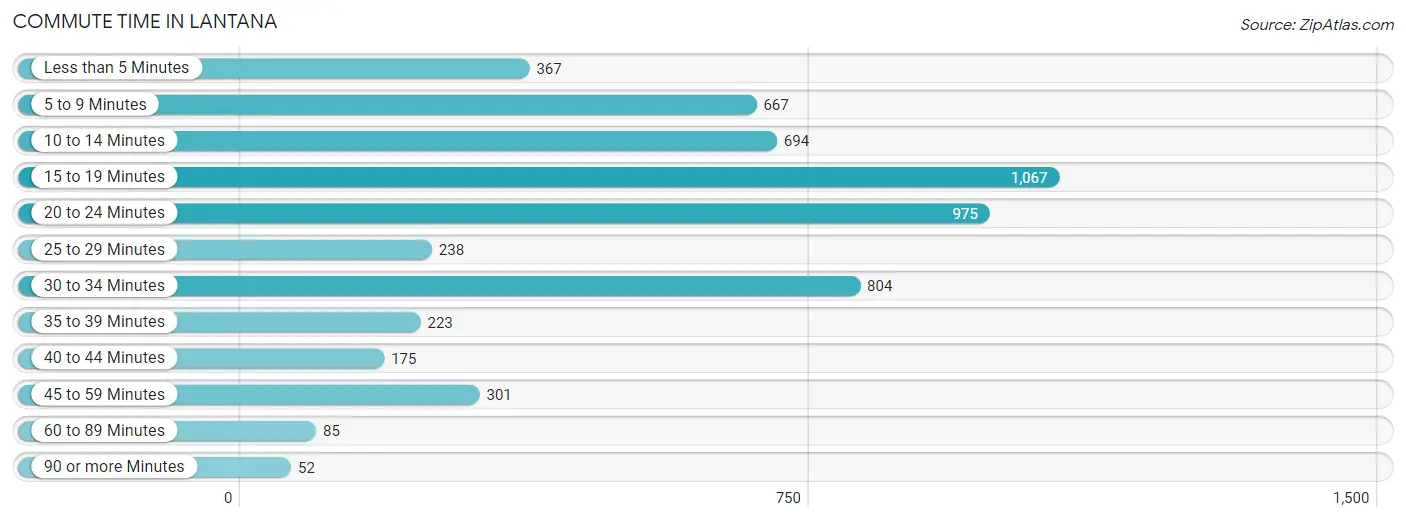
| Commute Time | # Commuters | % Commuters |
| Less than 5 Minutes | 367 | 6.5% |
| 5 to 9 Minutes | 667 | 11.8% |
| 10 to 14 Minutes | 694 | 12.3% |
| 15 to 19 Minutes | 1,067 | 18.9% |
| 20 to 24 Minutes | 975 | 17.3% |
| 25 to 29 Minutes | 238 | 4.2% |
| 30 to 34 Minutes | 804 | 14.2% |
| 35 to 39 Minutes | 223 | 4.0% |
| 40 to 44 Minutes | 175 | 3.1% |
| 45 to 59 Minutes | 301 | 5.3% |
| 60 to 89 Minutes | 85 | 1.5% |
| 90 or more Minutes | 52 | 0.9% |
Commute Time by Sex in Lantana
The most common commute times in Lantana are 30 to 34 minutes (610 commuters, 22.5%) for males and 15 to 19 minutes (729 commuters, 24.8%) for females.
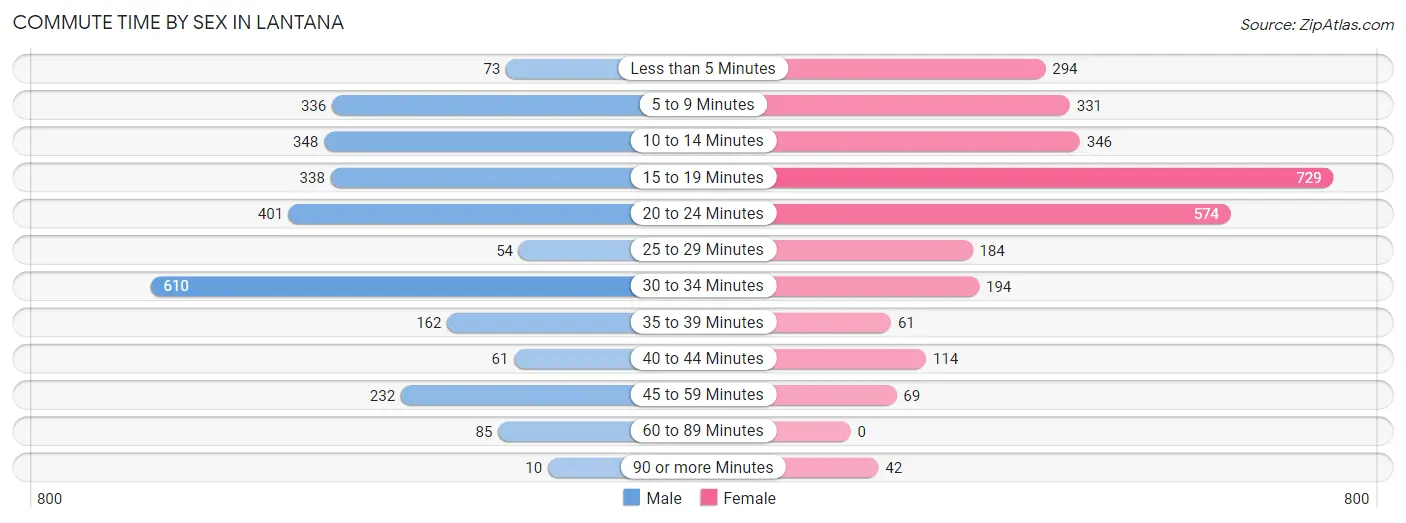
| Commute Time | Male | Female |
| Less than 5 Minutes | 73 (2.7%) | 294 (10.0%) |
| 5 to 9 Minutes | 336 (12.4%) | 331 (11.3%) |
| 10 to 14 Minutes | 348 (12.8%) | 346 (11.8%) |
| 15 to 19 Minutes | 338 (12.5%) | 729 (24.8%) |
| 20 to 24 Minutes | 401 (14.8%) | 574 (19.5%) |
| 25 to 29 Minutes | 54 (2.0%) | 184 (6.3%) |
| 30 to 34 Minutes | 610 (22.5%) | 194 (6.6%) |
| 35 to 39 Minutes | 162 (6.0%) | 61 (2.1%) |
| 40 to 44 Minutes | 61 (2.2%) | 114 (3.9%) |
| 45 to 59 Minutes | 232 (8.6%) | 69 (2.4%) |
| 60 to 89 Minutes | 85 (3.1%) | 0 (0.0%) |
| 90 or more Minutes | 10 (0.4%) | 42 (1.4%) |
Time of Departure to Work by Sex in Lantana
The most frequent times of departure to work in Lantana are 6:30 AM to 6:59 AM (378, 14.0%) for males and 7:30 AM to 7:59 AM (448, 15.2%) for females.
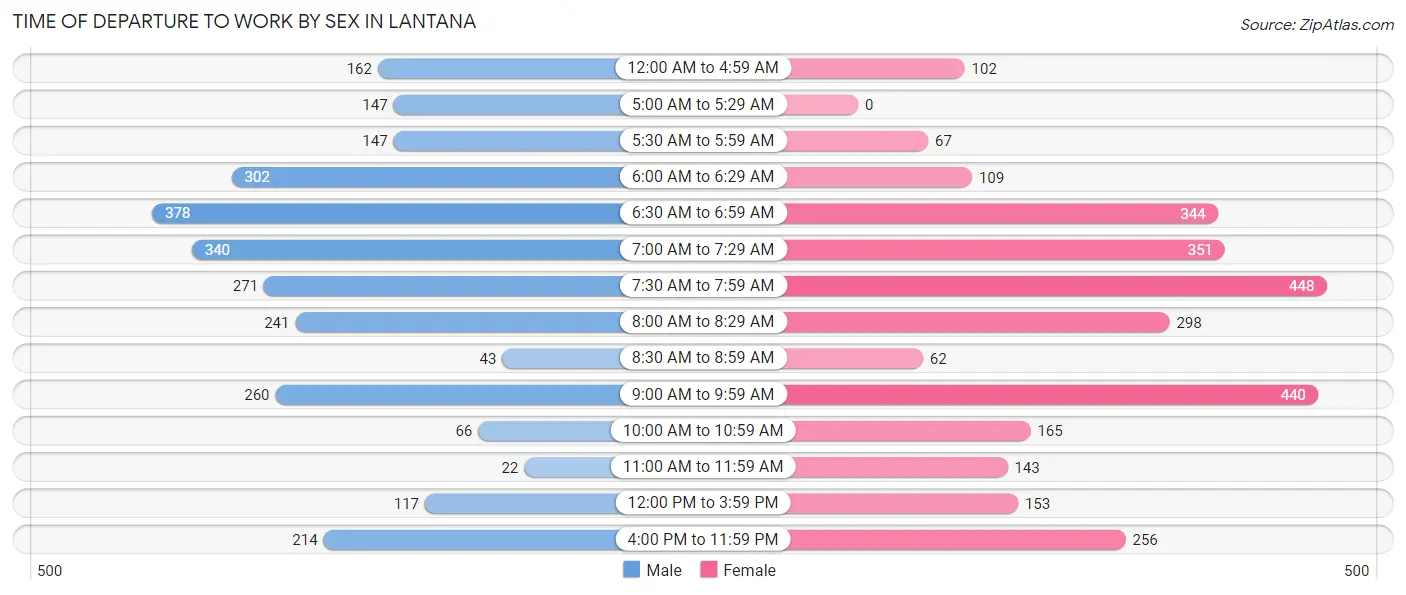
| Time of Departure | Male | Female |
| 12:00 AM to 4:59 AM | 162 (6.0%) | 102 (3.5%) |
| 5:00 AM to 5:29 AM | 147 (5.4%) | 0 (0.0%) |
| 5:30 AM to 5:59 AM | 147 (5.4%) | 67 (2.3%) |
| 6:00 AM to 6:29 AM | 302 (11.1%) | 109 (3.7%) |
| 6:30 AM to 6:59 AM | 378 (14.0%) | 344 (11.7%) |
| 7:00 AM to 7:29 AM | 340 (12.6%) | 351 (11.9%) |
| 7:30 AM to 7:59 AM | 271 (10.0%) | 448 (15.2%) |
| 8:00 AM to 8:29 AM | 241 (8.9%) | 298 (10.1%) |
| 8:30 AM to 8:59 AM | 43 (1.6%) | 62 (2.1%) |
| 9:00 AM to 9:59 AM | 260 (9.6%) | 440 (15.0%) |
| 10:00 AM to 10:59 AM | 66 (2.4%) | 165 (5.6%) |
| 11:00 AM to 11:59 AM | 22 (0.8%) | 143 (4.9%) |
| 12:00 PM to 3:59 PM | 117 (4.3%) | 153 (5.2%) |
| 4:00 PM to 11:59 PM | 214 (7.9%) | 256 (8.7%) |
| Total | 2,710 (100.0%) | 2,938 (100.0%) |
Housing Occupancy in Lantana
Occupancy by Ownership in Lantana
Of the total 4,734 dwellings in Lantana, owner-occupied units account for 2,760 (58.3%), while renter-occupied units make up 1,974 (41.7%).
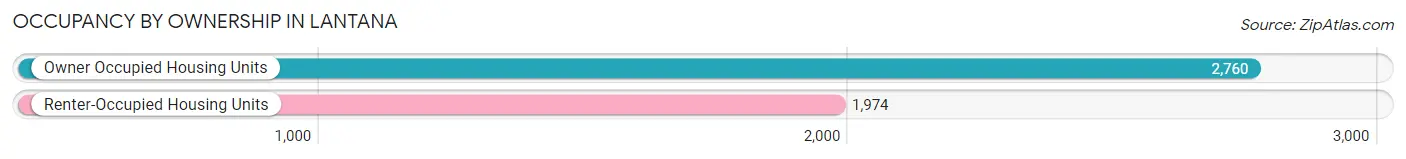
| Occupancy | # Housing Units | % Housing Units |
| Owner Occupied Housing Units | 2,760 | 58.3% |
| Renter-Occupied Housing Units | 1,974 | 41.7% |
| Total Occupied Housing Units | 4,734 | 100.0% |
Occupancy by Household Size in Lantana
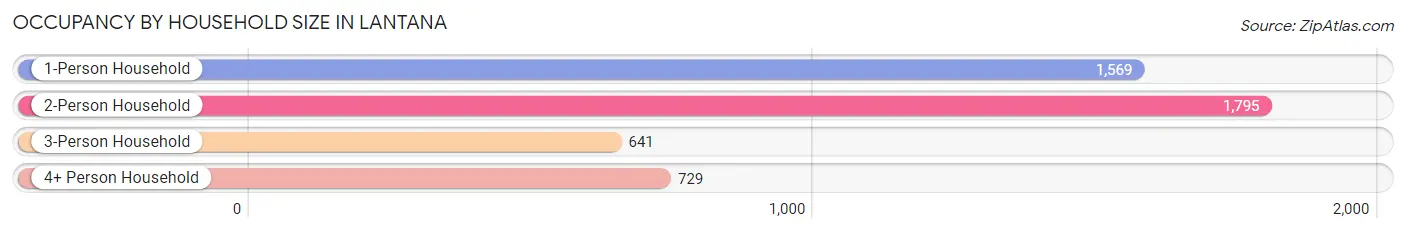
| Household Size | # Housing Units | % Housing Units |
| 1-Person Household | 1,569 | 33.1% |
| 2-Person Household | 1,795 | 37.9% |
| 3-Person Household | 641 | 13.5% |
| 4+ Person Household | 729 | 15.4% |
| Total Housing Units | 4,734 | 100.0% |
Occupancy by Ownership by Household Size in Lantana
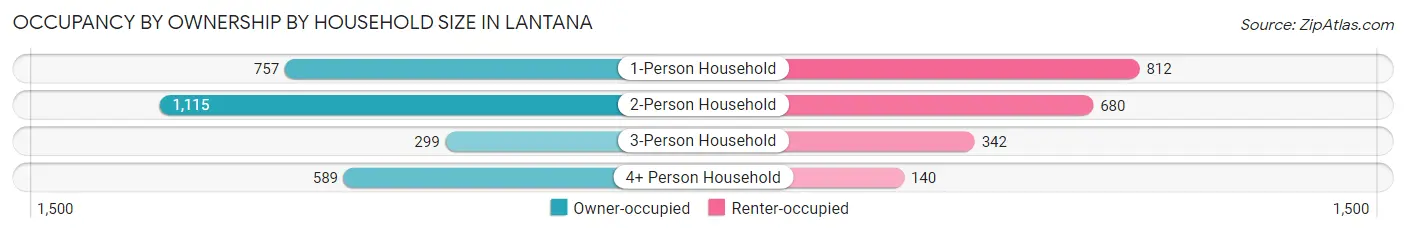
| Household Size | Owner-occupied | Renter-occupied |
| 1-Person Household | 757 (48.2%) | 812 (51.7%) |
| 2-Person Household | 1,115 (62.1%) | 680 (37.9%) |
| 3-Person Household | 299 (46.7%) | 342 (53.3%) |
| 4+ Person Household | 589 (80.8%) | 140 (19.2%) |
| Total Housing Units | 2,760 (58.3%) | 1,974 (41.7%) |
Occupancy by Educational Attainment in Lantana
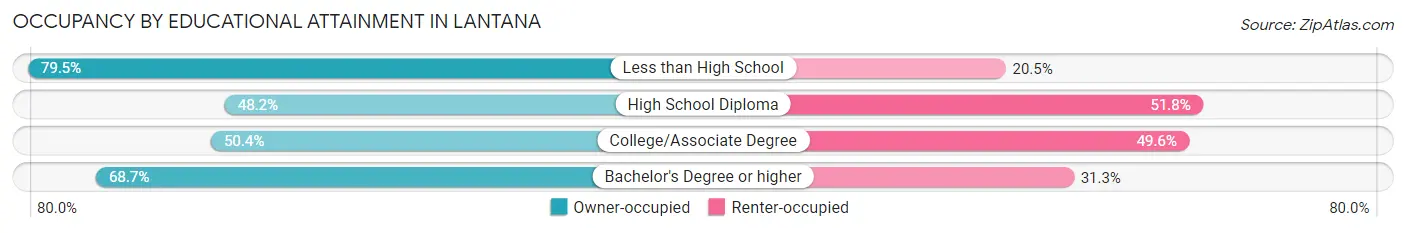
| Household Size | Owner-occupied | Renter-occupied |
| Less than High School | 430 (79.5%) | 111 (20.5%) |
| High School Diploma | 589 (48.2%) | 632 (51.8%) |
| College/Associate Degree | 829 (50.4%) | 815 (49.6%) |
| Bachelor's Degree or higher | 912 (68.7%) | 416 (31.3%) |
Occupancy by Age of Householder in Lantana
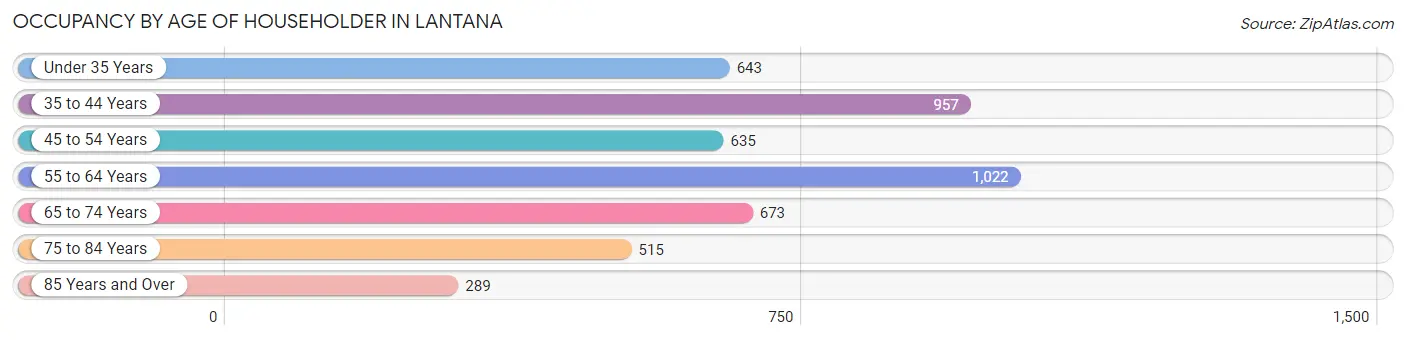
| Age Bracket | # Households | % Households |
| Under 35 Years | 643 | 13.6% |
| 35 to 44 Years | 957 | 20.2% |
| 45 to 54 Years | 635 | 13.4% |
| 55 to 64 Years | 1,022 | 21.6% |
| 65 to 74 Years | 673 | 14.2% |
| 75 to 84 Years | 515 | 10.9% |
| 85 Years and Over | 289 | 6.1% |
| Total | 4,734 | 100.0% |
Housing Finances in Lantana
Median Income by Occupancy in Lantana
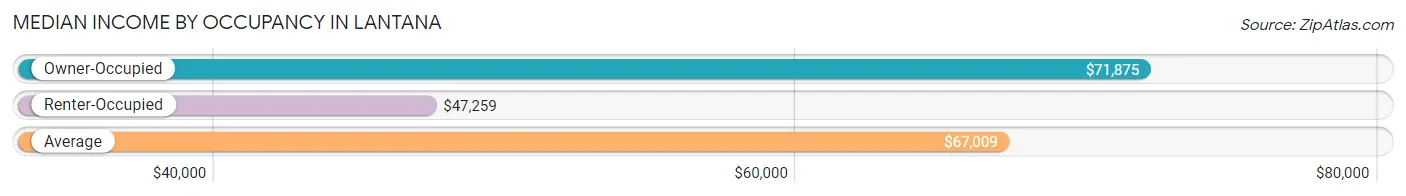
| Occupancy Type | # Households | Median Income |
| Owner-Occupied | 2,760 (58.3%) | $71,875 |
| Renter-Occupied | 1,974 (41.7%) | $47,259 |
| Average | 4,734 (100.0%) | $67,009 |
Occupancy by Householder Income Bracket in Lantana
| Income Bracket | Owner-occupied | Renter-occupied |
| Less than $5,000 | 137 (5.0%) | 123 (6.2%) |
| $5,000 to $9,999 | 19 (0.7%) | 67 (3.4%) |
| $10,000 to $14,999 | 61 (2.2%) | 92 (4.7%) |
| $15,000 to $19,999 | 60 (2.2%) | 102 (5.2%) |
| $20,000 to $24,999 | 51 (1.8%) | 25 (1.3%) |
| $25,000 to $34,999 | 273 (9.9%) | 280 (14.2%) |
| $35,000 to $49,999 | 171 (6.2%) | 328 (16.6%) |
| $50,000 to $74,999 | 611 (22.1%) | 273 (13.8%) |
| $75,000 to $99,999 | 236 (8.6%) | 122 (6.2%) |
| $100,000 to $149,999 | 480 (17.4%) | 475 (24.1%) |
| $150,000 or more | 661 (23.9%) | 87 (4.4%) |
| Total | 2,760 (100.0%) | 1,974 (100.0%) |
Monthly Housing Cost Tiers in Lantana
| Monthly Cost | Owner-occupied | Renter-occupied |
| Less than $300 | 105 (3.8%) | 0 (0.0%) |
| $300 to $499 | 404 (14.6%) | 0 (0.0%) |
| $500 to $799 | 352 (12.8%) | 73 (3.7%) |
| $800 to $999 | 166 (6.0%) | 144 (7.3%) |
| $1,000 to $1,499 | 331 (12.0%) | 912 (46.2%) |
| $1,500 to $1,999 | 397 (14.4%) | 468 (23.7%) |
| $2,000 to $2,499 | 400 (14.5%) | 101 (5.1%) |
| $2,500 to $2,999 | 382 (13.8%) | 90 (4.6%) |
| $3,000 or more | 223 (8.1%) | 142 (7.2%) |
| Total | 2,760 (100.0%) | 1,974 (100.0%) |
Physical Housing Characteristics in Lantana
Housing Structures in Lantana
| Structure Type | # Housing Units | % Housing Units |
| Single Unit, Detached | 2,462 | 52.0% |
| Single Unit, Attached | 152 | 3.2% |
| 2 Unit Apartments | 436 | 9.2% |
| 3 or 4 Unit Apartments | 212 | 4.5% |
| 5 to 9 Unit Apartments | 170 | 3.6% |
| 10 or more Apartments | 1,268 | 26.8% |
| Mobile Home / Other | 34 | 0.7% |
| Total | 4,734 | 100.0% |
Housing Structures by Occupancy in Lantana
| Structure Type | Owner-occupied | Renter-occupied |
| Single Unit, Detached | 2,244 (91.1%) | 218 (8.8%) |
| Single Unit, Attached | 87 (57.2%) | 65 (42.8%) |
| 2 Unit Apartments | 13 (3.0%) | 423 (97.0%) |
| 3 or 4 Unit Apartments | 15 (7.1%) | 197 (92.9%) |
| 5 to 9 Unit Apartments | 88 (51.8%) | 82 (48.2%) |
| 10 or more Apartments | 279 (22.0%) | 989 (78.0%) |
| Mobile Home / Other | 34 (100.0%) | 0 (0.0%) |
| Total | 2,760 (58.3%) | 1,974 (41.7%) |
Housing Structures by Number of Rooms in Lantana
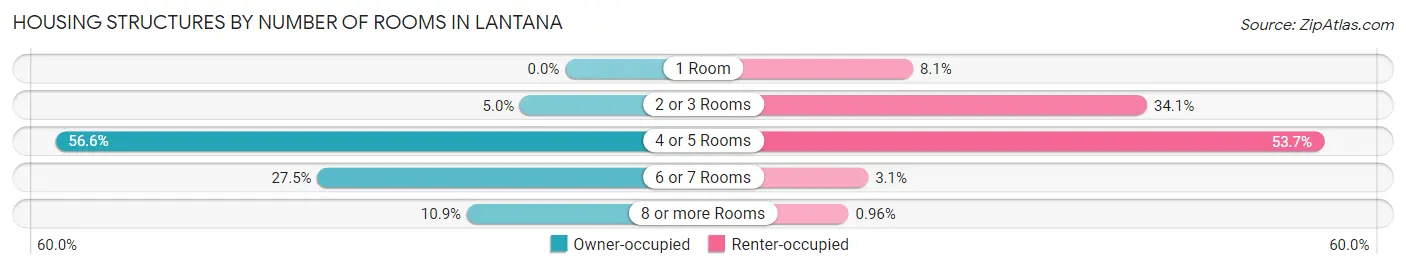
| Number of Rooms | Owner-occupied | Renter-occupied |
| 1 Room | 0 (0.0%) | 160 (8.1%) |
| 2 or 3 Rooms | 138 (5.0%) | 673 (34.1%) |
| 4 or 5 Rooms | 1,562 (56.6%) | 1,060 (53.7%) |
| 6 or 7 Rooms | 759 (27.5%) | 62 (3.1%) |
| 8 or more Rooms | 301 (10.9%) | 19 (1.0%) |
| Total | 2,760 (100.0%) | 1,974 (100.0%) |
Housing Structure by Heating Type in Lantana
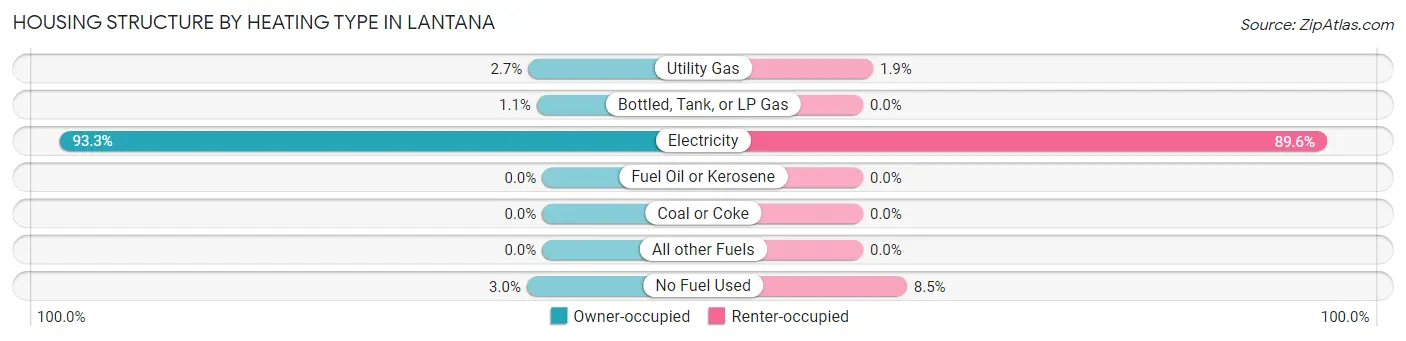
| Heating Type | Owner-occupied | Renter-occupied |
| Utility Gas | 75 (2.7%) | 38 (1.9%) |
| Bottled, Tank, or LP Gas | 29 (1.1%) | 0 (0.0%) |
| Electricity | 2,574 (93.3%) | 1,769 (89.6%) |
| Fuel Oil or Kerosene | 0 (0.0%) | 0 (0.0%) |
| Coal or Coke | 0 (0.0%) | 0 (0.0%) |
| All other Fuels | 0 (0.0%) | 0 (0.0%) |
| No Fuel Used | 82 (3.0%) | 167 (8.5%) |
| Total | 2,760 (100.0%) | 1,974 (100.0%) |
Household Vehicle Usage in Lantana
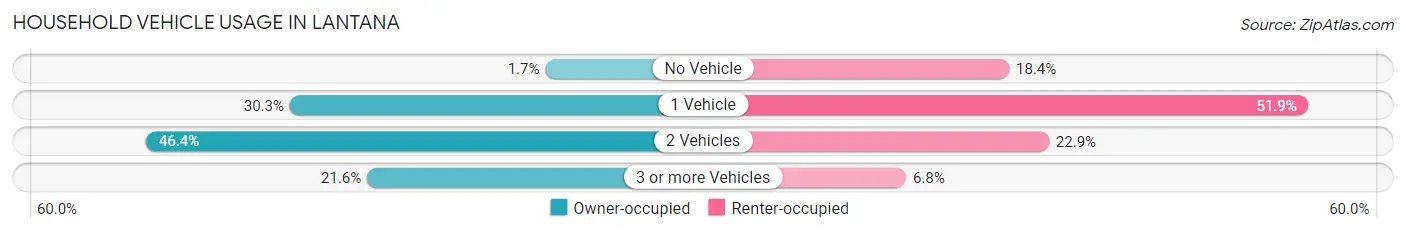
| Vehicles per Household | Owner-occupied | Renter-occupied |
| No Vehicle | 46 (1.7%) | 363 (18.4%) |
| 1 Vehicle | 836 (30.3%) | 1,025 (51.9%) |
| 2 Vehicles | 1,281 (46.4%) | 451 (22.9%) |
| 3 or more Vehicles | 597 (21.6%) | 135 (6.8%) |
| Total | 2,760 (100.0%) | 1,974 (100.0%) |
Real Estate & Mortgages in Lantana
Real Estate and Mortgage Overview in Lantana
| Characteristic | Without Mortgage | With Mortgage |
| Housing Units | 1,101 | 1,659 |
| Median Property Value | $313,700 | $297,000 |
| Median Household Income | $67,606 | $501 |
| Monthly Housing Costs | $519 | $207 |
| Real Estate Taxes | $1,383 | $17 |
Property Value by Mortgage Status in Lantana
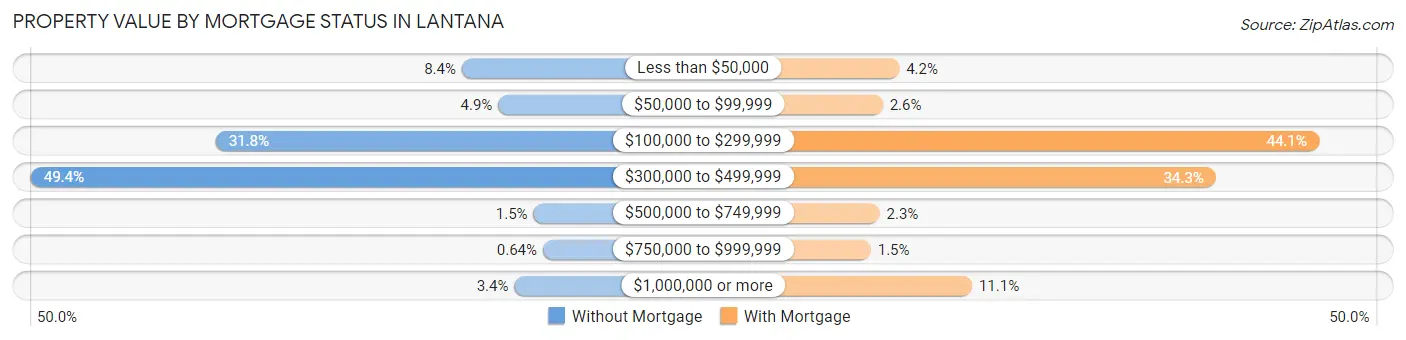
| Property Value | Without Mortgage | With Mortgage |
| Less than $50,000 | 92 (8.4%) | 69 (4.2%) |
| $50,000 to $99,999 | 54 (4.9%) | 43 (2.6%) |
| $100,000 to $299,999 | 350 (31.8%) | 732 (44.1%) |
| $300,000 to $499,999 | 544 (49.4%) | 569 (34.3%) |
| $500,000 to $749,999 | 17 (1.5%) | 38 (2.3%) |
| $750,000 to $999,999 | 7 (0.6%) | 24 (1.5%) |
| $1,000,000 or more | 37 (3.4%) | 184 (11.1%) |
| Total | 1,101 (100.0%) | 1,659 (100.0%) |
Household Income by Mortgage Status in Lantana
| Household Income | Without Mortgage | With Mortgage |
| Less than $10,000 | 62 (5.6%) | 6 (0.4%) |
| $10,000 to $24,999 | 77 (7.0%) | 94 (5.7%) |
| $25,000 to $34,999 | 146 (13.3%) | 95 (5.7%) |
| $35,000 to $49,999 | 46 (4.2%) | 127 (7.7%) |
| $50,000 to $74,999 | 401 (36.4%) | 125 (7.5%) |
| $75,000 to $99,999 | 21 (1.9%) | 210 (12.7%) |
| $100,000 to $149,999 | 188 (17.1%) | 215 (13.0%) |
| $150,000 or more | 160 (14.5%) | 292 (17.6%) |
| Total | 1,101 (100.0%) | 1,659 (100.0%) |
Property Value to Household Income Ratio in Lantana
| Value-to-Income Ratio | Without Mortgage | With Mortgage |
| Less than 2.0x | 307 (27.9%) | 95,208 (5,738.9%) |
| 2.0x to 2.9x | 65 (5.9%) | 570 (34.4%) |
| 3.0x to 3.9x | 101 (9.2%) | 278 (16.8%) |
| 4.0x or more | 622 (56.5%) | 170 (10.2%) |
| Total | 1,101 (100.0%) | 1,659 (100.0%) |
Real Estate Taxes by Mortgage Status in Lantana
| Property Taxes | Without Mortgage | With Mortgage |
| Less than $800 | 118 (10.7%) | 0 (0.0%) |
| $800 to $1,499 | 510 (46.3%) | 41 (2.5%) |
| $800 to $1,499 | 405 (36.8%) | 368 (22.2%) |
| Total | 1,101 (100.0%) | 1,659 (100.0%) |
Health & Disability in Lantana
Health Insurance Coverage by Age in Lantana
| Age Bracket | With Coverage | Without Coverage |
| Under 6 Years | 406 (74.9%) | 136 (25.1%) |
| 6 to 18 Years | 1,040 (80.7%) | 248 (19.3%) |
| 19 to 25 Years | 640 (66.8%) | 318 (33.2%) |
| 26 to 34 Years | 1,525 (77.4%) | 445 (22.6%) |
| 35 to 44 Years | 1,318 (83.8%) | 254 (16.2%) |
| 45 to 54 Years | 1,275 (79.3%) | 333 (20.7%) |
| 55 to 64 Years | 1,457 (88.0%) | 199 (12.0%) |
| 65 to 74 Years | 962 (97.0%) | 30 (3.0%) |
| 75 Years and older | 1,005 (99.1%) | 9 (0.9%) |
| Total | 9,628 (83.0%) | 1,972 (17.0%) |
Health Insurance Coverage by Citizenship Status in Lantana
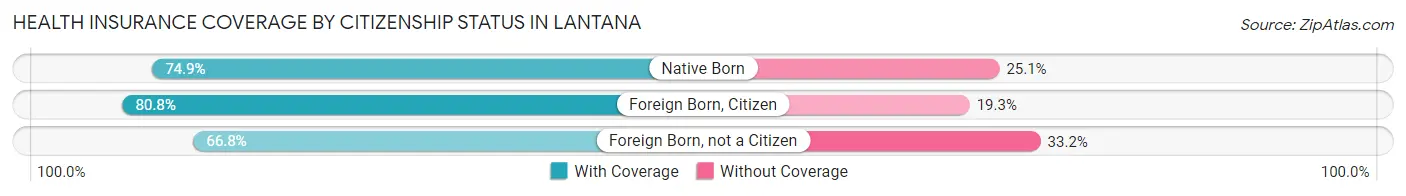
| Citizenship Status | With Coverage | Without Coverage |
| Native Born | 406 (74.9%) | 136 (25.1%) |
| Foreign Born, Citizen | 1,040 (80.7%) | 248 (19.3%) |
| Foreign Born, not a Citizen | 640 (66.8%) | 318 (33.2%) |
Health Insurance Coverage by Household Income in Lantana
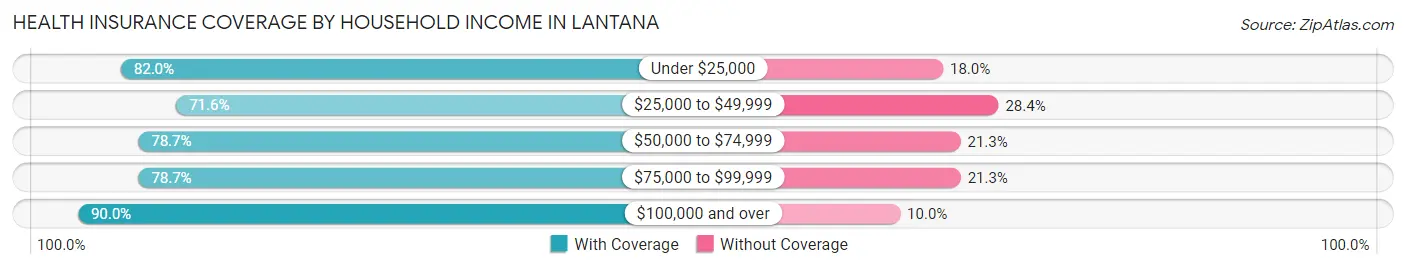
| Household Income | With Coverage | Without Coverage |
| Under $25,000 | 1,072 (82.0%) | 236 (18.0%) |
| $25,000 to $49,999 | 1,171 (71.6%) | 465 (28.4%) |
| $50,000 to $74,999 | 1,617 (78.7%) | 438 (21.3%) |
| $75,000 to $99,999 | 730 (78.7%) | 198 (21.3%) |
| $100,000 and over | 5,021 (90.0%) | 558 (10.0%) |
Public vs Private Health Insurance Coverage by Age in Lantana
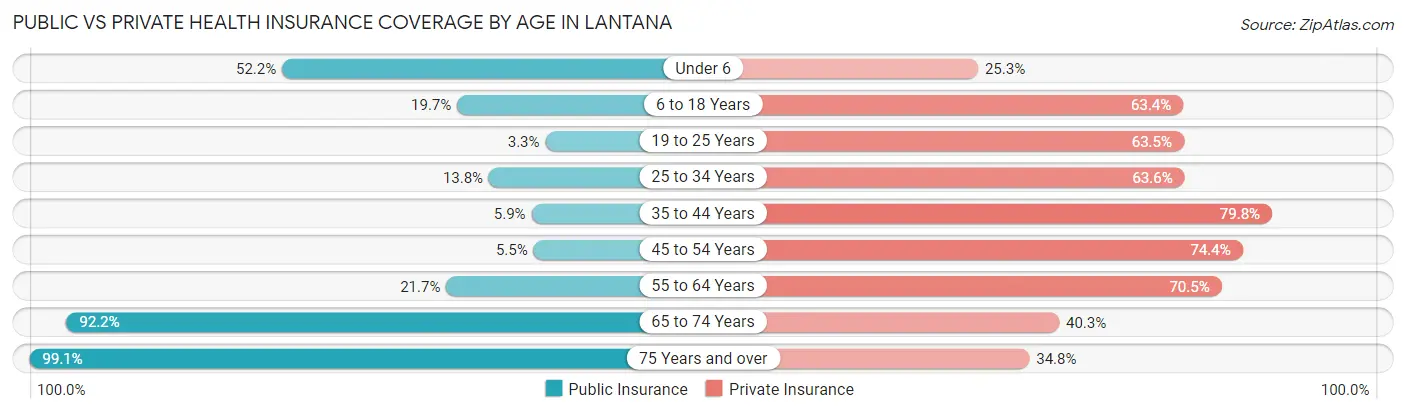
| Age Bracket | Public Insurance | Private Insurance |
| Under 6 | 283 (52.2%) | 137 (25.3%) |
| 6 to 18 Years | 254 (19.7%) | 816 (63.3%) |
| 19 to 25 Years | 32 (3.3%) | 608 (63.5%) |
| 25 to 34 Years | 272 (13.8%) | 1,253 (63.6%) |
| 35 to 44 Years | 93 (5.9%) | 1,255 (79.8%) |
| 45 to 54 Years | 89 (5.5%) | 1,196 (74.4%) |
| 55 to 64 Years | 360 (21.7%) | 1,167 (70.5%) |
| 65 to 74 Years | 915 (92.2%) | 400 (40.3%) |
| 75 Years and over | 1,005 (99.1%) | 353 (34.8%) |
| Total | 3,303 (28.5%) | 7,185 (61.9%) |
Disability Status by Sex by Age in Lantana
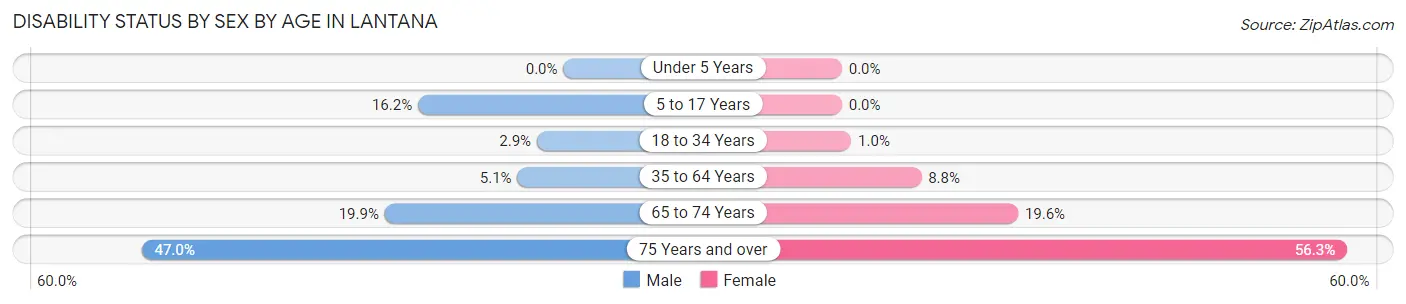
| Age Bracket | Male | Female |
| Under 5 Years | 0 (0.0%) | 0 (0.0%) |
| 5 to 17 Years | 143 (16.2%) | 0 (0.0%) |
| 18 to 34 Years | 46 (2.9%) | 15 (1.0%) |
| 35 to 64 Years | 128 (5.1%) | 206 (8.8%) |
| 65 to 74 Years | 104 (19.9%) | 92 (19.6%) |
| 75 Years and over | 240 (47.0%) | 283 (56.3%) |
Disability Class by Sex by Age in Lantana
Disability Class: Hearing Difficulty
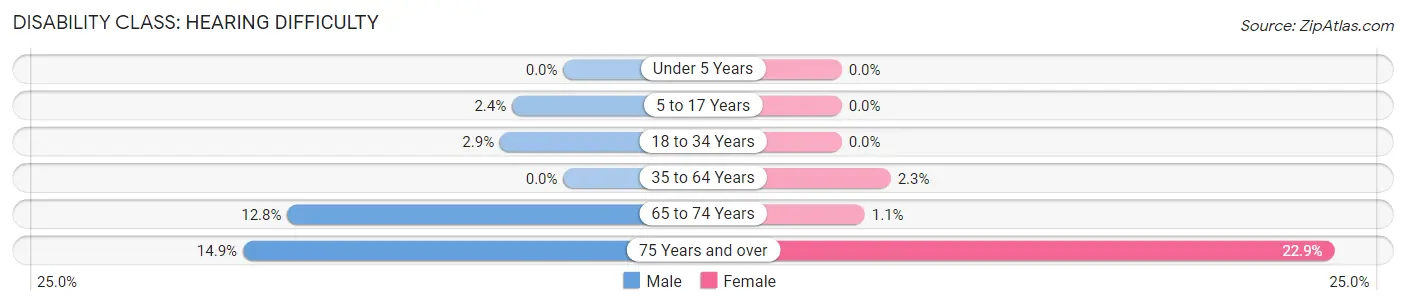
| Age Bracket | Male | Female |
| Under 5 Years | 0 (0.0%) | 0 (0.0%) |
| 5 to 17 Years | 21 (2.4%) | 0 (0.0%) |
| 18 to 34 Years | 46 (2.9%) | 0 (0.0%) |
| 35 to 64 Years | 0 (0.0%) | 53 (2.3%) |
| 65 to 74 Years | 67 (12.8%) | 5 (1.1%) |
| 75 Years and over | 76 (14.9%) | 115 (22.9%) |
Disability Class: Vision Difficulty
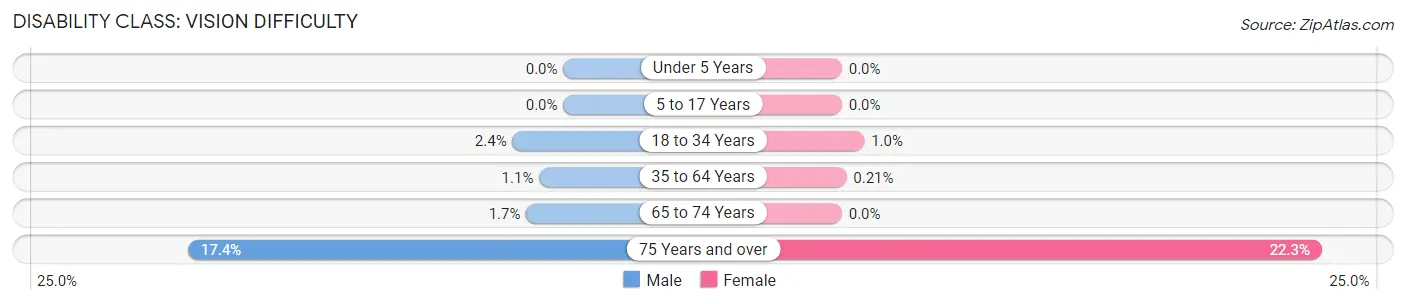
| Age Bracket | Male | Female |
| Under 5 Years | 0 (0.0%) | 0 (0.0%) |
| 5 to 17 Years | 0 (0.0%) | 0 (0.0%) |
| 18 to 34 Years | 37 (2.4%) | 15 (1.0%) |
| 35 to 64 Years | 28 (1.1%) | 5 (0.2%) |
| 65 to 74 Years | 9 (1.7%) | 0 (0.0%) |
| 75 Years and over | 89 (17.4%) | 112 (22.3%) |
Disability Class: Cognitive Difficulty
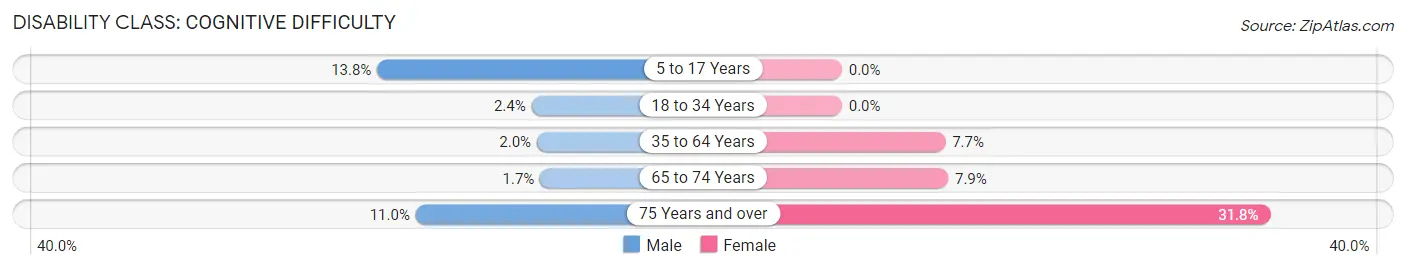
| Age Bracket | Male | Female |
| 5 to 17 Years | 122 (13.8%) | 0 (0.0%) |
| 18 to 34 Years | 37 (2.4%) | 0 (0.0%) |
| 35 to 64 Years | 49 (2.0%) | 179 (7.7%) |
| 65 to 74 Years | 9 (1.7%) | 37 (7.9%) |
| 75 Years and over | 56 (11.0%) | 160 (31.8%) |
Disability Class: Ambulatory Difficulty
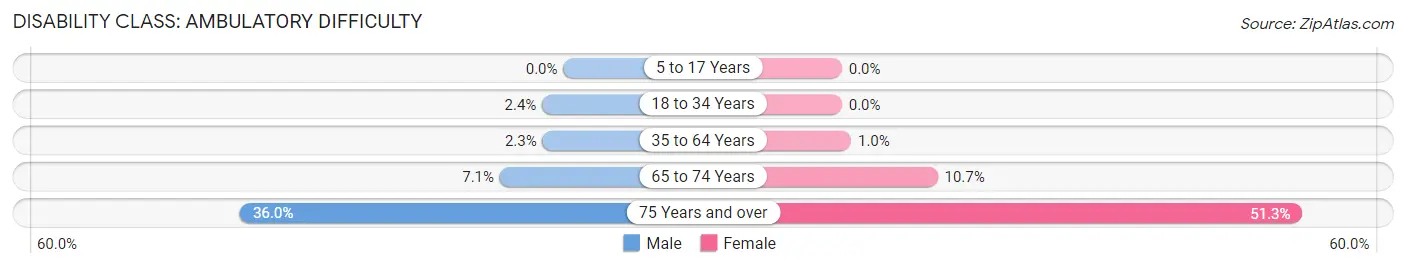
| Age Bracket | Male | Female |
| 5 to 17 Years | 0 (0.0%) | 0 (0.0%) |
| 18 to 34 Years | 37 (2.4%) | 0 (0.0%) |
| 35 to 64 Years | 58 (2.3%) | 24 (1.0%) |
| 65 to 74 Years | 37 (7.1%) | 50 (10.7%) |
| 75 Years and over | 184 (36.0%) | 258 (51.3%) |
Disability Class: Self-Care Difficulty
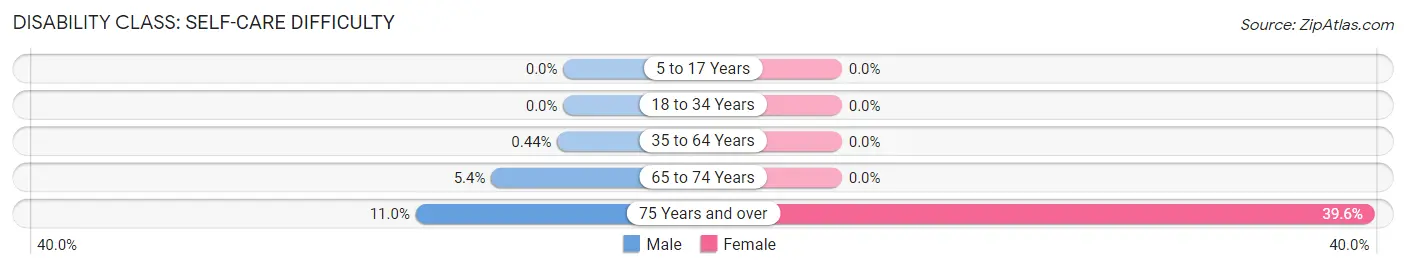
| Age Bracket | Male | Female |
| 5 to 17 Years | 0 (0.0%) | 0 (0.0%) |
| 18 to 34 Years | 0 (0.0%) | 0 (0.0%) |
| 35 to 64 Years | 11 (0.4%) | 0 (0.0%) |
| 65 to 74 Years | 28 (5.3%) | 0 (0.0%) |
| 75 Years and over | 56 (11.0%) | 199 (39.6%) |
Technology Access in Lantana
Computing Device Access in Lantana
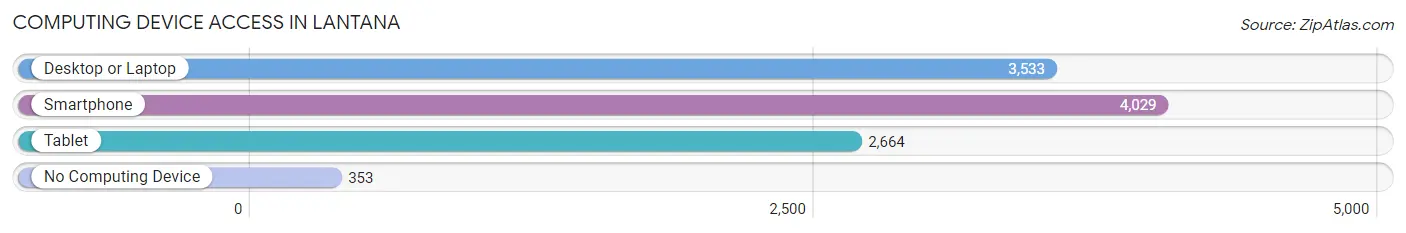
| Device Type | # Households | % Households |
| Desktop or Laptop | 3,533 | 74.6% |
| Smartphone | 4,029 | 85.1% |
| Tablet | 2,664 | 56.3% |
| No Computing Device | 353 | 7.5% |
| Total | 4,734 | 100.0% |
Internet Access in Lantana
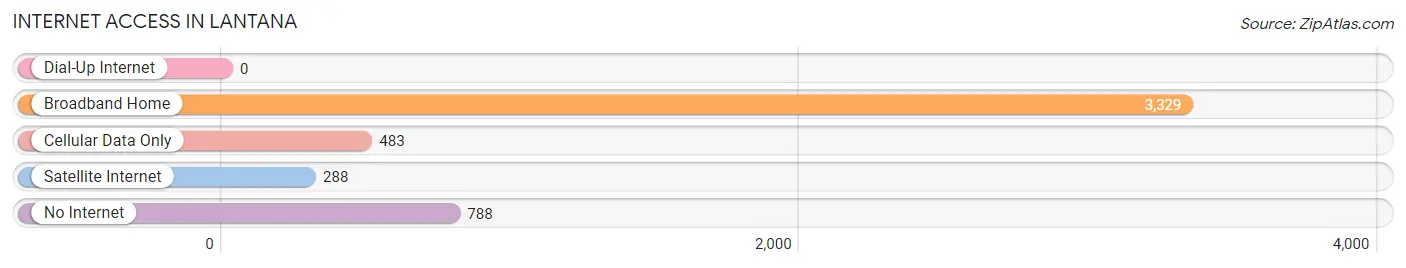
| Internet Type | # Households | % Households |
| Dial-Up Internet | 0 | 0.0% |
| Broadband Home | 3,329 | 70.3% |
| Cellular Data Only | 483 | 10.2% |
| Satellite Internet | 288 | 6.1% |
| No Internet | 788 | 16.7% |
| Total | 4,734 | 100.0% |
Lantana Summary
Lantana is a town located in Palm Beach County, Florida, United States. The population was 10,423 at the 2010 census. It is part of the Miami metropolitan area, which was home to an estimated 6,012,331 people in 2015.
History
Lantana was founded in the late 19th century by William L. Lantana, a former Confederate soldier. He purchased land in the area and began to develop it for farming. The town was incorporated in 1921 and was named after the Lantana plant, which was abundant in the area.
In the early 20th century, the town was a popular tourist destination, with many visitors coming to enjoy the beaches and fishing. The town was also known for its pineapple and citrus crops.
In the 1950s, the town began to experience rapid growth as more people moved to the area. This growth was fueled by the construction of the Intracoastal Waterway, which provided easy access to the Atlantic Ocean.
Geography
Lantana is located at 26°33'45" North, 80°4'45" West (26.5625, -80.0792). According to the United States Census Bureau, the town has a total area of 2.3 square miles (6.0 km2), of which 2.2 square miles (5.7 km2) is land and 0.1 square miles (0.3 km2) is water.
Economy
Lantana's economy is largely based on tourism and services. The town is home to several hotels, restaurants, and other businesses that cater to visitors. The town also has a number of retail stores, including a Walmart Supercenter.
The town is also home to several manufacturing companies, including a plastics manufacturer and a boat manufacturer.
Demographics
As of the 2010 census, there were 10,423 people, 4,845 households, and 2,845 families residing in the town. The population density was 4,717.3 people per square mile (1,822.2/km2). There were 5,541 housing units at an average density of 2,491.3 per square mile (962.2/km2). The racial makeup of the town was 79.2% White, 11.2% African American, 0.4% Native American, 1.2% Asian, 0.1% Pacific Islander, 5.7% from other races, and 2.2% from two or more races. Hispanic or Latino of any race were 18.2% of the population.
There were 4,845 households, out of which 20.3% had children under the age of 18 living with them, 43.2% were married couples living together, 11.7% had a female householder with no husband present, and 40.3% were non-families. 33.2% of all households were made up of individuals, and 14.2% had someone living alone who was 65 years of age or older. The average household size was 2.14 and the average family size was 2.71.
In the town, the population was spread out, with 17.7% under the age of 18, 6.7% from 18 to 24, 25.2% from 25 to 44, 28.2% from 45 to 64, and 22.2% who were 65 years of age or older. The median age was 45 years. For every 100 females, there were 91.2 males. For every 100 females age 18 and over, there were 88.3 males.
The median income for a household in the town was $41,945, and the median income for a family was $50,945. Males had a median income of $36,945 versus $27,945 for females. The per capita income for the town was $23,945. About 8.2% of families and 11.2% of the population were below the poverty line, including 16.2% of those under age 18 and 8.2% of those age 65 or over.
Common Questions
What is Per Capita Income in Lantana?
Per Capita income in Lantana is $42,097.
What is the Median Family Income in Lantana?
Median Family Income in Lantana is $94,103.
What is the Median Household income in Lantana?
Median Household Income in Lantana is $67,009.
What is Income or Wage Gap in Lantana?
Income or Wage Gap in Lantana is 4.6%.
Women in Lantana earn 95.4 cents for every dollar earned by a man.
What is Inequality or Gini Index in Lantana?
Inequality or Gini Index in Lantana is 0.51.
What is the Total Population of Lantana?
Total Population of Lantana is 11,703.
What is the Total Male Population of Lantana?
Total Male Population of Lantana is 6,459.
What is the Total Female Population of Lantana?
Total Female Population of Lantana is 5,244.
What is the Ratio of Males per 100 Females in Lantana?
There are 123.17 Males per 100 Females in Lantana.
What is the Ratio of Females per 100 Males in Lantana?
There are 81.19 Females per 100 Males in Lantana.
What is the Median Population Age in Lantana?
Median Population Age in Lantana is 41.1 Years.
What is the Average Family Size in Lantana
Average Family Size in Lantana is 3.2 People.
What is the Average Household Size in Lantana
Average Household Size in Lantana is 2.4 People.
How Large is the Labor Force in Lantana?
There are 6,809 People in the Labor Forcein in Lantana.
What is the Percentage of People in the Labor Force in Lantana?
65.9% of People are in the Labor Force in Lantana.
What is the Unemployment Rate in Lantana?
Unemployment Rate in Lantana is 9.3%.