Davie, FL Map & Demographics
Davie Map
Davie Overview
$42,349
PER CAPITA INCOME
$94,815
AVG FAMILY INCOME
$84,346
AVG HOUSEHOLD INCOME
32.2%
WAGE / INCOME GAP [ % ]
67.8¢/ $1
WAGE / INCOME GAP [ $ ]
$10,166
FAMILY INCOME DEFICIT
0.47
INEQUALITY / GINI INDEX
105,821
TOTAL POPULATION
52,837
MALE POPULATION
52,984
FEMALE POPULATION
99.72
MALES / 100 FEMALES
100.28
FEMALES / 100 MALES
36.8
MEDIAN AGE
3.2
AVG FAMILY SIZE
2.7
AVG HOUSEHOLD SIZE
59,266
LABOR FORCE [ PEOPLE ]
69.2%
PERCENT IN LABOR FORCE
4.5%
UNEMPLOYMENT RATE
Income in Davie
Income Overview in Davie
Per Capita Income in Davie is $42,349, while median incomes of families and households are $94,815 and $84,346 respectively.
| Characteristic | Number | Measure |
| Per Capita Income | 105,821 | $42,349 |
| Median Family Income | 26,368 | $94,815 |
| Mean Family Income | 26,368 | $128,926 |
| Median Household Income | 37,941 | $84,346 |
| Mean Household Income | 37,941 | $114,210 |
| Income Deficit | 26,368 | $10,166 |
| Wage / Income Gap (%) | 105,821 | 32.20% |
| Wage / Income Gap ($) | 105,821 | 67.80¢ per $1 |
| Gini / Inequality Index | 105,821 | 0.47 |
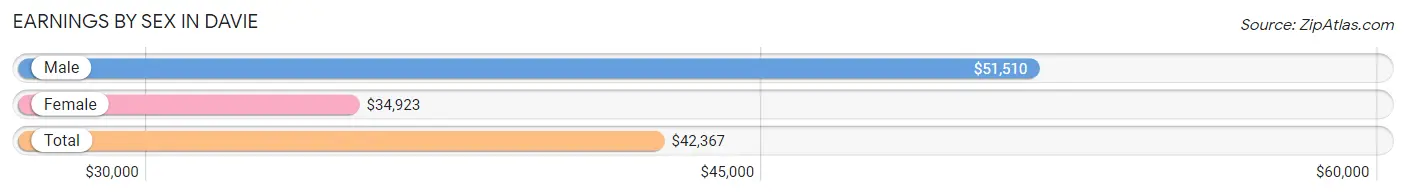
Earnings by Sex in Davie
Average Earnings in Davie are $42,367, $51,510 for men and $34,923 for women, a difference of 32.2%.
| Sex | Number | Average Earnings |
| Male | 32,094 (52.1%) | $51,510 |
| Female | 29,484 (47.9%) | $34,923 |
| Total | 61,578 (100.0%) | $42,367 |
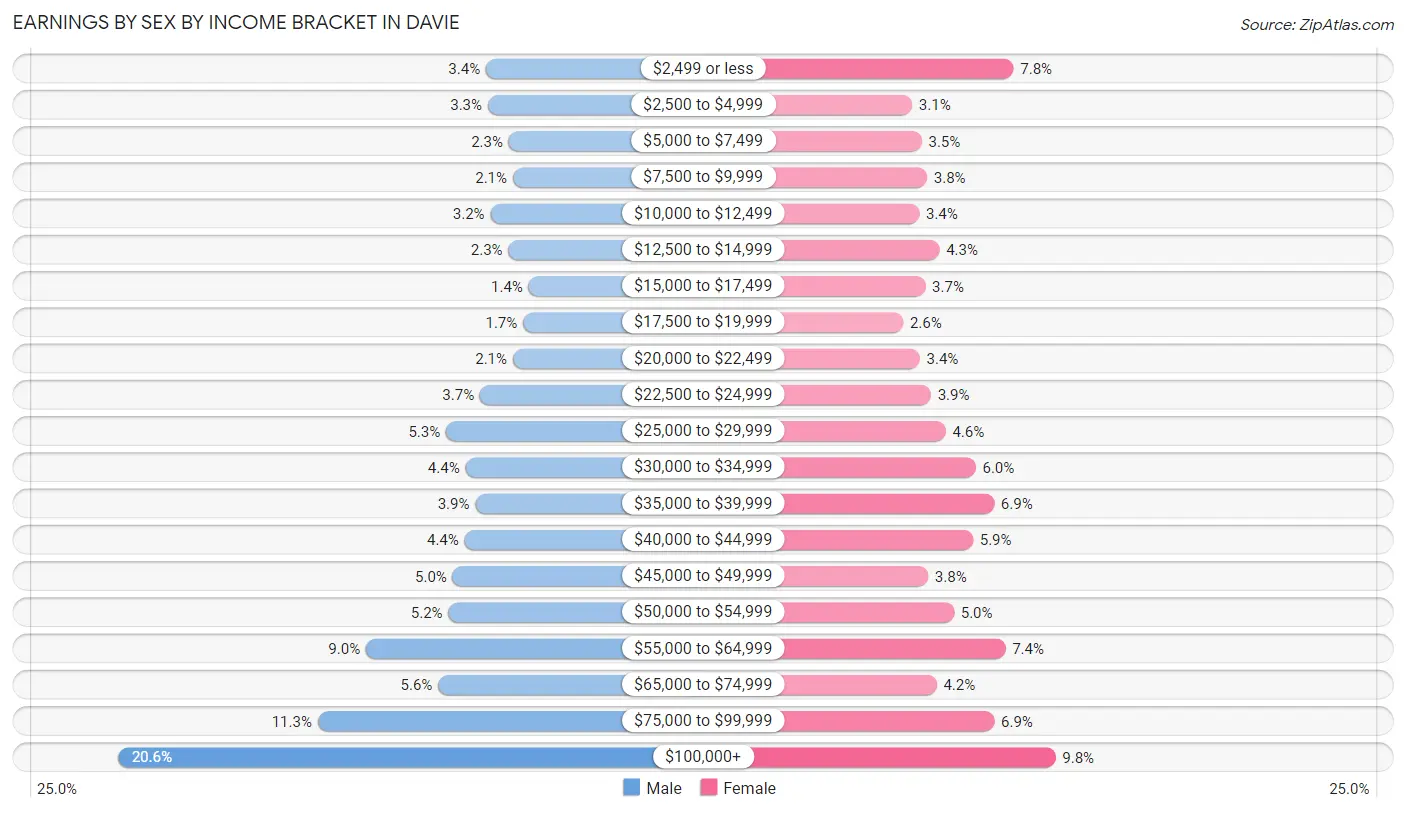
Earnings by Sex by Income Bracket in Davie
The most common earnings brackets in Davie are $100,000+ for men (6,608 | 20.6%) and $100,000+ for women (2,882 | 9.8%).
| Income | Male | Female |
| $2,499 or less | 1,089 (3.4%) | 2,300 (7.8%) |
| $2,500 to $4,999 | 1,059 (3.3%) | 899 (3.0%) |
| $5,000 to $7,499 | 745 (2.3%) | 1,033 (3.5%) |
| $7,500 to $9,999 | 685 (2.1%) | 1,106 (3.7%) |
| $10,000 to $12,499 | 1,022 (3.2%) | 997 (3.4%) |
| $12,500 to $14,999 | 752 (2.3%) | 1,278 (4.3%) |
| $15,000 to $17,499 | 446 (1.4%) | 1,082 (3.7%) |
| $17,500 to $19,999 | 530 (1.7%) | 775 (2.6%) |
| $20,000 to $22,499 | 684 (2.1%) | 1,006 (3.4%) |
| $22,500 to $24,999 | 1,178 (3.7%) | 1,158 (3.9%) |
| $25,000 to $29,999 | 1,687 (5.3%) | 1,361 (4.6%) |
| $30,000 to $34,999 | 1,395 (4.3%) | 1,779 (6.0%) |
| $35,000 to $39,999 | 1,247 (3.9%) | 2,032 (6.9%) |
| $40,000 to $44,999 | 1,409 (4.4%) | 1,741 (5.9%) |
| $45,000 to $49,999 | 1,590 (5.0%) | 1,119 (3.8%) |
| $50,000 to $54,999 | 1,652 (5.1%) | 1,478 (5.0%) |
| $55,000 to $64,999 | 2,891 (9.0%) | 2,187 (7.4%) |
| $65,000 to $74,999 | 1,808 (5.6%) | 1,238 (4.2%) |
| $75,000 to $99,999 | 3,617 (11.3%) | 2,033 (6.9%) |
| $100,000+ | 6,608 (20.6%) | 2,882 (9.8%) |
| Total | 32,094 (100.0%) | 29,484 (100.0%) |
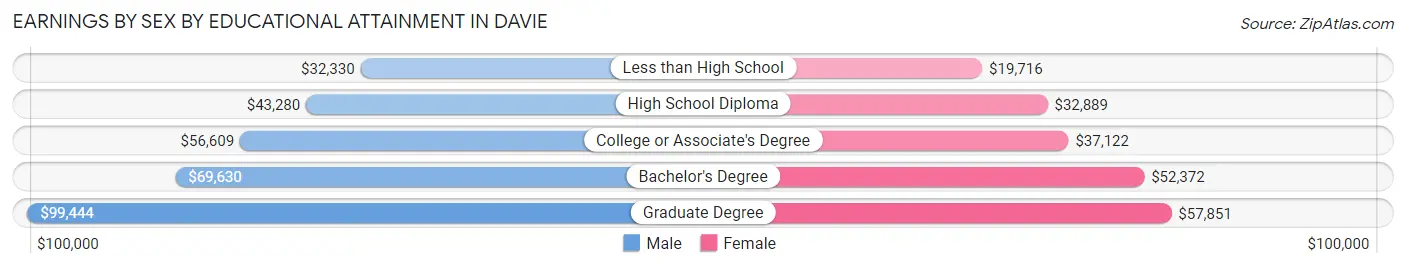
Earnings by Sex by Educational Attainment in Davie
Average earnings in Davie are $56,890 for men and $40,413 for women, a difference of 29.0%. Men with an educational attainment of graduate degree enjoy the highest average annual earnings of $99,444, while those with less than high school education earn the least with $32,330. Women with an educational attainment of graduate degree earn the most with the average annual earnings of $57,851, while those with less than high school education have the smallest earnings of $19,716.
| Educational Attainment | Male Income | Female Income |
| Less than High School | $32,330 | $19,716 |
| High School Diploma | $43,280 | $32,889 |
| College or Associate's Degree | $56,609 | $37,122 |
| Bachelor's Degree | $69,630 | $52,372 |
| Graduate Degree | $99,444 | $57,851 |
| Total | $56,890 | $40,413 |
Family Income in Davie
Family Income Brackets in Davie
According to the Davie family income data, there are 5,485 families falling into the $100,000 to $149,999 income range, which is the most common income bracket and makes up 20.8% of all families. Conversely, the $10,000 to $14,999 income bracket is the least frequent group with only 343 families (1.3%) belonging to this category.
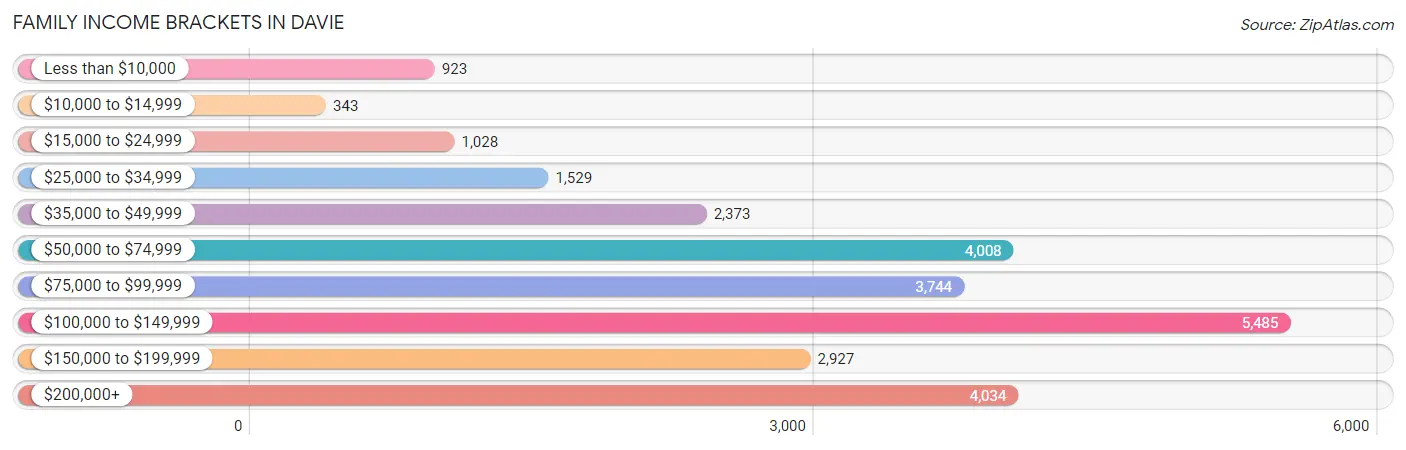
| Income Bracket | # Families | % Families |
| Less than $10,000 | 923 | 3.5% |
| $10,000 to $14,999 | 343 | 1.3% |
| $15,000 to $24,999 | 1,028 | 3.9% |
| $25,000 to $34,999 | 1,529 | 5.8% |
| $35,000 to $49,999 | 2,373 | 9.0% |
| $50,000 to $74,999 | 4,008 | 15.2% |
| $75,000 to $99,999 | 3,744 | 14.2% |
| $100,000 to $149,999 | 5,485 | 20.8% |
| $150,000 to $199,999 | 2,927 | 11.1% |
| $200,000+ | 4,034 | 15.3% |
Family Income by Famaliy Size in Davie
5-person families (1,654 | 6.3%) account for the highest median family income in Davie with $118,275 per family, while 2-person families (10,895 | 41.3%) have the highest median income of $43,258 per family member.
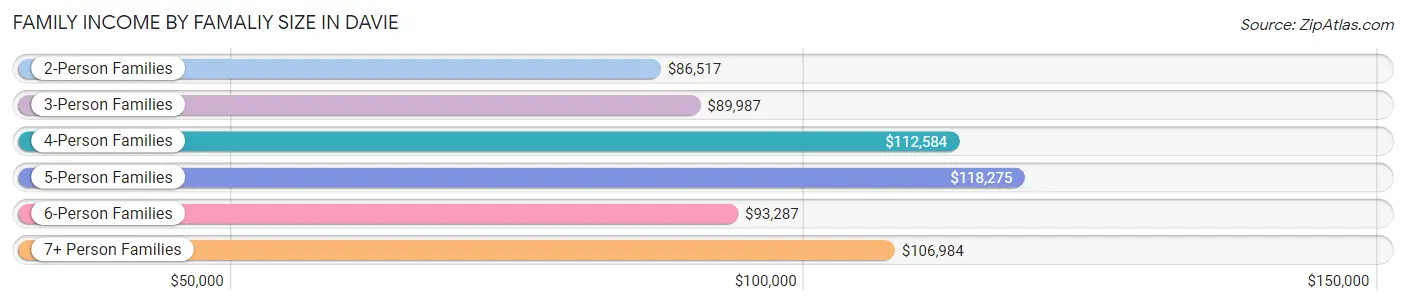
| Income Bracket | # Families | Median Income |
| 2-Person Families | 10,895 (41.3%) | $86,517 |
| 3-Person Families | 6,962 (26.4%) | $89,987 |
| 4-Person Families | 5,915 (22.4%) | $112,584 |
| 5-Person Families | 1,654 (6.3%) | $118,275 |
| 6-Person Families | 617 (2.3%) | $93,287 |
| 7+ Person Families | 325 (1.2%) | $106,984 |
| Total | 26,368 (100.0%) | $94,815 |
Family Income by Number of Earners in Davie
The median family income in Davie is $94,815, with families comprising 3+ earners (4,120) having the highest median family income of $122,612, while families with no earners (2,261) have the lowest median family income of $44,710, accounting for 15.6% and 8.6% of families, respectively.
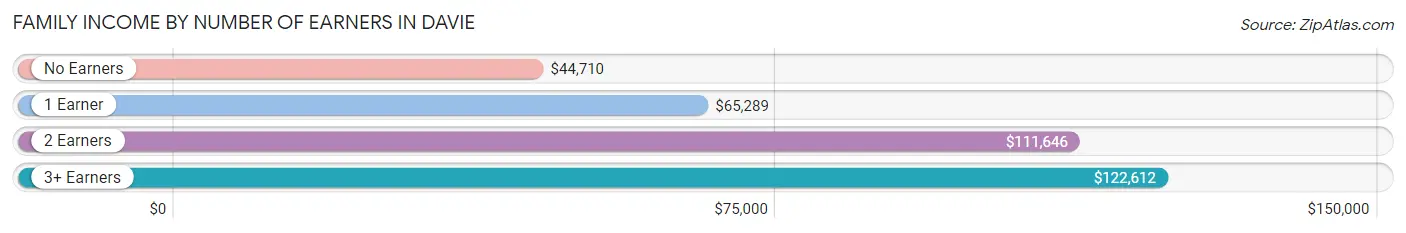
| Number of Earners | # Families | Median Income |
| No Earners | 2,261 (8.6%) | $44,710 |
| 1 Earner | 8,883 (33.7%) | $65,289 |
| 2 Earners | 11,104 (42.1%) | $111,646 |
| 3+ Earners | 4,120 (15.6%) | $122,612 |
| Total | 26,368 (100.0%) | $94,815 |
Household Income in Davie
Household Income Brackets in Davie
With 7,133 households falling in the category, the $100,000 to $149,999 income range is the most frequent in Davie, accounting for 18.8% of all households. In contrast, only 949 households (2.5%) fall into the $10,000 to $14,999 income bracket, making it the least populous group.
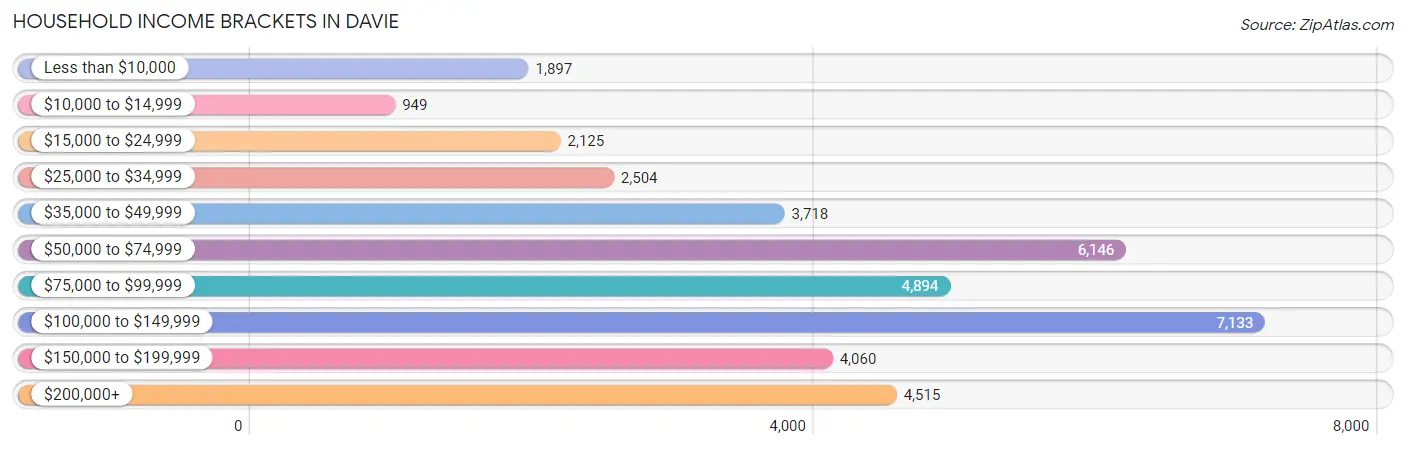
| Income Bracket | # Households | % Households |
| Less than $10,000 | 1,897 | 5.0% |
| $10,000 to $14,999 | 949 | 2.5% |
| $15,000 to $24,999 | 2,125 | 5.6% |
| $25,000 to $34,999 | 2,504 | 6.6% |
| $35,000 to $49,999 | 3,718 | 9.8% |
| $50,000 to $74,999 | 6,146 | 16.2% |
| $75,000 to $99,999 | 4,894 | 12.9% |
| $100,000 to $149,999 | 7,133 | 18.8% |
| $150,000 to $199,999 | 4,060 | 10.7% |
| $200,000+ | 4,515 | 11.9% |
Household Income by Householder Age in Davie
The median household income in Davie is $84,346, with the highest median household income of $95,419 found in the 45 to 64 years age bracket for the primary householder. A total of 16,402 households (43.2%) fall into this category. Meanwhile, the 15 to 24 years age bracket for the primary householder has the lowest median household income of $24,667, with 1,114 households (2.9%) in this group.
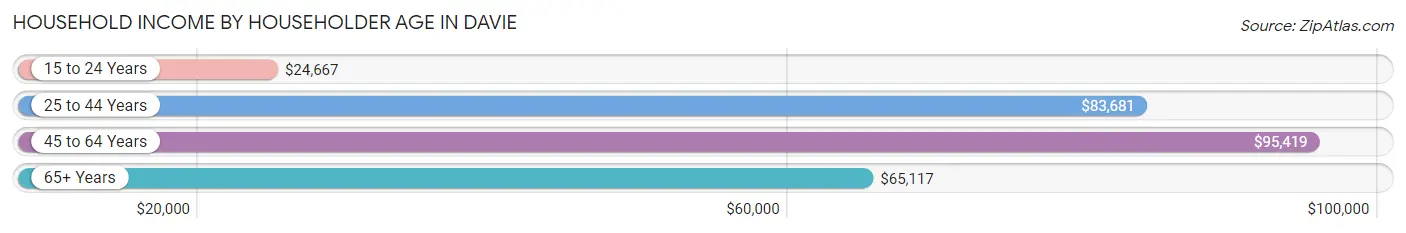
| Income Bracket | # Households | Median Income |
| 15 to 24 Years | 1,114 (2.9%) | $24,667 |
| 25 to 44 Years | 13,155 (34.7%) | $83,681 |
| 45 to 64 Years | 16,402 (43.2%) | $95,419 |
| 65+ Years | 7,270 (19.2%) | $65,117 |
| Total | 37,941 (100.0%) | $84,346 |
Poverty in Davie
Income Below Poverty by Sex and Age in Davie
With 10.5% poverty level for males and 12.5% for females among the residents of Davie, 5 year old males and 18 to 24 year old females are the most vulnerable to poverty, with 199 males (32.1%) and 1,063 females (22.4%) in their respective age groups living below the poverty level.
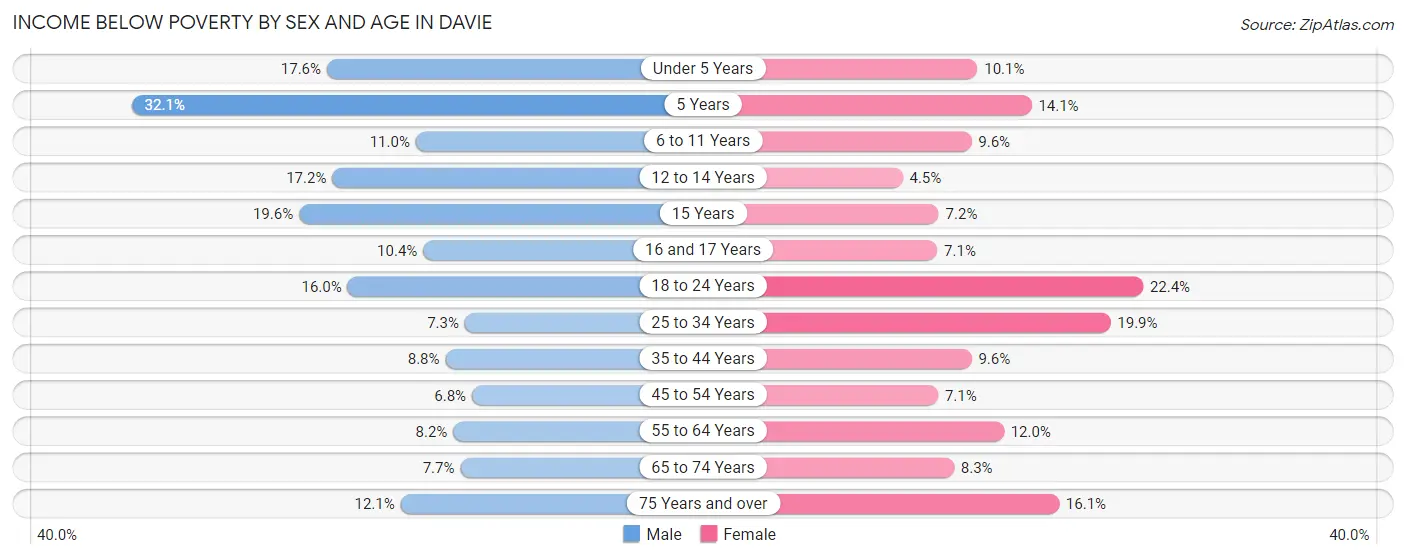
| Age Bracket | Male | Female |
| Under 5 Years | 651 (17.6%) | 235 (10.1%) |
| 5 Years | 199 (32.1%) | 67 (14.1%) |
| 6 to 11 Years | 500 (11.0%) | 346 (9.6%) |
| 12 to 14 Years | 345 (17.2%) | 68 (4.5%) |
| 15 Years | 128 (19.6%) | 40 (7.2%) |
| 16 and 17 Years | 143 (10.4%) | 88 (7.1%) |
| 18 to 24 Years | 714 (16.0%) | 1,063 (22.4%) |
| 25 to 34 Years | 568 (7.3%) | 1,682 (19.9%) |
| 35 to 44 Years | 622 (8.8%) | 689 (9.6%) |
| 45 to 54 Years | 500 (6.8%) | 595 (7.1%) |
| 55 to 64 Years | 574 (8.2%) | 731 (12.0%) |
| 65 to 74 Years | 277 (7.6%) | 335 (8.3%) |
| 75 Years and over | 245 (12.1%) | 517 (16.1%) |
| Total | 5,466 (10.5%) | 6,456 (12.5%) |
Income Above Poverty by Sex and Age in Davie
According to the poverty statistics in Davie, males aged 45 to 54 years and females aged 12 to 14 years are the age groups that are most secure financially, with 93.2% of males and 95.5% of females in these age groups living above the poverty line.
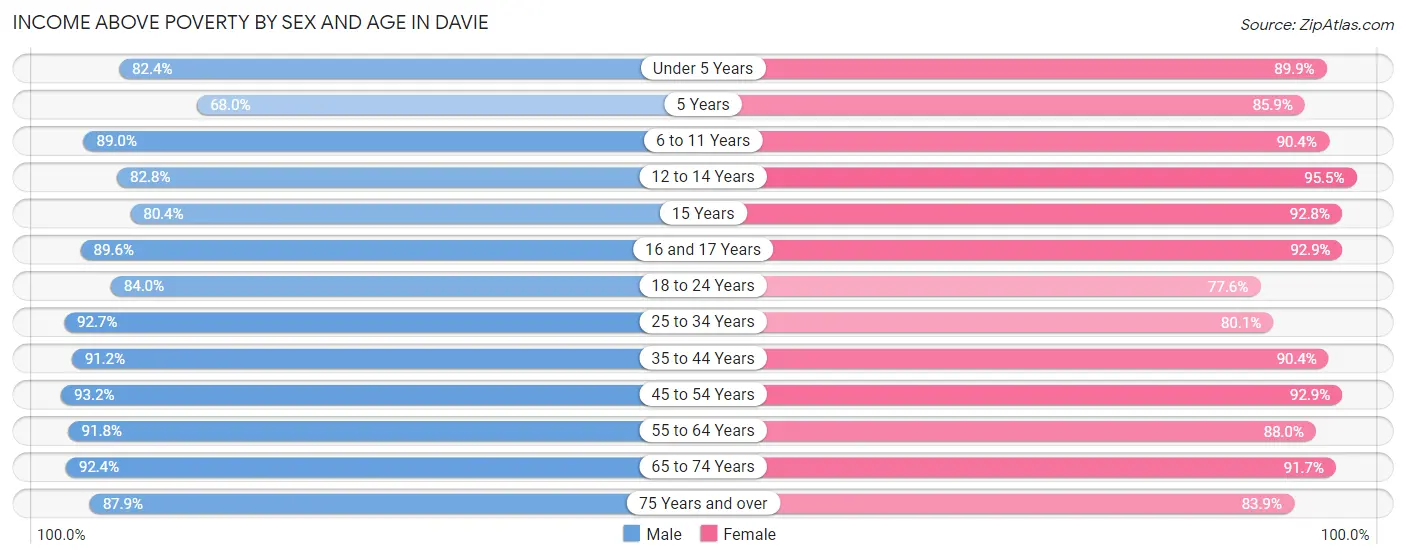
| Age Bracket | Male | Female |
| Under 5 Years | 3,057 (82.4%) | 2,101 (89.9%) |
| 5 Years | 422 (67.9%) | 409 (85.9%) |
| 6 to 11 Years | 4,063 (89.0%) | 3,251 (90.4%) |
| 12 to 14 Years | 1,665 (82.8%) | 1,439 (95.5%) |
| 15 Years | 524 (80.4%) | 516 (92.8%) |
| 16 and 17 Years | 1,231 (89.6%) | 1,155 (92.9%) |
| 18 to 24 Years | 3,743 (84.0%) | 3,690 (77.6%) |
| 25 to 34 Years | 7,189 (92.7%) | 6,754 (80.1%) |
| 35 to 44 Years | 6,479 (91.2%) | 6,465 (90.4%) |
| 45 to 54 Years | 6,863 (93.2%) | 7,740 (92.9%) |
| 55 to 64 Years | 6,444 (91.8%) | 5,352 (88.0%) |
| 65 to 74 Years | 3,346 (92.3%) | 3,693 (91.7%) |
| 75 Years and over | 1,782 (87.9%) | 2,690 (83.9%) |
| Total | 46,808 (89.5%) | 45,255 (87.5%) |
Income Below Poverty Among Married-Couple Families in Davie
The poverty statistics for married-couple families in Davie show that 6.0% or 1,078 of the total 17,834 families live below the poverty line. Families with 3 or 4 children have the highest poverty rate of 9.6%, comprising of 94 families. On the other hand, families with 5 or more children have the lowest poverty rate of 0.0%, which includes 0 families.
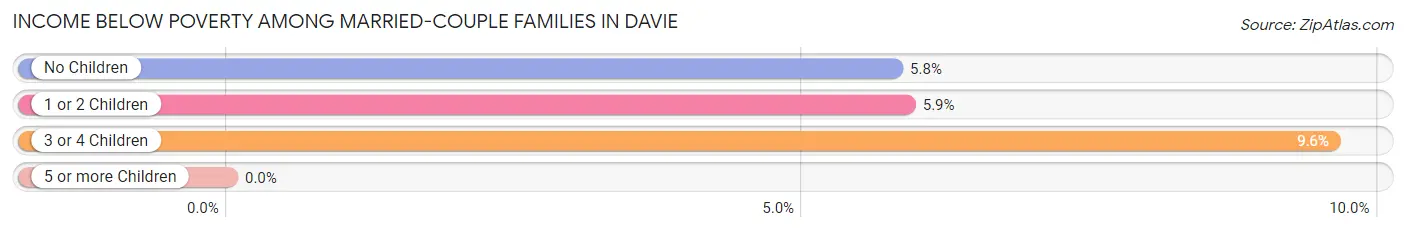
| Children | Above Poverty | Below Poverty |
| No Children | 8,911 (94.2%) | 548 (5.8%) |
| 1 or 2 Children | 6,953 (94.1%) | 436 (5.9%) |
| 3 or 4 Children | 885 (90.4%) | 94 (9.6%) |
| 5 or more Children | 7 (100.0%) | 0 (0.0%) |
| Total | 16,756 (94.0%) | 1,078 (6.0%) |
Income Below Poverty Among Single-Parent Households in Davie
According to the poverty data in Davie, 2.2% or 54 single-father households and 17.4% or 1,060 single-mother households are living below the poverty line. Among single-father households, those with no children have the highest poverty rate, with 48 households (3.5%) experiencing poverty. Likewise, among single-mother households, those with 5 or more children have the highest poverty rate, with 24 households (100.0%) falling below the poverty line.
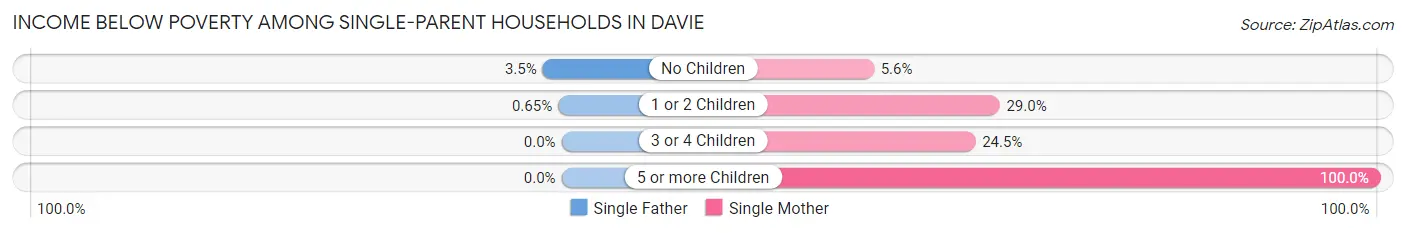
| Children | Single Father | Single Mother |
| No Children | 48 (3.5%) | 169 (5.6%) |
| 1 or 2 Children | 6 (0.6%) | 756 (29.0%) |
| 3 or 4 Children | 0 (0.0%) | 111 (24.5%) |
| 5 or more Children | 0 (0.0%) | 24 (100.0%) |
| Total | 54 (2.2%) | 1,060 (17.4%) |
Income Below Poverty Among Married-Couple vs Single-Parent Households in Davie
The poverty data for Davie shows that 1,078 of the married-couple family households (6.0%) and 1,114 of the single-parent households (13.1%) are living below the poverty level. Within the married-couple family households, those with 3 or 4 children have the highest poverty rate, with 94 households (9.6%) falling below the poverty line. Among the single-parent households, those with 5 or more children have the highest poverty rate, with 24 household (100.0%) living below poverty.
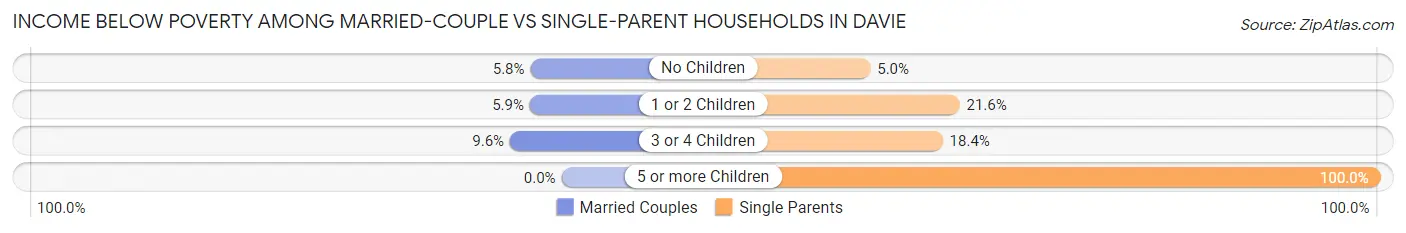
| Children | Married-Couple Families | Single-Parent Households |
| No Children | 548 (5.8%) | 217 (5.0%) |
| 1 or 2 Children | 436 (5.9%) | 762 (21.6%) |
| 3 or 4 Children | 94 (9.6%) | 111 (18.4%) |
| 5 or more Children | 0 (0.0%) | 24 (100.0%) |
| Total | 1,078 (6.0%) | 1,114 (13.1%) |
Race in Davie
The most populous races in Davie are White / Caucasian (63,089 | 59.6%), Hispanic or Latino (44,392 | 41.9%), and Two or more Races (21,073 | 19.9%).
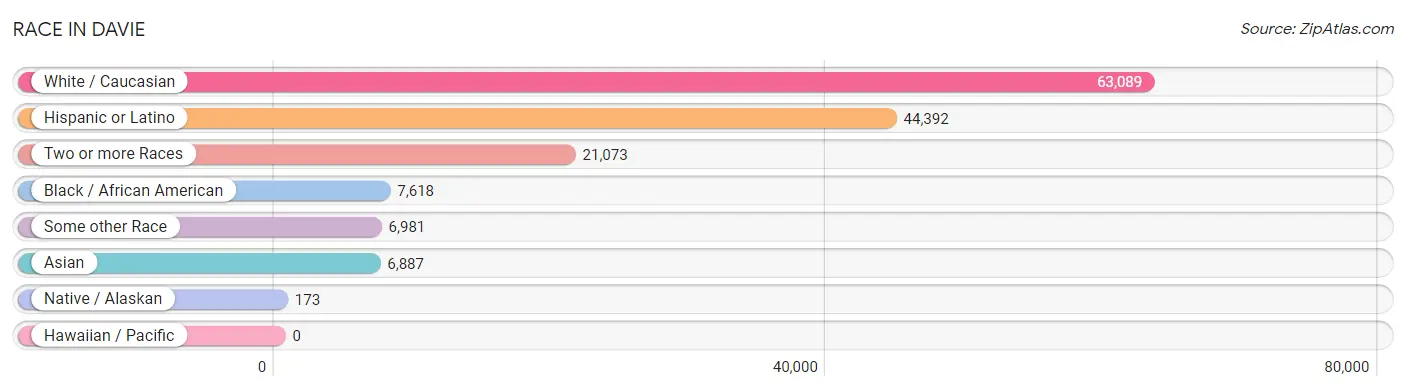
| Race | # Population | % Population |
| Asian | 6,887 | 6.5% |
| Black / African American | 7,618 | 7.2% |
| Hawaiian / Pacific | 0 | 0.0% |
| Hispanic or Latino | 44,392 | 41.9% |
| Native / Alaskan | 173 | 0.2% |
| White / Caucasian | 63,089 | 59.6% |
| Two or more Races | 21,073 | 19.9% |
| Some other Race | 6,981 | 6.6% |
| Total | 105,821 | 100.0% |
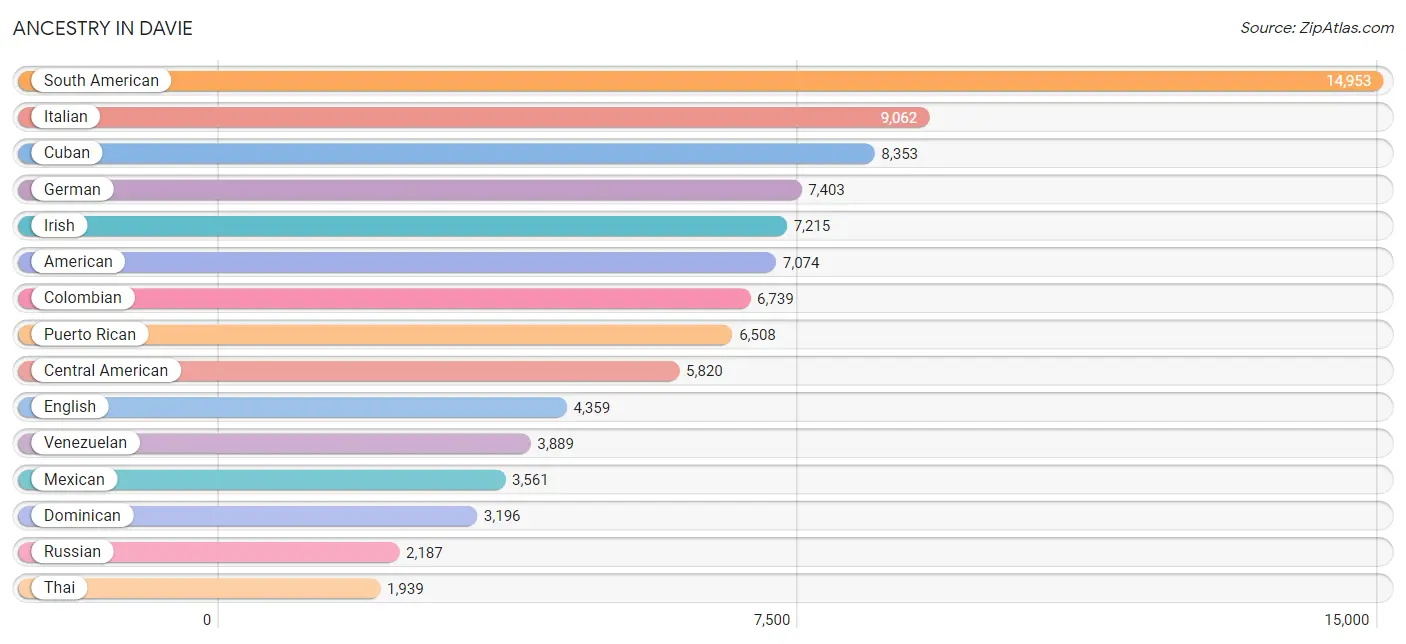
Ancestry in Davie
The most populous ancestries reported in Davie are South American (14,953 | 14.1%), Italian (9,062 | 8.6%), Cuban (8,353 | 7.9%), German (7,403 | 7.0%), and Irish (7,215 | 6.8%), together accounting for 44.4% of all Davie residents.
| Ancestry | # Population | % Population |
| African | 287 | 0.3% |
| American | 7,074 | 6.7% |
| Arab | 1,205 | 1.1% |
| Argentinean | 789 | 0.7% |
| Armenian | 104 | 0.1% |
| Australian | 41 | 0.0% |
| Austrian | 312 | 0.3% |
| Bahamian | 82 | 0.1% |
| Basque | 10 | 0.0% |
| Belgian | 8 | 0.0% |
| Bermudan | 6 | 0.0% |
| Bhutanese | 229 | 0.2% |
| Bolivian | 86 | 0.1% |
| Brazilian | 231 | 0.2% |
| British | 619 | 0.6% |
| British West Indian | 13 | 0.0% |
| Bulgarian | 142 | 0.1% |
| Burmese | 349 | 0.3% |
| Canadian | 374 | 0.4% |
| Central American | 5,820 | 5.5% |
| Central American Indian | 192 | 0.2% |
| Cherokee | 130 | 0.1% |
| Chilean | 128 | 0.1% |
| Colombian | 6,739 | 6.4% |
| Costa Rican | 241 | 0.2% |
| Creek | 114 | 0.1% |
| Croatian | 96 | 0.1% |
| Cuban | 8,353 | 7.9% |
| Czech | 162 | 0.2% |
| Czechoslovakian | 52 | 0.1% |
| Danish | 73 | 0.1% |
| Dominican | 3,196 | 3.0% |
| Dutch | 411 | 0.4% |
| Dutch West Indian | 20 | 0.0% |
| Eastern European | 527 | 0.5% |
| Ecuadorian | 1,188 | 1.1% |
| Egyptian | 263 | 0.3% |
| English | 4,359 | 4.1% |
| Estonian | 23 | 0.0% |
| European | 1,907 | 1.8% |
| Filipino | 77 | 0.1% |
| Finnish | 105 | 0.1% |
| French | 1,474 | 1.4% |
| French Canadian | 422 | 0.4% |
| German | 7,403 | 7.0% |
| Ghanaian | 31 | 0.0% |
| Greek | 676 | 0.6% |
| Guatemalan | 1,021 | 1.0% |
| Guyanese | 75 | 0.1% |
| Haitian | 1,701 | 1.6% |
| Honduran | 1,812 | 1.7% |
| Hungarian | 532 | 0.5% |
| Indian (Asian) | 1,598 | 1.5% |
| Indonesian | 8 | 0.0% |
| Iranian | 30 | 0.0% |
| Iraqi | 13 | 0.0% |
| Irish | 7,215 | 6.8% |
| Israeli | 242 | 0.2% |
| Italian | 9,062 | 8.6% |
| Jamaican | 1,889 | 1.8% |
| Japanese | 7 | 0.0% |
| Jordanian | 70 | 0.1% |
| Kenyan | 76 | 0.1% |
| Korean | 1,238 | 1.2% |
| Laotian | 116 | 0.1% |
| Lebanese | 399 | 0.4% |
| Lithuanian | 188 | 0.2% |
| Maltese | 10 | 0.0% |
| Mexican | 3,561 | 3.4% |
| Mongolian | 15 | 0.0% |
| Moroccan | 57 | 0.1% |
| Nicaraguan | 1,033 | 1.0% |
| Nigerian | 59 | 0.1% |
| Northern European | 70 | 0.1% |
| Norwegian | 214 | 0.2% |
| Pakistani | 12 | 0.0% |
| Palestinian | 5 | 0.0% |
| Panamanian | 534 | 0.5% |
| Paraguayan | 37 | 0.0% |
| Pennsylvania German | 66 | 0.1% |
| Peruvian | 1,881 | 1.8% |
| Polish | 1,787 | 1.7% |
| Portuguese | 357 | 0.3% |
| Puerto Rican | 6,508 | 6.1% |
| Romanian | 375 | 0.4% |
| Russian | 2,187 | 2.1% |
| Salvadoran | 1,179 | 1.1% |
| Scandinavian | 135 | 0.1% |
| Scotch-Irish | 484 | 0.5% |
| Scottish | 1,094 | 1.0% |
| Seminole | 144 | 0.1% |
| Serbian | 302 | 0.3% |
| Sioux | 8 | 0.0% |
| Slavic | 47 | 0.0% |
| Slovak | 126 | 0.1% |
| Slovene | 171 | 0.2% |
| South African | 36 | 0.0% |
| South American | 14,953 | 14.1% |
| South American Indian | 18 | 0.0% |
| Spaniard | 694 | 0.7% |
| Spanish | 234 | 0.2% |
| Sri Lankan | 1,599 | 1.5% |
| Subsaharan African | 597 | 0.6% |
| Sudanese | 64 | 0.1% |
| Swedish | 476 | 0.4% |
| Swiss | 8 | 0.0% |
| Syrian | 58 | 0.1% |
| Thai | 1,939 | 1.8% |
| Trinidadian and Tobagonian | 159 | 0.2% |
| Turkish | 151 | 0.1% |
| U.S. Virgin Islander | 77 | 0.1% |
| Ugandan | 80 | 0.1% |
| Ukrainian | 458 | 0.4% |
| Uruguayan | 216 | 0.2% |
| Venezuelan | 3,889 | 3.7% |
| Vietnamese | 469 | 0.4% |
| Welsh | 173 | 0.2% |
| West Indian | 345 | 0.3% | View All 118 Rows |
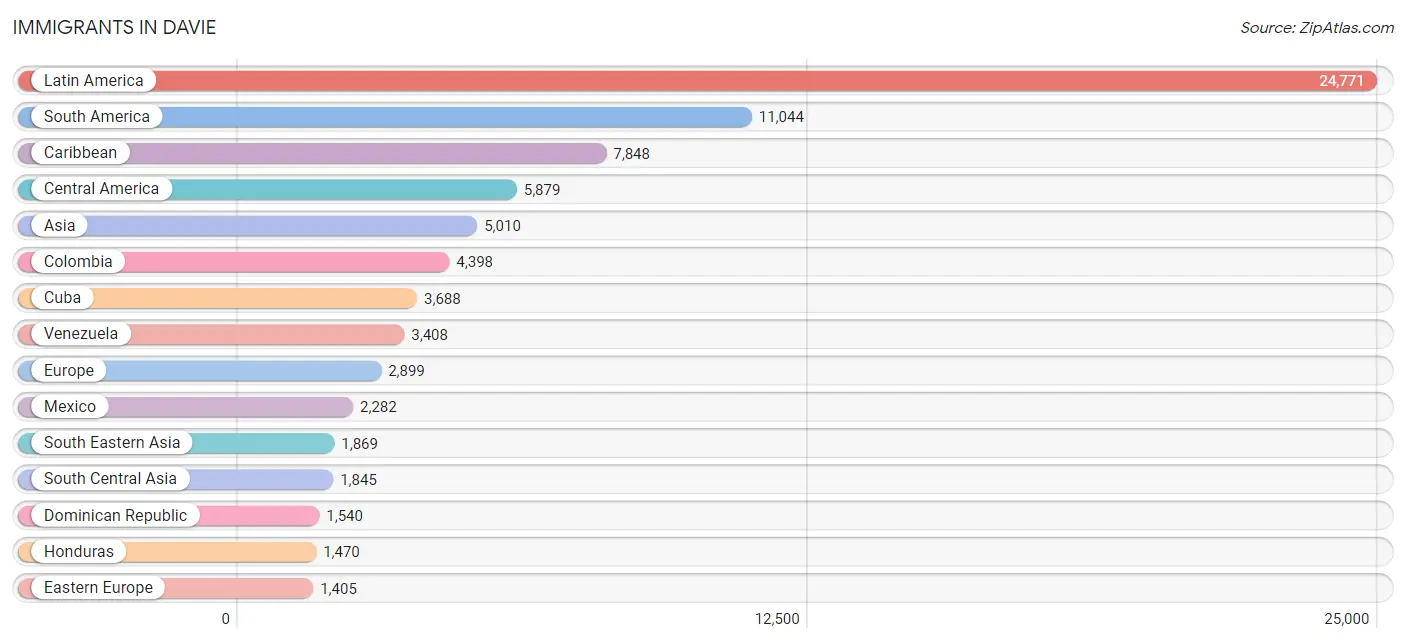
Immigrants in Davie
The most numerous immigrant groups reported in Davie came from Latin America (24,771 | 23.4%), South America (11,044 | 10.4%), Caribbean (7,848 | 7.4%), Central America (5,879 | 5.6%), and Asia (5,010 | 4.7%), together accounting for 51.6% of all Davie residents.
| Immigration Origin | # Population | % Population |
| Africa | 517 | 0.5% |
| Argentina | 392 | 0.4% |
| Asia | 5,010 | 4.7% |
| Australia | 32 | 0.0% |
| Austria | 12 | 0.0% |
| Bahamas | 85 | 0.1% |
| Bangladesh | 496 | 0.5% |
| Belarus | 24 | 0.0% |
| Bolivia | 86 | 0.1% |
| Brazil | 442 | 0.4% |
| Bulgaria | 142 | 0.1% |
| Cambodia | 7 | 0.0% |
| Cameroon | 85 | 0.1% |
| Canada | 1,173 | 1.1% |
| Caribbean | 7,848 | 7.4% |
| Central America | 5,879 | 5.6% |
| Chile | 121 | 0.1% |
| China | 695 | 0.7% |
| Colombia | 4,398 | 4.2% |
| Costa Rica | 103 | 0.1% |
| Croatia | 27 | 0.0% |
| Cuba | 3,688 | 3.5% |
| Czechoslovakia | 53 | 0.1% |
| Dominican Republic | 1,540 | 1.5% |
| Eastern Africa | 121 | 0.1% |
| Eastern Asia | 913 | 0.9% |
| Eastern Europe | 1,405 | 1.3% |
| Ecuador | 757 | 0.7% |
| Egypt | 112 | 0.1% |
| El Salvador | 615 | 0.6% |
| England | 330 | 0.3% |
| Europe | 2,899 | 2.7% |
| France | 15 | 0.0% |
| Germany | 191 | 0.2% |
| Ghana | 31 | 0.0% |
| Greece | 7 | 0.0% |
| Guatemala | 643 | 0.6% |
| Guyana | 129 | 0.1% |
| Haiti | 871 | 0.8% |
| Honduras | 1,470 | 1.4% |
| Hong Kong | 62 | 0.1% |
| Hungary | 110 | 0.1% |
| India | 544 | 0.5% |
| Iran | 46 | 0.0% |
| Iraq | 13 | 0.0% |
| Ireland | 94 | 0.1% |
| Israel | 216 | 0.2% |
| Italy | 164 | 0.2% |
| Jamaica | 1,223 | 1.2% |
| Jordan | 14 | 0.0% |
| Kenya | 41 | 0.0% |
| Korea | 218 | 0.2% |
| Latin America | 24,771 | 23.4% |
| Lebanon | 41 | 0.0% |
| Lithuania | 7 | 0.0% |
| Malaysia | 33 | 0.0% |
| Mexico | 2,282 | 2.2% |
| Middle Africa | 85 | 0.1% |
| Moldova | 32 | 0.0% |
| Nepal | 364 | 0.3% |
| Netherlands | 24 | 0.0% |
| Nicaragua | 548 | 0.5% |
| Nigeria | 59 | 0.1% |
| Northern Africa | 112 | 0.1% |
| Northern Europe | 871 | 0.8% |
| Norway | 82 | 0.1% |
| Oceania | 32 | 0.0% |
| Pakistan | 354 | 0.3% |
| Panama | 218 | 0.2% |
| Peru | 1,047 | 1.0% |
| Philippines | 611 | 0.6% |
| Poland | 22 | 0.0% |
| Portugal | 52 | 0.1% |
| Romania | 347 | 0.3% |
| Russia | 378 | 0.4% |
| Saudi Arabia | 46 | 0.0% |
| Scotland | 24 | 0.0% |
| Serbia | 129 | 0.1% |
| South Africa | 81 | 0.1% |
| South America | 11,044 | 10.4% |
| South Central Asia | 1,845 | 1.7% |
| South Eastern Asia | 1,869 | 1.8% |
| Southern Europe | 381 | 0.4% |
| Spain | 158 | 0.2% |
| Sweden | 120 | 0.1% |
| Taiwan | 102 | 0.1% |
| Thailand | 12 | 0.0% |
| Trinidad and Tobago | 394 | 0.4% |
| Turkey | 53 | 0.1% |
| Uganda | 35 | 0.0% |
| Ukraine | 89 | 0.1% |
| Uruguay | 139 | 0.1% |
| Uzbekistan | 41 | 0.0% |
| Venezuela | 3,408 | 3.2% |
| Vietnam | 1,189 | 1.1% |
| West Indies | 3 | 0.0% |
| Western Africa | 118 | 0.1% |
| Western Asia | 383 | 0.4% |
| Western Europe | 242 | 0.2% |
| Zimbabwe | 16 | 0.0% | View All 100 Rows |
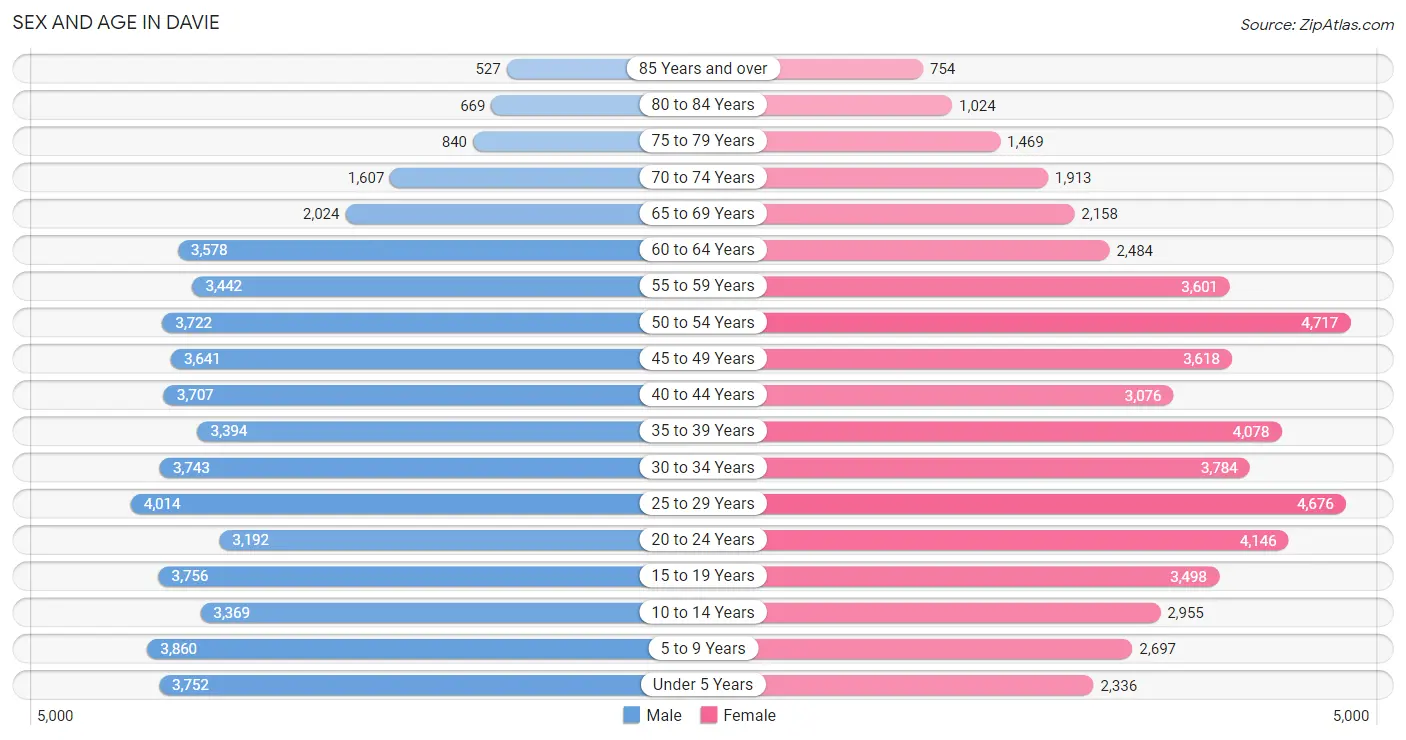
Sex and Age in Davie
Sex and Age in Davie
The most populous age groups in Davie are 25 to 29 Years (4,014 | 7.6%) for men and 50 to 54 Years (4,717 | 8.9%) for women.
| Age Bracket | Male | Female |
| Under 5 Years | 3,752 (7.1%) | 2,336 (4.4%) |
| 5 to 9 Years | 3,860 (7.3%) | 2,697 (5.1%) |
| 10 to 14 Years | 3,369 (6.4%) | 2,955 (5.6%) |
| 15 to 19 Years | 3,756 (7.1%) | 3,498 (6.6%) |
| 20 to 24 Years | 3,192 (6.0%) | 4,146 (7.8%) |
| 25 to 29 Years | 4,014 (7.6%) | 4,676 (8.8%) |
| 30 to 34 Years | 3,743 (7.1%) | 3,784 (7.1%) |
| 35 to 39 Years | 3,394 (6.4%) | 4,078 (7.7%) |
| 40 to 44 Years | 3,707 (7.0%) | 3,076 (5.8%) |
| 45 to 49 Years | 3,641 (6.9%) | 3,618 (6.8%) |
| 50 to 54 Years | 3,722 (7.0%) | 4,717 (8.9%) |
| 55 to 59 Years | 3,442 (6.5%) | 3,601 (6.8%) |
| 60 to 64 Years | 3,578 (6.8%) | 2,484 (4.7%) |
| 65 to 69 Years | 2,024 (3.8%) | 2,158 (4.1%) |
| 70 to 74 Years | 1,607 (3.0%) | 1,913 (3.6%) |
| 75 to 79 Years | 840 (1.6%) | 1,469 (2.8%) |
| 80 to 84 Years | 669 (1.3%) | 1,024 (1.9%) |
| 85 Years and over | 527 (1.0%) | 754 (1.4%) |
| Total | 52,837 (100.0%) | 52,984 (100.0%) |
Families and Households in Davie
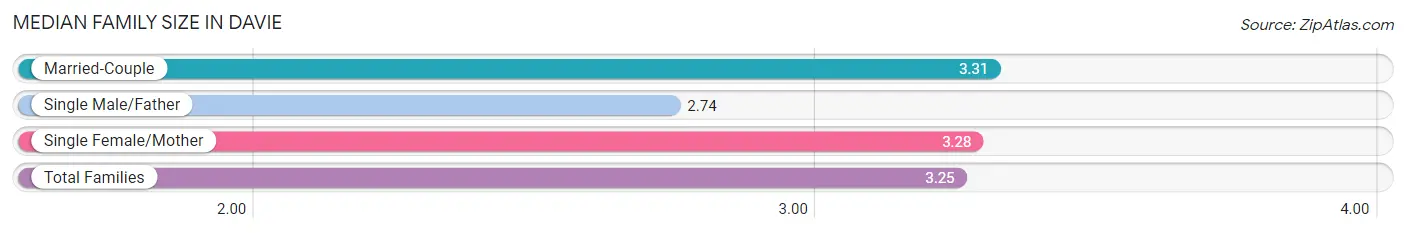
Median Family Size in Davie
The median family size in Davie is 3.25 persons per family, with married-couple families (17,834 | 67.6%) accounting for the largest median family size of 3.31 persons per family. On the other hand, single male/father families (2,432 | 9.2%) represent the smallest median family size with 2.74 persons per family.
| Family Type | # Families | Family Size |
| Married-Couple | 17,834 (67.6%) | 3.31 |
| Single Male/Father | 2,432 (9.2%) | 2.74 |
| Single Female/Mother | 6,102 (23.1%) | 3.28 |
| Total Families | 26,368 (100.0%) | 3.25 |
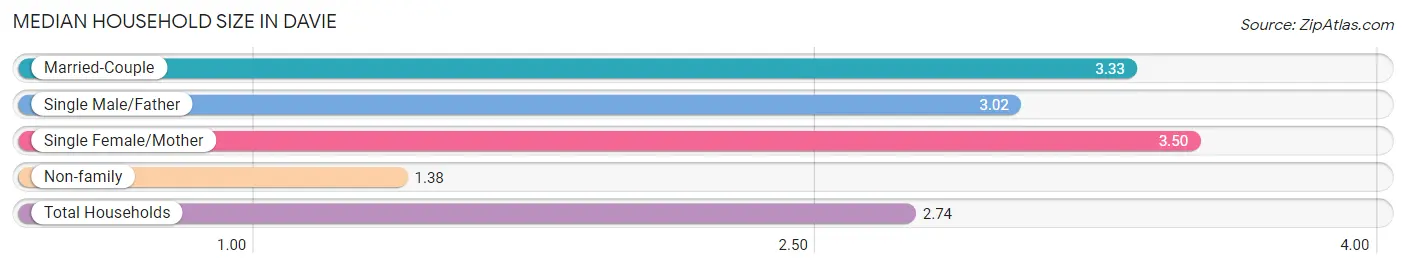
Median Household Size in Davie
The median household size in Davie is 2.74 persons per household, with single female/mother households (6,102 | 16.1%) accounting for the largest median household size of 3.5 persons per household. non-family households (11,573 | 30.5%) represent the smallest median household size with 1.38 persons per household.
| Household Type | # Households | Household Size |
| Married-Couple | 17,834 (47.0%) | 3.33 |
| Single Male/Father | 2,432 (6.4%) | 3.02 |
| Single Female/Mother | 6,102 (16.1%) | 3.50 |
| Non-family | 11,573 (30.5%) | 1.38 |
| Total Households | 37,941 (100.0%) | 2.74 |
Household Size by Marriage Status in Davie
Out of a total of 37,941 households in Davie, 26,368 (69.5%) are family households, while 11,573 (30.5%) are nonfamily households. The most numerous type of family households are 2-person households, comprising 9,990, and the most common type of nonfamily households are 1-person households, comprising 8,329.
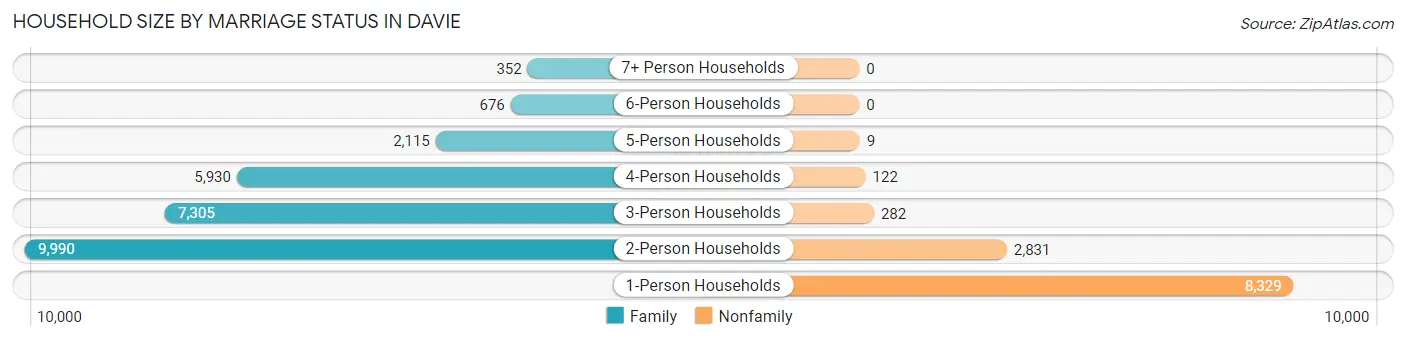
| Household Size | Family Households | Nonfamily Households |
| 1-Person Households | - | 8,329 (22.0%) |
| 2-Person Households | 9,990 (26.3%) | 2,831 (7.5%) |
| 3-Person Households | 7,305 (19.3%) | 282 (0.7%) |
| 4-Person Households | 5,930 (15.6%) | 122 (0.3%) |
| 5-Person Households | 2,115 (5.6%) | 9 (0.0%) |
| 6-Person Households | 676 (1.8%) | 0 (0.0%) |
| 7+ Person Households | 352 (0.9%) | 0 (0.0%) |
| Total | 26,368 (69.5%) | 11,573 (30.5%) |
Female Fertility in Davie
Fertility by Age in Davie
Average fertility rate in Davie is 40.0 births per 1,000 women. Women in the age bracket of 20 to 34 years have the highest fertility rate with 58.0 births per 1,000 women. Women in the age bracket of 20 to 34 years acount for 65.2% of all women with births.
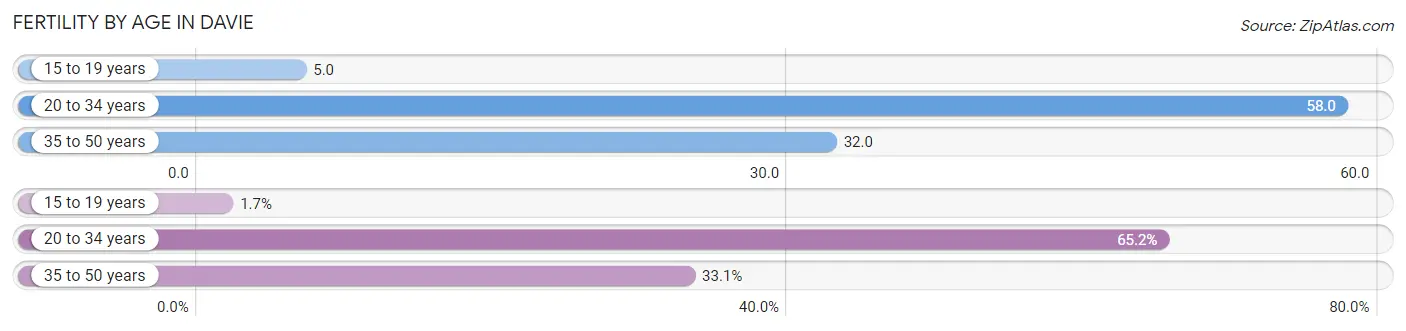
| Age Bracket | Women with Births | Births / 1,000 Women |
| 15 to 19 years | 19 (1.7%) | 5.0 |
| 20 to 34 years | 726 (65.2%) | 58.0 |
| 35 to 50 years | 368 (33.1%) | 32.0 |
| Total | 1,113 (100.0%) | 40.0 |
Fertility by Age by Marriage Status in Davie
69.3% of women with births (1,113) in Davie are married. The highest percentage of unmarried women with births falls into 15 to 19 years age bracket with 100.0% of them unmarried at the time of birth, while the lowest percentage of unmarried women with births belong to 35 to 50 years age bracket with 7.1% of them unmarried.
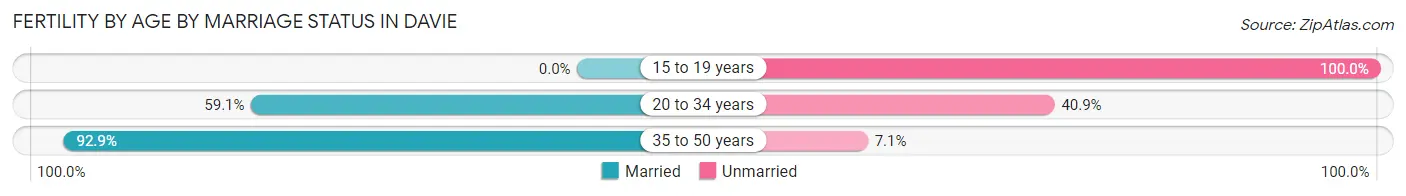
| Age Bracket | Married | Unmarried |
| 15 to 19 years | 0 (0.0%) | 19 (100.0%) |
| 20 to 34 years | 429 (59.1%) | 297 (40.9%) |
| 35 to 50 years | 342 (92.9%) | 26 (7.1%) |
| Total | 771 (69.3%) | 342 (30.7%) |
Fertility by Education in Davie
Average fertility rate in Davie is 40.0 births per 1,000 women. Women with the education attainment of graduate degree have the highest fertility rate of 55.0 births per 1,000 women, while women with the education attainment of less than high school have the lowest fertility at 11.0 births per 1,000 women. Women with the education attainment of college or associate's degree represent 34.1% of all women with births.
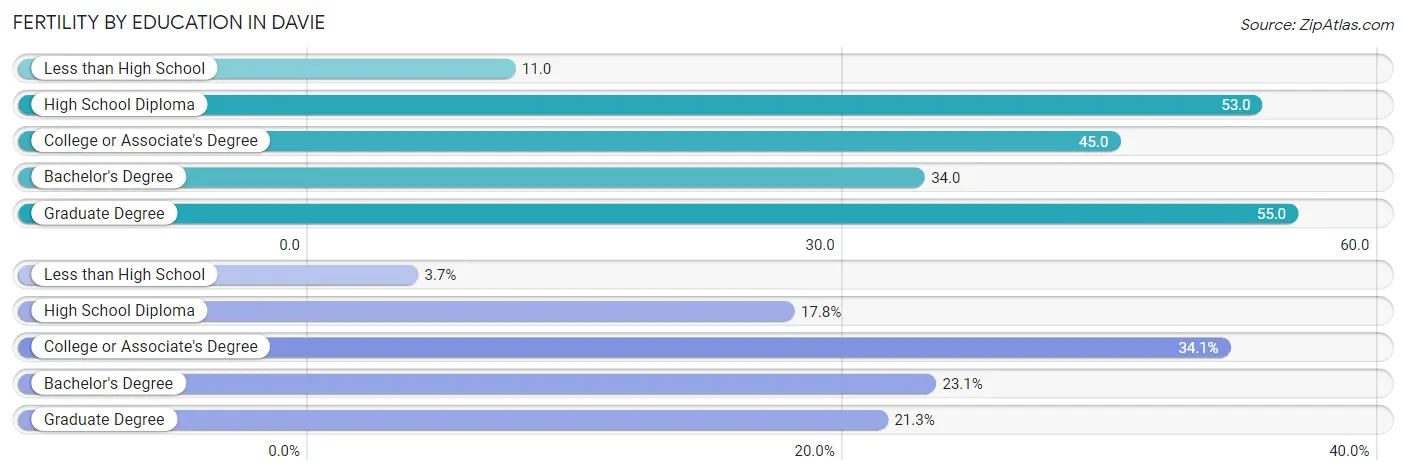
| Educational Attainment | Women with Births | Births / 1,000 Women |
| Less than High School | 41 (3.7%) | 11.0 |
| High School Diploma | 198 (17.8%) | 53.0 |
| College or Associate's Degree | 380 (34.1%) | 45.0 |
| Bachelor's Degree | 257 (23.1%) | 34.0 |
| Graduate Degree | 237 (21.3%) | 55.0 |
| Total | 1,113 (100.0%) | 40.0 |
Fertility by Education by Marriage Status in Davie
30.7% of women with births in Davie are unmarried. Women with the educational attainment of graduate degree are most likely to be married with 94.5% of them married at childbirth, while women with the educational attainment of less than high school are least likely to be married with 100.0% of them unmarried at childbirth.
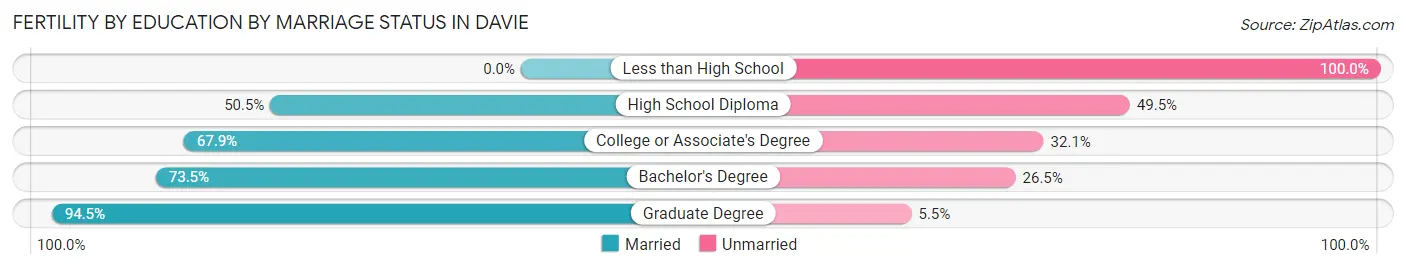
| Educational Attainment | Married | Unmarried |
| Less than High School | 0 (0.0%) | 41 (100.0%) |
| High School Diploma | 100 (50.5%) | 98 (49.5%) |
| College or Associate's Degree | 258 (67.9%) | 122 (32.1%) |
| Bachelor's Degree | 189 (73.5%) | 68 (26.5%) |
| Graduate Degree | 224 (94.5%) | 13 (5.5%) |
| Total | 771 (69.3%) | 342 (30.7%) |
Employment Characteristics in Davie
Employment by Class of Employer in Davie
Among the 54,948 employed individuals in Davie, private company employees (36,689 | 66.8%), self-employed (incorporated) (4,832 | 8.8%), and local government employees (4,051 | 7.4%) make up the most common classes of employment.
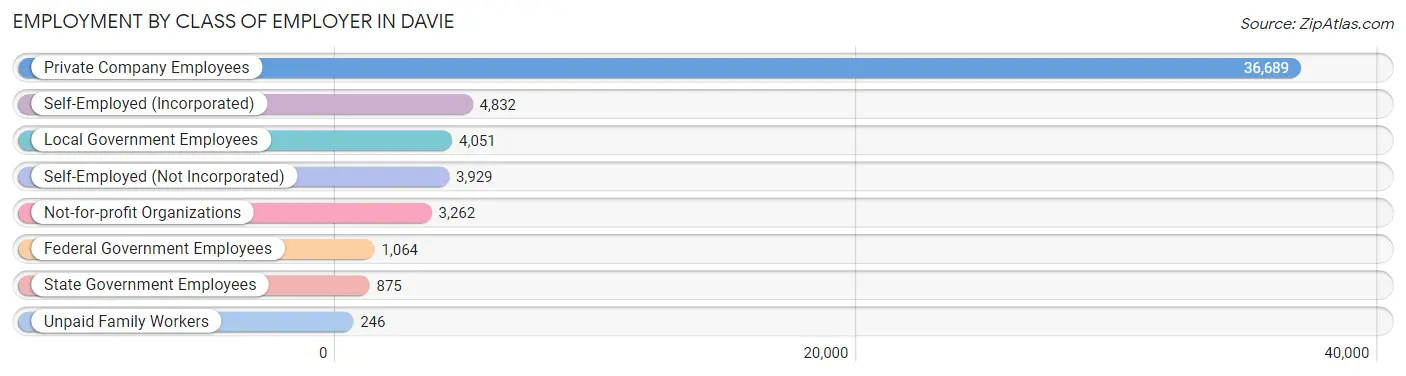
| Employer Class | # Employees | % Employees |
| Private Company Employees | 36,689 | 66.8% |
| Self-Employed (Incorporated) | 4,832 | 8.8% |
| Self-Employed (Not Incorporated) | 3,929 | 7.1% |
| Not-for-profit Organizations | 3,262 | 5.9% |
| Local Government Employees | 4,051 | 7.4% |
| State Government Employees | 875 | 1.6% |
| Federal Government Employees | 1,064 | 1.9% |
| Unpaid Family Workers | 246 | 0.4% |
| Total | 54,948 | 100.0% |
Employment Status by Age in Davie
According to the labor force statistics for Davie, out of the total population over 16 years of age (85,644), 69.2% or 59,266 individuals are in the labor force, with 4.5% or 2,667 of them unemployed. The age group with the highest labor force participation rate is 45 to 54 years, with 88.6% or 13,908 individuals in the labor force. Within the labor force, the 16 to 19 years age range has the highest percentage of unemployed individuals, with 10.5% or 251 of them being unemployed.
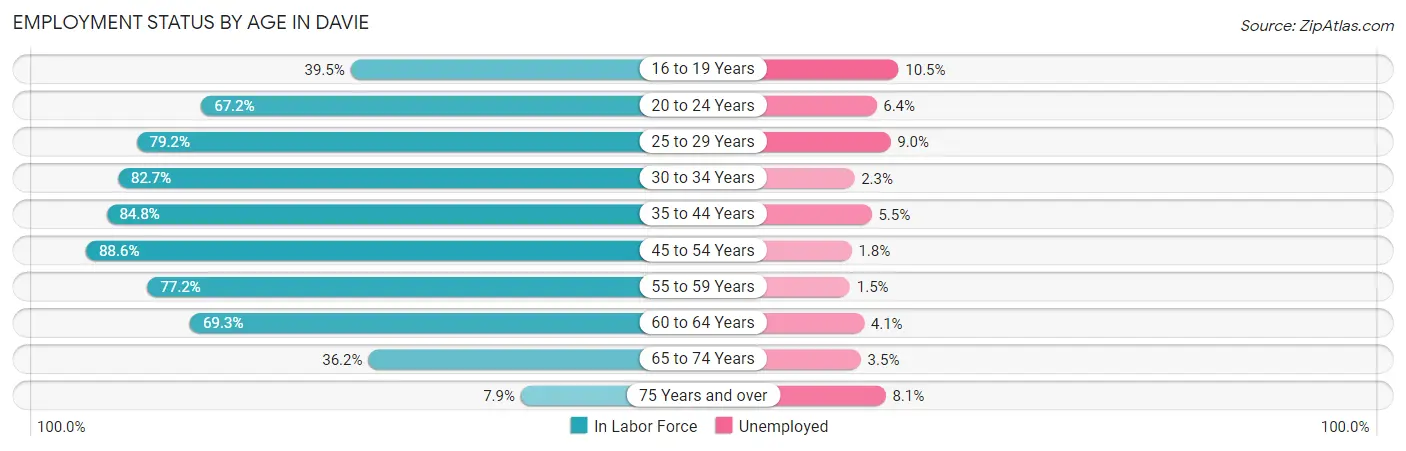
| Age Bracket | In Labor Force | Unemployed |
| 16 to 19 Years | 2,388 (39.5%) | 251 (10.5%) |
| 20 to 24 Years | 4,931 (67.2%) | 316 (6.4%) |
| 25 to 29 Years | 6,882 (79.2%) | 619 (9.0%) |
| 30 to 34 Years | 6,225 (82.7%) | 143 (2.3%) |
| 35 to 44 Years | 12,088 (84.8%) | 665 (5.5%) |
| 45 to 54 Years | 13,908 (88.6%) | 250 (1.8%) |
| 55 to 59 Years | 5,437 (77.2%) | 82 (1.5%) |
| 60 to 64 Years | 4,201 (69.3%) | 172 (4.1%) |
| 65 to 74 Years | 2,788 (36.2%) | 98 (3.5%) |
| 75 Years and over | 417 (7.9%) | 34 (8.1%) |
| Total | 59,266 (69.2%) | 2,667 (4.5%) |
Employment Status by Educational Attainment in Davie
According to labor force statistics for Davie, 82.2% of individuals (48,724) out of the total population between 25 and 64 years of age (59,275) are in the labor force, with 4.0% or 1,949 of them being unemployed. The group with the highest labor force participation rate are those with the educational attainment of bachelor's degree or higher, with 84.4% or 21,261 individuals in the labor force. Within the labor force, individuals with less than high school education have the highest percentage of unemployment, with 8.8% or 339 of them being unemployed.
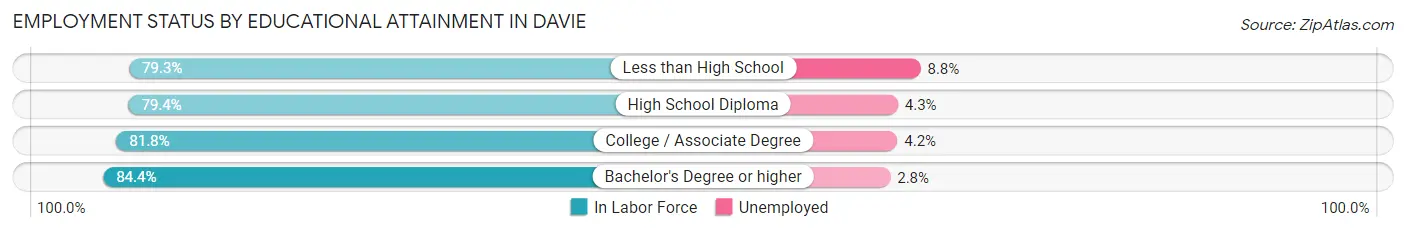
| Educational Attainment | In Labor Force | Unemployed |
| Less than High School | 3,848 (79.3%) | 427 (8.8%) |
| High School Diploma | 9,421 (79.4%) | 510 (4.3%) |
| College / Associate Degree | 14,206 (81.8%) | 729 (4.2%) |
| Bachelor's Degree or higher | 21,261 (84.4%) | 705 (2.8%) |
| Total | 48,724 (82.2%) | 2,371 (4.0%) |
Employment Occupations by Sex in Davie
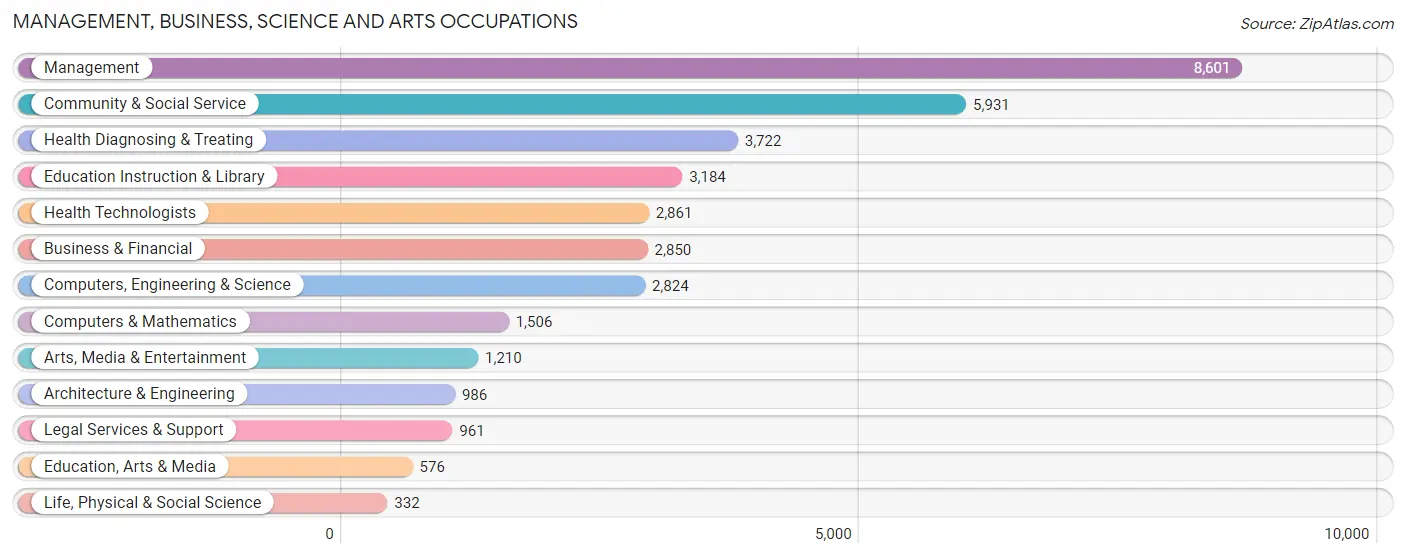
Management, Business, Science and Arts Occupations
The most common Management, Business, Science and Arts occupations in Davie are Management (8,601 | 15.2%), Community & Social Service (5,931 | 10.5%), Health Diagnosing & Treating (3,722 | 6.6%), Education Instruction & Library (3,184 | 5.6%), and Health Technologists (2,861 | 5.1%).
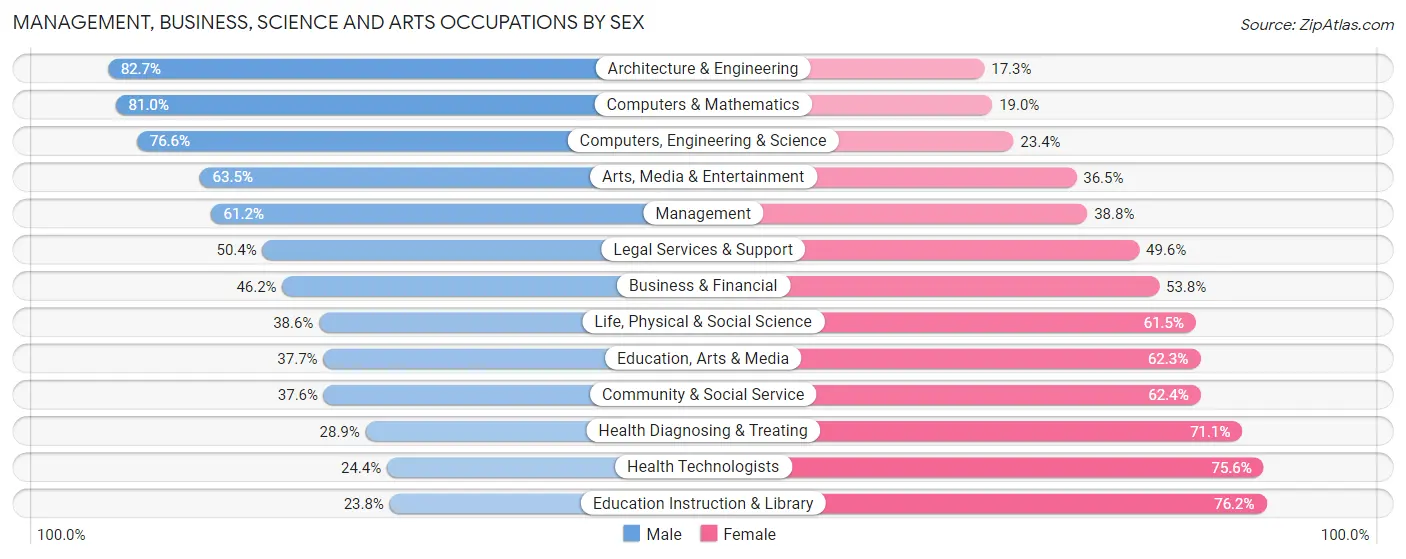
Management, Business, Science and Arts Occupations by Sex
Within the Management, Business, Science and Arts occupations in Davie, the most male-oriented occupations are Architecture & Engineering (82.7%), Computers & Mathematics (81.0%), and Computers, Engineering & Science (76.6%), while the most female-oriented occupations are Education Instruction & Library (76.2%), Health Technologists (75.6%), and Health Diagnosing & Treating (71.1%).
| Occupation | Male | Female |
| Management | 5,262 (61.2%) | 3,339 (38.8%) |
| Business & Financial | 1,317 (46.2%) | 1,533 (53.8%) |
| Computers, Engineering & Science | 2,163 (76.6%) | 661 (23.4%) |
| Computers & Mathematics | 1,220 (81.0%) | 286 (19.0%) |
| Architecture & Engineering | 815 (82.7%) | 171 (17.3%) |
| Life, Physical & Social Science | 128 (38.6%) | 204 (61.5%) |
| Community & Social Service | 2,228 (37.6%) | 3,703 (62.4%) |
| Education, Arts & Media | 217 (37.7%) | 359 (62.3%) |
| Legal Services & Support | 484 (50.4%) | 477 (49.6%) |
| Education Instruction & Library | 759 (23.8%) | 2,425 (76.2%) |
| Arts, Media & Entertainment | 768 (63.5%) | 442 (36.5%) |
| Health Diagnosing & Treating | 1,074 (28.9%) | 2,648 (71.1%) |
| Health Technologists | 698 (24.4%) | 2,163 (75.6%) |
| Total (Category) | 12,044 (50.3%) | 11,884 (49.7%) |
| Total (Overall) | 29,824 (52.8%) | 26,700 (47.2%) |
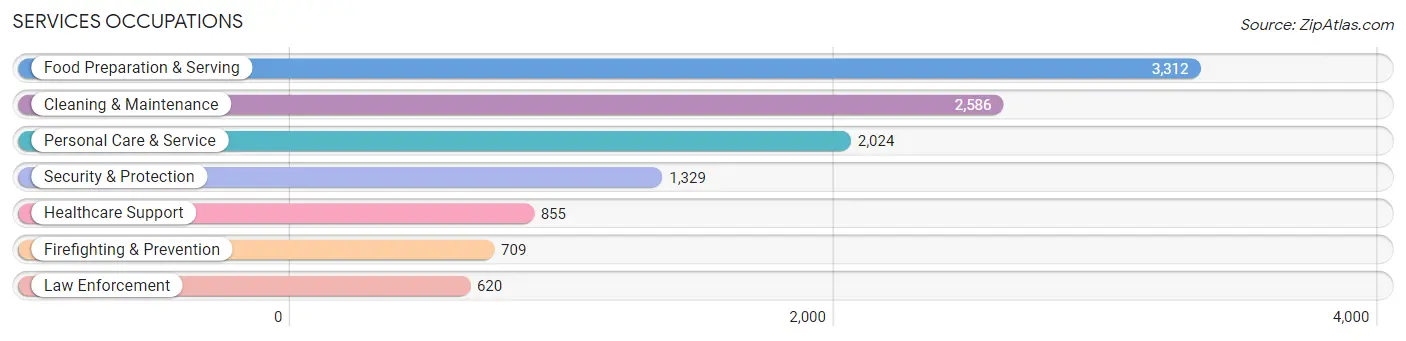
Services Occupations
The most common Services occupations in Davie are Food Preparation & Serving (3,312 | 5.9%), Cleaning & Maintenance (2,586 | 4.6%), Personal Care & Service (2,024 | 3.6%), Security & Protection (1,329 | 2.4%), and Healthcare Support (855 | 1.5%).
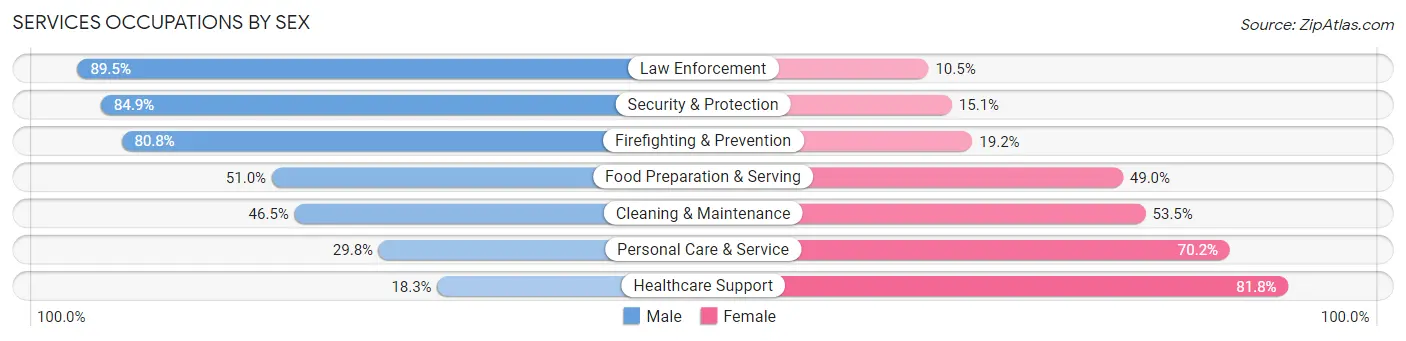
Services Occupations by Sex
Within the Services occupations in Davie, the most male-oriented occupations are Law Enforcement (89.5%), Security & Protection (84.9%), and Firefighting & Prevention (80.8%), while the most female-oriented occupations are Healthcare Support (81.8%), Personal Care & Service (70.2%), and Cleaning & Maintenance (53.5%).
| Occupation | Male | Female |
| Healthcare Support | 156 (18.2%) | 699 (81.8%) |
| Security & Protection | 1,128 (84.9%) | 201 (15.1%) |
| Firefighting & Prevention | 573 (80.8%) | 136 (19.2%) |
| Law Enforcement | 555 (89.5%) | 65 (10.5%) |
| Food Preparation & Serving | 1,690 (51.0%) | 1,622 (49.0%) |
| Cleaning & Maintenance | 1,203 (46.5%) | 1,383 (53.5%) |
| Personal Care & Service | 604 (29.8%) | 1,420 (70.2%) |
| Total (Category) | 4,781 (47.3%) | 5,325 (52.7%) |
| Total (Overall) | 29,824 (52.8%) | 26,700 (47.2%) |
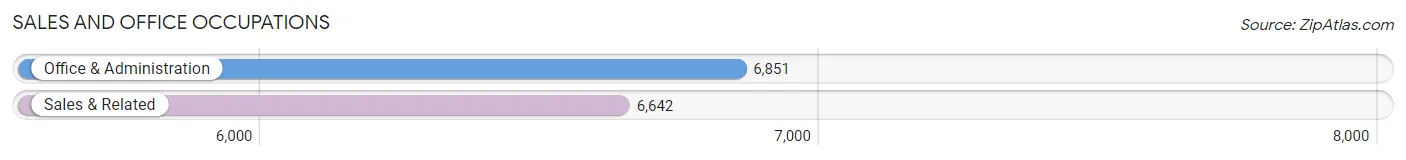
Sales and Office Occupations
The most common Sales and Office occupations in Davie are Office & Administration (6,851 | 12.1%), and Sales & Related (6,642 | 11.7%).
Sales and Office Occupations by Sex
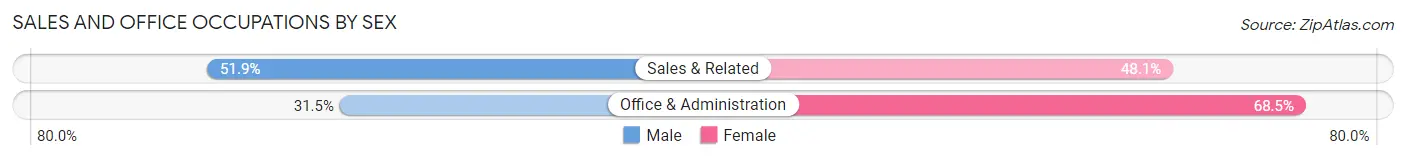
| Occupation | Male | Female |
| Sales & Related | 3,448 (51.9%) | 3,194 (48.1%) |
| Office & Administration | 2,159 (31.5%) | 4,692 (68.5%) |
| Total (Category) | 5,607 (41.5%) | 7,886 (58.5%) |
| Total (Overall) | 29,824 (52.8%) | 26,700 (47.2%) |
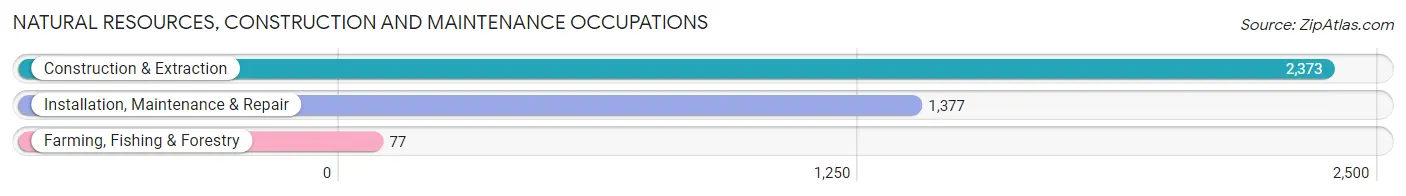
Natural Resources, Construction and Maintenance Occupations
The most common Natural Resources, Construction and Maintenance occupations in Davie are Construction & Extraction (2,373 | 4.2%), Installation, Maintenance & Repair (1,377 | 2.4%), and Farming, Fishing & Forestry (77 | 0.1%).
Natural Resources, Construction and Maintenance Occupations by Sex
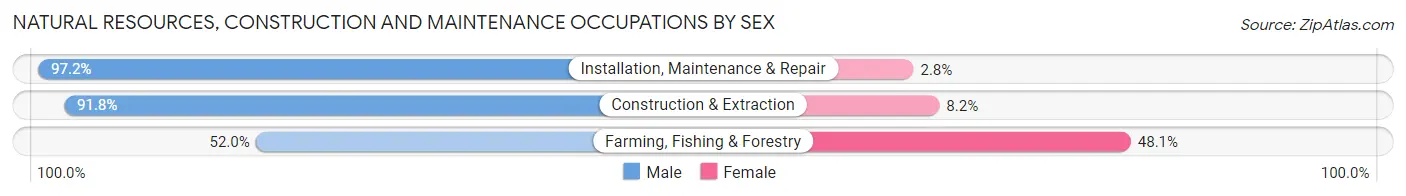
| Occupation | Male | Female |
| Farming, Fishing & Forestry | 40 (51.9%) | 37 (48.0%) |
| Construction & Extraction | 2,178 (91.8%) | 195 (8.2%) |
| Installation, Maintenance & Repair | 1,338 (97.2%) | 39 (2.8%) |
| Total (Category) | 3,556 (92.9%) | 271 (7.1%) |
| Total (Overall) | 29,824 (52.8%) | 26,700 (47.2%) |
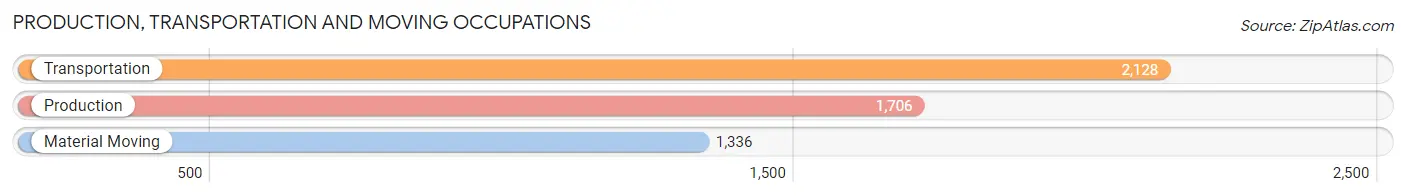
Production, Transportation and Moving Occupations
The most common Production, Transportation and Moving occupations in Davie are Transportation (2,128 | 3.8%), Production (1,706 | 3.0%), and Material Moving (1,336 | 2.4%).
Production, Transportation and Moving Occupations by Sex
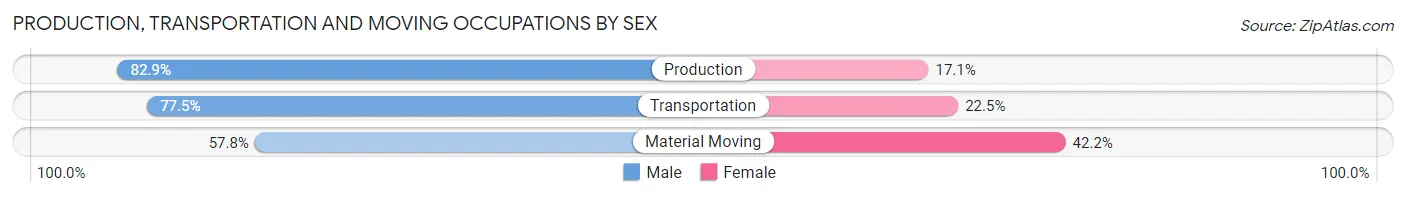
| Occupation | Male | Female |
| Production | 1,415 (82.9%) | 291 (17.1%) |
| Transportation | 1,649 (77.5%) | 479 (22.5%) |
| Material Moving | 772 (57.8%) | 564 (42.2%) |
| Total (Category) | 3,836 (74.2%) | 1,334 (25.8%) |
| Total (Overall) | 29,824 (52.8%) | 26,700 (47.2%) |
Employment Industries by Sex in Davie
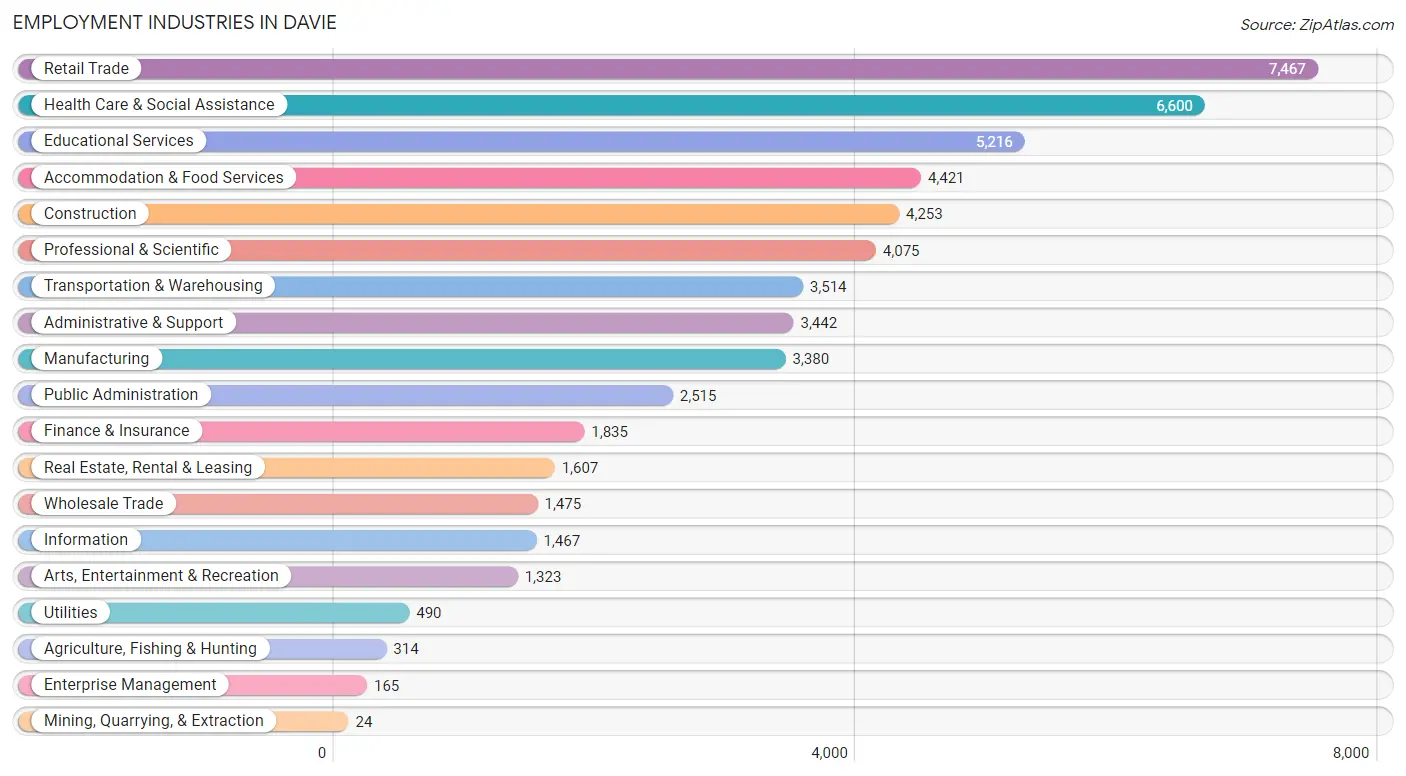
Employment Industries in Davie
The major employment industries in Davie include Retail Trade (7,467 | 13.2%), Health Care & Social Assistance (6,600 | 11.7%), Educational Services (5,216 | 9.2%), Accommodation & Food Services (4,421 | 7.8%), and Construction (4,253 | 7.5%).
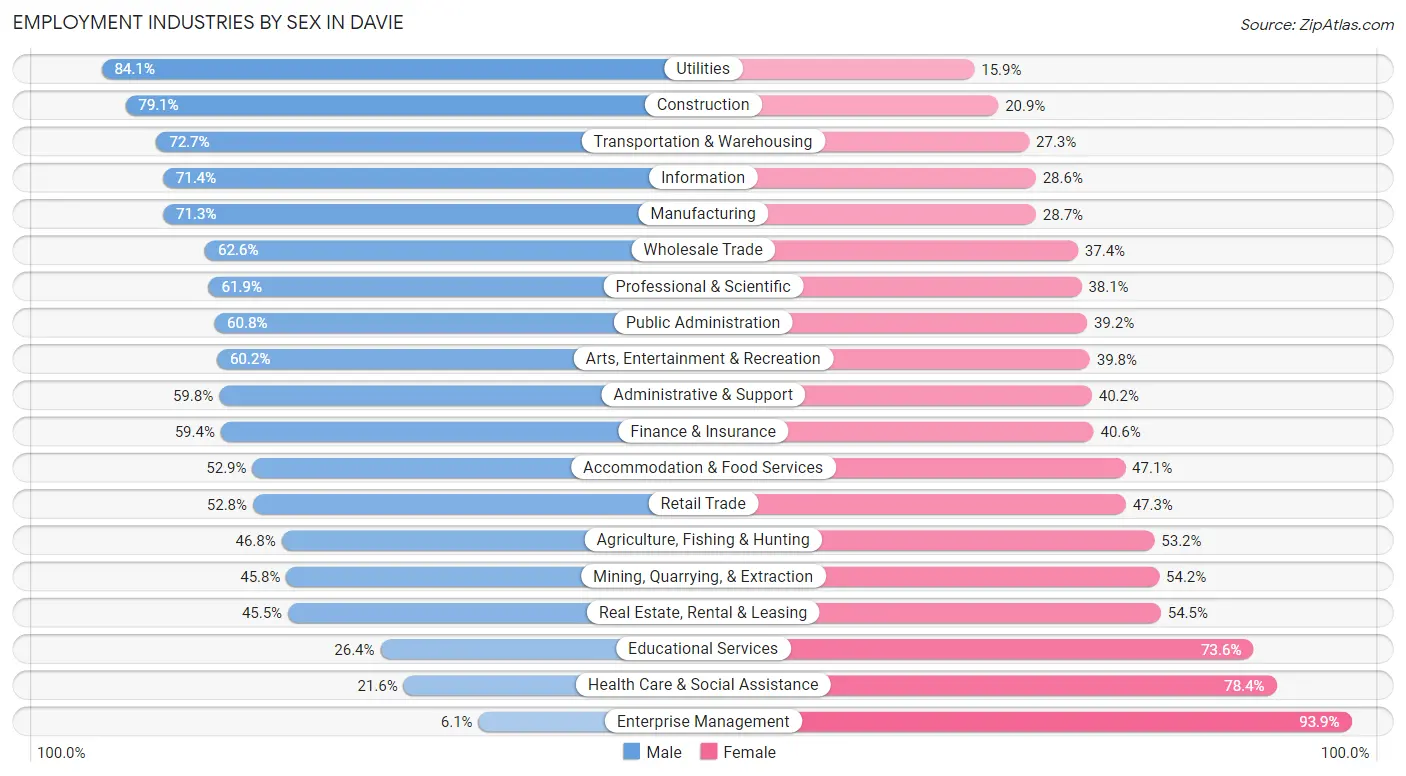
Employment Industries by Sex in Davie
The Davie industries that see more men than women are Utilities (84.1%), Construction (79.1%), and Transportation & Warehousing (72.7%), whereas the industries that tend to have a higher number of women are Enterprise Management (93.9%), Health Care & Social Assistance (78.4%), and Educational Services (73.6%).
| Industry | Male | Female |
| Agriculture, Fishing & Hunting | 147 (46.8%) | 167 (53.2%) |
| Mining, Quarrying, & Extraction | 11 (45.8%) | 13 (54.2%) |
| Construction | 3,366 (79.1%) | 887 (20.9%) |
| Manufacturing | 2,411 (71.3%) | 969 (28.7%) |
| Wholesale Trade | 924 (62.6%) | 551 (37.4%) |
| Retail Trade | 3,939 (52.7%) | 3,528 (47.2%) |
| Transportation & Warehousing | 2,556 (72.7%) | 958 (27.3%) |
| Utilities | 412 (84.1%) | 78 (15.9%) |
| Information | 1,047 (71.4%) | 420 (28.6%) |
| Finance & Insurance | 1,090 (59.4%) | 745 (40.6%) |
| Real Estate, Rental & Leasing | 731 (45.5%) | 876 (54.5%) |
| Professional & Scientific | 2,523 (61.9%) | 1,552 (38.1%) |
| Enterprise Management | 10 (6.1%) | 155 (93.9%) |
| Administrative & Support | 2,057 (59.8%) | 1,385 (40.2%) |
| Educational Services | 1,375 (26.4%) | 3,841 (73.6%) |
| Health Care & Social Assistance | 1,423 (21.6%) | 5,177 (78.4%) |
| Arts, Entertainment & Recreation | 796 (60.2%) | 527 (39.8%) |
| Accommodation & Food Services | 2,337 (52.9%) | 2,084 (47.1%) |
| Public Administration | 1,528 (60.8%) | 987 (39.2%) |
| Total | 29,824 (52.8%) | 26,700 (47.2%) |
Education in Davie
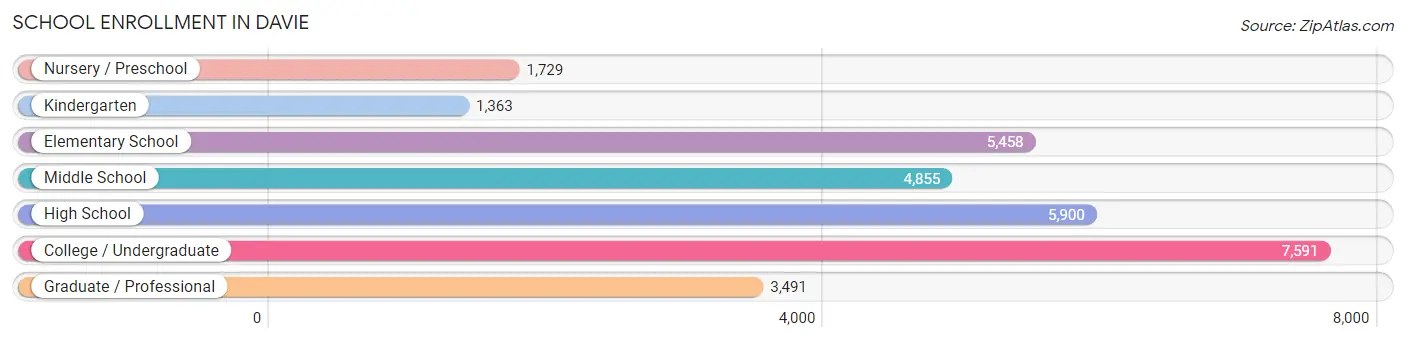
School Enrollment in Davie
The most common levels of schooling among the 30,387 students in Davie are college / undergraduate (7,591 | 25.0%), high school (5,900 | 19.4%), and elementary school (5,458 | 18.0%).
| School Level | # Students | % Students |
| Nursery / Preschool | 1,729 | 5.7% |
| Kindergarten | 1,363 | 4.5% |
| Elementary School | 5,458 | 18.0% |
| Middle School | 4,855 | 16.0% |
| High School | 5,900 | 19.4% |
| College / Undergraduate | 7,591 | 25.0% |
| Graduate / Professional | 3,491 | 11.5% |
| Total | 30,387 | 100.0% |
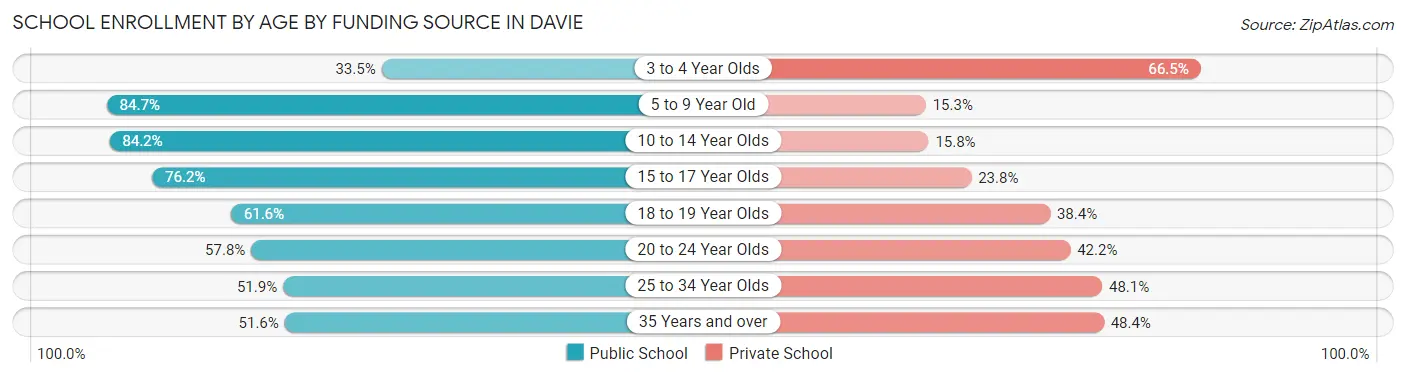
School Enrollment by Age by Funding Source in Davie
Out of a total of 30,387 students who are enrolled in schools in Davie, 9,390 (30.9%) attend a private institution, while the remaining 20,997 (69.1%) are enrolled in public schools. The age group of 3 to 4 year olds has the highest likelihood of being enrolled in private schools, with 1,025 (66.5% in the age bracket) enrolled. Conversely, the age group of 5 to 9 year old has the lowest likelihood of being enrolled in a private school, with 5,313 (84.7% in the age bracket) attending a public institution.
| Age Bracket | Public School | Private School |
| 3 to 4 Year Olds | 517 (33.5%) | 1,025 (66.5%) |
| 5 to 9 Year Old | 5,313 (84.7%) | 959 (15.3%) |
| 10 to 14 Year Olds | 5,105 (84.2%) | 957 (15.8%) |
| 15 to 17 Year Olds | 2,910 (76.2%) | 907 (23.8%) |
| 18 to 19 Year Olds | 1,889 (61.6%) | 1,179 (38.4%) |
| 20 to 24 Year Olds | 2,772 (57.8%) | 2,024 (42.2%) |
| 25 to 34 Year Olds | 1,778 (51.9%) | 1,650 (48.1%) |
| 35 Years and over | 723 (51.6%) | 679 (48.4%) |
| Total | 20,997 (69.1%) | 9,390 (30.9%) |
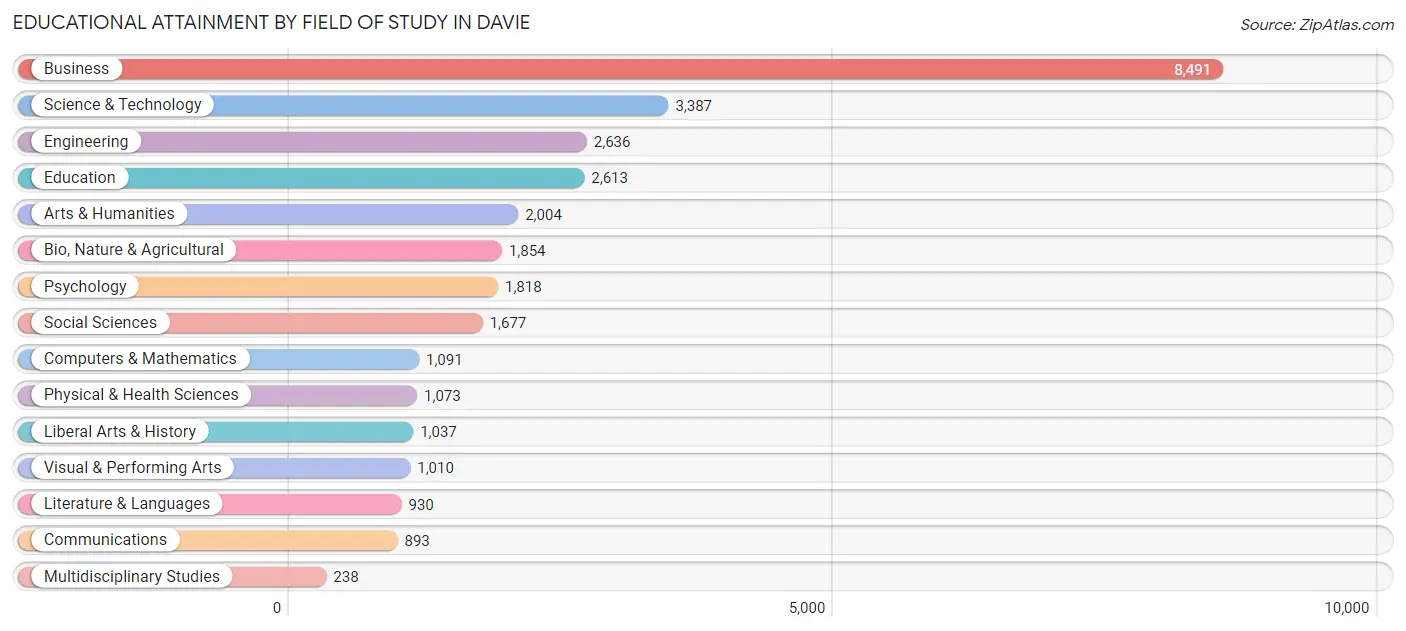
Educational Attainment by Field of Study in Davie
Business (8,491 | 27.6%), science & technology (3,387 | 11.0%), engineering (2,636 | 8.6%), education (2,613 | 8.5%), and arts & humanities (2,004 | 6.5%) are the most common fields of study among 30,752 individuals in Davie who have obtained a bachelor's degree or higher.
| Field of Study | # Graduates | % Graduates |
| Computers & Mathematics | 1,091 | 3.5% |
| Bio, Nature & Agricultural | 1,854 | 6.0% |
| Physical & Health Sciences | 1,073 | 3.5% |
| Psychology | 1,818 | 5.9% |
| Social Sciences | 1,677 | 5.4% |
| Engineering | 2,636 | 8.6% |
| Multidisciplinary Studies | 238 | 0.8% |
| Science & Technology | 3,387 | 11.0% |
| Business | 8,491 | 27.6% |
| Education | 2,613 | 8.5% |
| Literature & Languages | 930 | 3.0% |
| Liberal Arts & History | 1,037 | 3.4% |
| Visual & Performing Arts | 1,010 | 3.3% |
| Communications | 893 | 2.9% |
| Arts & Humanities | 2,004 | 6.5% |
| Total | 30,752 | 100.0% |
Transportation & Commute in Davie
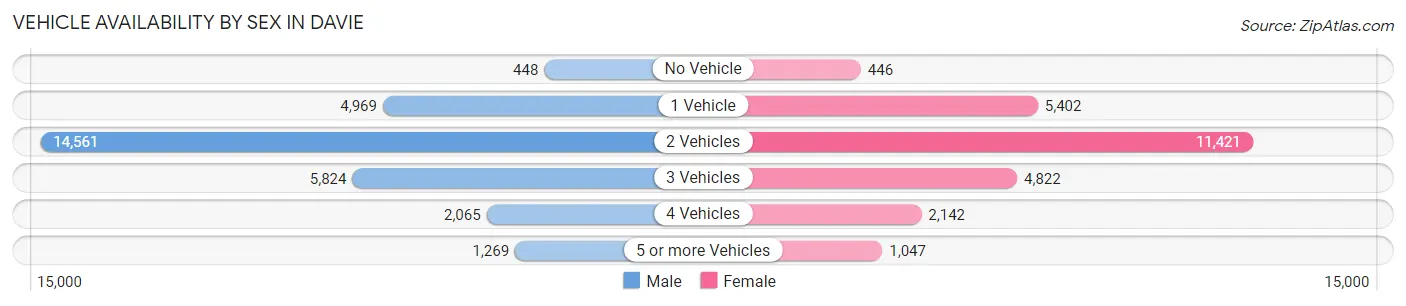
Vehicle Availability by Sex in Davie
The most prevalent vehicle ownership categories in Davie are males with 2 vehicles (14,561, accounting for 50.0%) and females with 2 vehicles (11,421, making up 57.6%).
| Vehicles Available | Male | Female |
| No Vehicle | 448 (1.5%) | 446 (1.8%) |
| 1 Vehicle | 4,969 (17.1%) | 5,402 (21.4%) |
| 2 Vehicles | 14,561 (50.0%) | 11,421 (45.2%) |
| 3 Vehicles | 5,824 (20.0%) | 4,822 (19.1%) |
| 4 Vehicles | 2,065 (7.1%) | 2,142 (8.5%) |
| 5 or more Vehicles | 1,269 (4.4%) | 1,047 (4.1%) |
| Total | 29,136 (100.0%) | 25,280 (100.0%) |
Commute Time in Davie
The most frequently occuring commute durations in Davie are 20 to 24 minutes (9,699 commuters, 20.1%), 30 to 34 minutes (8,377 commuters, 17.3%), and 15 to 19 minutes (6,435 commuters, 13.3%).
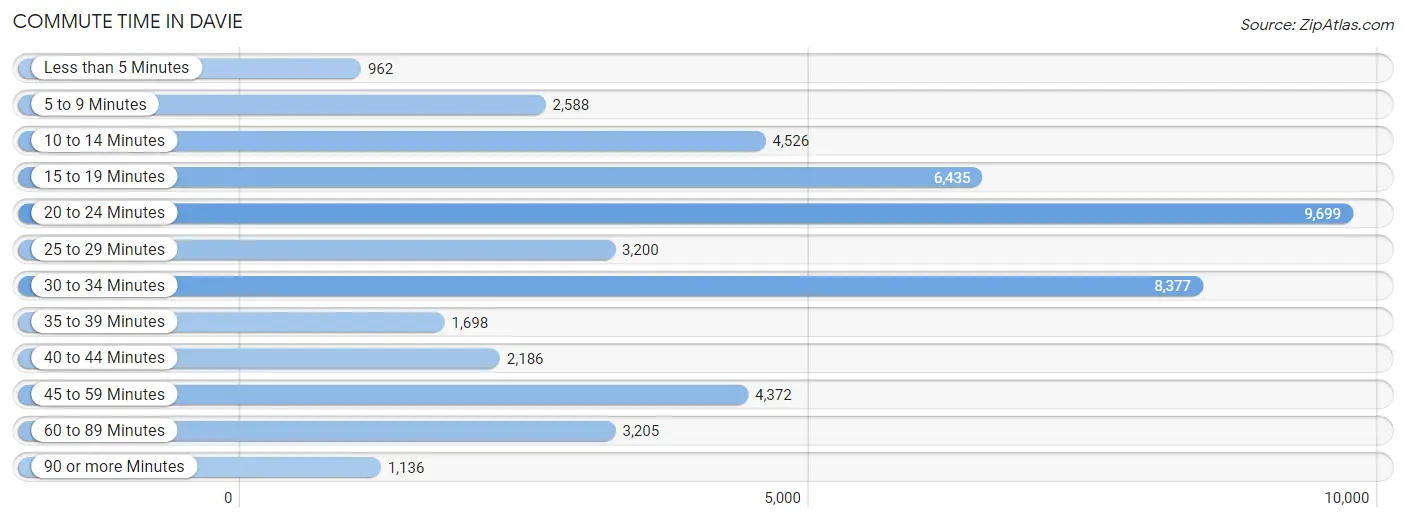
| Commute Time | # Commuters | % Commuters |
| Less than 5 Minutes | 962 | 2.0% |
| 5 to 9 Minutes | 2,588 | 5.3% |
| 10 to 14 Minutes | 4,526 | 9.3% |
| 15 to 19 Minutes | 6,435 | 13.3% |
| 20 to 24 Minutes | 9,699 | 20.1% |
| 25 to 29 Minutes | 3,200 | 6.6% |
| 30 to 34 Minutes | 8,377 | 17.3% |
| 35 to 39 Minutes | 1,698 | 3.5% |
| 40 to 44 Minutes | 2,186 | 4.5% |
| 45 to 59 Minutes | 4,372 | 9.0% |
| 60 to 89 Minutes | 3,205 | 6.6% |
| 90 or more Minutes | 1,136 | 2.4% |
Commute Time by Sex in Davie
The most common commute times in Davie are 20 to 24 minutes (5,024 commuters, 19.4%) for males and 20 to 24 minutes (4,675 commuters, 20.7%) for females.
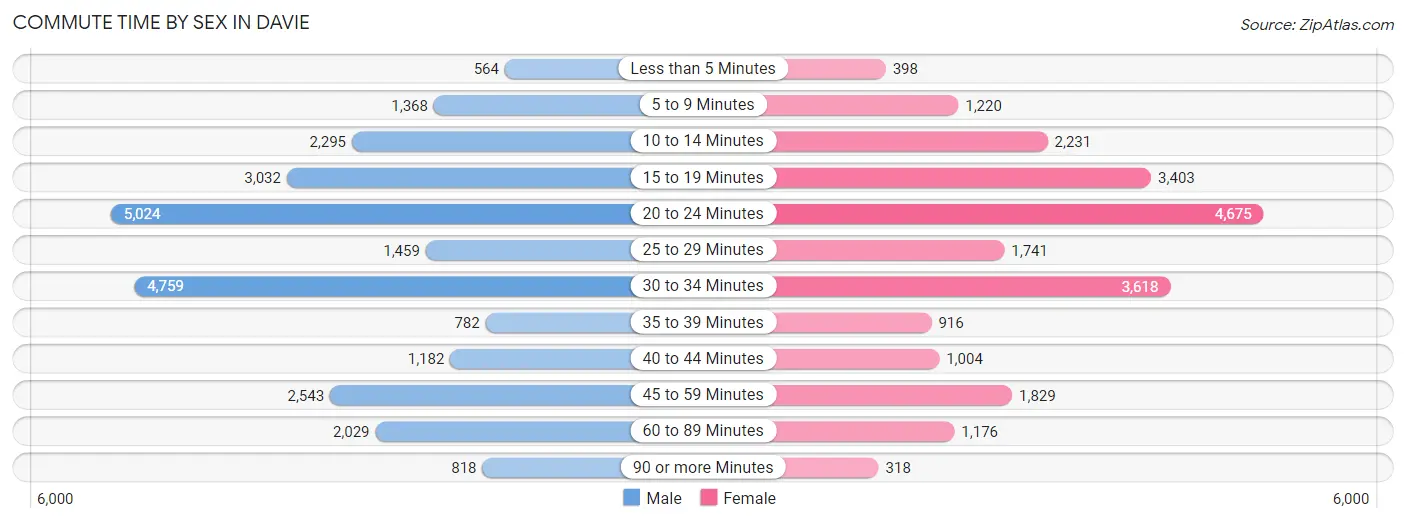
| Commute Time | Male | Female |
| Less than 5 Minutes | 564 (2.2%) | 398 (1.8%) |
| 5 to 9 Minutes | 1,368 (5.3%) | 1,220 (5.4%) |
| 10 to 14 Minutes | 2,295 (8.9%) | 2,231 (9.9%) |
| 15 to 19 Minutes | 3,032 (11.7%) | 3,403 (15.1%) |
| 20 to 24 Minutes | 5,024 (19.4%) | 4,675 (20.7%) |
| 25 to 29 Minutes | 1,459 (5.6%) | 1,741 (7.7%) |
| 30 to 34 Minutes | 4,759 (18.4%) | 3,618 (16.1%) |
| 35 to 39 Minutes | 782 (3.0%) | 916 (4.1%) |
| 40 to 44 Minutes | 1,182 (4.6%) | 1,004 (4.5%) |
| 45 to 59 Minutes | 2,543 (9.8%) | 1,829 (8.1%) |
| 60 to 89 Minutes | 2,029 (7.9%) | 1,176 (5.2%) |
| 90 or more Minutes | 818 (3.2%) | 318 (1.4%) |
Time of Departure to Work by Sex in Davie
The most frequent times of departure to work in Davie are 7:00 AM to 7:29 AM (3,427, 13.3%) for males and 8:00 AM to 8:29 AM (3,551, 15.8%) for females.
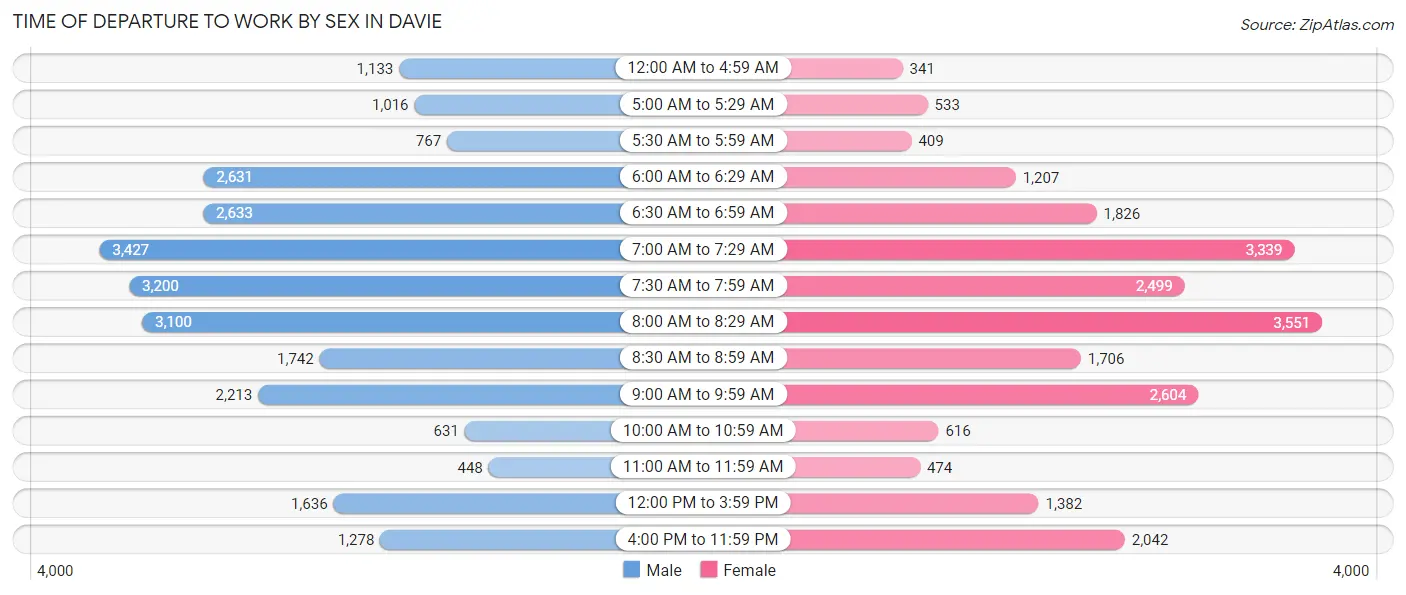
| Time of Departure | Male | Female |
| 12:00 AM to 4:59 AM | 1,133 (4.4%) | 341 (1.5%) |
| 5:00 AM to 5:29 AM | 1,016 (3.9%) | 533 (2.4%) |
| 5:30 AM to 5:59 AM | 767 (3.0%) | 409 (1.8%) |
| 6:00 AM to 6:29 AM | 2,631 (10.2%) | 1,207 (5.4%) |
| 6:30 AM to 6:59 AM | 2,633 (10.2%) | 1,826 (8.1%) |
| 7:00 AM to 7:29 AM | 3,427 (13.3%) | 3,339 (14.8%) |
| 7:30 AM to 7:59 AM | 3,200 (12.4%) | 2,499 (11.1%) |
| 8:00 AM to 8:29 AM | 3,100 (12.0%) | 3,551 (15.8%) |
| 8:30 AM to 8:59 AM | 1,742 (6.7%) | 1,706 (7.6%) |
| 9:00 AM to 9:59 AM | 2,213 (8.6%) | 2,604 (11.6%) |
| 10:00 AM to 10:59 AM | 631 (2.4%) | 616 (2.7%) |
| 11:00 AM to 11:59 AM | 448 (1.7%) | 474 (2.1%) |
| 12:00 PM to 3:59 PM | 1,636 (6.3%) | 1,382 (6.1%) |
| 4:00 PM to 11:59 PM | 1,278 (4.9%) | 2,042 (9.1%) |
| Total | 25,855 (100.0%) | 22,529 (100.0%) |
Housing Occupancy in Davie
Occupancy by Ownership in Davie
Of the total 37,941 dwellings in Davie, owner-occupied units account for 24,832 (65.4%), while renter-occupied units make up 13,109 (34.5%).
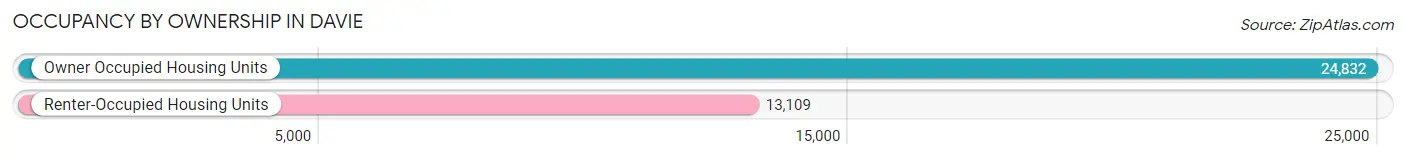
| Occupancy | # Housing Units | % Housing Units |
| Owner Occupied Housing Units | 24,832 | 65.4% |
| Renter-Occupied Housing Units | 13,109 | 34.5% |
| Total Occupied Housing Units | 37,941 | 100.0% |
Occupancy by Household Size in Davie
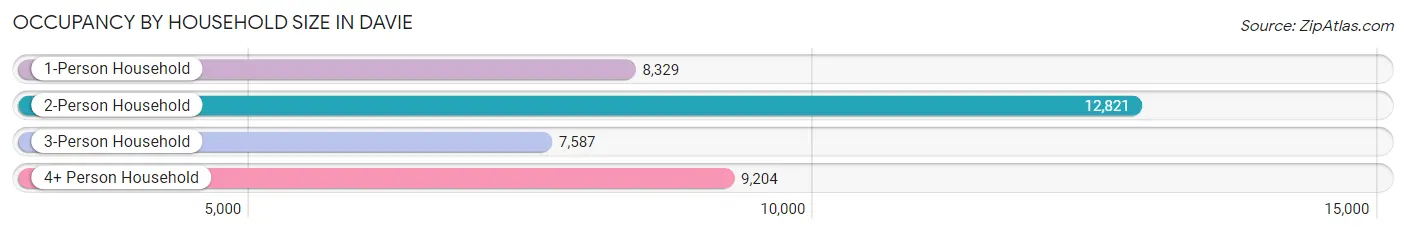
| Household Size | # Housing Units | % Housing Units |
| 1-Person Household | 8,329 | 22.0% |
| 2-Person Household | 12,821 | 33.8% |
| 3-Person Household | 7,587 | 20.0% |
| 4+ Person Household | 9,204 | 24.3% |
| Total Housing Units | 37,941 | 100.0% |
Occupancy by Ownership by Household Size in Davie
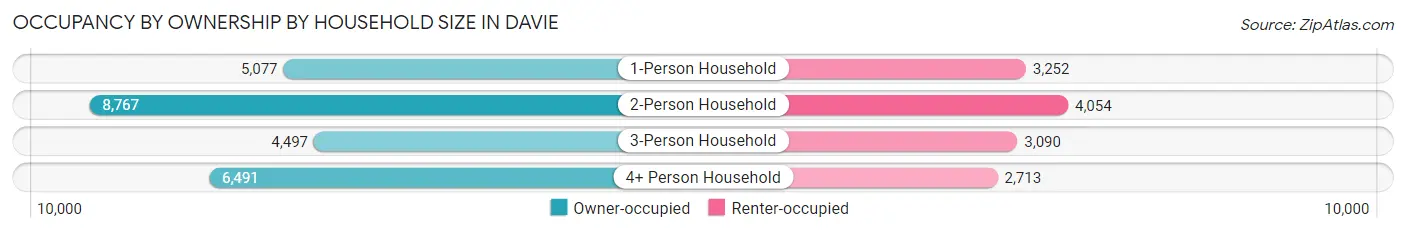
| Household Size | Owner-occupied | Renter-occupied |
| 1-Person Household | 5,077 (61.0%) | 3,252 (39.0%) |
| 2-Person Household | 8,767 (68.4%) | 4,054 (31.6%) |
| 3-Person Household | 4,497 (59.3%) | 3,090 (40.7%) |
| 4+ Person Household | 6,491 (70.5%) | 2,713 (29.5%) |
| Total Housing Units | 24,832 (65.4%) | 13,109 (34.5%) |
Occupancy by Educational Attainment in Davie
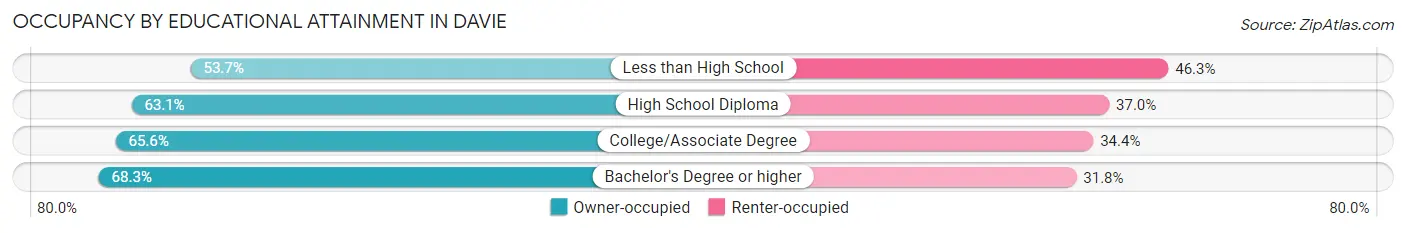
| Household Size | Owner-occupied | Renter-occupied |
| Less than High School | 1,491 (53.7%) | 1,287 (46.3%) |
| High School Diploma | 4,248 (63.0%) | 2,489 (36.9%) |
| College/Associate Degree | 7,514 (65.6%) | 3,946 (34.4%) |
| Bachelor's Degree or higher | 11,579 (68.2%) | 5,387 (31.8%) |
Occupancy by Age of Householder in Davie
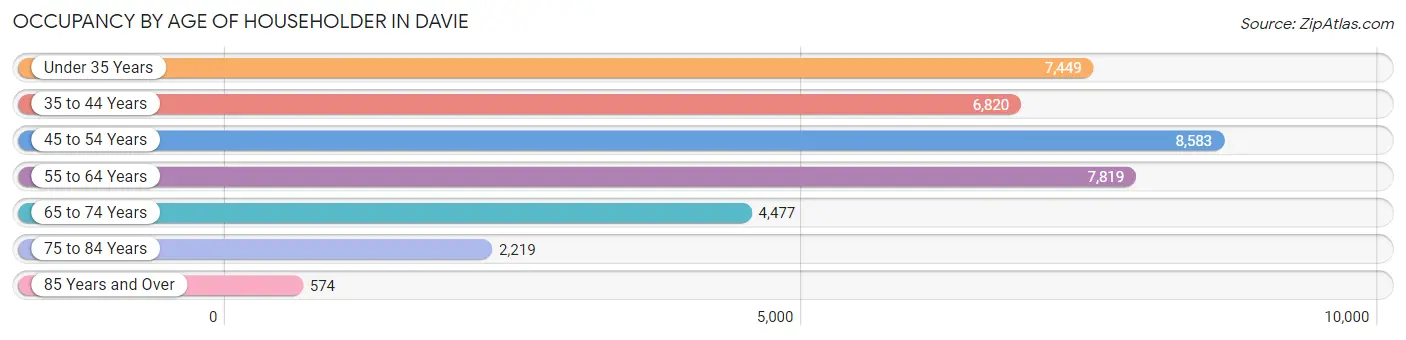
| Age Bracket | # Households | % Households |
| Under 35 Years | 7,449 | 19.6% |
| 35 to 44 Years | 6,820 | 18.0% |
| 45 to 54 Years | 8,583 | 22.6% |
| 55 to 64 Years | 7,819 | 20.6% |
| 65 to 74 Years | 4,477 | 11.8% |
| 75 to 84 Years | 2,219 | 5.9% |
| 85 Years and Over | 574 | 1.5% |
| Total | 37,941 | 100.0% |
Housing Finances in Davie
Median Income by Occupancy in Davie
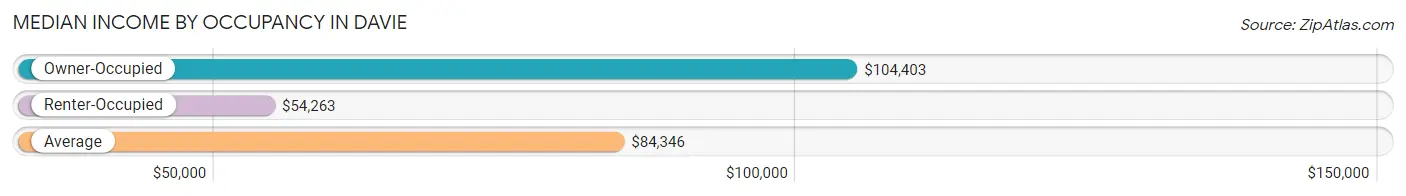
| Occupancy Type | # Households | Median Income |
| Owner-Occupied | 24,832 (65.4%) | $104,403 |
| Renter-Occupied | 13,109 (34.5%) | $54,263 |
| Average | 37,941 (100.0%) | $84,346 |
Occupancy by Householder Income Bracket in Davie
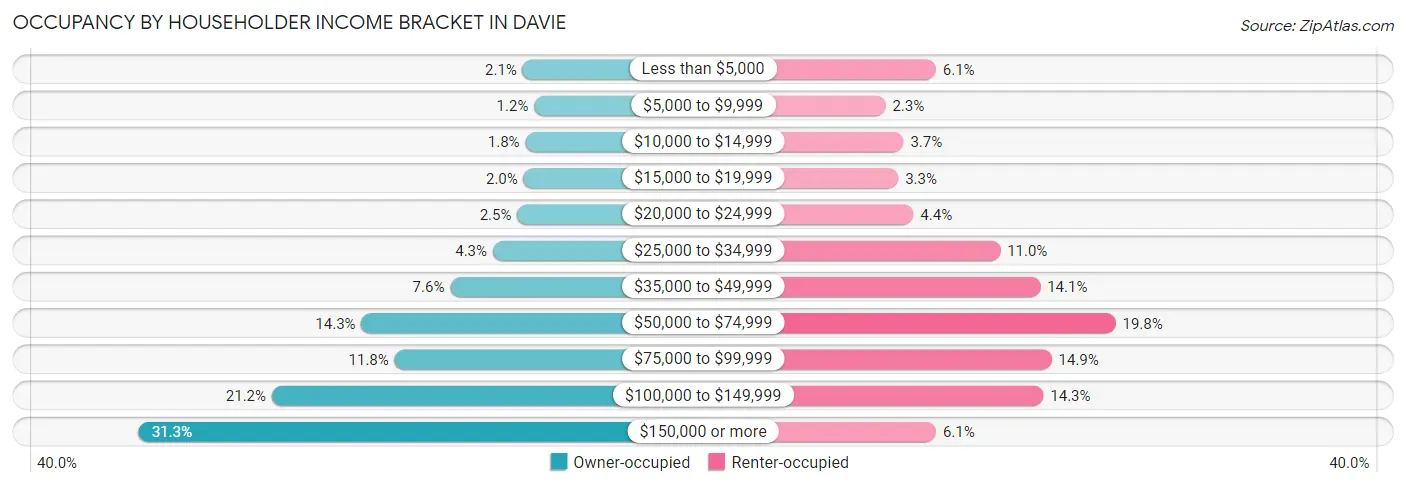
| Income Bracket | Owner-occupied | Renter-occupied |
| Less than $5,000 | 508 (2.1%) | 802 (6.1%) |
| $5,000 to $9,999 | 290 (1.2%) | 299 (2.3%) |
| $10,000 to $14,999 | 458 (1.8%) | 479 (3.6%) |
| $15,000 to $19,999 | 492 (2.0%) | 426 (3.3%) |
| $20,000 to $24,999 | 610 (2.5%) | 578 (4.4%) |
| $25,000 to $34,999 | 1,073 (4.3%) | 1,444 (11.0%) |
| $35,000 to $49,999 | 1,879 (7.6%) | 1,845 (14.1%) |
| $50,000 to $74,999 | 3,561 (14.3%) | 2,597 (19.8%) |
| $75,000 to $99,999 | 2,933 (11.8%) | 1,959 (14.9%) |
| $100,000 to $149,999 | 5,255 (21.2%) | 1,876 (14.3%) |
| $150,000 or more | 7,773 (31.3%) | 804 (6.1%) |
| Total | 24,832 (100.0%) | 13,109 (100.0%) |
Monthly Housing Cost Tiers in Davie
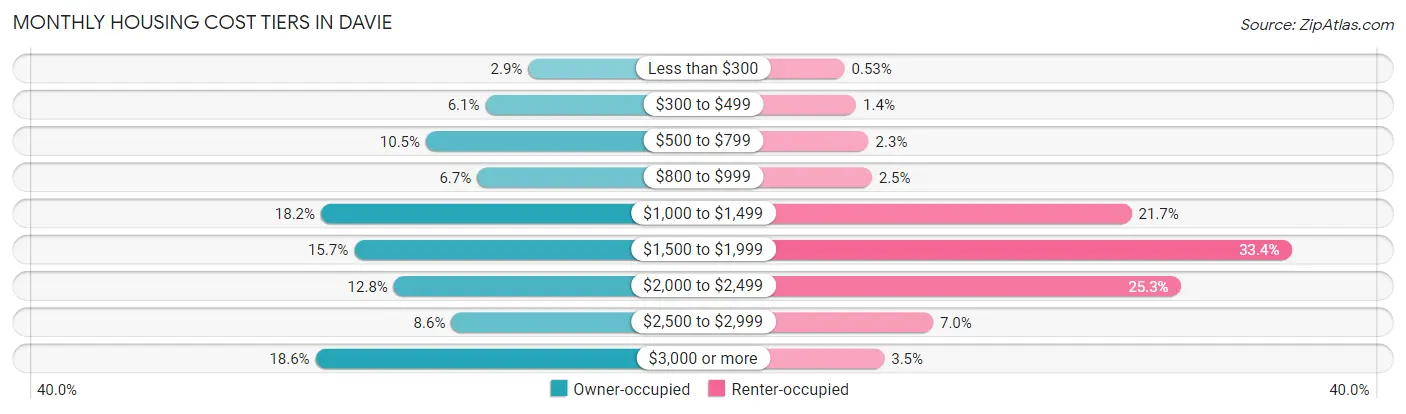
| Monthly Cost | Owner-occupied | Renter-occupied |
| Less than $300 | 723 (2.9%) | 69 (0.5%) |
| $300 to $499 | 1,507 (6.1%) | 181 (1.4%) |
| $500 to $799 | 2,594 (10.4%) | 301 (2.3%) |
| $800 to $999 | 1,658 (6.7%) | 332 (2.5%) |
| $1,000 to $1,499 | 4,514 (18.2%) | 2,839 (21.7%) |
| $1,500 to $1,999 | 3,908 (15.7%) | 4,381 (33.4%) |
| $2,000 to $2,499 | 3,183 (12.8%) | 3,311 (25.3%) |
| $2,500 to $2,999 | 2,130 (8.6%) | 923 (7.0%) |
| $3,000 or more | 4,615 (18.6%) | 452 (3.5%) |
| Total | 24,832 (100.0%) | 13,109 (100.0%) |
Physical Housing Characteristics in Davie
Housing Structures in Davie
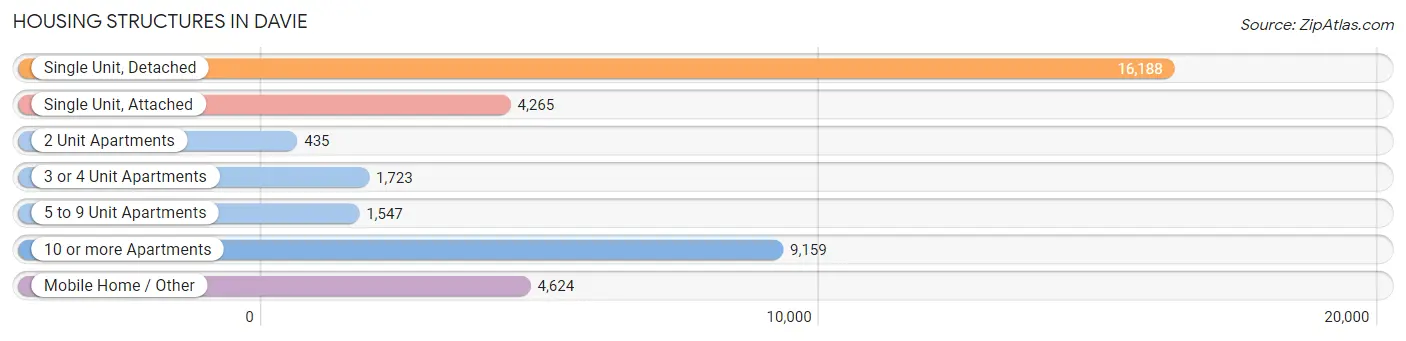
| Structure Type | # Housing Units | % Housing Units |
| Single Unit, Detached | 16,188 | 42.7% |
| Single Unit, Attached | 4,265 | 11.2% |
| 2 Unit Apartments | 435 | 1.1% |
| 3 or 4 Unit Apartments | 1,723 | 4.5% |
| 5 to 9 Unit Apartments | 1,547 | 4.1% |
| 10 or more Apartments | 9,159 | 24.1% |
| Mobile Home / Other | 4,624 | 12.2% |
| Total | 37,941 | 100.0% |
Housing Structures by Occupancy in Davie
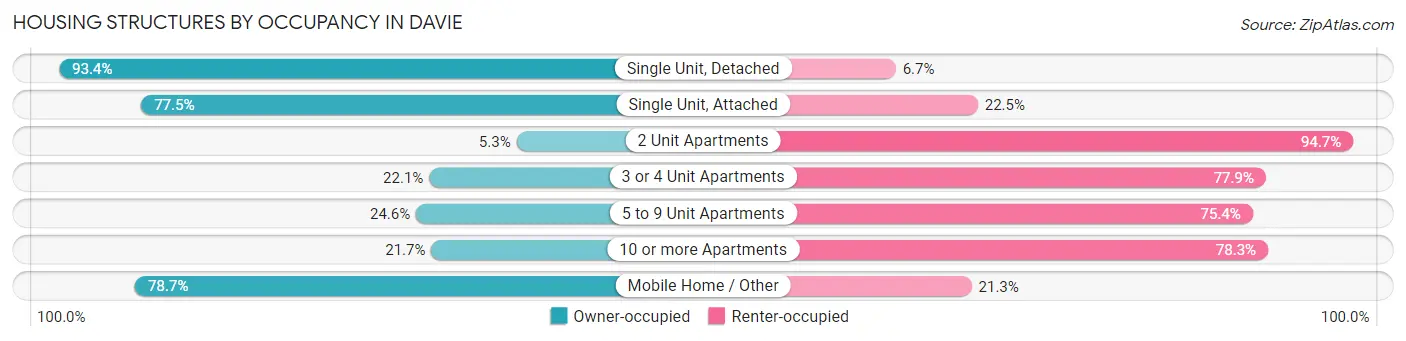
| Structure Type | Owner-occupied | Renter-occupied |
| Single Unit, Detached | 15,112 (93.3%) | 1,076 (6.7%) |
| Single Unit, Attached | 3,307 (77.5%) | 958 (22.5%) |
| 2 Unit Apartments | 23 (5.3%) | 412 (94.7%) |
| 3 or 4 Unit Apartments | 381 (22.1%) | 1,342 (77.9%) |
| 5 to 9 Unit Apartments | 381 (24.6%) | 1,166 (75.4%) |
| 10 or more Apartments | 1,987 (21.7%) | 7,172 (78.3%) |
| Mobile Home / Other | 3,641 (78.7%) | 983 (21.3%) |
| Total | 24,832 (65.4%) | 13,109 (34.5%) |
Housing Structures by Number of Rooms in Davie
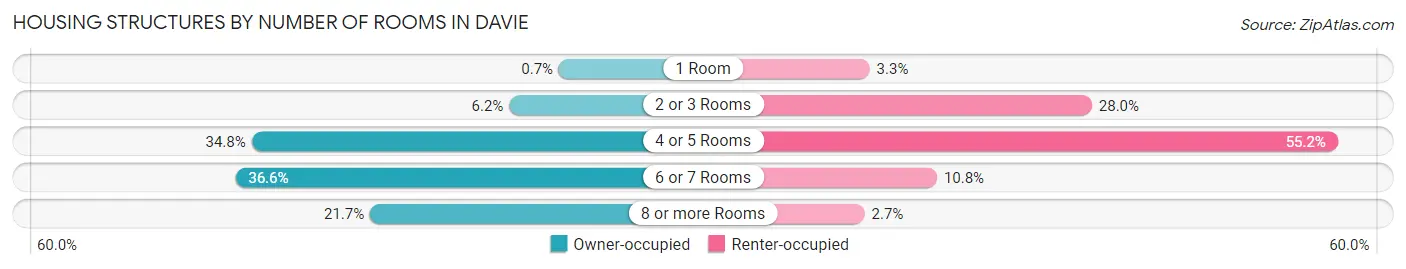
| Number of Rooms | Owner-occupied | Renter-occupied |
| 1 Room | 173 (0.7%) | 432 (3.3%) |
| 2 or 3 Rooms | 1,544 (6.2%) | 3,665 (28.0%) |
| 4 or 5 Rooms | 8,645 (34.8%) | 7,241 (55.2%) |
| 6 or 7 Rooms | 9,091 (36.6%) | 1,412 (10.8%) |
| 8 or more Rooms | 5,379 (21.7%) | 359 (2.7%) |
| Total | 24,832 (100.0%) | 13,109 (100.0%) |
Housing Structure by Heating Type in Davie
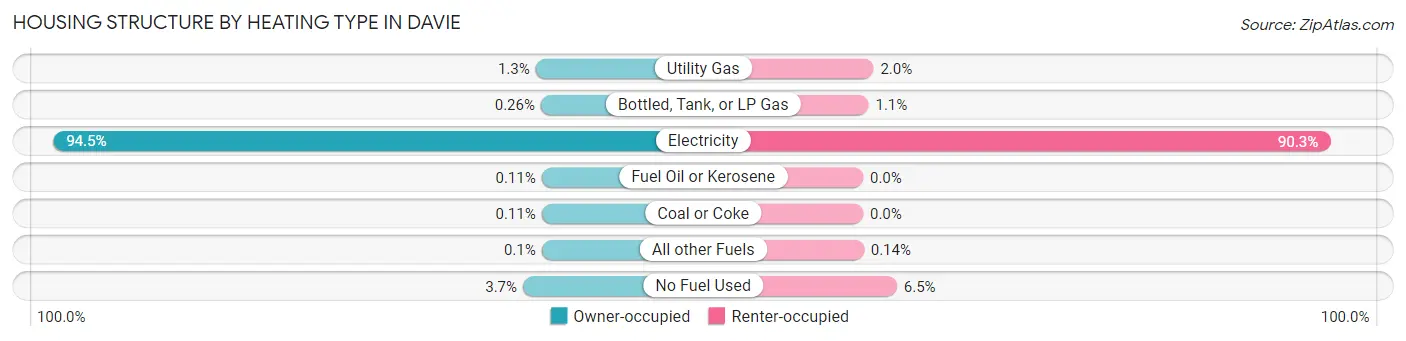
| Heating Type | Owner-occupied | Renter-occupied |
| Utility Gas | 312 (1.3%) | 264 (2.0%) |
| Bottled, Tank, or LP Gas | 64 (0.3%) | 139 (1.1%) |
| Electricity | 23,456 (94.5%) | 11,831 (90.2%) |
| Fuel Oil or Kerosene | 27 (0.1%) | 0 (0.0%) |
| Coal or Coke | 27 (0.1%) | 0 (0.0%) |
| All other Fuels | 24 (0.1%) | 19 (0.1%) |
| No Fuel Used | 922 (3.7%) | 856 (6.5%) |
| Total | 24,832 (100.0%) | 13,109 (100.0%) |
Household Vehicle Usage in Davie
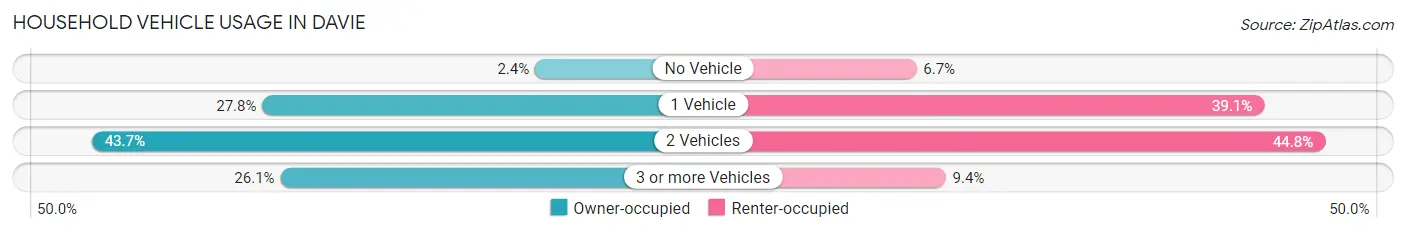
| Vehicles per Household | Owner-occupied | Renter-occupied |
| No Vehicle | 584 (2.4%) | 874 (6.7%) |
| 1 Vehicle | 6,905 (27.8%) | 5,129 (39.1%) |
| 2 Vehicles | 10,858 (43.7%) | 5,874 (44.8%) |
| 3 or more Vehicles | 6,485 (26.1%) | 1,232 (9.4%) |
| Total | 24,832 (100.0%) | 13,109 (100.0%) |
Real Estate & Mortgages in Davie
Real Estate and Mortgage Overview in Davie
| Characteristic | Without Mortgage | With Mortgage |
| Housing Units | 10,510 | 14,322 |
| Median Property Value | $328,800 | $436,100 |
| Median Household Income | $75,000 | $5,277 |
| Monthly Housing Costs | $909 | $4,403 |
| Real Estate Taxes | $3,223 | $206 |
Property Value by Mortgage Status in Davie
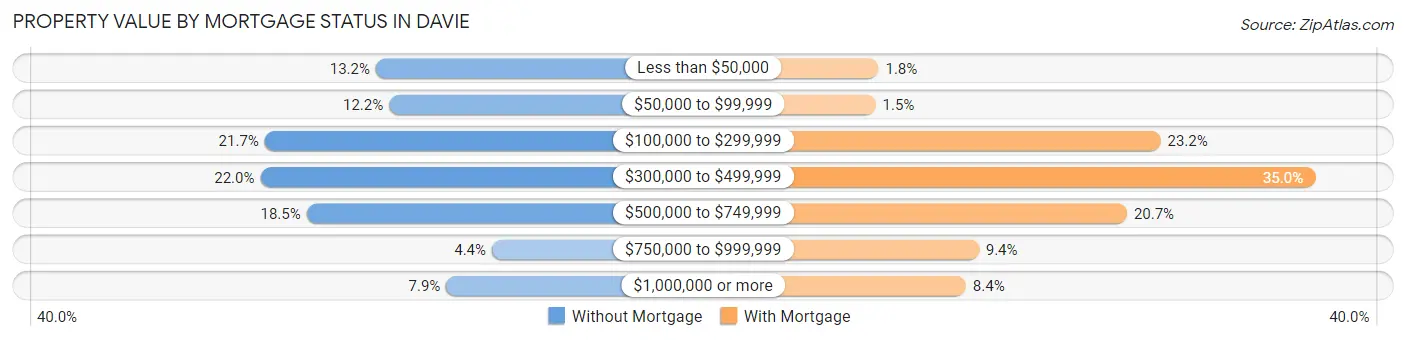
| Property Value | Without Mortgage | With Mortgage |
| Less than $50,000 | 1,391 (13.2%) | 250 (1.8%) |
| $50,000 to $99,999 | 1,285 (12.2%) | 219 (1.5%) |
| $100,000 to $299,999 | 2,282 (21.7%) | 3,329 (23.2%) |
| $300,000 to $499,999 | 2,316 (22.0%) | 5,012 (35.0%) |
| $500,000 to $749,999 | 1,946 (18.5%) | 2,962 (20.7%) |
| $750,000 to $999,999 | 462 (4.4%) | 1,345 (9.4%) |
| $1,000,000 or more | 828 (7.9%) | 1,205 (8.4%) |
| Total | 10,510 (100.0%) | 14,322 (100.0%) |
Household Income by Mortgage Status in Davie
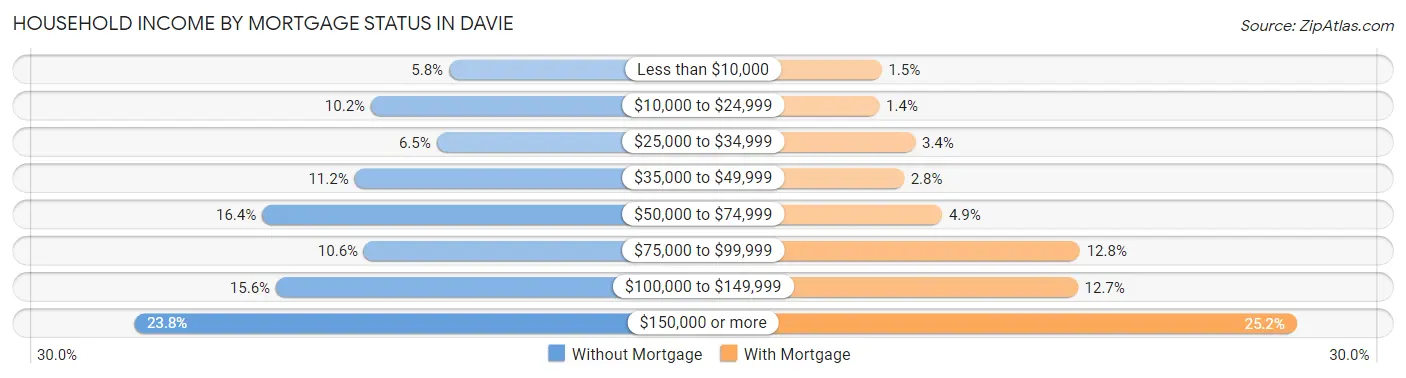
| Household Income | Without Mortgage | With Mortgage |
| Less than $10,000 | 604 (5.8%) | 212 (1.5%) |
| $10,000 to $24,999 | 1,073 (10.2%) | 194 (1.3%) |
| $25,000 to $34,999 | 679 (6.5%) | 487 (3.4%) |
| $35,000 to $49,999 | 1,172 (11.2%) | 394 (2.8%) |
| $50,000 to $74,999 | 1,727 (16.4%) | 707 (4.9%) |
| $75,000 to $99,999 | 1,115 (10.6%) | 1,834 (12.8%) |
| $100,000 to $149,999 | 1,644 (15.6%) | 1,818 (12.7%) |
| $150,000 or more | 2,496 (23.7%) | 3,611 (25.2%) |
| Total | 10,510 (100.0%) | 14,322 (100.0%) |
Property Value to Household Income Ratio in Davie
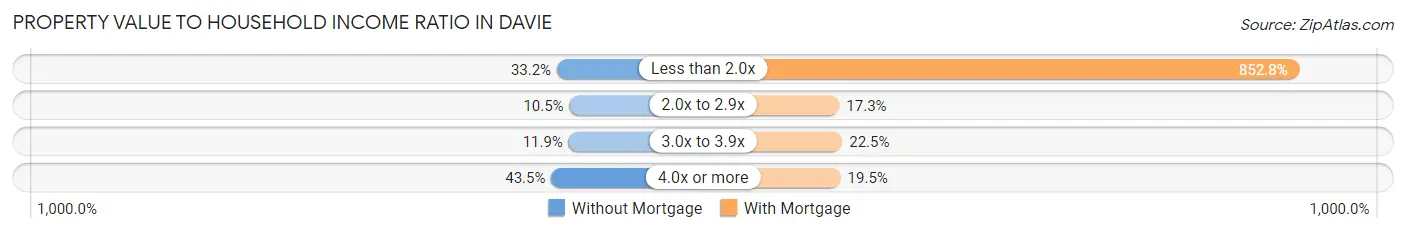
| Value-to-Income Ratio | Without Mortgage | With Mortgage |
| Less than 2.0x | 3,492 (33.2%) | 122,141 (852.8%) |
| 2.0x to 2.9x | 1,101 (10.5%) | 2,470 (17.2%) |
| 3.0x to 3.9x | 1,247 (11.9%) | 3,217 (22.5%) |
| 4.0x or more | 4,568 (43.5%) | 2,796 (19.5%) |
| Total | 10,510 (100.0%) | 14,322 (100.0%) |
Real Estate Taxes by Mortgage Status in Davie
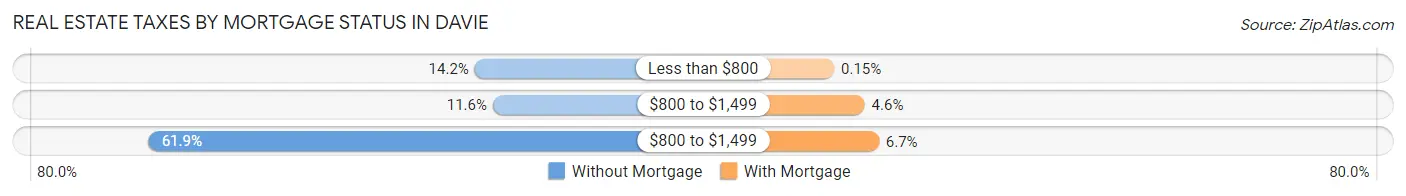
| Property Taxes | Without Mortgage | With Mortgage |
| Less than $800 | 1,497 (14.2%) | 22 (0.2%) |
| $800 to $1,499 | 1,218 (11.6%) | 662 (4.6%) |
| $800 to $1,499 | 6,501 (61.9%) | 958 (6.7%) |
| Total | 10,510 (100.0%) | 14,322 (100.0%) |
Health & Disability in Davie
Health Insurance Coverage by Age in Davie
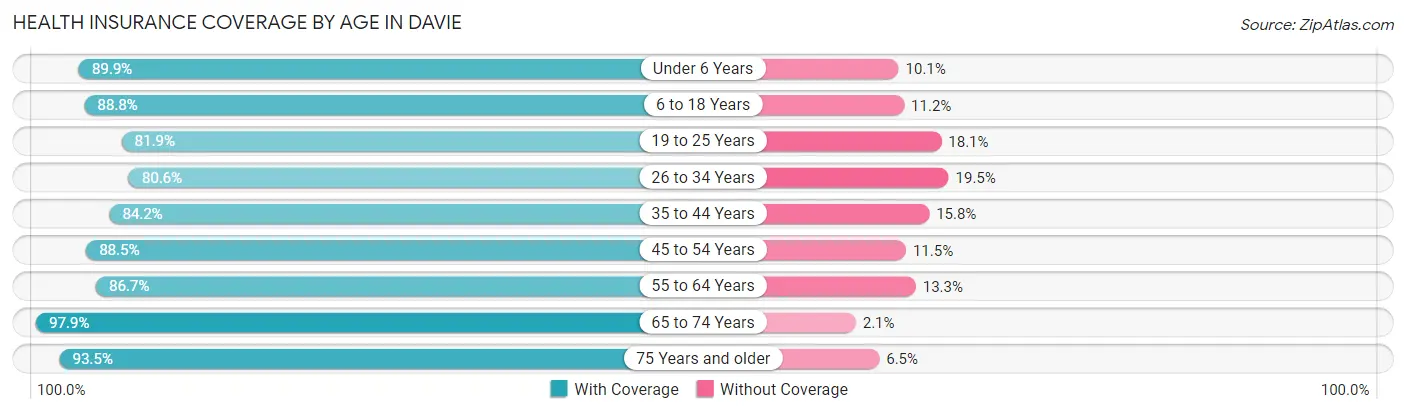
| Age Bracket | With Coverage | Without Coverage |
| Under 6 Years | 6,466 (89.9%) | 729 (10.1%) |
| 6 to 18 Years | 15,669 (88.8%) | 1,969 (11.2%) |
| 19 to 25 Years | 8,396 (81.9%) | 1,856 (18.1%) |
| 26 to 34 Years | 11,818 (80.5%) | 2,853 (19.5%) |
| 35 to 44 Years | 11,970 (84.2%) | 2,251 (15.8%) |
| 45 to 54 Years | 13,853 (88.5%) | 1,800 (11.5%) |
| 55 to 64 Years | 11,342 (86.7%) | 1,745 (13.3%) |
| 65 to 74 Years | 7,487 (97.9%) | 164 (2.1%) |
| 75 Years and older | 4,892 (93.5%) | 342 (6.5%) |
| Total | 91,893 (87.0%) | 13,709 (13.0%) |
Health Insurance Coverage by Citizenship Status in Davie
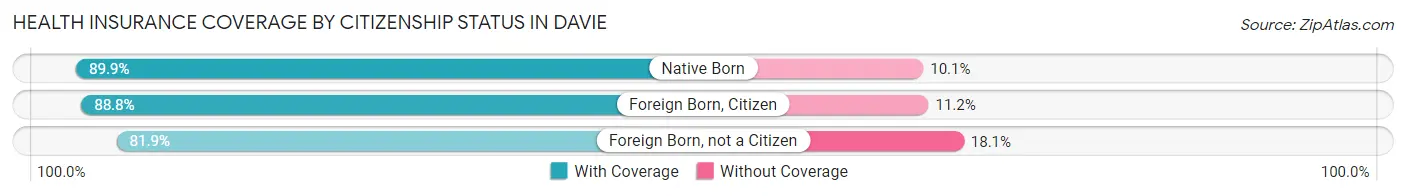
| Citizenship Status | With Coverage | Without Coverage |
| Native Born | 6,466 (89.9%) | 729 (10.1%) |
| Foreign Born, Citizen | 15,669 (88.8%) | 1,969 (11.2%) |
| Foreign Born, not a Citizen | 8,396 (81.9%) | 1,856 (18.1%) |
Health Insurance Coverage by Household Income in Davie
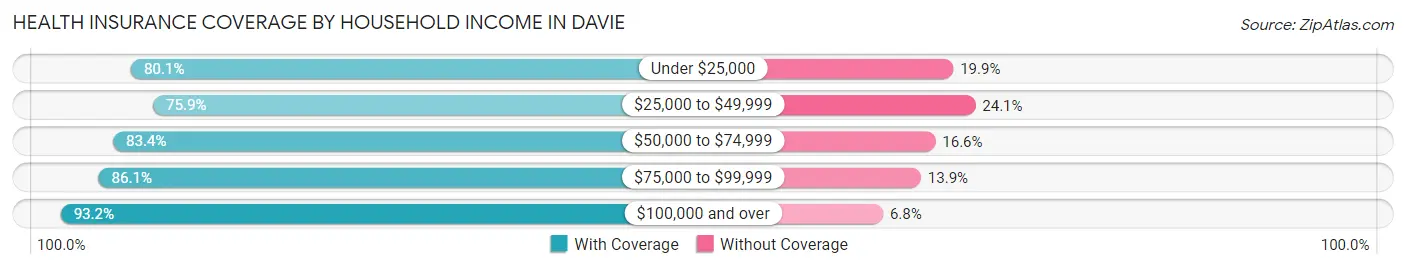
| Household Income | With Coverage | Without Coverage |
| Under $25,000 | 7,632 (80.1%) | 1,901 (19.9%) |
| $25,000 to $49,999 | 11,956 (75.9%) | 3,794 (24.1%) |
| $50,000 to $74,999 | 13,338 (83.4%) | 2,653 (16.6%) |
| $75,000 to $99,999 | 11,959 (86.1%) | 1,927 (13.9%) |
| $100,000 and over | 45,423 (93.2%) | 3,306 (6.8%) |
Public vs Private Health Insurance Coverage by Age in Davie
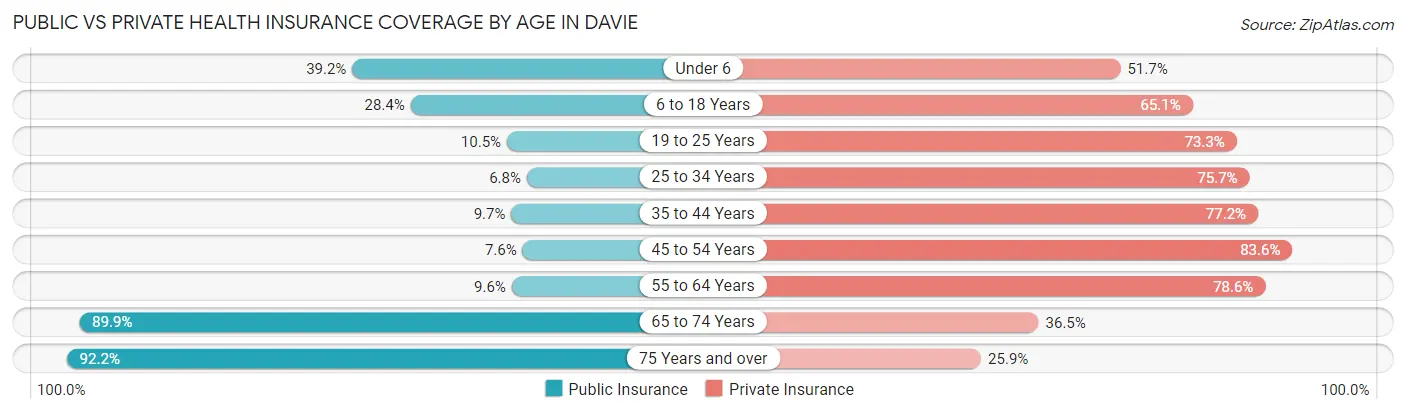
| Age Bracket | Public Insurance | Private Insurance |
| Under 6 | 2,820 (39.2%) | 3,722 (51.7%) |
| 6 to 18 Years | 5,001 (28.3%) | 11,483 (65.1%) |
| 19 to 25 Years | 1,074 (10.5%) | 7,514 (73.3%) |
| 25 to 34 Years | 994 (6.8%) | 11,100 (75.7%) |
| 35 to 44 Years | 1,374 (9.7%) | 10,983 (77.2%) |
| 45 to 54 Years | 1,185 (7.6%) | 13,086 (83.6%) |
| 55 to 64 Years | 1,255 (9.6%) | 10,284 (78.6%) |
| 65 to 74 Years | 6,877 (89.9%) | 2,795 (36.5%) |
| 75 Years and over | 4,825 (92.2%) | 1,354 (25.9%) |
| Total | 25,405 (24.1%) | 72,321 (68.5%) |
Disability Status by Sex by Age in Davie
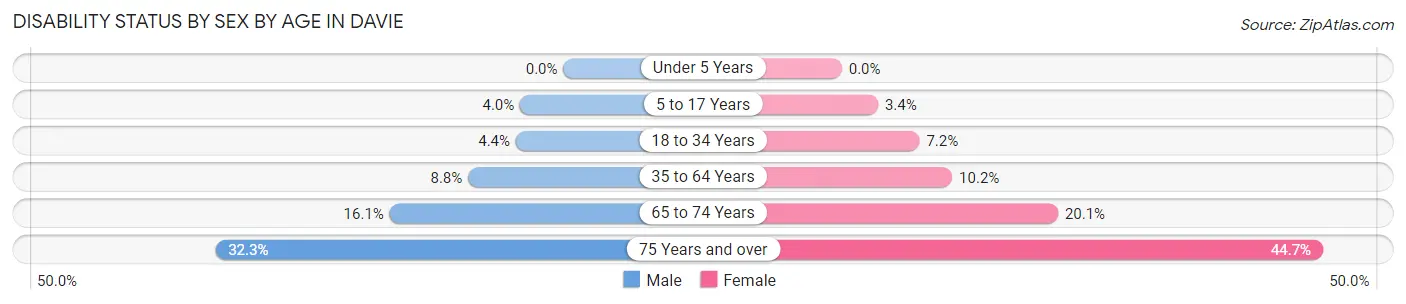
| Age Bracket | Male | Female |
| Under 5 Years | 0 (0.0%) | 0 (0.0%) |
| 5 to 17 Years | 371 (4.0%) | 250 (3.4%) |
| 18 to 34 Years | 558 (4.4%) | 1,032 (7.2%) |
| 35 to 64 Years | 1,894 (8.8%) | 2,206 (10.2%) |
| 65 to 74 Years | 584 (16.1%) | 808 (20.1%) |
| 75 Years and over | 655 (32.3%) | 1,432 (44.7%) |
Disability Class by Sex by Age in Davie
Disability Class: Hearing Difficulty
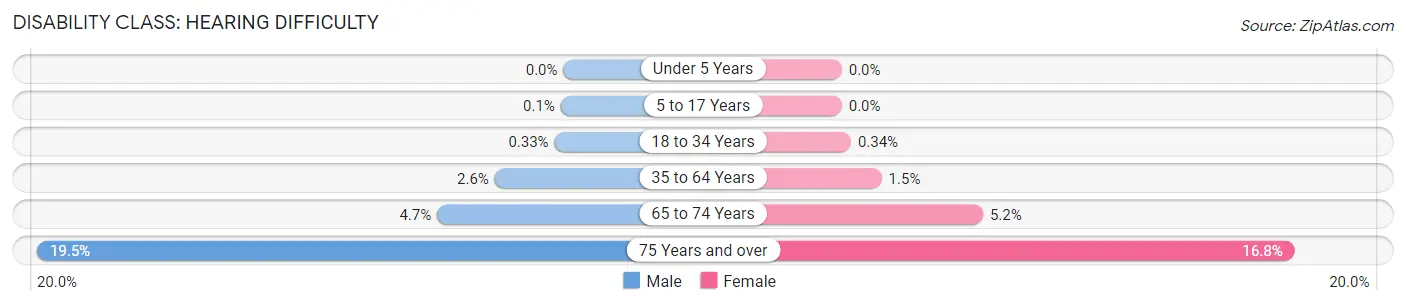
| Age Bracket | Male | Female |
| Under 5 Years | 0 (0.0%) | 0 (0.0%) |
| 5 to 17 Years | 9 (0.1%) | 0 (0.0%) |
| 18 to 34 Years | 42 (0.3%) | 49 (0.3%) |
| 35 to 64 Years | 546 (2.5%) | 319 (1.5%) |
| 65 to 74 Years | 170 (4.7%) | 211 (5.2%) |
| 75 Years and over | 396 (19.5%) | 539 (16.8%) |
Disability Class: Vision Difficulty
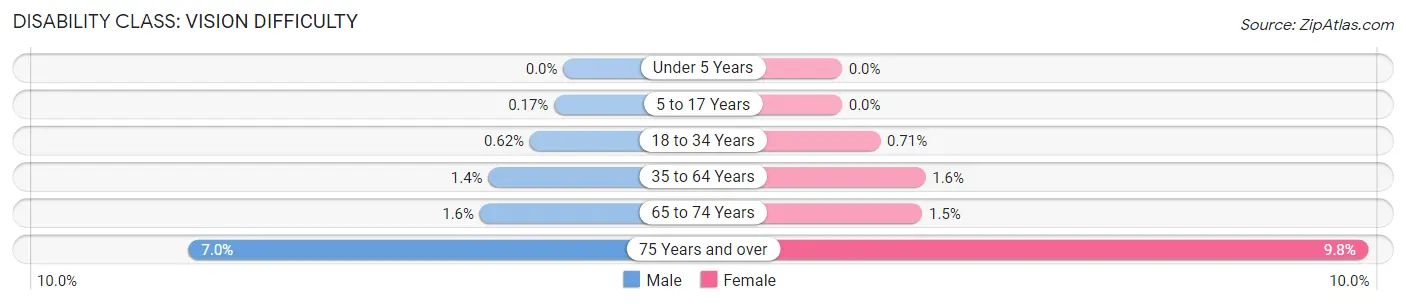
| Age Bracket | Male | Female |
| Under 5 Years | 0 (0.0%) | 0 (0.0%) |
| 5 to 17 Years | 16 (0.2%) | 0 (0.0%) |
| 18 to 34 Years | 78 (0.6%) | 101 (0.7%) |
| 35 to 64 Years | 297 (1.4%) | 334 (1.5%) |
| 65 to 74 Years | 56 (1.5%) | 60 (1.5%) |
| 75 Years and over | 141 (7.0%) | 313 (9.8%) |
Disability Class: Cognitive Difficulty
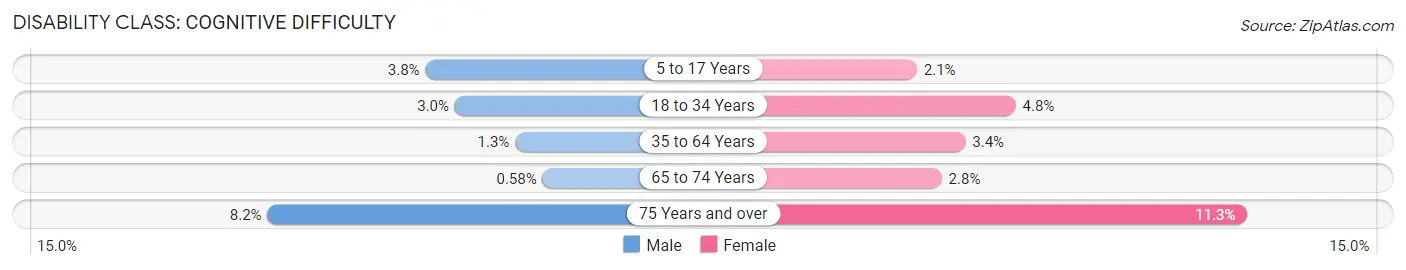
| Age Bracket | Male | Female |
| 5 to 17 Years | 355 (3.8%) | 156 (2.1%) |
| 18 to 34 Years | 382 (3.0%) | 693 (4.8%) |
| 35 to 64 Years | 288 (1.3%) | 741 (3.4%) |
| 65 to 74 Years | 21 (0.6%) | 112 (2.8%) |
| 75 Years and over | 167 (8.2%) | 362 (11.3%) |
Disability Class: Ambulatory Difficulty
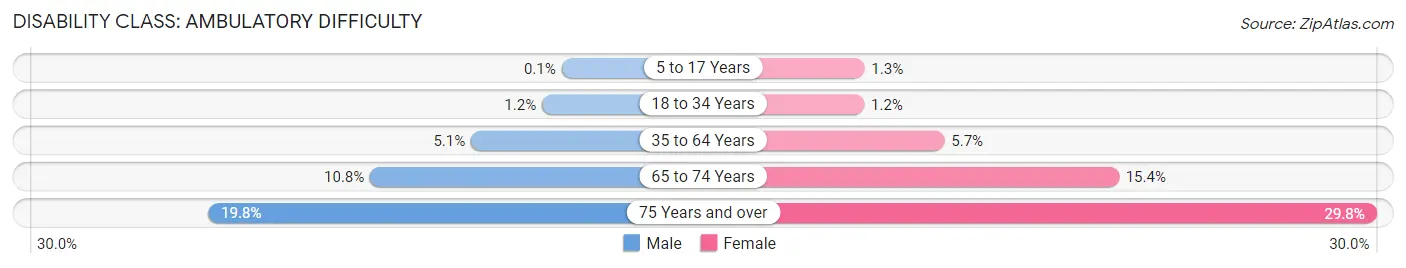
| Age Bracket | Male | Female |
| 5 to 17 Years | 9 (0.1%) | 94 (1.3%) |
| 18 to 34 Years | 151 (1.2%) | 178 (1.2%) |
| 35 to 64 Years | 1,100 (5.1%) | 1,230 (5.7%) |
| 65 to 74 Years | 390 (10.8%) | 621 (15.4%) |
| 75 Years and over | 401 (19.8%) | 955 (29.8%) |
Disability Class: Self-Care Difficulty
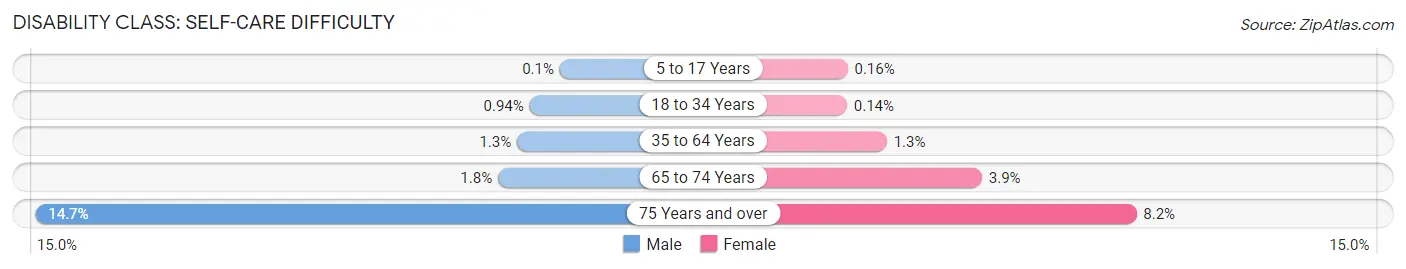
| Age Bracket | Male | Female |
| 5 to 17 Years | 9 (0.1%) | 12 (0.2%) |
| 18 to 34 Years | 119 (0.9%) | 20 (0.1%) |
| 35 to 64 Years | 276 (1.3%) | 270 (1.3%) |
| 65 to 74 Years | 66 (1.8%) | 157 (3.9%) |
| 75 Years and over | 298 (14.7%) | 263 (8.2%) |
Technology Access in Davie
Computing Device Access in Davie
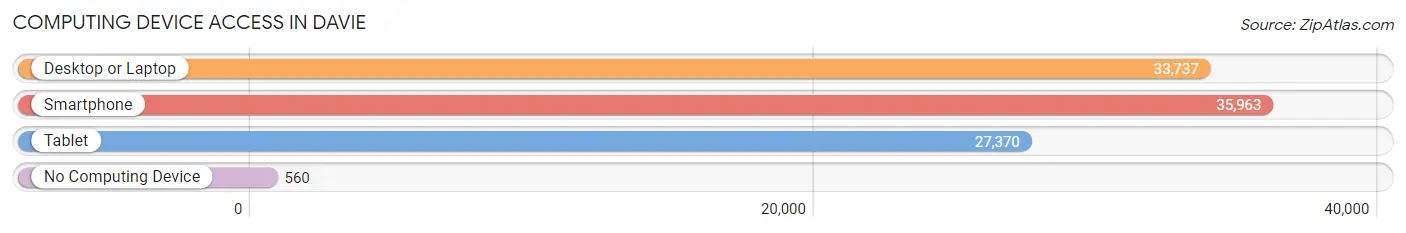
| Device Type | # Households | % Households |
| Desktop or Laptop | 33,737 | 88.9% |
| Smartphone | 35,963 | 94.8% |
| Tablet | 27,370 | 72.1% |
| No Computing Device | 560 | 1.5% |
| Total | 37,941 | 100.0% |
Internet Access in Davie
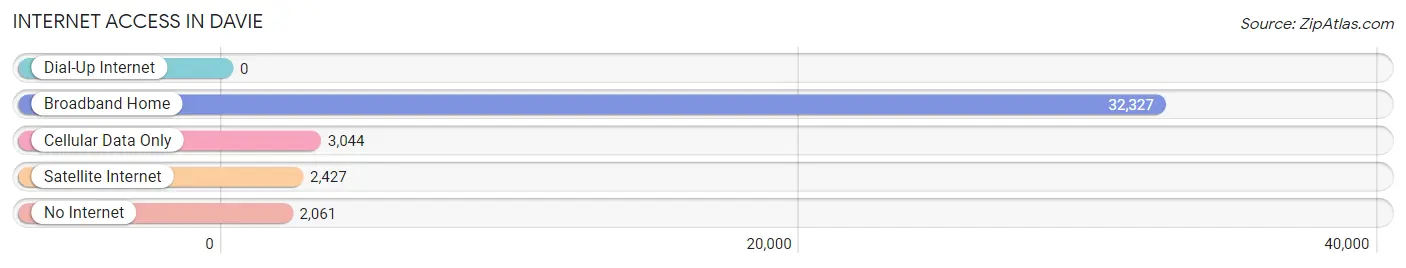
| Internet Type | # Households | % Households |
| Dial-Up Internet | 0 | 0.0% |
| Broadband Home | 32,327 | 85.2% |
| Cellular Data Only | 3,044 | 8.0% |
| Satellite Internet | 2,427 | 6.4% |
| No Internet | 2,061 | 5.4% |
| Total | 37,941 | 100.0% |
Davie Summary
Davie, Florida is a town located in Broward County, Florida, United States. It is the most populous town in the county, with a population of 91,992 as of the 2010 census. The town is known for its western-style atmosphere and rural character, and is home to many horse ranches and stables. It is also home to Nova Southeastern University, one of the largest private universities in the United States.
History
Davie was founded in 1910 by R.P. Davie, a former Florida state senator. The town was named after him, and was incorporated in 1925. The town was originally a farming community, and was known for its citrus groves and dairy farms. In the 1950s, the town began to grow rapidly, as many people moved to the area to take advantage of the booming economy.
Geography
Davie is located in southeastern Florida, about 25 miles north of Miami. It is bordered by the cities of Hollywood, Pembroke Pines, and Plantation. The town covers an area of 24.3 square miles, and has a population density of 3,743 people per square mile.
Economy
Davie’s economy is largely based on tourism, retail, and education. The town is home to several large shopping centers, including the Sawgrass Mills Mall, which is one of the largest malls in the United States. The town is also home to Nova Southeastern University, which is one of the largest private universities in the United States. The university has an enrollment of over 20,000 students, and employs over 4,000 faculty and staff.
Demographics
As of the 2010 census, the population of Davie was 91,992. The racial makeup of the town was 68.2% White, 16.3% African American, 0.3% Native American, 5.2% Asian, 0.1% Pacific Islander, and 8.9% from other races. The median household income was $54,945, and the median family income was $63,945. The per capita income was $25,945.
Conclusion
Davie, Florida is a town located in Broward County, Florida, United States. It is the most populous town in the county, with a population of 91,992 as of the 2010 census. The town is known for its western-style atmosphere and rural character, and is home to many horse ranches and stables. It is also home to Nova Southeastern University, one of the largest private universities in the United States. The town’s economy is largely based on tourism, retail, and education, and the population is diverse, with a median household income of $54,945.
Common Questions
What is Per Capita Income in Davie?
Per Capita income in Davie is $42,349.
What is the Median Family Income in Davie?
Median Family Income in Davie is $94,815.
What is the Median Household income in Davie?
Median Household Income in Davie is $84,346.
What is Income or Wage Gap in Davie?
Income or Wage Gap in Davie is 32.2%.
Women in Davie earn 67.8 cents for every dollar earned by a man.
What is Family Income Deficit in Davie?
Family Income Deficit in Davie is $10,166.
Families that are below poverty line in Davie earn $10,166 less on average than the poverty threshold level.
What is Inequality or Gini Index in Davie?
Inequality or Gini Index in Davie is 0.47.
What is the Total Population of Davie?
Total Population of Davie is 105,821.
What is the Total Male Population of Davie?
Total Male Population of Davie is 52,837.
What is the Total Female Population of Davie?
Total Female Population of Davie is 52,984.
What is the Ratio of Males per 100 Females in Davie?
There are 99.72 Males per 100 Females in Davie.
What is the Ratio of Females per 100 Males in Davie?
There are 100.28 Females per 100 Males in Davie.
What is the Median Population Age in Davie?
Median Population Age in Davie is 36.8 Years.
What is the Average Family Size in Davie
Average Family Size in Davie is 3.2 People.
What is the Average Household Size in Davie
Average Household Size in Davie is 2.7 People.
How Large is the Labor Force in Davie?
There are 59,266 People in the Labor Forcein in Davie.
What is the Percentage of People in the Labor Force in Davie?
69.2% of People are in the Labor Force in Davie.
What is the Unemployment Rate in Davie?
Unemployment Rate in Davie is 4.5%.