Tamarac, FL Map & Demographics
Tamarac Map
Tamarac Overview
$35,620
PER CAPITA INCOME
$67,739
AVG FAMILY INCOME
$59,140
AVG HOUSEHOLD INCOME
18.7%
WAGE / INCOME GAP [ % ]
81.3¢/ $1
WAGE / INCOME GAP [ $ ]
$7,793
FAMILY INCOME DEFICIT
0.47
INEQUALITY / GINI INDEX
71,578
TOTAL POPULATION
32,434
MALE POPULATION
39,144
FEMALE POPULATION
82.86
MALES / 100 FEMALES
120.69
FEMALES / 100 MALES
47.1
MEDIAN AGE
3.1
AVG FAMILY SIZE
2.3
AVG HOUSEHOLD SIZE
36,868
LABOR FORCE [ PEOPLE ]
61.1%
PERCENT IN LABOR FORCE
5.9%
UNEMPLOYMENT RATE
Income in Tamarac
Income Overview in Tamarac
Per Capita Income in Tamarac is $35,620, while median incomes of families and households are $67,739 and $59,140 respectively.
| Characteristic | Number | Measure |
| Per Capita Income | 71,578 | $35,620 |
| Median Family Income | 18,152 | $67,739 |
| Mean Family Income | 18,152 | $94,427 |
| Median Household Income | 30,605 | $59,140 |
| Mean Household Income | 30,605 | $81,296 |
| Income Deficit | 18,152 | $7,793 |
| Wage / Income Gap (%) | 71,578 | 18.73% |
| Wage / Income Gap ($) | 71,578 | 81.27¢ per $1 |
| Gini / Inequality Index | 71,578 | 0.47 |
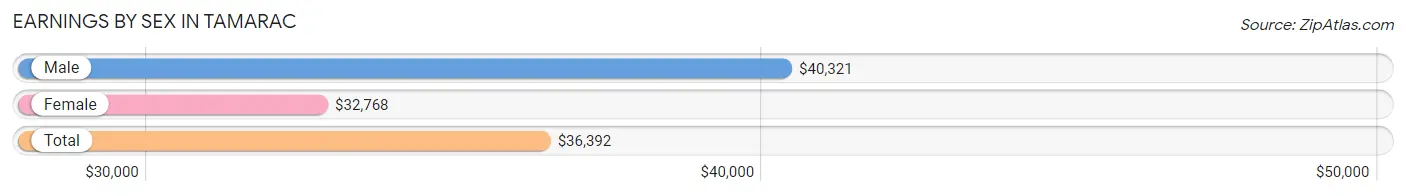
Earnings by Sex in Tamarac
Average Earnings in Tamarac are $36,392, $40,321 for men and $32,768 for women, a difference of 18.7%.
| Sex | Number | Average Earnings |
| Male | 18,827 (49.8%) | $40,321 |
| Female | 18,994 (50.2%) | $32,768 |
| Total | 37,821 (100.0%) | $36,392 |
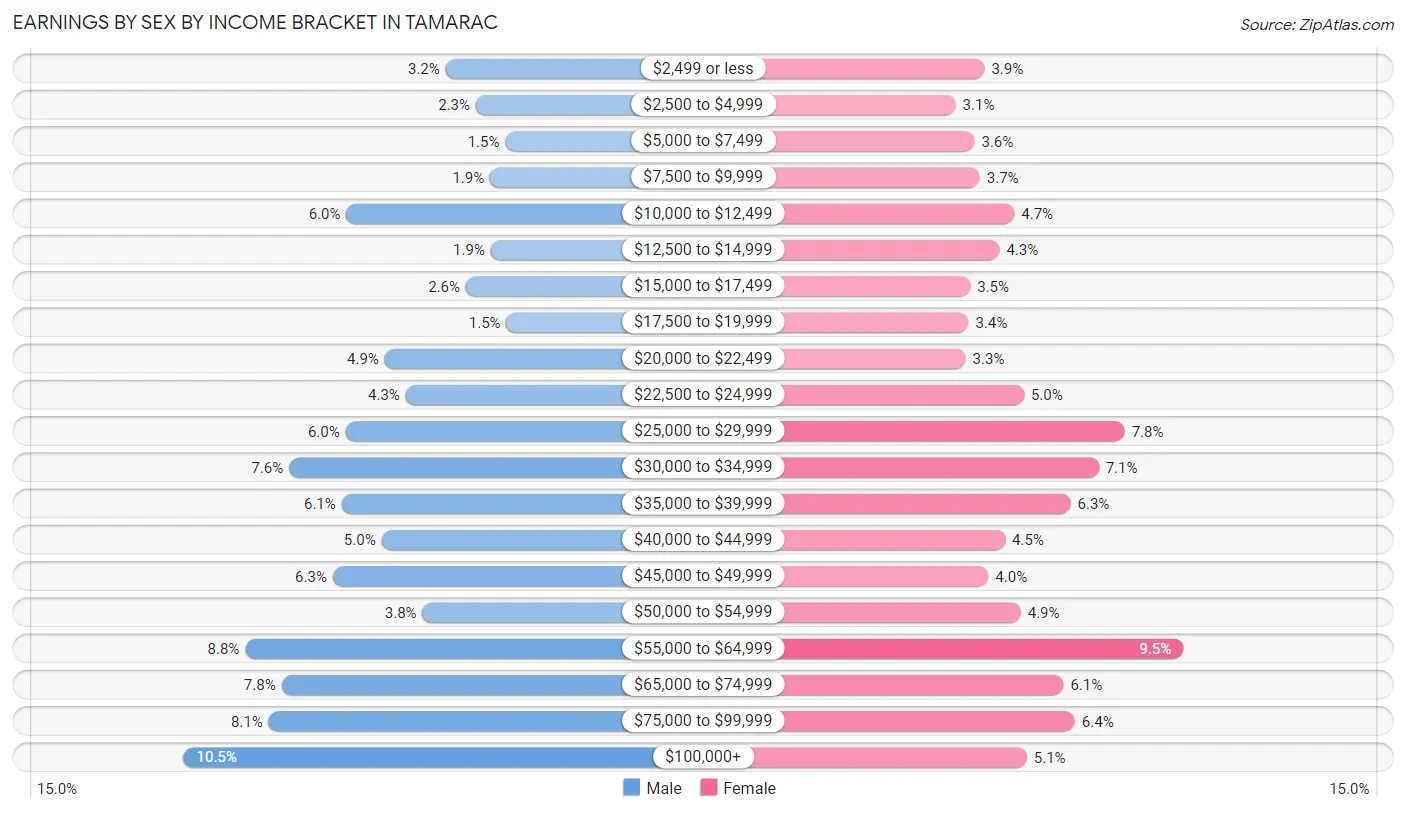
Earnings by Sex by Income Bracket in Tamarac
The most common earnings brackets in Tamarac are $100,000+ for men (1,983 | 10.5%) and $55,000 to $64,999 for women (1,795 | 9.5%).
| Income | Male | Female |
| $2,499 or less | 596 (3.2%) | 736 (3.9%) |
| $2,500 to $4,999 | 437 (2.3%) | 582 (3.1%) |
| $5,000 to $7,499 | 280 (1.5%) | 682 (3.6%) |
| $7,500 to $9,999 | 362 (1.9%) | 711 (3.7%) |
| $10,000 to $12,499 | 1,123 (6.0%) | 895 (4.7%) |
| $12,500 to $14,999 | 357 (1.9%) | 815 (4.3%) |
| $15,000 to $17,499 | 489 (2.6%) | 660 (3.5%) |
| $17,500 to $19,999 | 274 (1.5%) | 649 (3.4%) |
| $20,000 to $22,499 | 918 (4.9%) | 635 (3.3%) |
| $22,500 to $24,999 | 807 (4.3%) | 945 (5.0%) |
| $25,000 to $29,999 | 1,126 (6.0%) | 1,483 (7.8%) |
| $30,000 to $34,999 | 1,425 (7.6%) | 1,344 (7.1%) |
| $35,000 to $39,999 | 1,147 (6.1%) | 1,195 (6.3%) |
| $40,000 to $44,999 | 936 (5.0%) | 846 (4.4%) |
| $45,000 to $49,999 | 1,194 (6.3%) | 756 (4.0%) |
| $50,000 to $54,999 | 719 (3.8%) | 928 (4.9%) |
| $55,000 to $64,999 | 1,657 (8.8%) | 1,795 (9.5%) |
| $65,000 to $74,999 | 1,464 (7.8%) | 1,157 (6.1%) |
| $75,000 to $99,999 | 1,533 (8.1%) | 1,218 (6.4%) |
| $100,000+ | 1,983 (10.5%) | 962 (5.1%) |
| Total | 18,827 (100.0%) | 18,994 (100.0%) |
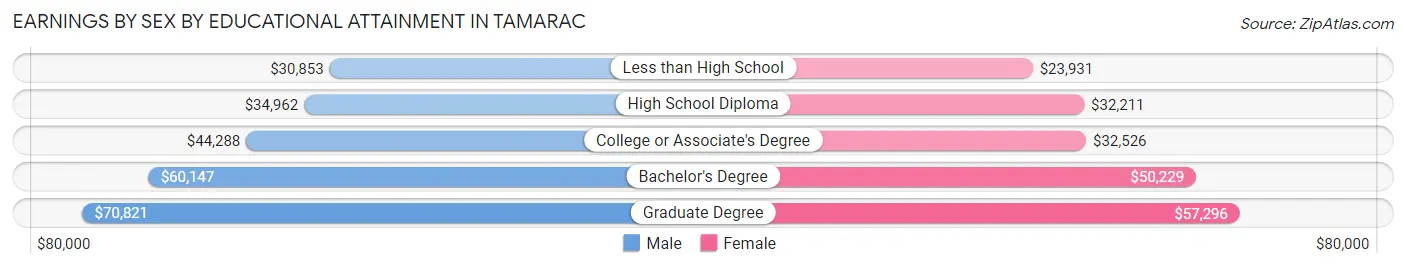
Earnings by Sex by Educational Attainment in Tamarac
Average earnings in Tamarac are $43,888 for men and $35,637 for women, a difference of 18.8%. Men with an educational attainment of graduate degree enjoy the highest average annual earnings of $70,821, while those with less than high school education earn the least with $30,853. Women with an educational attainment of graduate degree earn the most with the average annual earnings of $57,296, while those with less than high school education have the smallest earnings of $23,931.
| Educational Attainment | Male Income | Female Income |
| Less than High School | $30,853 | $23,931 |
| High School Diploma | $34,962 | $32,211 |
| College or Associate's Degree | $44,288 | $32,526 |
| Bachelor's Degree | $60,147 | $50,229 |
| Graduate Degree | $70,821 | $57,296 |
| Total | $43,888 | $35,637 |
Family Income in Tamarac
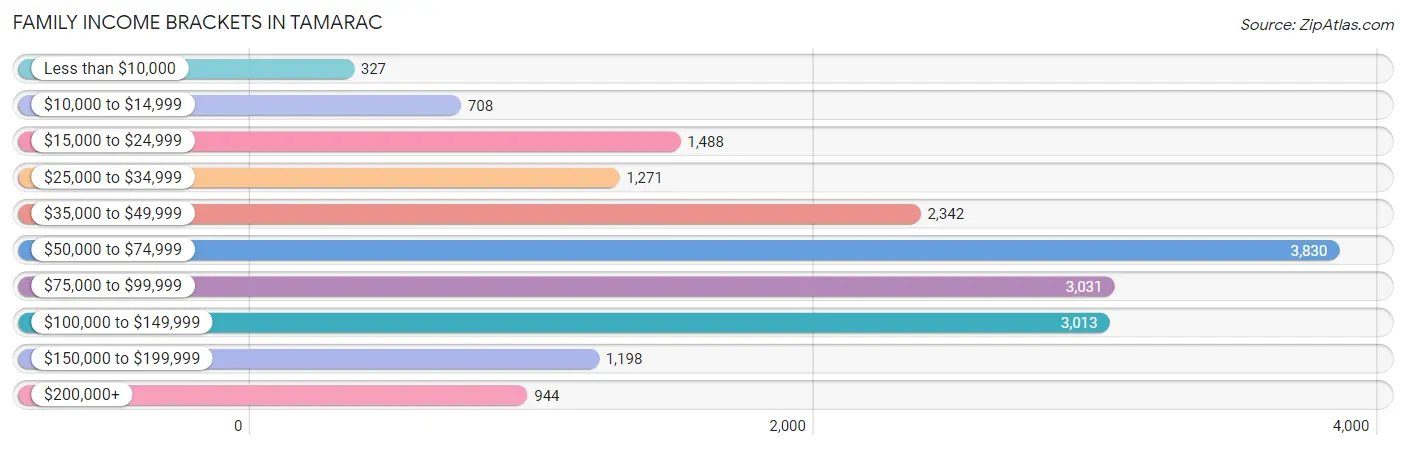
Family Income Brackets in Tamarac
According to the Tamarac family income data, there are 3,830 families falling into the $50,000 to $74,999 income range, which is the most common income bracket and makes up 21.1% of all families. Conversely, the less than $10,000 income bracket is the least frequent group with only 327 families (1.8%) belonging to this category.
| Income Bracket | # Families | % Families |
| Less than $10,000 | 327 | 1.8% |
| $10,000 to $14,999 | 708 | 3.9% |
| $15,000 to $24,999 | 1,488 | 8.2% |
| $25,000 to $34,999 | 1,271 | 7.0% |
| $35,000 to $49,999 | 2,342 | 12.9% |
| $50,000 to $74,999 | 3,830 | 21.1% |
| $75,000 to $99,999 | 3,031 | 16.7% |
| $100,000 to $149,999 | 3,013 | 16.6% |
| $150,000 to $199,999 | 1,198 | 6.6% |
| $200,000+ | 944 | 5.2% |
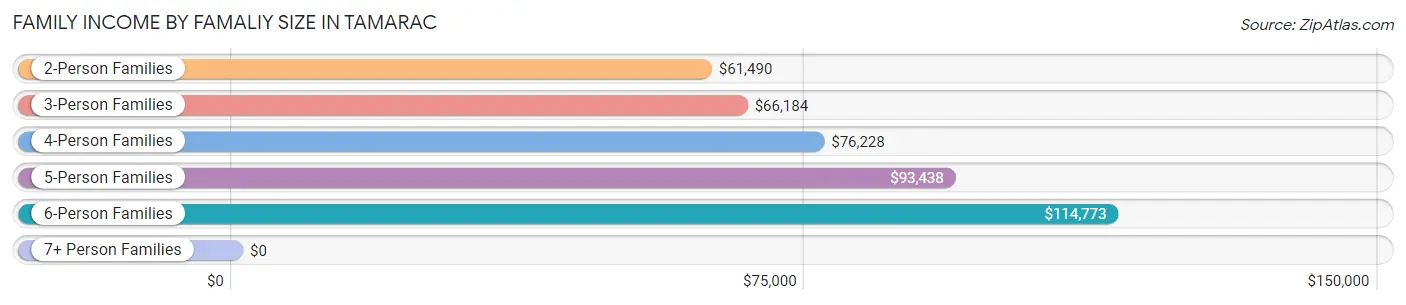
Family Income by Famaliy Size in Tamarac
6-person families (202 | 1.1%) account for the highest median family income in Tamarac with $114,773 per family, while 2-person families (9,277 | 51.1%) have the highest median income of $30,745 per family member.
| Income Bracket | # Families | Median Income |
| 2-Person Families | 9,277 (51.1%) | $61,490 |
| 3-Person Families | 4,636 (25.5%) | $66,184 |
| 4-Person Families | 2,692 (14.8%) | $76,228 |
| 5-Person Families | 1,228 (6.8%) | $93,438 |
| 6-Person Families | 202 (1.1%) | $114,773 |
| 7+ Person Families | 117 (0.6%) | $0 |
| Total | 18,152 (100.0%) | $67,739 |
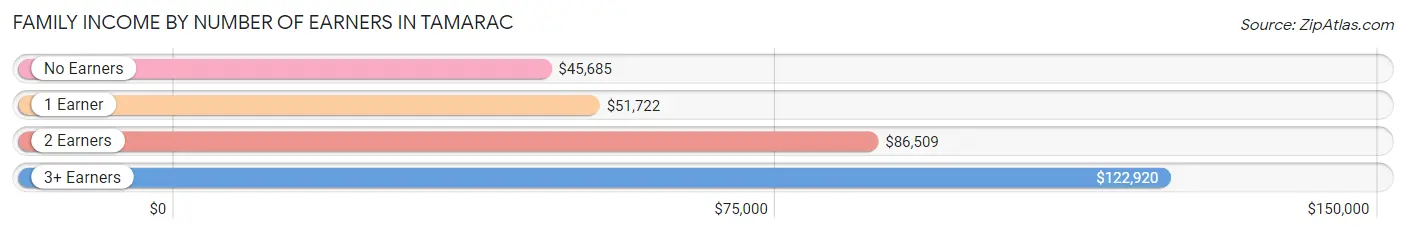
Family Income by Number of Earners in Tamarac
The median family income in Tamarac is $67,739, with families comprising 3+ earners (1,815) having the highest median family income of $122,920, while families with no earners (2,840) have the lowest median family income of $45,685, accounting for 10.0% and 15.7% of families, respectively.
| Number of Earners | # Families | Median Income |
| No Earners | 2,840 (15.7%) | $45,685 |
| 1 Earner | 6,043 (33.3%) | $51,722 |
| 2 Earners | 7,454 (41.1%) | $86,509 |
| 3+ Earners | 1,815 (10.0%) | $122,920 |
| Total | 18,152 (100.0%) | $67,739 |
Household Income in Tamarac
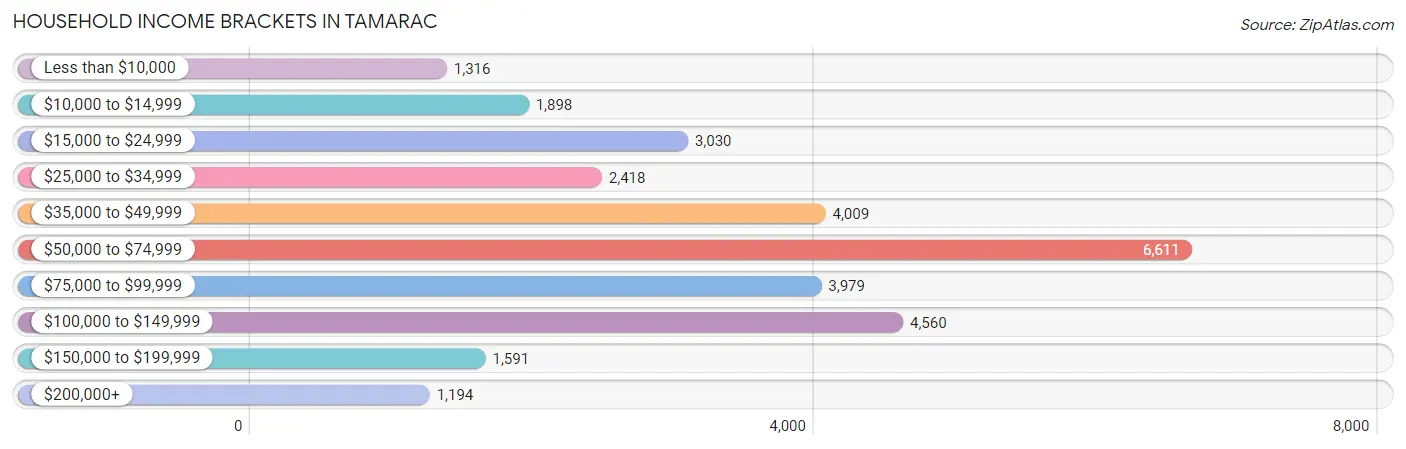
Household Income Brackets in Tamarac
With 6,611 households falling in the category, the $50,000 to $74,999 income range is the most frequent in Tamarac, accounting for 21.6% of all households. In contrast, only 1,194 households (3.9%) fall into the $200,000+ income bracket, making it the least populous group.
| Income Bracket | # Households | % Households |
| Less than $10,000 | 1,316 | 4.3% |
| $10,000 to $14,999 | 1,898 | 6.2% |
| $15,000 to $24,999 | 3,030 | 9.9% |
| $25,000 to $34,999 | 2,418 | 7.9% |
| $35,000 to $49,999 | 4,009 | 13.1% |
| $50,000 to $74,999 | 6,611 | 21.6% |
| $75,000 to $99,999 | 3,979 | 13.0% |
| $100,000 to $149,999 | 4,560 | 14.9% |
| $150,000 to $199,999 | 1,591 | 5.2% |
| $200,000+ | 1,194 | 3.9% |
Household Income by Householder Age in Tamarac
The median household income in Tamarac is $59,140, with the highest median household income of $71,176 found in the 45 to 64 years age bracket for the primary householder. A total of 10,084 households (33.0%) fall into this category. Meanwhile, the 15 to 24 years age bracket for the primary householder has the lowest median household income of $36,174, with 645 households (2.1%) in this group.
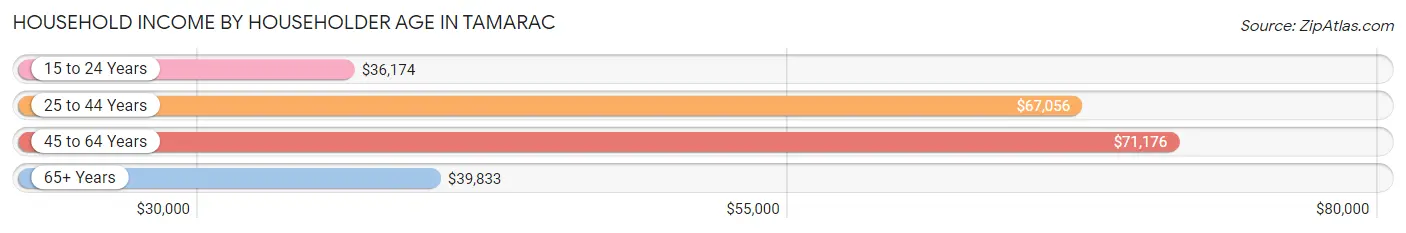
| Income Bracket | # Households | Median Income |
| 15 to 24 Years | 645 (2.1%) | $36,174 |
| 25 to 44 Years | 8,007 (26.2%) | $67,056 |
| 45 to 64 Years | 10,084 (33.0%) | $71,176 |
| 65+ Years | 11,869 (38.8%) | $39,833 |
| Total | 30,605 (100.0%) | $59,140 |
Poverty in Tamarac
Income Below Poverty by Sex and Age in Tamarac
With 10.3% poverty level for males and 14.7% for females among the residents of Tamarac, 16 and 17 year old males and 15 year old females are the most vulnerable to poverty, with 455 males (46.6%) and 81 females (26.9%) in their respective age groups living below the poverty level.
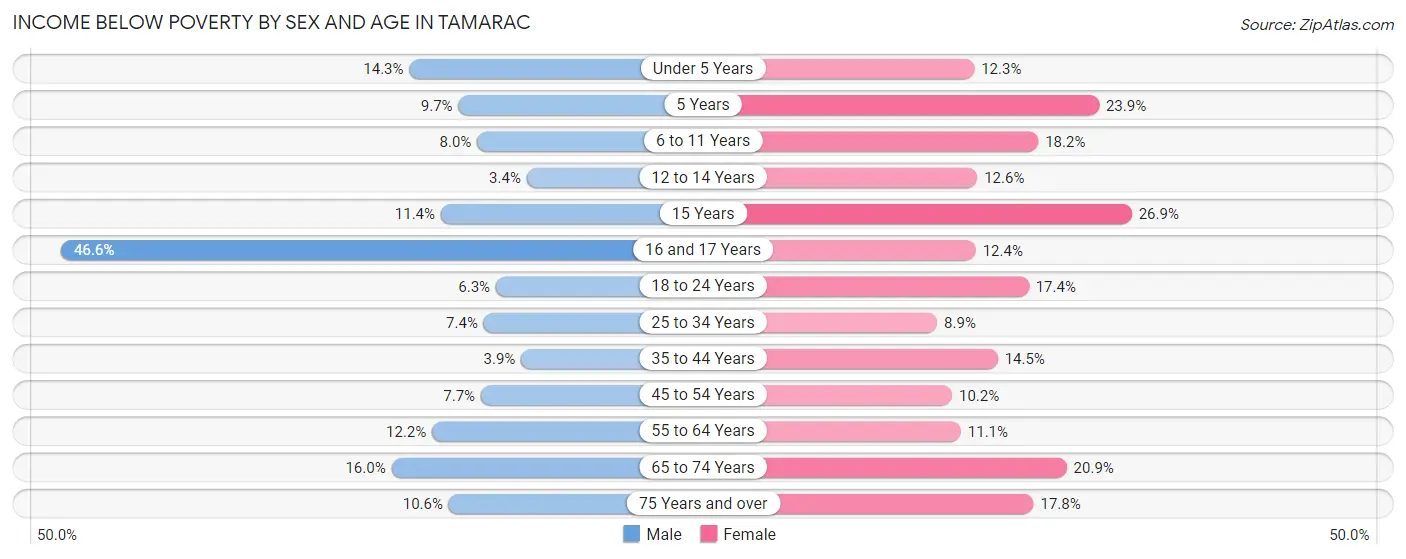
| Age Bracket | Male | Female |
| Under 5 Years | 234 (14.3%) | 244 (12.3%) |
| 5 Years | 15 (9.7%) | 74 (23.9%) |
| 6 to 11 Years | 170 (8.0%) | 404 (18.2%) |
| 12 to 14 Years | 39 (3.4%) | 141 (12.6%) |
| 15 Years | 24 (11.4%) | 81 (26.9%) |
| 16 and 17 Years | 455 (46.6%) | 111 (12.4%) |
| 18 to 24 Years | 139 (6.3%) | 375 (17.3%) |
| 25 to 34 Years | 302 (7.4%) | 392 (8.8%) |
| 35 to 44 Years | 151 (3.9%) | 637 (14.5%) |
| 45 to 54 Years | 343 (7.6%) | 460 (10.2%) |
| 55 to 64 Years | 579 (12.2%) | 539 (11.1%) |
| 65 to 74 Years | 560 (16.0%) | 1,284 (20.9%) |
| 75 Years and over | 336 (10.6%) | 985 (17.8%) |
| Total | 3,347 (10.3%) | 5,727 (14.7%) |
Income Above Poverty by Sex and Age in Tamarac
According to the poverty statistics in Tamarac, males aged 12 to 14 years and females aged 25 to 34 years are the age groups that are most secure financially, with 96.6% of males and 91.1% of females in these age groups living above the poverty line.
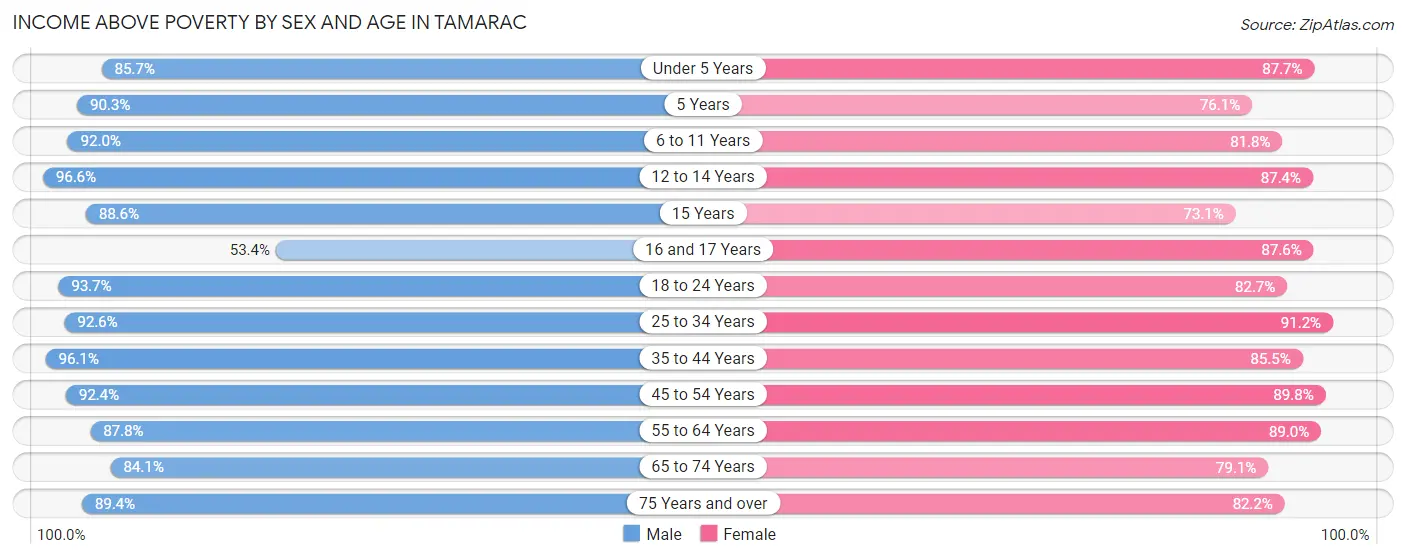
| Age Bracket | Male | Female |
| Under 5 Years | 1,403 (85.7%) | 1,741 (87.7%) |
| 5 Years | 139 (90.3%) | 236 (76.1%) |
| 6 to 11 Years | 1,954 (92.0%) | 1,812 (81.8%) |
| 12 to 14 Years | 1,107 (96.6%) | 981 (87.4%) |
| 15 Years | 187 (88.6%) | 220 (73.1%) |
| 16 and 17 Years | 521 (53.4%) | 782 (87.6%) |
| 18 to 24 Years | 2,083 (93.7%) | 1,787 (82.7%) |
| 25 to 34 Years | 3,782 (92.6%) | 4,039 (91.1%) |
| 35 to 44 Years | 3,707 (96.1%) | 3,766 (85.5%) |
| 45 to 54 Years | 4,142 (92.3%) | 4,035 (89.8%) |
| 55 to 64 Years | 4,175 (87.8%) | 4,338 (88.9%) |
| 65 to 74 Years | 2,951 (84.1%) | 4,869 (79.1%) |
| 75 Years and over | 2,826 (89.4%) | 4,549 (82.2%) |
| Total | 28,977 (89.6%) | 33,155 (85.3%) |
Income Below Poverty Among Married-Couple Families in Tamarac
The poverty statistics for married-couple families in Tamarac show that 4.8% or 551 of the total 11,447 families live below the poverty line. Families with no children have the highest poverty rate of 6.4%, comprising of 466 families. On the other hand, families with 1 or 2 children have the lowest poverty rate of 2.0%, which includes 73 families.
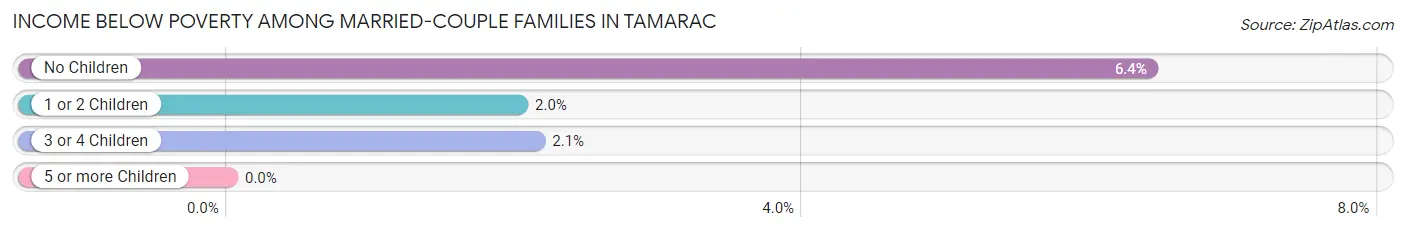
| Children | Above Poverty | Below Poverty |
| No Children | 6,803 (93.6%) | 466 (6.4%) |
| 1 or 2 Children | 3,545 (98.0%) | 73 (2.0%) |
| 3 or 4 Children | 548 (97.9%) | 12 (2.1%) |
| 5 or more Children | 0 (0.0%) | 0 (0.0%) |
| Total | 10,896 (95.2%) | 551 (4.8%) |
Income Below Poverty Among Single-Parent Households in Tamarac
According to the poverty data in Tamarac, 11.9% or 243 single-father households and 25.7% or 1,198 single-mother households are living below the poverty line. Among single-father households, those with 3 or 4 children have the highest poverty rate, with 86 households (47.0%) experiencing poverty. Likewise, among single-mother households, those with 1 or 2 children have the highest poverty rate, with 892 households (36.2%) falling below the poverty line.
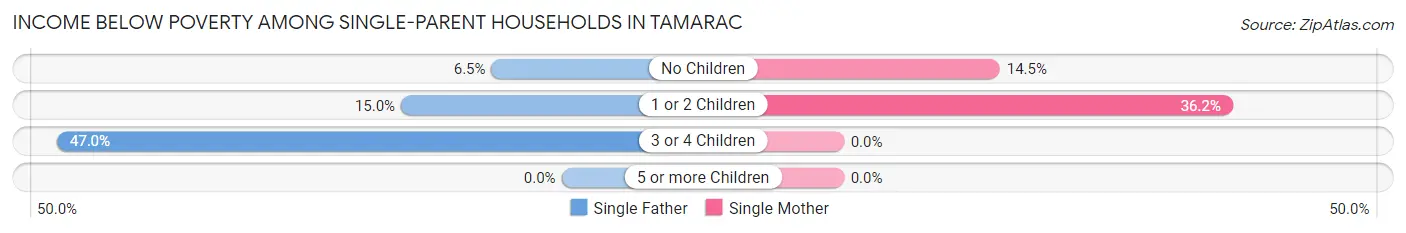
| Children | Single Father | Single Mother |
| No Children | 93 (6.5%) | 306 (14.5%) |
| 1 or 2 Children | 64 (14.9%) | 892 (36.2%) |
| 3 or 4 Children | 86 (47.0%) | 0 (0.0%) |
| 5 or more Children | 0 (0.0%) | 0 (0.0%) |
| Total | 243 (11.9%) | 1,198 (25.7%) |
Income Below Poverty Among Married-Couple vs Single-Parent Households in Tamarac
The poverty data for Tamarac shows that 551 of the married-couple family households (4.8%) and 1,441 of the single-parent households (21.5%) are living below the poverty level. Within the married-couple family households, those with no children have the highest poverty rate, with 466 households (6.4%) falling below the poverty line. Among the single-parent households, those with 1 or 2 children have the highest poverty rate, with 956 household (33.1%) living below poverty.
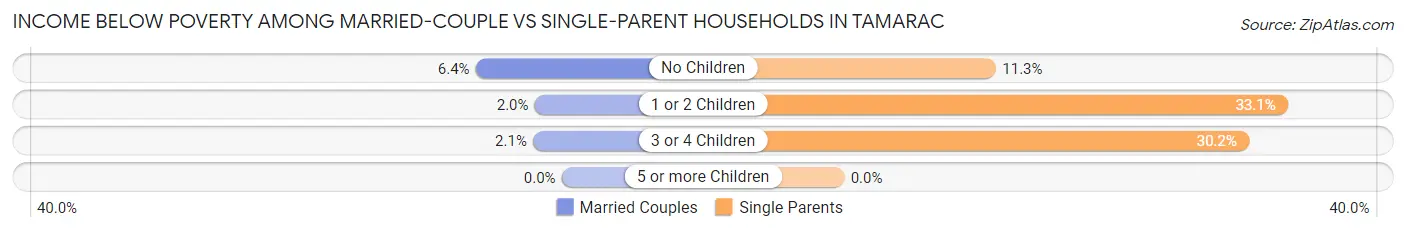
| Children | Married-Couple Families | Single-Parent Households |
| No Children | 466 (6.4%) | 399 (11.3%) |
| 1 or 2 Children | 73 (2.0%) | 956 (33.1%) |
| 3 or 4 Children | 12 (2.1%) | 86 (30.2%) |
| 5 or more Children | 0 (0.0%) | 0 (0.0%) |
| Total | 551 (4.8%) | 1,441 (21.5%) |
Race in Tamarac
The most populous races in Tamarac are White / Caucasian (33,698 | 47.1%), Hispanic or Latino (24,547 | 34.3%), and Black / African American (22,500 | 31.4%).
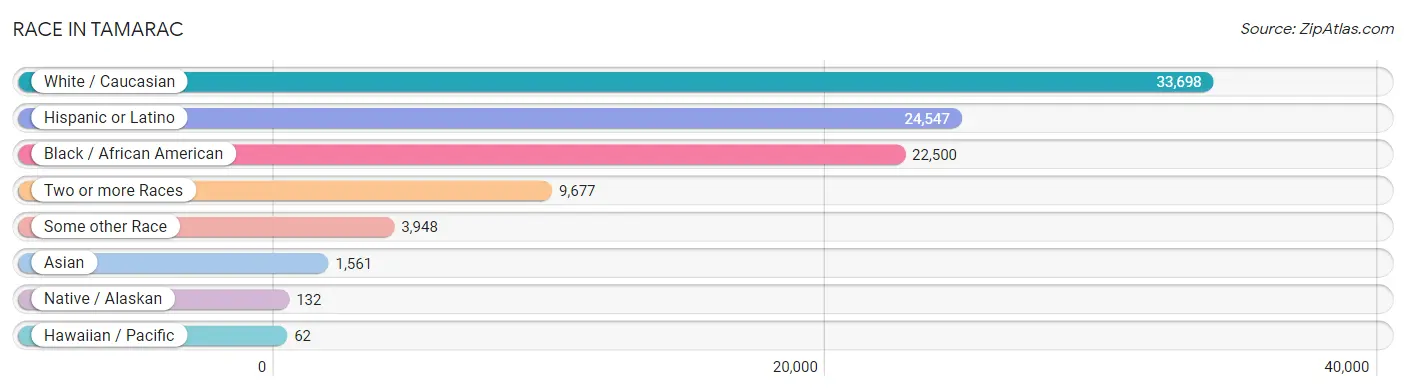
| Race | # Population | % Population |
| Asian | 1,561 | 2.2% |
| Black / African American | 22,500 | 31.4% |
| Hawaiian / Pacific | 62 | 0.1% |
| Hispanic or Latino | 24,547 | 34.3% |
| Native / Alaskan | 132 | 0.2% |
| White / Caucasian | 33,698 | 47.1% |
| Two or more Races | 9,677 | 13.5% |
| Some other Race | 3,948 | 5.5% |
| Total | 71,578 | 100.0% |
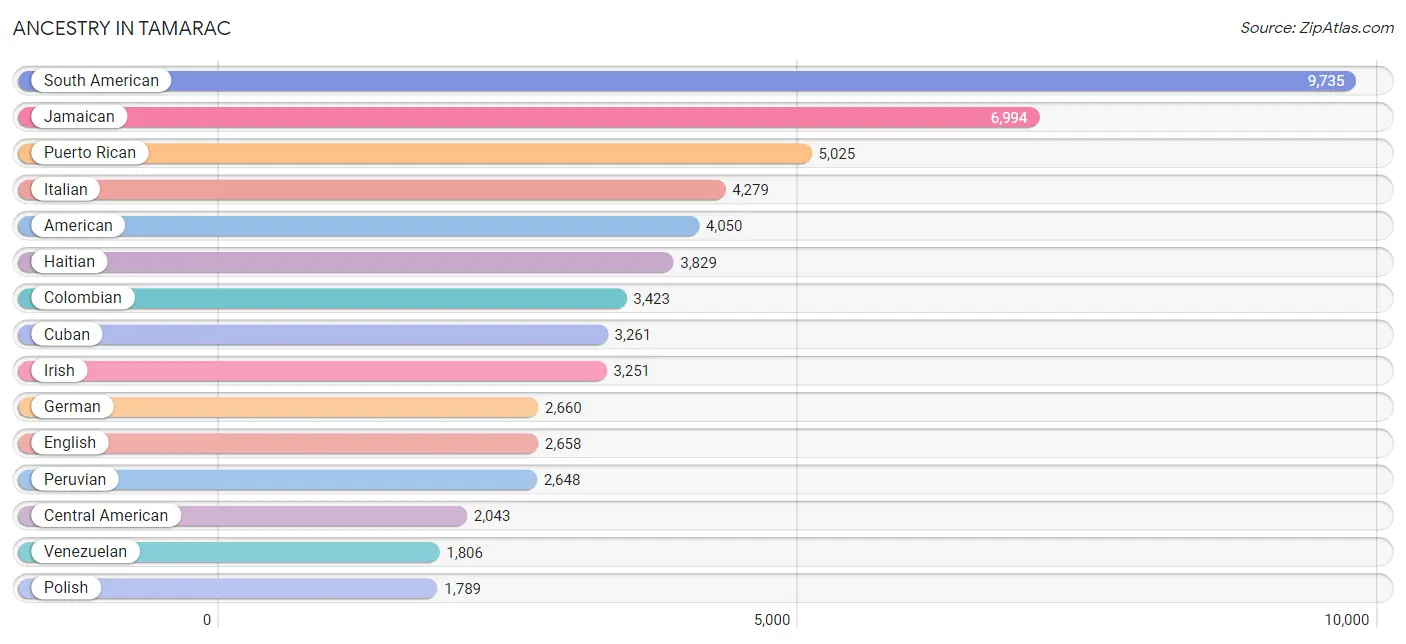
Ancestry in Tamarac
The most populous ancestries reported in Tamarac are South American (9,735 | 13.6%), Jamaican (6,994 | 9.8%), Puerto Rican (5,025 | 7.0%), Italian (4,279 | 6.0%), and American (4,050 | 5.7%), together accounting for 42.0% of all Tamarac residents.
| Ancestry | # Population | % Population |
| African | 312 | 0.4% |
| American | 4,050 | 5.7% |
| Arab | 249 | 0.4% |
| Argentinean | 297 | 0.4% |
| Armenian | 74 | 0.1% |
| Australian | 50 | 0.1% |
| Austrian | 146 | 0.2% |
| Bahamian | 913 | 1.3% |
| Barbadian | 75 | 0.1% |
| Basque | 18 | 0.0% |
| Bhutanese | 139 | 0.2% |
| Blackfeet | 107 | 0.2% |
| Bolivian | 93 | 0.1% |
| Brazilian | 358 | 0.5% |
| British | 315 | 0.4% |
| British West Indian | 447 | 0.6% |
| Burmese | 62 | 0.1% |
| Canadian | 87 | 0.1% |
| Cape Verdean | 8 | 0.0% |
| Central American | 2,043 | 2.9% |
| Central American Indian | 240 | 0.3% |
| Cherokee | 2 | 0.0% |
| Chilean | 422 | 0.6% |
| Colombian | 3,423 | 4.8% |
| Costa Rican | 24 | 0.0% |
| Croatian | 22 | 0.0% |
| Cuban | 3,261 | 4.6% |
| Czech | 41 | 0.1% |
| Danish | 30 | 0.0% |
| Dominican | 1,698 | 2.4% |
| Dutch | 302 | 0.4% |
| Eastern European | 217 | 0.3% |
| Ecuadorian | 557 | 0.8% |
| Egyptian | 39 | 0.1% |
| English | 2,658 | 3.7% |
| Estonian | 12 | 0.0% |
| European | 484 | 0.7% |
| French | 1,166 | 1.6% |
| French Canadian | 117 | 0.2% |
| German | 2,660 | 3.7% |
| Greek | 119 | 0.2% |
| Guamanian / Chamorro | 62 | 0.1% |
| Guatemalan | 35 | 0.1% |
| Guyanese | 210 | 0.3% |
| Haitian | 3,829 | 5.3% |
| Honduran | 772 | 1.1% |
| Hungarian | 366 | 0.5% |
| Icelander | 8 | 0.0% |
| Indian (Asian) | 711 | 1.0% |
| Irish | 3,251 | 4.5% |
| Italian | 4,279 | 6.0% |
| Jamaican | 6,994 | 9.8% |
| Japanese | 8 | 0.0% |
| Kenyan | 57 | 0.1% |
| Korean | 306 | 0.4% |
| Latvian | 38 | 0.1% |
| Lebanese | 53 | 0.1% |
| Lithuanian | 68 | 0.1% |
| Mexican | 1,635 | 2.3% |
| Mexican American Indian | 9 | 0.0% |
| Moroccan | 77 | 0.1% |
| Nicaraguan | 423 | 0.6% |
| Nigerian | 49 | 0.1% |
| Northern European | 10 | 0.0% |
| Norwegian | 81 | 0.1% |
| Pakistani | 33 | 0.1% |
| Panamanian | 28 | 0.0% |
| Paraguayan | 19 | 0.0% |
| Pennsylvania German | 12 | 0.0% |
| Peruvian | 2,648 | 3.7% |
| Polish | 1,789 | 2.5% |
| Portuguese | 425 | 0.6% |
| Puerto Rican | 5,025 | 7.0% |
| Romanian | 66 | 0.1% |
| Russian | 1,669 | 2.3% |
| Salvadoran | 761 | 1.1% |
| Scandinavian | 48 | 0.1% |
| Scotch-Irish | 132 | 0.2% |
| Scottish | 312 | 0.4% |
| Slovak | 148 | 0.2% |
| Slovene | 20 | 0.0% |
| South African | 1 | 0.0% |
| South American | 9,735 | 13.6% |
| South American Indian | 6 | 0.0% |
| Spaniard | 79 | 0.1% |
| Spanish | 79 | 0.1% |
| Sri Lankan | 131 | 0.2% |
| Subsaharan African | 436 | 0.6% |
| Swedish | 396 | 0.5% |
| Swiss | 37 | 0.1% |
| Thai | 747 | 1.0% |
| Trinidadian and Tobagonian | 1,006 | 1.4% |
| Turkish | 69 | 0.1% |
| U.S. Virgin Islander | 149 | 0.2% |
| Ukrainian | 101 | 0.1% |
| Uruguayan | 454 | 0.6% |
| Venezuelan | 1,806 | 2.5% |
| Vietnamese | 20 | 0.0% |
| Welsh | 95 | 0.1% |
| West Indian | 367 | 0.5% |
| Yugoslavian | 11 | 0.0% | View All 101 Rows |
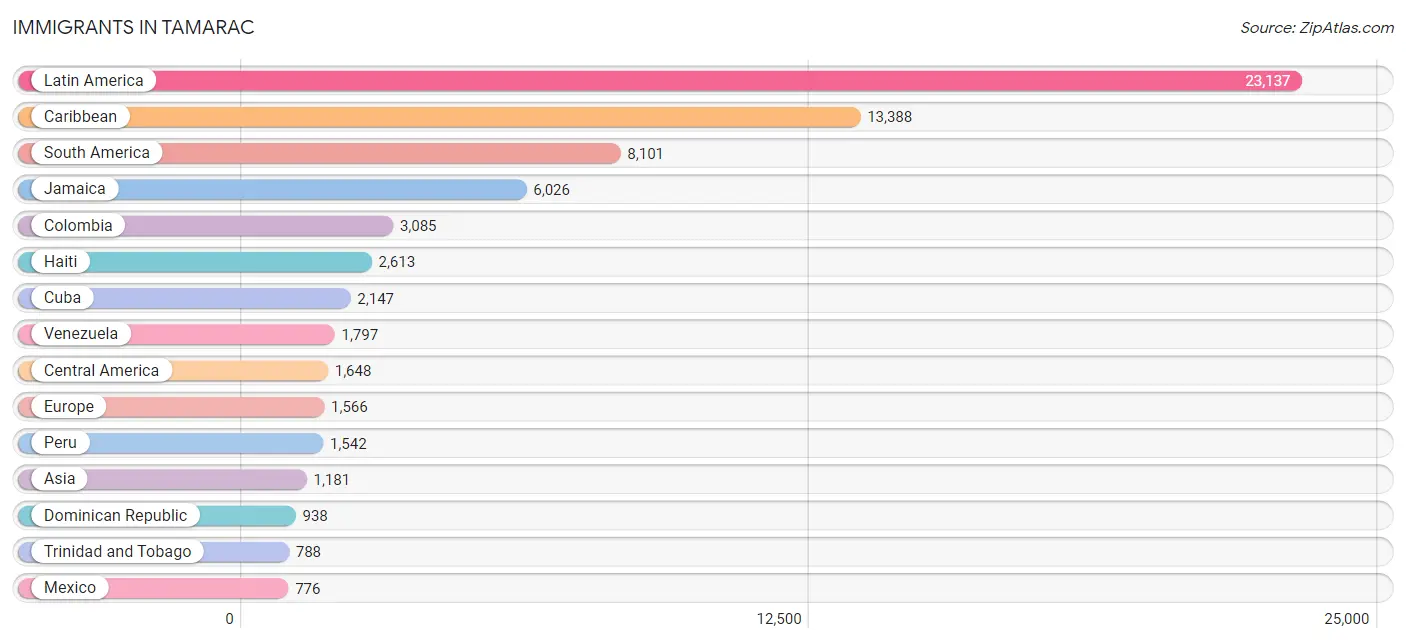
Immigrants in Tamarac
The most numerous immigrant groups reported in Tamarac came from Latin America (23,137 | 32.3%), Caribbean (13,388 | 18.7%), South America (8,101 | 11.3%), Jamaica (6,026 | 8.4%), and Colombia (3,085 | 4.3%), together accounting for 75.1% of all Tamarac residents.
| Immigration Origin | # Population | % Population |
| Africa | 352 | 0.5% |
| Argentina | 299 | 0.4% |
| Asia | 1,181 | 1.7% |
| Bahamas | 516 | 0.7% |
| Bangladesh | 11 | 0.0% |
| Barbados | 57 | 0.1% |
| Belarus | 162 | 0.2% |
| Belize | 20 | 0.0% |
| Bolivia | 16 | 0.0% |
| Brazil | 222 | 0.3% |
| Cabo Verde | 8 | 0.0% |
| Cambodia | 8 | 0.0% |
| Canada | 330 | 0.5% |
| Caribbean | 13,388 | 18.7% |
| Central America | 1,648 | 2.3% |
| Chile | 128 | 0.2% |
| China | 393 | 0.5% |
| Colombia | 3,085 | 4.3% |
| Congo | 13 | 0.0% |
| Costa Rica | 24 | 0.0% |
| Cuba | 2,147 | 3.0% |
| Czechoslovakia | 50 | 0.1% |
| Dominica | 30 | 0.0% |
| Dominican Republic | 938 | 1.3% |
| Eastern Africa | 95 | 0.1% |
| Eastern Asia | 433 | 0.6% |
| Eastern Europe | 505 | 0.7% |
| Ecuador | 417 | 0.6% |
| Egypt | 135 | 0.2% |
| El Salvador | 208 | 0.3% |
| England | 313 | 0.4% |
| Europe | 1,566 | 2.2% |
| France | 8 | 0.0% |
| Germany | 179 | 0.3% |
| Greece | 8 | 0.0% |
| Grenada | 43 | 0.1% |
| Guatemala | 30 | 0.0% |
| Guyana | 386 | 0.5% |
| Haiti | 2,613 | 3.6% |
| Honduras | 347 | 0.5% |
| Hong Kong | 23 | 0.0% |
| Hungary | 81 | 0.1% |
| India | 102 | 0.1% |
| Iran | 84 | 0.1% |
| Ireland | 4 | 0.0% |
| Israel | 20 | 0.0% |
| Italy | 230 | 0.3% |
| Jamaica | 6,026 | 8.4% |
| Japan | 30 | 0.0% |
| Kenya | 95 | 0.1% |
| Korea | 10 | 0.0% |
| Latin America | 23,137 | 32.3% |
| Lebanon | 69 | 0.1% |
| Mexico | 776 | 1.1% |
| Middle Africa | 13 | 0.0% |
| Moldova | 22 | 0.0% |
| Morocco | 76 | 0.1% |
| Nicaragua | 215 | 0.3% |
| Nigeria | 10 | 0.0% |
| Northern Africa | 224 | 0.3% |
| Northern Europe | 414 | 0.6% |
| Pakistan | 19 | 0.0% |
| Panama | 28 | 0.0% |
| Peru | 1,542 | 2.1% |
| Philippines | 156 | 0.2% |
| Poland | 76 | 0.1% |
| Portugal | 182 | 0.3% |
| Romania | 15 | 0.0% |
| Russia | 53 | 0.1% |
| Saudi Arabia | 31 | 0.0% |
| South Africa | 2 | 0.0% |
| South America | 8,101 | 11.3% |
| South Central Asia | 280 | 0.4% |
| South Eastern Asia | 278 | 0.4% |
| Southern Europe | 443 | 0.6% |
| Spain | 23 | 0.0% |
| Sri Lanka | 23 | 0.0% |
| St. Vincent and the Grenadines | 93 | 0.1% |
| Sweden | 13 | 0.0% |
| Switzerland | 17 | 0.0% |
| Taiwan | 10 | 0.0% |
| Thailand | 7 | 0.0% |
| Trinidad and Tobago | 788 | 1.1% |
| Turkey | 60 | 0.1% |
| Ukraine | 46 | 0.1% |
| Uruguay | 190 | 0.3% |
| Uzbekistan | 41 | 0.1% |
| Venezuela | 1,797 | 2.5% |
| Vietnam | 107 | 0.2% |
| West Indies | 12 | 0.0% |
| Western Africa | 18 | 0.0% |
| Western Asia | 190 | 0.3% |
| Western Europe | 204 | 0.3% | View All 93 Rows |
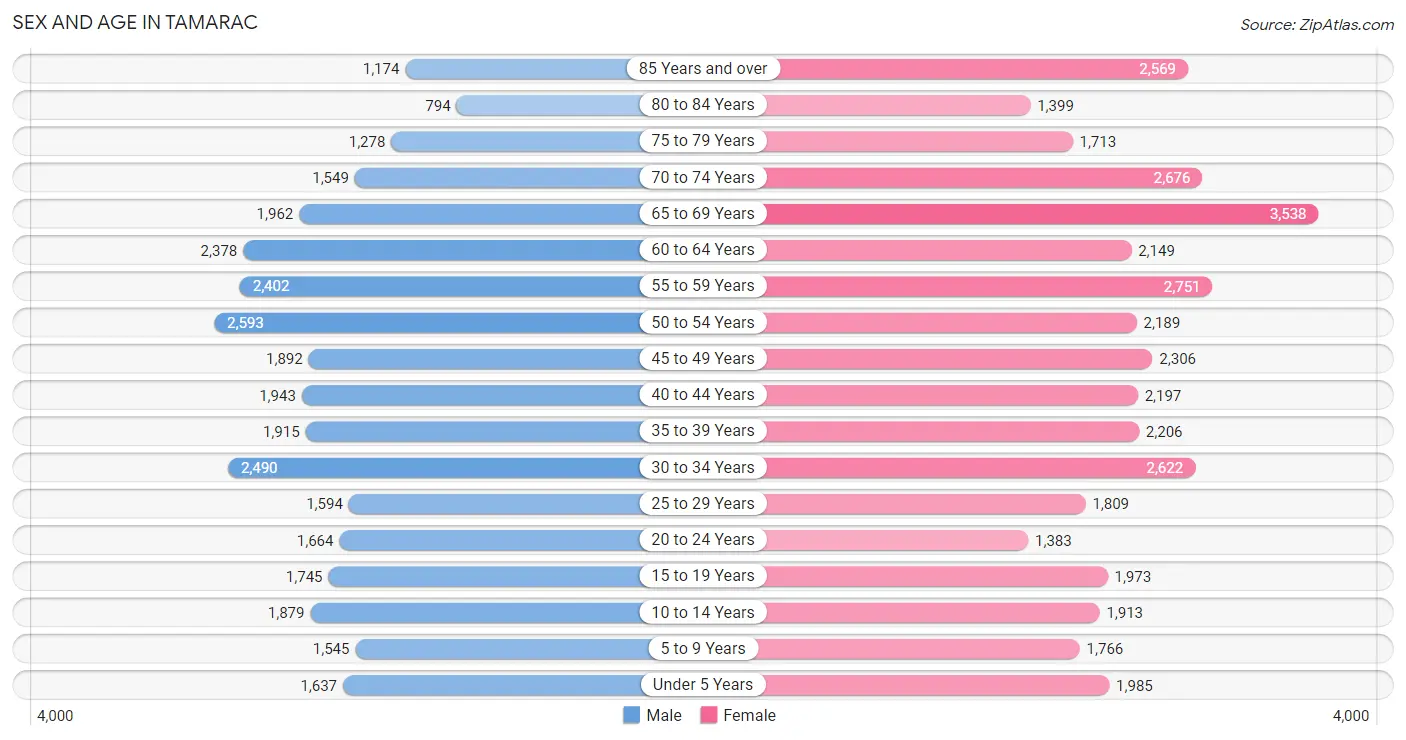
Sex and Age in Tamarac
Sex and Age in Tamarac
The most populous age groups in Tamarac are 50 to 54 Years (2,593 | 8.0%) for men and 65 to 69 Years (3,538 | 9.0%) for women.
| Age Bracket | Male | Female |
| Under 5 Years | 1,637 (5.1%) | 1,985 (5.1%) |
| 5 to 9 Years | 1,545 (4.8%) | 1,766 (4.5%) |
| 10 to 14 Years | 1,879 (5.8%) | 1,913 (4.9%) |
| 15 to 19 Years | 1,745 (5.4%) | 1,973 (5.0%) |
| 20 to 24 Years | 1,664 (5.1%) | 1,383 (3.5%) |
| 25 to 29 Years | 1,594 (4.9%) | 1,809 (4.6%) |
| 30 to 34 Years | 2,490 (7.7%) | 2,622 (6.7%) |
| 35 to 39 Years | 1,915 (5.9%) | 2,206 (5.6%) |
| 40 to 44 Years | 1,943 (6.0%) | 2,197 (5.6%) |
| 45 to 49 Years | 1,892 (5.8%) | 2,306 (5.9%) |
| 50 to 54 Years | 2,593 (8.0%) | 2,189 (5.6%) |
| 55 to 59 Years | 2,402 (7.4%) | 2,751 (7.0%) |
| 60 to 64 Years | 2,378 (7.3%) | 2,149 (5.5%) |
| 65 to 69 Years | 1,962 (6.0%) | 3,538 (9.0%) |
| 70 to 74 Years | 1,549 (4.8%) | 2,676 (6.8%) |
| 75 to 79 Years | 1,278 (3.9%) | 1,713 (4.4%) |
| 80 to 84 Years | 794 (2.5%) | 1,399 (3.6%) |
| 85 Years and over | 1,174 (3.6%) | 2,569 (6.6%) |
| Total | 32,434 (100.0%) | 39,144 (100.0%) |
Families and Households in Tamarac
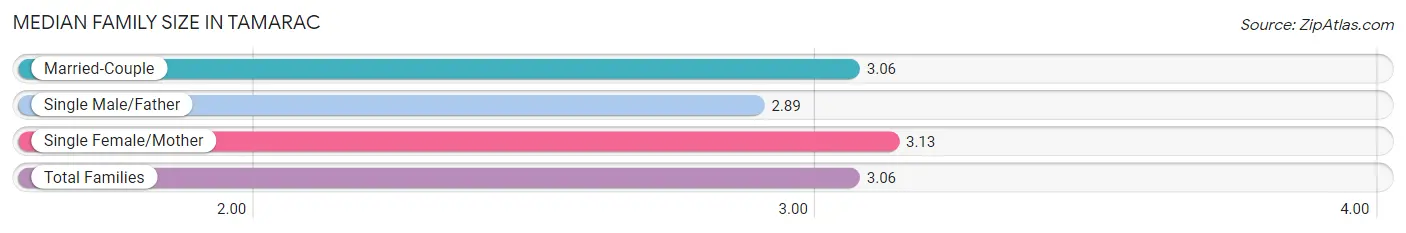
Median Family Size in Tamarac
The median family size in Tamarac is 3.06 persons per family, with single female/mother families (4,669 | 25.7%) accounting for the largest median family size of 3.13 persons per family. On the other hand, single male/father families (2,036 | 11.2%) represent the smallest median family size with 2.89 persons per family.
| Family Type | # Families | Family Size |
| Married-Couple | 11,447 (63.1%) | 3.06 |
| Single Male/Father | 2,036 (11.2%) | 2.89 |
| Single Female/Mother | 4,669 (25.7%) | 3.13 |
| Total Families | 18,152 (100.0%) | 3.06 |
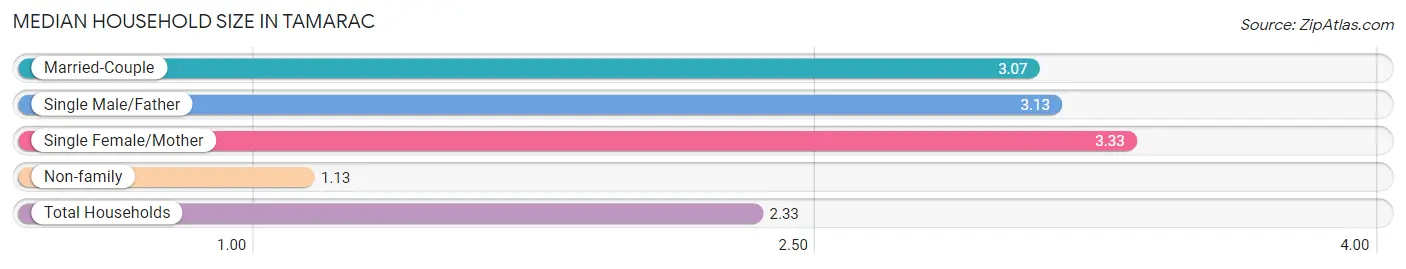
Median Household Size in Tamarac
The median household size in Tamarac is 2.33 persons per household, with single female/mother households (4,669 | 15.3%) accounting for the largest median household size of 3.33 persons per household. non-family households (12,453 | 40.7%) represent the smallest median household size with 1.13 persons per household.
| Household Type | # Households | Household Size |
| Married-Couple | 11,447 (37.4%) | 3.07 |
| Single Male/Father | 2,036 (6.7%) | 3.13 |
| Single Female/Mother | 4,669 (15.3%) | 3.33 |
| Non-family | 12,453 (40.7%) | 1.13 |
| Total Households | 30,605 (100.0%) | 2.33 |
Household Size by Marriage Status in Tamarac
Out of a total of 30,605 households in Tamarac, 18,152 (59.3%) are family households, while 12,453 (40.7%) are nonfamily households. The most numerous type of family households are 2-person households, comprising 8,575, and the most common type of nonfamily households are 1-person households, comprising 11,146.
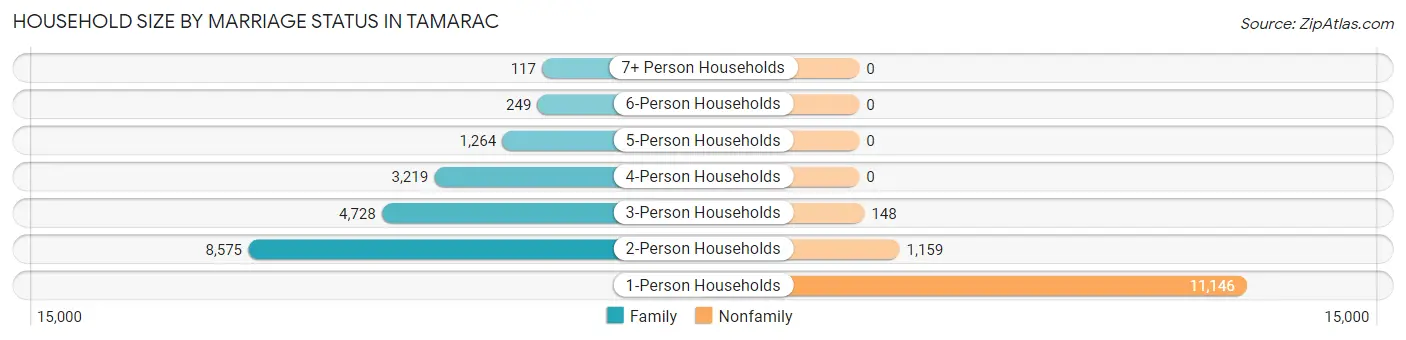
| Household Size | Family Households | Nonfamily Households |
| 1-Person Households | - | 11,146 (36.4%) |
| 2-Person Households | 8,575 (28.0%) | 1,159 (3.8%) |
| 3-Person Households | 4,728 (15.4%) | 148 (0.5%) |
| 4-Person Households | 3,219 (10.5%) | 0 (0.0%) |
| 5-Person Households | 1,264 (4.1%) | 0 (0.0%) |
| 6-Person Households | 249 (0.8%) | 0 (0.0%) |
| 7+ Person Households | 117 (0.4%) | 0 (0.0%) |
| Total | 18,152 (59.3%) | 12,453 (40.7%) |
Female Fertility in Tamarac
Fertility by Age in Tamarac
Average fertility rate in Tamarac is 59.0 births per 1,000 women. Women in the age bracket of 20 to 34 years have the highest fertility rate with 76.0 births per 1,000 women. Women in the age bracket of 20 to 34 years acount for 50.3% of all women with births.
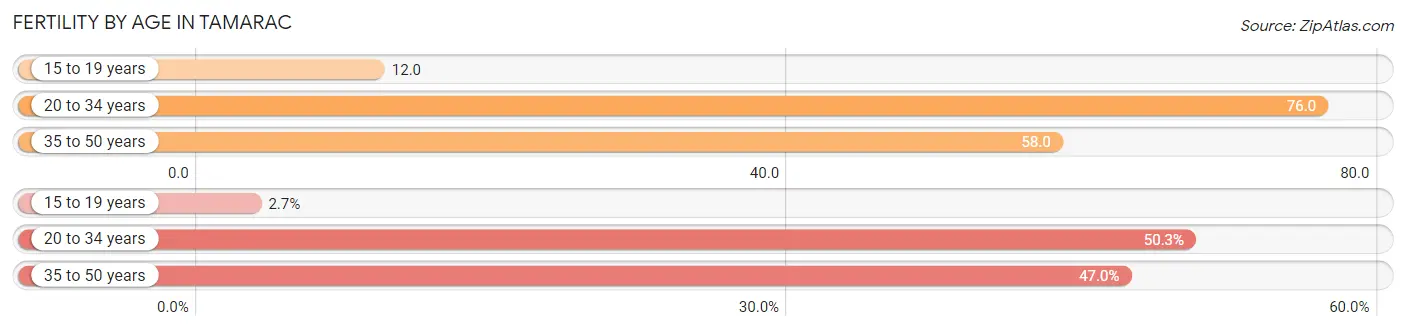
| Age Bracket | Women with Births | Births / 1,000 Women |
| 15 to 19 years | 24 (2.7%) | 12.0 |
| 20 to 34 years | 443 (50.3%) | 76.0 |
| 35 to 50 years | 414 (47.0%) | 58.0 |
| Total | 881 (100.0%) | 59.0 |
Fertility by Age by Marriage Status in Tamarac
50.4% of women with births (881) in Tamarac are married. The highest percentage of unmarried women with births falls into 15 to 19 years age bracket with 100.0% of them unmarried at the time of birth, while the lowest percentage of unmarried women with births belong to 35 to 50 years age bracket with 38.2% of them unmarried.
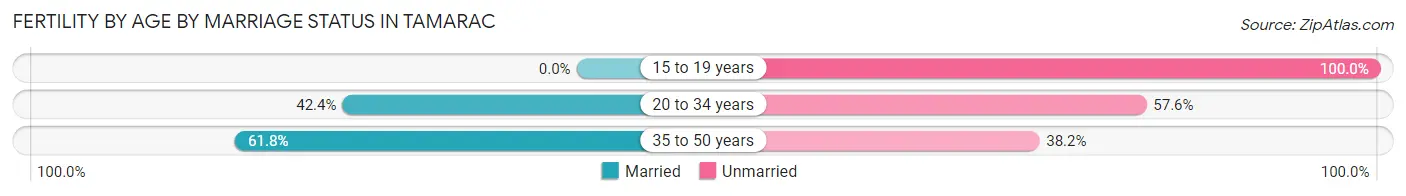
| Age Bracket | Married | Unmarried |
| 15 to 19 years | 0 (0.0%) | 24 (100.0%) |
| 20 to 34 years | 188 (42.4%) | 255 (57.6%) |
| 35 to 50 years | 256 (61.8%) | 158 (38.2%) |
| Total | 444 (50.4%) | 437 (49.6%) |
Fertility by Education in Tamarac
Average fertility rate in Tamarac is 59.0 births per 1,000 women. Women with the education attainment of graduate degree have the highest fertility rate of 75.0 births per 1,000 women, while women with the education attainment of less than high school have the lowest fertility at 31.0 births per 1,000 women. Women with the education attainment of college or associate's degree represent 42.2% of all women with births.
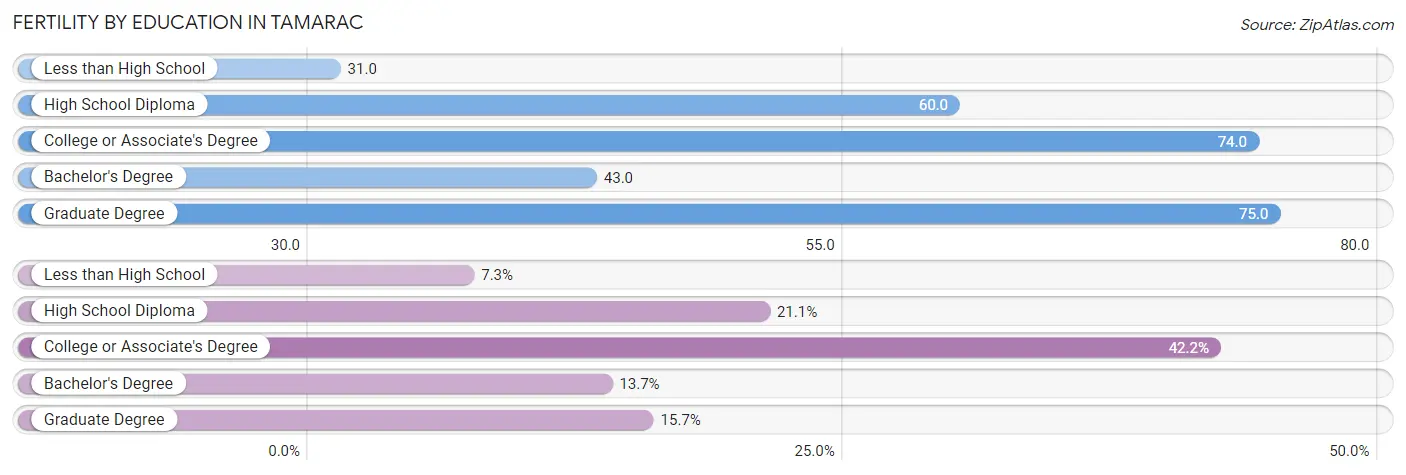
| Educational Attainment | Women with Births | Births / 1,000 Women |
| Less than High School | 64 (7.3%) | 31.0 |
| High School Diploma | 186 (21.1%) | 60.0 |
| College or Associate's Degree | 372 (42.2%) | 74.0 |
| Bachelor's Degree | 121 (13.7%) | 43.0 |
| Graduate Degree | 138 (15.7%) | 75.0 |
| Total | 881 (100.0%) | 59.0 |
Fertility by Education by Marriage Status in Tamarac
49.6% of women with births in Tamarac are unmarried. Women with the educational attainment of graduate degree are most likely to be married with 88.4% of them married at childbirth, while women with the educational attainment of college or associate's degree are least likely to be married with 80.4% of them unmarried at childbirth.
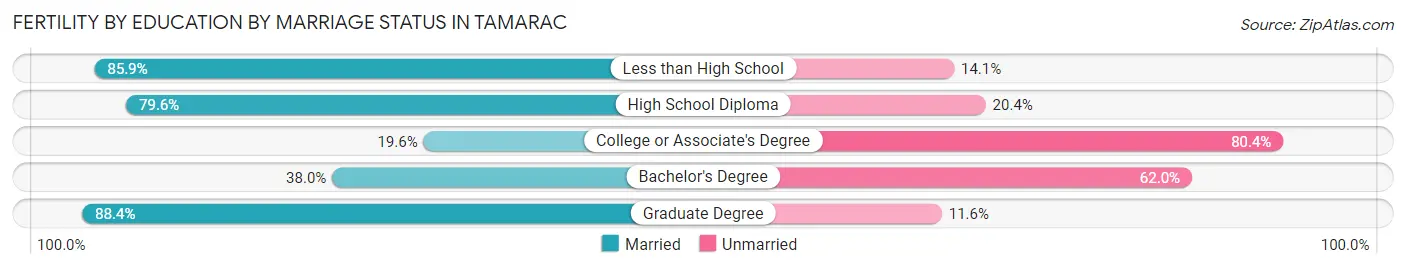
| Educational Attainment | Married | Unmarried |
| Less than High School | 55 (85.9%) | 9 (14.1%) |
| High School Diploma | 148 (79.6%) | 38 (20.4%) |
| College or Associate's Degree | 73 (19.6%) | 299 (80.4%) |
| Bachelor's Degree | 46 (38.0%) | 75 (62.0%) |
| Graduate Degree | 122 (88.4%) | 16 (11.6%) |
| Total | 444 (50.4%) | 437 (49.6%) |
Employment Characteristics in Tamarac
Employment by Class of Employer in Tamarac
Among the 33,926 employed individuals in Tamarac, private company employees (24,439 | 72.0%), local government employees (2,895 | 8.5%), and not-for-profit organizations (2,276 | 6.7%) make up the most common classes of employment.
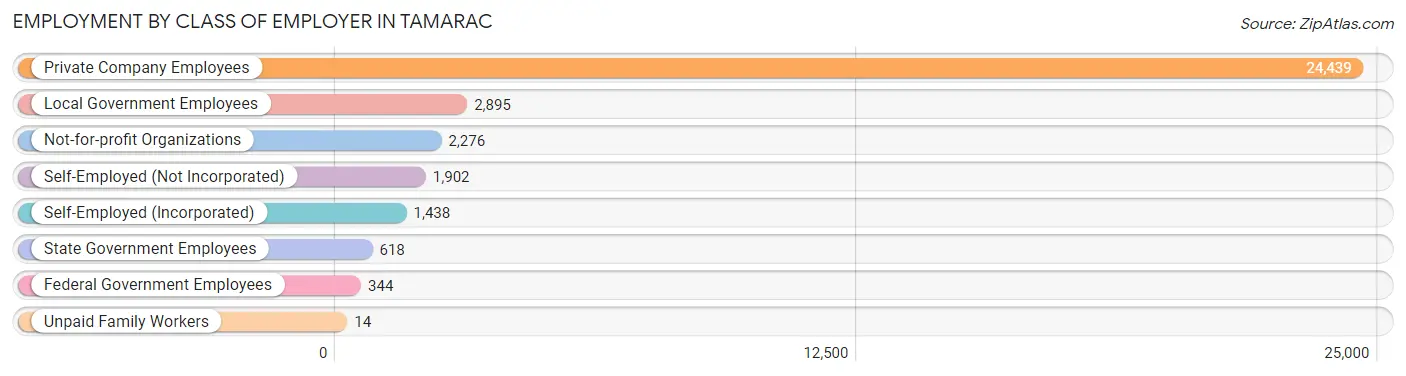
| Employer Class | # Employees | % Employees |
| Private Company Employees | 24,439 | 72.0% |
| Self-Employed (Incorporated) | 1,438 | 4.2% |
| Self-Employed (Not Incorporated) | 1,902 | 5.6% |
| Not-for-profit Organizations | 2,276 | 6.7% |
| Local Government Employees | 2,895 | 8.5% |
| State Government Employees | 618 | 1.8% |
| Federal Government Employees | 344 | 1.0% |
| Unpaid Family Workers | 14 | 0.0% |
| Total | 33,926 | 100.0% |
Employment Status by Age in Tamarac
According to the labor force statistics for Tamarac, out of the total population over 16 years of age (60,341), 61.1% or 36,868 individuals are in the labor force, with 5.9% or 2,175 of them unemployed. The age group with the highest labor force participation rate is 25 to 29 years, with 90.2% or 3,070 individuals in the labor force. Within the labor force, the 16 to 19 years age range has the highest percentage of unemployed individuals, with 24.9% or 236 of them being unemployed.
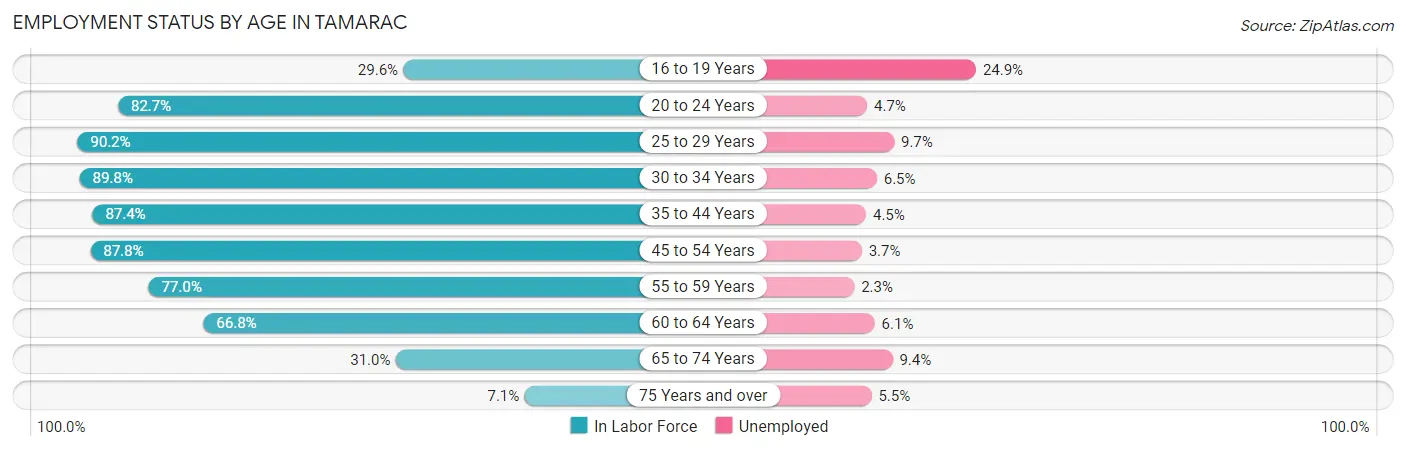
| Age Bracket | In Labor Force | Unemployed |
| 16 to 19 Years | 949 (29.6%) | 236 (24.9%) |
| 20 to 24 Years | 2,520 (82.7%) | 118 (4.7%) |
| 25 to 29 Years | 3,070 (90.2%) | 298 (9.7%) |
| 30 to 34 Years | 4,591 (89.8%) | 298 (6.5%) |
| 35 to 44 Years | 7,220 (87.4%) | 325 (4.5%) |
| 45 to 54 Years | 7,884 (87.8%) | 292 (3.7%) |
| 55 to 59 Years | 3,968 (77.0%) | 91 (2.3%) |
| 60 to 64 Years | 3,024 (66.8%) | 184 (6.1%) |
| 65 to 74 Years | 3,015 (31.0%) | 283 (9.4%) |
| 75 Years and over | 634 (7.1%) | 35 (5.5%) |
| Total | 36,868 (61.1%) | 2,175 (5.9%) |
Employment Status by Educational Attainment in Tamarac
According to labor force statistics for Tamarac, 84.0% of individuals (29,766) out of the total population between 25 and 64 years of age (35,436) are in the labor force, with 5.0% or 1,488 of them being unemployed. The group with the highest labor force participation rate are those with the educational attainment of bachelor's degree or higher, with 88.4% or 9,584 individuals in the labor force. Within the labor force, individuals with high school diploma education have the highest percentage of unemployment, with 6.6% or 495 of them being unemployed.
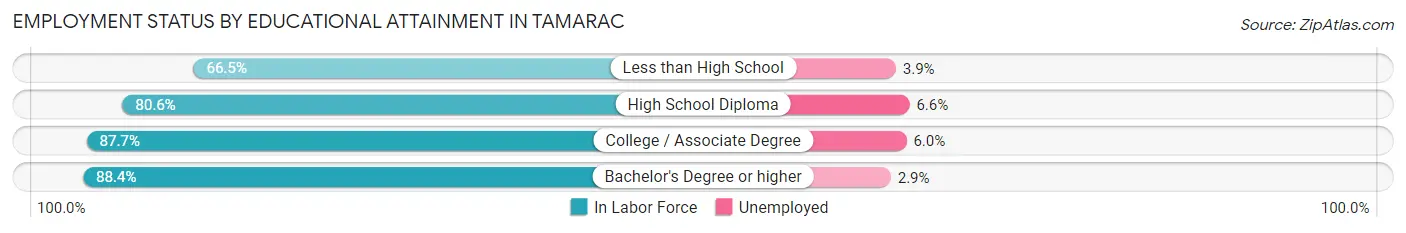
| Educational Attainment | In Labor Force | Unemployed |
| Less than High School | 2,289 (66.5%) | 134 (3.9%) |
| High School Diploma | 7,498 (80.6%) | 614 (6.6%) |
| College / Associate Degree | 10,392 (87.7%) | 711 (6.0%) |
| Bachelor's Degree or higher | 9,584 (88.4%) | 314 (2.9%) |
| Total | 29,766 (84.0%) | 1,772 (5.0%) |
Employment Occupations by Sex in Tamarac
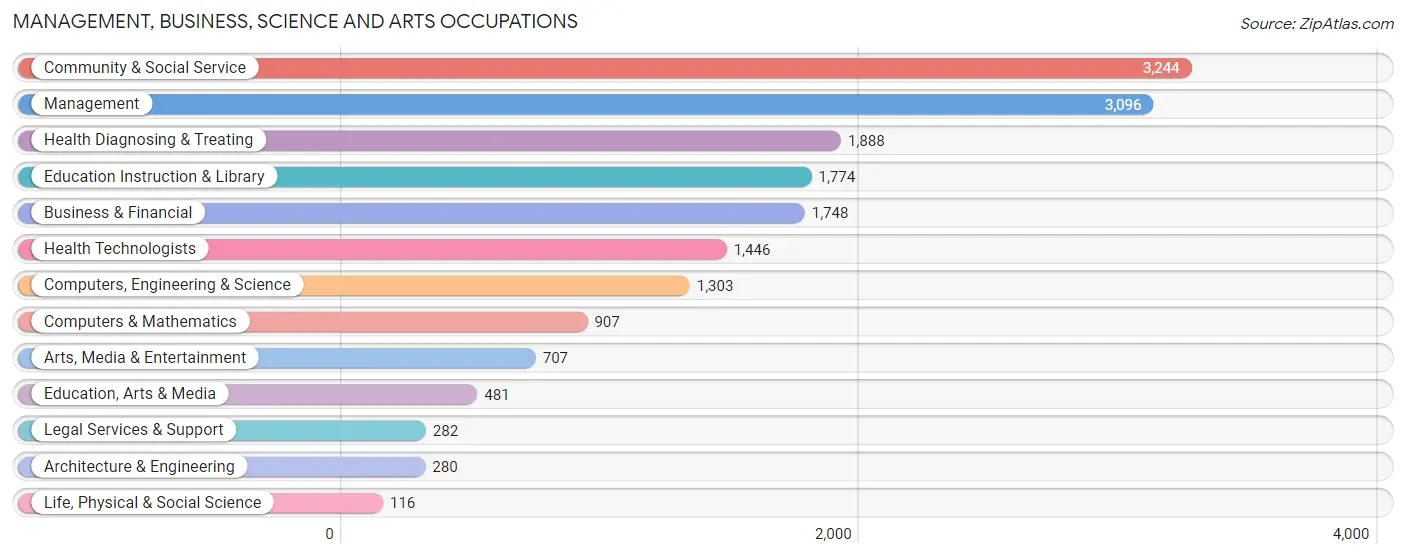
Management, Business, Science and Arts Occupations
The most common Management, Business, Science and Arts occupations in Tamarac are Community & Social Service (3,244 | 9.3%), Management (3,096 | 8.9%), Health Diagnosing & Treating (1,888 | 5.4%), Education Instruction & Library (1,774 | 5.1%), and Business & Financial (1,748 | 5.0%).
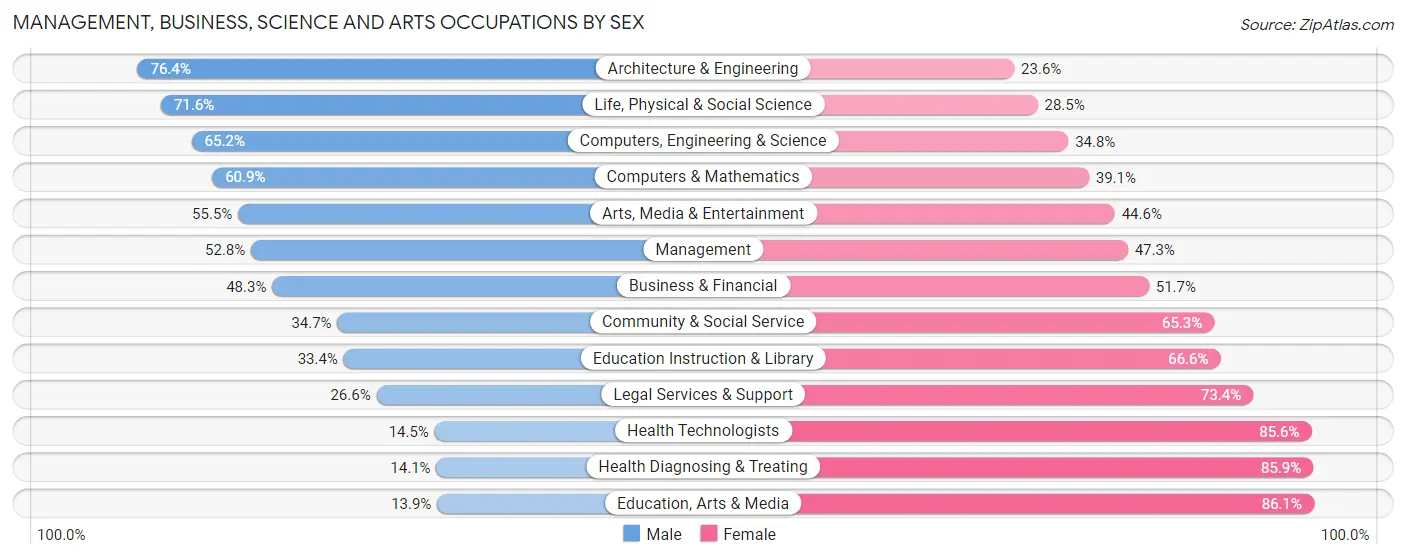
Management, Business, Science and Arts Occupations by Sex
Within the Management, Business, Science and Arts occupations in Tamarac, the most male-oriented occupations are Architecture & Engineering (76.4%), Life, Physical & Social Science (71.6%), and Computers, Engineering & Science (65.2%), while the most female-oriented occupations are Education, Arts & Media (86.1%), Health Diagnosing & Treating (85.9%), and Health Technologists (85.6%).
| Occupation | Male | Female |
| Management | 1,633 (52.7%) | 1,463 (47.2%) |
| Business & Financial | 845 (48.3%) | 903 (51.7%) |
| Computers, Engineering & Science | 849 (65.2%) | 454 (34.8%) |
| Computers & Mathematics | 552 (60.9%) | 355 (39.1%) |
| Architecture & Engineering | 214 (76.4%) | 66 (23.6%) |
| Life, Physical & Social Science | 83 (71.6%) | 33 (28.4%) |
| Community & Social Service | 1,127 (34.7%) | 2,117 (65.3%) |
| Education, Arts & Media | 67 (13.9%) | 414 (86.1%) |
| Legal Services & Support | 75 (26.6%) | 207 (73.4%) |
| Education Instruction & Library | 593 (33.4%) | 1,181 (66.6%) |
| Arts, Media & Entertainment | 392 (55.4%) | 315 (44.6%) |
| Health Diagnosing & Treating | 266 (14.1%) | 1,622 (85.9%) |
| Health Technologists | 209 (14.4%) | 1,237 (85.6%) |
| Total (Category) | 4,720 (41.8%) | 6,559 (58.2%) |
| Total (Overall) | 17,541 (50.5%) | 17,171 (49.5%) |
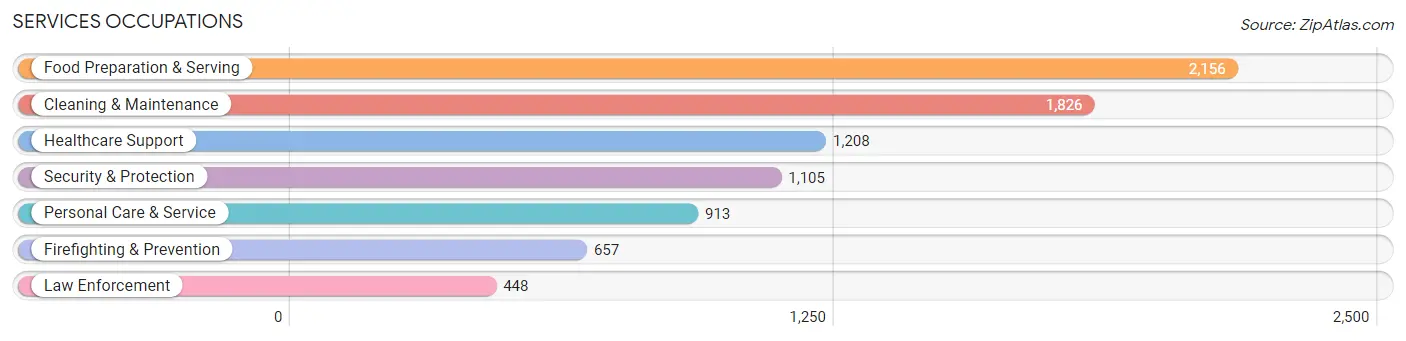
Services Occupations
The most common Services occupations in Tamarac are Food Preparation & Serving (2,156 | 6.2%), Cleaning & Maintenance (1,826 | 5.3%), Healthcare Support (1,208 | 3.5%), Security & Protection (1,105 | 3.2%), and Personal Care & Service (913 | 2.6%).
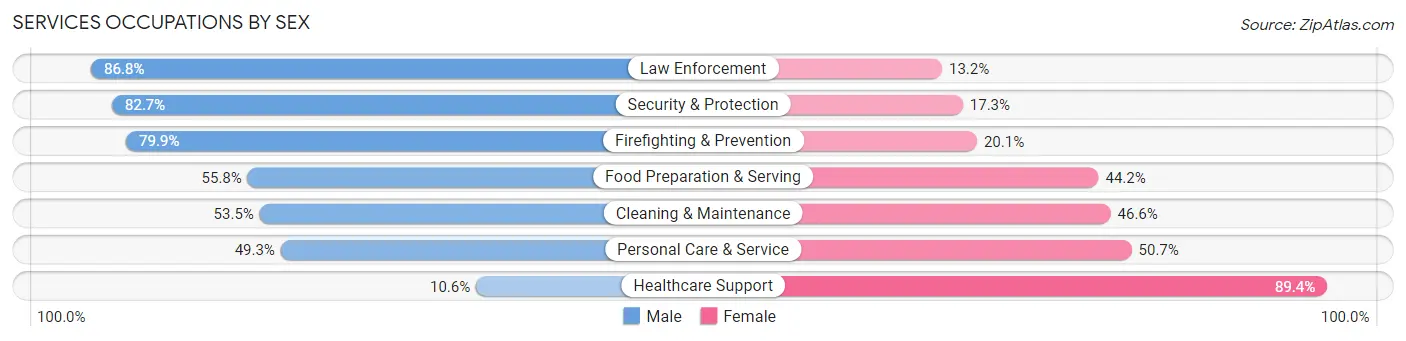
Services Occupations by Sex
Within the Services occupations in Tamarac, the most male-oriented occupations are Law Enforcement (86.8%), Security & Protection (82.7%), and Firefighting & Prevention (79.9%), while the most female-oriented occupations are Healthcare Support (89.4%), Personal Care & Service (50.7%), and Cleaning & Maintenance (46.6%).
| Occupation | Male | Female |
| Healthcare Support | 128 (10.6%) | 1,080 (89.4%) |
| Security & Protection | 914 (82.7%) | 191 (17.3%) |
| Firefighting & Prevention | 525 (79.9%) | 132 (20.1%) |
| Law Enforcement | 389 (86.8%) | 59 (13.2%) |
| Food Preparation & Serving | 1,204 (55.8%) | 952 (44.2%) |
| Cleaning & Maintenance | 976 (53.4%) | 850 (46.6%) |
| Personal Care & Service | 450 (49.3%) | 463 (50.7%) |
| Total (Category) | 3,672 (50.9%) | 3,536 (49.1%) |
| Total (Overall) | 17,541 (50.5%) | 17,171 (49.5%) |
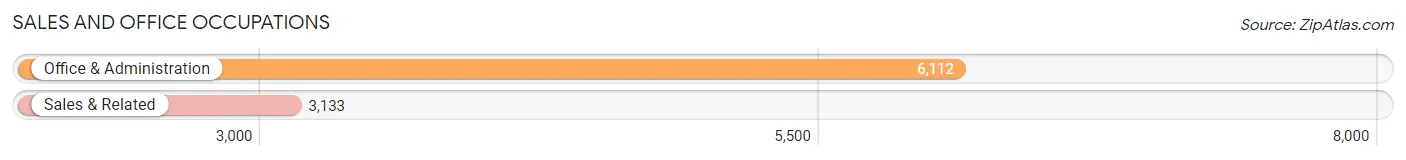
Sales and Office Occupations
The most common Sales and Office occupations in Tamarac are Office & Administration (6,112 | 17.6%), and Sales & Related (3,133 | 9.0%).
Sales and Office Occupations by Sex
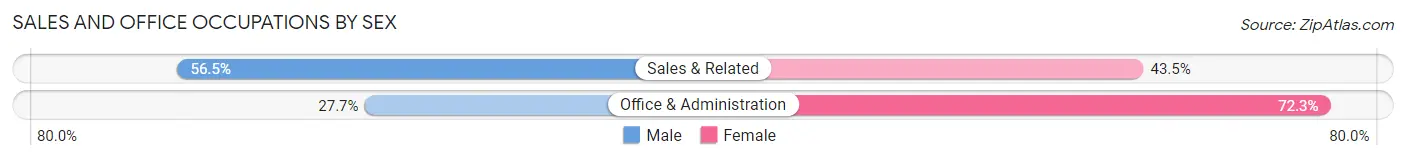
| Occupation | Male | Female |
| Sales & Related | 1,769 (56.5%) | 1,364 (43.5%) |
| Office & Administration | 1,695 (27.7%) | 4,417 (72.3%) |
| Total (Category) | 3,464 (37.5%) | 5,781 (62.5%) |
| Total (Overall) | 17,541 (50.5%) | 17,171 (49.5%) |
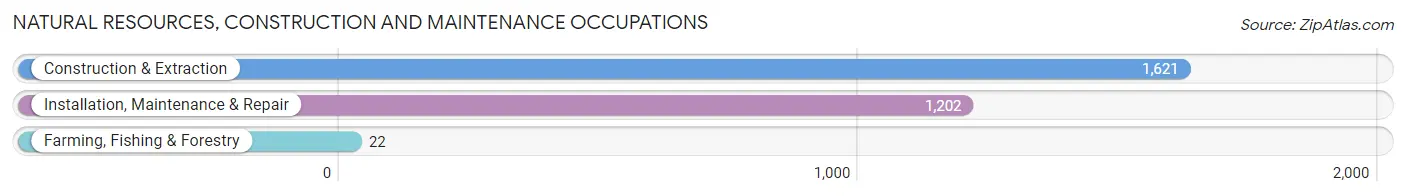
Natural Resources, Construction and Maintenance Occupations
The most common Natural Resources, Construction and Maintenance occupations in Tamarac are Construction & Extraction (1,621 | 4.7%), Installation, Maintenance & Repair (1,202 | 3.5%), and Farming, Fishing & Forestry (22 | 0.1%).
Natural Resources, Construction and Maintenance Occupations by Sex
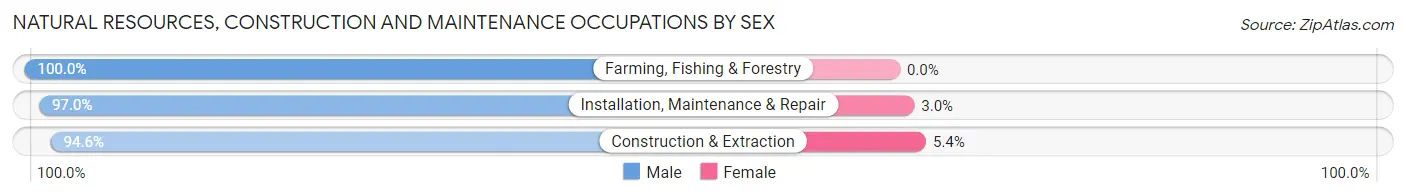
| Occupation | Male | Female |
| Farming, Fishing & Forestry | 22 (100.0%) | 0 (0.0%) |
| Construction & Extraction | 1,533 (94.6%) | 88 (5.4%) |
| Installation, Maintenance & Repair | 1,166 (97.0%) | 36 (3.0%) |
| Total (Category) | 2,721 (95.6%) | 124 (4.4%) |
| Total (Overall) | 17,541 (50.5%) | 17,171 (49.5%) |
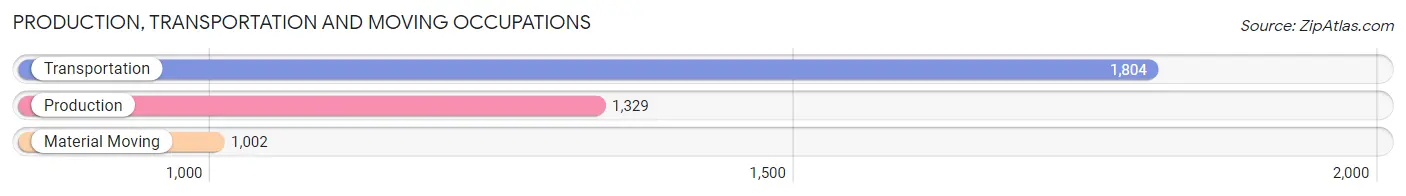
Production, Transportation and Moving Occupations
The most common Production, Transportation and Moving occupations in Tamarac are Transportation (1,804 | 5.2%), Production (1,329 | 3.8%), and Material Moving (1,002 | 2.9%).
Production, Transportation and Moving Occupations by Sex
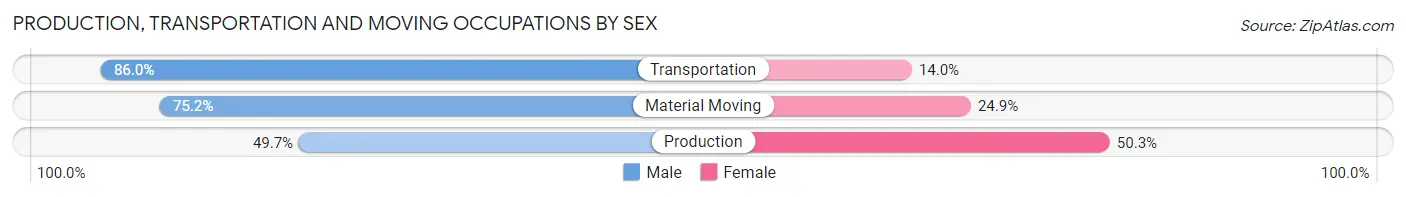
| Occupation | Male | Female |
| Production | 660 (49.7%) | 669 (50.3%) |
| Transportation | 1,551 (86.0%) | 253 (14.0%) |
| Material Moving | 753 (75.1%) | 249 (24.8%) |
| Total (Category) | 2,964 (71.7%) | 1,171 (28.3%) |
| Total (Overall) | 17,541 (50.5%) | 17,171 (49.5%) |
Employment Industries by Sex in Tamarac
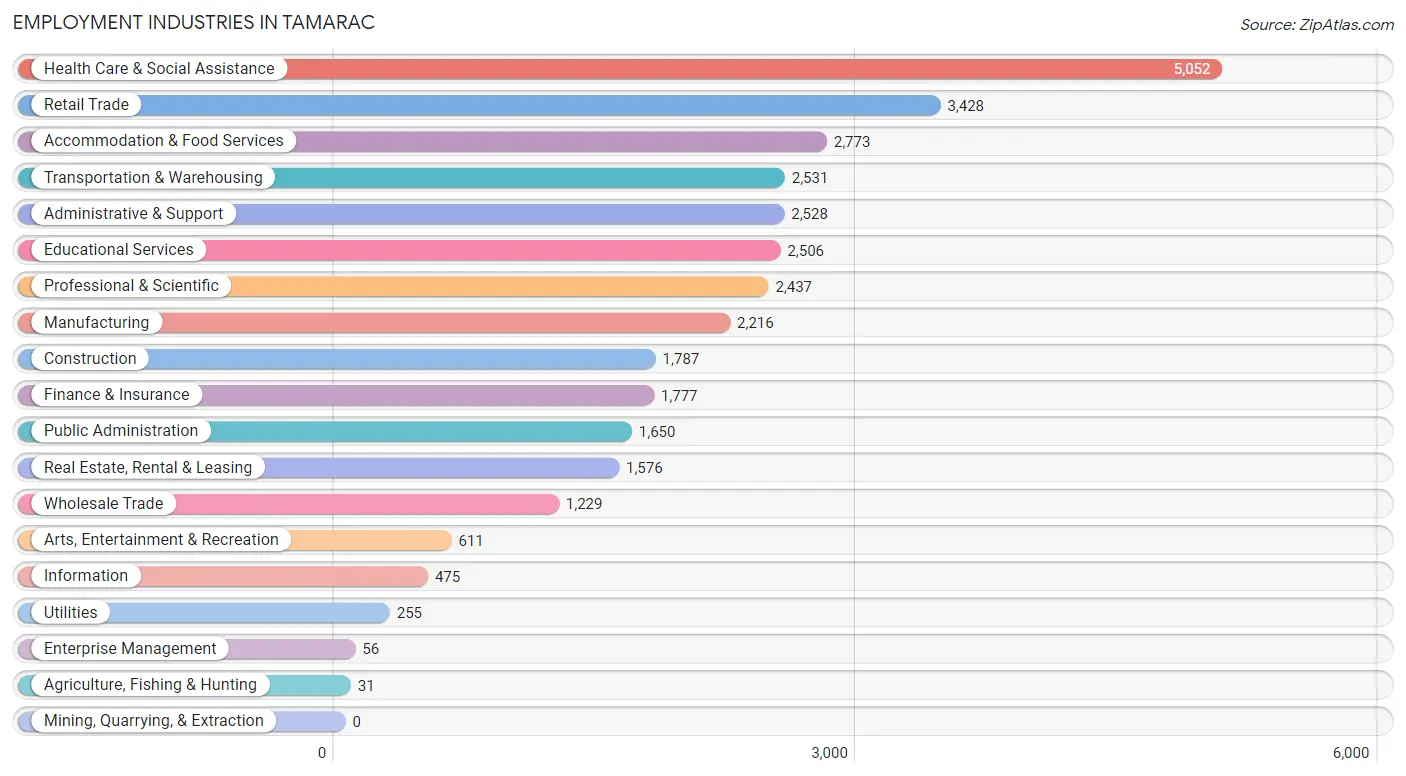
Employment Industries in Tamarac
The major employment industries in Tamarac include Health Care & Social Assistance (5,052 | 14.5%), Retail Trade (3,428 | 9.9%), Accommodation & Food Services (2,773 | 8.0%), Transportation & Warehousing (2,531 | 7.3%), and Administrative & Support (2,528 | 7.3%).
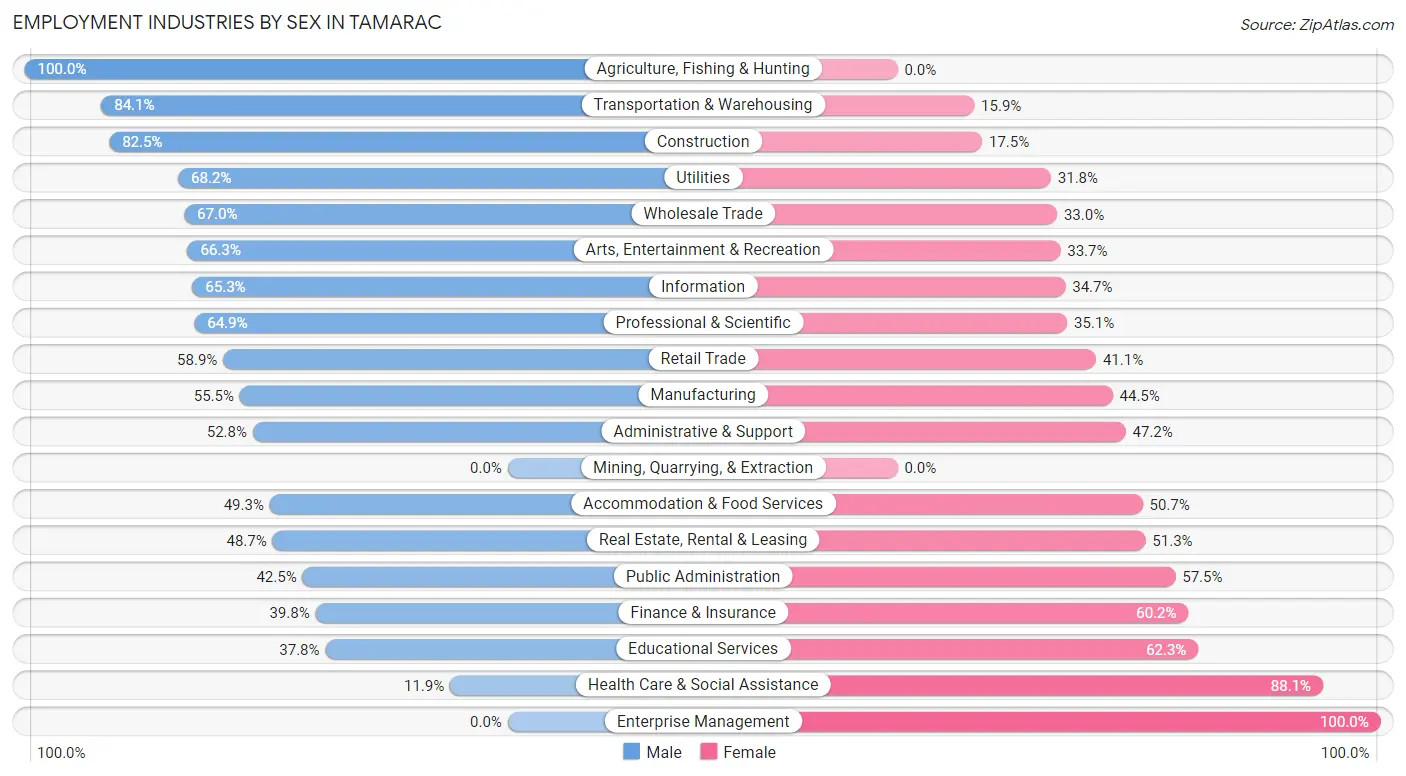
Employment Industries by Sex in Tamarac
The Tamarac industries that see more men than women are Agriculture, Fishing & Hunting (100.0%), Transportation & Warehousing (84.1%), and Construction (82.5%), whereas the industries that tend to have a higher number of women are Enterprise Management (100.0%), Health Care & Social Assistance (88.1%), and Educational Services (62.3%).
| Industry | Male | Female |
| Agriculture, Fishing & Hunting | 31 (100.0%) | 0 (0.0%) |
| Mining, Quarrying, & Extraction | 0 (0.0%) | 0 (0.0%) |
| Construction | 1,474 (82.5%) | 313 (17.5%) |
| Manufacturing | 1,229 (55.5%) | 987 (44.5%) |
| Wholesale Trade | 823 (67.0%) | 406 (33.0%) |
| Retail Trade | 2,019 (58.9%) | 1,409 (41.1%) |
| Transportation & Warehousing | 2,129 (84.1%) | 402 (15.9%) |
| Utilities | 174 (68.2%) | 81 (31.8%) |
| Information | 310 (65.3%) | 165 (34.7%) |
| Finance & Insurance | 707 (39.8%) | 1,070 (60.2%) |
| Real Estate, Rental & Leasing | 767 (48.7%) | 809 (51.3%) |
| Professional & Scientific | 1,581 (64.9%) | 856 (35.1%) |
| Enterprise Management | 0 (0.0%) | 56 (100.0%) |
| Administrative & Support | 1,334 (52.8%) | 1,194 (47.2%) |
| Educational Services | 946 (37.8%) | 1,560 (62.3%) |
| Health Care & Social Assistance | 603 (11.9%) | 4,449 (88.1%) |
| Arts, Entertainment & Recreation | 405 (66.3%) | 206 (33.7%) |
| Accommodation & Food Services | 1,366 (49.3%) | 1,407 (50.7%) |
| Public Administration | 701 (42.5%) | 949 (57.5%) |
| Total | 17,541 (50.5%) | 17,171 (49.5%) |
Education in Tamarac
School Enrollment in Tamarac
The most common levels of schooling among the 15,054 students in Tamarac are college / undergraduate (3,544 | 23.5%), high school (3,195 | 21.2%), and middle school (3,086 | 20.5%).
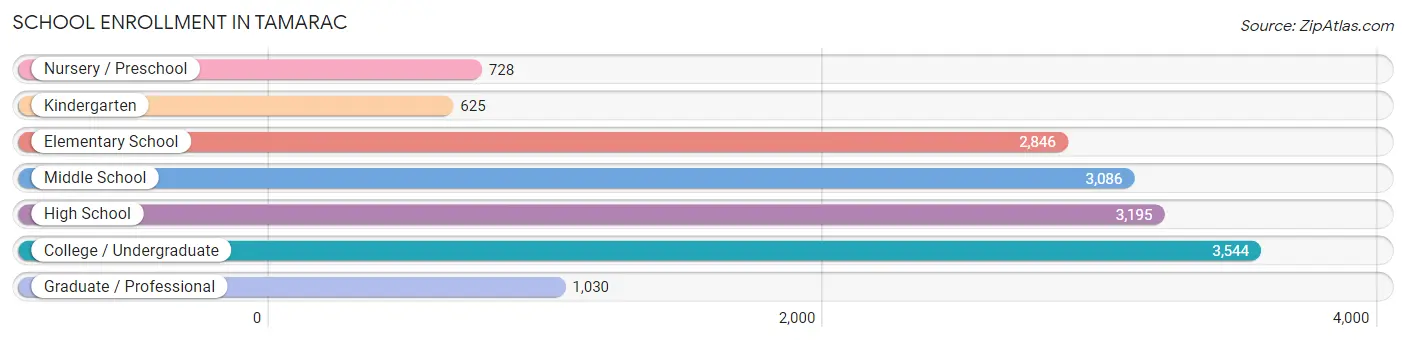
| School Level | # Students | % Students |
| Nursery / Preschool | 728 | 4.8% |
| Kindergarten | 625 | 4.2% |
| Elementary School | 2,846 | 18.9% |
| Middle School | 3,086 | 20.5% |
| High School | 3,195 | 21.2% |
| College / Undergraduate | 3,544 | 23.5% |
| Graduate / Professional | 1,030 | 6.8% |
| Total | 15,054 | 100.0% |
School Enrollment by Age by Funding Source in Tamarac
Out of a total of 15,054 students who are enrolled in schools in Tamarac, 3,658 (24.3%) attend a private institution, while the remaining 11,396 (75.7%) are enrolled in public schools. The age group of 3 to 4 year olds has the highest likelihood of being enrolled in private schools, with 476 (76.5% in the age bracket) enrolled. Conversely, the age group of 10 to 14 year olds has the lowest likelihood of being enrolled in a private school, with 3,199 (85.7% in the age bracket) attending a public institution.
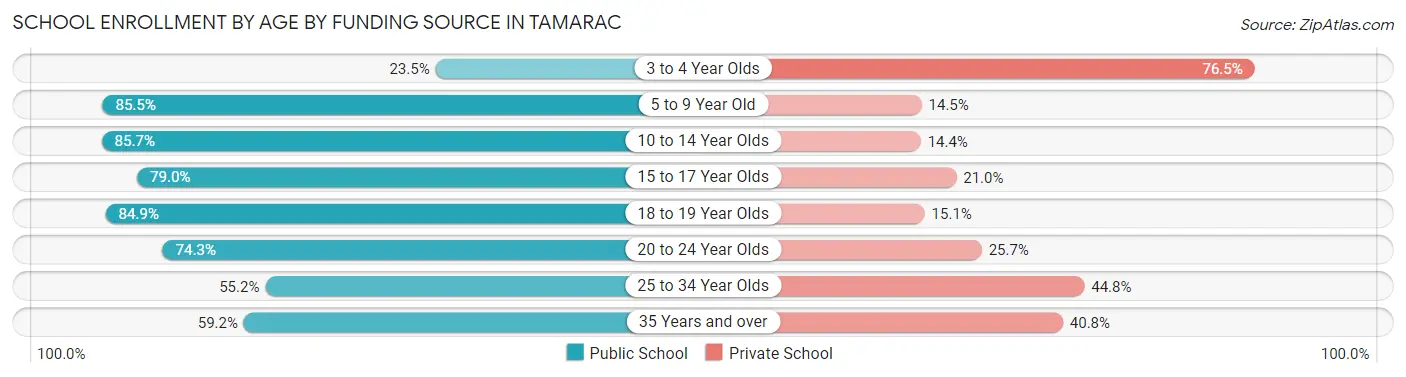
| Age Bracket | Public School | Private School |
| 3 to 4 Year Olds | 146 (23.5%) | 476 (76.5%) |
| 5 to 9 Year Old | 2,815 (85.5%) | 478 (14.5%) |
| 10 to 14 Year Olds | 3,199 (85.7%) | 536 (14.3%) |
| 15 to 17 Year Olds | 1,869 (79.0%) | 496 (21.0%) |
| 18 to 19 Year Olds | 895 (84.9%) | 159 (15.1%) |
| 20 to 24 Year Olds | 838 (74.3%) | 290 (25.7%) |
| 25 to 34 Year Olds | 809 (55.2%) | 657 (44.8%) |
| 35 Years and over | 823 (59.2%) | 568 (40.8%) |
| Total | 11,396 (75.7%) | 3,658 (24.3%) |
Educational Attainment by Field of Study in Tamarac
Business (3,724 | 22.7%), education (2,048 | 12.5%), science & technology (1,857 | 11.3%), engineering (1,298 | 7.9%), and arts & humanities (1,122 | 6.9%) are the most common fields of study among 16,383 individuals in Tamarac who have obtained a bachelor's degree or higher.
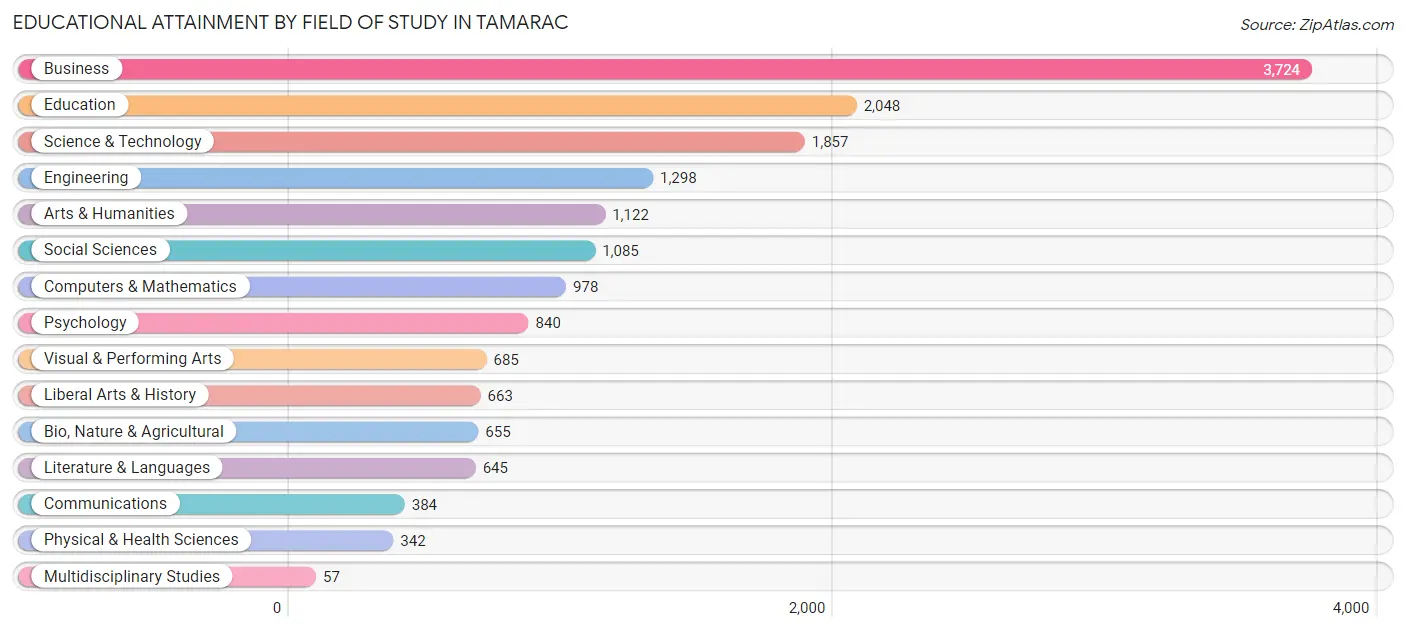
| Field of Study | # Graduates | % Graduates |
| Computers & Mathematics | 978 | 6.0% |
| Bio, Nature & Agricultural | 655 | 4.0% |
| Physical & Health Sciences | 342 | 2.1% |
| Psychology | 840 | 5.1% |
| Social Sciences | 1,085 | 6.6% |
| Engineering | 1,298 | 7.9% |
| Multidisciplinary Studies | 57 | 0.4% |
| Science & Technology | 1,857 | 11.3% |
| Business | 3,724 | 22.7% |
| Education | 2,048 | 12.5% |
| Literature & Languages | 645 | 3.9% |
| Liberal Arts & History | 663 | 4.1% |
| Visual & Performing Arts | 685 | 4.2% |
| Communications | 384 | 2.3% |
| Arts & Humanities | 1,122 | 6.9% |
| Total | 16,383 | 100.0% |
Transportation & Commute in Tamarac
Vehicle Availability by Sex in Tamarac
The most prevalent vehicle ownership categories in Tamarac are males with 2 vehicles (8,590, accounting for 50.0%) and females with 2 vehicles (7,340, making up 51.4%).
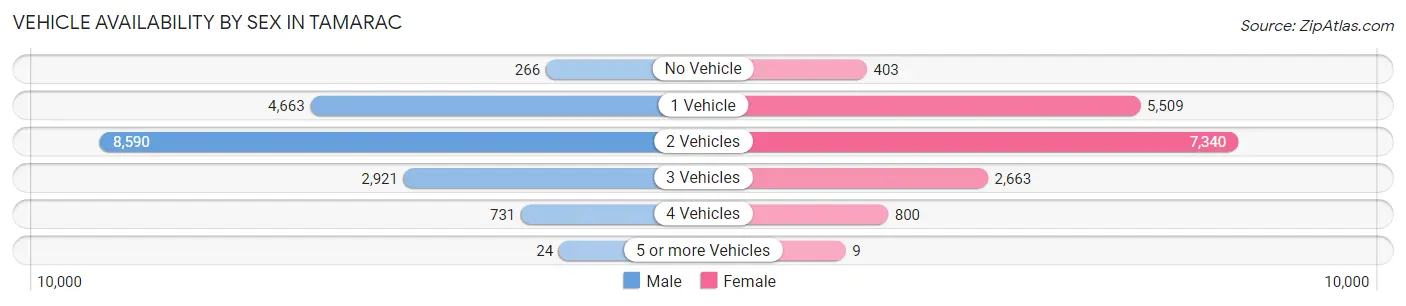
| Vehicles Available | Male | Female |
| No Vehicle | 266 (1.5%) | 403 (2.4%) |
| 1 Vehicle | 4,663 (27.1%) | 5,509 (32.9%) |
| 2 Vehicles | 8,590 (50.0%) | 7,340 (43.9%) |
| 3 Vehicles | 2,921 (17.0%) | 2,663 (15.9%) |
| 4 Vehicles | 731 (4.3%) | 800 (4.8%) |
| 5 or more Vehicles | 24 (0.1%) | 9 (0.1%) |
| Total | 17,195 (100.0%) | 16,724 (100.0%) |
Commute Time in Tamarac
The most frequently occuring commute durations in Tamarac are 30 to 34 minutes (5,739 commuters, 18.7%), 15 to 19 minutes (5,205 commuters, 17.0%), and 20 to 24 minutes (4,525 commuters, 14.8%).
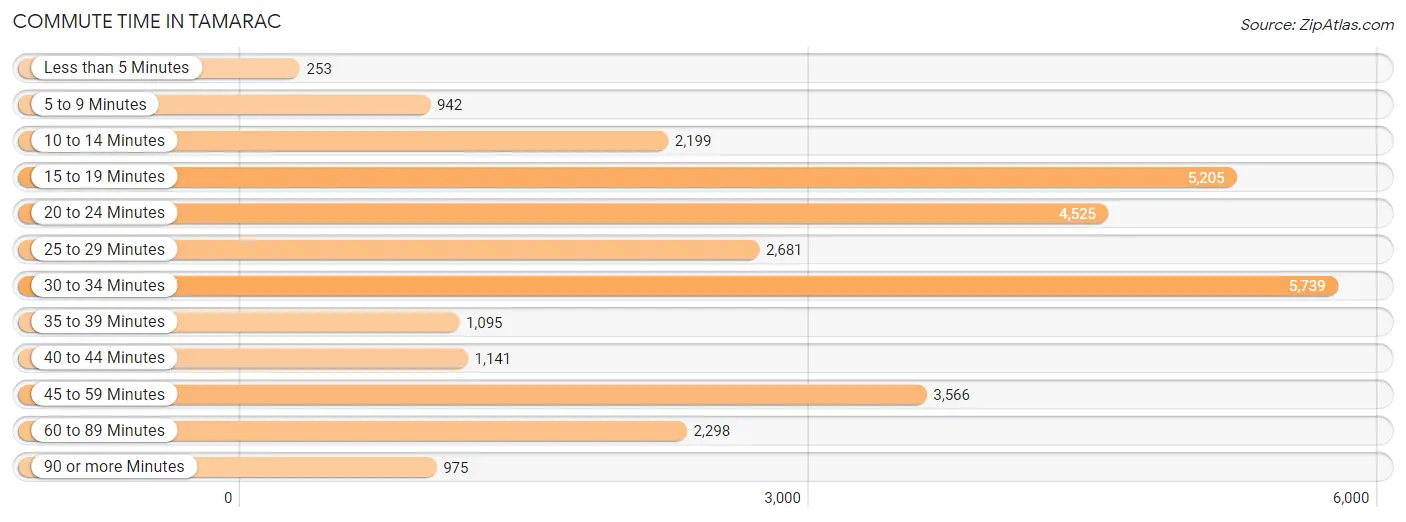
| Commute Time | # Commuters | % Commuters |
| Less than 5 Minutes | 253 | 0.8% |
| 5 to 9 Minutes | 942 | 3.1% |
| 10 to 14 Minutes | 2,199 | 7.2% |
| 15 to 19 Minutes | 5,205 | 17.0% |
| 20 to 24 Minutes | 4,525 | 14.8% |
| 25 to 29 Minutes | 2,681 | 8.8% |
| 30 to 34 Minutes | 5,739 | 18.7% |
| 35 to 39 Minutes | 1,095 | 3.6% |
| 40 to 44 Minutes | 1,141 | 3.7% |
| 45 to 59 Minutes | 3,566 | 11.7% |
| 60 to 89 Minutes | 2,298 | 7.5% |
| 90 or more Minutes | 975 | 3.2% |
Commute Time by Sex in Tamarac
The most common commute times in Tamarac are 30 to 34 minutes (3,249 commuters, 20.6%) for males and 15 to 19 minutes (2,931 commuters, 19.7%) for females.
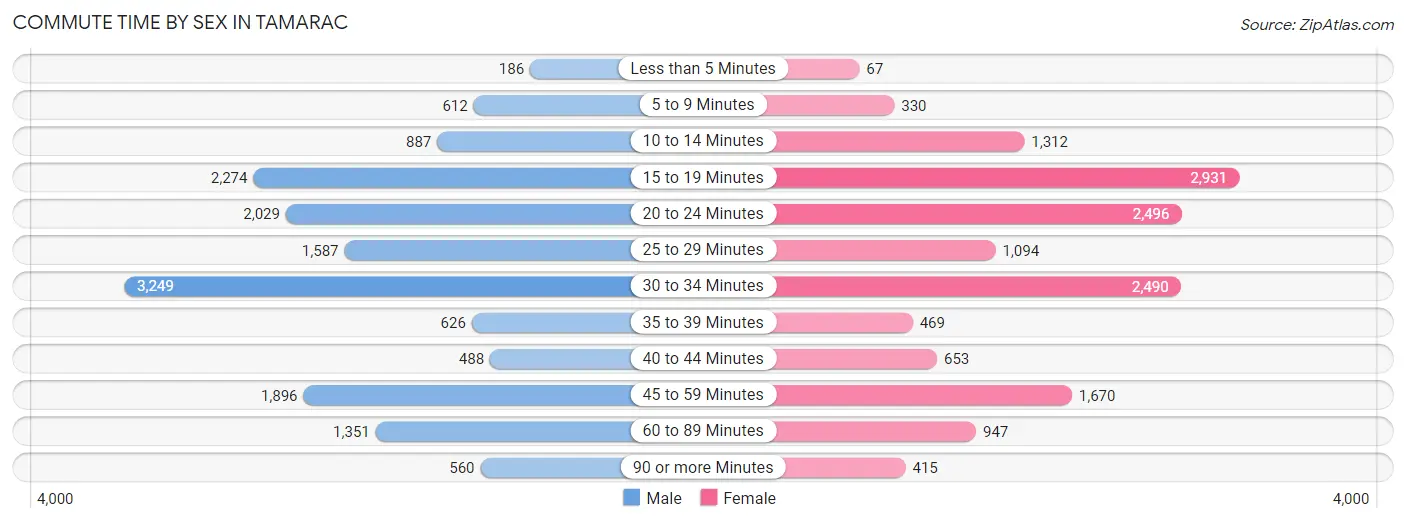
| Commute Time | Male | Female |
| Less than 5 Minutes | 186 (1.2%) | 67 (0.4%) |
| 5 to 9 Minutes | 612 (3.9%) | 330 (2.2%) |
| 10 to 14 Minutes | 887 (5.6%) | 1,312 (8.8%) |
| 15 to 19 Minutes | 2,274 (14.4%) | 2,931 (19.7%) |
| 20 to 24 Minutes | 2,029 (12.9%) | 2,496 (16.8%) |
| 25 to 29 Minutes | 1,587 (10.1%) | 1,094 (7.4%) |
| 30 to 34 Minutes | 3,249 (20.6%) | 2,490 (16.7%) |
| 35 to 39 Minutes | 626 (4.0%) | 469 (3.2%) |
| 40 to 44 Minutes | 488 (3.1%) | 653 (4.4%) |
| 45 to 59 Minutes | 1,896 (12.0%) | 1,670 (11.2%) |
| 60 to 89 Minutes | 1,351 (8.6%) | 947 (6.4%) |
| 90 or more Minutes | 560 (3.6%) | 415 (2.8%) |
Time of Departure to Work by Sex in Tamarac
The most frequent times of departure to work in Tamarac are 8:00 AM to 8:29 AM (2,576, 16.4%) for males and 8:00 AM to 8:29 AM (3,012, 20.3%) for females.
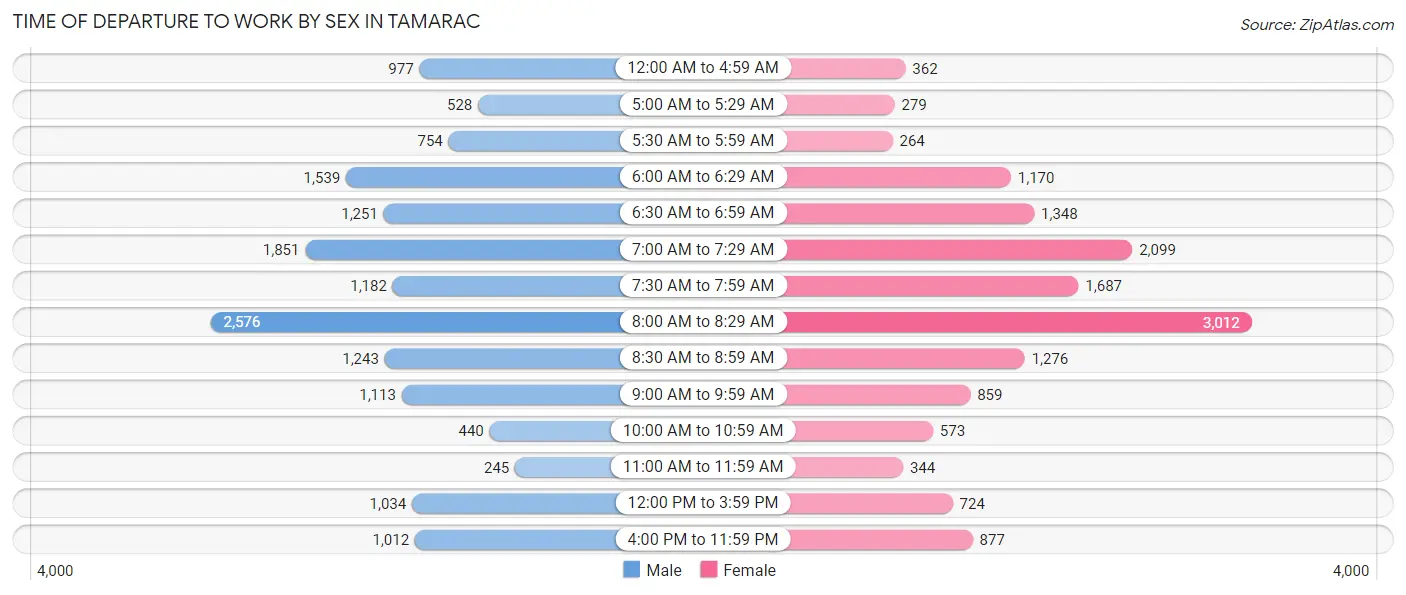
| Time of Departure | Male | Female |
| 12:00 AM to 4:59 AM | 977 (6.2%) | 362 (2.4%) |
| 5:00 AM to 5:29 AM | 528 (3.4%) | 279 (1.9%) |
| 5:30 AM to 5:59 AM | 754 (4.8%) | 264 (1.8%) |
| 6:00 AM to 6:29 AM | 1,539 (9.8%) | 1,170 (7.9%) |
| 6:30 AM to 6:59 AM | 1,251 (8.0%) | 1,348 (9.1%) |
| 7:00 AM to 7:29 AM | 1,851 (11.8%) | 2,099 (14.1%) |
| 7:30 AM to 7:59 AM | 1,182 (7.5%) | 1,687 (11.3%) |
| 8:00 AM to 8:29 AM | 2,576 (16.4%) | 3,012 (20.3%) |
| 8:30 AM to 8:59 AM | 1,243 (7.9%) | 1,276 (8.6%) |
| 9:00 AM to 9:59 AM | 1,113 (7.1%) | 859 (5.8%) |
| 10:00 AM to 10:59 AM | 440 (2.8%) | 573 (3.8%) |
| 11:00 AM to 11:59 AM | 245 (1.6%) | 344 (2.3%) |
| 12:00 PM to 3:59 PM | 1,034 (6.6%) | 724 (4.9%) |
| 4:00 PM to 11:59 PM | 1,012 (6.4%) | 877 (5.9%) |
| Total | 15,745 (100.0%) | 14,874 (100.0%) |
Housing Occupancy in Tamarac
Occupancy by Ownership in Tamarac
Of the total 30,605 dwellings in Tamarac, owner-occupied units account for 22,563 (73.7%), while renter-occupied units make up 8,042 (26.3%).
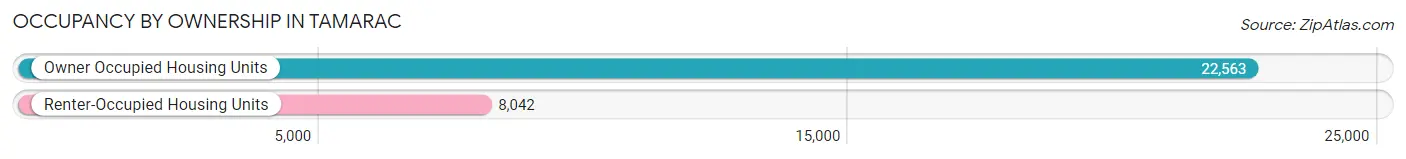
| Occupancy | # Housing Units | % Housing Units |
| Owner Occupied Housing Units | 22,563 | 73.7% |
| Renter-Occupied Housing Units | 8,042 | 26.3% |
| Total Occupied Housing Units | 30,605 | 100.0% |
Occupancy by Household Size in Tamarac
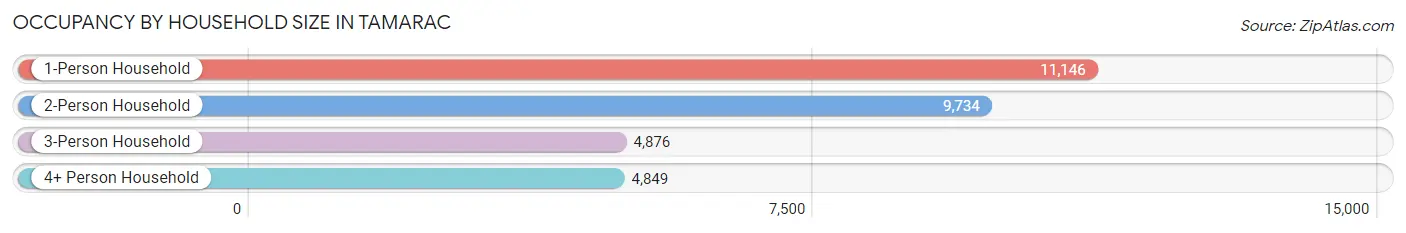
| Household Size | # Housing Units | % Housing Units |
| 1-Person Household | 11,146 | 36.4% |
| 2-Person Household | 9,734 | 31.8% |
| 3-Person Household | 4,876 | 15.9% |
| 4+ Person Household | 4,849 | 15.8% |
| Total Housing Units | 30,605 | 100.0% |
Occupancy by Ownership by Household Size in Tamarac
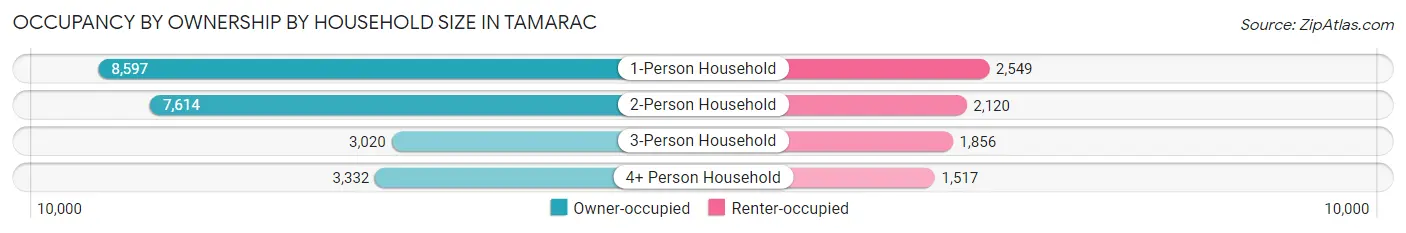
| Household Size | Owner-occupied | Renter-occupied |
| 1-Person Household | 8,597 (77.1%) | 2,549 (22.9%) |
| 2-Person Household | 7,614 (78.2%) | 2,120 (21.8%) |
| 3-Person Household | 3,020 (61.9%) | 1,856 (38.1%) |
| 4+ Person Household | 3,332 (68.7%) | 1,517 (31.3%) |
| Total Housing Units | 22,563 (73.7%) | 8,042 (26.3%) |
Occupancy by Educational Attainment in Tamarac
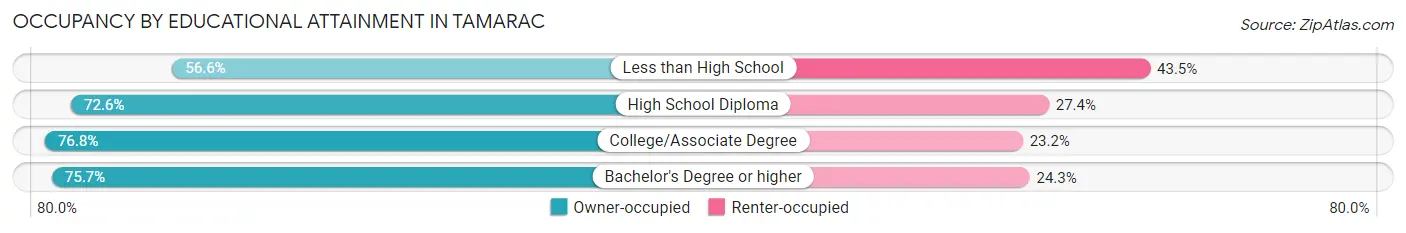
| Household Size | Owner-occupied | Renter-occupied |
| Less than High School | 1,347 (56.6%) | 1,035 (43.4%) |
| High School Diploma | 5,937 (72.6%) | 2,238 (27.4%) |
| College/Associate Degree | 7,704 (76.8%) | 2,333 (23.2%) |
| Bachelor's Degree or higher | 7,575 (75.7%) | 2,436 (24.3%) |
Occupancy by Age of Householder in Tamarac
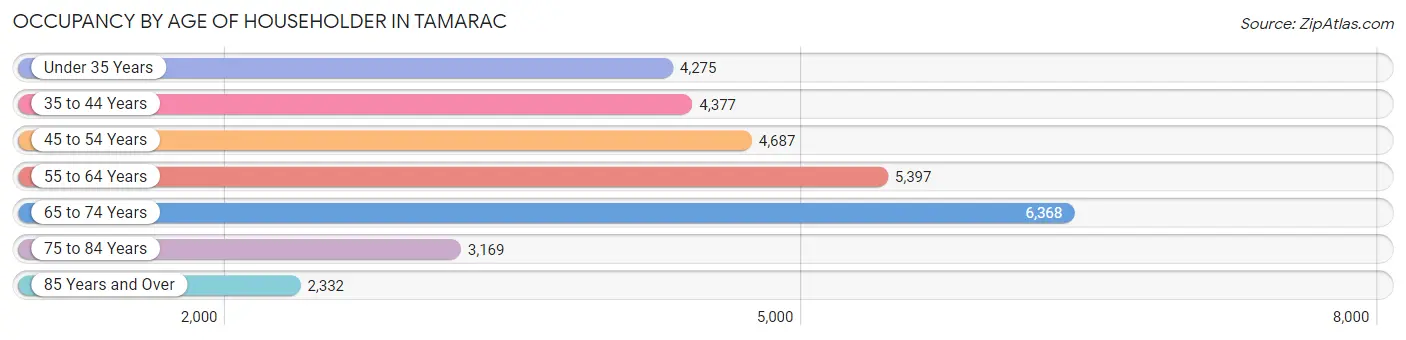
| Age Bracket | # Households | % Households |
| Under 35 Years | 4,275 | 14.0% |
| 35 to 44 Years | 4,377 | 14.3% |
| 45 to 54 Years | 4,687 | 15.3% |
| 55 to 64 Years | 5,397 | 17.6% |
| 65 to 74 Years | 6,368 | 20.8% |
| 75 to 84 Years | 3,169 | 10.3% |
| 85 Years and Over | 2,332 | 7.6% |
| Total | 30,605 | 100.0% |
Housing Finances in Tamarac
Median Income by Occupancy in Tamarac
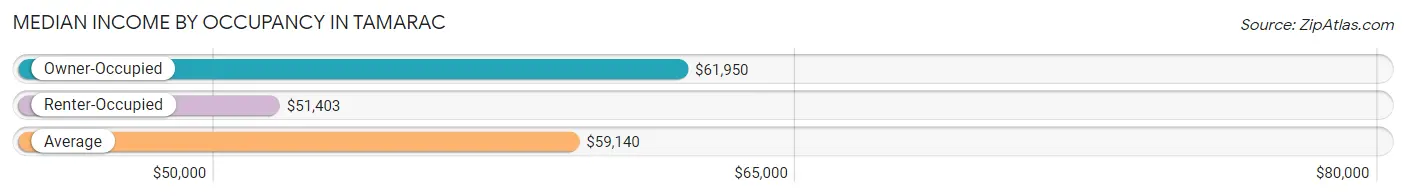
| Occupancy Type | # Households | Median Income |
| Owner-Occupied | 22,563 (73.7%) | $61,950 |
| Renter-Occupied | 8,042 (26.3%) | $51,403 |
| Average | 30,605 (100.0%) | $59,140 |
Occupancy by Householder Income Bracket in Tamarac
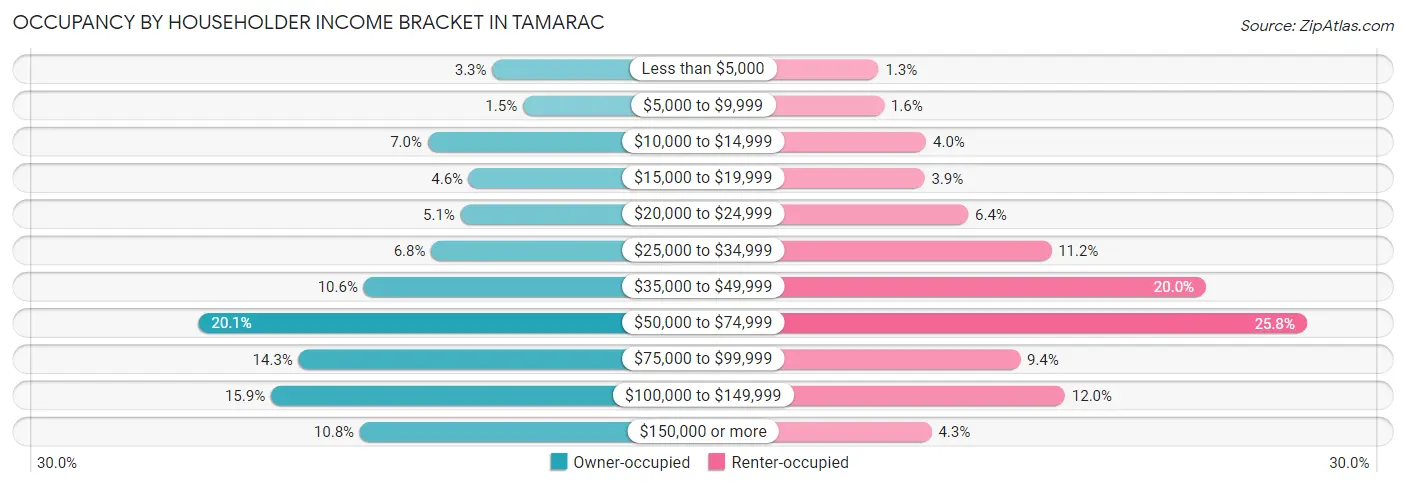
| Income Bracket | Owner-occupied | Renter-occupied |
| Less than $5,000 | 738 (3.3%) | 105 (1.3%) |
| $5,000 to $9,999 | 344 (1.5%) | 130 (1.6%) |
| $10,000 to $14,999 | 1,570 (7.0%) | 324 (4.0%) |
| $15,000 to $19,999 | 1,041 (4.6%) | 317 (3.9%) |
| $20,000 to $24,999 | 1,146 (5.1%) | 517 (6.4%) |
| $25,000 to $34,999 | 1,526 (6.8%) | 899 (11.2%) |
| $35,000 to $49,999 | 2,397 (10.6%) | 1,610 (20.0%) |
| $50,000 to $74,999 | 4,528 (20.1%) | 2,073 (25.8%) |
| $75,000 to $99,999 | 3,236 (14.3%) | 756 (9.4%) |
| $100,000 to $149,999 | 3,592 (15.9%) | 962 (12.0%) |
| $150,000 or more | 2,445 (10.8%) | 349 (4.3%) |
| Total | 22,563 (100.0%) | 8,042 (100.0%) |
Monthly Housing Cost Tiers in Tamarac
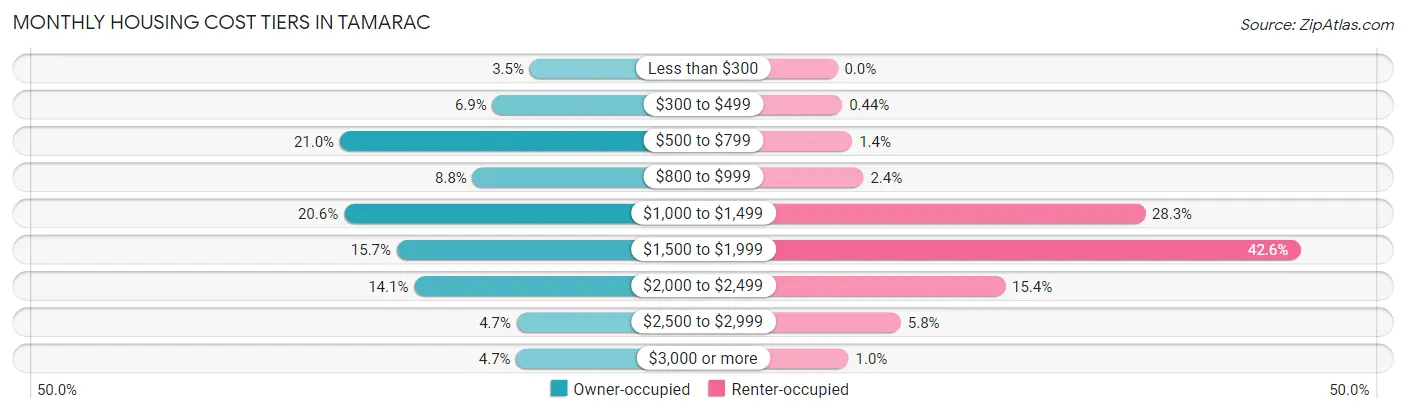
| Monthly Cost | Owner-occupied | Renter-occupied |
| Less than $300 | 788 (3.5%) | 0 (0.0%) |
| $300 to $499 | 1,561 (6.9%) | 35 (0.4%) |
| $500 to $799 | 4,731 (21.0%) | 109 (1.4%) |
| $800 to $999 | 1,974 (8.7%) | 193 (2.4%) |
| $1,000 to $1,499 | 4,649 (20.6%) | 2,277 (28.3%) |
| $1,500 to $1,999 | 3,550 (15.7%) | 3,425 (42.6%) |
| $2,000 to $2,499 | 3,188 (14.1%) | 1,241 (15.4%) |
| $2,500 to $2,999 | 1,058 (4.7%) | 470 (5.8%) |
| $3,000 or more | 1,064 (4.7%) | 83 (1.0%) |
| Total | 22,563 (100.0%) | 8,042 (100.0%) |
Physical Housing Characteristics in Tamarac
Housing Structures in Tamarac
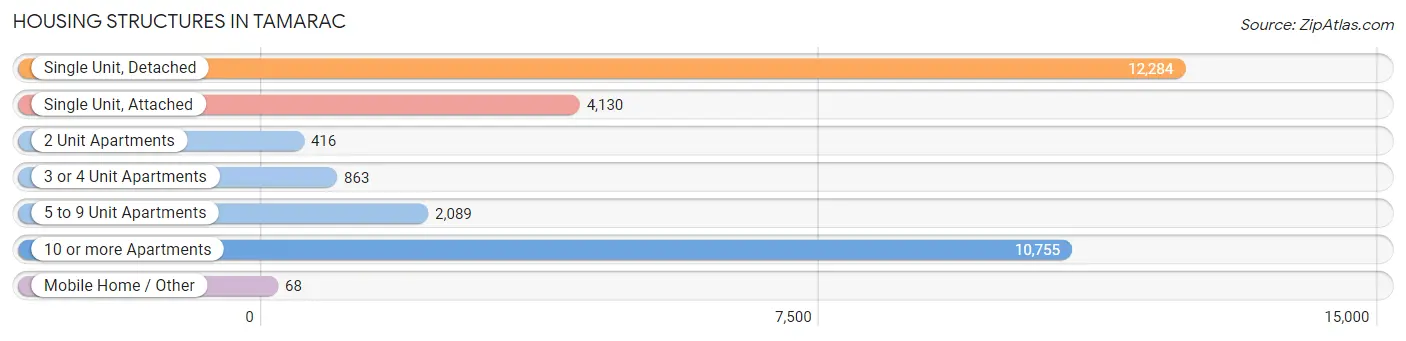
| Structure Type | # Housing Units | % Housing Units |
| Single Unit, Detached | 12,284 | 40.1% |
| Single Unit, Attached | 4,130 | 13.5% |
| 2 Unit Apartments | 416 | 1.4% |
| 3 or 4 Unit Apartments | 863 | 2.8% |
| 5 to 9 Unit Apartments | 2,089 | 6.8% |
| 10 or more Apartments | 10,755 | 35.1% |
| Mobile Home / Other | 68 | 0.2% |
| Total | 30,605 | 100.0% |
Housing Structures by Occupancy in Tamarac
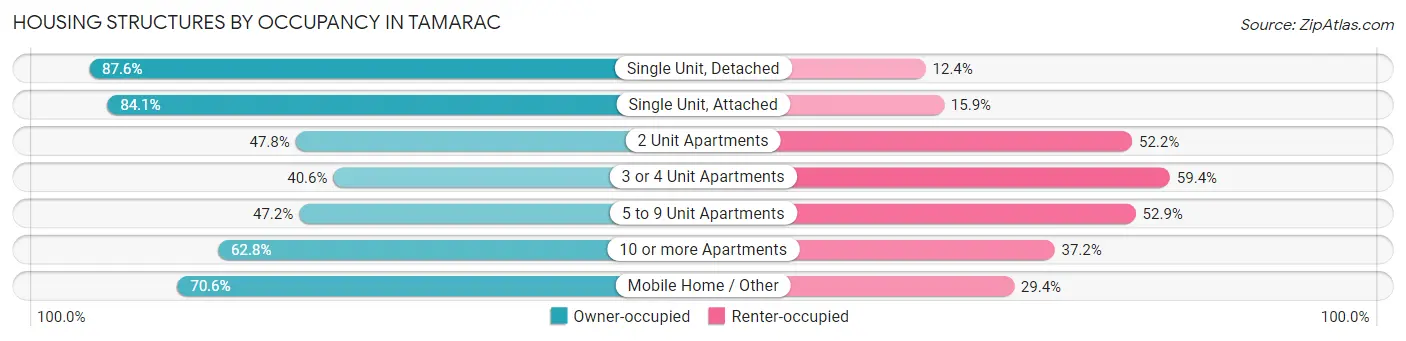
| Structure Type | Owner-occupied | Renter-occupied |
| Single Unit, Detached | 10,759 (87.6%) | 1,525 (12.4%) |
| Single Unit, Attached | 3,472 (84.1%) | 658 (15.9%) |
| 2 Unit Apartments | 199 (47.8%) | 217 (52.2%) |
| 3 or 4 Unit Apartments | 350 (40.6%) | 513 (59.4%) |
| 5 to 9 Unit Apartments | 985 (47.1%) | 1,104 (52.8%) |
| 10 or more Apartments | 6,750 (62.8%) | 4,005 (37.2%) |
| Mobile Home / Other | 48 (70.6%) | 20 (29.4%) |
| Total | 22,563 (73.7%) | 8,042 (26.3%) |
Housing Structures by Number of Rooms in Tamarac
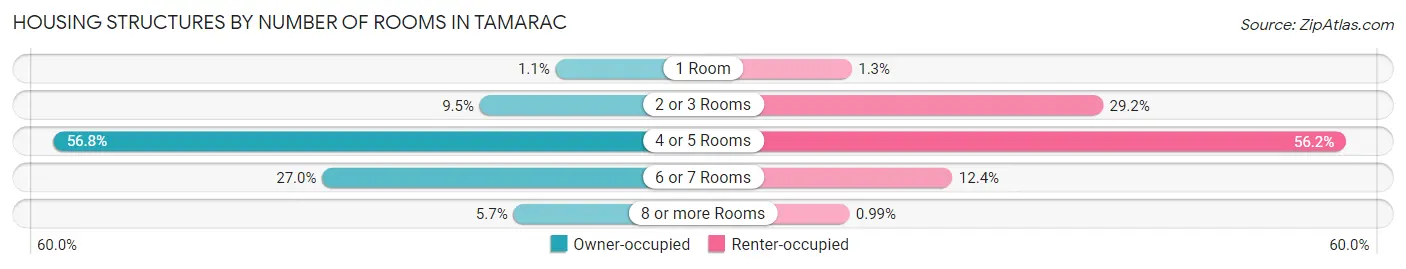
| Number of Rooms | Owner-occupied | Renter-occupied |
| 1 Room | 242 (1.1%) | 101 (1.3%) |
| 2 or 3 Rooms | 2,138 (9.5%) | 2,344 (29.1%) |
| 4 or 5 Rooms | 12,806 (56.8%) | 4,517 (56.2%) |
| 6 or 7 Rooms | 6,082 (27.0%) | 1,000 (12.4%) |
| 8 or more Rooms | 1,295 (5.7%) | 80 (1.0%) |
| Total | 22,563 (100.0%) | 8,042 (100.0%) |
Housing Structure by Heating Type in Tamarac
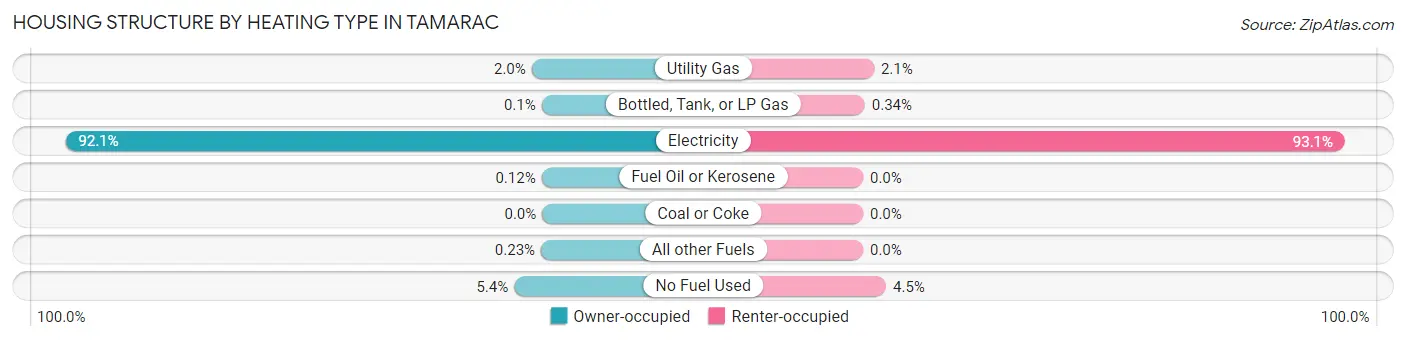
| Heating Type | Owner-occupied | Renter-occupied |
| Utility Gas | 455 (2.0%) | 170 (2.1%) |
| Bottled, Tank, or LP Gas | 23 (0.1%) | 27 (0.3%) |
| Electricity | 20,784 (92.1%) | 7,487 (93.1%) |
| Fuel Oil or Kerosene | 26 (0.1%) | 0 (0.0%) |
| Coal or Coke | 0 (0.0%) | 0 (0.0%) |
| All other Fuels | 51 (0.2%) | 0 (0.0%) |
| No Fuel Used | 1,224 (5.4%) | 358 (4.4%) |
| Total | 22,563 (100.0%) | 8,042 (100.0%) |
Household Vehicle Usage in Tamarac
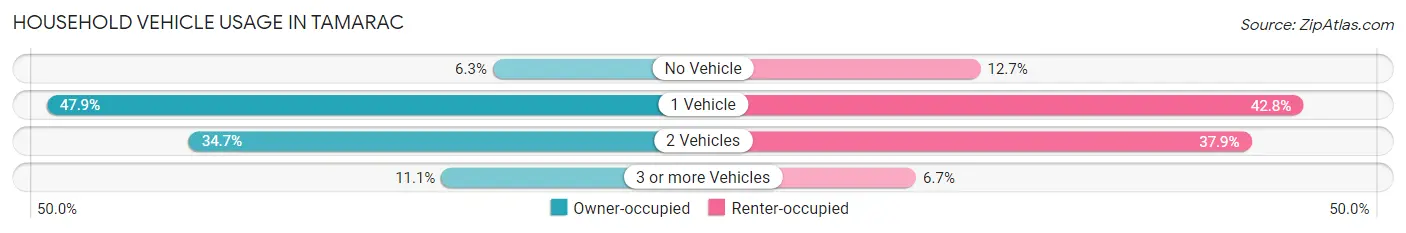
| Vehicles per Household | Owner-occupied | Renter-occupied |
| No Vehicle | 1,421 (6.3%) | 1,018 (12.7%) |
| 1 Vehicle | 10,813 (47.9%) | 3,439 (42.8%) |
| 2 Vehicles | 7,822 (34.7%) | 3,050 (37.9%) |
| 3 or more Vehicles | 2,507 (11.1%) | 535 (6.7%) |
| Total | 22,563 (100.0%) | 8,042 (100.0%) |
Real Estate & Mortgages in Tamarac
Real Estate and Mortgage Overview in Tamarac
| Characteristic | Without Mortgage | With Mortgage |
| Housing Units | 9,684 | 12,879 |
| Median Property Value | $186,200 | $267,100 |
| Median Household Income | $45,071 | $1,937 |
| Monthly Housing Costs | $672 | $1,029 |
| Real Estate Taxes | $1,743 | $387 |
Property Value by Mortgage Status in Tamarac
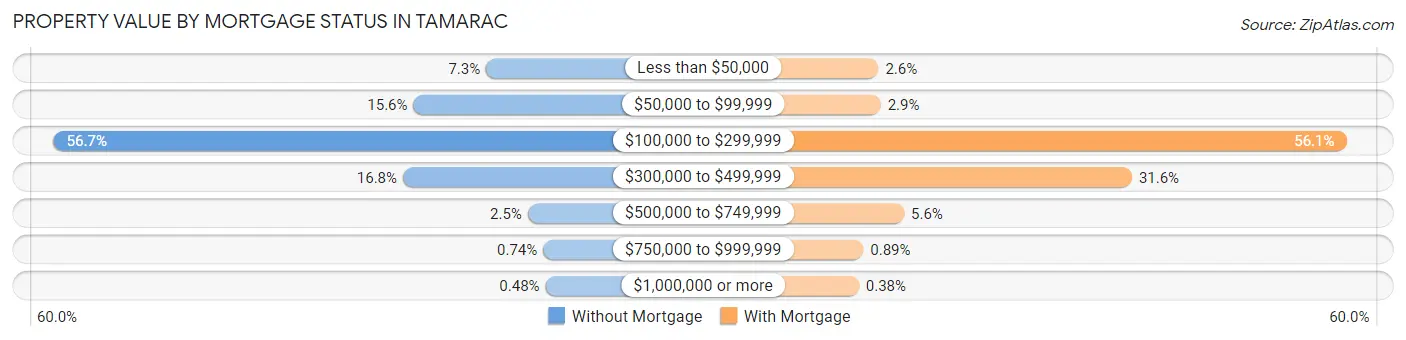
| Property Value | Without Mortgage | With Mortgage |
| Less than $50,000 | 703 (7.3%) | 338 (2.6%) |
| $50,000 to $99,999 | 1,508 (15.6%) | 371 (2.9%) |
| $100,000 to $299,999 | 5,489 (56.7%) | 7,223 (56.1%) |
| $300,000 to $499,999 | 1,624 (16.8%) | 4,068 (31.6%) |
| $500,000 to $749,999 | 242 (2.5%) | 715 (5.6%) |
| $750,000 to $999,999 | 72 (0.7%) | 115 (0.9%) |
| $1,000,000 or more | 46 (0.5%) | 49 (0.4%) |
| Total | 9,684 (100.0%) | 12,879 (100.0%) |
Household Income by Mortgage Status in Tamarac
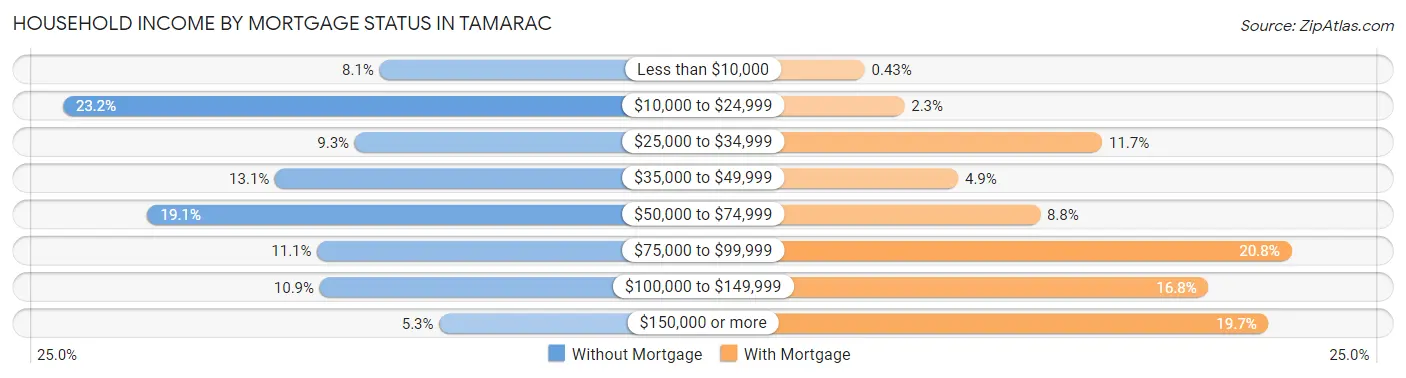
| Household Income | Without Mortgage | With Mortgage |
| Less than $10,000 | 783 (8.1%) | 55 (0.4%) |
| $10,000 to $24,999 | 2,245 (23.2%) | 299 (2.3%) |
| $25,000 to $34,999 | 898 (9.3%) | 1,512 (11.7%) |
| $35,000 to $49,999 | 1,266 (13.1%) | 628 (4.9%) |
| $50,000 to $74,999 | 1,854 (19.1%) | 1,131 (8.8%) |
| $75,000 to $99,999 | 1,071 (11.1%) | 2,674 (20.8%) |
| $100,000 to $149,999 | 1,059 (10.9%) | 2,165 (16.8%) |
| $150,000 or more | 508 (5.2%) | 2,533 (19.7%) |
| Total | 9,684 (100.0%) | 12,879 (100.0%) |
Property Value to Household Income Ratio in Tamarac
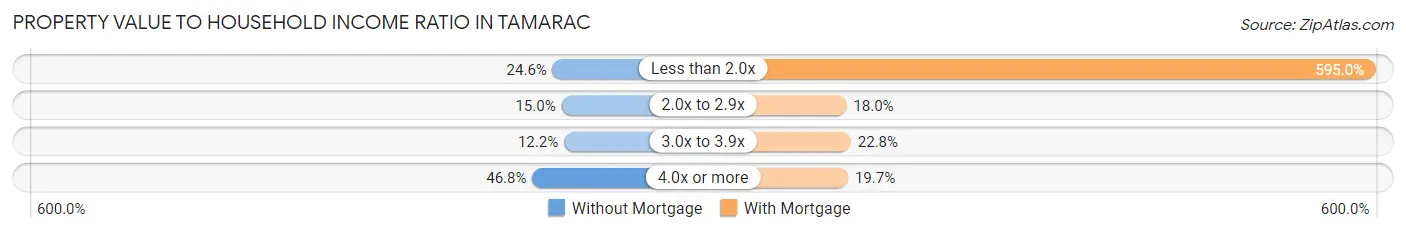
| Value-to-Income Ratio | Without Mortgage | With Mortgage |
| Less than 2.0x | 2,384 (24.6%) | 76,629 (595.0%) |
| 2.0x to 2.9x | 1,450 (15.0%) | 2,321 (18.0%) |
| 3.0x to 3.9x | 1,185 (12.2%) | 2,937 (22.8%) |
| 4.0x or more | 4,528 (46.8%) | 2,537 (19.7%) |
| Total | 9,684 (100.0%) | 12,879 (100.0%) |
Real Estate Taxes by Mortgage Status in Tamarac
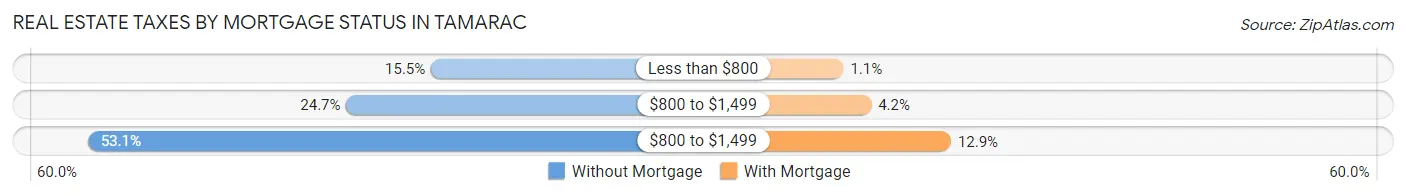
| Property Taxes | Without Mortgage | With Mortgage |
| Less than $800 | 1,496 (15.4%) | 147 (1.1%) |
| $800 to $1,499 | 2,396 (24.7%) | 538 (4.2%) |
| $800 to $1,499 | 5,140 (53.1%) | 1,664 (12.9%) |
| Total | 9,684 (100.0%) | 12,879 (100.0%) |
Health & Disability in Tamarac
Health Insurance Coverage by Age in Tamarac
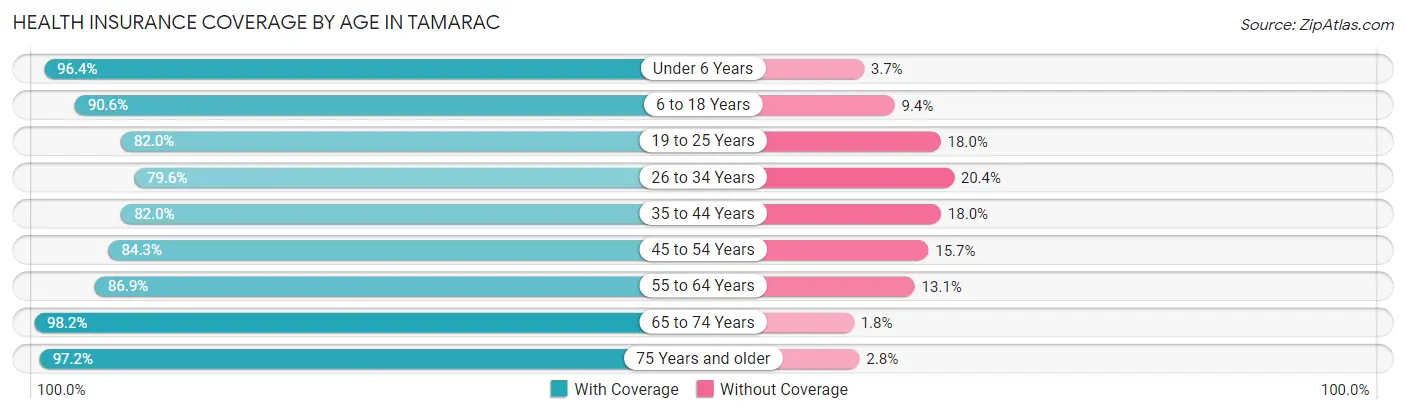
| Age Bracket | With Coverage | Without Coverage |
| Under 6 Years | 3,937 (96.4%) | 149 (3.6%) |
| 6 to 18 Years | 8,765 (90.6%) | 906 (9.4%) |
| 19 to 25 Years | 3,510 (82.0%) | 769 (18.0%) |
| 26 to 34 Years | 6,342 (79.6%) | 1,627 (20.4%) |
| 35 to 44 Years | 6,772 (82.0%) | 1,489 (18.0%) |
| 45 to 54 Years | 7,573 (84.3%) | 1,407 (15.7%) |
| 55 to 64 Years | 8,367 (86.9%) | 1,264 (13.1%) |
| 65 to 74 Years | 9,494 (98.2%) | 170 (1.8%) |
| 75 Years and older | 8,451 (97.2%) | 245 (2.8%) |
| Total | 63,211 (88.7%) | 8,026 (11.3%) |
Health Insurance Coverage by Citizenship Status in Tamarac
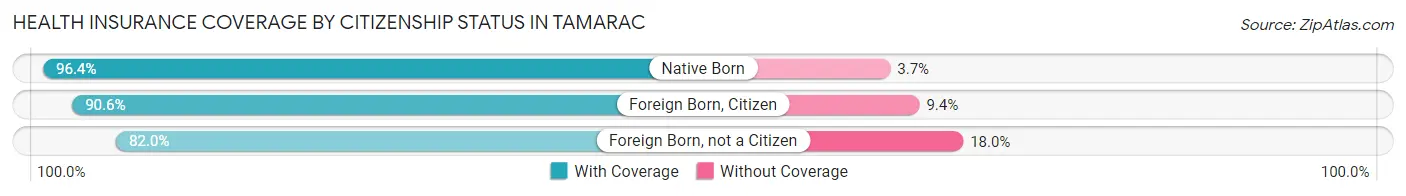
| Citizenship Status | With Coverage | Without Coverage |
| Native Born | 3,937 (96.4%) | 149 (3.6%) |
| Foreign Born, Citizen | 8,765 (90.6%) | 906 (9.4%) |
| Foreign Born, not a Citizen | 3,510 (82.0%) | 769 (18.0%) |
Health Insurance Coverage by Household Income in Tamarac
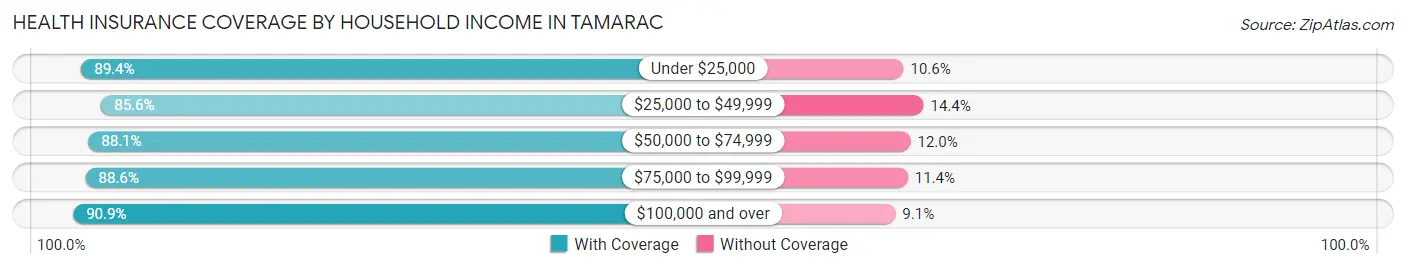
| Household Income | With Coverage | Without Coverage |
| Under $25,000 | 9,659 (89.4%) | 1,149 (10.6%) |
| $25,000 to $49,999 | 11,059 (85.6%) | 1,858 (14.4%) |
| $50,000 to $74,999 | 13,100 (88.0%) | 1,778 (11.9%) |
| $75,000 to $99,999 | 9,925 (88.6%) | 1,282 (11.4%) |
| $100,000 and over | 19,428 (90.9%) | 1,948 (9.1%) |
Public vs Private Health Insurance Coverage by Age in Tamarac
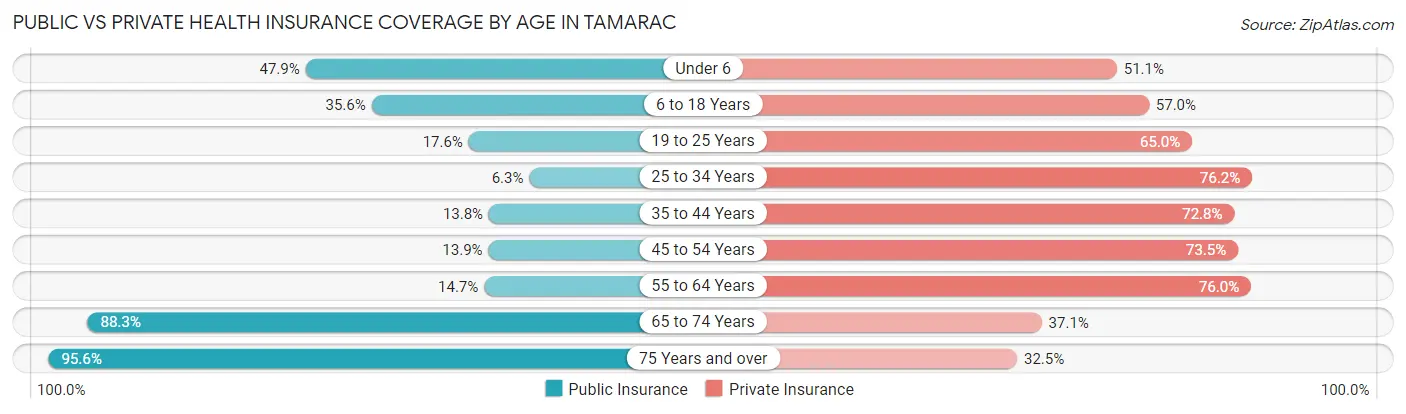
| Age Bracket | Public Insurance | Private Insurance |
| Under 6 | 1,955 (47.8%) | 2,086 (51.0%) |
| 6 to 18 Years | 3,443 (35.6%) | 5,512 (57.0%) |
| 19 to 25 Years | 752 (17.6%) | 2,782 (65.0%) |
| 25 to 34 Years | 504 (6.3%) | 6,068 (76.1%) |
| 35 to 44 Years | 1,141 (13.8%) | 6,017 (72.8%) |
| 45 to 54 Years | 1,249 (13.9%) | 6,604 (73.5%) |
| 55 to 64 Years | 1,417 (14.7%) | 7,315 (75.9%) |
| 65 to 74 Years | 8,534 (88.3%) | 3,585 (37.1%) |
| 75 Years and over | 8,310 (95.6%) | 2,829 (32.5%) |
| Total | 27,305 (38.3%) | 42,798 (60.1%) |
Disability Status by Sex by Age in Tamarac
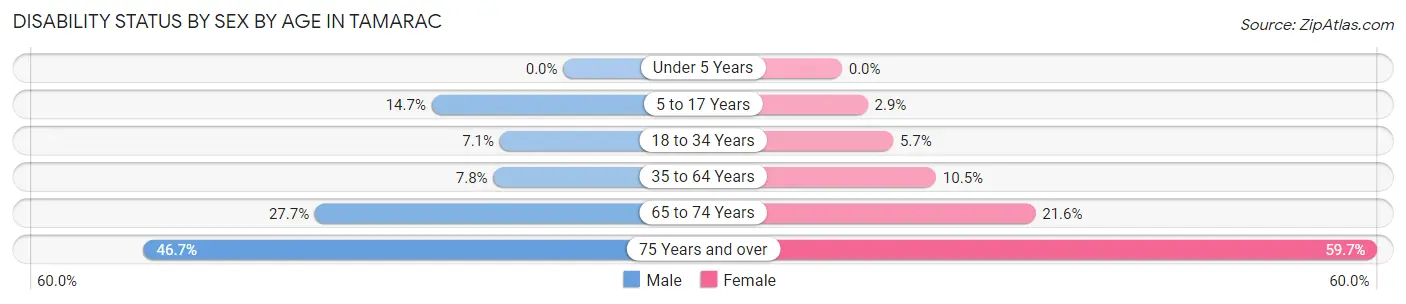
| Age Bracket | Male | Female |
| Under 5 Years | 0 (0.0%) | 0 (0.0%) |
| 5 to 17 Years | 676 (14.7%) | 140 (2.9%) |
| 18 to 34 Years | 446 (7.1%) | 376 (5.7%) |
| 35 to 64 Years | 1,020 (7.8%) | 1,443 (10.5%) |
| 65 to 74 Years | 971 (27.7%) | 1,326 (21.5%) |
| 75 Years and over | 1,478 (46.7%) | 3,301 (59.7%) |
Disability Class by Sex by Age in Tamarac
Disability Class: Hearing Difficulty
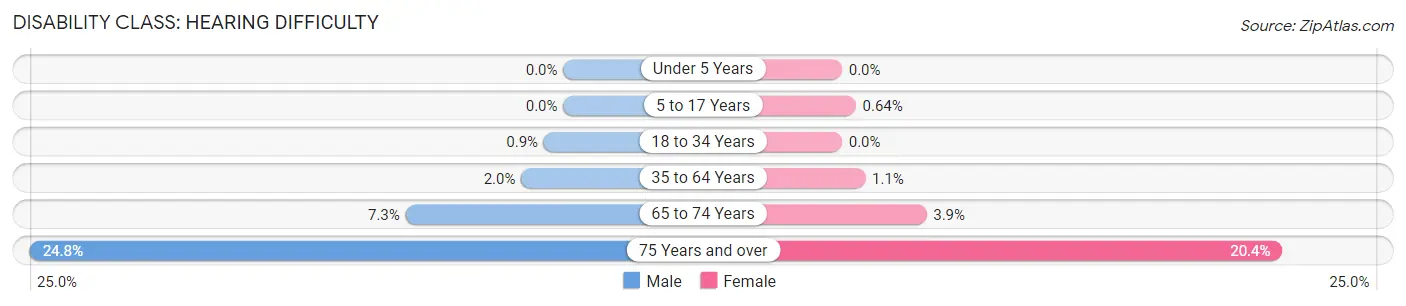
| Age Bracket | Male | Female |
| Under 5 Years | 0 (0.0%) | 0 (0.0%) |
| 5 to 17 Years | 0 (0.0%) | 31 (0.6%) |
| 18 to 34 Years | 57 (0.9%) | 0 (0.0%) |
| 35 to 64 Years | 256 (1.9%) | 149 (1.1%) |
| 65 to 74 Years | 257 (7.3%) | 241 (3.9%) |
| 75 Years and over | 783 (24.8%) | 1,131 (20.4%) |
Disability Class: Vision Difficulty
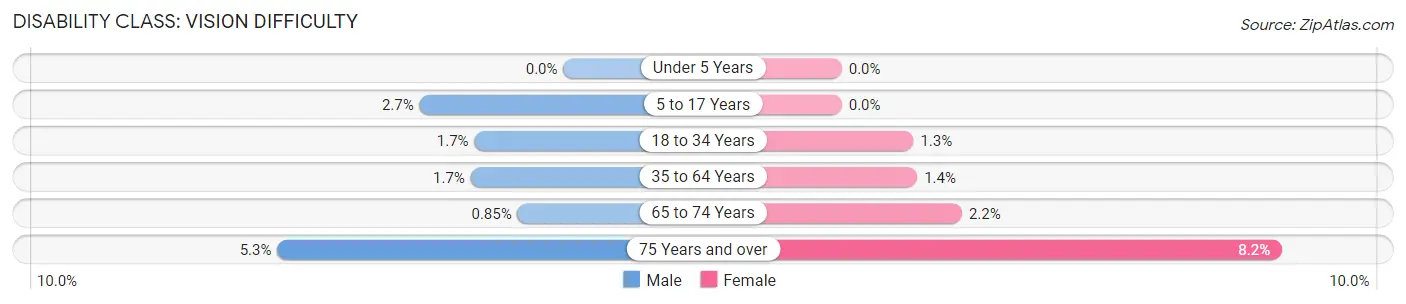
| Age Bracket | Male | Female |
| Under 5 Years | 0 (0.0%) | 0 (0.0%) |
| 5 to 17 Years | 123 (2.7%) | 0 (0.0%) |
| 18 to 34 Years | 104 (1.7%) | 88 (1.3%) |
| 35 to 64 Years | 225 (1.7%) | 193 (1.4%) |
| 65 to 74 Years | 30 (0.9%) | 137 (2.2%) |
| 75 Years and over | 168 (5.3%) | 452 (8.2%) |
Disability Class: Cognitive Difficulty
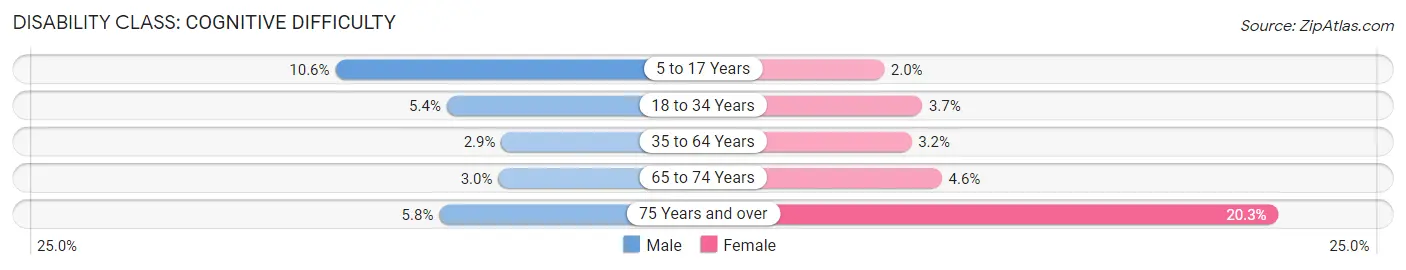
| Age Bracket | Male | Female |
| 5 to 17 Years | 488 (10.6%) | 95 (1.9%) |
| 18 to 34 Years | 341 (5.4%) | 245 (3.7%) |
| 35 to 64 Years | 377 (2.9%) | 444 (3.2%) |
| 65 to 74 Years | 106 (3.0%) | 285 (4.6%) |
| 75 Years and over | 182 (5.8%) | 1,121 (20.3%) |
Disability Class: Ambulatory Difficulty
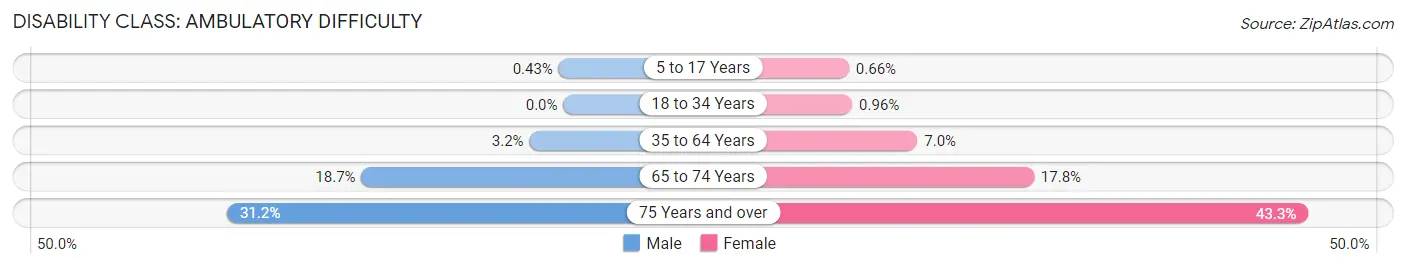
| Age Bracket | Male | Female |
| 5 to 17 Years | 20 (0.4%) | 32 (0.7%) |
| 18 to 34 Years | 0 (0.0%) | 63 (1.0%) |
| 35 to 64 Years | 413 (3.2%) | 965 (7.0%) |
| 65 to 74 Years | 658 (18.7%) | 1,097 (17.8%) |
| 75 Years and over | 987 (31.2%) | 2,395 (43.3%) |
Disability Class: Self-Care Difficulty
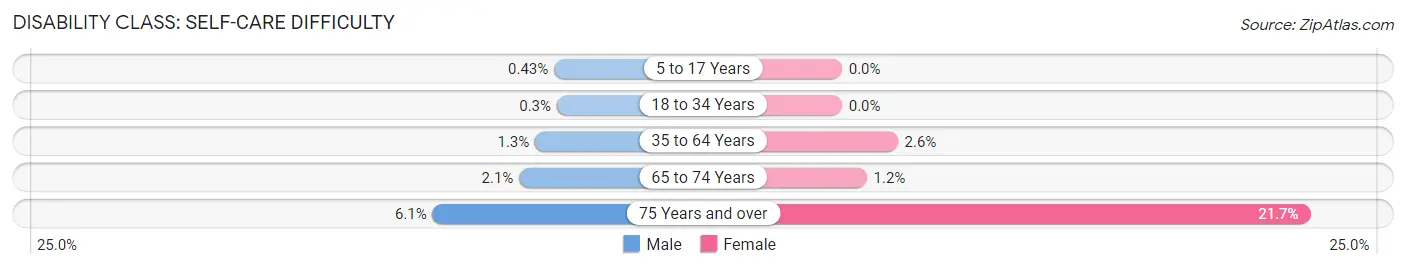
| Age Bracket | Male | Female |
| 5 to 17 Years | 20 (0.4%) | 0 (0.0%) |
| 18 to 34 Years | 19 (0.3%) | 0 (0.0%) |
| 35 to 64 Years | 171 (1.3%) | 357 (2.6%) |
| 65 to 74 Years | 72 (2.1%) | 71 (1.1%) |
| 75 Years and over | 192 (6.1%) | 1,203 (21.7%) |
Technology Access in Tamarac
Computing Device Access in Tamarac
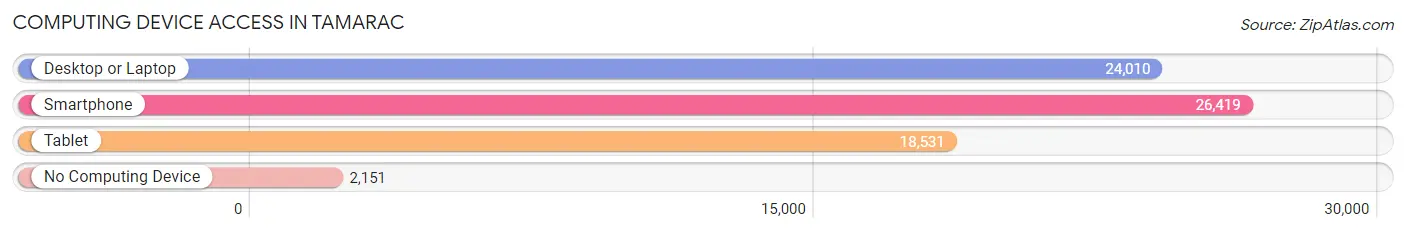
| Device Type | # Households | % Households |
| Desktop or Laptop | 24,010 | 78.4% |
| Smartphone | 26,419 | 86.3% |
| Tablet | 18,531 | 60.6% |
| No Computing Device | 2,151 | 7.0% |
| Total | 30,605 | 100.0% |
Internet Access in Tamarac
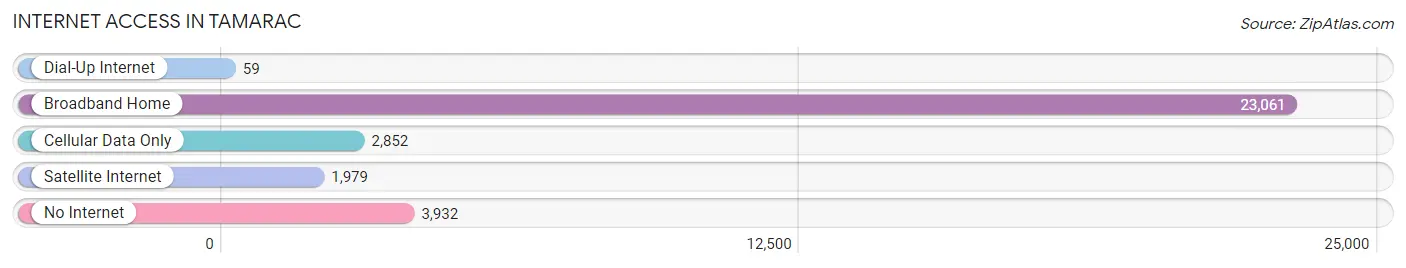
| Internet Type | # Households | % Households |
| Dial-Up Internet | 59 | 0.2% |
| Broadband Home | 23,061 | 75.3% |
| Cellular Data Only | 2,852 | 9.3% |
| Satellite Internet | 1,979 | 6.5% |
| No Internet | 3,932 | 12.9% |
| Total | 30,605 | 100.0% |
Tamarac Summary
Tamarac is a city located in Broward County, Florida, United States. It is located about 20 miles northwest of Fort Lauderdale and is part of the Miami metropolitan area. As of the 2010 census, the city had a population of 60,427.
History
Tamarac was originally part of the Everglades and was known as the “Heights of Tamarac”. The area was first settled in the early 1900s by farmers and ranchers who grew vegetables and raised cattle. In the 1950s, the area was developed as a residential community and was incorporated as a city in 1963.
Geography
Tamarac is located at 26°10'25" North, 80°14'48" West (26.173611, -80.246667). According to the United States Census Bureau, the city has a total area of 11.2 square miles, of which 10.9 square miles is land and 0.3 square miles is water.
Economy
Tamarac’s economy is largely based on the service industry, with many businesses providing services to the local population. The city is home to several large shopping centers, including the Tamarac Square Shopping Center, the Tamarac Town Center, and the Tamarac Commons Shopping Center. The city also has a number of restaurants, bars, and other entertainment venues.
Demographics
As of the 2010 census, there were 60,427 people, 24,844 households, and 16,845 families residing in the city. The population density was 5,541.3 people per square mile. The racial makeup of the city was 68.2% White, 16.3% African American, 0.3% Native American, 4.2% Asian, 0.1% Pacific Islander, 7.3% from other races, and 3.7% from two or more races. Hispanic or Latino of any race were 24.2% of the population.
The median income for a household in the city was $45,945, and the median income for a family was $54,845. Males had a median income of $41,845 versus $30,945 for females. The per capita income for the city was $25,945. About 8.7% of families and 11.2% of the population were below the poverty line, including 15.2% of those under age 18 and 8.2% of those age 65 or over.
Common Questions
What is Per Capita Income in Tamarac?
Per Capita income in Tamarac is $35,620.
What is the Median Family Income in Tamarac?
Median Family Income in Tamarac is $67,739.
What is the Median Household income in Tamarac?
Median Household Income in Tamarac is $59,140.
What is Income or Wage Gap in Tamarac?
Income or Wage Gap in Tamarac is 18.7%.
Women in Tamarac earn 81.3 cents for every dollar earned by a man.
What is Family Income Deficit in Tamarac?
Family Income Deficit in Tamarac is $7,793.
Families that are below poverty line in Tamarac earn $7,793 less on average than the poverty threshold level.
What is Inequality or Gini Index in Tamarac?
Inequality or Gini Index in Tamarac is 0.47.
What is the Total Population of Tamarac?
Total Population of Tamarac is 71,578.
What is the Total Male Population of Tamarac?
Total Male Population of Tamarac is 32,434.
What is the Total Female Population of Tamarac?
Total Female Population of Tamarac is 39,144.
What is the Ratio of Males per 100 Females in Tamarac?
There are 82.86 Males per 100 Females in Tamarac.
What is the Ratio of Females per 100 Males in Tamarac?
There are 120.69 Females per 100 Males in Tamarac.
What is the Median Population Age in Tamarac?
Median Population Age in Tamarac is 47.1 Years.
What is the Average Family Size in Tamarac
Average Family Size in Tamarac is 3.1 People.
What is the Average Household Size in Tamarac
Average Household Size in Tamarac is 2.3 People.
How Large is the Labor Force in Tamarac?
There are 36,868 People in the Labor Forcein in Tamarac.
What is the Percentage of People in the Labor Force in Tamarac?
61.1% of People are in the Labor Force in Tamarac.
What is the Unemployment Rate in Tamarac?
Unemployment Rate in Tamarac is 5.9%.