Margate, FL Map & Demographics
Margate Map
Margate Overview
$32,707
PER CAPITA INCOME
$73,823
AVG FAMILY INCOME
$56,324
AVG HOUSEHOLD INCOME
24.7%
WAGE / INCOME GAP [ % ]
75.3¢/ $1
WAGE / INCOME GAP [ $ ]
$8,245
FAMILY INCOME DEFICIT
0.44
INEQUALITY / GINI INDEX
58,396
TOTAL POPULATION
27,461
MALE POPULATION
30,935
FEMALE POPULATION
88.77
MALES / 100 FEMALES
112.65
FEMALES / 100 MALES
46.8
MEDIAN AGE
3.0
AVG FAMILY SIZE
2.3
AVG HOUSEHOLD SIZE
31,763
LABOR FORCE [ PEOPLE ]
63.7%
PERCENT IN LABOR FORCE
4.2%
UNEMPLOYMENT RATE
Income in Margate
Income Overview in Margate
Per Capita Income in Margate is $32,707, while median incomes of families and households are $73,823 and $56,324 respectively.
| Characteristic | Number | Measure |
| Per Capita Income | 58,396 | $32,707 |
| Median Family Income | 15,307 | $73,823 |
| Mean Family Income | 15,307 | $89,448 |
| Median Household Income | 25,468 | $56,324 |
| Mean Household Income | 25,468 | $73,520 |
| Income Deficit | 15,307 | $8,245 |
| Wage / Income Gap (%) | 58,396 | 24.72% |
| Wage / Income Gap ($) | 58,396 | 75.28¢ per $1 |
| Gini / Inequality Index | 58,396 | 0.44 |
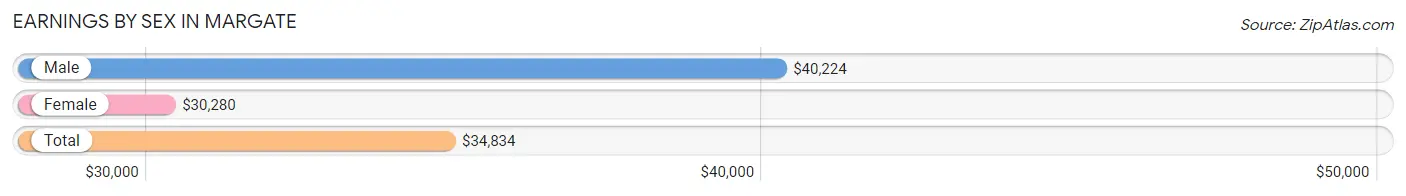
Earnings by Sex in Margate
Average Earnings in Margate are $34,834, $40,224 for men and $30,280 for women, a difference of 24.7%.
| Sex | Number | Average Earnings |
| Male | 16,648 (50.3%) | $40,224 |
| Female | 16,453 (49.7%) | $30,280 |
| Total | 33,101 (100.0%) | $34,834 |
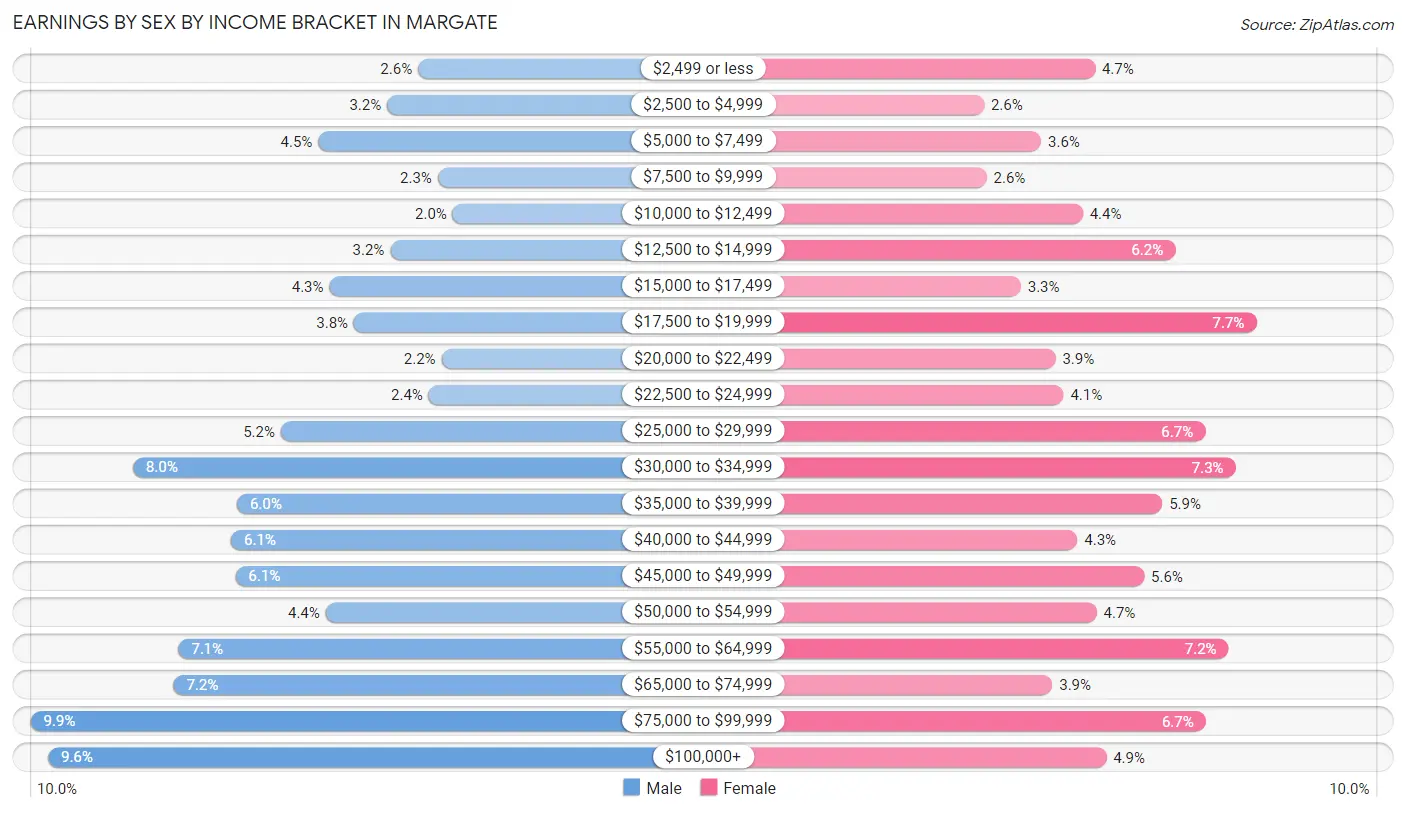
Earnings by Sex by Income Bracket in Margate
The most common earnings brackets in Margate are $75,000 to $99,999 for men (1,647 | 9.9%) and $17,500 to $19,999 for women (1,262 | 7.7%).
| Income | Male | Female |
| $2,499 or less | 438 (2.6%) | 765 (4.6%) |
| $2,500 to $4,999 | 535 (3.2%) | 423 (2.6%) |
| $5,000 to $7,499 | 749 (4.5%) | 599 (3.6%) |
| $7,500 to $9,999 | 377 (2.3%) | 431 (2.6%) |
| $10,000 to $12,499 | 329 (2.0%) | 728 (4.4%) |
| $12,500 to $14,999 | 524 (3.2%) | 1,012 (6.1%) |
| $15,000 to $17,499 | 715 (4.3%) | 536 (3.3%) |
| $17,500 to $19,999 | 637 (3.8%) | 1,262 (7.7%) |
| $20,000 to $22,499 | 364 (2.2%) | 644 (3.9%) |
| $22,500 to $24,999 | 405 (2.4%) | 668 (4.1%) |
| $25,000 to $29,999 | 866 (5.2%) | 1,104 (6.7%) |
| $30,000 to $34,999 | 1,327 (8.0%) | 1,198 (7.3%) |
| $35,000 to $39,999 | 1,002 (6.0%) | 972 (5.9%) |
| $40,000 to $44,999 | 1,021 (6.1%) | 710 (4.3%) |
| $45,000 to $49,999 | 1,008 (6.0%) | 917 (5.6%) |
| $50,000 to $54,999 | 726 (4.4%) | 770 (4.7%) |
| $55,000 to $64,999 | 1,186 (7.1%) | 1,176 (7.1%) |
| $65,000 to $74,999 | 1,200 (7.2%) | 633 (3.8%) |
| $75,000 to $99,999 | 1,647 (9.9%) | 1,105 (6.7%) |
| $100,000+ | 1,592 (9.6%) | 800 (4.9%) |
| Total | 16,648 (100.0%) | 16,453 (100.0%) |
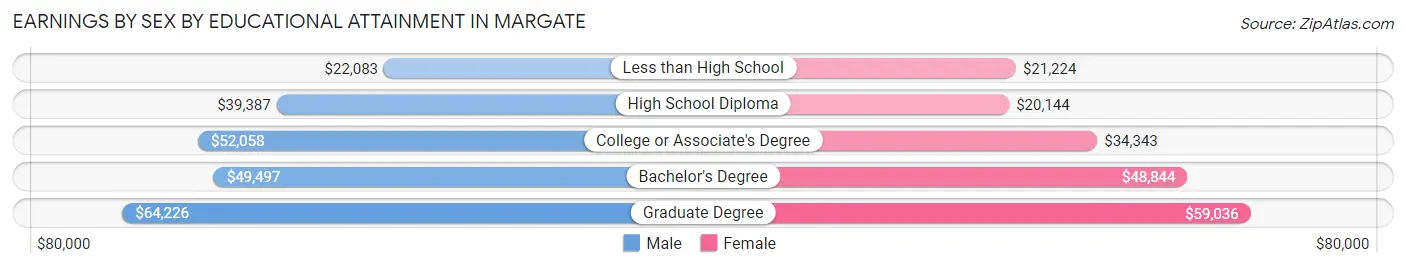
Earnings by Sex by Educational Attainment in Margate
Average earnings in Margate are $43,740 for men and $33,286 for women, a difference of 23.9%. Men with an educational attainment of graduate degree enjoy the highest average annual earnings of $64,226, while those with less than high school education earn the least with $22,083. Women with an educational attainment of graduate degree earn the most with the average annual earnings of $59,036, while those with high school diploma education have the smallest earnings of $20,144.
| Educational Attainment | Male Income | Female Income |
| Less than High School | $22,083 | $21,224 |
| High School Diploma | $39,387 | $20,144 |
| College or Associate's Degree | $52,058 | $34,343 |
| Bachelor's Degree | $49,497 | $48,844 |
| Graduate Degree | $64,226 | $59,036 |
| Total | $43,740 | $33,286 |
Family Income in Margate
Family Income Brackets in Margate
According to the Margate family income data, there are 2,970 families falling into the $100,000 to $149,999 income range, which is the most common income bracket and makes up 19.4% of all families. Conversely, the less than $10,000 income bracket is the least frequent group with only 276 families (1.8%) belonging to this category.
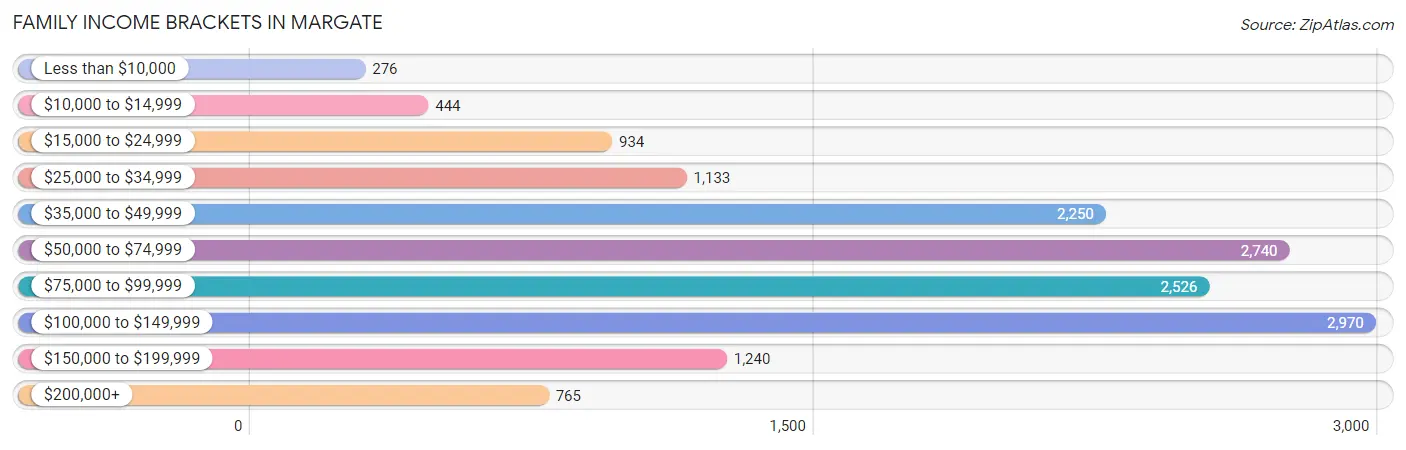
| Income Bracket | # Families | % Families |
| Less than $10,000 | 276 | 1.8% |
| $10,000 to $14,999 | 444 | 2.9% |
| $15,000 to $24,999 | 934 | 6.1% |
| $25,000 to $34,999 | 1,133 | 7.4% |
| $35,000 to $49,999 | 2,250 | 14.7% |
| $50,000 to $74,999 | 2,740 | 17.9% |
| $75,000 to $99,999 | 2,526 | 16.5% |
| $100,000 to $149,999 | 2,970 | 19.4% |
| $150,000 to $199,999 | 1,240 | 8.1% |
| $200,000+ | 765 | 5.0% |
Family Income by Famaliy Size in Margate
5-person families (781 | 5.1%) account for the highest median family income in Margate with $141,513 per family, while 2-person families (8,439 | 55.1%) have the highest median income of $31,904 per family member.
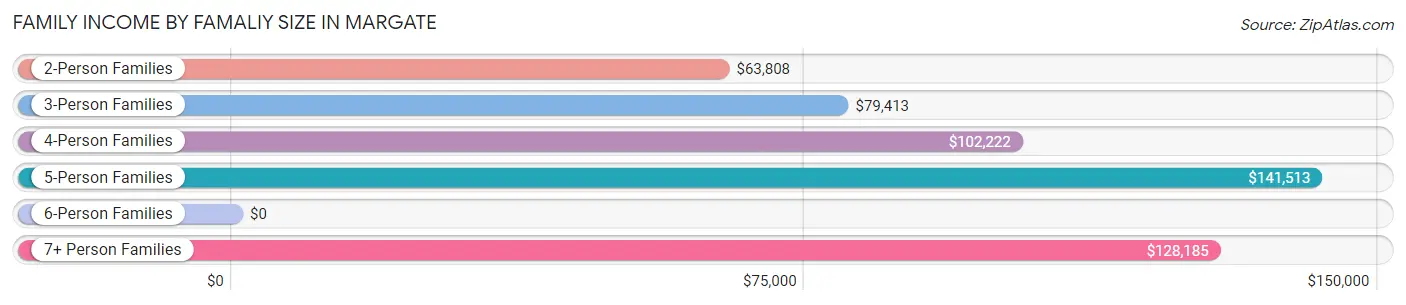
| Income Bracket | # Families | Median Income |
| 2-Person Families | 8,439 (55.1%) | $63,808 |
| 3-Person Families | 3,444 (22.5%) | $79,413 |
| 4-Person Families | 2,162 (14.1%) | $102,222 |
| 5-Person Families | 781 (5.1%) | $141,513 |
| 6-Person Families | 290 (1.9%) | $0 |
| 7+ Person Families | 191 (1.3%) | $128,185 |
| Total | 15,307 (100.0%) | $73,823 |
Family Income by Number of Earners in Margate
The median family income in Margate is $73,823, with families comprising 3+ earners (2,081) having the highest median family income of $120,721, while families with no earners (2,131) have the lowest median family income of $34,310, accounting for 13.6% and 13.9% of families, respectively.
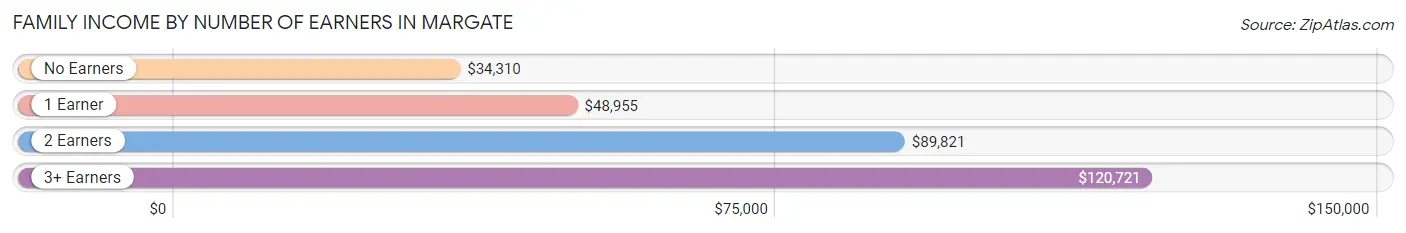
| Number of Earners | # Families | Median Income |
| No Earners | 2,131 (13.9%) | $34,310 |
| 1 Earner | 4,649 (30.4%) | $48,955 |
| 2 Earners | 6,446 (42.1%) | $89,821 |
| 3+ Earners | 2,081 (13.6%) | $120,721 |
| Total | 15,307 (100.0%) | $73,823 |
Household Income in Margate
Household Income Brackets in Margate
With 4,279 households falling in the category, the $35,000 to $49,999 income range is the most frequent in Margate, accounting for 16.8% of all households. In contrast, only 942 households (3.7%) fall into the $200,000+ income bracket, making it the least populous group.
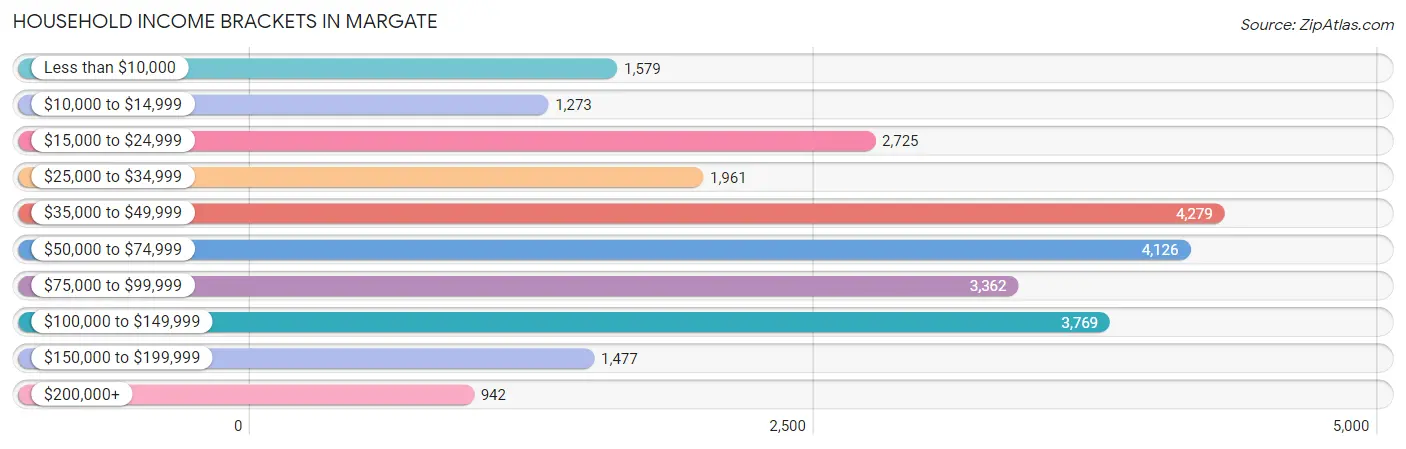
| Income Bracket | # Households | % Households |
| Less than $10,000 | 1,579 | 6.2% |
| $10,000 to $14,999 | 1,273 | 5.0% |
| $15,000 to $24,999 | 2,725 | 10.7% |
| $25,000 to $34,999 | 1,961 | 7.7% |
| $35,000 to $49,999 | 4,279 | 16.8% |
| $50,000 to $74,999 | 4,126 | 16.2% |
| $75,000 to $99,999 | 3,362 | 13.2% |
| $100,000 to $149,999 | 3,769 | 14.8% |
| $150,000 to $199,999 | 1,477 | 5.8% |
| $200,000+ | 942 | 3.7% |
Household Income by Householder Age in Margate
The median household income in Margate is $56,324, with the highest median household income of $72,630 found in the 25 to 44 years age bracket for the primary householder. A total of 7,009 households (27.5%) fall into this category. Meanwhile, the 65+ years age bracket for the primary householder has the lowest median household income of $36,929, with 8,923 households (35.0%) in this group.
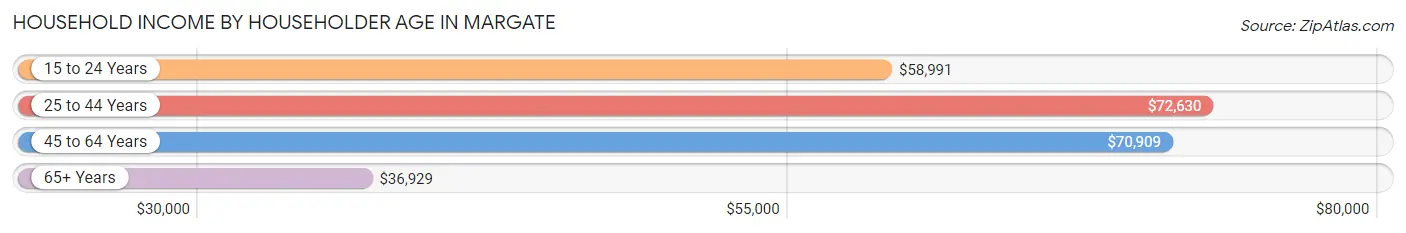
| Income Bracket | # Households | Median Income |
| 15 to 24 Years | 156 (0.6%) | $58,991 |
| 25 to 44 Years | 7,009 (27.5%) | $72,630 |
| 45 to 64 Years | 9,380 (36.8%) | $70,909 |
| 65+ Years | 8,923 (35.0%) | $36,929 |
| Total | 25,468 (100.0%) | $56,324 |
Poverty in Margate
Income Below Poverty by Sex and Age in Margate
With 10.8% poverty level for males and 13.6% for females among the residents of Margate, 5 year old males and 16 and 17 year old females are the most vulnerable to poverty, with 127 males (46.5%) and 216 females (36.1%) in their respective age groups living below the poverty level.
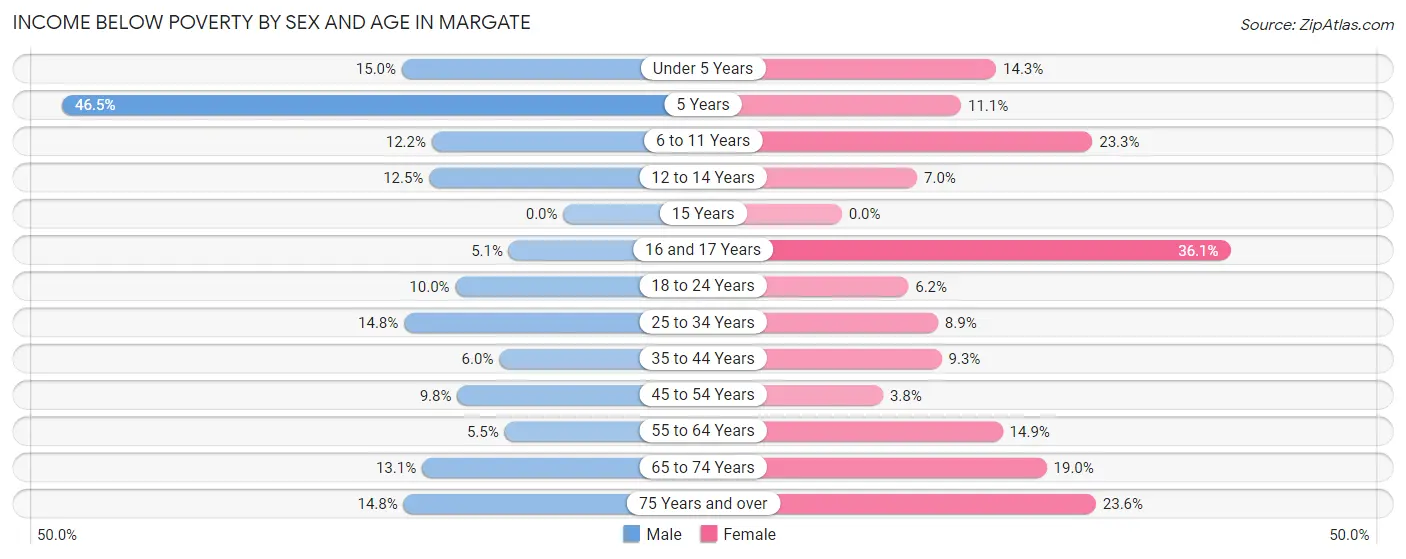
| Age Bracket | Male | Female |
| Under 5 Years | 152 (15.0%) | 168 (14.3%) |
| 5 Years | 127 (46.5%) | 29 (11.1%) |
| 6 to 11 Years | 203 (12.2%) | 443 (23.3%) |
| 12 to 14 Years | 135 (12.4%) | 61 (7.0%) |
| 15 Years | 0 (0.0%) | 0 (0.0%) |
| 16 and 17 Years | 40 (5.1%) | 216 (36.1%) |
| 18 to 24 Years | 176 (10.0%) | 100 (6.2%) |
| 25 to 34 Years | 573 (14.8%) | 310 (8.9%) |
| 35 to 44 Years | 206 (5.9%) | 381 (9.3%) |
| 45 to 54 Years | 310 (9.8%) | 146 (3.8%) |
| 55 to 64 Years | 228 (5.5%) | 784 (14.9%) |
| 65 to 74 Years | 515 (13.1%) | 950 (19.0%) |
| 75 Years and over | 307 (14.8%) | 610 (23.6%) |
| Total | 2,972 (10.8%) | 4,198 (13.6%) |
Income Above Poverty by Sex and Age in Margate
According to the poverty statistics in Margate, males aged 15 years and females aged 15 years are the age groups that are most secure financially, with 100.0% of males and 100.0% of females in these age groups living above the poverty line.
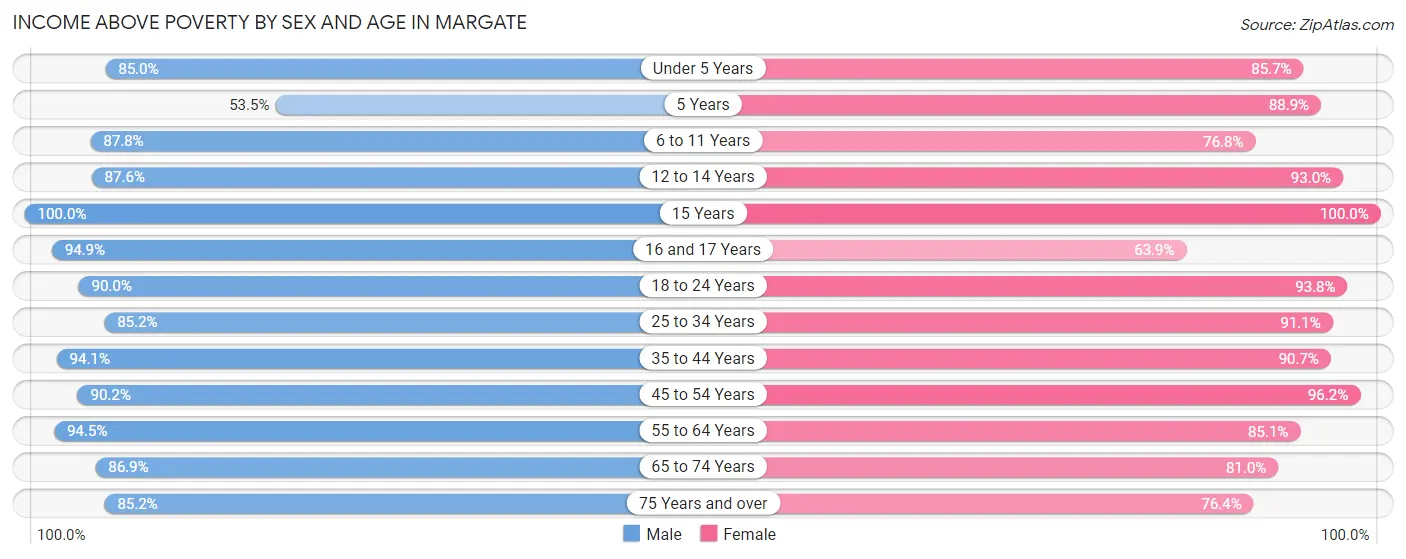
| Age Bracket | Male | Female |
| Under 5 Years | 862 (85.0%) | 1,005 (85.7%) |
| 5 Years | 146 (53.5%) | 233 (88.9%) |
| 6 to 11 Years | 1,459 (87.8%) | 1,462 (76.7%) |
| 12 to 14 Years | 949 (87.5%) | 812 (93.0%) |
| 15 Years | 147 (100.0%) | 109 (100.0%) |
| 16 and 17 Years | 750 (94.9%) | 383 (63.9%) |
| 18 to 24 Years | 1,581 (90.0%) | 1,522 (93.8%) |
| 25 to 34 Years | 3,303 (85.2%) | 3,165 (91.1%) |
| 35 to 44 Years | 3,256 (94.1%) | 3,732 (90.7%) |
| 45 to 54 Years | 2,840 (90.2%) | 3,679 (96.2%) |
| 55 to 64 Years | 3,949 (94.5%) | 4,466 (85.1%) |
| 65 to 74 Years | 3,410 (86.9%) | 4,047 (81.0%) |
| 75 Years and over | 1,763 (85.2%) | 1,977 (76.4%) |
| Total | 24,415 (89.1%) | 26,592 (86.4%) |
Income Below Poverty Among Married-Couple Families in Margate
The poverty statistics for married-couple families in Margate show that 7.8% or 857 of the total 10,954 families live below the poverty line. Families with 5 or more children have the highest poverty rate of 47.4%, comprising of 18 families. On the other hand, families with 3 or 4 children have the lowest poverty rate of 2.3%, which includes 9 families.
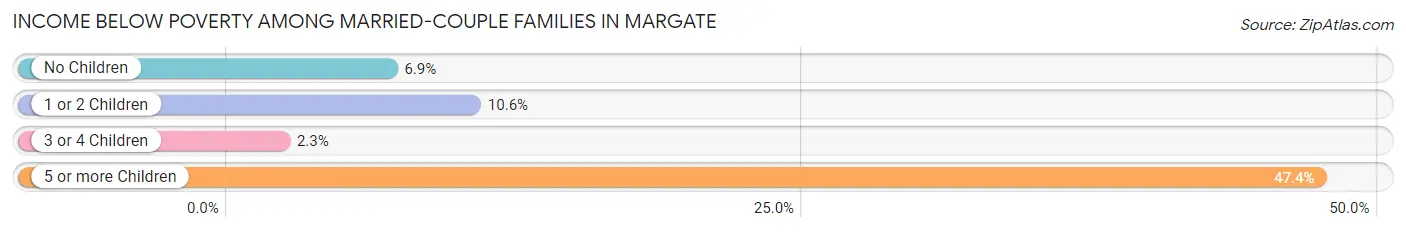
| Children | Above Poverty | Below Poverty |
| No Children | 7,224 (93.1%) | 539 (6.9%) |
| 1 or 2 Children | 2,463 (89.4%) | 291 (10.6%) |
| 3 or 4 Children | 390 (97.7%) | 9 (2.3%) |
| 5 or more Children | 20 (52.6%) | 18 (47.4%) |
| Total | 10,097 (92.2%) | 857 (7.8%) |
Income Below Poverty Among Single-Parent Households in Margate
According to the poverty data in Margate, 12.4% or 161 single-father households and 12.3% or 377 single-mother households are living below the poverty line. Among single-father households, those with 3 or 4 children have the highest poverty rate, with 7 households (100.0%) experiencing poverty. Likewise, among single-mother households, those with 5 or more children have the highest poverty rate, with 23 households (100.0%) falling below the poverty line.
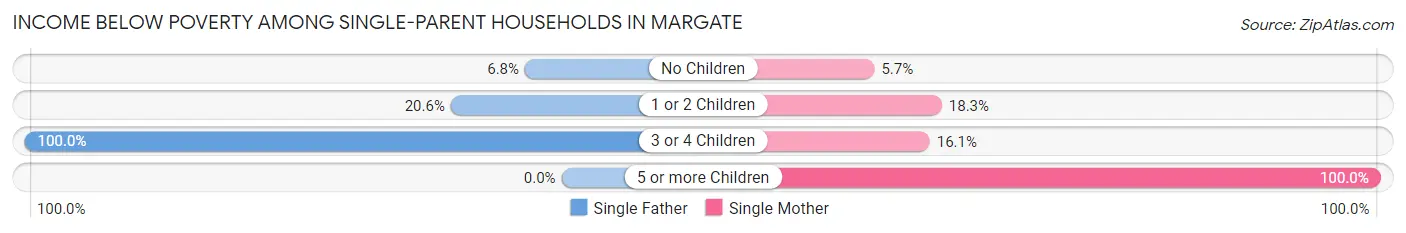
| Children | Single Father | Single Mother |
| No Children | 50 (6.8%) | 90 (5.7%) |
| 1 or 2 Children | 104 (20.6%) | 238 (18.3%) |
| 3 or 4 Children | 7 (100.0%) | 26 (16.1%) |
| 5 or more Children | 0 (0.0%) | 23 (100.0%) |
| Total | 161 (12.4%) | 377 (12.3%) |
Income Below Poverty Among Married-Couple vs Single-Parent Households in Margate
The poverty data for Margate shows that 857 of the married-couple family households (7.8%) and 538 of the single-parent households (12.4%) are living below the poverty level. Within the married-couple family households, those with 5 or more children have the highest poverty rate, with 18 households (47.4%) falling below the poverty line. Among the single-parent households, those with 5 or more children have the highest poverty rate, with 23 household (30.3%) living below poverty.
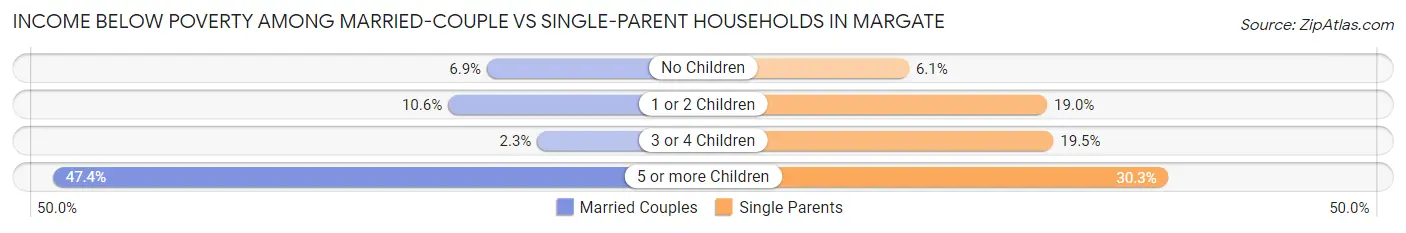
| Children | Married-Couple Families | Single-Parent Households |
| No Children | 539 (6.9%) | 140 (6.1%) |
| 1 or 2 Children | 291 (10.6%) | 342 (19.0%) |
| 3 or 4 Children | 9 (2.3%) | 33 (19.5%) |
| 5 or more Children | 18 (47.4%) | 23 (30.3%) |
| Total | 857 (7.8%) | 538 (12.4%) |
Race in Margate
The most populous races in Margate are White / Caucasian (24,793 | 42.5%), Black / African American (19,774 | 33.9%), and Hispanic or Latino (14,830 | 25.4%).
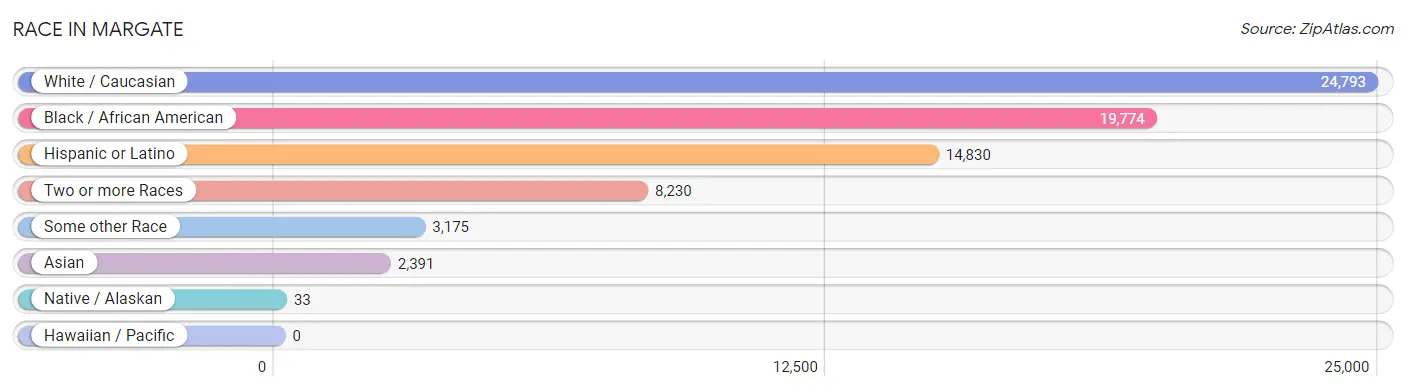
| Race | # Population | % Population |
| Asian | 2,391 | 4.1% |
| Black / African American | 19,774 | 33.9% |
| Hawaiian / Pacific | 0 | 0.0% |
| Hispanic or Latino | 14,830 | 25.4% |
| Native / Alaskan | 33 | 0.1% |
| White / Caucasian | 24,793 | 42.5% |
| Two or more Races | 8,230 | 14.1% |
| Some other Race | 3,175 | 5.4% |
| Total | 58,396 | 100.0% |
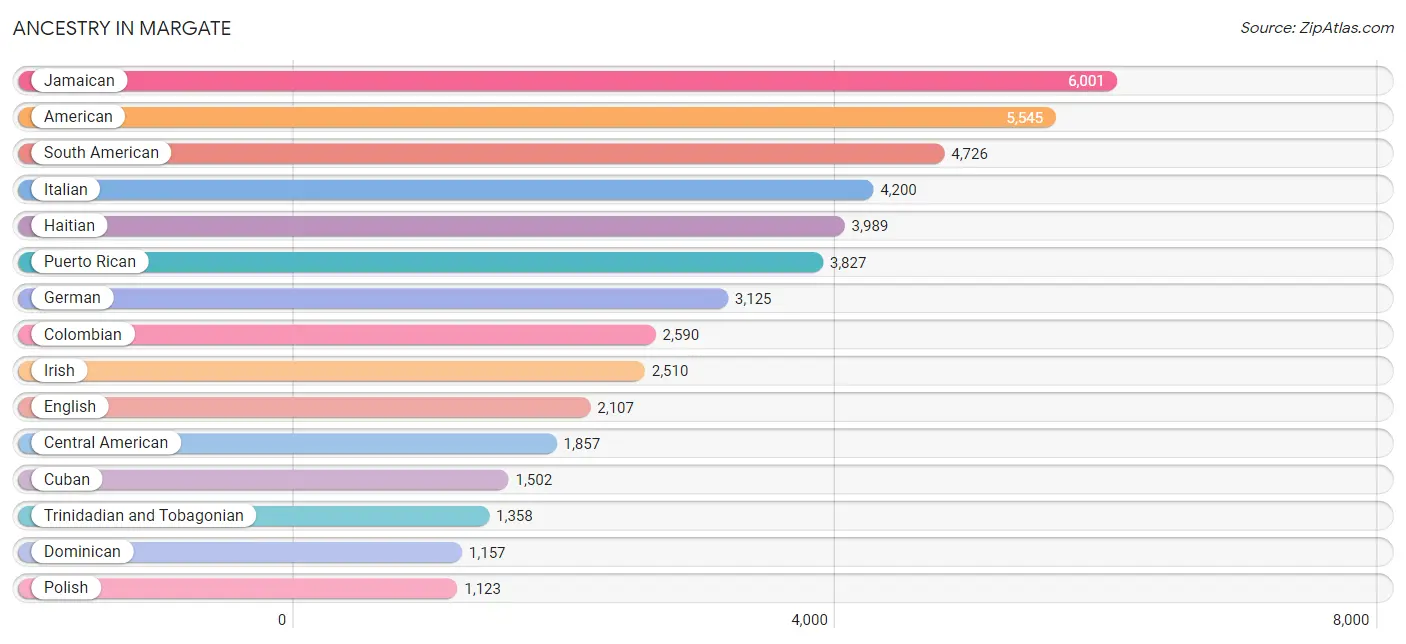
Ancestry in Margate
The most populous ancestries reported in Margate are Jamaican (6,001 | 10.3%), American (5,545 | 9.5%), South American (4,726 | 8.1%), Italian (4,200 | 7.2%), and Haitian (3,989 | 6.8%), together accounting for 41.9% of all Margate residents.
| Ancestry | # Population | % Population |
| African | 174 | 0.3% |
| American | 5,545 | 9.5% |
| Arab | 234 | 0.4% |
| Argentinean | 283 | 0.5% |
| Armenian | 33 | 0.1% |
| Austrian | 115 | 0.2% |
| Bahamian | 84 | 0.1% |
| Barbadian | 32 | 0.1% |
| Belizean | 12 | 0.0% |
| Bhutanese | 22 | 0.0% |
| Blackfeet | 27 | 0.1% |
| Bolivian | 167 | 0.3% |
| Brazilian | 495 | 0.9% |
| British | 66 | 0.1% |
| British West Indian | 299 | 0.5% |
| Bulgarian | 6 | 0.0% |
| Canadian | 198 | 0.3% |
| Central American | 1,857 | 3.2% |
| Cherokee | 162 | 0.3% |
| Chilean | 26 | 0.0% |
| Colombian | 2,590 | 4.4% |
| Costa Rican | 151 | 0.3% |
| Cree | 30 | 0.1% |
| Creek | 57 | 0.1% |
| Croatian | 28 | 0.1% |
| Cuban | 1,502 | 2.6% |
| Czech | 35 | 0.1% |
| Czechoslovakian | 8 | 0.0% |
| Danish | 59 | 0.1% |
| Dominican | 1,157 | 2.0% |
| Dutch | 338 | 0.6% |
| Eastern European | 70 | 0.1% |
| Ecuadorian | 574 | 1.0% |
| English | 2,107 | 3.6% |
| European | 670 | 1.1% |
| Finnish | 12 | 0.0% |
| French | 536 | 0.9% |
| French Canadian | 131 | 0.2% |
| German | 3,125 | 5.3% |
| Ghanaian | 38 | 0.1% |
| Greek | 309 | 0.5% |
| Guatemalan | 386 | 0.7% |
| Guyanese | 170 | 0.3% |
| Haitian | 3,989 | 6.8% |
| Honduran | 555 | 0.9% |
| Hungarian | 141 | 0.2% |
| Indian (Asian) | 487 | 0.8% |
| Iranian | 15 | 0.0% |
| Irish | 2,510 | 4.3% |
| Israeli | 9 | 0.0% |
| Italian | 4,200 | 7.2% |
| Jamaican | 6,001 | 10.3% |
| Korean | 340 | 0.6% |
| Lebanese | 8 | 0.0% |
| Liberian | 22 | 0.0% |
| Lithuanian | 27 | 0.1% |
| Mexican | 815 | 1.4% |
| Nicaraguan | 476 | 0.8% |
| Nigerian | 39 | 0.1% |
| Norwegian | 53 | 0.1% |
| Pakistani | 22 | 0.0% |
| Palestinian | 64 | 0.1% |
| Panamanian | 23 | 0.0% |
| Pennsylvania German | 54 | 0.1% |
| Peruvian | 760 | 1.3% |
| Polish | 1,123 | 1.9% |
| Portuguese | 228 | 0.4% |
| Potawatomi | 17 | 0.0% |
| Puerto Rican | 3,827 | 6.6% |
| Romanian | 46 | 0.1% |
| Russian | 573 | 1.0% |
| Salvadoran | 266 | 0.5% |
| Scandinavian | 36 | 0.1% |
| Scotch-Irish | 321 | 0.5% |
| Scottish | 579 | 1.0% |
| Senegalese | 40 | 0.1% |
| Serbian | 26 | 0.0% |
| Slovak | 27 | 0.1% |
| Slovene | 10 | 0.0% |
| South American | 4,726 | 8.1% |
| South American Indian | 99 | 0.2% |
| Spaniard | 65 | 0.1% |
| Spanish | 395 | 0.7% |
| Sri Lankan | 804 | 1.4% |
| Subsaharan African | 313 | 0.5% |
| Swedish | 299 | 0.5% |
| Swiss | 51 | 0.1% |
| Syrian | 60 | 0.1% |
| Thai | 925 | 1.6% |
| Trinidadian and Tobagonian | 1,358 | 2.3% |
| Turkish | 121 | 0.2% |
| U.S. Virgin Islander | 79 | 0.1% |
| Ukrainian | 335 | 0.6% |
| Venezuelan | 240 | 0.4% |
| Welsh | 61 | 0.1% |
| West Indian | 460 | 0.8% |
| Yugoslavian | 32 | 0.1% | View All 97 Rows |
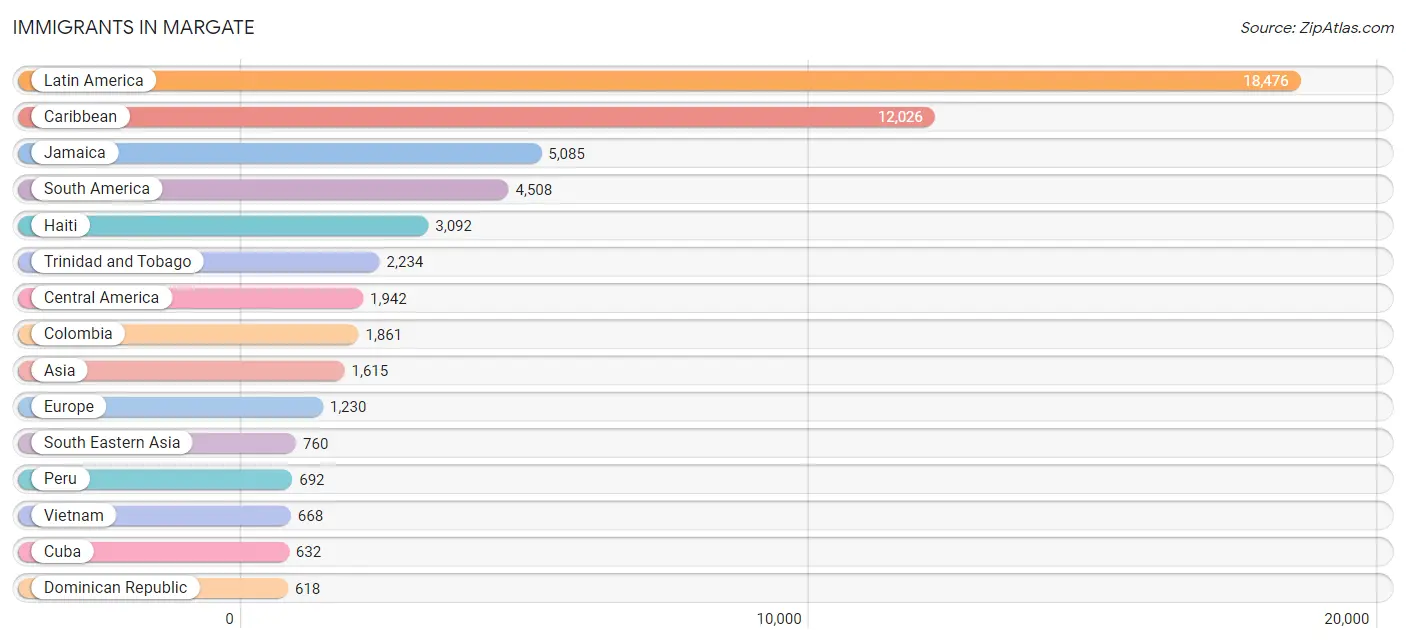
Immigrants in Margate
The most numerous immigrant groups reported in Margate came from Latin America (18,476 | 31.6%), Caribbean (12,026 | 20.6%), Jamaica (5,085 | 8.7%), South America (4,508 | 7.7%), and Haiti (3,092 | 5.3%), together accounting for 74.0% of all Margate residents.
| Immigration Origin | # Population | % Population |
| Africa | 97 | 0.2% |
| Argentina | 296 | 0.5% |
| Asia | 1,615 | 2.8% |
| Austria | 8 | 0.0% |
| Bahamas | 45 | 0.1% |
| Bangladesh | 66 | 0.1% |
| Barbados | 45 | 0.1% |
| Bolivia | 88 | 0.2% |
| Brazil | 445 | 0.8% |
| Canada | 414 | 0.7% |
| Caribbean | 12,026 | 20.6% |
| Central America | 1,942 | 3.3% |
| Chile | 42 | 0.1% |
| China | 240 | 0.4% |
| Colombia | 1,861 | 3.2% |
| Costa Rica | 165 | 0.3% |
| Croatia | 7 | 0.0% |
| Cuba | 632 | 1.1% |
| Czechoslovakia | 22 | 0.0% |
| Denmark | 18 | 0.0% |
| Dominica | 81 | 0.1% |
| Dominican Republic | 618 | 1.1% |
| Eastern Asia | 240 | 0.4% |
| Eastern Europe | 539 | 0.9% |
| Ecuador | 439 | 0.7% |
| Egypt | 17 | 0.0% |
| El Salvador | 222 | 0.4% |
| England | 59 | 0.1% |
| Europe | 1,230 | 2.1% |
| Germany | 155 | 0.3% |
| Grenada | 22 | 0.0% |
| Guatemala | 293 | 0.5% |
| Guyana | 334 | 0.6% |
| Haiti | 3,092 | 5.3% |
| Honduras | 387 | 0.7% |
| Hungary | 8 | 0.0% |
| India | 354 | 0.6% |
| Italy | 196 | 0.3% |
| Jamaica | 5,085 | 8.7% |
| Jordan | 23 | 0.0% |
| Latin America | 18,476 | 31.6% |
| Liberia | 22 | 0.0% |
| Malaysia | 41 | 0.1% |
| Mexico | 392 | 0.7% |
| Morocco | 9 | 0.0% |
| Netherlands | 135 | 0.2% |
| Nicaragua | 464 | 0.8% |
| Northern Africa | 35 | 0.1% |
| Northern Europe | 111 | 0.2% |
| Pakistan | 102 | 0.2% |
| Panama | 19 | 0.0% |
| Peru | 692 | 1.2% |
| Philippines | 29 | 0.1% |
| Poland | 42 | 0.1% |
| Portugal | 19 | 0.0% |
| Romania | 18 | 0.0% |
| Russia | 196 | 0.3% |
| Senegal | 40 | 0.1% |
| Serbia | 8 | 0.0% |
| South America | 4,508 | 7.7% |
| South Central Asia | 552 | 0.9% |
| South Eastern Asia | 760 | 1.3% |
| Southern Europe | 231 | 0.4% |
| Spain | 16 | 0.0% |
| Switzerland | 51 | 0.1% |
| Taiwan | 5 | 0.0% |
| Thailand | 22 | 0.0% |
| Trinidad and Tobago | 2,234 | 3.8% |
| Ukraine | 238 | 0.4% |
| Venezuela | 171 | 0.3% |
| Vietnam | 668 | 1.1% |
| West Indies | 42 | 0.1% |
| Western Africa | 62 | 0.1% |
| Western Asia | 44 | 0.1% |
| Western Europe | 349 | 0.6% | View All 75 Rows |
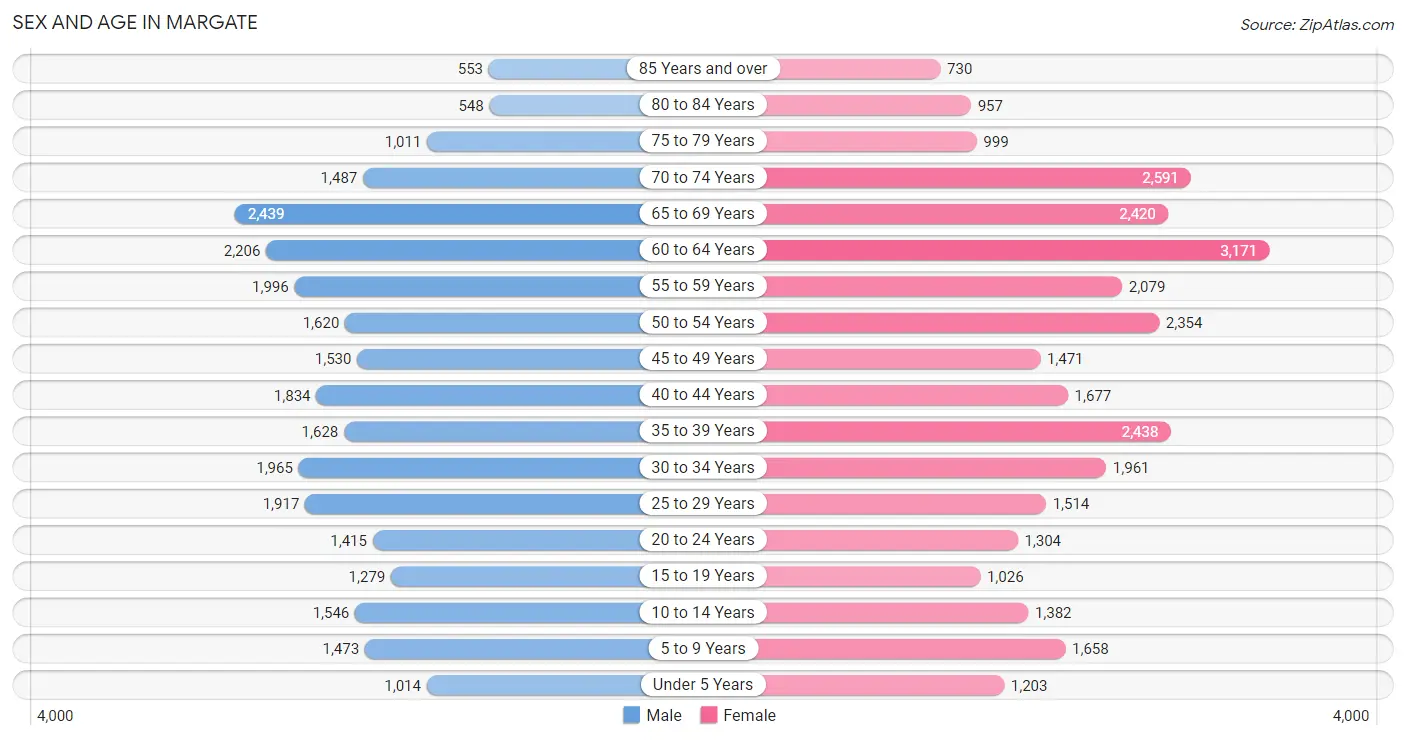
Sex and Age in Margate
Sex and Age in Margate
The most populous age groups in Margate are 65 to 69 Years (2,439 | 8.9%) for men and 60 to 64 Years (3,171 | 10.2%) for women.
| Age Bracket | Male | Female |
| Under 5 Years | 1,014 (3.7%) | 1,203 (3.9%) |
| 5 to 9 Years | 1,473 (5.4%) | 1,658 (5.4%) |
| 10 to 14 Years | 1,546 (5.6%) | 1,382 (4.5%) |
| 15 to 19 Years | 1,279 (4.7%) | 1,026 (3.3%) |
| 20 to 24 Years | 1,415 (5.1%) | 1,304 (4.2%) |
| 25 to 29 Years | 1,917 (7.0%) | 1,514 (4.9%) |
| 30 to 34 Years | 1,965 (7.2%) | 1,961 (6.3%) |
| 35 to 39 Years | 1,628 (5.9%) | 2,438 (7.9%) |
| 40 to 44 Years | 1,834 (6.7%) | 1,677 (5.4%) |
| 45 to 49 Years | 1,530 (5.6%) | 1,471 (4.8%) |
| 50 to 54 Years | 1,620 (5.9%) | 2,354 (7.6%) |
| 55 to 59 Years | 1,996 (7.3%) | 2,079 (6.7%) |
| 60 to 64 Years | 2,206 (8.0%) | 3,171 (10.2%) |
| 65 to 69 Years | 2,439 (8.9%) | 2,420 (7.8%) |
| 70 to 74 Years | 1,487 (5.4%) | 2,591 (8.4%) |
| 75 to 79 Years | 1,011 (3.7%) | 999 (3.2%) |
| 80 to 84 Years | 548 (2.0%) | 957 (3.1%) |
| 85 Years and over | 553 (2.0%) | 730 (2.4%) |
| Total | 27,461 (100.0%) | 30,935 (100.0%) |
Families and Households in Margate
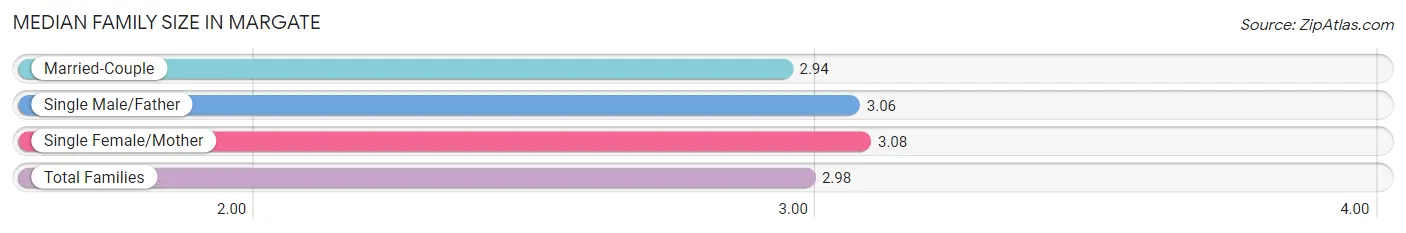
Median Family Size in Margate
The median family size in Margate is 2.98 persons per family, with single female/mother families (3,056 | 20.0%) accounting for the largest median family size of 3.08 persons per family. On the other hand, married-couple families (10,954 | 71.6%) represent the smallest median family size with 2.94 persons per family.
| Family Type | # Families | Family Size |
| Married-Couple | 10,954 (71.6%) | 2.94 |
| Single Male/Father | 1,297 (8.5%) | 3.06 |
| Single Female/Mother | 3,056 (20.0%) | 3.08 |
| Total Families | 15,307 (100.0%) | 2.98 |
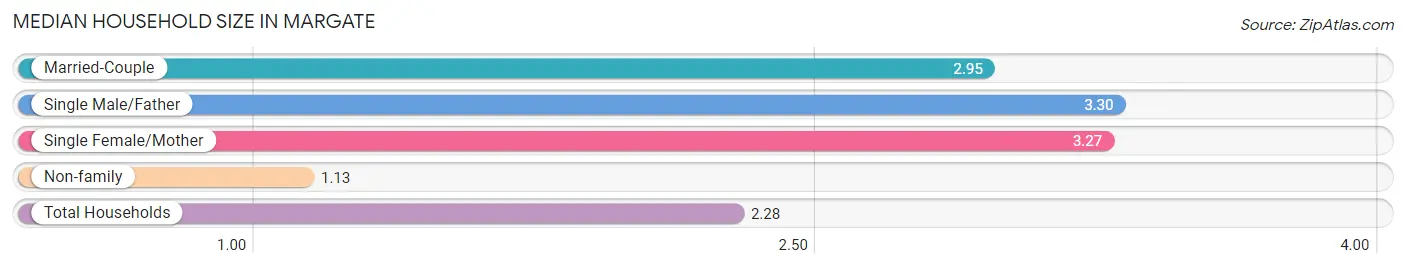
Median Household Size in Margate
The median household size in Margate is 2.28 persons per household, with single male/father households (1,297 | 5.1%) accounting for the largest median household size of 3.3 persons per household. non-family households (10,161 | 39.9%) represent the smallest median household size with 1.13 persons per household.
| Household Type | # Households | Household Size |
| Married-Couple | 10,954 (43.0%) | 2.95 |
| Single Male/Father | 1,297 (5.1%) | 3.30 |
| Single Female/Mother | 3,056 (12.0%) | 3.27 |
| Non-family | 10,161 (39.9%) | 1.13 |
| Total Households | 25,468 (100.0%) | 2.28 |
Household Size by Marriage Status in Margate
Out of a total of 25,468 households in Margate, 15,307 (60.1%) are family households, while 10,161 (39.9%) are nonfamily households. The most numerous type of family households are 2-person households, comprising 8,063, and the most common type of nonfamily households are 1-person households, comprising 8,989.
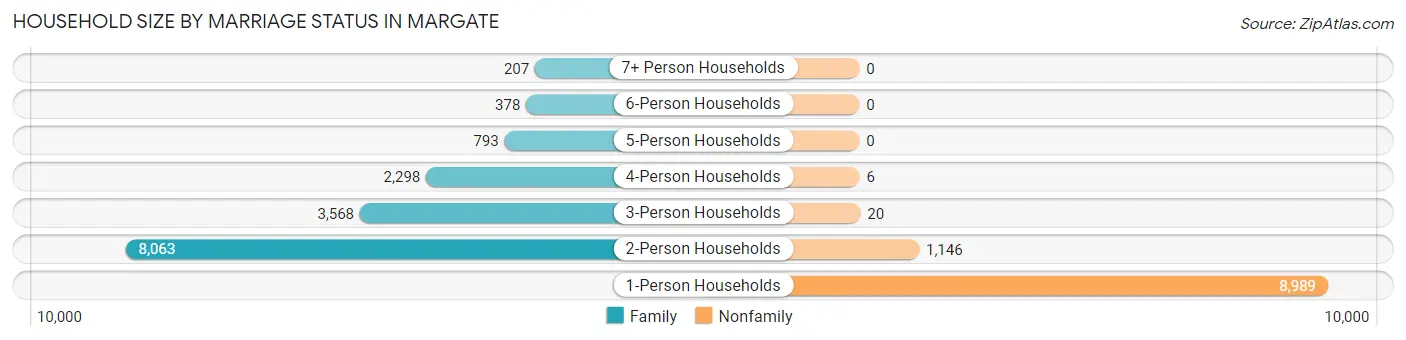
| Household Size | Family Households | Nonfamily Households |
| 1-Person Households | - | 8,989 (35.3%) |
| 2-Person Households | 8,063 (31.7%) | 1,146 (4.5%) |
| 3-Person Households | 3,568 (14.0%) | 20 (0.1%) |
| 4-Person Households | 2,298 (9.0%) | 6 (0.0%) |
| 5-Person Households | 793 (3.1%) | 0 (0.0%) |
| 6-Person Households | 378 (1.5%) | 0 (0.0%) |
| 7+ Person Households | 207 (0.8%) | 0 (0.0%) |
| Total | 15,307 (60.1%) | 10,161 (39.9%) |
Female Fertility in Margate
Fertility by Age in Margate
Average fertility rate in Margate is 36.0 births per 1,000 women. Women in the age bracket of 20 to 34 years have the highest fertility rate with 56.0 births per 1,000 women. Women in the age bracket of 20 to 34 years acount for 62.6% of all women with births.
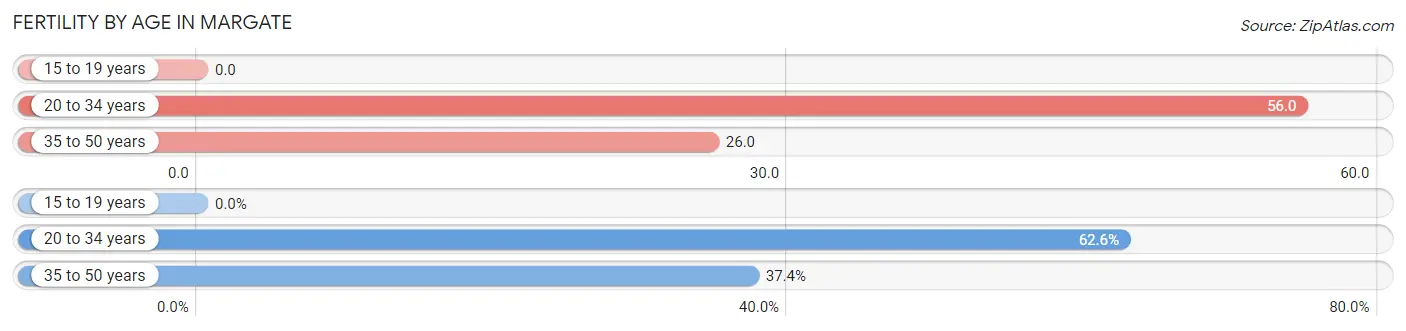
| Age Bracket | Women with Births | Births / 1,000 Women |
| 15 to 19 years | 0 (0.0%) | 0.0 |
| 20 to 34 years | 268 (62.6%) | 56.0 |
| 35 to 50 years | 160 (37.4%) | 26.0 |
| Total | 428 (100.0%) | 36.0 |
Fertility by Age by Marriage Status in Margate
41.6% of women with births (428) in Margate are married. The highest percentage of unmarried women with births falls into 20 to 34 years age bracket with 59.0% of them unmarried at the time of birth, while the lowest percentage of unmarried women with births belong to 35 to 50 years age bracket with 57.5% of them unmarried.
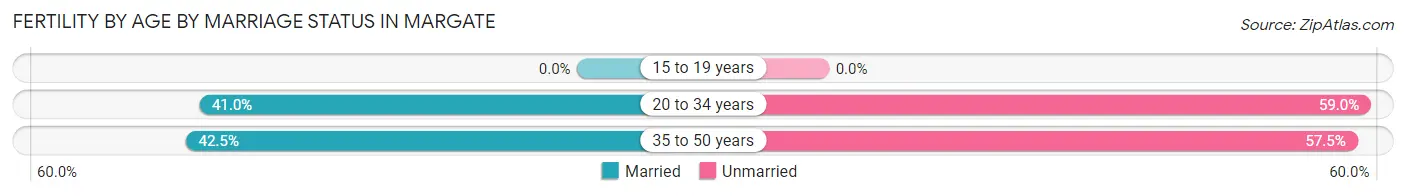
| Age Bracket | Married | Unmarried |
| 15 to 19 years | 0 (0.0%) | 0 (0.0%) |
| 20 to 34 years | 110 (41.0%) | 158 (59.0%) |
| 35 to 50 years | 68 (42.5%) | 92 (57.5%) |
| Total | 178 (41.6%) | 250 (58.4%) |
Fertility by Education in Margate
Average fertility rate in Margate is 36.0 births per 1,000 women. Women with the education attainment of bachelor's degree have the highest fertility rate of 64.0 births per 1,000 women, while women with the education attainment of less than high school have the lowest fertility at 13.0 births per 1,000 women. Women with the education attainment of bachelor's degree represent 40.6% of all women with births.
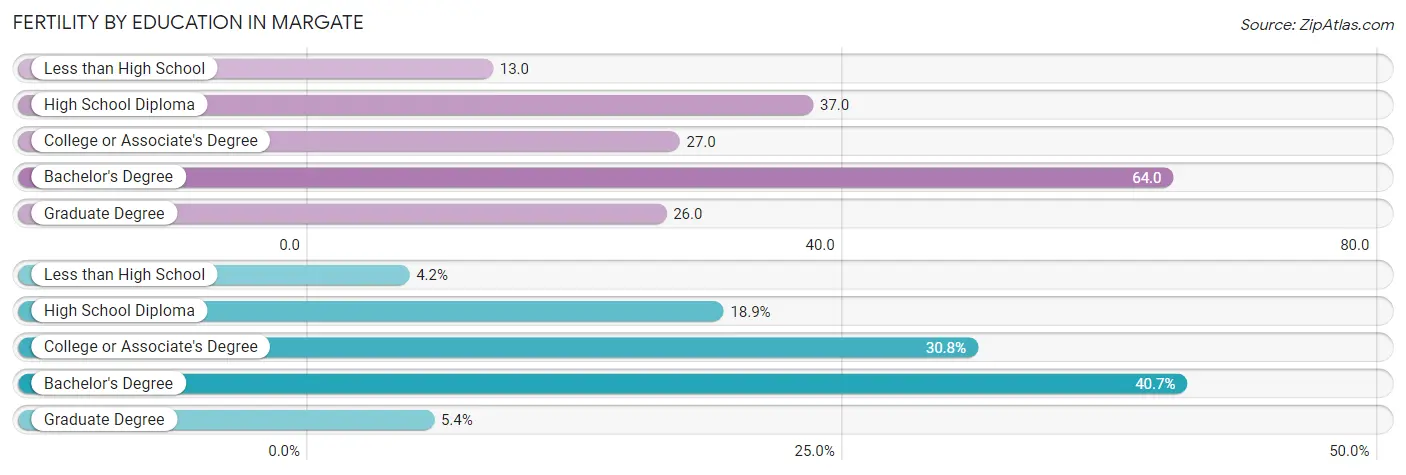
| Educational Attainment | Women with Births | Births / 1,000 Women |
| Less than High School | 18 (4.2%) | 13.0 |
| High School Diploma | 81 (18.9%) | 37.0 |
| College or Associate's Degree | 132 (30.8%) | 27.0 |
| Bachelor's Degree | 174 (40.6%) | 64.0 |
| Graduate Degree | 23 (5.4%) | 26.0 |
| Total | 428 (100.0%) | 36.0 |
Fertility by Education by Marriage Status in Margate
58.4% of women with births in Margate are unmarried. Women with the educational attainment of less than high school are most likely to be married with 100.0% of them married at childbirth, while women with the educational attainment of high school diploma are least likely to be married with 88.9% of them unmarried at childbirth.
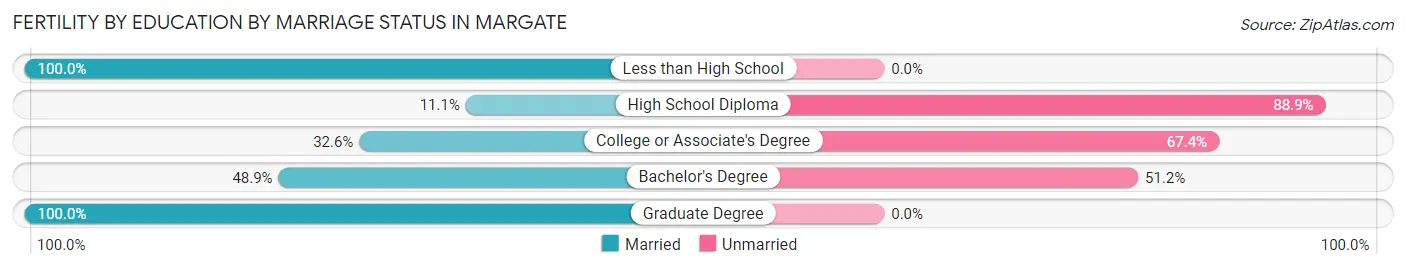
| Educational Attainment | Married | Unmarried |
| Less than High School | 18 (100.0%) | 0 (0.0%) |
| High School Diploma | 9 (11.1%) | 72 (88.9%) |
| College or Associate's Degree | 43 (32.6%) | 89 (67.4%) |
| Bachelor's Degree | 85 (48.8%) | 89 (51.1%) |
| Graduate Degree | 23 (100.0%) | 0 (0.0%) |
| Total | 178 (41.6%) | 250 (58.4%) |
Employment Characteristics in Margate
Employment by Class of Employer in Margate
Among the 29,732 employed individuals in Margate, private company employees (21,101 | 71.0%), local government employees (2,682 | 9.0%), and self-employed (not incorporated) (1,758 | 5.9%) make up the most common classes of employment.
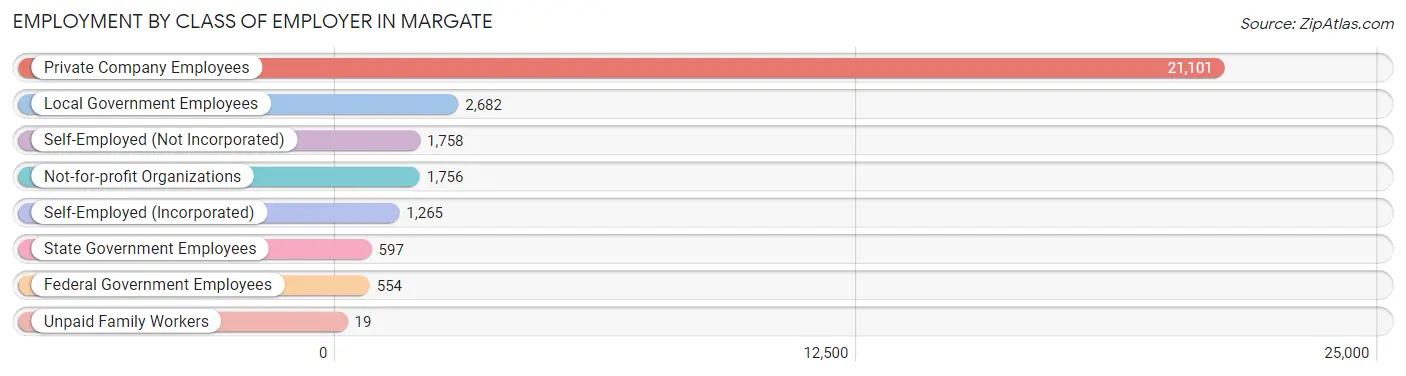
| Employer Class | # Employees | % Employees |
| Private Company Employees | 21,101 | 71.0% |
| Self-Employed (Incorporated) | 1,265 | 4.3% |
| Self-Employed (Not Incorporated) | 1,758 | 5.9% |
| Not-for-profit Organizations | 1,756 | 5.9% |
| Local Government Employees | 2,682 | 9.0% |
| State Government Employees | 597 | 2.0% |
| Federal Government Employees | 554 | 1.9% |
| Unpaid Family Workers | 19 | 0.1% |
| Total | 29,732 | 100.0% |
Employment Status by Age in Margate
According to the labor force statistics for Margate, out of the total population over 16 years of age (49,864), 63.7% or 31,763 individuals are in the labor force, with 4.2% or 1,334 of them unemployed. The age group with the highest labor force participation rate is 35 to 44 years, with 89.5% or 6,781 individuals in the labor force. Within the labor force, the 16 to 19 years age range has the highest percentage of unemployed individuals, with 24.6% or 131 of them being unemployed.
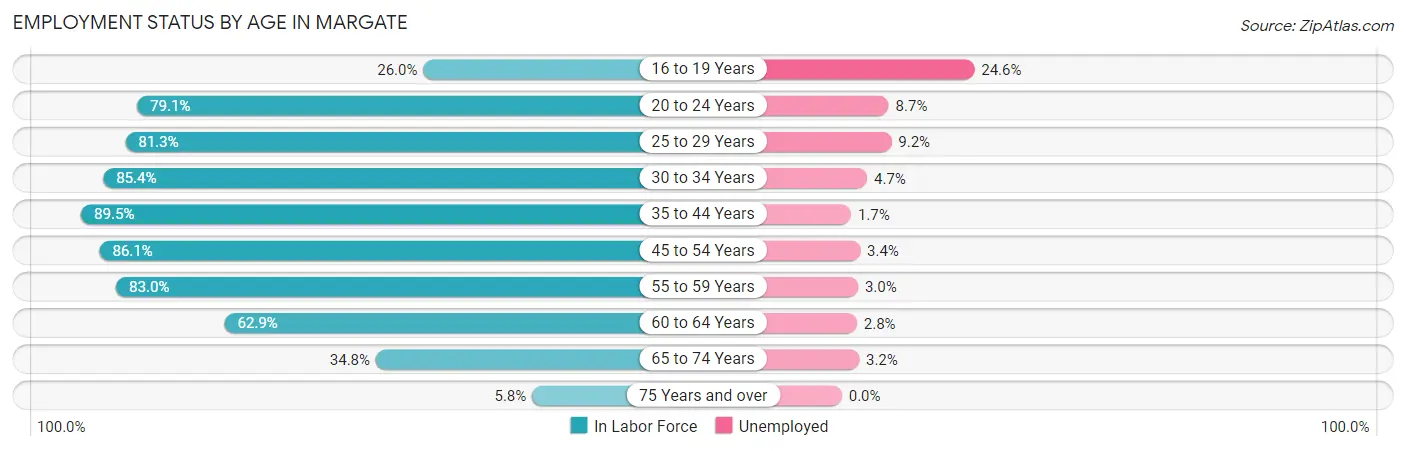
| Age Bracket | In Labor Force | Unemployed |
| 16 to 19 Years | 533 (26.0%) | 131 (24.6%) |
| 20 to 24 Years | 2,151 (79.1%) | 187 (8.7%) |
| 25 to 29 Years | 2,789 (81.3%) | 257 (9.2%) |
| 30 to 34 Years | 3,353 (85.4%) | 158 (4.7%) |
| 35 to 44 Years | 6,781 (89.5%) | 115 (1.7%) |
| 45 to 54 Years | 6,005 (86.1%) | 204 (3.4%) |
| 55 to 59 Years | 3,382 (83.0%) | 101 (3.0%) |
| 60 to 64 Years | 3,382 (62.9%) | 95 (2.8%) |
| 65 to 74 Years | 3,110 (34.8%) | 100 (3.2%) |
| 75 Years and over | 278 (5.8%) | 0 (0.0%) |
| Total | 31,763 (63.7%) | 1,334 (4.2%) |
Employment Status by Educational Attainment in Margate
According to labor force statistics for Margate, 81.9% of individuals (25,685) out of the total population between 25 and 64 years of age (31,361) are in the labor force, with 3.6% or 925 of them being unemployed. The group with the highest labor force participation rate are those with the educational attainment of college / associate degree, with 86.6% or 8,976 individuals in the labor force. Within the labor force, individuals with less than high school education have the highest percentage of unemployment, with 9.4% or 193 of them being unemployed.
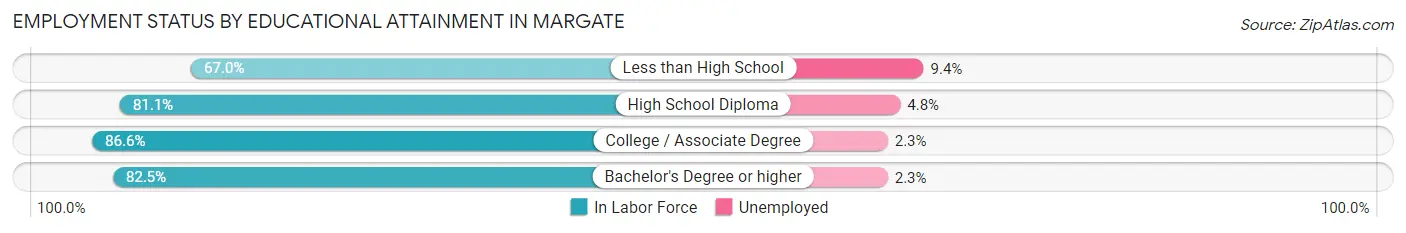
| Educational Attainment | In Labor Force | Unemployed |
| Less than High School | 2,052 (67.0%) | 288 (9.4%) |
| High School Diploma | 7,598 (81.1%) | 450 (4.8%) |
| College / Associate Degree | 8,976 (86.6%) | 238 (2.3%) |
| Bachelor's Degree or higher | 7,066 (82.5%) | 197 (2.3%) |
| Total | 25,685 (81.9%) | 1,129 (3.6%) |
Employment Occupations by Sex in Margate
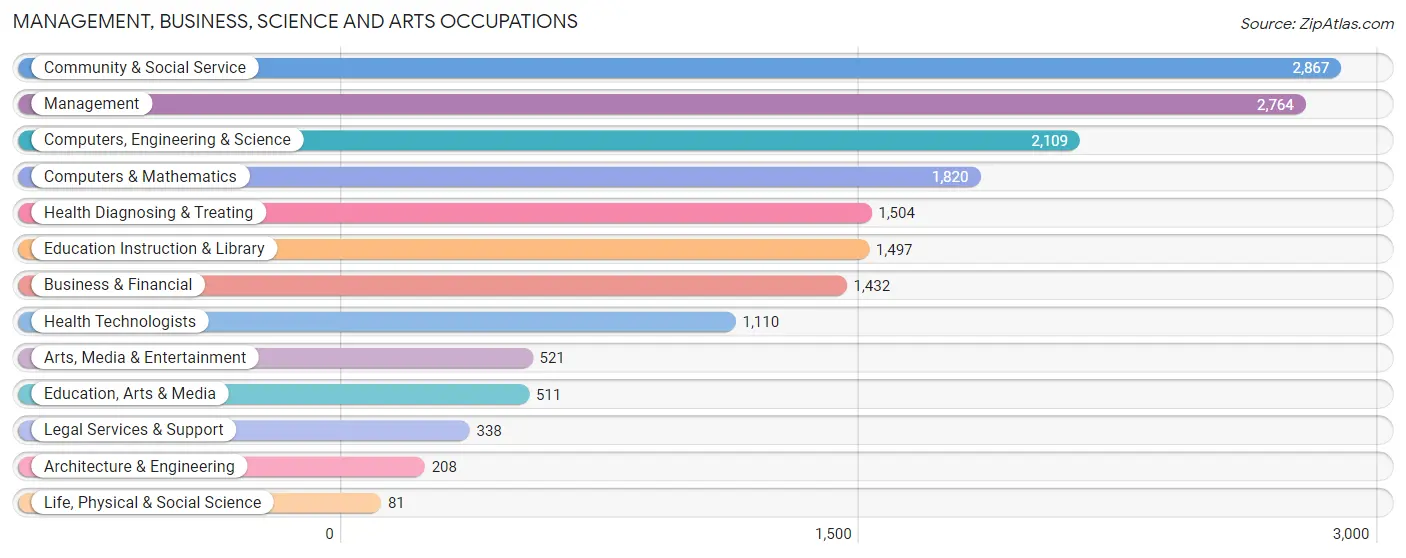
Management, Business, Science and Arts Occupations
The most common Management, Business, Science and Arts occupations in Margate are Community & Social Service (2,867 | 9.5%), Management (2,764 | 9.1%), Computers, Engineering & Science (2,109 | 7.0%), Computers & Mathematics (1,820 | 6.0%), and Health Diagnosing & Treating (1,504 | 5.0%).
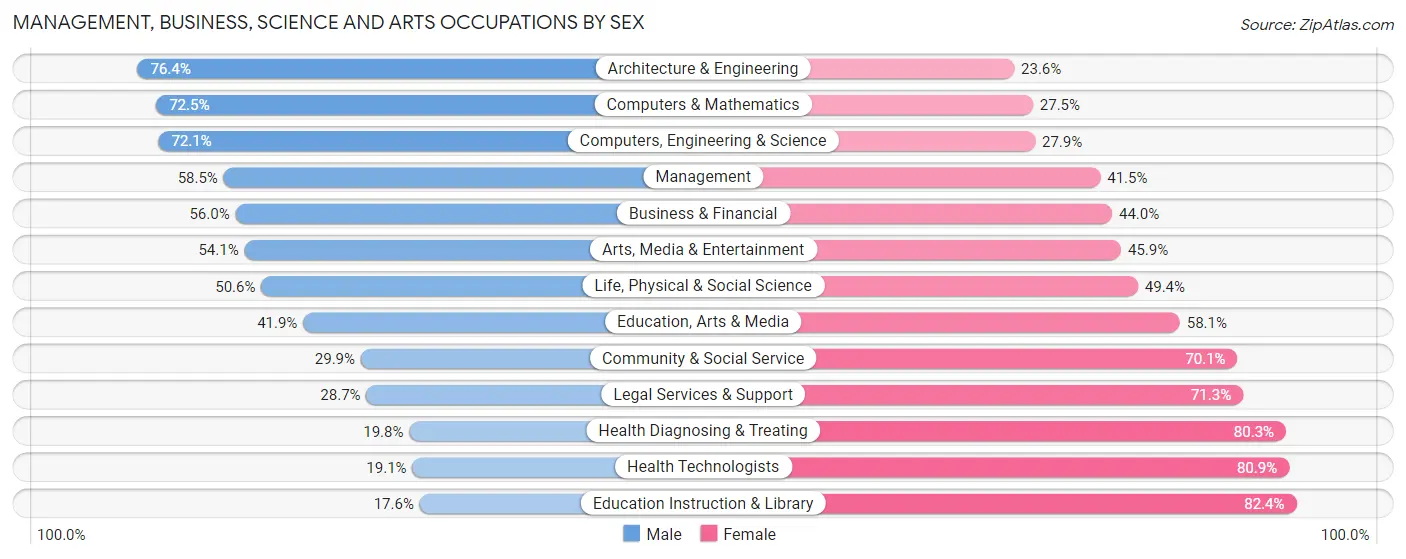
Management, Business, Science and Arts Occupations by Sex
Within the Management, Business, Science and Arts occupations in Margate, the most male-oriented occupations are Architecture & Engineering (76.4%), Computers & Mathematics (72.5%), and Computers, Engineering & Science (72.1%), while the most female-oriented occupations are Education Instruction & Library (82.4%), Health Technologists (80.9%), and Health Diagnosing & Treating (80.2%).
| Occupation | Male | Female |
| Management | 1,616 (58.5%) | 1,148 (41.5%) |
| Business & Financial | 802 (56.0%) | 630 (44.0%) |
| Computers, Engineering & Science | 1,520 (72.1%) | 589 (27.9%) |
| Computers & Mathematics | 1,320 (72.5%) | 500 (27.5%) |
| Architecture & Engineering | 159 (76.4%) | 49 (23.6%) |
| Life, Physical & Social Science | 41 (50.6%) | 40 (49.4%) |
| Community & Social Service | 856 (29.9%) | 2,011 (70.1%) |
| Education, Arts & Media | 214 (41.9%) | 297 (58.1%) |
| Legal Services & Support | 97 (28.7%) | 241 (71.3%) |
| Education Instruction & Library | 263 (17.6%) | 1,234 (82.4%) |
| Arts, Media & Entertainment | 282 (54.1%) | 239 (45.9%) |
| Health Diagnosing & Treating | 297 (19.8%) | 1,207 (80.2%) |
| Health Technologists | 212 (19.1%) | 898 (80.9%) |
| Total (Category) | 5,091 (47.7%) | 5,585 (52.3%) |
| Total (Overall) | 15,243 (50.3%) | 15,051 (49.7%) |
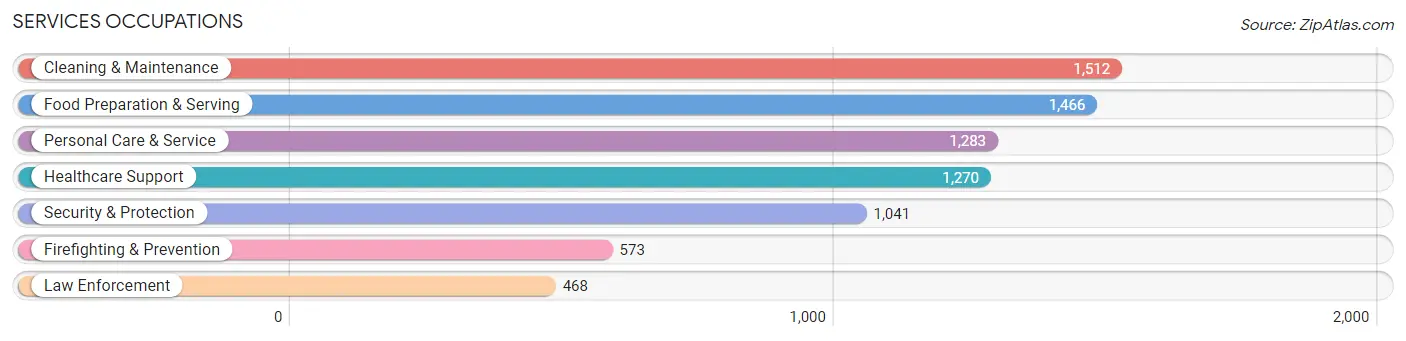
Services Occupations
The most common Services occupations in Margate are Cleaning & Maintenance (1,512 | 5.0%), Food Preparation & Serving (1,466 | 4.8%), Personal Care & Service (1,283 | 4.2%), Healthcare Support (1,270 | 4.2%), and Security & Protection (1,041 | 3.4%).
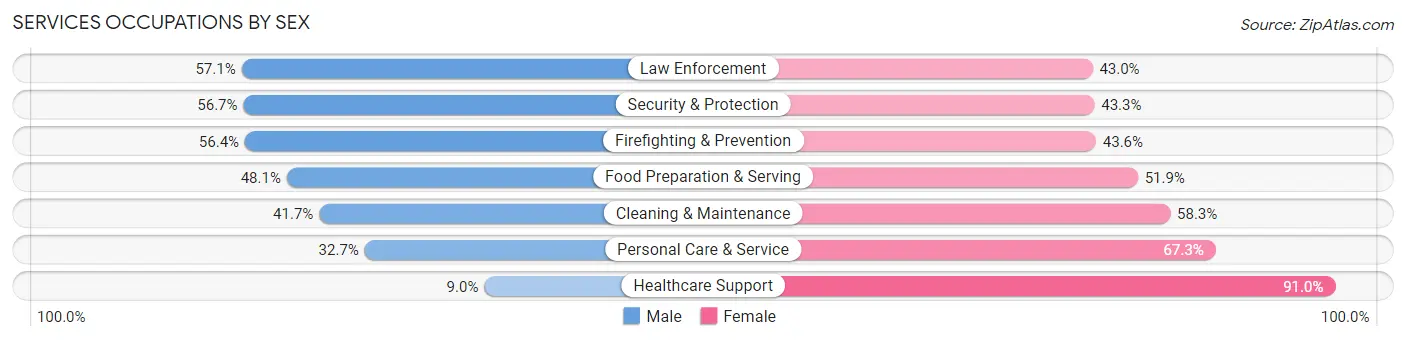
Services Occupations by Sex
Within the Services occupations in Margate, the most male-oriented occupations are Law Enforcement (57.1%), Security & Protection (56.7%), and Firefighting & Prevention (56.4%), while the most female-oriented occupations are Healthcare Support (91.0%), Personal Care & Service (67.3%), and Cleaning & Maintenance (58.3%).
| Occupation | Male | Female |
| Healthcare Support | 114 (9.0%) | 1,156 (91.0%) |
| Security & Protection | 590 (56.7%) | 451 (43.3%) |
| Firefighting & Prevention | 323 (56.4%) | 250 (43.6%) |
| Law Enforcement | 267 (57.1%) | 201 (42.9%) |
| Food Preparation & Serving | 705 (48.1%) | 761 (51.9%) |
| Cleaning & Maintenance | 630 (41.7%) | 882 (58.3%) |
| Personal Care & Service | 419 (32.7%) | 864 (67.3%) |
| Total (Category) | 2,458 (37.4%) | 4,114 (62.6%) |
| Total (Overall) | 15,243 (50.3%) | 15,051 (49.7%) |
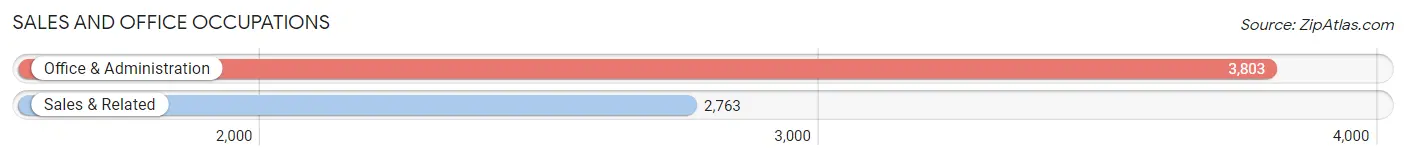
Sales and Office Occupations
The most common Sales and Office occupations in Margate are Office & Administration (3,803 | 12.6%), and Sales & Related (2,763 | 9.1%).
Sales and Office Occupations by Sex
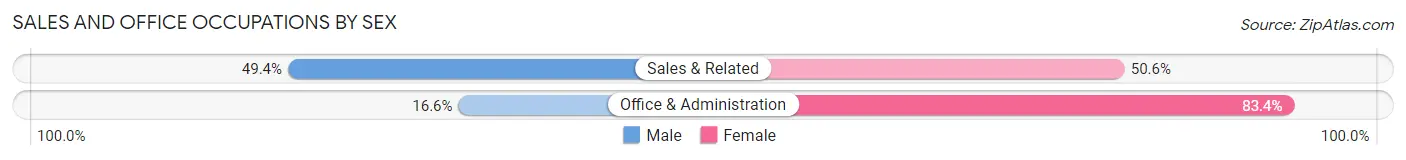
| Occupation | Male | Female |
| Sales & Related | 1,364 (49.4%) | 1,399 (50.6%) |
| Office & Administration | 631 (16.6%) | 3,172 (83.4%) |
| Total (Category) | 1,995 (30.4%) | 4,571 (69.6%) |
| Total (Overall) | 15,243 (50.3%) | 15,051 (49.7%) |
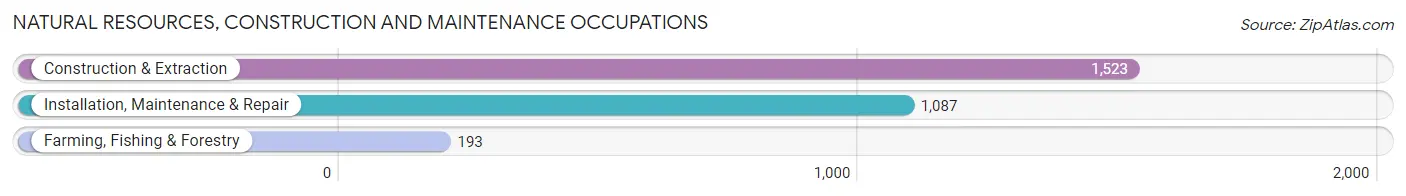
Natural Resources, Construction and Maintenance Occupations
The most common Natural Resources, Construction and Maintenance occupations in Margate are Construction & Extraction (1,523 | 5.0%), Installation, Maintenance & Repair (1,087 | 3.6%), and Farming, Fishing & Forestry (193 | 0.6%).
Natural Resources, Construction and Maintenance Occupations by Sex
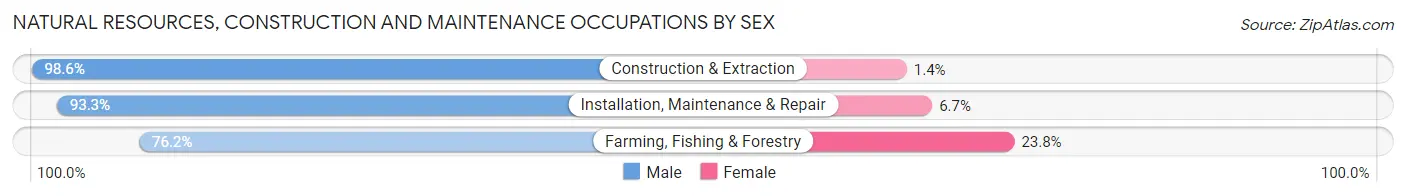
| Occupation | Male | Female |
| Farming, Fishing & Forestry | 147 (76.2%) | 46 (23.8%) |
| Construction & Extraction | 1,501 (98.6%) | 22 (1.4%) |
| Installation, Maintenance & Repair | 1,014 (93.3%) | 73 (6.7%) |
| Total (Category) | 2,662 (95.0%) | 141 (5.0%) |
| Total (Overall) | 15,243 (50.3%) | 15,051 (49.7%) |
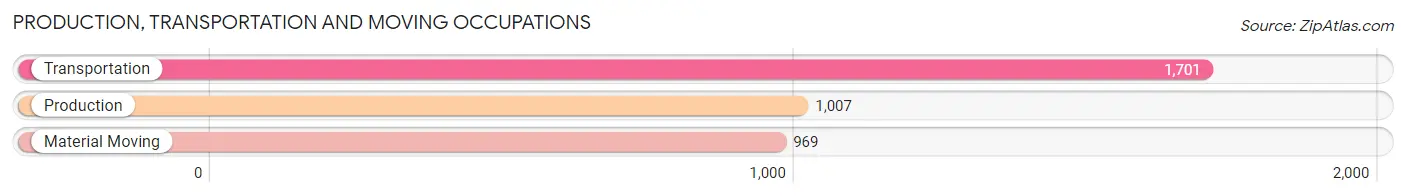
Production, Transportation and Moving Occupations
The most common Production, Transportation and Moving occupations in Margate are Transportation (1,701 | 5.6%), Production (1,007 | 3.3%), and Material Moving (969 | 3.2%).
Production, Transportation and Moving Occupations by Sex
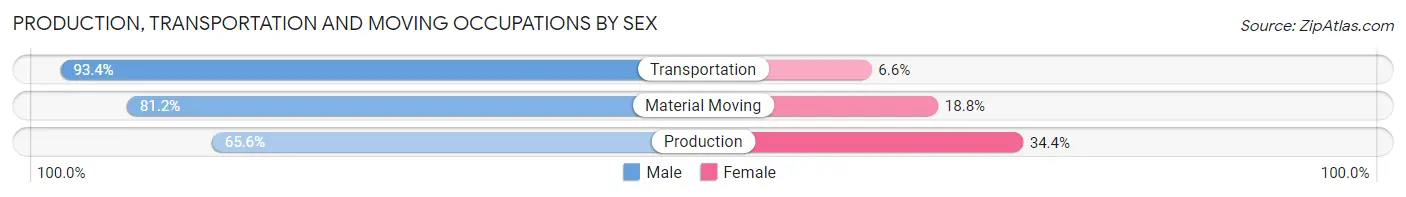
| Occupation | Male | Female |
| Production | 661 (65.6%) | 346 (34.4%) |
| Transportation | 1,589 (93.4%) | 112 (6.6%) |
| Material Moving | 787 (81.2%) | 182 (18.8%) |
| Total (Category) | 3,037 (82.6%) | 640 (17.4%) |
| Total (Overall) | 15,243 (50.3%) | 15,051 (49.7%) |
Employment Industries by Sex in Margate
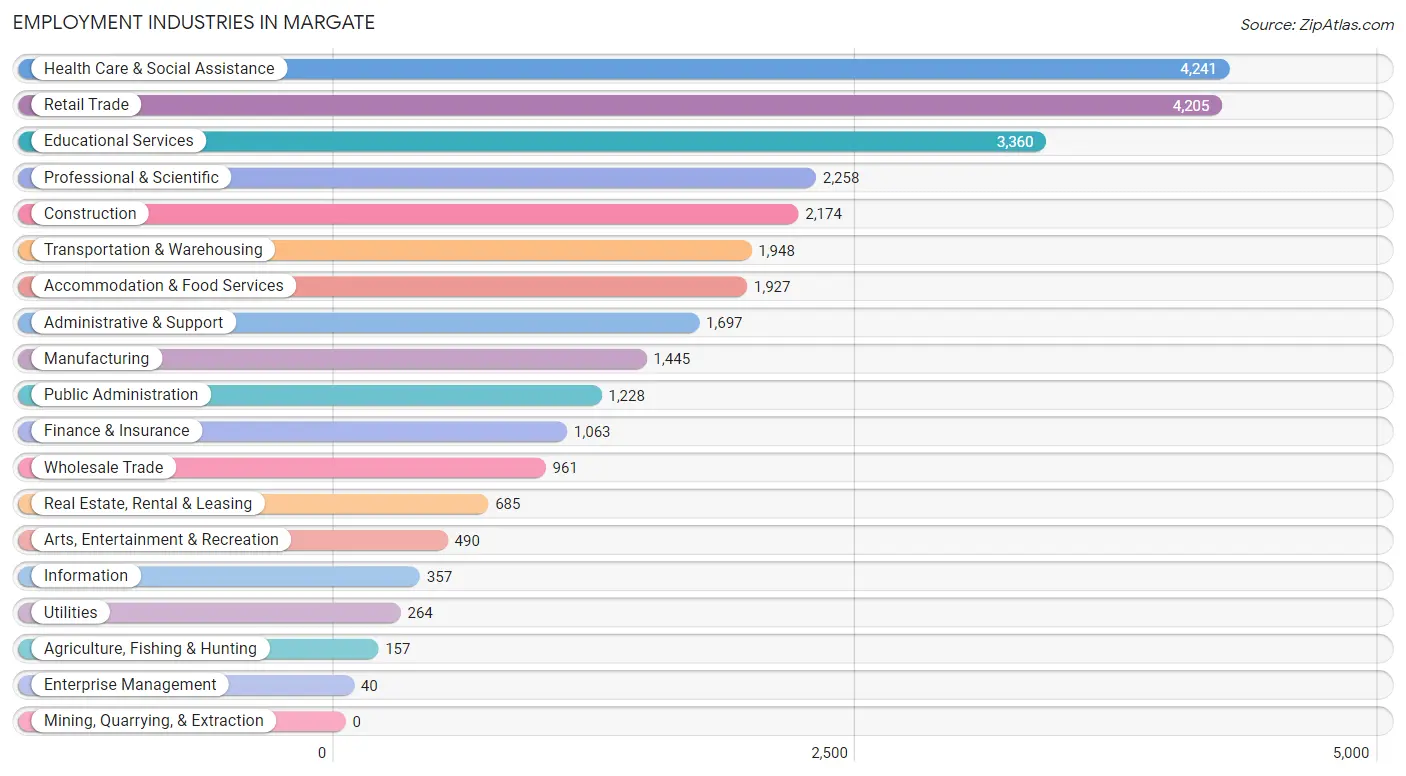
Employment Industries in Margate
The major employment industries in Margate include Health Care & Social Assistance (4,241 | 14.0%), Retail Trade (4,205 | 13.9%), Educational Services (3,360 | 11.1%), Professional & Scientific (2,258 | 7.4%), and Construction (2,174 | 7.2%).
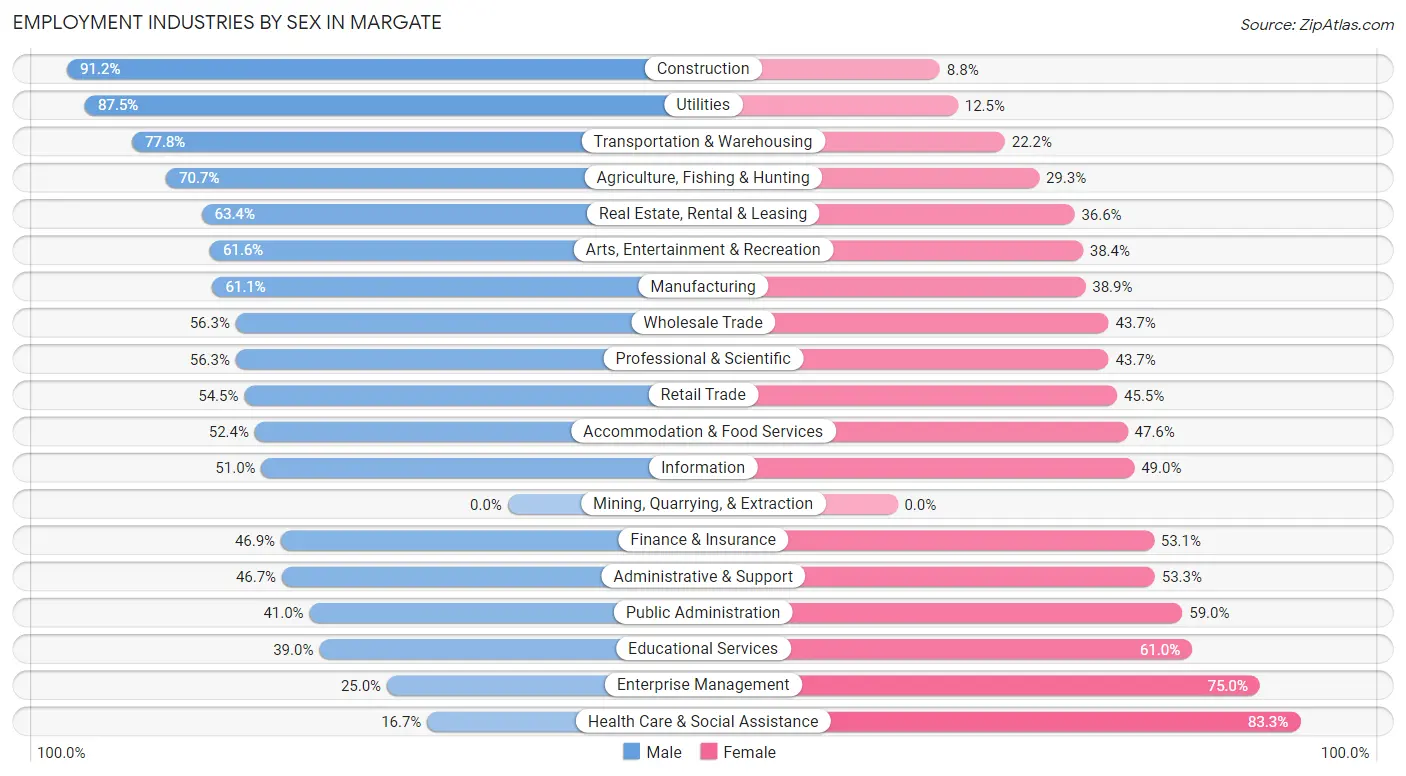
Employment Industries by Sex in Margate
The Margate industries that see more men than women are Construction (91.2%), Utilities (87.5%), and Transportation & Warehousing (77.8%), whereas the industries that tend to have a higher number of women are Health Care & Social Assistance (83.3%), Enterprise Management (75.0%), and Educational Services (61.0%).
| Industry | Male | Female |
| Agriculture, Fishing & Hunting | 111 (70.7%) | 46 (29.3%) |
| Mining, Quarrying, & Extraction | 0 (0.0%) | 0 (0.0%) |
| Construction | 1,983 (91.2%) | 191 (8.8%) |
| Manufacturing | 883 (61.1%) | 562 (38.9%) |
| Wholesale Trade | 541 (56.3%) | 420 (43.7%) |
| Retail Trade | 2,293 (54.5%) | 1,912 (45.5%) |
| Transportation & Warehousing | 1,515 (77.8%) | 433 (22.2%) |
| Utilities | 231 (87.5%) | 33 (12.5%) |
| Information | 182 (51.0%) | 175 (49.0%) |
| Finance & Insurance | 499 (46.9%) | 564 (53.1%) |
| Real Estate, Rental & Leasing | 434 (63.4%) | 251 (36.6%) |
| Professional & Scientific | 1,271 (56.3%) | 987 (43.7%) |
| Enterprise Management | 10 (25.0%) | 30 (75.0%) |
| Administrative & Support | 793 (46.7%) | 904 (53.3%) |
| Educational Services | 1,311 (39.0%) | 2,049 (61.0%) |
| Health Care & Social Assistance | 707 (16.7%) | 3,534 (83.3%) |
| Arts, Entertainment & Recreation | 302 (61.6%) | 188 (38.4%) |
| Accommodation & Food Services | 1,009 (52.4%) | 918 (47.6%) |
| Public Administration | 504 (41.0%) | 724 (59.0%) |
| Total | 15,243 (50.3%) | 15,051 (49.7%) |
Education in Margate
School Enrollment in Margate
The most common levels of schooling among the 12,335 students in Margate are college / undergraduate (2,588 | 21.0%), middle school (2,497 | 20.2%), and elementary school (2,331 | 18.9%).
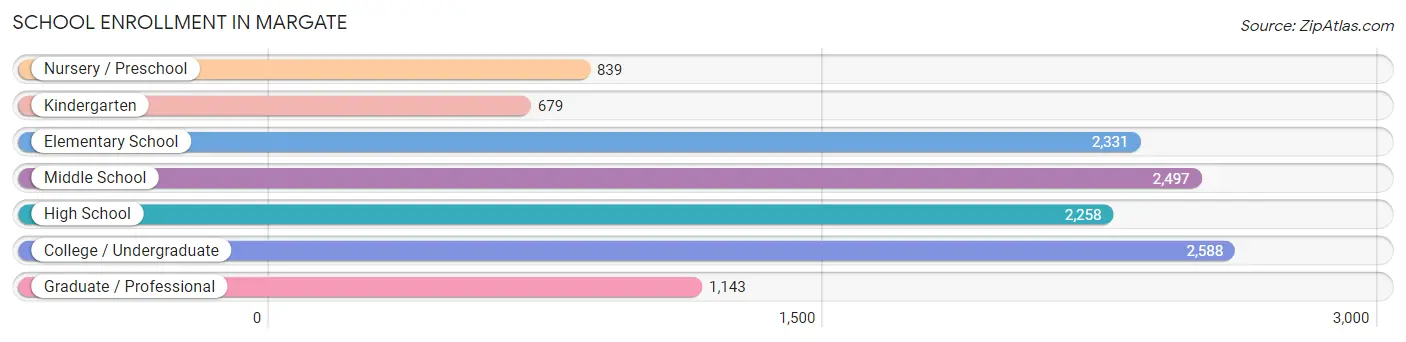
| School Level | # Students | % Students |
| Nursery / Preschool | 839 | 6.8% |
| Kindergarten | 679 | 5.5% |
| Elementary School | 2,331 | 18.9% |
| Middle School | 2,497 | 20.2% |
| High School | 2,258 | 18.3% |
| College / Undergraduate | 2,588 | 21.0% |
| Graduate / Professional | 1,143 | 9.3% |
| Total | 12,335 | 100.0% |
School Enrollment by Age by Funding Source in Margate
Out of a total of 12,335 students who are enrolled in schools in Margate, 2,183 (17.7%) attend a private institution, while the remaining 10,152 (82.3%) are enrolled in public schools. The age group of 3 to 4 year olds has the highest likelihood of being enrolled in private schools, with 279 (38.0% in the age bracket) enrolled. Conversely, the age group of 20 to 24 year olds has the lowest likelihood of being enrolled in a private school, with 1,225 (91.3% in the age bracket) attending a public institution.
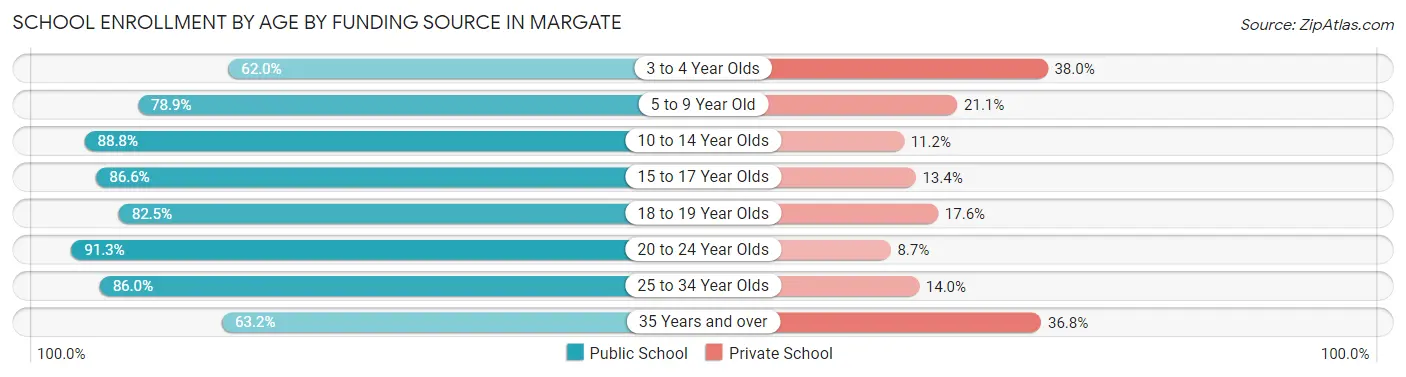
| Age Bracket | Public School | Private School |
| 3 to 4 Year Olds | 456 (62.0%) | 279 (38.0%) |
| 5 to 9 Year Old | 2,363 (78.9%) | 633 (21.1%) |
| 10 to 14 Year Olds | 2,445 (88.8%) | 308 (11.2%) |
| 15 to 17 Year Olds | 1,418 (86.6%) | 219 (13.4%) |
| 18 to 19 Year Olds | 404 (82.5%) | 86 (17.5%) |
| 20 to 24 Year Olds | 1,225 (91.3%) | 117 (8.7%) |
| 25 to 34 Year Olds | 1,265 (86.0%) | 206 (14.0%) |
| 35 Years and over | 576 (63.2%) | 335 (36.8%) |
| Total | 10,152 (82.3%) | 2,183 (17.7%) |
Educational Attainment by Field of Study in Margate
Business (2,937 | 23.6%), science & technology (1,333 | 10.7%), computers & mathematics (1,149 | 9.2%), education (1,054 | 8.5%), and social sciences (907 | 7.3%) are the most common fields of study among 12,445 individuals in Margate who have obtained a bachelor's degree or higher.
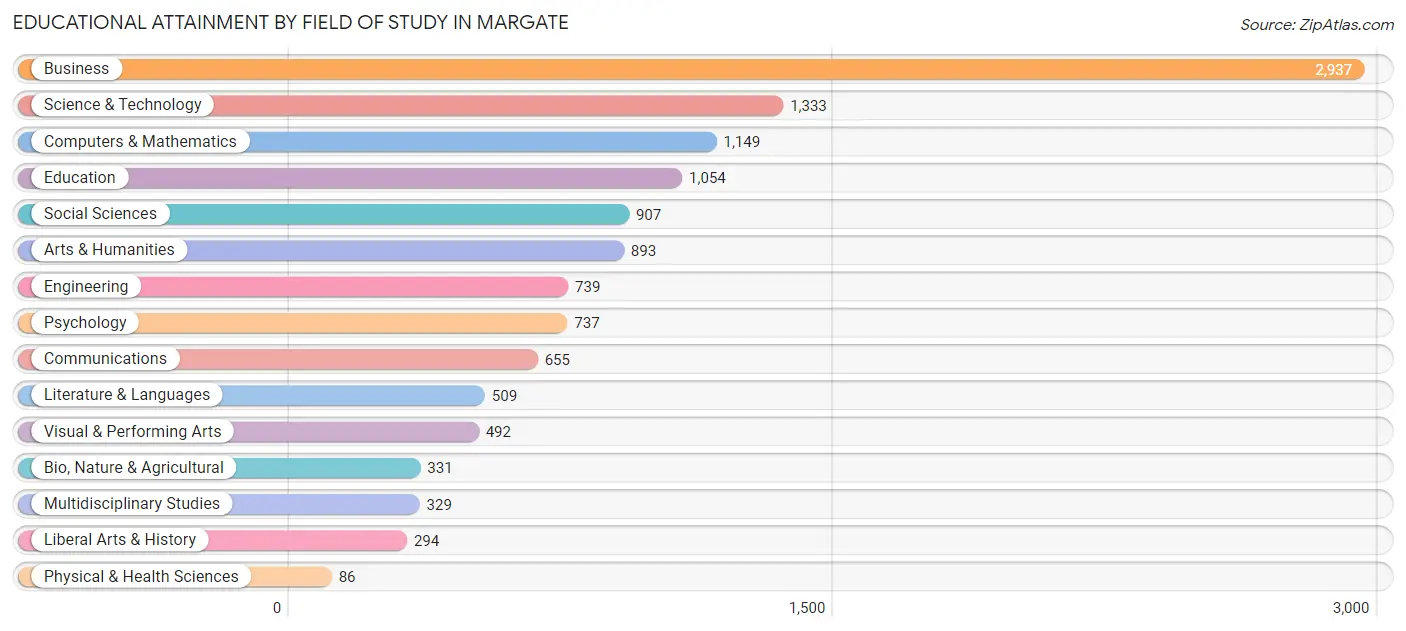
| Field of Study | # Graduates | % Graduates |
| Computers & Mathematics | 1,149 | 9.2% |
| Bio, Nature & Agricultural | 331 | 2.7% |
| Physical & Health Sciences | 86 | 0.7% |
| Psychology | 737 | 5.9% |
| Social Sciences | 907 | 7.3% |
| Engineering | 739 | 5.9% |
| Multidisciplinary Studies | 329 | 2.6% |
| Science & Technology | 1,333 | 10.7% |
| Business | 2,937 | 23.6% |
| Education | 1,054 | 8.5% |
| Literature & Languages | 509 | 4.1% |
| Liberal Arts & History | 294 | 2.4% |
| Visual & Performing Arts | 492 | 4.0% |
| Communications | 655 | 5.3% |
| Arts & Humanities | 893 | 7.2% |
| Total | 12,445 | 100.0% |
Transportation & Commute in Margate
Vehicle Availability by Sex in Margate
The most prevalent vehicle ownership categories in Margate are males with 2 vehicles (7,617, accounting for 50.9%) and females with 2 vehicles (7,012, making up 51.6%).
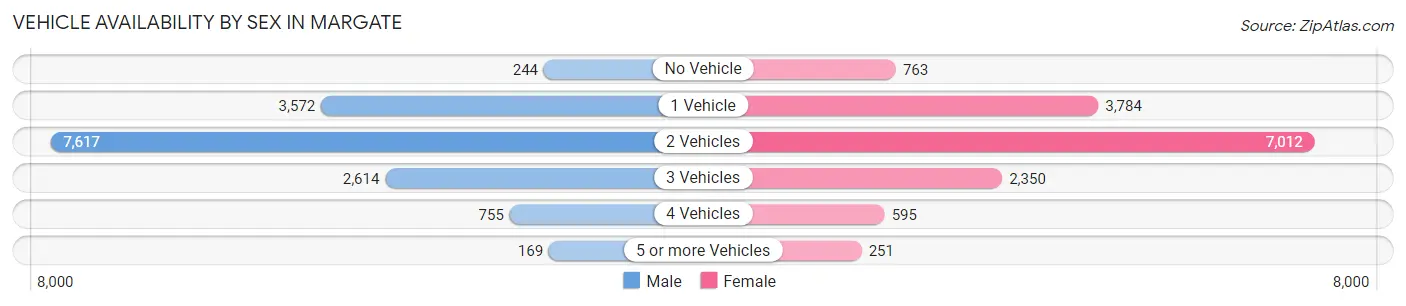
| Vehicles Available | Male | Female |
| No Vehicle | 244 (1.6%) | 763 (5.2%) |
| 1 Vehicle | 3,572 (23.9%) | 3,784 (25.7%) |
| 2 Vehicles | 7,617 (50.9%) | 7,012 (47.5%) |
| 3 Vehicles | 2,614 (17.5%) | 2,350 (15.9%) |
| 4 Vehicles | 755 (5.0%) | 595 (4.0%) |
| 5 or more Vehicles | 169 (1.1%) | 251 (1.7%) |
| Total | 14,971 (100.0%) | 14,755 (100.0%) |
Commute Time in Margate
The most frequently occuring commute durations in Margate are 30 to 34 minutes (5,228 commuters, 19.2%), 15 to 19 minutes (4,163 commuters, 15.3%), and 45 to 59 minutes (3,305 commuters, 12.1%).
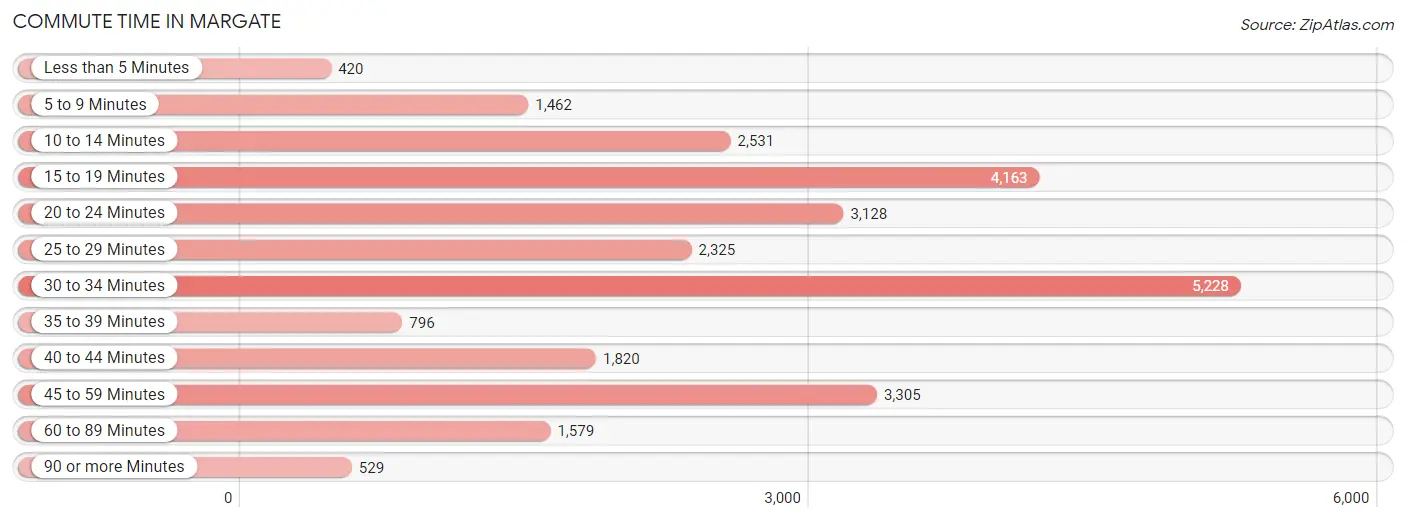
| Commute Time | # Commuters | % Commuters |
| Less than 5 Minutes | 420 | 1.5% |
| 5 to 9 Minutes | 1,462 | 5.4% |
| 10 to 14 Minutes | 2,531 | 9.3% |
| 15 to 19 Minutes | 4,163 | 15.3% |
| 20 to 24 Minutes | 3,128 | 11.5% |
| 25 to 29 Minutes | 2,325 | 8.5% |
| 30 to 34 Minutes | 5,228 | 19.2% |
| 35 to 39 Minutes | 796 | 2.9% |
| 40 to 44 Minutes | 1,820 | 6.7% |
| 45 to 59 Minutes | 3,305 | 12.1% |
| 60 to 89 Minutes | 1,579 | 5.8% |
| 90 or more Minutes | 529 | 1.9% |
Commute Time by Sex in Margate
The most common commute times in Margate are 30 to 34 minutes (2,476 commuters, 18.1%) for males and 30 to 34 minutes (2,752 commuters, 20.3%) for females.
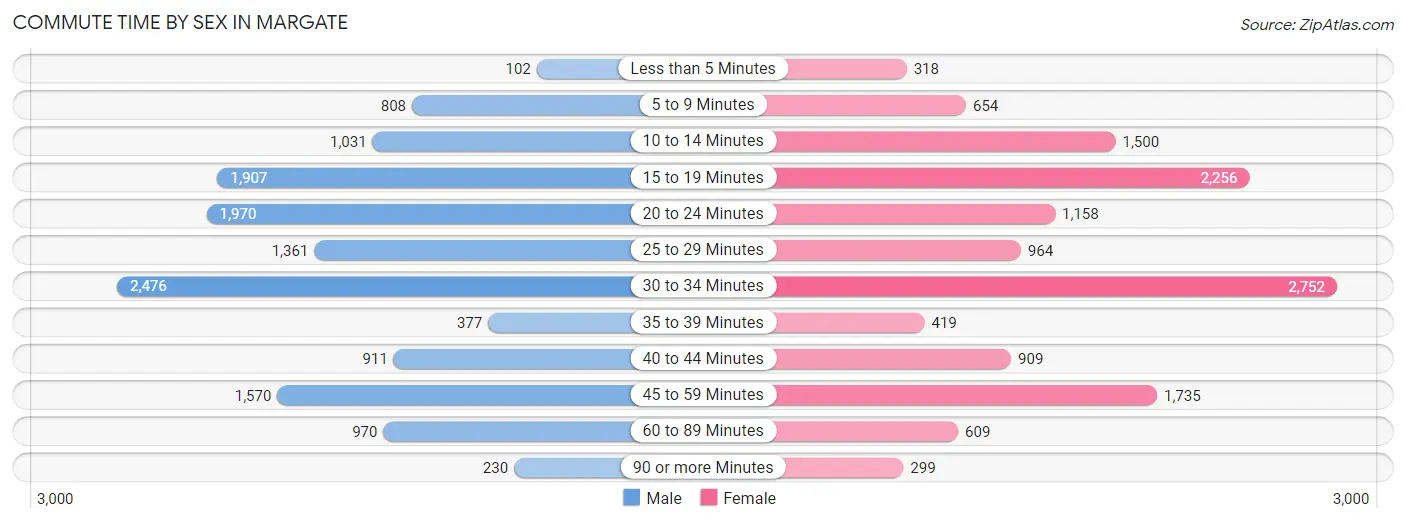
| Commute Time | Male | Female |
| Less than 5 Minutes | 102 (0.7%) | 318 (2.3%) |
| 5 to 9 Minutes | 808 (5.9%) | 654 (4.8%) |
| 10 to 14 Minutes | 1,031 (7.5%) | 1,500 (11.1%) |
| 15 to 19 Minutes | 1,907 (13.9%) | 2,256 (16.6%) |
| 20 to 24 Minutes | 1,970 (14.4%) | 1,158 (8.5%) |
| 25 to 29 Minutes | 1,361 (9.9%) | 964 (7.1%) |
| 30 to 34 Minutes | 2,476 (18.1%) | 2,752 (20.3%) |
| 35 to 39 Minutes | 377 (2.8%) | 419 (3.1%) |
| 40 to 44 Minutes | 911 (6.6%) | 909 (6.7%) |
| 45 to 59 Minutes | 1,570 (11.5%) | 1,735 (12.8%) |
| 60 to 89 Minutes | 970 (7.1%) | 609 (4.5%) |
| 90 or more Minutes | 230 (1.7%) | 299 (2.2%) |
Time of Departure to Work by Sex in Margate
The most frequent times of departure to work in Margate are 7:00 AM to 7:29 AM (2,160, 15.8%) for males and 7:00 AM to 7:29 AM (2,613, 19.3%) for females.
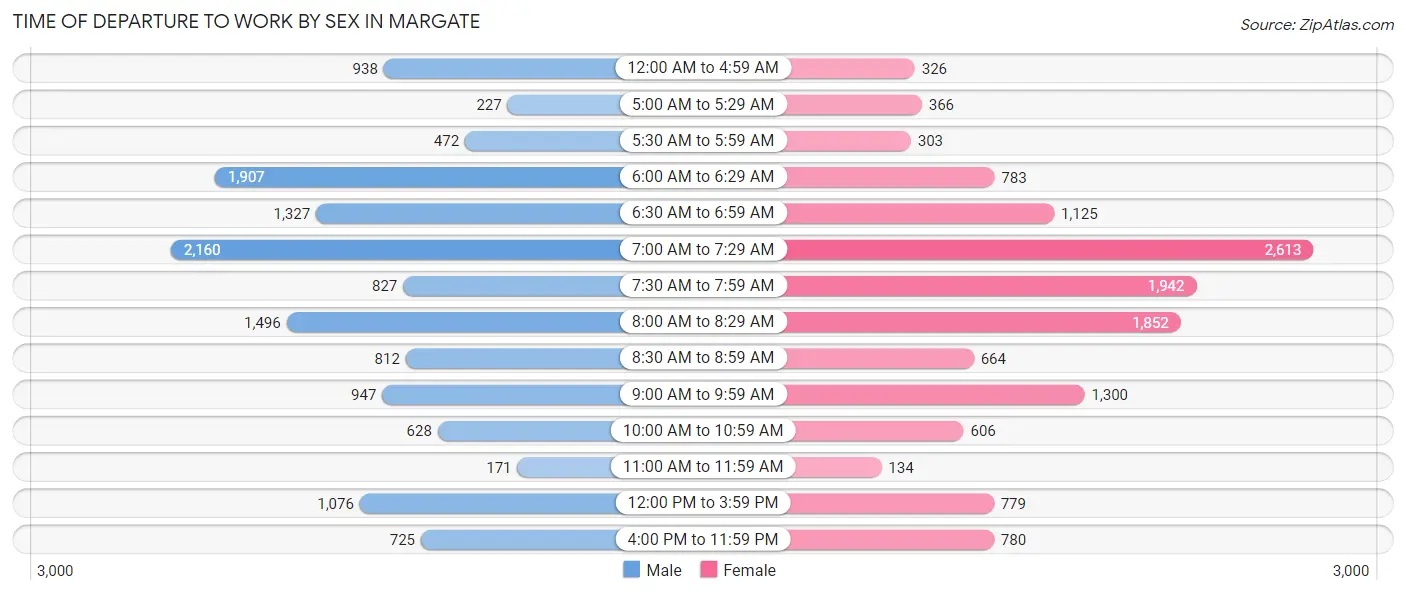
| Time of Departure | Male | Female |
| 12:00 AM to 4:59 AM | 938 (6.8%) | 326 (2.4%) |
| 5:00 AM to 5:29 AM | 227 (1.7%) | 366 (2.7%) |
| 5:30 AM to 5:59 AM | 472 (3.4%) | 303 (2.2%) |
| 6:00 AM to 6:29 AM | 1,907 (13.9%) | 783 (5.8%) |
| 6:30 AM to 6:59 AM | 1,327 (9.7%) | 1,125 (8.3%) |
| 7:00 AM to 7:29 AM | 2,160 (15.8%) | 2,613 (19.3%) |
| 7:30 AM to 7:59 AM | 827 (6.0%) | 1,942 (14.3%) |
| 8:00 AM to 8:29 AM | 1,496 (10.9%) | 1,852 (13.6%) |
| 8:30 AM to 8:59 AM | 812 (5.9%) | 664 (4.9%) |
| 9:00 AM to 9:59 AM | 947 (6.9%) | 1,300 (9.6%) |
| 10:00 AM to 10:59 AM | 628 (4.6%) | 606 (4.5%) |
| 11:00 AM to 11:59 AM | 171 (1.3%) | 134 (1.0%) |
| 12:00 PM to 3:59 PM | 1,076 (7.9%) | 779 (5.7%) |
| 4:00 PM to 11:59 PM | 725 (5.3%) | 780 (5.8%) |
| Total | 13,713 (100.0%) | 13,573 (100.0%) |
Housing Occupancy in Margate
Occupancy by Ownership in Margate
Of the total 25,468 dwellings in Margate, owner-occupied units account for 19,484 (76.5%), while renter-occupied units make up 5,984 (23.5%).
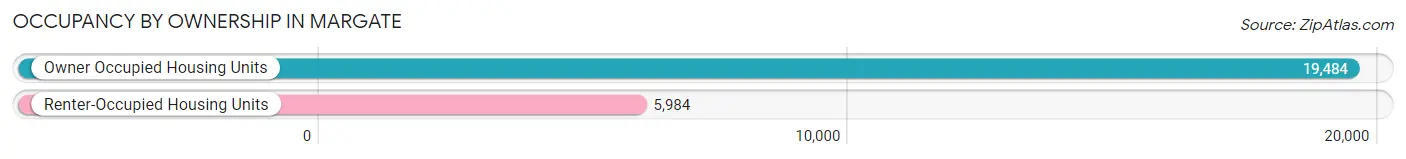
| Occupancy | # Housing Units | % Housing Units |
| Owner Occupied Housing Units | 19,484 | 76.5% |
| Renter-Occupied Housing Units | 5,984 | 23.5% |
| Total Occupied Housing Units | 25,468 | 100.0% |
Occupancy by Household Size in Margate
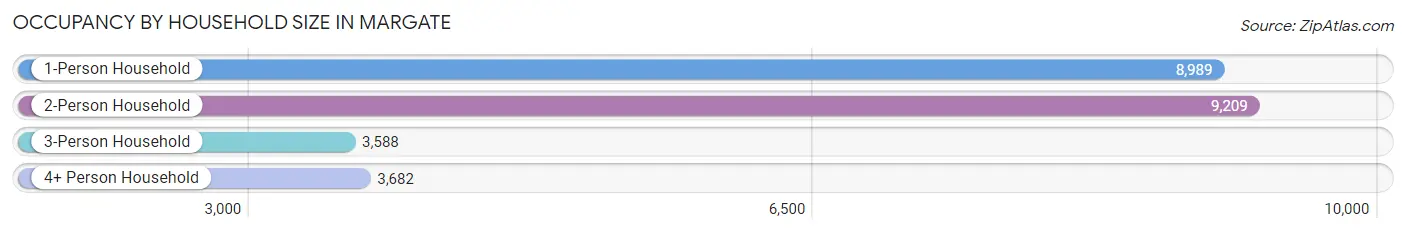
| Household Size | # Housing Units | % Housing Units |
| 1-Person Household | 8,989 | 35.3% |
| 2-Person Household | 9,209 | 36.2% |
| 3-Person Household | 3,588 | 14.1% |
| 4+ Person Household | 3,682 | 14.5% |
| Total Housing Units | 25,468 | 100.0% |
Occupancy by Ownership by Household Size in Margate
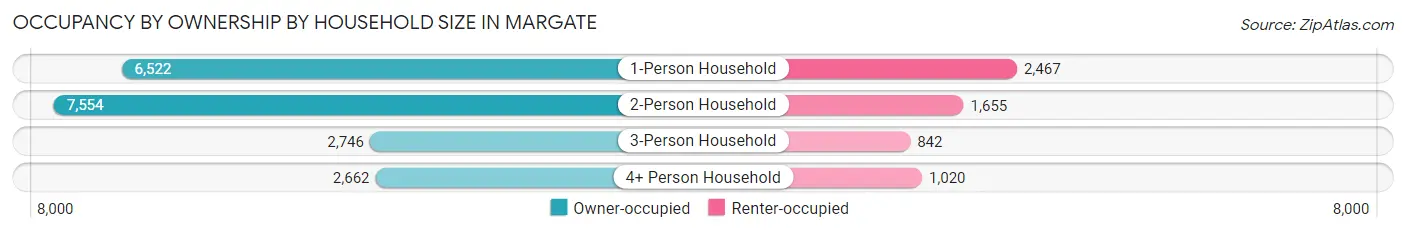
| Household Size | Owner-occupied | Renter-occupied |
| 1-Person Household | 6,522 (72.6%) | 2,467 (27.4%) |
| 2-Person Household | 7,554 (82.0%) | 1,655 (18.0%) |
| 3-Person Household | 2,746 (76.5%) | 842 (23.5%) |
| 4+ Person Household | 2,662 (72.3%) | 1,020 (27.7%) |
| Total Housing Units | 19,484 (76.5%) | 5,984 (23.5%) |
Occupancy by Educational Attainment in Margate
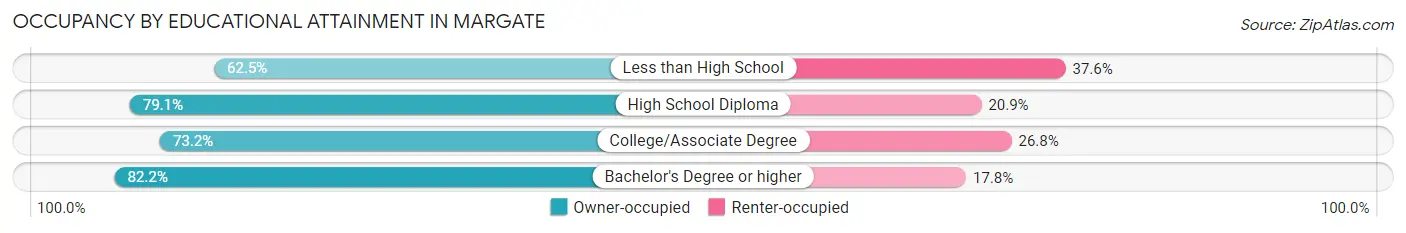
| Household Size | Owner-occupied | Renter-occupied |
| Less than High School | 1,515 (62.5%) | 911 (37.6%) |
| High School Diploma | 6,481 (79.1%) | 1,709 (20.9%) |
| College/Associate Degree | 5,815 (73.2%) | 2,133 (26.8%) |
| Bachelor's Degree or higher | 5,673 (82.2%) | 1,231 (17.8%) |
Occupancy by Age of Householder in Margate
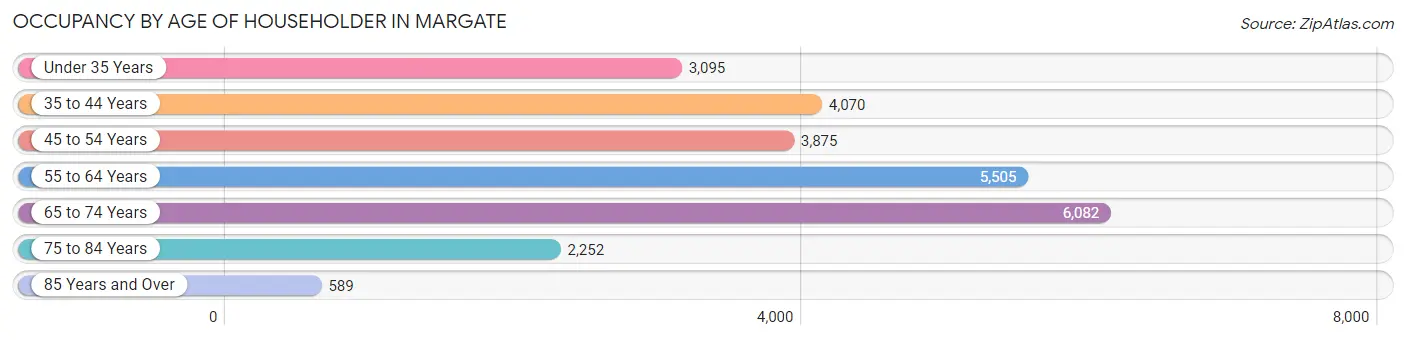
| Age Bracket | # Households | % Households |
| Under 35 Years | 3,095 | 12.1% |
| 35 to 44 Years | 4,070 | 16.0% |
| 45 to 54 Years | 3,875 | 15.2% |
| 55 to 64 Years | 5,505 | 21.6% |
| 65 to 74 Years | 6,082 | 23.9% |
| 75 to 84 Years | 2,252 | 8.8% |
| 85 Years and Over | 589 | 2.3% |
| Total | 25,468 | 100.0% |
Housing Finances in Margate
Median Income by Occupancy in Margate
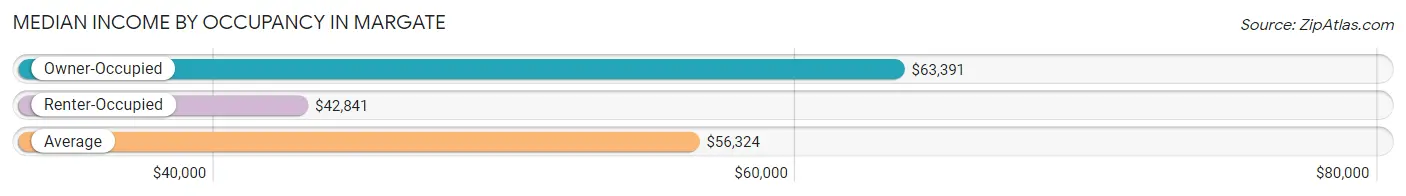
| Occupancy Type | # Households | Median Income |
| Owner-Occupied | 19,484 (76.5%) | $63,391 |
| Renter-Occupied | 5,984 (23.5%) | $42,841 |
| Average | 25,468 (100.0%) | $56,324 |
Occupancy by Householder Income Bracket in Margate
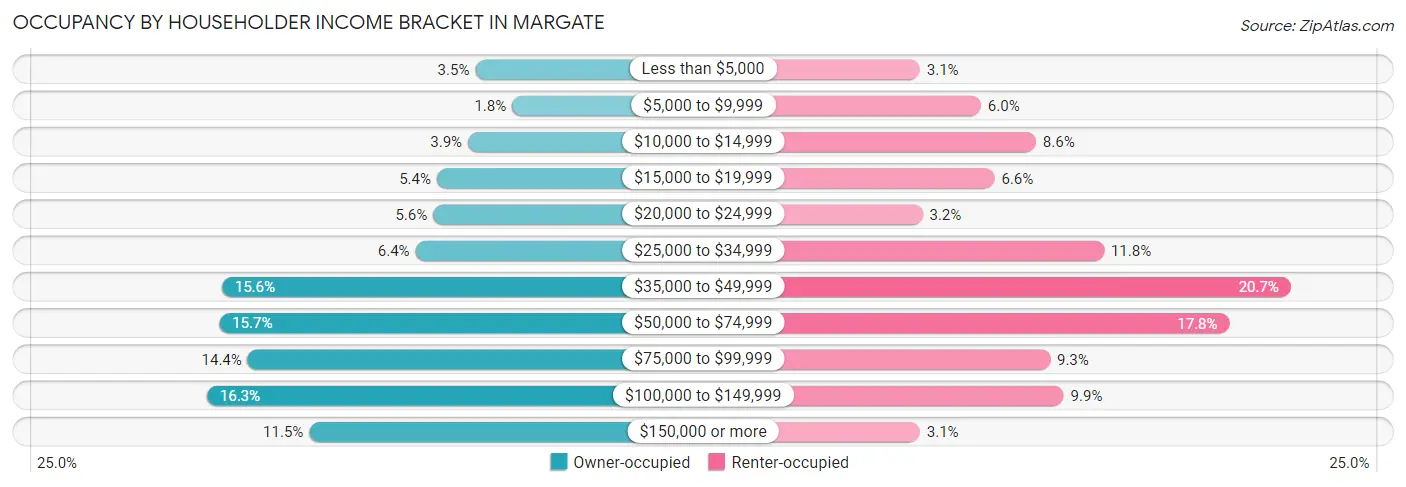
| Income Bracket | Owner-occupied | Renter-occupied |
| Less than $5,000 | 689 (3.5%) | 183 (3.1%) |
| $5,000 to $9,999 | 348 (1.8%) | 357 (6.0%) |
| $10,000 to $14,999 | 757 (3.9%) | 514 (8.6%) |
| $15,000 to $19,999 | 1,046 (5.4%) | 396 (6.6%) |
| $20,000 to $24,999 | 1,082 (5.6%) | 191 (3.2%) |
| $25,000 to $34,999 | 1,246 (6.4%) | 708 (11.8%) |
| $35,000 to $49,999 | 3,041 (15.6%) | 1,240 (20.7%) |
| $50,000 to $74,999 | 3,064 (15.7%) | 1,065 (17.8%) |
| $75,000 to $99,999 | 2,801 (14.4%) | 554 (9.3%) |
| $100,000 to $149,999 | 3,180 (16.3%) | 593 (9.9%) |
| $150,000 or more | 2,230 (11.5%) | 183 (3.1%) |
| Total | 19,484 (100.0%) | 5,984 (100.0%) |
Monthly Housing Cost Tiers in Margate

| Monthly Cost | Owner-occupied | Renter-occupied |
| Less than $300 | 622 (3.2%) | 24 (0.4%) |
| $300 to $499 | 1,862 (9.6%) | 84 (1.4%) |
| $500 to $799 | 3,960 (20.3%) | 234 (3.9%) |
| $800 to $999 | 1,636 (8.4%) | 241 (4.0%) |
| $1,000 to $1,499 | 2,959 (15.2%) | 2,318 (38.7%) |
| $1,500 to $1,999 | 3,592 (18.4%) | 1,750 (29.2%) |
| $2,000 to $2,499 | 2,176 (11.2%) | 836 (14.0%) |
| $2,500 to $2,999 | 1,581 (8.1%) | 335 (5.6%) |
| $3,000 or more | 1,096 (5.6%) | 72 (1.2%) |
| Total | 19,484 (100.0%) | 5,984 (100.0%) |
Physical Housing Characteristics in Margate
Housing Structures in Margate
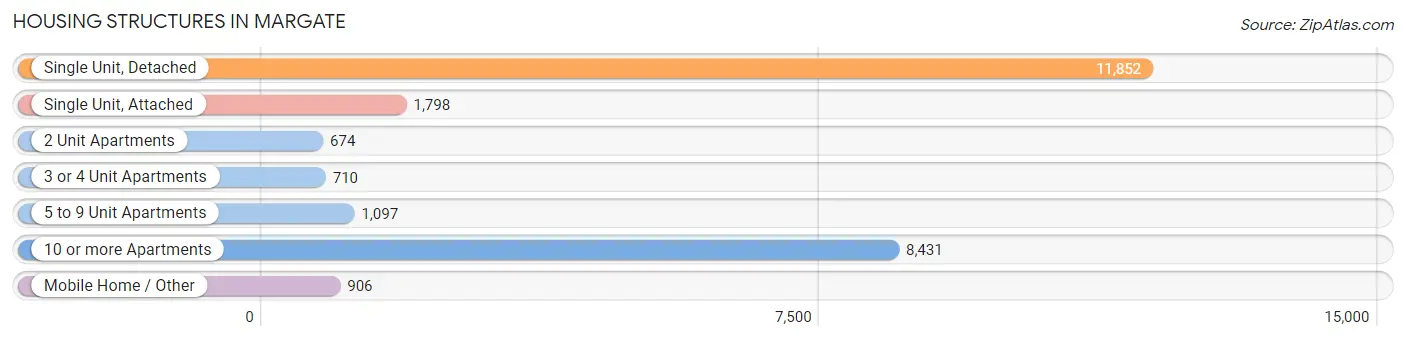
| Structure Type | # Housing Units | % Housing Units |
| Single Unit, Detached | 11,852 | 46.5% |
| Single Unit, Attached | 1,798 | 7.1% |
| 2 Unit Apartments | 674 | 2.6% |
| 3 or 4 Unit Apartments | 710 | 2.8% |
| 5 to 9 Unit Apartments | 1,097 | 4.3% |
| 10 or more Apartments | 8,431 | 33.1% |
| Mobile Home / Other | 906 | 3.6% |
| Total | 25,468 | 100.0% |
Housing Structures by Occupancy in Margate
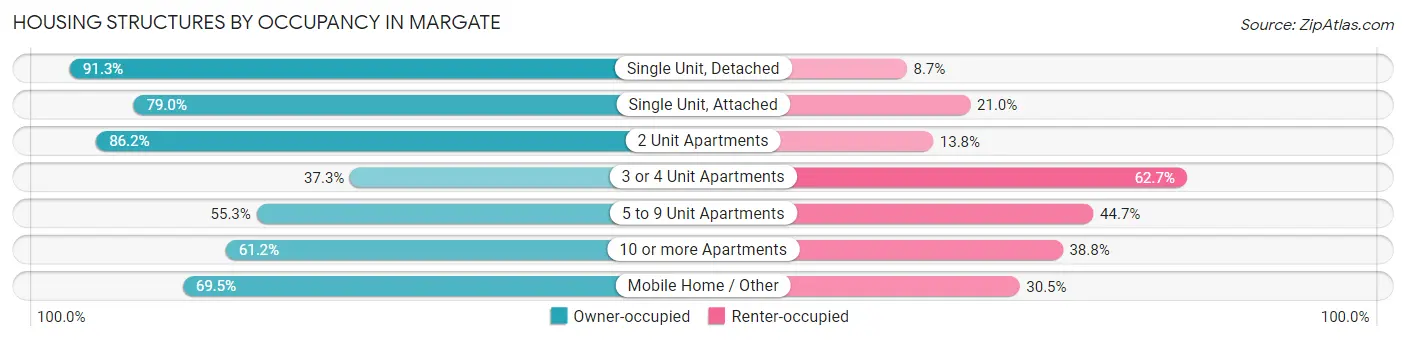
| Structure Type | Owner-occupied | Renter-occupied |
| Single Unit, Detached | 10,817 (91.3%) | 1,035 (8.7%) |
| Single Unit, Attached | 1,421 (79.0%) | 377 (21.0%) |
| 2 Unit Apartments | 581 (86.2%) | 93 (13.8%) |
| 3 or 4 Unit Apartments | 265 (37.3%) | 445 (62.7%) |
| 5 to 9 Unit Apartments | 607 (55.3%) | 490 (44.7%) |
| 10 or more Apartments | 5,163 (61.2%) | 3,268 (38.8%) |
| Mobile Home / Other | 630 (69.5%) | 276 (30.5%) |
| Total | 19,484 (76.5%) | 5,984 (23.5%) |
Housing Structures by Number of Rooms in Margate
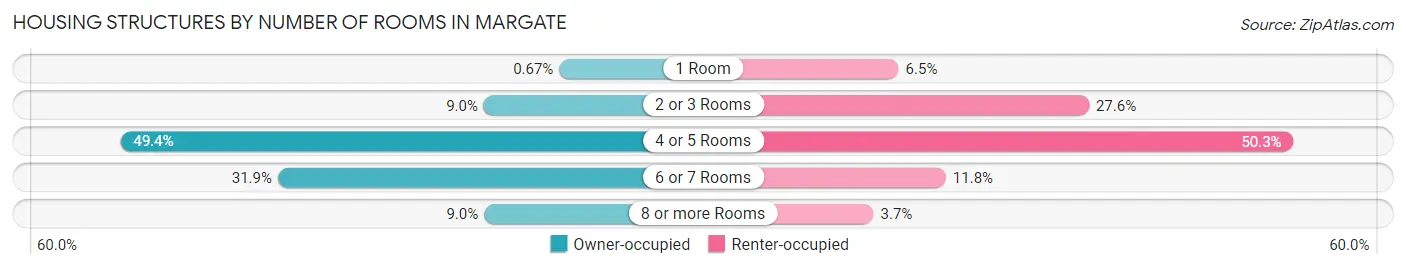
| Number of Rooms | Owner-occupied | Renter-occupied |
| 1 Room | 130 (0.7%) | 390 (6.5%) |
| 2 or 3 Rooms | 1,761 (9.0%) | 1,654 (27.6%) |
| 4 or 5 Rooms | 9,622 (49.4%) | 3,012 (50.3%) |
| 6 or 7 Rooms | 6,215 (31.9%) | 704 (11.8%) |
| 8 or more Rooms | 1,756 (9.0%) | 224 (3.7%) |
| Total | 19,484 (100.0%) | 5,984 (100.0%) |
Housing Structure by Heating Type in Margate
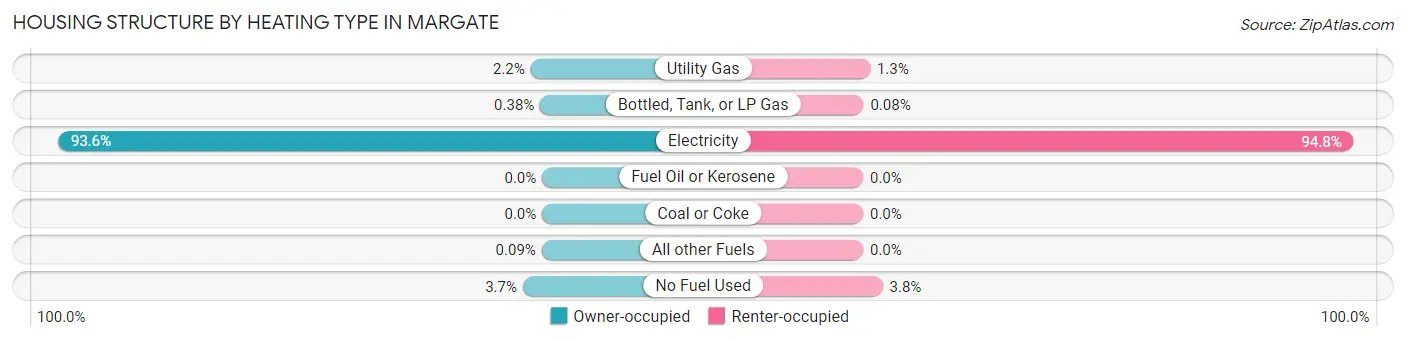
| Heating Type | Owner-occupied | Renter-occupied |
| Utility Gas | 432 (2.2%) | 80 (1.3%) |
| Bottled, Tank, or LP Gas | 75 (0.4%) | 5 (0.1%) |
| Electricity | 18,234 (93.6%) | 5,673 (94.8%) |
| Fuel Oil or Kerosene | 0 (0.0%) | 0 (0.0%) |
| Coal or Coke | 0 (0.0%) | 0 (0.0%) |
| All other Fuels | 17 (0.1%) | 0 (0.0%) |
| No Fuel Used | 726 (3.7%) | 226 (3.8%) |
| Total | 19,484 (100.0%) | 5,984 (100.0%) |
Household Vehicle Usage in Margate
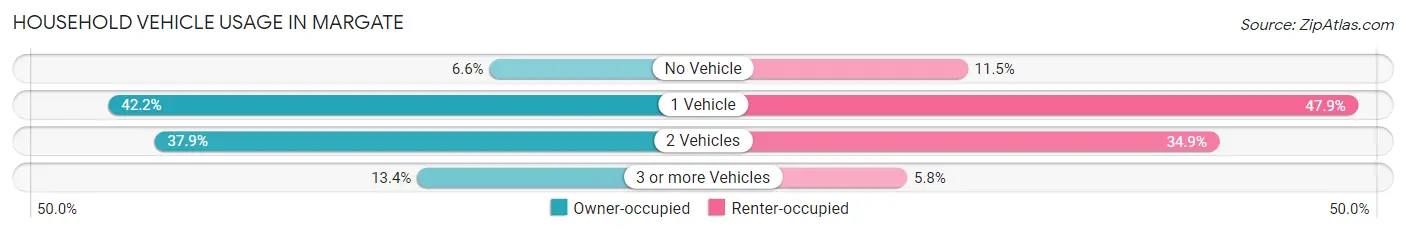
| Vehicles per Household | Owner-occupied | Renter-occupied |
| No Vehicle | 1,288 (6.6%) | 685 (11.5%) |
| 1 Vehicle | 8,219 (42.2%) | 2,864 (47.9%) |
| 2 Vehicles | 7,376 (37.9%) | 2,088 (34.9%) |
| 3 or more Vehicles | 2,601 (13.4%) | 347 (5.8%) |
| Total | 19,484 (100.0%) | 5,984 (100.0%) |
Real Estate & Mortgages in Margate
Real Estate and Mortgage Overview in Margate
| Characteristic | Without Mortgage | With Mortgage |
| Housing Units | 7,664 | 11,820 |
| Median Property Value | $134,400 | $306,700 |
| Median Household Income | $46,761 | $1,821 |
| Monthly Housing Costs | $591 | $1,062 |
| Real Estate Taxes | $1,181 | $1,610 |
Property Value by Mortgage Status in Margate
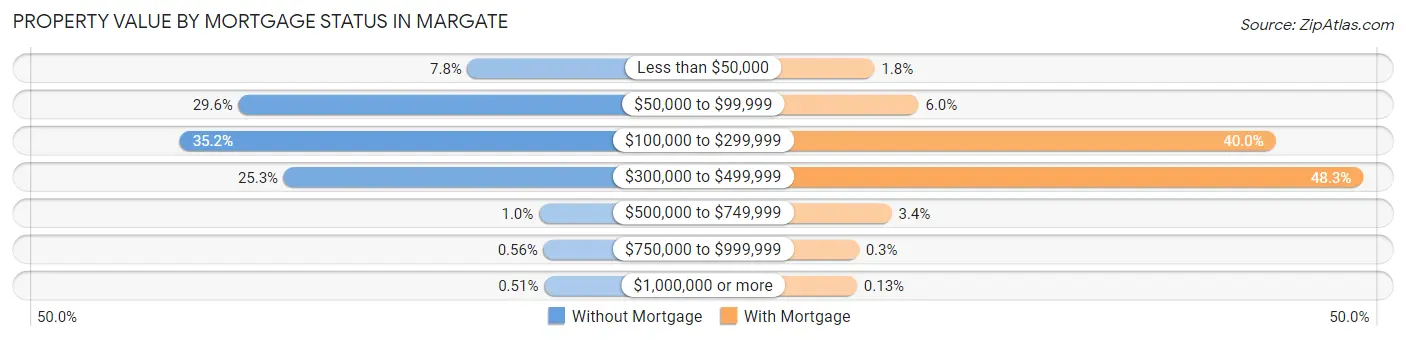
| Property Value | Without Mortgage | With Mortgage |
| Less than $50,000 | 598 (7.8%) | 213 (1.8%) |
| $50,000 to $99,999 | 2,269 (29.6%) | 709 (6.0%) |
| $100,000 to $299,999 | 2,699 (35.2%) | 4,728 (40.0%) |
| $300,000 to $499,999 | 1,939 (25.3%) | 5,714 (48.3%) |
| $500,000 to $749,999 | 77 (1.0%) | 405 (3.4%) |
| $750,000 to $999,999 | 43 (0.6%) | 36 (0.3%) |
| $1,000,000 or more | 39 (0.5%) | 15 (0.1%) |
| Total | 7,664 (100.0%) | 11,820 (100.0%) |
Household Income by Mortgage Status in Margate
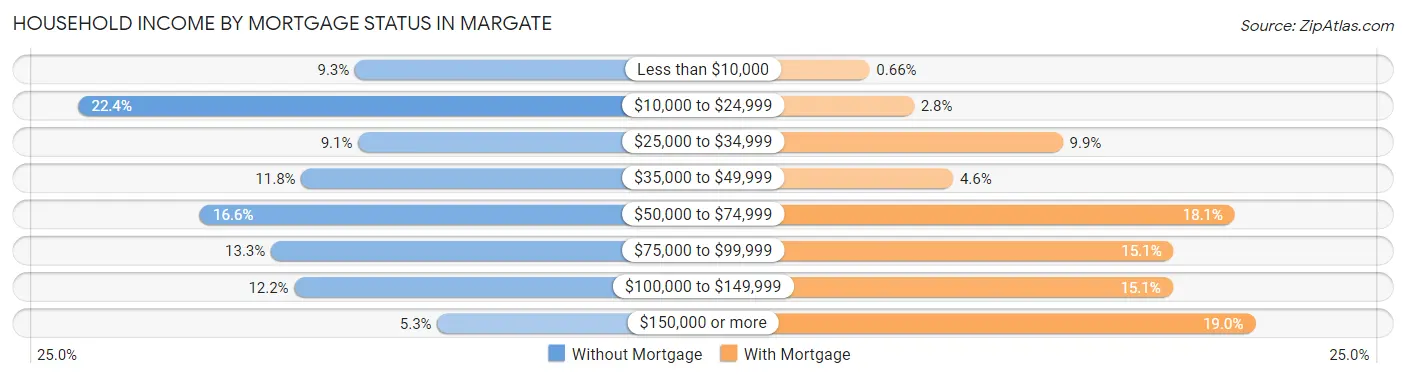
| Household Income | Without Mortgage | With Mortgage |
| Less than $10,000 | 710 (9.3%) | 78 (0.7%) |
| $10,000 to $24,999 | 1,719 (22.4%) | 327 (2.8%) |
| $25,000 to $34,999 | 698 (9.1%) | 1,166 (9.9%) |
| $35,000 to $49,999 | 906 (11.8%) | 548 (4.6%) |
| $50,000 to $74,999 | 1,275 (16.6%) | 2,135 (18.1%) |
| $75,000 to $99,999 | 1,016 (13.3%) | 1,789 (15.1%) |
| $100,000 to $149,999 | 931 (12.1%) | 1,785 (15.1%) |
| $150,000 or more | 409 (5.3%) | 2,249 (19.0%) |
| Total | 7,664 (100.0%) | 11,820 (100.0%) |
Property Value to Household Income Ratio in Margate
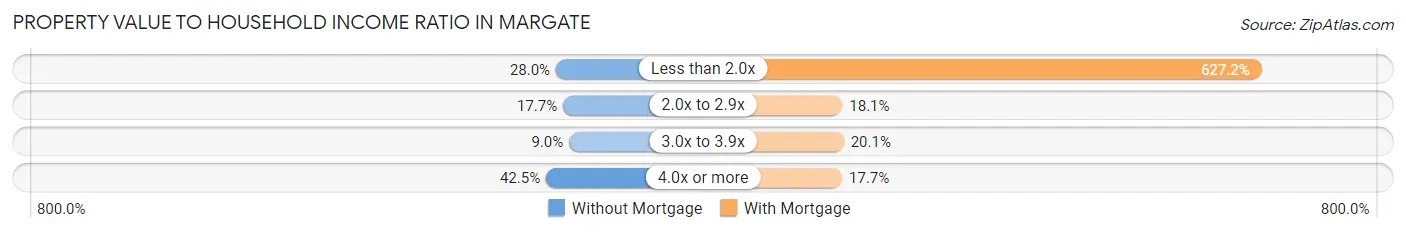
| Value-to-Income Ratio | Without Mortgage | With Mortgage |
| Less than 2.0x | 2,145 (28.0%) | 74,130 (627.2%) |
| 2.0x to 2.9x | 1,354 (17.7%) | 2,137 (18.1%) |
| 3.0x to 3.9x | 690 (9.0%) | 2,372 (20.1%) |
| 4.0x or more | 3,256 (42.5%) | 2,093 (17.7%) |
| Total | 7,664 (100.0%) | 11,820 (100.0%) |
Real Estate Taxes by Mortgage Status in Margate
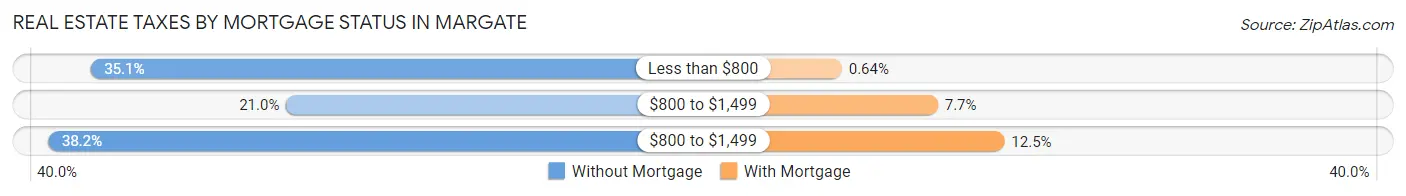
| Property Taxes | Without Mortgage | With Mortgage |
| Less than $800 | 2,692 (35.1%) | 76 (0.6%) |
| $800 to $1,499 | 1,606 (21.0%) | 904 (7.6%) |
| $800 to $1,499 | 2,930 (38.2%) | 1,480 (12.5%) |
| Total | 7,664 (100.0%) | 11,820 (100.0%) |
Health & Disability in Margate
Health Insurance Coverage by Age in Margate
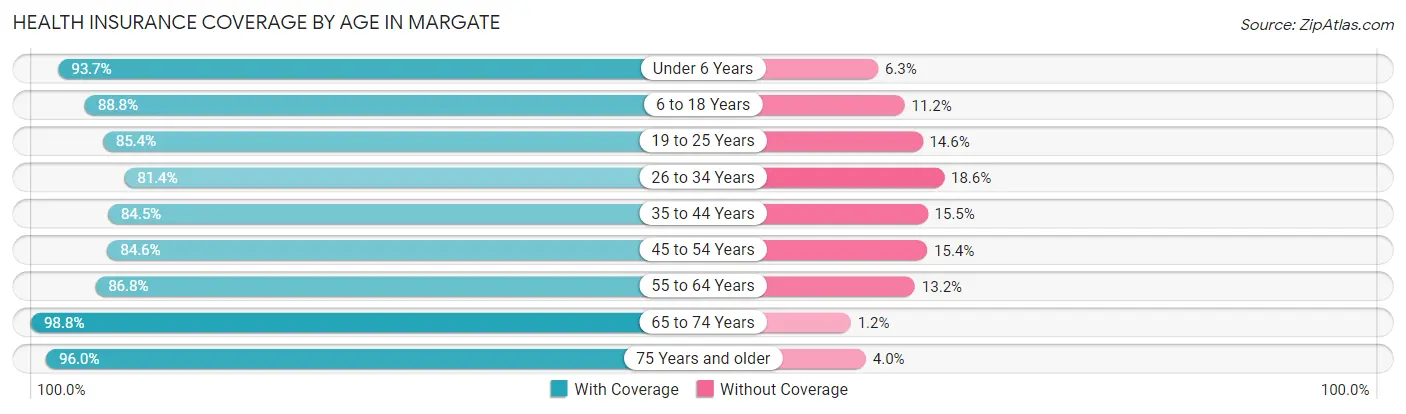
| Age Bracket | With Coverage | Without Coverage |
| Under 6 Years | 2,579 (93.7%) | 173 (6.3%) |
| 6 to 18 Years | 6,759 (88.8%) | 855 (11.2%) |
| 19 to 25 Years | 2,824 (85.4%) | 482 (14.6%) |
| 26 to 34 Years | 5,609 (81.4%) | 1,282 (18.6%) |
| 35 to 44 Years | 6,365 (84.5%) | 1,171 (15.5%) |
| 45 to 54 Years | 5,898 (84.6%) | 1,077 (15.4%) |
| 55 to 64 Years | 8,185 (86.8%) | 1,242 (13.2%) |
| 65 to 74 Years | 8,815 (98.8%) | 107 (1.2%) |
| 75 Years and older | 4,470 (96.0%) | 187 (4.0%) |
| Total | 51,504 (88.7%) | 6,576 (11.3%) |
Health Insurance Coverage by Citizenship Status in Margate
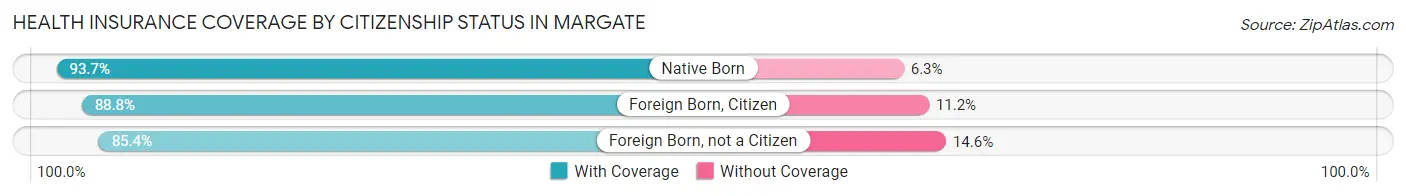
| Citizenship Status | With Coverage | Without Coverage |
| Native Born | 2,579 (93.7%) | 173 (6.3%) |
| Foreign Born, Citizen | 6,759 (88.8%) | 855 (11.2%) |
| Foreign Born, not a Citizen | 2,824 (85.4%) | 482 (14.6%) |
Health Insurance Coverage by Household Income in Margate
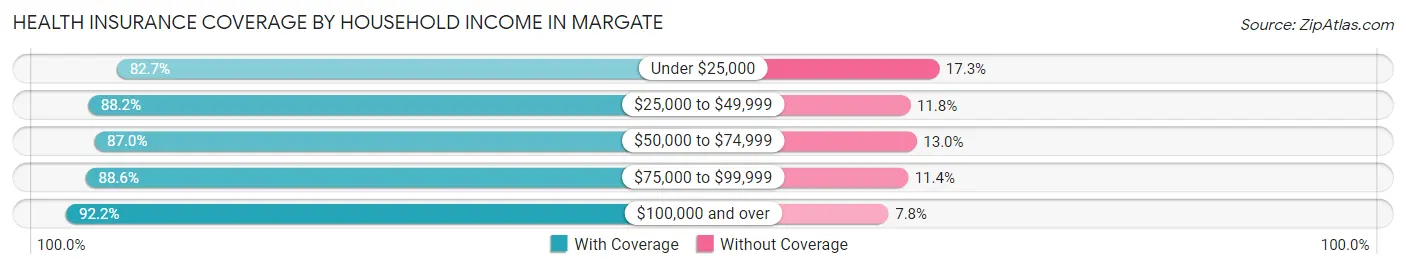
| Household Income | With Coverage | Without Coverage |
| Under $25,000 | 6,921 (82.7%) | 1,444 (17.3%) |
| $25,000 to $49,999 | 10,113 (88.2%) | 1,358 (11.8%) |
| $50,000 to $74,999 | 7,900 (87.0%) | 1,184 (13.0%) |
| $75,000 to $99,999 | 7,718 (88.6%) | 995 (11.4%) |
| $100,000 and over | 18,737 (92.2%) | 1,579 (7.8%) |
Public vs Private Health Insurance Coverage by Age in Margate
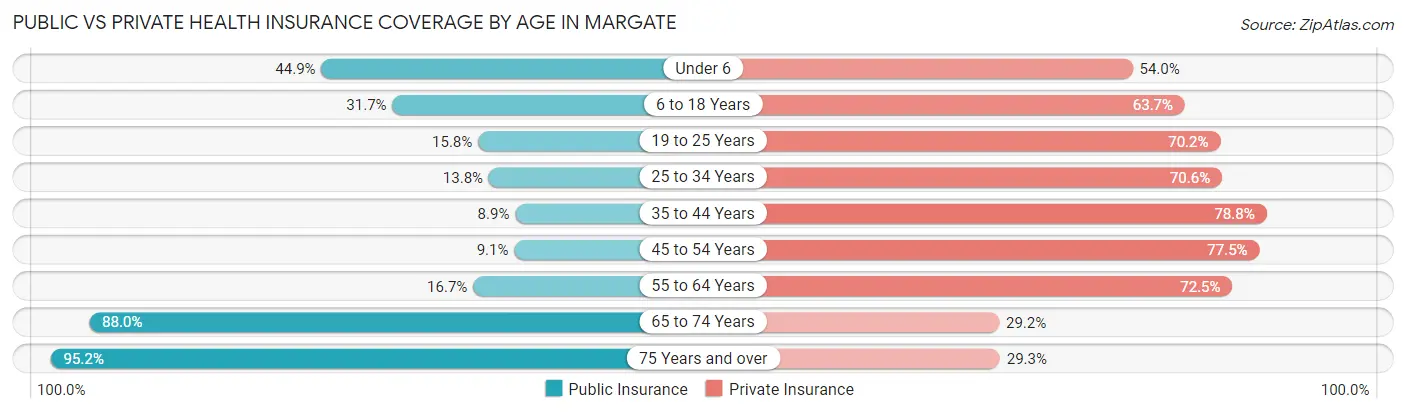
| Age Bracket | Public Insurance | Private Insurance |
| Under 6 | 1,236 (44.9%) | 1,485 (54.0%) |
| 6 to 18 Years | 2,416 (31.7%) | 4,848 (63.7%) |
| 19 to 25 Years | 523 (15.8%) | 2,322 (70.2%) |
| 25 to 34 Years | 952 (13.8%) | 4,862 (70.6%) |
| 35 to 44 Years | 673 (8.9%) | 5,940 (78.8%) |
| 45 to 54 Years | 635 (9.1%) | 5,406 (77.5%) |
| 55 to 64 Years | 1,578 (16.7%) | 6,834 (72.5%) |
| 65 to 74 Years | 7,853 (88.0%) | 2,604 (29.2%) |
| 75 Years and over | 4,433 (95.2%) | 1,366 (29.3%) |
| Total | 20,299 (34.9%) | 35,667 (61.4%) |
Disability Status by Sex by Age in Margate
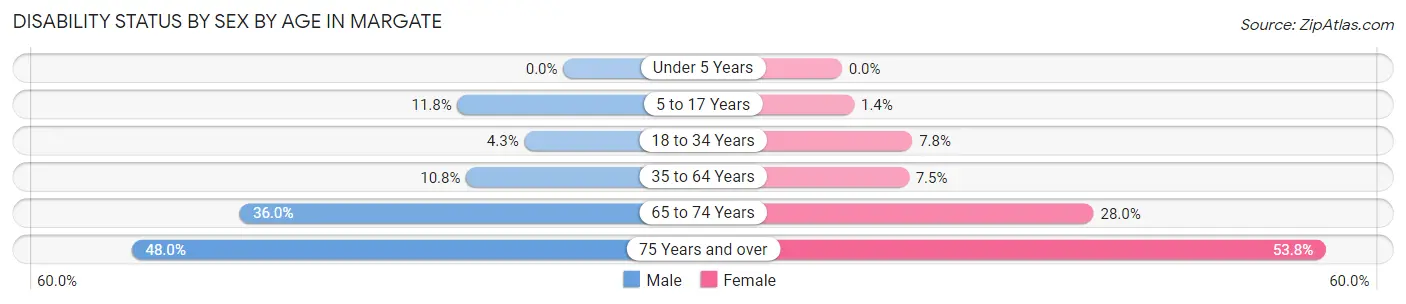
| Age Bracket | Male | Female |
| Under 5 Years | 0 (0.0%) | 0 (0.0%) |
| 5 to 17 Years | 466 (11.8%) | 51 (1.4%) |
| 18 to 34 Years | 243 (4.3%) | 395 (7.8%) |
| 35 to 64 Years | 1,162 (10.8%) | 982 (7.4%) |
| 65 to 74 Years | 1,413 (36.0%) | 1,401 (28.0%) |
| 75 Years and over | 993 (48.0%) | 1,392 (53.8%) |
Disability Class by Sex by Age in Margate
Disability Class: Hearing Difficulty
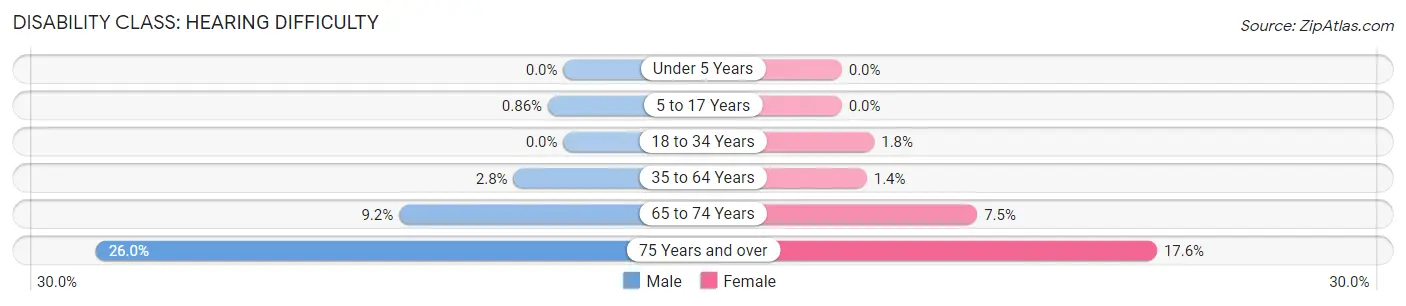
| Age Bracket | Male | Female |
| Under 5 Years | 0 (0.0%) | 0 (0.0%) |
| 5 to 17 Years | 34 (0.9%) | 0 (0.0%) |
| 18 to 34 Years | 0 (0.0%) | 91 (1.8%) |
| 35 to 64 Years | 299 (2.8%) | 183 (1.4%) |
| 65 to 74 Years | 359 (9.1%) | 377 (7.5%) |
| 75 Years and over | 539 (26.0%) | 454 (17.5%) |
Disability Class: Vision Difficulty
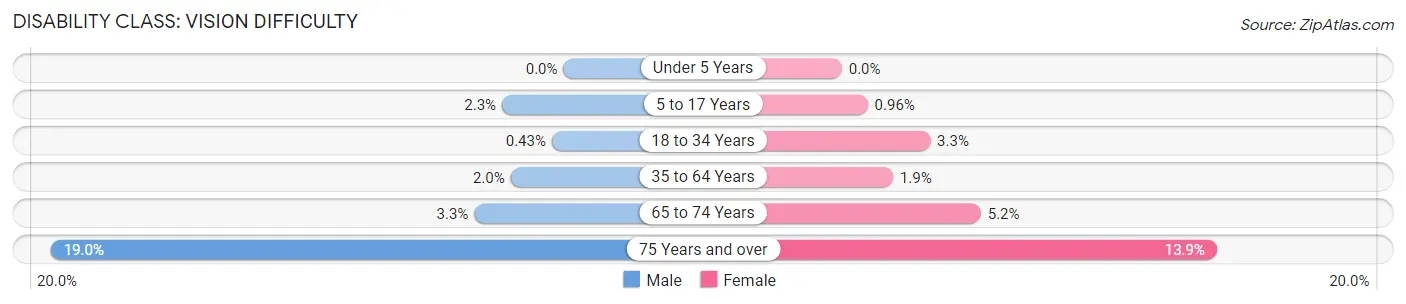
| Age Bracket | Male | Female |
| Under 5 Years | 0 (0.0%) | 0 (0.0%) |
| 5 to 17 Years | 90 (2.3%) | 36 (1.0%) |
| 18 to 34 Years | 24 (0.4%) | 165 (3.3%) |
| 35 to 64 Years | 211 (2.0%) | 251 (1.9%) |
| 65 to 74 Years | 130 (3.3%) | 258 (5.2%) |
| 75 Years and over | 394 (19.0%) | 360 (13.9%) |
Disability Class: Cognitive Difficulty
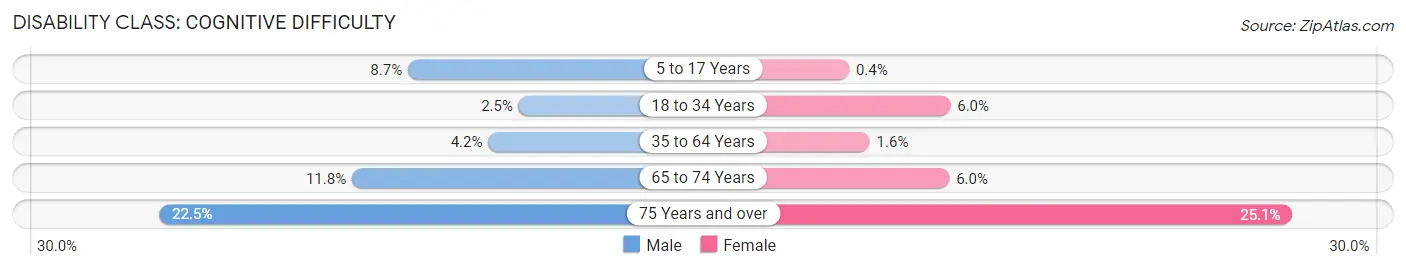
| Age Bracket | Male | Female |
| 5 to 17 Years | 342 (8.6%) | 15 (0.4%) |
| 18 to 34 Years | 139 (2.5%) | 304 (6.0%) |
| 35 to 64 Years | 449 (4.2%) | 204 (1.5%) |
| 65 to 74 Years | 462 (11.8%) | 299 (6.0%) |
| 75 Years and over | 466 (22.5%) | 649 (25.1%) |
Disability Class: Ambulatory Difficulty
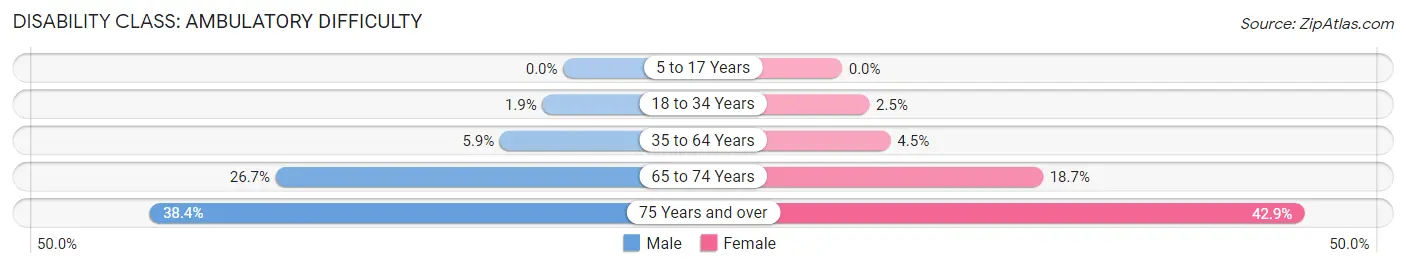
| Age Bracket | Male | Female |
| 5 to 17 Years | 0 (0.0%) | 0 (0.0%) |
| 18 to 34 Years | 108 (1.9%) | 128 (2.5%) |
| 35 to 64 Years | 631 (5.9%) | 595 (4.5%) |
| 65 to 74 Years | 1,047 (26.7%) | 932 (18.6%) |
| 75 Years and over | 794 (38.4%) | 1,110 (42.9%) |
Disability Class: Self-Care Difficulty
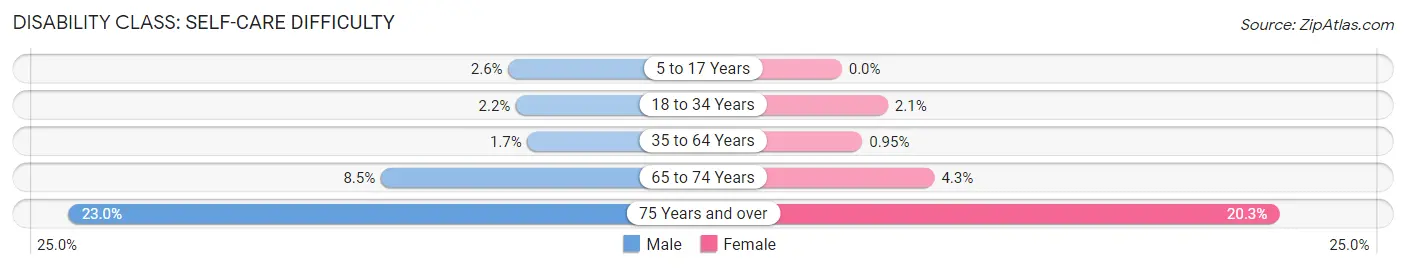
| Age Bracket | Male | Female |
| 5 to 17 Years | 101 (2.5%) | 0 (0.0%) |
| 18 to 34 Years | 123 (2.2%) | 108 (2.1%) |
| 35 to 64 Years | 178 (1.7%) | 125 (0.9%) |
| 65 to 74 Years | 332 (8.5%) | 215 (4.3%) |
| 75 Years and over | 475 (23.0%) | 525 (20.3%) |
Technology Access in Margate
Computing Device Access in Margate
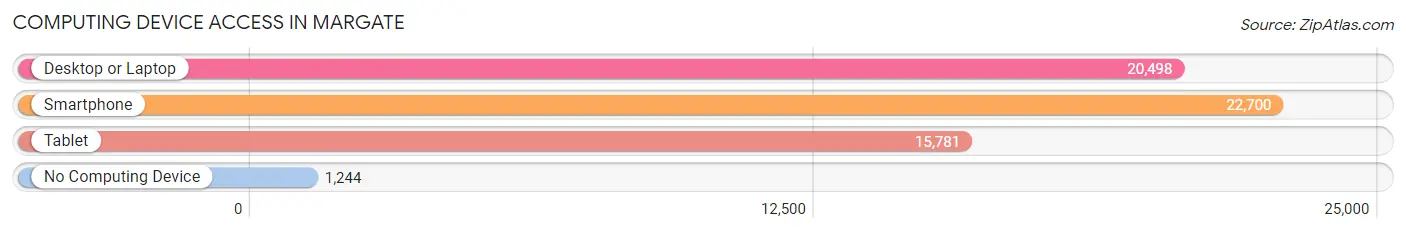
| Device Type | # Households | % Households |
| Desktop or Laptop | 20,498 | 80.5% |
| Smartphone | 22,700 | 89.1% |
| Tablet | 15,781 | 62.0% |
| No Computing Device | 1,244 | 4.9% |
| Total | 25,468 | 100.0% |
Internet Access in Margate
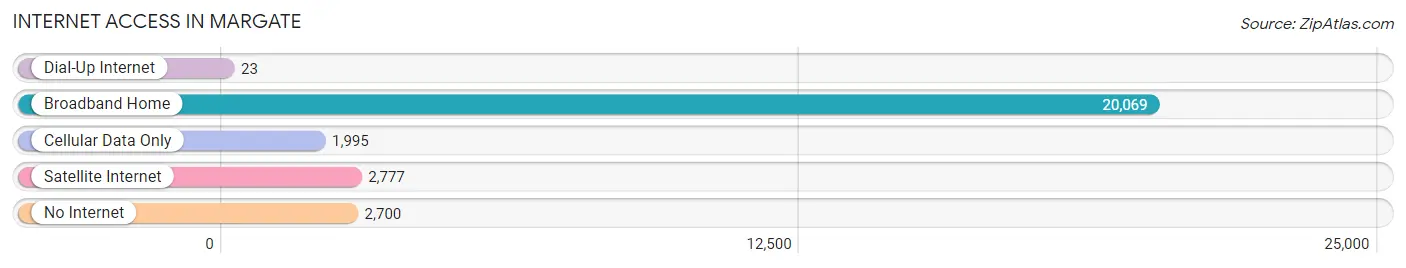
| Internet Type | # Households | % Households |
| Dial-Up Internet | 23 | 0.1% |
| Broadband Home | 20,069 | 78.8% |
| Cellular Data Only | 1,995 | 7.8% |
| Satellite Internet | 2,777 | 10.9% |
| No Internet | 2,700 | 10.6% |
| Total | 25,468 | 100.0% |
Margate Summary
Margate, Florida is a city located in Broward County, Florida, United States. It is part of the Miami metropolitan area. The city is located about 20 miles northwest of Fort Lauderdale and about 25 miles north of Miami. As of the 2010 census, the city had a population of 53,284.
History
The area that is now Margate was originally inhabited by the Tequesta Indians. The first European settlers arrived in the area in the late 1800s. The area was originally known as "Fish Camp" due to the abundance of fish in the area. In the early 1900s, the area was renamed "Margate" after the city of Margate in England.
In the 1920s, the area began to develop as a tourist destination. The first hotel was built in 1925 and the area quickly became a popular destination for vacationers. In the 1950s, the city began to grow rapidly as more people moved to the area.
Geography
Margate is located at 26°12'N 80°11'W (26.20, -80.18). According to the United States Census Bureau, the city has a total area of 11.2 square miles (29.0 km2), of which 10.9 square miles (28.2 km2) is land and 0.3 square miles (0.8 km2) (2.68%) is water.
Economy
The economy of Margate is largely based on tourism and retail. The city is home to several large shopping centers, including the Coral Square Mall and the Margate Town Center. The city also has a number of restaurants, bars, and other entertainment venues.
The city is also home to several large employers, including the Florida Panthers hockey team, the Miami Dolphins football team, and the Miami Heat basketball team.
Demographics
As of the 2010 census, there were 53,284 people, 20,845 households, and 13,845 families residing in the city. The population density was 4,867.3 people per square mile (1,878.2/km2). There were 22,945 housing units at an average density of 2,097.3 per square mile (808.7/km2). The racial makeup of the city was 68.2% White (non-Hispanic), 16.3% African American, 0.3% Native American, 3.2% Asian, 0.1% Pacific Islander, 8.7% from other races, and 3.3% from two or more races. Hispanic or Latino of any race were 24.2% of the population.
In terms of education, the city has a high school graduation rate of 81.3%, higher than the national average of 75.5%. The median household income in Margate was $45,845 in 2018, higher than the national median of $61,937. The median age in the city was 41.2 years, slightly higher than the national median of 38.7 years.
Common Questions
What is Per Capita Income in Margate?
Per Capita income in Margate is $32,707.
What is the Median Family Income in Margate?
Median Family Income in Margate is $73,823.
What is the Median Household income in Margate?
Median Household Income in Margate is $56,324.
What is Income or Wage Gap in Margate?
Income or Wage Gap in Margate is 24.7%.
Women in Margate earn 75.3 cents for every dollar earned by a man.
What is Family Income Deficit in Margate?
Family Income Deficit in Margate is $8,245.
Families that are below poverty line in Margate earn $8,245 less on average than the poverty threshold level.
What is Inequality or Gini Index in Margate?
Inequality or Gini Index in Margate is 0.44.
What is the Total Population of Margate?
Total Population of Margate is 58,396.
What is the Total Male Population of Margate?
Total Male Population of Margate is 27,461.
What is the Total Female Population of Margate?
Total Female Population of Margate is 30,935.
What is the Ratio of Males per 100 Females in Margate?
There are 88.77 Males per 100 Females in Margate.
What is the Ratio of Females per 100 Males in Margate?
There are 112.65 Females per 100 Males in Margate.
What is the Median Population Age in Margate?
Median Population Age in Margate is 46.8 Years.
What is the Average Family Size in Margate
Average Family Size in Margate is 3.0 People.
What is the Average Household Size in Margate
Average Household Size in Margate is 2.3 People.
How Large is the Labor Force in Margate?
There are 31,763 People in the Labor Forcein in Margate.
What is the Percentage of People in the Labor Force in Margate?
63.7% of People are in the Labor Force in Margate.
What is the Unemployment Rate in Margate?
Unemployment Rate in Margate is 4.2%.