Royal Palm Beach, FL Map & Demographics
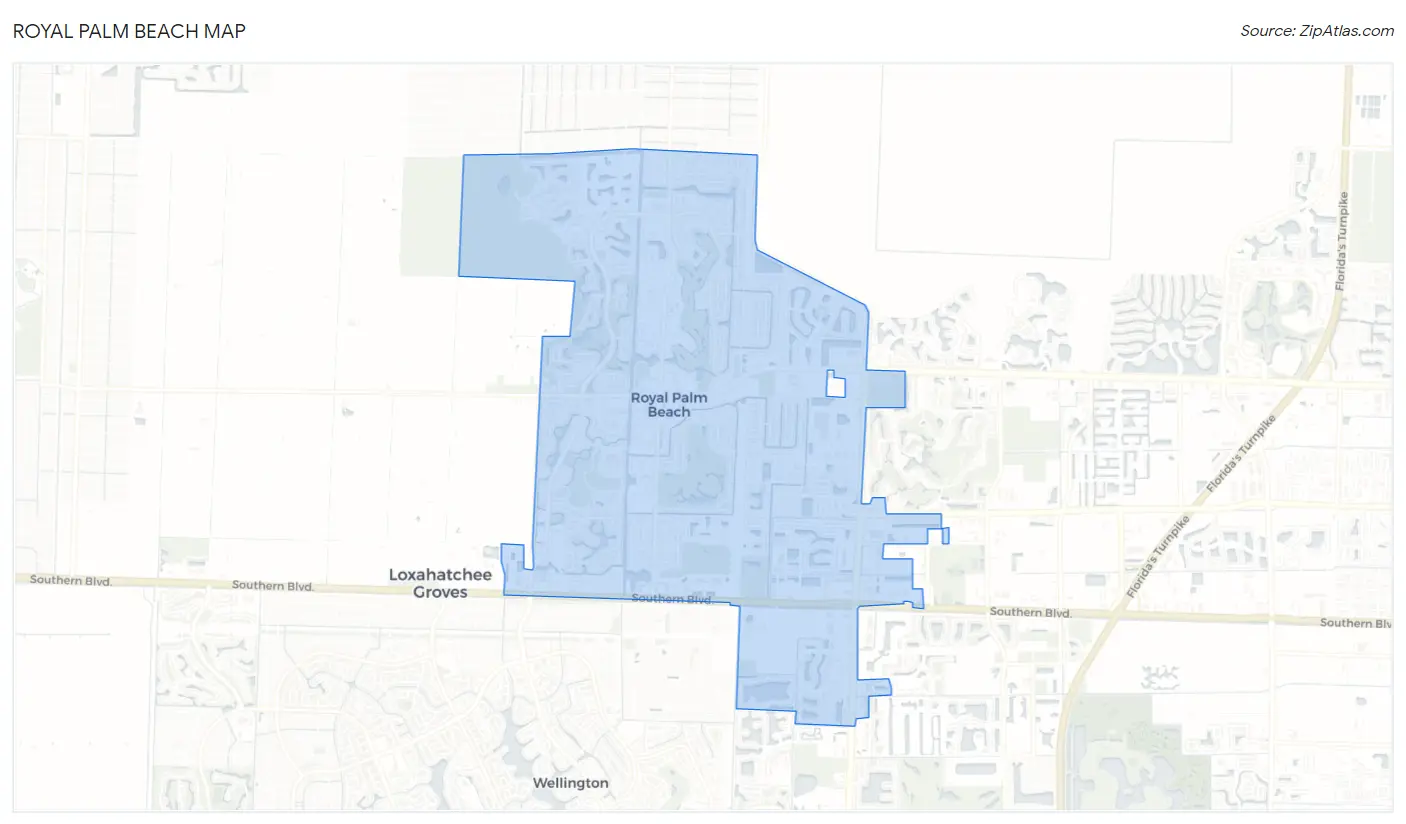
Royal Palm Beach Map
Royal Palm Beach Overview
$37,463
PER CAPITA INCOME
$101,928
AVG FAMILY INCOME
$90,143
AVG HOUSEHOLD INCOME
41.7%
WAGE / INCOME GAP [ % ]
58.3¢/ $1
WAGE / INCOME GAP [ $ ]
$12,280
FAMILY INCOME DEFICIT
0.37
INEQUALITY / GINI INDEX
38,874
TOTAL POPULATION
18,515
MALE POPULATION
20,359
FEMALE POPULATION
90.94
MALES / 100 FEMALES
109.96
FEMALES / 100 MALES
40.2
MEDIAN AGE
3.4
AVG FAMILY SIZE
3.0
AVG HOUSEHOLD SIZE
21,692
LABOR FORCE [ PEOPLE ]
69.6%
PERCENT IN LABOR FORCE
4.8%
UNEMPLOYMENT RATE
Royal Palm Beach Area Codes
Income in Royal Palm Beach
Income Overview in Royal Palm Beach
Per Capita Income in Royal Palm Beach is $37,463, while median incomes of families and households are $101,928 and $90,143 respectively.
| Characteristic | Number | Measure |
| Per Capita Income | 38,874 | $37,463 |
| Median Family Income | 9,684 | $101,928 |
| Mean Family Income | 9,684 | $115,931 |
| Median Household Income | 13,060 | $90,143 |
| Mean Household Income | 13,060 | $106,396 |
| Income Deficit | 9,684 | $12,280 |
| Wage / Income Gap (%) | 38,874 | 41.73% |
| Wage / Income Gap ($) | 38,874 | 58.27¢ per $1 |
| Gini / Inequality Index | 38,874 | 0.37 |
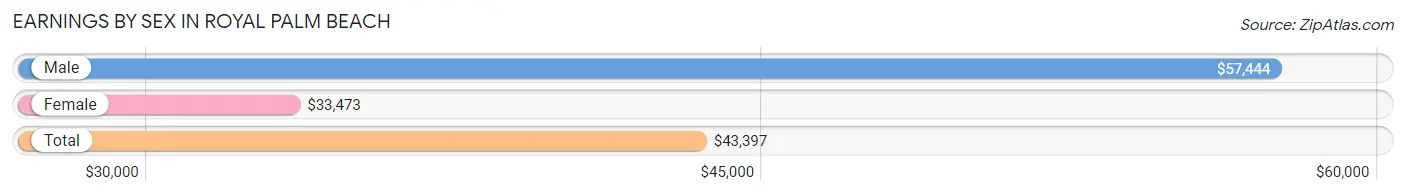
Earnings by Sex in Royal Palm Beach
Average Earnings in Royal Palm Beach are $43,397, $57,444 for men and $33,473 for women, a difference of 41.7%.
| Sex | Number | Average Earnings |
| Male | 11,194 (50.1%) | $57,444 |
| Female | 11,153 (49.9%) | $33,473 |
| Total | 22,347 (100.0%) | $43,397 |
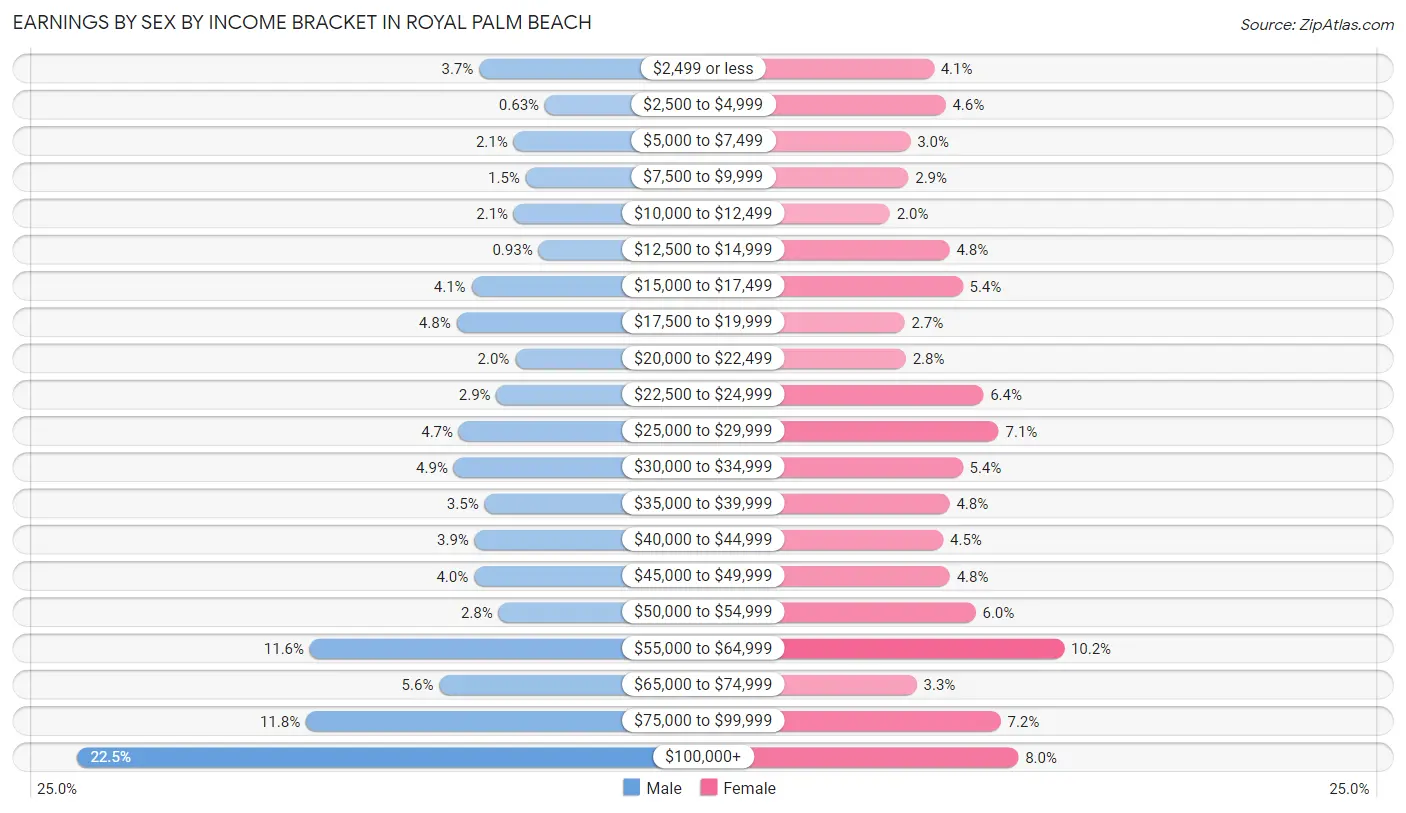
Earnings by Sex by Income Bracket in Royal Palm Beach
The most common earnings brackets in Royal Palm Beach are $100,000+ for men (2,521 | 22.5%) and $55,000 to $64,999 for women (1,134 | 10.2%).
| Income | Male | Female |
| $2,499 or less | 415 (3.7%) | 454 (4.1%) |
| $2,500 to $4,999 | 71 (0.6%) | 515 (4.6%) |
| $5,000 to $7,499 | 235 (2.1%) | 331 (3.0%) |
| $7,500 to $9,999 | 171 (1.5%) | 321 (2.9%) |
| $10,000 to $12,499 | 233 (2.1%) | 224 (2.0%) |
| $12,500 to $14,999 | 104 (0.9%) | 537 (4.8%) |
| $15,000 to $17,499 | 456 (4.1%) | 605 (5.4%) |
| $17,500 to $19,999 | 534 (4.8%) | 301 (2.7%) |
| $20,000 to $22,499 | 226 (2.0%) | 308 (2.8%) |
| $22,500 to $24,999 | 325 (2.9%) | 713 (6.4%) |
| $25,000 to $29,999 | 522 (4.7%) | 793 (7.1%) |
| $30,000 to $34,999 | 549 (4.9%) | 604 (5.4%) |
| $35,000 to $39,999 | 387 (3.5%) | 536 (4.8%) |
| $40,000 to $44,999 | 439 (3.9%) | 503 (4.5%) |
| $45,000 to $49,999 | 442 (4.0%) | 538 (4.8%) |
| $50,000 to $54,999 | 313 (2.8%) | 672 (6.0%) |
| $55,000 to $64,999 | 1,303 (11.6%) | 1,134 (10.2%) |
| $65,000 to $74,999 | 625 (5.6%) | 365 (3.3%) |
| $75,000 to $99,999 | 1,323 (11.8%) | 803 (7.2%) |
| $100,000+ | 2,521 (22.5%) | 896 (8.0%) |
| Total | 11,194 (100.0%) | 11,153 (100.0%) |
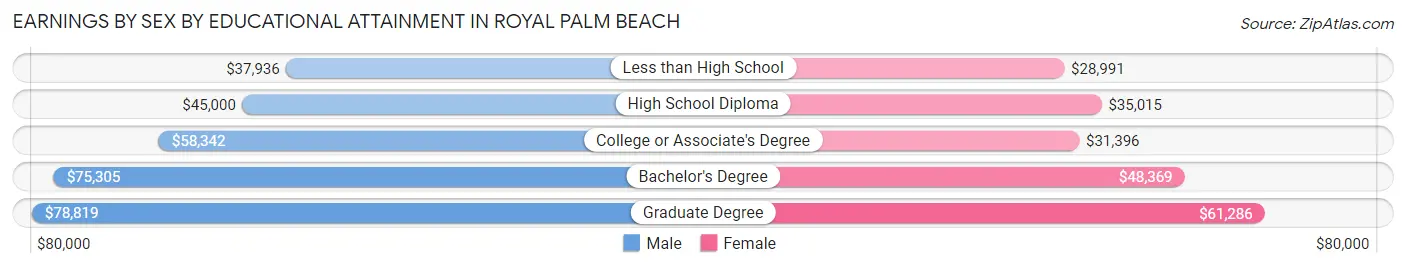
Earnings by Sex by Educational Attainment in Royal Palm Beach
Average earnings in Royal Palm Beach are $59,730 for men and $39,836 for women, a difference of 33.3%. Men with an educational attainment of graduate degree enjoy the highest average annual earnings of $78,819, while those with less than high school education earn the least with $37,936. Women with an educational attainment of graduate degree earn the most with the average annual earnings of $61,286, while those with less than high school education have the smallest earnings of $28,991.
| Educational Attainment | Male Income | Female Income |
| Less than High School | $37,936 | $28,991 |
| High School Diploma | $45,000 | $35,015 |
| College or Associate's Degree | $58,342 | $31,396 |
| Bachelor's Degree | $75,305 | $48,369 |
| Graduate Degree | $78,819 | $61,286 |
| Total | $59,730 | $39,836 |
Family Income in Royal Palm Beach
Family Income Brackets in Royal Palm Beach
According to the Royal Palm Beach family income data, there are 2,828 families falling into the $100,000 to $149,999 income range, which is the most common income bracket and makes up 29.2% of all families. Conversely, the $10,000 to $14,999 income bracket is the least frequent group with only 48 families (0.5%) belonging to this category.
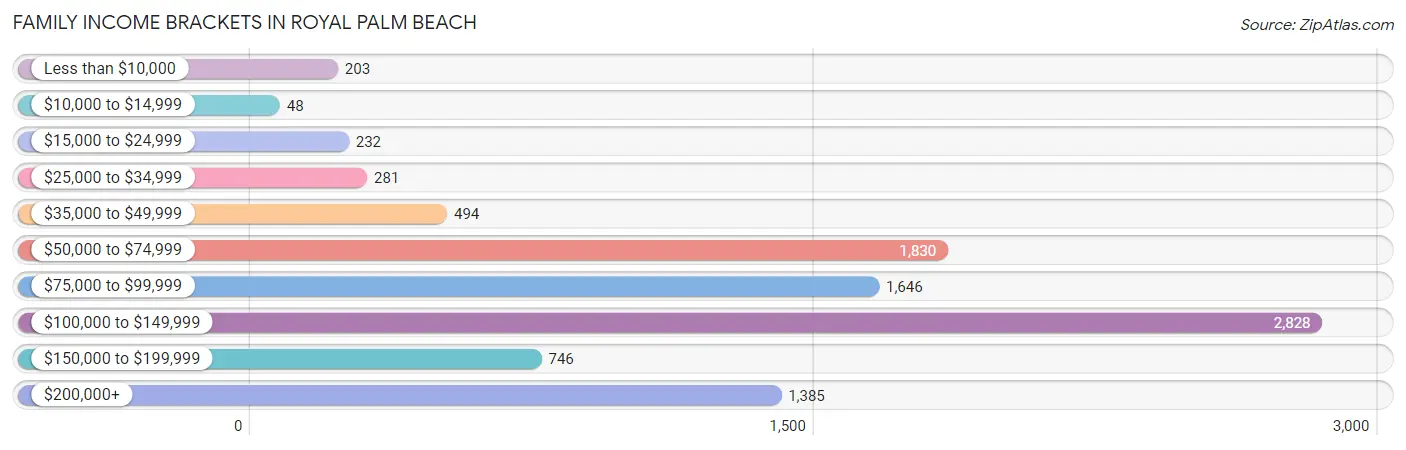
| Income Bracket | # Families | % Families |
| Less than $10,000 | 203 | 2.1% |
| $10,000 to $14,999 | 48 | 0.5% |
| $15,000 to $24,999 | 232 | 2.4% |
| $25,000 to $34,999 | 281 | 2.9% |
| $35,000 to $49,999 | 494 | 5.1% |
| $50,000 to $74,999 | 1,830 | 18.9% |
| $75,000 to $99,999 | 1,646 | 17.0% |
| $100,000 to $149,999 | 2,828 | 29.2% |
| $150,000 to $199,999 | 746 | 7.7% |
| $200,000+ | 1,385 | 14.3% |
Family Income by Famaliy Size in Royal Palm Beach
6-person families (63 | 0.6%) account for the highest median family income in Royal Palm Beach with $175,341 per family, while 2-person families (4,154 | 42.9%) have the highest median income of $44,336 per family member.
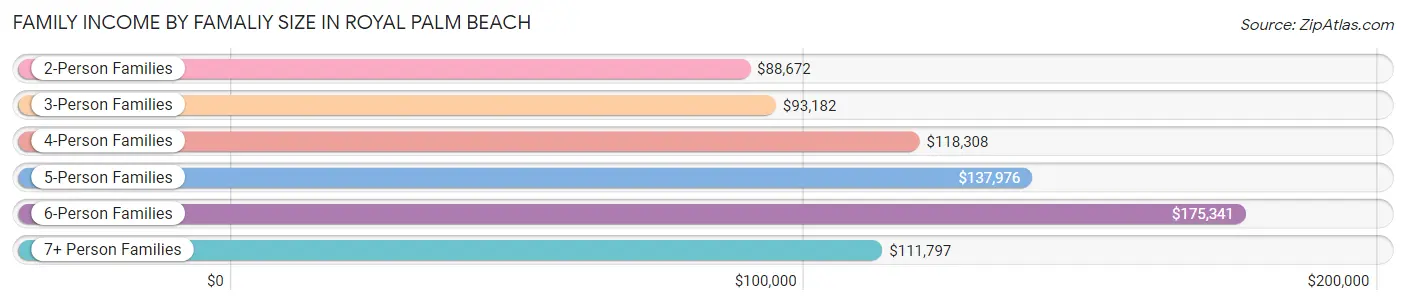
| Income Bracket | # Families | Median Income |
| 2-Person Families | 4,154 (42.9%) | $88,672 |
| 3-Person Families | 2,038 (21.0%) | $93,182 |
| 4-Person Families | 2,142 (22.1%) | $118,308 |
| 5-Person Families | 950 (9.8%) | $137,976 |
| 6-Person Families | 63 (0.6%) | $175,341 |
| 7+ Person Families | 337 (3.5%) | $111,797 |
| Total | 9,684 (100.0%) | $101,928 |
Family Income by Number of Earners in Royal Palm Beach
The median family income in Royal Palm Beach is $101,928, with families comprising 3+ earners (1,506) having the highest median family income of $155,213, while families with no earners (598) have the lowest median family income of $64,706, accounting for 15.5% and 6.2% of families, respectively.
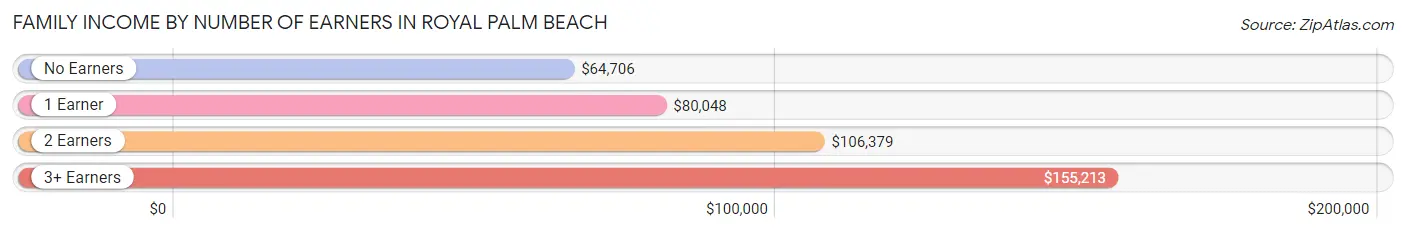
| Number of Earners | # Families | Median Income |
| No Earners | 598 (6.2%) | $64,706 |
| 1 Earner | 2,935 (30.3%) | $80,048 |
| 2 Earners | 4,645 (48.0%) | $106,379 |
| 3+ Earners | 1,506 (15.5%) | $155,213 |
| Total | 9,684 (100.0%) | $101,928 |
Household Income in Royal Palm Beach
Household Income Brackets in Royal Palm Beach
With 3,291 households falling in the category, the $100,000 to $149,999 income range is the most frequent in Royal Palm Beach, accounting for 25.2% of all households. In contrast, only 209 households (1.6%) fall into the $10,000 to $14,999 income bracket, making it the least populous group.
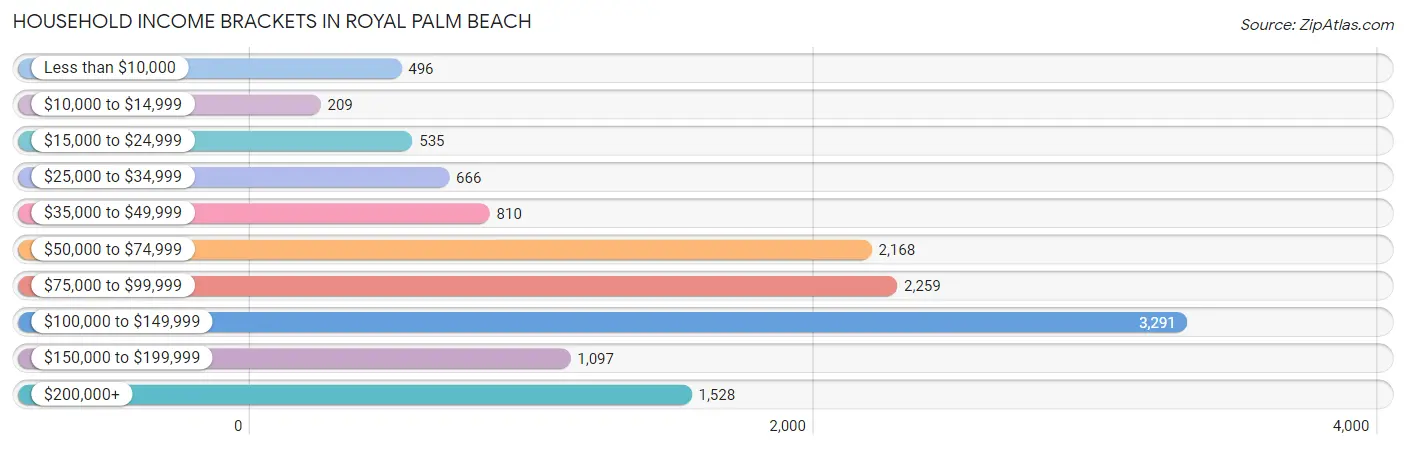
| Income Bracket | # Households | % Households |
| Less than $10,000 | 496 | 3.8% |
| $10,000 to $14,999 | 209 | 1.6% |
| $15,000 to $24,999 | 535 | 4.1% |
| $25,000 to $34,999 | 666 | 5.1% |
| $35,000 to $49,999 | 810 | 6.2% |
| $50,000 to $74,999 | 2,168 | 16.6% |
| $75,000 to $99,999 | 2,259 | 17.3% |
| $100,000 to $149,999 | 3,291 | 25.2% |
| $150,000 to $199,999 | 1,097 | 8.4% |
| $200,000+ | 1,528 | 11.7% |
Household Income by Householder Age in Royal Palm Beach
The median household income in Royal Palm Beach is $90,143, with the highest median household income of $110,523 found in the 45 to 64 years age bracket for the primary householder. A total of 5,864 households (44.9%) fall into this category. Meanwhile, the 15 to 24 years age bracket for the primary householder has the lowest median household income of $0, with 184 households (1.4%) in this group.
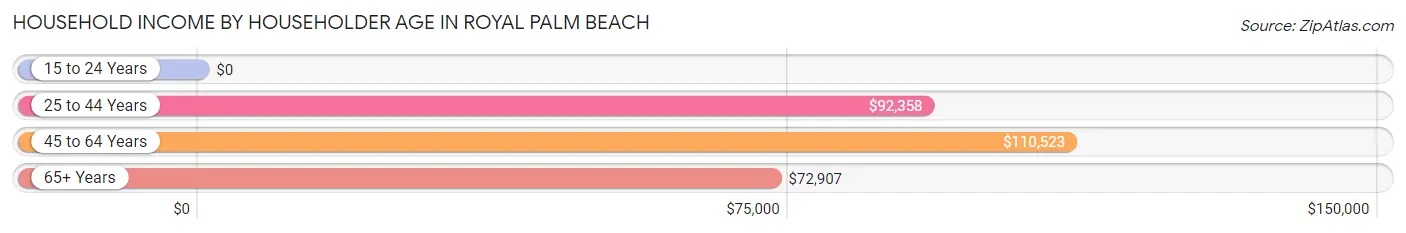
| Income Bracket | # Households | Median Income |
| 15 to 24 Years | 184 (1.4%) | $0 |
| 25 to 44 Years | 3,591 (27.5%) | $92,358 |
| 45 to 64 Years | 5,864 (44.9%) | $110,523 |
| 65+ Years | 3,421 (26.2%) | $72,907 |
| Total | 13,060 (100.0%) | $90,143 |
Poverty in Royal Palm Beach
Income Below Poverty by Sex and Age in Royal Palm Beach
With 4.6% poverty level for males and 6.0% for females among the residents of Royal Palm Beach, 5 year old males and 75 year old and over females are the most vulnerable to poverty, with 25 males (16.5%) and 231 females (12.2%) in their respective age groups living below the poverty level.
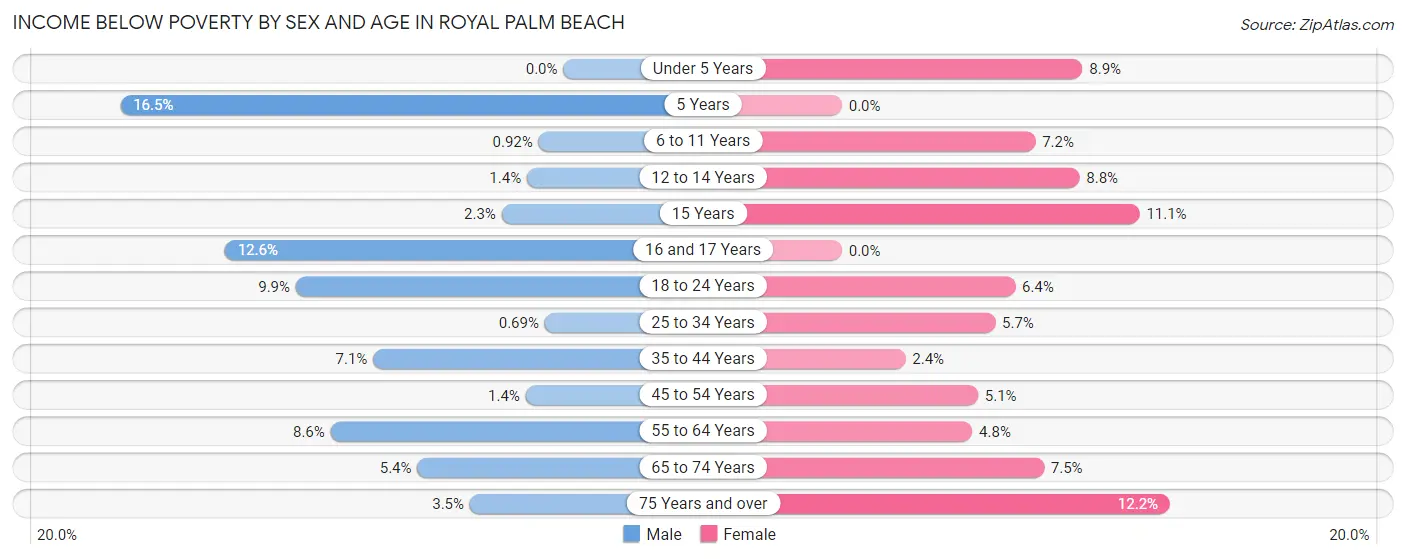
| Age Bracket | Male | Female |
| Under 5 Years | 0 (0.0%) | 88 (8.9%) |
| 5 Years | 25 (16.5%) | 0 (0.0%) |
| 6 to 11 Years | 17 (0.9%) | 92 (7.2%) |
| 12 to 14 Years | 11 (1.3%) | 83 (8.8%) |
| 15 Years | 10 (2.3%) | 20 (11.1%) |
| 16 and 17 Years | 63 (12.6%) | 0 (0.0%) |
| 18 to 24 Years | 148 (9.9%) | 80 (6.4%) |
| 25 to 34 Years | 15 (0.7%) | 147 (5.7%) |
| 35 to 44 Years | 178 (7.1%) | 61 (2.4%) |
| 45 to 54 Years | 37 (1.4%) | 142 (5.1%) |
| 55 to 64 Years | 229 (8.6%) | 142 (4.8%) |
| 65 to 74 Years | 85 (5.4%) | 139 (7.5%) |
| 75 Years and over | 25 (3.5%) | 231 (12.2%) |
| Total | 843 (4.6%) | 1,225 (6.0%) |
Income Above Poverty by Sex and Age in Royal Palm Beach
According to the poverty statistics in Royal Palm Beach, males aged under 5 years and females aged 5 years are the age groups that are most secure financially, with 100.0% of males and 100.0% of females in these age groups living above the poverty line.
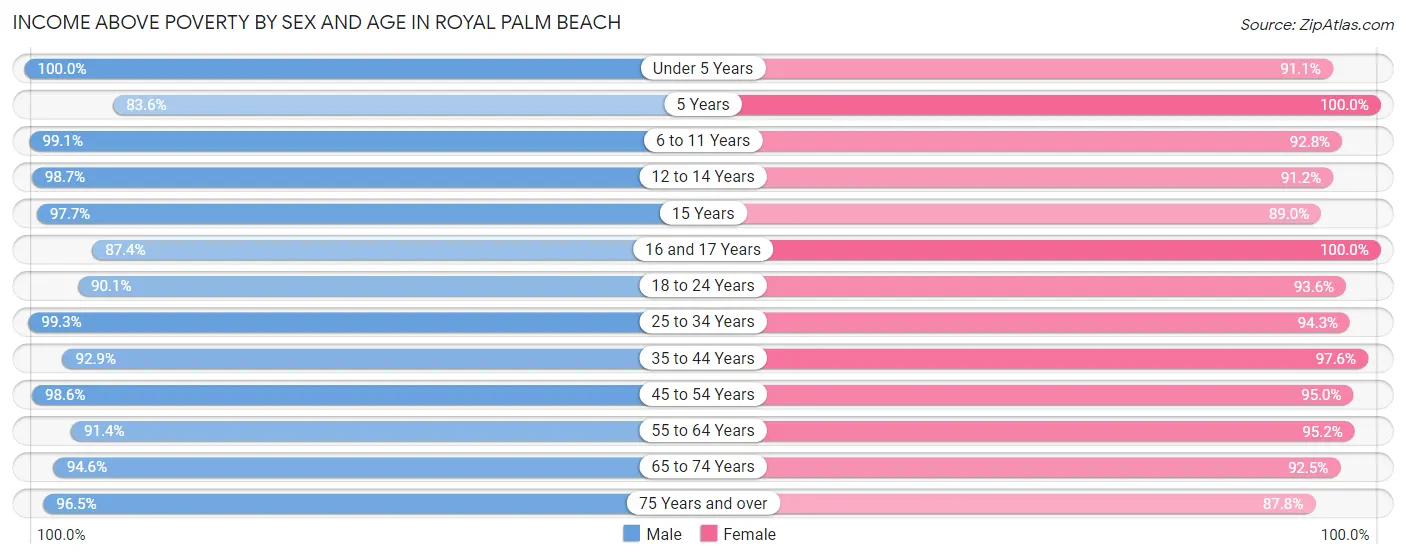
| Age Bracket | Male | Female |
| Under 5 Years | 906 (100.0%) | 897 (91.1%) |
| 5 Years | 127 (83.6%) | 115 (100.0%) |
| 6 to 11 Years | 1,835 (99.1%) | 1,190 (92.8%) |
| 12 to 14 Years | 804 (98.7%) | 858 (91.2%) |
| 15 Years | 426 (97.7%) | 161 (88.9%) |
| 16 and 17 Years | 438 (87.4%) | 830 (100.0%) |
| 18 to 24 Years | 1,343 (90.1%) | 1,165 (93.6%) |
| 25 to 34 Years | 2,162 (99.3%) | 2,437 (94.3%) |
| 35 to 44 Years | 2,344 (92.9%) | 2,522 (97.6%) |
| 45 to 54 Years | 2,602 (98.6%) | 2,672 (95.0%) |
| 55 to 64 Years | 2,422 (91.4%) | 2,792 (95.2%) |
| 65 to 74 Years | 1,483 (94.6%) | 1,715 (92.5%) |
| 75 Years and over | 696 (96.5%) | 1,666 (87.8%) |
| Total | 17,588 (95.4%) | 19,020 (94.0%) |
Income Below Poverty Among Married-Couple Families in Royal Palm Beach
The poverty statistics for married-couple families in Royal Palm Beach show that 1.1% or 84 of the total 7,409 families live below the poverty line. Families with 3 or 4 children have the highest poverty rate of 5.9%, comprising of 30 families. On the other hand, families with 1 or 2 children have the lowest poverty rate of 0.0%, which includes 0 families.
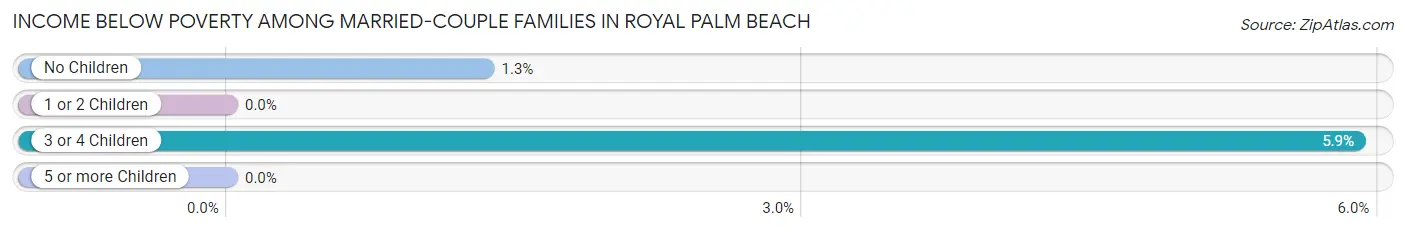
| Children | Above Poverty | Below Poverty |
| No Children | 3,977 (98.7%) | 54 (1.3%) |
| 1 or 2 Children | 2,754 (100.0%) | 0 (0.0%) |
| 3 or 4 Children | 479 (94.1%) | 30 (5.9%) |
| 5 or more Children | 115 (100.0%) | 0 (0.0%) |
| Total | 7,325 (98.9%) | 84 (1.1%) |
Income Below Poverty Among Single-Parent Households in Royal Palm Beach
According to the poverty data in Royal Palm Beach, 35.4% or 168 single-father households and 4.3% or 77 single-mother households are living below the poverty line. Among single-father households, those with 1 or 2 children have the highest poverty rate, with 86 households (51.2%) experiencing poverty. Likewise, among single-mother households, those with 1 or 2 children have the highest poverty rate, with 77 households (9.0%) falling below the poverty line.
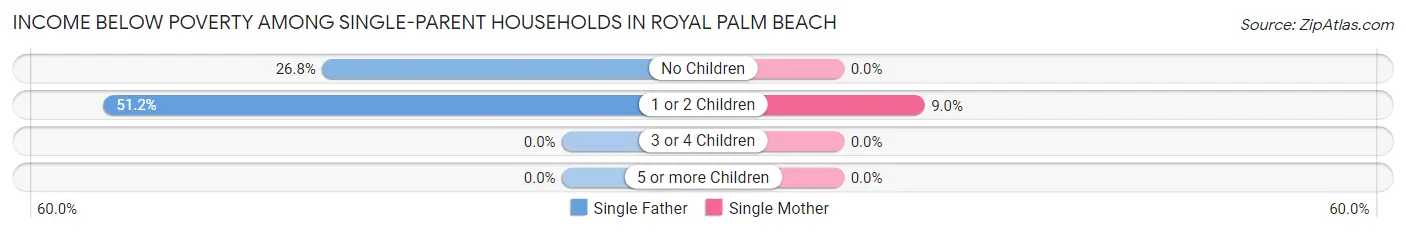
| Children | Single Father | Single Mother |
| No Children | 82 (26.8%) | 0 (0.0%) |
| 1 or 2 Children | 86 (51.2%) | 77 (9.0%) |
| 3 or 4 Children | 0 (0.0%) | 0 (0.0%) |
| 5 or more Children | 0 (0.0%) | 0 (0.0%) |
| Total | 168 (35.4%) | 77 (4.3%) |
Income Below Poverty Among Married-Couple vs Single-Parent Households in Royal Palm Beach
The poverty data for Royal Palm Beach shows that 84 of the married-couple family households (1.1%) and 245 of the single-parent households (10.8%) are living below the poverty level. Within the married-couple family households, those with 3 or 4 children have the highest poverty rate, with 30 households (5.9%) falling below the poverty line. Among the single-parent households, those with 1 or 2 children have the highest poverty rate, with 163 household (15.9%) living below poverty.
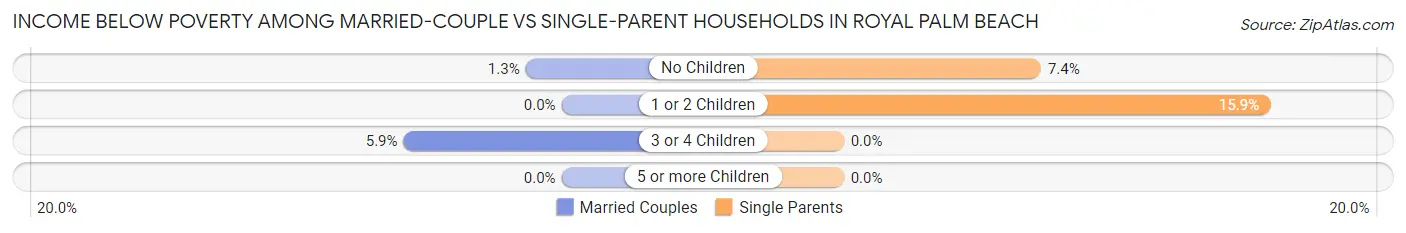
| Children | Married-Couple Families | Single-Parent Households |
| No Children | 54 (1.3%) | 82 (7.3%) |
| 1 or 2 Children | 0 (0.0%) | 163 (15.9%) |
| 3 or 4 Children | 30 (5.9%) | 0 (0.0%) |
| 5 or more Children | 0 (0.0%) | 0 (0.0%) |
| Total | 84 (1.1%) | 245 (10.8%) |
Race in Royal Palm Beach
The most populous races in Royal Palm Beach are White / Caucasian (20,099 | 51.7%), Black / African American (11,032 | 28.4%), and Hispanic or Latino (9,667 | 24.9%).
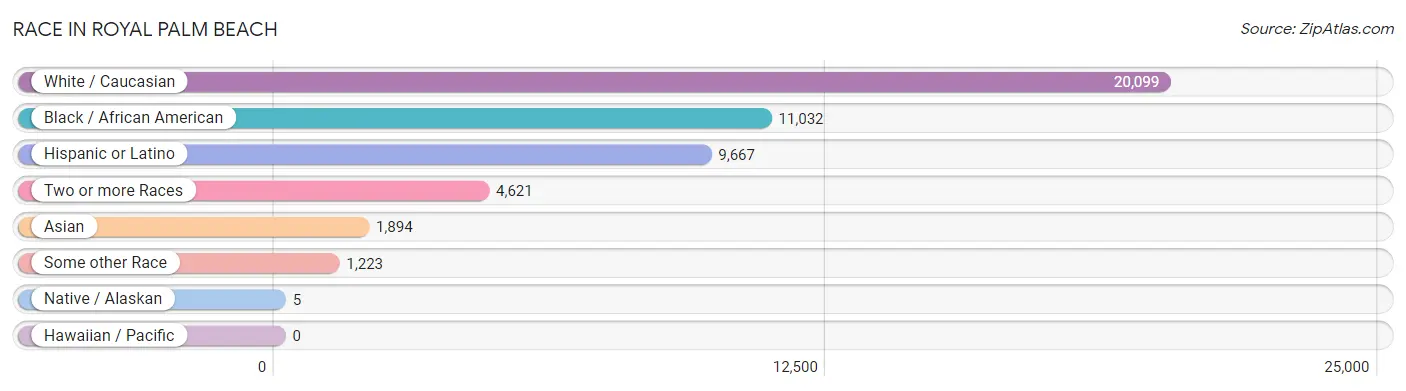
| Race | # Population | % Population |
| Asian | 1,894 | 4.9% |
| Black / African American | 11,032 | 28.4% |
| Hawaiian / Pacific | 0 | 0.0% |
| Hispanic or Latino | 9,667 | 24.9% |
| Native / Alaskan | 5 | 0.0% |
| White / Caucasian | 20,099 | 51.7% |
| Two or more Races | 4,621 | 11.9% |
| Some other Race | 1,223 | 3.2% |
| Total | 38,874 | 100.0% |
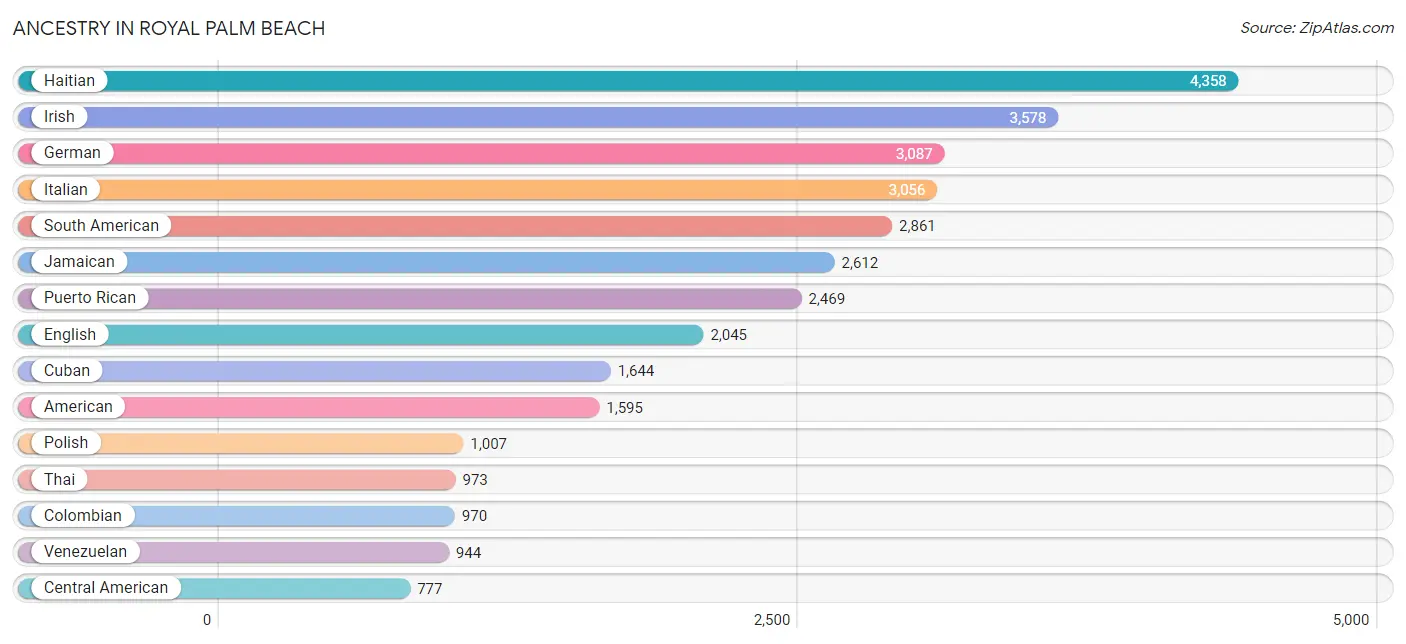
Ancestry in Royal Palm Beach
The most populous ancestries reported in Royal Palm Beach are Haitian (4,358 | 11.2%), Irish (3,578 | 9.2%), German (3,087 | 7.9%), Italian (3,056 | 7.9%), and South American (2,861 | 7.4%), together accounting for 43.6% of all Royal Palm Beach residents.
| Ancestry | # Population | % Population |
| African | 115 | 0.3% |
| American | 1,595 | 4.1% |
| Arab | 298 | 0.8% |
| Argentinean | 247 | 0.6% |
| Armenian | 75 | 0.2% |
| Assyrian / Chaldean / Syriac | 10 | 0.0% |
| Austrian | 57 | 0.2% |
| Bahamian | 110 | 0.3% |
| Basque | 8 | 0.0% |
| Belgian | 19 | 0.1% |
| Belizean | 26 | 0.1% |
| Bhutanese | 15 | 0.0% |
| Bolivian | 78 | 0.2% |
| Brazilian | 43 | 0.1% |
| British | 109 | 0.3% |
| British West Indian | 25 | 0.1% |
| Burmese | 499 | 1.3% |
| Canadian | 136 | 0.4% |
| Central American | 777 | 2.0% |
| Central American Indian | 65 | 0.2% |
| Cherokee | 143 | 0.4% |
| Chilean | 79 | 0.2% |
| Colombian | 970 | 2.5% |
| Comanche | 30 | 0.1% |
| Croatian | 19 | 0.1% |
| Cuban | 1,644 | 4.2% |
| Czech | 87 | 0.2% |
| Czechoslovakian | 22 | 0.1% |
| Danish | 53 | 0.1% |
| Delaware | 13 | 0.0% |
| Dominican | 477 | 1.2% |
| Dutch | 218 | 0.6% |
| Eastern European | 42 | 0.1% |
| Ecuadorian | 329 | 0.9% |
| Egyptian | 75 | 0.2% |
| English | 2,045 | 5.3% |
| European | 503 | 1.3% |
| Finnish | 53 | 0.1% |
| French | 500 | 1.3% |
| French Canadian | 203 | 0.5% |
| German | 3,087 | 7.9% |
| Greek | 56 | 0.1% |
| Guatemalan | 274 | 0.7% |
| Guyanese | 168 | 0.4% |
| Haitian | 4,358 | 11.2% |
| Honduran | 343 | 0.9% |
| Hungarian | 99 | 0.3% |
| Icelander | 12 | 0.0% |
| Indian (Asian) | 130 | 0.3% |
| Iranian | 80 | 0.2% |
| Irish | 3,578 | 9.2% |
| Iroquois | 5 | 0.0% |
| Italian | 3,056 | 7.9% |
| Jamaican | 2,612 | 6.7% |
| Korean | 229 | 0.6% |
| Lebanese | 38 | 0.1% |
| Liberian | 57 | 0.2% |
| Lithuanian | 31 | 0.1% |
| Macedonian | 27 | 0.1% |
| Maltese | 25 | 0.1% |
| Mexican | 725 | 1.9% |
| Nigerian | 32 | 0.1% |
| Northern European | 23 | 0.1% |
| Norwegian | 213 | 0.5% |
| Pakistani | 20 | 0.1% |
| Panamanian | 4 | 0.0% |
| Paraguayan | 11 | 0.0% |
| Peruvian | 102 | 0.3% |
| Polish | 1,007 | 2.6% |
| Portuguese | 220 | 0.6% |
| Puerto Rican | 2,469 | 6.4% |
| Romanian | 9 | 0.0% |
| Russian | 266 | 0.7% |
| Salvadoran | 156 | 0.4% |
| Scandinavian | 134 | 0.3% |
| Scotch-Irish | 46 | 0.1% |
| Scottish | 310 | 0.8% |
| Serbian | 33 | 0.1% |
| Slavic | 10 | 0.0% |
| Slovak | 21 | 0.1% |
| South American | 2,861 | 7.4% |
| South American Indian | 55 | 0.1% |
| Spaniard | 142 | 0.4% |
| Spanish | 91 | 0.2% |
| Sri Lankan | 485 | 1.3% |
| Subsaharan African | 204 | 0.5% |
| Swedish | 95 | 0.2% |
| Syrian | 161 | 0.4% |
| Thai | 973 | 2.5% |
| Trinidadian and Tobagonian | 56 | 0.1% |
| Ukrainian | 73 | 0.2% |
| Uruguayan | 101 | 0.3% |
| Venezuelan | 944 | 2.4% |
| Welsh | 160 | 0.4% |
| West Indian | 115 | 0.3% |
| Yugoslavian | 10 | 0.0% | View All 96 Rows |
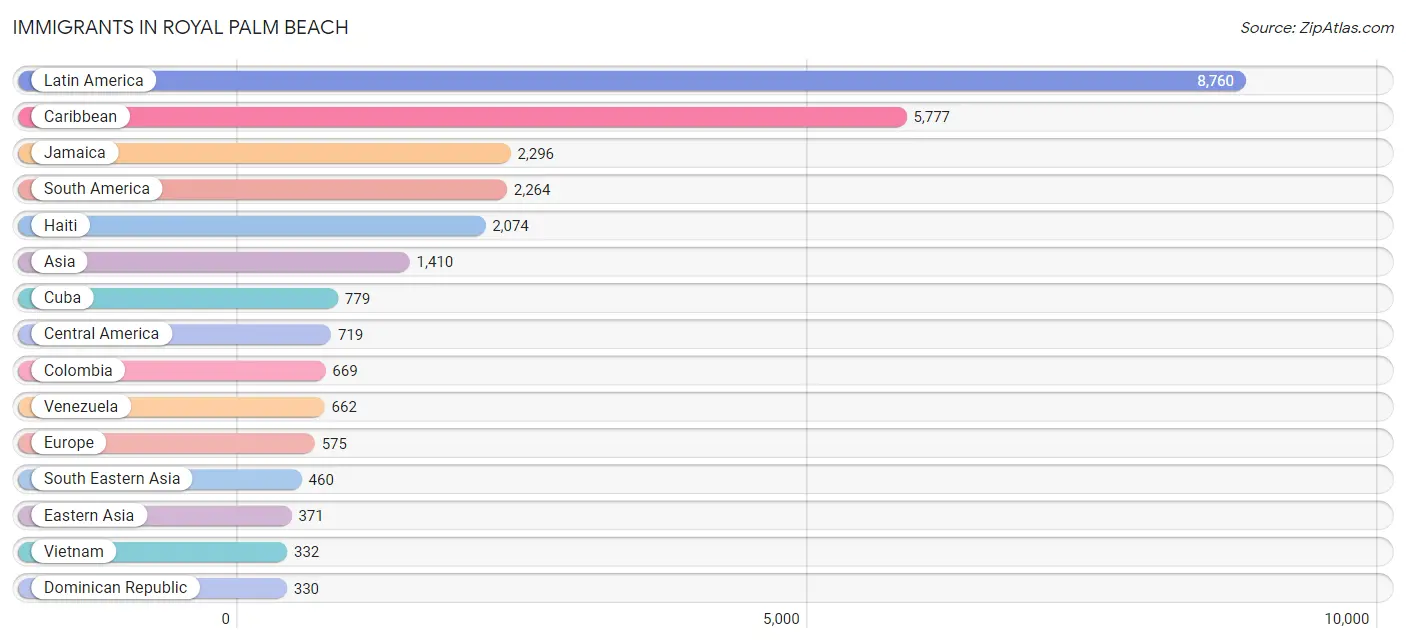
Immigrants in Royal Palm Beach
The most numerous immigrant groups reported in Royal Palm Beach came from Latin America (8,760 | 22.5%), Caribbean (5,777 | 14.9%), Jamaica (2,296 | 5.9%), South America (2,264 | 5.8%), and Haiti (2,074 | 5.3%), together accounting for 54.5% of all Royal Palm Beach residents.
| Immigration Origin | # Population | % Population |
| Africa | 92 | 0.2% |
| Argentina | 136 | 0.4% |
| Asia | 1,410 | 3.6% |
| Austria | 10 | 0.0% |
| Bahamas | 146 | 0.4% |
| Belarus | 14 | 0.0% |
| Belgium | 19 | 0.1% |
| Bolivia | 48 | 0.1% |
| Brazil | 56 | 0.1% |
| Canada | 41 | 0.1% |
| Caribbean | 5,777 | 14.9% |
| Central America | 719 | 1.8% |
| Chile | 44 | 0.1% |
| China | 185 | 0.5% |
| Colombia | 669 | 1.7% |
| Cuba | 779 | 2.0% |
| Dominican Republic | 330 | 0.9% |
| Eastern Asia | 371 | 0.9% |
| Eastern Europe | 148 | 0.4% |
| Ecuador | 254 | 0.6% |
| Egypt | 49 | 0.1% |
| El Salvador | 71 | 0.2% |
| England | 44 | 0.1% |
| Europe | 575 | 1.5% |
| France | 12 | 0.0% |
| Germany | 55 | 0.1% |
| Guatemala | 186 | 0.5% |
| Guyana | 269 | 0.7% |
| Haiti | 2,074 | 5.3% |
| Honduras | 260 | 0.7% |
| Hong Kong | 40 | 0.1% |
| India | 134 | 0.3% |
| Indonesia | 19 | 0.1% |
| Iran | 80 | 0.2% |
| Ireland | 33 | 0.1% |
| Israel | 7 | 0.0% |
| Italy | 73 | 0.2% |
| Jamaica | 2,296 | 5.9% |
| Kazakhstan | 23 | 0.1% |
| Korea | 186 | 0.5% |
| Latin America | 8,760 | 22.5% |
| Lebanon | 38 | 0.1% |
| Liberia | 30 | 0.1% |
| Mexico | 198 | 0.5% |
| Morocco | 13 | 0.0% |
| Northern Africa | 62 | 0.2% |
| Northern Europe | 205 | 0.5% |
| Norway | 61 | 0.2% |
| Panama | 4 | 0.0% |
| Peru | 41 | 0.1% |
| Philippines | 74 | 0.2% |
| Poland | 34 | 0.1% |
| Portugal | 28 | 0.1% |
| Romania | 61 | 0.2% |
| Russia | 39 | 0.1% |
| South America | 2,264 | 5.8% |
| South Central Asia | 303 | 0.8% |
| South Eastern Asia | 460 | 1.2% |
| Southern Europe | 126 | 0.3% |
| Spain | 25 | 0.1% |
| Sri Lanka | 63 | 0.2% |
| Syria | 205 | 0.5% |
| Taiwan | 12 | 0.0% |
| Thailand | 35 | 0.1% |
| Trinidad and Tobago | 152 | 0.4% |
| Uruguay | 74 | 0.2% |
| Uzbekistan | 3 | 0.0% |
| Venezuela | 662 | 1.7% |
| Vietnam | 332 | 0.9% |
| Western Africa | 30 | 0.1% |
| Western Asia | 276 | 0.7% |
| Western Europe | 96 | 0.3% | View All 72 Rows |
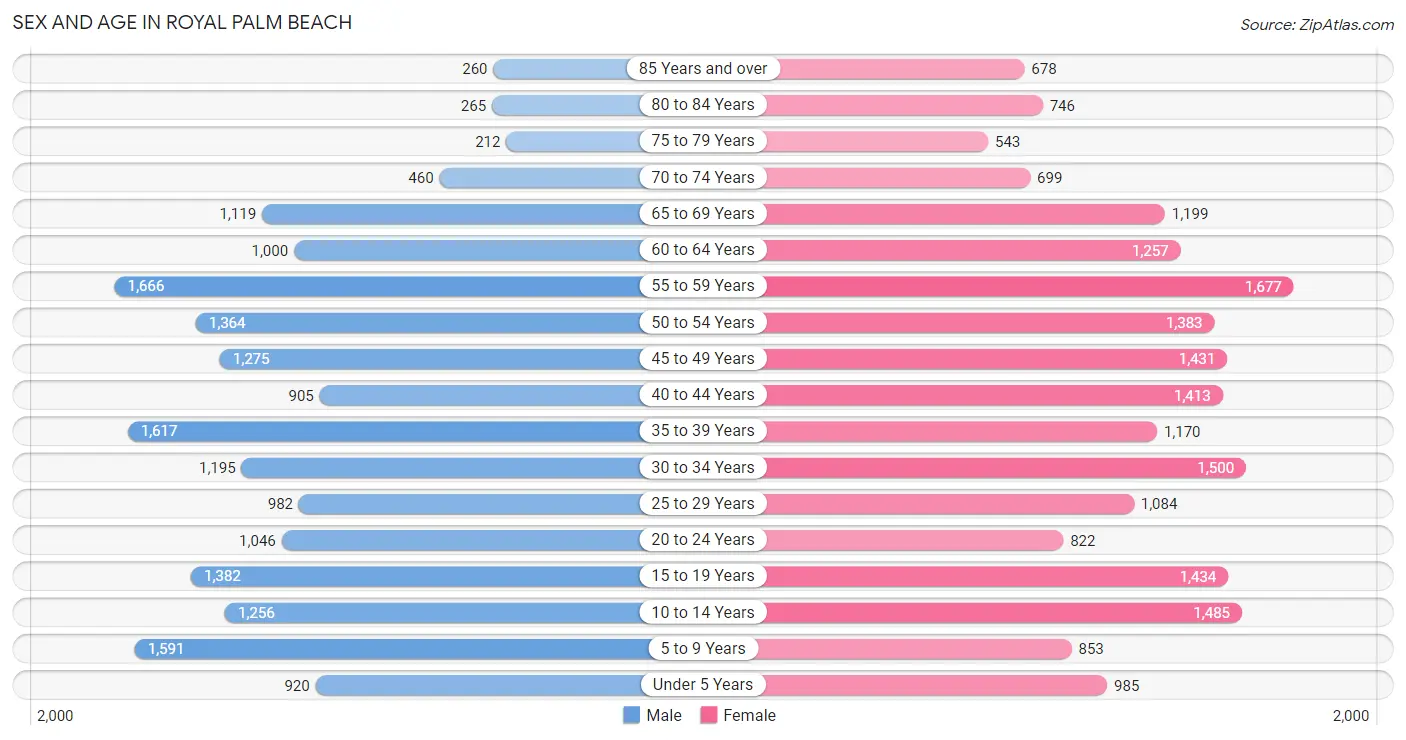
Sex and Age in Royal Palm Beach
Sex and Age in Royal Palm Beach
The most populous age groups in Royal Palm Beach are 55 to 59 Years (1,666 | 9.0%) for men and 55 to 59 Years (1,677 | 8.2%) for women.
| Age Bracket | Male | Female |
| Under 5 Years | 920 (5.0%) | 985 (4.8%) |
| 5 to 9 Years | 1,591 (8.6%) | 853 (4.2%) |
| 10 to 14 Years | 1,256 (6.8%) | 1,485 (7.3%) |
| 15 to 19 Years | 1,382 (7.5%) | 1,434 (7.0%) |
| 20 to 24 Years | 1,046 (5.7%) | 822 (4.0%) |
| 25 to 29 Years | 982 (5.3%) | 1,084 (5.3%) |
| 30 to 34 Years | 1,195 (6.5%) | 1,500 (7.4%) |
| 35 to 39 Years | 1,617 (8.7%) | 1,170 (5.8%) |
| 40 to 44 Years | 905 (4.9%) | 1,413 (6.9%) |
| 45 to 49 Years | 1,275 (6.9%) | 1,431 (7.0%) |
| 50 to 54 Years | 1,364 (7.4%) | 1,383 (6.8%) |
| 55 to 59 Years | 1,666 (9.0%) | 1,677 (8.2%) |
| 60 to 64 Years | 1,000 (5.4%) | 1,257 (6.2%) |
| 65 to 69 Years | 1,119 (6.0%) | 1,199 (5.9%) |
| 70 to 74 Years | 460 (2.5%) | 699 (3.4%) |
| 75 to 79 Years | 212 (1.1%) | 543 (2.7%) |
| 80 to 84 Years | 265 (1.4%) | 746 (3.7%) |
| 85 Years and over | 260 (1.4%) | 678 (3.3%) |
| Total | 18,515 (100.0%) | 20,359 (100.0%) |
Families and Households in Royal Palm Beach
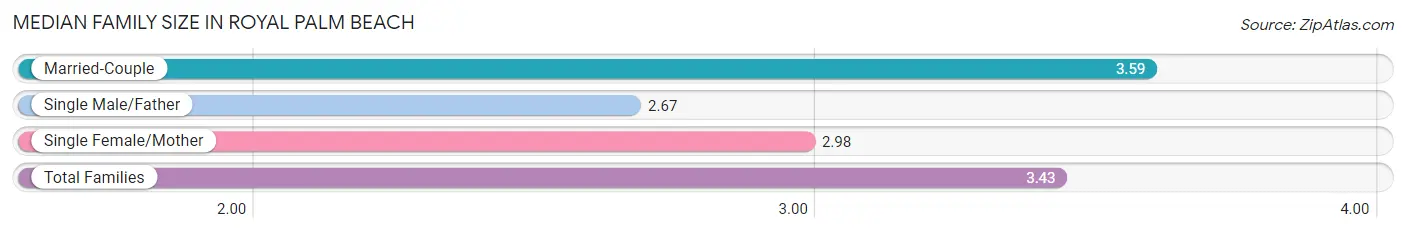
Median Family Size in Royal Palm Beach
The median family size in Royal Palm Beach is 3.43 persons per family, with married-couple families (7,409 | 76.5%) accounting for the largest median family size of 3.59 persons per family. On the other hand, single male/father families (474 | 4.9%) represent the smallest median family size with 2.67 persons per family.
| Family Type | # Families | Family Size |
| Married-Couple | 7,409 (76.5%) | 3.59 |
| Single Male/Father | 474 (4.9%) | 2.67 |
| Single Female/Mother | 1,801 (18.6%) | 2.98 |
| Total Families | 9,684 (100.0%) | 3.43 |
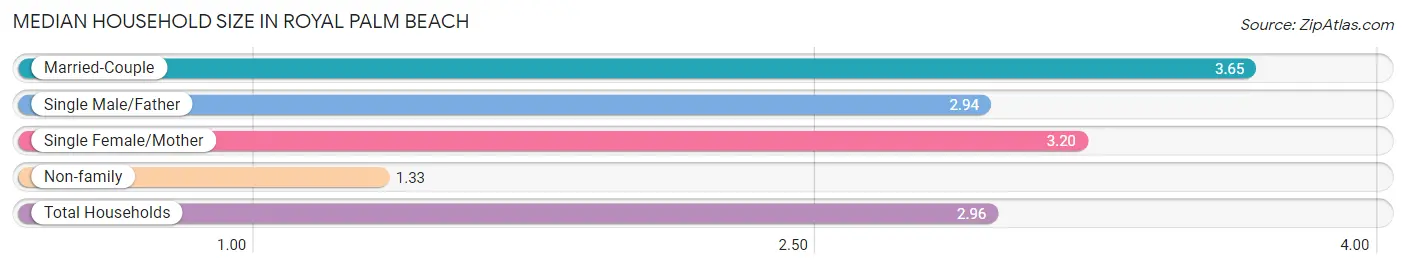
Median Household Size in Royal Palm Beach
The median household size in Royal Palm Beach is 2.96 persons per household, with married-couple households (7,409 | 56.7%) accounting for the largest median household size of 3.65 persons per household. non-family households (3,376 | 25.9%) represent the smallest median household size with 1.33 persons per household.
| Household Type | # Households | Household Size |
| Married-Couple | 7,409 (56.7%) | 3.65 |
| Single Male/Father | 474 (3.6%) | 2.94 |
| Single Female/Mother | 1,801 (13.8%) | 3.20 |
| Non-family | 3,376 (25.9%) | 1.33 |
| Total Households | 13,060 (100.0%) | 2.96 |
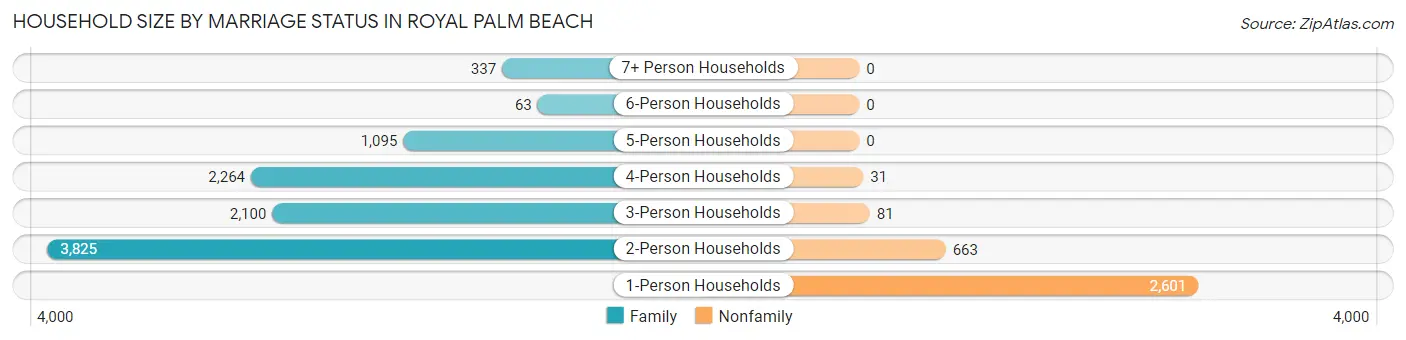
Household Size by Marriage Status in Royal Palm Beach
Out of a total of 13,060 households in Royal Palm Beach, 9,684 (74.2%) are family households, while 3,376 (25.9%) are nonfamily households. The most numerous type of family households are 2-person households, comprising 3,825, and the most common type of nonfamily households are 1-person households, comprising 2,601.
| Household Size | Family Households | Nonfamily Households |
| 1-Person Households | - | 2,601 (19.9%) |
| 2-Person Households | 3,825 (29.3%) | 663 (5.1%) |
| 3-Person Households | 2,100 (16.1%) | 81 (0.6%) |
| 4-Person Households | 2,264 (17.3%) | 31 (0.2%) |
| 5-Person Households | 1,095 (8.4%) | 0 (0.0%) |
| 6-Person Households | 63 (0.5%) | 0 (0.0%) |
| 7+ Person Households | 337 (2.6%) | 0 (0.0%) |
| Total | 9,684 (74.2%) | 3,376 (25.9%) |
Female Fertility in Royal Palm Beach
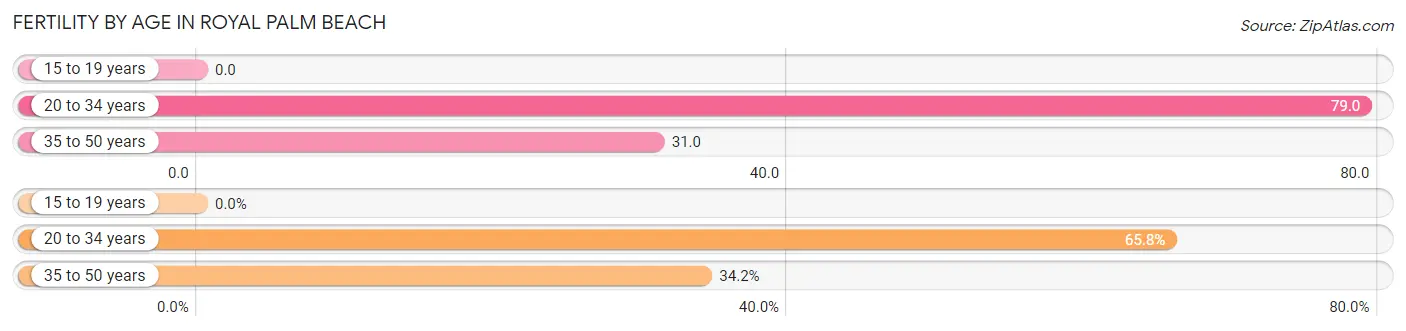
Fertility by Age in Royal Palm Beach
Average fertility rate in Royal Palm Beach is 44.0 births per 1,000 women. Women in the age bracket of 20 to 34 years have the highest fertility rate with 79.0 births per 1,000 women. Women in the age bracket of 20 to 34 years acount for 65.8% of all women with births.
| Age Bracket | Women with Births | Births / 1,000 Women |
| 15 to 19 years | 0 (0.0%) | 0.0 |
| 20 to 34 years | 269 (65.8%) | 79.0 |
| 35 to 50 years | 140 (34.2%) | 31.0 |
| Total | 409 (100.0%) | 44.0 |
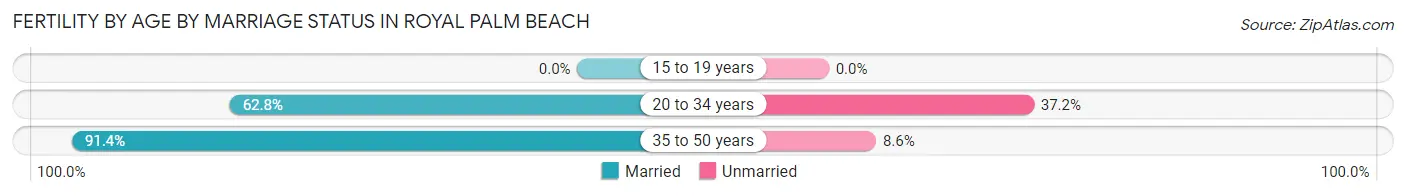
Fertility by Age by Marriage Status in Royal Palm Beach
72.6% of women with births (409) in Royal Palm Beach are married. The highest percentage of unmarried women with births falls into 20 to 34 years age bracket with 37.2% of them unmarried at the time of birth, while the lowest percentage of unmarried women with births belong to 35 to 50 years age bracket with 8.6% of them unmarried.
| Age Bracket | Married | Unmarried |
| 15 to 19 years | 0 (0.0%) | 0 (0.0%) |
| 20 to 34 years | 169 (62.8%) | 100 (37.2%) |
| 35 to 50 years | 128 (91.4%) | 12 (8.6%) |
| Total | 297 (72.6%) | 112 (27.4%) |
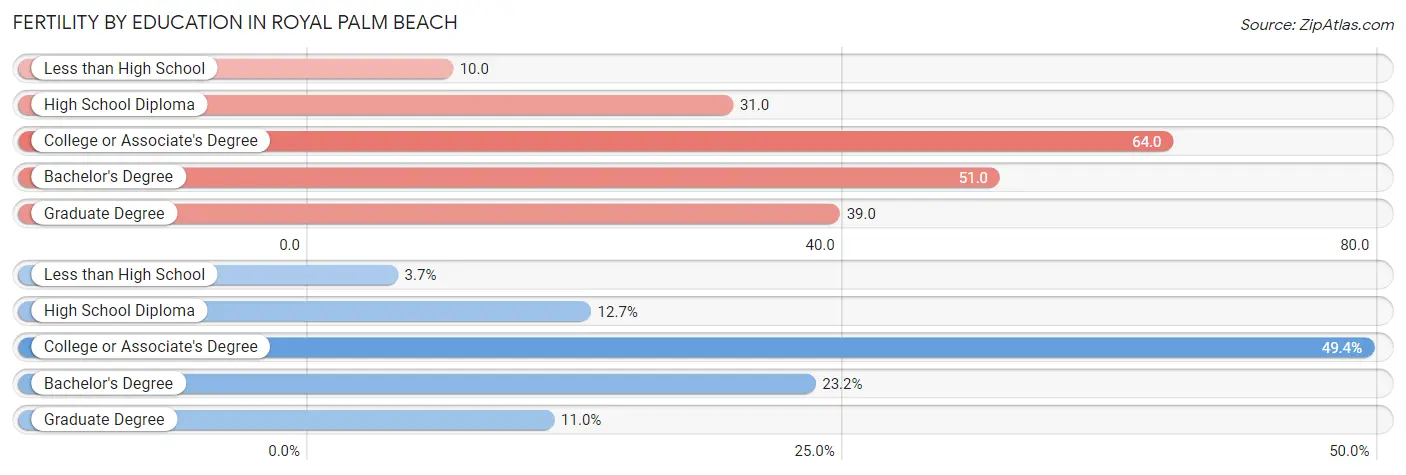
Fertility by Education in Royal Palm Beach
Average fertility rate in Royal Palm Beach is 44.0 births per 1,000 women. Women with the education attainment of college or associate's degree have the highest fertility rate of 64.0 births per 1,000 women, while women with the education attainment of less than high school have the lowest fertility at 10.0 births per 1,000 women. Women with the education attainment of college or associate's degree represent 49.4% of all women with births.
| Educational Attainment | Women with Births | Births / 1,000 Women |
| Less than High School | 15 (3.7%) | 10.0 |
| High School Diploma | 52 (12.7%) | 31.0 |
| College or Associate's Degree | 202 (49.4%) | 64.0 |
| Bachelor's Degree | 95 (23.2%) | 51.0 |
| Graduate Degree | 45 (11.0%) | 39.0 |
| Total | 409 (100.0%) | 44.0 |
Fertility by Education by Marriage Status in Royal Palm Beach
27.4% of women with births in Royal Palm Beach are unmarried. Women with the educational attainment of less than high school are most likely to be married with 100.0% of them married at childbirth, while women with the educational attainment of high school diploma are least likely to be married with 100.0% of them unmarried at childbirth.
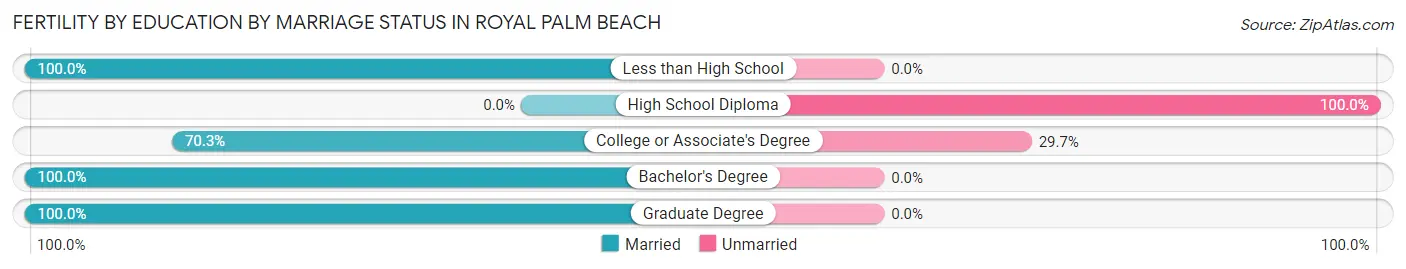
| Educational Attainment | Married | Unmarried |
| Less than High School | 15 (100.0%) | 0 (0.0%) |
| High School Diploma | 0 (0.0%) | 52 (100.0%) |
| College or Associate's Degree | 142 (70.3%) | 60 (29.7%) |
| Bachelor's Degree | 95 (100.0%) | 0 (0.0%) |
| Graduate Degree | 45 (100.0%) | 0 (0.0%) |
| Total | 297 (72.6%) | 112 (27.4%) |
Employment Characteristics in Royal Palm Beach
Employment by Class of Employer in Royal Palm Beach
Among the 20,032 employed individuals in Royal Palm Beach, private company employees (12,475 | 62.3%), local government employees (2,630 | 13.1%), and not-for-profit organizations (1,568 | 7.8%) make up the most common classes of employment.
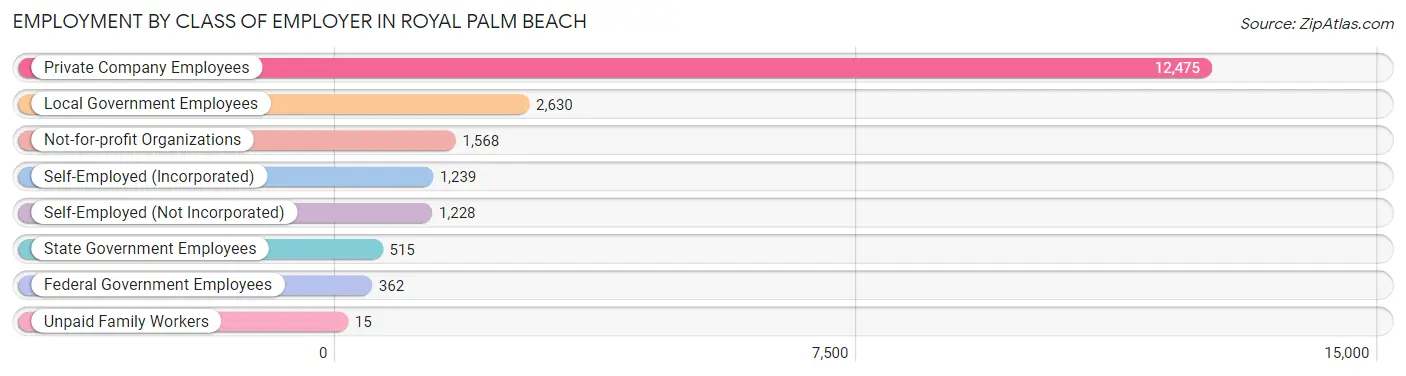
| Employer Class | # Employees | % Employees |
| Private Company Employees | 12,475 | 62.3% |
| Self-Employed (Incorporated) | 1,239 | 6.2% |
| Self-Employed (Not Incorporated) | 1,228 | 6.1% |
| Not-for-profit Organizations | 1,568 | 7.8% |
| Local Government Employees | 2,630 | 13.1% |
| State Government Employees | 515 | 2.6% |
| Federal Government Employees | 362 | 1.8% |
| Unpaid Family Workers | 15 | 0.1% |
| Total | 20,032 | 100.0% |
Employment Status by Age in Royal Palm Beach
According to the labor force statistics for Royal Palm Beach, out of the total population over 16 years of age (31,167), 69.6% or 21,692 individuals are in the labor force, with 4.8% or 1,041 of them unemployed. The age group with the highest labor force participation rate is 25 to 29 years, with 88.6% or 1,830 individuals in the labor force. Within the labor force, the 16 to 19 years age range has the highest percentage of unemployed individuals, with 24.4% or 217 of them being unemployed.
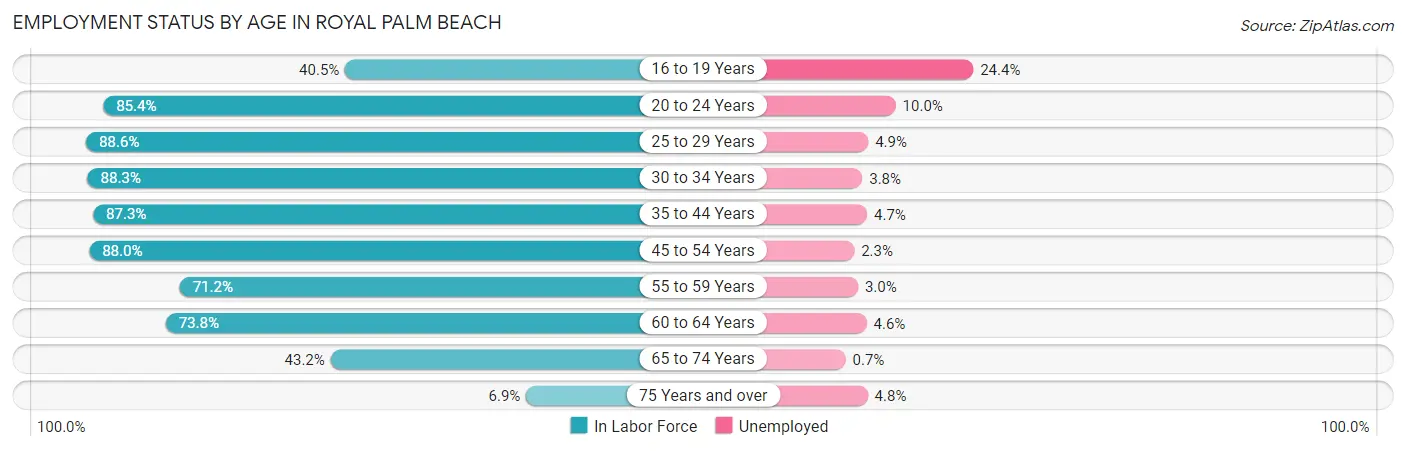
| Age Bracket | In Labor Force | Unemployed |
| 16 to 19 Years | 891 (40.5%) | 217 (24.4%) |
| 20 to 24 Years | 1,595 (85.4%) | 160 (10.0%) |
| 25 to 29 Years | 1,830 (88.6%) | 90 (4.9%) |
| 30 to 34 Years | 2,380 (88.3%) | 90 (3.8%) |
| 35 to 44 Years | 4,457 (87.3%) | 209 (4.7%) |
| 45 to 54 Years | 4,799 (88.0%) | 110 (2.3%) |
| 55 to 59 Years | 2,380 (71.2%) | 71 (3.0%) |
| 60 to 64 Years | 1,666 (73.8%) | 77 (4.6%) |
| 65 to 74 Years | 1,502 (43.2%) | 11 (0.7%) |
| 75 Years and over | 187 (6.9%) | 9 (4.8%) |
| Total | 21,692 (69.6%) | 1,041 (4.8%) |
Employment Status by Educational Attainment in Royal Palm Beach
According to labor force statistics for Royal Palm Beach, 83.7% of individuals (17,509) out of the total population between 25 and 64 years of age (20,919) are in the labor force, with 3.7% or 648 of them being unemployed. The group with the highest labor force participation rate are those with the educational attainment of bachelor's degree or higher, with 87.4% or 6,778 individuals in the labor force. Within the labor force, individuals with high school diploma education have the highest percentage of unemployment, with 8.0% or 240 of them being unemployed.
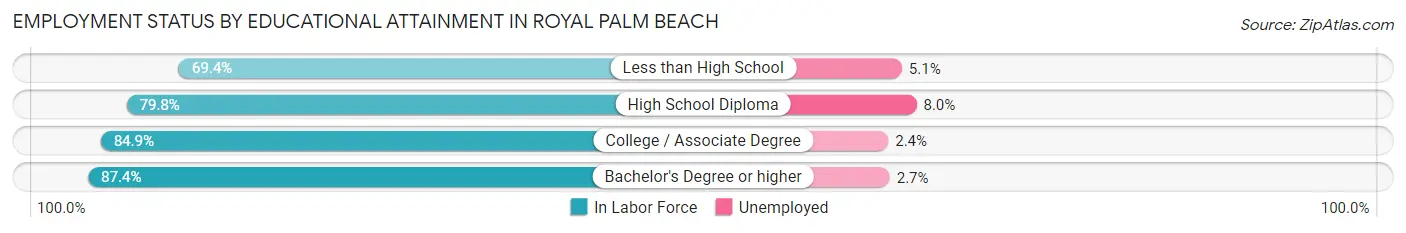
| Educational Attainment | In Labor Force | Unemployed |
| Less than High School | 1,128 (69.4%) | 83 (5.1%) |
| High School Diploma | 2,999 (79.8%) | 301 (8.0%) |
| College / Associate Degree | 6,606 (84.9%) | 187 (2.4%) |
| Bachelor's Degree or higher | 6,778 (87.4%) | 209 (2.7%) |
| Total | 17,509 (83.7%) | 774 (3.7%) |
Employment Occupations by Sex in Royal Palm Beach
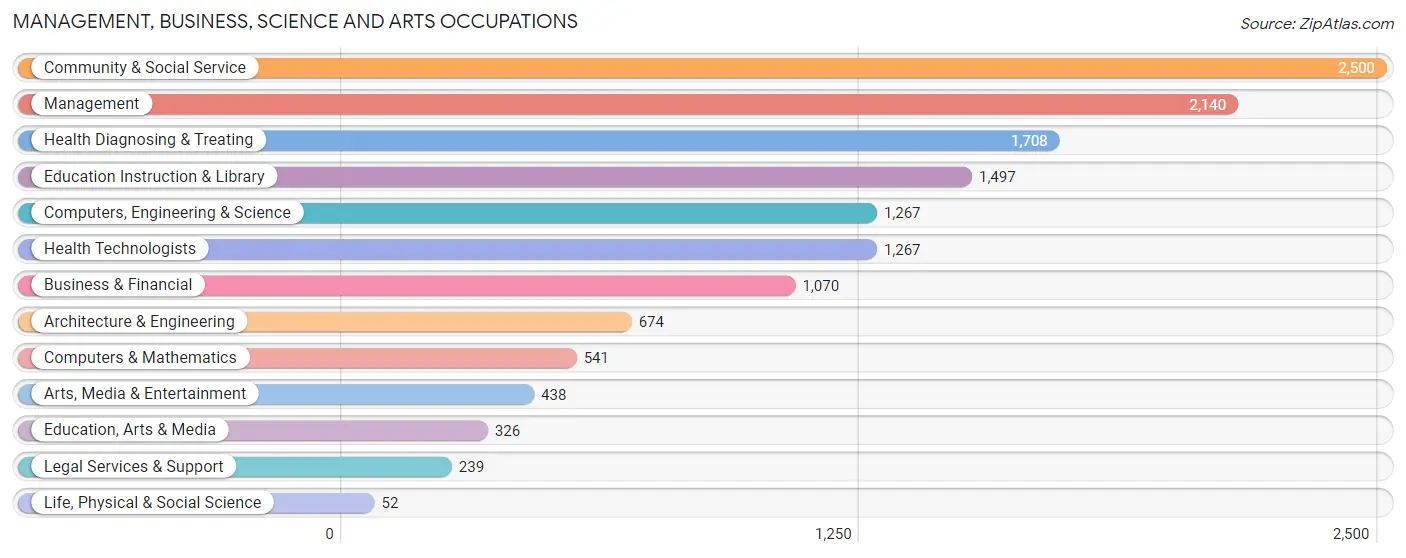
Management, Business, Science and Arts Occupations
The most common Management, Business, Science and Arts occupations in Royal Palm Beach are Community & Social Service (2,500 | 12.1%), Management (2,140 | 10.4%), Health Diagnosing & Treating (1,708 | 8.3%), Education Instruction & Library (1,497 | 7.2%), and Computers, Engineering & Science (1,267 | 6.1%).
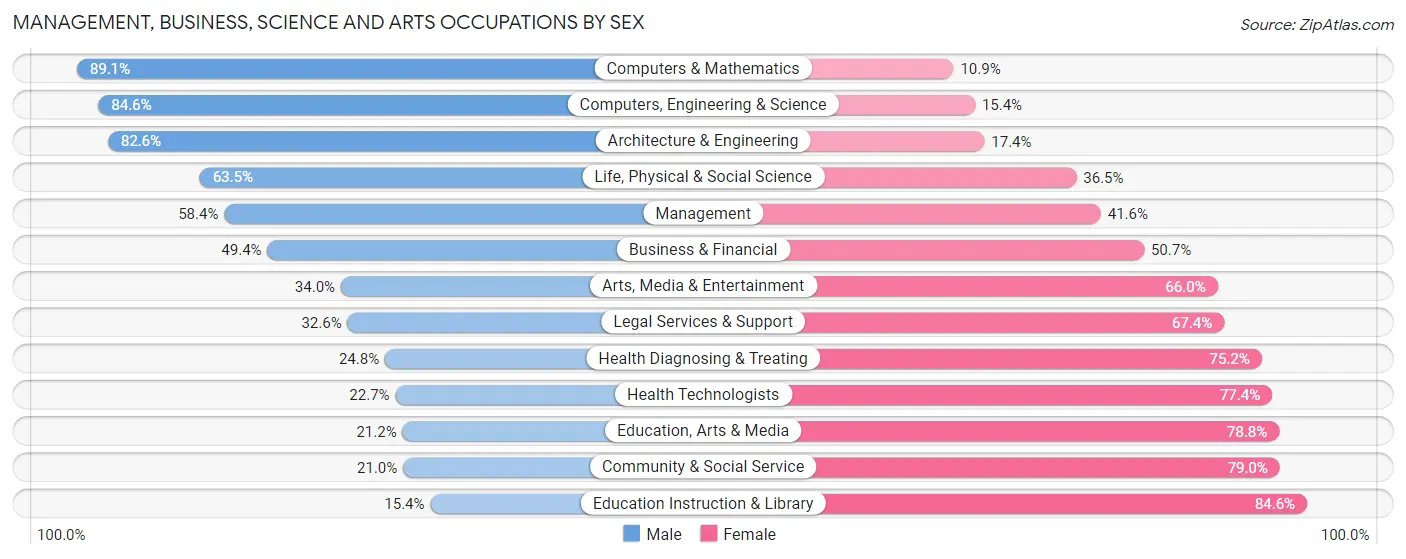
Management, Business, Science and Arts Occupations by Sex
Within the Management, Business, Science and Arts occupations in Royal Palm Beach, the most male-oriented occupations are Computers & Mathematics (89.1%), Computers, Engineering & Science (84.6%), and Architecture & Engineering (82.6%), while the most female-oriented occupations are Education Instruction & Library (84.6%), Community & Social Service (79.0%), and Education, Arts & Media (78.8%).
| Occupation | Male | Female |
| Management | 1,249 (58.4%) | 891 (41.6%) |
| Business & Financial | 528 (49.3%) | 542 (50.6%) |
| Computers, Engineering & Science | 1,072 (84.6%) | 195 (15.4%) |
| Computers & Mathematics | 482 (89.1%) | 59 (10.9%) |
| Architecture & Engineering | 557 (82.6%) | 117 (17.4%) |
| Life, Physical & Social Science | 33 (63.5%) | 19 (36.5%) |
| Community & Social Service | 526 (21.0%) | 1,974 (79.0%) |
| Education, Arts & Media | 69 (21.2%) | 257 (78.8%) |
| Legal Services & Support | 78 (32.6%) | 161 (67.4%) |
| Education Instruction & Library | 230 (15.4%) | 1,267 (84.6%) |
| Arts, Media & Entertainment | 149 (34.0%) | 289 (66.0%) |
| Health Diagnosing & Treating | 424 (24.8%) | 1,284 (75.2%) |
| Health Technologists | 287 (22.7%) | 980 (77.3%) |
| Total (Category) | 3,799 (43.7%) | 4,886 (56.3%) |
| Total (Overall) | 10,329 (50.0%) | 10,313 (50.0%) |
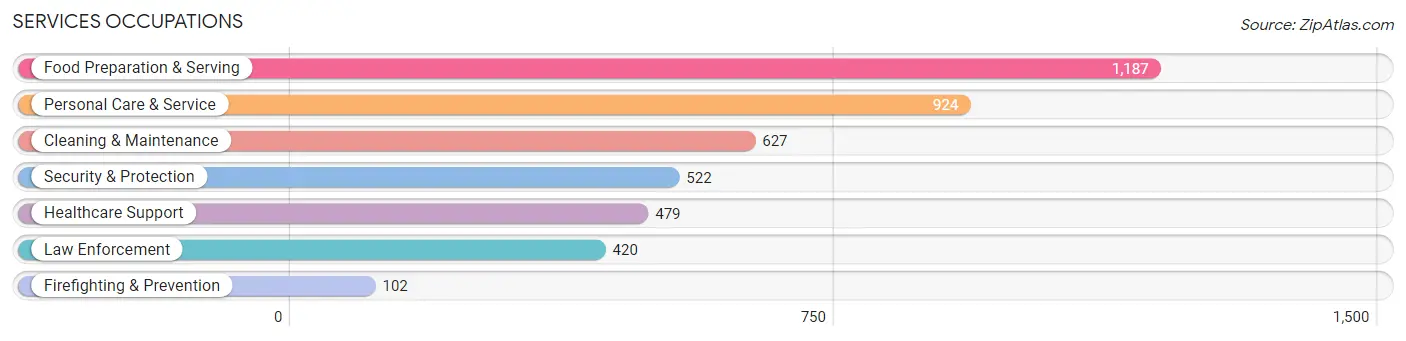
Services Occupations
The most common Services occupations in Royal Palm Beach are Food Preparation & Serving (1,187 | 5.8%), Personal Care & Service (924 | 4.5%), Cleaning & Maintenance (627 | 3.0%), Security & Protection (522 | 2.5%), and Healthcare Support (479 | 2.3%).
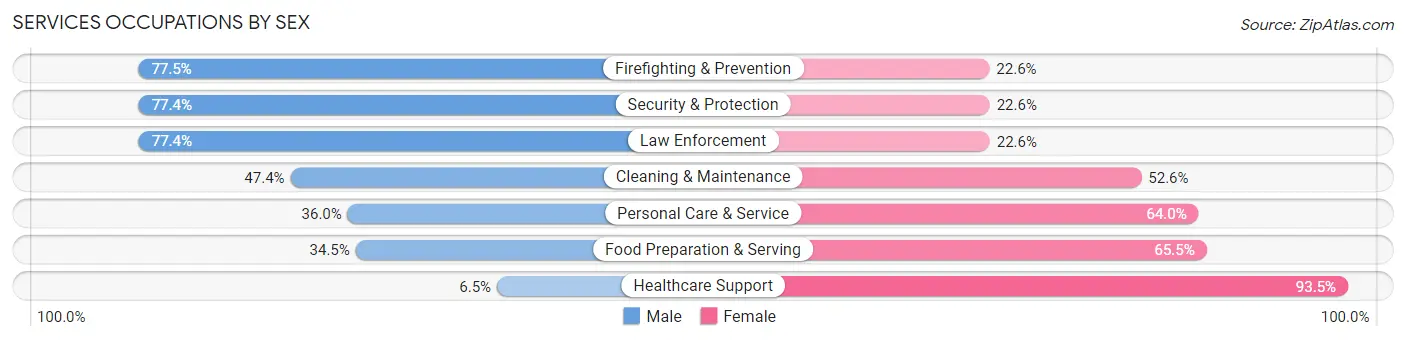
Services Occupations by Sex
Within the Services occupations in Royal Palm Beach, the most male-oriented occupations are Firefighting & Prevention (77.4%), Security & Protection (77.4%), and Law Enforcement (77.4%), while the most female-oriented occupations are Healthcare Support (93.5%), Food Preparation & Serving (65.5%), and Personal Care & Service (64.0%).
| Occupation | Male | Female |
| Healthcare Support | 31 (6.5%) | 448 (93.5%) |
| Security & Protection | 404 (77.4%) | 118 (22.6%) |
| Firefighting & Prevention | 79 (77.4%) | 23 (22.6%) |
| Law Enforcement | 325 (77.4%) | 95 (22.6%) |
| Food Preparation & Serving | 409 (34.5%) | 778 (65.5%) |
| Cleaning & Maintenance | 297 (47.4%) | 330 (52.6%) |
| Personal Care & Service | 333 (36.0%) | 591 (64.0%) |
| Total (Category) | 1,474 (39.4%) | 2,265 (60.6%) |
| Total (Overall) | 10,329 (50.0%) | 10,313 (50.0%) |
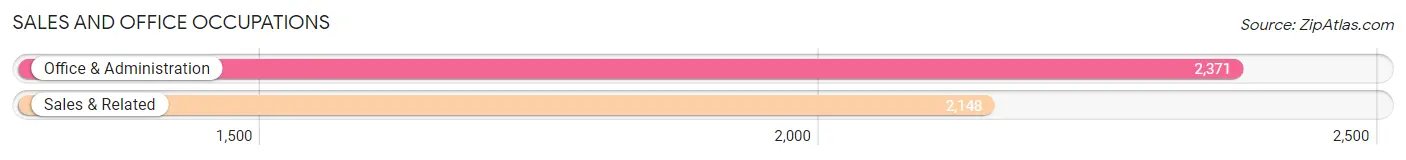
Sales and Office Occupations
The most common Sales and Office occupations in Royal Palm Beach are Office & Administration (2,371 | 11.5%), and Sales & Related (2,148 | 10.4%).
Sales and Office Occupations by Sex
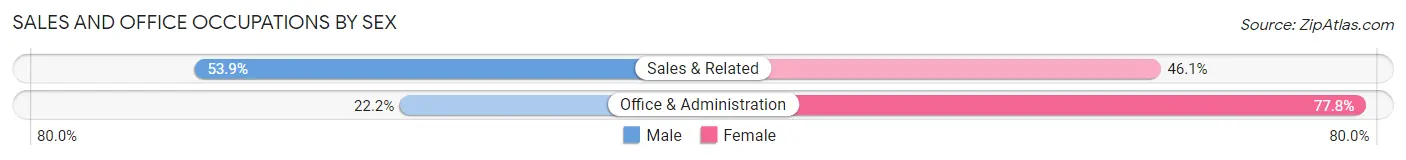
| Occupation | Male | Female |
| Sales & Related | 1,157 (53.9%) | 991 (46.1%) |
| Office & Administration | 527 (22.2%) | 1,844 (77.8%) |
| Total (Category) | 1,684 (37.3%) | 2,835 (62.7%) |
| Total (Overall) | 10,329 (50.0%) | 10,313 (50.0%) |
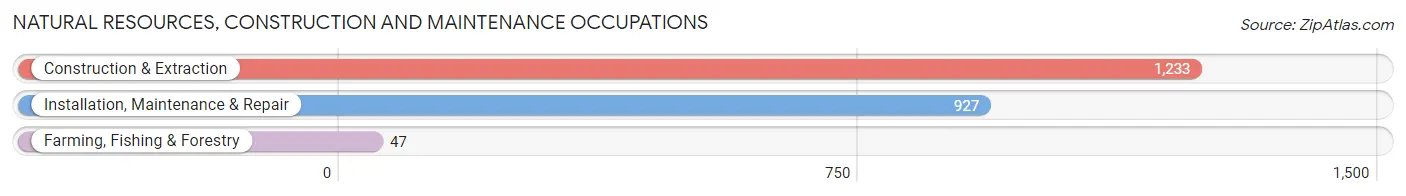
Natural Resources, Construction and Maintenance Occupations
The most common Natural Resources, Construction and Maintenance occupations in Royal Palm Beach are Construction & Extraction (1,233 | 6.0%), Installation, Maintenance & Repair (927 | 4.5%), and Farming, Fishing & Forestry (47 | 0.2%).
Natural Resources, Construction and Maintenance Occupations by Sex
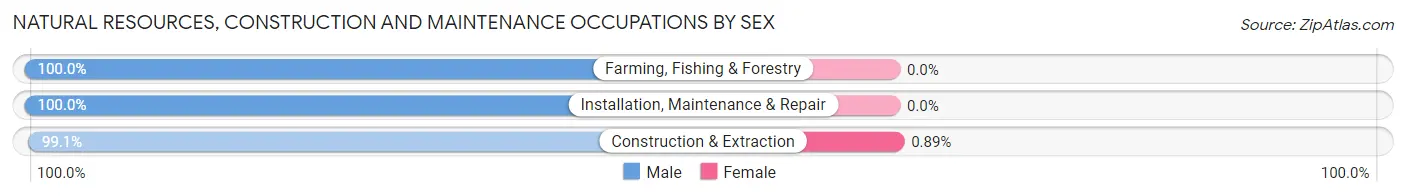
| Occupation | Male | Female |
| Farming, Fishing & Forestry | 47 (100.0%) | 0 (0.0%) |
| Construction & Extraction | 1,222 (99.1%) | 11 (0.9%) |
| Installation, Maintenance & Repair | 927 (100.0%) | 0 (0.0%) |
| Total (Category) | 2,196 (99.5%) | 11 (0.5%) |
| Total (Overall) | 10,329 (50.0%) | 10,313 (50.0%) |
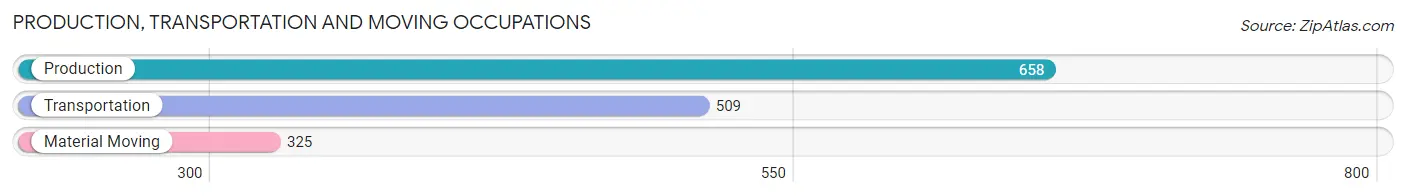
Production, Transportation and Moving Occupations
The most common Production, Transportation and Moving occupations in Royal Palm Beach are Production (658 | 3.2%), Transportation (509 | 2.5%), and Material Moving (325 | 1.6%).
Production, Transportation and Moving Occupations by Sex
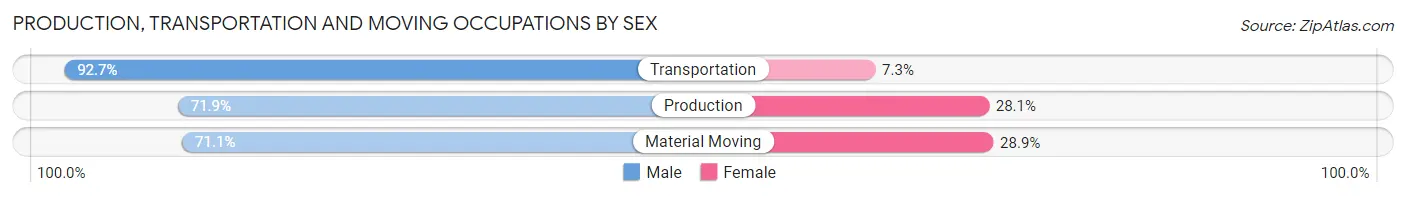
| Occupation | Male | Female |
| Production | 473 (71.9%) | 185 (28.1%) |
| Transportation | 472 (92.7%) | 37 (7.3%) |
| Material Moving | 231 (71.1%) | 94 (28.9%) |
| Total (Category) | 1,176 (78.8%) | 316 (21.2%) |
| Total (Overall) | 10,329 (50.0%) | 10,313 (50.0%) |
Employment Industries by Sex in Royal Palm Beach
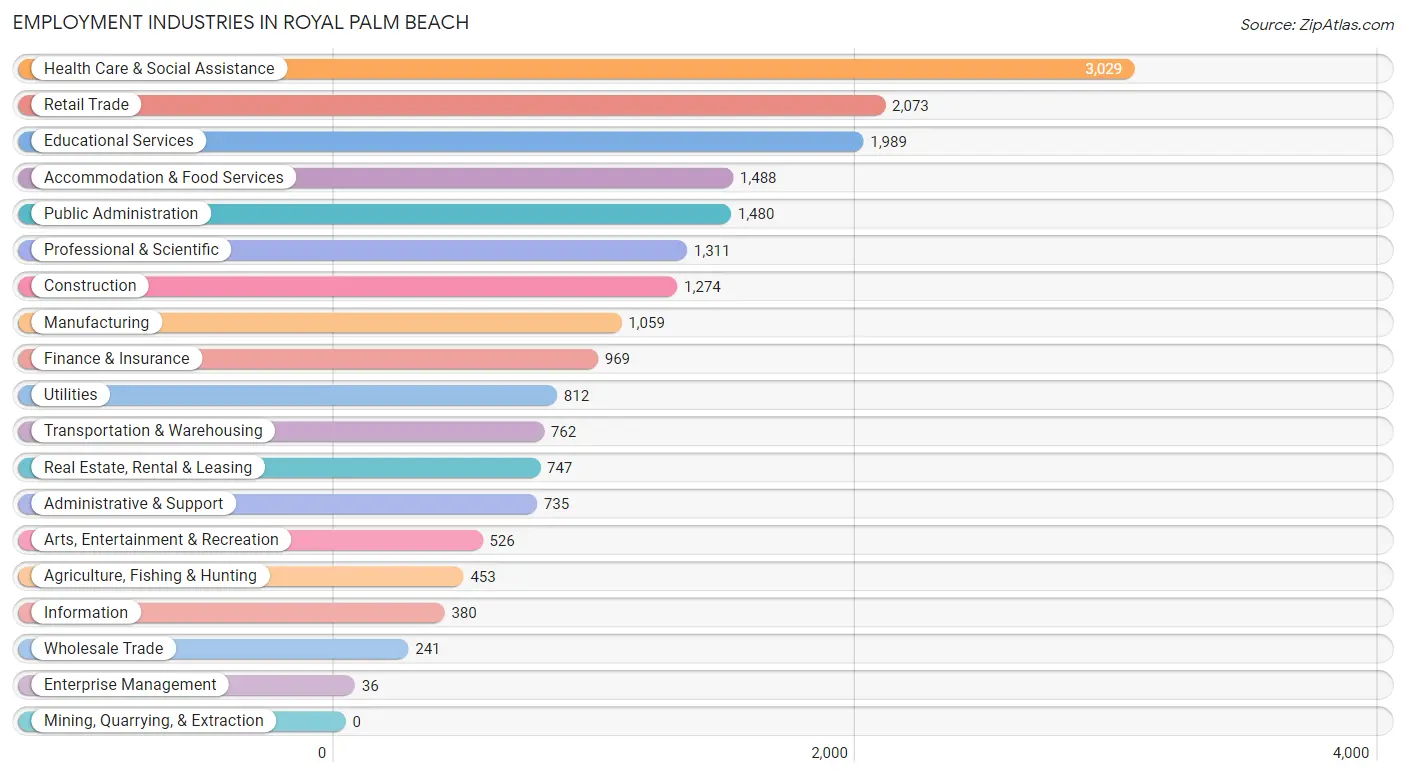
Employment Industries in Royal Palm Beach
The major employment industries in Royal Palm Beach include Health Care & Social Assistance (3,029 | 14.7%), Retail Trade (2,073 | 10.0%), Educational Services (1,989 | 9.6%), Accommodation & Food Services (1,488 | 7.2%), and Public Administration (1,480 | 7.2%).
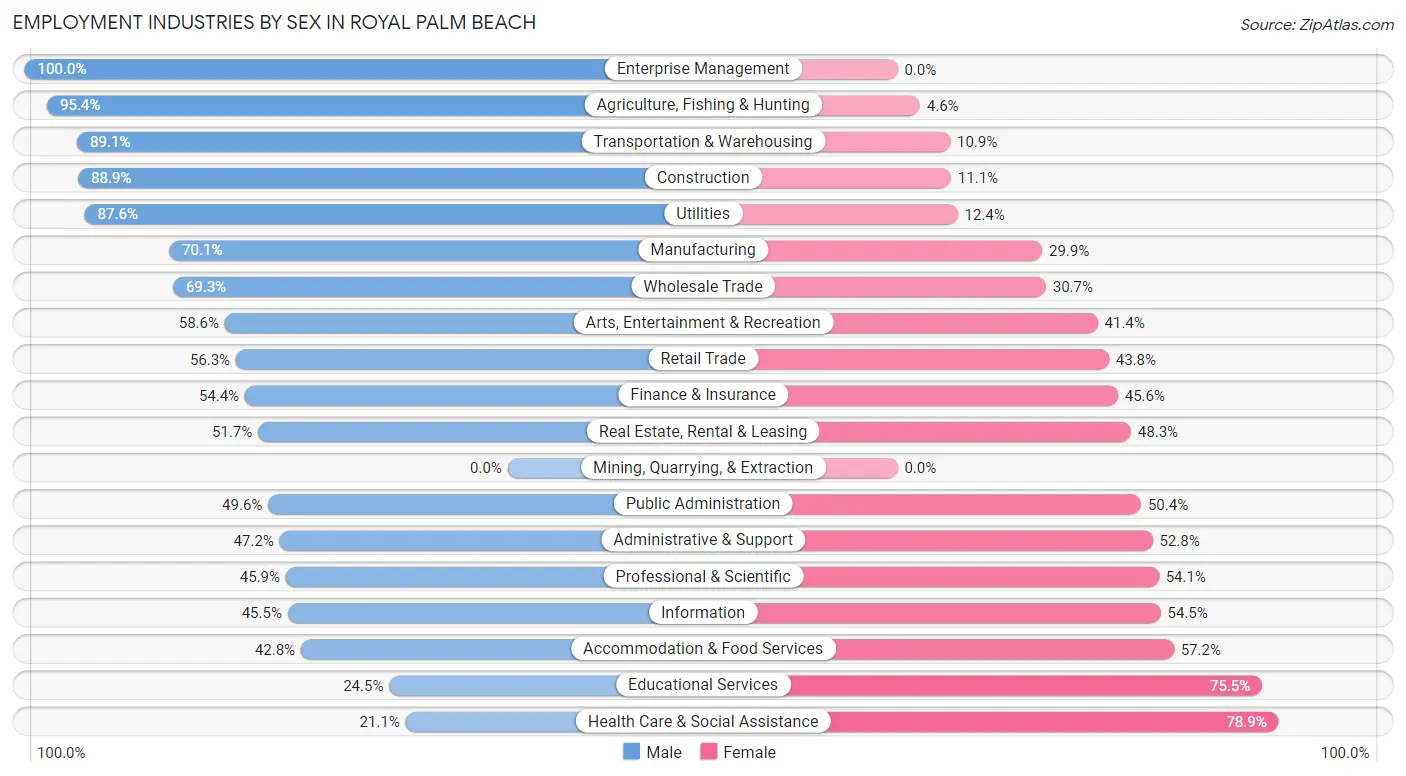
Employment Industries by Sex in Royal Palm Beach
The Royal Palm Beach industries that see more men than women are Enterprise Management (100.0%), Agriculture, Fishing & Hunting (95.4%), and Transportation & Warehousing (89.1%), whereas the industries that tend to have a higher number of women are Health Care & Social Assistance (78.9%), Educational Services (75.5%), and Accommodation & Food Services (57.2%).
| Industry | Male | Female |
| Agriculture, Fishing & Hunting | 432 (95.4%) | 21 (4.6%) |
| Mining, Quarrying, & Extraction | 0 (0.0%) | 0 (0.0%) |
| Construction | 1,133 (88.9%) | 141 (11.1%) |
| Manufacturing | 742 (70.1%) | 317 (29.9%) |
| Wholesale Trade | 167 (69.3%) | 74 (30.7%) |
| Retail Trade | 1,166 (56.2%) | 907 (43.8%) |
| Transportation & Warehousing | 679 (89.1%) | 83 (10.9%) |
| Utilities | 711 (87.6%) | 101 (12.4%) |
| Information | 173 (45.5%) | 207 (54.5%) |
| Finance & Insurance | 527 (54.4%) | 442 (45.6%) |
| Real Estate, Rental & Leasing | 386 (51.7%) | 361 (48.3%) |
| Professional & Scientific | 602 (45.9%) | 709 (54.1%) |
| Enterprise Management | 36 (100.0%) | 0 (0.0%) |
| Administrative & Support | 347 (47.2%) | 388 (52.8%) |
| Educational Services | 488 (24.5%) | 1,501 (75.5%) |
| Health Care & Social Assistance | 640 (21.1%) | 2,389 (78.9%) |
| Arts, Entertainment & Recreation | 308 (58.6%) | 218 (41.4%) |
| Accommodation & Food Services | 637 (42.8%) | 851 (57.2%) |
| Public Administration | 734 (49.6%) | 746 (50.4%) |
| Total | 10,329 (50.0%) | 10,313 (50.0%) |
Education in Royal Palm Beach
School Enrollment in Royal Palm Beach
The most common levels of schooling among the 10,582 students in Royal Palm Beach are high school (2,585 | 24.4%), middle school (2,290 | 21.6%), and college / undergraduate (2,262 | 21.4%).
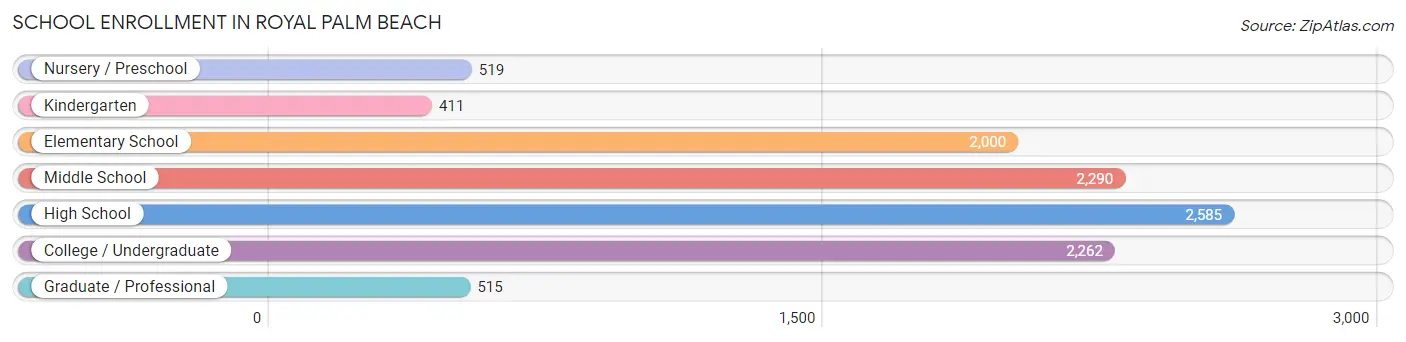
| School Level | # Students | % Students |
| Nursery / Preschool | 519 | 4.9% |
| Kindergarten | 411 | 3.9% |
| Elementary School | 2,000 | 18.9% |
| Middle School | 2,290 | 21.6% |
| High School | 2,585 | 24.4% |
| College / Undergraduate | 2,262 | 21.4% |
| Graduate / Professional | 515 | 4.9% |
| Total | 10,582 | 100.0% |
School Enrollment by Age by Funding Source in Royal Palm Beach
Out of a total of 10,582 students who are enrolled in schools in Royal Palm Beach, 1,556 (14.7%) attend a private institution, while the remaining 9,026 (85.3%) are enrolled in public schools. The age group of 3 to 4 year olds has the highest likelihood of being enrolled in private schools, with 238 (59.4% in the age bracket) enrolled. Conversely, the age group of 5 to 9 year old has the lowest likelihood of being enrolled in a private school, with 2,243 (94.4% in the age bracket) attending a public institution.
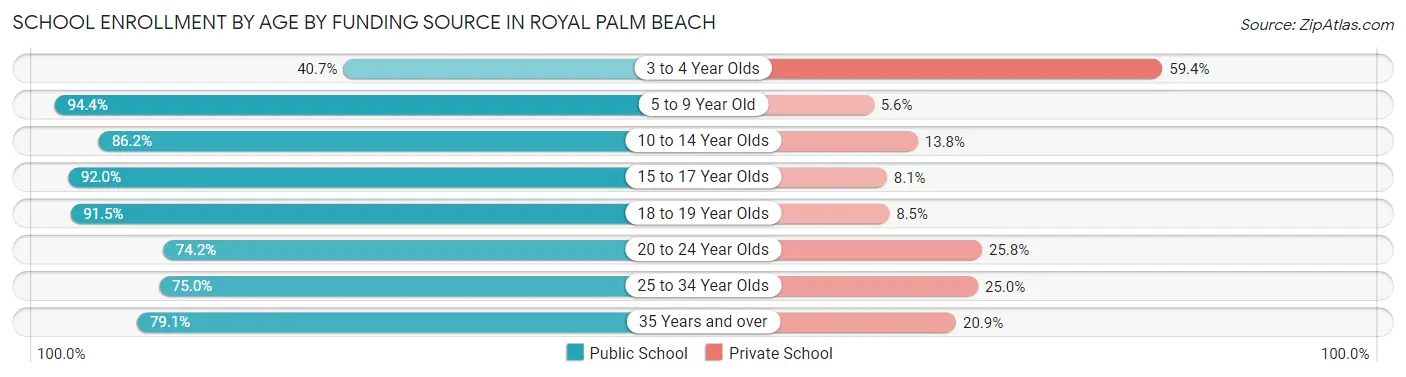
| Age Bracket | Public School | Private School |
| 3 to 4 Year Olds | 163 (40.6%) | 238 (59.4%) |
| 5 to 9 Year Old | 2,243 (94.4%) | 133 (5.6%) |
| 10 to 14 Year Olds | 2,332 (86.2%) | 374 (13.8%) |
| 15 to 17 Year Olds | 1,771 (91.9%) | 155 (8.1%) |
| 18 to 19 Year Olds | 603 (91.5%) | 56 (8.5%) |
| 20 to 24 Year Olds | 628 (74.2%) | 218 (25.8%) |
| 25 to 34 Year Olds | 638 (75.0%) | 213 (25.0%) |
| 35 Years and over | 646 (79.1%) | 171 (20.9%) |
| Total | 9,026 (85.3%) | 1,556 (14.7%) |
Educational Attainment by Field of Study in Royal Palm Beach
Business (2,174 | 21.8%), education (1,598 | 16.1%), science & technology (993 | 10.0%), engineering (903 | 9.1%), and liberal arts & history (752 | 7.5%) are the most common fields of study among 9,957 individuals in Royal Palm Beach who have obtained a bachelor's degree or higher.
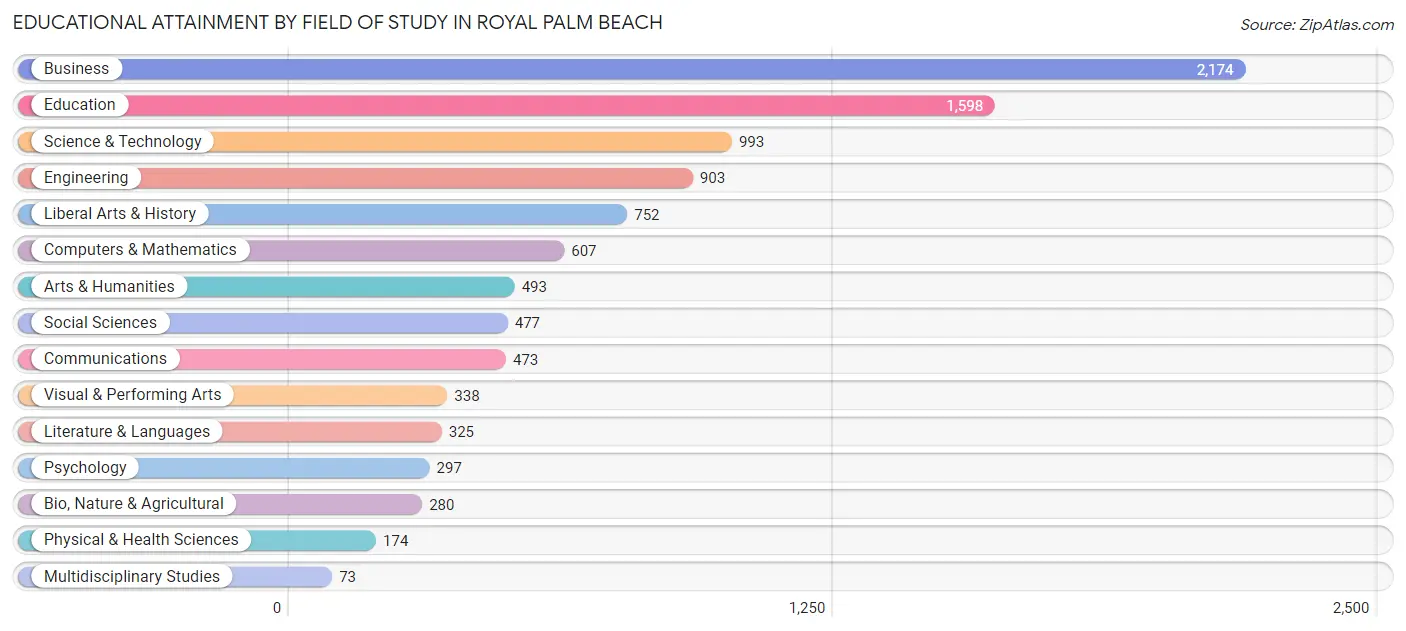
| Field of Study | # Graduates | % Graduates |
| Computers & Mathematics | 607 | 6.1% |
| Bio, Nature & Agricultural | 280 | 2.8% |
| Physical & Health Sciences | 174 | 1.8% |
| Psychology | 297 | 3.0% |
| Social Sciences | 477 | 4.8% |
| Engineering | 903 | 9.1% |
| Multidisciplinary Studies | 73 | 0.7% |
| Science & Technology | 993 | 10.0% |
| Business | 2,174 | 21.8% |
| Education | 1,598 | 16.1% |
| Literature & Languages | 325 | 3.3% |
| Liberal Arts & History | 752 | 7.5% |
| Visual & Performing Arts | 338 | 3.4% |
| Communications | 473 | 4.8% |
| Arts & Humanities | 493 | 5.0% |
| Total | 9,957 | 100.0% |
Transportation & Commute in Royal Palm Beach
Vehicle Availability by Sex in Royal Palm Beach
The most prevalent vehicle ownership categories in Royal Palm Beach are males with 2 vehicles (4,944, accounting for 48.7%) and females with 2 vehicles (4,794, making up 50.0%).
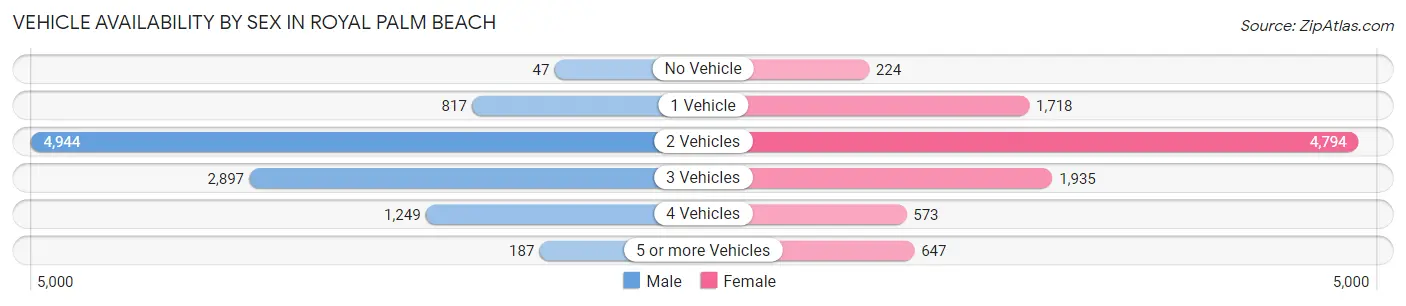
| Vehicles Available | Male | Female |
| No Vehicle | 47 (0.5%) | 224 (2.3%) |
| 1 Vehicle | 817 (8.1%) | 1,718 (17.4%) |
| 2 Vehicles | 4,944 (48.7%) | 4,794 (48.5%) |
| 3 Vehicles | 2,897 (28.6%) | 1,935 (19.6%) |
| 4 Vehicles | 1,249 (12.3%) | 573 (5.8%) |
| 5 or more Vehicles | 187 (1.8%) | 647 (6.5%) |
| Total | 10,141 (100.0%) | 9,891 (100.0%) |
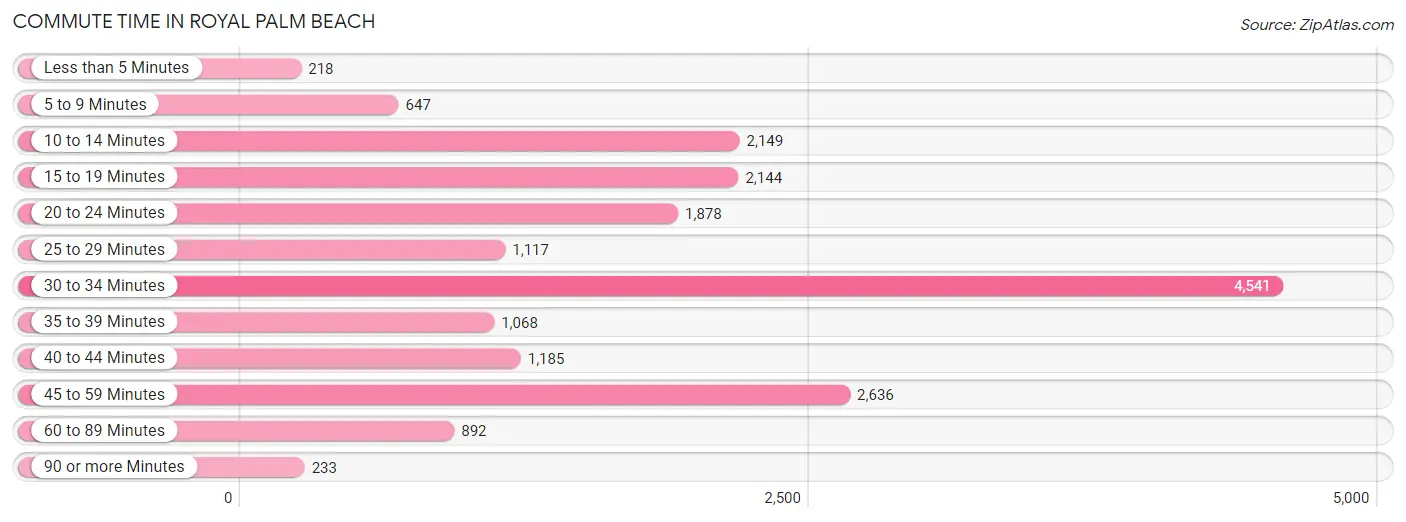
Commute Time in Royal Palm Beach
The most frequently occuring commute durations in Royal Palm Beach are 30 to 34 minutes (4,541 commuters, 24.3%), 45 to 59 minutes (2,636 commuters, 14.1%), and 10 to 14 minutes (2,149 commuters, 11.5%).
| Commute Time | # Commuters | % Commuters |
| Less than 5 Minutes | 218 | 1.2% |
| 5 to 9 Minutes | 647 | 3.5% |
| 10 to 14 Minutes | 2,149 | 11.5% |
| 15 to 19 Minutes | 2,144 | 11.5% |
| 20 to 24 Minutes | 1,878 | 10.0% |
| 25 to 29 Minutes | 1,117 | 6.0% |
| 30 to 34 Minutes | 4,541 | 24.3% |
| 35 to 39 Minutes | 1,068 | 5.7% |
| 40 to 44 Minutes | 1,185 | 6.3% |
| 45 to 59 Minutes | 2,636 | 14.1% |
| 60 to 89 Minutes | 892 | 4.8% |
| 90 or more Minutes | 233 | 1.3% |
Commute Time by Sex in Royal Palm Beach
The most common commute times in Royal Palm Beach are 30 to 34 minutes (2,096 commuters, 21.9%) for males and 30 to 34 minutes (2,445 commuters, 26.7%) for females.
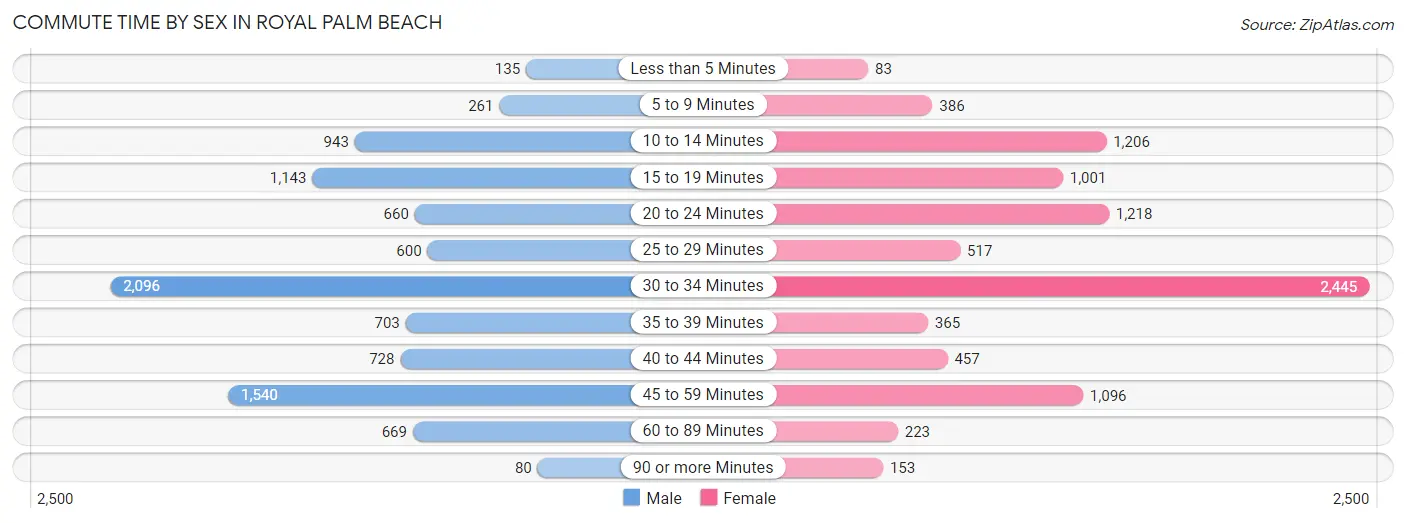
| Commute Time | Male | Female |
| Less than 5 Minutes | 135 (1.4%) | 83 (0.9%) |
| 5 to 9 Minutes | 261 (2.7%) | 386 (4.2%) |
| 10 to 14 Minutes | 943 (9.9%) | 1,206 (13.2%) |
| 15 to 19 Minutes | 1,143 (12.0%) | 1,001 (10.9%) |
| 20 to 24 Minutes | 660 (6.9%) | 1,218 (13.3%) |
| 25 to 29 Minutes | 600 (6.3%) | 517 (5.7%) |
| 30 to 34 Minutes | 2,096 (21.9%) | 2,445 (26.7%) |
| 35 to 39 Minutes | 703 (7.4%) | 365 (4.0%) |
| 40 to 44 Minutes | 728 (7.6%) | 457 (5.0%) |
| 45 to 59 Minutes | 1,540 (16.1%) | 1,096 (12.0%) |
| 60 to 89 Minutes | 669 (7.0%) | 223 (2.4%) |
| 90 or more Minutes | 80 (0.8%) | 153 (1.7%) |
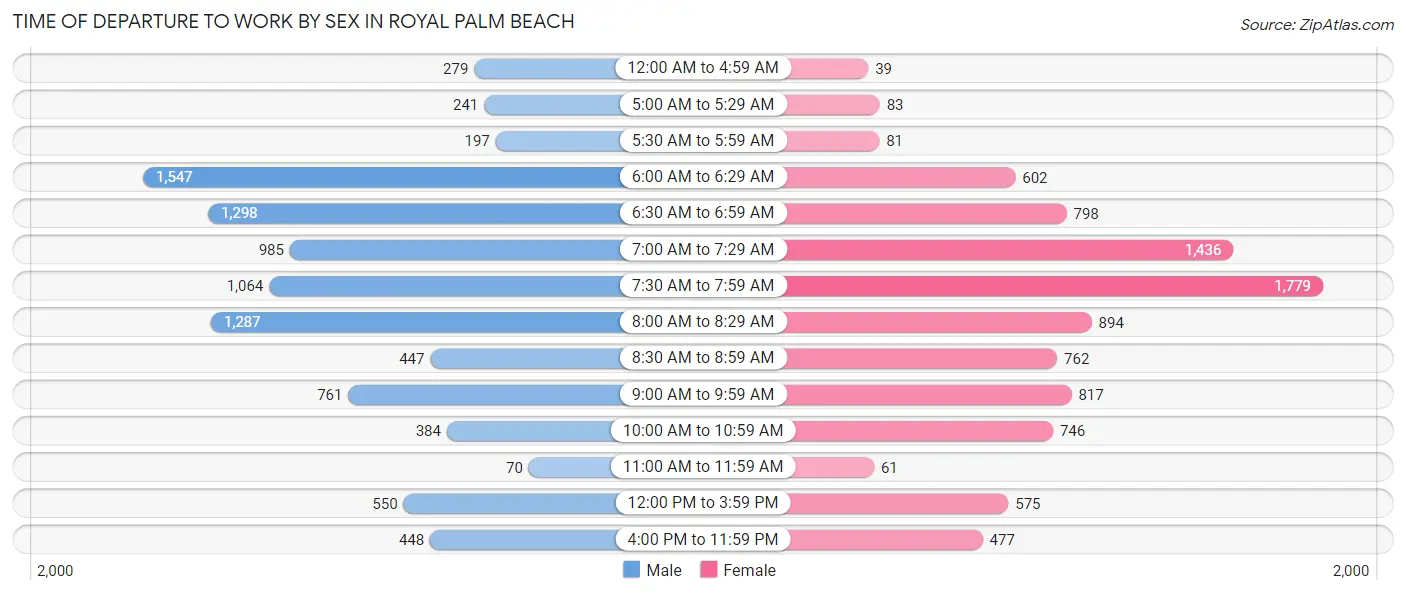
Time of Departure to Work by Sex in Royal Palm Beach
The most frequent times of departure to work in Royal Palm Beach are 6:00 AM to 6:29 AM (1,547, 16.2%) for males and 7:30 AM to 7:59 AM (1,779, 19.4%) for females.
| Time of Departure | Male | Female |
| 12:00 AM to 4:59 AM | 279 (2.9%) | 39 (0.4%) |
| 5:00 AM to 5:29 AM | 241 (2.5%) | 83 (0.9%) |
| 5:30 AM to 5:59 AM | 197 (2.1%) | 81 (0.9%) |
| 6:00 AM to 6:29 AM | 1,547 (16.2%) | 602 (6.6%) |
| 6:30 AM to 6:59 AM | 1,298 (13.6%) | 798 (8.7%) |
| 7:00 AM to 7:29 AM | 985 (10.3%) | 1,436 (15.7%) |
| 7:30 AM to 7:59 AM | 1,064 (11.1%) | 1,779 (19.4%) |
| 8:00 AM to 8:29 AM | 1,287 (13.5%) | 894 (9.8%) |
| 8:30 AM to 8:59 AM | 447 (4.7%) | 762 (8.3%) |
| 9:00 AM to 9:59 AM | 761 (8.0%) | 817 (8.9%) |
| 10:00 AM to 10:59 AM | 384 (4.0%) | 746 (8.2%) |
| 11:00 AM to 11:59 AM | 70 (0.7%) | 61 (0.7%) |
| 12:00 PM to 3:59 PM | 550 (5.8%) | 575 (6.3%) |
| 4:00 PM to 11:59 PM | 448 (4.7%) | 477 (5.2%) |
| Total | 9,558 (100.0%) | 9,150 (100.0%) |
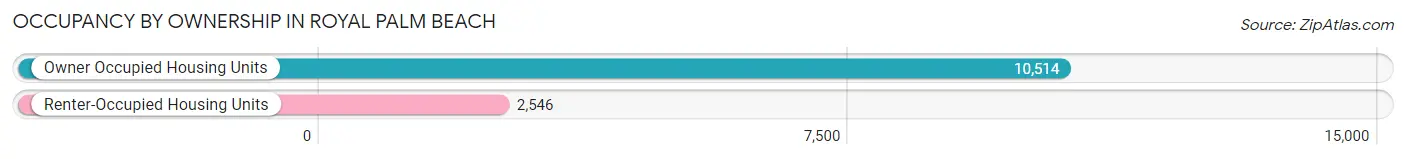
Housing Occupancy in Royal Palm Beach
Occupancy by Ownership in Royal Palm Beach
Of the total 13,060 dwellings in Royal Palm Beach, owner-occupied units account for 10,514 (80.5%), while renter-occupied units make up 2,546 (19.5%).
| Occupancy | # Housing Units | % Housing Units |
| Owner Occupied Housing Units | 10,514 | 80.5% |
| Renter-Occupied Housing Units | 2,546 | 19.5% |
| Total Occupied Housing Units | 13,060 | 100.0% |
Occupancy by Household Size in Royal Palm Beach
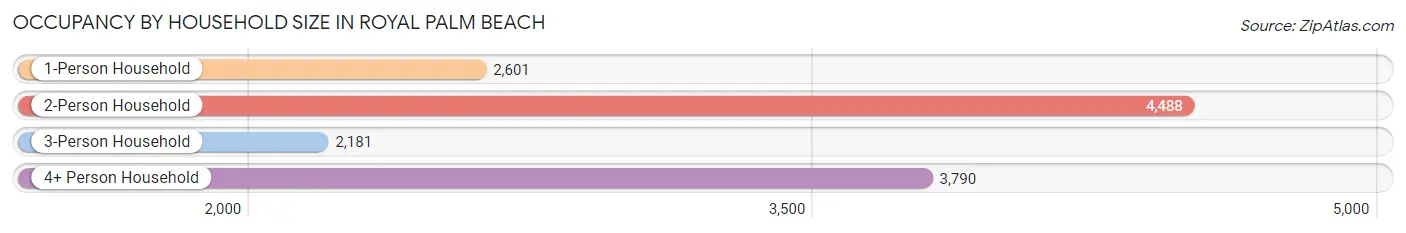
| Household Size | # Housing Units | % Housing Units |
| 1-Person Household | 2,601 | 19.9% |
| 2-Person Household | 4,488 | 34.4% |
| 3-Person Household | 2,181 | 16.7% |
| 4+ Person Household | 3,790 | 29.0% |
| Total Housing Units | 13,060 | 100.0% |
Occupancy by Ownership by Household Size in Royal Palm Beach
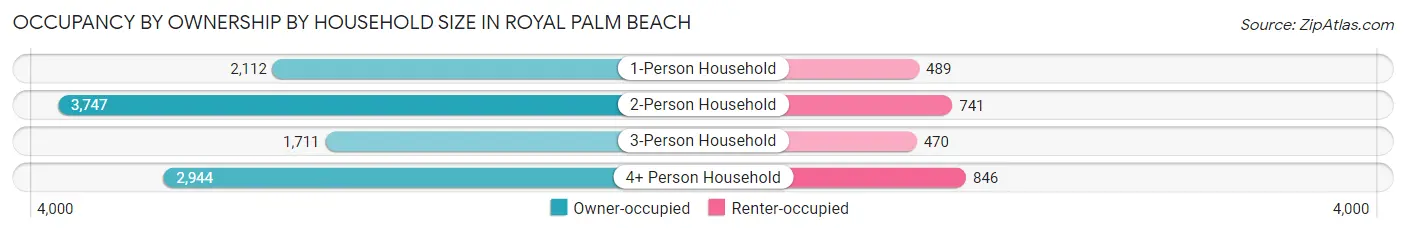
| Household Size | Owner-occupied | Renter-occupied |
| 1-Person Household | 2,112 (81.2%) | 489 (18.8%) |
| 2-Person Household | 3,747 (83.5%) | 741 (16.5%) |
| 3-Person Household | 1,711 (78.4%) | 470 (21.5%) |
| 4+ Person Household | 2,944 (77.7%) | 846 (22.3%) |
| Total Housing Units | 10,514 (80.5%) | 2,546 (19.5%) |
Occupancy by Educational Attainment in Royal Palm Beach
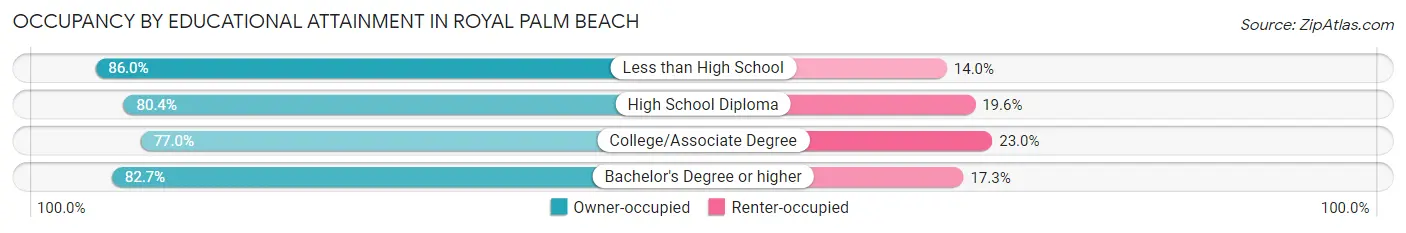
| Household Size | Owner-occupied | Renter-occupied |
| Less than High School | 730 (86.0%) | 119 (14.0%) |
| High School Diploma | 2,247 (80.4%) | 549 (19.6%) |
| College/Associate Degree | 3,343 (77.0%) | 1,000 (23.0%) |
| Bachelor's Degree or higher | 4,194 (82.7%) | 878 (17.3%) |
Occupancy by Age of Householder in Royal Palm Beach
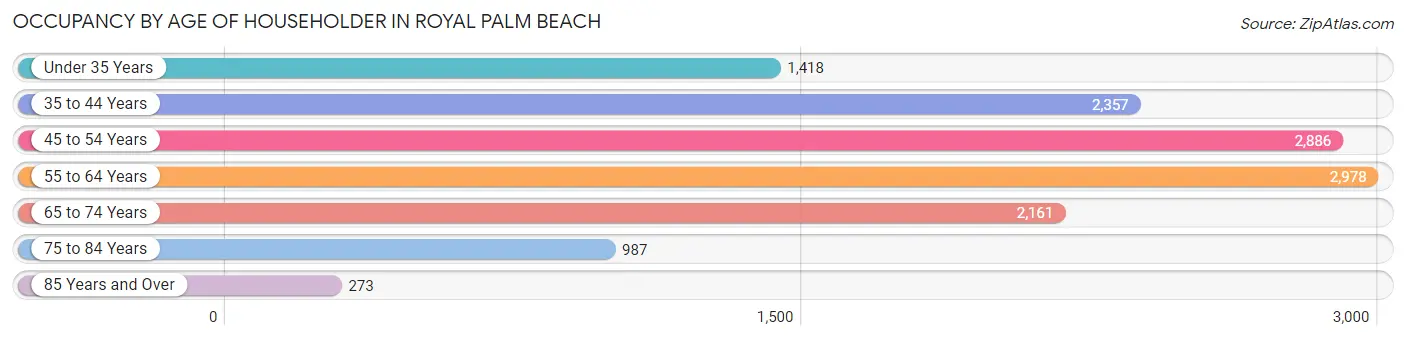
| Age Bracket | # Households | % Households |
| Under 35 Years | 1,418 | 10.9% |
| 35 to 44 Years | 2,357 | 18.0% |
| 45 to 54 Years | 2,886 | 22.1% |
| 55 to 64 Years | 2,978 | 22.8% |
| 65 to 74 Years | 2,161 | 16.6% |
| 75 to 84 Years | 987 | 7.6% |
| 85 Years and Over | 273 | 2.1% |
| Total | 13,060 | 100.0% |
Housing Finances in Royal Palm Beach
Median Income by Occupancy in Royal Palm Beach
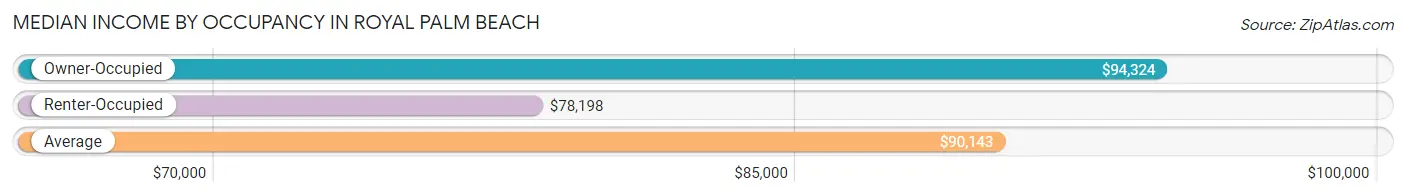
| Occupancy Type | # Households | Median Income |
| Owner-Occupied | 10,514 (80.5%) | $94,324 |
| Renter-Occupied | 2,546 (19.5%) | $78,198 |
| Average | 13,060 (100.0%) | $90,143 |
Occupancy by Householder Income Bracket in Royal Palm Beach
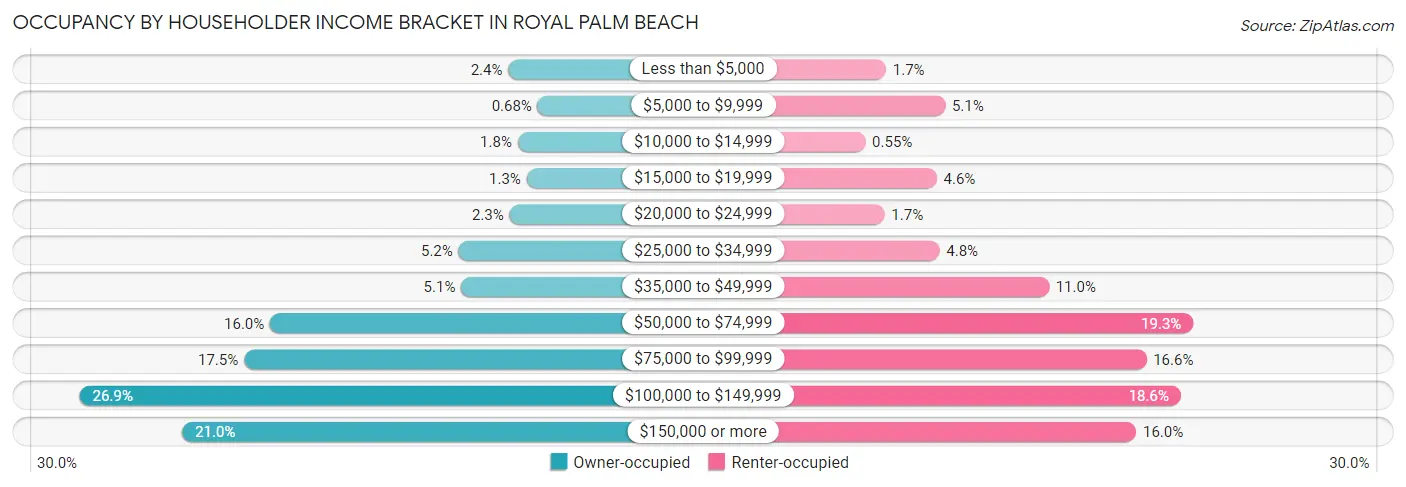
| Income Bracket | Owner-occupied | Renter-occupied |
| Less than $5,000 | 248 (2.4%) | 44 (1.7%) |
| $5,000 to $9,999 | 71 (0.7%) | 130 (5.1%) |
| $10,000 to $14,999 | 191 (1.8%) | 14 (0.5%) |
| $15,000 to $19,999 | 138 (1.3%) | 118 (4.6%) |
| $20,000 to $24,999 | 241 (2.3%) | 42 (1.7%) |
| $25,000 to $34,999 | 547 (5.2%) | 122 (4.8%) |
| $35,000 to $49,999 | 531 (5.1%) | 281 (11.0%) |
| $50,000 to $74,999 | 1,679 (16.0%) | 491 (19.3%) |
| $75,000 to $99,999 | 1,836 (17.5%) | 423 (16.6%) |
| $100,000 to $149,999 | 2,824 (26.9%) | 473 (18.6%) |
| $150,000 or more | 2,208 (21.0%) | 408 (16.0%) |
| Total | 10,514 (100.0%) | 2,546 (100.0%) |
Monthly Housing Cost Tiers in Royal Palm Beach
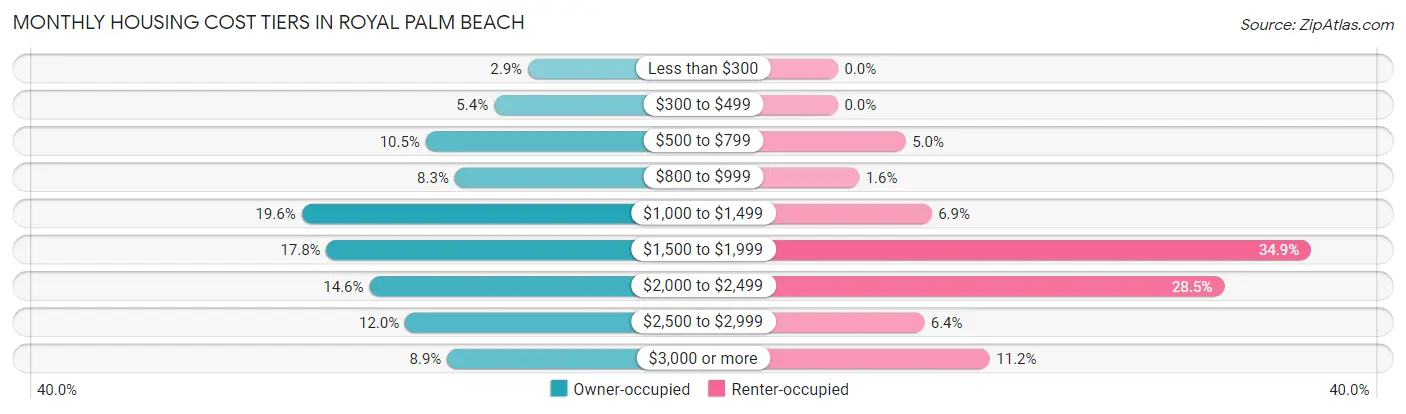
| Monthly Cost | Owner-occupied | Renter-occupied |
| Less than $300 | 308 (2.9%) | 0 (0.0%) |
| $300 to $499 | 571 (5.4%) | 0 (0.0%) |
| $500 to $799 | 1,100 (10.5%) | 127 (5.0%) |
| $800 to $999 | 875 (8.3%) | 40 (1.6%) |
| $1,000 to $1,499 | 2,062 (19.6%) | 176 (6.9%) |
| $1,500 to $1,999 | 1,868 (17.8%) | 888 (34.9%) |
| $2,000 to $2,499 | 1,536 (14.6%) | 725 (28.5%) |
| $2,500 to $2,999 | 1,260 (12.0%) | 162 (6.4%) |
| $3,000 or more | 934 (8.9%) | 285 (11.2%) |
| Total | 10,514 (100.0%) | 2,546 (100.0%) |
Physical Housing Characteristics in Royal Palm Beach
Housing Structures in Royal Palm Beach
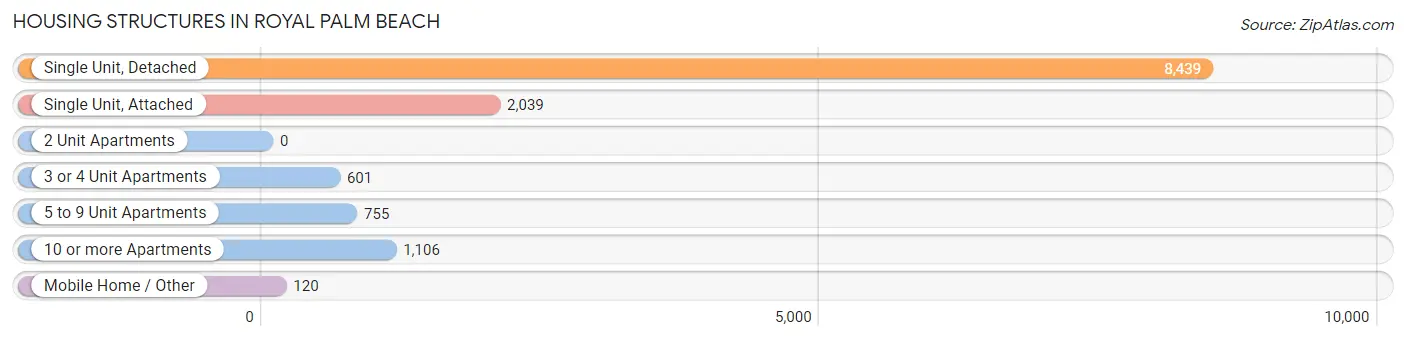
| Structure Type | # Housing Units | % Housing Units |
| Single Unit, Detached | 8,439 | 64.6% |
| Single Unit, Attached | 2,039 | 15.6% |
| 2 Unit Apartments | 0 | 0.0% |
| 3 or 4 Unit Apartments | 601 | 4.6% |
| 5 to 9 Unit Apartments | 755 | 5.8% |
| 10 or more Apartments | 1,106 | 8.5% |
| Mobile Home / Other | 120 | 0.9% |
| Total | 13,060 | 100.0% |
Housing Structures by Occupancy in Royal Palm Beach
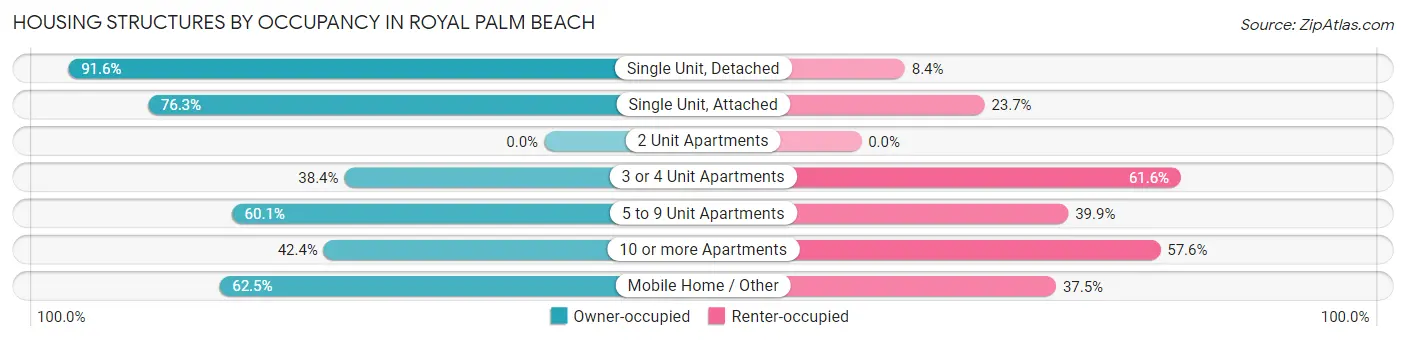
| Structure Type | Owner-occupied | Renter-occupied |
| Single Unit, Detached | 7,730 (91.6%) | 709 (8.4%) |
| Single Unit, Attached | 1,555 (76.3%) | 484 (23.7%) |
| 2 Unit Apartments | 0 (0.0%) | 0 (0.0%) |
| 3 or 4 Unit Apartments | 231 (38.4%) | 370 (61.6%) |
| 5 to 9 Unit Apartments | 454 (60.1%) | 301 (39.9%) |
| 10 or more Apartments | 469 (42.4%) | 637 (57.6%) |
| Mobile Home / Other | 75 (62.5%) | 45 (37.5%) |
| Total | 10,514 (80.5%) | 2,546 (19.5%) |
Housing Structures by Number of Rooms in Royal Palm Beach
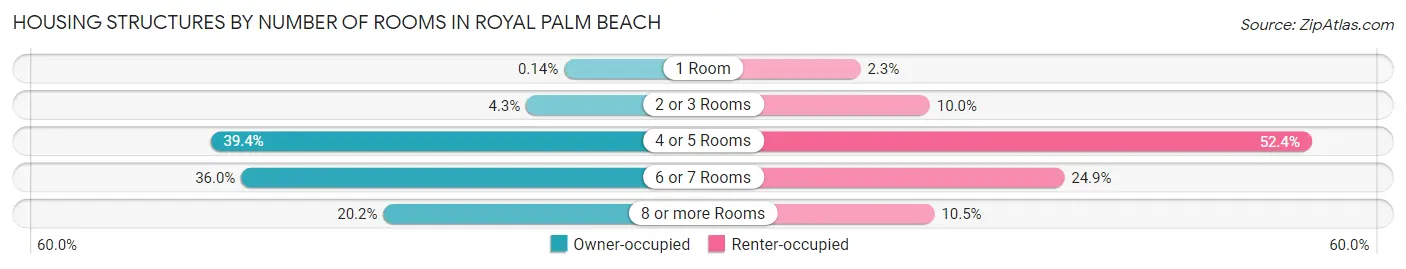
| Number of Rooms | Owner-occupied | Renter-occupied |
| 1 Room | 15 (0.1%) | 58 (2.3%) |
| 2 or 3 Rooms | 456 (4.3%) | 254 (10.0%) |
| 4 or 5 Rooms | 4,139 (39.4%) | 1,333 (52.4%) |
| 6 or 7 Rooms | 3,781 (36.0%) | 634 (24.9%) |
| 8 or more Rooms | 2,123 (20.2%) | 267 (10.5%) |
| Total | 10,514 (100.0%) | 2,546 (100.0%) |
Housing Structure by Heating Type in Royal Palm Beach
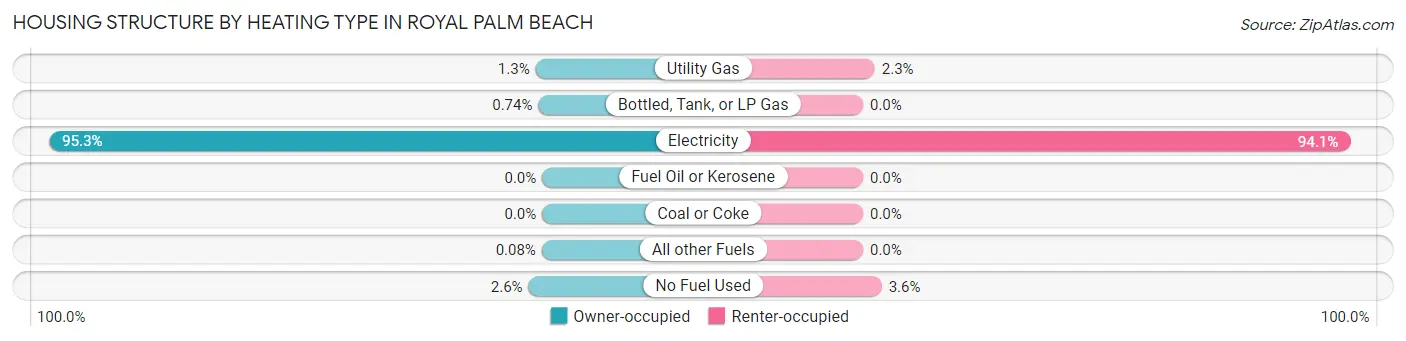
| Heating Type | Owner-occupied | Renter-occupied |
| Utility Gas | 135 (1.3%) | 58 (2.3%) |
| Bottled, Tank, or LP Gas | 78 (0.7%) | 0 (0.0%) |
| Electricity | 10,015 (95.3%) | 2,396 (94.1%) |
| Fuel Oil or Kerosene | 0 (0.0%) | 0 (0.0%) |
| Coal or Coke | 0 (0.0%) | 0 (0.0%) |
| All other Fuels | 8 (0.1%) | 0 (0.0%) |
| No Fuel Used | 278 (2.6%) | 92 (3.6%) |
| Total | 10,514 (100.0%) | 2,546 (100.0%) |
Household Vehicle Usage in Royal Palm Beach
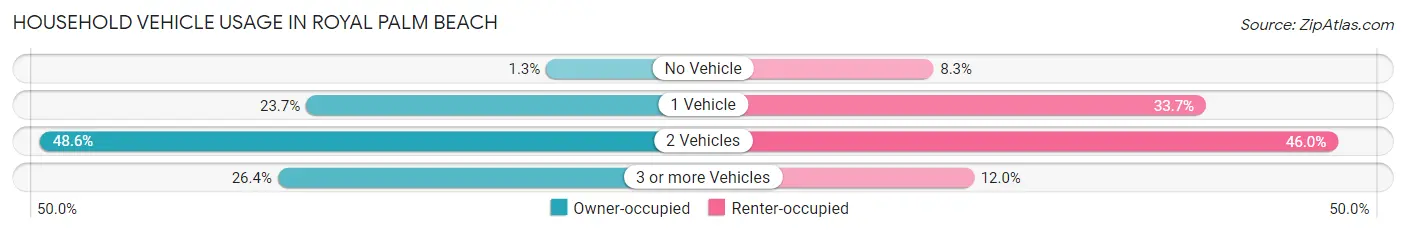
| Vehicles per Household | Owner-occupied | Renter-occupied |
| No Vehicle | 139 (1.3%) | 210 (8.3%) |
| 1 Vehicle | 2,495 (23.7%) | 858 (33.7%) |
| 2 Vehicles | 5,107 (48.6%) | 1,172 (46.0%) |
| 3 or more Vehicles | 2,773 (26.4%) | 306 (12.0%) |
| Total | 10,514 (100.0%) | 2,546 (100.0%) |
Real Estate & Mortgages in Royal Palm Beach
Real Estate and Mortgage Overview in Royal Palm Beach
| Characteristic | Without Mortgage | With Mortgage |
| Housing Units | 2,683 | 7,831 |
| Median Property Value | $331,800 | $355,100 |
| Median Household Income | $71,404 | $1,720 |
| Monthly Housing Costs | $646 | $934 |
| Real Estate Taxes | $2,490 | $86 |
Property Value by Mortgage Status in Royal Palm Beach
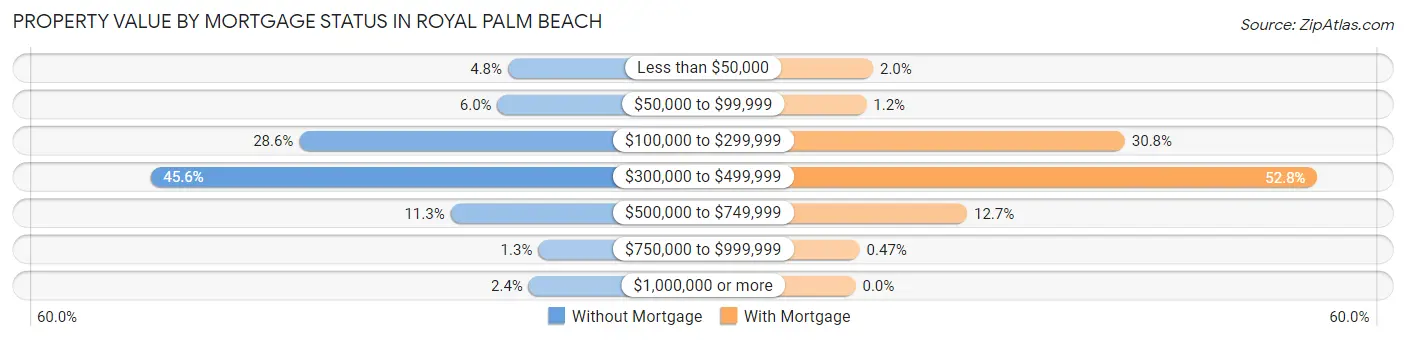
| Property Value | Without Mortgage | With Mortgage |
| Less than $50,000 | 128 (4.8%) | 157 (2.0%) |
| $50,000 to $99,999 | 160 (6.0%) | 96 (1.2%) |
| $100,000 to $299,999 | 768 (28.6%) | 2,410 (30.8%) |
| $300,000 to $499,999 | 1,224 (45.6%) | 4,133 (52.8%) |
| $500,000 to $749,999 | 304 (11.3%) | 998 (12.7%) |
| $750,000 to $999,999 | 35 (1.3%) | 37 (0.5%) |
| $1,000,000 or more | 64 (2.4%) | 0 (0.0%) |
| Total | 2,683 (100.0%) | 7,831 (100.0%) |
Household Income by Mortgage Status in Royal Palm Beach
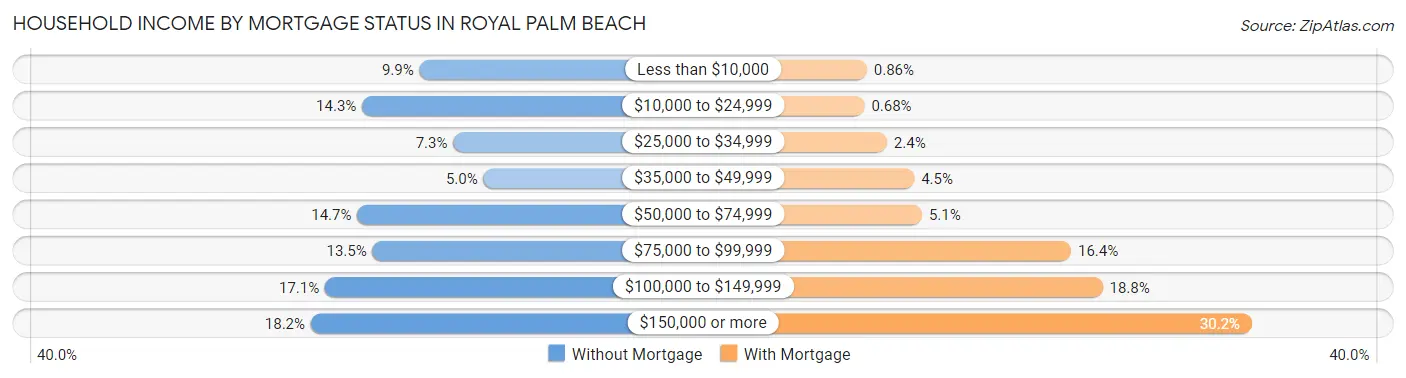
| Household Income | Without Mortgage | With Mortgage |
| Less than $10,000 | 266 (9.9%) | 67 (0.9%) |
| $10,000 to $24,999 | 383 (14.3%) | 53 (0.7%) |
| $25,000 to $34,999 | 197 (7.3%) | 187 (2.4%) |
| $35,000 to $49,999 | 135 (5.0%) | 350 (4.5%) |
| $50,000 to $74,999 | 393 (14.6%) | 396 (5.1%) |
| $75,000 to $99,999 | 362 (13.5%) | 1,286 (16.4%) |
| $100,000 to $149,999 | 459 (17.1%) | 1,474 (18.8%) |
| $150,000 or more | 488 (18.2%) | 2,365 (30.2%) |
| Total | 2,683 (100.0%) | 7,831 (100.0%) |
Property Value to Household Income Ratio in Royal Palm Beach
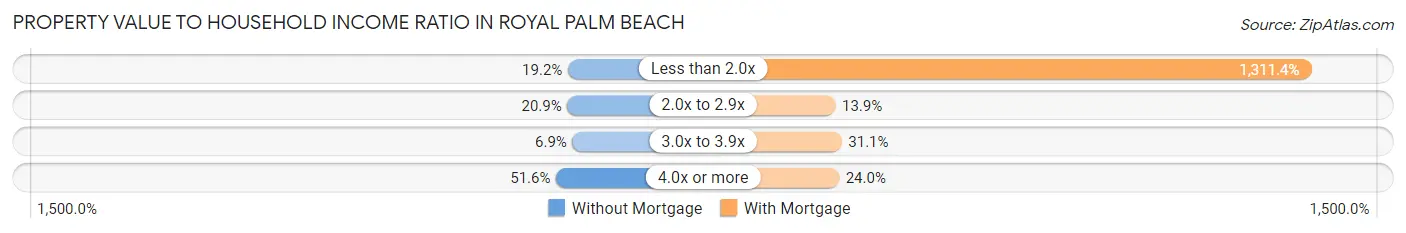
| Value-to-Income Ratio | Without Mortgage | With Mortgage |
| Less than 2.0x | 516 (19.2%) | 102,694 (1,311.4%) |
| 2.0x to 2.9x | 561 (20.9%) | 1,085 (13.9%) |
| 3.0x to 3.9x | 186 (6.9%) | 2,438 (31.1%) |
| 4.0x or more | 1,385 (51.6%) | 1,882 (24.0%) |
| Total | 2,683 (100.0%) | 7,831 (100.0%) |
Real Estate Taxes by Mortgage Status in Royal Palm Beach
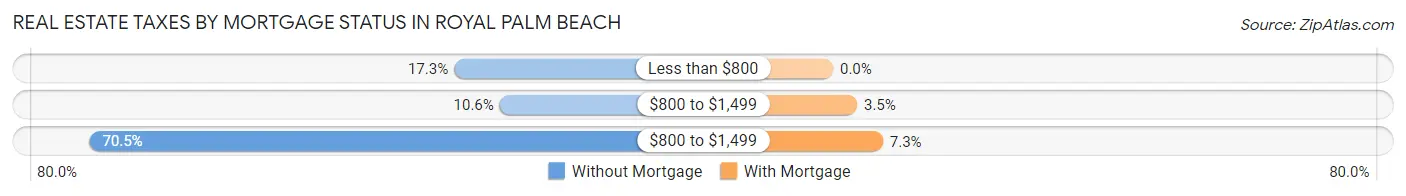
| Property Taxes | Without Mortgage | With Mortgage |
| Less than $800 | 463 (17.3%) | 0 (0.0%) |
| $800 to $1,499 | 284 (10.6%) | 275 (3.5%) |
| $800 to $1,499 | 1,892 (70.5%) | 570 (7.3%) |
| Total | 2,683 (100.0%) | 7,831 (100.0%) |
Health & Disability in Royal Palm Beach
Health Insurance Coverage by Age in Royal Palm Beach
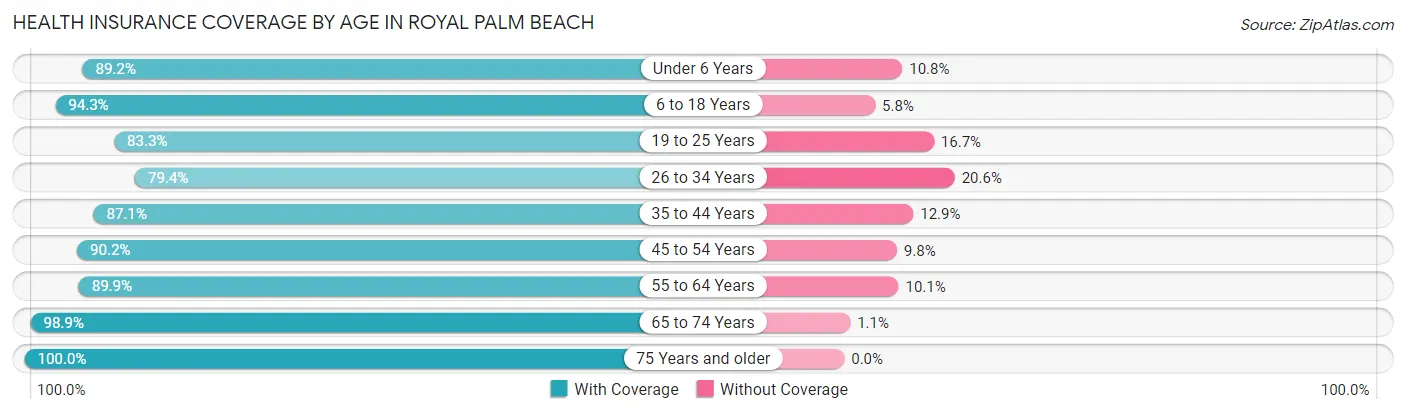
| Age Bracket | With Coverage | Without Coverage |
| Under 6 Years | 1,937 (89.2%) | 235 (10.8%) |
| 6 to 18 Years | 6,956 (94.3%) | 424 (5.8%) |
| 19 to 25 Years | 2,208 (83.3%) | 443 (16.7%) |
| 26 to 34 Years | 3,439 (79.4%) | 892 (20.6%) |
| 35 to 44 Years | 4,448 (87.1%) | 657 (12.9%) |
| 45 to 54 Years | 4,918 (90.2%) | 535 (9.8%) |
| 55 to 64 Years | 5,020 (89.9%) | 565 (10.1%) |
| 65 to 74 Years | 3,384 (98.9%) | 38 (1.1%) |
| 75 Years and older | 2,618 (100.0%) | 0 (0.0%) |
| Total | 34,928 (90.2%) | 3,789 (9.8%) |
Health Insurance Coverage by Citizenship Status in Royal Palm Beach
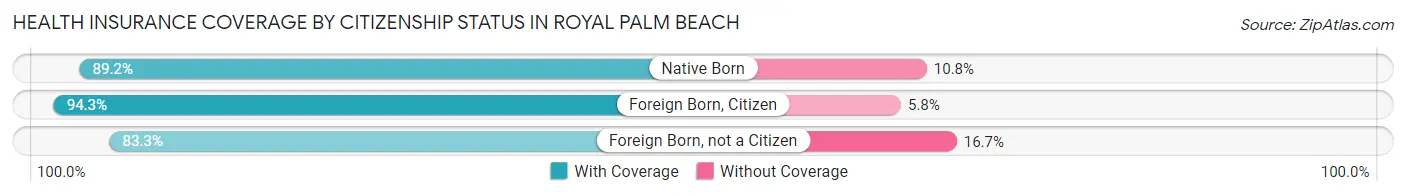
| Citizenship Status | With Coverage | Without Coverage |
| Native Born | 1,937 (89.2%) | 235 (10.8%) |
| Foreign Born, Citizen | 6,956 (94.3%) | 424 (5.8%) |
| Foreign Born, not a Citizen | 2,208 (83.3%) | 443 (16.7%) |
Health Insurance Coverage by Household Income in Royal Palm Beach
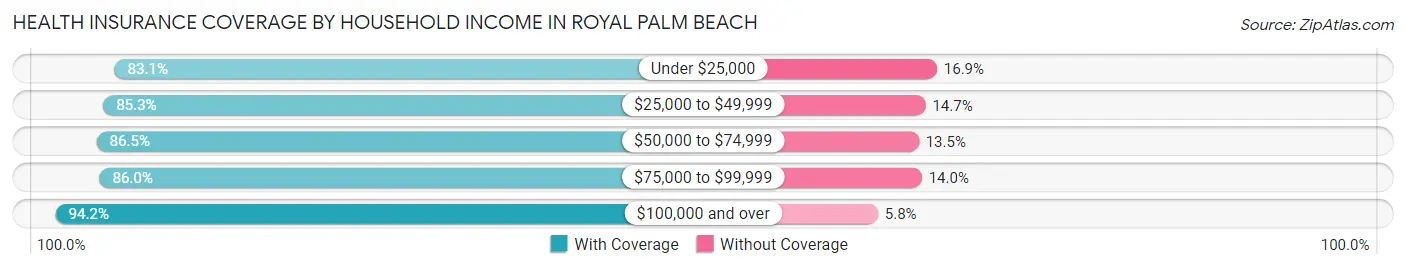
| Household Income | With Coverage | Without Coverage |
| Under $25,000 | 1,724 (83.1%) | 350 (16.9%) |
| $25,000 to $49,999 | 2,679 (85.3%) | 463 (14.7%) |
| $50,000 to $74,999 | 5,404 (86.5%) | 842 (13.5%) |
| $75,000 to $99,999 | 5,732 (86.0%) | 936 (14.0%) |
| $100,000 and over | 19,360 (94.2%) | 1,196 (5.8%) |
Public vs Private Health Insurance Coverage by Age in Royal Palm Beach
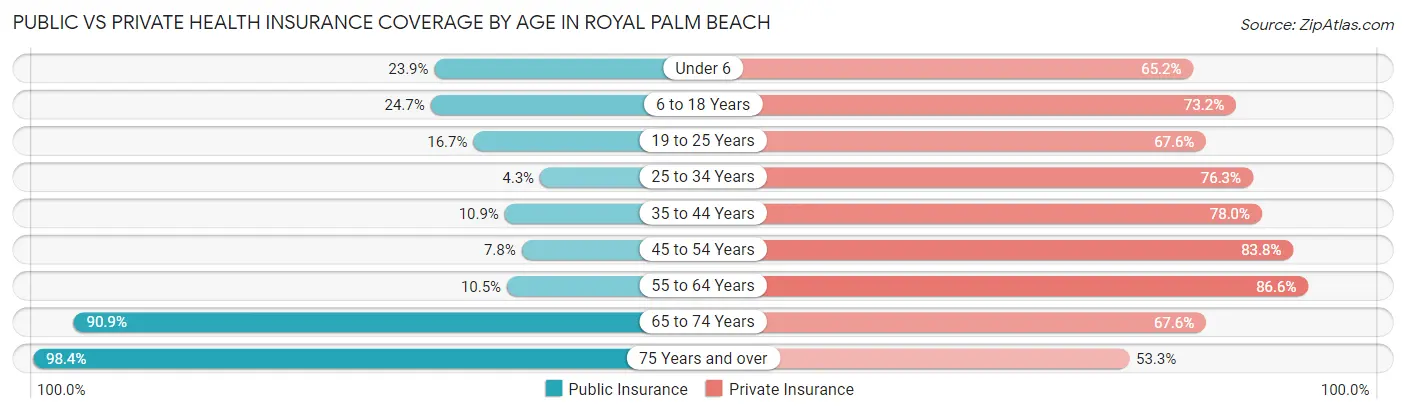
| Age Bracket | Public Insurance | Private Insurance |
| Under 6 | 520 (23.9%) | 1,417 (65.2%) |
| 6 to 18 Years | 1,819 (24.6%) | 5,401 (73.2%) |
| 19 to 25 Years | 443 (16.7%) | 1,793 (67.6%) |
| 25 to 34 Years | 188 (4.3%) | 3,304 (76.3%) |
| 35 to 44 Years | 556 (10.9%) | 3,980 (78.0%) |
| 45 to 54 Years | 423 (7.8%) | 4,569 (83.8%) |
| 55 to 64 Years | 585 (10.5%) | 4,835 (86.6%) |
| 65 to 74 Years | 3,111 (90.9%) | 2,313 (67.6%) |
| 75 Years and over | 2,577 (98.4%) | 1,396 (53.3%) |
| Total | 10,222 (26.4%) | 29,008 (74.9%) |
Disability Status by Sex by Age in Royal Palm Beach
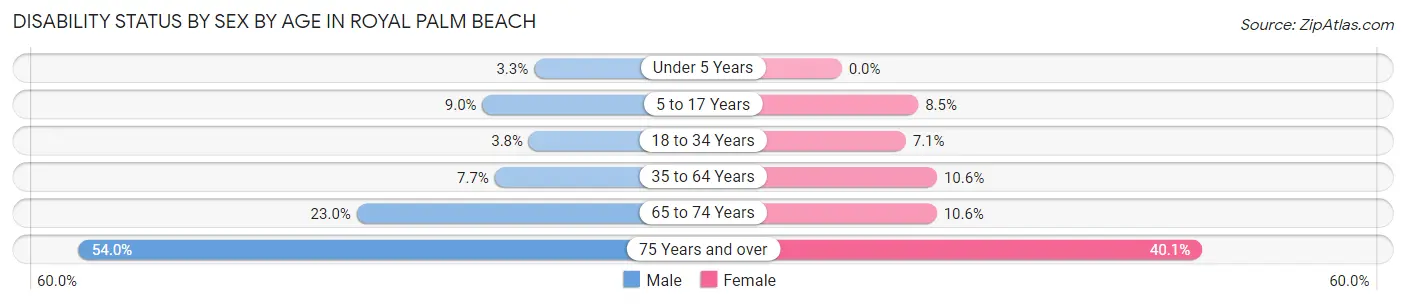
| Age Bracket | Male | Female |
| Under 5 Years | 30 (3.3%) | 0 (0.0%) |
| 5 to 17 Years | 341 (9.0%) | 285 (8.5%) |
| 18 to 34 Years | 141 (3.8%) | 273 (7.1%) |
| 35 to 64 Years | 598 (7.6%) | 883 (10.6%) |
| 65 to 74 Years | 361 (23.0%) | 196 (10.6%) |
| 75 Years and over | 389 (53.9%) | 761 (40.1%) |
Disability Class by Sex by Age in Royal Palm Beach
Disability Class: Hearing Difficulty
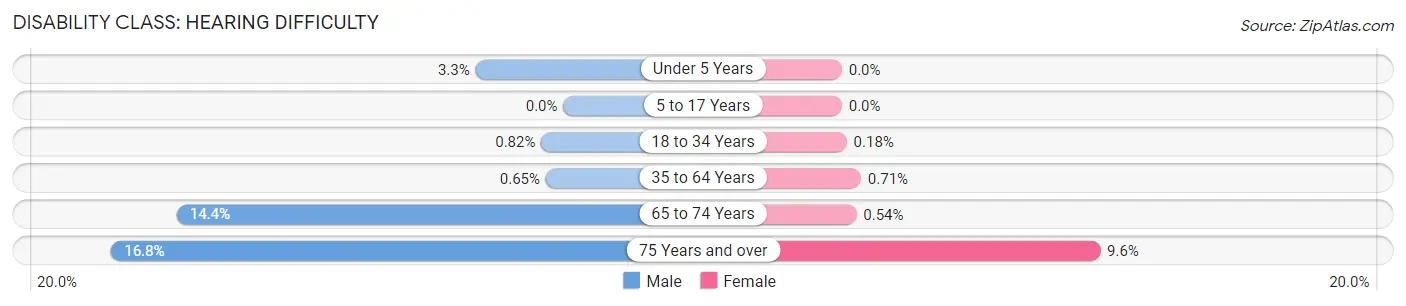
| Age Bracket | Male | Female |
| Under 5 Years | 30 (3.3%) | 0 (0.0%) |
| 5 to 17 Years | 0 (0.0%) | 0 (0.0%) |
| 18 to 34 Years | 30 (0.8%) | 7 (0.2%) |
| 35 to 64 Years | 51 (0.6%) | 59 (0.7%) |
| 65 to 74 Years | 225 (14.3%) | 10 (0.5%) |
| 75 Years and over | 121 (16.8%) | 182 (9.6%) |
Disability Class: Vision Difficulty
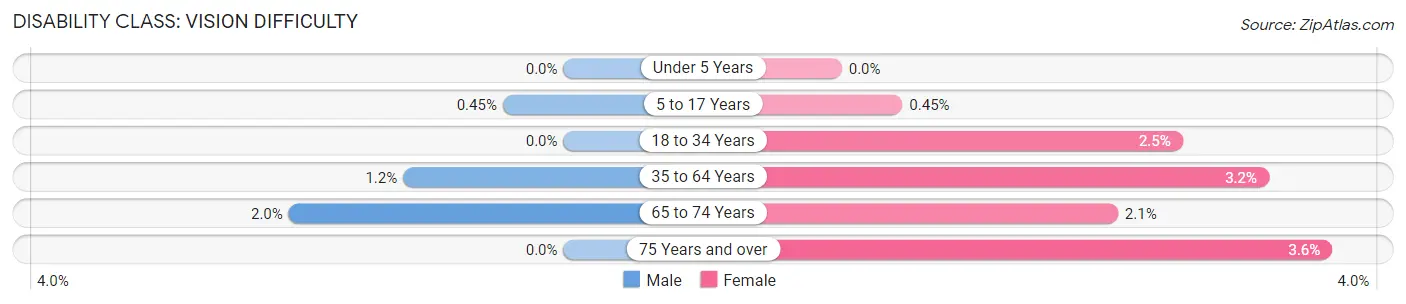
| Age Bracket | Male | Female |
| Under 5 Years | 0 (0.0%) | 0 (0.0%) |
| 5 to 17 Years | 17 (0.4%) | 15 (0.4%) |
| 18 to 34 Years | 0 (0.0%) | 97 (2.5%) |
| 35 to 64 Years | 93 (1.2%) | 264 (3.2%) |
| 65 to 74 Years | 32 (2.0%) | 38 (2.1%) |
| 75 Years and over | 0 (0.0%) | 69 (3.6%) |
Disability Class: Cognitive Difficulty
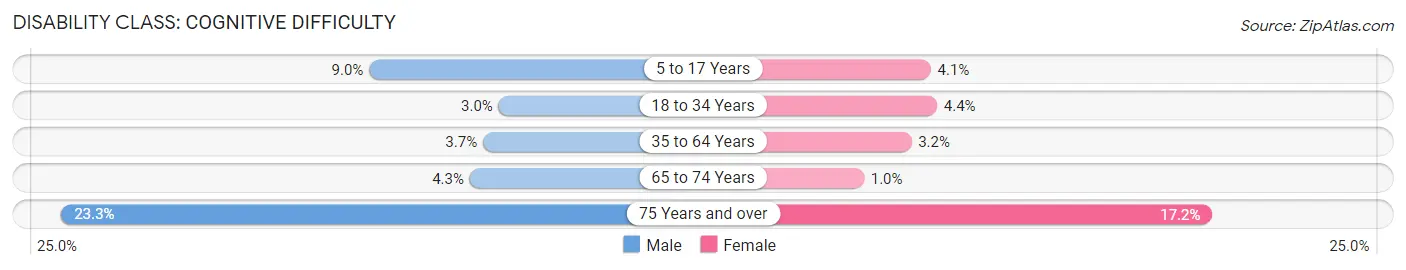
| Age Bracket | Male | Female |
| 5 to 17 Years | 341 (9.0%) | 138 (4.1%) |
| 18 to 34 Years | 110 (3.0%) | 169 (4.4%) |
| 35 to 64 Years | 291 (3.7%) | 268 (3.2%) |
| 65 to 74 Years | 68 (4.3%) | 19 (1.0%) |
| 75 Years and over | 168 (23.3%) | 326 (17.2%) |
Disability Class: Ambulatory Difficulty
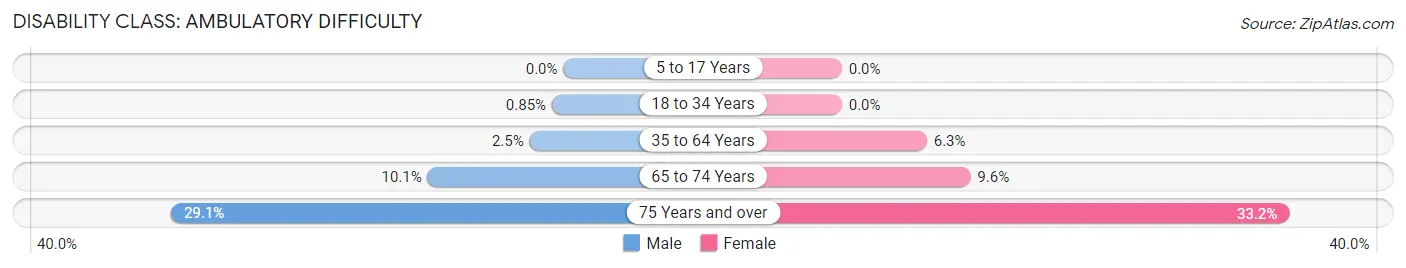
| Age Bracket | Male | Female |
| 5 to 17 Years | 0 (0.0%) | 0 (0.0%) |
| 18 to 34 Years | 31 (0.9%) | 0 (0.0%) |
| 35 to 64 Years | 196 (2.5%) | 526 (6.3%) |
| 65 to 74 Years | 158 (10.1%) | 177 (9.6%) |
| 75 Years and over | 210 (29.1%) | 630 (33.2%) |
Disability Class: Self-Care Difficulty
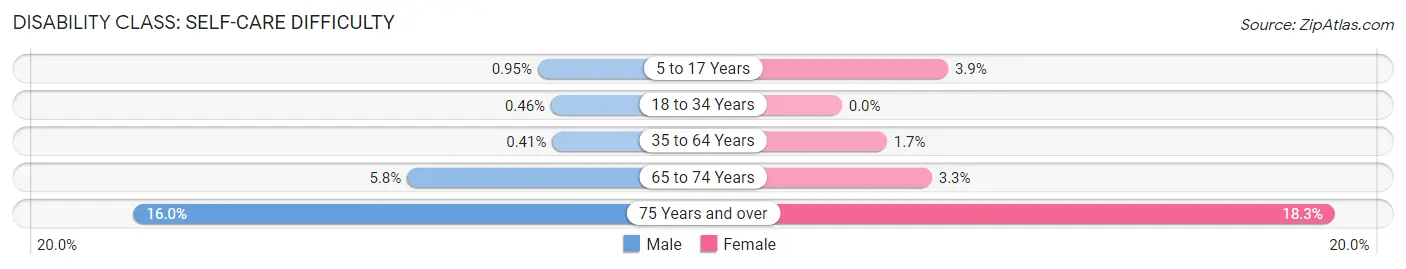
| Age Bracket | Male | Female |
| 5 to 17 Years | 36 (0.9%) | 132 (3.9%) |
| 18 to 34 Years | 17 (0.5%) | 0 (0.0%) |
| 35 to 64 Years | 32 (0.4%) | 139 (1.7%) |
| 65 to 74 Years | 91 (5.8%) | 62 (3.3%) |
| 75 Years and over | 115 (16.0%) | 347 (18.3%) |
Technology Access in Royal Palm Beach
Computing Device Access in Royal Palm Beach
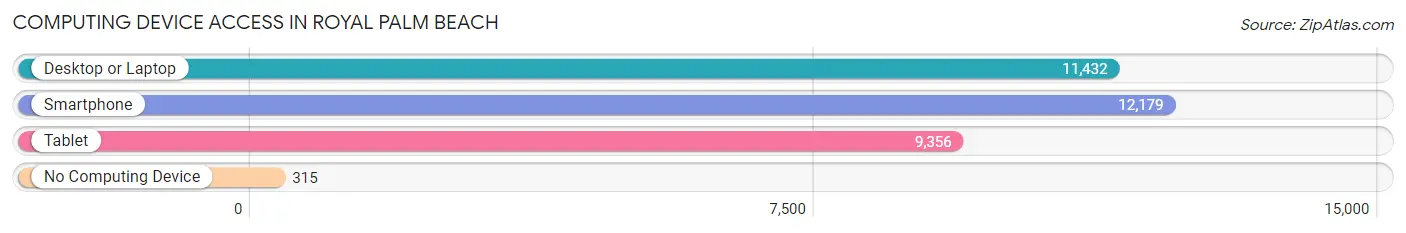
| Device Type | # Households | % Households |
| Desktop or Laptop | 11,432 | 87.5% |
| Smartphone | 12,179 | 93.2% |
| Tablet | 9,356 | 71.6% |
| No Computing Device | 315 | 2.4% |
| Total | 13,060 | 100.0% |
Internet Access in Royal Palm Beach
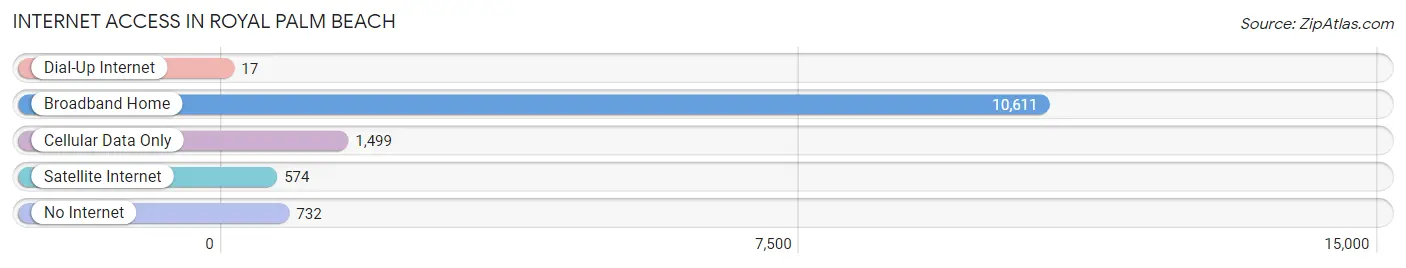
| Internet Type | # Households | % Households |
| Dial-Up Internet | 17 | 0.1% |
| Broadband Home | 10,611 | 81.2% |
| Cellular Data Only | 1,499 | 11.5% |
| Satellite Internet | 574 | 4.4% |
| No Internet | 732 | 5.6% |
| Total | 13,060 | 100.0% |
Royal Palm Beach Summary
History
Royal Palm Beach is a village located in Palm Beach County, Florida. It is located in the western part of the county, just west of West Palm Beach. The village was incorporated in 1959 and is one of the oldest municipalities in the county. The area was originally inhabited by the Tequesta Indians, who were the first known inhabitants of the area. The first settlers in the area were the Seminole Indians, who arrived in the late 1700s.
The area was first settled by Europeans in the late 1800s. The first settlers were farmers who grew citrus, vegetables, and other crops. The area was known as the “Citrus Capital of the World” due to its abundance of citrus groves. The area was also known for its cattle ranches and dairy farms.
In the early 1900s, the area began to develop as a residential community. The first subdivision was developed in the 1920s and was named Royal Palm Beach. The village was officially incorporated in 1959 and has since grown to become one of the largest municipalities in Palm Beach County.
Geography
Royal Palm Beach is located in the western part of Palm Beach County, just west of West Palm Beach. The village is bordered by the cities of Wellington and Loxahatchee to the north, Greenacres to the east, and Lake Worth to the south. The village covers an area of approximately 10 square miles and has a population of approximately 37,000 people.
The village is located on the Atlantic Coastal Ridge, which is a ridge of sand and limestone that runs along the eastern coast of Florida. The ridge provides the village with a unique topography, which includes rolling hills, lakes, and wetlands. The village is also home to several parks and preserves, including the Royal Palm Beach Nature Preserve, which is a 1,000-acre preserve that is home to a variety of wildlife.
Economy
The economy of Royal Palm Beach is largely based on tourism and retail. The village is home to several shopping centers, including the Royal Palm Beach Commons, which is a large shopping center that features a variety of stores and restaurants. The village is also home to several hotels and resorts, which attract visitors from all over the world.
The village is also home to several corporate headquarters, including the headquarters of the Florida Panthers hockey team. The village is also home to several manufacturing and distribution centers, which provide jobs to many of the residents of the village.
Demographics
As of the 2010 census, the population of Royal Palm Beach was 37,000. The population is largely white (77.3%), with a small percentage of African Americans (7.2%), Hispanics (7.1%), and Asians (3.2%). The median household income in the village is $60,000, and the median home value is $220,000.
The village is served by the Palm Beach County School District, which operates several elementary, middle, and high schools in the area. The village is also home to several private schools, including the Royal Palm Beach Christian Academy.
Conclusion
Royal Palm Beach is a village located in Palm Beach County, Florida. It is located in the western part of the county, just west of West Palm Beach. The village was incorporated in 1959 and is one of the oldest municipalities in the county. The area was originally inhabited by the Tequesta Indians, who were the first known inhabitants of the area. The economy of Royal Palm Beach is largely based on tourism and retail, and the village is home to several corporate headquarters and manufacturing and distribution centers. As of the 2010 census, the population of Royal Palm Beach was 37,000, and the median household income in the village is $60,000. The village is served by the Palm Beach County School District, which operates several elementary, middle, and high schools in the area.
Common Questions
What is Per Capita Income in Royal Palm Beach?
Per Capita income in Royal Palm Beach is $37,463.
What is the Median Family Income in Royal Palm Beach?
Median Family Income in Royal Palm Beach is $101,928.
What is the Median Household income in Royal Palm Beach?
Median Household Income in Royal Palm Beach is $90,143.
What is Income or Wage Gap in Royal Palm Beach?
Income or Wage Gap in Royal Palm Beach is 41.7%.
Women in Royal Palm Beach earn 58.3 cents for every dollar earned by a man.
What is Family Income Deficit in Royal Palm Beach?
Family Income Deficit in Royal Palm Beach is $12,280.
Families that are below poverty line in Royal Palm Beach earn $12,280 less on average than the poverty threshold level.
What is Inequality or Gini Index in Royal Palm Beach?
Inequality or Gini Index in Royal Palm Beach is 0.37.
What is the Total Population of Royal Palm Beach?
Total Population of Royal Palm Beach is 38,874.
What is the Total Male Population of Royal Palm Beach?
Total Male Population of Royal Palm Beach is 18,515.
What is the Total Female Population of Royal Palm Beach?
Total Female Population of Royal Palm Beach is 20,359.
What is the Ratio of Males per 100 Females in Royal Palm Beach?
There are 90.94 Males per 100 Females in Royal Palm Beach.
What is the Ratio of Females per 100 Males in Royal Palm Beach?
There are 109.96 Females per 100 Males in Royal Palm Beach.
What is the Median Population Age in Royal Palm Beach?
Median Population Age in Royal Palm Beach is 40.2 Years.
What is the Average Family Size in Royal Palm Beach
Average Family Size in Royal Palm Beach is 3.4 People.
What is the Average Household Size in Royal Palm Beach
Average Household Size in Royal Palm Beach is 3.0 People.
How Large is the Labor Force in Royal Palm Beach?
There are 21,692 People in the Labor Forcein in Royal Palm Beach.
What is the Percentage of People in the Labor Force in Royal Palm Beach?
69.6% of People are in the Labor Force in Royal Palm Beach.
What is the Unemployment Rate in Royal Palm Beach?
Unemployment Rate in Royal Palm Beach is 4.8%.