North Lauderdale, FL Map & Demographics
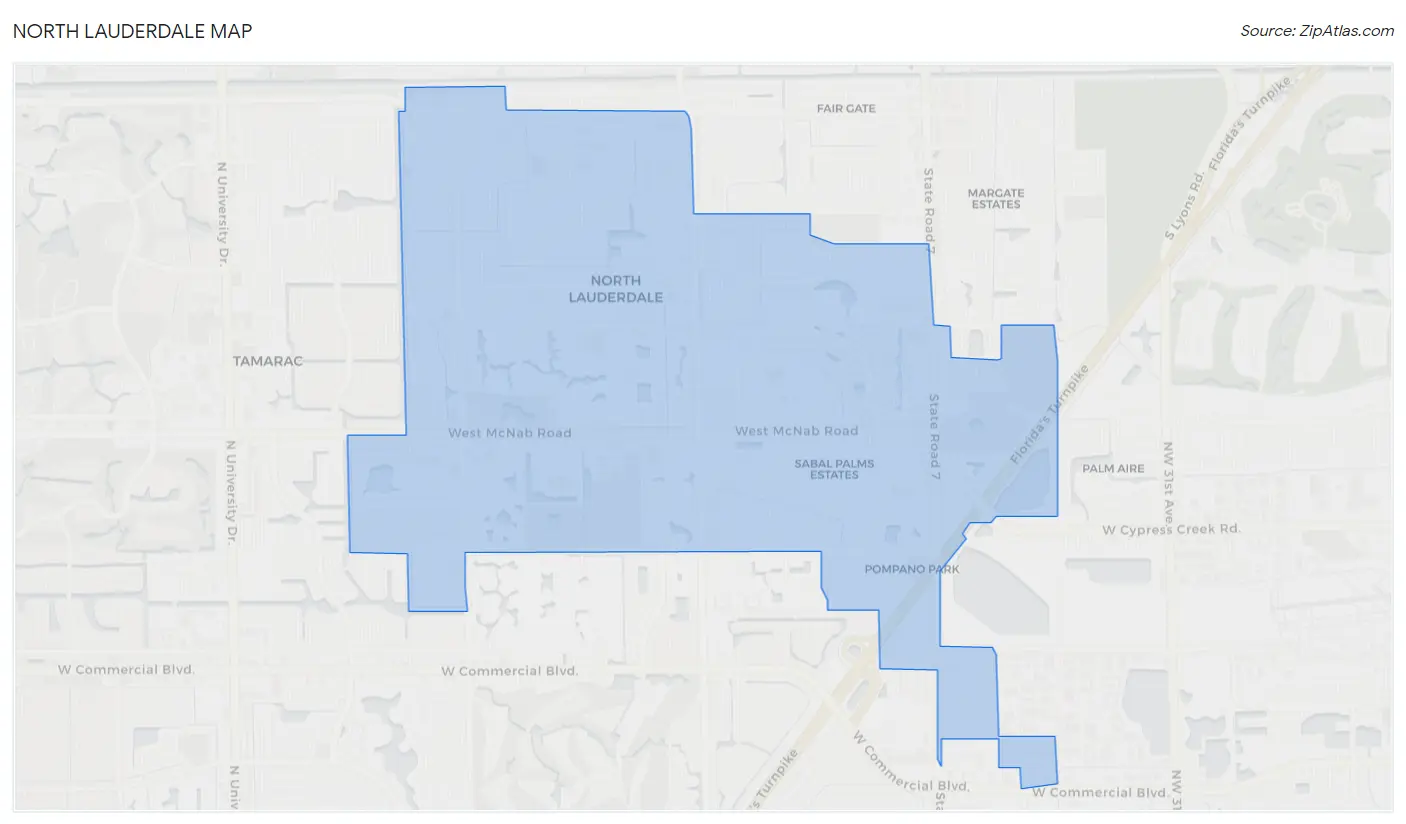
North Lauderdale Map
North Lauderdale Overview
$25,124
PER CAPITA INCOME
$63,072
AVG FAMILY INCOME
$60,168
AVG HOUSEHOLD INCOME
12.1%
WAGE / INCOME GAP [ % ]
87.9¢/ $1
WAGE / INCOME GAP [ $ ]
$10,479
FAMILY INCOME DEFICIT
0.38
INEQUALITY / GINI INDEX
44,635
TOTAL POPULATION
21,171
MALE POPULATION
23,464
FEMALE POPULATION
90.23
MALES / 100 FEMALES
110.83
FEMALES / 100 MALES
35.9
MEDIAN AGE
3.5
AVG FAMILY SIZE
2.9
AVG HOUSEHOLD SIZE
26,362
LABOR FORCE [ PEOPLE ]
74.2%
PERCENT IN LABOR FORCE
6.2%
UNEMPLOYMENT RATE
North Lauderdale Area Codes
Income in North Lauderdale
Income Overview in North Lauderdale
Per Capita Income in North Lauderdale is $25,124, while median incomes of families and households are $63,072 and $60,168 respectively.
| Characteristic | Number | Measure |
| Per Capita Income | 44,635 | $25,124 |
| Median Family Income | 10,535 | $63,072 |
| Mean Family Income | 10,535 | $72,533 |
| Median Household Income | 15,394 | $60,168 |
| Mean Household Income | 15,394 | $68,112 |
| Income Deficit | 10,535 | $10,479 |
| Wage / Income Gap (%) | 44,635 | 12.08% |
| Wage / Income Gap ($) | 44,635 | 87.92¢ per $1 |
| Gini / Inequality Index | 44,635 | 0.38 |
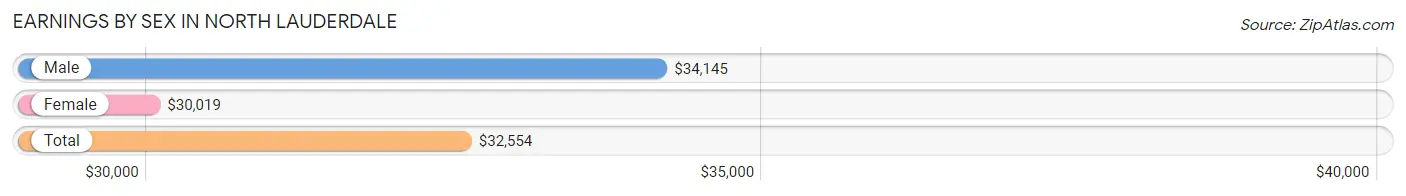
Earnings by Sex in North Lauderdale
Average Earnings in North Lauderdale are $32,554, $34,145 for men and $30,019 for women, a difference of 12.1%.
| Sex | Number | Average Earnings |
| Male | 13,036 (49.4%) | $34,145 |
| Female | 13,355 (50.6%) | $30,019 |
| Total | 26,391 (100.0%) | $32,554 |
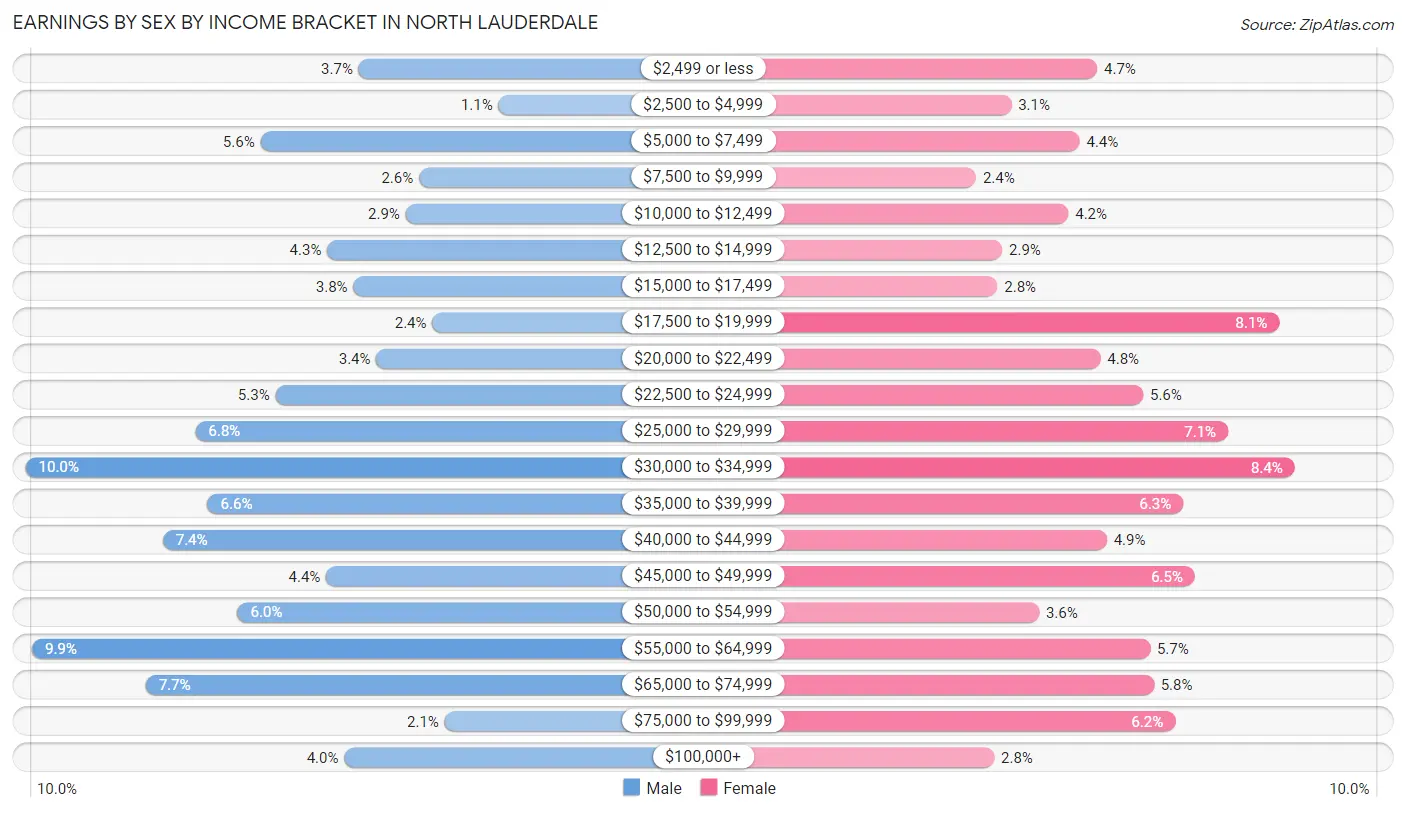
Earnings by Sex by Income Bracket in North Lauderdale
The most common earnings brackets in North Lauderdale are $30,000 to $34,999 for men (1,301 | 10.0%) and $30,000 to $34,999 for women (1,121 | 8.4%).
| Income | Male | Female |
| $2,499 or less | 487 (3.7%) | 627 (4.7%) |
| $2,500 to $4,999 | 146 (1.1%) | 412 (3.1%) |
| $5,000 to $7,499 | 727 (5.6%) | 582 (4.4%) |
| $7,500 to $9,999 | 340 (2.6%) | 323 (2.4%) |
| $10,000 to $12,499 | 373 (2.9%) | 554 (4.2%) |
| $12,500 to $14,999 | 565 (4.3%) | 389 (2.9%) |
| $15,000 to $17,499 | 501 (3.8%) | 376 (2.8%) |
| $17,500 to $19,999 | 307 (2.4%) | 1,082 (8.1%) |
| $20,000 to $22,499 | 445 (3.4%) | 635 (4.8%) |
| $22,500 to $24,999 | 691 (5.3%) | 741 (5.6%) |
| $25,000 to $29,999 | 887 (6.8%) | 953 (7.1%) |
| $30,000 to $34,999 | 1,301 (10.0%) | 1,121 (8.4%) |
| $35,000 to $39,999 | 856 (6.6%) | 841 (6.3%) |
| $40,000 to $44,999 | 966 (7.4%) | 651 (4.9%) |
| $45,000 to $49,999 | 567 (4.3%) | 871 (6.5%) |
| $50,000 to $54,999 | 783 (6.0%) | 481 (3.6%) |
| $55,000 to $64,999 | 1,285 (9.9%) | 758 (5.7%) |
| $65,000 to $74,999 | 1,008 (7.7%) | 768 (5.8%) |
| $75,000 to $99,999 | 278 (2.1%) | 822 (6.1%) |
| $100,000+ | 523 (4.0%) | 368 (2.8%) |
| Total | 13,036 (100.0%) | 13,355 (100.0%) |
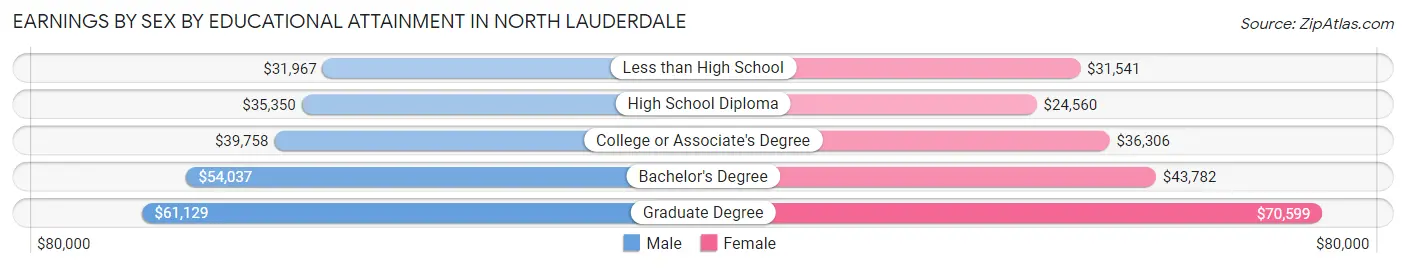
Earnings by Sex by Educational Attainment in North Lauderdale
Average earnings in North Lauderdale are $39,024 for men and $34,480 for women, a difference of 11.6%. Men with an educational attainment of graduate degree enjoy the highest average annual earnings of $61,129, while those with less than high school education earn the least with $31,967. Women with an educational attainment of graduate degree earn the most with the average annual earnings of $70,599, while those with high school diploma education have the smallest earnings of $24,560.
| Educational Attainment | Male Income | Female Income |
| Less than High School | $31,967 | $31,541 |
| High School Diploma | $35,350 | $24,560 |
| College or Associate's Degree | $39,758 | $36,306 |
| Bachelor's Degree | $54,037 | $43,782 |
| Graduate Degree | $61,129 | $70,599 |
| Total | $39,024 | $34,480 |
Family Income in North Lauderdale
Family Income Brackets in North Lauderdale
According to the North Lauderdale family income data, there are 2,128 families falling into the $100,000 to $149,999 income range, which is the most common income bracket and makes up 20.2% of all families. Conversely, the $200,000+ income bracket is the least frequent group with only 158 families (1.5%) belonging to this category.
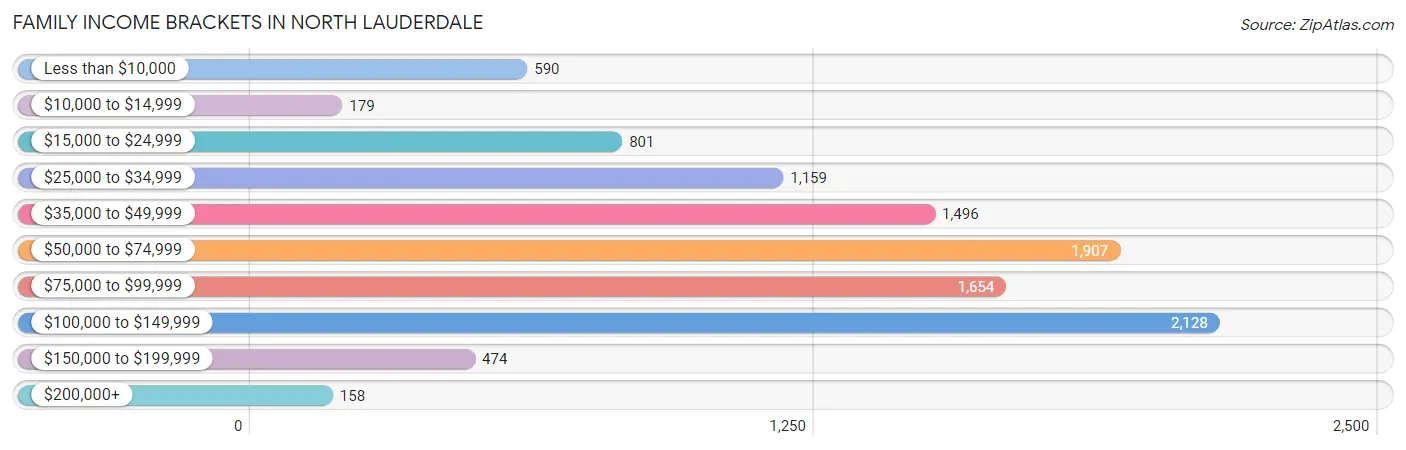
| Income Bracket | # Families | % Families |
| Less than $10,000 | 590 | 5.6% |
| $10,000 to $14,999 | 179 | 1.7% |
| $15,000 to $24,999 | 801 | 7.6% |
| $25,000 to $34,999 | 1,159 | 11.0% |
| $35,000 to $49,999 | 1,496 | 14.2% |
| $50,000 to $74,999 | 1,907 | 18.1% |
| $75,000 to $99,999 | 1,654 | 15.7% |
| $100,000 to $149,999 | 2,128 | 20.2% |
| $150,000 to $199,999 | 474 | 4.5% |
| $200,000+ | 158 | 1.5% |
Family Income by Famaliy Size in North Lauderdale
7+ person families (244 | 2.3%) account for the highest median family income in North Lauderdale with $124,167 per family, while 2-person families (4,062 | 38.6%) have the highest median income of $30,564 per family member.
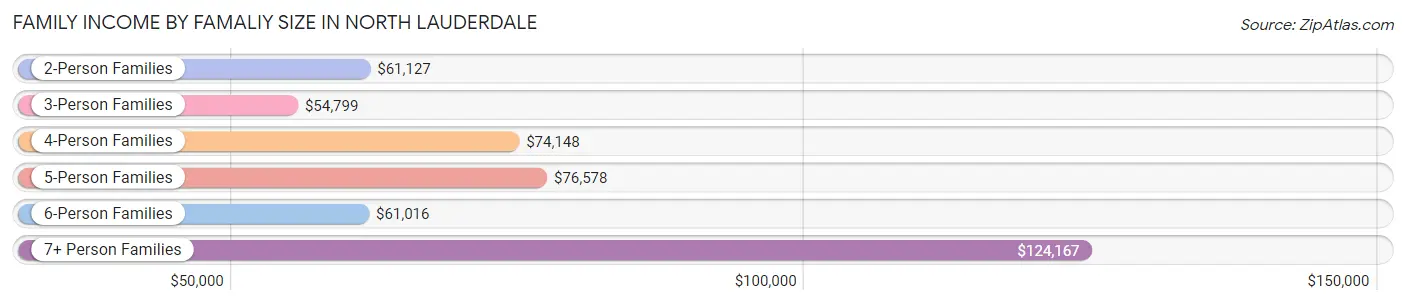
| Income Bracket | # Families | Median Income |
| 2-Person Families | 4,062 (38.6%) | $61,127 |
| 3-Person Families | 2,993 (28.4%) | $54,799 |
| 4-Person Families | 2,064 (19.6%) | $74,148 |
| 5-Person Families | 941 (8.9%) | $76,578 |
| 6-Person Families | 231 (2.2%) | $61,016 |
| 7+ Person Families | 244 (2.3%) | $124,167 |
| Total | 10,535 (100.0%) | $63,072 |
Family Income by Number of Earners in North Lauderdale
The median family income in North Lauderdale is $63,072, with families comprising 3+ earners (1,952) having the highest median family income of $94,392, while families with no earners (969) have the lowest median family income of $16,311, accounting for 18.5% and 9.2% of families, respectively.
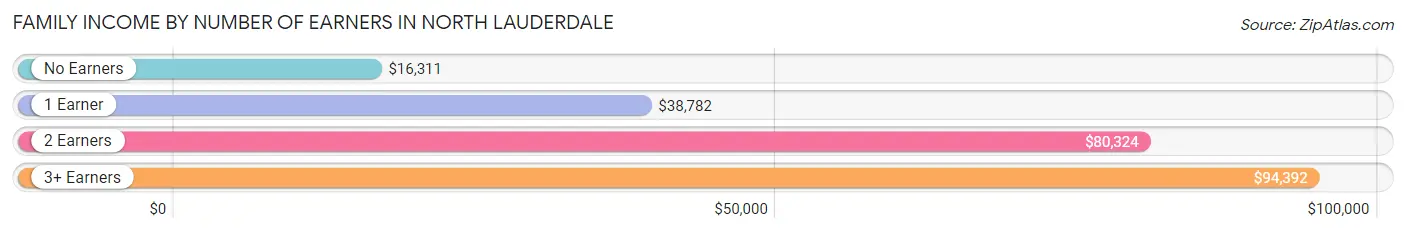
| Number of Earners | # Families | Median Income |
| No Earners | 969 (9.2%) | $16,311 |
| 1 Earner | 3,150 (29.9%) | $38,782 |
| 2 Earners | 4,464 (42.4%) | $80,324 |
| 3+ Earners | 1,952 (18.5%) | $94,392 |
| Total | 10,535 (100.0%) | $63,072 |
Household Income in North Lauderdale
Household Income Brackets in North Lauderdale
With 2,786 households falling in the category, the $50,000 to $74,999 income range is the most frequent in North Lauderdale, accounting for 18.1% of all households. In contrast, only 216 households (1.4%) fall into the $200,000+ income bracket, making it the least populous group.
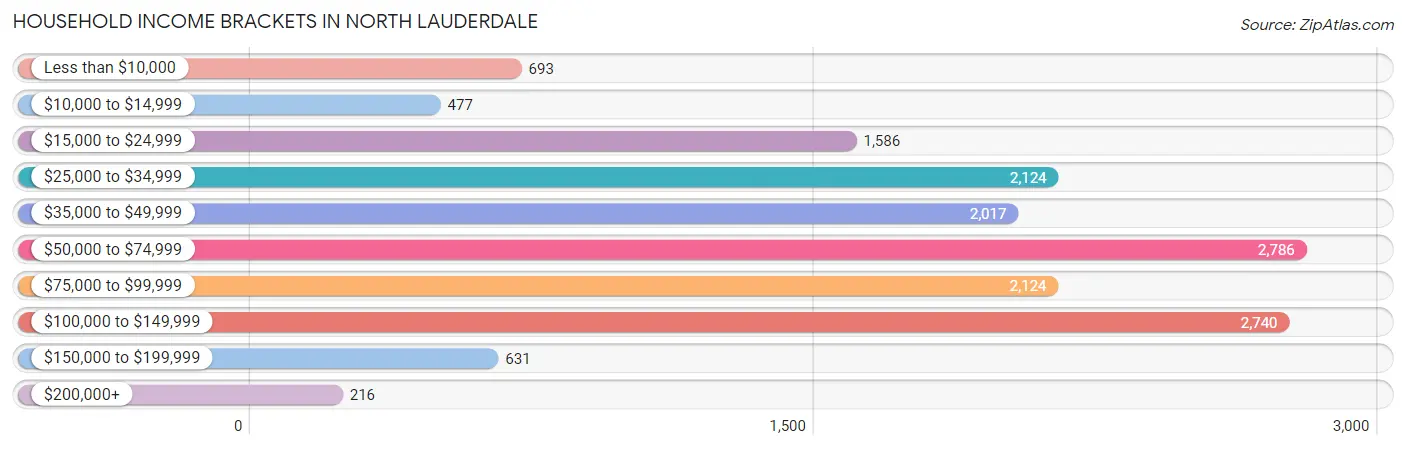
| Income Bracket | # Households | % Households |
| Less than $10,000 | 693 | 4.5% |
| $10,000 to $14,999 | 477 | 3.1% |
| $15,000 to $24,999 | 1,586 | 10.3% |
| $25,000 to $34,999 | 2,124 | 13.8% |
| $35,000 to $49,999 | 2,017 | 13.1% |
| $50,000 to $74,999 | 2,786 | 18.1% |
| $75,000 to $99,999 | 2,124 | 13.8% |
| $100,000 to $149,999 | 2,740 | 17.8% |
| $150,000 to $199,999 | 631 | 4.1% |
| $200,000+ | 216 | 1.4% |
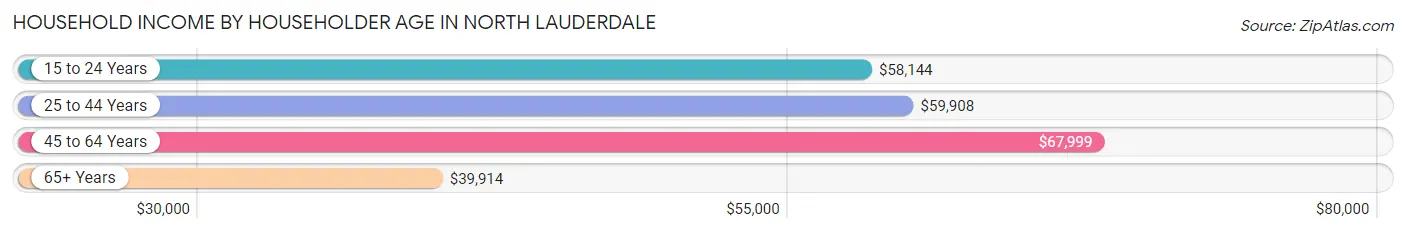
Household Income by Householder Age in North Lauderdale
The median household income in North Lauderdale is $60,168, with the highest median household income of $67,999 found in the 45 to 64 years age bracket for the primary householder. A total of 5,839 households (37.9%) fall into this category. Meanwhile, the 65+ years age bracket for the primary householder has the lowest median household income of $39,914, with 2,857 households (18.6%) in this group.
| Income Bracket | # Households | Median Income |
| 15 to 24 Years | 411 (2.7%) | $58,144 |
| 25 to 44 Years | 6,287 (40.8%) | $59,908 |
| 45 to 64 Years | 5,839 (37.9%) | $67,999 |
| 65+ Years | 2,857 (18.6%) | $39,914 |
| Total | 15,394 (100.0%) | $60,168 |
Poverty in North Lauderdale
Income Below Poverty by Sex and Age in North Lauderdale
With 16.0% poverty level for males and 17.6% for females among the residents of North Lauderdale, under 5 year old males and 12 to 14 year old females are the most vulnerable to poverty, with 558 males (41.2%) and 272 females (31.4%) in their respective age groups living below the poverty level.
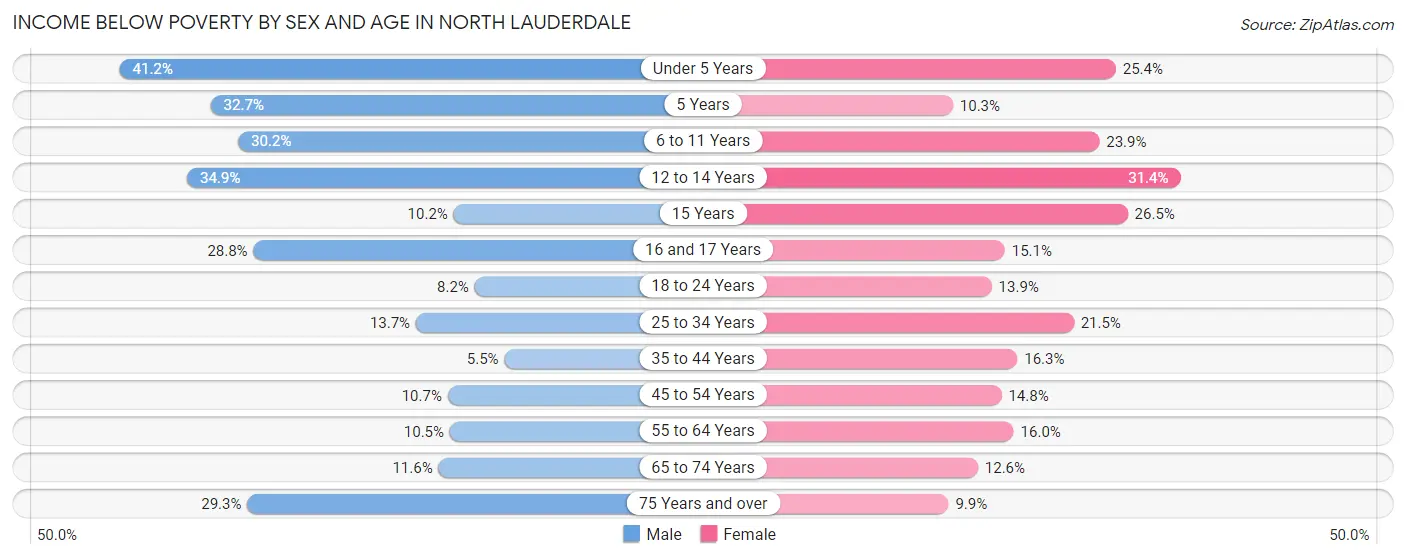
| Age Bracket | Male | Female |
| Under 5 Years | 558 (41.2%) | 236 (25.4%) |
| 5 Years | 72 (32.7%) | 23 (10.3%) |
| 6 to 11 Years | 583 (30.2%) | 458 (23.9%) |
| 12 to 14 Years | 257 (34.9%) | 272 (31.4%) |
| 15 Years | 45 (10.2%) | 130 (26.5%) |
| 16 and 17 Years | 216 (28.8%) | 90 (15.1%) |
| 18 to 24 Years | 184 (8.2%) | 380 (13.9%) |
| 25 to 34 Years | 404 (13.7%) | 722 (21.5%) |
| 35 to 44 Years | 175 (5.5%) | 586 (16.3%) |
| 45 to 54 Years | 361 (10.7%) | 505 (14.8%) |
| 55 to 64 Years | 214 (10.5%) | 392 (16.0%) |
| 65 to 74 Years | 160 (11.6%) | 237 (12.6%) |
| 75 Years and over | 166 (29.3%) | 101 (9.9%) |
| Total | 3,395 (16.0%) | 4,132 (17.6%) |
Income Above Poverty by Sex and Age in North Lauderdale
According to the poverty statistics in North Lauderdale, males aged 35 to 44 years and females aged 75 years and over are the age groups that are most secure financially, with 94.5% of males and 90.1% of females in these age groups living above the poverty line.
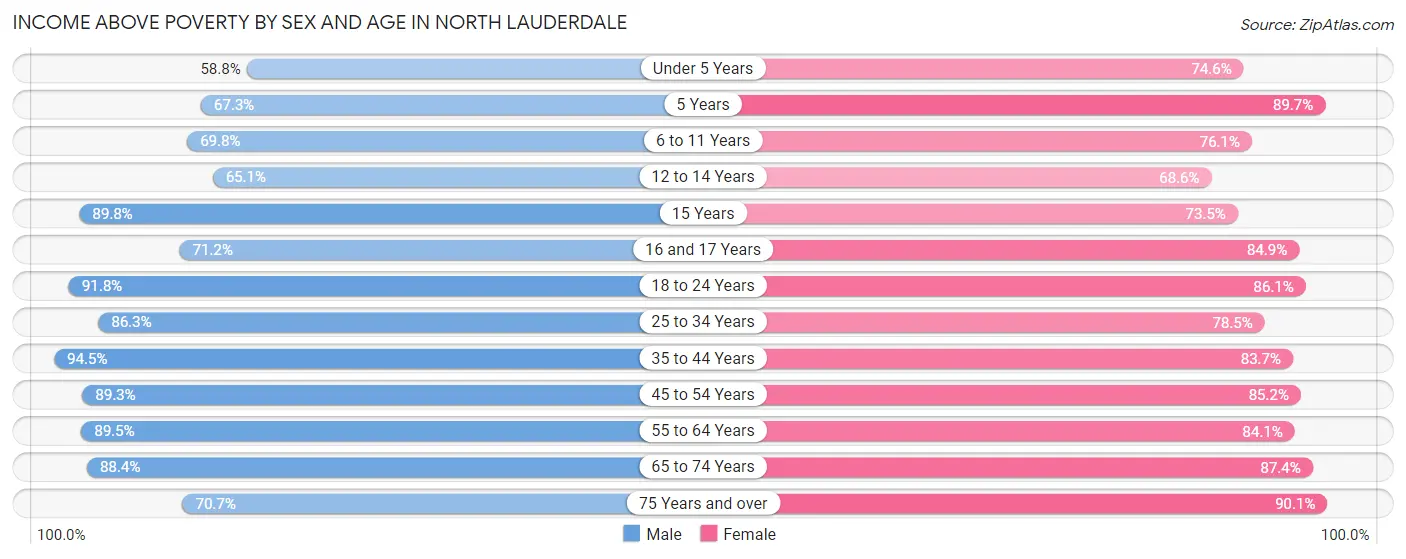
| Age Bracket | Male | Female |
| Under 5 Years | 797 (58.8%) | 692 (74.6%) |
| 5 Years | 148 (67.3%) | 200 (89.7%) |
| 6 to 11 Years | 1,348 (69.8%) | 1,458 (76.1%) |
| 12 to 14 Years | 479 (65.1%) | 594 (68.6%) |
| 15 Years | 397 (89.8%) | 360 (73.5%) |
| 16 and 17 Years | 535 (71.2%) | 505 (84.9%) |
| 18 to 24 Years | 2,053 (91.8%) | 2,351 (86.1%) |
| 25 to 34 Years | 2,550 (86.3%) | 2,633 (78.5%) |
| 35 to 44 Years | 3,025 (94.5%) | 3,012 (83.7%) |
| 45 to 54 Years | 3,004 (89.3%) | 2,903 (85.2%) |
| 55 to 64 Years | 1,818 (89.5%) | 2,065 (84.1%) |
| 65 to 74 Years | 1,220 (88.4%) | 1,640 (87.4%) |
| 75 Years and over | 400 (70.7%) | 919 (90.1%) |
| Total | 17,774 (84.0%) | 19,332 (82.4%) |
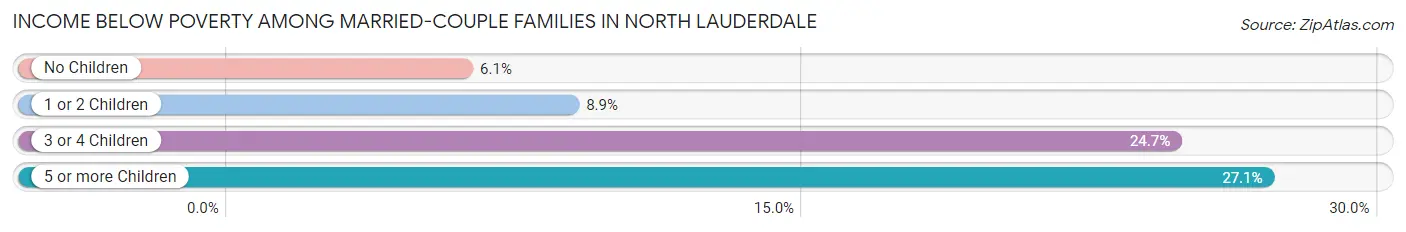
Income Below Poverty Among Married-Couple Families in North Lauderdale
The poverty statistics for married-couple families in North Lauderdale show that 8.7% or 495 of the total 5,703 families live below the poverty line. Families with 5 or more children have the highest poverty rate of 27.1%, comprising of 23 families. On the other hand, families with no children have the lowest poverty rate of 6.1%, which includes 214 families.
| Children | Above Poverty | Below Poverty |
| No Children | 3,269 (93.9%) | 214 (6.1%) |
| 1 or 2 Children | 1,553 (91.1%) | 152 (8.9%) |
| 3 or 4 Children | 324 (75.3%) | 106 (24.6%) |
| 5 or more Children | 62 (72.9%) | 23 (27.1%) |
| Total | 5,208 (91.3%) | 495 (8.7%) |
Income Below Poverty Among Single-Parent Households in North Lauderdale
According to the poverty data in North Lauderdale, 10.3% or 101 single-father households and 25.5% or 982 single-mother households are living below the poverty line. Among single-father households, those with 1 or 2 children have the highest poverty rate, with 101 households (19.3%) experiencing poverty. Likewise, among single-mother households, those with 3 or 4 children have the highest poverty rate, with 137 households (63.4%) falling below the poverty line.
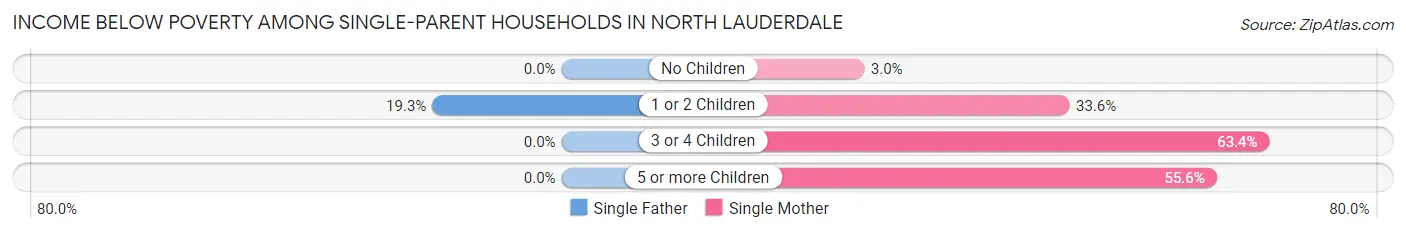
| Children | Single Father | Single Mother |
| No Children | 0 (0.0%) | 38 (3.0%) |
| 1 or 2 Children | 101 (19.3%) | 782 (33.6%) |
| 3 or 4 Children | 0 (0.0%) | 137 (63.4%) |
| 5 or more Children | 0 (0.0%) | 25 (55.6%) |
| Total | 101 (10.3%) | 982 (25.5%) |
Income Below Poverty Among Married-Couple vs Single-Parent Households in North Lauderdale
The poverty data for North Lauderdale shows that 495 of the married-couple family households (8.7%) and 1,083 of the single-parent households (22.4%) are living below the poverty level. Within the married-couple family households, those with 5 or more children have the highest poverty rate, with 23 households (27.1%) falling below the poverty line. Among the single-parent households, those with 3 or 4 children have the highest poverty rate, with 137 household (63.4%) living below poverty.
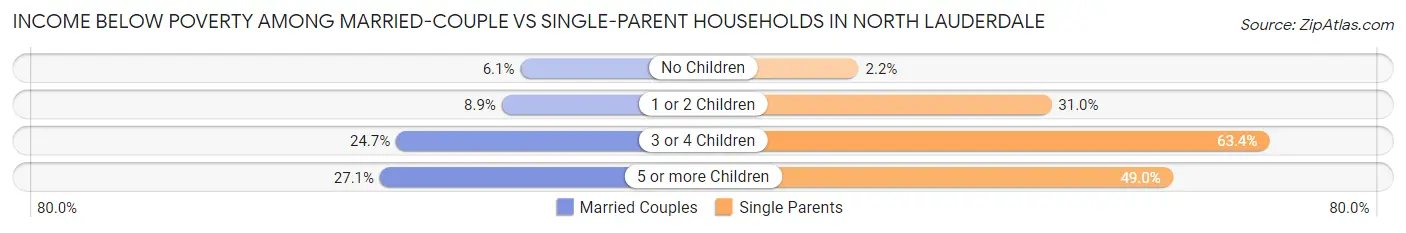
| Children | Married-Couple Families | Single-Parent Households |
| No Children | 214 (6.1%) | 38 (2.2%) |
| 1 or 2 Children | 152 (8.9%) | 883 (30.9%) |
| 3 or 4 Children | 106 (24.6%) | 137 (63.4%) |
| 5 or more Children | 23 (27.1%) | 25 (49.0%) |
| Total | 495 (8.7%) | 1,083 (22.4%) |
Race in North Lauderdale
The most populous races in North Lauderdale are Black / African American (25,736 | 57.7%), Hispanic or Latino (11,767 | 26.4%), and White / Caucasian (10,026 | 22.5%).
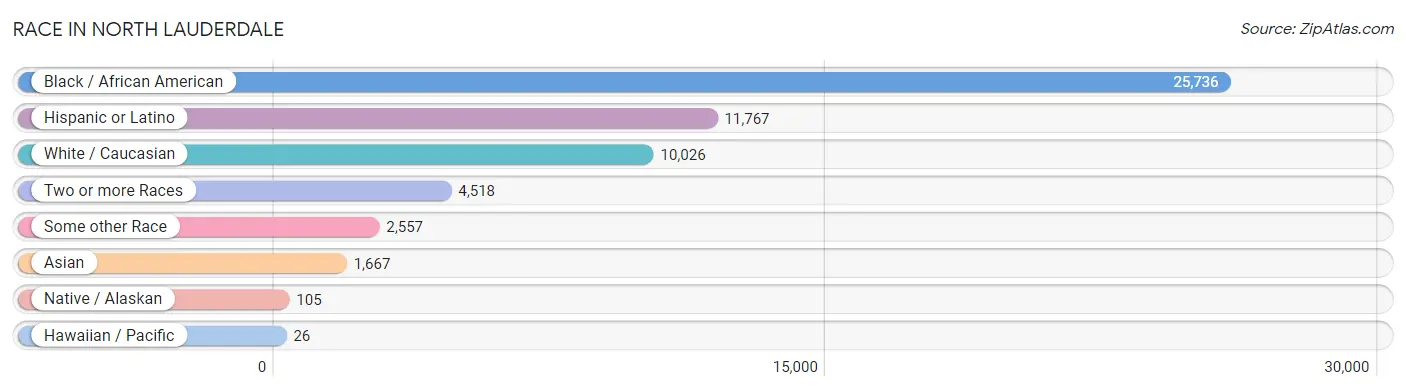
| Race | # Population | % Population |
| Asian | 1,667 | 3.7% |
| Black / African American | 25,736 | 57.7% |
| Hawaiian / Pacific | 26 | 0.1% |
| Hispanic or Latino | 11,767 | 26.4% |
| Native / Alaskan | 105 | 0.2% |
| White / Caucasian | 10,026 | 22.5% |
| Two or more Races | 4,518 | 10.1% |
| Some other Race | 2,557 | 5.7% |
| Total | 44,635 | 100.0% |
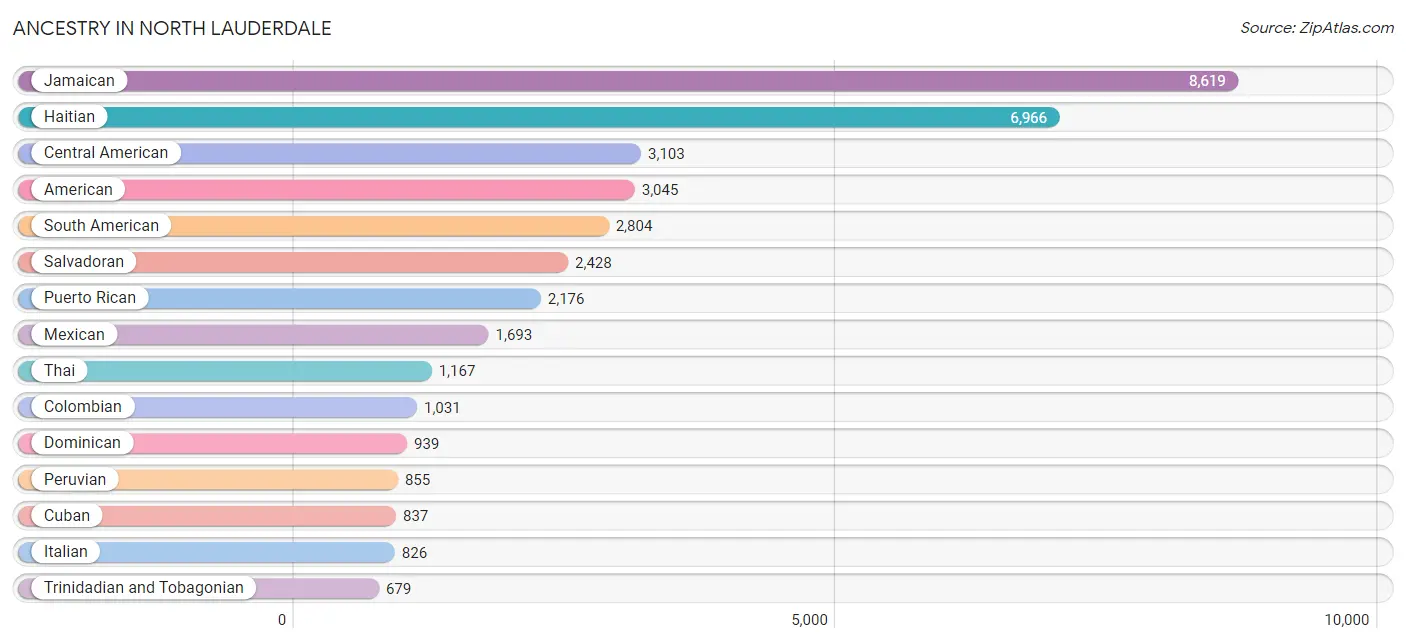
Ancestry in North Lauderdale
The most populous ancestries reported in North Lauderdale are Jamaican (8,619 | 19.3%), Haitian (6,966 | 15.6%), Central American (3,103 | 7.0%), American (3,045 | 6.8%), and South American (2,804 | 6.3%), together accounting for 55.0% of all North Lauderdale residents.
| Ancestry | # Population | % Population |
| African | 43 | 0.1% |
| American | 3,045 | 6.8% |
| Arab | 16 | 0.0% |
| Argentinean | 204 | 0.5% |
| Austrian | 43 | 0.1% |
| Bahamian | 182 | 0.4% |
| Barbadian | 20 | 0.0% |
| Belizean | 31 | 0.1% |
| Brazilian | 177 | 0.4% |
| British West Indian | 23 | 0.1% |
| Canadian | 92 | 0.2% |
| Central American | 3,103 | 7.0% |
| Central American Indian | 101 | 0.2% |
| Cherokee | 4 | 0.0% |
| Colombian | 1,031 | 2.3% |
| Costa Rican | 17 | 0.0% |
| Cuban | 837 | 1.9% |
| Czech | 21 | 0.1% |
| Danish | 40 | 0.1% |
| Dominican | 939 | 2.1% |
| Dutch | 51 | 0.1% |
| Ecuadorian | 397 | 0.9% |
| English | 155 | 0.4% |
| European | 33 | 0.1% |
| Finnish | 6 | 0.0% |
| French | 348 | 0.8% |
| French Canadian | 117 | 0.3% |
| German | 617 | 1.4% |
| Greek | 6 | 0.0% |
| Guamanian / Chamorro | 26 | 0.1% |
| Guatemalan | 225 | 0.5% |
| Guyanese | 144 | 0.3% |
| Haitian | 6,966 | 15.6% |
| Honduran | 368 | 0.8% |
| Hungarian | 32 | 0.1% |
| Indian (Asian) | 195 | 0.4% |
| Indonesian | 16 | 0.0% |
| Iranian | 18 | 0.0% |
| Irish | 567 | 1.3% |
| Italian | 826 | 1.8% |
| Jamaican | 8,619 | 19.3% |
| Korean | 61 | 0.1% |
| Mexican | 1,693 | 3.8% |
| Nicaraguan | 16 | 0.0% |
| Nigerian | 35 | 0.1% |
| Norwegian | 94 | 0.2% |
| Panamanian | 49 | 0.1% |
| Peruvian | 855 | 1.9% |
| Polish | 105 | 0.2% |
| Portuguese | 57 | 0.1% |
| Puerto Rican | 2,176 | 4.9% |
| Romanian | 51 | 0.1% |
| Russian | 180 | 0.4% |
| Salvadoran | 2,428 | 5.4% |
| Scottish | 84 | 0.2% |
| Slavic | 84 | 0.2% |
| South American | 2,804 | 6.3% |
| Sri Lankan | 211 | 0.5% |
| Subsaharan African | 78 | 0.2% |
| Thai | 1,167 | 2.6% |
| Trinidadian and Tobagonian | 679 | 1.5% |
| U.S. Virgin Islander | 59 | 0.1% |
| Uruguayan | 83 | 0.2% |
| Venezuelan | 234 | 0.5% |
| Vietnamese | 36 | 0.1% |
| Welsh | 13 | 0.0% |
| West Indian | 208 | 0.5% | View All 67 Rows |
Immigrants in North Lauderdale
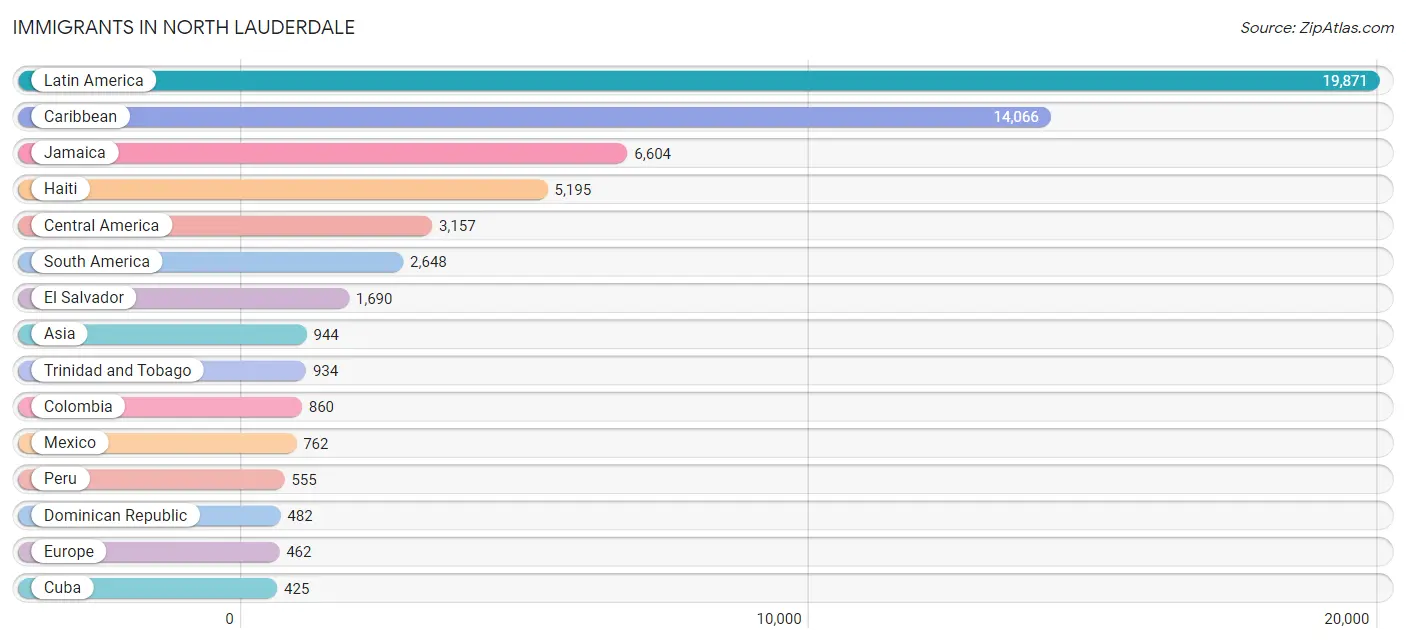
The most numerous immigrant groups reported in North Lauderdale came from Latin America (19,871 | 44.5%), Caribbean (14,066 | 31.5%), Jamaica (6,604 | 14.8%), Haiti (5,195 | 11.6%), and Central America (3,157 | 7.1%), together accounting for 109.5% of all North Lauderdale residents.
| Immigration Origin | # Population | % Population |
| Africa | 41 | 0.1% |
| Argentina | 193 | 0.4% |
| Asia | 944 | 2.1% |
| Austria | 43 | 0.1% |
| Bahamas | 234 | 0.5% |
| Bangladesh | 146 | 0.3% |
| Barbados | 54 | 0.1% |
| Belize | 31 | 0.1% |
| Brazil | 150 | 0.3% |
| Caribbean | 14,066 | 31.5% |
| Central America | 3,157 | 7.1% |
| China | 130 | 0.3% |
| Colombia | 860 | 1.9% |
| Costa Rica | 17 | 0.0% |
| Cuba | 425 | 0.9% |
| Dominica | 62 | 0.1% |
| Dominican Republic | 482 | 1.1% |
| Eastern Asia | 130 | 0.3% |
| Eastern Europe | 171 | 0.4% |
| Ecuador | 237 | 0.5% |
| El Salvador | 1,690 | 3.8% |
| England | 134 | 0.3% |
| Europe | 462 | 1.0% |
| France | 26 | 0.1% |
| Guatemala | 215 | 0.5% |
| Guyana | 270 | 0.6% |
| Haiti | 5,195 | 11.6% |
| Honduras | 378 | 0.9% |
| India | 206 | 0.5% |
| Jamaica | 6,604 | 14.8% |
| Laos | 25 | 0.1% |
| Latin America | 19,871 | 44.5% |
| Mexico | 762 | 1.7% |
| Nicaragua | 53 | 0.1% |
| Nigeria | 25 | 0.1% |
| Northern Africa | 16 | 0.0% |
| Northern Europe | 202 | 0.4% |
| Pakistan | 37 | 0.1% |
| Panama | 11 | 0.0% |
| Peru | 555 | 1.2% |
| Philippines | 45 | 0.1% |
| Portugal | 20 | 0.0% |
| Romania | 44 | 0.1% |
| Russia | 127 | 0.3% |
| South America | 2,648 | 5.9% |
| South Central Asia | 389 | 0.9% |
| South Eastern Asia | 425 | 0.9% |
| Southern Europe | 20 | 0.0% |
| Taiwan | 18 | 0.0% |
| Trinidad and Tobago | 934 | 2.1% |
| Uruguay | 83 | 0.2% |
| Venezuela | 267 | 0.6% |
| Vietnam | 339 | 0.8% |
| West Indies | 76 | 0.2% |
| Western Africa | 25 | 0.1% |
| Western Europe | 69 | 0.2% | View All 56 Rows |
Sex and Age in North Lauderdale
Sex and Age in North Lauderdale
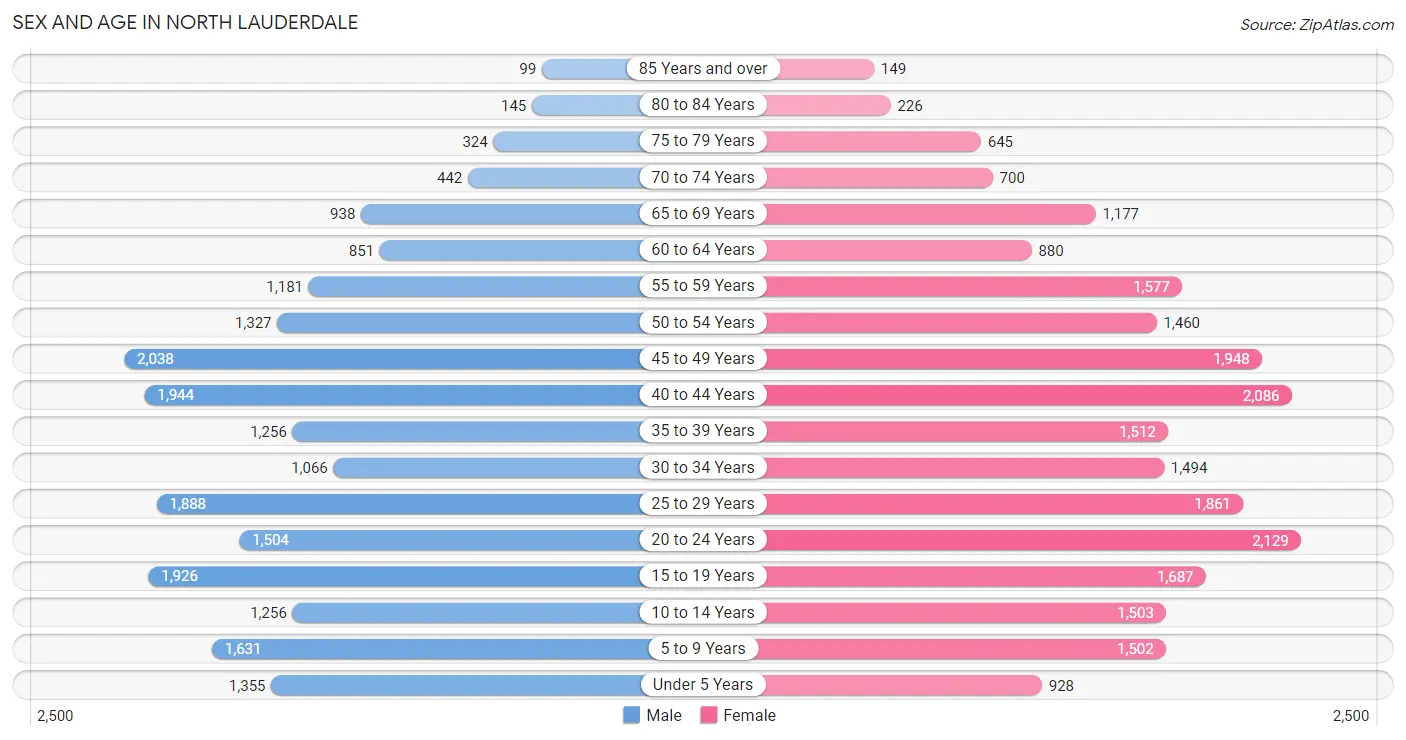
The most populous age groups in North Lauderdale are 45 to 49 Years (2,038 | 9.6%) for men and 20 to 24 Years (2,129 | 9.1%) for women.
| Age Bracket | Male | Female |
| Under 5 Years | 1,355 (6.4%) | 928 (4.0%) |
| 5 to 9 Years | 1,631 (7.7%) | 1,502 (6.4%) |
| 10 to 14 Years | 1,256 (5.9%) | 1,503 (6.4%) |
| 15 to 19 Years | 1,926 (9.1%) | 1,687 (7.2%) |
| 20 to 24 Years | 1,504 (7.1%) | 2,129 (9.1%) |
| 25 to 29 Years | 1,888 (8.9%) | 1,861 (7.9%) |
| 30 to 34 Years | 1,066 (5.0%) | 1,494 (6.4%) |
| 35 to 39 Years | 1,256 (5.9%) | 1,512 (6.4%) |
| 40 to 44 Years | 1,944 (9.2%) | 2,086 (8.9%) |
| 45 to 49 Years | 2,038 (9.6%) | 1,948 (8.3%) |
| 50 to 54 Years | 1,327 (6.3%) | 1,460 (6.2%) |
| 55 to 59 Years | 1,181 (5.6%) | 1,577 (6.7%) |
| 60 to 64 Years | 851 (4.0%) | 880 (3.7%) |
| 65 to 69 Years | 938 (4.4%) | 1,177 (5.0%) |
| 70 to 74 Years | 442 (2.1%) | 700 (3.0%) |
| 75 to 79 Years | 324 (1.5%) | 645 (2.8%) |
| 80 to 84 Years | 145 (0.7%) | 226 (1.0%) |
| 85 Years and over | 99 (0.5%) | 149 (0.6%) |
| Total | 21,171 (100.0%) | 23,464 (100.0%) |
Families and Households in North Lauderdale
Median Family Size in North Lauderdale
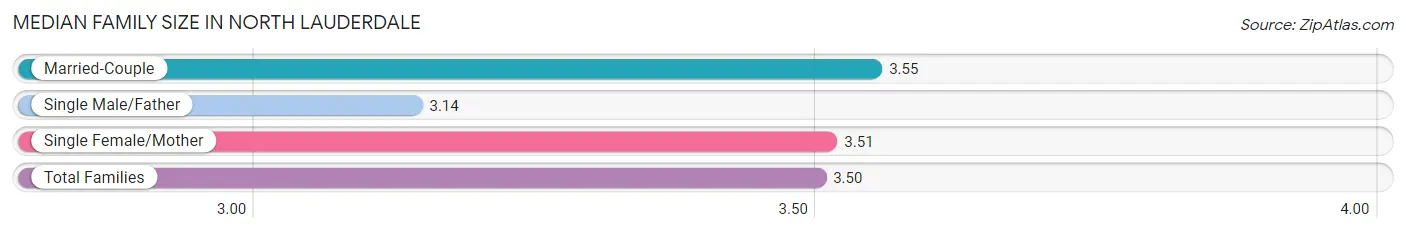
The median family size in North Lauderdale is 3.50 persons per family, with married-couple families (5,703 | 54.1%) accounting for the largest median family size of 3.55 persons per family. On the other hand, single male/father families (980 | 9.3%) represent the smallest median family size with 3.14 persons per family.
| Family Type | # Families | Family Size |
| Married-Couple | 5,703 (54.1%) | 3.55 |
| Single Male/Father | 980 (9.3%) | 3.14 |
| Single Female/Mother | 3,852 (36.6%) | 3.51 |
| Total Families | 10,535 (100.0%) | 3.50 |
Median Household Size in North Lauderdale
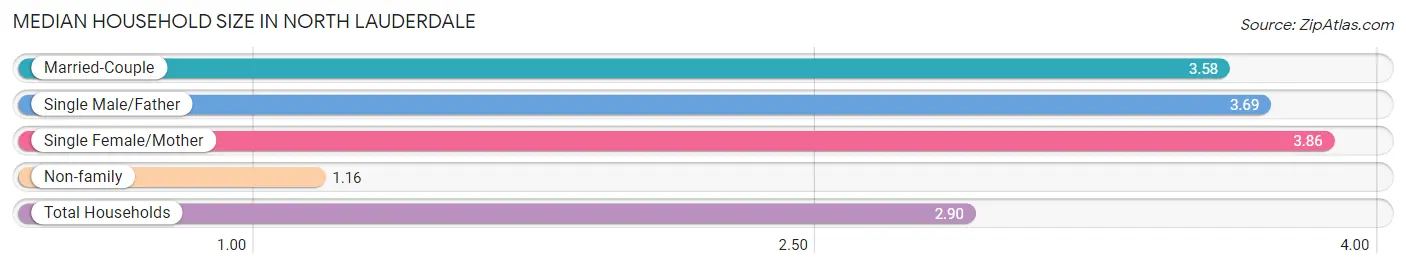
The median household size in North Lauderdale is 2.90 persons per household, with single female/mother households (3,852 | 25.0%) accounting for the largest median household size of 3.86 persons per household. non-family households (4,859 | 31.6%) represent the smallest median household size with 1.16 persons per household.
| Household Type | # Households | Household Size |
| Married-Couple | 5,703 (37.0%) | 3.58 |
| Single Male/Father | 980 (6.4%) | 3.69 |
| Single Female/Mother | 3,852 (25.0%) | 3.86 |
| Non-family | 4,859 (31.6%) | 1.16 |
| Total Households | 15,394 (100.0%) | 2.90 |
Household Size by Marriage Status in North Lauderdale
Out of a total of 15,394 households in North Lauderdale, 10,535 (68.4%) are family households, while 4,859 (31.6%) are nonfamily households. The most numerous type of family households are 2-person households, comprising 3,329, and the most common type of nonfamily households are 1-person households, comprising 4,234.
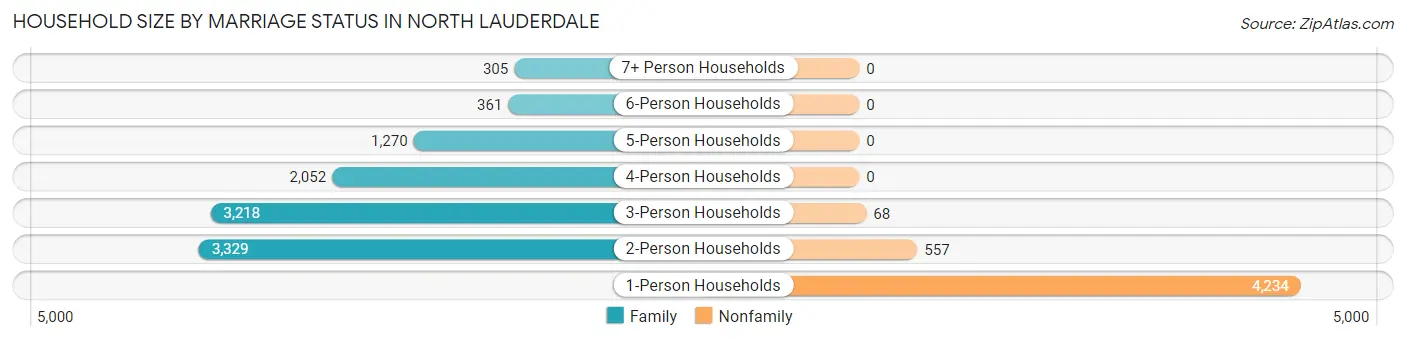
| Household Size | Family Households | Nonfamily Households |
| 1-Person Households | - | 4,234 (27.5%) |
| 2-Person Households | 3,329 (21.6%) | 557 (3.6%) |
| 3-Person Households | 3,218 (20.9%) | 68 (0.4%) |
| 4-Person Households | 2,052 (13.3%) | 0 (0.0%) |
| 5-Person Households | 1,270 (8.3%) | 0 (0.0%) |
| 6-Person Households | 361 (2.4%) | 0 (0.0%) |
| 7+ Person Households | 305 (2.0%) | 0 (0.0%) |
| Total | 10,535 (68.4%) | 4,859 (31.6%) |
Female Fertility in North Lauderdale
Fertility by Age in North Lauderdale
Average fertility rate in North Lauderdale is 54.0 births per 1,000 women. Women in the age bracket of 20 to 34 years have the highest fertility rate with 89.0 births per 1,000 women. Women in the age bracket of 20 to 34 years acount for 67.7% of all women with births.
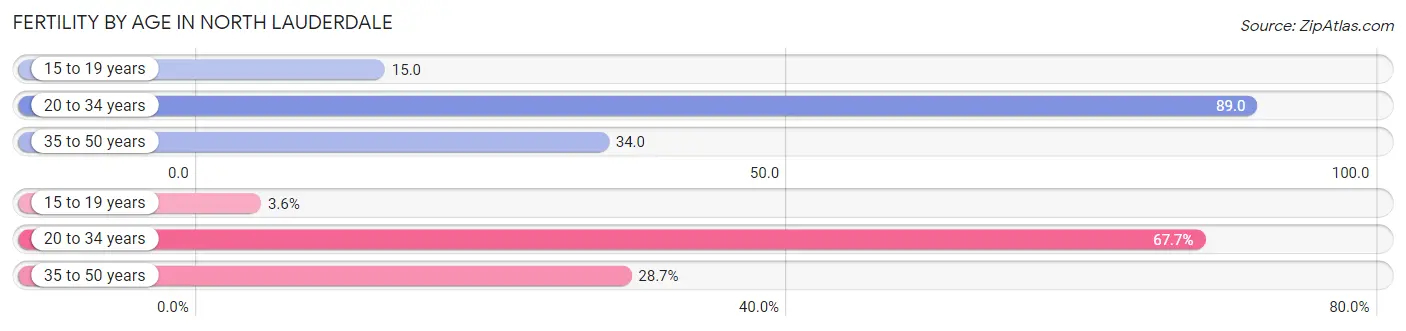
| Age Bracket | Women with Births | Births / 1,000 Women |
| 15 to 19 years | 26 (3.6%) | 15.0 |
| 20 to 34 years | 490 (67.7%) | 89.0 |
| 35 to 50 years | 208 (28.7%) | 34.0 |
| Total | 724 (100.0%) | 54.0 |
Fertility by Age by Marriage Status in North Lauderdale
40.5% of women with births (724) in North Lauderdale are married. The highest percentage of unmarried women with births falls into 15 to 19 years age bracket with 100.0% of them unmarried at the time of birth, while the lowest percentage of unmarried women with births belong to 35 to 50 years age bracket with 48.6% of them unmarried.
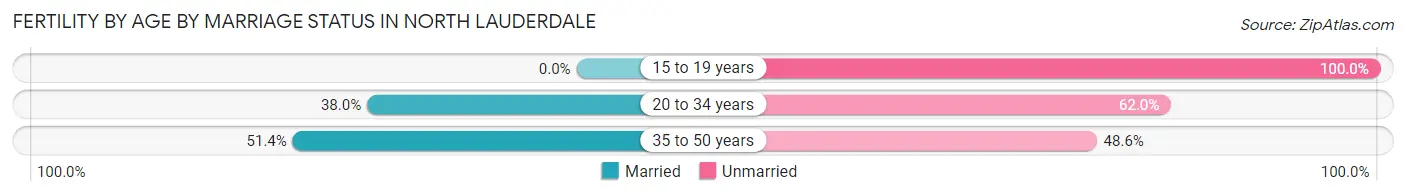
| Age Bracket | Married | Unmarried |
| 15 to 19 years | 0 (0.0%) | 26 (100.0%) |
| 20 to 34 years | 186 (38.0%) | 304 (62.0%) |
| 35 to 50 years | 107 (51.4%) | 101 (48.6%) |
| Total | 293 (40.5%) | 431 (59.5%) |
Fertility by Education in North Lauderdale
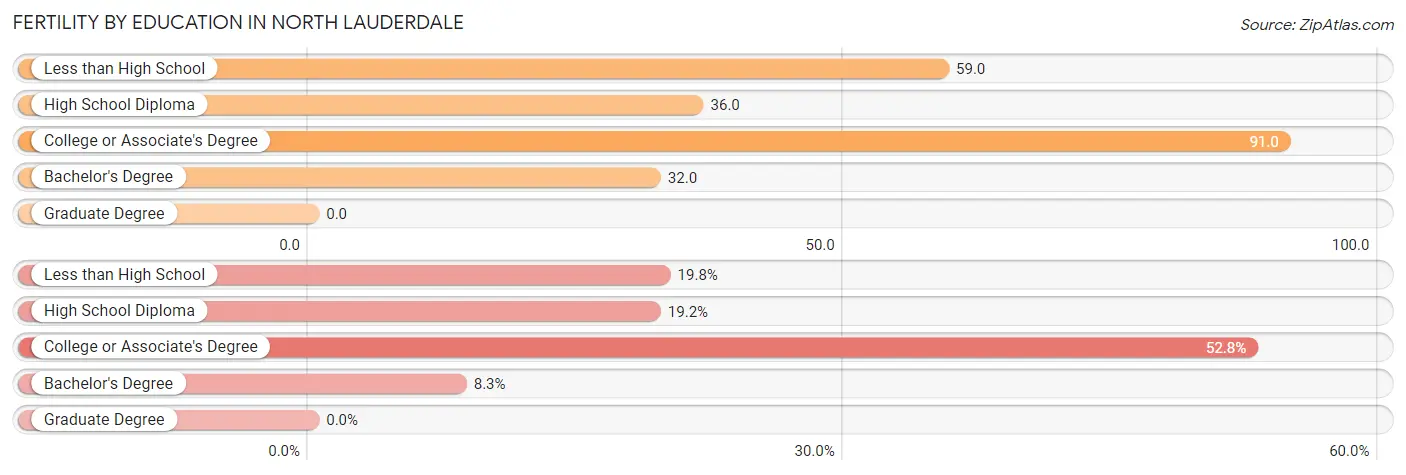
| Educational Attainment | Women with Births | Births / 1,000 Women |
| Less than High School | 143 (19.8%) | 59.0 |
| High School Diploma | 139 (19.2%) | 36.0 |
| College or Associate's Degree | 382 (52.8%) | 91.0 |
| Bachelor's Degree | 60 (8.3%) | 32.0 |
| Graduate Degree | 0 (0.0%) | 0.0 |
| Total | 724 (100.0%) | 54.0 |
Fertility by Education by Marriage Status in North Lauderdale
59.5% of women with births in North Lauderdale are unmarried. Women with the educational attainment of less than high school are most likely to be married with 90.2% of them married at childbirth, while women with the educational attainment of high school diploma are least likely to be married with 80.6% of them unmarried at childbirth.
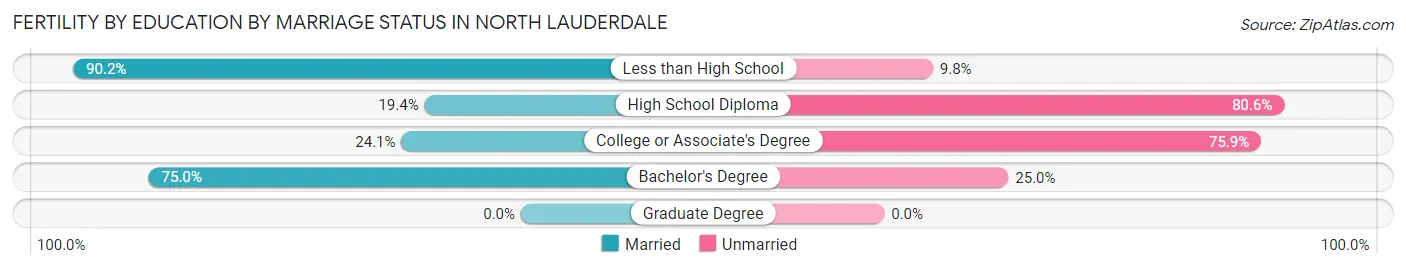
| Educational Attainment | Married | Unmarried |
| Less than High School | 129 (90.2%) | 14 (9.8%) |
| High School Diploma | 27 (19.4%) | 112 (80.6%) |
| College or Associate's Degree | 92 (24.1%) | 290 (75.9%) |
| Bachelor's Degree | 45 (75.0%) | 15 (25.0%) |
| Graduate Degree | 0 (0.0%) | 0 (0.0%) |
| Total | 293 (40.5%) | 431 (59.5%) |
Employment Characteristics in North Lauderdale
Employment by Class of Employer in North Lauderdale
Among the 24,315 employed individuals in North Lauderdale, private company employees (18,134 | 74.6%), self-employed (not incorporated) (1,653 | 6.8%), and not-for-profit organizations (1,411 | 5.8%) make up the most common classes of employment.
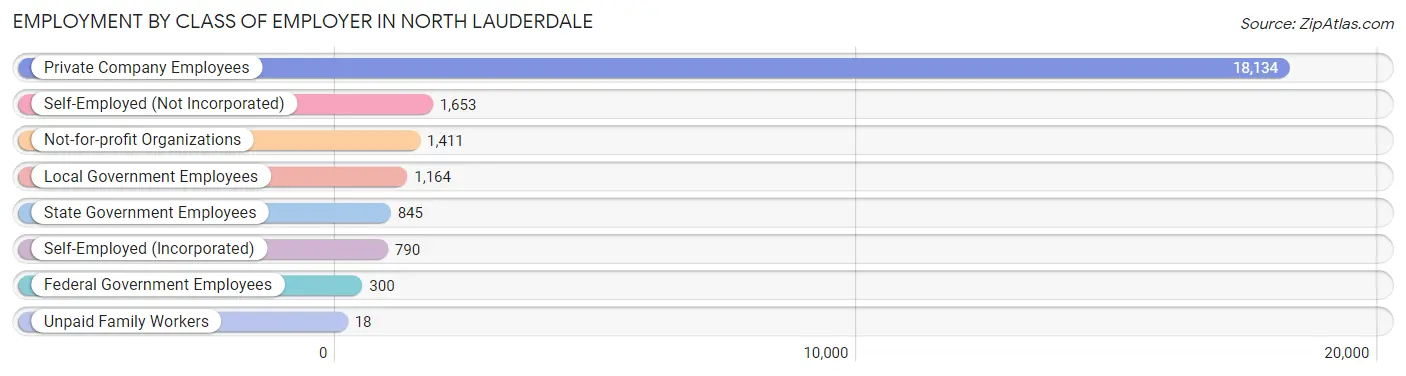
| Employer Class | # Employees | % Employees |
| Private Company Employees | 18,134 | 74.6% |
| Self-Employed (Incorporated) | 790 | 3.3% |
| Self-Employed (Not Incorporated) | 1,653 | 6.8% |
| Not-for-profit Organizations | 1,411 | 5.8% |
| Local Government Employees | 1,164 | 4.8% |
| State Government Employees | 845 | 3.5% |
| Federal Government Employees | 300 | 1.2% |
| Unpaid Family Workers | 18 | 0.1% |
| Total | 24,315 | 100.0% |
Employment Status by Age in North Lauderdale
According to the labor force statistics for North Lauderdale, out of the total population over 16 years of age (35,528), 74.2% or 26,362 individuals are in the labor force, with 6.2% or 1,634 of them unemployed. The age group with the highest labor force participation rate is 30 to 34 years, with 91.2% or 2,335 individuals in the labor force. Within the labor force, the 20 to 24 years age range has the highest percentage of unemployed individuals, with 13.0% or 381 of them being unemployed.
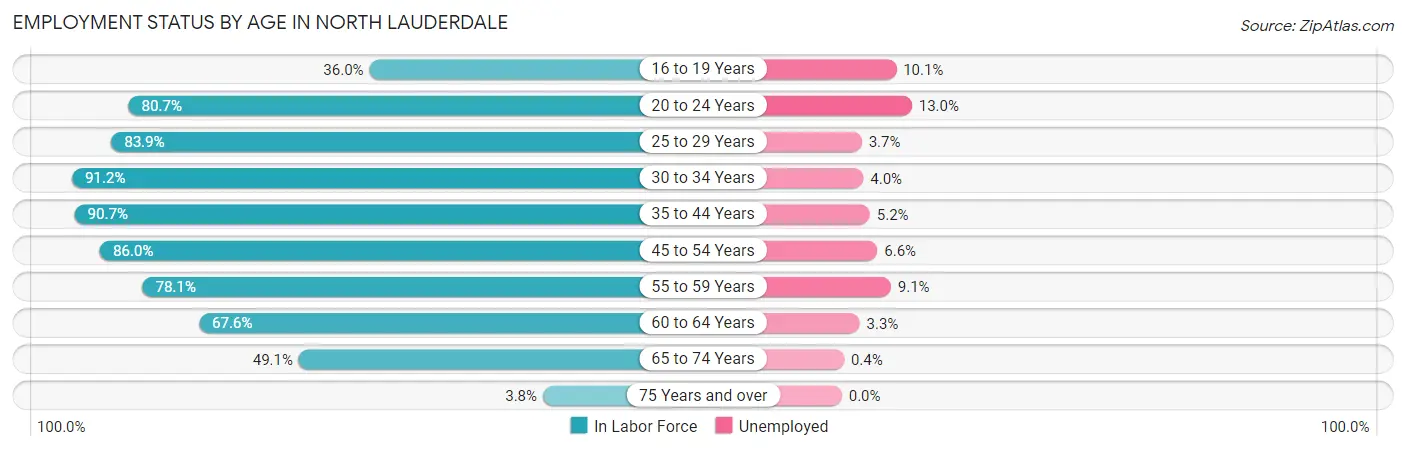
| Age Bracket | In Labor Force | Unemployed |
| 16 to 19 Years | 965 (36.0%) | 97 (10.1%) |
| 20 to 24 Years | 2,932 (80.7%) | 381 (13.0%) |
| 25 to 29 Years | 3,145 (83.9%) | 116 (3.7%) |
| 30 to 34 Years | 2,335 (91.2%) | 93 (4.0%) |
| 35 to 44 Years | 6,166 (90.7%) | 321 (5.2%) |
| 45 to 54 Years | 5,825 (86.0%) | 384 (6.6%) |
| 55 to 59 Years | 2,154 (78.1%) | 196 (9.1%) |
| 60 to 64 Years | 1,170 (67.6%) | 39 (3.3%) |
| 65 to 74 Years | 1,599 (49.1%) | 6 (0.4%) |
| 75 Years and over | 60 (3.8%) | 0 (0.0%) |
| Total | 26,362 (74.2%) | 1,634 (6.2%) |
Employment Status by Educational Attainment in North Lauderdale
According to labor force statistics for North Lauderdale, 85.4% of individuals (20,811) out of the total population between 25 and 64 years of age (24,369) are in the labor force, with 5.5% or 1,145 of them being unemployed. The group with the highest labor force participation rate are those with the educational attainment of bachelor's degree or higher, with 94.0% or 5,006 individuals in the labor force. Within the labor force, individuals with less than high school education have the highest percentage of unemployment, with 9.9% or 259 of them being unemployed.
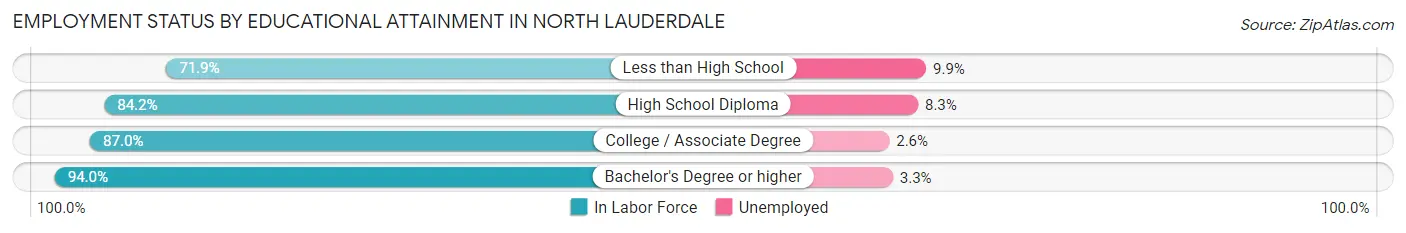
| Educational Attainment | In Labor Force | Unemployed |
| Less than High School | 2,619 (71.9%) | 361 (9.9%) |
| High School Diploma | 6,630 (84.2%) | 654 (8.3%) |
| College / Associate Degree | 6,548 (87.0%) | 196 (2.6%) |
| Bachelor's Degree or higher | 5,006 (94.0%) | 176 (3.3%) |
| Total | 20,811 (85.4%) | 1,340 (5.5%) |
Employment Occupations by Sex in North Lauderdale
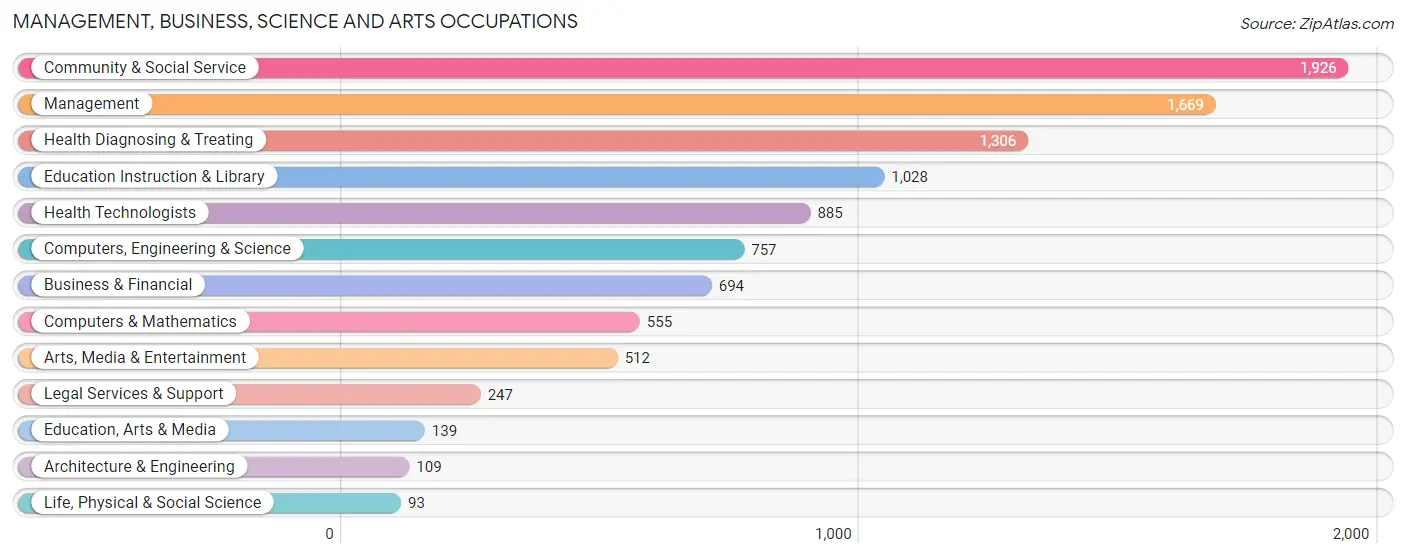
Management, Business, Science and Arts Occupations
The most common Management, Business, Science and Arts occupations in North Lauderdale are Community & Social Service (1,926 | 7.8%), Management (1,669 | 6.8%), Health Diagnosing & Treating (1,306 | 5.3%), Education Instruction & Library (1,028 | 4.2%), and Health Technologists (885 | 3.6%).
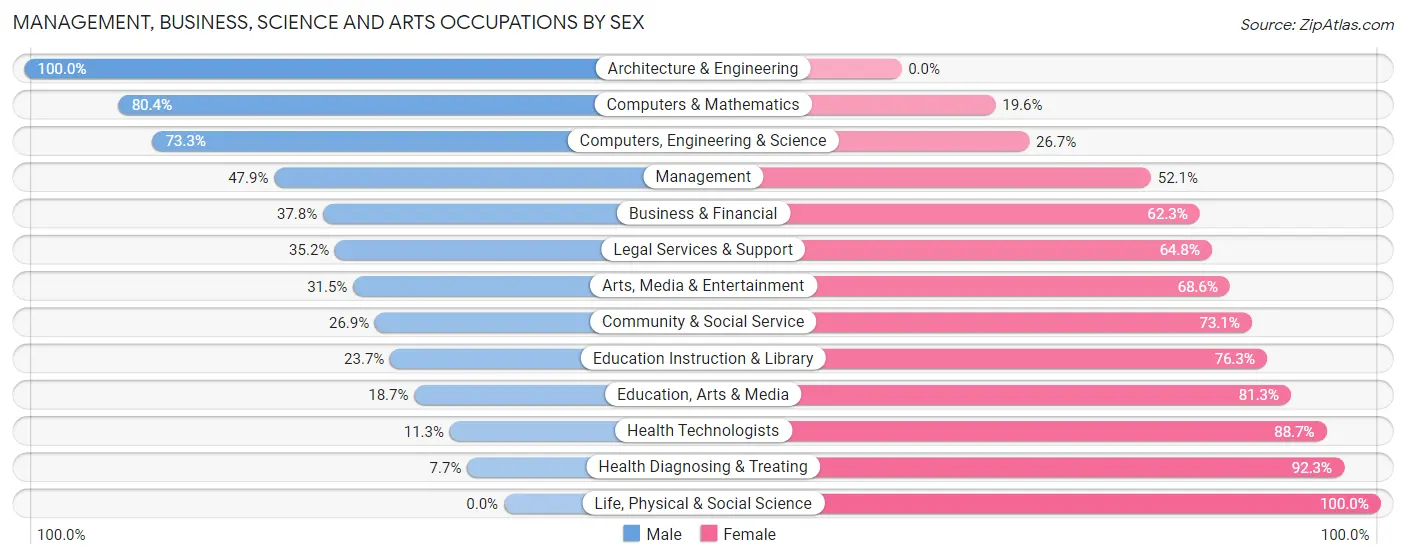
Management, Business, Science and Arts Occupations by Sex
Within the Management, Business, Science and Arts occupations in North Lauderdale, the most male-oriented occupations are Architecture & Engineering (100.0%), Computers & Mathematics (80.4%), and Computers, Engineering & Science (73.3%), while the most female-oriented occupations are Life, Physical & Social Science (100.0%), Health Diagnosing & Treating (92.3%), and Health Technologists (88.7%).
| Occupation | Male | Female |
| Management | 800 (47.9%) | 869 (52.1%) |
| Business & Financial | 262 (37.8%) | 432 (62.3%) |
| Computers, Engineering & Science | 555 (73.3%) | 202 (26.7%) |
| Computers & Mathematics | 446 (80.4%) | 109 (19.6%) |
| Architecture & Engineering | 109 (100.0%) | 0 (0.0%) |
| Life, Physical & Social Science | 0 (0.0%) | 93 (100.0%) |
| Community & Social Service | 518 (26.9%) | 1,408 (73.1%) |
| Education, Arts & Media | 26 (18.7%) | 113 (81.3%) |
| Legal Services & Support | 87 (35.2%) | 160 (64.8%) |
| Education Instruction & Library | 244 (23.7%) | 784 (76.3%) |
| Arts, Media & Entertainment | 161 (31.5%) | 351 (68.5%) |
| Health Diagnosing & Treating | 100 (7.7%) | 1,206 (92.3%) |
| Health Technologists | 100 (11.3%) | 785 (88.7%) |
| Total (Category) | 2,235 (35.2%) | 4,117 (64.8%) |
| Total (Overall) | 12,538 (50.7%) | 12,171 (49.3%) |
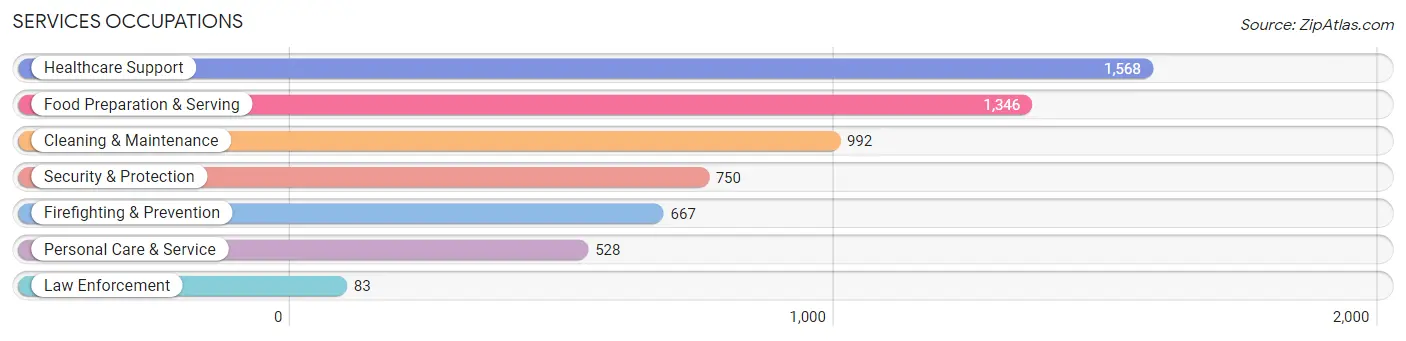
Services Occupations
The most common Services occupations in North Lauderdale are Healthcare Support (1,568 | 6.4%), Food Preparation & Serving (1,346 | 5.4%), Cleaning & Maintenance (992 | 4.0%), Security & Protection (750 | 3.0%), and Firefighting & Prevention (667 | 2.7%).
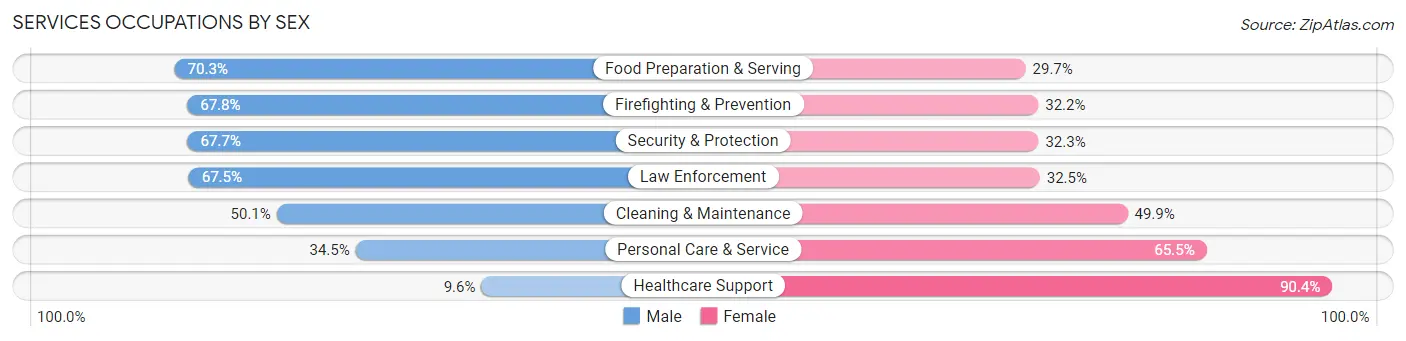
Services Occupations by Sex
Within the Services occupations in North Lauderdale, the most male-oriented occupations are Food Preparation & Serving (70.3%), Firefighting & Prevention (67.8%), and Security & Protection (67.7%), while the most female-oriented occupations are Healthcare Support (90.4%), Personal Care & Service (65.5%), and Cleaning & Maintenance (49.9%).
| Occupation | Male | Female |
| Healthcare Support | 150 (9.6%) | 1,418 (90.4%) |
| Security & Protection | 508 (67.7%) | 242 (32.3%) |
| Firefighting & Prevention | 452 (67.8%) | 215 (32.2%) |
| Law Enforcement | 56 (67.5%) | 27 (32.5%) |
| Food Preparation & Serving | 946 (70.3%) | 400 (29.7%) |
| Cleaning & Maintenance | 497 (50.1%) | 495 (49.9%) |
| Personal Care & Service | 182 (34.5%) | 346 (65.5%) |
| Total (Category) | 2,283 (44.0%) | 2,901 (56.0%) |
| Total (Overall) | 12,538 (50.7%) | 12,171 (49.3%) |
Sales and Office Occupations
The most common Sales and Office occupations in North Lauderdale are Sales & Related (3,571 | 14.4%), and Office & Administration (3,271 | 13.2%).

Sales and Office Occupations by Sex
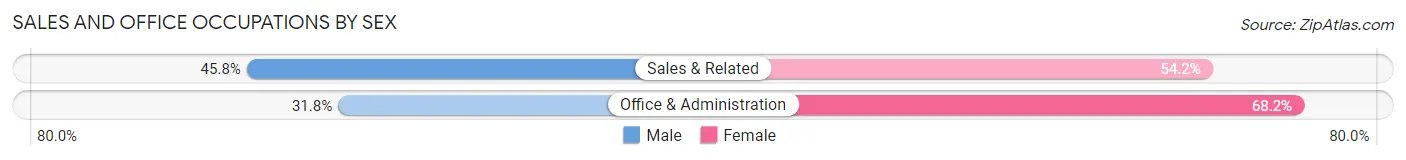
| Occupation | Male | Female |
| Sales & Related | 1,637 (45.8%) | 1,934 (54.2%) |
| Office & Administration | 1,040 (31.8%) | 2,231 (68.2%) |
| Total (Category) | 2,677 (39.1%) | 4,165 (60.9%) |
| Total (Overall) | 12,538 (50.7%) | 12,171 (49.3%) |
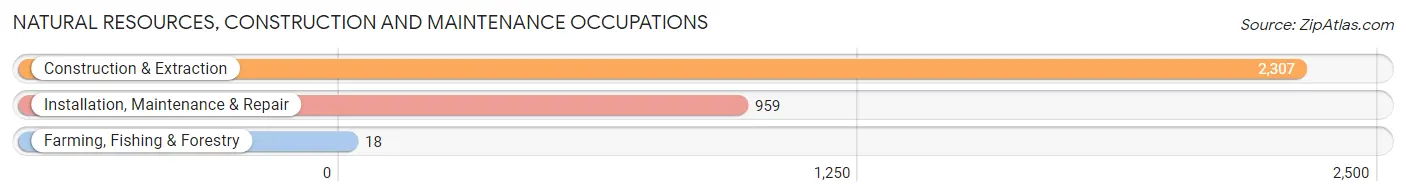
Natural Resources, Construction and Maintenance Occupations
The most common Natural Resources, Construction and Maintenance occupations in North Lauderdale are Construction & Extraction (2,307 | 9.3%), Installation, Maintenance & Repair (959 | 3.9%), and Farming, Fishing & Forestry (18 | 0.1%).
Natural Resources, Construction and Maintenance Occupations by Sex
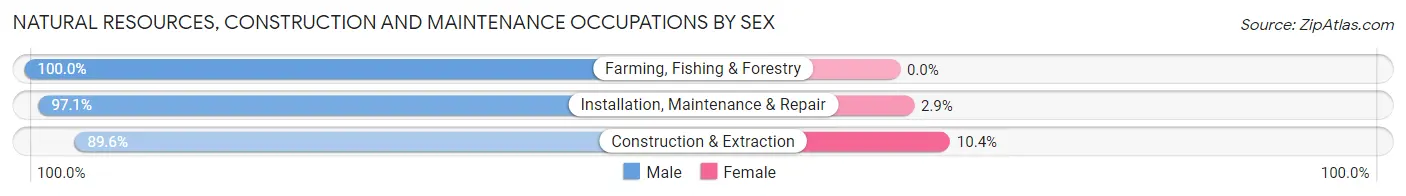
| Occupation | Male | Female |
| Farming, Fishing & Forestry | 18 (100.0%) | 0 (0.0%) |
| Construction & Extraction | 2,067 (89.6%) | 240 (10.4%) |
| Installation, Maintenance & Repair | 931 (97.1%) | 28 (2.9%) |
| Total (Category) | 3,016 (91.8%) | 268 (8.2%) |
| Total (Overall) | 12,538 (50.7%) | 12,171 (49.3%) |
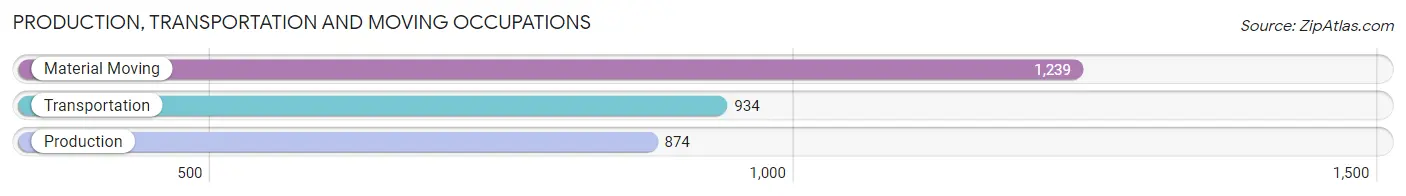
Production, Transportation and Moving Occupations
The most common Production, Transportation and Moving occupations in North Lauderdale are Material Moving (1,239 | 5.0%), Transportation (934 | 3.8%), and Production (874 | 3.5%).
Production, Transportation and Moving Occupations by Sex
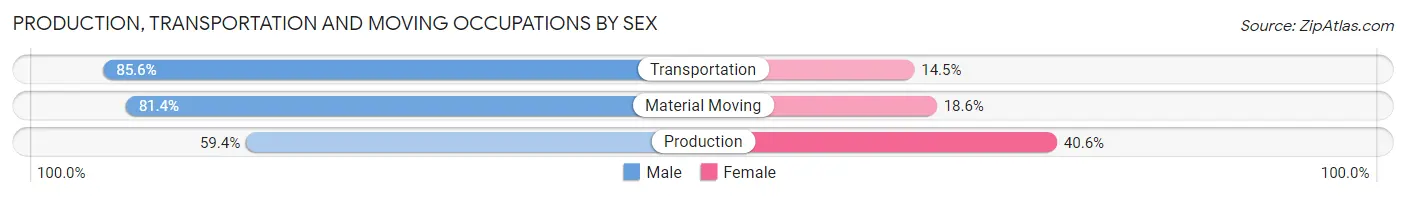
| Occupation | Male | Female |
| Production | 519 (59.4%) | 355 (40.6%) |
| Transportation | 799 (85.6%) | 135 (14.4%) |
| Material Moving | 1,009 (81.4%) | 230 (18.6%) |
| Total (Category) | 2,327 (76.4%) | 720 (23.6%) |
| Total (Overall) | 12,538 (50.7%) | 12,171 (49.3%) |
Employment Industries by Sex in North Lauderdale
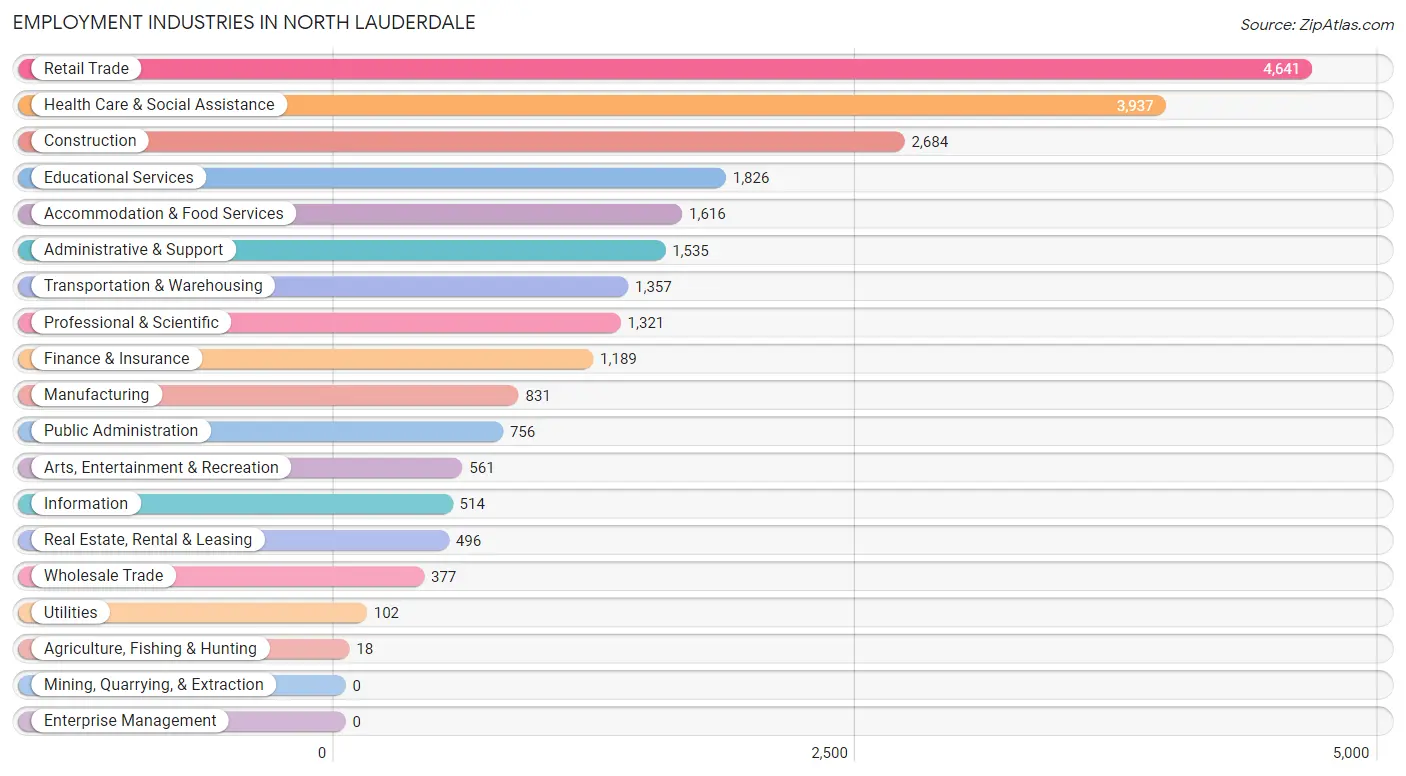
Employment Industries in North Lauderdale
The major employment industries in North Lauderdale include Retail Trade (4,641 | 18.8%), Health Care & Social Assistance (3,937 | 15.9%), Construction (2,684 | 10.9%), Educational Services (1,826 | 7.4%), and Accommodation & Food Services (1,616 | 6.5%).
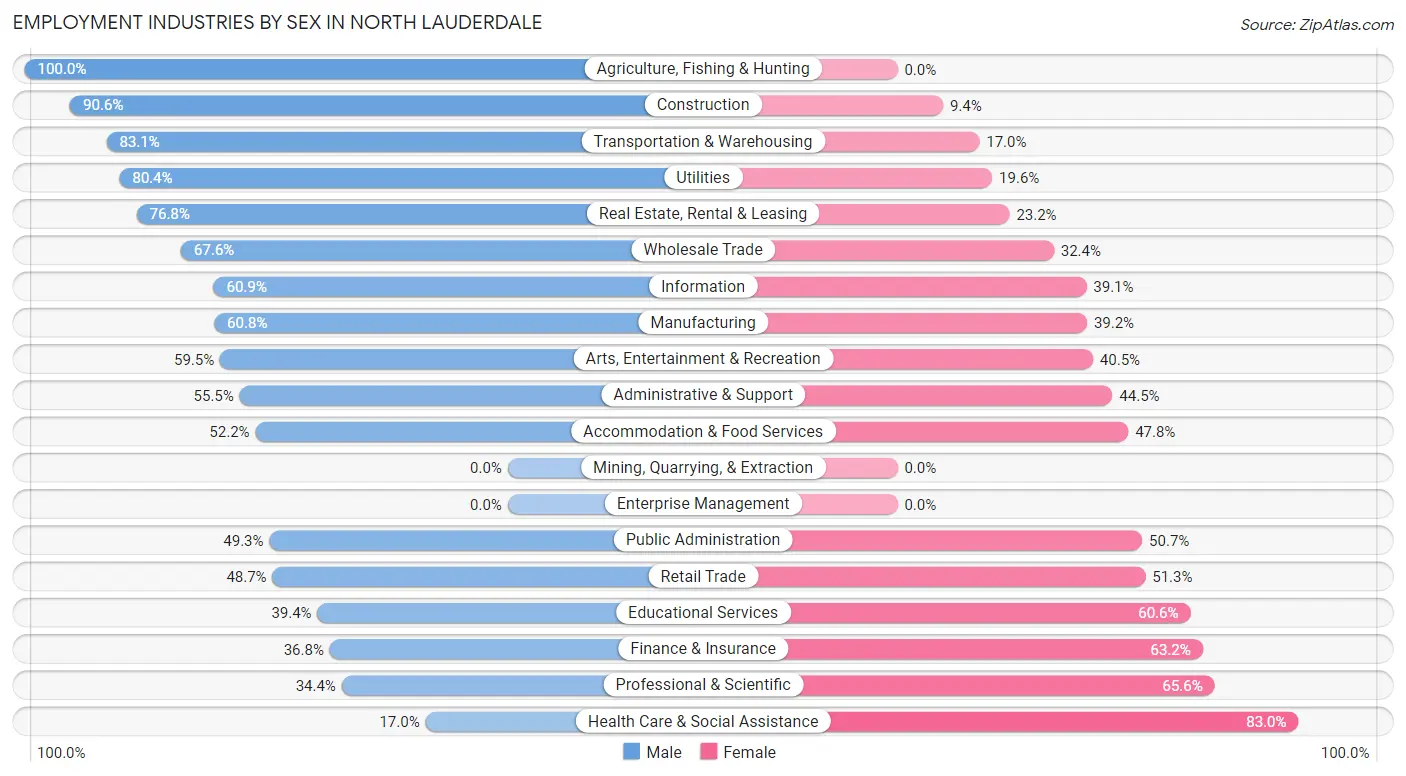
Employment Industries by Sex in North Lauderdale
The North Lauderdale industries that see more men than women are Agriculture, Fishing & Hunting (100.0%), Construction (90.6%), and Transportation & Warehousing (83.1%), whereas the industries that tend to have a higher number of women are Health Care & Social Assistance (83.0%), Professional & Scientific (65.6%), and Finance & Insurance (63.2%).
| Industry | Male | Female |
| Agriculture, Fishing & Hunting | 18 (100.0%) | 0 (0.0%) |
| Mining, Quarrying, & Extraction | 0 (0.0%) | 0 (0.0%) |
| Construction | 2,431 (90.6%) | 253 (9.4%) |
| Manufacturing | 505 (60.8%) | 326 (39.2%) |
| Wholesale Trade | 255 (67.6%) | 122 (32.4%) |
| Retail Trade | 2,260 (48.7%) | 2,381 (51.3%) |
| Transportation & Warehousing | 1,127 (83.1%) | 230 (17.0%) |
| Utilities | 82 (80.4%) | 20 (19.6%) |
| Information | 313 (60.9%) | 201 (39.1%) |
| Finance & Insurance | 438 (36.8%) | 751 (63.2%) |
| Real Estate, Rental & Leasing | 381 (76.8%) | 115 (23.2%) |
| Professional & Scientific | 454 (34.4%) | 867 (65.6%) |
| Enterprise Management | 0 (0.0%) | 0 (0.0%) |
| Administrative & Support | 852 (55.5%) | 683 (44.5%) |
| Educational Services | 719 (39.4%) | 1,107 (60.6%) |
| Health Care & Social Assistance | 670 (17.0%) | 3,267 (83.0%) |
| Arts, Entertainment & Recreation | 334 (59.5%) | 227 (40.5%) |
| Accommodation & Food Services | 844 (52.2%) | 772 (47.8%) |
| Public Administration | 373 (49.3%) | 383 (50.7%) |
| Total | 12,538 (50.7%) | 12,171 (49.3%) |
Education in North Lauderdale
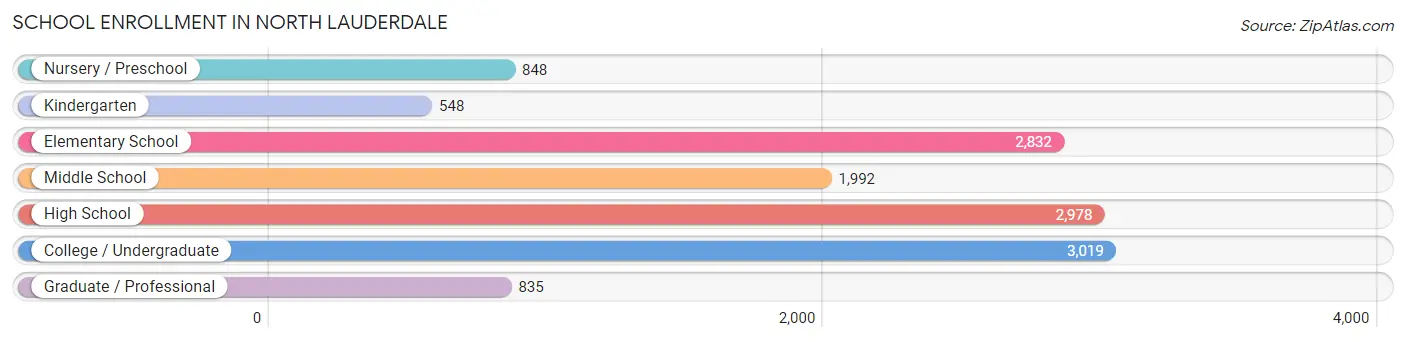
School Enrollment in North Lauderdale
The most common levels of schooling among the 13,052 students in North Lauderdale are college / undergraduate (3,019 | 23.1%), high school (2,978 | 22.8%), and elementary school (2,832 | 21.7%).
| School Level | # Students | % Students |
| Nursery / Preschool | 848 | 6.5% |
| Kindergarten | 548 | 4.2% |
| Elementary School | 2,832 | 21.7% |
| Middle School | 1,992 | 15.3% |
| High School | 2,978 | 22.8% |
| College / Undergraduate | 3,019 | 23.1% |
| Graduate / Professional | 835 | 6.4% |
| Total | 13,052 | 100.0% |
School Enrollment by Age by Funding Source in North Lauderdale
Out of a total of 13,052 students who are enrolled in schools in North Lauderdale, 1,501 (11.5%) attend a private institution, while the remaining 11,551 (88.5%) are enrolled in public schools. The age group of 35 years and over has the highest likelihood of being enrolled in private schools, with 356 (38.6% in the age bracket) enrolled. Conversely, the age group of 15 to 17 year olds has the lowest likelihood of being enrolled in a private school, with 2,119 (95.5% in the age bracket) attending a public institution.
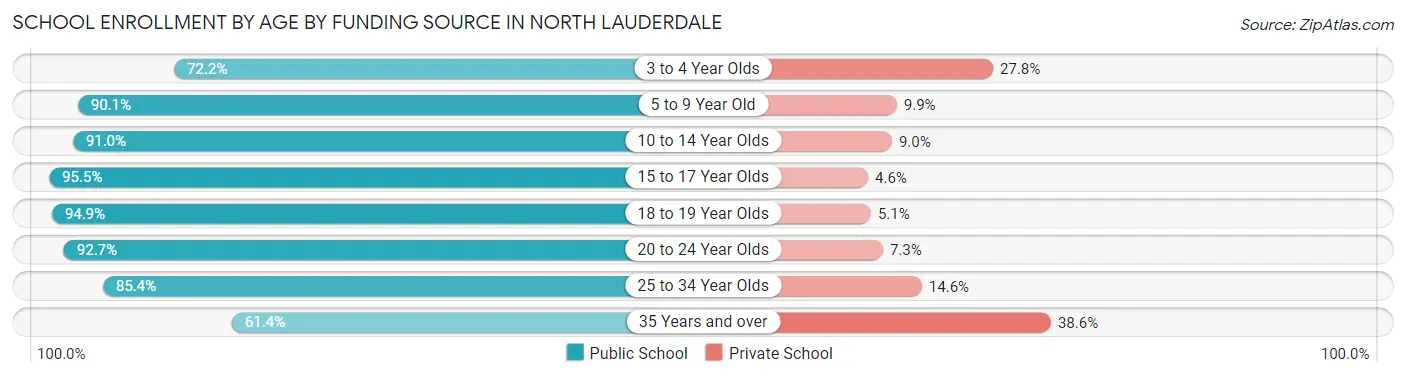
| Age Bracket | Public School | Private School |
| 3 to 4 Year Olds | 503 (72.2%) | 194 (27.8%) |
| 5 to 9 Year Old | 2,764 (90.1%) | 304 (9.9%) |
| 10 to 14 Year Olds | 2,460 (91.0%) | 243 (9.0%) |
| 15 to 17 Year Olds | 2,119 (95.5%) | 101 (4.5%) |
| 18 to 19 Year Olds | 896 (94.9%) | 48 (5.1%) |
| 20 to 24 Year Olds | 1,367 (92.7%) | 108 (7.3%) |
| 25 to 34 Year Olds | 874 (85.4%) | 149 (14.6%) |
| 35 Years and over | 566 (61.4%) | 356 (38.6%) |
| Total | 11,551 (88.5%) | 1,501 (11.5%) |
Educational Attainment by Field of Study in North Lauderdale
Business (1,060 | 17.4%), science & technology (921 | 15.1%), arts & humanities (915 | 15.0%), education (741 | 12.2%), and social sciences (429 | 7.0%) are the most common fields of study among 6,092 individuals in North Lauderdale who have obtained a bachelor's degree or higher.
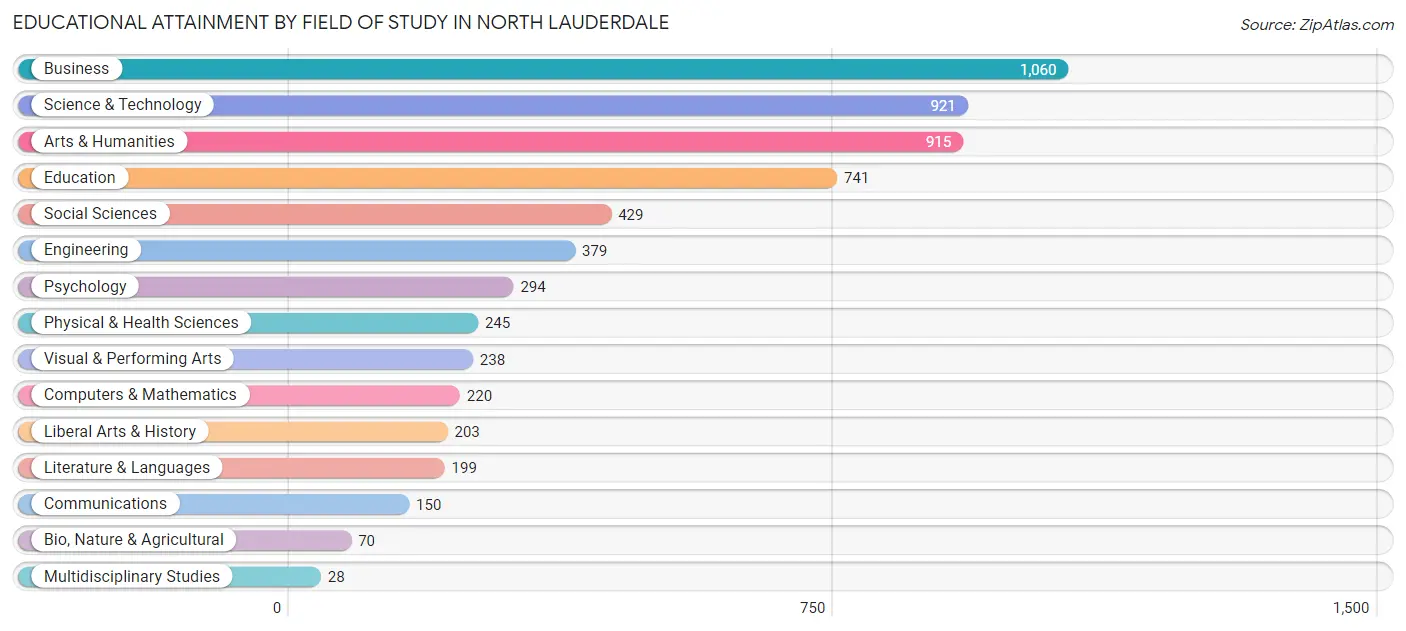
| Field of Study | # Graduates | % Graduates |
| Computers & Mathematics | 220 | 3.6% |
| Bio, Nature & Agricultural | 70 | 1.1% |
| Physical & Health Sciences | 245 | 4.0% |
| Psychology | 294 | 4.8% |
| Social Sciences | 429 | 7.0% |
| Engineering | 379 | 6.2% |
| Multidisciplinary Studies | 28 | 0.5% |
| Science & Technology | 921 | 15.1% |
| Business | 1,060 | 17.4% |
| Education | 741 | 12.2% |
| Literature & Languages | 199 | 3.3% |
| Liberal Arts & History | 203 | 3.3% |
| Visual & Performing Arts | 238 | 3.9% |
| Communications | 150 | 2.5% |
| Arts & Humanities | 915 | 15.0% |
| Total | 6,092 | 100.0% |
Transportation & Commute in North Lauderdale
Vehicle Availability by Sex in North Lauderdale
The most prevalent vehicle ownership categories in North Lauderdale are males with 2 vehicles (5,940, accounting for 47.7%) and females with 2 vehicles (4,478, making up 50.1%).
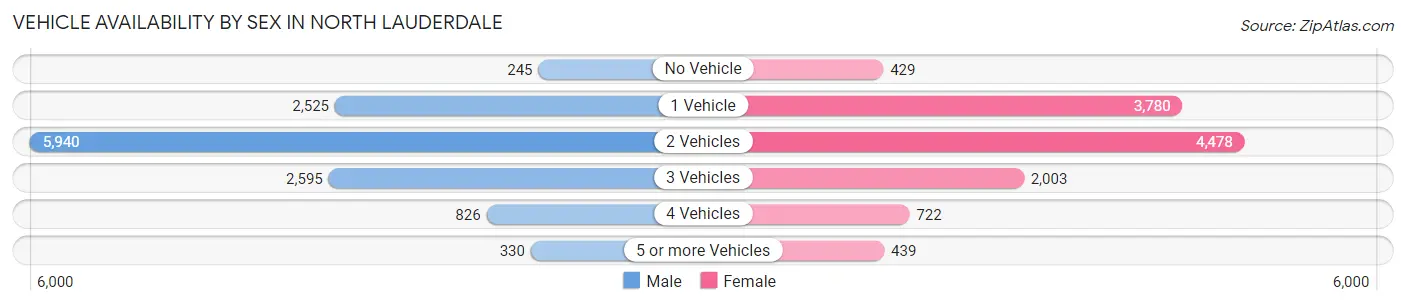
| Vehicles Available | Male | Female |
| No Vehicle | 245 (2.0%) | 429 (3.6%) |
| 1 Vehicle | 2,525 (20.3%) | 3,780 (31.9%) |
| 2 Vehicles | 5,940 (47.7%) | 4,478 (37.8%) |
| 3 Vehicles | 2,595 (20.8%) | 2,003 (16.9%) |
| 4 Vehicles | 826 (6.6%) | 722 (6.1%) |
| 5 or more Vehicles | 330 (2.6%) | 439 (3.7%) |
| Total | 12,461 (100.0%) | 11,851 (100.0%) |
Commute Time in North Lauderdale
The most frequently occuring commute durations in North Lauderdale are 30 to 34 minutes (5,677 commuters, 24.5%), 20 to 24 minutes (4,611 commuters, 19.9%), and 15 to 19 minutes (2,976 commuters, 12.8%).
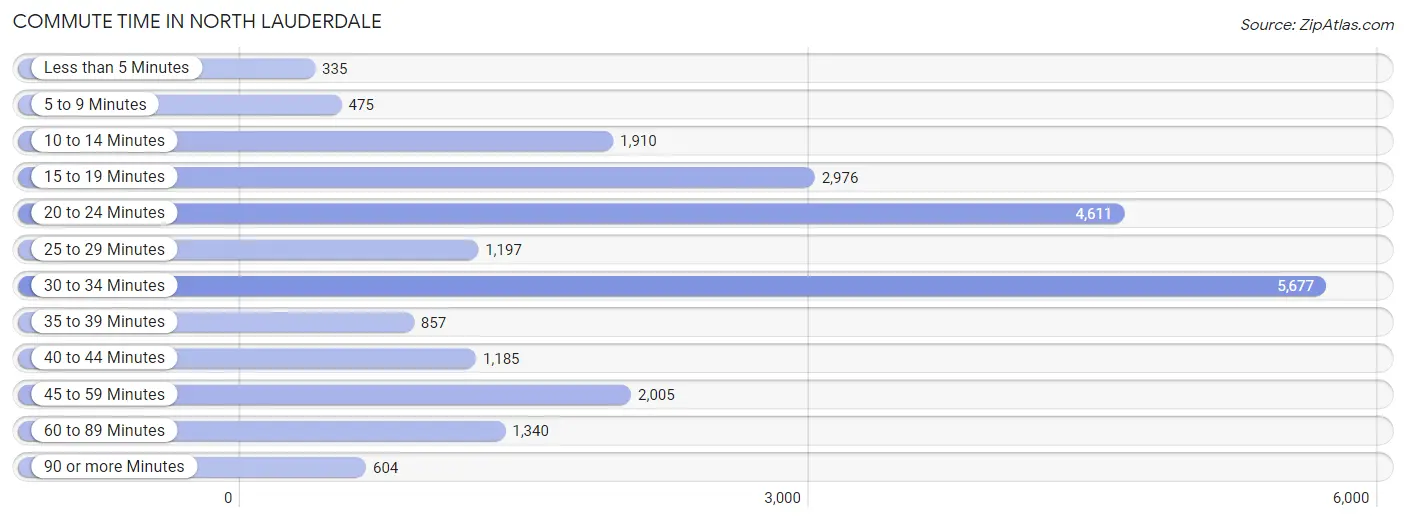
| Commute Time | # Commuters | % Commuters |
| Less than 5 Minutes | 335 | 1.5% |
| 5 to 9 Minutes | 475 | 2.1% |
| 10 to 14 Minutes | 1,910 | 8.2% |
| 15 to 19 Minutes | 2,976 | 12.8% |
| 20 to 24 Minutes | 4,611 | 19.9% |
| 25 to 29 Minutes | 1,197 | 5.2% |
| 30 to 34 Minutes | 5,677 | 24.5% |
| 35 to 39 Minutes | 857 | 3.7% |
| 40 to 44 Minutes | 1,185 | 5.1% |
| 45 to 59 Minutes | 2,005 | 8.6% |
| 60 to 89 Minutes | 1,340 | 5.8% |
| 90 or more Minutes | 604 | 2.6% |
Commute Time by Sex in North Lauderdale
The most common commute times in North Lauderdale are 20 to 24 minutes (2,720 commuters, 23.1%) for males and 30 to 34 minutes (2,993 commuters, 26.3%) for females.
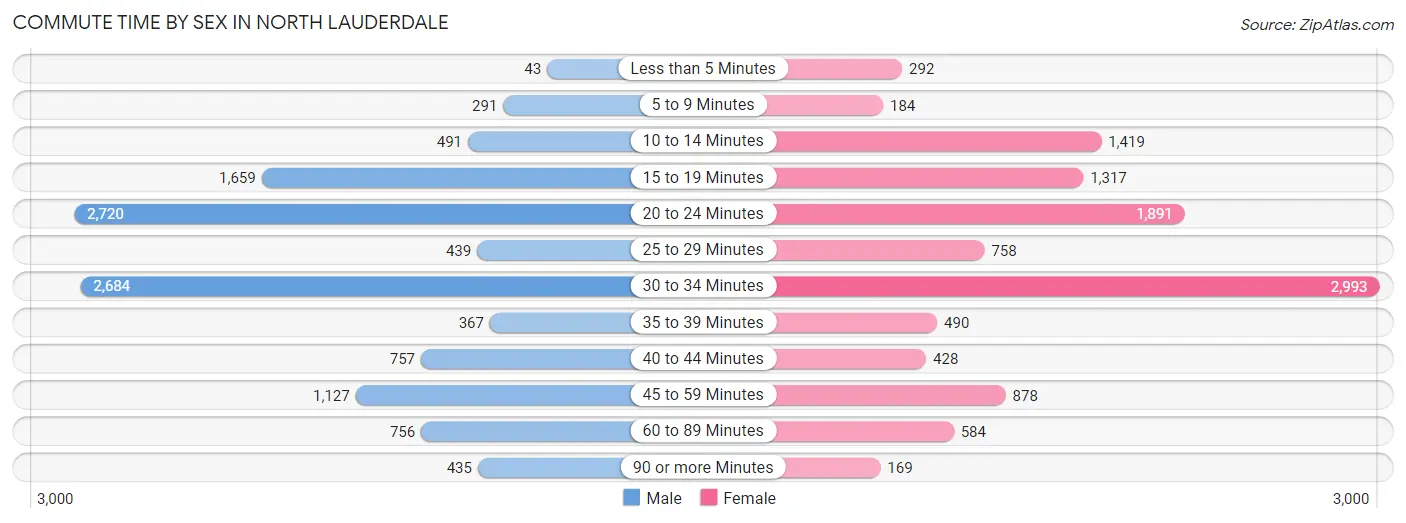
| Commute Time | Male | Female |
| Less than 5 Minutes | 43 (0.4%) | 292 (2.6%) |
| 5 to 9 Minutes | 291 (2.5%) | 184 (1.6%) |
| 10 to 14 Minutes | 491 (4.2%) | 1,419 (12.4%) |
| 15 to 19 Minutes | 1,659 (14.1%) | 1,317 (11.6%) |
| 20 to 24 Minutes | 2,720 (23.1%) | 1,891 (16.6%) |
| 25 to 29 Minutes | 439 (3.7%) | 758 (6.7%) |
| 30 to 34 Minutes | 2,684 (22.8%) | 2,993 (26.3%) |
| 35 to 39 Minutes | 367 (3.1%) | 490 (4.3%) |
| 40 to 44 Minutes | 757 (6.4%) | 428 (3.7%) |
| 45 to 59 Minutes | 1,127 (9.6%) | 878 (7.7%) |
| 60 to 89 Minutes | 756 (6.4%) | 584 (5.1%) |
| 90 or more Minutes | 435 (3.7%) | 169 (1.5%) |
Time of Departure to Work by Sex in North Lauderdale
The most frequent times of departure to work in North Lauderdale are 7:00 AM to 7:29 AM (1,729, 14.7%) for males and 8:00 AM to 8:29 AM (2,278, 20.0%) for females.
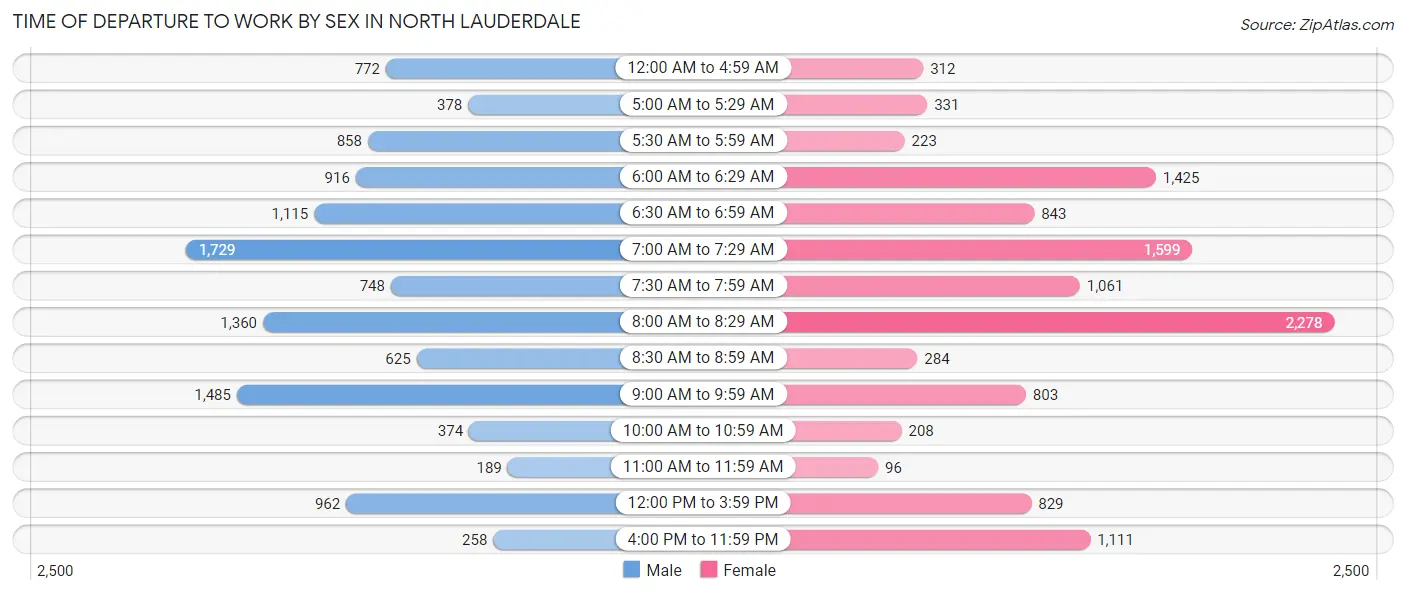
| Time of Departure | Male | Female |
| 12:00 AM to 4:59 AM | 772 (6.6%) | 312 (2.7%) |
| 5:00 AM to 5:29 AM | 378 (3.2%) | 331 (2.9%) |
| 5:30 AM to 5:59 AM | 858 (7.3%) | 223 (2.0%) |
| 6:00 AM to 6:29 AM | 916 (7.8%) | 1,425 (12.5%) |
| 6:30 AM to 6:59 AM | 1,115 (9.5%) | 843 (7.4%) |
| 7:00 AM to 7:29 AM | 1,729 (14.7%) | 1,599 (14.0%) |
| 7:30 AM to 7:59 AM | 748 (6.4%) | 1,061 (9.3%) |
| 8:00 AM to 8:29 AM | 1,360 (11.6%) | 2,278 (20.0%) |
| 8:30 AM to 8:59 AM | 625 (5.3%) | 284 (2.5%) |
| 9:00 AM to 9:59 AM | 1,485 (12.6%) | 803 (7.0%) |
| 10:00 AM to 10:59 AM | 374 (3.2%) | 208 (1.8%) |
| 11:00 AM to 11:59 AM | 189 (1.6%) | 96 (0.8%) |
| 12:00 PM to 3:59 PM | 962 (8.2%) | 829 (7.3%) |
| 4:00 PM to 11:59 PM | 258 (2.2%) | 1,111 (9.7%) |
| Total | 11,769 (100.0%) | 11,403 (100.0%) |
Housing Occupancy in North Lauderdale
Occupancy by Ownership in North Lauderdale
Of the total 15,394 dwellings in North Lauderdale, owner-occupied units account for 8,917 (57.9%), while renter-occupied units make up 6,477 (42.1%).
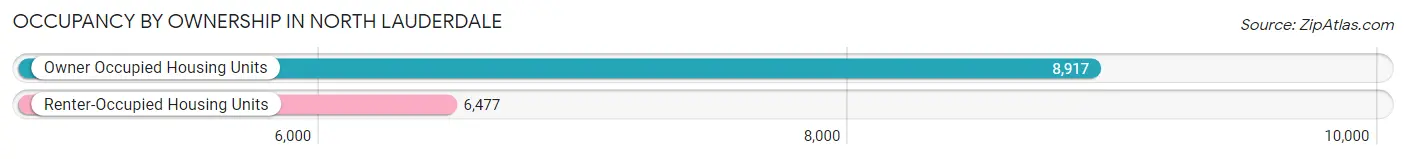
| Occupancy | # Housing Units | % Housing Units |
| Owner Occupied Housing Units | 8,917 | 57.9% |
| Renter-Occupied Housing Units | 6,477 | 42.1% |
| Total Occupied Housing Units | 15,394 | 100.0% |
Occupancy by Household Size in North Lauderdale
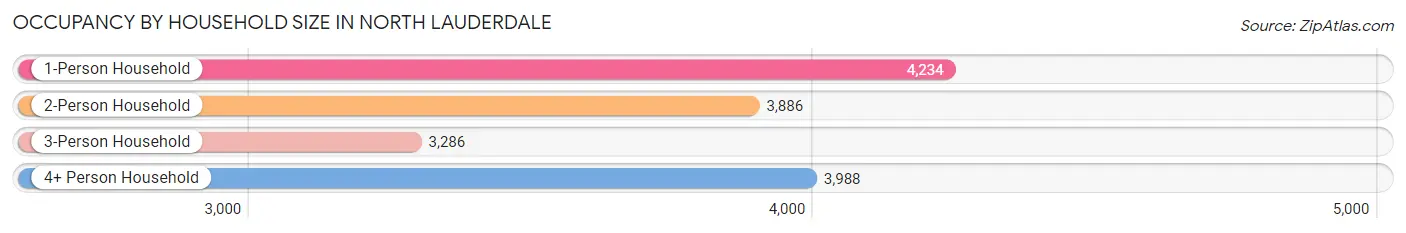
| Household Size | # Housing Units | % Housing Units |
| 1-Person Household | 4,234 | 27.5% |
| 2-Person Household | 3,886 | 25.2% |
| 3-Person Household | 3,286 | 21.3% |
| 4+ Person Household | 3,988 | 25.9% |
| Total Housing Units | 15,394 | 100.0% |
Occupancy by Ownership by Household Size in North Lauderdale
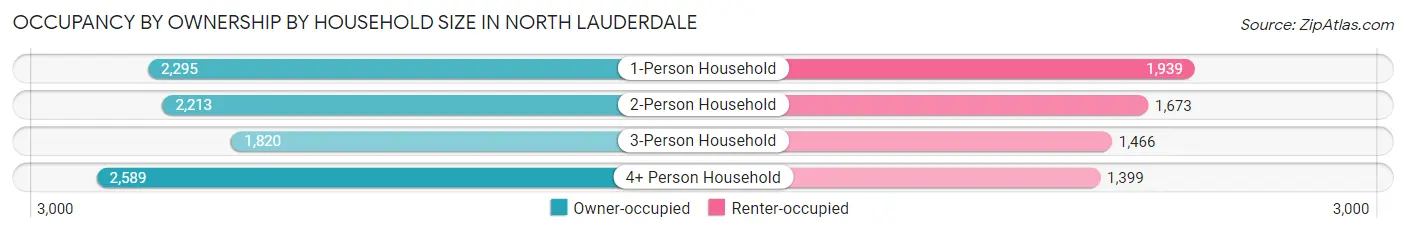
| Household Size | Owner-occupied | Renter-occupied |
| 1-Person Household | 2,295 (54.2%) | 1,939 (45.8%) |
| 2-Person Household | 2,213 (57.0%) | 1,673 (43.0%) |
| 3-Person Household | 1,820 (55.4%) | 1,466 (44.6%) |
| 4+ Person Household | 2,589 (64.9%) | 1,399 (35.1%) |
| Total Housing Units | 8,917 (57.9%) | 6,477 (42.1%) |
Occupancy by Educational Attainment in North Lauderdale
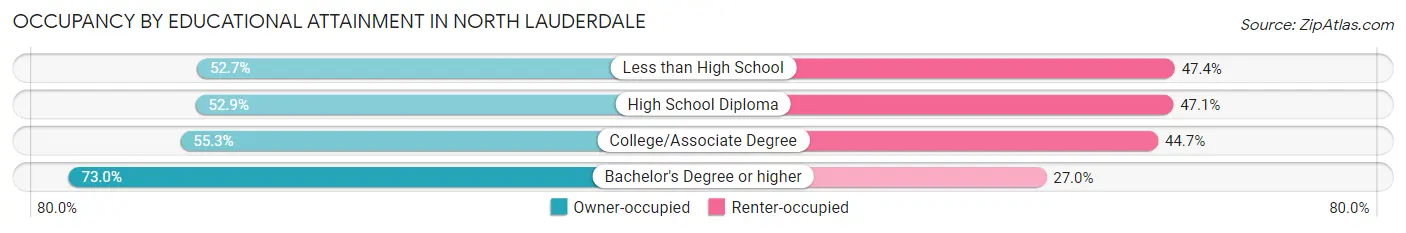
| Household Size | Owner-occupied | Renter-occupied |
| Less than High School | 1,224 (52.6%) | 1,101 (47.3%) |
| High School Diploma | 2,560 (52.9%) | 2,280 (47.1%) |
| College/Associate Degree | 2,732 (55.3%) | 2,209 (44.7%) |
| Bachelor's Degree or higher | 2,401 (73.0%) | 887 (27.0%) |
Occupancy by Age of Householder in North Lauderdale
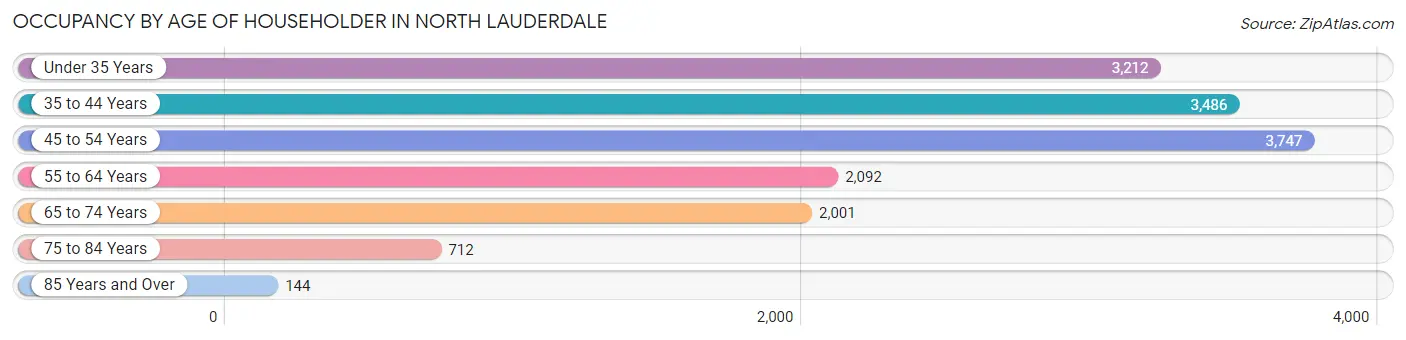
| Age Bracket | # Households | % Households |
| Under 35 Years | 3,212 | 20.9% |
| 35 to 44 Years | 3,486 | 22.7% |
| 45 to 54 Years | 3,747 | 24.3% |
| 55 to 64 Years | 2,092 | 13.6% |
| 65 to 74 Years | 2,001 | 13.0% |
| 75 to 84 Years | 712 | 4.6% |
| 85 Years and Over | 144 | 0.9% |
| Total | 15,394 | 100.0% |
Housing Finances in North Lauderdale
Median Income by Occupancy in North Lauderdale
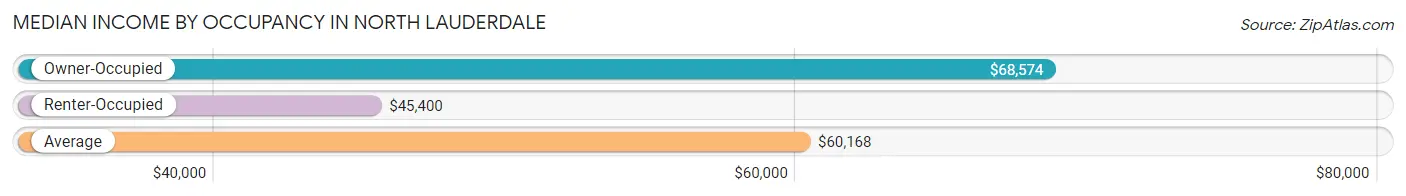
| Occupancy Type | # Households | Median Income |
| Owner-Occupied | 8,917 (57.9%) | $68,574 |
| Renter-Occupied | 6,477 (42.1%) | $45,400 |
| Average | 15,394 (100.0%) | $60,168 |
Occupancy by Householder Income Bracket in North Lauderdale
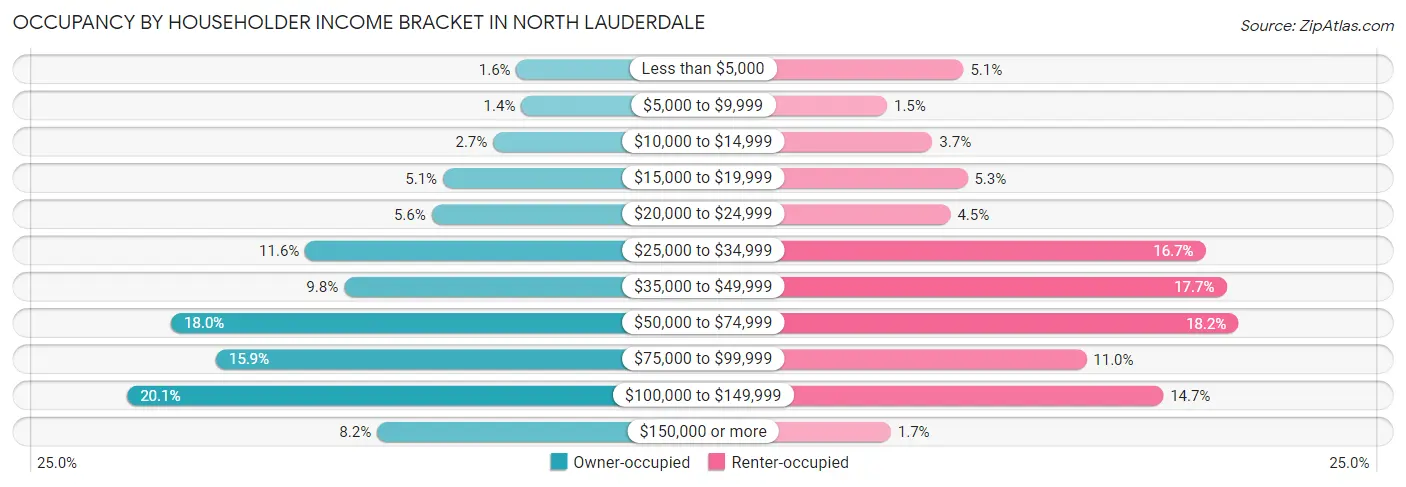
| Income Bracket | Owner-occupied | Renter-occupied |
| Less than $5,000 | 141 (1.6%) | 333 (5.1%) |
| $5,000 to $9,999 | 120 (1.3%) | 97 (1.5%) |
| $10,000 to $14,999 | 240 (2.7%) | 237 (3.7%) |
| $15,000 to $19,999 | 453 (5.1%) | 345 (5.3%) |
| $20,000 to $24,999 | 501 (5.6%) | 293 (4.5%) |
| $25,000 to $34,999 | 1,038 (11.6%) | 1,079 (16.7%) |
| $35,000 to $49,999 | 873 (9.8%) | 1,143 (17.6%) |
| $50,000 to $74,999 | 1,608 (18.0%) | 1,180 (18.2%) |
| $75,000 to $99,999 | 1,417 (15.9%) | 712 (11.0%) |
| $100,000 to $149,999 | 1,793 (20.1%) | 949 (14.6%) |
| $150,000 or more | 733 (8.2%) | 109 (1.7%) |
| Total | 8,917 (100.0%) | 6,477 (100.0%) |
Monthly Housing Cost Tiers in North Lauderdale
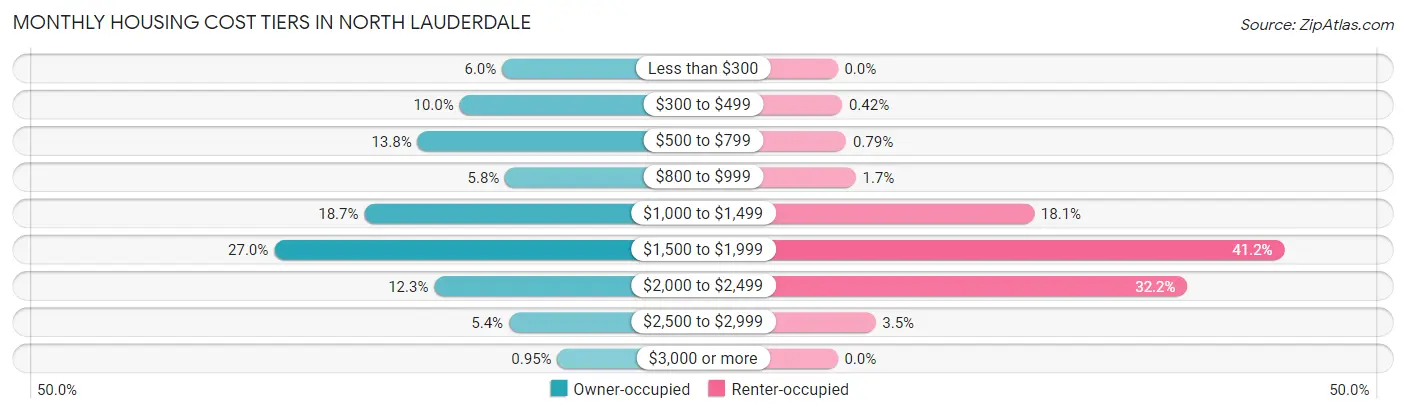
| Monthly Cost | Owner-occupied | Renter-occupied |
| Less than $300 | 539 (6.0%) | 0 (0.0%) |
| $300 to $499 | 888 (10.0%) | 27 (0.4%) |
| $500 to $799 | 1,233 (13.8%) | 51 (0.8%) |
| $800 to $999 | 514 (5.8%) | 108 (1.7%) |
| $1,000 to $1,499 | 1,670 (18.7%) | 1,172 (18.1%) |
| $1,500 to $1,999 | 2,410 (27.0%) | 2,665 (41.1%) |
| $2,000 to $2,499 | 1,096 (12.3%) | 2,086 (32.2%) |
| $2,500 to $2,999 | 482 (5.4%) | 226 (3.5%) |
| $3,000 or more | 85 (0.9%) | 0 (0.0%) |
| Total | 8,917 (100.0%) | 6,477 (100.0%) |
Physical Housing Characteristics in North Lauderdale
Housing Structures in North Lauderdale
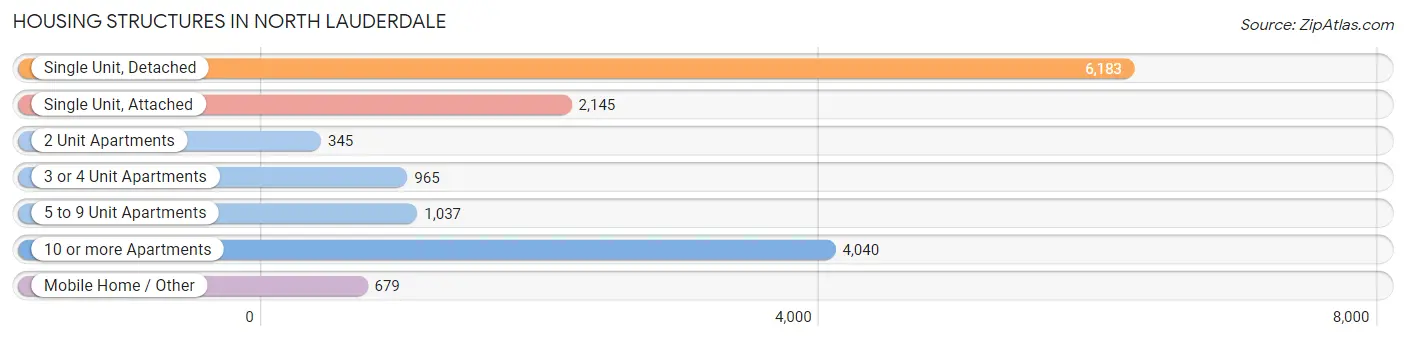
| Structure Type | # Housing Units | % Housing Units |
| Single Unit, Detached | 6,183 | 40.2% |
| Single Unit, Attached | 2,145 | 13.9% |
| 2 Unit Apartments | 345 | 2.2% |
| 3 or 4 Unit Apartments | 965 | 6.3% |
| 5 to 9 Unit Apartments | 1,037 | 6.7% |
| 10 or more Apartments | 4,040 | 26.2% |
| Mobile Home / Other | 679 | 4.4% |
| Total | 15,394 | 100.0% |
Housing Structures by Occupancy in North Lauderdale
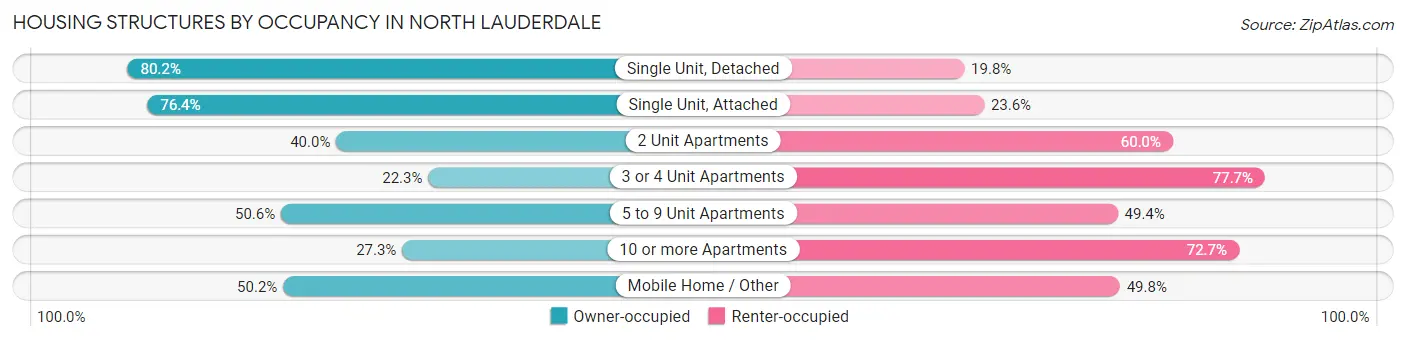
| Structure Type | Owner-occupied | Renter-occupied |
| Single Unit, Detached | 4,957 (80.2%) | 1,226 (19.8%) |
| Single Unit, Attached | 1,638 (76.4%) | 507 (23.6%) |
| 2 Unit Apartments | 138 (40.0%) | 207 (60.0%) |
| 3 or 4 Unit Apartments | 215 (22.3%) | 750 (77.7%) |
| 5 to 9 Unit Apartments | 525 (50.6%) | 512 (49.4%) |
| 10 or more Apartments | 1,103 (27.3%) | 2,937 (72.7%) |
| Mobile Home / Other | 341 (50.2%) | 338 (49.8%) |
| Total | 8,917 (57.9%) | 6,477 (42.1%) |
Housing Structures by Number of Rooms in North Lauderdale
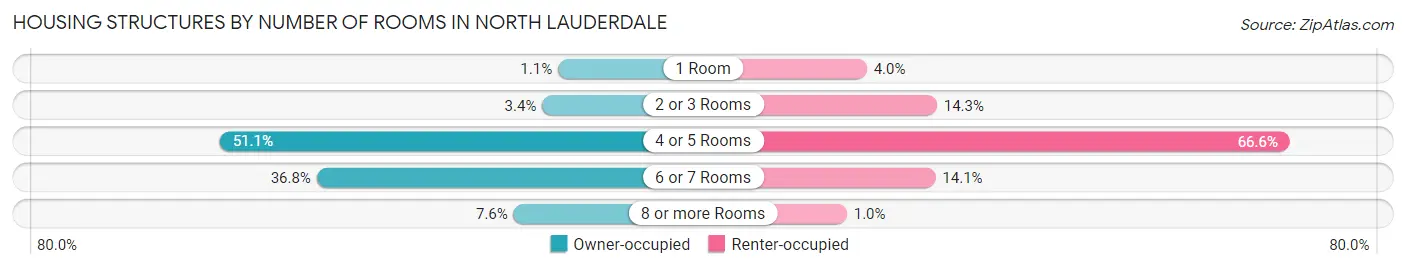
| Number of Rooms | Owner-occupied | Renter-occupied |
| 1 Room | 95 (1.1%) | 257 (4.0%) |
| 2 or 3 Rooms | 303 (3.4%) | 928 (14.3%) |
| 4 or 5 Rooms | 4,558 (51.1%) | 4,311 (66.6%) |
| 6 or 7 Rooms | 3,280 (36.8%) | 915 (14.1%) |
| 8 or more Rooms | 681 (7.6%) | 66 (1.0%) |
| Total | 8,917 (100.0%) | 6,477 (100.0%) |
Housing Structure by Heating Type in North Lauderdale
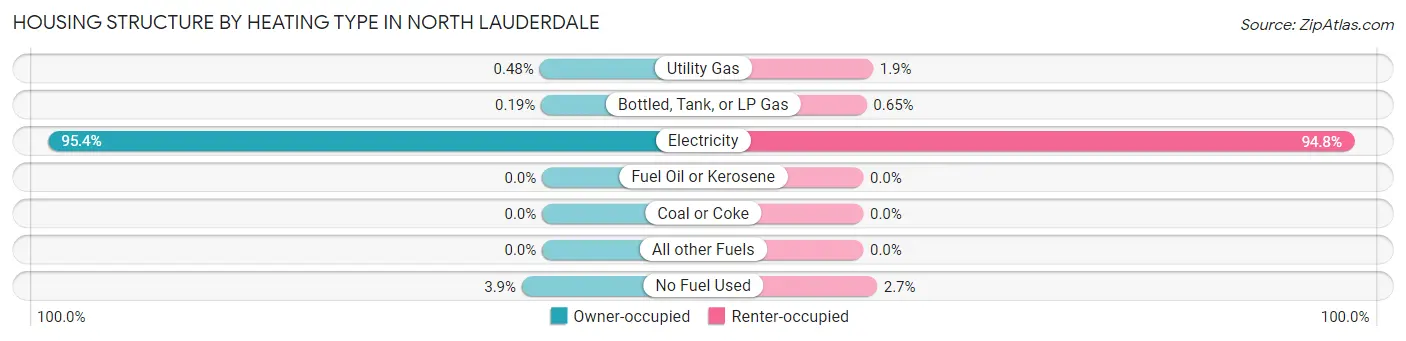
| Heating Type | Owner-occupied | Renter-occupied |
| Utility Gas | 43 (0.5%) | 122 (1.9%) |
| Bottled, Tank, or LP Gas | 17 (0.2%) | 42 (0.6%) |
| Electricity | 8,508 (95.4%) | 6,141 (94.8%) |
| Fuel Oil or Kerosene | 0 (0.0%) | 0 (0.0%) |
| Coal or Coke | 0 (0.0%) | 0 (0.0%) |
| All other Fuels | 0 (0.0%) | 0 (0.0%) |
| No Fuel Used | 349 (3.9%) | 172 (2.7%) |
| Total | 8,917 (100.0%) | 6,477 (100.0%) |
Household Vehicle Usage in North Lauderdale
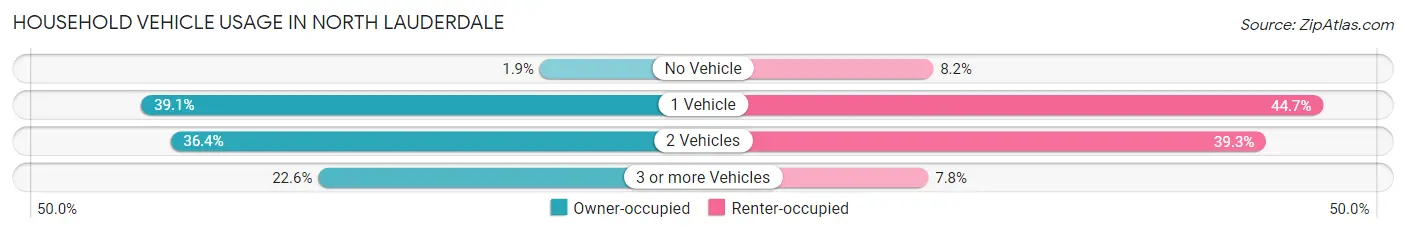
| Vehicles per Household | Owner-occupied | Renter-occupied |
| No Vehicle | 169 (1.9%) | 534 (8.2%) |
| 1 Vehicle | 3,488 (39.1%) | 2,892 (44.7%) |
| 2 Vehicles | 3,246 (36.4%) | 2,547 (39.3%) |
| 3 or more Vehicles | 2,014 (22.6%) | 504 (7.8%) |
| Total | 8,917 (100.0%) | 6,477 (100.0%) |
Real Estate & Mortgages in North Lauderdale
Real Estate and Mortgage Overview in North Lauderdale
| Characteristic | Without Mortgage | With Mortgage |
| Housing Units | 2,962 | 5,955 |
| Median Property Value | $201,200 | $245,500 |
| Median Household Income | $42,943 | $578 |
| Monthly Housing Costs | $530 | $85 |
| Real Estate Taxes | $1,368 | $633 |
Property Value by Mortgage Status in North Lauderdale
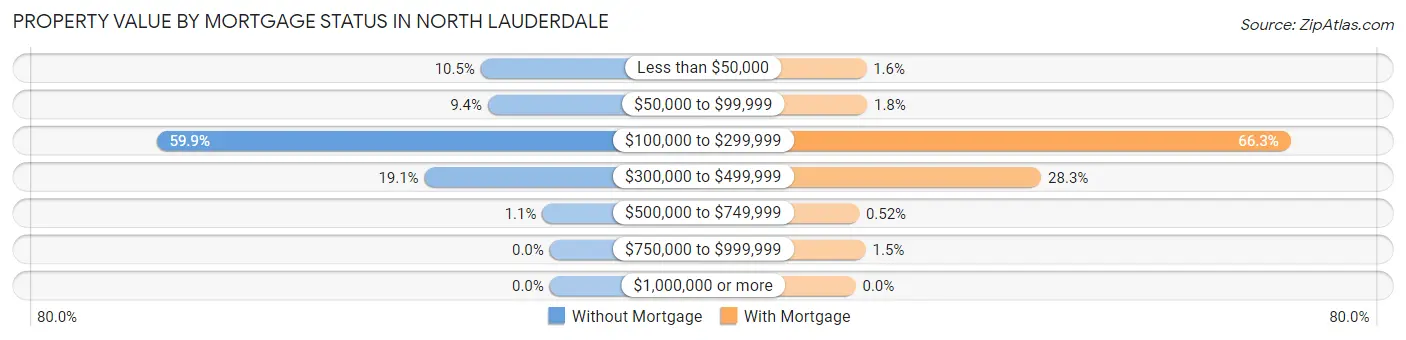
| Property Value | Without Mortgage | With Mortgage |
| Less than $50,000 | 311 (10.5%) | 97 (1.6%) |
| $50,000 to $99,999 | 279 (9.4%) | 104 (1.8%) |
| $100,000 to $299,999 | 1,774 (59.9%) | 3,948 (66.3%) |
| $300,000 to $499,999 | 565 (19.1%) | 1,684 (28.3%) |
| $500,000 to $749,999 | 33 (1.1%) | 31 (0.5%) |
| $750,000 to $999,999 | 0 (0.0%) | 91 (1.5%) |
| $1,000,000 or more | 0 (0.0%) | 0 (0.0%) |
| Total | 2,962 (100.0%) | 5,955 (100.0%) |
Household Income by Mortgage Status in North Lauderdale
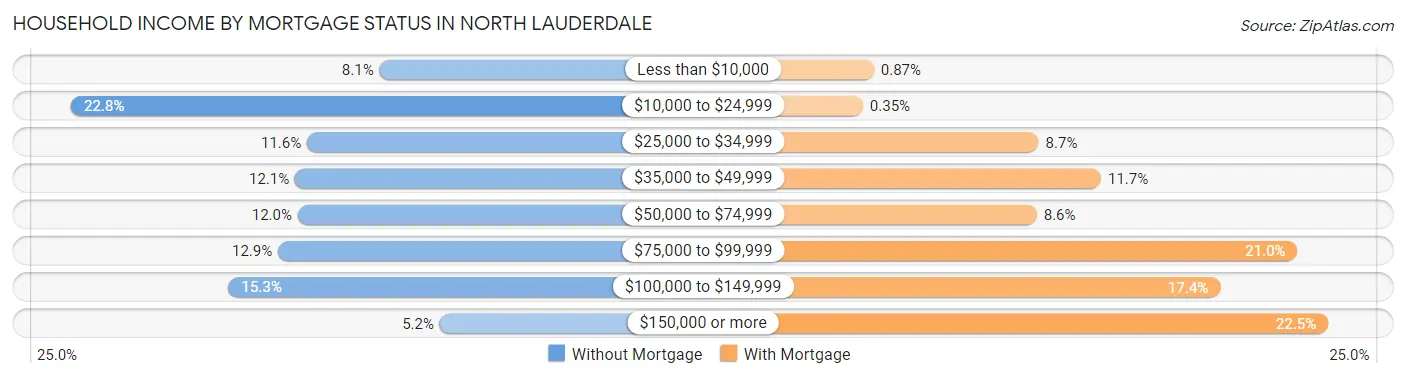
| Household Income | Without Mortgage | With Mortgage |
| Less than $10,000 | 240 (8.1%) | 52 (0.9%) |
| $10,000 to $24,999 | 675 (22.8%) | 21 (0.4%) |
| $25,000 to $34,999 | 342 (11.6%) | 519 (8.7%) |
| $35,000 to $49,999 | 359 (12.1%) | 696 (11.7%) |
| $50,000 to $74,999 | 355 (12.0%) | 514 (8.6%) |
| $75,000 to $99,999 | 383 (12.9%) | 1,253 (21.0%) |
| $100,000 to $149,999 | 453 (15.3%) | 1,034 (17.4%) |
| $150,000 or more | 155 (5.2%) | 1,340 (22.5%) |
| Total | 2,962 (100.0%) | 5,955 (100.0%) |
Property Value to Household Income Ratio in North Lauderdale
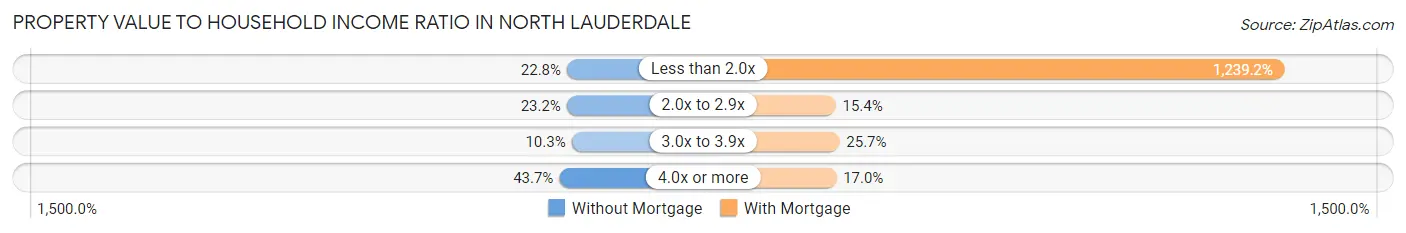
| Value-to-Income Ratio | Without Mortgage | With Mortgage |
| Less than 2.0x | 676 (22.8%) | 73,797 (1,239.2%) |
| 2.0x to 2.9x | 688 (23.2%) | 918 (15.4%) |
| 3.0x to 3.9x | 304 (10.3%) | 1,530 (25.7%) |
| 4.0x or more | 1,294 (43.7%) | 1,015 (17.0%) |
| Total | 2,962 (100.0%) | 5,955 (100.0%) |
Real Estate Taxes by Mortgage Status in North Lauderdale
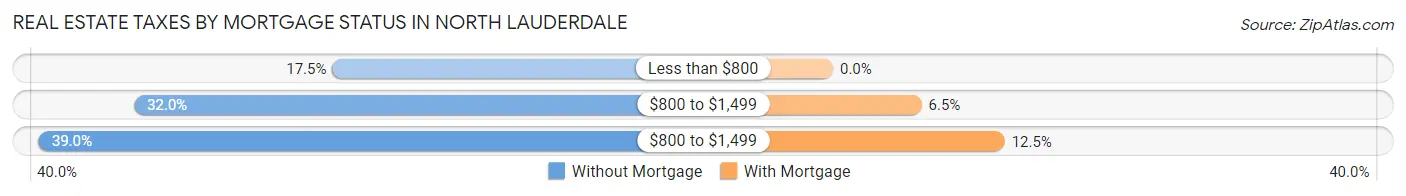
| Property Taxes | Without Mortgage | With Mortgage |
| Less than $800 | 519 (17.5%) | 0 (0.0%) |
| $800 to $1,499 | 948 (32.0%) | 385 (6.5%) |
| $800 to $1,499 | 1,154 (39.0%) | 747 (12.5%) |
| Total | 2,962 (100.0%) | 5,955 (100.0%) |
Health & Disability in North Lauderdale
Health Insurance Coverage by Age in North Lauderdale
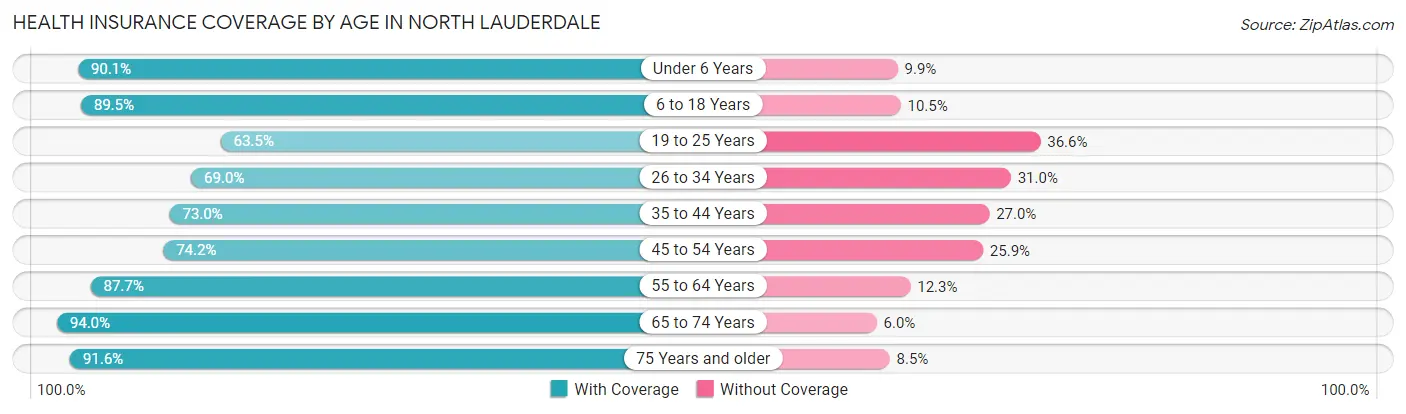
| Age Bracket | With Coverage | Without Coverage |
| Under 6 Years | 2,455 (90.1%) | 271 (9.9%) |
| 6 to 18 Years | 7,774 (89.5%) | 911 (10.5%) |
| 19 to 25 Years | 2,807 (63.4%) | 1,617 (36.5%) |
| 26 to 34 Years | 4,055 (69.0%) | 1,825 (31.0%) |
| 35 to 44 Years | 4,958 (73.0%) | 1,836 (27.0%) |
| 45 to 54 Years | 5,022 (74.2%) | 1,751 (25.9%) |
| 55 to 64 Years | 3,937 (87.7%) | 552 (12.3%) |
| 65 to 74 Years | 3,061 (94.0%) | 196 (6.0%) |
| 75 Years and older | 1,452 (91.5%) | 134 (8.5%) |
| Total | 35,521 (79.6%) | 9,093 (20.4%) |
Health Insurance Coverage by Citizenship Status in North Lauderdale

| Citizenship Status | With Coverage | Without Coverage |
| Native Born | 2,455 (90.1%) | 271 (9.9%) |
| Foreign Born, Citizen | 7,774 (89.5%) | 911 (10.5%) |
| Foreign Born, not a Citizen | 2,807 (63.4%) | 1,617 (36.5%) |
Health Insurance Coverage by Household Income in North Lauderdale
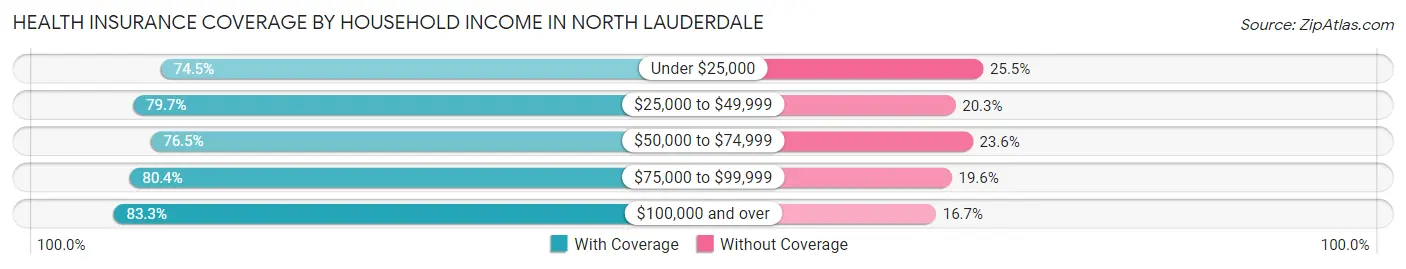
| Household Income | With Coverage | Without Coverage |
| Under $25,000 | 4,260 (74.5%) | 1,461 (25.5%) |
| $25,000 to $49,999 | 8,220 (79.7%) | 2,098 (20.3%) |
| $50,000 to $74,999 | 6,270 (76.4%) | 1,931 (23.5%) |
| $75,000 to $99,999 | 5,252 (80.4%) | 1,283 (19.6%) |
| $100,000 and over | 11,486 (83.3%) | 2,297 (16.7%) |
Public vs Private Health Insurance Coverage by Age in North Lauderdale
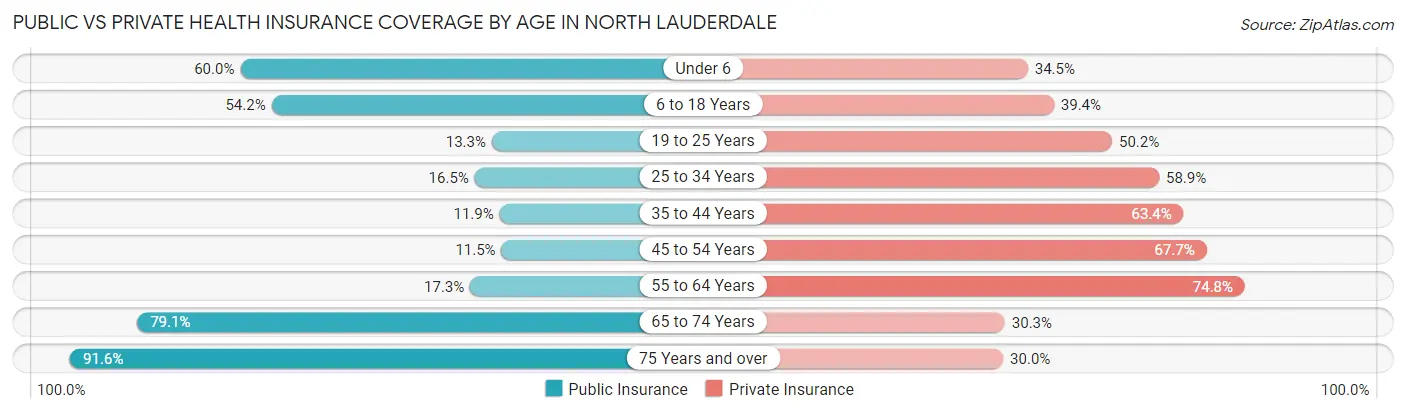
| Age Bracket | Public Insurance | Private Insurance |
| Under 6 | 1,635 (60.0%) | 941 (34.5%) |
| 6 to 18 Years | 4,705 (54.2%) | 3,418 (39.4%) |
| 19 to 25 Years | 588 (13.3%) | 2,219 (50.2%) |
| 25 to 34 Years | 968 (16.5%) | 3,463 (58.9%) |
| 35 to 44 Years | 805 (11.8%) | 4,310 (63.4%) |
| 45 to 54 Years | 778 (11.5%) | 4,587 (67.7%) |
| 55 to 64 Years | 777 (17.3%) | 3,358 (74.8%) |
| 65 to 74 Years | 2,576 (79.1%) | 986 (30.3%) |
| 75 Years and over | 1,452 (91.5%) | 475 (29.9%) |
| Total | 14,284 (32.0%) | 23,757 (53.2%) |
Disability Status by Sex by Age in North Lauderdale
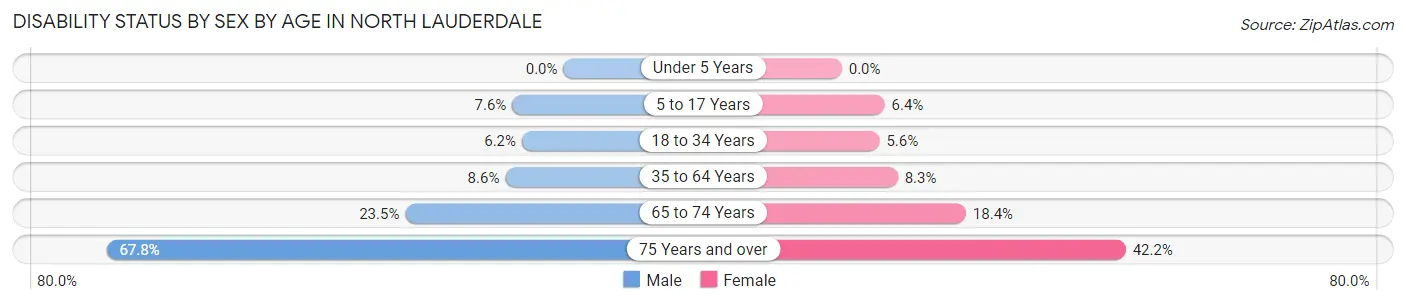
| Age Bracket | Male | Female |
| Under 5 Years | 0 (0.0%) | 0 (0.0%) |
| 5 to 17 Years | 310 (7.6%) | 260 (6.4%) |
| 18 to 34 Years | 319 (6.2%) | 340 (5.6%) |
| 35 to 64 Years | 742 (8.6%) | 785 (8.3%) |
| 65 to 74 Years | 324 (23.5%) | 346 (18.4%) |
| 75 Years and over | 384 (67.8%) | 430 (42.2%) |
Disability Class by Sex by Age in North Lauderdale
Disability Class: Hearing Difficulty
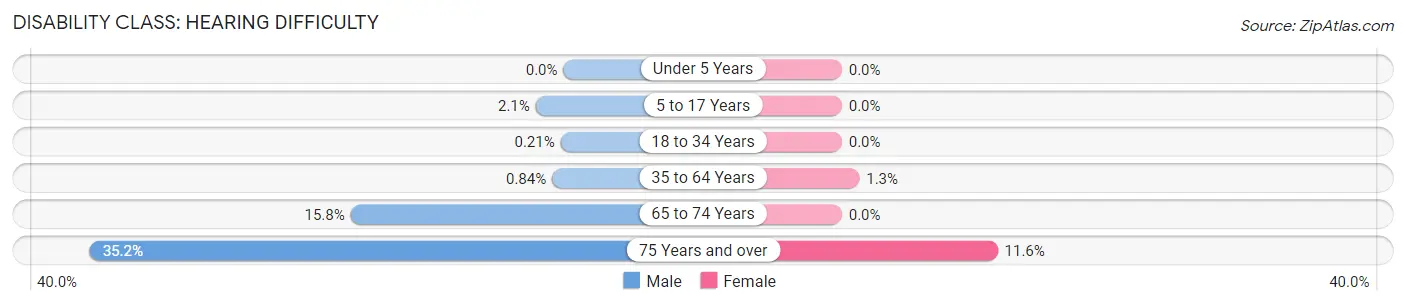
| Age Bracket | Male | Female |
| Under 5 Years | 0 (0.0%) | 0 (0.0%) |
| 5 to 17 Years | 84 (2.1%) | 0 (0.0%) |
| 18 to 34 Years | 11 (0.2%) | 0 (0.0%) |
| 35 to 64 Years | 72 (0.8%) | 123 (1.3%) |
| 65 to 74 Years | 218 (15.8%) | 0 (0.0%) |
| 75 Years and over | 199 (35.2%) | 118 (11.6%) |
Disability Class: Vision Difficulty
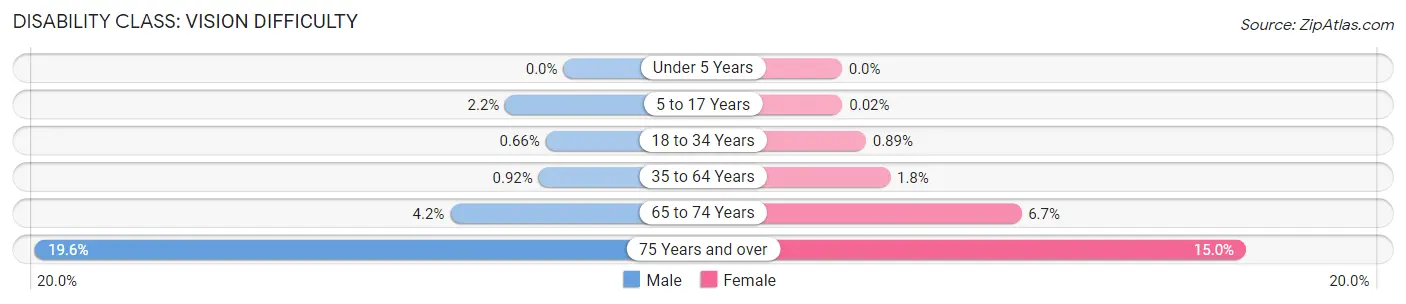
| Age Bracket | Male | Female |
| Under 5 Years | 0 (0.0%) | 0 (0.0%) |
| 5 to 17 Years | 88 (2.2%) | 1 (0.0%) |
| 18 to 34 Years | 34 (0.7%) | 54 (0.9%) |
| 35 to 64 Years | 79 (0.9%) | 169 (1.8%) |
| 65 to 74 Years | 58 (4.2%) | 125 (6.7%) |
| 75 Years and over | 111 (19.6%) | 153 (15.0%) |
Disability Class: Cognitive Difficulty
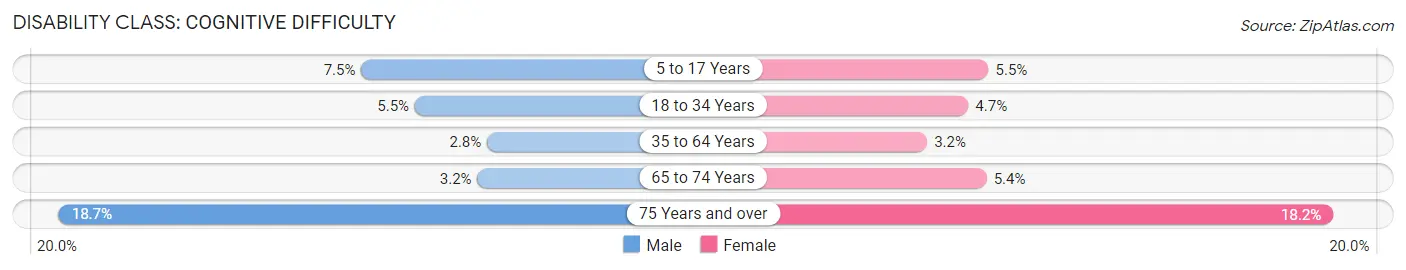
| Age Bracket | Male | Female |
| 5 to 17 Years | 306 (7.5%) | 223 (5.4%) |
| 18 to 34 Years | 285 (5.5%) | 286 (4.7%) |
| 35 to 64 Years | 243 (2.8%) | 300 (3.2%) |
| 65 to 74 Years | 44 (3.2%) | 101 (5.4%) |
| 75 Years and over | 106 (18.7%) | 186 (18.2%) |
Disability Class: Ambulatory Difficulty
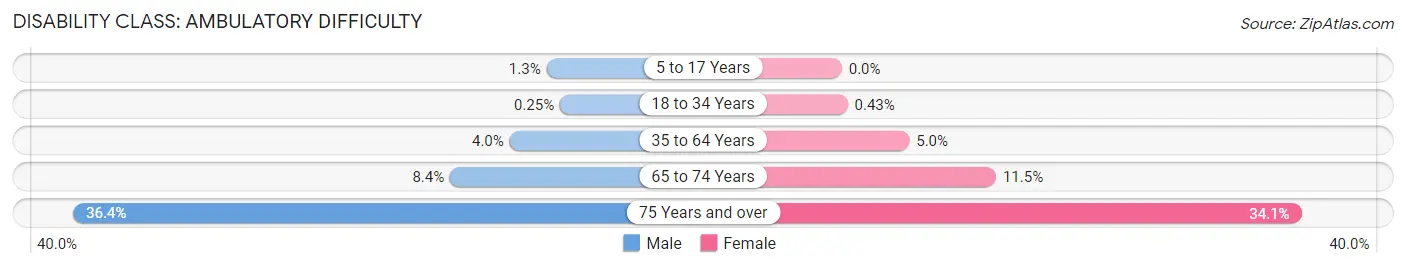
| Age Bracket | Male | Female |
| 5 to 17 Years | 51 (1.3%) | 0 (0.0%) |
| 18 to 34 Years | 13 (0.3%) | 26 (0.4%) |
| 35 to 64 Years | 343 (4.0%) | 474 (5.0%) |
| 65 to 74 Years | 116 (8.4%) | 215 (11.5%) |
| 75 Years and over | 206 (36.4%) | 348 (34.1%) |
Disability Class: Self-Care Difficulty
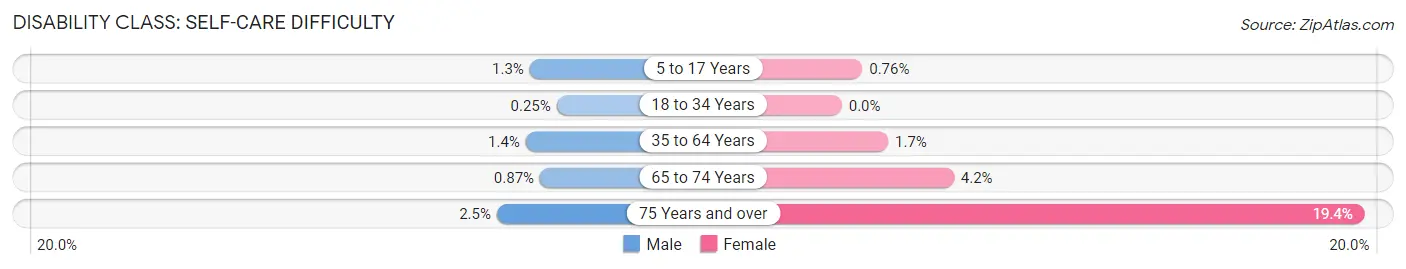
| Age Bracket | Male | Female |
| 5 to 17 Years | 51 (1.3%) | 31 (0.8%) |
| 18 to 34 Years | 13 (0.3%) | 0 (0.0%) |
| 35 to 64 Years | 120 (1.4%) | 163 (1.7%) |
| 65 to 74 Years | 12 (0.9%) | 78 (4.2%) |
| 75 Years and over | 14 (2.5%) | 198 (19.4%) |
Technology Access in North Lauderdale
Computing Device Access in North Lauderdale
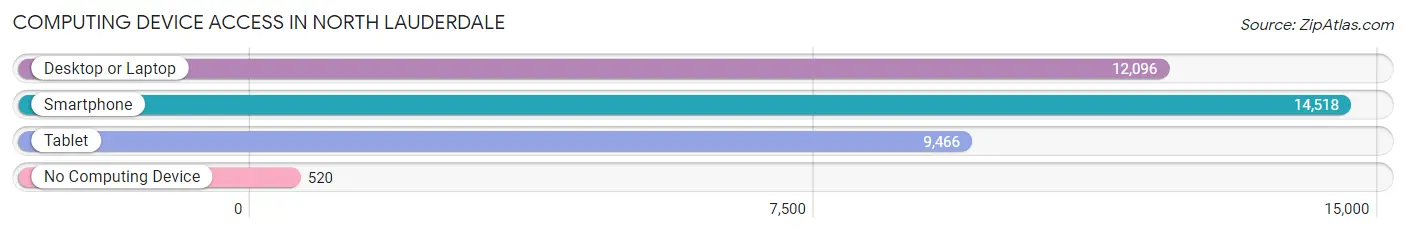
| Device Type | # Households | % Households |
| Desktop or Laptop | 12,096 | 78.6% |
| Smartphone | 14,518 | 94.3% |
| Tablet | 9,466 | 61.5% |
| No Computing Device | 520 | 3.4% |
| Total | 15,394 | 100.0% |
Internet Access in North Lauderdale
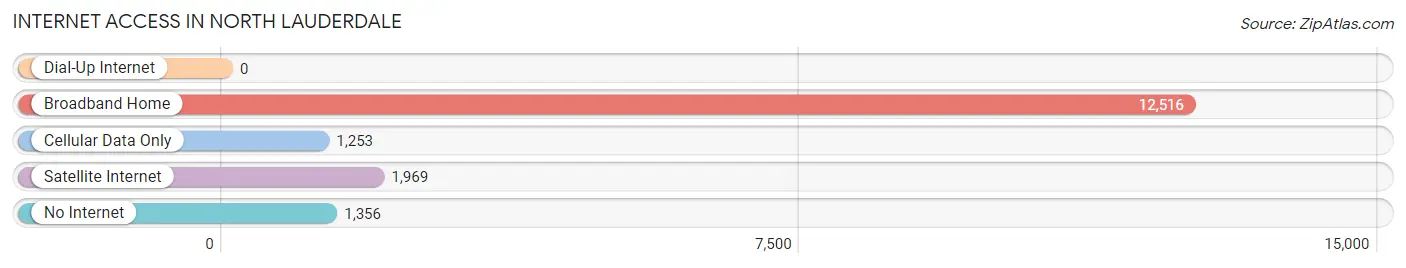
| Internet Type | # Households | % Households |
| Dial-Up Internet | 0 | 0.0% |
| Broadband Home | 12,516 | 81.3% |
| Cellular Data Only | 1,253 | 8.1% |
| Satellite Internet | 1,969 | 12.8% |
| No Internet | 1,356 | 8.8% |
| Total | 15,394 | 100.0% |
North Lauderdale Summary
History
North Lauderdale is a city located in Broward County, Florida. It is part of the Miami metropolitan area and is located just north of Fort Lauderdale. The city was incorporated in 1963 and has a population of approximately 43,000 people.
North Lauderdale was originally part of the Everglades, and the area was first settled by Native Americans. The Seminole Indians were the first to inhabit the area, and they were followed by the Miccosukee tribe. The area was then settled by European settlers in the late 19th century. The first settlers were farmers who grew citrus and vegetables.
In the early 20th century, the area was developed as a residential community. The city was incorporated in 1963 and was named after the nearby North Lauderdale Canal. The city has grown steadily since then and is now home to a diverse population.
Geography
North Lauderdale is located in Broward County, Florida. It is part of the Miami metropolitan area and is located just north of Fort Lauderdale. The city is bordered by Tamarac to the north, Coconut Creek to the east, Margate to the south, and Lauderhill to the west.
The city has a total area of 4.2 square miles, of which 4.1 square miles is land and 0.1 square miles is water. The city is located on the Atlantic Coastal Ridge, which is a series of low hills that run along the eastern coast of Florida. The city is also located near the Everglades, which is a large wetland area.
The climate in North Lauderdale is classified as a tropical monsoon climate. The city experiences hot and humid summers and mild winters. The average temperature in the summer is around 90 degrees Fahrenheit, and the average temperature in the winter is around 70 degrees Fahrenheit.
Economy
North Lauderdale has a diverse economy that is driven by a variety of industries. The city is home to a number of corporate headquarters, including AutoNation, JM Family Enterprises, and JM Lexus. The city is also home to a number of retail stores, restaurants, and other businesses.
The city is also home to a number of manufacturing and distribution companies, including the North Lauderdale Industrial Park. The city is also home to a number of healthcare facilities, including the North Lauderdale Medical Center.
Demographics
North Lauderdale has a population of approximately 43,000 people. The city has a diverse population, with a variety of ethnic and racial backgrounds. The largest racial group in the city is African American, making up approximately 44% of the population. The second largest racial group is White, making up approximately 33% of the population. Other racial groups include Hispanic or Latino (14%), Asian (4%), and other (5%).
The median household income in North Lauderdale is $45,000, and the median home value is $175,000. The city has a poverty rate of 16%, which is higher than the national average. The city also has a high rate of unemployment, with an unemployment rate of 8%.
Common Questions
What is Per Capita Income in North Lauderdale?
Per Capita income in North Lauderdale is $25,124.
What is the Median Family Income in North Lauderdale?
Median Family Income in North Lauderdale is $63,072.
What is the Median Household income in North Lauderdale?
Median Household Income in North Lauderdale is $60,168.
What is Income or Wage Gap in North Lauderdale?
Income or Wage Gap in North Lauderdale is 12.1%.
Women in North Lauderdale earn 87.9 cents for every dollar earned by a man.
What is Family Income Deficit in North Lauderdale?
Family Income Deficit in North Lauderdale is $10,479.
Families that are below poverty line in North Lauderdale earn $10,479 less on average than the poverty threshold level.
What is Inequality or Gini Index in North Lauderdale?
Inequality or Gini Index in North Lauderdale is 0.38.
What is the Total Population of North Lauderdale?
Total Population of North Lauderdale is 44,635.
What is the Total Male Population of North Lauderdale?
Total Male Population of North Lauderdale is 21,171.
What is the Total Female Population of North Lauderdale?
Total Female Population of North Lauderdale is 23,464.
What is the Ratio of Males per 100 Females in North Lauderdale?
There are 90.23 Males per 100 Females in North Lauderdale.
What is the Ratio of Females per 100 Males in North Lauderdale?
There are 110.83 Females per 100 Males in North Lauderdale.
What is the Median Population Age in North Lauderdale?
Median Population Age in North Lauderdale is 35.9 Years.
What is the Average Family Size in North Lauderdale
Average Family Size in North Lauderdale is 3.5 People.
What is the Average Household Size in North Lauderdale
Average Household Size in North Lauderdale is 2.9 People.
How Large is the Labor Force in North Lauderdale?
There are 26,362 People in the Labor Forcein in North Lauderdale.
What is the Percentage of People in the Labor Force in North Lauderdale?
74.2% of People are in the Labor Force in North Lauderdale.
What is the Unemployment Rate in North Lauderdale?
Unemployment Rate in North Lauderdale is 6.2%.