Lake Park, FL Map & Demographics
Lake Park Map
Lake Park Overview
$28,920
PER CAPITA INCOME
$63,662
AVG FAMILY INCOME
$54,741
AVG HOUSEHOLD INCOME
39.9%
WAGE / INCOME GAP [ % ]
60.1¢/ $1
WAGE / INCOME GAP [ $ ]
$8,390
FAMILY INCOME DEFICIT
0.41
INEQUALITY / GINI INDEX
8,996
TOTAL POPULATION
4,201
MALE POPULATION
4,795
FEMALE POPULATION
87.61
MALES / 100 FEMALES
114.14
FEMALES / 100 MALES
37.4
MEDIAN AGE
3.5
AVG FAMILY SIZE
2.7
AVG HOUSEHOLD SIZE
4,598
LABOR FORCE [ PEOPLE ]
63.0%
PERCENT IN LABOR FORCE
9.4%
UNEMPLOYMENT RATE
Lake Park Area Codes
Income in Lake Park
Income Overview in Lake Park
Per Capita Income in Lake Park is $28,920, while median incomes of families and households are $63,662 and $54,741 respectively.
| Characteristic | Number | Measure |
| Per Capita Income | 8,996 | $28,920 |
| Median Family Income | 2,036 | $63,662 |
| Mean Family Income | 2,036 | $84,631 |
| Median Household Income | 3,341 | $54,741 |
| Mean Household Income | 3,341 | $75,299 |
| Income Deficit | 2,036 | $8,390 |
| Wage / Income Gap (%) | 8,996 | 39.91% |
| Wage / Income Gap ($) | 8,996 | 60.09¢ per $1 |
| Gini / Inequality Index | 8,996 | 0.41 |
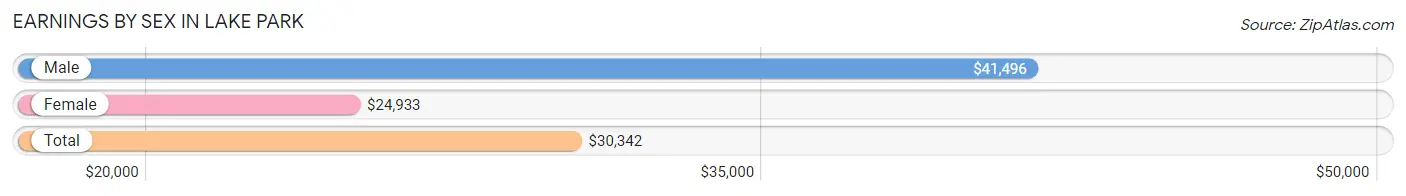
Earnings by Sex in Lake Park
Average Earnings in Lake Park are $30,342, $41,496 for men and $24,933 for women, a difference of 39.9%.
| Sex | Number | Average Earnings |
| Male | 2,387 (49.5%) | $41,496 |
| Female | 2,430 (50.4%) | $24,933 |
| Total | 4,817 (100.0%) | $30,342 |
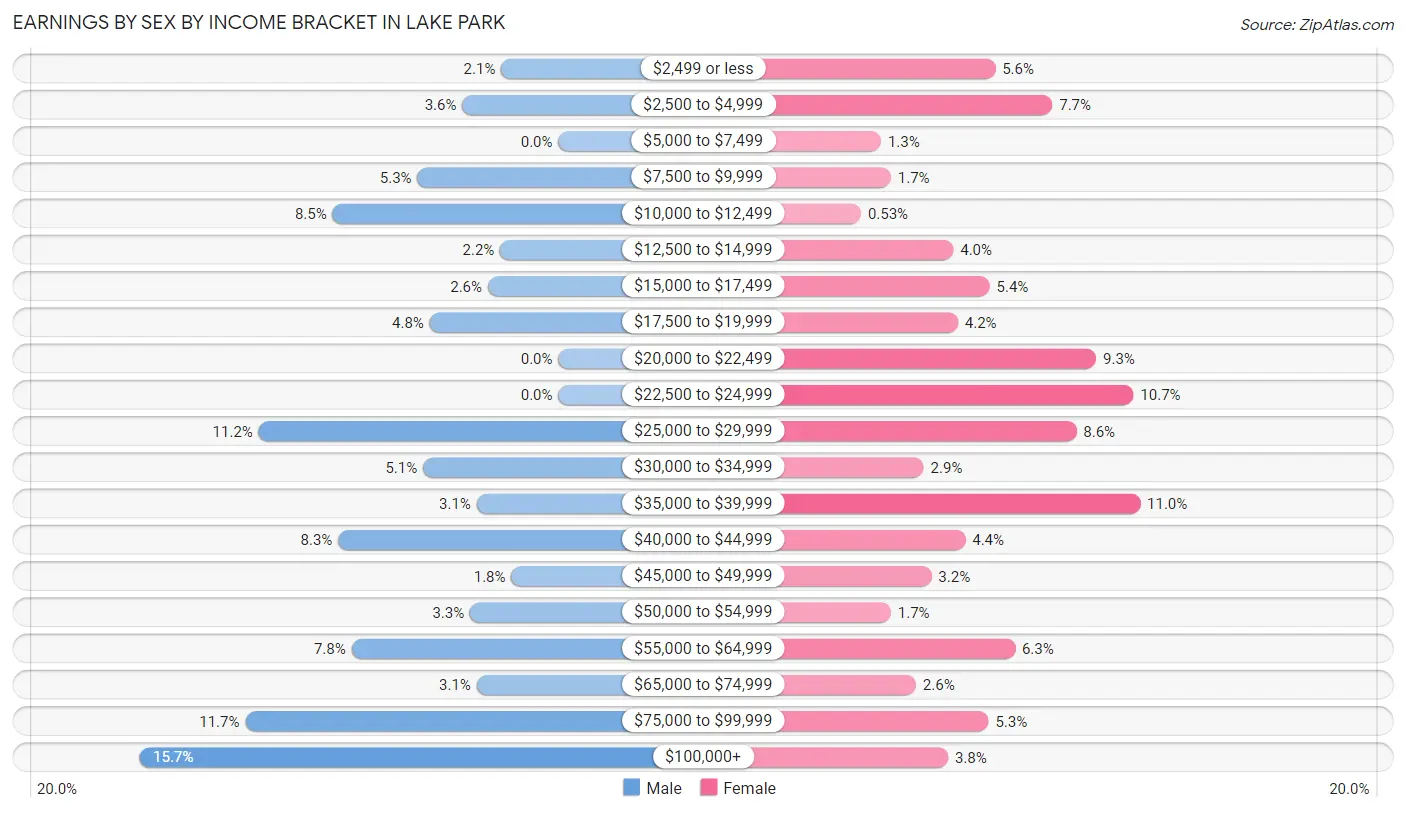
Earnings by Sex by Income Bracket in Lake Park
The most common earnings brackets in Lake Park are $100,000+ for men (374 | 15.7%) and $35,000 to $39,999 for women (267 | 11.0%).
| Income | Male | Female |
| $2,499 or less | 51 (2.1%) | 135 (5.6%) |
| $2,500 to $4,999 | 86 (3.6%) | 187 (7.7%) |
| $5,000 to $7,499 | 0 (0.0%) | 31 (1.3%) |
| $7,500 to $9,999 | 126 (5.3%) | 40 (1.7%) |
| $10,000 to $12,499 | 202 (8.5%) | 13 (0.5%) |
| $12,500 to $14,999 | 52 (2.2%) | 97 (4.0%) |
| $15,000 to $17,499 | 63 (2.6%) | 130 (5.3%) |
| $17,500 to $19,999 | 115 (4.8%) | 101 (4.2%) |
| $20,000 to $22,499 | 0 (0.0%) | 227 (9.3%) |
| $22,500 to $24,999 | 0 (0.0%) | 261 (10.7%) |
| $25,000 to $29,999 | 268 (11.2%) | 209 (8.6%) |
| $30,000 to $34,999 | 121 (5.1%) | 70 (2.9%) |
| $35,000 to $39,999 | 73 (3.1%) | 267 (11.0%) |
| $40,000 to $44,999 | 197 (8.3%) | 108 (4.4%) |
| $45,000 to $49,999 | 42 (1.8%) | 77 (3.2%) |
| $50,000 to $54,999 | 79 (3.3%) | 40 (1.7%) |
| $55,000 to $64,999 | 185 (7.7%) | 153 (6.3%) |
| $65,000 to $74,999 | 73 (3.1%) | 63 (2.6%) |
| $75,000 to $99,999 | 280 (11.7%) | 129 (5.3%) |
| $100,000+ | 374 (15.7%) | 92 (3.8%) |
| Total | 2,387 (100.0%) | 2,430 (100.0%) |
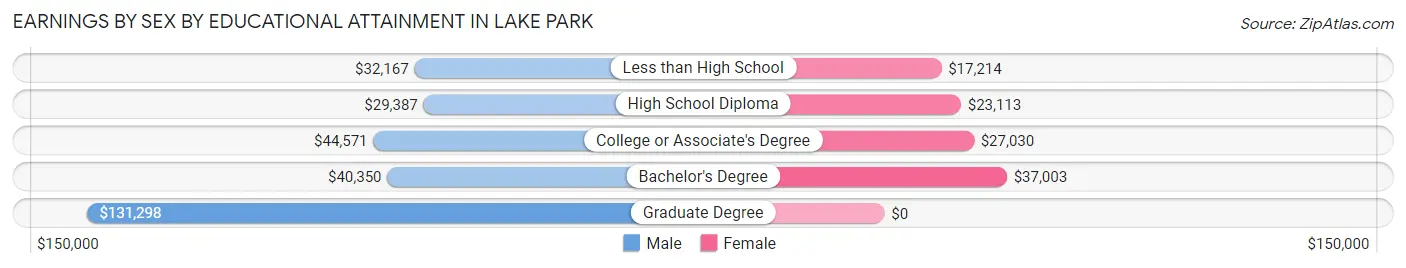
Earnings by Sex by Educational Attainment in Lake Park
Average earnings in Lake Park are $44,669 for men and $25,268 for women, a difference of 43.4%. Men with an educational attainment of graduate degree enjoy the highest average annual earnings of $131,298, while those with high school diploma education earn the least with $29,387. Women with an educational attainment of bachelor's degree earn the most with the average annual earnings of $37,003, while those with less than high school education have the smallest earnings of $17,214.
| Educational Attainment | Male Income | Female Income |
| Less than High School | $32,167 | $17,214 |
| High School Diploma | $29,387 | $23,113 |
| College or Associate's Degree | $44,571 | $27,030 |
| Bachelor's Degree | $40,350 | $37,003 |
| Graduate Degree | $131,298 | $0 |
| Total | $44,669 | $25,268 |
Family Income in Lake Park
Family Income Brackets in Lake Park
According to the Lake Park family income data, there are 478 families falling into the $35,000 to $49,999 income range, which is the most common income bracket and makes up 23.5% of all families. Conversely, the $10,000 to $14,999 income bracket is the least frequent group with only 39 families (1.9%) belonging to this category.
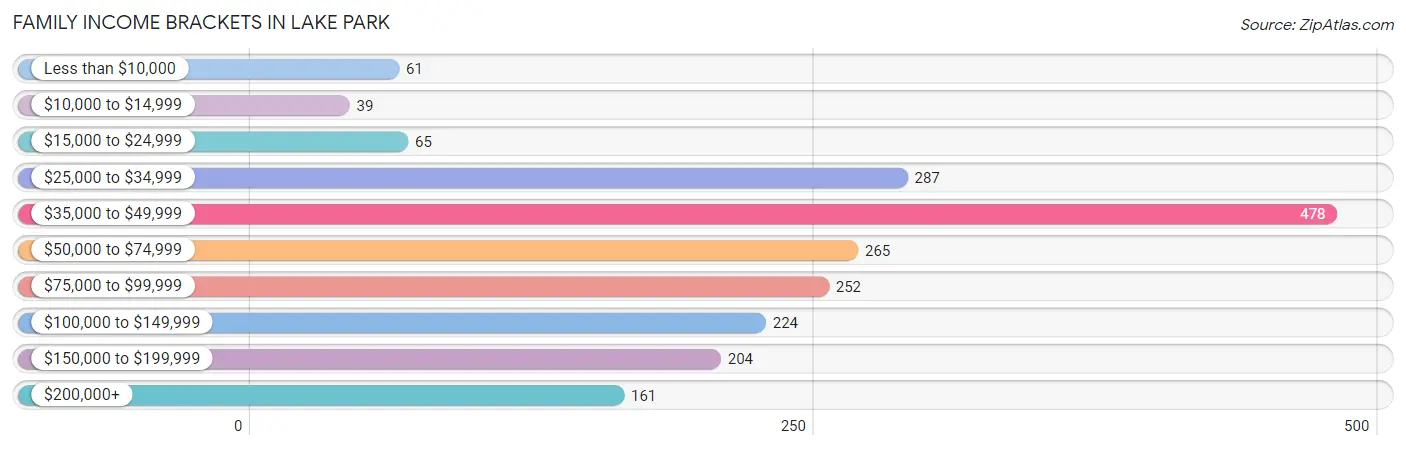
| Income Bracket | # Families | % Families |
| Less than $10,000 | 61 | 3.0% |
| $10,000 to $14,999 | 39 | 1.9% |
| $15,000 to $24,999 | 65 | 3.2% |
| $25,000 to $34,999 | 287 | 14.1% |
| $35,000 to $49,999 | 478 | 23.5% |
| $50,000 to $74,999 | 265 | 13.0% |
| $75,000 to $99,999 | 252 | 12.4% |
| $100,000 to $149,999 | 224 | 11.0% |
| $150,000 to $199,999 | 204 | 10.0% |
| $200,000+ | 161 | 7.9% |
Family Income by Famaliy Size in Lake Park
2-person families (756 | 37.1%) account for the highest median family income in Lake Park with $106,176 per family, while 2-person families (756 | 37.1%) have the highest median income of $53,088 per family member.
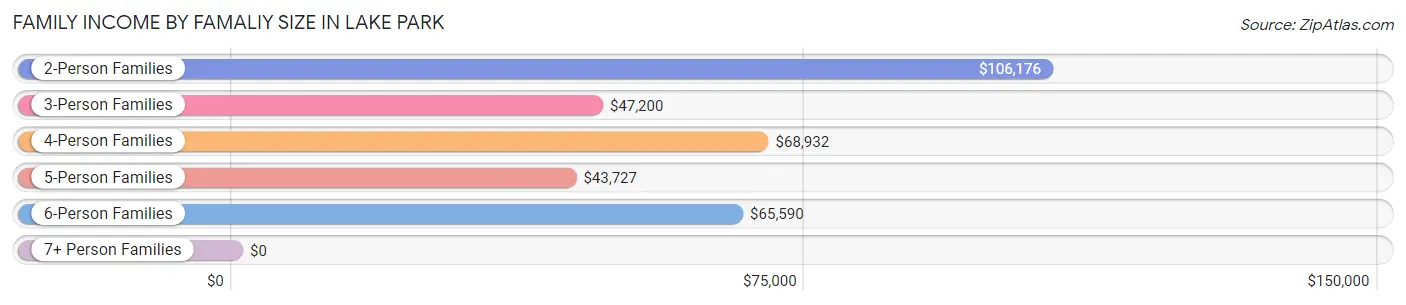
| Income Bracket | # Families | Median Income |
| 2-Person Families | 756 (37.1%) | $106,176 |
| 3-Person Families | 634 (31.1%) | $47,200 |
| 4-Person Families | 311 (15.3%) | $68,932 |
| 5-Person Families | 222 (10.9%) | $43,727 |
| 6-Person Families | 113 (5.6%) | $65,590 |
| 7+ Person Families | 0 (0.0%) | $0 |
| Total | 2,036 (100.0%) | $63,662 |
Family Income by Number of Earners in Lake Park
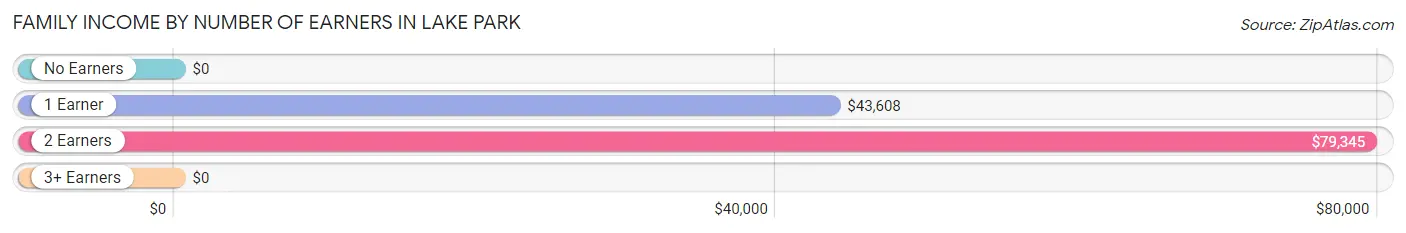
| Number of Earners | # Families | Median Income |
| No Earners | 82 (4.0%) | $0 |
| 1 Earner | 648 (31.8%) | $43,608 |
| 2 Earners | 1,253 (61.5%) | $79,345 |
| 3+ Earners | 53 (2.6%) | $0 |
| Total | 2,036 (100.0%) | $63,662 |
Household Income in Lake Park
Household Income Brackets in Lake Park
With 601 households falling in the category, the $25,000 to $34,999 income range is the most frequent in Lake Park, accounting for 18.0% of all households. In contrast, only 114 households (3.4%) fall into the less than $10,000 income bracket, making it the least populous group.
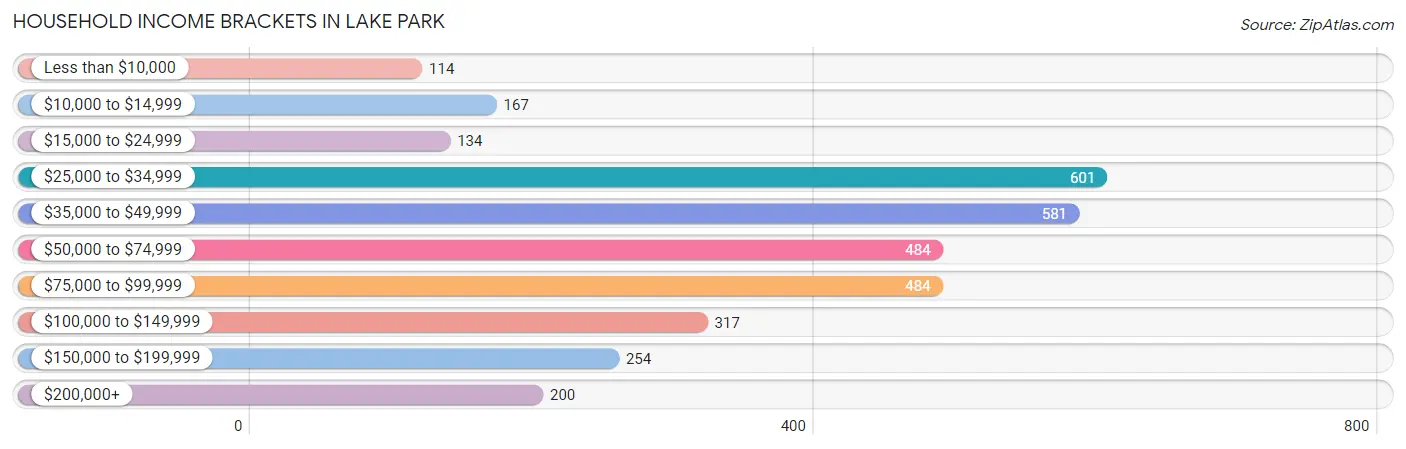
| Income Bracket | # Households | % Households |
| Less than $10,000 | 114 | 3.4% |
| $10,000 to $14,999 | 167 | 5.0% |
| $15,000 to $24,999 | 134 | 4.0% |
| $25,000 to $34,999 | 601 | 18.0% |
| $35,000 to $49,999 | 581 | 17.4% |
| $50,000 to $74,999 | 484 | 14.5% |
| $75,000 to $99,999 | 484 | 14.5% |
| $100,000 to $149,999 | 317 | 9.5% |
| $150,000 to $199,999 | 254 | 7.6% |
| $200,000+ | 200 | 6.0% |
Household Income by Householder Age in Lake Park
The median household income in Lake Park is $54,741, with the highest median household income of $68,271 found in the 45 to 64 years age bracket for the primary householder. A total of 1,223 households (36.6%) fall into this category. Meanwhile, the 15 to 24 years age bracket for the primary householder has the lowest median household income of $0, with 31 households (0.9%) in this group.
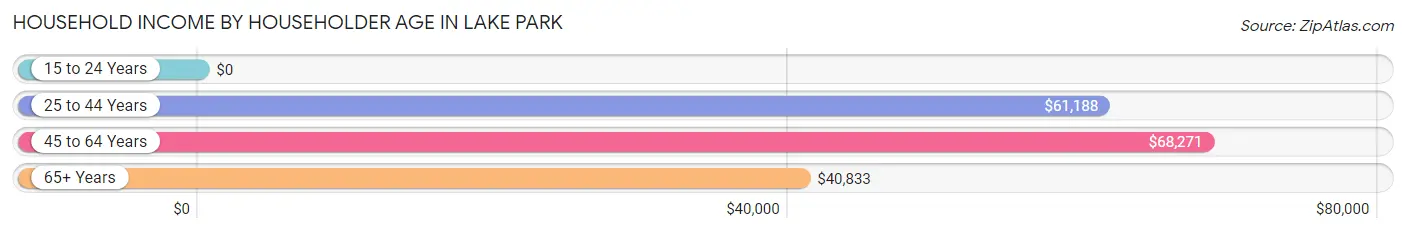
| Income Bracket | # Households | Median Income |
| 15 to 24 Years | 31 (0.9%) | $0 |
| 25 to 44 Years | 1,013 (30.3%) | $61,188 |
| 45 to 64 Years | 1,223 (36.6%) | $68,271 |
| 65+ Years | 1,074 (32.2%) | $40,833 |
| Total | 3,341 (100.0%) | $54,741 |
Poverty in Lake Park
Income Below Poverty by Sex and Age in Lake Park
With 10.0% poverty level for males and 20.4% for females among the residents of Lake Park, 6 to 11 year old males and 18 to 24 year old females are the most vulnerable to poverty, with 135 males (58.2%) and 96 females (86.5%) in their respective age groups living below the poverty level.
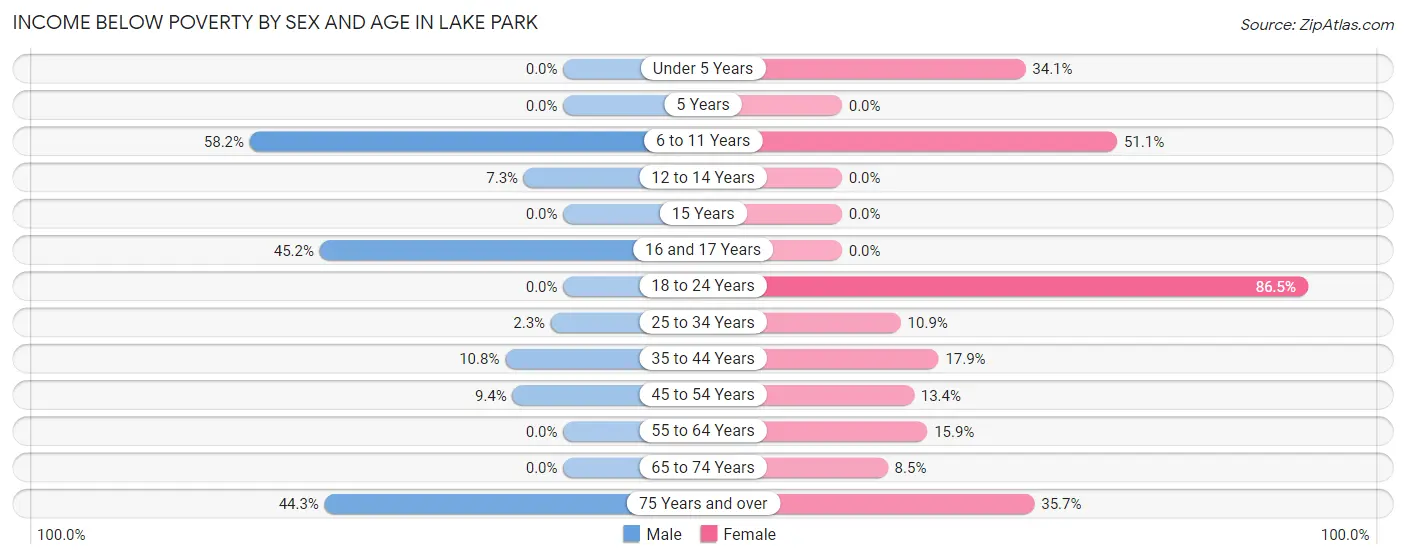
| Age Bracket | Male | Female |
| Under 5 Years | 0 (0.0%) | 108 (34.1%) |
| 5 Years | 0 (0.0%) | 0 (0.0%) |
| 6 to 11 Years | 135 (58.2%) | 165 (51.1%) |
| 12 to 14 Years | 15 (7.3%) | 0 (0.0%) |
| 15 Years | 0 (0.0%) | 0 (0.0%) |
| 16 and 17 Years | 85 (45.2%) | 0 (0.0%) |
| 18 to 24 Years | 0 (0.0%) | 96 (86.5%) |
| 25 to 34 Years | 11 (2.3%) | 101 (10.9%) |
| 35 to 44 Years | 67 (10.8%) | 153 (17.9%) |
| 45 to 54 Years | 68 (9.4%) | 62 (13.4%) |
| 55 to 64 Years | 0 (0.0%) | 65 (15.9%) |
| 65 to 74 Years | 0 (0.0%) | 41 (8.5%) |
| 75 Years and over | 35 (44.3%) | 179 (35.7%) |
| Total | 416 (10.0%) | 970 (20.4%) |
Income Above Poverty by Sex and Age in Lake Park
According to the poverty statistics in Lake Park, males aged under 5 years and females aged 5 years are the age groups that are most secure financially, with 100.0% of males and 100.0% of females in these age groups living above the poverty line.
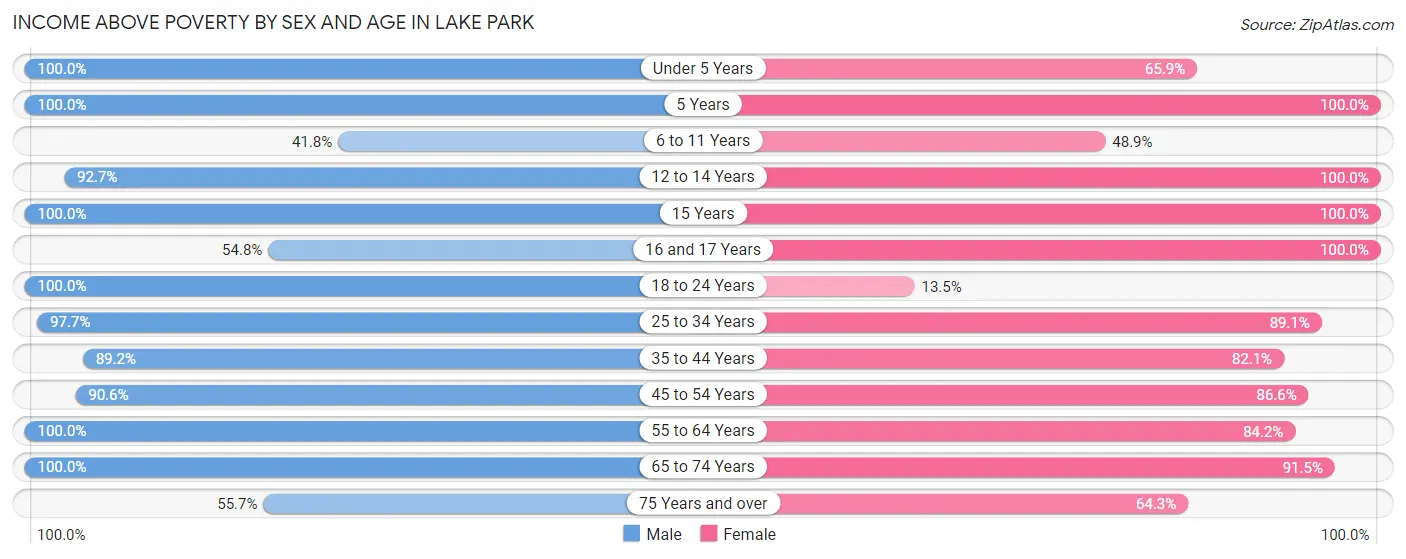
| Age Bracket | Male | Female |
| Under 5 Years | 353 (100.0%) | 209 (65.9%) |
| 5 Years | 30 (100.0%) | 119 (100.0%) |
| 6 to 11 Years | 97 (41.8%) | 158 (48.9%) |
| 12 to 14 Years | 190 (92.7%) | 37 (100.0%) |
| 15 Years | 32 (100.0%) | 50 (100.0%) |
| 16 and 17 Years | 103 (54.8%) | 163 (100.0%) |
| 18 to 24 Years | 449 (100.0%) | 15 (13.5%) |
| 25 to 34 Years | 465 (97.7%) | 823 (89.1%) |
| 35 to 44 Years | 554 (89.2%) | 700 (82.1%) |
| 45 to 54 Years | 654 (90.6%) | 402 (86.6%) |
| 55 to 64 Years | 336 (100.0%) | 345 (84.2%) |
| 65 to 74 Years | 454 (100.0%) | 441 (91.5%) |
| 75 Years and over | 44 (55.7%) | 322 (64.3%) |
| Total | 3,761 (90.0%) | 3,784 (79.6%) |
Income Below Poverty Among Married-Couple Families in Lake Park
The poverty statistics for married-couple families in Lake Park show that 6.3% or 75 of the total 1,196 families live below the poverty line. Families with 3 or 4 children have the highest poverty rate of 46.3%, comprising of 44 families. On the other hand, families with 1 or 2 children have the lowest poverty rate of 0.0%, which includes 0 families.
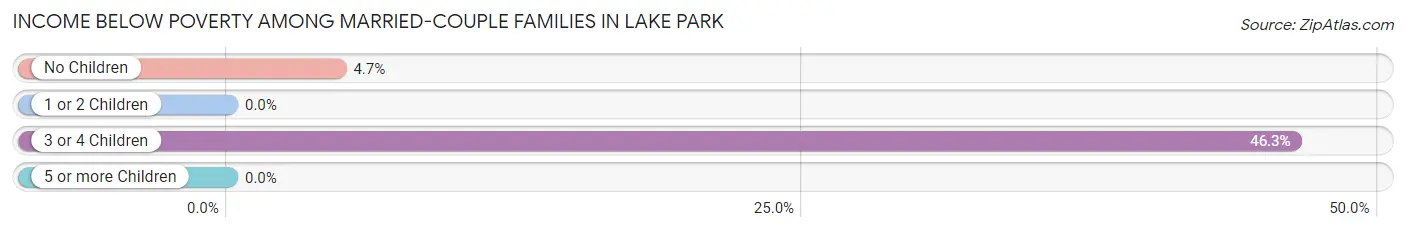
| Children | Above Poverty | Below Poverty |
| No Children | 626 (95.3%) | 31 (4.7%) |
| 1 or 2 Children | 444 (100.0%) | 0 (0.0%) |
| 3 or 4 Children | 51 (53.7%) | 44 (46.3%) |
| 5 or more Children | 0 (0.0%) | 0 (0.0%) |
| Total | 1,121 (93.7%) | 75 (6.3%) |
Income Below Poverty Among Single-Parent Households in Lake Park
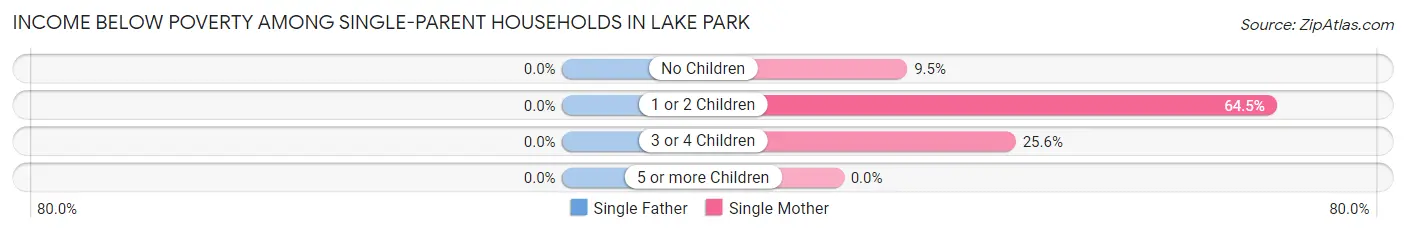
| Children | Single Father | Single Mother |
| No Children | 0 (0.0%) | 32 (9.5%) |
| 1 or 2 Children | 0 (0.0%) | 89 (64.5%) |
| 3 or 4 Children | 0 (0.0%) | 40 (25.6%) |
| 5 or more Children | 0 (0.0%) | 0 (0.0%) |
| Total | 0 (0.0%) | 161 (25.5%) |
Income Below Poverty Among Married-Couple vs Single-Parent Households in Lake Park
The poverty data for Lake Park shows that 75 of the married-couple family households (6.3%) and 161 of the single-parent households (19.2%) are living below the poverty level. Within the married-couple family households, those with 3 or 4 children have the highest poverty rate, with 44 households (46.3%) falling below the poverty line. Among the single-parent households, those with 1 or 2 children have the highest poverty rate, with 89 household (44.7%) living below poverty.
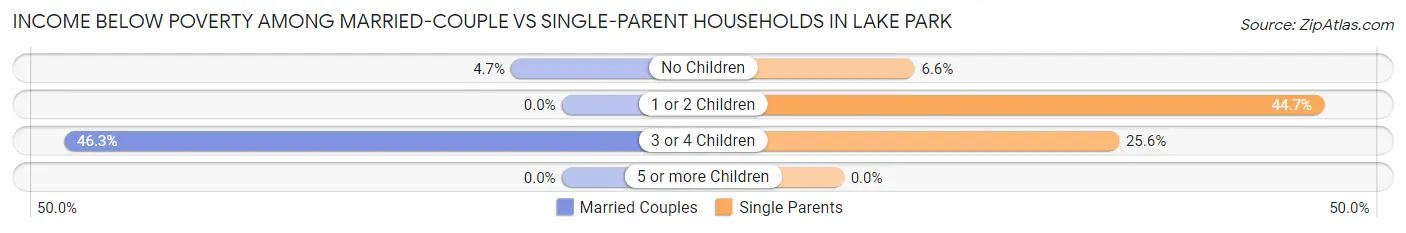
| Children | Married-Couple Families | Single-Parent Households |
| No Children | 31 (4.7%) | 32 (6.6%) |
| 1 or 2 Children | 0 (0.0%) | 89 (44.7%) |
| 3 or 4 Children | 44 (46.3%) | 40 (25.6%) |
| 5 or more Children | 0 (0.0%) | 0 (0.0%) |
| Total | 75 (6.3%) | 161 (19.2%) |
Race in Lake Park
The most populous races in Lake Park are Black / African American (4,743 | 52.7%), White / Caucasian (3,255 | 36.2%), and Hispanic or Latino (1,016 | 11.3%).
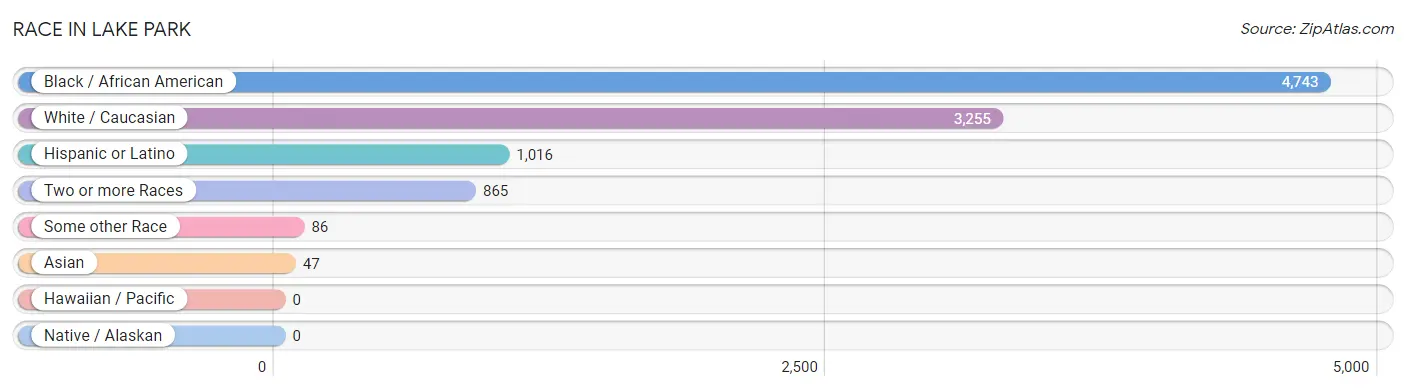
| Race | # Population | % Population |
| Asian | 47 | 0.5% |
| Black / African American | 4,743 | 52.7% |
| Hawaiian / Pacific | 0 | 0.0% |
| Hispanic or Latino | 1,016 | 11.3% |
| Native / Alaskan | 0 | 0.0% |
| White / Caucasian | 3,255 | 36.2% |
| Two or more Races | 865 | 9.6% |
| Some other Race | 86 | 1.0% |
| Total | 8,996 | 100.0% |
Ancestry in Lake Park
The most populous ancestries reported in Lake Park are Haitian (1,728 | 19.2%), Jamaican (652 | 7.2%), German (636 | 7.1%), English (564 | 6.3%), and Irish (549 | 6.1%), together accounting for 45.9% of all Lake Park residents.
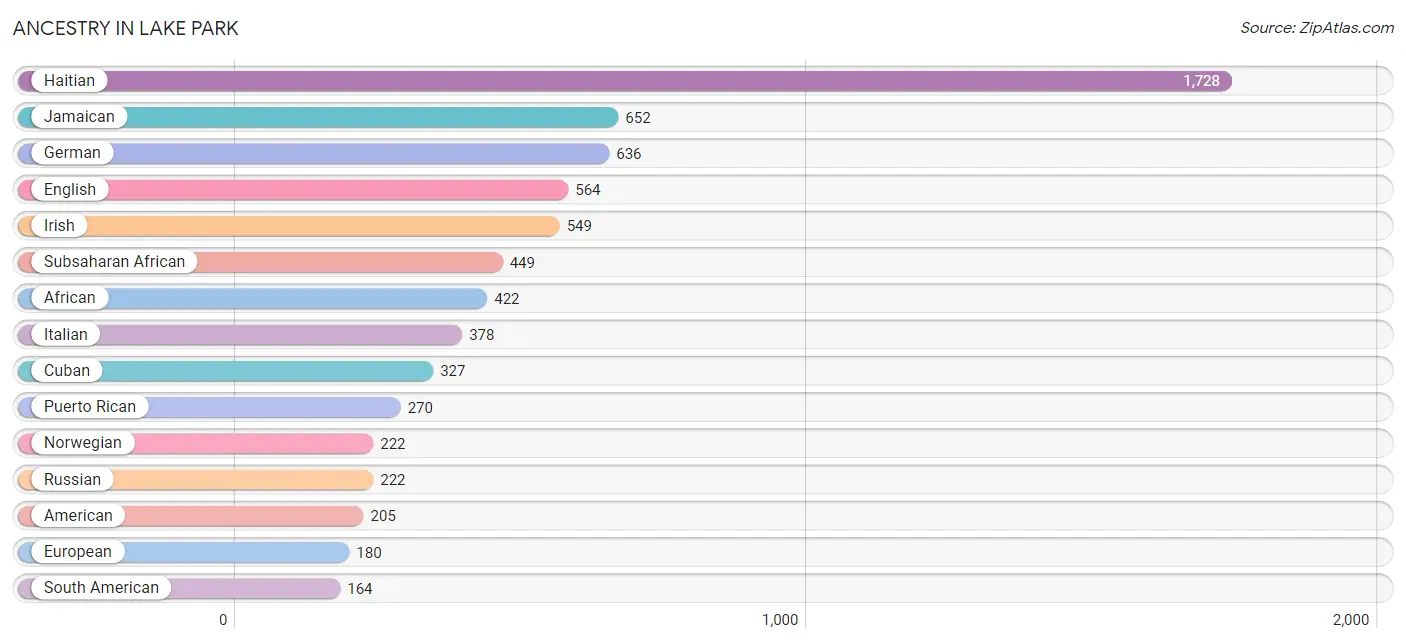
| Ancestry | # Population | % Population |
| African | 422 | 4.7% |
| American | 205 | 2.3% |
| Arab | 36 | 0.4% |
| Blackfeet | 48 | 0.5% |
| British | 34 | 0.4% |
| Central American | 135 | 1.5% |
| Central American Indian | 32 | 0.4% |
| Colombian | 28 | 0.3% |
| Cuban | 327 | 3.6% |
| Danish | 22 | 0.2% |
| Dominican | 39 | 0.4% |
| Dutch | 46 | 0.5% |
| Eastern European | 66 | 0.7% |
| Ecuadorian | 88 | 1.0% |
| English | 564 | 6.3% |
| European | 180 | 2.0% |
| Finnish | 7 | 0.1% |
| French | 54 | 0.6% |
| French Canadian | 9 | 0.1% |
| German | 636 | 7.1% |
| Greek | 9 | 0.1% |
| Haitian | 1,728 | 19.2% |
| Hungarian | 19 | 0.2% |
| Indian (Asian) | 36 | 0.4% |
| Iraqi | 36 | 0.4% |
| Irish | 549 | 6.1% |
| Italian | 378 | 4.2% |
| Jamaican | 652 | 7.2% |
| Lithuanian | 43 | 0.5% |
| Mexican | 81 | 0.9% |
| Norwegian | 222 | 2.5% |
| Panamanian | 112 | 1.2% |
| Polish | 118 | 1.3% |
| Puerto Rican | 270 | 3.0% |
| Romanian | 24 | 0.3% |
| Russian | 222 | 2.5% |
| Salvadoran | 23 | 0.3% |
| Scotch-Irish | 73 | 0.8% |
| Scottish | 146 | 1.6% |
| Slovak | 20 | 0.2% |
| Slovene | 8 | 0.1% |
| South African | 27 | 0.3% |
| South American | 164 | 1.8% |
| Sri Lankan | 92 | 1.0% |
| Subsaharan African | 449 | 5.0% |
| Swedish | 103 | 1.1% |
| Swiss | 9 | 0.1% |
| Thai | 11 | 0.1% |
| Ukrainian | 14 | 0.2% |
| Venezuelan | 48 | 0.5% | View All 50 Rows |
Immigrants in Lake Park
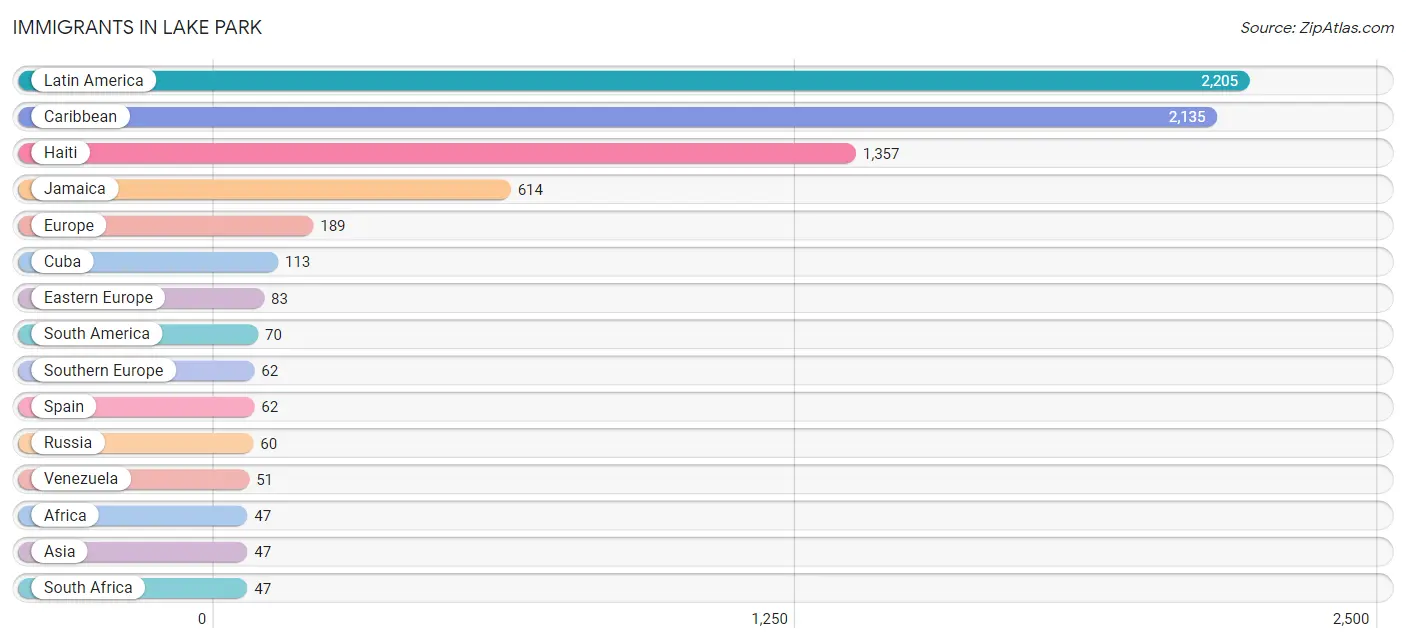
The most numerous immigrant groups reported in Lake Park came from Latin America (2,205 | 24.5%), Caribbean (2,135 | 23.7%), Haiti (1,357 | 15.1%), Jamaica (614 | 6.8%), and Europe (189 | 2.1%), together accounting for 72.3% of all Lake Park residents.
| Immigration Origin | # Population | % Population |
| Africa | 47 | 0.5% |
| Asia | 47 | 0.5% |
| Canada | 19 | 0.2% |
| Caribbean | 2,135 | 23.7% |
| China | 29 | 0.3% |
| Cuba | 113 | 1.3% |
| Dominican Republic | 34 | 0.4% |
| Eastern Asia | 29 | 0.3% |
| Eastern Europe | 83 | 0.9% |
| Ecuador | 19 | 0.2% |
| Europe | 189 | 2.1% |
| Germany | 13 | 0.1% |
| Haiti | 1,357 | 15.1% |
| Jamaica | 614 | 6.8% |
| Latin America | 2,205 | 24.5% |
| Malaysia | 7 | 0.1% |
| Netherlands | 20 | 0.2% |
| Northern Europe | 11 | 0.1% |
| Philippines | 11 | 0.1% |
| Poland | 9 | 0.1% |
| Russia | 60 | 0.7% |
| South Africa | 47 | 0.5% |
| South America | 70 | 0.8% |
| South Eastern Asia | 18 | 0.2% |
| Southern Europe | 62 | 0.7% |
| Spain | 62 | 0.7% |
| Trinidad and Tobago | 17 | 0.2% |
| Ukraine | 14 | 0.2% |
| Venezuela | 51 | 0.6% |
| Western Europe | 33 | 0.4% | View All 30 Rows |
Sex and Age in Lake Park
Sex and Age in Lake Park
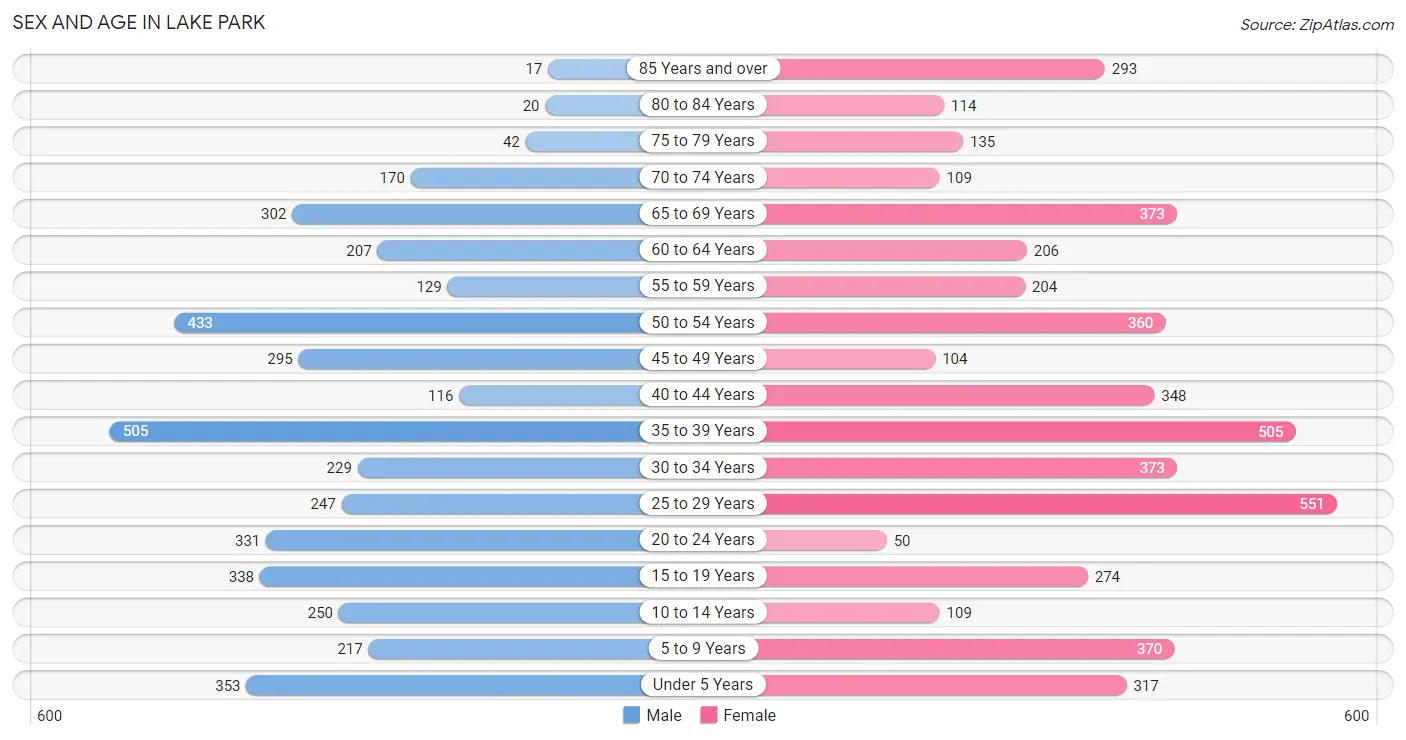
The most populous age groups in Lake Park are 35 to 39 Years (505 | 12.0%) for men and 25 to 29 Years (551 | 11.5%) for women.
| Age Bracket | Male | Female |
| Under 5 Years | 353 (8.4%) | 317 (6.6%) |
| 5 to 9 Years | 217 (5.2%) | 370 (7.7%) |
| 10 to 14 Years | 250 (5.9%) | 109 (2.3%) |
| 15 to 19 Years | 338 (8.1%) | 274 (5.7%) |
| 20 to 24 Years | 331 (7.9%) | 50 (1.0%) |
| 25 to 29 Years | 247 (5.9%) | 551 (11.5%) |
| 30 to 34 Years | 229 (5.4%) | 373 (7.8%) |
| 35 to 39 Years | 505 (12.0%) | 505 (10.5%) |
| 40 to 44 Years | 116 (2.8%) | 348 (7.3%) |
| 45 to 49 Years | 295 (7.0%) | 104 (2.2%) |
| 50 to 54 Years | 433 (10.3%) | 360 (7.5%) |
| 55 to 59 Years | 129 (3.1%) | 204 (4.3%) |
| 60 to 64 Years | 207 (4.9%) | 206 (4.3%) |
| 65 to 69 Years | 302 (7.2%) | 373 (7.8%) |
| 70 to 74 Years | 170 (4.1%) | 109 (2.3%) |
| 75 to 79 Years | 42 (1.0%) | 135 (2.8%) |
| 80 to 84 Years | 20 (0.5%) | 114 (2.4%) |
| 85 Years and over | 17 (0.4%) | 293 (6.1%) |
| Total | 4,201 (100.0%) | 4,795 (100.0%) |
Families and Households in Lake Park
Median Family Size in Lake Park
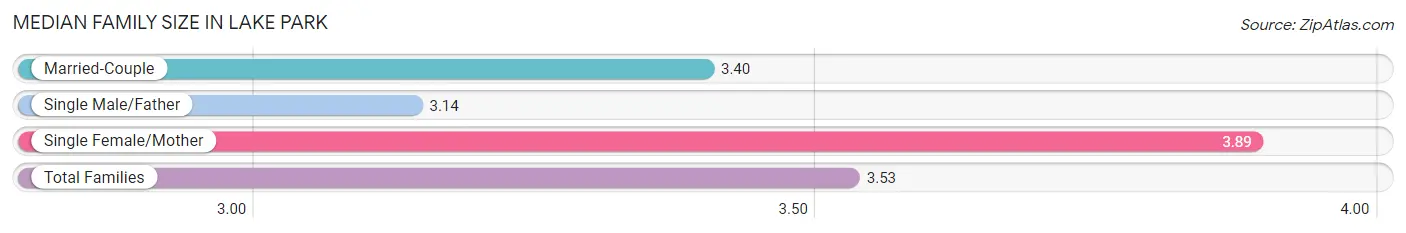
The median family size in Lake Park is 3.53 persons per family, with single female/mother families (632 | 31.0%) accounting for the largest median family size of 3.89 persons per family. On the other hand, single male/father families (208 | 10.2%) represent the smallest median family size with 3.14 persons per family.
| Family Type | # Families | Family Size |
| Married-Couple | 1,196 (58.7%) | 3.40 |
| Single Male/Father | 208 (10.2%) | 3.14 |
| Single Female/Mother | 632 (31.0%) | 3.89 |
| Total Families | 2,036 (100.0%) | 3.53 |
Median Household Size in Lake Park
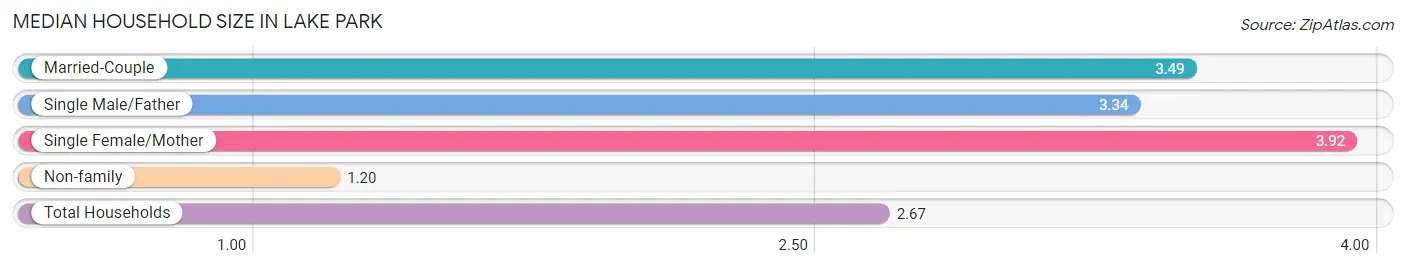
The median household size in Lake Park is 2.67 persons per household, with single female/mother households (632 | 18.9%) accounting for the largest median household size of 3.92 persons per household. non-family households (1,305 | 39.1%) represent the smallest median household size with 1.20 persons per household.
| Household Type | # Households | Household Size |
| Married-Couple | 1,196 (35.8%) | 3.49 |
| Single Male/Father | 208 (6.2%) | 3.34 |
| Single Female/Mother | 632 (18.9%) | 3.92 |
| Non-family | 1,305 (39.1%) | 1.20 |
| Total Households | 3,341 (100.0%) | 2.67 |
Household Size by Marriage Status in Lake Park
Out of a total of 3,341 households in Lake Park, 2,036 (60.9%) are family households, while 1,305 (39.1%) are nonfamily households. The most numerous type of family households are 2-person households, comprising 756, and the most common type of nonfamily households are 1-person households, comprising 1,116.
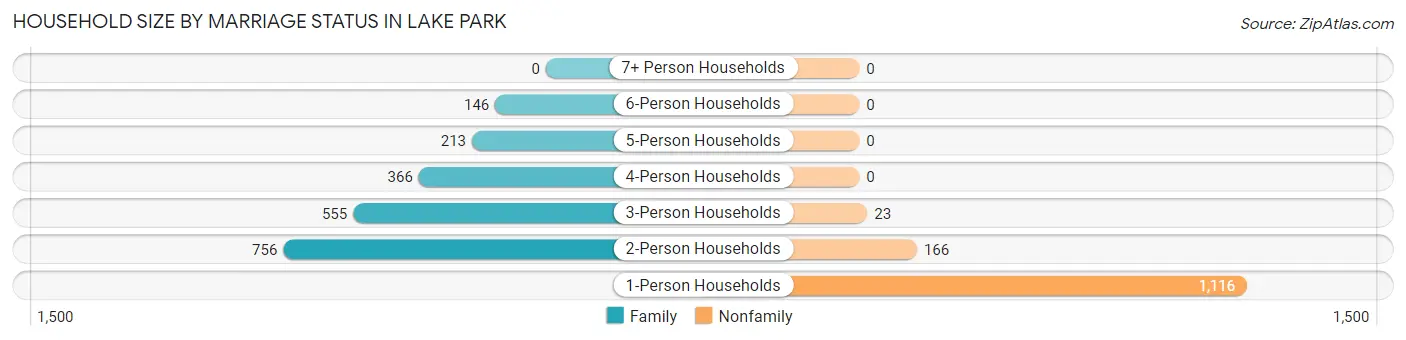
| Household Size | Family Households | Nonfamily Households |
| 1-Person Households | - | 1,116 (33.4%) |
| 2-Person Households | 756 (22.6%) | 166 (5.0%) |
| 3-Person Households | 555 (16.6%) | 23 (0.7%) |
| 4-Person Households | 366 (11.0%) | 0 (0.0%) |
| 5-Person Households | 213 (6.4%) | 0 (0.0%) |
| 6-Person Households | 146 (4.4%) | 0 (0.0%) |
| 7+ Person Households | 0 (0.0%) | 0 (0.0%) |
| Total | 2,036 (60.9%) | 1,305 (39.1%) |
Female Fertility in Lake Park
Fertility by Age in Lake Park
Average fertility rate in Lake Park is 89.0 births per 1,000 women. Women in the age bracket of 20 to 34 years have the highest fertility rate with 142.0 births per 1,000 women. Women in the age bracket of 20 to 34 years acount for 66.0% of all women with births.
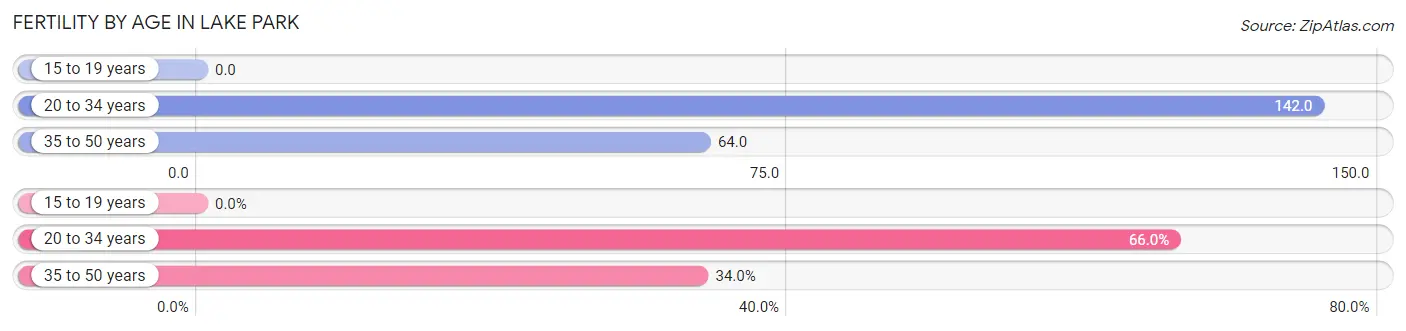
| Age Bracket | Women with Births | Births / 1,000 Women |
| 15 to 19 years | 0 (0.0%) | 0.0 |
| 20 to 34 years | 138 (66.0%) | 142.0 |
| 35 to 50 years | 71 (34.0%) | 64.0 |
| Total | 209 (100.0%) | 89.0 |
Fertility by Age by Marriage Status in Lake Park
63.2% of women with births (209) in Lake Park are married. The highest percentage of unmarried women with births falls into 20 to 34 years age bracket with 55.8% of them unmarried at the time of birth, while the lowest percentage of unmarried women with births belong to 35 to 50 years age bracket with 0.0% of them unmarried.
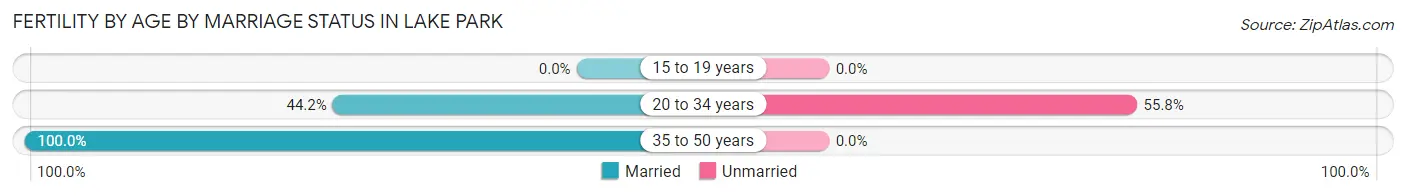
| Age Bracket | Married | Unmarried |
| 15 to 19 years | 0 (0.0%) | 0 (0.0%) |
| 20 to 34 years | 61 (44.2%) | 77 (55.8%) |
| 35 to 50 years | 71 (100.0%) | 0 (0.0%) |
| Total | 132 (63.2%) | 77 (36.8%) |
Fertility by Education in Lake Park
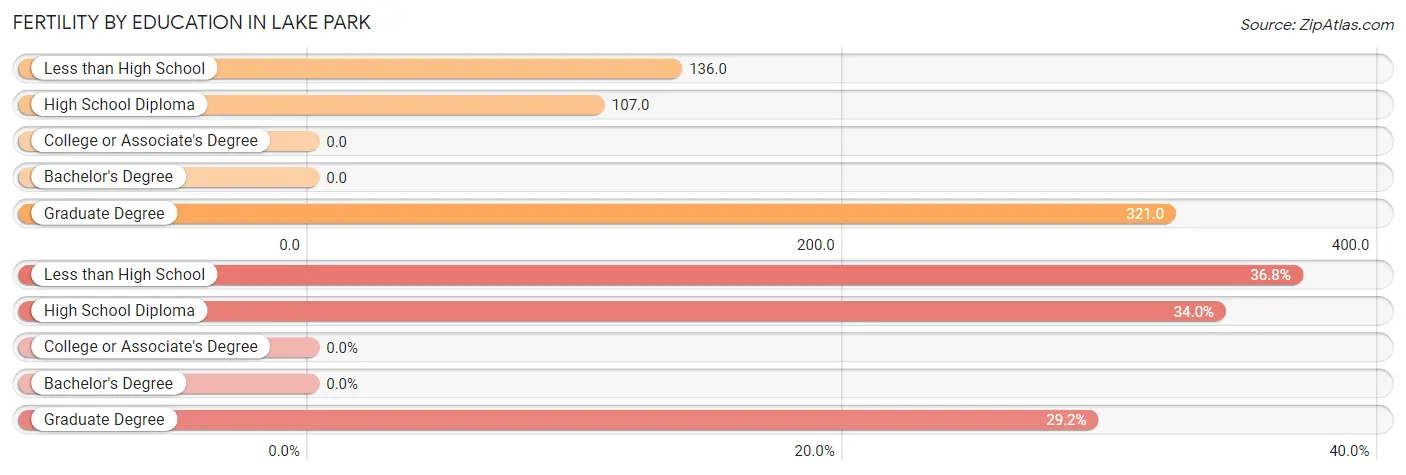
| Educational Attainment | Women with Births | Births / 1,000 Women |
| Less than High School | 77 (36.8%) | 136.0 |
| High School Diploma | 71 (34.0%) | 107.0 |
| College or Associate's Degree | 0 (0.0%) | 0.0 |
| Bachelor's Degree | 0 (0.0%) | 0.0 |
| Graduate Degree | 61 (29.2%) | 321.0 |
| Total | 209 (100.0%) | 89.0 |
Fertility by Education by Marriage Status in Lake Park
36.8% of women with births in Lake Park are unmarried. Women with the educational attainment of high school diploma are most likely to be married with 100.0% of them married at childbirth, while women with the educational attainment of less than high school are least likely to be married with 100.0% of them unmarried at childbirth.
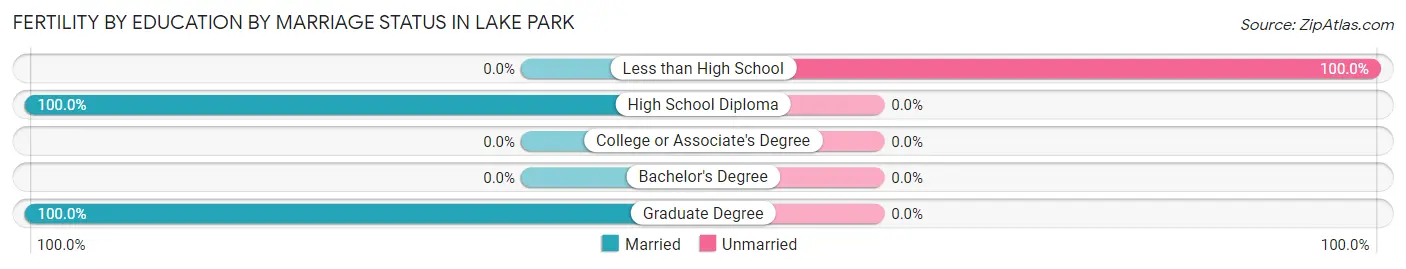
| Educational Attainment | Married | Unmarried |
| Less than High School | 0 (0.0%) | 77 (100.0%) |
| High School Diploma | 71 (100.0%) | 0 (0.0%) |
| College or Associate's Degree | 0 (0.0%) | 0 (0.0%) |
| Bachelor's Degree | 0 (0.0%) | 0 (0.0%) |
| Graduate Degree | 61 (100.0%) | 0 (0.0%) |
| Total | 132 (63.2%) | 77 (36.8%) |
Employment Characteristics in Lake Park
Employment by Class of Employer in Lake Park
Among the 4,054 employed individuals in Lake Park, private company employees (2,991 | 73.8%), local government employees (320 | 7.9%), and self-employed (incorporated) (236 | 5.8%) make up the most common classes of employment.
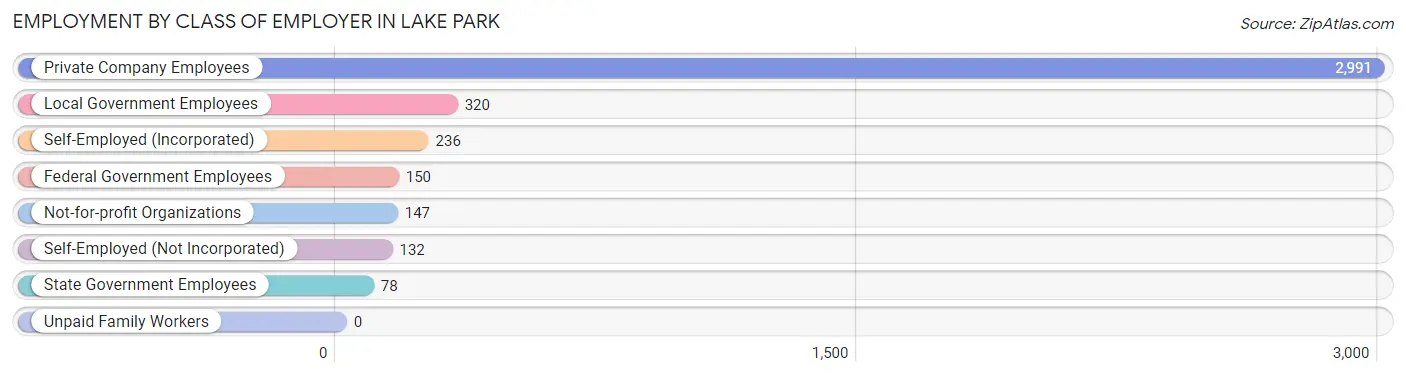
| Employer Class | # Employees | % Employees |
| Private Company Employees | 2,991 | 73.8% |
| Self-Employed (Incorporated) | 236 | 5.8% |
| Self-Employed (Not Incorporated) | 132 | 3.3% |
| Not-for-profit Organizations | 147 | 3.6% |
| Local Government Employees | 320 | 7.9% |
| State Government Employees | 78 | 1.9% |
| Federal Government Employees | 150 | 3.7% |
| Unpaid Family Workers | 0 | 0.0% |
| Total | 4,054 | 100.0% |
Employment Status by Age in Lake Park
According to the labor force statistics for Lake Park, out of the total population over 16 years of age (7,298), 63.0% or 4,598 individuals are in the labor force, with 9.4% or 432 of them unemployed. The age group with the highest labor force participation rate is 35 to 44 years, with 90.4% or 1,332 individuals in the labor force. Within the labor force, the 16 to 19 years age range has the highest percentage of unemployed individuals, with 57.7% or 86 of them being unemployed.
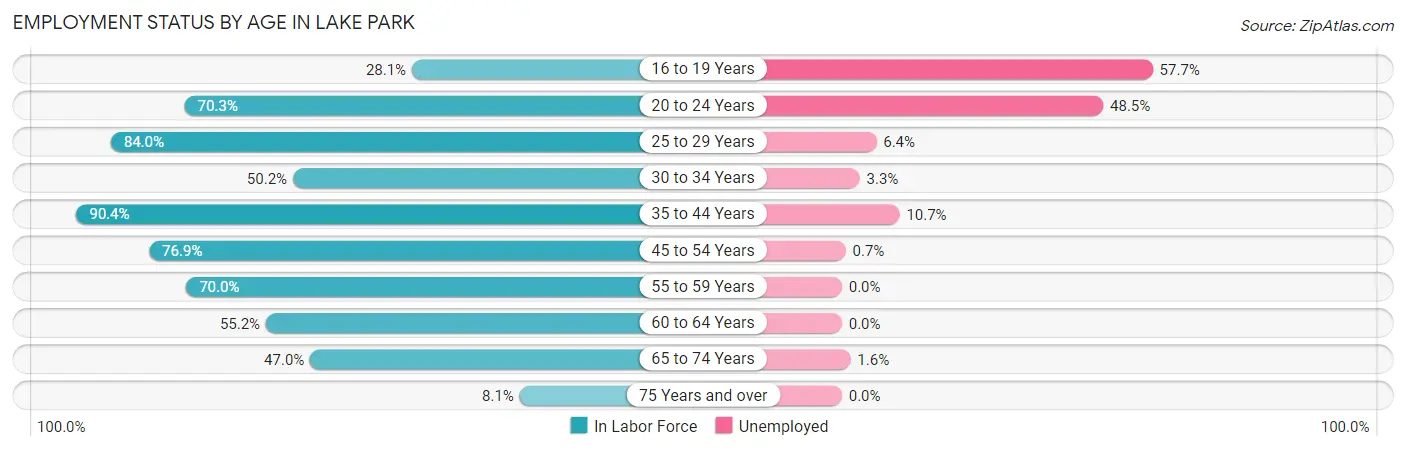
| Age Bracket | In Labor Force | Unemployed |
| 16 to 19 Years | 149 (28.1%) | 86 (57.7%) |
| 20 to 24 Years | 268 (70.3%) | 130 (48.5%) |
| 25 to 29 Years | 670 (84.0%) | 43 (6.4%) |
| 30 to 34 Years | 302 (50.2%) | 10 (3.3%) |
| 35 to 44 Years | 1,332 (90.4%) | 143 (10.7%) |
| 45 to 54 Years | 917 (76.9%) | 6 (0.7%) |
| 55 to 59 Years | 233 (70.0%) | 0 (0.0%) |
| 60 to 64 Years | 228 (55.2%) | 0 (0.0%) |
| 65 to 74 Years | 448 (47.0%) | 7 (1.6%) |
| 75 Years and over | 50 (8.1%) | 0 (0.0%) |
| Total | 4,598 (63.0%) | 432 (9.4%) |
Employment Status by Educational Attainment in Lake Park
According to labor force statistics for Lake Park, 76.5% of individuals (3,681) out of the total population between 25 and 64 years of age (4,812) are in the labor force, with 5.6% or 206 of them being unemployed. The group with the highest labor force participation rate are those with the educational attainment of bachelor's degree or higher, with 91.1% or 1,238 individuals in the labor force. Within the labor force, individuals with high school diploma education have the highest percentage of unemployment, with 15.8% or 152 of them being unemployed.
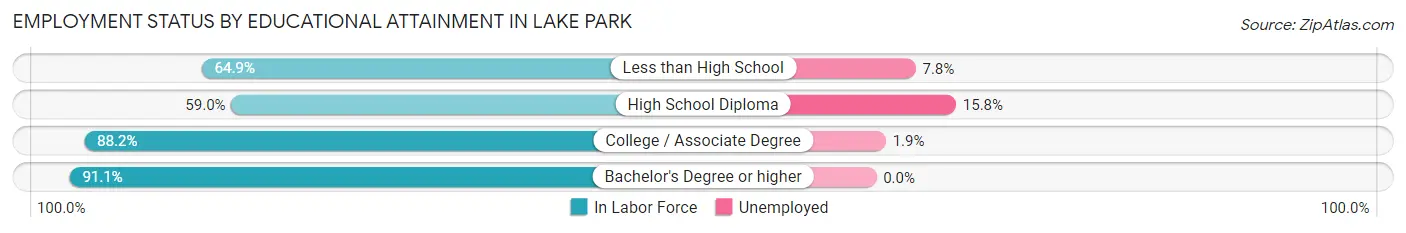
| Educational Attainment | In Labor Force | Unemployed |
| Less than High School | 347 (64.9%) | 42 (7.8%) |
| High School Diploma | 963 (59.0%) | 258 (15.8%) |
| College / Associate Degree | 1,133 (88.2%) | 24 (1.9%) |
| Bachelor's Degree or higher | 1,238 (91.1%) | 0 (0.0%) |
| Total | 3,681 (76.5%) | 269 (5.6%) |
Employment Occupations by Sex in Lake Park
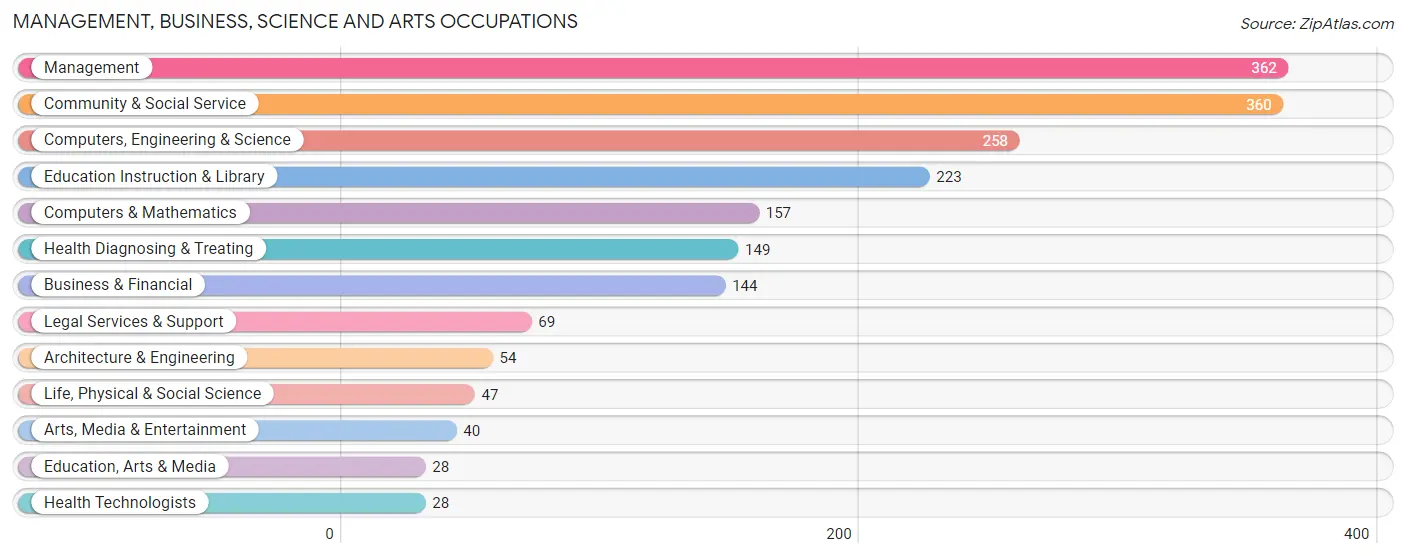
Management, Business, Science and Arts Occupations
The most common Management, Business, Science and Arts occupations in Lake Park are Management (362 | 8.8%), Community & Social Service (360 | 8.8%), Computers, Engineering & Science (258 | 6.3%), Education Instruction & Library (223 | 5.4%), and Computers & Mathematics (157 | 3.8%).
Management, Business, Science and Arts Occupations by Sex
Within the Management, Business, Science and Arts occupations in Lake Park, the most male-oriented occupations are Architecture & Engineering (100.0%), Computers & Mathematics (88.5%), and Legal Services & Support (81.2%), while the most female-oriented occupations are Life, Physical & Social Science (100.0%), Education, Arts & Media (100.0%), and Health Diagnosing & Treating (94.0%).
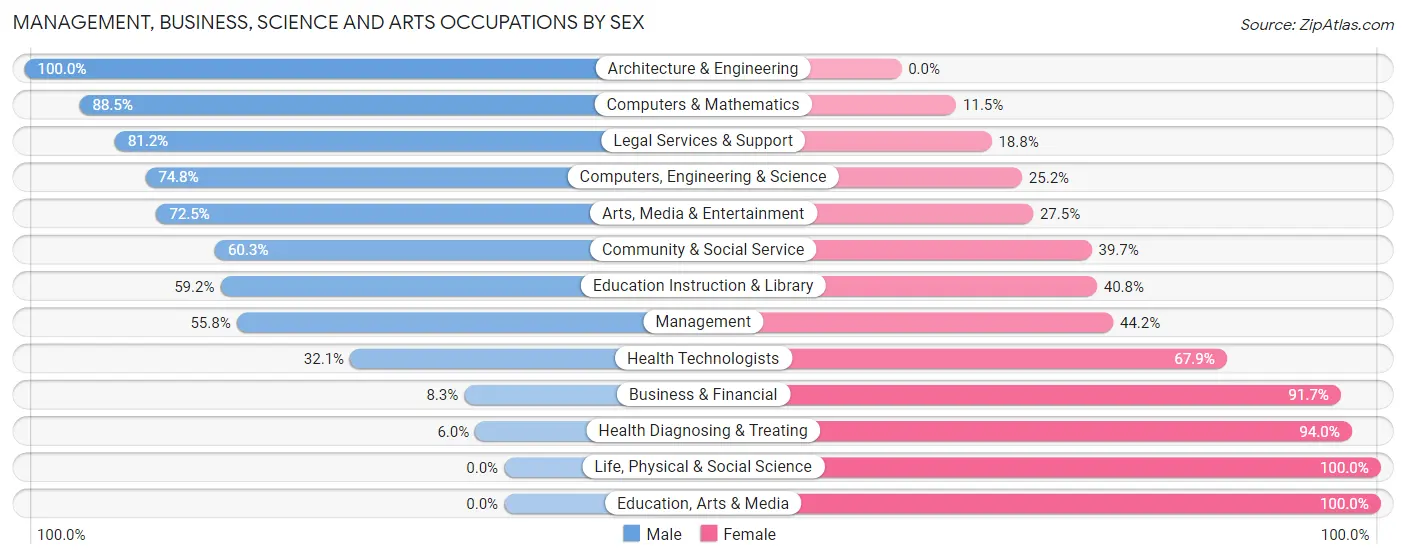
| Occupation | Male | Female |
| Management | 202 (55.8%) | 160 (44.2%) |
| Business & Financial | 12 (8.3%) | 132 (91.7%) |
| Computers, Engineering & Science | 193 (74.8%) | 65 (25.2%) |
| Computers & Mathematics | 139 (88.5%) | 18 (11.5%) |
| Architecture & Engineering | 54 (100.0%) | 0 (0.0%) |
| Life, Physical & Social Science | 0 (0.0%) | 47 (100.0%) |
| Community & Social Service | 217 (60.3%) | 143 (39.7%) |
| Education, Arts & Media | 0 (0.0%) | 28 (100.0%) |
| Legal Services & Support | 56 (81.2%) | 13 (18.8%) |
| Education Instruction & Library | 132 (59.2%) | 91 (40.8%) |
| Arts, Media & Entertainment | 29 (72.5%) | 11 (27.5%) |
| Health Diagnosing & Treating | 9 (6.0%) | 140 (94.0%) |
| Health Technologists | 9 (32.1%) | 19 (67.9%) |
| Total (Category) | 633 (49.7%) | 640 (50.3%) |
| Total (Overall) | 2,028 (49.5%) | 2,066 (50.5%) |
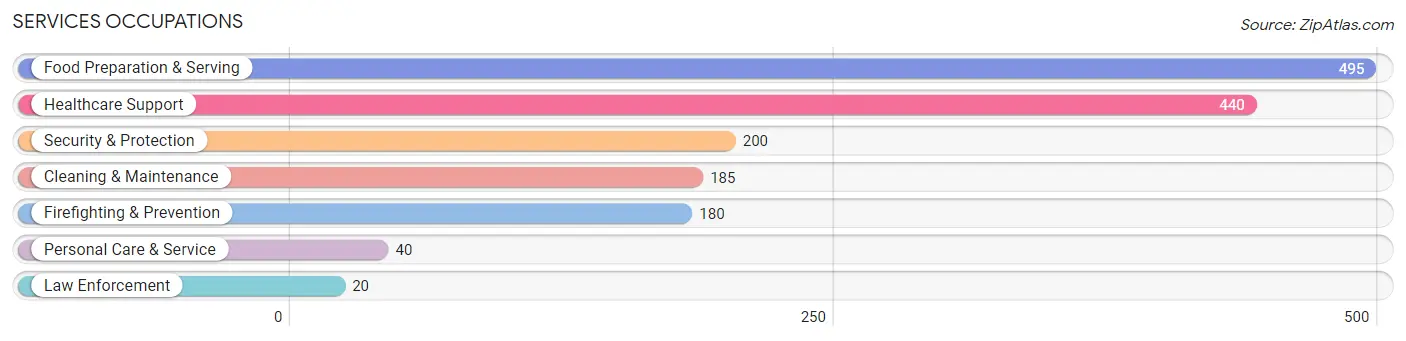
Services Occupations
The most common Services occupations in Lake Park are Food Preparation & Serving (495 | 12.1%), Healthcare Support (440 | 10.7%), Security & Protection (200 | 4.9%), Cleaning & Maintenance (185 | 4.5%), and Firefighting & Prevention (180 | 4.4%).
Services Occupations by Sex
Within the Services occupations in Lake Park, the most male-oriented occupations are Firefighting & Prevention (100.0%), Personal Care & Service (100.0%), and Security & Protection (90.0%), while the most female-oriented occupations are Healthcare Support (100.0%), Law Enforcement (100.0%), and Food Preparation & Serving (64.8%).
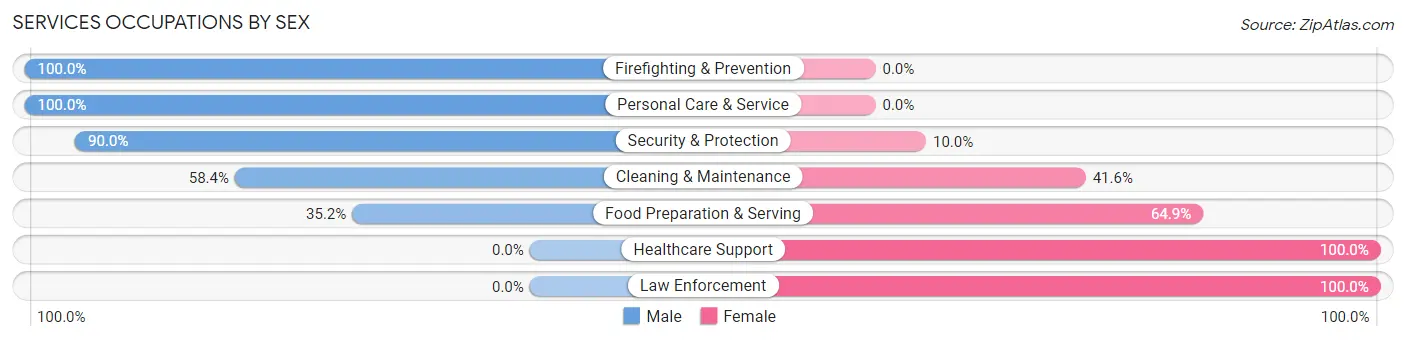
| Occupation | Male | Female |
| Healthcare Support | 0 (0.0%) | 440 (100.0%) |
| Security & Protection | 180 (90.0%) | 20 (10.0%) |
| Firefighting & Prevention | 180 (100.0%) | 0 (0.0%) |
| Law Enforcement | 0 (0.0%) | 20 (100.0%) |
| Food Preparation & Serving | 174 (35.1%) | 321 (64.8%) |
| Cleaning & Maintenance | 108 (58.4%) | 77 (41.6%) |
| Personal Care & Service | 40 (100.0%) | 0 (0.0%) |
| Total (Category) | 502 (36.9%) | 858 (63.1%) |
| Total (Overall) | 2,028 (49.5%) | 2,066 (50.5%) |
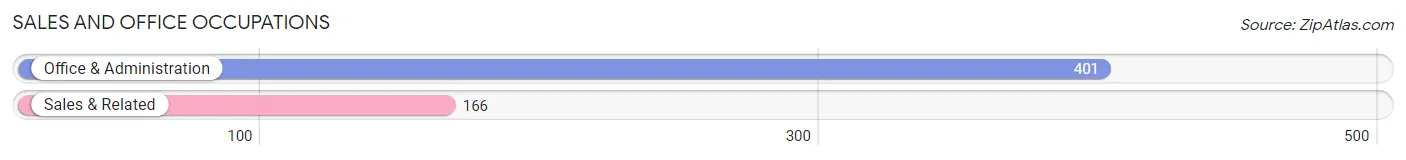
Sales and Office Occupations
The most common Sales and Office occupations in Lake Park are Office & Administration (401 | 9.8%), and Sales & Related (166 | 4.1%).
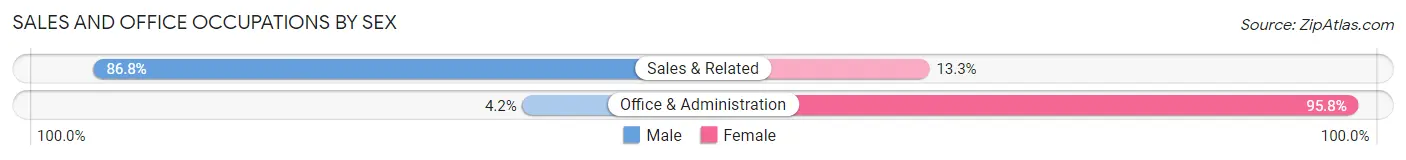
Sales and Office Occupations by Sex
| Occupation | Male | Female |
| Sales & Related | 144 (86.8%) | 22 (13.3%) |
| Office & Administration | 17 (4.2%) | 384 (95.8%) |
| Total (Category) | 161 (28.4%) | 406 (71.6%) |
| Total (Overall) | 2,028 (49.5%) | 2,066 (50.5%) |
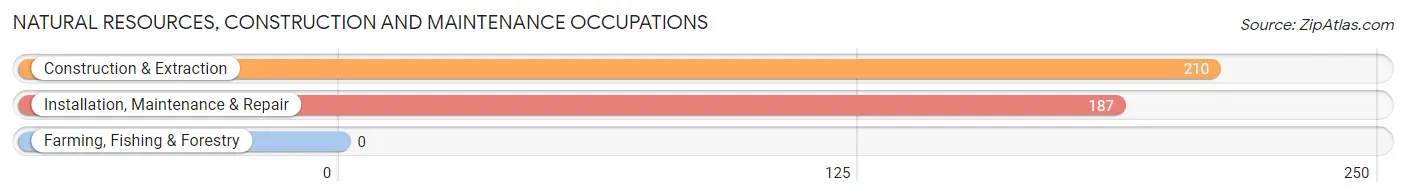
Natural Resources, Construction and Maintenance Occupations
The most common Natural Resources, Construction and Maintenance occupations in Lake Park are Construction & Extraction (210 | 5.1%), and Installation, Maintenance & Repair (187 | 4.6%).
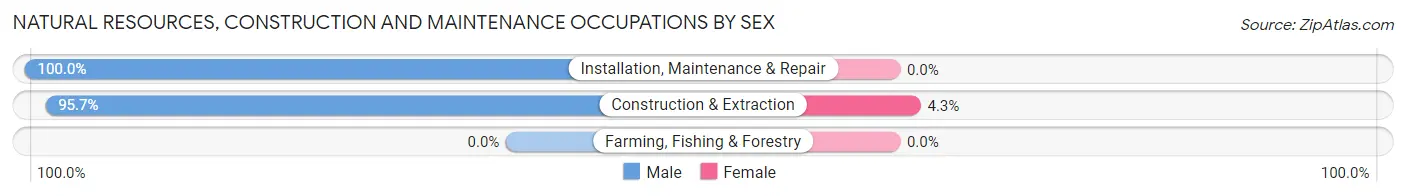
Natural Resources, Construction and Maintenance Occupations by Sex
| Occupation | Male | Female |
| Farming, Fishing & Forestry | 0 (0.0%) | 0 (0.0%) |
| Construction & Extraction | 201 (95.7%) | 9 (4.3%) |
| Installation, Maintenance & Repair | 187 (100.0%) | 0 (0.0%) |
| Total (Category) | 388 (97.7%) | 9 (2.3%) |
| Total (Overall) | 2,028 (49.5%) | 2,066 (50.5%) |
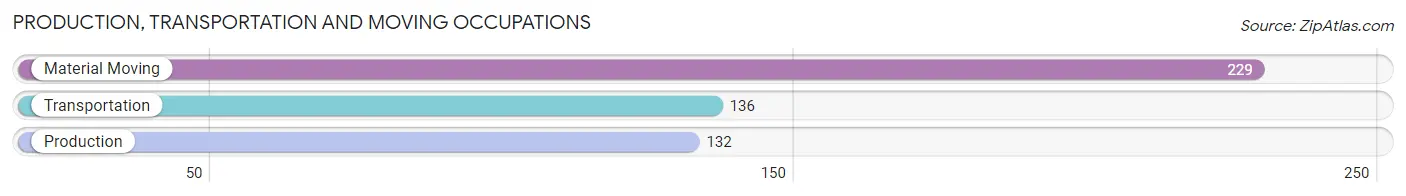
Production, Transportation and Moving Occupations
The most common Production, Transportation and Moving occupations in Lake Park are Material Moving (229 | 5.6%), Transportation (136 | 3.3%), and Production (132 | 3.2%).
Production, Transportation and Moving Occupations by Sex
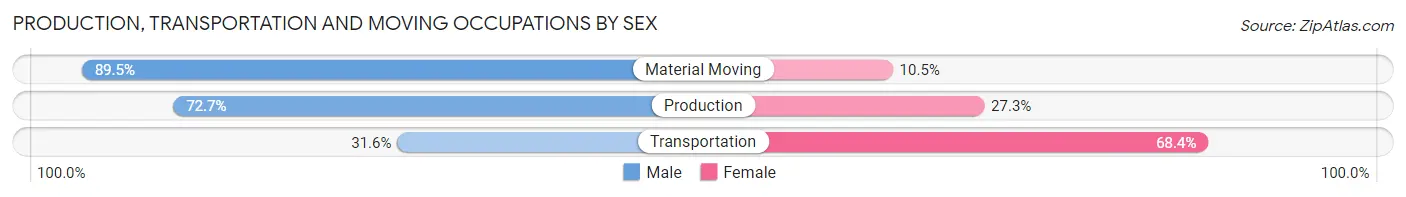
| Occupation | Male | Female |
| Production | 96 (72.7%) | 36 (27.3%) |
| Transportation | 43 (31.6%) | 93 (68.4%) |
| Material Moving | 205 (89.5%) | 24 (10.5%) |
| Total (Category) | 344 (69.2%) | 153 (30.8%) |
| Total (Overall) | 2,028 (49.5%) | 2,066 (50.5%) |
Employment Industries by Sex in Lake Park
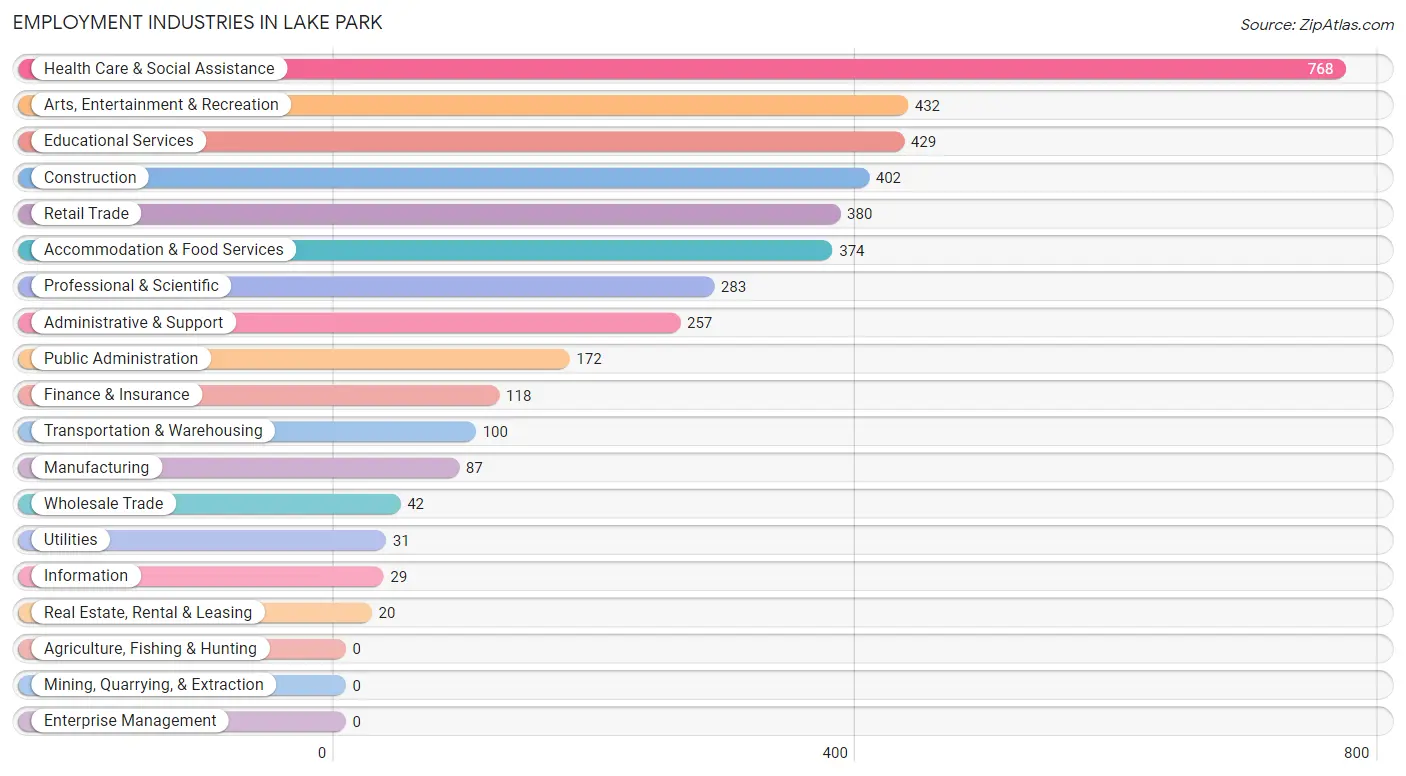
Employment Industries in Lake Park
The major employment industries in Lake Park include Health Care & Social Assistance (768 | 18.8%), Arts, Entertainment & Recreation (432 | 10.5%), Educational Services (429 | 10.5%), Construction (402 | 9.8%), and Retail Trade (380 | 9.3%).
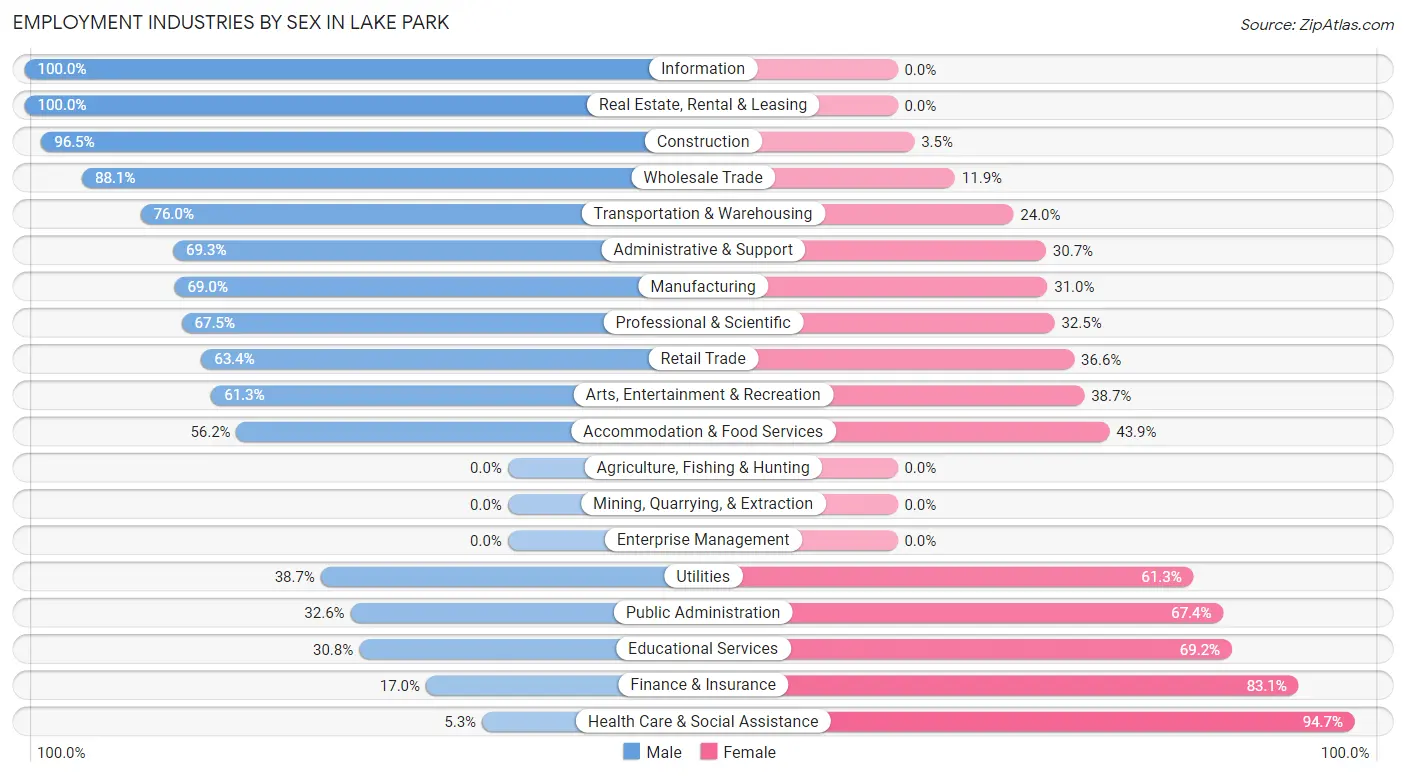
Employment Industries by Sex in Lake Park
The Lake Park industries that see more men than women are Information (100.0%), Real Estate, Rental & Leasing (100.0%), and Construction (96.5%), whereas the industries that tend to have a higher number of women are Health Care & Social Assistance (94.7%), Finance & Insurance (83.1%), and Educational Services (69.2%).
| Industry | Male | Female |
| Agriculture, Fishing & Hunting | 0 (0.0%) | 0 (0.0%) |
| Mining, Quarrying, & Extraction | 0 (0.0%) | 0 (0.0%) |
| Construction | 388 (96.5%) | 14 (3.5%) |
| Manufacturing | 60 (69.0%) | 27 (31.0%) |
| Wholesale Trade | 37 (88.1%) | 5 (11.9%) |
| Retail Trade | 241 (63.4%) | 139 (36.6%) |
| Transportation & Warehousing | 76 (76.0%) | 24 (24.0%) |
| Utilities | 12 (38.7%) | 19 (61.3%) |
| Information | 29 (100.0%) | 0 (0.0%) |
| Finance & Insurance | 20 (17.0%) | 98 (83.1%) |
| Real Estate, Rental & Leasing | 20 (100.0%) | 0 (0.0%) |
| Professional & Scientific | 191 (67.5%) | 92 (32.5%) |
| Enterprise Management | 0 (0.0%) | 0 (0.0%) |
| Administrative & Support | 178 (69.3%) | 79 (30.7%) |
| Educational Services | 132 (30.8%) | 297 (69.2%) |
| Health Care & Social Assistance | 41 (5.3%) | 727 (94.7%) |
| Arts, Entertainment & Recreation | 265 (61.3%) | 167 (38.7%) |
| Accommodation & Food Services | 210 (56.1%) | 164 (43.9%) |
| Public Administration | 56 (32.6%) | 116 (67.4%) |
| Total | 2,028 (49.5%) | 2,066 (50.5%) |
Education in Lake Park
School Enrollment in Lake Park
The most common levels of schooling among the 2,303 students in Lake Park are high school (637 | 27.7%), college / undergraduate (533 | 23.1%), and elementary school (345 | 15.0%).
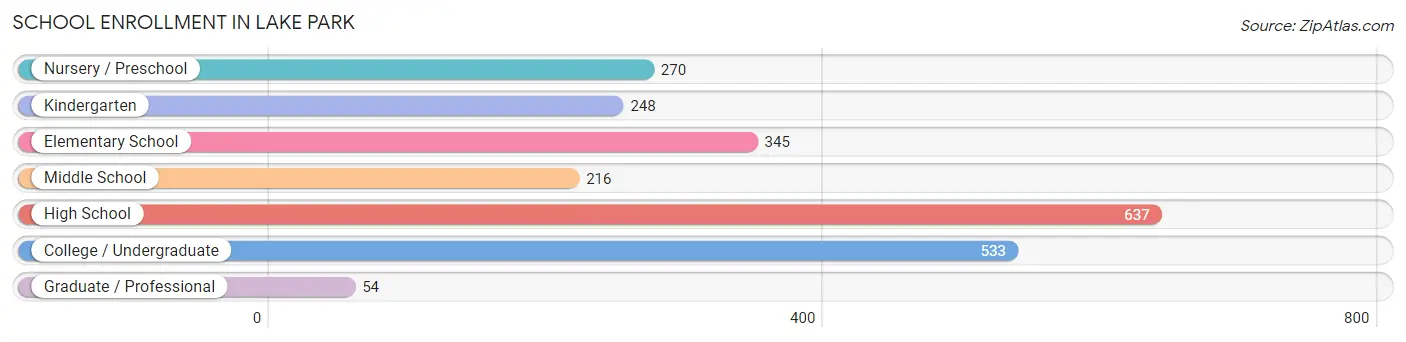
| School Level | # Students | % Students |
| Nursery / Preschool | 270 | 11.7% |
| Kindergarten | 248 | 10.8% |
| Elementary School | 345 | 15.0% |
| Middle School | 216 | 9.4% |
| High School | 637 | 27.7% |
| College / Undergraduate | 533 | 23.1% |
| Graduate / Professional | 54 | 2.3% |
| Total | 2,303 | 100.0% |
School Enrollment by Age by Funding Source in Lake Park
Out of a total of 2,303 students who are enrolled in schools in Lake Park, 283 (12.3%) attend a private institution, while the remaining 2,020 (87.7%) are enrolled in public schools. The age group of 35 years and over has the highest likelihood of being enrolled in private schools, with 50 (100.0% in the age bracket) enrolled. Conversely, the age group of 15 to 17 year olds has the lowest likelihood of being enrolled in a private school, with 433 (100.0% in the age bracket) attending a public institution.
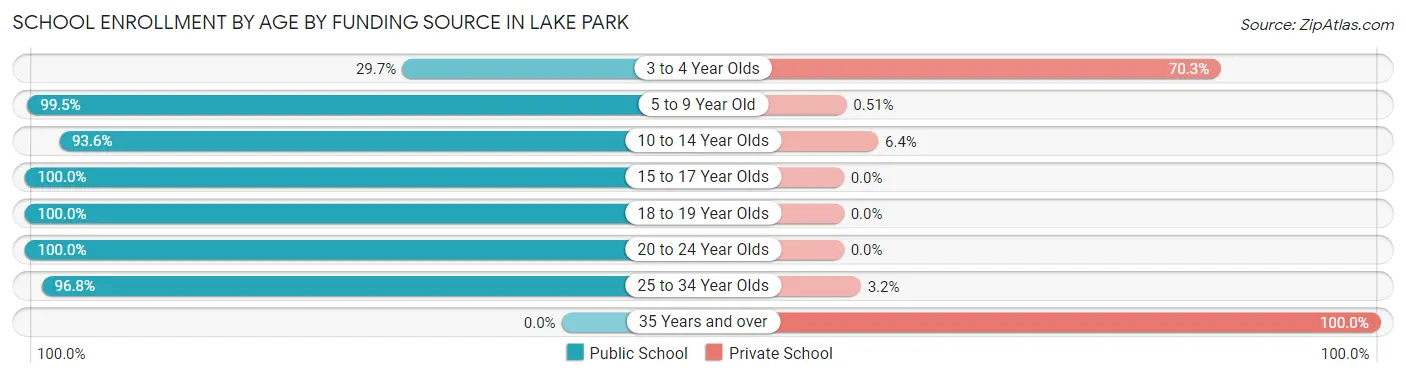
| Age Bracket | Public School | Private School |
| 3 to 4 Year Olds | 82 (29.7%) | 194 (70.3%) |
| 5 to 9 Year Old | 584 (99.5%) | 3 (0.5%) |
| 10 to 14 Year Olds | 336 (93.6%) | 23 (6.4%) |
| 15 to 17 Year Olds | 433 (100.0%) | 0 (0.0%) |
| 18 to 19 Year Olds | 179 (100.0%) | 0 (0.0%) |
| 20 to 24 Year Olds | 9 (100.0%) | 0 (0.0%) |
| 25 to 34 Year Olds | 397 (96.8%) | 13 (3.2%) |
| 35 Years and over | 0 (0.0%) | 50 (100.0%) |
| Total | 2,020 (87.7%) | 283 (12.3%) |
Educational Attainment by Field of Study in Lake Park
Business (495 | 23.4%), social sciences (377 | 17.8%), science & technology (346 | 16.3%), education (216 | 10.2%), and psychology (199 | 9.4%) are the most common fields of study among 2,117 individuals in Lake Park who have obtained a bachelor's degree or higher.
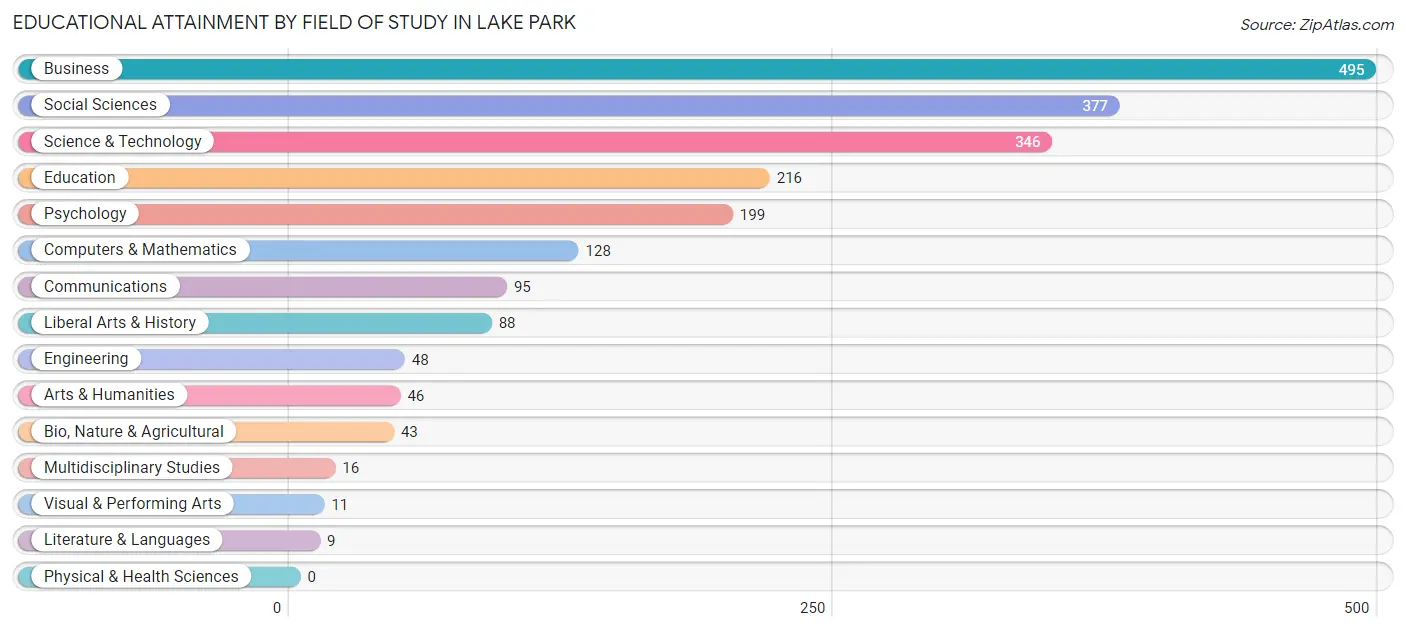
| Field of Study | # Graduates | % Graduates |
| Computers & Mathematics | 128 | 6.0% |
| Bio, Nature & Agricultural | 43 | 2.0% |
| Physical & Health Sciences | 0 | 0.0% |
| Psychology | 199 | 9.4% |
| Social Sciences | 377 | 17.8% |
| Engineering | 48 | 2.3% |
| Multidisciplinary Studies | 16 | 0.8% |
| Science & Technology | 346 | 16.3% |
| Business | 495 | 23.4% |
| Education | 216 | 10.2% |
| Literature & Languages | 9 | 0.4% |
| Liberal Arts & History | 88 | 4.2% |
| Visual & Performing Arts | 11 | 0.5% |
| Communications | 95 | 4.5% |
| Arts & Humanities | 46 | 2.2% |
| Total | 2,117 | 100.0% |
Transportation & Commute in Lake Park
Vehicle Availability by Sex in Lake Park
The most prevalent vehicle ownership categories in Lake Park are males with 2 vehicles (914, accounting for 43.4%) and females with 2 vehicles (577, making up 46.9%).
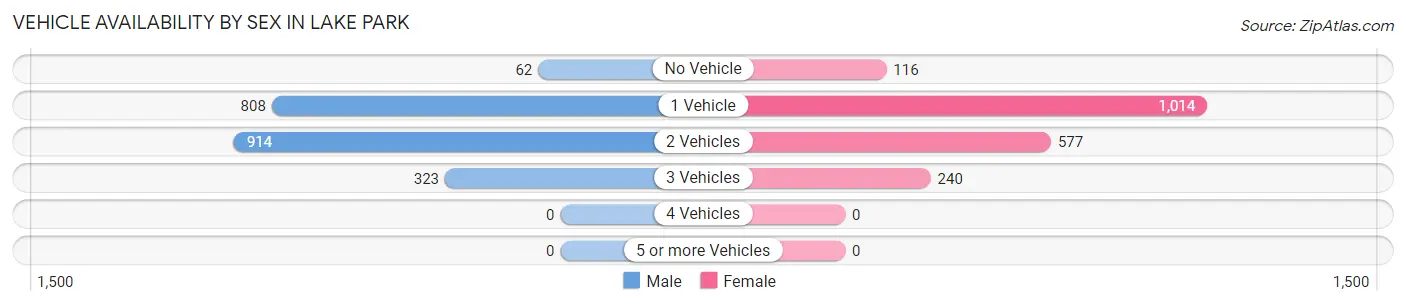
| Vehicles Available | Male | Female |
| No Vehicle | 62 (2.9%) | 116 (6.0%) |
| 1 Vehicle | 808 (38.4%) | 1,014 (52.1%) |
| 2 Vehicles | 914 (43.4%) | 577 (29.6%) |
| 3 Vehicles | 323 (15.3%) | 240 (12.3%) |
| 4 Vehicles | 0 (0.0%) | 0 (0.0%) |
| 5 or more Vehicles | 0 (0.0%) | 0 (0.0%) |
| Total | 2,107 (100.0%) | 1,947 (100.0%) |
Commute Time in Lake Park
The most frequently occuring commute durations in Lake Park are 20 to 24 minutes (851 commuters, 22.8%), 10 to 14 minutes (722 commuters, 19.3%), and 15 to 19 minutes (633 commuters, 16.9%).
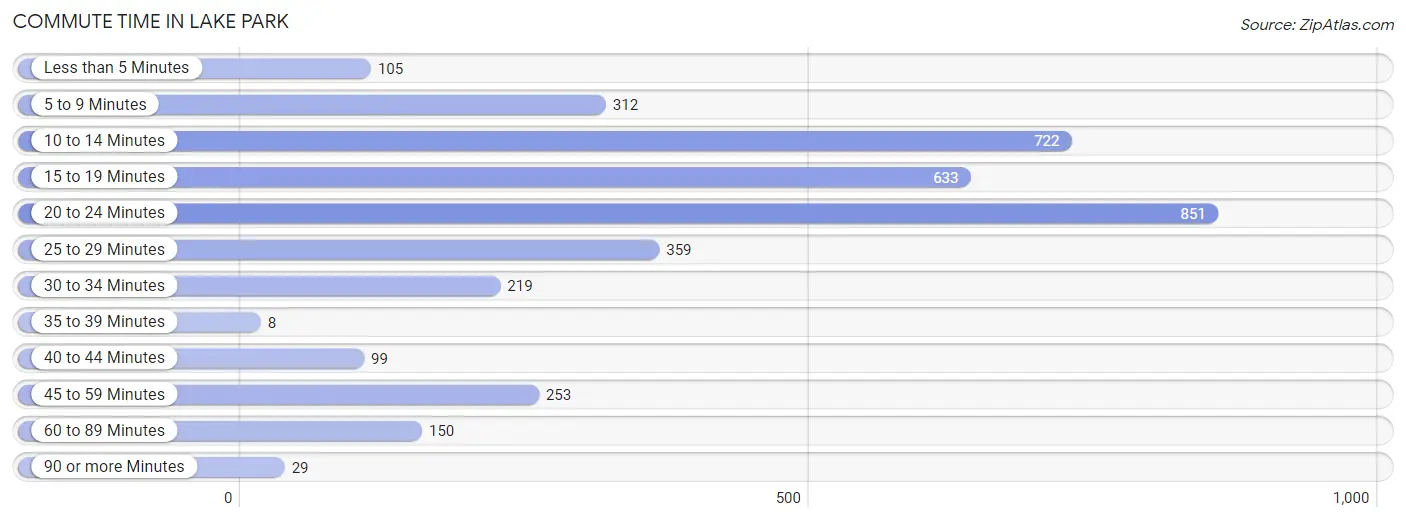
| Commute Time | # Commuters | % Commuters |
| Less than 5 Minutes | 105 | 2.8% |
| 5 to 9 Minutes | 312 | 8.3% |
| 10 to 14 Minutes | 722 | 19.3% |
| 15 to 19 Minutes | 633 | 16.9% |
| 20 to 24 Minutes | 851 | 22.8% |
| 25 to 29 Minutes | 359 | 9.6% |
| 30 to 34 Minutes | 219 | 5.9% |
| 35 to 39 Minutes | 8 | 0.2% |
| 40 to 44 Minutes | 99 | 2.6% |
| 45 to 59 Minutes | 253 | 6.8% |
| 60 to 89 Minutes | 150 | 4.0% |
| 90 or more Minutes | 29 | 0.8% |
Commute Time by Sex in Lake Park
The most common commute times in Lake Park are 20 to 24 minutes (491 commuters, 26.3%) for males and 10 to 14 minutes (401 commuters, 21.4%) for females.
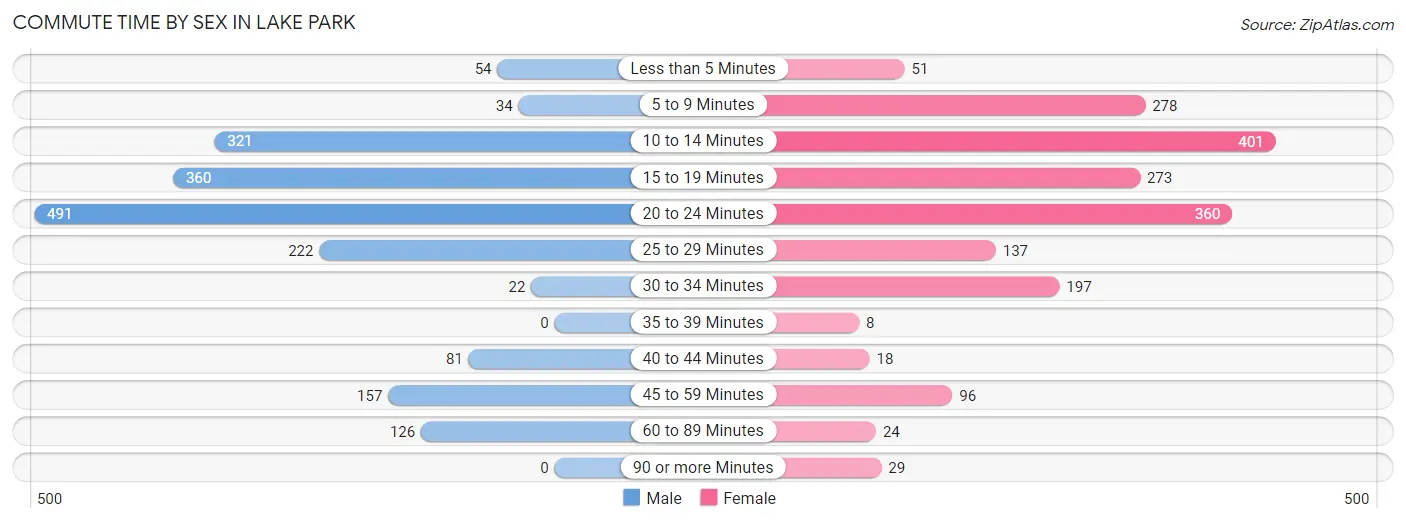
| Commute Time | Male | Female |
| Less than 5 Minutes | 54 (2.9%) | 51 (2.7%) |
| 5 to 9 Minutes | 34 (1.8%) | 278 (14.8%) |
| 10 to 14 Minutes | 321 (17.2%) | 401 (21.4%) |
| 15 to 19 Minutes | 360 (19.3%) | 273 (14.6%) |
| 20 to 24 Minutes | 491 (26.3%) | 360 (19.2%) |
| 25 to 29 Minutes | 222 (11.9%) | 137 (7.3%) |
| 30 to 34 Minutes | 22 (1.2%) | 197 (10.5%) |
| 35 to 39 Minutes | 0 (0.0%) | 8 (0.4%) |
| 40 to 44 Minutes | 81 (4.3%) | 18 (1.0%) |
| 45 to 59 Minutes | 157 (8.4%) | 96 (5.1%) |
| 60 to 89 Minutes | 126 (6.8%) | 24 (1.3%) |
| 90 or more Minutes | 0 (0.0%) | 29 (1.5%) |
Time of Departure to Work by Sex in Lake Park
The most frequent times of departure to work in Lake Park are 7:00 AM to 7:29 AM (329, 17.6%) for males and 6:30 AM to 6:59 AM (398, 21.3%) for females.
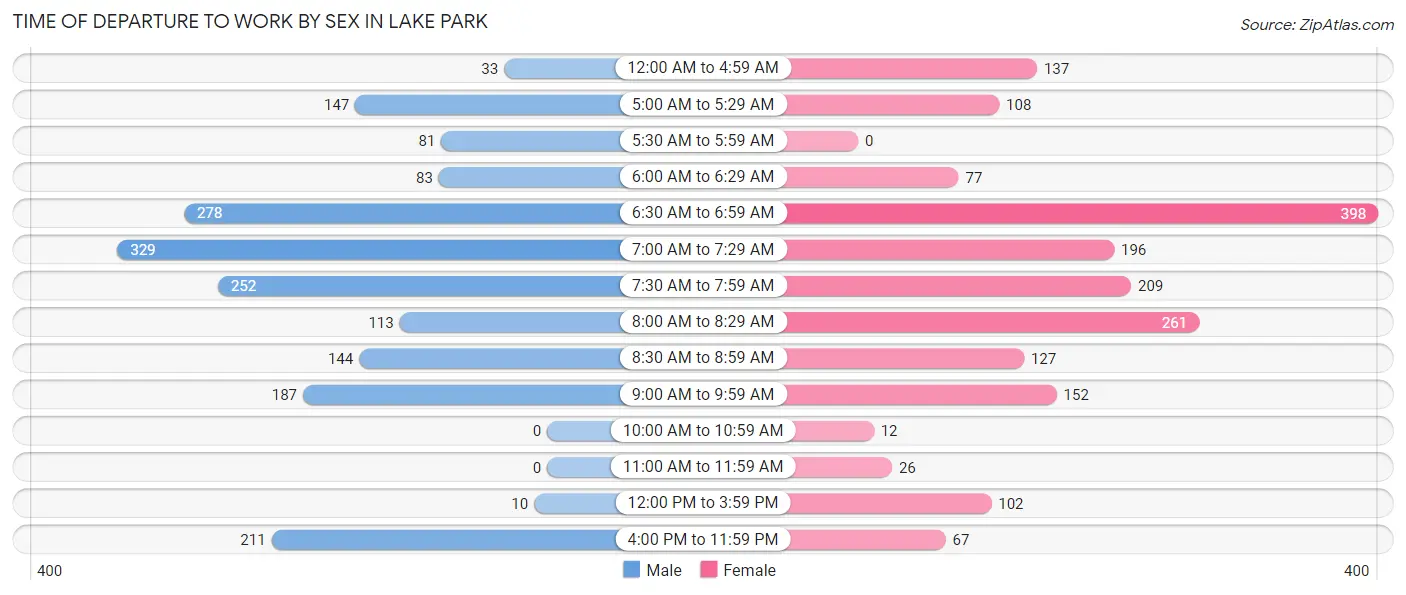
| Time of Departure | Male | Female |
| 12:00 AM to 4:59 AM | 33 (1.8%) | 137 (7.3%) |
| 5:00 AM to 5:29 AM | 147 (7.9%) | 108 (5.8%) |
| 5:30 AM to 5:59 AM | 81 (4.3%) | 0 (0.0%) |
| 6:00 AM to 6:29 AM | 83 (4.4%) | 77 (4.1%) |
| 6:30 AM to 6:59 AM | 278 (14.9%) | 398 (21.3%) |
| 7:00 AM to 7:29 AM | 329 (17.6%) | 196 (10.5%) |
| 7:30 AM to 7:59 AM | 252 (13.5%) | 209 (11.2%) |
| 8:00 AM to 8:29 AM | 113 (6.0%) | 261 (13.9%) |
| 8:30 AM to 8:59 AM | 144 (7.7%) | 127 (6.8%) |
| 9:00 AM to 9:59 AM | 187 (10.0%) | 152 (8.1%) |
| 10:00 AM to 10:59 AM | 0 (0.0%) | 12 (0.6%) |
| 11:00 AM to 11:59 AM | 0 (0.0%) | 26 (1.4%) |
| 12:00 PM to 3:59 PM | 10 (0.5%) | 102 (5.4%) |
| 4:00 PM to 11:59 PM | 211 (11.3%) | 67 (3.6%) |
| Total | 1,868 (100.0%) | 1,872 (100.0%) |
Housing Occupancy in Lake Park
Occupancy by Ownership in Lake Park
Of the total 3,341 dwellings in Lake Park, owner-occupied units account for 1,526 (45.7%), while renter-occupied units make up 1,815 (54.3%).
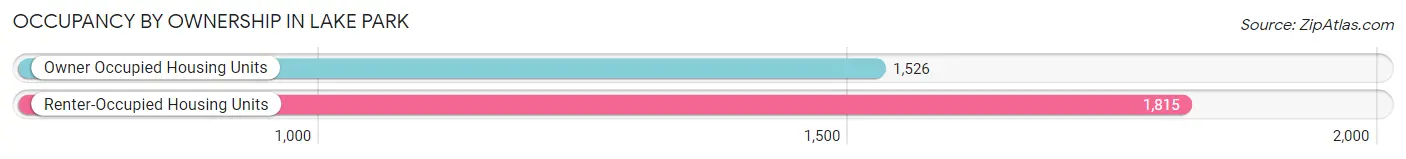
| Occupancy | # Housing Units | % Housing Units |
| Owner Occupied Housing Units | 1,526 | 45.7% |
| Renter-Occupied Housing Units | 1,815 | 54.3% |
| Total Occupied Housing Units | 3,341 | 100.0% |
Occupancy by Household Size in Lake Park
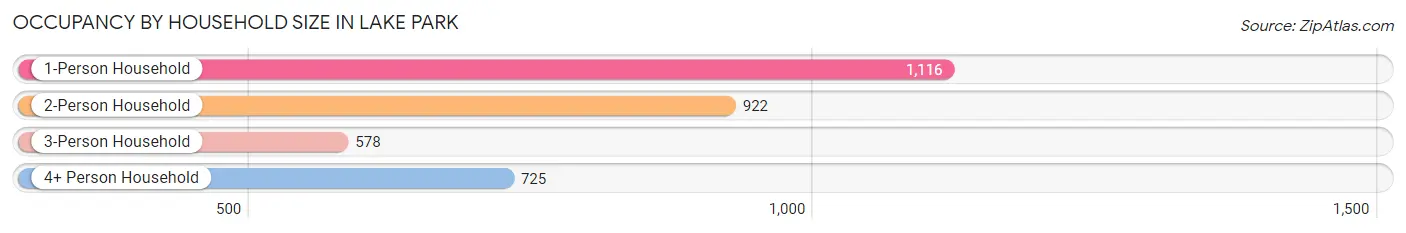
| Household Size | # Housing Units | % Housing Units |
| 1-Person Household | 1,116 | 33.4% |
| 2-Person Household | 922 | 27.6% |
| 3-Person Household | 578 | 17.3% |
| 4+ Person Household | 725 | 21.7% |
| Total Housing Units | 3,341 | 100.0% |
Occupancy by Ownership by Household Size in Lake Park
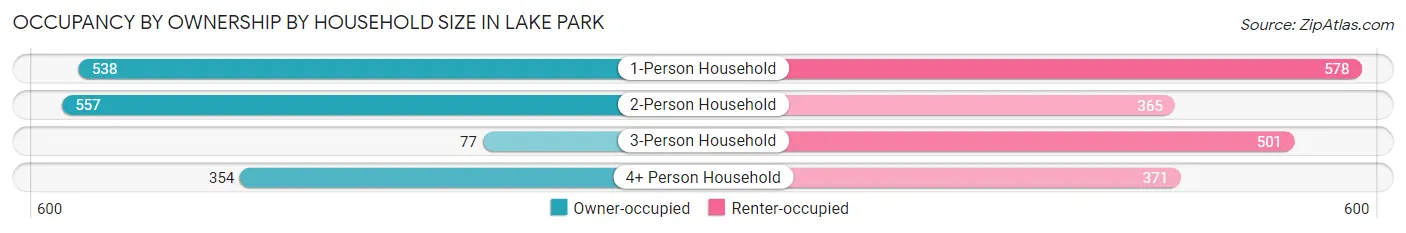
| Household Size | Owner-occupied | Renter-occupied |
| 1-Person Household | 538 (48.2%) | 578 (51.8%) |
| 2-Person Household | 557 (60.4%) | 365 (39.6%) |
| 3-Person Household | 77 (13.3%) | 501 (86.7%) |
| 4+ Person Household | 354 (48.8%) | 371 (51.2%) |
| Total Housing Units | 1,526 (45.7%) | 1,815 (54.3%) |
Occupancy by Educational Attainment in Lake Park
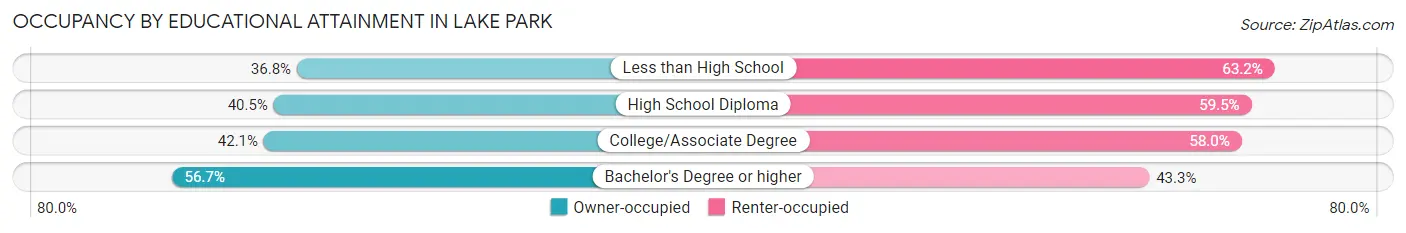
| Household Size | Owner-occupied | Renter-occupied |
| Less than High School | 180 (36.8%) | 309 (63.2%) |
| High School Diploma | 366 (40.5%) | 538 (59.5%) |
| College/Associate Degree | 357 (42.0%) | 492 (58.0%) |
| Bachelor's Degree or higher | 623 (56.7%) | 476 (43.3%) |
Occupancy by Age of Householder in Lake Park
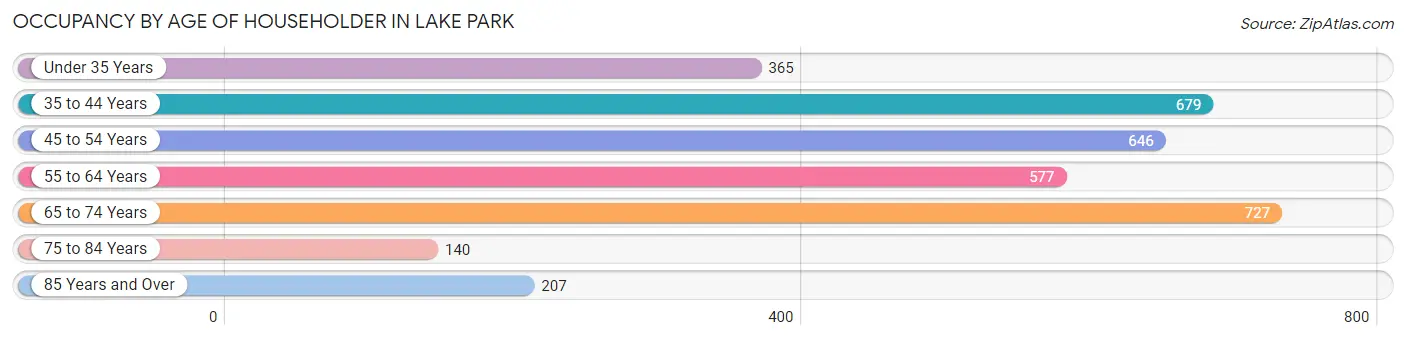
| Age Bracket | # Households | % Households |
| Under 35 Years | 365 | 10.9% |
| 35 to 44 Years | 679 | 20.3% |
| 45 to 54 Years | 646 | 19.3% |
| 55 to 64 Years | 577 | 17.3% |
| 65 to 74 Years | 727 | 21.8% |
| 75 to 84 Years | 140 | 4.2% |
| 85 Years and Over | 207 | 6.2% |
| Total | 3,341 | 100.0% |
Housing Finances in Lake Park
Median Income by Occupancy in Lake Park
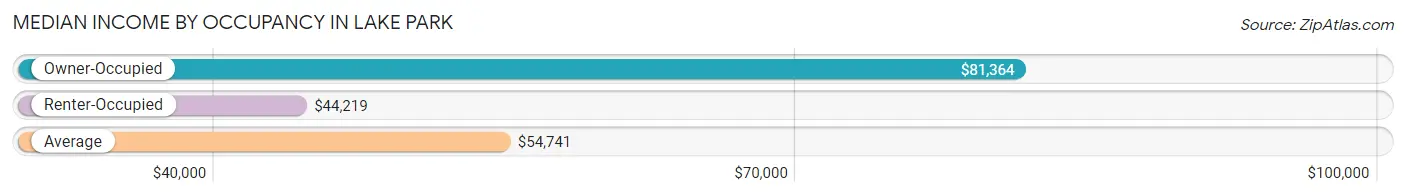
| Occupancy Type | # Households | Median Income |
| Owner-Occupied | 1,526 (45.7%) | $81,364 |
| Renter-Occupied | 1,815 (54.3%) | $44,219 |
| Average | 3,341 (100.0%) | $54,741 |
Occupancy by Householder Income Bracket in Lake Park
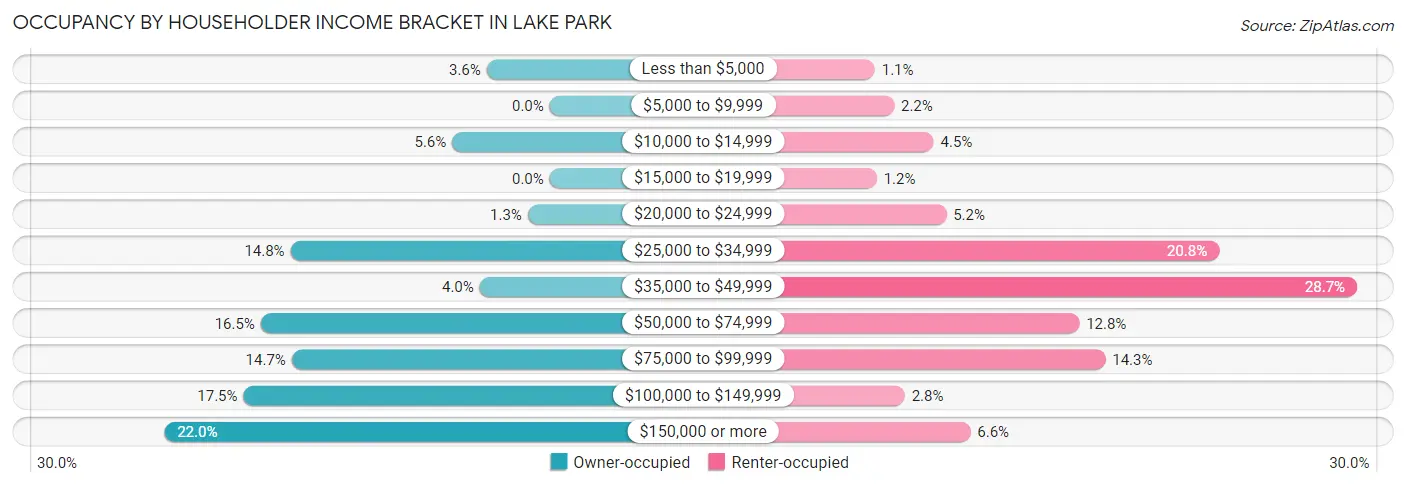
| Income Bracket | Owner-occupied | Renter-occupied |
| Less than $5,000 | 55 (3.6%) | 20 (1.1%) |
| $5,000 to $9,999 | 0 (0.0%) | 40 (2.2%) |
| $10,000 to $14,999 | 85 (5.6%) | 81 (4.5%) |
| $15,000 to $19,999 | 0 (0.0%) | 22 (1.2%) |
| $20,000 to $24,999 | 19 (1.3%) | 94 (5.2%) |
| $25,000 to $34,999 | 226 (14.8%) | 377 (20.8%) |
| $35,000 to $49,999 | 61 (4.0%) | 520 (28.6%) |
| $50,000 to $74,999 | 252 (16.5%) | 232 (12.8%) |
| $75,000 to $99,999 | 225 (14.7%) | 259 (14.3%) |
| $100,000 to $149,999 | 267 (17.5%) | 51 (2.8%) |
| $150,000 or more | 336 (22.0%) | 119 (6.6%) |
| Total | 1,526 (100.0%) | 1,815 (100.0%) |
Monthly Housing Cost Tiers in Lake Park
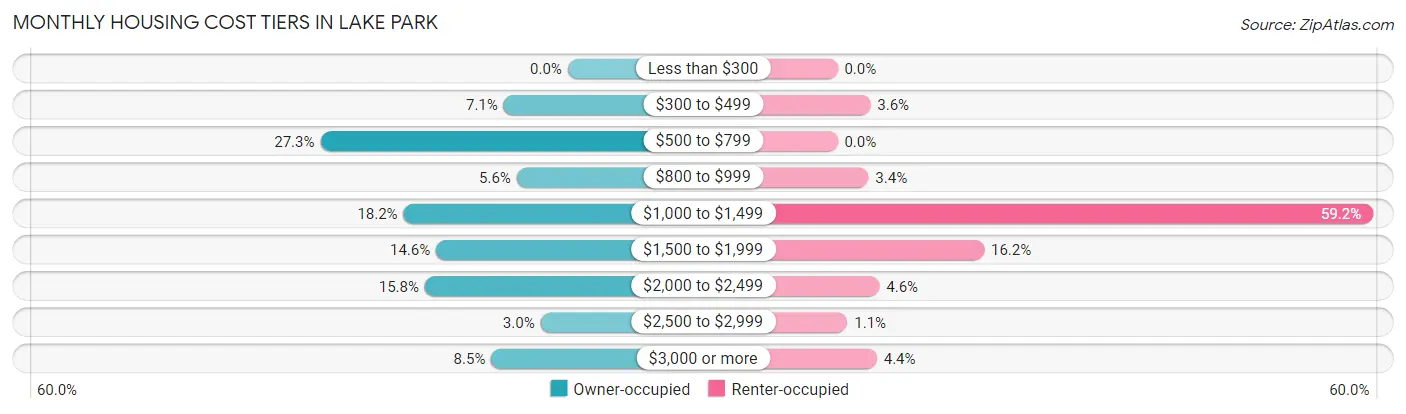
| Monthly Cost | Owner-occupied | Renter-occupied |
| Less than $300 | 0 (0.0%) | 0 (0.0%) |
| $300 to $499 | 108 (7.1%) | 66 (3.6%) |
| $500 to $799 | 417 (27.3%) | 0 (0.0%) |
| $800 to $999 | 86 (5.6%) | 62 (3.4%) |
| $1,000 to $1,499 | 277 (18.1%) | 1,074 (59.2%) |
| $1,500 to $1,999 | 222 (14.5%) | 294 (16.2%) |
| $2,000 to $2,499 | 241 (15.8%) | 84 (4.6%) |
| $2,500 to $2,999 | 46 (3.0%) | 20 (1.1%) |
| $3,000 or more | 129 (8.5%) | 79 (4.3%) |
| Total | 1,526 (100.0%) | 1,815 (100.0%) |
Physical Housing Characteristics in Lake Park
Housing Structures in Lake Park
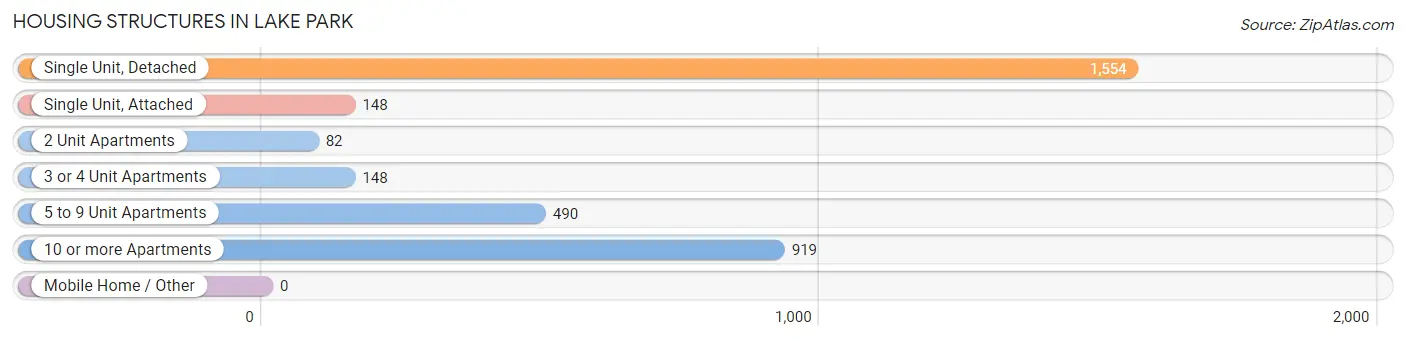
| Structure Type | # Housing Units | % Housing Units |
| Single Unit, Detached | 1,554 | 46.5% |
| Single Unit, Attached | 148 | 4.4% |
| 2 Unit Apartments | 82 | 2.5% |
| 3 or 4 Unit Apartments | 148 | 4.4% |
| 5 to 9 Unit Apartments | 490 | 14.7% |
| 10 or more Apartments | 919 | 27.5% |
| Mobile Home / Other | 0 | 0.0% |
| Total | 3,341 | 100.0% |
Housing Structures by Occupancy in Lake Park
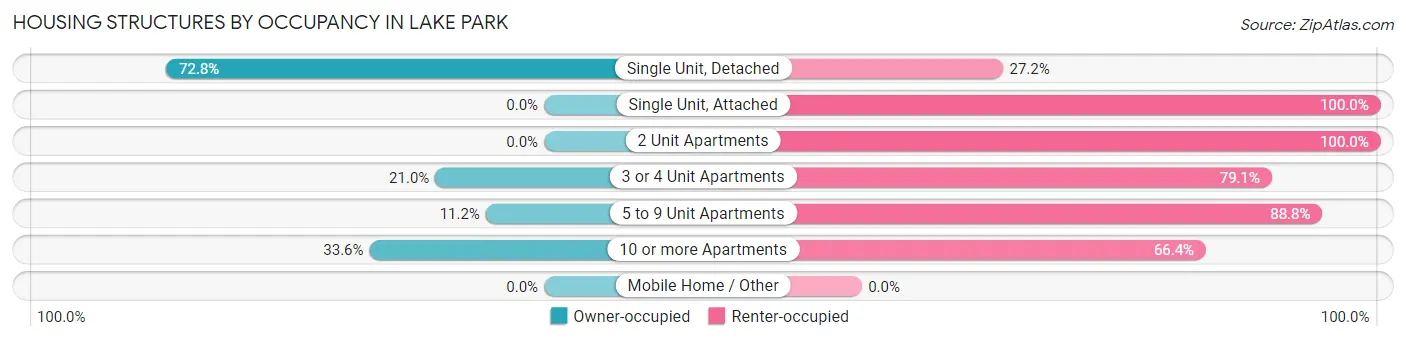
| Structure Type | Owner-occupied | Renter-occupied |
| Single Unit, Detached | 1,131 (72.8%) | 423 (27.2%) |
| Single Unit, Attached | 0 (0.0%) | 148 (100.0%) |
| 2 Unit Apartments | 0 (0.0%) | 82 (100.0%) |
| 3 or 4 Unit Apartments | 31 (20.9%) | 117 (79.0%) |
| 5 to 9 Unit Apartments | 55 (11.2%) | 435 (88.8%) |
| 10 or more Apartments | 309 (33.6%) | 610 (66.4%) |
| Mobile Home / Other | 0 (0.0%) | 0 (0.0%) |
| Total | 1,526 (45.7%) | 1,815 (54.3%) |
Housing Structures by Number of Rooms in Lake Park
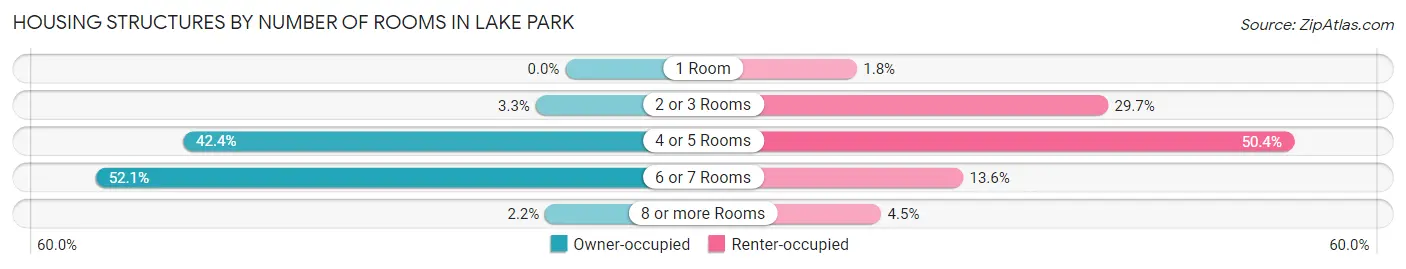
| Number of Rooms | Owner-occupied | Renter-occupied |
| 1 Room | 0 (0.0%) | 33 (1.8%) |
| 2 or 3 Rooms | 50 (3.3%) | 539 (29.7%) |
| 4 or 5 Rooms | 647 (42.4%) | 914 (50.4%) |
| 6 or 7 Rooms | 795 (52.1%) | 247 (13.6%) |
| 8 or more Rooms | 34 (2.2%) | 82 (4.5%) |
| Total | 1,526 (100.0%) | 1,815 (100.0%) |
Housing Structure by Heating Type in Lake Park
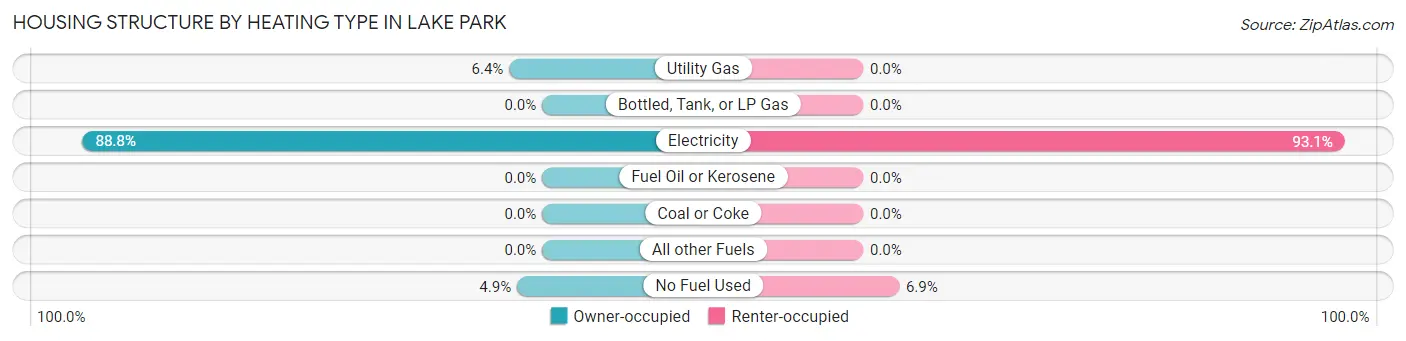
| Heating Type | Owner-occupied | Renter-occupied |
| Utility Gas | 97 (6.4%) | 0 (0.0%) |
| Bottled, Tank, or LP Gas | 0 (0.0%) | 0 (0.0%) |
| Electricity | 1,355 (88.8%) | 1,689 (93.1%) |
| Fuel Oil or Kerosene | 0 (0.0%) | 0 (0.0%) |
| Coal or Coke | 0 (0.0%) | 0 (0.0%) |
| All other Fuels | 0 (0.0%) | 0 (0.0%) |
| No Fuel Used | 74 (4.9%) | 126 (6.9%) |
| Total | 1,526 (100.0%) | 1,815 (100.0%) |
Household Vehicle Usage in Lake Park
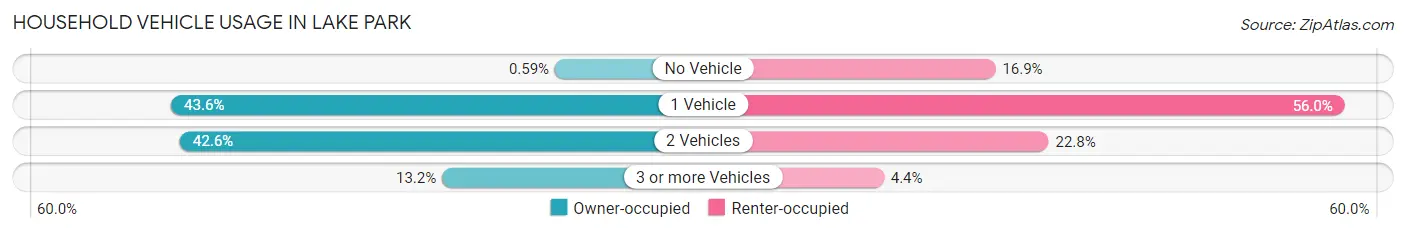
| Vehicles per Household | Owner-occupied | Renter-occupied |
| No Vehicle | 9 (0.6%) | 306 (16.9%) |
| 1 Vehicle | 665 (43.6%) | 1,016 (56.0%) |
| 2 Vehicles | 650 (42.6%) | 414 (22.8%) |
| 3 or more Vehicles | 202 (13.2%) | 79 (4.3%) |
| Total | 1,526 (100.0%) | 1,815 (100.0%) |
Real Estate & Mortgages in Lake Park
Real Estate and Mortgage Overview in Lake Park
| Characteristic | Without Mortgage | With Mortgage |
| Housing Units | 594 | 932 |
| Median Property Value | $313,200 | $328,700 |
| Median Household Income | $34,580 | $320 |
| Monthly Housing Costs | $651 | $129 |
| Real Estate Taxes | $2,328 | $0 |
Property Value by Mortgage Status in Lake Park
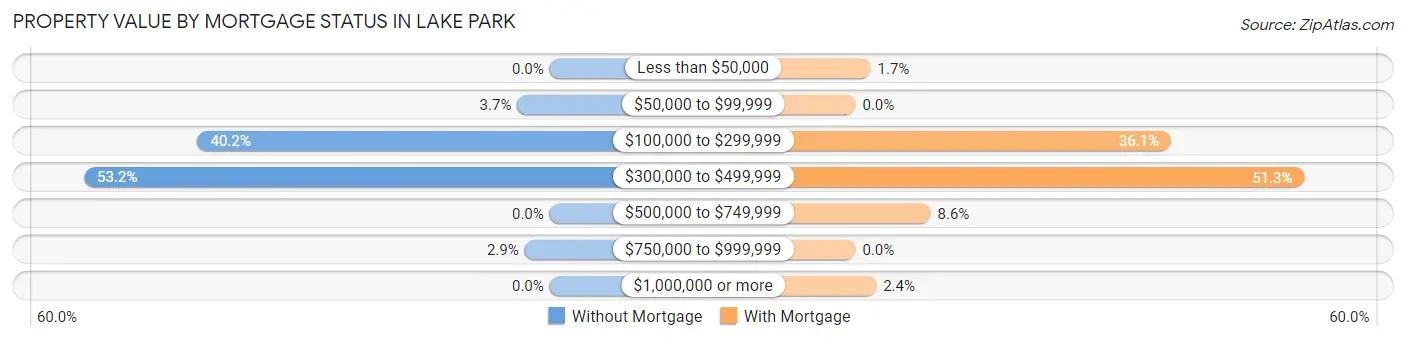
| Property Value | Without Mortgage | With Mortgage |
| Less than $50,000 | 0 (0.0%) | 16 (1.7%) |
| $50,000 to $99,999 | 22 (3.7%) | 0 (0.0%) |
| $100,000 to $299,999 | 239 (40.2%) | 336 (36.0%) |
| $300,000 to $499,999 | 316 (53.2%) | 478 (51.3%) |
| $500,000 to $749,999 | 0 (0.0%) | 80 (8.6%) |
| $750,000 to $999,999 | 17 (2.9%) | 0 (0.0%) |
| $1,000,000 or more | 0 (0.0%) | 22 (2.4%) |
| Total | 594 (100.0%) | 932 (100.0%) |
Household Income by Mortgage Status in Lake Park
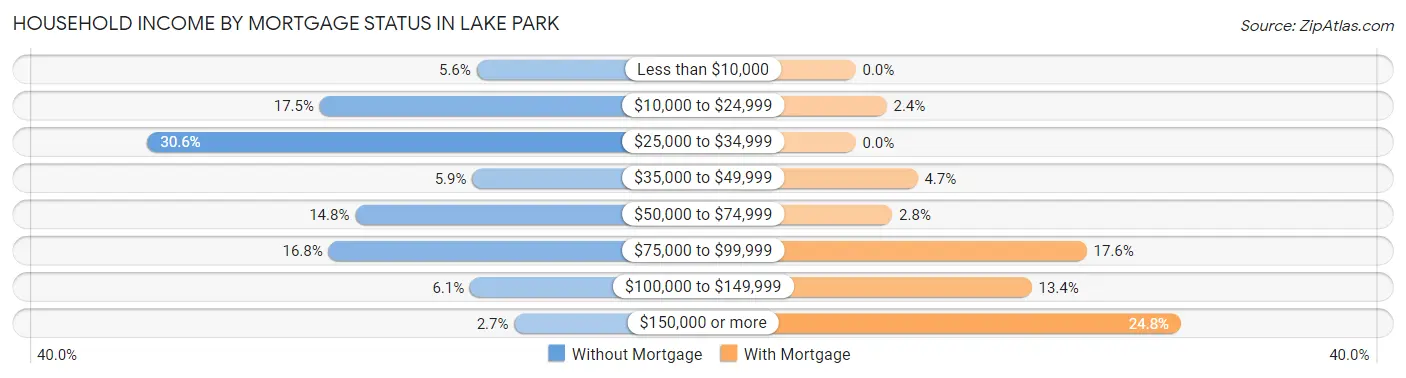
| Household Income | Without Mortgage | With Mortgage |
| Less than $10,000 | 33 (5.6%) | 0 (0.0%) |
| $10,000 to $24,999 | 104 (17.5%) | 22 (2.4%) |
| $25,000 to $34,999 | 182 (30.6%) | 0 (0.0%) |
| $35,000 to $49,999 | 35 (5.9%) | 44 (4.7%) |
| $50,000 to $74,999 | 88 (14.8%) | 26 (2.8%) |
| $75,000 to $99,999 | 100 (16.8%) | 164 (17.6%) |
| $100,000 to $149,999 | 36 (6.1%) | 125 (13.4%) |
| $150,000 or more | 16 (2.7%) | 231 (24.8%) |
| Total | 594 (100.0%) | 932 (100.0%) |
Property Value to Household Income Ratio in Lake Park
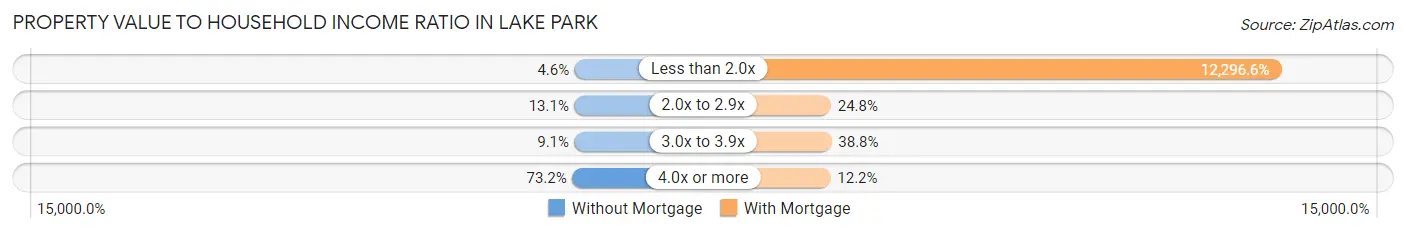
| Value-to-Income Ratio | Without Mortgage | With Mortgage |
| Less than 2.0x | 27 (4.5%) | 114,604 (12,296.6%) |
| 2.0x to 2.9x | 78 (13.1%) | 231 (24.8%) |
| 3.0x to 3.9x | 54 (9.1%) | 362 (38.8%) |
| 4.0x or more | 435 (73.2%) | 114 (12.2%) |
| Total | 594 (100.0%) | 932 (100.0%) |
Real Estate Taxes by Mortgage Status in Lake Park
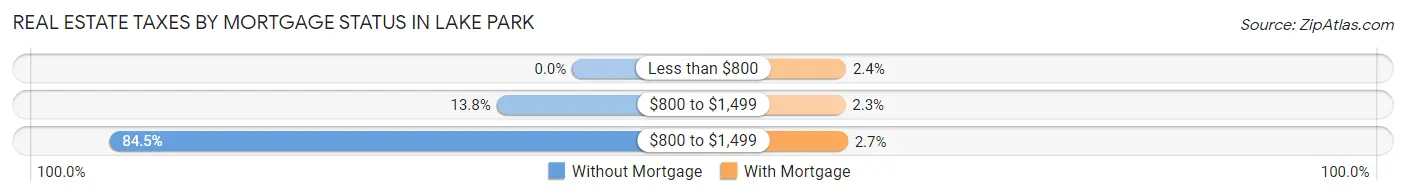
| Property Taxes | Without Mortgage | With Mortgage |
| Less than $800 | 0 (0.0%) | 22 (2.4%) |
| $800 to $1,499 | 82 (13.8%) | 21 (2.2%) |
| $800 to $1,499 | 502 (84.5%) | 25 (2.7%) |
| Total | 594 (100.0%) | 932 (100.0%) |
Health & Disability in Lake Park
Health Insurance Coverage by Age in Lake Park
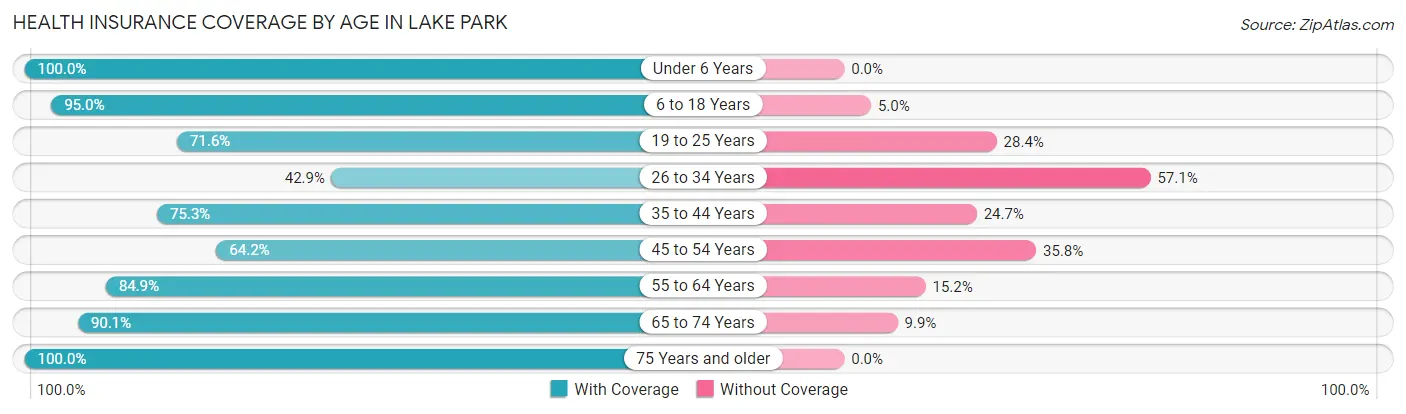
| Age Bracket | With Coverage | Without Coverage |
| Under 6 Years | 819 (100.0%) | 0 (0.0%) |
| 6 to 18 Years | 1,339 (95.0%) | 70 (5.0%) |
| 19 to 25 Years | 514 (71.6%) | 204 (28.4%) |
| 26 to 34 Years | 456 (42.9%) | 607 (57.1%) |
| 35 to 44 Years | 1,110 (75.3%) | 364 (24.7%) |
| 45 to 54 Years | 711 (64.2%) | 396 (35.8%) |
| 55 to 64 Years | 633 (84.9%) | 113 (15.1%) |
| 65 to 74 Years | 843 (90.1%) | 93 (9.9%) |
| 75 Years and older | 580 (100.0%) | 0 (0.0%) |
| Total | 7,005 (79.1%) | 1,847 (20.9%) |
Health Insurance Coverage by Citizenship Status in Lake Park
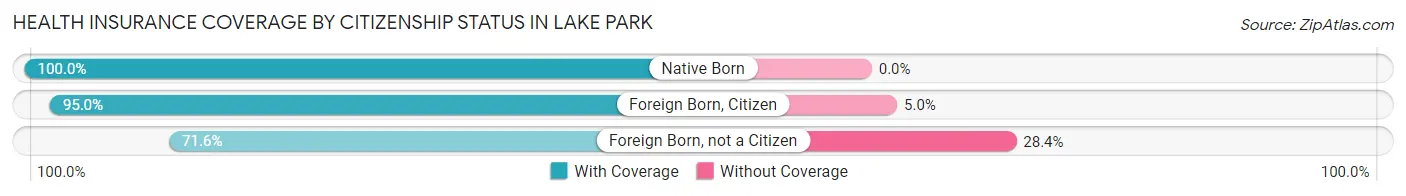
| Citizenship Status | With Coverage | Without Coverage |
| Native Born | 819 (100.0%) | 0 (0.0%) |
| Foreign Born, Citizen | 1,339 (95.0%) | 70 (5.0%) |
| Foreign Born, not a Citizen | 514 (71.6%) | 204 (28.4%) |
Health Insurance Coverage by Household Income in Lake Park
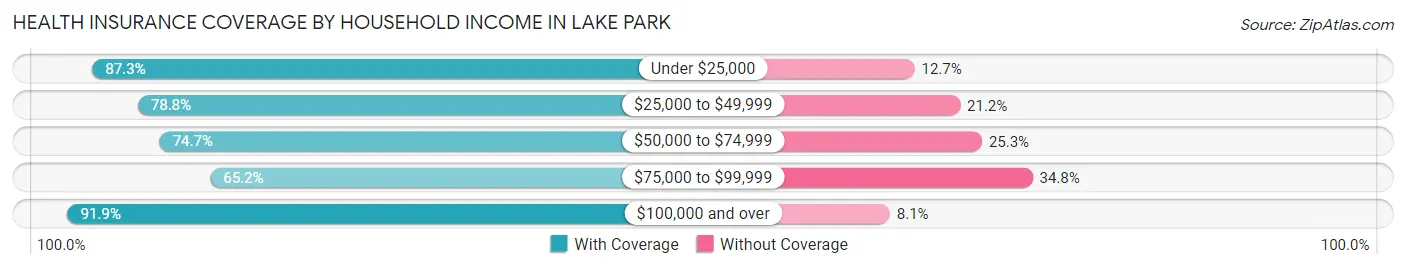
| Household Income | With Coverage | Without Coverage |
| Under $25,000 | 702 (87.3%) | 102 (12.7%) |
| $25,000 to $49,999 | 2,512 (78.8%) | 677 (21.2%) |
| $50,000 to $74,999 | 1,059 (74.7%) | 359 (25.3%) |
| $75,000 to $99,999 | 1,055 (65.2%) | 563 (34.8%) |
| $100,000 and over | 1,665 (91.9%) | 146 (8.1%) |
Public vs Private Health Insurance Coverage by Age in Lake Park
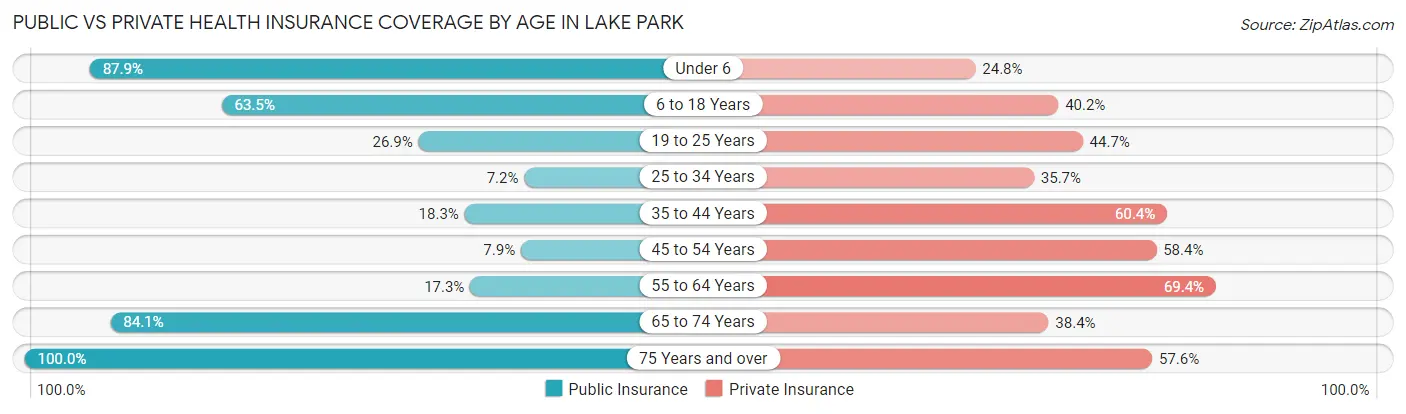
| Age Bracket | Public Insurance | Private Insurance |
| Under 6 | 720 (87.9%) | 203 (24.8%) |
| 6 to 18 Years | 894 (63.4%) | 566 (40.2%) |
| 19 to 25 Years | 193 (26.9%) | 321 (44.7%) |
| 25 to 34 Years | 77 (7.2%) | 379 (35.6%) |
| 35 to 44 Years | 270 (18.3%) | 890 (60.4%) |
| 45 to 54 Years | 87 (7.9%) | 646 (58.4%) |
| 55 to 64 Years | 129 (17.3%) | 518 (69.4%) |
| 65 to 74 Years | 787 (84.1%) | 359 (38.4%) |
| 75 Years and over | 580 (100.0%) | 334 (57.6%) |
| Total | 3,737 (42.2%) | 4,216 (47.6%) |
Disability Status by Sex by Age in Lake Park
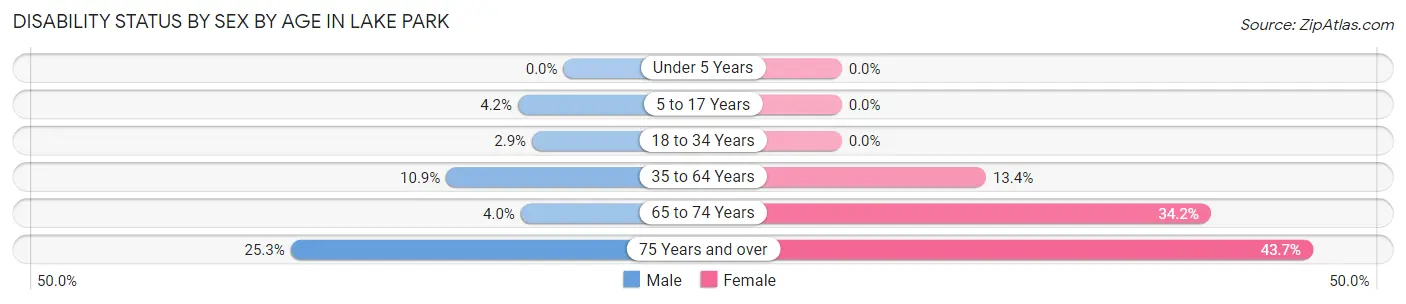
| Age Bracket | Male | Female |
| Under 5 Years | 0 (0.0%) | 0 (0.0%) |
| 5 to 17 Years | 29 (4.2%) | 0 (0.0%) |
| 18 to 34 Years | 27 (2.9%) | 0 (0.0%) |
| 35 to 64 Years | 174 (10.9%) | 231 (13.4%) |
| 65 to 74 Years | 18 (4.0%) | 165 (34.2%) |
| 75 Years and over | 20 (25.3%) | 219 (43.7%) |
Disability Class by Sex by Age in Lake Park
Disability Class: Hearing Difficulty
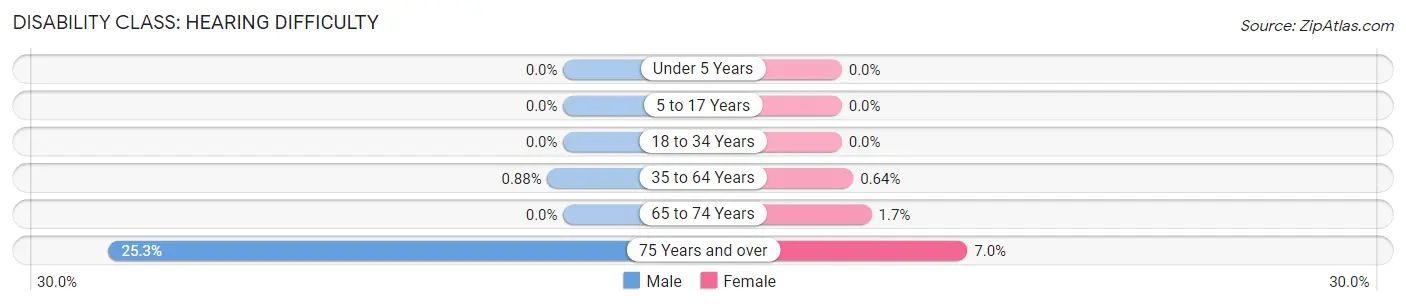
| Age Bracket | Male | Female |
| Under 5 Years | 0 (0.0%) | 0 (0.0%) |
| 5 to 17 Years | 0 (0.0%) | 0 (0.0%) |
| 18 to 34 Years | 0 (0.0%) | 0 (0.0%) |
| 35 to 64 Years | 14 (0.9%) | 11 (0.6%) |
| 65 to 74 Years | 0 (0.0%) | 8 (1.7%) |
| 75 Years and over | 20 (25.3%) | 35 (7.0%) |
Disability Class: Vision Difficulty
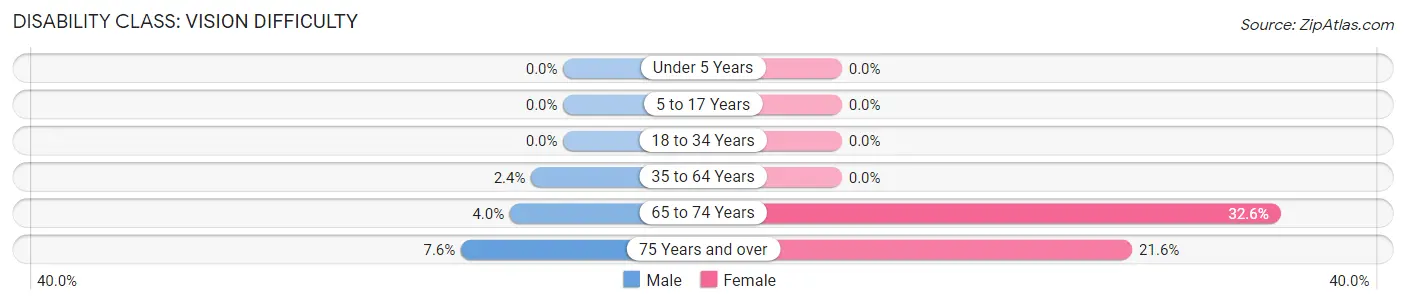
| Age Bracket | Male | Female |
| Under 5 Years | 0 (0.0%) | 0 (0.0%) |
| 5 to 17 Years | 0 (0.0%) | 0 (0.0%) |
| 18 to 34 Years | 0 (0.0%) | 0 (0.0%) |
| 35 to 64 Years | 38 (2.4%) | 0 (0.0%) |
| 65 to 74 Years | 18 (4.0%) | 157 (32.6%) |
| 75 Years and over | 6 (7.6%) | 108 (21.6%) |
Disability Class: Cognitive Difficulty
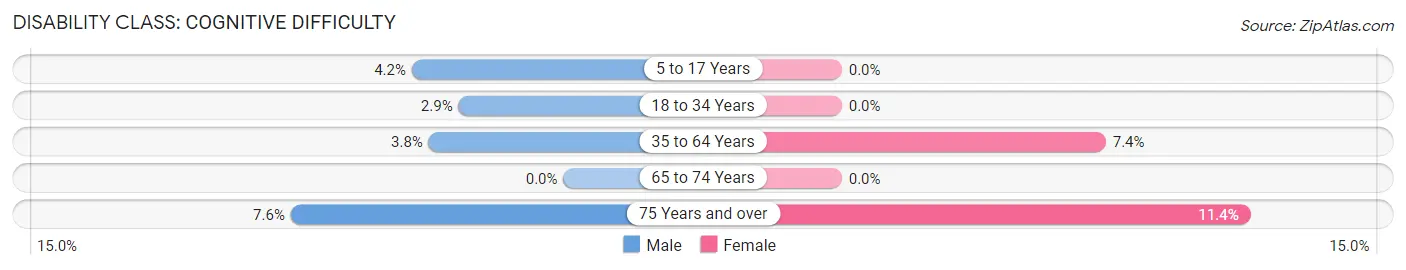
| Age Bracket | Male | Female |
| 5 to 17 Years | 29 (4.2%) | 0 (0.0%) |
| 18 to 34 Years | 27 (2.9%) | 0 (0.0%) |
| 35 to 64 Years | 60 (3.7%) | 127 (7.3%) |
| 65 to 74 Years | 0 (0.0%) | 0 (0.0%) |
| 75 Years and over | 6 (7.6%) | 57 (11.4%) |
Disability Class: Ambulatory Difficulty
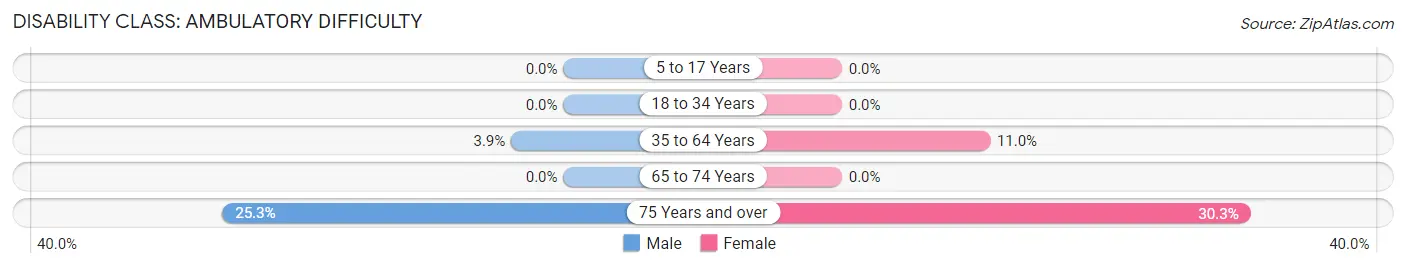
| Age Bracket | Male | Female |
| 5 to 17 Years | 0 (0.0%) | 0 (0.0%) |
| 18 to 34 Years | 0 (0.0%) | 0 (0.0%) |
| 35 to 64 Years | 62 (3.9%) | 190 (11.0%) |
| 65 to 74 Years | 0 (0.0%) | 0 (0.0%) |
| 75 Years and over | 20 (25.3%) | 152 (30.3%) |
Disability Class: Self-Care Difficulty
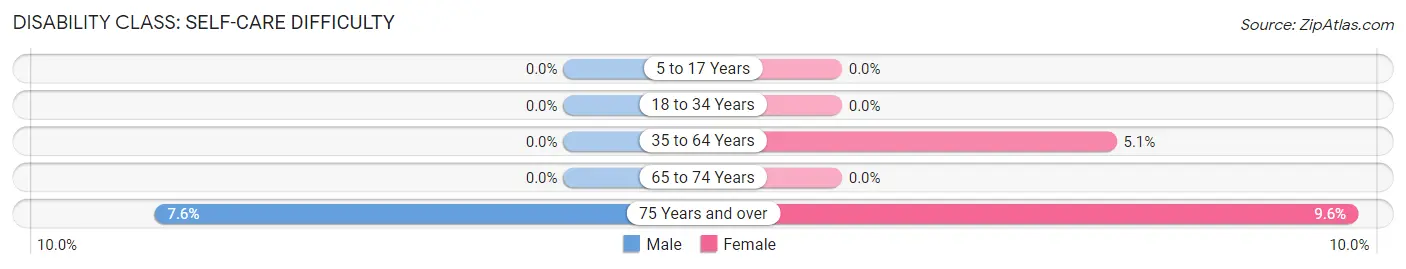
| Age Bracket | Male | Female |
| 5 to 17 Years | 0 (0.0%) | 0 (0.0%) |
| 18 to 34 Years | 0 (0.0%) | 0 (0.0%) |
| 35 to 64 Years | 0 (0.0%) | 88 (5.1%) |
| 65 to 74 Years | 0 (0.0%) | 0 (0.0%) |
| 75 Years and over | 6 (7.6%) | 48 (9.6%) |
Technology Access in Lake Park
Computing Device Access in Lake Park
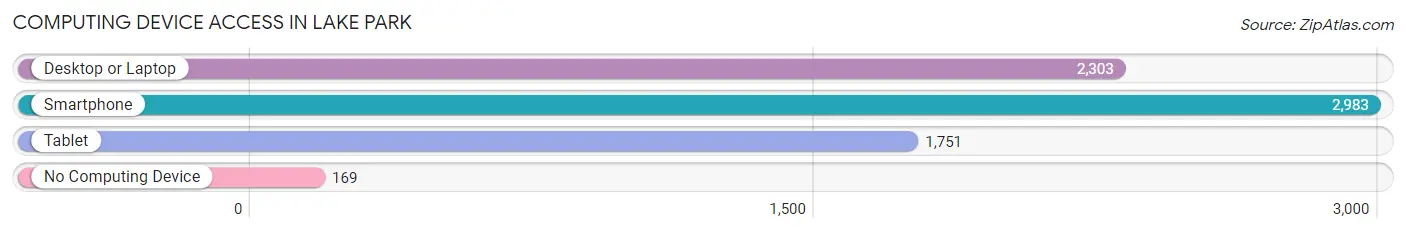
| Device Type | # Households | % Households |
| Desktop or Laptop | 2,303 | 68.9% |
| Smartphone | 2,983 | 89.3% |
| Tablet | 1,751 | 52.4% |
| No Computing Device | 169 | 5.1% |
| Total | 3,341 | 100.0% |
Internet Access in Lake Park
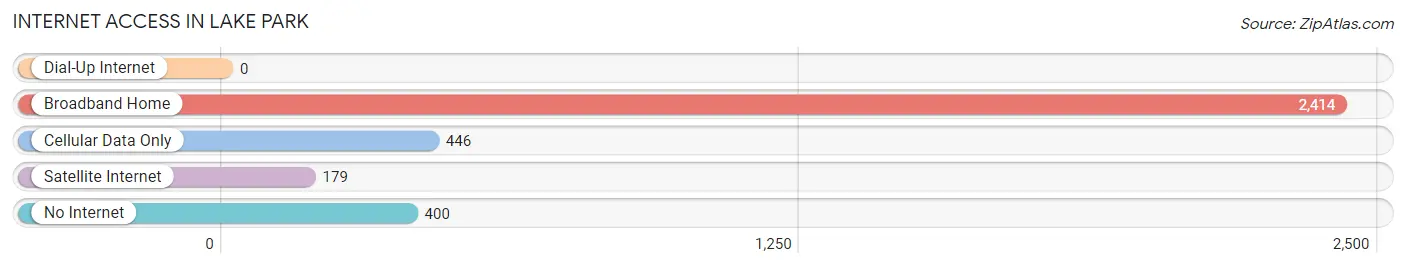
| Internet Type | # Households | % Households |
| Dial-Up Internet | 0 | 0.0% |
| Broadband Home | 2,414 | 72.3% |
| Cellular Data Only | 446 | 13.4% |
| Satellite Internet | 179 | 5.4% |
| No Internet | 400 | 12.0% |
| Total | 3,341 | 100.0% |
Lake Park Summary
Park Lake is a small town located in Palm Beach County, Florida. It is situated on the eastern shore of Lake Okeechobee, the largest freshwater lake in the state. The town was founded in the late 19th century and has a population of approximately 1,500 people.
History
Park Lake was founded in 1892 by a group of settlers from the Midwest. The settlers were attracted to the area by the abundance of natural resources, including the lake and the nearby Everglades. The town was originally called Parkville, but the name was changed to Park Lake in 1895.
The town grew slowly over the years, but it was not until the 1950s that it began to experience significant growth. This was due to the construction of the Herbert Hoover Dike, which allowed for the development of the lake for recreational activities. The town also benefited from the construction of the Cross-Florida Barge Canal, which provided access to the Gulf of Mexico.
Geography
Park Lake is located on the eastern shore of Lake Okeechobee, the largest freshwater lake in the state. The town is situated on the northern edge of the lake, with the Herbert Hoover Dike to the south. The town is surrounded by wetlands and is home to a variety of wildlife, including alligators, turtles, and birds.
The town is located in Palm Beach County, which is part of the Miami metropolitan area. The nearest major city is West Palm Beach, which is approximately 30 miles away.
Economy
The economy of Park Lake is largely based on tourism and agriculture. The town is home to several tourist attractions, including the Herbert Hoover Dike, the Cross-Florida Barge Canal, and the Everglades National Park. The town also has several marinas and boat ramps, which attract visitors from all over the state.
Agriculture is also an important part of the local economy. The town is home to several farms, which produce a variety of crops, including sugarcane, corn, and soybeans.
Demographics
As of the 2010 census, the population of Park Lake was 1,500. The town is predominantly white, with a small Hispanic population. The median household income is $41,000, and the median home value is $150,000.
Conclusion
Park Lake is a small town located on the eastern shore of Lake Okeechobee in Palm Beach County, Florida. The town was founded in the late 19th century and has a population of approximately 1,500 people. The economy of Park Lake is largely based on tourism and agriculture, and the town is home to several tourist attractions and farms. The population of Park Lake is predominantly white, with a small Hispanic population, and the median household income is $41,000.
Common Questions
What is Per Capita Income in Lake Park?
Per Capita income in Lake Park is $28,920.
What is the Median Family Income in Lake Park?
Median Family Income in Lake Park is $63,662.
What is the Median Household income in Lake Park?
Median Household Income in Lake Park is $54,741.
What is Income or Wage Gap in Lake Park?
Income or Wage Gap in Lake Park is 39.9%.
Women in Lake Park earn 60.1 cents for every dollar earned by a man.
What is Family Income Deficit in Lake Park?
Family Income Deficit in Lake Park is $8,390.
Families that are below poverty line in Lake Park earn $8,390 less on average than the poverty threshold level.
What is Inequality or Gini Index in Lake Park?
Inequality or Gini Index in Lake Park is 0.41.
What is the Total Population of Lake Park?
Total Population of Lake Park is 8,996.
What is the Total Male Population of Lake Park?
Total Male Population of Lake Park is 4,201.
What is the Total Female Population of Lake Park?
Total Female Population of Lake Park is 4,795.
What is the Ratio of Males per 100 Females in Lake Park?
There are 87.61 Males per 100 Females in Lake Park.
What is the Ratio of Females per 100 Males in Lake Park?
There are 114.14 Females per 100 Males in Lake Park.
What is the Median Population Age in Lake Park?
Median Population Age in Lake Park is 37.4 Years.
What is the Average Family Size in Lake Park
Average Family Size in Lake Park is 3.5 People.
What is the Average Household Size in Lake Park
Average Household Size in Lake Park is 2.7 People.
How Large is the Labor Force in Lake Park?
There are 4,598 People in the Labor Forcein in Lake Park.
What is the Percentage of People in the Labor Force in Lake Park?
63.0% of People are in the Labor Force in Lake Park.
What is the Unemployment Rate in Lake Park?
Unemployment Rate in Lake Park is 9.4%.